UNITED STATES
SECURITIES AND EXCHANGE COMMISSION
Washington, D.C. 20549
FORM N-CSR
CERTIFIED SHAREHOLDER REPORT OF REGISTERED
MANAGEMENT INVESTMENT COMPANIES
Investment Company Act file number 811-08510
Matthews International Funds
(Exact name of registrant as specified in charter)
Four Embarcadero Center, Suite 550
San Francisco, CA 94111
(Address of principal executive offices) (Zip code)
William J. Hackett, President
Four Embarcadero Center, Suite 550
San Francisco, CA 94111
(Name and address of agent for service)
Registrant’s telephone number, including area code: 415-788-7553
Date of fiscal year end: December 31
Date of reporting period: December 31, 2020
Form N-CSR is to be used by management investment companies to file reports with the Commission not later than 10 days after the transmission to stockholders of any report that is required to be transmitted to stockholders under Rule 30e-1 under the Investment Company Act of 1940 (17 CFR 270.30e-1). The Commission may use the information provided on Form N-CSR in its regulatory, disclosure review, inspection, and policymaking roles.
A registrant is required to disclose the information specified by Form N-CSR, and the Commission will make this information public. A registrant is not required to respond to the collection of information contained in Form N-CSR unless the Form displays a currently valid Office of Management and Budget (“OMB”) control number. Please direct comments concerning the accuracy of the information collection burden estimate and any suggestions for reducing the burden to Secretary, Securities and Exchange Commission, 450 Fifth Street, NW, Washington, DC 20549-0609. The OMB has reviewed this collection of information under the clearance requirements of 44 U.S.C. § 3507.
| Item 1. | Reports to Stockholders. |
| | (a) | The Report to Shareholders is attached herewith. |
Matthews Asia Funds | Annual Report
December 31, 2020 | matthewsasia.com
GLOBAL EMERGING MARKETS STRATEGY
Matthews Emerging Markets Equity Fund
ASIA FIXED INCOME STRATEGIES
Matthews Asia Total Return Bond Fund
Matthews Asia Credit Opportunities Fund
ASIA GROWTH AND INCOME STRATEGIES
Matthews Asian Growth and Income Fund
Matthews Asia Dividend Fund
Matthews China Dividend Fund
ASIA GROWTH STRATEGIES
Matthews Asia Growth Fund
Matthews Pacific Tiger Fund
Matthews Asia ESG Fund
Matthews Emerging Asia Fund
Matthews Asia Innovators Fund
Matthews China Fund
Matthews India Fund
Matthews Japan Fund
Matthews Korea Fund
ASIA SMALL COMPANY STRATEGIES
Matthews Asia Small Companies Fund
Matthews China Small Companies Fund

As of January 1, 2021, as permitted by regulations adopted by the Securities and Exchange Commission, paper copies of the Funds’ annual and semi-annual shareholder reports are no longer being sent by mail, unless you specifically request paper copies of the reports. Instead, the reports will be made available on the Funds’ website matthewsasia.com, and you will be notified by mail each time a report is posted and provided with a website link to access the report. You may elect to receive paper copies of shareholder reports and other communications from the Funds anytime by contacting your financial intermediary (such as a broker-dealer or bank) or, if you are a direct investor, by calling 800.789.ASIA (2742).
You may elect to receive all future reports in paper free of charge. If you invest through a financial intermediary, you can contact your financial intermediary to request that you continue to receive paper copies of your shareholder reports. If you invest directly with a Fund, you can call 800.789.ASIA (2742) to let the Fund know you wish to receive paper copies of your shareholder reports. Your election to receive reports in paper will apply to all Funds held in your account if you invest through your financial intermediary or all Funds held directly with Matthews Asia Funds.

Investor Class Performance and Expense Ratios (December 31, 2020) (unaudited)
| | | | | | | | | | | | | | | | | | | | | | | | | | | | | | | | | | | | |
| | | | | |
Average Annual Total Return† | | | | | | 2020
Annual
Operating
Expense
Ratios* | | | 2020
Annual
Operating
Expense
Ratios
after Fee
Waiver
and
Expense
Reim- bursement** | | | Prospectus
Expense
Ratios‡ | | | Prospectus
Expense
Ratios
after Fee
Waiver
and
Expense
Reim- bursement‡ | |
| Investor Class | | 1 year | | | 5 years | | | 10 years | | | Since
Inception | | | Inception
Date | |
GLOBAL EMERGING MARKETS STRATEGY | | | | | | | | | | | | | | | | | | | | | | | | | | | | | | | | | | | | |
| | | | | | | | | |
Emerging Markets Equity Fund (MEGMX) | | | n.a. | | | | n.a. | | | | n.a. | | | | 61.23% | | | | 4/30/20 | | | | 2.76% | | | | 1.08% | 1 | | | 2.77% | | | | 1.15% | 1 |
ASIA FIXED INCOME STRATEGIES | | | | | | | | | | | | | | | | | | | | | | | | | | | | | | | | | | | | |
| | | | | | | | | |
Asia Total Return Bond Fund (MAINX)§ | | | 5.36% | | | | 6.35% | | | | n.a. | | | | 5.01% | | | | 11/30/11 | | | | 1.15% | | | | 1.12% | 1 | | | 1.08% | | | | 1.07% | 1 |
| | | | | | | | | |
Asia Credit Opportunities Fund (MCRDX) | | | 1.80% | | | | n.a. | | | | n.a. | | | | 5.16% | | | | 4/29/16 | | | | 1.14% | | | | 1.14% | 1 | | | 1.24% | | | | 1.12% | 1 |
ASIA GROWTH AND INCOME STRATEGIES | | | | | | | | | | | | | | | | | | | | | | | | | | | | | | | | | | | | |
| | | | | | | | | |
Asian Growth and Income Fund (MACSX) | | | 16.00% | | | | 8.38% | | | | 5.37% | | | | 9.22% | | | | 9/12/94 | | | | 1.09% | | | | 1.09% | | | | 1.08% | | | | 1.08% | |
| | | | | | | | | |
Asia Dividend Fund (MAPIX) | | | 31.25% | | | | 12.30% | | | | 8.46% | | | | 9.98% | | | | 10/31/06 | | | | 1.03% | | | | 1.02% | 2 | | | 1.03% | | | | 1.02% | 2 |
| | | | | | | | | |
China Dividend Fund (MCDFX) | | | 24.22% | | | | 13.36% | | | | 9.88% | | | | 11.06% | | | | 11/30/09 | | | | 1.15% | | | | 1.15% | | | | 1.15% | | | | 1.15% | |
ASIA GROWTH STRATEGIES | | | | | | | | | | | | | | | | | | | | | | | | | | | | | | | | | | | | |
| | | | | | | | | |
Asia Growth Fund (MPACX) | | | 46.76% | | | | 16.88% | | | | 10.48% | | | | 11.15% | | | | 10/31/03 | | | | 1.08% | | | | 1.08% | | | | 1.09% | | | | 1.09% | |
| | | | | | | | | |
Pacific Tiger Fund (MAPTX) | | | 28.83% | | | | 12.12% | | | | 8.06% | | | | 9.20% | | | | 9/12/94 | | | | 1.08% | | | | 1.06% | 2 | | | 1.08% | | | | 1.05% | 2 |
| | | | | | | | | |
Asia ESG Fund (MASGX) | | | 42.87% | | | | 13.87% | | | | n.a. | | | | 10.65% | | | | 4/30/15 | | | | 1.42% | | | | 1.38% | 3 | | | 1.54% | | | | 1.38% | 3 |
| | | | | | | | | |
Emerging Asia Fund (MEASX) | | | -2.16% | | | | 2.43% | | | | n.a. | | | | 3.29% | | | | 4/30/13 | | | | 1.75% | | | | 1.40% | 3 | | | 1.65% | | | | 1.42% | 3 |
| | | | | | | | | |
Asia Innovators Fund (MATFX) | | | 86.72% | | | | 22.31% | | | | 14.87% | | | | 7.05% | | | | 12/27/99 | | | | 1.10% | | | | 1.10% | | | | 1.19% | | | | 1.19% | |
| | | | | | | | | |
China Fund (MCHFX) | | | 43.05% | | | | 17.98% | | | | 8.05% | | | | 11.20% | | | | 2/19/98 | | | | 1.09% | | | | 1.09% | | | | 1.09% | | | | 1.09% | |
| | | | | | | | | |
India Fund (MINDX) | | | 16.45% | | | | 6.84% | | | | 6.10% | | | | 10.45% | | | | 10/31/05 | | | | 1.15% | | | | 1.15% | | | | 1.11% | | | | 1.11% | |
| | | | | | | | | |
Japan Fund (MJFOX) | | | 29.82% | | | | 11.80% | | | | 10.66% | | | | 7.19% | | | | 12/31/98 | | | | 0.95% | | | | 0.95% | | | | 0.93% | | | | 0.93% | |
| | | | | | | | | |
Korea Fund (MAKOX) | | | 40.77% | | | | 8.88% | | | | 8.38% | | | | 6.79% | | | | 1/3/95 | | | | 1.19% | | | | 1.19% | | | | 1.15% | | | | 1.15% | |
ASIA SMALL COMPANY STRATEGIES | | | | | | | | | | | | | | | | | | | | | | | | | | | | | | | | | | | | |
| | | | | | | | | |
Asia Small Companies Fund (MSMLX) | | | 43.68% | | | | 12.21% | | | | 6.66% | | | | 12.25% | | | | 9/15/08 | | | | 1.57% | | | | 1.39% | 3 | | | 1.60% | | | | 1.41% | 3 |
| | | | | | | | | |
China Small Companies Fund (MCSMX) | | | 82.52% | | | | 25.05% | | | | n.a. | | | | 12.48% | | | | 5/31/11 | | | | 1.52% | | | | 1.43% | 3 | | | 1.62% | | | | 1.38% | 3 |
| † | Annualized performance for periods of at least one year, otherwise cumulative. |
| * | Before fee waivers and expense reimbursement. |
| ** | Expense ratio represents the actual expense ratio a shareholder would have paid if they had been invested the entire year. |
| ‡ | These figures are from the Funds’ prospectus dated as of April 29, 2020, and may differ from the actual expense ratios for fiscal year 2020, as shown in the financial highlights section of this report. |
| § | The Fund’s name changed from Matthews Asia Strategic Income Fund to Matthews Asia Total Return Bond Fund on January 31, 2020. |
| 1 | Matthews has contractually agreed (i) to waive fees and reimburse expenses to the extent needed to limit Total Annual Fund Operating Expenses (excluding Rule 12b-1 fees, taxes, interest, brokerage commissions, short sale dividend expenses, expenses incurred in connection with any merger or reorganization or extraordinary expenses such as litigation) of the Institutional Class to 0.90% first by waiving class specific expenses (i.e., shareholder service fees specific to a particular class) of the Institutional Class and then, to the extent necessary, by waiving non-class specific expenses (e.g., custody fees) of the Institutional Class, and (ii) if any Fund-wide expenses (i.e., expenses that apply to both the Institutional Class and the Investor Class) are waived for the Institutional Class to maintain the 0.90% expense limitation, to waive an equal amount (in annual percentage terms) of those same expenses for the Investor Class. The Total Annual Fund Operating Expenses After Fee Waiver and Expense Reimbursement for the Investor Class may vary from year to year and will in some years exceed 0.90%. Pursuant to this agreement, any amount waived for prior fiscal years with respect to the Matthews Asia Total Return Bond Fund and the Matthews Asia Credit Opportunities Fund is not subject to recoupment. For the Matthews Emerging Markets Equity Fund, if the operating expenses fall below the expense limitation in a year within three years after Matthews has made a waiver or reimbursement, the Fund may reimburse Matthews up to an amount that does not cause the expenses for that year to exceed the lesser of (i) the expense limitation applicable at the time of that fee waiver and/or expense reimbursement or (ii) the expense limitation in effect at the time of recoupment. This agreement will remain in place until April 30, 2022 and may be terminated at any time by the Board of Trustees on behalf of the Fund on 60 days’ written notice to Matthews. Matthews may decline to renew this agreement by written notice to the Trust at least 30 days before its annual expiration date. |
| 2 | Matthews has contractually agreed to waive a portion of its advisory fee and administrative and shareholder services fee if the Fund’s average daily net assets are over $3 billion, as follows: for every $2.5 billion average daily net assets of the Fund that are over $3 billion, the advisory fee rate and the administrative and shareholder services fee rate for the Fund with respect to such excess average daily net assets will be each reduced by 0.01%, in each case without reducing such fee rate below 0.00%. Any amount waived by Matthews pursuant to this agreement may not be recouped by Matthews. This agreement will remain in place until April 30, 2022 and may be terminated (i) at any time by the Board of Trustees upon 60 days’ prior written notice to Matthews; or (ii) by Matthews at the annual expiration date of the agreement upon 60 days’ prior written notice to the Trust, in each case without payment of any penalty. |
| 3 | Matthews has contractually agreed (i) to waive fees and reimburse expenses to the extent needed to limit Total Annual Fund Operating Expenses (excluding Rule 12b-1 fees, taxes, interest, brokerage commissions, short sale dividend expenses, expenses incurred in connection with any merger or reorganization or extraordinary expenses such as litigation) of the Institutional Class to 1.20% first by waiving class specific expenses (i.e., shareholder service fees specific to a particular class) of the Institutional Class and then, to the extent necessary, by waiving non-class specific expenses (e.g., custody fees) of the Institutional Class, and (ii) if any Fund-wide expenses (i.e., expenses that apply to both the Institutional Class and the Investor Class) are waived for the Institutional Class to maintain the 1.20% expense limitation, to waive an equal amount (in annual percentage terms) of those same expenses for the Investor Class. Beginning on December 1, 2020 for the Matthews Emerging Asia Fund, Matthews voluntarily reduced this expense limitation to 1.10% for the Institutional Class and waived a corresponding amount (in annual percentage terms) for the Investor Class. The Total Annual Fund Operating Expenses After Fee Waiver and Expense Reimbursement for the Investor Class may vary from year to year and will in some years exceed 1.20%. If the operating expenses fall below the expense limitation in a year within three years after Matthews has made a waiver or reimbursement, the Fund may reimburse Matthews up to an amount that does not cause the expenses for that year to exceed the lesser of (i) the expense limitation applicable at the time of that fee waiver and/or expense reimbursement or (ii) the expense limitation in effect at the time of recoupment. This agreement will remain in place until April 30, 2022 and may be terminated at any time by the Board of Trustees on behalf of the Fund on 60 days’ written notice to Matthews. Matthews may decline to renew this agreement by written notice to the Trust at least 30 days before its annual expiration date. |
Institutional Class Performance and Expense Ratios (December 31, 2020) (unaudited)
| | | | | | | | | | | | | | | | | | | | | | | | | | | | | | | | | | | | |
| | | | | |
Average Annual Total Return† | | | | | | 2020
Annual
Operating
Expense
Ratios* | | | 2020
Annual
Operating
Expense
Ratios
after Fee
Waiver
and
Expense
Reim- bursement** | | | Prospectus
Expense
Ratios‡ | | | Prospectus
Expense
Ratios
after Fee
Waiver
and
Expense
Reim- bursement‡ | |
| Institutional Class | | 1 year | | | 5 years | | | 10 years | | | Since
Inception | | | Inception
Date | |
GLOBAL EMERGING MARKETS STRATEGY | | | | | | | | | | | | | | | | | | | | | | | | | | | | | | | | | | | | |
| | | | | | | | | |
Emerging Markets Equity Fund (MIEFX) | | | n.a. | | | | n.a. | | | | n.a. | | | | 61.55% | | | | 4/30/20 | | | | 2.65% | | | | 0.90% | 1 | | | 2.57% | | | | 0.90% | 1 |
ASIA FIXED INCOME STRATEGIES | | | | | | | | | | | | | | | | | | | | | | | | | | | | | | | | | | | | |
| | | | | | | | | |
Asia Total Return Bond Fund (MINCX)§ | | | 5.60% | | | | 6.58% | | | | n.a. | | | | 5.23% | | | | 11/30/11 | | | | 1.00% | | | | 0.90% | 1 | | | 0.97% | | | | 0.90% | 1 |
| | | | | | | | | |
Asia Credit Opportunities Fund (MICPX) | | | 2.05% | | | | n.a. | | | | n.a. | | | | 5.41% | | | | 4/29/16 | | | | 0.98% | | | | 0.90% | 1 | | | 1.07% | | | | 0.90% | 1 |
ASIA GROWTH AND INCOME STRATEGIES | | | | | | | | | | | | | | | | | | | | | | | | | | | | | | | | | | | | |
| | | | | | | | | |
Asian Growth and Income Fund (MICSX) | | | 16.18% | | | | 8.53% | | | | 5.52% | | | | 5.68% | | | | 10/29/10 | | | | 0.96% | | | | 0.96% | | | | 0.94% | | | | 0.94% | |
| | | | | | | | | |
Asia Dividend Fund (MIPIX) | | | 31.29% | | | | 12.42% | | | | 8.57% | | | | 8.73% | | | | 10/29/10 | | | | 0.93% | | | | 0.93% | 2 | | | 0.93% | | | | 0.92% | 2 |
| | | | | | | | | |
China Dividend Fund (MICDX) | | | 24.37% | | | | 13.53% | | | | 10.07% | | | | 10.31% | | | | 10/29/10 | | | | 1.02% | | | | 1.02% | | | | 1.01% | | | | 1.01% | |
ASIA GROWTH STRATEGIES | | | | | | | | | | | | | | | | | | | | | | | | | | | | | | | | | | | | |
| | | | | | | | | |
Asia Growth Fund (MIAPX) | | | 47.01% | | | | 17.07% | | | | 10.67% | | | | 10.78% | | | | 10/29/10 | | | | 0.95% | | | | 0.95% | | | | 0.94% | | | | 0.94% | |
| | | | | | | | | |
Pacific Tiger Fund (MIPTX) | | | 28.98% | | | | 12.30% | | | | 8.24% | | | | 8.17% | | | | 10/29/10 | | | | 0.94% | | | | 0.92% | 2 | | | 0.93% | | | | 0.91% | 2 |
| | | | | | | | | |
Asia ESG Fund (MISFX) | | | 43.13% | | | | 14.12% | | | | n.a. | | | | 10.89% | | | | 4/30/15 | | | | 1.29% | | | | 1.20% | 3 | | | 1.41% | | | | 1.20% | 3 |
| | | | | | | | | |
Emerging Asia Fund (MIASX) | | | -1.94% | | | | 2.65% | | | | n.a. | | | | 3.51% | | | | 4/30/13 | | | | 1.62% | | | | 1.19% | 3 | | | 1.51% | | | | 1.20% | 3 |
| | | | | | | | | |
Asia Innovators Fund (MITEX) | | | 87.01% | | | | 22.53% | | | | n.a. | | | | 19.63% | | | | 4/30/13 | | | | 0.95% | | | | 0.95% | | | | 1.05% | | | | 1.05% | |
| | | | | | | | | |
China Fund (MICFX) | | | 43.23% | | | | 18.18% | | | | 8.23% | | | | 7.91% | | | | 10/29/10 | | | | 0.93% | | | | 0.93% | | | | 0.91% | | | | 0.91% | |
| | | | | | | | | |
India Fund (MIDNX) | | | 16.65% | | | | 7.03% | | | | 6.29% | | | | 5.97% | | | | 10/29/10 | | | | 1.03% | | | | 1.03% | | | | 0.94% | | | | 0.94% | |
| | | | | | | | | |
Japan Fund (MIJFX) | | | 29.85% | | | | 11.87% | | | | 10.76% | | | | 11.73% | | | | 10/29/10 | | | | 0.91% | | | | 0.91% | | | | 0.88% | | | | 0.88% | |
| | | | | | | | | |
Korea Fund (MIKOX) | | | 40.76% | | | | 9.00% | | | | 8.52% | | | | 9.24% | | | | 10/29/10 | | | | 1.05% | | | | 1.05% | | | | 1.05% | | | | 1.05% | |
ASIA SMALL COMPANY STRATEGIES | | | | | | | | | | | | | | | | | | | | | | | | | | | | | | | | | | | | |
| | | | | | | | | |
Asia Small Companies Fund (MISMX) | | | 43.90% | | | | 12.44% | | | | n.a. | | | | 8.15% | | | | 4/30/13 | | | | 1.47% | | | | 1.20% | 3 | | | 1.46% | | | | 1.20% | 3 |
| | | | | | | | | |
China Small Companies Fund (MICHX) | | | 82.89% | | | | n.a. | | | | n.a. | | | | 28.63% | | | | 11/30/17 | | | | 1.37% | | | | 1.20% | 3 | | | 1.51% | | | | 1.20% | 3 |
| † | Annualized performance for periods of at least one year, otherwise cumulative. |
| * | Before fee waivers and expense reimbursement. |
| ** | Expense ratio represents the actual expense ratio a shareholder would have paid if they had been invested the entire year. |
| ‡ | These figures are from the Funds’ prospectus dated as of April 29, 2020, and may differ from the actual expense ratios for fiscal year 2020, as shown in the financial highlights section of this report. |
| § | The Fund’s name changed from Matthews Asia Strategic Income Fund to Matthews Asia Total Return Bond Fund on January 31, 2020. |
| 1 | Matthews has contractually agreed to waive fees and reimburse expenses to the extent needed to limit Total Annual Fund Operating Expenses (excluding Rule 12b-1 fees, taxes, interest, brokerage commissions, short sale dividend expenses, expenses incurred in connection with any merger or reorganization or extraordinary expenses such as litigation) of the Institutional Class to 0.90%. Pursuant to this agreement, any amount waived for prior fiscal years with respect to the Matthews Asia Total Return Bond Fund and the Matthews Asia Credit Opportunities Fund is not subject to recoupment. For the Matthews Emerging Markets Equity Fund, if the operating expenses fall below the expense limitation in a year within three years after Matthews has made a waiver or reimbursement, the Fund may reimburse Matthews up to an amount that does not cause the expenses for that year to exceed the lesser of (i) the expense limitation applicable at the time of that fee waiver and/or expense reimbursement or (ii) the expense limitation in effect at the time of recoupment. This agreement will remain in place until April 30, 2022 and may be terminated at any time by the Board of Trustees on behalf of the Fund on 60 days’ written notice to Matthews. Matthews may decline to renew this agreement by written notice to the Trust at least 30 days before its annual expiration date. |
| 2 | Matthews has contractually agreed to waive a portion of its advisory fee and administrative and shareholder services fee if the Fund’s average daily net assets are over $3 billion, as follows: for every $2.5 billion average daily net assets of the Fund that are over $3 billion, the advisory fee rate and the administrative and shareholder services fee rate for the Fund with respect to such excess average daily net assets will be each reduced by 0.01%, in each case without reducing such fee rate below 0.00%. Any amount waived by Matthews pursuant to this agreement may not be recouped by Matthews. This agreement will remain in place until April 30, 2022 and may be terminated (i) at any time by the Board of Trustees upon 60 days’ prior written notice to Matthews; or (ii) by Matthews at the annual expiration date of the agreement upon 60 days’ prior written notice to the Trust, in each case without payment of any penalty. |
| 3 | Matthews has contractually agreed to waive fees and reimburse expenses to the extent needed to limit Total Annual Fund Operating Expenses (excluding Rule 12b-1 fees, taxes, interest, brokerage commissions, short sale dividend expenses, expenses incurred in connection with any merger or reorganization or extraordinary expenses such as litigation) of the Institutional Class to 1.20%. Beginning on December 1, 2020 for the Matthews Emerging Asia Fund, Matthews voluntarily reduced this expense limitation to 1.10% for the Institutional Class. If the operating expenses fall below the expense limitation in a year within three years after Matthews has made a waiver or reimbursement, the Fund may reimburse Matthews up to an amount that does not cause the expenses for that year to exceed the lesser of (i) the expense limitation applicable at the time of that fee waiver and/or expense reimbursement or (ii) the expense limitation in effect at the time of recoupment. This agreement will remain in place until April 30, 2022 and may be terminated at any time by the Board of Trustees on behalf of the Fund on 60 days’ written notice to Matthews. Matthews may decline to renew this agreement by written notice to the Trust at least 30 days before its annual expiration date. |
Past Performance: All performance quoted in this report is past performance and is no guarantee of future results. Investment return and principal value will fluctuate with changing market conditions so that when redeemed, shares may be worth more or less than their original cost. Current performance may be lower or higher than the returns quoted. If certain of the Funds’ fees and expenses had not been waived, returns would have been lower. For the Funds’ most recent month-end performance, please call 800.789.ASIA (2742) or visit matthewsasia.com.
| | | | |
| matthewsasia.com | 800.789.ASIA | | | 3 | |

Cover photo: Terraced fields at Yunnan, China
This report has been prepared for Matthews International Funds (d/b/a Matthews Asia Funds) shareholders. It is not authorized for distribution to prospective investors unless accompanied or preceded by a current Matthews Asia Funds prospectus, which contains more complete information about the Funds’ investment objectives, risks and expenses. Additional copies of the prospectus or summary prospectus may be obtained at matthewsasia.com. Please read the prospectus carefully before you invest or send money.
The views and opinions in this report were current as of December 31, 2020. They are not guarantees of performance or investment results and should not be taken as investment advice. Investment decisions reflect a variety of factors, and the managers reserve the right to change their views about individual stocks, sectors and the markets at any time. As a result, the views expressed should not be relied upon as a forecast of a Fund’s future investment intent. Current and future portfolio holdings are subject to risk.
Statements of fact are from sources considered reliable, but neither the Funds nor the Investment Advisor makes any representation or guarantee as to their completeness or accuracy.
Contents
*The Fund’s name changed from Matthews Asia Strategic Income Fund to Matthews Asia Total Return Bond Fund on January 31, 2020.
Investment Risk: Mutual fund shares are not deposits or obligations of, or guaranteed by, any depositary institution. Shares are not insured by the FDIC, Federal Reserve Board or any government agency and are subject to investment risks, including possible loss of principal amount invested. Investing in international and emerging markets may involve additional risks, such as social and political instability, market illiquidity, exchange-rate fluctuations, a high level of volatility and limited regulation. Fixed income investments are subject to additional risks, including, but not limited to, interest rate, credit and inflation risks. In addition, single-country and sector funds may be subject to a higher degree of market risk than diversified funds because of a concentration in a specific industry, sector or geographic location. Investing in small and mid-size companies is more risky than investing in large companies as they may be more volatile and less liquid than larger companies. Please see the Funds’ Prospectuses and Statement of Additional Information for more risk disclosure.
| | | | |
| matthewsasia.com | 800.789.ASIA | | | 5 | |
Message to Shareholders from the President of Matthews Asia Funds
Dear Valued Shareholder,
For most of us, 2020 will be remembered for being an unprecedented year, with the depth and duration of COVID-19 affecting global economic activity and markets across the world. Of course, as we look back, what is most important is not the economic impact but the human one. With that, our thoughts are with all those that have been impacted by the virus, either directly or indirectly, and we extend our gratitude to all health care professionals, scientists and service providers who have diligently worked to help and provide care to those in need around the world.
Notably, we at Matthews Asia are no strangers to operating through health crises, with the infectious diseases SARS, MERS and swine flu all occurring this century. Their ability to cause disruption was fortunately temporary and we hope that the same will be said of the pandemic we currently face. During outbreaks such as COVID-19, our primary objective is the health and well-being of our employees and their families, consideration for our shareholders and our service providers and the continuity of business operations to ensure our portfolios can be managed without interruption. In this regard, I am particularly proud of how our firm has responded despite the significant disruption to daily life that has occurred.
Performance
Against a backdrop of a pandemic, we witnessed an initial collapse in economic activity and plunges in stock markets around the world. Remarkably, however, 2020 may also be remembered for the surprising strength of markets as investors began to reappraise their outlook. This is particularly true of Asia, where control over the pandemic enabled a return to normality and economic output for many of its countries long before those in the West. Following the tumult of the first quarter, equity markets across much of the globe reversed course in the second half of the year. We then saw an uptick in sentiment in the fourth quarter, largely driven by the development and rollout of the coronavirus vaccines as well as prospects for improving China—U.S. relations with the election of a new U.S. president.
We are accustomed to these kinds of swings in markets, given our long history of focusing on Asia. This strengthens our resolve to remain focused on our core investment principles with a bottom-up approach and long-range view. While the lockdowns have limited the amount of travel that our analysts and portfolio managers can do to visit companies, our investment team was still able to conduct 15-20 virtual meetings each a day on average across the team, starting early in the morning and continuing late into the night, to catch the working day in Asia on behalf of our shareholders. Amid the volatile environment, I am proud of the positive relative and absolute performance delivered across most of the Matthews Asia Funds.
Emerging Markets
Despite a challenging year, we successfully launched the Matthews Emerging Markets Equity Fund—an important milestone for Matthews Asia as it is our first strategy to invest in broad emerging markets. For almost 30 years, we have focused our research and investment capabilities within a region that now dominates the emerging markets. Asia’s representation within the MSCI Emerging Market Index has risen to over 75%, with the increasing inclusion of China’s domestically listed A-shares driving recent changes in benchmark weightings. As an Asia investment specialist, we have significant experience investing in the complex and diverse range of countries and economies that comprise the largest segment of emerging markets. We believe we can leverage this expertise in other emerging markets and apply the same established fundamental investment process in order to evaluate a company, its management team and corporate governance.
ESG
We recognize that a growing number of investors are looking for strategies that have ESG integration, particularly given events over the past 12 months. A deep appreciation of corporate governance is built into our DNA and our investment approach has always been committed to assessing corporate governance. We believe governance influences social and environmental factors, providing a starting point for analysis. At Matthews Asia, we remain committed to incorporating ESG considerations within the very fabric of our investment process. We continue to look at integrating ESG practices into our portfolios and further enhancing our ESG capabilities. While strong corporate governance, as well as good ESG practices, may show little direct link to short-term stock performance, we believe they are critical to delivering long-term, risk-adjusted shareholder value.
The New Matthewsasia.com Website
In December, we launched the newly designed matthewsasia.com website. With a visually engaging design, our new website provides a faster, easier navigation experience—whether on your mobile, tablet or desktop—for quicker access to information and content, including
new scrollable Funds section with fewer tabs and fewer clicks. The site includes a new Insights section that makes finding and accessing content easier with curated articles, whitepapers, webcasts, podcasts and videos that bring Asia to you with rich imagery for a more immersive web experience. We hope you enjoy exploring the new website with its enhanced search function that allows you to explore our extensive resources on Asia and to more easily find the information on your investments and thought leadership from the investment team.
Looking Ahead to 2021
While uncertainty remains as we head into the New Year, we look forward to a successful rollout of vaccinations and the return to normal daily patterns prior to the pandemic. We will continue to maintain a thoughtful but opportunistic approach to identify the most attractive long-term investment opportunities, and we remain steadfast in our investment approach on developing deep insights through fundamental research on behalf of our clients. We take seriously the stewardship of your assets and thank you for being a valued shareholder during what has been a particularly tumultuous and challenging year.

William J. Hackett
President of Matthews Asia Funds
| | | | |
| matthewsasia.com | 800.789.ASIA | | | 7 | |
Message to Shareholders from the
Investment Advisor
Dear Valued Shareholders,
I don’t know if I have ever experienced such a strange year. Perhaps that is a common sentiment. However, I refer less to the lockdown. Nor do I refer about work so much. We were able to keep in touch with each other through technology and socially distanced face-to-face meetings. Through the same use of video conference calls, we were able to maintain contact with companies, both familiar and new. We were able to adapt—we were given lemons and we made lemonade. In many respects, performance of the portfolios has been excellent; so it is hard to see how the environment disadvantaged our investors. Nevertheless, our investment team are all to be congratulated by the way they responded to the environment and continued to make decisions on behalf of clients.
No, none of that has been too strange. But the markets themselves? There, I do pause for thought. Given the set of circumstances we have faced—political, economic and emotional—I would not have expected markets to do so well. So, why have they?
Perhaps we need to go back to the beginning. At least from a market perspective, our initial reaction was sanguine. After all, China had faced things like this before and had dealt with them. In the past, such episodes had little long-term effect on the markets. This turned out, in hindsight, to be more or less true for the current virus, but only for China, which reacted in a way largely consistent with previous outbreaks. For the rest of the world, however, it didn’t start out that way. The economic effects of the lockdown hit hard on expectations of current sales and profits. Only in the virtual world were businesses somewhat protected from the worst, as people could transact with total physical distance.
The virus spread far wider than previous outbreaks and the economic effects were deeper and longer-lasting than we ever suspected. And yet, the idea that this was a temporary disruption to the general trend of economic and human progress has never really gone away. Markets were able to see through the near term and still believe in a “normal” future. So, when the dampening effects of weak current economic activity and raised household savings caused bond yields to fall across much of the world outside of China, valuations soared. After all, if you are able to discount a normal future at abnormally low interest rates, then price-to-earnings ratios (valuation ratio of a company’s current share price compared to its per-share earnings) should be much higher. So, the equity market saw a positive future while bond yields were suppressed by low demand for goods and the persistent lack of demand for new investment that has been a commonplace of recent years.
And so it has been a topsy-turvy world in many ways. Perhaps white is the new black—“watch out when things get better, they may get worse!” In any other year, I might feel self-conscious writing such phrases; but not this year. For I can see it is entirely possible that, in the face of a vaccine and a recovery in economic activity, bond yields may rise again and those valuations that seemed justified may suddenly become unrealistic. Now, how much of a concern is this?
It’s undeniable that some of these valuation effects have helped performance in your portfolios this past year. However, these effects are mitigated by several factors. First, of course, we are aware of these effects and always strive to own securities whose valuations are justifiable in the face of their long-term business prospects. Second, we have been trying to take advantage of those businesses which have suffered most from the direct effects of the lockdown. These are not poor businesses but businesses that many investors have overlooked simply because they have been fascinated by the momentum elsewhere. And finally, when we look at the strange interaction between weak activity, collapsing bond yields and high valuations on weak profits that has been the heady, if startling, recipe of
2020, it is perhaps least in evidence in China—economic activity has bounced back earlier and stronger than elsewhere and bond yields are, for want of a better word, “normal.”
As I look into 2021, the dislocations in the markets that may happen from a return to normality may be more keenly felt in those markets where normal conditions have been suspended the longest. It’s not hard to imagine a vaccine-inspired end of lockdowns in the U.S. and the West leading to a burst of inflationary pressures as demand returns more swiftly than supply, people pay down precautionary savings and enjoy a return to normal spending patterns. My expectation in such a case would be for bond yields to rise and valuations in the most extended parts of all markets, particularly the U.S. and Europe, to revert to something more normal. However, my relative optimism for Asia and the emerging markets extends beyond these short-term effects. In the U.S. we have already seen the first suggestions of a return to more friendly policy internationally, a more pro-labor stance and an administration likely to be supportive of fiscal and monetary expansion. All of this brings the U.S. belatedly in line with some policies that have already been prevalent in Asia for the past decade, to the detriment of Asia’s relative market performance but the benefit of the internal stability of their societies.
The common perception among asset allocators, both in the U.S. and abroad, appears to be that a period of a slightly weaker dollar is the most likely outcome in the currency markets. There is a renewed willingness to look at international markets in general and emerging and Asian markets in particular. I wish the fortunes of these markets were not so tightly tied in the short-run to the direction of the U.S. dollar, but that seems to be one constant of the world. I believe it is a relationship that will gradually weaken along with the continuing development of China’s own capital markets and the likelihood that it will continue to be an international investor. Nevertheless, a weaker dollar, if that is indeed to happen, is an important tailwind for our markets.
And if a weaker dollar should focus investors’ attention a little more on the long-term trends we seek, so much the better. We still believe that one can prosper over the long term by finding businesses that are the leaders of the development of a world class health care industry, indigenous innovation in technology hardware and online business models, the growth and domination of local brand leaders in more traditional business, and the modernization and development of capital markets to support efficient and sustainable growth for more than half the world’s population. So, even in a topsy-turvy 2020, and maybe a turvy-topsy 2021, that is what we will continue to try and do.

Robert Horrocks, PhD
Chief Investment Officer
Matthews International Capital Management, LLC
| | | | |
| matthewsasia.com | 800.789.ASIA | | | 9 | |

| | | | |
| PORTFOLIO MANAGERS |
| |
| John Paul Lech | | |
Lead Manager | | |
|
| FUND FACTS |
| | |
| | | Investor | | Institutional |
Ticker | | MEGMX | | MIEFX |
CUSIP | | 577130651 | | 577130644 |
Inception | | 4/30/20 | | 4/30/20 |
NAV | | $15.76 | | $15.77 |
Initial Investment | | $2,500 | | $100,000 |
Gross Expense Ratio1 | | 2.76% | | 2.65% |
After fee waiver and Reimbursement2 | | 1.08% | | 0.90% |
Portfolio Statistics |
Total # of Positions | | | | 58 |
Net Assets | | | | $44.8 million |
Weighted Average Market Cap | | $154.2 billion |
Portfolio Turnover3 | | | | 62.3% |
Benchmark | | |
MSCI Emerging Markets Index |
OBJECTIVE
Long-term capital appreciation.
STRATEGY
Under normal circumstances, the Matthews Emerging Markets Equity Fund seeks to achieve its investment objective by investing at least 80% of its net assets, which include borrowings for investment purposes, in the common and preferred stocks of companies located in emerging market countries. Emerging market countries generally include every country in the world except the United States, Australia, Canada, Hong Kong, Israel, Japan, New Zealand, Singapore and most of the countries in Western Europe. Certain emerging market countries may also be classified as “frontier” market countries, which are a subset of emerging market countries with newer or even less developed economies and markets, such as Sri Lanka and Vietnam. The list of emerging market countries and frontier market countries may change from time to time. The Fund may also invest in companies located in developed countries; however, the Fund may not invest in any company located in a developed country if, at the time of purchase, more than 20% of the Fund’s assets are invested in developed market companies.
Matthews Emerging Markets Equity Fund
Portfolio Manager Commentary (unaudited)
The Matthews Emerging Markets Equity Fund launched on April 30, 2020. From inception to December 31, 2020, the Fund returned 61.23% (Investor Class) and 61.55% (Institutional Class), while its benchmark, the MSCI Emerging Markets Index, returned 42.23%. For the quarter ending December 31, 2020, the Fund returned 22.15% (Investor Class) and 22.30% (Institutional Class) versus 19.77% for the index.
Market Environment:
Global equities were volatile in the year, but ultimately generated attractive returns, and this was particularly pronounced in Asian and emerging markets more broadly. Global markets fell in the first quarter, as worries surrounding the spread of COVID-19 moved beyond China. Fears of a global growth slowdown turned into reality as governments worldwide began to implement different versions of ‘shelter in place’ to contain the movement of the virus. Markets recovered in part due to the extraordinary fiscal and monetary measures put in place by many countries. Early in the year, cyclically sensitive sectors like energy, materials, industrials and financials suffered most while companies related to communication services and technology performed better. In the second quarter, most global financial markets, including Asia’s, began to rise as major economies began to relax prior pandemic-related restrictions. The gradual reopening of businesses—especially those focused on services and consumption—helped bolster sentiment and bring a floor to stock prices globally.
In the third quarter, economic recovery and improved sentiment began to take hold as major economies continued to relax COVID-19 lockdown restrictions even further. China’s V-shaped recovery in manufacturing along with a steady recovery in domestic consumption brought some normalcy to daily life. Emerging market currencies rallied slightly against the US dollar in the third quarter, acting as a slight tailwind for EM equities. Growth stocks outpaced value and small caps outperformed large caps in the third quarter. The fourth quarter saw further economic strengthening. Cyclical stocks in beaten up or export driven markets such as Indonesia and Korea rallied most in the fourth quarter, while markets that experienced early recovery like China, Japan and India lagged slightly. Market strength gained momentum following the U.S. Presidential elections in November as markets hoped for less confrontational U.S.—China relations, combined with an announcement of several approved COVID-19 vaccines that were due for distribution early in 2021.
Performance Contributors and Detractors:
For the fourth quarter, stock selection in China and Hong Kong was a notable contributor to performance from a regional perspective. On the other hand, stock selection in South Korea was a detractor. From a sector perspective, stock selection in communication services and financials was a contributor. Meanwhile, stock selection in energy and an overweight in real estate were slight detractors.
Samsung Electronics was a major contributor to portfolio returns in the fourth quarter as expectations regarding the company’s semiconductor business, which is the majority of the firm’s profitability, remain positive. The semiconductor
(continued)
| 1 | Actual 2020 expense ratios. |
| 2 | Matthews has contractually agreed (i) to waive fees and reimburse expenses to the extent needed to limit Total Annual Fund Operating Expenses (excluding Rule 12b-1 fees, taxes, interest, brokerage commissions, short sale dividend expenses, expenses incurred in connection with any merger or reorganization or extraordinary expenses such as litigation) of the Institutional Class to 0.90% first by waiving class specific expenses (i.e., shareholder service fees specific to a particular class) of the Institutional Class and then, to the extent necessary, by waiving non-class specific expenses (e.g., custody fees) of the Institutional Class, and (ii) if any Fund-wide expenses (i.e., expenses that apply to both the Institutional Class and the Investor Class) are waived for the Institutional Class to maintain the 0.90% expense limitation, to waive an equal amount (in annual percentage terms) of those same expenses for the Investor Class. The Total Annual Fund Operating Expenses After Fee Waiver and Expense Reimbursement for the Investor Class may vary from year to year and will in some years exceed 0.90%. If the operating expenses fall below the expense limitation in a year within three years after Matthews has made a waiver or reimbursement, the Fund may reimburse Matthews up to an amount that does not cause the expenses for that year to exceed the lesser of (i) the expense limitation applicable at the time of that fee waiver and/or expense reimbursement or (ii) the expense limitation in effect at the time of recoupment. This agreement will remain in place until April 30, 2022 and may be terminated at any time by the Board of Trustees on behalf of the Fund on 60 days’ written notice to Matthews. Matthews may decline to renew this agreement by written notice to the Trust at least 30 days before its annual expiration date. |
| 3 | The lesser of fiscal year 2020 long-term purchase costs or sales proceeds divided by the average monthly market value of long-term securities. |
| | | | | | | | | | | | |
| | | |
| PERFORMANCE AS OF DECEMBER 31, 2020 | | | | | | |
| | | | | | Actual Return,
Not Annualized | |
| | | 3 Months | | | Since
Inception | | | Inception
date | |
| Investor Class (MEGMX) | | | 22.15% | | | | 61.23% | | | | 04/30/20 | |
| Institutional Class (MIEFX) | | | 22.30% | | | | 61.55% | | | | 04/30/20 | |
| MSCI Emerging Markets Index4 | | | 19.77% | | | | 42.23% | | | | | |
Performance assumes reinvestment of all dividends and/or distributions before taxes. All performance quoted represents past performance and is no guarantee of future results. Investment return and principal value will fluctuate with market conditions so that when redeemed, shares may be worth more or less than their original cost. Current performance may be lower or higher than the return figures quoted. Returns would have been lower if certain of the Fund’s fees and expenses had not been waived. For the Fund’s most recent month-end performance visit matthewsasia.com.
GROWTH OF A HYPOTHETICAL $10,000 INVESTMENT SINCE INCEPTION—INVESTOR CLASS
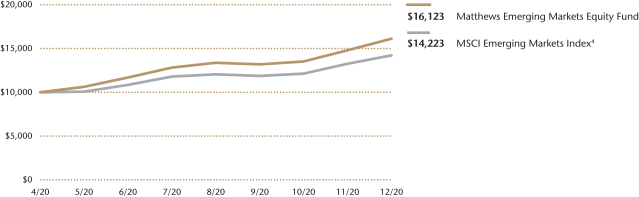
Plotted monthly. The performance data and graph do not reflect the deduction of taxes that a shareholder would pay on dividends, capital gains distributions or redemption of Fund shares. Values are in US$.
| | 4 | It is not possible to invest directly in an index. Source: Index data from Morgan Stanley Capital International and Bloomberg; total return calculations performed by BNY Mellon Investment Servicing (US) Inc. Please see page 93 for index definition. |
| | | | | | | | |
| | | | |
| TOP TEN HOLDINGS5 | | | | | | | |
| | | Sector | | Country | | % of Net Assets | |
| Samsung Electronics Co., Ltd., Pfd. | | Information Technology | | South Korea | | | 5.8% | |
| Taiwan Semiconductor Manufacturing Co., Ltd. | | Information Technology | | Taiwan | | | 5.8% | |
| Alibaba Group Holding, Ltd. | | Consumer Discretionary | | China/Hong Kong | | | 3.9% | |
| Tencent Holdings, Ltd. | | Communication Services | | China/Hong Kong | | | 3.2% | |
| AIA Group, Ltd. | | Financials | | China/Hong Kong | | | 3.0% | |
| LVMH Moet Hennessy Louis Vuitton SE | | Consumer Discretionary | | France | | | 2.6% | |
| LUKOIL PJSC | | Energy | | Russia | | | 2.1% | |
| CapitaLand, Ltd. | | Real Estate | | Singapore | | | 2.0% | |
| Heineken N.V. | | Consumer Staples | | Netherlands | | | 2.0% | |
| Kotak Mahindra Bank, Ltd. | | Financials | | India | | | 2.0% | |
| % OF ASSETS IN TOP 10 | | | | | | | 32.4% | |
| | 5 | Holdings may combine more than one security from same issuer and related depositary receipts. |
| | | | |
| matthewsasia.com | 800.789.ASIA | | | 11 | |
Matthews Emerging Markets Equity Fund
Portfolio Manager Commentary (unaudited) (continued)
business can be divided between memory and logic, both of which are becoming more consolidated. We believe Samsung Electronics’ governance, balance sheet and competitive position are all attractive attributes.
On the other hand, Anhui Conch Cement was a slight detractor. The company is considered a leader in its industry with some of the lowest costs and a good history of capital allocation. We remain positive on the company’s prospects as its core product is an essential component of any increase in construction or infrastructure spending.
Notable Portfolio Changes:
The year’s market volatility required an active approach to portfolio construction and we initiated positions over the fourth quarter. We added Allegro, an e-commerce company in Poland that does more than 10 times the gross merchandise value (GMV) of its next largest competitor. In China, we augmented our holdings in the consumer discretionary by adding JD.com which has a growing business in grocery delivery—an underpenetrated segment of online retail. We also added a position in Grupo Aeroportuario del Sureste, which operates several airports across Mexico and could be a beneficiary of increased travel once vaccinations against COVID-19 become more widely implemented.
Outlook:
Looking back at an extraordinary year, North Asia handled the pandemic significantly better than other parts of the world, and this was largely reflected in the outperformance of the MSCI Emerging Markets Asia Index from the March lows versus the rest of emerging markets. When considering this outperformance, it is important to remember that equities are fundamentally an anticipatory asset class: What has happened is less important than what is likely to happen and how fast potential changes may happen.
In the year ahead, we will continue to look for good investment opportunities across a broad swath of geographies including Southeast Asia, Russia and Brazil. In all markets, we believe fundamental research is the name of the game. We find that China in particular is a market where looking beyond the leading companies could prove fruitful to active investors. The incoming Biden administration in the U.S. may decrease the vitriol and unpredictability that has existed between the U.S. and China. A more predictable relationship is a positive development for markets globally. Risks in 2021 include the potential for an uneven global economic recovery, but we are also focused on political and ESG risks. In terms of currency moves, the consensus view is for a weakening U.S. dollar versus many emerging market currencies.
Thematically, we are thinking in terms of a re-opening and the “next normal.” The key is to separate companies that artificially benefit from the pandemic from companies where long-term fundamentals have been catalytically charged by it. We are encouraged by the rapid scientific progress related to the vaccines. In the third quarter of 2020, many analysts were hoping for a vaccine with perhaps 50% effectiveness. So, distribution challenges aside, the announcement of multiple vaccines with 80%+ effectiveness during the fourth quarter should be seen as positive news. Strong local currencies and a re-opening of the world economy bode well for emerging markets to potentially offer attractive equity gains in 2021.
| | | | |
| |
| COUNTRY ALLOCATION (%)6,7 | |
| China/Hong Kong | | | 30.0 | |
| South Korea | | | 11.9 | |
| India | | | 11.2 | |
| Brazil | | | 6.3 | |
| Taiwan | | | 5.8 | |
| Russia | | | 5.4 | |
| Singapore | | | 3.3 | |
| Mexico | | | 3.2 | |
| Poland | | | 3.1 | |
| France | | | 2.6 | |
| Netherlands | | | 2.0 | |
| United Kingdom | | | 1.8 | |
| Indonesia | | | 1.7 | |
| Canada | | | 1.6 | |
| Philippines | | | 1.3 | |
| Peru | | | 1.3 | |
| Argentina | | | 1.3 | |
| South Africa | | | 1.1 | |
| Vietnam | | | 0.7 | |
| Cyprus | | | 0.4 | |
| Cash and Other Assets, Less Liabilities | | | 4.0 | |
| | | | |
| |
| SECTOR ALLOCATION (%)7 | |
| Information Technology | | | 19.3 | |
| Consumer Discretionary | | | 18.6 | |
| Financials | | | 17.7 | |
| Communication Services | | | 9.0 | |
| Materials | | | 6.7 | |
| Health Care | | | 6.6 | |
| Energy | | | 5.2 | |
| Consumer Staples | | | 5.0 | |
| Industrials | | | 4.0 | |
| Real Estate | | | 3.9 | |
| Cash and Other Assets, Less Liabilities | | | 4.0 | |
| | | | |
| |
| MARKET CAP EXPOSURE (%)7 | |
| Mega Cap (over $25B) | | | 57.4 | |
| Large Cap ($10B–$25B) | | | 18.6 | |
| Mid Cap ($3B–10B) | | | 12.1 | |
| Small Cap (under $3B) | | | 7.8 | |
| Cash and Other Assets, Less Liabilities | | | 4.0 | |
| 6 | Not all countries where the Fund may invest are included in the benchmark index. |
| 7 | Source: FactSet Research Systems. Percentage values in data are rounded to the nearest tenth of one percent, so the values may not sum to 100% due to rounding. Country allocations and percentage values may be derived from different data sources and may not be consistent with other Fund literature. |
Matthews Emerging Markets Equity Fund
December 31, 2020
Schedule of Investmentsa
COMMON EQUITIES: 90.2%
| | | | | | | | |
| | | Shares | | | Value | |
| | |
| CHINA/HONG KONG: 30.0% | | | | | | | | |
Tencent Holdings, Ltd. | | | 20,200 | | | | $1,453,467 | |
| | |
AIA Group, Ltd. | | | 108,600 | | | | 1,323,413 | |
| | |
Alibaba Group Holding, Ltd.b | | | 37,700 | | | | 1,096,487 | |
| | |
Ping An Insurance Group Co. of China, Ltd. A Shares | | | 67,100 | | | | 897,912 | |
| | |
Midea Group Co., Ltd. A Shares | | | 56,400 | | | | 849,407 | |
| | |
Bilibili, Inc. ADRb | | | 9,800 | | | | 840,056 | |
| | |
Yum China Holdings, Inc. | | | 13,900 | | | | 793,551 | |
| | |
Wuxi Biologics Cayman, Inc.b,c,d | | | 59,000 | | | | 782,419 | |
| | |
Techtronic Industries Co., Ltd. | | | 50,000 | | | | 714,671 | |
| | |
Alibaba Group Holding, Ltd. ADRb | | | 2,800 | | | | 651,644 | |
| | |
Anhui Conch Cement Co., Ltd. A Shares | | | 81,400 | | | | 647,105 | |
| | |
Lepu Medical Technology Beijing Co., Ltd. A Shares | | | 154,242 | | | | 644,763 | |
| | |
JD.com, Inc. ADRb | | | 6,600 | | | | 580,140 | |
| | |
JD Health International, Inc.b,c,d | | | 29,400 | | | | 568,853 | |
| | |
China International Capital Corp., Ltd. H Sharesb,c,d | | | 206,000 | | | | 558,517 | |
| | |
Estun Automation Co., Ltd. A Sharesb | | | 117,000 | | | | 537,070 | |
| | |
Jiumaojiu International Holdings, Ltd.b,c,d | | | 161,000 | | | | 490,584 | |
| | | | | | | | |
Total China/Hong Kong | | | | | | | 13,430,059 | |
| | | | | | | | |
| | | | | | | | |
| | | |
| INDIA: 11.2% | | | | | | | | |
Kotak Mahindra Bank, Ltd.b | | | 33,183 | | | | 906,914 | |
| | |
Infosys, Ltd. ADR | | | 43,100 | | | | 730,545 | |
| | |
HDFC Bank, Ltd. ADRb | | | 9,700 | | | | 700,922 | |
| | |
Reliance Industries, Ltd. | | | 22,763 | | | | 619,357 | |
| | |
Colgate-Palmolive India, Ltd. | | | 25,684 | | | | 550,933 | |
| | |
Aditya Birla Capital, Ltd.b | | | 436,712 | | | | 508,062 | |
| | |
PI Industries, Ltd. | | | 16,884 | | | | 507,694 | |
| | |
Dr. Reddy’s Laboratories, Ltd. ADR | | | 6,800 | | | | 484,772 | |
| | | | | | | | |
Total India | | | | | | | 5,009,199 | |
| | | | | | | | |
| | | | | | | | |
| | | |
| BRAZIL: 6.3% | | | | | | | | |
Banco BTG Pactual SA | | | 38,400 | | | | 694,035 | |
| | |
Vale SA ADR | | | 39,100 | | | | 655,316 | |
| | |
Pagseguro Digital, Ltd. Class Ab | | | 10,300 | | | | 585,864 | |
| | |
Hapvida Participacoes e Investimentos SAc,d | | | 158,500 | | | | 467,615 | |
| | |
Magazine Luiza SA | | | 91,200 | | | | 437,319 | |
| | | | | | | | |
Total Brazil | | | | | | | 2,840,149 | |
| | | | | | | | |
| | | | | | | | |
| | | |
| SOUTH KOREA: 6.1% | | | | | | | | |
LG Household & Health Care, Ltd. | | | 510 | | | | 761,188 | |
| | |
Hugel, Inc.b | | | 3,372 | | | | 583,375 | |
| | |
Macquarie Korea Infrastructure Fund | | | 50,756 | | | | 497,990 | |
| | |
Kia Motors Corp. | | | 7,876 | | | | 453,790 | |
| | |
NAVER Corp. | | | 1,614 | | | | 435,085 | |
| | | | | | | | |
Total South Korea | | | | | | | 2,731,428 | |
| | | | | | | | |
| | | | | | | | |
| | | |
| TAIWAN: 5.8% | | | | | | | | |
Taiwan Semiconductor Manufacturing Co., Ltd. | | | 138,000 | | | | 2,610,611 | |
| | | | | | | | |
Total Taiwan | | | | | | | 2,610,611 | |
| | | | | | | | |
| | | | | | | | |
| | | |
| RUSSIA: 5.8% | | | | | | | | |
LUKOIL PJSC ADR | | | 14,063 | | | | 956,467 | |
| | |
Novatek PJSC GDRd | | | 4,556 | | | | 741,934 | |
| | |
Yandex N.V. Class Ab | | | 10,500 | | | | 730,590 | |
| | |
Polymetal International PLC | | | 7,700 | | | | 177,256 | |
| | | | | | | | |
Total Russia | | | | | | | 2,606,247 | |
| | | | | | | | |
| | | | | | | | |
| | | Shares | | | Value | |
| | |
| MEXICO: 3.8% | | | | | | | | |
Prologis Property Mexico SA de CV, REIT | | | 380,638 | | | | $853,875 | |
| | |
Grupo Aeroportuario del Sureste S.A.B. de CV. ADRb | | | 3,400 | | | | 560,762 | |
| | |
Fresnillo PLC | | | 18,347 | | | | 283,380 | |
| | | | | | | | |
Total Mexico | | | | | | | 1,698,017 | |
| | | | | | | | |
| | | | | | | | |
| | | |
| SINGAPORE: 3.3% | | | | | | | | |
CapitaLand, Ltd. | | | 366,000 | | | | 908,145 | |
| | |
Sea, Ltd. ADRb | | | 2,800 | | | | 557,340 | |
| | | | | | | | |
Total Singapore | | | | | | | 1,465,485 | |
| | | | | | | | |
| | | | | | | | |
| | | |
| POLAND: 3.1% | | | | | | | | |
Allegro.eu SAb,c,d | | | 30,763 | | | | 697,493 | |
| | |
LiveChat Software SA | | | 24,646 | | | | 692,730 | |
| | | | | | | | |
Total Poland | | | | | | | 1,390,223 | |
| | | | | | | | |
| | | | | | | | |
| | | |
| FRANCE: 2.6% | | | | | | | | |
LVMH Moet Hennessy Louis Vuitton SE | | | 1,836 | | | | 1,149,339 | |
| | | | | | | | |
Total France | | | | | | | 1,149,339 | |
| | | | | | | | |
| | | | | | | | |
| | | |
| NETHERLANDS: 2.0% | | | | | | | | |
Heineken N.V. | | | 8,147 | | | | 907,893 | |
| | | | | | | | |
Total Netherlands | | | | | | | 907,893 | |
| | | | | | | | |
| | | | | | | | |
| | | |
| INDONESIA: 1.7% | | | | | | | | |
PT Bank Rakyat Indonesia Persero | | | 2,488,300 | | | | 739,780 | |
| | | | | | | | |
Total Indonesia | | | | | | | 739,780 | |
| | | | | | | | |
| | | | | | | | |
| | | |
| ZAMBIA: 1.6% | | | | | | | | |
First Quantum Minerals, Ltd. | | | 40,300 | | | | 723,431 | |
| | | | | | | | |
Total Zambia | | | | | | | 723,431 | |
| | | | | | | | |
| | | | | | | | |
| | | |
| PERU: 1.3% | | | | | | | | |
Credicorp, Ltd. | | | 3,600 | | | | 590,472 | |
| | | | | | | | |
Total Peru | | | | | | | 590,472 | |
| | | | | | | | |
| | | | | | | | |
| | | |
| ARGENTINA: 1.3% | | | | | | | | |
Globant SAb | | | 2,700 | | | | 587,547 | |
| | | | | | | | |
Total Argentina | | | | | | | 587,547 | |
| | | | | | | | |
| | | | | | | | |
| | | |
| PHILIPPINES: 1.3% | | | | | | | | |
Wilcon Depot, Inc. | | | 1,602,300 | | | | 565,079 | |
| | | | | | | | |
Total Philippines | | | | | | | 565,079 | |
| | | | | | | | |
| | | | | | | | |
| | | |
| UNITED KINGDOM: 1.2% | | | | | | | | |
Avast PLCc,d | | | 73,218 | | | | 537,623 | |
| | | | | | | | |
Total United Kingdom | | | | | | | 537,623 | |
| | | | | | | | |
| | | | | | | | |
| | | |
| SOUTH AFRICA: 1.1% | | | | | | | | |
Discovery, Ltd. | | | 46,887 | | | | 490,169 | |
| | | | | | | | |
Total South Africa | | | | | | | 490,169 | |
| | | | | | | | |
| | | | | | | | |
| | | |
| VIETNAM: 0.7% | | | | | | | | |
FPT Corp. | | | 120,914 | | | | 309,358 | |
| | | | | | | | |
Total Vietnam | | | | | | | 309,358 | |
| | | | | | | | |
| | | | | | | | |
| | |
| TOTAL COMMON EQUITIES | | | | 40,382,109 | |
| | | | | | | | |
(Cost $34,381,230) | | | | | | | | |
| | | | |
| matthewsasia.com | 800.789.ASIA | | | 13 | |
Matthews Emerging Markets Equity Fund
December 31, 2020
Schedule of Investmentsa (continued)
PREFERRED EQUITIES: 5.8%
| | | | | | | | |
| | | Shares | | | Value | |
|
| SOUTH KOREA: 5.8% | |
Samsung Electronics Co., Ltd., Pfd. | | | 38,490 | | | | $2,611,045 | |
| | | | | | | | |
Total South Korea | | | | | | | 2,611,045 | |
| | | | | | | | |
| | | | | | | | |
| | |
| TOTAL PREFERRED EQUITIES | | | | 2,611,045 | |
| | | | | | | | |
(Cost $1,638,350) | | | | | | | | |
| | | | | | | | |
| | |
| TOTAL INVESTMENTS: 96.0% | | | | 42,993,154 | |
(Cost $36,019,580) | | | | | | | | |
| | | | | | | | |
| | |
CASH AND OTHER ASSETS,
LESS LIABILITIES: 4.0% | | | | | | | 1,798,943 | |
| | | | | | | | |
| | |
NET ASSETS: 100.0% | | | | | | | $44,792,097 | |
| | | | | | | | |
| a | Certain securities were fair valued under the valuation policies approved by the Board of Trustees (Note 2-A). |
| b | Non-income producing security. |
| c | Security exempt from registration under Rule 144A of the Securities Act of 1933, as amended. The security may be resold in transactions exempt from registration normally to qualified institutional buyers. The security has been determined to be liquid in accordance with procedures adopted by the Funds’ Board of Trustees. At December 31, 2020, the aggregate value is $4,103,104, which is 9.16% of net assets. |
| d | The securities may be resold to qualified foreign investors and foreign institutional buyers under Regulation S of the Securities Act of 1933. |
| ADR | American Depositary Receipt |
| GDR | Global Depositary Receipt |
| REIT | Real Estate Investment Trust |
See accompanying notes to financial statements.

| | | | |
| PORTFOLIO MANAGERS |
| |
| Teresa Kong, CFA | | |
Lead Manager | | |
| |
| Satya Patel | | Wei Zhang |
Co-Manager | | Co-Manager |
|
| FUND FACTS |
| | |
| | | Investor | | Institutional |
Ticker | | MAINX | | MINCX |
CUSIP | | 577125503 | | 577125602 |
Inception | | 11/30/11 | | 11/30/11 |
NAV | | $11.25 | | $11.25 |
Initial Investment | | $2,500 | | $100,000 |
Gross Expense Ratio1 | | 1.15% | | 1.00% |
After Fee Waiver and Reimbursement2 | | 1.12% | | 0.90% |
Portfolio Statistics | | | | |
Total # of Positions | | 42 | | |
Net Assets | |
$114.8 million | |
|
Modified Duration3 | | 4.3 | | |
Portfolio Turnover4 | | 39.7% | | |
Benchmark | | |
| 50% Markit iBoxx Asian Local Bond Index, 50% J.P. Morgan Asia Credit Index* |
OBJECTIVE
Total return over the long term with an emphasis on income.
STRATEGY
Under normal market conditions, the Fund seeks to achieve its investment objective by investing at least 80% of its net assets, which include borrowings for investment purposes, in debt and debt-related instruments issued by governments, quasi-governmental entities, supra-national institutions, and companies in Asia. Asia consists of all countries and markets in Asia, such as China and India, and includes developed, emerging, and frontier countries and markets in the Asian region. The Fund’s investments in debt securities may be denominated in any currency, may be of any quality or may be unrated, and may have no stated maturity or duration target.
Matthews Asia Total Return Bond Fund†
Portfolio Manager Commentary (unaudited)
For the year ending December 31, 2020, the Matthews Asia Total Return Fund returned 5.36% (Investor Class) and 5.60% (Institutional Class), while its benchmark, the 50% Markit iBoxx Asian Local Bond/50% J.P. Morgan Asia Credit Index returned 7.95%. For the fourth quarter of the year, the Fund returned 5.41% (Investor Class) and 5.48% (Institutional Class) versus 3.70% for the Index.
Market Discussion:
Just as the COVID-19 pandemic re-shaped our daily lives, it also reshaped markets. Sectors that were traditionally considered risky, such as IT, became darlings as work-from-home became “safe” while traditionally “safe” sectors like gaming and real estate investment trusts (REITs—REITs are income-generating vehicles designed to pay out maximum amounts of their underlying cash flow as dividends to their unit holders) became “risky” as all sectors faced a new paradigm of virtual over bricks and mortar. The theme of safety, and safety over risky, dominated all asset classes. Investment grade outperformed high yield (A high-yield bond has a credit rating of below investment grade. Credit ratings are issued by three major credit rating agencies: S&P, Moody’s and Fitch. If the bond is rated AAA to BBB-, then it is considered investment grade. If it is BBB- to C-, it is considered to be high yield. If it’s below C-, it’s a defaulted bond. Issuers with lower bond ratings and higher default risks need to offer higher yields to compensate for the higher risk.), developed markets (DM) rates outperformed emerging markets (EM) rates, gold outperformed copper and oil. Within Asia high yield, companies with little liquidity risks outperformed those with more murky stories. The equity market was no different, favoring safe themes such as companies that benefited from stay-at-home or tech names that benefited from secular growth trends. Growth vastly outperformed value, with the S&P 500 Growth Index returning 20% for the first three quarters of 2020 compared to the S&P 500 Value Index which returned -14%, a gap of 34%. Growth represented safety while value represented risk as cyclical companies were the most affected by the pandemic.
In the fourth quarter, as people grew weary of continued lock-downs, the market charted a new direction. With the announcement of successful vaccine trials, the mood turned decidedly risk-on. High yield outperformed investment grade, EM (including Asia) outperformed U.S. equities, local currencies rose versus the U.S. dollar, and U.S. treasury yields rose. Up until then, these fourth quarter outperformers had been among the biggest losers of the year.
Within Asian local bonds, the Philippines was the top performer in 2020, followed by Taiwan, Malaysia, and China. However, in the fourth quarter, the top performers were Indonesia and Thailand which were hit hard by the pandemic due to their reliance on tourism, as well as commodities exports in the case of Indonesia. China bonds benefited from the country’s relative success in virus containment, greater government measures to open up the local bond market to foreign investment, as well as greater foreign investment interest due to the decline in rates across the DM world.
Performance Contributors and Detractors:
The Fund’s top contribution to performance came from our overweight to U.S. dollar-denominated high yield credit and allocation to local-currency Chinese credit. However, an underweight to local rates, such as Hong Kong, Singapore and India, as well as an underweight to U.S. dollar-denominated investment grade credit detracted from performance. By currency, our overweights in Chinese renminbi, Singaporean dollar and South Korean won contributed positively, while exposures in Indian rupee and Indonesian rupiah detracted from performance.
The top contributors to Fund performance during the fourth quarter came from U.S. dollar-denominated high yield credit. In terms of country allocation, exposures to South Korea currency and Indonesian local bonds contributed. The top detractors came from China and India, where we have a slight underweight in terms of rates. Currency contributed positively to performance in the quarter, led by our overweights in Chinese
(continued)
| † | The Fund’s name changed from Matthews Asia Strategic Income Fund to Matthews Asia Total Return Bond Fund on January 31, 2020. |
| * | Effective January 31, 2020, the Fund changed its benchmark to a blended benchmark comprised of 50% Markit iBoxx Asian Local Bond Index and 50% J.P. Morgan Asia Credit Index. Prior to January 31, 2020, the Fund’s benchmark was the Markit iBoxx Asian Local Bond Index. Matthews believes that the blended benchmark is more appropriate in light of the Fund’s current investment strategy. The Markit iBoxx Local Bond Index performance reflects the returns of the discontinued predecessor HSBC Asia Local Bond Index up to December 31, 2012 and the returns of the successor Markit iBoxx Local Bond Index thereafter. |
| 1 | Actual 2020 expense ratios. |
| 2 | Matthews has contractually agreed (i) to waive fees and reimburse expenses to the extent needed to limit Total Annual Fund Operating Expenses (excluding Rule 12b-1 fees, taxes, interest, brokerage commissions, short sale dividend expenses, expenses incurred in connection with any merger or reorganization or extraordinary expenses such as litigation) of the Institutional Class to 0.90% first by waiving class specific expenses (i.e., shareholder service fees specific to a particular class) of the Institutional Class and then, to the extent necessary, by waiving non-class specific expenses (e.g. custody fees) of the Institutional Class, and (ii) if any Fund-wide expenses (i.e., expenses that apply to both the Institutional Class and the Investor Class) are waived for the Institutional Class to maintain the 0.90% expense limitation, to waive an equal amount (in annual percentage terms) of those same expenses for the Investor Class. The Total Annual Fund Operating Expenses After Fee Waiver and Expense Reimbursement for the Investor Class may vary from year to year and will in some years exceed 0.90%. Pursuant to this agreement, any amount waived for prior fiscal years with respect to the Fund is not subject to recoupment. This agreement will remain in place until April 30, 2022 and may be terminated at any time by the Board of Trustees on behalf of the Fund on 60 days’ written notice to Matthews. Matthews may decline to renew this agreement by written notice to the Trust at least 30 days before its annual expiration date. |
| 3 | Modified duration measures the percent change in value of the fixed income portion of the portfolio in response to a 1% change in interest rates. In a multi-currency denominated portfolio with sensitivities to different interest rate regimes, modified duration will not accurately reflect the change in value of the overall portfolio from a change in any one interest rate regime. |
| 4 | The lesser of fiscal year 2020 long-term purchase costs or sales proceeds divided by the average monthly market value of long-term securities. |
| | | | |
| matthewsasia.com | 800.789.ASIA | | | 15 | |
| | | | | | | | | | | | | | | | | | | | | | | | |
| | | | | | | |
PERFORMANCE AS OF DECEMBER 31, 2020 | | | | | | | | | | | | | | | | | | |
| | | | | | | | | Average Annual Total Returns | | | | |
| | | 3 Months | | | 1 Year | | | 3 Years | | | 5 Years | | | Since
Inception | | | Inception
Date | |
| Investor Class (MAINX) | | | 5.41% | | | | 5.36% | | | | 4.54% | | | | 6.35% | | | | 5.01% | | | | 11/30/11 | |
| Institutional Class (MINCX) | | | 5.48% | | | | 5.60% | | | | 4.77% | | | | 6.58% | | | | 5.23% | | | | 11/30/11 | |
| 50% Markit iBoxx Asian Local Bond Index, 50% J.P. Morgan Asia Credit Index5 | | | 3.70% | | | | 7.95% | | | | 5.74% | | | | 5.87% | | | | 4.78% | | | | | |
| Markit iBoxx Asian Local Bond Index5 | | | 5.61% | | | | 9.55% | | | | 5.93% | | | | 6.07% | | | | 3.75% | | | | | |
Performance assumes reinvestment of all dividends and/or distributions before taxes. All performance quoted represents past performance and is no guarantee of future results. Investment return and principal value will fluctuate with market conditions so that when redeemed, shares may be worth more or less than their original cost. Current performance may be lower or higher than the return figures quoted. Returns would have been lower if certain of the Fund’s fees and expenses had not been waived. For the Fund’s most recent month-end performance visit matthewsasia.com.
| | | | | | | | | | | | | | | | | | | | | | | | | | | | | | | | | | | | | | | | | | | | | | | | | | | | | | | | | | | | | | | | | | | | | | | | | | | | |
| |
| INCOME DISTRIBUTION HISTORY | |
| | | 2020 | | | | | | 2019 | |
| | Jan. | | | Feb. | | | Mar. | | | Apr. | | | May | | | June | | | July | | | Aug. | | | Sept. | | | Oct. | | | Nov. | | | Dec. | | | Total | | | | | | Q1 | | | Q2 | | | Q3 | | | Q4 | | | Total | |
| Investor (MAINX) | | | n.a. | | | $ | 0.06 | | | $ | 0.04 | | | $ | 0.00 | | | $ | 0.03 | | | $ | 0.04 | | | $ | 0.03 | | | $ | 0.04 | | | $ | 0.04 | | | $ | 0.04 | | | $ | 0.03 | | | $ | 0.08 | | | $ | 0.44 | | | | | | | $ | 0.08 | | | $ | 0.10 | | | $ | 0.14 | | | $ | 0.12 | | | $ | 0.44 | |
| Inst’l (MINCX) | | | n.a. | | | $ | 0.07 | | | $ | 0.04 | | | $ | 0.01 | | | $ | 0.03 | | | $ | 0.04 | | | $ | 0.04 | | | $ | 0.04 | | | $ | 0.04 | | | $ | 0.04 | | | $ | 0.04 | | | $ | 0.09 | | | $ | 0.46 | | | | | | | $ | 0.09 | | | $ | 0.11 | | | $ | 0.14 | | | $ | 0.12 | | | $ | 0.46 | |
Note: This table does not include capital gains distributions. Totals may differ by $0.02 due to rounding. For income distribution history, visit matthewsasia.com.
| | | | |
| | | |
30-DAY YIELD: Investor Class: 4.80% (4.68% excluding waivers) Institutional Class: 5.04% (4.82% excluding waivers) The 30-Day Yield represents net investment income earned by the Fund over the 30-day period ended 12/31/20, expressed as an annual percentage rate based on the Fund’s share price at the end of the 30-day period. The 30-Day Yield should be regarded as an estimate of the Fund’s rate of investment income, and it may not equal the Fund’s actual income distribution rate. Source: BNY Mellon Investment Servicing (US) Inc. | | | | YIELD TO WORST: 6.27% Yield to worst is the lowest yield that can be received on a bond assuming that the issuer does not default. It is calculated by utilizing the worst case assumptions for a bond with respect to certain income-reducing factors, including prepayment, call or sinking fund provisions. It does not represent the yield that an investor should expect to receive. Past yields are no guarantee of future yields. Source: FactSet Research Systems |
GROWTH OF A HYPOTHETICAL $10,000 INVESTMENT SINCE INCEPTION—INVESTOR CLASS
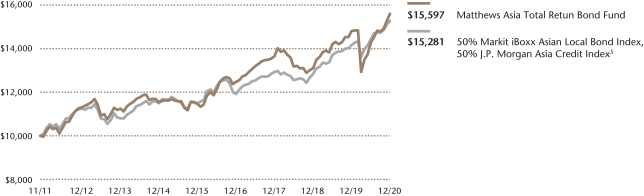
Plotted monthly. The performance data and graph do not reflect the deduction of taxes that a shareholder would pay on dividends, capital gains distributions or redemption of Fund shares. Values are in US$.
| | 5 | It is not possible to invest directly in an index. Source: Index data from HSBC, Markit iBoxx and Bloomberg; total return calculations performed by BNY Mellon Investment Servicing (US) Inc. Please see page 93 for index definitions. Effective January 31, 2020, the Fund changed its benchmark to a blended benchmark comprised of 50% Markit iBoxx Asian Local Bond Index and 50% J.P. Morgan Asia Credit Index. Prior to January 31, 2020, the Fund’s benchmark was the Markit iBoxx Asian Local Bond Index. Matthews believes that the blended benchmark is more appropriate in light of the Fund’s current investment strategy. The Markit iBoxx Asian Local Bond Index performance reflects the returns of the discontinued predecessor HSBC Asian Local Bond Index up to December 31, 2012 and the returns of the successor Markit iBoxx Asian Local Bond Index thereafter. |
| | | | | | | | |
| | | | |
| TOP TEN HOLDINGS | | | | | | | |
| | | Sector | | Currency | | % of Net Assets | |
| Network i2i, Ltd., 5.650%, 04/15/2068 | | Communication Services | | U.S. Dollar | | | 5.7% | |
| Wanda Properties International Co., Ltd., 7.250%, 01/29/2024 | | Real Estate | | U.S. Dollar | | | 4.7% | |
| Viet Nam Debt & Asset Trading Corp., 1.000%, 10/10/2025 | | Financials | | U.S. Dollar | | | 4.7% | |
| ABJA Investment Co. Pte, Ltd., 5.450%, 01/24/2028 | | Materials | | U.S. Dollar | | | 4.1% | |
| Luye Pharma Group, Ltd., Cnv., 1.500%, 07/09/2024 | | Health Care | | U.S. Dollar | | | 3.9% | |
| Poseidon Finance 1, Ltd., Cnv., 0.000%, 02/01/2025 | | Financials | | U.S. Dollar | | | 3.9% | |
| Times China Holdings, Ltd., 6.200%, 03/22/2026 | | Real Estate | | U.S. Dollar | | | 3.5% | |
| Logan Group Co., Ltd., 5.250%, 02/23/2023 | | Real Estate | | U.S. Dollar | | | 3.5% | |
| Malaysia Government Bond, 4.642%, 11/07/2033 | | Foreign Government Bonds | | Malaysian Ringgit | | | 3.2% | |
| KWG Group Holdings, Ltd., 5.875%, 11/10/2024 | | Real Estate | | U.S. Dollar | | | 3.0% | |
| % OF ASSETS IN TOP 10 | | | | | | | 40.2% | |
| | | | |
| |
| CURRENCY ALLOCATION (%)6,7 | |
| US Dollar | | | 43.0 | |
| South Korean Won | | | 10.3 | |
| Singapore Dollar | | | 9.3 | |
| China Renminbi | | | 8.6 | |
| Malaysian Ringgit | | | 6.6 | |
| Indonesian Rupiah | | | 6.5 | |
| Philippines Peso | | | 5.4 | |
| Thailand Baht | | | 5.3 | |
| Indian Rupee | | | 3.4 | |
| China Renminbi Offshore | | | 1.6 | |
| | | | |
| |
| COUNTRY ALLOCATION (%)6,7,8 | |
| China/Hong Kong | | | 40.4 | |
| India | | | 12.8 | |
| Indonesia | | | 12.2 | |
| Philippines | | | 7.7 | |
| Malaysia | | | 6.3 | |
| Vietnam | | | 4.7 | |
| Switzerland | | | 2.5 | |
| Thailand | | | 2.2 | |
| South Korea | | | 1.6 | |
| Cash and Other Assets, Less Liabilities | | | 9.7 | |
| | | | |
| |
| SECTOR ALLOCATION (%)6,7 | |
| Real Estate | | | 23.2 | |
| Foreign Government Bonds | | | 20.2 | |
| Financials | | | 16.7 | |
| Communication Services | | | 8.8 | |
| Materials | | | 6.6 | |
| Consumer Discretionary | | | 6.1 | |
| Health Care | | | 3.9 | |
| Energy | | | 3.9 | |
| Industrials | | | 0.9 | |
| Cash and Other Assets, Less Liabilities | | | 9.7 | |
Please note: Foreign Government Bonds category includes Supranationals.
| | | | |
| |
| ASSET TYPE BREAKDOWN (%)6,7 | |
| Non-Convertible Corporate Bonds | | | 56.1 | |
| Government Bonds | | | 24.8 | |
| Convertible Corporate Bonds | | | 9.4 | |
| Cash and Other Assets, Less Liabilities | | | 9.7 | |
| 6 | Source: FactSet Research Systems. Percentage values in data are rounded to the nearest tenth of one percent, so the values may not sum to 100% due to rounding. Country allocations and percentage values may be derived from different data sources and may not be consistent with other Fund literature. |
| 7 | Cash and other assets may include forward currency exchange contracts and certain derivative instruments that have been marked-to-market. |
| 8 | Not all countries where the Fund may invest are included in the benchmark index. |
Matthews Asia Total Return Bond Fund
Portfolio Manager Commentary (unaudited) (continued)
renminbi and South Korean won, while the portfolio’s overweight in Indonesian rupiah detracted slightly.
Notable Portfolio Changes:
We started 2020 with a focus on boosting duration (a measure of the sensitivity of the price of a bond or other debt instrument to a change in interest rates), adding investment grade-rated credit in local Chinese renminbi bonds and U.S. dollar-denominated bonds. As the virus sell-off intensified, we began to look for value among bonds most punished and continued to do so throughout the second quarter. This included adding to some perpetual bonds and highly-rated long-duration bonds, such as Geely, JD.com, and Syngenta. These bonds had suffered from illiquidity risk and the dash-for-cash panic, but are fundamentally strong companies that we believe are capable of weathering prolonged financial stress. In the third quarter, as governments worldwide focused on providing ample stimulus, the risk appetite of the market grew. We took profits on some investment grade names, such as JD.com and Weibo that had rebounded quickly. We believed value remained in many high yield bonds, which had not recovered as quickly and began boosting allocation to high yield bonds again, such as by adding Times China. We also added local currency exposure.
In the fourth quarter, we exited Chinese apparel maker Bosideng as it had rallied substantially and hit our price target. We also exited long-dated Syngenta bonds as it had rallied quite well in the recovery and we were concerned about rising rate risk associated with this long-duration bond. We added the convertible bonds of South Korean internet company Kakao (Daum) to increase exposure to the high-growth tech sector. We also added Powerlong, a commercial real estate developer in China, to diversify our Chinese real estate exposure which had been concentrated on residential development. In terms of currency, we added exposure to Indonesian rupiah, Korean won, Singaporean dollar, and Indian rupee in anticipation of local currency outperformance versus the U.S. dollar on the back of global risk-on sentiment.
Outlook:
The big question for 2021 is whether we are entering the start of a new macro trend, the much anticipated “value rotation” or cyclical risk-on. With new lockdown restrictions in countries with a new COVID strain, the value rotation could seem premature. However, governments and central banks globally seem committed to providing stimulus to help the sectors most hit by COVID—largely value sectors such as retail, banks, energy and industrials. Therefore, we think it’s unlikely that stimulus will be withdrawn before the recovery in value sectors seem more certain. As such, we believe Asia high yield credit and local currencies—considered “value” in the bond space—could continue to outperform.
With the market expecting a higher chance of U.S. stimulus and significantly more virus spread, U.S. 10-year treasury increased 23 basis points (0.23%) during the quarter. We believe U.S. interest rates have some scope to rise as inflation and economic activity normalizes in 2021, but don’t expect it to be a sharply disruptive move. In Asia, we expect to see relatively muted movements in interest rates for most countries. China bonds acted as a diversifier in the fourth quarter and we continue to believe they have the long-term potential to become a source of safety and diversification, similar to the roles played by other DM Asia rates and U.S. treasuries.
Given this backdrop, we are positioning our portfolio with a mild underweight to U.S. dollar-denominated securities and interest rate duration. We expect spreads to continue its march tighter as spreads continue to be wide relative to its history, as well as relative to similar quality issuers in U.S. and other EM regions. We also expect technicals to remain favorable as demand outstrips supply as we expect issuance from the biggest issuers, the Chinese real estate sector, to remain subdued as regulators limit leverage in the industry. In summary, we seek to position our portfolio to benefit from tail winds of credit spread (the difference between the quoted rates of return on two different investments, usually of different credit qualities but similar maturities) tightening and Asia currency appreciation while mitigating mild headwinds from likely interest rate rises and further steepening of yield curves (yield curve is a curve showing several yields to maturity or interest rates across different contract lengths for a similar debt contract).
| | | | |
| matthewsasia.com | 800.789.ASIA | | | 17 | |
Matthews Asia Total Return Bond Fund
December 31, 2020
Schedule of Investmentsa
NON-CONVERTIBLE CORPORATE BONDS: 56.1%
| | | | | | | | |
| | | Face Amount* | | | Value | |
| | |
| CHINA/HONG KONG: 32.6% | | | | | | | | |
|
Wanda Properties International Co., Ltd. | |
7.250%, 01/29/24b | | | 5,300,000 | | | | $5,438,012 | |
| | |
Times China Holdings, Ltd. 6.200%, 03/22/26b | | | 3,900,000 | | | | 4,046,206 | |
| | |
Logan Group Co., Ltd.
5.250%, 02/23/23b | | | 3,900,000 | | | | 3,970,195 | |
| | |
KWG Group Holdings, Ltd. 5.875%, 11/10/24b | | | 3,400,000 | | | | 3,495,211 | |
| | |
CIFI Holdings Group Co., Ltd. 6.550%, 03/28/24b | | | 3,200,000 | | | | 3,417,632 | |
| | |
King Talent Management, Ltd. 5.600%c, 12/04/22b,d | | | 3,500,000 | | | | 3,035,167 | |
| | |
KWG Group Holdings, Ltd. 7.875%, 09/01/23b | | | 2,050,000 | | | | 2,132,566 | |
|
Powerlong Real Estate Holdings, Ltd. | |
5.950%, 04/30/25b | | | 1,800,000 | | | | 1,825,896 | |
|
CITIC Telecom International Finance, Ltd. | |
6.100%, 03/05/25b | | | 1,631,000 | | | | 1,704,395 | |
|
China Cinda Asset Management Co., Ltd. | |
5.500%, 03/14/28 | | | CNY 10,000,000 | | | | 1,668,315 | |
| | |
Agricultural Bank of China, Ltd. 4.300%, 04/11/29b | | | CNY 10,000,000 | | | | 1,534,703 | |
|
China Cinda Asset Management Co., Ltd. | |
3.900%, 03/05/30 | | | CNY 10,000,000 | | | | 1,501,713 | |
| | |
Sino-Ocean Land Treasure III, Ltd. 4.900%c, 09/21/22b,d | | | 1,400,000 | | | | 1,174,105 | |
| | |
Times China Holdings, Ltd. 6.750%, 07/08/25b | | | 1,100,000 | | | | 1,161,875 | |
| | |
Honghua Group, Ltd.
6.375%, 08/01/22b | | | 1,100,000 | | | | 1,083,500 | |
| | |
Deutsche Bank AG
3.671%c, 04/10/25b | | | CNY 2,000,000 | | | | 274,280 | |
| | | | | | | | |
Total China/Hong Kong | | | | | | | 37,463,771 | |
| | | | | | | | |
| | | | | | | | |
| | | |
| INDIA: 12.8% | | | | | | | | |
Network i2i, Ltd.
5.650%c, 01/15/25d,e | | | 5,000,000 | | | | 5,315,000 | |
| | |
ABJA Investment Co. Pte, Ltd. 5.450%, 01/24/28b | | | 4,440,000 | | | | 4,696,450 | |
| | |
Tata Motors, Ltd.
5.875%, 05/20/25b | | | 2,000,000 | | | | 2,087,000 | |
| | |
ICICI Bank UK PLC
5.375%c, 09/26/28b | | | SGD 1,750,000 | | | | 1,361,957 | |
| | |
Network i2i, Ltd.
5.650%c, 01/15/25b,d | | | 1,200,000 | | | | 1,275,600 | |
| | | | | | | | |
Total India | | | | | | | 14,736,007 | |
| | | | | | | | |
| | | | | | | | |
| | | |
| INDONESIA: 5.8% | | | | | | | | |
Indika Energy Capital III Pte, Ltd. 5.875%, 11/09/24b | | | 3,300,000 | | | | 3,382,500 | |
| | |
PB International BV
7.625%, 01/26/22b | | | 5,100,000 | | | | 3,289,500 | |
| | | | | | | | |
Total Indonesia | | | | | | | 6,672,000 | |
| | | | | | | | |
| | | | | | | | |
| | | |
| SWITZERLAND: 2.5% | | | | | | | | |
Syngenta Finance N.V. 5.182%, 04/24/28b | | | 2,400,000 | | | | 2,573,207 | |
| | |
Syngenta Finance N.V.
4.892%, 04/24/25e | | | 300,000 | | | | 321,918 | |
| | | | | | | | |
Total Switzerland | | | | | | | 2,895,125 | |
| | | | | | | | |
| | | | | | | | |
| | | | | | | | |
| | | Face Amount* | | | Value | |
| | |
| PHILIPPINES: 2.4% | | | | | | | | |
Jollibee Worldwide Pte, Ltd.
3.900%c, 01/23/25b,d | | | 1,729,000 | | | | $1,654,480 | |
| | |
Royal Capital BV
4.875%c, 05/05/24b,d | | | 1,041,000 | | | | 1,059,180 | |
| | | | | | | | |
Total Philippines | | | | | | | 2,713,660 | |
| | | | | | | | |
| | | | | | | | |
| | |
| TOTAL NON-CONVERTIBLE CORPORATE BONDS | | | | 64,480,563 | |
| | | | | | | | |
(Cost $62,991,851) | | | | | | | | |
| | | | | | | | |
| |
FOREIGN GOVERNMENT OBLIGATIONS: 24.8% | | | | | |
| |
| INDONESIA: 6.4% | |
Indonesia Government Bond
9.000%, 03/15/29 | | | IDR 38,000,000,000 | | | | 3,226,619 | |
| | |
Indonesia Government Bond
8.250%, 05/15/29 | | | IDR 34,550,000,000 | | | | 2,829,397 | |
| | |
Indonesia Government Bond
8.375%, 04/15/39 | | | IDR 15,000,000,000 | | | | 1,259,767 | |
| | | | | | | | |
Total Indonesia | | | | | | | 7,315,783 | |
| | | | | | | | |
| | | | | | | | |
| |
| MALAYSIA: 6.3% | |
Malaysia Government Bond
4.642%, 11/07/33 | | | MYR 13,000,000 | | | | 3,693,491 | |
| | |
Malaysia Government Bond
3.478%, 06/14/24 | | | MYR 4,800,000 | | | | 1,251,664 | |
|
Malaysia Government Investment Issue | |
4.119%, 11/30/34 | | | MYR 4,500,000 | | | | 1,216,275 | |
| | |
Malaysia Government Investment Issue
3.422%, 09/30/27 | | | MYR 4,000,000 | | | | 1,049,621 | |
| | | | | | | | |
Total Malaysia | | | | | | | 7,211,051 | |
| | | | | | | | |
| | | | | | | | |
| |
| PHILIPPINES: 5.3% | |
Republic of Philippines 3.900%, 11/26/22 | | | PHP 123,000,000 | | | | 2,604,972 | |
| | |
Republic of Philippines 6.250%, 01/14/36 | | | PHP 70,000,000 | | | | 1,861,497 | |
| | |
Philippine Government Bond
4.950%, 01/15/21 | | | PHP 80,000,000 | | | | 1,664,760 | |
| | | | | | | | |
Total Philippines | | | | | | | 6,131,229 | |
| | | | | | | | |
| | | | | | | | |
| |
| VIETNAM: 4.6% | |
Viet Nam Debt & Asset Trading Corp.
1.000%, 10/10/25b | | | 6,219,000 | | | | 5,348,340 | |
| | | | | | | | |
Total Vietnam | | | | | | | 5,348,340 | |
| | | | | | | | |
| | | | | | | | |
| |
| THAILAND: 2.2% | |
Thailand Government Bond
1.600%, 12/17/29 | | | THB 72,000,000 | | | | 2,493,532 | |
| | | | | | | | |
Total Thailand | | | | | | | 2,493,532 | |
| | | | | | | | |
| | | | | | | | |
| | |
| TOTAL FOREIGN GOVERNMENT OBLIGATIONS | | | | 28,499,935 | |
| | | | | | | | |
(Cost $25,689,277) | | | | | | | | |
| | | | | | | | |
Matthews Asia Total Return Bond Fund
December 31, 2020
Schedule of Investmentsa (continued)
CONVERTIBLE CORPORATE BONDS: 9.4%
| | | | | | | | |
| | | Face Amount* | | | Value | |
|
| CHINA/HONG KONG: 7.8% | |
Luye Pharma Group, Ltd., Cnv.
1.500%, 07/09/24b | | | 4,700,000 | | | | $4,491,226 | |
| | |
Poseidon Finance 1, Ltd., Cnv.
0.000%, 02/01/25b | | | 4,600,000 | | | | 4,473,500 | |
| | | | | | | | |
Total China/Hong Kong | | | | 8,964,726 | |
| | | | | | | | |
| | | | | | | | |
| |
| SOUTH KOREA: 1.6% | |
Kakao Corp., Cnv.
0.000%, 04/28/23b | | | 1,600,000 | | | | 1,820,000 | |
| | | | | | | | |
Total South Korea | | | | 1,820,000 | |
| | | | | | | | |
| | | | | | | | |
| | |
| TOTAL CONVERTIBLE CORPORATE BONDS | | | | 10,784,726 | |
| | | | | | | | |
(Cost $ 11,018,359) | | | | | | | | |
| | | | | | | | |
| | |
| TOTAL INVESTMENTS: 90.3% | | | | 103,765,224 | |
(Cost $ 99,699,487) | | | | | | | | |
| | | | | | | | |
| |
CASH AND OTHER ASSETS,
LESS LIABILITIES: 9.7% | | | | 11,083,016 | |
| | | | | | | | |
| |
NET ASSETS: 100.0% | | | | $114,848,240 | |
| | | | | | | | |
| a | Certain securities were fair valued under the valuation policies approved by the Board of Trustees (Note 2-A). |
| b | The securities may be resold to qualified foreign investors and foreign institutional buyers under Regulation S of the Securities Act of 1933. |
| c | Security is a fix-to-float security, which carries a fixed coupon until a certain date, upon which it switches to a floating rate. Reference rate and spread are provided if the rate is currently floating. |
| d | Perpetual security with no stated maturity date. First call date is disclosed. |
| e | Security exempt from registration under Rule 144A of the Securities Act of 1933, as amended. The security may be resold in transactions exempt from registration normally to qualified institutional buyers. The security has been determined to be liquid in accordance with procedures adopted by the Funds’ Board of Trustees. At December 31, 2020, the aggregate value is $5,636,918, which is 4.91% of net assets. |
| * | All Values in USD unless otherwise specified |
| 3M MYR-KLIBOR | Three Month Kuala Lumpur Interbank Offered Rate |
| 6M THB-THBFIX | Six Month Thai Baht Interest Rate Fixing |
| CNY | Chinese Renminbi (Yuan) |
FORWARD FOREIGN CURRENCY EXCHANGE CONTRACTS
| | | | | | | | | | | | | | |
Currency
Purchased | | Currency Sold | | | Counterparty | | Settlement
Date | | | Unrealized
Appreciation
(Depreciation) | |
| KRW 12,804,807,000 | | | USD 10,830,000 | | | Bank of America, N.A. | | | 01/15/21 | | | | $949,095 | |
| SGD 12,281,840 | | | USD 8,900,000 | | | Bank of America, N.A. | | | 01/15/21 | | | | 393,296 | |
| THB 84,191,400 | | | USD 2,700,000 | | | Bank of America, N.A. | | | 01/15/21 | | | | 110,150 | |
| CNY 19,404,000 | | | USD 2,750,000 | | | Bank of America, N.A. | | | 02/04/21 | | | | 227,117 | |
| CNY 29,937,112 | | | USD 4,380,000 | | | Bank of America, N.A. | | | 02/04/21 | | | | 204,084 | |
| INR 286,982,000 | | | USD 3,850,000 | | | Bank of America, N.A. | | | 02/22/21 | | | | 57,984 | |
| IDR 32,532,450,000 | | | USD 2,271,819 | | | Bank of America, N.A. | | | 04/05/21 | | | | 49,020 | |
| | | | | | | | | | | | | | |
| | | | | | | | | | | | | 1,990,746 | |
| | | | | | | | | | | | | | |
| | | | |
| USD 1,085,995 | | | CNY 7,634,000 | | | Bank of America, N.A. | | | 02/04/21 | | | | (85,275 | ) |
| USD 2,125,609 | | | IDR 32,532,450,000 | | | Bank of America, N.A. | | | 04/05/21 | | | | (195,230 | ) |
| | | | | | | | | | | | | | |
| | | | | | | | | | | | | (280,505 | ) |
| | | | | | | | | | | | | | |
| Net Unrealized Appreciation | | | | | | | | | | $1,710,241 | |
| | | | | | | | | | | | | | |
OTC INTEREST RATE SWAPS*
| | | | | | | | | | | | | | | | | | | | | | | | | | | | |
Floating Rate
Paid by Fund | | Fixed Rate
Received by Fund | | Counterparty | | Termination Date | | | Notional
Amount (000) | | | Value | | | Upfront Premium
Paid
(Received) | | | Unrealized
Appreciation | |
| Rate | | Frequency | | Rate | | Frequency |
3M MYR-KLIBOR, 1.940% | | Quarterly | | 3.300% | | Quarterly | | Bank of America, N.A. | | | 06/19/2024 | | | | MYR 13,000 | | | $ | 141,735 | | | | — | | | $ | 141,735 | |
6M THB-THBFIX, 0.231% | | Semi-annual | | 1.610% | | Semi-annual | | Bank of America, N.A. | | | 06/21/2024 | | | | THB 281,000 | | | | 359,005 | | | | — | | | | 359,005 | |
6M THB-THBFIX, 0.410% | | Semi-annual | | 1.265% | | Semi-annual | | Bank of America, N.A. | | | 09/04/2024 | | | | THB 210,000 | | | | 204,157 | | | | — | | | | 204,157 | |
| | | | | | | | | | | | | | | | | | | | |
Total | | | | | | | | | | | | | | | | | | $ | 704,897 | | | | — | | | $ | 704,897 | |
| | | | | | | | | | | | | | | | | | | | |
| * | Swaps are not centrally cleared. |
See accompanying notes to financial statements.
| | | | |
| matthewsasia.com | 800.789.ASIA | | | 19 | |
| | | | |
| PORTFOLIO MANAGERS |
| |
| Teresa Kong, CFA | | Satya Patel |
Lead Manager | | Lead Manager |
| | |
| FUND FACTS | | | | |
| | |
| | | Investor | | Institutional |
Ticker | | MCRDX | | MICPX |
CUSIP | | 577130677 | | 577130669 |
Inception | | 4/29/16 | | 4/29/16 |
NAV | | $10.27 | | $10.27 |
Initial Investment | | $2,500 | | $100,000 |
Gross Expense Ratio1 | | 1.14% | | 0.98% |
After Fee Waiver and Reimbursement2 | | 1.14% | | 0.90% |
Portfolio Statistics | | |
Total # of Positions | | | | 31 |
Net Assets | | | | $91.1 million |
Modified Duration3 | | | | 2.86 |
Portfolio Turnover4 | | | | 48.5% |
Benchmark | | | | |
J.P. Morgan Asia Credit Index |
OBJECTIVE
Total return over the long term.
STRATEGY
Under normal market conditions, the Fund seeks to achieve its investment objective by investing at least 80% of its net assets, which include borrowings for investment purposes, in debt and debt-related instruments issued by companies as well as governments, quasi-governmental entities, and supra-national institutions in Asia. Debt and debt-related instruments typically include bonds, debentures, bills, securitized instruments (which are vehicles backed by pools of assets such as loans or other receivables), notes, certificates of deposit and other bank obligations, bank loans, senior secured bank debt, convertible debt securities, exchangeable bonds, credit-linked notes, inflation-linked instruments, repurchase agreements, payment-in-kind securities and derivative instruments with fixed income characteristics. Asia consists of all countries and markets in Asia, such as China and Indonesia, in addition to the developed, emerging, and frontier countries and markets in the Asian region.
Matthews Asia Credit Opportunities Fund
Portfolio Manager Commentary (unaudited)
For the year ending December 31, 2020, the Matthews Asia Credit Opportunities Fund returned 1.80% (Investor Class) and 2.05% (Institutional Class), while its benchmark, the J.P. Morgan Asia Credit Index returned 6.33%. For the fourth quarter of the year, the Fund returned 3.61% (Investor Class) and 3.68% (Institutional Class) versus 1.82% for the Index.
Market Discussion:
2020 marked the end of a credit cycle—defined by a trend of falling spreads—as the global pandemic roiled markets. It also marked the beginning of a new credit cycle, as spreads staged a remarkable recovery as governments globally committed to unprecedented monetary and fiscal support to backstop the global economic recession due to COVID-19. Unlike past credit cycles where the lack of liquidity was the primary driver of defaults, solvency is becoming the primary driver as vulnerable sectors saw revenues, profits and free cash flows (Free cash flows are a measure of financial performance calculated as operating cash flow minus capital expenditures. Free cash flow represents the cash that a company is able to generate after laying out the money required to maintain or expand its asset base.) plummet and working capital needs rose. Fortunately, many Asian countries, led by China, have staged a remarkable recovery and do not appear to be suffering from long-term structural damage as containment proved to be relatively swift. Emerging Asia’s recovery has been relatively slow and uneven with containment incomplete including in India and Indonesia. This dichotomy has also been playing out with companies, with larger companies having unfettered liquidity while smaller companies struggled to survive. The year closed with Asia default rates at 3.5%, compared to 9.7% in the U.S.
The fourth quarter can be described in two distinct sub-periods: before and after the U.S. election in November. The first month was dominated by worries, while the latter period provided a welcomed respite and positive returns across almost all risk assets. The average spread of the J.P. Morgan Asia Credit Index tightened 39 basis points (0.39%) in the quarter while the high yield portion of the Index tightened 98 basis points (0.98%).
In the pre-election period, there were several sources of uncertainty: conflicting news on the likelihood of U.S. fiscal stimulus with the market widely perceiving a second stimulus as necessary given the weakened U.S. economy due to the pandemic; large increases in daily new confirmed cases of COVID-19 in the U.S. and Europe; and highly uncertain election results. And in Asia, the large divergence of recovery between East Asia (China, Japan, South Korea) and the rest of Asia and room for further fiscal stimulus was an additional question. These uncertainties led to market caution early in the quarter.
In the post-election period, risk sentiment improved for a number of reasons, including a Democratic Party win with the possibility that Democrats might take the majority in the Senate—viewed as having a much higher chance of passing a large stimulus. At the same time, successful COVID vaccine trials brought in view the end of the pandemic. The fact that a “Hard Brexit” did not materialize was an additional piece of good news. Within Asia, we saw volatility after President Trump signed Executive Orders directed at China. One Executive Order stipulates that all U.S. funds must divest from a list of Chinese companies associated with the military.
Performance Contributors and Detractors:
In general, lower-rated securities outperformed higher-rated securities in the fourth quarter. The portfolio’s overweight in BB-rated securities helped Fund performance. Basic industries and real estate were the top contributors to performance, driven by securities such as Indika, Tata Industries, and Adaro within basic industries, and within real estate, Lippo Karawaci, KWG, and CIFI. However, security selection in Pan Brothers
(continued)
| 1 | Actual 2020 expense ratios. |
| 2 | Matthews has contractually agreed (i) to waive fees and reimburse expenses to the extent needed to limit Total Annual Fund Operating Expenses (excluding Rule 12b-1 fees, taxes, interest, brokerage commissions, short sale dividend expenses, expenses incurred in connection with any merger or reorganization or extraordinary expenses such as litigation) of the Institutional Class to 0.90% first by waiving class specific expenses (i.e., shareholder service fees specific to a particular class) of the Institutional Class and then, to the extent necessary, by waiving non-class specific expenses (e.g., custody fees) of the Institutional Class, and (ii) if any Fund-wide expenses (i.e., expenses that apply to both the Institutional Class and the Investor Class) are waived for the Institutional Class to maintain the 0.90% expense limitation, to waive an equal amount (in annual percentage terms) of those same expenses for the Investor Class. The Total Annual Fund Operating Expenses After Fee Waiver and Expense Reimbursement for the Investor Class may vary from year to year and will in some years exceed 0.90%. Pursuant to this agreement, any amount waived for prior fiscal years with respect to the Fund is not subject to recoupment. This agreement will remain in place until April 30, 2022 and may be terminated at any time by the Board of Trustees on behalf of the Fund on 60 days’ written notice to Matthews. Matthews may decline to renew this agreement by written notice to the Trust at least 30 days before its annual expiration date. |
| 3 | Modified duration measures the percent change in value of the fixed income portion of the portfolio in response to a 1% change in interest rates. In a multi-currency denominated portfolio with sensitivities to different interest rate regimes, modified duration will not accurately reflect the change in value of the overall portfolio from a change in any one interest rate regime. |
| 4 | The lesser of fiscal year 2020 long-term purchase costs or sales proceeds divided by the average monthly market value of long-term securities. |
| | | | | | | | | | | | | | | | | | | | |
| | | | | |
| PERFORMANCE AS OF DECEMBER 31, 2020 | | | | | | | | | | | | |
| | | | | | | | | Average Annual Total Retuns | | | | |
| | | 3 Months | | | 1 Year | | | 3 Years | | | Since
Inception | | | Inception
Date | |
| Investor Class (MCRDX) | | | 3.61% | | | | 1.80% | | | | 3.86% | | | | 5.16% | | | | 4/29/16 | |
| Institutional Class (MICPX) | | | 3.68% | | | | 2.05% | | | | 4.11% | | | | 5.41% | | | | 4/29/16 | |
| J.P. Morgan Asia Credit Index5 | | | 1.82% | | | | 6.33% | | | | 5.52% | | | | 5.07% | | | | | |
Performance assumes reinvestment of all dividends and/or distributions before taxes. All performance quoted represents past performance and is no guarantee of future results. Investment return and principal value will fluctuate with market conditions so that when redeemed, shares may be worth more or less than their original cost. Current performance may be lower or higher than the return figures quoted. Returns would have been lower if certain of the Fund’s fees and expenses had not been waived. For the Fund’s most recent month-end performance, visit matthewsasia.com.
| | | | | | | | | | | | | | | | | | | | | | | | | | | | | | | | | | | | | | | | | | | | | | | | | | | | | | | | | | | | | | | | | | | | | | | | | | | | |
| |
| INCOME DISTRIBUTION HISTORY | |
| | | 2020 | | | | | | 2019 | |
| | Jan. | | | Feb. | | | Mar. | | | Apr. | | | May | | | June | | | July | | | Aug. | | | Sept. | | | Oct. | | | Nov. | | | Dec. | | | Total | | | | | | Q1 | | | Q2 | | | Q3 | | | Q4 | | | Total | |
| Investor (MCRDX) | | | n.a. | | | $ | 0.04 | | | $ | 0.03 | | | $ | 0.04 | | | $ | 0.04 | | | $ | 0.04 | | | $ | 0.04 | | | $ | 0.04 | | | $ | 0.04 | | | $ | 0.03 | | | $ | 0.04 | | | $ | 0.06 | | | $ | 0.44 | | | | | | | $ | 0.10 | | | $ | 0.10 | | | $ | 0.13 | | | $ | 0.11 | | | $ | 0.44 | |
| Inst’l (MICPX) | | | n.a. | | | $ | 0.04 | | | $ | 0.03 | | | $ | 0.04 | | | $ | 0.04 | | | $ | 0.04 | | | $ | 0.04 | | | $ | 0.04 | | | $ | 0.04 | | | $ | 0.04 | | | $ | 0.04 | | | $ | 0.06 | | | $ | 0.46 | | | | | | | $ | 0.10 | | | $ | 0.11 | | | $ | 0.14 | | | $ | 0.11 | | | $ | 0.46 | |
Note: This table does not include capital gains distributions. Totals may differ by $0.02 due to rounding. For income distribution history, visit matthewsasia.com.
| | | | |
| | | |
30 DAY YIELD: Investor Class: 6.13% (6.21% excluding waivers) Institutional Class: 6.42% (6.30% excluding waivers) The 30-Day Yield represents net investment income earned by the Fund over the 30-day period ended 12/31/20, expressed as an annual percentage rate based on the Fund’s share price at the end of the 30-day period. The 30-Day Yield should be regarded as an estimate of the Fund’s rate of investment income, and it may not equal the Fund’s actual income distribution rate. Source: BNY Mellon Investment Servicing (US) Inc. | | | | YIELD TO WORST: 7.36% Yield to worst is the lowest yield that can be received on a bond assuming that the issuer does not default. It is calculated by utilizing the worst case assumptions for a bond with respect to certain income-reducing factors, including prepayment, call or sinking fund provisions. It does not represent the yield that an investor should expect to receive. Past yields are no guarantee of future yields. Source: FactSet Research Systems |
GROWTH OF A HYPOTHETICAL $10,000 INVESTMENT SINCE INCEPTION—INVESTOR CLASS
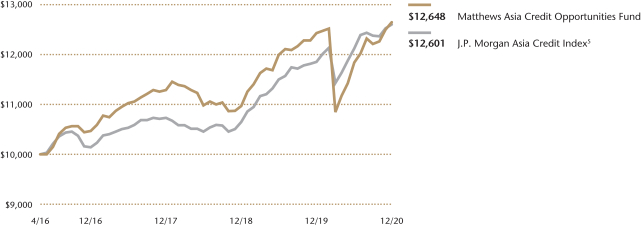
Plotted monthly. The performance data and graph do not reflect the deduction of taxes that a shareholder would pay on dividends, capital gains distributions, or redemption of Fund shares. Values are in US$.
| | 5 | It is not possible to invest directly in an index. Source: Index data from J.P. Morgan and Bloomberg; total return calculations performed by BNY Mellon Investment Servicing (US) Inc. Please see page 93 for index definition. |
| | | | | | | | |
| | | | |
| TOP TEN HOLDINGS | | | | | | | |
| | | Sector | | Currency | | % of Net Assets | |
| Network i2i, Ltd., 5.650%, 04/15/2068 | | Communication Services | | U.S. Dollar | | | 6.1% | |
| Indika Energy Capital III Pte, Ltd., 5.875%, 11/09/2024 | | Energy | | U.S. Dollar | | | 5.6% | |
| Viet Nam Debt & Asset Trading Corp., 1.000%, 10/10/2025 | | Financials | | U.S. Dollar | | | 5.4% | |
| Honghua Group, Ltd., 6.375%, 08/01/2022 | | Energy | | U.S. Dollar | | | 5.2% | |
| Sino-Ocean Land Treasure III, Ltd., 4.900%, 03/21/2068 | | Real Estate | | U.S. Dollar | | | 5.2% | |
| King Talent Management, Ltd., 5.600%, 06/04/2068 | | Financials | | U.S. Dollar | | | 5.0% | |
| Tata Motors, Ltd., 5.875%, 05/20/2025 | | Consumer Discretionary | | U.S. Dollar | | | 4.8% | |
| Luye Pharma Group, Ltd., Cnv., 1.500%, 07/09/2024 | | Health Care | | U.S. Dollar | | | 4.3% | |
| Poseidon Finance 1, Ltd., Cnv., 0.000%, 02/01/2025 | | Financials | | U.S. Dollar | | | 4.1% | |
| Times China Holdings, Ltd., 6.200%, 03/22/2026 | | Real Estate | | U.S. Dollar | | | 3.9% | |
| % OF ASSETS IN TOP 10 | | | | | | | 49.6% | |
| | | | |
| matthewsasia.com | 800.789.ASIA | | | 21 | |
Matthews Asia Credit Opportunities Fund
Portfolio Manager Commentary (unaudited) (continued)
detracted from performance, as Pan Brothers was downgraded during the quarter due to concerns about their ability to refinance outstanding bank loans. In addition, exposure to Luye Pharmaceutical, a Chinese pharmaceutical company, also detracted from performance.
For the year 2020, Fund performance was mainly hurt by our overweight to high yield credit relative to investment grade, which had outperformed in the year as markets sought “safety”. But security selection in the investment grade space, including Syngenta and longer-dated Indonesian quasi-sovereigns credit, helped the Fund in the year.
In terms of country allocation, overweights in India and Vietnam were the top contributors while allocation to Indonesia, which failed to effectively control COVID-19, and Sri Lanka, which was hurt by pandemic-driven declines in tourism, were detractors. Within China, Fund performance was roughly in line with the benchmark. Contributors included real estate developers and internet names such as Baozun and iQiyi, while underweights in investment grade-rated names detracted.
Notable Portfolio Changes:
2020 was a year of many surprises and required continual rotation in search of value. We sold names that had benefited or recovered quickly from the COVID-crisis such as Weibo and Citic Telecom and redeployed capital into good companies where recovery was more delayed, including Chinese apparel brand Bosideng, and Jollibee, a Philippines restaurant chain. We reduced risk in Pakistan and Sri Lanka as we expected frontier markets nations to have both less ability to deal with a public health crisis and slower economic recoveries. We also rotated capital within Indonesia, from investment grade state-owned companies, such as InAlum and Cikarang Listrindo, into higher yield names, such as Sritex, a textile manufacturer, and Adaro, a coal miner. We also added high yield names such as Tata Motors of India, which has embarked on an ambitious debt reduction plan.
In the fourth quarter, we exited Chinese apparel maker Bosideng as it had rallied substantially and hit our price target. We switched out of China Jinmao as we saw rising risks associated with Chinese state-owned entities after the passage of President Trump’s Executive Order. We added Times China in replacement, as we liked its exposure to the fast-growing Pearl River Delta region. We added the convertible bonds of South Korean internet firm Kakao (Daum) to increase exposure to the high-growth tech sector.
Outlook:
Having experienced the worst of the credit cycle in 2020, we expect markets and economies globally to continue their recoveries in 2021. We will likely see policymakers gradually ease up on the unprecedented levels of support and accommodation seen in 2020, but largely expect monetary and fiscal policies to remain supportive for the foreseeable future. As such, we expect default rates (the corporate default rate measures the percentage of issuers in a given fixed-income asset class that failed to make scheduled interest or principal payments in the prior 12 months) in Asia to tick up slightly from 2020 year end levels and stay well contained in the mid-single digits.
Despite the strong support of policymakers, we continue to monitor some key risks, including new variants of COVID-19 and how this might affect the economic recovery. Additionally, we are watching the pace of recovery of countries such as China which has largely contained the virus. While we do expect further U.S. stimulus as well as vaccine distribution to solidify the economic recovery going into 2021, we are monitoring for any disruptions to the base case. In this base case, we believe that U.S. dollar-denominated, non-investment grade Asia bonds potentially offer the most attractive risk-adjusted returns.
Looking ahead, we are cautiously optimistic that U.S.—China relations could normalize to a more rules-based and engagement-based way of interaction. While the U.S. will continue to focus on rectifying grievances in trade and technology competition, we are hopeful that less erratic, Executive Order-driven policies will reduce Asian markets’ volatility.
As markets continue to assess the uncertainties, we expect idiosyncratic risks and company-specific risks to be the dominant concern for markets. We believe the market will shift its focus to determine to what degree each sector and each company is affected by the imminent vaccine distribution. As a result, dispersion between geographical regions and between different credit qualities will increase going forward.
| | | | |
| |
| CURRENCY ALLOCATION (%)6,7 | |
| US Dollar | | | 100.0 | |
| | | | |
| |
| COUNTRY ALLOCATION (%)6,7,8 | |
| China/Hong Kong | | | 44.0 | |
| Indonesia | | | 17.3 | |
| India | | | 14.2 | |
| Vietnam | | | 6.8 | |
| Switzerland | | | 3.1 | |
| Australia | | | 2.6 | |
| Philippines | | | 2.5 | |
| South Korea | | | 1.7 | |
| Cash and Other Assets, Less Liabilities | | | 7.8 | |
| | | | |
| |
| SECTOR ALLOCATION (%)6,7 | |
| Real Estate | | | 23.9 | |
| Financials | | | 17.0 | |
| Consumer Discretionary | | | 16.6 | |
| Energy | | | 13.8 | |
| Communication Services | | | 7.8 | |
| Materials | | | 6.5 | |
| Health Care | | | 4.3 | |
| Foreign Government Bonds | | | 1.5 | |
| Industrials | | | 0.9 | |
| Cash and Other Assets, Less Liabilities | | | 7.8 | |
| | | | |
| |
| ASSET TYPE BREAKDOWN (%)6,7 | |
| Non-Convertible Corporate Bonds | | | 72.4 | |
| Government Bonds | | | 6.8 | |
| Convertible Corporate Bonds | | | 13.1 | |
| Cash and Other Assets, Less Liabilities | | | 7.8 | |
| 6 | Source: FactSet Research Systems. Percentage values in data are rounded to the nearest tenth of one percent, so the values may not sum to 100% due to rounding. Country allocations and percentage values may be derived from different data sources and may not be consistent with other Fund literature. |
| 7 | Cash and other assets may include forward currency exchange contracts and certain derivative instruments that have been marked-to-market. |
| 8 | Not all countries where the Fund may invest are included in the benchmark index. |
Matthews Asia Credit Opportunities Fund
December 31, 2020
Schedule of Investmentsa
NON-CONVERTIBLE CORPORATE BONDS: 72.4%
| | | | | | | | |
| | | Face Amount* | | | Value | |
| | |
| CHINA/HONG KONG: 32.6% | | | | | | | | |
Honghua Group, Ltd.
6.375%, 08/01/22b | | | 4,800,000 | | | | $4,728,000 | |
| | |
Sino-Ocean Land Treasure III, Ltd.
4.900%c, 09/21/22b,d | | | 5,600,000 | | | | 4,696,418 | |
| | |
King Talent Management, Ltd.
5.600%c, 12/04/22b,d | | | 5,300,000 | | | | 4,596,110 | |
| | |
Times China Holdings, Ltd.
6.200%, 03/22/26 | | | 3,400,000 | | | | 3,527,462 | |
| | |
KWG Group Holdings, Ltd.
5.875%, 11/10/24b | | | 3,200,000 | | | | 3,289,610 | |
| | |
Wanda Properties International Co., Ltd.
7.250%, 01/29/24b | | | 2,400,000 | | | | 2,462,496 | |
| | |
Wanda Group Overseas, Ltd. 7.500%, 07/24/22b | | | 2,500,000 | | | | 2,416,554 | |
| | |
CIFI Holdings Group Co., Ltd. 5.950%, 10/20/25b | | | 2,000,000 | | | | 2,150,997 | |
| | |
Logan Group Co., Ltd.
5.250%, 02/23/23b | | | 1,500,000 | | | | 1,526,998 | |
| | |
KWG Group Holdings, Ltd.
7.400%, 03/05/24b | | | 300,000 | | | | 321,375 | |
| | | | | | | | |
Total China/Hong Kong | | | | | | | 29,716,020 | |
| | | | | | | | |
| | | | | | | | |
| |
| INDONESIA: 17.3% | |
Indika Energy Capital III Pte, Ltd. 5.875%, 11/09/24b | | | 5,000,000 | | | | 5,125,000 | |
| | |
PB International BV
7.625%, 01/26/22b | | | 5,300,000 | | | | 3,418,500 | |
| | |
PT Sri Rejeki Isman
7.250%, 01/16/25b | | | 3,000,000 | | | | 3,120,329 | |
| | |
PT Adaro Indonesia
4.250%, 10/31/24b | | | 2,600,000 | | | | 2,674,750 | |
| | |
Theta Capital Pte, Ltd.
6.750%, 10/31/26b | | | 1,500,000 | | | | 1,417,437 | |
| | | | | | | | |
Total Indonesia | | | | | | | 15,756,016 | |
| | | | | | | | |
| | | | | | | | |
| |
| INDIA: 14.3% | |
Tata Motors, Ltd.
5.875%, 05/20/25b | | | 4,200,000 | | | | 4,382,700 | |
| | |
Network i2i, Ltd.
5.650%c, 01/15/25d,e | | | 3,000,000 | | | | 3,189,000 | |
| | |
ABJA Investment Co. Pte, Ltd. 5.450%, 01/24/28b | | | 2,900,000 | | | | 3,067,501 | |
| | |
Network i2i, Ltd.
5.650%c, 01/15/25b,d | | | 2,200,000 | | | | 2,338,600 | |
| | | | | | | | |
Total India | | | | | | | 12,977,801 | |
| | | | | | | | |
| | | | | | | | |
| |
| SWITZERLAND: 3.1% | |
Syngenta Finance N.V.
5.182%, 04/24/28b | | | 1,400,000 | | | | 1,501,037 | |
| | |
Syngenta Finance N.V.
5.676%, 04/24/48b | | | 1,100,000 | | | | 1,143,087 | |
| | |
Syngenta Finance N.V.
4.892%, 04/24/25e | | | 200,000 | | | | 214,612 | |
| | | | | | | | |
Total Switzerland | | | | | | | 2,858,736 | |
| | | | | | | | |
| | | | | | | | |
| |
| AUSTRALIA: 2.6% | |
Australia & New Zealand Banking Group, Ltd.
6.750%c, 06/15/26b,d | | | 2,000,000 | | | | 2,334,300 | |
| | | | | | | | |
Total Australia | | | | | | | 2,334,300 | |
| | | | | | | | |
| | | | | | | | |
| |
| PHILIPPINES: 2.5% | |
Jollibee Worldwide Pte, Ltd. 3.900%c, 01/23/25b,d | | | 1,556,000 | | | | 1,488,936 | |
| | | | | | | | |
| | | Face Amount* | | | Value | |
| | |
Royal Capital BV
4.875%c, 05/05/24b,d | | | 782,000 | | | | $795,657 | |
| | | | | | | | |
Total Philippines | | | | | | | 2,284,593 | |
| | | | | | | | |
| | | | | | | | |
| | |
| TOTAL NON-CONVERTIBLE CORPORATE BONDS | | | | 65,927,466 | |
| | | | | | | | |
(Cost $65,332,298) | | | | | | | | |
| | | | | | | | |
| |
CONVERTIBLE CORPORATE BONDS: 13.0% | | | | | |
| |
| CHINA/HONG KONG: 11.3% | |
| | |
Luye Pharma Group, Ltd., Cnv. 1.500%, 07/09/24b | | | 4,100,000 | | | | 3,917,878 | |
| | |
Poseidon Finance 1, Ltd., Cnv. 0.000%, 02/01/25b | | | 3,800,000 | | | | 3,695,500 | |
| | |
Baozun, Inc., Cnv.
1.625%, 05/01/24 | | | 2,800,000 | | | | 2,688,303 | |
| | | | | | | | |
Total China/Hong Kong | | | | | | | 10,301,681 | |
| | | | | | | | |
| | | | | | | | |
| |
| SOUTH KOREA: 1.7% | |
Kakao Corp., Cnv.
0.000%, 04/28/23b | | | 1,400,000 | | | | 1,592,500 | |
| | | | | | | | |
Total South Korea | | | | 1,592,500 | |
| | | | | | | | |
| | | | | | | | |
| | |
| TOTAL CONVERTIBLE CORPORATE BONDS | | | | 11,894,181 | |
| | | | | | | | |
(Cost $12,137,582) | | | | | | | | |
| | | | | | | | |
| |
FOREIGN GOVERNMENT OBLIGATIONS: 6.8% | | | | | |
| |
| VIETNAM: 6.8% | |
Viet Nam Debt & Asset Trading Corp. 1.000%, 10/10/25b | | | 5,689,000 | | | | 4,892,540 | |
| | |
Socialist Republic of Vietnam 5.500%, 03/12/28 | | | 1,320,000 | | | | 1,326,600 | |
| | | | | | | | |
Total Vietnam | | | | 6,219,140 | |
| | | | | | | | |
| | | | | | | | |
| | |
| TOTAL FOREIGN GOVERNMENT OBLIGATIONS | | | | 6,219,140 | |
| | | | | | | | |
(Cost $5,892,881) | | | | | | | | |
| | | | | | | | |
| | |
| TOTAL INVESTMENTS: 92.2% | | | | 84,040,787 | |
(Cost $83,362,761) | | | | | | | | |
| | | | | | | | |
| |
CASH AND OTHER ASSETS,
LESS LIABILITIES: 7.8% | | | | 7,066,649 | |
| | | | | | | | |
| |
NET ASSETS: 100.0% | | | | $91,107,436 | |
| | | | | | | | |
| a | Certain securities were fair valued under the valuation policies approved by the Board of Trustees (Note 2-A). |
| b | The securities may be resold to qualified foreign investors and foreign institutional buyers under Regulation S of the Securities Act of 1933. |
| c | Security is a fix-to-float security, which carries a fixed coupon until a certain date, upon which it switches to a floating rate. Reference rate and spread are provided if the rate is currently floating. |
| d | Perpetual security with no stated maturity date. First call date is disclosed. |
| e | Security exempt from registration under Rule 144A of the Securities Act of 1933, as amended. The security may be resold in transactions exempt from registration normally to qualified institutional buyers. The security has been determined to be liquid in accordance with procedures adopted by the Funds’ Board of Trustees. At December 31, 2020, the aggregate value is $3,403,612, which is 3.74% of net assets. |
| * | All Values in USD unless otherwise specified |
See accompanying notes to financial statements.
| | | | |
| matthewsasia.com | 800.789.ASIA | | | 23 | |

| | | | |
| PORTFOLIO MANAGERS |
| |
| Robert J. Horrocks, PhD | | Kenneth Lowe, CFA |
Lead Manager | | Lead Manager |
| |
| Satya Patel* | | |
Co-Manager | | | | |
|
* As of August 31, 2020 |
| | | | |
|
| FUND FACTS |
| | |
| | | Investor | | Institutional |
Ticker | | MACSX | | MICSX |
CUSIP | | 577130206 | | 577130842 |
Inception | | 9/12/94 | | 10/29/10 |
NAV | | $18.05 | | $18.02 |
Initial Investment | | $2,500 | | $100,000 |
Gross Expense Ratio1 | | 1.09% | | 0.96% |
Portfolio Statistics | | |
Total # of Positions | | 57 |
Net Assets | | $1.5 billion |
Weighted Average Market Cap | | $134.1 billion |
Portfolio Turnover2 | | 36.3% |
Benchmark | | |
MSCI AC Asia ex Japan Index |
OBJECTIVE
Long-term capital appreciation. The Fund also seeks to provide some current income.
STRATEGY
Under normal market conditions, the Fund seeks to achieve its investment objective by investing at least 80% of its net assets, which include borrowings for investment purposes, in dividend-paying common stock, preferred stock and other equity securities, and convertible securities as well as fixed-income securities, of any duration or quality, including high yield securities, of companies located in Asia, which consists of all countries and markets in Asia, including developed, emerging and frontier countries and markets in the Asian region.
Matthews Asian Growth and Income Fund
Portfolio Manager Commentary (unaudited)
For the year ending December 31, 2020, the Matthews Asian Growth and Income Fund returned 16.00% (Investor Class) and 16.18% (Institutional Class), while its benchmark, the MSCI All Country Asia ex Japan Index, returned 25.36%. For the fourth quarter of the year, the Fund returned 15.52% (Investor Class) and 15.53% (Institutional Class) versus 18.66% for the Index.
Market Environment:
2020 was a remarkable year in many respects, not least of which is the unquestionably surprising strength of the performance of risk assets against a backdrop of a major health crisis that has crippled parts of the global economy. The coronavirus pandemic alongside a disputed U.S. presidential election, rising geopolitical tensions and an equity bull market that is long in the tooth appeared to be sufficient reasons to expect increased volatility, but these factors have been more than offset by a ramping up of aggressive monetary and fiscal support by almost all governmental and central bank regimes globally. This has caused the cost of capital to plummet to levels that most market participants have not witnessed during their careers, and the elevated valuations that follow.
Within Asia, equity market strength is a touch more understandable as the North Asian countries of China, Taiwan and South Korea led the charge. In China’s case, it has done a solid job of dealing with the virus and parts of the country are now functioning relatively normally with activity returning to pre-pandemic levels. For Taiwan and South Korea, both are important players within the technology supply chain that has been one of the few areas of visible and structural growth. Much of the rest of the region suffered a different fate as most markets in Southeast Asia finished the year in negative territory, although India bucked this trend with a late surge on hopes for a significant economic recovery in 2021.
Performance Contributor and Detractors:
The Fund underperformed over the course of the year but delivered solid absolute returns. This is a robust outcome given our more conservative, income-oriented investment approach. Style factors played an important role in relative performance during the year in light of the largest divergence between the performance of “growth” and “income” equities witnessed for some time.
In light of this, a key reason for the Fund’s relative performance was due to what we do not hold in the portfolio as a number of stay-at-home and electric vehicle stocks such as JD.Com, Alibaba, Meituan and Nio which delivered exceptionally strong performance. Although some of these are solid businesses, many do not fit our mandate of balancing growth and income. Elsewhere, the financial sector was the largest detractor to returns for the full year, although it contributed significantly over the fourth quarter. The largest of these was HSBC Group, which fell following a worsened outlook for global trade, questions over Hong Kong’s role in international finance and a suspension of its dividend. Thailand’s Kasikornbank also dropped on declining margins and elevated credit costs as the tourist dependent nation struggled to deal with the pandemic. We exited both positions during the year.
Parts of Southeast Asia also detracted from performance despite solid relative stock selection. SingTel dropped as it cut its dividend and delivered poor earnings due to lower roaming fees, rising price competition and weaker enterprise revenues. Genting Malaysia declined as the current health crisis is likely to impact the casino operator for quite some time.
The largest contributors to performance came from the IT sector with TSMC the strongest of these. The world’s largest semiconductor foundry gained as competitor Intel announced that it may consider outsourcing its own production. This further confirms TSMC’s leading position as we believe it is also likely to gain from increasing content value in Apple’s new iPhone as well as potential wins from other customers. Samsung Electronics rose as it is expected that it can gain smartphone market share from Huawei given U.S. restrictions on the latter’s access to necessary components, as well as
(continued)
| 1 | Actual 2020 expense ratios. |
| 2 | The lesser of fiscal year 2020 long-term purchase costs or sales proceeds divided by the average monthly market value of long-term securities. |
| | | | | | | | | | | | | | | | | | | | | | | | | | | | |
| | | | | | | | |
| PERFORMANCE AS OF DECEMBER 31, 2020 | | | | | | | | | | | | | | | | | | | | | |
| | | | | | | | | Average Annual Total Returns | | | | |
| | | 3 Months | | | 1 Year | | | 3 Years | | | 5 Years | | | 10 Years | | | Since
Inception | | | Inception
Date | |
Investor Class (MACSX) | | | 15.52% | | | | 16.00% | | | | 6.59% | | | | 8.38% | | | | 5.37% | | | | 9.22% | | | | 9/12/94 | |
Institutional Class (MICSX) | | | 15.53% | | | | 16.18% | | | | 6.76% | | | | 8.53% | | | | 5.52% | | | | 5.68% | | | | 10/29/10 | |
MSCI AC Asia ex Japan Index3 | | | 18.66% | | | | 25.36% | | | | 8.46% | | | | 13.90% | | | | 6.80% | | | | 5.40% | 4 | | | | |
Performance assumes reinvestment of all dividends and/or distributions before taxes. All performance quoted represents past performance and is no guarantee of future results. Investment return and principal value will fluctuate with market conditions so that when redeemed, shares may be worth more or less than their original cost. Current performance may be lower or higher than the return figures quoted. Returns would have been lower if certain of the Fund’s fees and expenses had not been waived. For the Fund’s most recent month-end performance, visit matthewsasia.com.
| | | | | | | | | | | | | | | | | | | | | | | | | | | | |
| | | | | | | | |
| INCOME DISTRIBUTION HISTORY | | | | | | | | | | | | | | | | | | | | | |
| | | 2020 | | | | | | 2019 | |
| | | June | | | December | | | Total | | | | | | June | | | December | | | Total | |
Investor (MACSX) | | $ | 0.11 | | | $ | 0.06 | | | $ | 0.16 | | | | | | | $ | 0.17 | | | $ | 0.18 | | | $ | 0.35 | |
Inst’l (MICSX) | | $ | 0.12 | | | $ | 0.07 | | | $ | 0.18 | | | | | | | $ | 0.18 | | | $ | 0.19 | | | $ | 0.38 | |
Note: This table does not include capital gains distributions. Totals may differ by $0.02 due to rounding. For income distribution history, visit matthewsasia.com.
| | | | |
| | | |
30-DAY YIELD: 1.37% (Investor Class) 1.44% (Institutional Class) The 30-Day Yield represents net investment income earned by the Fund over the 30-day period ended 12/31/20, expressed as an annual percentage rate based on the Fund’s share price at the end of the 30-day period. The 30-Day Yield should be regarded as an estimate of the Fund’s rate of investment income, and it may not equal the Fund’s actual income distribution rate. Source: BNY Mellon Investment Servicing (US) Inc. | | | | DIVIDEND YIELD: 2.55% The dividend yield (trailing) for the portfolio is the weighted average sum of the dividends paid by each equity security held by the Fund over the 12 months ended 12/31/20 divided by the current price of each equity as of 12/31/20. The annualized dividend yield for the Fund is for the equity-only portion of the portfolio. Please note that this is based on gross equity portfolio holdings and does not reflect the actual yield an investor in the Fund would receive. Past yields are no guarantee of future yields. Source: FactSet Research Systems, Bloomberg, MICM |
GROWTH OF A HYPOTHETICAL $10,000 INVESTMENT SINCE INCEPTION—INVESTOR CLASS
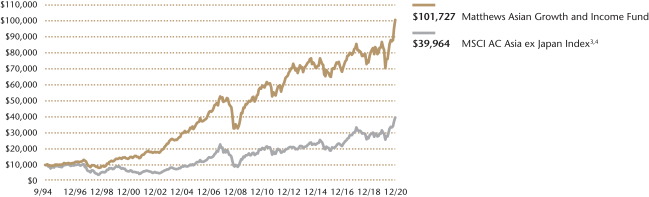
Plotted monthly. The performance data and graph do not reflect the deduction of taxes that a shareholder would pay on dividends, capital gains distributions or redemption of Fund shares. Values are in US$.
| | 3 | It is not possible to invest directly in an index. Source: Index data from Morgan Stanley Capital International and Bloomberg; total return calculations performed by BNY Mellon Investment Servicing (US) Inc. Please see page 93 for index definition. |
| | 4 | Calculated from 8/31/94. |
| | | | | | | | |
| | | | |
| TOP TEN HOLDINGS5 | | | | | | | |
| | | Sector | | Country | | % of Net Assets | |
Taiwan Semiconductor Manufacturing Co., Ltd. | | Information Technology | | Taiwan | | | 7.1% | |
Tencent Holdings, Ltd. | | Communication Services | | China/Hong Kong | | | 4.9% | |
Samsung Electronics Co., Ltd. | | Information Technology | | South Korea | | | 4.3% | |
AIA Group, Ltd. | | Financials | | China/Hong Kong | | | 4.1% | |
Midea Group Co., Ltd. | | Consumer Discretionary | | China/Hong Kong | | | 2.4% | |
Techtronic Industries Co., Ltd. | | Industrials | | China/Hong Kong | | | 2.4% | |
Housing Development Finance Corp., Ltd. | | Financials | | India | | | 2.3% | |
Broadcom, Inc. | | Information Technology | | United States | | | 2.1% | |
Advantech Co., Ltd. | | Information Technology | | Taiwan | | | 2.0% | |
Macquarie Korea Infrastructure Fund | | Financials | | South Korea | | | 2.0% | |
% OF ASSETS IN TOP 10 | | | | | | | 33.6% | |
| | 5 | Holdings may combine more than one security from same issuer and related depositary receipts. |
| | | | |
| matthewsasia.com | 800.789.ASIA | | | 25 | |
Matthews Asian Growth and Income Fund
Portfolio Manager Commentary (unaudited) (continued)
benefiting from an improving memory cycle. Elsewhere, the Fund’s holdings in domestic demand-oriented Chinese companies such as Tencent, Netease, Jiangsu Yanghe, Yili Industrial and Midea Group all rose significantly. The commonality here is that these are all leaders in their respective fields, and in strong positions to take advantage of a still growing consumer base.
Notable Portfolio Changes:
The final quarter to the year was an active one as increased volatility created a number of disconnects in markets. The largest alterations to the portfolio came in both China and convertible bonds as we exited nine positions and established six new holdings.
A number of new issues during 2020 created some attractive opportunities within the convertible bond market, including South Korean internet giant Kakao and Chinese e-commerce platform Pinduoduo. These additions increased the portfolio’s exposure to leading stay-at-home economy stocks, but done so in a way that we believe will continue to prudently manage risk. Both of these companies are strong credits with net cash balance sheets, and offer an attractive risk-reward skew as growth is likely to remain strong in our view.
Within equities, we added a small position in gold miner Saracen Mineral Holdings. The company is on the verge of merging with Northern Star Resources and in our view, the combined entity should be a business with a well-respected management team, solid production growth and room for synergies that could drive double digit earnings growth.* It also provides the portfolio with some exposure to the precious metal as a means of tail risk given the scale of unprecedented monetary action that has been taken by central banks globally.
These were funded through the sales of convertible bonds in Anta Sports, Bosideng, Haier and CapitaLand as well as equity positions in Jiangsu Yanghe, Lepu Medical, Zhejiang Supor, and KDDI.
Outlook:
Looking to 2021, the backdrop for emerging market and Asian equities appears reasonable. It is likely that the geopolitical landscape will become less erratic than the last few years with renewed hopes of engagement and diplomacy from the new U.S. administration. Further, the alteration in the U.S. Fed’s approach to monetary policy toward targeting average inflation is anticipated to keep interest rates low for the foreseeable future. This combined with a growing fiscal deficit in the U.S. and calls to undergo yet more stimulus may continue to put downward pressure on the U.S. dollar—often a key driver of relative returns for emerging markets. Adding to this constructive backdrop is that relative growth expectations in much of Asia are greater to Western counterparts and we have begun to witness earnings upgrades as the economic recovery ensues.
There are, of course, some counter arguments. Chief amongst these are valuations and style bifurcation. Headline multiples of 16.5x FY1 earnings (P/E Ratio is the share price of a stock as of the report date, divided by the forecasted earnings per share for the next 12-month period (FY1)) are lofty and also do not illustrate the degree to which “value” has underperformed “growth” over 2020. (Value stocks are represented by the MSCI All Country Asia ex Japan Value Index. Growth stocks are represented by the MSCI All Country Asia ex Japan Growth Index). The “value” index trades at only 10.6x FY1 earnings having delivered a relatively weak 9.9% return over 2020 in comparison to the “growth” index return of 40.4% and 25.5x FY1 earnings multiple. This is arguably justified to a degree, but it remains our belief that the party in high growth equities will not last in perpetuity. A raft of IPOs, SPACs (special-purpose acquisition companies) and elevated retail participation point to speculative behavior that lacks discipline. As a portfolio that aims to deliver attractive risk-adjusted returns across cycles through buying quality companies that display a blend of both growth and income, this backdrop leaves us fairly optimistic from a macroeconomic and style backdrop. We believe that we can generate attractive future portfolio returns as we aim to avoid value traps as well as overpriced conceptual growth stocks, focusing on long-term compounders that provide some income
| * | Earnings growth is not representative of the Fund’s future performance. |
| | | | |
| |
| COUNTRY ALLOCATION (%)6,7 | |
| China/Hong Kong | | | 43.8 | |
| South Korea | | | 13.0 | |
| Taiwan | | | 10.6 | |
| Singapore | | | 7.7 | |
| India | | | 7.4 | |
| France | | | 3.5 | |
| Indonesia | | | 2.5 | |
| Australia | | | 2.5 | |
| United States | | | 2.1 | |
| Vietnam | | | 1.4 | |
| Philippines | | | 1.3 | |
| Thailand | | | 0.9 | |
| Cash and Other Assets, Less Liabilities | | | 3.3 | |
| | | | |
| |
| SECTOR ALLOCATION (%)7 | |
| Information Technology | | | 19.1 | |
| Consumer Discretionary | | | 17.1 | |
| Financials | | | 16.0 | |
| Communication Services | | | 11.4 | |
| Industrials | | | 10.8 | |
| Consumer Staples | | | 8.2 | |
| Real Estate | | | 6.7 | |
| Utilities | | | 3.9 | |
| Health Care | | | 2.3 | |
| Materials | | | 1.1 | |
| Cash and Other Assets, Less Liabilities | | | 3.3 | |
| | | | |
| |
| MARKET CAP EXPOSURE (%)7 | |
| Mega Cap (over $25B) | | | 54.3 | |
| Large Cap ($10B-$25B) | | | 11.9 | |
| Mid Cap ($3B-10B) | | | 23.2 | |
| Small Cap (under $3B) | | | 7.4 | |
| Cash and Other Assets, Less Liabilities | | | 3.3 | |
| | | | |
| |
| ASSET TYPE BREAKDOWN (%)7,8 | |
| Common Equities and ADRs | | | 85.8 | |
| Convertible Corporate Bonds | | | 9.1 | |
| Preferred Equities | | | 1.8 | |
| Cash and Other Assets, Less Liabilities | | | 3.3 | |
| 6 | Not all countries where the Fund may invest are included in the benchmark index. |
| 7 | Source: FactSet Research Systems. Percentage values in data are rounded to the nearest tenth of one percent, so the values may not sum to 100% due to rounding. Country allocations and percentage values may be derived from different data sources and may not be consistent with other Fund literature. |
| 8 | Bonds are not included in the MSCI All Country Asia ex Japan Index. |
Matthews Asian Growth and Income Fund
December 31, 2020
Schedule of Investmentsa
COMMON EQUITIES: 85.8%
| | | | | | | | |
| | | Shares | | | Value | |
| | |
| CHINA/HONG KONG: 36.1% | | | | | | | | |
Tencent Holdings, Ltd. | | | 1,014,400 | | | | $72,989,933 | |
| | |
AIA Group, Ltd. | | | 4,998,400 | | | | 60,911,114 | |
| | |
Midea Group Co., Ltd. A Shares | | | 2,372,079 | | | | 35,927,468 | |
| | |
Techtronic Industries Co., Ltd. | | | 2,494,000 | | | | 35,647,803 | |
| | |
Inner Mongolia Yili Industrial Group Co., Ltd. A Shares | | | 4,047,575 | | | | 27,622,787 | |
| | |
NetEase, Inc. ADR | | | 286,000 | | | | 27,390,220 | |
| | |
Yum China Holdings, Inc. | | | 429,500 | | | | 24,520,155 | |
| | |
Minth Group, Ltd. | | | 4,556,000 | | | | 24,104,330 | |
| | |
Zhongsheng Group Holdings, Ltd. | | | 3,143,500 | | | | 22,455,055 | |
| | |
Guangdong Investment, Ltd. | | | 12,456,000 | | | | 22,454,290 | |
| | |
CK Hutchison Holdings, Ltd. | | | 3,041,672 | | | | 21,236,451 | |
| | |
Link REIT | | | 2,214,800 | | | | 20,114,319 | |
| | |
Ever Sunshine Lifestyle Services Group, Ltd.b | | | 8,984,000 | | | | 19,730,360 | |
| | |
Ping An Insurance Group Co. of China, Ltd. | | | | | | | | |
| | |
H Shares | | | 1,581,500 | | | | 19,246,249 | |
| | |
China Yangtze Power Co., Ltd. A Shares | | | 6,508,400 | | | | 19,172,735 | |
| | |
Jiangsu Expressway Co., Ltd. H Shares | | | 16,770,000 | | | | 18,757,227 | |
| | |
HKT Trust & HKT, Ltd. | | | 14,402,000 | | | | 18,678,392 | |
| | |
China Resources Land, Ltd. | | | 4,276,000 | | | | 17,620,926 | |
| | |
CLP Holdings, Ltd. | | | 1,726,200 | | | | 15,961,556 | |
| | |
BOC Hong Kong Holdings, Ltd. | | | 5,107,500 | | | | 15,481,991 | |
| | | | | | | | |
Total China/Hong Kong | | | | | | | 540,023,361 | |
| | | | | | | | |
| | | | | | | | |
| | | |
| TAIWAN: 10.6% | | | | | | | | |
Taiwan Semiconductor Manufacturing Co., Ltd. | | | 5,586,187 | | | | 105,676,540 | |
| | |
Advantech Co., Ltd. | | | 2,419,884 | | | | 30,208,357 | |
| | |
Taiwan Secom Co., Ltd. | | | 7,112,000 | | | | 22,464,481 | |
| | | | | | | | |
Total Taiwan | | | | | | | 158,349,378 | |
| | | | | | | | |
| | | | | | | | |
| | | |
| SOUTH KOREA: 9.8% | | | | | | | | |
Samsung Electronics Co., Ltd. | | | 866,075 | | | | 64,674,601 | |
| | |
Macquarie Korea Infrastructure Fund | | | 3,054,814 | | | | 29,972,197 | |
| | |
Coway Co., Ltd.c | | | 330,466 | | | | 22,146,178 | |
| | |
Hanon Systems | | | 1,478,342 | | | | 22,132,888 | |
| | |
LEENO Industrial, Inc. | | | 66,525 | | | | 8,273,342 | |
| | | | | | | | |
Total South Korea | | | | | | | 147,199,206 | |
| | | | | | | | |
| | | | | | | | |
| | | |
| SINGAPORE: 7.7% | | | | | | | | |
Ascendas, REIT | | | 10,083,484 | | | | 22,763,061 | |
| | |
Singapore Technologies Engineering, Ltd. | | | 7,823,325 | | | | 22,641,310 | |
| | |
Venture Corp., Ltd. | | | 1,454,400 | | | | 21,385,227 | |
| | |
United Overseas Bank, Ltd. | | | 1,193,000 | | | | 20,333,989 | |
| | |
Singapore Telecommunications, Ltd. | | | 10,515,700 | | | | 18,361,903 | |
| | |
Ascendas India Trust | | | 8,946,700 | | | | 9,340,244 | |
| | | | | | | | |
Total Singapore | | | | | | | 114,825,734 | |
| | | | | | | | |
| | | | | | | | |
| | | |
| INDIA: 7.4% | | | | | | | | |
Housing Development Finance Corp., Ltd. | | | 979,513 | | | | 34,318,171 | |
| | |
Tata Consultancy Services, Ltd. | | | 628,279 | | | | 24,669,459 | |
| | |
ITC, Ltd. | | | 8,338,840 | | | | 23,881,033 | |
| | |
Sanofi India, Ltd. | | | 182,288 | | | | 20,766,875 | |
| | |
Embassy Office Parks, REIT | | | 1,644,000 | | | | 7,759,027 | |
| | | | | | | | |
Total India | | | | | | | 111,394,565 | |
| | | | | | | | |
| | | | | | | | |
| | | | | | | | |
| | | Shares | | | Value | |
| | |
| FRANCE: 3.5% | | | | | | | | |
LVMH Moet Hennessy Louis Vuitton SE | | | 46,973 | | | | $29,405,165 | |
| | |
Pernod Ricard SA | | | 121,618 | | | | 23,356,316 | |
| | | | | | | | |
Total France | | | | | | | 52,761,481 | |
| | | | | | | | |
| | | | | | | | |
| | | |
| AUSTRALIA: 2.5% | | | | | | | | |
Macquarie Group, Ltd. | | | 197,166 | | | | 21,045,378 | |
| | |
Saracen Mineral Holdings, Ltd.c | | | 4,641,324 | | | | 17,029,989 | |
| | | | | | | | |
Total Australia | | | | | | | 38,075,367 | |
| | | | | | | | |
| | | | | | | | |
| | | |
| INDONESIA: 2.5% | | | | | | | | |
PT Bank Rakyat Indonesia Persero | | | 65,968,800 | | | | 19,612,752 | |
| | |
PT Ace Hardware Indonesia | | | 140,400,400 | | | | 17,160,216 | |
| | | | | | | | |
Total Indonesia | | | | | | | 36,772,968 | |
| | | | | | | | |
| | | | | | | | |
| | | |
| UNITED STATES: 2.1% | | | | | | | | |
Broadcom, Inc. | | | 70,600 | | | | 30,912,210 | |
| | | | | | | | |
Total United States | | | | | | | 30,912,210 | |
| | | | | | | | |
| | | | | | | | |
| | | |
| VIETNAM: 1.4% | | | | | | | | |
Vietnam Dairy Products JSC | | | 4,315,311 | | | | 20,359,776 | |
| | | | | | | | |
Total Vietnam | | | | | | | 20,359,776 | |
| | | | | | | | |
| | | | | | | | |
| | | |
| PHILIPPINES: 1.3% | | | | | | | | |
Bank of the Philippine Islands | | | 11,310,504 | | | | 19,140,324 | |
| | | | | | | | |
Total Philippines | | | | | | | 19,140,324 | |
| | | | | | | | |
| | | | | | | | |
| | | |
| THAILAND: 0.9% | | | | | | | | |
Digital Telecommunications Infrastructure Fund F Shares | | | 32,704,700 | | | | 14,088,319 | |
| | | | | | | | |
Total Thailand | | | | | | | 14,088,319 | |
| | | | | | | | |
| | | | | | | | |
| | | |
| TOTAL COMMON EQUITIES | | | | | | | 1,283,902,689 | |
| | | | | | | | |
(Cost $921,941,395) | | | | | | | | |
CONVERTIBLE CORPORATE BONDS: 9.1%
| | | | | | | | |
| | | Face Amount* | | | Value | |
| | |
| CHINA/HONG KONG: 7.8% | | | | | | | | |
| | |
ESR Cayman, Ltd., Cnv. 1.500%, 09/30/25b | | | 20,647,000 | | | | 23,011,082 | |
| | |
Pinduoduo, Inc., Cnv.
0.000%, 12/01/25 | | | 18,223,000 | | | | 22,474,169 | |
|
China Conch Venture Holdings International, Ltd., Cnv. | |
0.000%, 09/05/23b | | | HKD 142,000,000 | | | | 21,119,259 | |
| | |
Baozun, Inc., Cnv.
1.625%, 05/01/24 | | | 19,572,000 | | | | 18,791,239 | |
|
China Education Group Holdings, Ltd., Cnv. | |
2.000%, 03/28/24b | | | HKD 111,000,000 | | | | 16,966,894 | |
| | |
Luye Pharma Group, Ltd., Cnv.
1.500%, 07/09/24b | | | 14,101,000 | | | | 13,474,634 | |
| | | | | | | | |
Total China/Hong Kong | | | | | | | 115,837,277 | |
| | | | | | | | |
| | | | | | | | |
| | | | |
| matthewsasia.com | 800.789.ASIA | | | 27 | |
Matthews Asian Growth and Income Fund
December 31, 2020
Schedule of Investmentsa (continued)
| | |
| CONVERTIBLE CORPORATE BONDS (continued) | | |
| | | | | | | | |
| | | Face Amount* | | | Value | |
| | |
| SOUTH KOREA: 1.3% | | | | | | | | |
Kakao Corp., Cnv. 0.000%, 04/28/23b | | | 17,300,000 | | | | $19,678,750 | |
| | | | | | | | |
Total South Korea | | | | | | | 19,678,750 | |
| | | | | | | | |
| | | | | | | | |
| | |
| TOTAL CONVERTIBLE CORPORATE BONDS | | | | 135,516,027 | |
| | | | | | | | |
(Cost $130,489,111) | | | | | | | | |
PREFERRED EQUITIES: 1.8%
| | | | | | | | |
| | | Shares | | | Value | |
| | |
| SOUTH KOREA: 1.8% | | | | | | | | |
LG Household & Health Care, Ltd., Pfd. | | | 41,042 | | | | 27,149,805 | |
| | | | | | | | |
Total South Korea | | | | | | | 27,149,805 | |
| | | | | | | | |
| | | | | | | | |
| | | |
| TOTAL PREFERRED EQUITIES | | | | | | | 27,149,805 | |
| | | | | | | | |
(Cost $11,577,044) | | | | | | | | |
| | | | | | | | |
| | | |
| TOTAL INVESTMENTS: 96.7% | | | | | | | 1,446,568,521 | |
(Cost $1,064,007,550) | | | | | | | | |
| | | | | | | | |
| | |
CASH AND OTHER ASSETS,
LESS LIABILITIES: 3.3% | | | | | | | 49,186,383 | |
| | | | | | | | |
| | |
NET ASSETS: 100.0% | | | | | | | $1,495,754,904 | |
| | | | | | | | |
| a | Certain securities were fair valued under the valuation policies approved by the Board of Trustees (Note 2-A). |
| b | The securities may be resold to qualified foreign investors and foreign institutional buyers under Regulation S of the Securities Act of 1933. |
| c | Non-income producing security. |
| * | All Values in USD unless otherwise specified |
| ADR | American Depositary Receipt |
| REIT | Real Estate Investment Trust |
See accompanying notes to financial statements.
| | | | |
| PORTFOLIO MANAGERS |
| |
| Yu Zhang, CFA | | |
Lead Manager | | |
| |
| Robert Horrocks, PhD | | S. Joyce Li, CFA |
Co-Manager | | Co-Manager |
| |
| Sherwood Zhang, CFA | | |
Co-Manager | | |
|
| FUND FACTS |
| | |
| | | Investor | | Institutional |
Ticker | | MAPIX | | MIPIX |
CUSIP | | 577125107 | | 577130750 |
Inception | | 10/31/06 | | 10/29/10 |
NAV | | $22.63 | | $22.62 |
Initial Investment | | $2,500 | | $100,000 |
Gross Expense Ratio1 | | 1.03% | | 0.93% |
After Fee Waiver and Reimbursement2 | | 1.02% | | 0.93% |
Portfolio Statistics |
Total # of Positions | | 55 |
Net Assets | | $5.2 billion |
Weighted Average Market Cap | | $81.7 billion |
Portfolio Turnover3 | | 37.7% |
Benchmark | | | | |
MSCI AC Asia Pacific Index |
OBJECTIVE
Total return with an emphasis on providing current income.
STRATEGY
Under normal market conditions, the Fund seeks to achieve its investment objective by investing at least 80% of its net assets, which include borrowings for investment purposes, in dividend-paying equity securities of companies located in Asia. Asia consists of all countries and markets in Asia, and includes developed, emerging and frontier countries and markets in the Asian region. The Fund may also invest in convertible debt and equity securities of companies located in Asia.
Matthews Asia Dividend Fund
Portfolio Manager Commentary (unaudited)
For the year ending December 31, 2020, the Matthews Asia Dividend Fund returned 31.25% (Investor Class) and 31.29% (Institutional Class), while its benchmark, the MSCI All Country Asia Pacific Index returned 20.07%. For the fourth quarter of the year, the Fund returned 14.52% (Investor Class) and 14.47% (Institutional Class) versus 17.88% for the Index.
Market Environment:
Asian equities delivered a strong performance in 2020, despite the severe blow to the region’s economy by the COVID-19 pandemic. After suffering a steep loss due to the onset of the virus outbreak early in the year, Asian markets quickly found a firm bottom and staged a sharp rebound, thanks to the unprecedented liquidity injection and fiscal stimulus measures by governments. Investors’ confidence was later further bolstered by clear signs of a speedy recovery of the Chinese economy and the breakthrough in COVID vaccine development. The market gained further momentum, pushing Asian equities to a record-high.
Performance Contributors and Detractors:
Our total-return investment approach provides the flexibility of investing in both dividend-paying stocks and dividend growth stocks. During the market meltdown early in the year, we aggressively increased our exposure to dividend growth stocks whose valuation was brought down significantly by the market dislocation but whose structural growth remained intact. This pivot towards dividend growth stocks paid off well for the strategy.
From a country perspective, China/Hong Kong contributed most to the Fund’s performance for 2020, helped by both stock selection and an overweight allocation relative to the benchmark. China’s effective response in containing the pandemic and a swift recovery of its economy provided a positive backdrop for Chinese equities to perform well. In addition, the further opening up of China’s onshore capital market attracted strong capital inflow from global investors. Our portfolio benefited from an increased allocation to China-A shares (shares in mainland China-based companies that trade on Chinese stock exchanges such as the Shanghai Stock Exchange and the Shenzhen Stock Exchange), as several of our A-share holdings were among the top-performing stocks for the year. On the other hand, our holdings in India detracted the most from relative performance. As India was lagging behind North Asia in terms of pandemic control, cyclical businesses suffered a demand shock and their shares underperformed.
From a sector perspective, the portfolio’s overweight to and stock selection in consumer discretionary was the top contributor to Fund performance. Our holdings in Chinese auto-parts and auto dealerships performed strongly during the year, as demand recovered quickly in China and the companies further solidified their industry leadership. On the other hand, communication services was the bottom-performing sector. Several of our traditional telecom stocks underperformed during the year, as growth-oriented stocks outperformed value stocks.
Turning to individual stocks, among the top-performing stocks for the year was our holding in LG Chemical based in South Korea. Traditionally considered a petrochemical business, LG Chemical has been investing aggressively in its electric
(continued)
| 1 | Actual 2020 expense ratios. |
| 2 | Matthews has contractually agreed to waive a portion of its advisory fee and administrative and shareholder services fee if the Fund’s average daily net assets are over $3 billion, as follows: for every $2.5 billion average daily net assets of the Fund that are over $3 billion, the advisory fee rate and the administrative and shareholder services fee rate for the Fund with respect to such excess average daily net assets will be each reduced by 0.01%, in each case without reducing such fee rate below 0.00%. Any amount waived by Matthews pursuant to this agreement may not be recouped by Matthews. This agreement will remain in place until April 30, 2022 and may be terminated (i) at any time by the Board of Trustees upon 60 days’ prior written notice to Matthews; or (ii) by Matthews at the annual expiration date of the agreement upon 60 days’ prior written notice to the Trust, in each case without payment of any penalty. |
| 3 | The lesser of fiscal year 2020 long-term purchase costs or sales proceeds divided by the average monthly market value of long-term securities. |
| | | | |
| matthewsasia.com | 800.789.ASIA | | | 29 | |
| | | | | | | | | | | | | | | | | | | | | | | | | | | | |
| |
| PERFORMANCE AS OF DECEMBER 31, 2020 | |
| | | | | | | | | Average Annual Total Returns | | | | |
| | | 3 Months | | | 1 Year | | | 3 Years | | | 5 Years | | | 10 Years | | | Since
Inception | | | Inception
Date | |
| Investor Class (MAPIX) | | | 14.52% | | | | 31.25% | | | | 8.39% | | | | 12.30% | | | | 8.46% | | | | 9.98% | | | | 10/31/06 | |
| Institutional Class (MIPIX) | | | 14.47% | | | | 31.29% | | | | 8.50% | | | | 12.42% | | | | 8.57% | | | | 8.73% | | | | 10/29/10 | |
| MSCI AC Asia Pacific Index4 | | | 17.88% | | | | 20.07% | | | | 7.64% | | | | 11.62% | | | | 6.68% | | | | 5.72% | 5 | | | | |
Performance assumes reinvestment of all dividends and/or distributions before taxes. All performance quoted represents past performance and is no guarantee of future results. Investment return and principal value will fluctuate with market conditions so that when redeemed, shares may be worth more or less than their original cost. Current performance may be lower or higher than the return figures quoted. Returns would have been lower if certain of the Fund’s fees and expenses had not been waived. For the Fund’s most recent month-end performance, visit matthewsasia.com.
| | | | | | | | | | | | | | | | | | | | | | | | | | | | | | | | | | | | | | | | | | | | |
| | | | | | | | | | |
| INCOME DISTRIBUTION HISTORY | | | | | | | | | | | | | | | | | | | | | | | | | | | | |
| | | 2020 | | | | | | 2019 | |
| | | Q1 | | | Q2 | | | Q3 | | | Q4 | | | Total | | | | | | Q1 | | | Q2 | | | Q3 | | | Q4 | | | Total | |
| Investor (MAPIX) | | $ | 0.04 | | | $ | 0.12 | | | $ | 0.06 | | | $ | 0.00 | | | $ | 0.22 | | | | | | | $ | 0.03 | | | $ | 0.12 | | | $ | 0.11 | | | $ | 0.09 | | | $ | 0.36 | |
| Inst’l (MIPIX) | | $ | 0.05 | | | $ | 0.12 | | | $ | 0.06 | | | $ | 0.00 | | | $ | 0.23 | | | | | | | $ | 0.04 | | | $ | 0.12 | | | $ | 0.12 | | | $ | 0.10 | | | $ | 0.37 | |
Note: This table does not include capital gains distributions. Totals may differ by $0.02 due to rounding and a return of capital. For distribution history please visit matthewsasia.com.
| | | | |
| | | |
30-DAY YIELD: Investor Class: 0.86% (0.86% excluding waivers) Institutional Class: 0.96% (0.96% excluding waivers) The 30-Day Yield represents net investment income earned by the Fund over the 30-day period ended 12/31/20, expressed as an annual percentage rate based on the Fund’s share price at the end of the 30-day period. The 30-Day Yield should be regarded as an estimate of the Fund’s rate of investment income, and it may not equal the Fund’s actual income distribution rate. Source: BNY Mellon Investment Servicing (US) Inc. | | | | DIVIDEND YIELD: 1.80% The dividend yield (trailing) for the portfolio is the weighted average sum of the dividends paid by each equity security held by the Fund over the 12 months ended 12/31/20 divided by the current price of each equity as of 12/31/20. The annualized dividend yield for the Fund is for the equity-only portion of the portfolio. Please note that this is based on gross equity portfolio holdings and does not reflect the actual yield an investor in the Fund would receive. Past yields are no guarantee of future yields. Source: FactSet Research Systems, Bloomberg, MICM. |
GROWTH OF A HYPOTHETICAL $10,000 INVESTMENT SINCE INCEPTION—INVESTOR CLASS
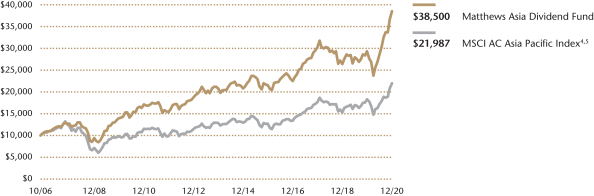
Plotted monthly. The performance data and graph do not reflect the deduction of taxes that a shareholder would pay on dividends, capital gains distributions or redemption of Fund shares. Values are in US$.
| | 4 | It is not possible to invest directly in an index. Source: Index data from Morgan Stanley Capital International and Bloomberg; total return calculations performed by BNY Mellon Investment Servicing (US) Inc. Please see page 93 for index definition. |
| | 5 | Calculated from 10/31/06. |
| | | | | | | | |
| | | | |
| TOP TEN HOLDINGS6 | | | | | | | |
| | | Sector | | Country | | % of Net Assets | |
| Minth Group, Ltd. | | Consumer Discretionary | | China/Hong Kong | | | 6.2% | |
| Taiwan Semiconductor Manufacturing Co., Ltd. | | Information Technology | | Taiwan | | | 4.8% | |
| LG Chem, Ltd., Pfd. | | Materials | | South Korea | | | 3.3% | |
| Breville Group, Ltd. | | Consumer Discretionary | | Australia | | | 2.9% | |
| Chongqing Brewery Co., Ltd. | | Consumer Staples | | China/Hong Kong | | | 2.8% | |
| KATITAS Co., Ltd. | | Real Estate | | Japan | | | 2.6% | |
| Hoya Corp. | | Health Care | | Japan | | | 2.6% | |
| MISUMI Group, Inc. | | Industrials | | Japan | | | 2.4% | |
| Anritsu Corp. | | Information Technology | | Japan | | | 2.3% | |
| Tencent Holdings, Ltd. | | Communication Services | | China/Hong Kong | | | 2.2% | |
| % OF ASSETS IN TOP 10 | | | | | | | 32.1% | |
| | 6 | Holdings may combine more than one security from same issuer and related depositary receipts. |
| | | | |
| |
| COUNTRY ALLOCATION (%)7,8 | |
| Japan | | | 30.7 | |
| China/Hong Kong | | | 30.7 | |
| South Korea | | | 9.5 | |
| Australia | | | 8.1 | |
| Taiwan | | | 6.2 | |
| Singapore | | | 5.3 | |
| India | | | 2.5 | |
| Philippines | | | 1.5 | |
| Thailand | | | 1.2 | |
| Bangladesh | | | 1.1 | |
| Cash and Other Assets, Less Liabilities | | | 3.1 | |
| | | | |
| SECTOR ALLOCATION (%)8 | |
| Consumer Discretionary | | | 26.7 | |
| Information Technology | | | 14.1 | |
| Industrials | | | 12.3 | |
| Financials | | | 9.5 | |
| Communication Services | | | 9.5 | |
| Consumer Staples | | | 8.6 | |
| Health Care | | | 6.5 | |
| Real Estate | | | 5.3 | |
| Materials | | | 3.3 | |
| Energy | | | 1.1 | |
| Cash and Other Assets, Less Liabilities | | | 3.1 | |
| | | | |
| MARKET CAP EXPOSURE (%)8 | |
| Mega Cap (over $25B) | | | 34.3 | |
| Large Cap ($10B–$25B) | | | 19.2 | |
| Mid Cap ($3B–10B) | | | 27.5 | |
| Small Cap (under $3B) | | | 15.9 | |
| Cash and Other Assets, Less Liabilities | | | 3.1 | |
| 7 | Not all countries where the Fund may invest are included in the benchmark index. |
| 8 | Source: FactSet Research Systems. Percentage values in data are rounded to the nearest tenth of one percent, so the values may not sum to 100% due to rounding. Country allocations and percentage values may be derived from different data sources and may not be consistent with other Fund literature. |
Matthews Asia Dividend Fund
Portfolio Manager Commentary (unaudited) (continued)
vehicle (EV) battery business over the last several years. Today, LG Chemical is ranked among the top EV battery makers globally. Recognizing this paradigm shift of the global automobile industry, investors started bidding up share prices of key players along the EV industry value chain, and the company’s share price appreciated significantly. On the flipside, Hyundai Mobis, an auto-parts business also based in South Korea, was among the bottom-performing holdings for the year. Mobis saw a substantial, negative impact from the COVID-19 pandemic as its downstream auto OEM (original equipment manufacturer) customers faced both demand collapse and production disruption. Despite the short-term lag underperformance, we believe our investment thesis on Mobis remains valid. A potential value-unlocking, triggered by Hyundai Group’s restructuring and Mobis’ increased focus towards vehicle electrification, could be positive for Mobis’ valuation re-rating and dividend growth.
Portfolio Changes:
In the fourth quarter, we initiated two new financial stocks: AIA Group, a Hong Kong-based life insurance business with strong market presence across Asia, and Postal Savings Bank, a commercial bank with a strong deposit franchise in rural China. The financial sector was the worse-performing sector within Asia during the year and both AIA and Postal Savings Bank underperformed. However, we believe both stocks are currently priced at attractive levels versus their long-term growth potentials, and think the negative impact from COVID has been sufficiently reflected in the underperforming share price. In addition, an improving outlook on economic recovery, helped by vaccine rollouts in 2021, could be a tailwind for interest-rate sensitive stocks like financials to perform.
During the quarter, we exited one stock, China Resources Land, a Chinese real estate developer. We exited our position as our investment thesis for the company—value-unlocking from a potential spinoff of CR Land’s property management business—materialized after a successful listing of its property management division in Hong Kong.
Outlook:
The resurgence of COVID-19 and the vaccine rollout are likely to drive the market volatility in the near term. Taking a more disciplined approach managing the pandemic, Asia is relatively better positioned for a potential post-pandemic economic recovery. Corporate earnings recovery and liquidity conditions should both be closely monitored to determine the strength of the current market rally. Geopolitical factors, especially U.S.—China relations under the Biden administration, will also influence the unfolding of Asia’s market in the new year. We believe a total-return approach, balancing dividend income with dividend growth, should continue to help us uncover attractive market opportunities in 2021.
| | | | |
| matthewsasia.com | 800.789.ASIA | | | 31 | |
Matthews Asia Dividend Fund
December 31, 2020
Schedule of Investmentsa
COMMON EQUITIES: 91.4%
| | | | | | | | |
| | | Shares | | | Value | |
| | |
| CHINA/HONG KONG: 30.8% | | | | | | | | |
Minth Group, Ltd.† | | | 61,253,000 | | | | $324,069,910 | |
| | |
Chongqing Brewery Co., Ltd. A Shares | | | 8,084,870 | | | | 147,241,962 | |
| | |
Tencent Holdings, Ltd. | | | 1,618,900 | | | | 116,486,004 | |
| | |
Shenzhou International Group Holdings, Ltd. | | | 5,008,700 | | | | 98,161,758 | |
| | |
Gree Electric Appliances, Inc. of Zhuhai A Shares | | | 10,169,803 | | | | 96,941,894 | |
| | |
Zhongsheng Group Holdings, Ltd. | | | 12,812,500 | | | | 91,523,905 | |
| | |
China Tourism Group Duty Free Corp., Ltd. A Shares | | | 2,010,593 | | | | 87,518,201 | |
| | |
Wuliangye Yibin Co., Ltd. A Shares | | | 1,916,644 | | | | 86,084,381 | |
| | |
China Education Group Holdings, Ltd.b | | | 44,063,000 | | | | 84,991,502 | |
| | |
AIA Group, Ltd. | | | 6,731,800 | | | | 82,034,538 | |
| | |
Pharmaron Beijing Co., Ltd. A Shares | | | 4,327,964 | | | | 80,223,418 | |
| | |
Postal Savings Bank of China Co., Ltd. H Sharesb,c | | | 131,505,000 | | | | 74,308,225 | |
| | |
HKBN, Ltd. | | | 46,034,623 | | | | 71,306,045 | |
| | |
China East Education Holdings, Ltd.b,c | | | 28,112,000 | | | | 67,652,928 | |
| | |
Yuexiu Transport Infrastructure, Ltd.† | | | 93,902,000 | | | | 64,004,076 | |
| | |
Pharmaron Beijing Co., Ltd. H Sharesb,c | | | 1,609,500 | | | | 27,211,371 | |
| | | | | | | | |
Total China/Hong Kong | | | | | | | 1,599,760,118 | |
| | | | | | | | |
| | | | | | | | |
| | | |
| JAPAN: 30.7% | | | | | | | | |
KATITAS Co., Ltd.† | | | 4,186,900 | | | | 135,099,904 | |
| | |
Hoya Corp. | | | 964,800 | | | | 133,619,800 | |
| | |
MISUMI Group, Inc. | | | 3,777,800 | | | | 124,015,101 | |
| | |
Anritsu Corp. | | | 5,461,500 | | | | 121,921,213 | |
| | |
Bandai Namco Holdings, Inc. | | | 1,302,500 | | | | 112,797,501 | |
| | |
Nintendo Co., Ltd. | | | 159,300 | | | | 102,261,268 | |
| | |
Lixil Corp. | | | 4,632,900 | | | | 100,472,171 | |
| | |
Disco Corp. | | | 277,700 | | | | 93,594,045 | |
| | |
TDK Corp. | | | 598,500 | | | | 90,303,795 | |
| | |
Dai-ichi Life Holdings, Inc. | | | 5,932,600 | | | | 89,376,980 | |
| | |
Oriental Land Co., Ltd. | | | 531,100 | | | | 87,754,359 | |
| | |
Daifuku Co., Ltd. | | | 686,500 | | | | 84,951,340 | |
| | |
Pigeon Corp. | | | 2,048,200 | | | | 84,534,813 | |
| | |
BELLSYSTEM24 Holdings, Inc.† | | | 5,045,500 | | | | 79,189,759 | |
| | |
Shiseido Co., Ltd. | | | 1,033,300 | | | | 71,529,427 | |
| | |
MANI, INC. | | | 2,038,000 | | | | 55,591,656 | |
| | |
Mitsubishi Pencil Co., Ltd. | | | 2,403,000 | | | | 32,072,768 | |
| | | | | | | | |
Total Japan | | | | | | | 1,599,085,900 | |
| | | | | | | | |
| | | | | | | | |
| | | |
| AUSTRALIA: 8.1% | | | | | | | | |
Breville Group, Ltd.† | | | 7,564,257 | | | | 148,884,666 | |
| | |
Macquarie Group, Ltd. | | | 873,108 | | | | 93,195,013 | |
| | |
Sydney Airport | | | 18,253,479 | | | | 90,351,473 | |
| | |
QBE Insurance Group, Ltd. | | | 12,339,933 | | | | 80,436,971 | |
| | |
IDP Education, Ltd. | | | 610,051 | | | | 9,350,662 | |
| | | | | | | | |
Total Australia | | | | | | | 422,218,785 | |
| | | | | | | | |
| | | | | | | | |
| | | |
| TAIWAN: 6.2% | | | | | | | | |
Taiwan Semiconductor Manufacturing Co., Ltd. ADR | | | 1,147,440 | | | | 125,116,857 | |
| | |
Taiwan Semiconductor Manufacturing Co., Ltd. | | | 6,449,469 | | | | 122,007,654 | |
| | |
Cathay Financial Holding Co., Ltd. | | | 49,390,000 | | | | 74,370,528 | |
| | | | | | | | |
Total Taiwan | | | | | | | 321,495,039 | |
| | | | | | | | |
| | | | | | | | |
| | | | | | | | |
| | | Shares | | | Value | |
| | |
| SINGAPORE: 5.3% | | | | | | | | |
Keppel DC, REIT | | | 38,579,180 | | | | $82,151,614 | |
| | |
NetLink NBN Trustb | | | 94,863,200 | | | | 69,335,194 | |
| | |
BOC Aviation, Ltd.b,c | | | 7,703,800 | | | | 66,680,308 | |
| | |
Ascendas India Trust | | | 57,288,600 | | | | 59,808,587 | |
| | | | | | | | |
Total Singapore | | | | | | | 277,975,703 | |
| | | | | | | | |
| | | | | | | | |
| | | |
| SOUTH KOREA: 4.0% | | | | | | | | |
Hyundai Mobis Co., Ltd. | | | 449,593 | | | | 105,818,979 | |
| | |
Samsung Electronics Co., Ltd. | | | 870,241 | | | | 64,985,699 | |
| | |
Hugel, Inc.d | | | 225,785 | | | | 39,062,066 | |
| | | | | | | | |
Total South Korea | | | | | | | 209,866,744 | |
| | | | | | | | |
| | | | | | | | |
| | | |
| INDIA: 2.5% | | | | | | | | |
Minda Industries, Ltd.† | | | 13,619,268 | | | | 74,543,018 | |
| | |
Reliance Industries, Ltd. | | | 2,034,882 | | | | 55,366,969 | |
| | | | | | | | |
Total India | | | | | | | 129,909,987 | |
| | | | | | | | |
| | | | | | | | |
| | | |
| PHILIPPINES: 1.5% | | | | | | | | |
Globe Telecom, Inc. | | | 1,829,305 | | | | 77,409,997 | |
| | | | | | | | |
Total Philippines | | | | | | | 77,409,997 | |
| | | | | | | | |
| | | | | | | | |
| | | |
| THAILAND: 1.2% | | | | | | | | |
Thai Beverage Public Co., Ltd. | | | 108,527,600 | | | | 60,416,517 | |
| | | | | | | | |
Total Thailand | | | | | | | 60,416,517 | |
| | | | | | | | |
| | | | | | | | |
| | | |
| BANGLADESH: 1.1% | | | | | | | | |
GrameenPhone, Ltd. | | | 14,140,431 | | | | 57,913,199 | |
| | | | | | | | |
Total Bangladesh | | | | | | | 57,913,199 | |
| | | | | | | | |
| | | | | | | | |
| | | |
| TOTAL COMMON EQUITIES | | | | | | | 4,756,051,989 | |
| | | | | | | | |
(Cost $3,046,234,540) | | | | | | | | |
| | | | | | | | |
| |
PREFERRED EQUITIES: 5.5% | | | | | |
| | | |
| SOUTH KOREA: 5.5% | | | | | | | | |
LG Chem, Ltd., Pfd. | | | 488,391 | | | | 171,930,580 | |
| | |
Samsung Electronics Co., Ltd., Pfd. | | | 1,671,655 | | | | 113,399,999 | |
| | | | | | | | |
Total South Korea | | | | | | | 285,330,579 | |
| | | | | | | | |
| | | | | | | | |
| | |
| TOTAL PREFERRED EQUITIES | | | | 285,330,579 | |
| | | | | | | | |
(Cost $105,374,274) | | | | | | | | |
| | | | | | | | |
| | | |
| TOTAL INVESTMENTS: 96.9% | | | | | | | 5,041,382,568 | |
| | |
(Cost $3,151,608,814) | | | | | | | | |
| | | | | | | | |
| |
CASH AND OTHER ASSETS,
LESS LIABILITIES: 3.1% | | | | 159,553,353 | |
| | | | | | | | |
| | |
NET ASSETS: 100.0% | | | | | | | $5,200,935,921 | |
| | | | | | | | |
Matthews Asia Dividend Fund
December 31, 2020
Schedule of Investmentsa (continued)
| a | Certain securities were fair valued under the valuation policies approved by the Board of Trustees (Note 2-A). |
| b | The securities may be resold to qualified foreign investors and foreign institutional buyers under Regulation S of the Securities Act of 1933. |
| c | Security exempt from registration under Rule 144A of the Securities Act of 1933, as amended. The security may be resold in transactions exempt from registration normally to qualified institutional buyers. The security has been determined to be liquid in accordance with procedures adopted by the Funds’ Board of Trustees. At December 31, 2020, the aggregate value is $235,852,832, which is 4.53% of net assets. |
| d | Non-income producing security. |
| † | Affiliated Issuer, as defined under the Investment Company Act of 1940 (ownership of 5% or more of the outstanding voting securities of this issuer) (See Note 7) |
| ADR | American Depositary Receipt |
| REIT | Real Estate Investment Trust |
See accompanying notes to financial statements.
| | | | |
| matthewsasia.com | 800.789.ASIA | | | 33 | |
| | | | |
| PORTFOLIO MANAGERS |
| |
| Sherwood Zhang, CFA | | |
Lead Manager | | | | |
| |
| Yu Zhang, CFA | | S. Joyce Li, CFA |
Co-Manager | | Co-Manager |
| | |
| FUND FACTS | | | | |
| | |
| | | Investor | | Institutional |
Ticker | | MCDFX | | MICDX |
CUSIP | | 577125305 | | 577130735 |
Inception | | 11/30/09 | | 10/29/10 |
NAV | | $19.64 | | $19.64 |
Initial Investment | | $2,500 | | $100,000 |
Gross Expense Ratio1 | | 1.15% | | 1.02% |
Portfolio Statistics | | |
Total # of Positions | | 47 |
Net Assets | | $384.6 million |
Weighted Average Market Cap | | $67.7 billion |
Portfolio Turnover2 | | 81.8% |
Benchmark | | | | |
MSCI China Index |
OBJECTIVE
Total return with an emphasis on providing current income.
STRATEGY
Under normal market conditions, the Fund seeks to achieve its investment objective by investing at least 80% of its net assets, which include borrowings for investment purposes, in dividend-paying equity securities of companies located in China. China includes its administrative and other districts, such as Hong Kong. The Fund may also invest in convertible debt and equity securities of companies located in China.
Matthews China Dividend Fund
Portfolio Manager Commentary (unaudited)
For the year ending December 31, 2020, the Matthews China Dividend Fund returned 24.22% (Investor Class) and 24.37% (Institutional Class), while its benchmark, the MSCI China Index, returned 29.67%. For the quarter ending December 31, 2020, the Matthews China Dividend Fund returned 11.12% (Investor and Institutional Classes), while its benchmark, the MSCI China Index, returned 11.21%.
Market Environment:
Following some early missteps in addressing the pandemic, Chinese authorities acted decisively, limiting internal travel and controlling its borders while working with world health organizations to control the outbreak. In addition, policy actions meant to assist small and medium-size enterprises were implemented including an increase in loan quotas, lowering of borrowing rates, a delay in loan repayments and value added tax (VAT) relief. The result was an early 2020 outperformance of Chinese equities which added support to neighboring country markets.
The second quarter of 2020 was lackluster even though anecdotes from our local offices and official economic data implied that recovery was well under way, however, the uncertainty around the national security law in Hong Kong has shadowed the performance of Chinese equities, especially the market in Hong Kong.
Chinese equities posted strong returns in the third quarter but most of those gains were registered in the first two weeks of the quarter—reflecting increased tensions between the U.S. and China. Nevertheless, consumer discretionary stocks (autos, travel and retail) were the strongest performers due to economic data pointing to a full recovery underway. Chinese equities were strong going into the last quarter of 2020, however, the surprising cancellation of Ant Financial’s IPO caused investors to worry about China’s regulatory risk towards giant internet companies, causing overall sentiment to wane somewhat.
Performance Contributors and Detractors:
For the full year of 2020, the Fund’s underweight in the financials sector and security selection in the real estate sector contributed the most to performance. On the other hand, security selection in communication services and consumer staple sectors detracted from Fund performance. Our total-return investment approach provides the flexibility of investing in both dividend-paying stocks and dividend growth stocks. To achieve a balance between dividend growth and current high yield, we maintained certain high dividend yield stocks such as telecom operators. However, these names are likely to underperform during a rally driven by ample global liquidity.
During the fourth quarter, SITC International Holding, a shipping company with focus on intra-Asia routes, was the top contributor to Fund performance. Container shipping rates rose rapidly around the Christmas shopping season which benefited the company. We believe SITC is also well positioned to benefit from regional trade among Asian countries boosted by the Regional Comprehensive Economic Program (RCEP). The Fund’s second largest contributor was Leader Harmonious Drive Systems, the precision parts company we added during the third quarter, as the market started to realize the company’s competence on the global stage. Cathay Media and Education Group was the third largest performance contributor, as it completed an acquisition of an after school tutoring service company, further expanding its art and performance education business into a bigger potential market.
(continued)
| | | | | | | | | | | | | | | | | | | | | | | | | | | | |
| | | | | | | | |
| PERFORMANCE AS OF DECEMBER 31, 2020 | | | | | | | | | | | | | | | | | | | | | |
| | | | | | | | | Average Annual Total Returns | | | | |
| | | 3 Months | | | 1 Year | | | 3 Year | | | 5 Year | | | 10 Years | | | Since
Inception | | | Inception
Date | |
| Investor Class (MCDFX) | | | 11.12% | | | | 24.22% | | | | 8.75% | | | | 13.36% | | | | 9.88% | | | | 11.06% | | | | 11/30/09 | |
| Institutional Class (MICDX) | | | 11.12% | | | | 24.37% | | | | 8.90% | | | | 13.53% | | | | 10.07% | | | | 10.31% | | | | 10/29/10 | |
| MSCI China Index3 | | | 11.21% | | | | 29.67% | | | | 9.22% | | | | 15.25% | | | | 7.84% | | | | 7.55% | 4 | | | | |
Performance assumes reinvestment of all dividends and/or distributions before taxes. All performance quoted represents past performance and is no guarantee of future results. Investment return and principal value will fluctuate with market conditions so that when redeemed, shares may be worth more or less than their original cost. Current performance may be lower or higher than the return figures quoted. For the Fund’s most recent month-end performance, visit matthewsasia.com.
| | | | | | | | | | | | | | | | | | | | | | | | | | | | |
| | | | | | | | |
| INCOME DISTRIBUTION HISTORY | | | | | | | | | | | | | | | | | | | | | |
| | | 2020 | | | | | | 2019 | |
| | | June | | | December | | | Total | | | | | | June | | | December | | | Total | |
| Investor (MCDFX) | | $ | 0.36 | | | $ | 0.04 | | | $ | 0.40 | | | | | | | $ | 0.24 | | | $ | 0.02 | | | $ | 0.26 | |
| Inst’l (MICDX) | | $ | 0.38 | | | $ | 0.05 | | | $ | 0.42 | | | | | | | $ | 0.25 | | | $ | 0.03 | | | $ | 0.28 | |
Note: This table does not include capital gains distributions. Totals may differ by $0.02 due to rounding. For income distribution history, visit matthewsasia.com.
| | | | |
| | | |
30 DAY YIELD: 0.97% (Investor Class) 1.06% (Institutional Class) The 30-Day Yield represents net investment income earned by the Fund over the 30-day period ended 12/31/20, expressed as an annual percentage rate based on the Fund’s share price at the end of the 30-day period. The 30-Day Yield should be regarded as an estimate of the Fund’s rate of investment income, and it may not equal the Fund’s actual income distribution rate. Source: BNY Mellon Investment Servicing (US) Inc. | | | | DIVIDEND YIELD: 2.73% The dividend yield (trailing) for the portfolio is the weighted average sum of the dividends paid by each equity security held by the Fund over the 12 months ended 12/31/20 divided by the current price of each equity as of 12/31/20. The annualized dividend yield for the Fund is for the equity-only portion of the portfolio. Please note that this is based on gross equity portfolio holdings and does not reflect the actual yield an investor in the Fund would receive. Past yields are no guarantee of future yields. Source: FactSet Research Systems, Bloomberg, MICM. |
GROWTH OF A HYPOTHETICAL $10,000 INVESTMENT SINCE INCEPTION—INVESTOR CLASS
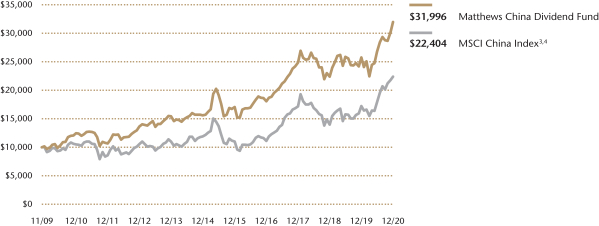
Plotted monthly. The performance data and graph do not reflect the deduction of taxes that a shareholder would pay on dividends, capital gains distributions or redemption of Fund shares. Values are in US$.
| | 3 | It is not possible to invest directly in an index. Source: Index data from Morgan Stanley Capital International and Bloomberg; total return calculations performed by BNY Mellon Investment Servicing (US) Inc. Please see page 93 for index definition. |
| | 4 | Calculated from 11/30/09. |
| | | | | | | | |
| | | | |
| TOP TEN HOLDINGS5 | | | | | | | |
| | | Sector | | | | % of Net Assets | |
| Tencent Holdings, Ltd. | | Communication Services | | | | | 7.3% | |
| Shanghai Baosight Software Co., Ltd. | | Information Technology | | | | | 4.0% | |
| SITC International Holdings Co., Ltd. | | Industrials | | | | | 3.9% | |
| Tsingtao Brewery Co., Ltd. | | Consumer Staples | | | | | 3.4% | |
| Minth Group, Ltd. | | Consumer Discretionary | | | | | 3.4% | |
| China International Capital Corp., Ltd. | | Financials | | | | | 3.1% | |
| Postal Savings Bank of China Co., Ltd. | | Financials | | | | | 3.0% | |
| Gree Electric Appliances, Inc. of Zhuhai | | Consumer Discretionary | | | | | 2.8% | |
| MediaTek, Inc. | | Information Technology | | | | | 2.7% | |
| Leader Harmonious Drive Systems Co., Ltd. | | Industrials | | | | | 2.7% | |
| % OF ASSETS IN TOP 10 | | | | | | | 36.3% | |
| | 5 | Holdings may combine more than one security from same issuer and related depositary receipts. |
| | | | |
| matthewsasia.com | 800.789.ASIA | | | 35 | |
Matthews China Dividend Fund
Portfolio Manager Commentary (unaudited) (continued)
On the contrary, medical equipment maker AK Medical was the largest performance detractor during the quarter, as the market worried that the centralized procurement of AK Medical’s products could depress its margin. We are closely monitoring the situation. Shimao Services Holding, a residential property manager, was the second largest performance detractor. We participated in the company’s IPO due to its reputation of quality service. However, in a relatively short period of time, the market was flooded with many property managers’ IPO, and when negative news about its parent company’s bad acquisition emerged, Shimao’s shares sold off. In our view, this has very little impact on the company’s own operation, thus, we added to our position during the market selloff. HKBN, the broadband operator in Hong Kong, was the third largest performance detractor during the quarter. The company reported dismal outlook as its customers have been significantly impacted by COVID-19. However, we are still confident in HKBN’s management to maintain its growth longer term.
Notable Portfolio Changes:
During the fourth quarter, we re-initiated positions in Postal Saving Bank of China. As China’s economy stabilizes further, we believe the asset quality of the banking sector should also improve. We also initiated a position in Travelsky Technology, the dominant airfare ticketing agency in China. Although its earnings had been impacted by bad debt incurred by one of its customers (a troubled airliner in financial distress), we believe it is largely a one-off situation and should not impact its fundamentals. As Chinese and global air travel could improve further into 2021, we think TravelSky should be well positioned to ride the recovery.
In addition, we rotated capital from Zhong Sheng Group to China Yongda Auto. As the valuation gap between these two companies widens, we think there is more upside potential for Yongda Auto to catch up as the market may be late to recognize its improvements in operations. We also exited our position in China Tower as we were concerned that it could be impacted by Donald Trump’s executive order to exclude Chinese companies with a military link, as the largest shareholders of China Tower are China Mobile, China Telecom and China Unicom. We also exited KWG Group as we viewed the company’s further upside was limited going forward after it spun off its property service arm.
Outlook:
Unlike many developed economies’ unlimited quantitative monetary easing policy, China’s monetary aggregates have been balanced for several months, offering Chinese policymakers a future cushion to stimulate the economy, if needed. At the same time, China’s rebounding economy and solid mid-teens consensus earnings growth* estimates should support current valuations.
China’s newly released five-year plan could support businesses benefiting from the “dual-circulation” announcement focused on domestic demand and self-sufficiency in key areas of technology, innovation, health care and the digitalization of its economy. Meanwhile China has not given up its participation in the global economy—just in the last quarter alone, China concluded two key trade negotiations, RCEP (Regional Comprehensive Economic Cooperation) with mostly Asian counties and a bilateral investment agreement with the European Union. The investment agreement with the European Union includes for the first time, specific language to rein in behavior of State Owned Enterprises. This shows quite significant progress of the long waited reform. Geopolitical factors, especially U.S.—China relations under the Biden administration, will also influence the unfolding of Asia’s market in the new year. We believe a total-return approach, balancing dividend income with dividend growth, should continue to help us uncover attractive market opportunities in 2021.
| * | Earnings growth is not representative of the Fund’s future performance. |
| | | | |
| |
| COUNTRY ALLOCATION (%)6,7 | |
| China/Hong Kong | | | 91.2 | |
| Taiwan | | | 4.1 | |
| Singapore | | | 1.8 | |
| Cash and Other Assets, Less Liabilities | | | 2.9 | |
| | | | |
| | |
| SECTOR ALLOCATION (%)7 | | | |
| Consumer Discretionary | | | 21.0 | |
| Communication Services | | | 14.7 | |
| Industrials | | | 14.1 | |
| Financials | | | 10.5 | |
| Information Technology | | | 10.2 | |
| Consumer Staples | | | 6.3 | |
| Real Estate | | | 6.0 | |
| Health Care | | | 4.8 | |
| Materials | | | 4.8 | |
| Energy | | | 2.6 | |
| Utilities | | | 2.1 | |
| Cash and Other Assets, Less Liabilities | | | 2.9 | |
| | | | |
| |
| MARKET CAP EXPOSURE (%)7 | |
| Mega Cap (over $25B) | | | 23.8 | |
| Large Cap ($10B–$25B) | | | 15.6 | |
| Mid Cap ($3B–10B) | | | 35.0 | |
| Small Cap (under $3B) | | | 22.8 | |
| Cash and Other Assets, Less Liabilities | | | 2.9 | |
| 6 | Not all countries where the Fund may invest are included in the benchmark index. |
| 7 | Source: FactSet Research Systems. Percentage values in data are rounded to the nearest tenth of one percent, so the values may not sum to 100% due to rounding. Country allocations and percentage values may be derived from different data sources and may not be consistent with other Fund literature. |
Matthews China Dividend Fund
December 31, 2020
Schedule of Investmentsa
COMMON EQUITIES: 97.1%
| | | | | | | | |
| | | Shares | | | Value | |
| | |
| CONSUMER DISCRETIONARY: 21.0% | | | | | | | | |
Specialty Retail: 5.0% | | | | | | | | |
| | |
China Yongda Automobiles Services Holdings, Ltd. | | | 4,374,500 | | | | $7,253,946 | |
| | |
Topsports International Holdings, Ltd.b,c | | | 4,743,000 | | | | 7,102,955 | |
| | |
China Tourism Group Duty Free Corp., Ltd. A | | | | | | | | |
| | |
Shares | | | 114,300 | | | | 4,975,313 | |
| | | | | | | | |
| | | | | | | 19,332,214 | |
| | | | | | | | |
| | | | | | | | |
Diversified Consumer Services: 4.3% | | | | | | | | |
| | |
China Education Group Holdings, Ltd.c | | | 5,359,000 | | | | 10,336,778 | |
| | |
Union Medical Healthcare, Ltd. | | | 5,110,000 | | | | 3,981,212 | |
| | |
Neusoft Education Technology Co., Ltd.d | | | 3,232,800 | | | | 2,085,018 | |
| | | | | | | | |
| | | | | | | 16,403,008 | |
| | | | | | | | |
| | | | | | | | |
Auto Components: 3.4% | | | | | | | | |
Minth Group, Ltd. | | | 2,444,000 | | | | 12,930,418 | |
| | | | | | | | |
| | | | | | | | |
Household Durables: 2.8% | | | | | | | | |
Gree Electric Appliances, Inc. of Zhuhai A Shares | | | 1,137,104 | | | | 10,839,248 | |
| | | | | | | | |
| | | | | | | | |
Textiles, Apparel & Luxury Goods: 2.3% | | | | | | | | |
Bosideng International Holdings, Ltd. | | | 17,810,000 | | | | 9,081,371 | |
| | | | | | | | |
| | | | | | | | |
Leisure Products: 1.1% | | | | | | | | |
Bafang Electric Suzhou Co., Ltd. A Shares | | | 148,569 | | | | 4,353,972 | |
| | | | | | | | |
| | | | | | | | |
Hotels, Restaurants & Leisure: 1.1% | | | | | | | | |
Melco Resorts & Entertainment, Ltd. ADR | | | 224,100 | | | | 4,157,055 | |
| | | | | | | | |
| | | | | | | | |
Internet & Direct Marketing Retail: 0.7% | | | | | | | | |
JD Health International, Inc.b,c,d | | | 133,400 | | | | 2,581,120 | |
| | | | | | | | |
| | | | | | | | |
Multiline Retail: 0.3% | | | | | | | | |
MINISO Group Holding, Ltd. ADRd | | | 47,600 | | | | 1,256,164 | |
| | | | | | | | |
Total Consumer Discretionary | | | | | | | 80,934,570 | |
| | | | | | | | |
| | | | | | | | |
| | | |
| COMMUNICATION SERVICES: 14.7% | | | | | | | | |
Interactive Media & Services: 7.3% | | | | | | | | |
Tencent Holdings, Ltd. | | | 389,600 | | | | 28,033,200 | |
| | | | | | | | |
| | | | | | | | |
Diversified Telecommunication Services: 4.4% | | | | | |
| | |
CITIC Telecom International Holdings, Ltd. | | | 29,061,000 | | | | 9,145,583 | |
| | |
HKBN, Ltd. | | | 5,069,957 | | | | 7,853,189 | |
| | | | | | | | |
| | | | | | | 16,998,772 | |
| | | | | | | | |
| | | | | | | | |
Entertainment: 3.0% | | | | | | | | |
| | |
Cathay Media and Education Group, Inc.b,c,d | | | 8,224,303 | | | | 8,718,046 | |
| | |
BAIOO Family Interactive, Ltd.b,c | | | 23,848,000 | | | | 2,862,923 | |
| | | | | | | | |
| | | | | | | 11,580,969 | |
| | | | | | | | |
Total Communication Services | | | | | | | 56,612,941 | |
| | | | | | | | |
| | | | | | | | |
| | | |
| INDUSTRIALS: 14.1% | | | | | | | | |
Machinery: 6.5% | | | | | | | | |
| | |
Leader Harmonious Drive Systems Co., Ltd. A Sharesd | | | 465,410 | | | | 10,434,235 | |
| | |
Shanghai Mechanical and Electrical Industry Co., Ltd. B Shares | | | 4,976,114 | | | | 7,387,021 | |
| | |
Weichai Power Co., Ltd. A Shares | | | 2,947,581 | | | | 7,164,198 | |
| | | | | | | | |
| | | | | | | 24,985,454 | |
| | | | | | | | |
| | | | | | | | |
| | | | | | | | |
| | | Shares | | | Value | |
Marine: 3.9% | | | | | | | | |
SITC International Holdings Co., Ltd. | | | 7,004,000 | | | | $15,126,259 | |
| | | | | | | | |
| | | | | | | | |
Trading Companies & Distributors: 1.9% | | | | | | | | |
BOC Aviation, Ltd.b,c | | | 815,900 | | | | 7,062,029 | |
| | | | | | | | |
| | | | | | | | |
Industrial Conglomerates: 1.8% | | | | | | | | |
CK Hutchison Holdings, Ltd. | | | 1,006,500 | | | | 7,027,217 | |
| | | | | | | | |
Total Industrials | | | | | | | 54,200,959 | |
| | | | | | | | |
| | | | | | | | |
| | | |
| FINANCIALS: 10.5% | | | | | | | | |
Capital Markets: 4.7% | | | | | | | | |
| | |
China International Capital Corp., Ltd. H Sharesb,c,d | | | 4,347,200 | | | | 11,786,341 | |
| | |
China Everbright, Ltd. | | | 4,622,000 | | | | 6,190,002 | |
| | | | | | | | |
| | | | | | | 17,976,343 | |
| | | | | | | | |
| | | | | | | | |
Banks: 3.0% | | | | | | | | |
Postal Savings Bank of China Co., Ltd. H Sharesb,c | | | 20,604,000 | | | | 11,642,498 | |
| | | | | | | | |
| | | | | | | | |
Insurance: 2.8% | | | | | | | | |
| | |
New China Life Insurance Co., Ltd. H Shares | | | 1,771,500 | | | | 6,910,149 | |
| | |
Ping An Insurance Group Co. of China, Ltd. H Shares | | | 331,000 | | | | 4,028,143 | |
| | | | | | | | |
| | | | | | | 10,938,292 | |
| | | | | | | | |
Total Financials | | | | | | | 40,557,133 | |
| | | | | | | | |
| | | | | | | | |
| | | |
| INFORMATION TECHNOLOGY: 10.2% | | | | | | | | |
Software: 4.0% | | | | | | | | |
| | |
Shanghai Baosight Software Co., Ltd. B Shares | | | 3,790,910 | | | | 15,437,139 | |
| | | | | | | | |
| | | | | | | | |
Semiconductors & Semiconductor Equipment: 2.8% | | | | | |
| | |
MediaTek, Inc. | | | 396,000 | | | | 10,560,243 | |
| | | | | | | | |
| | | | | | | | |
IT Services: 2.0% | | | | | | | | |
| | |
TravelSky Technology, Ltd. H Shares | | | 3,203,000 | | | | 7,738,169 | |
| | | | | | | | |
| | | | | | | | |
Communications Equipment: 1.4% | | | | | | | | |
| | |
Accton Technology Corp. | | | 477,000 | | | | 5,378,029 | |
| | | | | | | | |
Total Information Technology | | | | | | | 39,113,580 | |
| | | | | | | | |
| | | | | | | | |
| | | |
| CONSUMER STAPLES: 6.3% | | | | | | | | |
Beverages: 4.5% | | | | | | | | |
| | |
Tsingtao Brewery Co., Ltd. H Shares | | | 1,262,000 | | | | 13,221,850 | |
| | |
Yantai Changyu Pioneer Wine Co., Ltd. B Shares | | | 1,914,173 | | | | 3,922,610 | |
| | | | | | | | |
| | | | | | | 17,144,460 | |
| | | | | | | | |
Food Products: 1.8% | | | | | | | | |
WH Group, Ltd.b,c | | | 8,467,500 | | | | 7,100,441 | |
| | | | | | | | |
Total Consumer Staples | | | | | | | 24,244,901 | |
| | | | | | | | |
| | | | | | | | |
| | | |
| REAL ESTATE: 6.0% | | | | | | | | |
Real Estate Management & Development: 6.0% | | | | | |
| | |
Powerlong Commercial Management Holdings, Ltd.c | | | 2,319,000 | | | | 7,438,952 | |
| | |
Excellence Commercial Property & Facilities Management Group, Ltd.c,d | | | 4,834,000 | | | | 6,335,215 | |
| | |
Shimao Services Holdings, Ltd.b,c,d | | | 3,656,000 | | | | 5,640,251 | |
| | |
K Wah International Holdings, Ltd. | | | 7,387,000 | | | | 3,551,967 | |
| | | | | | | | |
Total Real Estate | | | | | | | 22,966,385 | |
| | | | | | | | |
| | | | | | | | |
| | | | |
| matthewsasia.com | 800.789.ASIA | | | 37 | |
Matthews China Dividend Fund
December 31, 2020
Schedule of Investmentsa (continued)
COMMON EQUITIES (continued)
| | | | | | | | |
| | | Shares | | | Value | |
| | |
| HEALTH CARE: 4.8% | | | | | | | | |
Life Sciences Tools & Services: 2.6% | |
Pharmaron Beijing Co., Ltd. H Sharesb,c | | | 592,700 | | | | $10,020,615 | |
| | | | | | | | |
| | | | | | | | |
Pharmaceuticals: 1.4% | |
Livzon Pharmaceutical Group, Inc. H Shares | | | 1,386,000 | | | | 5,370,384 | |
| | | | | | | | |
| | | | | | | | |
Health Care Equipment & Supplies: 0.8% | |
AK Medical Holdings, Ltd.b,c | | | 1,784,000 | | | | 3,092,724 | |
| | | | | | | | |
Total Health Care | | | | | | | 18,483,723 | |
| | | | | | | | |
| | | | | | | | |
| | | |
| MATERIALS: 4.8% | | | | | | | | |
Construction Materials: 2.6% | |
Huaxin Cement Co., Ltd. B Shares | | | 4,577,692 | | | | 9,922,033 | |
| | | | | | | | |
| | | | | | | | |
Containers & Packaging: 2.2% | |
Greatview Aseptic Packaging Co., Ltd. | | | 14,514,000 | | | | 8,493,857 | |
| | | | | | | | |
Total Materials | | | | | | | 18,415,890 | |
| | | | | | | | |
| | | | | | | | |
| | | |
| ENERGY: 2.6% | | | | | | | | |
Oil, Gas & Consumable Fuels: 2.6% | |
| | |
China Suntien Green Energy Corp., Ltd. H | | | | | | | | |
Shares | | | 32,695,000 | | | | 10,031,161 | |
| | | | | | | | |
Total Energy | | | | | | | 10,031,161 | |
| | | | | | | | |
| | | | | | | | |
| | | |
| UTILITIES: 2.1% | | | | | | | | |
Gas Utilities: 2.1% | |
Kunlun Energy Co., Ltd. | | | 9,298,000 | | | | 8,058,432 | |
| | | | | | | | |
Total Utilities | | | | | | | 8,058,432 | |
| | | | | | | | |
| | | | | | | | |
| | | |
| TOTAL INVESTMENTS: 97.1% | | | | | | | 373,619,675 | |
(Cost $290,469,962) | | | | | | | | |
| | | | | | | | |
| | |
CASH AND OTHER ASSETS,
LESS LIABILITIES: 2.9% | | | | | | | 11,023,284 | |
| | | | | | | | |
| | |
NET ASSETS: 100.0% | | | | | | | $384,642,959 | |
| | | | | | | | |
| a | Certain securities were fair valued under the valuation policies approved by the Board of Trustees (Note 2-A). |
| b | Security exempt from registration under Rule 144A of the Securities Act of 1933, as amended. The security may be resold in transactions exempt from registration normally to qualified institutional buyers. The security has been determined to be liquid in accordance with procedures adopted by the Funds’ Board of Trustees. At December 31, 2020, the aggregate value is $77,609,943, which is 20.18% of net assets. |
| c | The securities may be resold to qualified foreign investors and foreign institutional buyers under Regulation S of the Securities Act of 1933. |
| d | Non-income producing security. |
| ADR | American Depositary Receipt |
See accompanying notes to financial statements.

| | | | |
| PORTFOLIO MANAGERS |
| |
| Taizo Ishida | | |
Lead Manager | | |
| |
| Michael J. Oh, CFA* | | |
Co-Manager | | |
|
* As of August 31, 2020 |
|
| FUND FACTS |
| | |
| | | Investor | | Institutional |
Ticker | | MPACX | | MIAPX |
CUSIP | | 577130867 | | 577130776 |
Inception | | 10/31/03 | | 10/29/10 |
NAV | | $39.44 | | $39.82 |
Initial Investment | | $2,500 | | $100,000 |
Gross Expense Ratio1 | | 1.08% | | 0.95% |
Portfolio Statistics | | | | |
Total # of Positions | | | | 65 |
Net Assets | | | | $2.1 billion |
Weighted Average Market Cap | | $61.0 billion |
Portfolio Turnover2 | | 42.8% |
Benchmark |
MSCI AC Asia Pacific Index |
OBJECTIVE
Long-term capital appreciation.
STRATEGY
Under normal market conditions, the Fund seeks to achieve its investment objective by investing at least 80% of its net assets, which include borrowings for investment purposes, in the common and preferred stocks of companies located in Asia. Asia consists of all countries and markets in Asia, and includes developed, emerging and frontier countries and markets in the Asian region. The Fund may also invest in the convertible securities, of any duration or quality, of Asian companies.
Matthews Asia Growth Fund
Portfolio Manager Commentary (unaudited)
For the year ending December 31, 2020, the Matthews Asia Growth Fund returned 46.76% (Investor Class) and 47.01% (Institutional Class), while its benchmark, the MSCI All Country Asia Pacific Index, returned 20.07%. For the fourth quarter, the Fund returned 26.54% (Investor Class) and 26.64% (Institutional Class) versus 17.88% for the Index.
Market Environment:
Equities across Asia were volatile in the year, but broad market indexes tracking the region ultimately generated attractive returns. Global markets fell in the first quarter, as worries surrounding the spread of COVID-19 moved from China throughout Europe to the U.S. and then back to South Asia, including India. Fears of a global growth slowdown turned into reality as governments worldwide began to implement different versions of ‘shelter in place’ to contain the movement of the virus. Early in the year, cyclically sensitive sectors like energy, materials, industrials and financials suffered most while companies related to communication services and technology performed better. In the second quarter, most global financial markets, including Asia’s, began to rise as major economies began to relax prior pandemic-related restrictions. The gradual reopening of businesses—especially those focused on services and consumption— helped bolster sentiment and bring a floor to stock prices globally.
In the third quarter, economic recovery and improved sentiment began to take hold as major economies continued to relax COVID-19 lockdown restrictions even further. China’s V-shaped recovery in manufacturing along with a steady recovery in domestic consumption brought some normalcy to daily life. EM currencies rallied slightly against the U.S. dollar in the third quarter, acting as a slight tailwind for EM equities. Growth stocks outpaced value and small caps outperformed large caps in the third quarter. The fourth quarter saw further economic strengthening. Cyclical stocks in beaten-up or export-driven markets such as Indonesia and South Korea rallied most in the fourth quarter, while markets that experienced early recovery like China, Japan and India lagged slightly. Market strength gained momentum following the U.S. Presidential elections in November as markets hoped for less confrontational U.S.—China relations, combined with an announcement of several approved COVID-19 vaccines that were due for distribution early in 2021.
Performance Contributors and Detractors:
From a regional perspective, stock selection in China/Hong Kong was a notable contributor to performance. China’s economy went into lockdown and emerged from lockdown earlier than other major economies, boosting local sentiment and asset prices. From a sector perspective, stock selection and our overweight in health care was a notable contributor to performance. Health care stocks occupy an interesting spot in the risk-reward continuum in our view, because they offer the potential for both attractive growth and steady growth.
On the other hand, our underweight to Taiwan and South Korea detracted slightly from relative performance. Our underweight to the information technology sector was also a slight detractor from relative performance, even though stock selection in information technology was a contributor. Large-cap information technology companies, which have a strong presence in Taiwan and South Korea, generated strong gains in the year. The Fund’s underweights are result of our bottom-up stock selection process.
Turning to individual securities, the Chinese electric vehicle (EV) maker Xpeng, which we purchased during its IPO in mid-August, generated strong gains in the reporting period. China continues to focus on cleaner energy and cleaner transit, fueling demand for EVs. On the other hand, the Chinese health care company Kangji Medical Holdings was a detractor. We exited the company in the fourth quarter to redeploy the capital in higher conviction holdings.
(continued)
| 1 | Actual 2020 expense ratios. |
| 2 | The lesser of fiscal year 2020 long-term purchase costs or sales proceeds divided by the average monthly market value of long-term securities. |
| | | | |
| matthewsasia.com | 800.789.ASIA | | | 39 | |
| | | | | | | | | | | | | | | | | | | | | | | | | | | | |
| |
| PERFORMANCE AS OF DECEMBER 31, 2020 | |
| | | | | | | | | Average Annual Total Returns | | | | |
| | | 3 Months | | | 1 Year | | | 3 Years | | | 5 Years | | | 10 Years | | | Since
Inception | | | Inception
Date | |
| Investor Class (MPACX) | | | 26.54% | | | | 46.76% | | | | 15.75% | | | | 16.88% | | | | 10.48% | | | | 11.15% | | | | 10/31/03 | |
| Institutional Class (MIAPX) | | | 26.64% | | | | 47.01% | | | | 15.94% | | | | 17.07% | | | | 10.67% | | | | 10.78% | | | | 10/29/10 | |
| MSCI AC Asia Pacific Index3 | | | 17.88% | | | | 20.07% | | | | 7.64% | | | | 11.62% | | | | 6.68% | | | | 7.93% | 4 | | | | |
Performance assumes reinvestment of all dividends and/or distributions before taxes. All performance quoted represents past performance and is no guarantee of future results. Investment return and principal value will fluctuate with market conditions so that when redeemed, shares may be worth more or less than their original cost. Current performance may be lower or higher than the return figures quoted. For the Fund’s most recent month-end performance, visit matthewsasia.com.
GROWTH OF A HYPOTHETICAL $10,000 INVESTMENT SINCE INCEPTION—INVESTOR CLASS
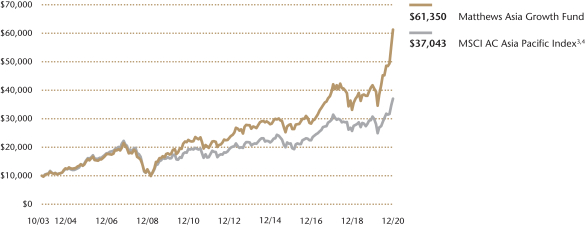
Plotted monthly. The performance data and graph do not reflect the deduction of taxes that a shareholder would pay on dividends, capital gains distributions or redemption of Fund shares. Values are in US$.
| | 3 | It is not possible to invest directly in an index. Source: Index data from Morgan Stanley Capital International and Bloomberg; total return calculations performed by BNY Mellon Investment Servicing (US) Inc. Please see page 93 for index definition. |
| | 4 | Calculated from 10/31/03. |
| | | | | | | | | | |
| | | | | |
| TOP TEN HOLDINGS5 | | | | | | | | | |
| | | Sector | | Country | | | | % of Net Assets | |
| Bilibili, Inc. | | Communication Services | | China/Hong Kong | | | | | 6.0% | |
| Wuxi Biologics Cayman, Inc. | | Health Care | | China/Hong Kong | | | | | 5.0% | |
| Innovent Biologics, Inc. | | Health Care | | China/Hong Kong | | | | | 3.6% | |
| PT Bank Rakyat Indonesia Persero | | Financials | | Indonesia | | | | | 3.0% | |
| HDFC Bank, Ltd. | | Financials | | India | | | | | 2.7% | |
| Sony Corp. | | Consumer Discretionary | | Japan | | | | | 2.7% | |
| BeiGene, Ltd. | | Health Care | | China/Hong Kong | | | | | 2.5% | |
| Nintendo Co., Ltd. | | Communication Services | | Japan | | | | | 2.3% | |
| Shenzhou International Group Holdings, Ltd. | | Consumer Discretionary | | China/Hong Kong | | | | | 2.3% | |
| XPeng, Inc. | | Consumer Discretionary | | China/Hong Kong | | | | | 2.2% | |
| % OF ASSETS IN TOP 10 | | | | | | | | | 32.3% | |
| | 5 | Holdings may combine more than one security from same issuer and related depositary receipts. |
| | | | |
| |
| COUNTRY ALLOCATION (%)6,7 | |
| China/Hong Kong | | | 46.7 | |
| Japan | | | 28.1 | |
| India | | | 4.6 | |
| Indonesia | | | 3.5 | |
| Australia | | | 2.8 | |
| United States | | | 2.6 | |
| Taiwan | | | 1.9 | |
| Bangladesh | | | 1.4 | |
| Singapore | | | 0.9 | |
| Vietnam | | | 0.9 | |
| Sri Lanka | | | 0.5 | |
| Switzerland | | | 0.4 | |
| Cash and Other Assets, Less Liabilities | | | 5.9 | |
| | | | |
| |
| SECTOR ALLOCATION (%)7 | |
| Health Care | | | 38.5 | |
| Consumer Discretionary | | | 15.0 | |
| Communication Services | | | 11.3 | |
| Information Technology | | | 10.0 | |
| Financials | | | 7.8 | |
| Industrials | | | 4.7 | |
| Energy | | | 2.5 | |
| Consumer Staples | | | 2.2 | |
| Real Estate | | | 2.0 | |
| Cash and Other Assets, Less Liabilities | | | 5.9 | |
| | | | |
| |
| MARKET CAP EXPOSURE (%)7 | |
| Mega Cap (over $25B) | | | 51.9 | |
| Large Cap ($10B–$25B) | | | 11.7 | |
| Mid Cap ($3B–10B) | | | 12.7 | |
| Small Cap (under $3B) | | | 17.8 | |
| Cash and Other Assets, Less Liabilities | | | 5.9 | |
| 6 | Not all countries where the Fund may invest are included in the benchmark index. |
| 7 | Source: FactSet Research Systems. Percentage values in data are rounded to the nearest tenth of one percent, so the values may not sum to 100% due to rounding. Country allocations and percentage values may be derived from different data sources and may not be consistent with other Fund literature. |
Matthews Asia Growth Fund
Portfolio Manager Commentary (unaudited) (continued)
By market capitalization, stock selection among mid-cap stocks (those with a market cap between $3 billion and $10 billion) was also a strong contributor in the period. In our view, mid-cap stocks offer attractive alpha (the excess return on an investment relative to the return on a benchmark index) generation potential because they are often in an earlier stage of growth with a longer trajectory for generating future returns. The spirit of a growth-oriented fund is to capture this early stage growth when possible. While the Fund skews towards large caps in aggregate, we continue to find compelling opportunities in mid caps. On the other hand, stock selection in small caps was a detractor in the period. While the economic recovery is starting to broaden out and include smaller companies, investors gravitated toward larger companies with larger balance sheets amid a year of economic disruption. Small caps remain a focus of our research efforts, particularly in Japan.
Notable Portfolio Changes:
A robust IPO market in China led to a busy fourth quarter in terms of new portfolio additions. We purchased China-based health care companies Jacobio Pharmaceuticals Group, JD Health International, JW Cayman Therapeutics and Remegen Co. In addition, we purchased Chinese real estate management company Shimao Services and Chinese cosmetics company Yatsen Holding. The surge of IPOs created some interesting buying opportunities. Elsewhere in the region, we initiated a small position in the Indian non-banking financials company Bajaj Finance. And in Singapore, we initiated a position in Sea, Ltd.
Outlook:
Looking ahead, we expect China and Japan to remain compelling markets from a bottom-up perspective. U.S.—China trade tensions may linger to some degree, even as the incoming Biden administration appears likely to employ a more nuanced and diplomatic tone. For Japan, as the global economic outlook improves due to vaccine rollouts and lessening impacts of the pandemic, we expect the country’s macro conditions to improve as well. We especially see opportunities among small-cap names in Japan. In both markets, active security selection will remain key in our view. Turning to South and Southeast Asian economies such as India, the outlook is improving in many parts of the region and we continue to look for opportunities in these markets as well.
From a sector perspective, continued prospects for growth in the health care sector remains sound in our view, with attractive compounding potential for bottom-up equity investors. What’s more we find a broader universe of opportunity among health care companies. Whereas a sector such as communication services tends to be dominated by a few large players, we can more easily diversify our exposure within the health care sector because of the breadth and depth of the universe. Parts of the health care sector have seen a rise in valuations, but opportunities remain and we expect the sector to become a much larger part of the indexes and broader universe of stocks in Asia over time. From a bottom-up perspective, we are also finding opportunities in sectors such as real estate and information technology that have been less represented in the portfolio in the past. The core of our process remains in identifying opportunities on a company-by-company basis with strong top-line growth, strong management teams and an ability to grow its market share.
| | | | |
| matthewsasia.com | 800.789.ASIA | | | 41 | |
Matthews Asia Growth Fund
December 31, 2020
Schedule of Investmentsa
COMMON EQUITIES: 94.1%
| | | | | | | | |
| | | Shares | | | Value | |
| | |
| CHINA/HONG KONG: 45.9% | | | | | | | | |
Bilibili, Inc. ADRb | | | 1,434,500 | | | | $122,965,340 | |
| | |
Wuxi Biologics Cayman, Inc.b,c,d | | | 7,719,000 | | | | 102,364,313 | |
| | |
Innovent Biologics, Inc.b,c,d | | | 6,984,500 | | | | 73,757,111 | |
| | |
BeiGene, Ltd. ADRb | | | 200,000 | | | | 51,678,000 | |
| | |
Shenzhou International Group Holdings, Ltd. | | | 2,365,300 | | | | 46,355,742 | |
| | |
XPeng, Inc. ADRb | | | 1,048,275 | | | | 44,897,618 | |
| | |
Shenzhen Inovance Technology Co., Ltd. A Shares | | | 2,817,075 | | | | 40,459,451 | |
| | |
Baozun, Inc. ADRb | | | 1,054,700 | | | | 36,228,945 | |
| | |
Burning Rock Biotech, Ltd. ADRb | | | 1,528,948 | | | | 35,318,699 | |
| | |
Alibaba Group Holding, Ltd.b | | | 1,173,600 | | | | 34,133,605 | |
| | |
Silergy Corp. | | | 345,000 | | | | 29,691,281 | |
| | |
JD Health International, Inc.b,c,d | | | 1,437,400 | | | | 27,811,853 | |
| | |
Hansoh Pharmaceutical Group Co., Ltd.b,c,d | | | 5,620,000 | | | | 27,235,931 | |
| | |
Chindata Group Holdings, Ltd. ADRb | | | 1,094,700 | | | | 26,229,012 | |
| | |
Shimao Services Holdings, Ltd.b,c,d | | | 16,182,000 | | | | 24,964,588 | |
| | |
Jiangsu Hengrui Medicine Co., Ltd. A Shares | | | 1,434,048 | | | | 24,571,231 | |
| | |
Alphamab Oncologyb,c,d | | | 11,510,000 | | | | 24,136,487 | |
| | |
InnoCare Pharma, Ltd.b,c,d | | | 13,816,000 | | | | 24,029,516 | |
| | |
Hangzhou Tigermed Consulting Co., Ltd. H Sharesb,c,d | | | 1,023,000 | | | | 23,724,638 | |
| | |
AK Medical Holdings, Ltd.c,d | | | 11,702,000 | | | | 20,286,470 | |
| | |
Yatsen Holding, Ltd. ADRb | | | 1,044,900 | | | | 17,763,300 | |
| | |
Peijia Medical, Ltd.b,c,d | | | 4,867,000 | | | | 17,759,422 | |
| | |
KE Holdings, Inc. ADRb | | | 253,067 | | | | 15,573,743 | |
| | |
RemeGen Co., Ltd. H Sharesb,c,d | | | 1,260,500 | | | | 15,446,407 | |
| | |
Jacobio Pharmaceuticals Group Co., Ltd.b,c,d | | | 7,456,500 | | | | 13,619,442 | |
| | |
Genscript Biotech Corp.b | | | 9,144,000 | | | | 13,304,268 | |
| | |
JW Cayman Therapeutics Co., Ltd.b,c,d | | | 2,715,000 | | | | 9,228,083 | |
| | | | | | | | |
Total China/Hong Kong | | | | | | | 943,534,496 | |
| | | | | | | | |
| | | | | | | | |
| | | |
| JAPAN: 28.1% | | | | | | | | |
Sony Corp. | | | 552,500 | | | | 55,674,369 | |
| | |
Nintendo Co., Ltd. | | | 74,900 | | | | 48,081,412 | |
| | |
SoftBank Group Corp. | | | 552,400 | | | | 42,885,619 | |
| | |
Terumo Corp. | | | 921,900 | | | | 38,578,080 | |
| | |
M3, Inc. | | | 400,400 | | | | 37,824,718 | |
| | |
AI inside, Inc.b | | | 51,800 | | | | 36,875,088 | |
| | |
Nidec Corp. | | | 289,200 | | | | 36,586,104 | |
| | |
Keyence Corp. | | | 55,500 | | | | 31,219,695 | |
| | |
Fast Retailing Co., Ltd. | | | 33,600 | | | | 30,128,443 | |
| | |
PeptiDream, Inc.b | | | 555,300 | | | | 28,246,454 | |
| | |
Chugai Pharmaceutical Co., Ltd. | | | 427,900 | | | | 22,830,666 | |
| | |
HEALIOS KKb | | | 1,149,400 | | | | 21,956,474 | |
| | |
Freee KKb | | | 218,700 | | | | 21,387,481 | |
| | |
Japan Elevator Service Holdings Co., Ltd. | | | 805,200 | | | | 20,505,391 | |
| | |
Takeda Pharmaceutical Co., Ltd. | | | 562,900 | | | | 20,370,999 | |
| | |
Sysmex Corp. | | | 168,900 | | | | 20,323,166 | |
| | |
Sansan, Inc.b | | | 299,800 | | | | 19,780,265 | |
| | |
Nitori Holdings Co., Ltd. | | | 80,900 | | | | 16,916,310 | |
| | |
Hikari Tsushin, Inc. | | | 70,600 | | | | 16,565,164 | |
| | |
Sosei Group Corp.b | | | 550,900 | | | | 9,627,353 | |
| | | | | | | | |
Total Japan | | | | | | | 576,363,251 | |
| | | | | | | | |
| | | | | | | | |
| | | | | | | | |
| | | Shares | | | Value | |
| | |
| INDIA: 4.6% | | | | | | | | |
HDFC Bank, Ltd.b | | | 2,837,251 | | | | $55,883,876 | |
| | |
Bajaj Finance, Ltd. | | | 287,951 | | | | 20,906,777 | |
| | |
Reliance Industries, Ltd. | | | 655,967 | | | | 17,848,163 | |
| | | | | | | | |
Total India | | | | | | | 94,638,816 | |
| | | | | | | | |
| | | | | | | | |
| | | |
| INDONESIA: 3.5% | | | | | | | | |
PT Bank Rakyat Indonesia Persero | | | 205,971,900 | | | | 61,236,159 | |
| | |
PT Mayora Indah | | | 54,105,900 | | | | 10,438,470 | |
| | | | | | | | |
Total Indonesia | | | | | | | 71,674,629 | |
| | | | | | | | |
| | | | | | | | |
| | | |
| UNITED STATES: 3.3% | | | | | | | | |
Schrodinger, Inc.b | | | 352,900 | | | | 27,942,622 | |
| | |
Frequency Therapeutics, Inc.b | | | 476,465 | | | | 16,800,156 | |
| | |
Legend Biotech Corp. ADRb | | | 537,538 | | | | 15,137,070 | |
| | |
Turning Point Therapeutics, Inc.b | | | 69,800 | | | | 8,505,130 | |
| | | | | | | | |
Total United States | | | | | | | 68,384,978 | |
| | | | | | | | |
| | | | | | | | |
| | | |
| AUSTRALIA: 2.8% | | | | | | | | |
Oil Search, Ltd. | | | 11,936,340 | | | | 34,208,801 | |
| | |
CSL, Ltd. | | | 102,838 | | | | 22,469,338 | |
| | | | | | | | |
Total Australia | | | | | | | 56,678,139 | |
| | | | | | | | |
| | | | | | | | |
| | | |
| TAIWAN: 1.9% | | | | | | | | |
Taiwan Semiconductor Manufacturing Co., Ltd. ADR | | | 360,300 | | | | 39,287,112 | |
| | | | | | | | |
Total Taiwan | | | | | | | 39,287,112 | |
| | | | | | | | |
| | | | | | | | |
| | | |
| BANGLADESH: 1.4% | | | | | | | | |
Square Pharmaceuticals, Ltd. | | | 6,511,715 | | | | 16,865,150 | |
| | |
BRAC Bank, Ltd. | | | 24,353,713 | | | | 12,736,275 | |
| | | | | | | | |
Total Bangladesh | | | | | | | 29,601,425 | |
| | | | | | | | |
| | | | | | | | |
| | | |
| SINGAPORE: 0.9% | | | | | | | | |
Sea, Ltd. ADRb | | | 92,200 | | | | 18,352,410 | |
| | | | | | | | |
Total Singapore | | | | | | | 18,352,410 | |
| | | | | | | | |
| | | | | | | | |
| | | |
| VIETNAM: 0.8% | | | | | | | | |
Vietnam Dairy Products JSC | | | 3,739,910 | | | | 17,645,016 | |
| | | | | | | | |
Total Vietnam | | | | | | | 17,645,016 | |
| | | | | | | | |
| | | | | | | | |
| | | |
| SRI LANKA: 0.5% | | | | | | | | |
Sampath Bank PLC | | | 13,125,953 | | | | 9,607,985 | |
| | | | | | | | |
Total Sri Lanka | | | | | | | 9,607,985 | |
| | | | | | | | |
| | | | | | | | |
| | | |
| SWITZERLAND: 0.4% | | | | | | | | |
ADC Therapeutics SAb | | | 239,500 | | | | 7,666,395 | |
| | | | | | | | |
Total Switzerland | | | | | | | 7,666,395 | |
| | | | | | | | |
| | | | | | | | |
| | | |
| TOTAL INVESTMENTS: 94.1% | | | | | | | 1,933,434,652 | |
(Cost $1,136,293,667) | | | | | | | | |
| | | | | | | | |
| | |
CASH AND OTHER ASSETS,
LESS LIABILITIES: 5.9% | | | | | | | 120,352,999 | |
| | | | | | | | |
| | |
NET ASSETS: 100.0% | | | | | | | $2,053,787,651 | |
| | | | | | | | |
Matthews Asia Growth Fund
December 31, 2020
Schedule of Investmentsa (continued)
| a | Certain securities were fair valued under the valuation policies approved by the Board of Trustees (Note 2-A). |
| b | Non-income producing security. |
| c | Security exempt from registration under Rule 144A of the Securities Act of 1933, as amended. The security may be resold in transactions exempt from registration normally to qualified institutional buyers. The security has been determined to be liquid in accordance with procedures adopted by the Funds’ Board of Trustees. At December 31, 2020, the aggregate value is $404,364,261, which is 19.69% of net assets. |
| d | The securities may be resold to qualified foreign investors and foreign institutional buyers under Regulation S of the Securities Act of 1933. |
| ADR | American Depositary Receipt |
See accompanying notes to financial statements.
| | | | |
| matthewsasia.com | 800.789.ASIA | | | 43 | |
| | | | |
| PORTFOLIO MANAGERS |
| | |
| Sharat Shroff, CFA | | | | |
Lead Manager | | | | |
| |
| Inbok Song | | Raymond Deng |
Co-Manager | | Co-Manager |
| | |
| FUND FACTS | | | | |
| | |
| | | Investor | | Institutional |
Ticker | | MAPTX | | MIPTX |
CUSIP | | 577130107 | | 577130834 |
Inception | | 9/12/94 | | 10/29/10 |
NAV | | $34.94 | | $34.90 |
Initial Investment | | $2,500 | | $100,000 |
Gross Expense Ratio1 | | 1.08% | | 0.94% |
After Fee Waiver and Reimbursement2 | | 1.06% | | 0.92% |
Portfolio Statistics | | |
Total # of Positions | | 64 |
Net Assets | | $8.8 billion |
Weighted Average Market Cap | | $173.1 billion |
Portfolio Turnover3 | | 38.1% |
Benchmark |
MSCI AC Asia ex Japan Index |
OBJECTIVE
Long-term capital appreciation.
STRATEGY
Under normal market conditions, the Fund seeks to achieve its investment objective by investing at least 80% of its net assets, which include borrowings for investment purposes, in the common and preferred stocks of companies located in Asia ex Japan, which consists of all countries and markets in Asia excluding Japan, but including all other developed, emerging and frontier countries and markets in the Asian region.
Matthews Pacific Tiger Fund
Portfolio Manager Commentary (unaudited)
For the year ending December 31, 2020, the Matthews Pacific Tiger Fund returned 28.83% (Investor Class) and 28.98% (Institutional Class), while its benchmark, the MSCI All Country Asia ex Japan Index, returned 25.36%. For the fourth quarter of the year, the Fund returned 19.32% (Investor Class) and 19.37% (Institutional Class) versus 18.66% for the Index.
Market Environment:
The pandemic created notable disruptions and opportunities in 2020, providing markets and companies with a major accelerant and catalyst for change. The pandemic accelerated the move into areas such as e-commerce, software services and digital platforms into warp speed, creating new opportunities for innovative businesses. Another significant trend is the acceleration of labor reform in India and Indonesia. And finally, we continued to see further deregulation and liberalization of China’s capital markets including greater openness towards foreign investment, which is providing additional liquidity and support for China’s rapidly growing bond and equity markets.
In 2020, corporate earnings across Asia dropped much less than analysts initially feared and we believe that earnings may rebound strongly in 2021. Taiwan and South Korea, for example, contributed significantly to Asia’s growth in 2020. Doing a strong job in containing the pandemic, both economies are also home to companies that are benefiting from the accelerated update in e-commerce and digital services. Another positive trend during the year was companies and management teams’ agility in cutting down costs and reining in capital expenditures. Free cash flow (Free cash flow is a measure of financial performance calculated as operating cash flow minus capital expenditures. Free cash flow (FCF) represents the cash that a company is able to generate after laying out the money required to maintain or expand its asset base.) was resilient in the course of 2020.
While small cap stocks slightly outperformed large caps in 2020—the first time we’ve seen that dynamic in the past five years—the impact of the pandemic was disproportionately felt by small and medium-size businesses. As the economic recovery starts to broaden out, small and mid-sized companies may be able to participate more fully in economic growth.
Performance Contributors and Detractors:
During the year, contributors to performance included stock selection in China, Taiwan and South Korea. North Asian economies contained the pandemic relatively faster and companies in these countries responded proactively to the uncertain demand environment. The Fund’s holdings in IT hardware and software, health care and leading consumer brands such as Mediatek, Naver, Wuxi Biologics and China Resources Beer have shown strong core business operation and contributed positively during the year. From the strong equity market, the Fund’s financial holdings in Hong Kong Exchanges & Clearing Ltd. had positive performance too. Coupled with strong equity market, capital raising activities by mainland Chinese companies have led greater trading volume on the exchange.
On the other hand, the Fund’s relative overweight in India and ASEAN detracted from performance during the year, as these economies took more time to recover from the pandemic and recovery has been more gradual. The Fund’s holdings in the shopping mall operators in Thailand, such as Central Pattana Public Co. Ltd,
(continued)
| 1 | Actual 2020 expense ratios. |
| 2 | Matthews has contractually agreed to waive a portion of its advisory fee and administrative and shareholder services fee if the Fund’s average daily net assets are over $3 billion, as follows: for every $2.5 billion average daily net assets of the Fund that are over $3 billion, the advisory fee rate and the administrative and shareholder services fee rate for the Fund with respect to such excess average daily net assets will be each reduced by 0.01%, in each case without reducing such fee rate below 0.00%. Any amount waived by Matthews pursuant to this agreement may not be recouped by Matthews. This agreement will remain in place until April 30, 2022 and may be terminated (i) at any time by the Board of Trustees upon 60 days’ prior written notice to Matthews; or (ii) by Matthews at the annual expiration date of the agreement upon 60 days’ prior written notice to the Trust, in each case without payment of any penalty. |
| 3 | The lesser of fiscal year 2020 long-term purchase costs or sales proceeds divided by the average monthly market value of long-term securities. |
| | | | | | | | | | | | | | | | | | | | | | | | | | | | |
| |
| PERFORMANCE AS OF DECEMBER 31, 2020 | |
| | | | | | | | | Average Annual Total Returns | | | | |
| | | 3 Months | | | 1 Year | | | 3 Years | | | 5 Years | | | 10 Years | | | Since
Inception | | | Inception
Date | |
Investor Class (MAPTX) | | | 19.32% | | | | 28.83% | | | | 8.23% | | | | 12.12% | | | | 8.06% | | | | 9.20% | | | | 9/12/94 | |
Institutional Class (MIPTX) | | | 19.37% | | | | 28.98% | | | | 8.40% | | | | 12.30% | | | | 8.24% | | | | 8.17% | | | | 10/29/10 | |
MSCI AC Asia ex Japan Index4 | | | 18.66% | | | | 25.36% | | | | 8.46% | | | | 13.90% | | | | 6.80% | | | | 5.40% | 5 | | | | |
Performance assumes reinvestment of all dividends and/or distributions before taxes. All performance quoted represents past performance and is no guarantee of future results. Investment return and principal value will fluctuate with market conditions so that when redeemed, shares may be worth more or less than their original cost. Current performance may be lower or higher than the return figures quoted. Returns would have been lower if certain of the Fund’s fees and expenses had not been waived. For the Fund’s most recent month-end performance, visit matthewsasia.com.
GROWTH OF A HYPOTHETICAL $10,000 INVESTMENT SINCE INCEPTION—INVESTOR CLASS
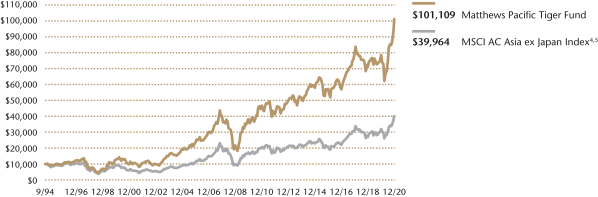
Plotted monthly. The performance data and graph do not reflect the deduction of taxes that a shareholder would pay on dividends, capital gains distributions or redemption of Fund shares. Values are in US$.
| | 4 | It is not possible to invest directly in an index. Source: Index data from Morgan Stanley Capital International and Bloomberg; total return calculations performed by BNY Mellon Investment Servicing (US) Inc. Please see page 93 for index definition. |
| | 5 | Calculated from 8/31/94. |
| | | | | | | | |
| | | | |
| TOP TEN HOLDINGS6 | | | | | | | |
| | | Sector | | Country | | % of Net Assets | |
Samsung Electronics Co., Ltd. | | Information Technology | | South Korea | | | 6.3% | |
Tencent Holdings, Ltd. | | Communication Services | | China/Hong Kong | | | 5.5% | |
Taiwan Semiconductor Manufacturing Co., Ltd. | | Information Technology | | Taiwan | | | 5.4% | |
Alibaba Group Holding, Ltd. | | Consumer Discretionary | | China/Hong Kong | | | 4.9% | |
AIA Group, Ltd. | | Financials | | China/Hong Kong | | | 3.4% | |
Hong Kong Exchanges & Clearing, Ltd. | | Financials | | China/Hong Kong | | | 3.0% | |
Wuxi Biologics Cayman, Inc. | | Health Care | | China/Hong Kong | | | 2.3% | |
China Resources Beer Holdings Co., Ltd. | | Consumer Staples | | China/Hong Kong | | | 2.3% | |
Housing Development Finance Corp., Ltd. | | Financials | | India | | | 2.2% | |
LG Chem Ltd. | | Materials | | South Korea | | | 2.2% | |
% OF ASSETS IN TOP 10 | | | | | | | 37.5% | |
| | 6 | Holdings may combine more than one security from same issuer and related depositary receipts. |
| | | | |
| matthewsasia.com | 800.789.ASIA | | | 45 | |
Matthews Pacific Tiger Fund
Portfolio Manager Commentary (unaudited) (continued)
and the Philippines such as SM Prime Holdings, Inc. were also affected negatively during the year as traffic was restricted to those malls and tenants’ revenue shrunk. Additionally, the impact of the lock down on the asset quality of the banking sector weighed on investors’ sentiment, impacting the Fund’s holdings in India banks, such as HDFC Bank Limited (which we sold in the fourth quarter), and Indonesian banks, such as PT Bank Central Asia. Our approach continues to maintain exposure to those shopping malls and banks with strong balance sheets as we believe long term structural demand is still intact.
Notable Portfolio Changes:
During this year, we continued to diversify the portfolio to capture secular growth opportunities that we believe can persist in coming years while maintaining focus on domestically oriented growth in Asia. The continued evolution in the business landscape especially in China, and pandemic-induced volatility in the capital markets allowed us to capture newer growth opportunities for the portfolio. As a result, our weight in consumer discretionary, health care and IT sectors has increased. Meanwhile, the Fund’s weight in financials and consumer staples sectors decreased.
In the fourth quarter, we initiated some new positions, including in Yageo, a Taiwanese listed company that produces computer chips and other electronic components. As a small to mid-cap stock, Yageo appears undervalued relative to its global peers. We also see a strong turnaround story with the company, as its management is focused on new areas of growth and improving its execution. Some of these new positions were funded from capital released from positions like DKSH which we exited during the fourth quarter. The company has taken notable steps to improve cost structure but we believe there may be better growth opportunities elsewhere in the portfolio.
Outlook:
Looking ahead, uncertainty remains in terms of the pace of Asia’s economic recovery. Given the uncertainty of how quickly vaccines can be distributed, how quickly daily patterns may return to normal remain unknown and the strength of the economic recovery in different markets where we invest may not be immediately evident. Valuations for Asia ex-Japan equities are above their historic averages and in some areas of the market, we believe investors have already priced in a high level of anticipated future growth. All of these emphasize the importance of investing with a long-term view.
At the same time, we see many reasons for optimism. There are three important drivers for equity prices—growth, valuation and liquidity. From a growth perspective, Asia is on a path to economic recovery and the sheer size of the consumer base in Asia works in its favor. Valuations for Asia ex-Japan equities rose in 2020, so there is less valuation support for the broader market, but we continue to see pockets of opportunity. Finally, turning to market liquidity, we see good liquidity across Asia. We believe the confluence of these drivers will support medium to long-term growth across many parts of Asia.
| | | | |
| |
| COUNTRY ALLOCATION (%)7,8 | |
| China/Hong Kong | | | 49.7 | |
| Taiwan | | | 13.6 | |
| South Korea | | | 12.9 | |
| India | | | 11.4 | |
| Indonesia | | | 3.3 | |
| Singapore | | | 2.5 | |
| Philippines | | | 1.9 | |
| Thailand | | | 1.5 | |
| Vietnam | | | 1.1 | |
| Malaysia | | | 0.8 | |
| Cash and Other Assets, Less Liabilities | | | 1.5 | |
| | | | |
| |
| SECTOR ALLOCATION (%)8 | |
| Information Technology | | | 24.1 | |
| Consumer Discretionary | | | 16.7 | |
| Financials | | | 13.8 | |
| Consumer Staples | | | 11.4 | |
| Communication Services | | | 10.6 | |
| Real Estate | | | 6.4 | |
| Health Care | | | 6.1 | |
| Utilities | | | 4.3 | |
| Industrials | | | 2.9 | |
| Materials | | | 2.2 | |
| Cash and Other Assets, Less Liabilities | | | 1.5 | |
| | | | |
| |
| MARKET CAP EXPOSURE (%)8 | |
| Mega Cap (over $25B) | | | 60.8 | |
| Large Cap ($10B–$25B) | | | 18.7 | |
| Mid Cap ($3B–10B) | | | 17.1 | |
| Small Cap (under $3B) | | | 1.9 | |
| Cash and Other Assets, Less Liabilities | | | 1.5 | |
| 7 | Not all countries where the Fund may invest are included in the benchmark index. |
| 8 | Source: FactSet Research Systems. Percentage values in data are rounded to the nearest tenth of one percent, so the values may not sum to 100% due to rounding. Country allocations and percentage values may be derived from different data sources and may not be consistent with other Fund literature. |
Matthews Pacific Tiger Fund
December 31, 2020
Schedule of Investmentsa
COMMON EQUITIES: 98.5%
| | | | | | | | |
| | | Shares | | | Value | |
| | |
| CHINA/HONG KONG: 49.6% | | | | | | | | |
Tencent Holdings, Ltd. | | | 6,703,100 | | | | $482,313,504 | |
| | |
Alibaba Group Holding, Ltd.b | | | 12,916,000 | | | | 375,655,797 | |
| | |
AIA Group, Ltd. | | | 24,134,000 | | | | 294,099,876 | |
| | |
Hong Kong Exchanges & Clearing, Ltd. | | | 4,835,500 | | | | 265,235,531 | |
| | |
Wuxi Biologics Cayman, Inc.b,c,d | | | 15,494,500 | | | | 205,477,892 | |
| | |
China Resources Beer Holdings Co., Ltd. | | | 21,613,775 | | | | 198,756,232 | |
| | |
Kweichow Moutai Co., Ltd. A Shares | | | 617,173 | | | | 189,678,963 | |
| | |
ENN Energy Holdings, Ltd. | | | 11,747,300 | | | | 172,446,876 | |
| | |
China Tourism Group Duty Free Corp., Ltd. A Shares | | | 3,618,678 | | | | 157,515,811 | |
| | |
Inner Mongolia Yili Industrial Group Co., Ltd. A Shares | | | 22,636,308 | | | | 154,482,104 | |
| | |
Jiangsu Hengrui Medicine Co., Ltd. A Shares | | | 8,525,841 | | | | 146,083,262 | |
| | |
Weichai Power Co., Ltd. A Shares | | | 58,589,367 | | | | 142,403,493 | |
| | |
Midea Group Co., Ltd. A Shares | | | 8,465,616 | | | | 128,220,075 | |
| | |
China Resources Land, Ltd. | | | 29,190,000 | | | | 120,288,784 | |
| | |
Kingdee International Software Group Co., Ltd. | | | 29,295,000 | | | | 119,598,560 | |
| | |
Topsports International Holdings, Ltd.c,d | | | 73,548,000 | | | | 110,142,969 | |
| | |
Ping An Insurance Group Co. of China, Ltd. H Shares | | | 8,801,000 | | | | 107,104,800 | |
| | |
Yum China Holdings, Inc. | | | 1,741,201 | | | | 99,405,165 | |
| | |
China East Education Holdings, Ltd.c,d | | | 40,962,000 | | | | 98,577,093 | |
| | |
China Resources Mixc Lifestyle Services, Ltd.b,c,d | | | 21,165,430 | | | | 98,149,257 | |
| | |
Xinyi Solar Holdings, Ltd. | | | 36,406,000 | | | | 95,464,140 | |
| | |
CITIC Securities Co., Ltd. H Shares | | | 37,861,500 | | | | 85,434,111 | |
| | |
JD.com, Inc. ADRb | | | 945,800 | | | | 83,135,820 | |
| | |
Ming Yuan Cloud Group Holdings, Ltd.b | | | 12,327,175 | | | | 75,917,233 | |
| | |
Fuyao Glass Industry Group Co., Ltd. H Sharesc,d | | | 11,697,200 | | | | 64,384,828 | |
| | |
Midea Group Co., Ltd. A Shares | | | 4,206,937 | | | | 63,358,187 | |
| | |
Alibaba Group Holding, Ltd. ADRb | | | 232,775 | | | | 54,173,726 | |
| | |
Shenzhen New Industries Biomedical Engineering Co., Ltd. A Shares | | | 2,256,007 | | | | 45,674,714 | |
| | |
Shimao Services Holdings, Ltd.b,c,d | | | 28,627,000 | | | | 44,163,964 | |
| | |
TravelSky Technology, Ltd. H Shares | | | 16,592,000 | | | | 40,084,825 | |
| | |
JD.com, Inc. A Sharesb | | | 720,250 | | | | 31,721,556 | |
| | | | | | | | |
Total China/Hong Kong | | | | | | | 4,349,149,148 | |
| | | | | | | | |
| | | | | | | | |
| | | |
| TAIWAN: 13.6% | | | | | | | | |
Taiwan Semiconductor Manufacturing Co., Ltd. | | | 25,197,000 | | | | 476,663,560 | |
| | |
MediaTek, Inc. | | | 6,766,000 | | | | 180,430,820 | |
| | |
Yageo Corp. | | | 7,672,000 | | | | 142,006,976 | |
| | |
President Chain Store Corp. | | | 13,620,608 | | | | 129,260,613 | |
| | |
Delta Electronics, Inc. | | | 11,361,182 | | | | 106,544,536 | |
| | |
Realtek Semiconductor Corp. | | | 6,897,000 | | | | 96,085,092 | |
| | |
ASMedia Technology, Inc. | | | 1,125,000 | | | | 63,029,176 | |
| | | | | | | | |
Total Taiwan | | | | | | | 1,194,020,773 | |
| | | | | | | | |
| | | | | | | | |
| | | |
| SOUTH KOREA: 12.9% | | | | | | | | |
Samsung Electronics Co., Ltd. | | | 7,429,327 | | | | 554,788,859 | |
| | |
LG Chem Ltd. | | | 252,844 | | | | 192,266,852 | |
| | |
NAVER Corp. | | | 553,220 | | | | 149,131,112 | |
| | |
NCSoft Corp. | | | 105,881 | | | | 90,904,267 | |
| | | | | | | | |
| | | Shares | | | Value | |
| | |
Mando Corp. | | | 1,040,573 | | | | $56,448,350 | |
| | |
Amorepacific Corp. | | | 243,504 | | | | 46,236,817 | |
| | |
Korea Electric Power Corp. | | | 1,641,895 | | | | 41,441,853 | |
| | | | | | | | |
Total South Korea | | | | | | | 1,131,218,110 | |
| | | | | | | | |
| | | | | | | | |
| | | |
| INDIA: 11.3% | | | | | | | | |
Housing Development Finance Corp., Ltd. | | | 5,575,438 | | | | 195,340,780 | |
| | |
Tata Power Co., Ltd. | | | 158,179,377 | | | | 163,943,014 | |
| | |
Titan Co., Ltd. | | | 6,423,426 | | | | 137,990,925 | |
| | |
Kotak Mahindra Bank, Ltd.b | | | 4,359,159 | | | | 119,138,702 | |
| | |
Dabur India, Ltd. | | | 16,112,505 | | | | 117,924,432 | |
| | |
Tata Consultancy Services, Ltd. | | | 2,303,129 | | | | 90,432,667 | |
| | |
Info Edge India, Ltd. | | | 1,350,000 | | | | 88,063,726 | |
| | |
Container Corp. of India, Ltd. | | | 8,081,457 | | | | 44,192,311 | |
| | |
PVR, Ltd. | | | 2,054,065 | | | | 37,214,553 | |
| | | | | | | | |
Total India | | | | | | | 994,241,110 | |
| | | | | | | | |
| | | | | | | | |
| | | |
| INDONESIA: 3.3% | | | | | | | | |
PT Bank Central Asia | | | 59,006,900 | | | | 142,237,892 | |
| | |
PT Indofood CBP Sukses Makmur | | | 108,422,500 | | | | 73,919,782 | |
| | |
PT Mitra Keluarga Karyasehatd | | | 358,729,800 | | | | 69,738,215 | |
| | | | | | | | |
Total Indonesia | | | | | | | 285,895,889 | |
| | | | | | | | |
| | | | | | | | |
| | | |
| SINGAPORE: 2.5% | | | | | | | | |
Sea, Ltd. ADRb | | | 402,400 | | | | 80,097,720 | |
| | |
SATS, Ltd.b | | | 23,207,600 | | | | 70,023,472 | |
| | |
Venture Corp., Ltd. | | | 4,577,200 | | | | 67,302,299 | |
| | | | | | | | |
Total Singapore | | | | | | | 217,423,491 | |
| | | | | | | | |
| | | | | | | | |
| | | |
| PHILIPPINES: 1.9% | | | | | | | | |
SM Prime Holdings, Inc. | | | 203,509,671 | | | | 163,181,240 | |
| | | | | | | | |
Total Philippines | | | | | | | 163,181,240 | |
| | | | | | | | |
| | | | | | | | |
| | | |
| THAILAND: 1.5% | | | | | | | | |
Central Pattana Public Co., Ltd. | | | 83,172,700 | | | | 132,426,632 | |
| | | | | | | | |
Total Thailand | | | | | | | 132,426,632 | |
| | | | | | | | |
| | | | | | | | |
| | | |
| VIETNAM: 1.1% | | | | | | | | |
Vietnam Dairy Products JSC | | | 19,619,028 | | | | 92,563,207 | |
| | | | | | | | |
Total Vietnam | | | | | | | 92,563,207 | |
| | | | | | | | |
| | | | | | | | |
| | | |
| MALAYSIA: 0.8% | | | | | | | | |
IHH Healthcare BHD | | | 50,774,600 | | | | 69,519,421 | |
| | | | | | | | |
Total Malaysia | | | | | | | 69,519,421 | |
| | | | | | | | |
| | | | | | | | |
| | |
| TOTAL INVESTMENTS: 98.5% | | | | 8,629,639,021 | |
(Cost $4,903,246,584) | | | | | | | | |
| | | | | | | | |
| | |
CASH AND OTHER ASSETS,
LESS LIABILITIES: 1.5% | | | | | | | 129,010,517 | |
| | | | | | | | |
| | |
NET ASSETS: 100.0% | | | | | | | $8,758,649,538 | |
| | | | | | | | |
| | | | |
| matthewsasia.com | 800.789.ASIA | | | 47 | |
Matthews Pacific Tiger Fund
December 31, 2020
Schedule of Investmentsa (continued)
| a | Certain securities were fair valued under the valuation policies approved by the Board of Trustees (Note 2-A). |
| b | Non-income producing security. |
| c | Security exempt from registration under Rule 144A of the Securities Act of 1933, as amended. The security may be resold in transactions exempt from registration normally to qualified institutional buyers. The security has been determined to be liquid in accordance with procedures adopted by the Funds’ Board of Trustees. At December 31, 2020, the aggregate value is $620,896,003, which is 7.09% of net assets. |
| d | The securities may be resold to qualified foreign investors and foreign institutional buyers under Regulation S of the Securities Act of 1933. |
| ADR | American Depositary Receipt |
See accompanying notes to financial statements.
| | | | |
| PORTFOLIO MANAGERS |
| |
| Vivek Tanneeru | | |
Lead Manager | | |
| |
| Winnie Chwang | | |
Co-Manager | | | | |
|
| FUND FACTS |
| | |
| | | Investor | | Institutional |
Ticker | | MASGX | | MISFX |
CUSIP | | 577130727 | | 577130719 |
Inception | | 4/30/15 | | 4/30/15 |
NAV | | $14.94 | | $14.92 |
Initial Investment | | $2,500 | | $100,000 |
Gross Expense Ratio1 | | 1.42% | | 1.29% |
After Fee Waiver and Reimbursement2 | | 1.38% | | 1.20% |
Portfolio Statistics | | | | |
Total # of Positions | | 55 |
Net Assets | | $88.0 million |
Weighted Average
Market Cap | | $35.0 billion |
Portfolio Turnover3 | | 84.6% |
Benchmark | | |
MSCI AC Asia ex Japan Index |
OBJECTIVE
Long-term capital appreciation.
STRATEGY
Under normal market conditions, the Fund seeks to achieve its investment objective by investing at least 80% of its net assets, which include borrowings for investment purposes, in the common and preferred stocks of companies of any market capitalization located in Asia that Matthews believes satisfy one or more of its environmental, social and governance (“ESG”) standards. Asia consists of all countries and markets in Asia and includes developed, emerging, and frontier countries and markets in the Asia region. The Fund may also invest in convertible securities and fixed-income securities, of any duration or quality, including high yield securities, of Asian companies.
Matthews Asia ESG Fund
Portfolio Manager Commentary (unaudited)
For the year ending December 31, 2020, the Matthews Asia ESG Fund returned 42.87% (Investor Class) and 43.13% (Institutional Class), while its benchmark, the MSCI All Country Asia ex Japan Index, returned 25.36%. For the fourth quarter, the Fund returned 25.34% (Investor Class) and 25.43% (Institutional Class) versus 18.66% for the Index.
Market Environment:
Equities across Asia were volatile in the year, but broad market indexes tracking the region ultimately generated attractive returns. Global markets fell in the first quarter, as worries surrounding the spread of COVID-19 moved from China throughout Europe to the U.S. and then back to South Asia, including India. Fears of a global growth slowdown turned into reality as governments worldwide began to implement different versions of “shelter in place” to contain the movement of the virus. But central banks globally, led by the U.S. Federal Reserve, unleashed powerful, and largely effective, monetary stimulus. Many governments also unveiled meaningful fiscal stimulus. Both those actions helped ease worries about a crippling and sustained global recession. They also provided cover for many emerging markets (EM) to undertake their own monetary and fiscal stimuli thereby supporting their economies.
In the third quarter, economic recovery and improved sentiment began to take hold as major economies continued to relax COVID-19 lockdown restrictions even further. China’s V-shaped recovery in manufacturing along with a steady recovery in domestic consumption brought some normalcy to daily life. EM currencies rallied slightly against the U.S. dollar in the third quarter, acting as a slight tailwind for EM equities. Growth stocks outpaced value and small caps outperformed large caps. The fourth quarter saw further economic strengthening. Cyclical stocks in beaten-up or export-driven markets such as Indonesia and South Korea rallied most in the fourth quarter, while markets that experienced early recovery like China, Japan and India lagged slightly. Market strength gained momentum following the U.S. Presidential elections in November as markets hoped for less confrontational U.S.—China relations, combined with an announcement of several approved COVID-19 vaccines that were due for distribution early in 2021.
Performance Contributors and Detractors:
From a regional perspective, stock selection in China and South Korea was a notable contributor for the full year. North Asia economies reopened more quickly following the early stages of the pandemic and investor sentiment turned to optimism toward Chinese and South Korean equities. From a sector perspective, stock selection in information technology was a notable contributor. Information technology companies rallied as the pandemic boosted demand for e-commerce and other stay-at-home solutions. Among individual securities, Samsung SDI was a contributor. The company is one of the world’s leading small, automotive and energy storage battery suppliers. It also has a minority equity stake in the world’s largest display company. In addition it also has an electronic materials division with exposure to memory and foundry customers. The company is one of the global leaders in the battery technology primarily used in electric vehicles (EVs) and utility-grade energy storage systems.
(continued)
| 1 | Actual 2020 expense ratios. |
| 2 | Matthews has contractually agreed (i) to waive fees and reimburse expenses to the extent needed to limit Total Annual Fund Operating Expenses (excluding Rule 12b-1 fees, taxes, interest, brokerage commissions, short sale dividend expenses, expenses incurred in connection with any merger or reorganization or extraordinary expenses such as litigation) of the Institutional Class to 1.20% first by waiving class specific expenses (i.e., shareholder service fees specific to a particular class) of the Institutional Class and then, to the extent necessary, by waiving non-class specific expenses (e.g., custody fees) of the Institutional Class, and (ii) if any Fund-wide expenses (i.e., expenses that apply to both the Institutional Class and the Investor Class) are waived for the Institutional Class to maintain the 1.20% expense limitation, to waive an equal amount (in annual percentage terms) of those same expenses for the Investor Class. The Total Annual Fund Operating Expenses After Fee Waiver and Expense Reimbursement for the Investor Class may vary from year to year and will in some years exceed 1.20%. If the operating expenses fall below the expense limitation in a year within three years after Matthews has made a waiver or reimbursement, the Fund may reimburse Matthews up to an amount that does not cause the expenses for that year to exceed the lesser of (i) the expense limitation applicable at the time of that fee waiver and/or expense reimbursement or (ii) the expense limitation in effect at the time of recoupment. This agreement will remain in place until April 30, 2022 and may be terminated at any time by the Board of Trustees on behalf of the Fund on 60 days’ written notice to Matthews. Matthews may decline to renew this agreement by written notice to the Trust at least 30 days before its annual expiration date. |
| 3 | The lesser of fiscal year 2020 long-term purchase costs or sales proceeds divided by the average monthly market value of long-term securities. |
| | | | |
| matthewsasia.com | 800.789.ASIA | | | 49 | |
| | | | | | | | | | | | | | | | | | | | | | | | |
| |
| PERFORMANCE AS OF DECEMBER 31, 2020 | |
| | | | | | | | | Average Annual Total Returns | | | | |
| | | 3 Months | | | 1 Year | | | 3 years | | | 5 years | | | Since
Inception | | | Inception
Date | |
| Investor Class (MASGX) | | | 25.34% | | | | 42.87% | | | | 13.22% | | | | 13.87% | | | | 10.65% | | | | 4/30/15 | |
| Institutional Class (MISFX) | | | 25.43% | | | | 43.13% | | | | 13.44% | | | | 14.12% | | | | 10.89% | | | | 4/30/15 | |
| MSCI AC Asia ex Japan Index4 | | | 18.66% | | | | 25.36% | | | | 8.46% | | | | 13.90% | | | | 8.07% | | | | | |
Performance assumes reinvestment of all dividends and/or distributions before taxes. All performance quoted represents past performance and is no guarantee of future results. Investment return and principal value will fluctuate with market conditions so that when redeemed, shares may be worth more or less than their original cost. Current performance may be lower or higher than the return figures quoted. Returns would have been lower if certain of the Fund’s fees and expenses had not been waived. For the Fund’s most recent month-end performance visit matthewsasia.com.
GROWTH OF A HYPOTHETICAL $10,000 INVESTMENT SINCE INCEPTION—INVESTOR CLASS
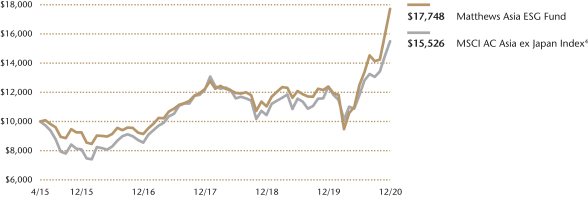
Plotted Monthly. The performance data and graph do not reflect the deduction of taxes that a shareholder would pay on dividends, capital gain distributions or redemption of Fund shares. Values are in US$.
| | 4 | It is not possible to invest directly in an index. Source: Index data from Morgan Stanley Capital International; total return calculations performed by BNY Mellon Investment Servicing (US) Inc. Please see page 93 for index definition. |
| | | | | | | | | | | | |
| | | | | |
| TOP TEN HOLDINGS5 | | | | | | | | | | |
| | | Sector | | Country | | | | | % of Net Assets | |
| LG Chem, Ltd., Pfd. | | Materials | | South Korea | | | | | | | 6.0% | |
| Samsung SDI Co., Ltd., Pfd. | | Information Technology | | South Korea | | | | | | | 5.0% | |
| Hong Kong Exchanges & Clearing, Ltd. | | Financials | | China/Hong Kong | | | | | | | 4.6% | |
| Flat Glass Group Co., Ltd. | | Information Technology | | China/Hong Kong | | | | | | | 4.4% | |
| Bandhan Bank, Ltd. | | Financials | | India | | | | | | | 3.6% | |
| Wuxi Biologics Cayman, Inc. | | Health Care | | China/Hong Kong | | | | | | | 3.3% | |
| Shriram City Union Finance, Ltd. | | Financials | | India | | | | | | | 3.2% | |
| IndusInd Bank, Ltd. | | Financials | | India | | | | | | | 3.0% | |
| Phoenix Mills, Ltd. | | Real Estate | | India | | | | | | | 3.0% | |
| Mahindra & Mahindra, Ltd. | | Consumer Discretionary | | India | | | | | | | 2.8% | |
| % OF ASSETS IN TOP 10 | | | | | | | | | | | 38.9% | |
| | 5 | Holdings may combine more than one security from same issuer and related depositary receipts. |
| | | | |
| | |
| COUNTRY ALLOCATION (%)6,7 | | | |
| China/Hong Kong | | | 37.4 | |
| India | | | 21.3 | |
| South Korea | | | 12.2 | |
| Taiwan | | | 11.7 | |
| Japan | | | 5.7 | |
| Bangladesh | | | 3.6 | |
| Singapore | | | 2.6 | |
| United States | | | 1.8 | |
| Thailand | | | 1.3 | |
| Vietnam | | | 0.7 | |
| Indonesia | | | 0.1 | |
| Cash and Other Assets, Less Liabilities | | | 1.6 | |
| | | | |
| | |
| SECTOR ALLOCATION (%)7 | | | |
| Information Technology | | | 24.6 | |
| Financials | | | 16.6 | |
| Health Care | | | 14.6 | |
| Industrials | | | 12.9 | |
| Consumer Discretionary | | | 11.2 | |
| Materials | | | 6.0 | |
| Real Estate | | | 5.2 | |
| Communication Services | | | 3.7 | |
| Consumer Staples | | | 3.5 | |
| Cash and Other Assets, Less Liabilities | | | 1.6 | |
| | | | |
| | |
| MARKET CAP EXPOSURE (%)7 | | | |
| Mega Cap (over $25B) | | | 30.7 | |
| Large Cap ($10B-$25B) | | | 17.8 | |
| Mid Cap ($3B-10B) | | | 21.7 | |
| Small Cap (under $3B) | | | 28.2 | |
| Cash and Other Assets, Less Liabilities | | | 1.6 | |
| 6 | Not all countries are included in the benchmark index. |
| 7 | Source: FactSet Research Systems. Percentage values in data are rounded to the nearest tenth of one percent, so the values may not sum to 100% due to rounding. Country allocations and percentage values may be derived from different data sources and may not be consistent with other Fund literature. |
Matthews Asia ESG Fund
Portfolio Manager Commentary (unaudited) (continued)
On the other hand, stock selection in India and an overweight to Bangladesh detracted from performance. Sentiment toward South and Southeast Asia was weaker in the early stages of the pandemic, though sentiment began to improve markedly in the second half of the year. Stock selection in financials was a detractor. Indian financials, including Induslnd Bank, struggled amid poor sentiment toward banks but we maintain a positive long-term view on the Indian financials in the portfolio. Going into 2020, the Indian banking system was already dealing with the after effects of several years of anemic growth and the resultant credit cycle was presented with a new challenge in the form of COVID19-related lockdown in India. However, India’s central government announced a slew of fiscal measures to support the economy. Our bank holdings recovered from their first quarter bottoms during the rest of the year as asset quality held up better than expected but share prices still remain below their pre-COVID19 levels.
Notable Portfolio Changes:
During the fourth quarter, the Fund initiated a position in Flat Glass, a leading Chinese PV (photo voltaic) glass manufacturer. This is our first initiation in a solar power-related name since the inception of the Fund. Historically, the broader sector was plagued by cyclicality of demand, regulatory and policy uncertainties, excess capacity, intense competition, inability to generate cash flows and excess leverage. With solar power reaching grid parity across much of the globe, the economics have improved meaningfully and no longer need government subsidies in the form of feed-in-tariffs and the policy uncertainty it brings.
During the quarter we also participated in select health care IPOs in China including in JD Health, a leader in the fast growing online pharmacy and consultation business in China. We also exited our positions in South Asian pharmaceutical names such as Lupin and Abbott Laboratories Pakistan to fund more attractive opportunities elsewhere.
Outlook:
Looking ahead, uncertainty remains in terms of the pace of Asia’s economic recovery. Given the uncertainty of how quickly vaccines can be distributed and return to normal daily patterns remain unknown, the strength of the economic recovery in different markets where we invest may not be immediately evident. Valuations for Asia ex-Japan equities are above their historic averages and in some areas of the market, we believe investors have already priced in a high level of anticipated future growth. All of these emphasize the importance of investing with a long-term view.
At the same time, we see many reasons for optimism. From a growth perspective, Asia is on a path to economic recovery and the sheer size of the consumer base in Asia works in its favor. Valuations for Asia ex-Japan equities rose in 2020, so there is less valuation support for the broader market, but we continue to see pockets of opportunity. Finally, turning to market liquidity, we see good liquidity across Asia. We believe the confluence of these drivers will support medium to long-term growth across many parts of Asia.
The pandemic accelerated many trends, including the importance of ESG criteria when investing with a long-term view. Through our bottom-up research process, we continue to follow themes that have the potential to improve the quality of life for millions, and even billions, of people in the developing world. These areas of interest include companies that are working to expand access to high-quality, affordable health care, provide more inclusive financing solutions to individuals and small businesses, build more affordable housing and generate sustainable transportation solutions.
| | | | |
| matthewsasia.com | 800.789.ASIA | | | 51 | |
Matthews Asia ESG Fund
December 31, 2020
Schedule of Investmentsa
COMMON EQUITIES: 87.3%
| | | | | | | | |
| | | Shares | | | Value | |
| | |
| CHINA/HONG KONG: 35.4% | | | | | | | | |
Hong Kong Exchanges & Clearing, Ltd. | | | 73,100 | | | | $4,009,661 | |
| | |
Flat Glass Group Co., Ltd. H Shares | | | 909,000 | | | | 3,834,452 | |
| | |
Wuxi Biologics Cayman, Inc.b,c,d | | | 216,000 | | | | 2,864,450 | |
| | |
China Conch Venture Holdings, Ltd. | | | 497,000 | | | | 2,418,433 | |
| | |
Hangzhou Tigermed Consulting Co., Ltd. A Shares | | | 95,276 | | | | 2,365,936 | |
| | |
Innovent Biologics, Inc.b,c,d | | | 219,000 | | | | 2,312,665 | |
| | |
Meituan B Sharesc,d | | | 51,800 | | | | 1,949,931 | |
| | |
Xinyi Glass Holdings, Ltd. | | | 676,000 | | | | 1,890,801 | |
| | |
CSPC Pharmaceutical Group, Ltd. | | | 1,512,960 | | | | 1,540,406 | |
| | |
ASM Pacific Technology, Ltd. | | | 110,200 | | | | 1,455,376 | |
| | |
Yonghui Superstores Co., Ltd. A Shares | | | 1,134,195 | | | | 1,253,221 | |
| | |
Contemporary Amperex Technology Co., Ltd. A | | | | | | | | |
| | |
Shares | | | 22,200 | | | | 1,201,712 | |
| | |
Chindata Group Holdings, Ltd. ADRc | | | 48,400 | | | | 1,159,664 | |
| | |
Tencent Music Entertainment Group ADRc | | | 44,700 | | | | 860,028 | |
| | |
RemeGen Co., Ltd. H Sharesb,c,d | | | 56,500 | | | | 692,362 | |
| | |
JD Health International, Inc.b,c,d | | | 31,950 | | | | 618,192 | |
| | |
New Oriental Education & Technology Group, | | | | | | | | |
| | |
Inc. ADRc | | | 2,000 | | | | 371,620 | |
| | |
JW Cayman Therapeutics Co., Ltd.b,c,d | | | 104,000 | | | | 353,488 | |
| | | | | | | | |
Total China/Hong Kong | | | | | | | 31,152,398 | |
| | | | | | | | |
| | | | | | | | |
| | | |
| INDIA: 21.3% | | | | | | | | |
Bandhan Bank, Ltd.b,c,d | | | 578,370 | | | | 3,192,250 | |
| | |
Shriram City Union Finance, Ltd. | | | 192,833 | | | | 2,805,940 | |
| | |
IndusInd Bank, Ltd.c | | | 217,963 | | | | 2,674,729 | |
| | |
Phoenix Mills, Ltd.c | | | 249,708 | | | | 2,649,849 | |
| | |
Mahindra & Mahindra, Ltd. | | | 251,131 | | | | 2,483,486 | |
| | |
Lemon Tree Hotels, Ltd.b,c,d | | | 2,158,440 | | | | 1,192,222 | |
| | |
NBCC India, Ltd. | | | 2,921,513 | | | | 1,167,689 | |
| | |
Marico, Ltd. | | | 191,275 | | | | 1,054,895 | |
| | |
Minda Industries, Ltd. | | | 185,558 | | | | 1,015,624 | |
| | |
TTK Prestige, Ltd. | | | 5,866 | | | | 496,731 | |
| | | | | | | | |
Total India | | | | | | | 18,733,415 | |
| | | | | | | | |
| | | | | | | | |
| | | |
| TAIWAN: 11.7% | | | | | | | | |
Andes Technology Corp. | | | 149,000 | | | | 1,778,226 | |
| | |
Taiwan Semiconductor Manufacturing Co., Ltd. ADR | | | 15,800 | | | | 1,722,832 | |
| | |
Sporton International, Inc. | | | 164,903 | | | | 1,576,653 | |
| | |
Zhen Ding Technology Holding, Ltd. | | | 384,000 | | | | 1,562,631 | |
| | |
M31 Technology Corp. | | | 104,000 | | | | 1,252,896 | |
| | |
Poya International Co., Ltd. | | | 47,000 | | | | 964,441 | |
| | |
Merida Industry Co., Ltd. | | | 88,000 | | | | 739,492 | |
| | |
ASMedia Technology, Inc. | | | 12,000 | | | | 672,311 | |
| | | | | | | | |
Total Taiwan | | | | | | | 10,269,482 | |
| | | | | | | | |
| | | | | | | | |
| | | |
| JAPAN: 5.7% | | | | | | | | |
Koa Corp. | | | 84,400 | | | | 1,208,969 | |
| | |
Nidec Corp. | | | 9,200 | | | | 1,163,873 | |
| | |
UT Group Co., Ltd.c | | | 30,200 | | | | 940,145 | |
| | |
Unicharm Corp. | | | 17,000 | | | | 806,242 | |
| | |
Tsukui Holdings Corp. | | | 105,300 | | | | 559,747 | |
| | |
Sosei Group Corp.c | | | 21,300 | | | | 372,232 | |
| | | | | | | | |
Total Japan | | | | | | | 5,051,208 | |
| | | | | | | | |
| | | | | | | | |
| | | | | | | | |
| | | Shares | | | Value | |
| | |
| UNITED STATES: 3.8% | | | | | | | | |
Legend Biotech Corp. ADRc | | | 62,688 | | | | $1,765,294 | |
| | |
Micron Technology, Inc.c | | | 21,300 | | | | 1,601,334 | |
| | | | | | | | |
Total United States | | | | | | | 3,366,628 | |
| | | | | | | | |
| | | | | | | | |
| | | |
| BANGLADESH: 3.6% | | | | | | | | |
BRAC Bank, Ltd. | | | 3,521,927 | | | | 1,841,864 | |
| | |
GrameenPhone, Ltd. | | | 319,501 | | | | 1,308,541 | |
| | | | | | | | |
Total Bangladesh | | | | | | | 3,150,405 | |
| | | | | | | | |
| | | | | | | | |
| | | |
| SINGAPORE: 2.6% | | | | | | | | |
CDL Hospitality Trusts | | | 1,187,200 | | | | 1,141,103 | |
| | |
SATS, Ltd.c | | | 319,700 | | | | 964,620 | |
| | |
Keppel DC, REIT | | | 80,300 | | | | 170,993 | |
| | | | | | | | |
Total Singapore | | | | | | | 2,276,716 | |
| | | | | | | | |
| | | | | | | | |
| | | |
| THAILAND: 1.3% | | | | | | | | |
Total Access Communication Public Co., Ltd. NVDR | | | 1,009,100 | | | | 1,119,029 | |
| | | | | | | | |
Total Thailand | | | | | | | 1,119,029 | |
| | | | | | | | |
| | | | | | | | |
| | | |
| SOUTH KOREA: 1.1% | | | | | | | | |
Eugene Technology Co., Ltd. | | | 33,266 | | | | 1,023,679 | |
| | | | | | | | |
Total South Korea | | | | | | | 1,023,679 | |
| | | | | | | | |
| | | | | | | | |
| | | |
| VIETNAM: 0.7% | | | | | | | | |
Nam Long Investment Corp. | | | 506,869 | | | | 647,388 | |
| | | | | | | | |
Total Vietnam | | | | | | | 647,388 | |
| | | | | | | | |
| | | | | | | | |
| | | |
| INDONESIA: 0.1% | | | | | | | | |
PT Bank Rakyat Indonesia Persero | | | 302,600 | | | | 89,964 | |
| | | | | | | | |
Total Indonesia | | | | | | | 89,964 | |
| | | | | | | | |
| | | | | | | | |
| | | |
| TOTAL COMMON EQUITIES | | | | | | | 76,880,312 | |
| | | | | | | | |
(Cost $56,389,005) | | | | | | | | |
| | | | | | | | |
| | |
PREFERRED EQUITIES: 11.1% | | | | | | | | |
| | | |
| SOUTH KOREA: 11.1% | | | | | | | | |
LG Chem, Ltd., Pfd. | | | 15,108 | | | | 5,318,540 | |
| | |
Samsung SDI Co., Ltd., Pfd. | | | 15,650 | | | | 4,406,418 | |
| | | | | | | | |
Total South Korea | | | | | | | 9,724,958 | |
| | | | | | | | |
| | | | | | | | |
| | |
| TOTAL PREFERRED EQUITIES | | | | 9,724,958 | |
| | | | | | | | |
(Cost $5,115,280) | | | | | | | | |
| | | | | | | | |
| | |
| TOTAL INVESTMENTS: 98.4% | | | | 86,605,270 | |
(Cost $61,504,285) | | | | | | | | |
| | | | | | | | |
| | |
CASH AND OTHER ASSETS,
LESS LIABILITIES: 1.6% | | | | | | | 1,421,570 | |
| | | | | | | | |
| | |
NET ASSETS: 100.0% | | | | | | | $88,026,840 | |
| | | | | | | | |
Matthews Asia ESG Fund
December 31, 2020
Schedule of Investmentsa (continued)
| a | Certain securities were fair valued under the valuation policies approved by the Board of Trustees (Note 2-A). |
| b | Security exempt from registration under Rule 144A of the Securities Act of 1933, as amended. The security may be resold in transactions exempt from registration normally to qualified institutional buyers. The security has been determined to be liquid in accordance with procedures adopted by the Funds’ Board of Trustees. At December 31, 2020, the aggregate value is $11,225,629, which is 12.75% of net assets. |
| c | Non-income producing security. |
| d | The securities may be resold to qualified foreign investors and foreign institutional buyers under Regulation S of the Securities Act of 1933. |
| ADR | American Depositary Receipt |
| NVDR | Non-voting Depositary Receipt |
| REIT | Real Estate Investment Trust |
See accompanying notes to financial statements.
| | | | |
| matthewsasia.com | 800.789.ASIA | | | 53 | |
| | | | |
| PORTFOLIO MANAGERS |
| |
| Taizo Ishida | | Robert Harvey, CFA |
Lead Manager | | Lead Manager |
|
| FUND FACTS |
| | |
| | | Investor | | Institutional |
Ticker | | MEASX | | MIASX |
CUSIP | | 577125883 | | 577125875 |
Inception | | 4/30/13 | | 4/30/13 |
NAV | | $11.62 | | $11.68 |
Initial Investment | | $2,500 | | $100,000 |
Gross Expense Ratio1 | | 1.75% | | 1.62% |
After Fee Waiver and Reimbursement2 | | 1.40% | | 1.19% |
Portfolio Statistics |
Total # of Positions | | 58 |
Net Assets | | $196.8 million |
Weighted Average Market Cap | | $8.5 billion |
Portfolio Turnover3 | | 29.8% |
Benchmark |
MSCI Emerging Markets Asia Index |
OBJECTIVE
Long-term capital appreciation.
STRATEGY
Under normal market conditions, the Fund seeks to achieve its investment objective by investing at least 80% of its net assets, which include borrowings for investment purposes, in the common and preferred stocks of companies located in Asia excluding Japan, South Korea, Hong Kong and Singapore. The Fund may also invest in the convertible securities, of any duration or quality, of companies located in Asia excluding Japan, South Korea, Hong Kong and Singapore. Under normal market conditions, the Fund is expected to invest a substantial portion of its net assets in the emerging countries and markets in the Asian region, including, but not limited to, Bangladesh, Cambodia, China (including Taiwan, but excluding Hong Kong), India, Indonesia, Laos, Malaysia, Mongolia, Myanmar, Pakistan, Papua New Guinea, Philippines, Sri Lanka, Thailand, and Vietnam.
Matthews Emerging Asia Fund
Portfolio Manager Commentary (unaudited)
For the year ending December 31, 2020, the Matthews Emerging Asia Fund returned –2.16% (Investor Class) and –1.94% (Institutional Class), while its benchmark the MSCI Emerging Markets Asia Index, returned 28.77%. For the fourth quarter, the Fund returned 19.17% (Investor Class) and 19.18% (Institutional Class) versus 18.93% for the Index.
Market Environment:
In 2020, there was a notable divergence in performance between the benchmark and the geographies where the Fund typically invests. The benchmark index is dominated by three markets—China/Hong Kong, South Korea and Taiwan—which collectively made up more than 80% of the index in the reporting period. These markets all had very strong returns. For example, Chinese equites, represented by the MSCI China Index, returned 29.67% for the year ending December 31, 2020, while Korean equities, represented by the Korea Composite Stock Price Index returned 39.76% for the same period. As we have always been focused on the smaller emerging and frontier markets in Asia, Asia’s most undeveloped economies, the Fund has virtually no exposure to the South Korea and Taiwan markets and a large underweight position in China over the number of years. These three giants benefit from global trade and economic trends.
During the year, equity markets among smaller, less developed economies in Asia struggled amid the public health and economic impacts of the pandemic. In economies such as Bangladesh, Pakistan and Sri Lanka, consumer demand remained weak throughout the year and many consumer-oriented companies were struggling. With low levels of momentum in these markets, investors largely remained on the sidelines. Broad equity markets in Pakistan, Thailand, the Philippines and Malaysia were all negative in the year. Towards the end of the year, many of these markets started to rebound. India, in particular, saw a notable upswing in equity prices as sentiment started to slowly improve. As the economic recovery started to broaden, some investors began to look for more value-oriented opportunities, which often favors less developed markets.
In contrast, equity markets in economies representing the more developed end of the spectrum in Asia—such as China, South Korea and Taiwan—generated much stronger performance during the year. Following volatility in the first quarter, these markets quickly regained significant momentum. South Korea and Taiwan have economies that are largely driven by global demand for information technology, which was strong in the year. As global companies increasingly moved their operations online, there was increased demand for key components of the technology supply chain. Sentiment toward North Asian economies was also stronger due to faster economic re-opening.
Performance Contributors and Detractors:
The Fund’s overweight to Sri Lanka, Indonesia and Pakistan detracted from performance during the full year. Sri Lanka’s economy is largely dependent on tourism, which came to a standstill amid the pandemic. While valuations for Sri Lanka
(continued)
| 1 | Actual 2020 expense ratios. |
| 2 | Matthews has contractually agreed (i) to waive fees and reimburse expenses to the extent needed to limit Total Annual Fund Operating Expenses (excluding Rule 12b-1 fees, taxes, interest, brokerage commissions, short sale dividend expenses, expenses incurred in connection with any merger or reorganization or extraordinary expenses such as litigation) of the Institutional Class to 1.20% first by waiving class specific expenses (i.e., shareholder service fees specific to a particular class) of the Institutional Class and then, to the extent necessary, by waiving non-class specific expenses (e.g., custody fees) of the Institutional Class, and (ii) if any Fund-wide expenses (i.e., expenses that apply to both the Institutional Class and the Investor Class) are waived for the Institutional Class to maintain the 1.20% expense limitation, to waive an equal amount (in annual percentage terms) of those same expenses for the Investor Class. Beginning on December 1, 2020 for the Matthews Emerging Asia Fund, Matthews voluntarily reduced this expense limitation to 1.10% for the Institutional Class and waived a corresponding amount (in annual percentage terms) for the Investor Class. The Total Annual Fund Operating Expenses After Fee Waiver and Expense Reimbursement for the Investor Class may vary from year to year and will in some years exceed 1.20%. If the operating expenses fall below the expense limitation in a year within three years after Matthews has made a waiver or reimbursement, the Fund may reimburse Matthews up to an amount that does not cause the expenses for that year to exceed the lesser of (i) the expense limitation applicable at the time of that fee waiver and/or expense reimbursement or (ii) the expense limitation in effect at the time of recoupment. This agreement will remain in place until April 30, 2022 and may be terminated at any time by the Board of Trustees on behalf of the Fund on 60 days’ written notice to Matthews. Matthews may decline to renew this agreement by written notice to the Trust at least 30 days before its annual expiration date. |
| 3 | The lesser of fiscal year 2020 long-term purchase costs or sales proceeds divided by the average monthly market value of long-term securities. |
| | | | | | | | | | | | | | | | | | | | | | | | |
| | | | | |
| PERFORMANCE AS OF DECEMBER 31, 2020 | | | | | | | | | | | | |
| | | | | | | | | Average Annual Total Returns | | | | |
| | | 3 Months | | | 1 Year | | | 3 Years | | | 5 Years | | | Since
Inception | | | Inception
Date | |
| Investor Class (MEASX) | | | 19.17% | | | | -2.16% | | | | -7.24% | | | | 2.43% | | | | 3.29% | | | | 4/30/13 | |
| Institutional Class (MIASX) | | | 19.18% | | | | -1.94% | | | | -7.05% | | | | 2.65% | | | | 3.51% | | | | 4/30/13 | |
| MSCI Emerging Markets Asia Index4 | | | 18.93% | | | | 28.77% | | | | 9.34% | | | | 14.81% | | | | 9.03% | | | | | |
Performance assumes reinvestment of all dividends and/or distributions before taxes. All performance quoted represents past performance and is no guarantee of future results. Investment return and principal value will fluctuate with market conditions so that when redeemed, shares may be worth more or less than their original cost. Current performance may be lower or higher than the return figures quoted. Returns would have been lower if certain of the Fund’s fees and expenses had not been waived. For the Fund’s most recent month-end performance visit matthewsasia.com.
GROWTH OF A HYPOTHETICAL $10,000 INVESTMENT SINCE INCEPTION—INVESTOR CLASS

Plotted monthly. The performance data and graph do not reflect the deduction of taxes that a shareholder would pay on dividends, capital gain distributions or redemption of Fund shares. Values are in US$.
| | 4 | It is not possible to invest directly in an index. Source: Index data from Morgan Stanley Capital International and Bloomberg; total return calculations performed by BNY Mellon Investment Servicing (US) Inc. Please see page 93 for index definition. |
| | | | | | | | |
| | | | |
| TOP TEN HOLDINGS5 | | | | | | | |
| | | Sector | | Country | | % of Net Assets | |
| Mobile World Investment Corp. | | Consumer Discretionary | | Vietnam | | | 3.6% | |
| Bajaj Finance, Ltd. | | Financials | | India | | | 3.6% | |
| Jollibee Foods Corp. | | Consumer Discretionary | | Philippines | | | 3.5% | |
| Military Commercial Joint Stock Bank | | Financials | | Vietnam | | | 3.5% | |
| Vinh Hoan Corp. | | Consumer Staples | | Vietnam | | | 3.5% | |
| British American Tobacco Bangladesh Co., Ltd. | | Consumer Staples | | Bangladesh | | | 3.3% | |
| John Keells Holdings PLC | | Industrials | | Sri Lanka | | | 3.1% | |
| Phu Nhuan Jewelry JSC | | Consumer Discretionary | | Vietnam | | | 3.0% | |
| Meezan Bank, Ltd. | | Financials | | Pakistan | | | 3.0% | |
| PT Bank Mandiri Persero | | Financials | | Indonesia | | | 2.7% | |
| % OF ASSETS IN TOP 10 | | | | | | | 32.8% | |
| | 5 | Holdings may combine more than one security from same issuer and related depositary receipts. |
| | | | |
| matthewsasia.com | 800.789.ASIA | | | 55 | |
Matthews Emerging Asia Fund
Portfolio Manager Commentary (unaudited) (continued)
equities are extremely low, negative sentiment prevented a rebound. The government’s efforts to stimulate the economy are putting pressure on its fiscal position, placing downward pressure on its currency and sentiment more broadly. Turning to Indonesia, which is primarily a domestic economy with low exports, recurring lockdowns throughout the year stifled economic activity. On the other hand, stock selection in China/Hong Kong was positive across the full year. China was one of the few economies to have an active IPO market in the year, as domestic Chinese investor sentiment quickly turned bullish as the pandemic in China became contained. The Fund participated in some of those IPOs, which generated attractive returns.
Among individual securities, Chinese electric vehicle maker XPeng was a contributor. As one of the leading EV (electric vehicle) companies in China, Xpeng competes with local EV makers, as well as Tesla, which now produces cars in China. In our view, China is a natural market for EVs, where electric two-wheelers are already familiar to many consumers. Elsewhere, Indonesia retailer Ramayana Lestari Sentosa was a detractor. When the virus hit Indonesia and the economy moved into lockdown, sentiment turned negative. However, we expect economic activity in Indonesia to gradually recover and normalize and remain constructive on the holding over the long term.
Notable Portfolio Changes:
In the fourth quarter, we added a position to Bajaj Finance, an Indian financial company. Bajaj uses algorithms for its lending activities. The company has extensive borrowing histories and financial data for many of its customers, allowing them to make decisions very quickly for new loan approvals using proprietary data. Looking ahead, the company plans to offer a broader menu of integrated financial services. We also added a Chinese property services business, Shimao Services, with an attractive growth trajectory. Shimao is working to increase value-added services to their existing clients, while expanding to new segments, such as universities and hospitals.
Outlook:
While smaller and less developed economies bore the brunt of the pandemic’s economic pain, we expect that corporate earnings may rebound strongly as daily life begins to normalize over the coming years. From a weak base in 2020, we see room for earnings growth.* In addition, we see strong valuation support among equity prices. Because these economies have been neglected and many investors are underweight to these markets, we expect to see multiple expansion as earnings start to turn around.
Vietnam continues to have a robust macroeconomic story, with a young, educated workforce and continued inflows of foreign direct investment. Fundamentals remain strong in Vietnam. Pakistan’s market has performed better following a difficult period. With Pakistan’s large population, companies in banks and consumer-facing businesses have a large opportunity set for future growth. Indonesia also has a large population and its economy is quickly reopening. We see opportunities for solid returns from Indonesia as the impact of the virus begins to recede.
The bottom line of these emerging economies are demographics. As these economies with large populations become wealthier, consumer spending tends to naturally rise. Well-managed consumer-oriented companies are poised to tap into this growth, creating long-term structural opportunities for investors.
| * | Earnings growth is not representative of the Fund’s future performance. |
| | | | |
| |
| COUNTRY ALLOCATION (%)6,7 | |
| Vietnam | | | 17.4 | |
| Indonesia | | | 12.5 | |
| India | | | 11.6 | |
| China | | | 10.9 | |
| Bangladesh | | | 10.9 | |
| Pakistan | | | 10.8 | |
| Sri Lanka | | | 8.4 | |
| Philippines | | | 8.3 | |
| Thailand | | | 2.5 | |
| Australia | | | 2.2 | |
| Singapore | | | 1.1 | |
| Cash and Other Assets, Less Liabilities | | | 3.4 | |
| | | | |
| |
| SECTOR ALLOCATION (%)7 | |
| Consumer Staples | | | 26.7 | |
| Consumer Discretionary | | | 24.1 | |
| Financials | | | 21.3 | |
| Health Care | | | 5.4 | |
| Industrials | | | 5.3 | |
| Real Estate | | | 4.8 | |
| Materials | | | 3.2 | |
| Energy | | | 3.0 | |
| Information Technology | | | 2.7 | |
| Cash and Other Assets, Less Liabilities | | | 3.4 | |
| | | | |
| |
| MARKET CAP EXPOSURE (%)7 | |
| Mega Cap (over $25B) | | | 8.3 | |
| Large Cap ($10B–$25B) | | | 8.1 | |
| Mid Cap ($3B–10B) | | | 18.1 | |
| Small Cap (under $3B) | | | 62.1 | |
| Cash and Other Assets, Less Liabilities | | | 3.4 | |
| 6 | Not all countries where the Fund may invest are included in the benchmark index. |
| 7 | Source: FactSet Research Systems. Percentage values in data are rounded to the nearest tenth of one percent, so the values may not sum to 100% due to rounding. Country allocations and percentage values may be derived from different data sources and may not be consistent with other Fund literature. |
Matthews Emerging Asia Fund
December 31, 2020
Schedule of Investmentsa
COMMON EQUITIES: 96.6%
| | | | | | | | |
| | | Shares | | | Value | |
| | |
| VIETNAM: 17.4% | | | | | | | | |
Mobile World Investment Corp. | | | 1,360,605 | | | | $7,023,687 | |
| | |
Military Commercial Joint Stock Bankb | | | 6,958,003 | | | | 6,945,922 | |
| | |
Vinh Hoan Corp. | | | 3,803,360 | | | | 6,832,632 | |
| | |
Phu Nhuan Jewelry JSC | | | 1,689,494 | | | | 5,943,345 | |
| | |
Taisun International Holding Corp. | | | 601,000 | | | | 2,611,444 | |
| | |
Nam Long Investment Corp. | | | 1,505,612 | | | | 1,923,013 | |
| | |
Thien Long Group Corp. | | | 1,068,330 | | | | 1,804,751 | |
| | |
FPT Corp. | | | 448,400 | | | | 1,147,230 | |
| | | | | | | | |
Total Vietnam | | | | | | | 34,232,024 | |
| | | | | | | | |
| | | | | | | | |
| | | |
| INDONESIA: 12.5% | | | | | | | | |
PT Bank Mandiri Persero | | | 11,812,400 | | | | 5,330,337 | |
| | |
PT Kino Indonesia | | | 21,306,800 | | | | 4,126,695 | |
| | |
PT Ramayana Lestari Sentosa | | | 61,600,200 | | | | 3,405,688 | |
| | |
PT Mayora Indah | | | 16,785,800 | | | | 3,238,428 | |
| | |
PT Adira Dinamika Multi Finance | | | 4,322,700 | | | | 2,761,075 | |
| | |
PT Indofood CBP Sukses Makmur | | | 3,756,200 | | | | 2,560,884 | |
| | |
PT Gudang Garamb | | | 612,300 | | | | 1,787,271 | |
| | |
PT Hexindo Adiperkasa | | | 6,059,300 | | | | 1,419,707 | |
| | | | | | | | |
Total Indonesia | | | | | | | 24,630,085 | |
| | | | | | | | |
| | | | | | | | |
| | | |
| INDIA: 11.6% | | | | | | | | |
Bajaj Finance, Ltd. | | | 96,436 | | | | 7,001,768 | |
| | |
L&T Finance Holdings, Ltd. | | | 2,906,578 | | | | 3,732,740 | |
| | |
Crompton Greaves Consumer Electricals, Ltd. | | | 673,190 | | | | 3,513,043 | |
| | |
ICICI Prudential Life Insurance Co., Ltd.b,c,d | | | 321,219 | | | | 2,194,996 | |
| | |
Poly Medicure, Ltd. | | | 263,369 | | | | 1,826,820 | |
| | |
Reliance Industries, Ltd. | | | 63,394 | | | | 1,724,883 | |
| | |
Caplin Point Laboratories, Ltd. | | | 219,706 | | | | 1,522,905 | |
| | |
Praj Industries, Ltd. | | | 814,769 | | | | 1,292,029 | |
| | | | | | | | |
Total India | | | | | | | 22,809,184 | |
| | | | | | | | |
| | | | | | | | |
| | | |
| CHINA/HONG KONG: 10.9% | | | | | | | | |
Chindata Group Holdings, Ltd. ADRb | | | 174,100 | | | | 4,171,436 | |
| | |
Shimao Services Holdings, Ltd.b,c,d | | | 2,394,000 | | | | 3,693,315 | |
| | |
Hangzhou Tigermed Consulting Co., Ltd. H Sharesb,c,d | | | 148,000 | | | | 3,432,303 | |
| | |
XPeng, Inc. ADRb | | | 72,000 | | | | 3,083,760 | |
| | |
JD Health International, Inc.b,c,d | | | 148,250 | | | | 2,868,448 | |
| | |
Yatsen Holding, Ltd. ADRb | | | 129,500 | | | | 2,201,500 | |
| | |
KE Holdings, Inc. ADRb | | | 27,453 | | | | 1,689,458 | |
| | |
Everest Medicines, Ltd.b,c,d | | | 43,000 | | | | 375,507 | |
| | | | | | | | |
Total China/Hong Kong | | | | | | | 21,515,727 | |
| | | | | | | | |
| | | | | | | | |
| | | |
| BANGLADESH: 10.9% | | | | | | | | |
British American Tobacco Bangladesh Co., Ltd. | | | 460,292 | | | | 6,413,130 | |
| | |
Berger Paints Bangladesh, Ltd. | | | 261,900 | | | | 4,410,953 | |
| | |
BRAC Bank, Ltd. | | | 6,241,817 | | | | 3,264,287 | |
| | |
Marico Bangladesh, Ltd. | | | 113,074 | | | | 2,853,601 | |
| | |
Square Pharmaceuticals, Ltd. | | | 1,034,797 | | | | 2,680,094 | |
| | |
Olympic Industries, Ltd. | | | 832,242 | | | | 1,876,595 | |
| | | | | | | | |
Total Bangladesh | | | | | | | 21,498,660 | |
| | | | | | | | |
| | | | | | | | |
| | | | | | | | |
| | | Shares | | | Value | |
| | |
| PAKISTAN: 10.8% | | | | | | | | |
Meezan Bank, Ltd. | | | 9,077,666 | | | | $5,932,863 | |
| | |
PAK Suzuki Motor Co., Ltd.b | | | 3,345,900 | | | | 5,074,805 | |
| | |
Indus Motor Co., Ltd. | | | 587,650 | | | | 4,405,389 | |
| | |
GlaxoSmithKline Consumer Healthcare Pakistan, Ltd. | | | 1,257,557 | | | | 2,086,459 | |
| | |
ICI Pakistan, Ltd. | | | 396,900 | | | | 1,887,858 | |
| | |
Hascol Petroleum, Ltd.b | | | 11,199,510 | | | | 1,029,542 | |
| | |
Shifa International Hospitals, Ltd.b | | | 646,751 | | | | 809,410 | |
| | | | | | | | |
Total Pakistan | | | | | | | 21,226,326 | |
| | | | | | | | |
| | | | | | | | |
| | | |
| SRI LANKA: 8.4% | | | | | | | | |
John Keells Holdings PLC | | | 7,438,130 | | | | 6,006,716 | |
| | |
Sampath Bank PLC | | | 6,539,310 | | | | 4,786,669 | |
| | |
Teejay Lanka PLC | | | 15,439,483 | | | | 3,167,073 | |
| | |
Ceylon Cold Stores PLC | | | 370,786 | | | | 1,410,288 | |
| | |
Ceylon Tobacco Co. PLC | | | 214,321 | | | | 1,190,364 | |
| | | | | | | | |
Total Sri Lanka | | | | | | | 16,561,110 | |
| | | | | | | | |
| | | | | | | | |
| | | |
| PHILIPPINES: 8.3% | | | | | | | | |
Jollibee Foods Corp. | | | 1,714,290 | | | | 6,974,405 | |
| | |
Cosco Capital, Inc. | | | 44,191,200 | | | | 5,210,310 | |
| | |
Universal Robina Corp. | | | 1,014,610 | | | | 3,220,203 | |
| | |
STI Education Systems Holdings, Inc. | | | 85,815,000 | | | | 831,196 | |
| | | | | | | | |
Total Philippines | | | | | | | 16,236,114 | |
| | | | | | | | |
| | | | | | | | |
| | | |
| THAILAND: 2.5% | | | | | | | | |
| | |
Thai Beverage Public Co., Ltd. | | | 8,797,000 | | | | 4,897,225 | |
| | | | | | | | |
Total Thailand | | | | | | | 4,897,225 | |
| | | | | | | | |
| | | | | | | | |
| | | |
| AUSTRALIA: 2.2% | | | | | | | | |
| | |
Oil Search, Ltd. | | | 1,491,542 | | | | 4,274,666 | |
| | | | | | | | |
Total Australia | | | | | | | 4,274,666 | |
| | | | | | | | |
| | | | | | | | |
| | | |
| SINGAPORE: 1.1% | | | | | | | | |
| | |
Yoma Strategic Holdings, Ltd.b | | | 9,555,766 | | | | 2,100,765 | |
| | | | | | | | |
Total Singapore | | | | | | | 2,100,765 | |
| | | | | | | | |
| | | | | | | | |
| | | |
| MALAYSIA: 0.0% | | | | | | | | |
| | |
MR DIY Group M BHDc,d | | | 50,000 | | | | 38,782 | |
| | | | | | | | |
Total Malaysia | | | | | | | 38,782 | |
| | | | | | | | |
| | | | | | | | |
| | |
| TOTAL INVESTMENTS: 96.6% | | | | 190,020,668 | |
(Cost $174,705,066) | | | | | | | | |
| | | | | | | | |
| | |
CASH AND OTHER ASSETS,
LESS LIABILITIES: 3.4% | | | | | | | 6,732,507 | |
| | | | | | | | |
| | |
NET ASSETS: 100.0% | | | | | | | $196,753,175 | |
| | | | | | | | |
| a | Certain securities were fair valued under the valuation policies approved by the Board of Trustees (Note 2-A). |
| b | Non-income producing security. |
| | | | |
| matthewsasia.com | 800.789.ASIA | | | 57 | |
Matthews Emerging Asia Fund
December 31, 2020
Schedule of Investmentsa (continued)
| c | Security exempt from registration under Rule 144A of the Securities Act of 1933, as amended. The security may be resold in transactions exempt from registration normally to qualified institutional buyers. The security has been determined to be liquid in accordance with procedures adopted by the Funds’ Board of Trustees. At December 31, 2020, the aggregate value is $12,603,351, which is 6.41% of net assets. |
| d | The securities may be resold to qualified foreign investors and foreign institutional buyers under Regulation S of the Securities Act of 1933. |
| ADR | American Depositary Receipt |
See accompanying notes to financial statements.
| | | | |
| PORTFOLIO MANAGERS |
| |
| Michael J. Oh, CFA | | |
Lead Manager | | | | |
| |
| Raymond Deng* | | |
Co-Manager | | |
| |
* As of August 31, 2020 | | |
| | |
| FUND FACTS | | | | |
| | |
| | | Investor | | Institutional |
Ticker | | MATFX | | MITEX |
CUSIP | | 577130883 | | 577125859 |
Inception | | 12/27/99 | | 4/30/13 |
NAV | | $26.70 | | $26.91 |
Initial Investment | | $2,500 | | $100,000 |
Gross Expense Ratio1 | | 1.10% | | 0.95% |
Portfolio Statistics | | | | |
Total # of Positions | | | | 38 |
Net Assets | | | | $1.7 billion |
Weighted Average Market Cap | | $173.3 billion |
Portfolio Turnover2 | | 119.8% |
Benchmark | | | | |
MSCI AC Asia ex Japan Index |
OBJECTIVE
Long-term capital appreciation.
STRATEGY
Under normal market conditions, the Fund seeks to achieve its investment objective by investing at least 80% of its net assets, which include borrowings for investment purposes, in the common and preferred stocks of companies located in Asia that Matthews believes are innovators in their products, services, processes, business models, management, use of technology, or approach to creating, expanding or servicing their markets. Asia consists of all countries and markets in Asia, including developed, emerging, and frontier countries and markets in the Asian region.
Matthews Asia Innovators Fund
Portfolio Manager Commentary (unaudited)
For the year ending December 31, 2020, the Matthews Asia Innovators Fund returned 86.72% (Investor Class) and 87.01% (Institutional Class), while its benchmark, the MSCI All Country Asia ex Japan Index, returned 25.36% over the same period. For the fourth quarter of the year, the Fund returned 29.06% (Investor Class) and 29.08% (Institutional Class) versus 18.66% for the Index.
Market Environment:
Equities across Asia were volatile in the year, but broad market indexes tracking the region ultimately generated attractive returns. Global markets fell in the first quarter, as worries surrounding the spread of COVID-19 moved from China throughout Europe to the U.S. and then back to South Asia, including India. Fears of a global growth slowdown turned into reality as governments worldwide began to implement different versions of “shelter in place” to contain the movement of the virus. Early in the year, cyclically sensitive sectors like energy, materials, industrials and financials suffered most while companies related to communication services and technology performed better. In the second quarter, most global financial markets, including Asia’s, began to rise as major economies began to relax prior pandemic-related restrictions. The gradual reopening of businesses—especially those focused on services and consumption—helped bolster sentiment and bring a floor to stock prices globally.
In the third quarter, economic recovery and improved sentiment began to take hold as major economies continued to relax COVID-19 lockdown restrictions even further. China’s V-shaped recovery in manufacturing along with a steady recovery in domestic consumption brought some normalcy to daily life. EM currencies rallied slightly against the U.S. dollar in the third quarter, acting as a slight tailwind for EM equities. Growth stocks outpaced value and small caps outperformed large caps in the third quarter. The fourth quarter saw further economic strengthening. Cyclical stocks in beaten-up or export-driven markets such as Indonesia and South Korea rallied most in the fourth quarter, while markets that experienced early recovery like China, Japan and India lagged slightly. Market strength gained momentum following the U.S. Presidential elections in November as markets hoped for less confrontational U.S.—China relations, combined with an announcement of several approved COVID-19 vaccines that were due for distribution early in 2021.
Performance Contributors and Detractors:
From a regional perspective, stock selection in China/Hong Kong was a contributor in the full year. Innovative companies in China continued to benefit from trends accelerated by the pandemic, generating attractive equity price gains. From a sector perspective, stock selection in communication services was also a contributor. Companies that provide digital platforms, video sharing and even online classifieds, for example, made gains across the region. Among individual securities, Sea Ltd was a contributor. As a Singapore-based gaming and e-commerce company, Sea is one of the few Internet companies focused on serving customers in South and Southeast Asia with significant scale and market share in Singapore, Indonesia and Thailand. On the other hand, the Fund’s underweight to South Korea and Taiwan were slight detractors from relative performance, even though stock selection was positive for both. HDFC Bank Ltd, an Indian financials company, was a slight relative detractor. The financial sector overall took longer to recover than other sectors. Financials were weak in the reporting period, but we continue to like the company’s long-term prospects. As one of India’s oldest private sector banks, HDFC is a high-quality bank primarily serving retail customers.
(continued)
| 1 | Actual 2020 expense ratios. |
| 2 | The lesser of fiscal year 2020 long-term purchase costs or sales proceeds divided by the average monthly market value of long-term securities. |
| | | | |
| matthewsasia.com | 800.789.ASIA | | | 59 | |
| | | | | | | | | | | | | | | | | | | | | | | | | | | | |
| |
| PERFORMANCE AS OF DECEMBER 31, 2020 | |
| | | | | | | | | Average Annual Total Returns | | | | | | | |
| | | 3 Months | | | 1 Year | | | 3 Years | | | 5 Years | | | 10 Years | | | Since
Inception | | | Inception
Date | |
| Investor Class (MATFX) | | | 29.06% | | | | 86.72% | | | | 25.35% | | | | 22.31% | | | | 14.87% | | | | 7.05% | | | | 12/27/99 | |
| Institutional Class (MITEX) | | | 29.08% | | | | 87.01% | | | | 25.56% | | | | 22.53% | | | | n.a. | | | | 19.63% | | | | 4/30/13 | |
| MSCI AC Asia ex Japan Index3 | | | 18.66% | | | | 25.36% | | | | 8.46% | | | | 13.90% | | | | 6.80% | | | | 7.27% | 4 | | | | |
Performance assumes reinvestment of all dividends and/or distributions before taxes. All performance quoted represents past performance and is no guarantee of future results. Investment return and principal value will fluctuate with market conditions so that when redeemed, shares may be worth more or less than their original cost. Current performance may be lower or higher than the return figures quoted. For the Fund’s most recent month-end performance, visit matthewsasia.com.
GROWTH OF A HYPOTHETICAL $10,000 INVESTMENT SINCE INCEPTION—INVESTOR CLASS
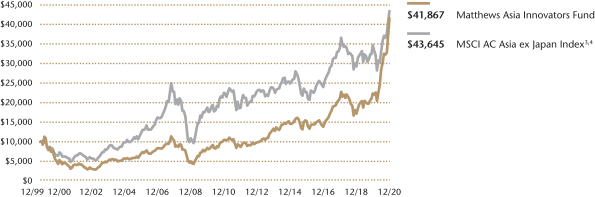
Plotted monthly. The performance data and graph do not reflect the deduction of taxes that a shareholder would pay on dividends, capital gains distributions or redemption of Fund shares. Values are in US$.
| | 3 | It is not possible to invest directly in an index. Source: Index data from Morgan Stanley Capital International and Bloomberg; total return calculations performed by BNY Mellon Investment Servicing (US) Inc. Please see page 93 for index definition. |
| | 4 | Calculated from 12/31/99. |
| | | | | | | | |
| | | | |
| TOP TEN HOLDINGS5 | | | | | | | |
| | | Sector | | Country | | % of Net Assets | |
Bilibili, Inc. | | Communication Services | | China/Hong Kong | | | 7.0% | |
Sea, Ltd. | | Communication Services | | Singapore | | | 5.1% | |
Taiwan Semiconductor Manufacturing Co., Ltd. | | Information Technology | | Taiwan | | | 5.0% | |
Samsung Electronics Co., Ltd. | | Information Technology | | South Korea | | | 4.8% | |
TAL Education Group | | Consumer Discretionary | | China/Hong Kong | | | 4.4% | |
HDFC Bank, Ltd. | | Financials | | India | | | 4.4% | |
Meituan | | Consumer Discretionary | | China/Hong Kong | | | 4.2% | |
Wuxi Biologics Cayman, Inc. | | Health Care | | China/Hong Kong | | | 4.1% | |
Tencent Holdings, Ltd. | | Communication Services | | China/Hong Kong | | | 4.0% | |
Alibaba Group Holding, Ltd. | | Consumer Discretionary | | China/Hong Kong | | | 3.8% | |
| % OF ASSETS IN TOP TEN | | | | | | | 46.8% | |
| | 5 | Holdings may combine more than one security from same issuer and related depositary receipts. |
| | | | |
| | |
| COUNTRY ALLOCATION (%)6,7 | | | |
| China/Hong Kong | | | 62.1 | |
| India | | | 8.7 | |
| South Korea | | | 7.9 | |
| Singapore | | | 5.1 | |
| Taiwan | | | 5.0 | |
| France | | | 3.5 | |
| Indonesia | | | 1.9 | |
| United States | | | 1.9 | |
| Vietnam | | | 0.3 | |
| Cash and Other Assets, Less Liabilities | | | 3.7 | |
| | | | |
| | |
| SECTOR ALLOCATION (%)7 | | | |
| Consumer Discretionary | | | 27.7 | |
| Communication Services | | | 17.1 | |
| Information Technology | | | 15.2 | |
| Financials | | | 12.9 | |
| Health Care | | | 9.5 | |
| Consumer Staples | | | 6.5 | |
| Real Estate | | | 2.9 | |
| Industrials | | | 1.8 | |
| Energy | | | 1.6 | |
| Materials | | | 1.1 | |
| Cash and Other Assets, Less Liabilities | | | 3.7 | |
| | | | |
| | |
| MARKET CAP EXPOSURE (%)7 | | | |
| Mega Cap (over $25B) | | | 78.2 | |
| Large Cap ($10B–$25B) | | | 13.4 | |
| Mid Cap ($3B–10B) | | | 2.6 | |
| Small Cap (under $3B) | | | 2.1 | |
| Cash and Other Assets, Less Liabilities | | | 3.7 | |
| | 6 | Not all countries are included in the benchmark index. |
| | 7 | Source: FactSet Research Systems. Percentage values in data are rounded to the nearest tenth of one percent, so the values may not sum to 100% due to rounding. Country allocations and percentage values may be derived from different data sources and may not be consistent with other Fund literature. |
Matthews Asia Innovators Fund
Portfolio Manager Commentary (unaudited) (continued)
Notable Portfolio Changes:
During the fourth quarter, we rotated capital and also trimmed some positions that we believe have reached their full intrinsic value and rotated into other nascent opportunities in innovative companies across the region. As part of this rotation, we added a handful of positions in China, as well as South and Southeast Asia, where we found what we believe to be better growth opportunities at attractive valuations.
We initiated a position in e-commerce company JD.com, which experienced increased demand for its services during the pandemic. As the second largest e-commerce company in China, JD.com has a broad reach and its profitability is improving. Logistics-oriented businesses tend to be very capital intensive in their early years, but with much of JD.com’s logistic infrastructure already in place, we expect that the business may be less capital intensive going forward. China has many metropolitan densities and the complexity of making deliveries to most households is high, creating a competitive moat for an e-commerce player such as JD.com. The new position in JD.com serves as a complement to existing Fund holding Alibaba, another giant in China’s e-commerce space. As we continue to monitor potential regulatory risks associated with Alibaba, owning JD.com is a way for us to increase and diversify our China e-commerce exposure. We expect China’s strong economic recovery to continue to boost e-commerce sales in the year ahead.
Outlook:
Looking ahead, uncertainty remains in terms of the pace of Asia’s economic recovery. As we don’t yet know how quickly vaccines can be distributed, we can’t forecast how quickly daily patterns may return to normal. The strength of the economic recovery in different markets where we invest may not be immediately evident. Also, valuations for Asia ex-Japan equities are above their historic averages. In some areas of the market, we believe investors have already priced in a high level of anticipated future growth. All of these emphasize the importance of investing with a long-term view.
At the same time, we see many reasons for optimism. Asia is on a path to economic recovery and the sheer size of the consumer base in Asia works in its favor. Valuations for Asia ex-Japan equities rose in 2020, so there is less valuation support for the broader market, but we continue to see pockets of opportunity. Over time, the market will begin to differentiate between companies that can execute well on their vision, and seize market share in an altered business environment. Innovation remains a key driver of growth in Asia. We continue to look for companies that can build deep, competitive moats by differentiating their products and services through creativity, intellectual property and new ways of meeting consumer demand.
| | | | |
| matthewsasia.com | 800.789.ASIA | | | 61 | |
Matthews Asia Innovators Fund
December 31, 2020
Schedule of Investmentsa
COMMON EQUITIES: 96.3%
| | | | | | | | |
| | | Shares | | | Value | |
| | |
| CHINA/HONG KONG: 62.1% | | | | | | | | |
Bilibili, Inc. ADRb | | | 1,401,244 | | | | $120,114,636 | |
| | |
TAL Education Group ADRb | | | 1,071,800 | | | | 76,644,418 | |
| | |
Meituan B Sharesb,c | | | 1,925,100 | | | | 72,467,420 | |
| | |
Wuxi Biologics Cayman, Inc.b,c,d | | | 5,394,000 | | | | 71,531,689 | |
| | |
Tencent Holdings, Ltd. | | | 947,900 | | | | 68,205,005 | |
| | |
Alibaba Group Holding, Ltd.b | | | 2,239,700 | | | | 65,140,623 | |
| | |
AIA Group, Ltd. | | | 4,949,400 | | | | 60,313,994 | |
| | |
Innovent Biologics, Inc.b,c,d | | | 4,882,500 | | | | 51,559,753 | |
| | |
JD.com, Inc. A Sharesb | | | 1,162,550 | | | | 51,201,520 | |
Kingdee International Software Group Co., Ltd. | | | 8,821,000 | | | | 36,012,251 | |
XPeng, Inc. ADRb | | | 812,500 | | | | 34,799,375 | |
China Tourism Group Duty Free Corp., Ltd. A Shares | | | 742,294 | | | | 32,310,983 | |
Leader Harmonious Drive Systems Co., Ltd. A Sharesb | | | 1,410,372 | | | | 31,619,759 | |
Li Ning Co., Ltd. | | | 4,584,500 | | | | 31,546,653 | |
Ming Yuan Cloud Group Holdings, Ltd.b | | | 5,097,000 | | | | 31,390,009 | |
JD Health International, Inc.b,c,d | | | 1,464,150 | | | | 28,329,431 | |
China Resources Mixc Lifestyle Services, Ltd.b,c,d | | | 5,910,600 | | | | 27,408,893 | |
Wuliangye Yibin Co., Ltd. A Shares | | | 588,595 | | | | 26,436,227 | |
Silergy Corp. | | | 301,000 | | | | 25,904,567 | |
China Merchants Bank Co., Ltd. A Shares | | | 3,775,690 | | | | 25,542,384 | |
KE Holdings, Inc. ADRb | | | 366,400 | | | | 22,548,256 | |
Jiangsu Hengrui Medicine Co., Ltd. A Shares | | | 1,306,657 | | | | 22,388,491 | |
Haidilao International Holding, Ltd.c,d | | | 2,572,000 | | | | 19,834,360 | |
Yatsen Holding, Ltd. ADRb | | | 1,128,000 | | | | 19,176,000 | |
| | |
Shenzhen Mindray Bio-Medical Electronics Co., Ltd. A Shares | | | 282,813 | | | | 18,502,124 | |
| | | | | | | | |
Total China/Hong Kong | | | | | | | 1,070,928,821 | |
| | | | | | | | |
| | | | | | | | |
| | | |
| INDIA: 8.7% | | | | | | | | |
HDFC Bank, Ltd.b | | | 3,828,981 | | | | 75,417,473 | |
| | |
Reliance Industries, Ltd. | | | 1,031,157 | | | | 28,056,682 | |
| | |
Bajaj Finance, Ltd. | | | 385,280 | | | | 27,973,381 | |
| | |
Info Edge India, Ltd. | | | 284,032 | | | | 18,528,086 | |
| | | | | | | | |
Total India | | | | | | | 149,975,622 | |
| | | | | | | | |
| | | | | | | | |
| | | |
| SOUTH KOREA: 7.9% | | | | | | | | |
Samsung Electronics Co., Ltd. | | | 1,107,620 | | | | 82,712,100 | |
| | |
LG Household & Health Care, Ltd. | | | 22,664 | | | | 33,826,585 | |
| | |
LG Chem Ltd. | | | 25,530 | | | | 19,413,444 | |
| | | | | | | | |
Total South Korea | | | | | | | 135,952,129 | |
| | | | | | | | |
| | | | | | | | |
| | | |
| SINGAPORE: 5.1% | | | | | | | | |
Sea, Ltd. ADRb | | | 442,200 | | | | 88,019,910 | |
| | | | | | | | |
Total Singapore | | | | | | | 88,019,910 | |
| | | | | | | | |
| | | | | | | | |
| | | |
| TAIWAN: 5.0% | | | | | | | | |
Taiwan Semiconductor Manufacturing Co., Ltd. | | | 4,528,000 | | | | 85,658,316 | |
| | | | | | | | |
Total Taiwan | | | | | | | 85,658,316 | |
| | | | | | | | |
| | | | | | | | |
| | | |
| FRANCE: 3.4% | | | | | | | | |
LVMH Moet Hennessy Louis Vuitton SE | | | 95,486 | | | | 59,774,372 | |
| | | | | | | | |
Total France | | | | | | | 59,774,372 | |
| | | | | | | | |
| | | | | | | | |
| | | | | | | | |
| | | Shares | | | Value | |
| | |
| INDONESIA: 1.9% | | | | | | | | |
PT Bank Rakyat Indonesia Persero | | | 112,030,300 | | | | $33,306,996 | |
| | | | | | | | |
Total Indonesia | | | | | | | 33,306,996 | |
| | | | | | | | |
| | | | | | | | |
| | | |
| UNITED STATES: 1.9% | | | | | | | | |
Estee Lauder Companies, Inc. Class A | | | 123,600 | | | | 32,901,084 | |
| | | | | | | | |
Total United States | | | | | | | 32,901,084 | |
| | | | | | | | |
| | | | | | | | |
| | | |
| VIETNAM: 0.3% | | | | | | | | |
Mobile World Investment Corp.b | | | 1,047,293 | | | | 5,406,314 | |
| | | | | | | | |
Total Vietnam | | | | | | | 5,406,314 | |
| | | | | | | | |
| | | | | | | | |
| | |
| TOTAL INVESTMENTS: 96.3% | | | | 1,661,923,564 | |
(Cost $1,072,224,881) | | | | | | | | |
| | | | | | | | |
| | |
CASH AND OTHER ASSETS,
LESS LIABILITIES: 3.7% | | | | | | | 63,533,421 | |
| | | | | | | | |
| | |
NET ASSETS: 100.0% | | | | | | | $1,725,456,985 | |
| | | | | | | | |
| a | Certain securities were fair valued under the valuation policies approved by the Board of Trustees (Note 2-A). |
| b | Non-income producing security. |
| c | The securities may be resold to qualified foreign investors and foreign institutional buyers under Regulation S of the Securities Act of 1933. |
| d | Security exempt from registration under Rule 144A of the Securities Act of 1933, as amended. The security may be resold in transactions exempt from registration normally to qualified institutional buyers. The security has been determined to be liquid in accordance with procedures adopted by the Funds’ Board of Trustees. At December 31, 2020, the aggregate value is $198,664,126, which is 11.51% of net assets. |
| ADR | American Depositary Receipt |
See accompanying notes to financial statements.
| | | | |
| PORTFOLIO MANAGERS |
| |
| Andrew Mattock, CFA | | |
Lead Manager | | |
| |
| Winnie Chwang | | |
Co-Manager | | |
| | |
| FUND FACTS | | | | |
| | |
| | | Investor | | Institutional |
Ticker | | MCHFX | | MICFX |
CUSIP | | 577130701 | | 577130818 |
Inception | | 2/19/98 | | 10/29/10 |
NAV | | $27.00 | | $26.94 |
Initial Investment | | $2,500 | | $100,000 |
Gross Expense Ratio1 | | 1.09% | | 0.93% |
Portfolio Statistics |
Total # of Positions | | 54 |
Net Assets | | $1.5 billion |
Weighted Average
Market Cap | | $192.7 billion |
Portfolio Turnover2 | | 52.6% |
Benchmarks |
MSCI China Index |
MSCI China All Shares Index |
OBJECTIVE
Long-term capital appreciation.
STRATEGY
Under normal market conditions, the Fund seeks to achieve its investment objective by investing at least 80% of its net assets, which include borrowings for investment purposes, in the common and preferred stocks of companies located in China. China includes its administrative and other districts, such as Hong Kong.
Matthews China Fund
Portfolio Manager Commentary (unaudited)
For the year ending December 31, 2020, the Matthews China Fund returned 43.05% (Investor Class) and 43.23% (Institutional Class), while its benchmark, the MSCI China Index, returned 29.67%. For the fourth quarter, the Fund returned 12.69% (Investor Class) and 12.69% (Institutional Class) versus 11.21% for the Index.
Market Environment:
Chinese equities were stand-out performers among global peers in 2020. Following some early missteps in addressing the pandemic, Chinese authorities shifted gears quickly, acting decisively to limit travel and controlling its borders while working with world health organizations to control the outbreak. In addition, policy actions meant to assist small and medium-size enterprises were implemented including an increase in loan quotas, lowering of borrowing rates, a delay in loan repayments and tax relief. The result was an early 2020 outperformance of Chinese equities. The second quarter of 2020 was lackluster for equity prices, even though anecdotes from our local offices and official economic data implied that recovery was well under way as factory workers reported back to the assembly line, local shops and restaurants accepted walk-in customers and some travel restrictions were lifted.
Chinese equities posted strong returns in the third quarter but most of those gains were registered in the first two weeks of the quarter—reflecting increased tensions between the U.S. and China. Chinese manufacturing data pointed to a continued V-shaped recovery and a bright spot within the data suggested that small, private businesses were beginning to participate in the rebound. In the final quarter of the calendar year, Chinese equity returns were strong again, but lagged other markets in the region. Some growth stocks within the communication services, health care and discretionary sectors took a breather while valued-oriented names within materials, energy and financials outperformed. With the coronavirus pandemic held in check across China, cities, governments, businesses and schools remained open for regular, daily activities. Government micro-reforms in areas such as health care, education and housing continue to support sustainable growth in economic activity.
Performance Contributors and Detractors:
Stock selection in information technology, industrials and financials contributed to performance for the full year. A contributor among individual stocks was e-commerce company JD.com, which experienced increased demand for its services during the pandemic. As the second largest e-commerce company in China, JD.com has a broad reach and its profitability is improving. Logistics-oriented businesses tend to be very capital intensive in their early years, but with much of JD.com’s logistic infrastructure already in place, we expect that the business may be less capital intensive going forward. China has many metropolitan densities and the complexity of making deliveries to most households is high, creating a competitive moat for an e-commerce player such as JD.com.
On the other hand, stock selection in health care and materials, as well as an overweight to real estate, detracted from performance for the full year. A detractor among individual stocks was Sinopharm, China’s largest pharmaceutical distributor and one of the few distributors with a meaningful nationwide presence. The company saw weak results in the first half of 2020 owing to negative economic impact from the COVID-19 outbreak. Hospital visitation during the pandemic fell, which reduced pharmaceutical distribution needs. At the same time, the company
(continued)
| 1 | Actual 2020 expense ratios. |
| 2 | The lesser of fiscal year 2020 long-term purchase costs or sales proceeds divided by the average monthly market value of long-term securities. |
| | | | |
| matthewsasia.com | 800.789.ASIA | | | 63 | |
| | | | | | | | | | | | | | | | | | | | | | | | | | | | |
| |
| PERFORMANCE AS OF DECEMBER 31, 2020 | |
| | | | | | | | | Average Annual Total Returns | | | | |
| | | 3 Months | | | 1 Year | | | 3 Years | | | 5 Years | | | 10 Years | | | Since
Inception | | | Inception
Date | |
| Investor Class (MCHFX) | | | 12.69% | | | | 43.05% | | | | 14.79% | | | | 17.98% | | | | 8.05% | | | | 11.20% | | | | 2/19/98 | |
| Institutional Class (MICFX) | | | 12.69% | | | | 43.23% | | | | 14.98% | | | | 18.18% | | | | 8.23% | | | | 7.91% | | | | 10/29/10 | |
| MSCI China Index3 | | | 11.21% | | | | 29.67% | | | | 9.22% | | | | 15.25% | | | | 7.84% | | | | 5.78% | 4 | | | | |
| MSCI China All Shares Index3 | | | 13.38% | | | | 33.61% | | | | 9.51% | | | | 11.38% | | | | 7.45% | | | | n.a. | 5 | | | | |
Performance assumes reinvestment of all dividends and/or distributions before taxes. All performance quoted represents past performance and is no guarantee of future results. Investment return and principal value will fluctuate with market conditions so that when redeemed, shares may be worth more or less than their original cost. Current performance may be lower or higher than the return figures quoted. For the Fund’s most recent month-end performance, visit matthewsasia.com.
GROWTH OF A HYPOTHETICAL $10,000 INVESTMENT SINCE INCEPTION—INVESTOR CLASS
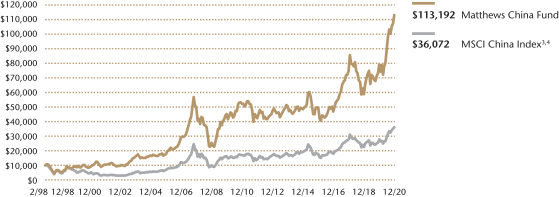
Plotted monthly. The performance data and graph do not reflect the deduction of taxes that a shareholder would pay on dividends, capital gains distributions or redemption of Fund shares. Values are in US$.
| | 3 | It is not possible to invest directly in an index. Source: Index data from Morgan Stanley Capital International and Bloomberg; total return calculations performed by BNY Mellon Investment Servicing (US) Inc. Please see page 93 for index definition. |
| | 4 | Calculated from 2/28/98. |
| | 5 | Index performance data prior to 11/25/08 is not available. |
| | | | | | | | |
| | | | |
| TOP TEN HOLDINGS5 | | | | | | | |
| | | Sector | | | | % of Net Assets | |
Tencent Holdings, Ltd. | | Communication Services | | | | | 10.5% | |
Alibaba Group Holding, Ltd. | | Consumer Discretionary | | | | | 9.3% | |
JD.com, Inc. | | Consumer Discretionary | | | | | 5.8% | |
China Merchants Bank Co., Ltd. | | Financials | | | | | 4.4% | |
Bilibili, Inc. | | Communication Services | | | | | 3.3% | |
AIA Group, Ltd. | | Financials | | | | | 3.1% | |
Meituan | | Consumer Discretionary | | | | | 2.9% | |
China International Capital Corp., Ltd. | | Financials | | | | | 2.7% | |
Midea Group Co., Ltd. | | Consumer Discretionary | | | | | 2.5% | |
New Oriental Education & Technology Group, Inc. | | Consumer Discretionary | | | | | 2.5% | |
% OF ASSETS IN TOP 10 | | | | | | | 47.0% | |
| | 5 | Holdings may combine more than one security from same issuer and related depositary receipts. |
| | | | |
| |
| COUNTRY ALLOCATION (%)6 | |
| China/Hong Kong | | | 99.4 | |
| Cash and Other Assets, Less Liabilities | | | 0.6 | |
| | | | |
| |
| SECTOR ALLOCATION (%)6 | |
| Consumer Discretionary | | | 25.8 | |
| Financials | | | 19.1 | |
| Communication Services | | | 13.8 | |
| Information Technology | | | 12.5 | |
| Health Care | | | 8.6 | |
| Industrials | | | 6.2 | |
| Real Estate | | | 4.6 | |
| Materials | | | 4.2 | |
| Consumer Staples | | | 3.5 | |
| Utilities | | | 1.0 | |
| Cash and Other Assets, Less Liabilities | | | 0.6 | |
| | | | |
| |
| MARKET CAP EXPOSURE (%)6 | |
| Mega Cap (over $25B) | | | 66.1 | |
| Large Cap ($10B–$25B) | | | 16.1 | |
| Mid Cap ($3B–10B) | | | 14.9 | |
| Small Cap (under $3B) | | | 2.3 | |
| Cash and Other Assets, Less Liabilities | | | 0.6 | |
| 6 | Source: FactSet Research Systems. Percentage values in data are rounded to the nearest tenth of one percent, so the values may not sum to 100% due to rounding. Country allocations and percentage values may be derived from different data sources and may not be consistent with other Fund literature. |
Matthews China Fund
Portfolio Manager Commentary (unaudited) (continued)
saw increased operational expenses associated with the prevention and containment of the virus situation. Sinopharm trades at attractive valuations and commands a still large and dominant presence in China’s healthcare distribution industry. We continue to monitor this position for updates and operational improvements.
Notable Portfolio Changes:
During the fourth quarter, we initiated new positions in Kingsoft Corp. and Wuxi Lead Intelligent Equipment Co. Kingsoft is a technology company with three main businesses: online gaming, cloud services and software services. The company’s online gaming business provides a stable and growing source of cash flow. Its cloud services business supports companies with growing data and storage needs, including major clients in the social media and entertainment industries. Kingsoft’s software services business is growing beyond its traditional presence in enterprise operating systems into consumer facing software services where penetration of paying users is currently very low with room to grow. In our view, Kingsoft trades at a deep discount to the sum of the parts valuations for each of the individual businesses. Wuxi Lead Intelligent Equipment is a full-service battery equipment provider with strong ties to China’s largest battery manufacturer, CATL. We believe that on-going growth in electric vehicle (EV) sales will spur capacity growth for batteries. Such increased CapEx (an amount spent by a company to acquire or significantly improve the capacity or capabilities of a long-term asset such as equipment or buildings) investments drives the need for equipment investments. The company also has an opportunity to expand its customer base from mainly Chinese domestic customers to global clients as well.
Outlook:
Going forward, China seems well positioned for continued stability as monetary aggregates have been balanced for several months while China’s rebounding economy and solid mid-teens consensus earnings growth* should support current valuations. The newly released five-year plan could support businesses benefiting from the ‘”dual-circulation” announcement focused on domestic demand and self-sufficiency in key areas of technology, innovation, health care and the digitalization of the economy.
Market participants believe a Biden administration could potentially focus less on trade-related issues, in favor of a multi-lateral approach on topics related to market access, climate change and human rights. Investors expect more predictability and less headline risk associated with U.S.—China relations going forward. On the domestic front, the latest Chinese economic data points to continued recovery led by consumption, manufacturing activity and investment. In addition, analysts expect upside earnings momentum to carry through 2021 driven by robust economic activity.
| * | Earnings growth is not representative of the Fund’s future performance. |
| | | | |
| matthewsasia.com | 800.789.ASIA | | | 65 | |
Matthews China Fund
December 31, 2020
Schedule of Investmentsa
COMMON EQUITIES: 99.4%
| | | | | | | | |
| | | Shares | | | Value | |
| |
| CONSUMER DISCRETIONARY: 25.8% | | | | | |
Internet & Direct Marketing Retail: 18.0% | | | | | |
Alibaba Group Holding, Ltd.b | | | 4,804,000 | | | | $139,722,085 | |
| | |
Meituan B Sharesb,c | | | 1,173,500 | | | | 44,174,597 | |
| | |
JD.com, Inc. A Sharesb | | | 998,780 | | | | 43,988,693 | |
| | |
JD.com, Inc. ADRb | | | 499,389 | | | | 43,896,293 | |
| | | | | | | | |
| | | | | | | 271,781,668 | |
| | | | | | | | |
| | | | | | | | |
Specialty Retail: 2.7% | | | | | | | | |
Zhongsheng Group Holdings, Ltd. | | | 3,595,000 | | | | 25,680,268 | |
| | |
China Yongda Automobiles Services Holdings, Ltd. | | | 9,231,000 | | | | 15,307,162 | |
| | | | | | | | |
| | | | | | | 40,987,430 | |
| | | | | | | | |
| | | | | | | | |
Household Durables: 2.6% | | | | | | | | |
Midea Group Co., Ltd. A Shares | | | 2,537,352 | | | | 38,430,690 | |
| | | | | | | | |
| | | | | | | | |
Diversified Consumer Services: 2.5% | | | | | | | | |
New Oriental Education & Technology Group, Inc. ADRb | | | 206,100 | | | | 38,295,441 | |
| | | | | | | | |
Total Consumer Discretionary | | | | | | | 389,495,229 | |
| | | | | | | | |
| | | | | | | | |
| | | |
| FINANCIALS: 19.1% | | | | | | | | |
Capital Markets: 8.3% | | | | | | | | |
China International Capital Corp., Ltd. H Sharesb,c,d | | | 14,751,200 | | | | 39,994,175 | |
| | |
CITIC Securities Co., Ltd. H Shares | | | 16,021,000 | | | | 36,151,233 | |
| | |
Hong Kong Exchanges & Clearing, Ltd. | | | 506,700 | | | | 27,793,371 | |
| | |
China Merchants Securities Co., Ltd. H Sharesc,d | | | 13,888,800 | | | | 20,802,251 | |
| | | | | | | | |
| | | | | | | 124,741,030 | |
| | | | | | | | |
| | | | | | | | |
Banks: 5.7% | | | | | | | | |
China Merchants Bank Co., Ltd. A Shares | | | 9,730,523 | | | | 65,826,578 | |
| | |
China Construction Bank Corp. H Shares | | | 27,210,660 | | | | 20,524,428 | |
| | | | | | | | |
| | | | | | | 86,351,006 | |
| | | | | | | | |
| | | | | | | | |
Insurance: 5.1% | | | | | | | | |
AIA Group, Ltd. | | | 3,824,000 | | | | 46,599,732 | |
Ping An Insurance Group Co. of China, Ltd. A Shares | | | 2,233,746 | | | | 29,891,312 | |
| | | | | | | | |
| | | | | | | 76,491,044 | |
| | | | | | | | |
Total Financials | | | | | | | 287,583,080 | |
| | | | | | | | |
| | | | | | | | |
| | | |
| COMMUNICATION SERVICES: 13.8% | | | | | | | | |
Interactive Media & Services: 10.5% | | | | | | | | |
Tencent Holdings, Ltd. | | | 2,202,400 | | | | 158,471,045 | |
| | | | | | | | |
| | | | | | | | |
Entertainment: 3.3% | | | | | | | | |
Bilibili, Inc. ADRb | | | 582,600 | | | | 49,940,472 | |
| | | | | | | | |
Total Communication Services | | | | | | | 208,411,517 | |
| | | | | | | | |
| | | | | | | | |
| | |
| INFORMATION TECHNOLOGY: 12.5% | | | | | |
Software: 4.8% | | | | | | | | |
Weimob, Inc.b,c,d | | | 14,247,000 | | | | 25,683,119 | |
| | |
Kingsoft Corp., Ltd. | | | 3,222,000 | | | | 20,832,624 | |
| | |
Thunder Software Technology Co., Ltd. A Shares | | | 881,100 | | | | 15,873,239 | |
| | |
Kingdee International Software Group Co., Ltd. | | | 2,299,000 | | | | 9,385,803 | |
| | | | | | | | |
| | | | | | | 71,774,785 | |
| | | | | | | | |
| | | | | | | | |
| | | | | | | | |
| | | Shares | | | Value | |
Electronic Equipment, Instruments & Components: 4.6% | |
AVIC Jonhon Optronic Technology Co., Ltd. A Shares | | | 2,597,101 | | | | $31,321,069 | |
| | |
Wuxi Lead Intelligent Equipment Co., Ltd. A Shares | | | 1,277,955 | | | | 16,520,971 | |
| | |
Wingtech Technology Co., Ltd. A Shares | | | 938,707 | | | | 14,311,757 | |
| | |
Luxshare Precision Industry Co., Ltd. A Shares | | | 865,562 | | | | 7,481,172 | |
| | | | | | | | |
| | | | | | | 69,634,969 | |
| | | | | | | | |
| | | | | | | | |
Semiconductors & Semiconductor Equipment: 2.3% | | | | | |
NAURA Technology Group Co., Ltd. A Shares | | | 688,241 | | | | 19,134,692 | |
| | |
LONGi Green Energy Technology Co., Ltd. A Shares | | | 1,122,659 | | | | 15,940,847 | |
| | | | | | | | |
| | | | | | | 35,075,539 | |
| | | | | | | | |
| | | | | | | | |
IT Services: 0.8% | | | | | | | | |
Chinasoft International, Ltd. | | | 11,168,000 | | | | 12,481,522 | |
| | | | | | | | |
Total Information Technology | | | | | | | 188,966,815 | |
| | | | | | | | |
| | | | | | | | |
| | | |
| HEALTH CARE: 8.7% | | | | | | | | |
Life Sciences Tools & Services: 4.5% | | | | | | | | |
Pharmaron Beijing Co., Ltd. A Shares | | | 1,602,592 | | | | 29,705,748 | |
| | |
Wuxi Biologics Cayman, Inc.b,c,d | | | 1,485,000 | | | | 19,693,096 | |
| | |
Hangzhou Tigermed Consulting Co., Ltd. A Shares | | | 711,686 | | | | 17,672,903 | |
| | | | | | | | |
| | | | | | | 67,071,747 | |
| | | | | | | | |
| | | | | | | | |
Biotechnology: 1.6% | | | | | | | | |
Innovent Biologics, Inc.b,c,d | | | 1,373,500 | | | | 14,504,315 | |
| | |
Shenzhen New Industries Biomedical Engineering Co., Ltd. A Shares | | | 465,350 | | | | 9,421,393 | |
| | | | | | | | |
| | | | | | | 23,925,708 | |
| | | | | | | | |
| | | | | | | | |
Health Care Equipment & Supplies: 1.4% | | | | | | | | |
Lepu Medical Technology Beijing Co., Ltd. A Shares | | | 3,199,579 | | | | 13,374,899 | |
| | |
China Isotope & Radiation Corp. | | | 2,285,000 | | | | 7,937,197 | |
| | | | | | | | |
| | | | | | | 21,312,096 | |
| | | | | | | | |
| | | | | | | | |
Health Care Providers & Services: 1.0% | | | | | | | | |
Dian Diagnostics Group Co., Ltd. A Shares | | | 2,628,843 | | | | 13,851,502 | |
| | |
Sinopharm Group Co., Ltd. H Shares | | | 611,600 | | | | 1,483,635 | |
| | | | | | | | |
| | | | | | | 15,335,137 | |
| | | | | | | | |
| | | | | | | | |
Pharmaceuticals: 0.2% | | | | | | | | |
Sino Biopharmaceutical, Ltd. | | | 2,955,500 | | | | 2,850,258 | |
| | | | | | | | |
Total Health Care | | | | | | | 130,494,946 | |
| | | | | | | | |
| | | | | | | | |
| | | |
| INDUSTRIALS: 6.2% | | | | | | | | |
Machinery: 3.3% | | | | | | | | |
Estun Automation Co., Ltd. A Sharesb | | | 7,010,125 | | | | 32,178,855 | |
| | |
Weichai Power Co., Ltd. A Shares | | | 7,410,061 | | | | 18,010,411 | |
| | | | | | | | |
| | | | | | | 50,189,266 | |
| | | | | | | | |
| | | | | | | | |
Building Products: 1.9% | | | | | | | | |
Xinyi Glass Holdings, Ltd. | | | 10,058,000 | | | | 28,132,653 | |
| | | | | | | | |
| | | | | | | | |
Electrical Equipment: 1.0% | | | | | | | | |
Sunwoda Electronic Co., Ltd. A Shares | | | 3,291,047 | | | | 15,566,363 | |
| | | | | | | | |
Total Industrials | | | | | | | 93,888,282 | |
| | | | | | | | |
| | | | | | | | |
Matthews China Fund
December 31, 2020
Schedule of Investmentsa (continued)
COMMON EQUITIES (continued)
| | | | | | | | |
| | | Shares | | | Value | |
| | |
| REAL ESTATE: 4.6% | | | | | | | | |
Real Estate Management & Development: 4.6% | | | | | |
China Resources Land, Ltd. | | | 5,350,000 | | | | $22,046,763 | |
| | |
CIFI Holdings Group Co., Ltd. | | | 23,328,000 | | | | 19,768,333 | |
| | |
Times China Holdings, Ltd. | | | 10,717,000 | | | | 14,921,962 | |
| | |
China Overseas Property Holdings, Ltd. | | | 23,630,000 | | | | 12,313,737 | |
| | | | | | | | |
Total Real Estate | | | | | | | 69,050,795 | |
| | | | | | | | |
| | | | | | | | |
| | | |
| MATERIALS: 4.2% | | | | | | | | |
Chemicals: 3.0% | | | | | | | | |
Zhejiang Juhua Co., Ltd. A Shares | | | 14,085,700 | | | | 17,588,567 | |
| | |
Wanhua Chemical Group Co., Ltd. A Shares | | | 1,118,419 | | | | 15,672,423 | |
| | |
Shandong Sinocera Functional Material Co., Ltd. A Shares | | | 1,680,522 | | | | 11,677,591 | |
| | | | | | | | |
| | | | | | | 44,938,581 | |
| | | | | | | | |
| | | | | | | | |
Construction Materials: 1.2% | | | | | | | | |
Anhui Conch Cement Co., Ltd. A Shares | | | 2,361,644 | | | | 18,774,344 | |
| | | | | | | | |
Total Materials | | | | | | | 63,712,925 | |
| | | | | | | | |
| | | | | | | | |
| | | |
| CONSUMER STAPLES: 3.5% | | | | | | | | |
Beverages: 3.5% | | | | | | | | |
Kweichow Moutai Co., Ltd. A Shares | | | 90,823 | | | | 27,913,101 | |
| | |
Wuliangye Yibin Co., Ltd. A Shares | | | 558,477 | | | | 25,083,504 | |
| | | | | | | | |
Total Consumer Staples | | | | | | | 52,996,605 | |
| | | | | | | | |
| | | | | | | | |
| | | |
| UTILITIES: 1.0% | | | | | | | | |
Gas Utilities: 1.0% | | | | | | | | |
ENN Energy Holdings, Ltd. | | | 1,052,400 | | | | 15,448,919 | |
| | | | | | | | |
Total Utilities | | | | | | | 15,448,919 | |
| | | | | | | | |
| | | | | | | | |
| | | |
| TOTAL INVESTMENTS: 99.4% | | | | | | | 1,500,049,113 | |
(Cost $1,061,317,626) | | | | | | | | |
| | | | | | | | |
| | |
CASH AND OTHER ASSETS,
LESS LIABILITIES: 0.6% | | | | | | | 8,822,044 | |
| | | | | | | | |
| | |
NET ASSETS: 100.0% | | | | | | | $1,508,871,157 | |
| | | | | | | | |
| a | Certain securities were fair valued under the valuation policies approved by the Board of Trustees (Note 2-A). |
| b | Non-income producing security. |
| c | The securities may be resold to qualified foreign investors and foreign institutional buyers under Regulation S of the Securities Act of 1933. |
| d | Security exempt from registration under Rule 144A of the Securities Act of 1933, as amended. The security may be resold in transactions exempt from registration normally to qualified institutional buyers. The security has been determined to be liquid in accordance with procedures adopted by the Funds’ Board of Trustees. At December 31, 2020, the aggregate value is $120,676,956, which is 8.00% of net assets. |
| ADR | American Depositary Receipt |
See accompanying notes to financial statements.
| | | | |
| matthewsasia.com | 800.789.ASIA | | | 67 | |
| | | | |
| PORTFOLIO MANAGERS |
| |
| Peeyush Mittal,CFA | | |
Lead Manager | | |
| |
| Sharat Shroff, CFA | | |
Co-Manager | | |
|
| FUND FACTS |
| | |
| | | Investor | | Institutional |
Ticker | | MINDX | | MIDNX |
CUSIP | | 577130859 | | 577130768 |
Inception | | 10/31/05 | | 10/29/10 |
NAV | | $26.29 | | $26.65 |
Initial Investment | | $2,500 | | $100,000 |
Gross Expense Ratio1 | | 1.15% | | 1.03% |
Portfolio Statistics | | | | |
Total # of Positions | | 60 |
Net Assets | | $708 million |
Weighted Average Market Cap | | $46.5 billion |
Portfolio Turnover2 | | 57.4% |
Benchmark | | |
S&P Bombay Stock Exchange 100 Index |
OBJECTIVE
Long-term capital appreciation.
STRATEGY
Under normal market conditions, the Fund seeks to achieve its investment objective by investing at least 80% of its net assets, which include borrowings for investment purposes, in publicly traded common stocks, preferred stocks and convertible securities of companies located in India.
Matthews India Fund
Portfolio Manager Commentary (unaudited)
For the year ending December 31, 2020, the Matthews India Fund returned 16.45% (Investor Class) and 16.65% (Institutional Class), while its benchmark, the S&P Bombay Stock Exchange 100 Index, returned 13.92%. For the fourth quarter, the Fund returned 21.85% (Investor Class) and 21.88% (Institutional Class), while its benchmark returned 24.97%.
Market Environment:
Indian equities suffered large drawdowns early in the year, then rebounded quickly. Markets were down sharply in March amid fears about the pandemic’s economic impact. The government took unprecedented steps to slow the spread of the virus by ordering a nationwide lockdown for 21-days starting on March 25. In addition, the Finance Minister announced significant stimulus early in the year in hopes of aiding low-income households while in lockdown. The Reserve Bank of India took significant steps as well to lower the cost of capital by reducing repurchase agreement (repo) rates and by injecting surplus liquidity to keep the strength of the financial system intact. In the second and third quarters of 2020, Indian shares soared as lockdown restrictions were gradually eased and economic activity started to normalize.
Although its economy has been slow to recover, India’s latest economic data suggests that activity has returned to near pre-pandemic levels. Local sentiment is improving. Economic restrictions in large urban sectors are gradually easing and we are seeing near-normalization of mobility and economic activity. For example, restaurants and bars in Mumbai were allowed to open in early October. Government fiscal accounts are outperforming estimates as tax receipts are coming in higher than expected. In addition, economic output as measured by Purchasing Managers’ Index (PMI) composite data seems well placed in expansionary territory. Rural India has done substantially better in the last 12 months on back of robust rainfall in the last two monsoons, helping to cushion the negative impact of COVID on India as a whole.
Performance Contributors and Detractors:
Stock selection and an overweight to small-cap stocks was a notable contributor to performance in the year. India has a large, rich universe of small companies with low analyst coverage, creating opportunities to generate alpha (the excess return on an investment relative to the return on a benchmark index) via active stock selection. What’s more, as economic recovery began to broaden out, smaller companies began to participate more in the market rally. On the other hand, stock selection and allocation effects among mega-cap stocks was neutral to performance in the year. But we continue to see long-term opportunity among select mega-cap companies, particularly as India continues to move toward a more innovation-based economy, where size and scale are often rewarded in terms of digital platforms and connectivity.
From a sector perspective, stock selection in health care, communication services and industrials contributed to performance, while stock selection in financials, consumer staples and consumer discretionary detracted.
Among individual stocks, Laurus Labs was a contributor. Laurus Labs is one of the lowest cost manufacturer of APIs (active pharmaceutical ingredients) used to formulate drugs, particularly in ARV (antiretroviral) drugs. In the last couple of years, Laurus has integrated into manufacturing and marketing their own formulations, which boosted sales and earnings growth substantially. Stock performance has largely followed the earnings growth* trajectory. Meanwhile, Shriram City Union
(continued)
| * | Earnings growth is not representative of the Fund’s future performance. |
| 1 | Actual 2020 expense ratios. |
| 2 | The lesser of fiscal year 2020 long-term purchase costs or sales proceeds divided by the average monthly market value of long-term securities. |
| | | | | | | | | | | | | | | | | | | | | | | | | | | | |
| |
| PERFORMANCE AS OF DECEMBER 31, 2020 | |
| | | | | | | | | Average Annual Total Returns | | | | |
| | | 3 Months | | | 1 Year | | | 3 Years | | | 5 Years | | | 10 Years | | | Since
Inception | | | Inception
Date | |
Investor Class (MINDX) | | | 21.85% | | | | 16.45% | | | | 1.24% | | | | 6.84% | | | | 6.10% | | | | 10.45% | | | | 10/31/05 | |
Institutional Class (MIDNX) | | | 21.88% | | | | 16.65% | | | | 1.41% | | | | 7.03% | | | | 6.29% | | | | 5.97% | | | | 10/29/10 | |
S&P Bombay Stock Exchange 100 Index3 | | | 24.97% | | | | 13.92% | | | | 5.14% | | | | 11.03% | | | | 4.84% | | | | 10.30% | 4 | | | | |
Performance assumes reinvestment of all dividends and/or distributions before taxes. All performance quoted represents past performance and is no guarantee of future results. Investment return and principal value will fluctuate with market conditions so that when redeemed, shares may be worth more or less than their original cost. Current performance may be lower or higher than the return figures quoted. For the Fund’s most recent month-end performance, visit matthewsasia.com.
GROWTH OF A HYPOTHETICAL $10,000 INVESTMENT SINCE INCEPTION—INVESTOR CLASS
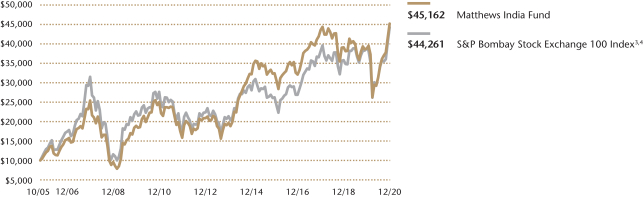
Plotted monthly. The performance data and graph do not reflect the deduction of taxes that a shareholder would pay on dividends, capital gains distributions or redemption of Fund shares. Values are in US$.
| | 3 | It is not possible to invest directly in an index. Source: Index data from S&P BSE 100 Index and Bloomberg; total return calculations performed by BNY Mellon Investment Servicing (US) Inc. Please see page 93 for index definition. |
| | 4 | Calculated from 10/31/05. |
| | | | | | | | |
| | | | |
| TOP TEN HOLDINGS5 | | | | | | | |
| | | Sector | | | | % of Net Assets | |
HDFC Bank, Ltd. | | Financials | | | | | 8.5% | |
Reliance Industries, Ltd. | | Energy | | | | | 7.6% | |
Infosys, Ltd. | | Information Technology | | | | | 5.9% | |
ICICI Bank, Ltd. | | Financials | | | | | 5.2% | |
Housing Development Finance Corp., Ltd. | | Financials | | | | | 4.4% | |
Kotak Mahindra Bank, Ltd. | | Financials | | | | | 4.2% | |
Info Edge India, Ltd. | | Communication Services | | | | | 4.0% | |
Bajaj Finance, Ltd. | | Financials | | | | | 3.6% | |
Tata Consultancy Services, Ltd. | | Information Technology | | | | | 3.4% | |
Bandhan Bank, Ltd. | | Financials | | | | | 3.0% | |
% OF ASSETS IN TOP 10 | | | | | | | 49.8% | |
| | 5 | Holdings may combine more than one security from same issuer and related depositary receipts. |
| | | | |
| matthewsasia.com | 800.789.ASIA | | | 69 | |
Matthews India Fund
Portfolio Manager Commentary (unaudited) (continued)
Finance, a non-banking financial that is dependent on capital markets and on banks for funding, detracted. Shriram was negatively impacted as liquidity in small and micro-cap companies dried up during March and April. We continue to like this name given management continued to improve their financial performance on back of a notable improvement in credit quality. The company is well capitalized, with enough liquidity on the balance sheet, and it is one of the lowest valuation financial service names in the portfolio.
Notable Portfolio Changes:
We made a few changes to the portfolio across different sectors, including health care, consumer discretionary, financials and IT services.
Within consumer discretionary, we added Bosch India Limited, a supplier of fuel ignition systems to commercial and passenger vehicles in India. Bosch’s business is likely to be positively impacted in our view on back of a cyclical upturn expected in the auto segment in the country. Bosch has been undergoing a restructuring, limiting its margins, but we think it is almost complete and thus believe its revenue growth may lead to substantially higher growth in earnings.
Within consumer discretionary, we recently participated in the IPO of Burger King India. Quick Service Restaurants (QSR) have been gaining share away from small mom-and-pop restaurants over the years and we expect that trend to only accelerate further post pandemic. Burger King India has a very credible management team with extensive global experience in the QSR segment that we think will help it grow faster than their peers both on revenue and earnings.
We exited Syngene, a Contract Research Organization (CRO), which we held in the portfolio for over two years. While we believe there is substantial opportunity for growth for many years to come, its stock outperformed sharply during the last 12 months and became excessively overpriced. As we do not think the company’s revenue growth will change substantially, we exited our position as we deemed the risk reward was adverse to continue to remain invested.
Outlook:
Entering into 2021, India’s financial system is seeing signs of reopening with loan growth rebounding and credit quality improving. The stronger current account and overall balance of payments bodes well for the Indian rupee and a potential tailwind for foreign investors. Equity valuations are at or slightly above historical averages; however, we believe that current valuations may not fairly incorporate a lower cost of capital making seemingly high valuations actually much more reasonable. In our view, India is sitting at the cusp of an earnings recovery. The overwhelming majority of companies are delivering earnings in excess of expectations; too many companies to count have taken prudent cost-cutting measures to shore up margins.
India’s central government is taking substantial steps to create more manufacturing jobs in the country. It is offering financial incentives to global corporates for setting up factories in the country, as well as changing its legal framework that governs labor laws in the country to make it much easier to do business in India. Corporates across different sectors are also reporting heightened interest in procuring raw materials and finished products from India as part of an increasing wave of China-plus-India supply chain strategy being considered by corporates globally. We believe the change in external environment combined with steps taken by the government has the potential to create positive surprise on India’s economic growth over the next 24-36 months.
| | | | |
| |
| COUNTRY ALLOCATION (%)6 | |
| India | | | 101.3 | |
| Japan | | | 1.0 | |
| Liabilities in Excess of Cash and Other Assets | | | -2.3 | |
| | | | |
| |
| SECTOR ALLOCATION (%)6 | |
| Financials | | | 38.0 | |
| Information Technology | | | 16.4 | |
| Consumer Staples | | | 11.9 | |
| Consumer Discretionary | | | 8.3 | |
| Energy | | | 7.6 | |
| Health Care | | | 6.4 | |
| Communication Services | | | 6.3 | |
| Materials | | | 3.7 | |
| Industrials | | | 3.7 | |
| Liabilities in Excess of Cash and Other Assets | | | -2.3 | |
| | | | |
| |
| MARKET CAP EXPOSURE (%)6 | |
| Mega Cap (over $25B) | | | 50.8 | |
| Large Cap ($10B–$25B) | | | 9.6 | |
| Mid Cap ($3B–10B) | | | 21.2 | |
| Small Cap (under $3B) | | | 20.7 | |
| Liabilities in Excess of Cash and Other Assets | | | -2.3 | |
| 6 | Source: FactSet Research Systems. Percentage values in data are rounded to the nearest tenth of one percent, so the values may not sum to 100% due to rounding. Country allocations and percentage values may be derived from different data sources and may not be consistent with other Fund literature. |
Matthews India Fund
December 31, 2020
Schedule of Investmentsa
COMMON EQUITIES: 102.3%
| | | | | | | | |
| | | Shares | | | Value | |
| | |
| FINANCIALS: 38.0% | | | | | | | | |
Banks: 24.1% | | | | | | | | |
HDFC Bank, Ltd.b | | | 3,039,887 | | | | $59,875,094 | |
| | |
ICICI Bank, Ltd.b | | | 4,981,084 | | | | 36,627,836 | |
| | |
Kotak Mahindra Bank, Ltd.b | | | 1,096,143 | | | | 29,958,314 | |
| | |
Bandhan Bank, Ltd.b,c,d | | | 3,785,081 | | | | 20,891,339 | |
| | |
Axis Bank, Ltd.b | | | 1,677,122 | | | | 14,275,541 | |
| | |
DCB Bank, Ltd.b | | | 5,440,926 | | | | 8,897,343 | |
| | | | | | | | |
| | | | | | | 170,525,467 | |
| | | | | | | | |
| | | | | | | | |
Consumer Finance: 6.9% | | | | | | | | |
Bajaj Finance, Ltd. | | | 349,067 | | | | 25,344,124 | |
| | |
Shriram City Union Finance, Ltd. | | | 1,120,472 | | | | 16,304,148 | |
| | |
Mahindra & Mahindra Financial Services, Ltd.b | | | 3,020,632 | | | | 7,239,000 | |
| | | | | | | | |
| | | | | | | 48,887,272 | |
| | | | | | | | |
| | | | | | | | |
Thrifts & Mortgage Finance: 5.4% | | | | | | | | |
Housing Development Finance Corp., Ltd. | | | 881,231 | | | | 30,874,767 | |
| | |
LIC Housing Finance, Ltd. | | | 881,598 | | | | 4,366,567 | |
| | |
Aavas Financiers, Ltd.b | | | 117,904 | | | | 2,741,700 | |
| | | | | | | | |
| | | | | | | 37,983,034 | |
| | | | | | | | |
| | | | | | | | |
Capital Markets: 0.8% | | | | | | | | |
Multi Commodity Exchange of India, Ltd. | | | 249,386 | | | | 5,910,378 | |
| | | | | | | | |
| | | | | | | | |
Insurance: 0.8% | | | | | | | | |
HDFC Life Insurance Co., Ltd.b,c,d | | | 588,556 | | | | 5,463,560 | |
| | | | | | | | |
Total Financials | | | | | | | 268,769,711 | |
| | | | | | | | |
| | | | | | | | |
| | | |
| INFORMATION TECHNOLOGY: 16.4% | | | | | | | | |
IT Services: 15.6% | | | | | | | | |
Infosys, Ltd. | | | 2,417,874 | | | | 41,449,088 | |
| | |
Tata Consultancy Services, Ltd. | | | 611,588 | | | | 24,014,084 | |
| | |
Tech Mahindra, Ltd. | | | 937,912 | | | | 12,535,661 | |
| | |
Mindtree, Ltd. | | | 413,965 | | | | 9,426,901 | |
| | |
Larsen & Toubro Infotech, Ltd.c,d | | | 179,838 | | | | 9,019,350 | |
| | |
Wipro, Ltd. | | | 1,633,722 | | | | 8,653,718 | |
| | |
HCL Technologies, Ltd. | | | 346,047 | | | | 4,491,312 | |
| | |
Mphasis, Ltd. | | | 48,733 | | | | 1,028,950 | |
| | | | | | | | |
| | | | | | | 110,619,064 | |
| | | | | | | | |
| | | | | | | | |
Software: 0.8% | | | | | | | | |
Birlasoft, Ltd. | | | 1,523,334 | | | | 5,165,521 | |
| | | | | | | | |
Total Information Technology | | | | | | | 115,784,585 | |
| | | | | | | | |
| | | | | | | | |
| | | |
| CONSUMER STAPLES: 11.9% | | | | | | | | |
Food Products: 3.2% | | | | | | | | |
Zydus Wellness, Ltd. | | | 733,686 | | | | 20,010,604 | |
| | |
Britannia Industries, Ltd. | | | 61,251 | | | | 3,003,523 | |
| | | | | | | | |
| | | | | | | 23,014,127 | |
| | | | | | | | |
| | | | | | | | |
Tobacco: 2.5% | | | | | | | | |
VST Industries, Ltd. | | | 345,776 | | | | 17,558,700 | |
| | | | | | | | |
| | | | | | | | |
Food & Staples Retailing: 2.2% | | | | | | | | |
Avenue Supermarts, Ltd.b,c,d | | | 411,370 | | | | 15,585,232 | |
| | | | | | | | |
| | | | | | | | |
Personal Products: 2.2% | | | | | | | | |
| | |
Dabur India, Ltd. | | | 1,267,254 | | | | 9,274,797 | |
| | |
Marico, Ltd. | | | 1,129,181 | | | | 6,227,509 | |
| | | | | | | | |
| | | | | | | 15,502,306 | |
| | | | | | | | |
| | | | | | | | |
| | | | | | | | |
| | | Shares | | | Value | |
Household Products: 1.8% | | | | | | | | |
Hindustan Unilever, Ltd. | | | 385,463 | | | | $12,654,383 | |
| | | | | | | | |
Total Consumer Staples | | | | | | | 84,314,748 | |
| | | | | | | | |
| | | | | | | | |
| | | |
| CONSUMER DISCRETIONARY: 8.3% | | | | | | | | |
Automobiles: 3.3% | | | | | | | | |
Eicher Motors, Ltd. | | | 276,447 | | | | 9,590,011 | |
| | |
Hero MotoCorp, Ltd. | | | 166,274 | | | | 7,085,980 | |
| | |
Suzuki Motor Corp. | | | 145,500 | | | | 6,744,729 | |
| | | | | | | | |
| | | | | | | 23,420,720 | |
| | | | | | | | |
| | | | | | | | |
Household Durables: 2.4% | | | | | | | | |
| | |
Crompton Greaves Consumer Electricals, Ltd. | | | 2,075,559 | | | | 10,831,308 | |
| | |
Whirlpool of India, Ltd. | | | 177,005 | | | | 6,376,629 | |
| | | | | | | | |
| | | | | | | 17,207,937 | |
| | | | | | | | |
| | | | | | | | |
Multiline Retail: 1.0% | | | | | | | | |
Trent, Ltd. | | | 752,915 | | | | 7,101,939 | |
| | | | | | | | |
| | | | | | | | |
Hotels, Restaurants & Leisure: 0.8% | | | | | | | | |
Burger King India, Ltd.b | | | 2,333,250 | | | | 5,604,207 | |
| | | | | | | | |
| | | | | | | | |
Auto Components: 0.8% | |
Bosch, Ltd. | | | 30,904 | | | | 5,417,309 | |
| | | | | | | | |
| | | | | | | | |
Textiles, Apparel & Luxury Goods: 0.0% | |
Vaibhav Global, Ltd. | | | 8,331 | | | | 279,572 | |
| | | | | | | | |
Total Consumer Discretionary | | | | | | | 59,031,684 | |
| | | | | | | | |
| | | | | | | | |
| | | |
| ENERGY: 7.6% | | | | | | | | |
Oil, Gas & Consumable Fuels: 7.6% | | | | | | | | |
Reliance Industries, Ltd. | | | 1,905,779 | | | | 51,854,214 | |
| | |
Reliance Industries, Ltd. - partially paid | | | 141,310 | | | | 2,170,741 | |
| | | | | | | | |
Total Energy | | | | | | | 54,024,955 | |
| | | | | | | | |
| | | | | | | | |
| | | |
| HEALTH CARE: 6.4% | | | | | | | | |
Pharmaceuticals: 3.6% | | | | | | | | |
Laurus Labs, Ltd.c,d | | | 2,034,941 | | | | 9,851,950 | |
| | |
Lupin, Ltd. | | | 331,368 | | | | 4,434,185 | |
| | |
Neuland Laboratories, Ltd. | | | 282,302 | | | | 4,237,218 | |
| | |
Alembic Pharmaceuticals, Ltd. | | | 286,853 | | | | 4,055,505 | |
| | |
Caplin Point Laboratories, Ltd. | | | 473,148 | | | | 3,279,654 | |
| | | | | | | | |
| | | | | | | 25,858,512 | |
| | | | | | | | |
| | | | | | | | |
Health Care Equipment & Supplies: 1.0% | | | | | | | | |
Poly Medicure, Ltd. | | | 992,068 | | | | 6,881,332 | |
| | | | | | | | |
| | | | | | | | |
Life Sciences Tools & Services: 0.9% | | | | | | | | |
Divi’s Laboratories, Ltd. | | | 119,445 | | | | 6,281,879 | |
| | | | | | | | |
| | | | | | | | |
Health Care Providers & Services: 0.9% | | | | | | | | |
Metropolis Healthcare, Ltd.c,d | | | 233,464 | | | | 6,265,948 | |
| | | | | | | | |
Total Health Care | | | | | | | 45,287,671 | |
| | | | | | | | |
| | | | | | | | |
| | | |
| COMMUNICATION SERVICES: 6.3% | | | | | | | | |
Interactive Media & Services: 4.0% | | | | | | | | |
Info Edge India, Ltd. | | | 434,782 | | | | 28,361,869 | |
| | | | | | | | |
| | | | | | | | |
Wireless Telecommunication Services: 1.1% | | | | | | | | |
Bharti Airtel, Ltd. | | | 1,137,528 | | | | 7,944,052 | |
| | | | | | | | |
| | | | | | | | |
Entertainment: 0.8% | | | | | | | | |
PVR, Ltd. | | | 300,355 | | | | 5,441,686 | |
| | | | | | | | |
| | | | | | | | |
| | | | |
| matthewsasia.com | 800.789.ASIA | | | 71 | |
Matthews India Fund
December 31, 2020
Schedule of Investmentsa (continued)
COMMON EQUITIES (continued)
| | | | | | | | |
| | | Shares | | | Value | |
Media: 0.4% | |
Affle India, Ltd.b | | | 54,552 | | | | $2,830,454 | |
| | | | | | | | |
Total Communication Services | | | | | | | 44,578,061 | |
| | | | | | | | |
| | | | | | | | |
| | | |
| MATERIALS: 3.7% | | | | | | | | |
Chemicals: 3.7% | | | | | | | | |
Asian Paints, Ltd. | | | 252,496 | | | | 9,564,123 | |
| | |
Pidilite Industries, Ltd. | | | 389,392 | | | | 9,420,375 | |
| | |
PI Industries, Ltd. | | | 249,775 | | | | 7,510,621 | |
| | | | | | | | |
Total Materials | | | | | | | 26,495,119 | |
| | | | | | | | |
| | | | | | | | |
| | | |
| INDUSTRIALS: 3.7% | | | | | | | | |
Machinery: 3.2% | | | | | | | | |
Ashok Leyland, Ltd. | | | 9,936,652 | | | | 13,003,805 | |
| | |
AIA Engineering, Ltd. | | | 256,866 | | | | 6,937,372 | |
| | |
Carborundum Universal, Ltd. | | | 433,720 | | | | 2,412,503 | |
| | | | | | | | |
| | | | | | | 22,353,680 | |
| | | | | | | | |
| | | | | | | | |
Electrical Equipment: 0.5% | | | | | | | | |
ABB India, Ltd. | | | 211,441 | | | | 3,512,524 | |
| | | | | | | | |
Total Industrials | | | | | | | 25,866,204 | |
| | | | | | | | |
| | | | | | | | |
| | | |
| TOTAL INVESTMENTS: 102.3% | | | | | | | 724,152,738 | |
(Cost $529,772,817) | | | | | | | | |
| | | | | | | | |
| | |
LIABILITIES IN EXCESS OF CASH
AND OTHER ASSETS: (2.3%) | | | | | | | (16,191,458 | ) |
| | | | | | | | |
| | |
NET ASSETS: 100.0% | | | | | | | $707,961,280 | |
| | | | | | | | |
| a | Certain securities were fair valued under the valuation policies approved by the Board of Trustees (Note 2-A). |
| b | Non-income producing security. |
| c | Security exempt from registration under Rule 144A of the Securities Act of 1933, as amended. The security may be resold in transactions exempt from registration normally to qualified institutional buyers. The security has been determined to be liquid in accordance with procedures adopted by the Funds’ Board of Trustees. At December 31, 2020, the aggregate value is $67,077,379, which is 9.47% of net assets. |
| d | The securities may be resold to qualified foreign investors and foreign institutional buyers under Regulation S of the Securities Act of 1933. |
See accompanying notes to financial statements.
| | | | |
PORTFOLIO MANAGERS |
| | |
| Taizo Ishida | | | | |
Lead Manager | | | | |
| | |
| Shuntaro Takeuchi | | | | |
Co-Manager | | | | |
|
| FUND FACTS |
| | |
| | | Investor | | Institutional |
Ticker | | MJFOX | | MIJFX |
CUSIP | | 577130800 | | 577130792 |
Inception | | 12/31/98 | | 10/29/10 |
NAV | | $25.27 | | $25.32 |
Initial Investment | | $2,500 | | $100,000 |
Gross Expense Ratio1 | | 0.95% | | 0.91% |
Portfolio Statistics | | | | |
Total # of Positions | | 49 |
Net Assets | | $1.7 billion |
Weighted Average Market Cap | | $43.5 billion |
Portfolio Turnover2 | | 62.0% |
Benchmark |
MSCI Japan Index |
OBJECTIVE
Long-term capital appreciation.
STRATEGY
Under normal market conditions, the Fund seeks to achieve its investment objective by investing at least 80% of its net assets, which include borrowings for investment purposes, in the common and preferred stocks of companies located in Japan.
Matthews Japan Fund
Portfolio Manager Commentary (unaudited)
For the year ending December 31, 2020, the Matthews Japan Fund returned 29.82% (Investor Class) and 29.85% (Institutional Class), while its benchmark, the MSCI Japan Index, returned 14.91%. For the fourth quarter of the year, the Fund returned 15.87% (Investor Class) and 15.87% (Institutional Class), versus 15.29% for the Index.
Market Environment:
Japan’s equity markets were volatile but resilient in 2020. Equity prices declined sharply in February and March, triggered by the COVID-19 pandemic, but had rebounded strongly by year end. Swift monetary expansion actions by the major central banks, along with large-scale fiscal policy measures to offset the negative economic impact, improved sentiment toward growth-oriented stocks globally, including Japan. The Bank of Japan announced an option to double exchange-traded fund (ETF) purchases, while the Japanese government passed a significant stimulus package to help bolster the economy.
Against this backdrop, Japanese equities handily outperformed their EAFE counterparts in 2020. We believe this was driven by Japanese corporates’ ample cash balance, which helped to cushion against extreme situations during the COVID outbreak. Equity prices were also bolstered by an incremental improvement in the outlook for corporate profits and economic conditions. Ample liquidity provided by the central banks around the world also benefited the Japanese equity market, as this liquidity lead to improvements in the global manufacturing cycle.
At current levels, we view the recovery scenario has somewhat been reflected in share prices. Going forward, it will be a tug of war between the trajectory of the COVID-19 situation and the pace of vaccine distribution, which will influence the pace and the magnitude of economic recovery.
Performance Contributors and Detractors:
From a sector perspective, stock selection in industrials, health care and information technology contributed to Fund performance over the course of the year. On the other hand, stock selection in consumer staples, real estate and financials was a slight detractor, even though these sectors in aggregate were contributors due to allocation effects. From a market-cap perspective, stock selection contributed across all capitalizations—mega, large, mid and small.
Turning to individual securities, photomask inspection equipment maker Lasertec was the largest contributor to the overall performance for the full year. Lasertec is currently the only provider of mask and mask-blank inspection equipment using EUV (extreme ultraviolet lithography) as a light source, and EUV adoption in major foundries and increased usage in memory makers is likely to further enhance the business opportunity of the company. However, we exited the name during the year, as we viewed the market is starting to build lofty expectations to justify the share price momentum.
Medical platformer M3 was also a major contributor to performance with its Japan platform now covering 90% of all doctors. The company is utilizing the platform to expand and disrupt the areas of contract research organizations and career business recruitment and networking, in Japan and other markets. Overseas is a meaningful part of overall revenue, with China being the largest growth driver.
On the other hand, engineer-staffing company Technopro dragged within our portfolio companies. We see long-term trend of labor tightness and trend of outsourcing
(continued)
| 1 | Actual 2020 expense ratios. |
| 2 | The lesser of fiscal year 2020 long-term purchase costs or sales proceeds divided by the average monthly market value of long-term securities. |
| | | | |
| matthewsasia.com | 800.789.ASIA | | | 73 | |
| | | | | | | | | | | | | | | | | | | | | | | | | | | | |
| | |
| PERFORMANCE AS OF DECEMBER 31, 2020 | | | | |
| | | | | | | | | Average Annual Total Returns | | | | |
| | | 3 Months | | | 1 Year | | | 3 Years | | | 5 Years | | | 10 Years | | | Since
Inception | | | Inception
Date | |
| Investor Class (MJFOX) | | | 15.87% | | | | 29.82% | | | | 9.32% | | | | 11.80% | | | | 10.66% | | | | 7.19% | | | | 12/31/98 | |
| Institutional Class (MIJFX) | | | 15.87% | | | | 29.85% | | | | 9.38% | | | | 11.87% | | | | 10.76% | | | | 11.73% | | | | 10/29/10 | |
| MSCI Japan Index3 | | | 15.29% | | | | 14.91% | | | | 6.45% | | | | 9.04% | | | | 6.80% | | | | 4.29% | 4 | | | | |
Performance assumes reinvestment of all dividends and/or distributions before taxes. All performance quoted represents past performance and is no guarantee of future results. Investment return and principal value will fluctuate with market conditions so that when redeemed, shares may be worth more or less than their original cost. Current performance may be lower or higher than the return figures quoted. For the Fund’s most recent month-end performance, visit matthewsasia.com.
GROWTH OF A HYPOTHETICAL $10,000 INVESTMENT SINCE INCEPTION—INVESTOR CLASS
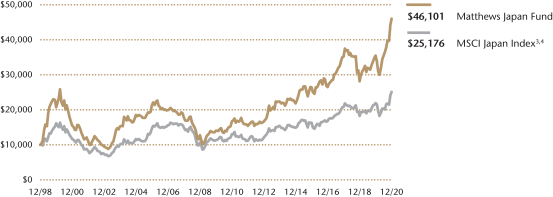
Plotted monthly. The performance data and graph do not reflect the deduction of taxes that a shareholder would pay on dividends, capital gains distributions or redemption of Fund shares. Values are in US$.
| | 3 | It is not possible to invest directly in an index. Source: Index data from Morgan Stanley Capital International and Bloomberg; total return calculations performed by BNY Mellon Investment Servicing (US) Inc. Please see page 93 for index definitions. |
| | 4 | Calculated from 12/31/98. |
| | | | | | | | | | |
| | | | |
| TOP TEN HOLDINGS5 | | | | | | | | |
| | | Sector | | | | | % of Net Assets | |
| Shin-Etsu Chemical Co., Ltd. | | Materials | | | | | | | 5.3% | |
| Sony Corp. | | Consumer Discretionary | | | | | | | 4.8% | |
| TDK Corp. | | Information Technology | | | | | | | 3.9% | |
| SMC Corp. | | Industrials | | | | | | | 3.6% | |
| M3, Inc. | | Health Care | | | | | | | 3.0% | |
| Keyence Corp. | | Information Technology | | | | | | | 3.0% | |
| Hoya Corp. | | Health Care | | | | | | | 2.8% | |
| SoftBank Group Corp. | | Communication Services | | | | | | | 2.8% | |
| Recruit Holdings Co., Ltd. | | Industrials | | | | | | | 2.7% | |
| PeptiDream, Inc. | | Health Care | | | | | | | 2.7% | |
| % OF ASSETS IN TOP 10 | | | | | | | | | 34.6% | |
| | 5 | Holdings may combine more than one security from same issuer and related depositary receipts. |
| | | | |
| |
| COUNTRY ALLOCATION (%)6 | |
| Japan | | | 98.8 | |
| Cash and Other Assets, Less Liabilities | | | 1.2 | |
| | | | |
| | |
| SECTOR ALLOCATION (%)6 | | | |
| Information Technology | | | 22.3 | |
| Industrials | | | 19.7 | |
| Consumer Discretionary | | | 16.8 | |
| Health Care | | | 16.8 | |
| Financials | | | 8.5 | |
| Communication Services | | | 7.7 | |
| Materials | | | 7.0 | |
| Cash and Other Assets, Less Liabilities | | | 1.2 | |
| | | | |
| | |
| MARKET CAP EXPOSURE (%)6 | | | |
| Mega Cap (over $25B) | | | 49.3 | |
| Large Cap ($10B-$25B) | | | 27.7 | |
| Mid Cap ($3B-10B) | | | 13.9 | |
| Small Cap (under $3B) | | | 7.9 | |
| Cash and Other Assets, Less Liabilities | | | 1.2 | |
| 6 | Source: FactSet Research Systems. Percentage values in data are rounded to the nearest tenth of one percent, so the values may not sum to 100% due to rounding. Country allocations and percentage values may be derived from different data sources and may not be consistent with other Fund literature. |
Matthews Japan Fund
Portfolio Manager Commentary (unaudited) (continued)
in IT engineering remain intact. However, the slowdown of the economy in Japan and other economies overseas may impact the staffing industry both in terms of demand and pricing for staffing services. We exited the stock during the year.
Notable Portfolio Changes:
Our portfolio actions in 2020 occurred in two phases. During the first three months of the year, we reduced the number of names in the Fund and shifted to high-quality names that we believed could generate positive cash flow regardless of the macro economic situation. Later in the year, during July and August, we started to increase our exposure to cyclical growth companies as economic activity started to improve.
In the fourth quarter, we initiated a new position in medical equipment manufacturer Olympus. Olympus had previously struggled with governance issues, including past accounting issues and several large-scaled recalls. However, under new management along with much stronger board oversight, we are seeing some positive changes, especially over the past year, in fundamentals and ESG measures.
We have also participated in a few IPOs, including musical instrument manufacturer Roland and application development platform Yappli. Roland has strong brand equity in its digital musical instruments, with a strong following of “Roland sound” by many professional and amateur music enthusiasts. We also believe with the current capable management, there are company specific margin improvement opportunities in product average selling price growth and reducing stock keeping units (SKUs). Yappli is one of the leading no-code mobile app development companies based in Japan, benefitting from e-commerce growth in Japan.
Outlook:
In terms of market leadership, 2020 turned out to be another great year for growth equity investing. In a recessionary environment coupled with lower interest rates and ample money supply, high-quality, stable growth, large cap, innovation sectors outperformed strongly against value, small cap, cyclical and lower-quality names. We think 2021 will not be such a one-way street like 2020. With profit recovery already baked in current consensus estimates and valuation levels, upside surprise in profits will ever be more important in investment returns going forward. We will continue to look for investment opportunities in high-quality companies that are able to execute well. At the same time we will also seek opportunities in cyclical areas that have a potential to achieve high growth via lower and easier competition.
For many years, Japanese equities have not been considered a place to invest by many investors, but rather a place to trade in and out of. Investors tend to buy Japan when things bottom out and improve, then get out when things start to peak. However, the dynamic has meaningfully changed since 2010 as Japanese corporates have been generating improving levels of profits in each bottom of the cycle. 2020 showed another year of resiliency of Japanese corporate profits. We believe Japan’s equity market fundamentals have turned from pure value to cyclical growth, but many global investors are still skeptical of this change. In our opinion, this creates opportunities for attractive alpha (the excess return on an investment relative to the return on a benchmark index) generation through bottom-up, active stock selection.
| | | | |
| matthewsasia.com | 800.789.ASIA | | | 75 | |
Matthews Japan Fund
December 31, 2020
Schedule of Investmentsa
COMMON EQUITIES: 98.8%
| | | | | | | | |
| | | Shares | | | Value | |
| | |
| INFORMATION TECHNOLOGY: 22.3% | | | | | | | | |
Electronic Equipment, Instruments & Components: 8.9% | | | | | |
TDK Corp. | | | 428,400 | | | | $64,638,506 | |
| | |
Keyence Corp. | | | 87,600 | | | | 49,276,492 | |
| | |
Ibiden Co., Ltd. | | | 704,900 | | | | 32,952,081 | |
| | | | | | | | |
| | | | | | | 146,867,079 | |
| | | | | | | | |
| | | | | | | | |
Software: 4.9% | | | | | | | | |
Freee KKb | | | 205,500 | | | | 20,096,605 | |
| | |
Oracle Corp. Japan | | | 143,600 | | | | 18,718,921 | |
| | |
Sansan, Inc.b | | | 227,900 | | | | 15,036,432 | |
| | |
AI inside, Inc.b | | | 19,300 | | | | 13,739,174 | |
| | |
Yappli, Inc.b | | | 133,400 | | | | 7,493,293 | |
| | |
Plaid, Inc.b | | | 125,200 | | | | 4,504,557 | |
| | |
Kaonavi, Inc.b | | | 14,700 | | | | 644,488 | |
| | | | | | | | |
| | | | | | | 80,233,470 | |
| | | | | | | | |
| | | | | | | | |
Semiconductors & Semiconductor Equipment: 4.5% | | | | | |
Advantest Corp. | | | 556,400 | | | | 41,675,384 | |
| | |
Disco Corp. | | | 98,800 | | | | 33,298,854 | |
| | | | | | | | |
| | | | | | | 74,974,238 | |
| | | | | | | | |
| | | | | | | | |
IT Services: 4.0% | | | | | | | | |
OBIC Co., Ltd. | | | 166,700 | | | | 33,503,004 | |
| | |
ITOCHU Techno-Solutions Corp. | | | 524,100 | | | | 18,714,578 | |
| | |
Hennge KKb | | | 177,900 | | | | 14,330,995 | |
| | | | | | | | |
| | | | | | | 66,548,577 | |
| | | | | | | | |
Total Information Technology | | | | | | | 368,623,364 | |
| | | | | | | | |
| | | | | | | | |
| | | |
| INDUSTRIALS: 19.7% | | | | | | | | |
Professional Services: 7.5% | | | | | | | | |
Recruit Holdings Co., Ltd. | | | 1,074,600 | | | | 45,136,378 | |
| | |
SMS Co., Ltd. | | | 1,151,800 | | | | 44,168,917 | |
| | |
Nihon M&A Center, Inc. | | | 516,600 | | | | 34,546,715 | |
| | | | | | | | |
| | | | | | | 123,852,010 | |
| | | | | | | | |
| | | | | | | | |
Machinery: 5.9% | | | | | | | | |
SMC Corp. | | | 96,700 | | | | 59,058,326 | |
| | |
Makita Corp. | | | 765,400 | | | | 38,390,268 | |
| | | | | | | | |
| | | | | | | 97,448,594 | |
| | | | | | | | |
| | | | | | | | |
Electrical Equipment: 2.7% | | | | | | | | |
Nidec Corp. | | | 351,400 | | | | 44,454,899 | |
| | | | | | | | |
| | | | | | | | |
Road & Rail: 2.5% | |
East Japan Railway Co. | | | 621,100 | | | | 41,436,931 | |
| | | | | | | | |
| | | | | | | | |
Building Products: 1.1% | |
Daikin Industries, Ltd. | | | 82,100 | | | | 18,264,553 | |
| | | | | | | | |
Total Industrials | | | | | | | 325,456,987 | |
| | | | | | | | |
| | | | | | | | |
| | | |
| CONSUMER DISCRETIONARY: 16.8% | | | | | | | | |
Specialty Retail: 4.9% | | | | | | | | |
Fast Retailing Co., Ltd. | | | 36,900 | | | | 33,087,487 | |
| | |
Nitori Holdings Co., Ltd. | | | 113,800 | | | | 23,795,749 | |
| | |
Hikari Tsushin, Inc. | | | 98,300 | | | | 23,064,527 | |
| | | | | | | | |
| | | | | | | 79,947,763 | |
| | | | | | | | |
| | | | | | | | |
Multiline Retail: 4.8% | | | | | | | | |
Pan Pacific International Holdings Corp. | | | 1,868,700 | | | | 43,173,907 | |
| | | | | | | | |
| | | Shares | | | Value | |
| | |
Marui Group Co., Ltd. | | | 2,084,600 | | | | $36,709,826 | |
| | | | | | | | |
| | | | | | | 79,883,733 | |
| | | | | | | | |
| | | | | | | | |
Household Durables: 4.8% | | | | | | | | |
Sony Corp. | | | 786,200 | | | | 79,223,871 | |
| | | | | | | | |
| | | | | | | | |
Leisure Products: 2.3% | | | | | | | | |
Bandai Namco Holdings, Inc. | | | 345,200 | | | | 29,894,585 | |
| | |
Roland Corp. | | | 275,500 | | | | 8,404,678 | |
| | | | | | | | |
| | | | | | | 38,299,263 | |
| | | | | | | | |
| | | | | | | | |
Total Consumer Discretionary | | | | | | | 277,354,630 | |
| | | | | | | | |
| | | | | | | | |
| | | |
| HEALTH CARE: 16.8% | | | | | | | | |
Health Care Equipment & Supplies: 7.9% | | | | | | | | |
Hoya Corp. | | | 338,700 | | | | 46,908,194 | |
| | |
Terumo Corp. | | | 988,700 | | | | 41,373,411 | |
| | |
Olympus Corp. | | | 1,104,700 | | | | 24,186,187 | |
| | |
Sysmex Corp. | | | 145,600 | | | | 17,519,556 | |
| | | | | | | | |
| | | | | | | 129,987,348 | |
| | | | | | | | |
| | | | | | | | |
Pharmaceuticals: 3.2% | | | | | | | | |
Chugai Pharmaceutical Co., Ltd. | | | 668,800 | | | | 35,683,920 | |
| | |
Takeda Pharmaceutical Co., Ltd. | | | 460,000 | | | | 16,647,112 | |
| | | | | | | | |
| | | | | | | 52,331,032 | |
| | | | | | | | |
| | | | | | | | |
Health Care Technology: 3.0% | | | | | | | | |
M3, Inc. | | | 523,500 | | | | 49,453,646 | |
| | | | | | | | |
| | | | | | | | |
Biotechnology: 2.7% | | | | | | | | |
PeptiDream, Inc.b | | | 880,300 | | | | 44,778,234 | |
| | | | | | | | |
Total Health Care | | | | | | | 276,550,260 | |
| | | | | | | | |
| | | | | | | | |
| | | |
| FINANCIALS: 8.5% | | | | | | | | |
Diversified Financial Services: 4.3% | | | | | | | | |
ORIX Corp. | | | 2,661,800 | | | | 40,949,444 | |
| | |
eGuarantee, Inc. | | | 1,364,500 | | | | 29,742,672 | |
| | | | | | | | |
| | | | | | | 70,692,116 | |
| | | | | | | | |
| | | | | | | | |
Insurance: 4.2% | | | | | | | | |
Tokio Marine Holdings, Inc. | | | 748,400 | | | | 38,558,731 | |
| | |
Dai-ichi Life Holdings, Inc. | | | 2,084,300 | | | | 31,400,809 | |
| | | | | | | | |
| | | | | | | 69,959,540 | |
| | | | | | | | |
| | | | | | | | |
Total Financials | | | | | | | 140,651,656 | |
| | | | | | | | |
| | | | | | | | |
| | | |
| COMMUNICATION SERVICES: 7.7% | | | | | | | | |
Entertainment: 4.4% | | | | | | | | |
Nintendo Co., Ltd. | | | 63,800 | | | | 40,955,862 | |
| | |
Capcom Co., Ltd. | | | 485,300 | | | | 31,473,008 | |
| | | | | | | | |
| | | | | | | 72,428,870 | |
| | | | | | | | |
| | | | | | | | |
Wireless Telecommunication Services: 2.8% | | | | | | | | |
SoftBank Group Corp. | | | 585,100 | | | | 45,424,286 | |
| | | | | | | | |
| | | | | | | | |
Media: 0.5% | | | | | | | | |
Direct Marketing MiX, Inc. | | | 334,900 | | | | 8,507,508 | |
| | | | | | | | |
Total Communication Services | | | | | | | 126,360,664 | |
| | | | | | | | |
| | | | | | | | |
| | | |
| MATERIALS: 7.0% | | | | | | | | |
Chemicals: 7.0% | | | | | | | | |
Shin-Etsu Chemical Co., Ltd. | | | 500,100 | | | | 87,775,482 | |
Matthews Japan Fund
December 31, 2020
Schedule of Investmentsa (continued)
COMMON EQUITIES (continued)
| | | | | | | | |
| | | Shares | | | Value | |
| | |
Sumitomo Bakelite Co., Ltd. | | | 809,700 | | | | $27,923,671 | |
| | | | | | | | |
Total Materials | | | | | | | 115,699,153 | |
| | | | | | | | |
| | | | | | | | |
| | | |
| TOTAL INVESTMENTS: 98.8% | | | | | | | 1,630,696,714 | |
(Cost $1,139,085,719) | | | | | | | | |
| | | | | | | | |
| | |
CASH AND OTHER ASSETS,
LESS LIABILITIES: 1.2% | | | | | | | 20,091,097 | |
| | | | | | | | |
| | |
NET ASSETS: 100.0% | | | | | | | $1,650,787,811 | |
| | | | | | | | |
| a | Certain securities were fair valued under the valuation policies approved by the Board of Trustees (Note 2-A). |
| b | Non-income producing security. |
See accompanying notes to financial statements.
| | | | |
| matthewsasia.com | 800.789.ASIA | | | 77 | |
| | | | |
| PORTFOLIO MANAGERS |
| |
| Michael J. Oh, CFA | | |
Lead Manager | | | | |
| |
| Elli Lee | | |
Co-Manager | | | | |
|
| FUND FACTS |
| | |
| | | Investor | | Institutional |
Ticker | | MAKOX | | MIKOX |
CUSIP | | 577130305 | | 577130826 |
Inception | | 1/3/95 | | 10/29/10 |
NAV | | $6.12 | | $6.17 |
Initial Investment | | $2,500 | | $100,000 |
Gross Expense Ratio1 | | 1.19% | | 1.05% |
Portfolio Statistics |
Total # of Positions | | 32 |
Net Assets | | $154.1 million |
Weighted Average
Market Cap | | $151.7 billion |
Portfolio Turnover2 | | 39.6% |
Benchmark |
Korea Composite Stock Price Index |
OBJECTIVE
Long-term capital appreciation.
STRATEGY
Under normal market conditions, the Fund seeks to achieve its investment objective by investing at least 80% of its net assets, which include borrowings for investment purposes, in the common and preferred stocks of companies located in South Korea.
Matthews Korea Fund
Portfolio Manager Commentary (unaudited)
For the year ending December 31, 2020, the Matthews Korea Fund returned 40.77% (Investor Class) and 40.76% (Institutional Class), while its benchmark, the Korea Composite Stock Price Index, returned 39.76%. For the fourth quarter, the Fund returned 29.53% (Investor Class) and 29.62% (Institutional Class) versus 32.53% for the Index.
Market Environment:
South Korean equities were the region’s strongest performers in 2020. A combination of low valuations, a rebound in earnings and a cyclical bounce coming out of COVID-19 proved to be a confluence of upside catalysts, which propelled Korean equity prices higher. Early year optimism surrounding the U.S.—China trade resolution faded quickly as investors weighed potential negative spillover of the coronavirus into slower trade, tourism and demand for Korean products. Korea’s response to COVID-19 was prompt and effective resulting in a relatively fast control over the spread of cases. Upside momentum in South Korean equities continued late into 2020 with improving earnings outlook for 2021 and a rotation to cyclically oriented names driven by global pandemic recovery.
Performance Contributors and Detractors:
From a sector perspective, stock selection in information technology and communication services was a notable contributor for the full year. By market cap, stock selection among mega-cap and mid-cap stocks was also a contributor. Among individual stocks, a contributor was Kakao Corp., South Korea’s largest chat platform. The company’s return on investment improved significantly from 2019 with successful monetization into advertisement and commerce revenue. Its financial and content platforms are turning profitable with scale. We expect it to continue to strengthen its network effect within domestic users in Korea even after the COVID-19 pandemic. LG Chem, a lithium ion battery (LiB) manufacturer for automobiles, was another contributor. The company’s management has been establishing solid brand equity and technology in automotive LiB over the last few years. We view management’s decision to separate the LiB business from its existing chemical business to continue focusing on global expansions to be positive in the longer term.
On the other hand, stock selection in consumer staples, including LG Household & Health Care, was a detractor. LG Household and Health Care produces cosmetics and health care products. The company’s high-end cosmetic brand ‘Whoo’ is especially popular amongst Chinese customers and tourists. With the COVID-19 outbreak, travel bans negatively affected LG Household & Health Care sales in its tourist platform while it continued to maintain and improve brand equity in China. We continue to see the company attractive at this valuation with strong brand equity and the marketing capability of the management team.
Notable Portfolio Changes:
In the fourth quarter, we re-initiated a position in Amorepacific Corp, which had previously been a long-held position in the Fund. It recently had a new management team come in to improve channel and brand strategy for both Korea and China. We believe Amorepacific has a solid heritage in its brands and revamping its marketing strategy could improve its bottom line. We continue to monitor the progress of its new management team and how well the team can execute on its strategy in China. We also added Korea’s largest steel mill, POSCO. As the global economy improves, we believe demand for high-end steel will increase.
(continued)
| 1 | Actual 2020 expense ratios. |
| 2 | The lesser of fiscal year 2020 long-term purchase costs or sales proceeds divided by the average monthly market value of long-term securities. |
| | | | | | | | | | | | | | | | | | | | | | | | | | | | |
| | | | | | | | |
| PERFORMANCE AS OF DECEMBER 31, 2020 | | | | | | | | | | | | | | | | | | | | | |
| | | | | | | | | Average Annual Total Returns | | | | |
| | | 3 Months | | | 1 Year | | | 3 Years | | | 5 Years | | | 10 Years | | | Since
Inception | | | Inception
Date | |
| Investor Class (MAKOX) | | | 29.53% | | | | 40.77% | | | | 4.36% | | | | 8.88% | | | | 8.38% | | | | 6.79% | | | | 01/03/95 | |
| Institutional Class (MIKOX) | | | 29.62% | | | | 40.76% | | | | 4.46% | | | | 9.00% | | | | 8.52% | | | | 9.24% | | | | 10/29/10 | |
| Korea Composite Stock Price Index3 | | | 32.53% | | | | 39.76% | | | | 6.38% | | | | 11.52% | | | | 5.42% | | | | 4.36% | 4 | | | | |
Performance assumes reinvestment of all dividends and/or distributions before taxes. All performance quoted represents past performance and is no guarantee of future results. Investment return and principal value will fluctuate with market conditions so that when redeemed, shares may be worth more or less than their original cost. Current performance may be lower or higher than the return figures quoted. For the Fund’s most recent month-end performance, visit matthewsasia.com.
GROWTH OF A HYPOTHETICAL $10,000 INVESTMENT SINCE INCEPTION—INVESTOR CLASS
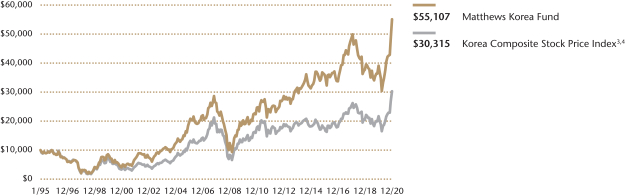
Plotted monthly. The performance data and graph do not reflect the deduction of taxes that a shareholder would pay on dividends, capital gains distributions or redemption of Fund shares. Values are in US$.
| | 3 | Korea Composite Stock Price Index performance data may be readjusted periodically by the Korea Exchange due to certain factors, including the declaration of dividends. It is not possible to invest directly in an index. Source: Index data from Korea Composite Stock Price Index and Bloomberg; total return calculations performed by BNY Mellon Investment Servicing (US) Inc. Please see page 93 for index definition. |
| | | | | | | | |
| | | | |
| TOP TEN HOLDINGS5 | | | | | | | |
| | | Sector | | | | % of Net Assets | |
| Samsung Electronics Co., Ltd., Pfd. | | Information Technology | | | | | 19.4% | |
| Samsung Electronics Co., Ltd. | | Information Technology | | | | | 6.8% | |
| SK Hynix, Inc. | | Information Technology | | | | | 5.0% | |
| LG Chem, Ltd., Pfd. | | Materials | | | | | 4.8% | |
| Samsung SDI Co., Ltd. | | Information Technology | | | | | 4.2% | |
| Hyundai Mobis Co., Ltd. | | Consumer Discretionary | | | | | 4.2% | |
| Kakao Corp. | | Communication Services | | | | | 4.2% | |
| LG Household & Health Care, Ltd., Pfd. | | Consumer Staples | | | | | 4.1% | |
| Shinhan Financial Group Co., Ltd. | | Financials | | | | | 4.1% | |
| Orion Corp. | | Consumer Staples | | | | | 3.5% | |
| % OF ASSETS IN TOP 10 | | | | | | | 60.3% | |
| | 5 | Holdings may combine more than one security from same issuer and related depositary receipts. |
| | | | |
| matthewsasia.com | 800.789.ASIA | | | 79 | |
Matthews Korea Fund
Portfolio Manager Commentary (unaudited) (continued)
Outlook:
Looking ahead, we expect global consumption to see some recovery in 2021 with COVID-19 vaccinations. As always, we believe active security selection is essential to capturing South Korea’s long-term growth potential. We continue to look for companies that can benefit from domestic consumption within Korea, as well as those companies headquartered in Korea that are effectively competing and innovating in global markets. As bottom-up investors, we look for companies that can grow organically without the assistance of strong macroeconomic tailwinds. We also look for companies who can further strengthen business models and bargaining power over the next few years against customers and peers.
| | | | |
| |
| COUNTRY ALLOCATION (%)6 | |
South Korea | | | 96.4 | |
| Japan | | | 1.9 | |
Cash and Other Assets, Less Liabilities | | | 1.7 | |
| | | | |
| |
| SECTOR ALLOCATION (%)6 | |
| Information Technology | | | 41.8 | |
| Consumer Discretionary | | | 12.3 | |
| Communication Services | | | 11.7 | |
| Consumer Staples | | | 10.0 | |
| Financials | | | 7.7 | |
| Materials | | | 6.8 | |
| Health Care | | | 5.9 | |
| Industrials | | | 2.2 | |
| Cash and Other Assets, Less Liabilities | | | 1.7 | |
| | | | |
| |
| MARKET CAP EXPOSURE (%)6 | |
| Mega Cap (over $25B) | | | 53.0 | |
| Large Cap ($10B–$25B) | | | 23.5 | |
| Mid Cap ($3B–10B) | | | 8.9 | |
| Small Cap (under $3B) | | | 12.9 | |
| Cash and Other Assets, Less Liabilities | | | 1.7 | |
| 6 | Source: FactSet Research Systems. Percentage values in data are rounded to the nearest tenth of one percent, so the values may not sum to 100% due to rounding. Country allocations and percentage values may be derived from different data sources and may not be consistent with other Fund literature. |
Matthews Korea Fund
December 31, 2020
Schedule of Investmentsa
COMMON EQUITIES: 66.6%
| | | | | | | | |
| | | Shares | | | Value | |
| | |
| INFORMATION TECHNOLOGY: 22.4% | | | | | | | | |
Semiconductors & Semiconductor Equipment: 9.2% | | | | | |
SK Hynix, Inc. | | | 69,937 | | | | $7,639,114 | |
| | |
Koh Young Technology, Inc. | | | 39,456 | | | | 3,817,460 | |
| | |
LEENO Industrial, Inc. | | | 21,739 | | | | 2,703,558 | |
| | | | | | | | |
| | | | | | | 14,160,132 | |
| | | | | | | | |
| | | | | | | | |
Technology Hardware, Storage & Peripherals: 6.8% | | | | | |
Samsung Electronics Co., Ltd. | | | 140,211 | | | | 10,470,329 | |
| | | | | | | | |
| | | | | | | | |
Electronic Equipment, Instruments & Components: 6.4% | |
| | |
Samsung SDI Co., Ltd. | | | 11,277 | | | | 6,535,561 | |
| | |
Samsung Electro-Mechanics Co., Ltd. | | | 20,271 | | | | 3,328,971 | |
| | | | | | | | |
| | | | | | | 9,864,532 | |
| | | | | | | | |
Total Information Technology | | | | | | | 34,494,993 | |
| | | | | | | | |
| | | | | | | | |
| | | |
| COMMUNICATION SERVICES: 11.7% | | | | | | | | |
Interactive Media & Services: 7.5% | | | | | | | | |
Kakao Corp. | | | 17,872 | | | | 6,412,840 | |
| | |
NAVER Corp. | | | 19,152 | | | | 5,162,791 | |
| | | | | | | | |
| | | | | | | 11,575,631 | |
| | | | | | | | |
| | | | | | | | |
Entertainment: 3.3% | |
Nexon Co., Ltd. | | | 93,900 | | | | 2,897,276 | |
| | |
NCSoft Corp. | | | 2,552 | | | | 2,191,023 | |
| | | | | | | | |
| | | | | | | 5,088,299 | |
| | | | | | | | |
| | | | | | | | |
Diversified Telecommunication Services: 0.9% | | | | | |
KINX, Inc. | | | 19,579 | | | | 1,296,832 | |
| | | | | | | | |
Total Communication Services | | | | | | | 17,960,762 | |
| | | | | | | | |
| | | | | | | | |
| | | |
| CONSUMER DISCRETIONARY: 8.8% | | | | | | | | |
Auto Components: 6.4% | | | | | | | | |
Hyundai Mobis Co., Ltd. | | | 27,457 | | | | 6,462,449 | |
| | |
Hankook Tire & Technology Co., Ltd. | | | 60,312 | | | | 2,191,151 | |
| | |
Hanon Systems | | | 86,728 | | | | 1,298,442 | |
| | | | | | | | |
| | | | | | | 9,952,042 | |
| | | | | | | | |
| | | | | | | | |
Automobiles: 2.4% | | | | | | | | |
Kia Motors Corp. | | | 63,093 | | | | 3,635,215 | |
| | | | | | | | |
Total Consumer Discretionary | | | | | | | 13,587,257 | |
| | | | | | | | |
| | | | | | | | |
| | | |
| FINANCIALS: 7.7% | | | | | | | | |
Banks: 6.2% | | | | | | | | |
Shinhan Financial Group Co., Ltd. | | | 214,655 | | | | 6,369,473 | |
| | |
KB Financial Group, Inc. | | | 80,162 | | | | 3,183,797 | |
| | | | | | | | |
| | | | | | | 9,553,270 | |
| | | | | | | | |
| | | | | | | | |
Capital Markets: 0.9% | | | | | | | | |
Kiwoom Securities Co., Ltd. | | | 11,013 | | | | 1,286,538 | |
| | | | | | | | |
| | | | | | | | |
Mortgage REITs: 0.6% | | | | | | | | |
ESR Kendall Square REIT Co., Ltd.b | | | 209,517 | | | | 977,862 | |
| | | | | | | | |
Total Financials | | | | | | | 11,817,670 | |
| | | | | | | | |
| | | | | | | | |
| | | |
| HEALTH CARE: 5.9% | | | | | | | | |
Pharmaceuticals: 4.0% | | | | | | | | |
Yuhan Corp. | | | 50,779 | | | | 3,516,103 | |
| | |
DongKook Pharmaceutical Co., Ltd. | | | 100,682 | | | | 2,713,546 | |
| | | | | | | | |
| | | | | | | 6,229,649 | |
| | | | | | | | |
| | | | | | | | |
| | | | | | | | |
| | | Shares | | | Value | |
Biotechnology: 1.9% | | | | | | | | |
Hugel, Inc.b | | | 16,836 | | | | $2,912,722 | |
| | | | | | | | |
Total Health Care | | | | | | | 9,142,371 | |
| | | | | | | | |
| | | | | | | | |
| | | |
| CONSUMER STAPLES: 5.9% | | | | | | | | |
Food Products: 4.9% | | | | | | | | |
Orion Corp. | | | 47,276 | | | | 5,399,045 | |
| | |
Nongshim Co., Ltd. | | | 7,946 | | | | 2,196,584 | |
| | | | | | | | |
| | | | | | | 7,595,629 | |
| | | | | | | | |
| | | | | | | | |
Personal Products: 1.0% | | | | | | | | |
Amorepacific Corp. | | | 7,930 | | | | 1,505,757 | |
| | | | | | | | |
Total Consumer Staples | | | | | | | 9,101,386 | |
| | | | | | | | |
| | | | | | | | |
| | | |
| INDUSTRIALS: 2.2% | | | | | | | | |
Professional Services: 1.2% | | | | | | | | |
NICE Information Service Co., Ltd. | | | 77,815 | | | | 1,779,869 | |
| | | | | | | | |
| | | | | | | | |
Machinery: 1.0% | | | | | | | | |
Hyundai Mipo Dockyard Co., Ltd. | | | 35,228 | | | | 1,559,847 | |
| | | | | | | | |
Total Industrials | | | | | | | 3,339,716 | |
| | | | | | | | |
| | | | | | | | |
| | | |
| MATERIALS: 2.0% | | | | | | | | |
Metals & Mining: 2.0% | | | | | | | | |
POSCO | | | 12,600 | | | | 3,148,482 | |
| | | | | | | | |
Total Materials | | | | 3,148,482 | |
| | | | | | | | |
| | | | | | | | |
| | |
| TOTAL COMMON EQUITIES | | | | 102,592,637 | |
| | | | | | | | |
(Cost $69,040,689) | | | | | | | | |
| | | | | | | | |
|
PREFERRED EQUITIES: 31.7% | |
| |
| INFORMATION TECHNOLOGY: 19.4% | |
Technology Hardware, Storage & Peripherals: 19.4% | | | | | |
Samsung Electronics Co., Ltd., Pfd. | | | 440,443 | | | | 29,878,316 | |
| | | | | | | | |
Total Information Technology | | | | 29,878,316 | |
| | | | | | | | |
| | | | | | | | |
| | |
| MATERIALS: 4.8% | | | | | |
Chemicals: 4.8% | | | | | | | | |
LG Chem, Ltd., Pfd. | | | 20,921 | | | | 7,364,918 | |
| | | | | | | | |
Total Materials | | | | 7,364,918 | |
| | | | | | | | |
| | | | | | | | |
| | |
| CONSUMER STAPLES: 4.1% | | | | | |
Personal Products: 4.1% | | | | | | | | |
LG Household & Health Care, Ltd., Pfd. | | | 9,644 | | | | 6,379,628 | |
| | | | | | | | |
Total Consumer Staples | | | | 6,379,628 | |
| | | | | | | | |
| | | | | | | | |
| | | | |
| matthewsasia.com | 800.789.ASIA | | | 81 | |
Matthews Korea Fund
December 31, 2020
Schedule of Investmentsa (continued)
PREFERRED EQUITIES (continued)
| | | | | | | | |
| | | Shares | | | Value | |
| |
| CONSUMER DISCRETIONARY: 3.4% | | | | | |
Automobiles: 3.4% | | | | | | | | |
Hyundai Motor Co., Ltd., Pfd. | | | 65,245 | | | | $5,329,739 | |
| | | | | | | | |
Total Consumer Discretionary | | | | 5,329,739 | |
| | | | | | | | |
| | | | | | | | |
| | |
| TOTAL PREFERRED EQUITIES | | | | 48,952,601 | |
| | | | | | | | |
(Cost $21,880,911) | |
| | | | | | | | |
| | |
| TOTAL INVESTMENTS: 98.3% | | | | 151,545,238 | |
(Cost $90,921,600) | |
| | | | | | | | |
| |
CASH AND OTHER ASSETS,
LESS LIABILITIES: 1.7% | | | | 2,577,499 | |
| | | | | | | | |
| |
NET ASSETS: 100.0% | | | | $154,122,737 | |
| | | | | | | | |
| a | Certain securities were fair valued under the valuation policies approved by the Board of Trustees (Note 2-A). |
| b | Non-income producing security. |
| REIT | Real Estate Investment Trust |
See accompanying notes to financial statements.

| | | | |
| PORTFOLIO MANAGERS |
| |
| Vivek Tanneeru* | | |
| Lead Manager | | |
|
* As of August 31, 2020 |
|
| FUND FACTS |
| | |
| | | Investor | | Institutional |
Ticker | | MSMLX | | MISMX |
CUSIP | | 577125206 | | 577125867 |
Inception | | 9/15/08 | | 4/30/13 |
NAV | | $25.93 | | $25.87 |
Initial Investment | | $2,500 | | $100,000 |
Gross Expense Ratio1 | | 1.57% | | 1.47% |
After Fee Waiver and Reimbursement2 | | 1.39% | | 1.20% |
Portfolio Statistics | | |
Total # of Positions | | 70 |
Net Assets | | $207.1 million |
Weighted Average
Market Cap | | 5.0 billion |
Portfolio Turnover3 | | 111.9% |
Benchmark | | |
MSCI AC Asia ex Japan Small Cap Index |
OBJECTIVE
Long-term capital appreciation.
STRATEGY
Under normal market conditions, the Fund seeks to achieve its investment objective by investing at least 80% of its net assets, which include borrowings for investment purposes, in the common and preferred stocks of Small Companies located in Asia ex Japan, which consists of all countries and markets in Asia excluding Japan, but including all other developed, emerging and frontier countries and markets in the Asian region. The Fund defines Small Companies as companies with market capitalization no higher than the greater of $5 billion or the market capitalization of the largest company included in the Fund’s primary benchmark, the MSCI All Country Asia ex Japan Small Cap Index.
Matthews Asia Small Companies Fund
Portfolio Manager Commentary (unaudited)
For the year ending December 31, 2020, the Matthews Asia Small Companies Fund returned 43.68% (Investor Class) and 43.90% (Institutional Class), while its benchmark, the MSCI All Country Asia ex Japan Small Cap Index, returned 26.60%. For the fourth quarter, the Fund returned 22.90% (Investor Class) and 22.94% (Institutional Class), while its benchmark returned 19.72%.
Market Environment:
Equities across Asia were volatile in the year, but broad market indexes tracking the region ultimately generated attractive returns. Global markets fell in the first quarter, as worries surrounding the spread of COVID-19 moved from China throughout Europe to the U.S. and then back to South Asia, including India. Fears of a global growth slowdown turned into reality as governments worldwide began to implement different versions of “shelter in place” to contain the movement of the virus. But central banks globally, led by the U.S. Federal Reserve, unleashed powerful, and largely effective, monetary stimulus. Many governments also unveiled meaningful fiscal stimulus. Both those actions helped ease worries about a crippling and sustained global recession. They also provided cover for many emerging markets (EM) to undertake their own monetary and fiscal stimuli thereby supporting their economies.
In the third quarter, economic recovery and improved sentiment began to take hold as major economies continued to relax COVID-19 lockdown restrictions even further. China’s V-shaped recovery in manufacturing along with a steady recovery in domestic consumption brought some normalcy to daily life. EM currencies rallied slightly against the U.S. dollar in the third quarter, acting as a slight tailwind for EM equities. Growth stocks outpaced value and small caps outperformed large caps. The fourth quarter saw further economic strengthening. Cyclical stocks in beaten-up or export-driven markets such as Indonesia and South Korea rallied most in the fourth quarter, while markets that experienced early recovery like China, Japan and India lagged slightly. Market strength gained momentum following the U.S. Presidential elections in November as markets hoped for less confrontational U.S.—China relations, combined with an announcement of several approved COVID-19 vaccines that were due for distribution early in 2021.
Performance Contributors and Detractors:
Stock selection in China/Hong Kong was a notable contributor to performance for the year. As the economic recovery continued to broaden in the year, small companies, especially in the health care and technology space, did well. On the other hand, stock selection and an underweight to South Korea was a detractor. South Korea’s broader markets, led by cyclical sectors such as materials, shipping and shipbuilding rallied late in the year on improving sentiment toward global exports and trade. Our underweight worked against us in this environment.
From a sector perspective, stock selection in information technology was a notable contributor. The expansion of China’s local supply chain development especially in areas such as semiconductors and industrial automation has aided stock performance. Smaller companies are well positioned to participate in this growth,
(continued)
| 1 | Actual 2020 expense ratios. |
| 2 | Matthews has contractually agreed (i) to waive fees and reimburse expenses to the extent needed to limit Total Annual Fund Operating Expenses (excluding Rule 12b-1 fees, taxes, interest, brokerage commissions, short sale dividend expenses, expenses incurred in connection with any merger or reorganization or extraordinary expenses such as litigation) of the Institutional Class to 1.20% first by waiving class specific expenses (i.e., shareholder service fees specific to a particular class) of the Institutional Class and then, to the extent necessary, by waiving non-class specific expenses (e.g., custody fees) of the Institutional Class, and (ii) if any Fund-wide expenses (i.e., expenses that apply to both the Institutional Class and the Investor Class) are waived for the Institutional Class to maintain the 1.20% expense limitation, to waive an equal amount (in annual percentage terms) of those same expenses for the Investor Class. The Total Annual Fund Operating Expenses After Fee Waiver and Expense Reimbursement for the Investor Class may vary from year to year and will in some years exceed 1.20%. If the operating expenses fall below the expense limitation in a year within three years after Matthews has made a waiver or reimbursement, the Fund may reimburse Matthews up to an amount that does not cause the expenses for that year to exceed the lesser of (i) the expense limitation applicable at the time of that fee waiver and/or expense reimbursement or (ii) the expense limitation in effect at the time of recoupment. This agreement will remain in place until April 30, 2022 and may be terminated at any time by the Board of Trustees on behalf of the Fund on 60 days’ written notice to Matthews. Matthews may decline to renew this agreement by written notice to the Trust at least 30 days before its annual expiration date. |
| 3 | The lesser of fiscal year 2020 long-term purchase costs or sales proceeds divided by the average monthly market value of long-term securities. |
| | | | |
| matthewsasia.com | 800.789.ASIA | | | 83 | |
| | | | | | | | | | | | | | | | | | | | | | | | | | | | |
| | | | | | | | |
| PERFORMANCE AS OF DECEMBER 31, 2020 | | | | | | | | | | | | | | | | | | | | | |
| | | | | | | | | Average Annual Total Returns | | | | |
| | | 3 Months | | | 1 Year | | | 3 Years | | | 5 Years | | | 10 Years | | | Since
Inception | | | Inception
Date | |
| Investor Class (MSMLX) | | | 22.90% | | | | 43.68% | | | | 11.39% | | | | 12.21% | | | | 6.66% | | | | 12.25% | | | | 09/15/08 | |
| Institutional Class (MISMX) | | | 22.94% | | | | 43.90% | | | | 11.62% | | | | 12.44% | | | | n.a. | | | | 8.15% | | | | 04/30/13 | |
| MSCI AC Asia ex Japan Small Cap Index4 | | | 19.72% | | | | 26.60% | | | | 3.49% | | | | 7.76% | | | | 3.35% | | | | 7.87% | 5 | | | | |
Performance assumes reinvestment of all dividends and/or distributions before taxes. All performance quoted represents past performance and is no guarantee of future results. Investment return and principal value will fluctuate with market conditions so that when redeemed, shares may be worth more or less than their original cost. Current performance may be lower or higher than the return figures quoted. Returns would have been lower if certain of the Fund’s fees and expenses had not been waived. For the Fund’s most recent month-end performance, visit matthewsasia.com.
GROWTH OF A HYPOTHETICAL $10,000 INVESTMENT SINCE INCEPTION—INVESTOR CLASS
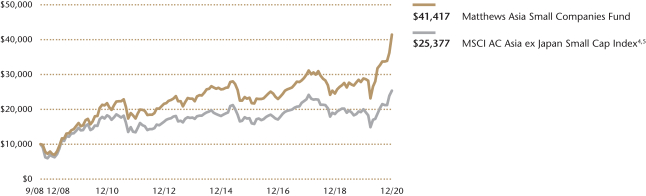
Plotted monthly. The performance data and graph do not reflect the deduction of taxes that a shareholder would pay on dividends, capital gains distributions or redemption of Fund shares. Values are in US$.
| | 4 | It is not possible to invest directly in an index. Source: Index data from Morgan Stanley Capital International and Bloomberg; total return calculations performed by BNY Mellon Investment Servicing (US) Inc. Please see page 93 for index definition. |
| | 5 | Calculated from 9/15/08. |
| | | | | | | | |
| | | | |
| TOP TEN HOLDINGS6 | | | | | | | |
| | | Sector | | Country | | % of Net Assets | |
Flat Glass Group Co., Ltd. | | Information Technology | | China/Hong Kong | | | 4.5% | |
Silergy Corp. | | Information Technology | | China/Hong Kong | | | 4.5% | |
Kingdee International Software Group Co., Ltd. | | Information Technology | | China/Hong Kong | | | 3.1% | |
Phoenix Mills, Ltd. | | Real Estate | | India | | | 3.1% | |
Innovent Biologics, Inc. | | Health Care | | China/Hong Kong | | | 3.1% | |
Shriram City Union Finance, Ltd. | | Financials | | India | | | 2.6% | |
Airtac International Group | | Industrials | | China/Hong Kong | | | 2.5% | |
Peijia Medical, Ltd. | | Health Care | | China/Hong Kong | | | 2.4% | |
Crompton Greaves Consumer Electricals, Ltd. | | Consumer Discretionary | | India | | | 2.3% | |
Andes Technology Corp. | | Information Technology | | Taiwan | | | 2.2% | |
% OF ASSETS IN TOP 10 | | | | | | | 30.3% | |
| | 6 | Holdings may combine more than one security from same issuer and related depositary receipts. |
| | | | |
| |
| COUNTRY ALLOCATION (%)7,8 | |
| China/Hong Kong | | | 48.5 | |
| India | | | 20.6 | |
| Taiwan | | | 14.5 | |
| South Korea | | | 8.7 | |
| Vietnam | | | 2.2 | |
| Indonesia | | | 1.5 | |
| Philippines | | | 1.4 | |
| Thailand | | | 1.3 | |
| Singapore | | | 0.9 | |
| Malaysia | | | 0.3 | |
| Cash and Other Assets, Less Liabilities | | | 0.2 | |
| | | | |
| |
| SECTOR ALLOCATION (%)8 | |
| Information Technology | | | 32.7 | |
| Health Care | | | 21.0 | |
| Industrials | | | 16.9 | |
| Consumer Discretionary | | | 10.6 | |
| Real Estate | | | 6.0 | |
| Consumer Staples | | | 5.5 | |
| Financials | | | 4.6 | |
| Materials | | | 1.5 | |
| Communication Services | | | 0.9 | |
| Cash and Other Assets, Less Liabilities | | | 0.2 | |
| | | | |
| |
| MARKET CAP EXPOSURE (%)8,9 | |
| Mega Cap (over $25B) | | | 0.0 | |
| Large Cap ($10B–$25B) | | | 15.2 | |
| Mid Cap ($3B–10B) | | | 38.5 | |
| Small Cap (under $3B) | | | 46.1 | |
| Cash and Other Assets, Less Liabilities | | | 0.2 | |
| 7 | Not all countries where the Fund may invest are included in the benchmark index. |
| 8 | Source: FactSet Research Systems. Percentage values in data are rounded to the nearest tenth of one percent, so the values may not sum to 100% due to rounding. Country allocations and percentage values may be derived from different data sources and may not be consistent with other Fund literature. |
| 9 | The Fund defines Small Companies as companies with market capitalization no higher than the greater of $5 billion or the market capitalization of the largest company included in the Fund’s primary benchmark, the MSCI All Country Asia ex Japan Small Cap Index. |
Matthews Asia Small Companies Fund
Portfolio Manager Commentary (unaudited) (continued)
bringing innovative new approaches to existing customer needs. On the other hand, stock selection in health care was a detractor, even though our overweight to the sector was a contributor. While our health care holdings generated attractive total returns in aggregate, they trailed the returns of the benchmark constituents within the sector. We continue to like the long-term prospects of our health care holdings.
Among indivdual stocks, Silergy Corp was a notable contributor. While listed in Taiwan, Silergy is a truly global company with an edge in China. The company designs mixed-signal and analog power management integrated circuits that are used in industrial, consumer, computing and communications. On the other hand, a detractor was property developer Times China, which focuses on developments in the Greater Bay Area in Guangdong province. This area has been earmarked for further development in high-value-adding sectors such as the technology and financial industries, and is likely to see growth in infrastructure connectivity over time. The real estate industry has been sluggish as the pandemic has disrupted sales in China, but we continue to like the company’s long-term prospects in land banking, as well as its attractive valuations.
Notable Portfolio Changes:
During the fourth quarter we have initiated a new position in Formosa Sumco Technology Corporation, a Taiwanese semiconductor wafer manufacturing company. The company derives the majority of its revenues from 12-inch wafers while also having meaningful exposure to the 8-inch wafers. Its main customers include foundry and memory companies operating in Taiwan and China. The demand for wafers is expected to continue to recover in 2021 and beyond, providing support to top and bottom line growth. At the same time the industry is also consolidating, thereby potentially bringing in capacity addition and pricing discipline. We find the company reasonably valued.
We also initiated a position in Malaysian home improvement retailer Mr. DIY through the IPO process. Mr. DIY is the largest player in the industry with about 30% market share in an end market that is growing. The company’s value proposition is that it has an offering that is attractively priced at convenient locations in a store format that has a large number of items per store. The company continues to drive sales growth through both new store openings as well as by delivering good like-for-like sales growth, which translates into attractive profit growth driven by its efficient operations. Two new formats—the discount retail format, MR DOLLAR and value-for-money toy store, MR. TOY—offer further growth options.
Outlook:
Looking ahead, uncertainty remains in terms of the pace of Asia’s economic recovery. Given the uncertainty of how quickly vaccines can be distributed, how quickly daily patterns may return to normal remain unknown and the strength of the economic recovery in different markets where we invest may not be immediately evident. Valuations for Asia ex-Japan equities are above their historic averages and in some areas of the market, we believe investors have already priced in a high level of anticipated future growth. All of these emphasize the importance of investing with a long-term view.
At the same time, we see many reasons for optimism. There are three important drivers for equity prices—growth, valuation and liquidity. From a growth perspective, Asia is on a path to economic recovery and the sheer size of the consumer base in Asia works in its favor. Valuations for Asia ex-Japan equities rose in 2020, so there is less valuation support for the broader market, but we continue to see pockets of opportunity. Finally, turning to market liquidity, we find good liquidity across Asia. We believe the confluence of these drivers will support medium to long-term growth across many parts of Asia.
| | | | |
| matthewsasia.com | 800.789.ASIA | | | 85 | |
Matthews Asia Small Companies Fund
December 31, 2020
Schedule of Investmentsa
COMMON EQUITIES: 99.8%
| | | | | | | | |
| | | Shares | | | Value | |
| | |
| CHINA/HONG KONG: 47.5% | | | | | | | | |
| | |
Flat Glass Group Co., Ltd. H Shares | | | 2,233,000 | | | | $9,419,507 | |
| | |
Silergy Corp. | | | 109,000 | | | | 9,380,724 | |
| | |
Kingdee International Software Group Co., Ltd. | | | 1,597,000 | | | | 6,519,847 | |
| | |
Innovent Biologics, Inc.b,c,d | | | 612,000 | | | | 6,462,789 | |
| | |
Airtac International Group | | | 160,000 | | | | 5,142,500 | |
| | |
Peijia Medical, Ltd.b,c,d | | | 1,343,000 | | | | 4,900,535 | |
| | |
SITC International Holdings Co., Ltd. | | | 2,089,000 | | | | 4,511,530 | |
| | |
Pharmaron Beijing Co., Ltd. H Sharesb,d | | | 251,800 | | | | 4,257,113 | |
| | |
Centre Testing International Group Co., Ltd. A Shares | | | 949,174 | | | | 3,994,427 | |
| | |
Yantai China Pet Foods Co., Ltd. A Shares | | | 449,300 | | | | 3,953,533 | |
| | |
Ginlong Technologies Co., Ltd. A Shares | | | 146,210 | | | | 3,341,800 | |
| | |
Alphamab Oncologyb,c,d | | | 1,437,000 | | | | 3,013,391 | |
| | |
Chindata Group Holdings, Ltd. ADRc | | | 118,900 | | | | 2,848,844 | |
| | |
Hongfa Technology Co., Ltd. A Shares | | | 315,100 | | | | 2,632,512 | |
| | |
Hua Hong Semiconductor, Ltd.b,c,d | | | 460,000 | | | | 2,618,859 | |
| | |
Yihai International Holding, Ltd. | | | 168,000 | | | | 2,494,938 | |
| | |
Sichuan Teway Food Group Co., Ltd. A Shares | | | 189,410 | | | | 2,398,832 | |
| | |
Jiumaojiu International Holdings, Ltd.b,c,d | | | 783,000 | | | | 2,385,885 | |
| | |
InnoCare Pharma, Ltd.b,c,d | | | 1,364,000 | | | | 2,372,341 | |
| | |
Winning Health Technology Group Co., Ltd. A Shares | | | 847,080 | | | | 2,282,065 | |
| | |
Asymchem Laboratories (Tianjin) Co., Ltd. A Shares | | | 49,114 | | | | 2,260,916 | |
| | |
AK Medical Holdings, Ltd.b,d | | | 1,304,000 | | | | 2,260,601 | |
| | |
RemeGen Co., Ltd. H Sharesb,c,d | | | 151,500 | | | | 1,856,510 | |
| | |
Times China Holdings, Ltd. | | | 1,252,000 | | | | 1,743,239 | |
| | |
ASM Pacific Technology, Ltd. | | | 105,800 | | | | 1,397,266 | |
| | |
Venus MedTech Hangzhou, Inc. H Sharesb,c,d | | | 136,500 | | | | 1,393,066 | |
| | |
Jacobio Pharmaceuticals Group Co., Ltd.b,c,d | | | 759,900 | | | | 1,387,972 | |
| | |
Kangji Medical Holdings, Ltd.c | | | 515,500 | | | | 999,615 | |
| | |
Zai Lab, Ltd. ADRc | | | 900 | | | | 121,806 | |
| | | | | | | | |
Total China/Hong Kong | | | | | | | 98,352,963 | |
| | | | | | | | |
| | | | | | | | |
| | | |
| INDIA: 20.6% | | | | | | | | |
| | |
Phoenix Mills, Ltd.c | | | 610,829 | | | | 6,481,989 | |
| | |
Shriram City Union Finance, Ltd. | | | 373,802 | | | | 5,439,246 | |
| | |
Crompton Greaves Consumer Electricals, Ltd. | | | 899,980 | | | | 4,696,547 | |
| | |
Dr. Lal PathLabs, Ltd.b,d | | | 132,154 | | | | 4,172,666 | |
| | |
IFB Industries, Ltd.c | | | 243,339 | | | | 3,897,683 | |
| | |
Lemon Tree Hotels, Ltd.b,c,d | | | 5,712,363 | | | | 3,155,245 | |
| | |
Galaxy Surfactants, Ltd.d | | | 111,515 | | | | 3,056,809 | |
| | |
Ashok Leyland, Ltd. | | | 2,274,606 | | | | 2,976,710 | |
| | |
Marico, Ltd. | | | 479,426 | | | | 2,644,067 | |
| | |
GMR Infrastructure, Ltd.c | | | 6,885,633 | | | | 2,499,712 | |
| | |
Finolex Cables, Ltd. | | | 471,149 | | | | 2,226,907 | |
| | |
Shankara Building Products, Ltd. | | | 162,916 | | | | 779,520 | |
| | |
Gabriel India, Ltd. | | | 252,296 | | | | 364,628 | |
| | |
Burger King India, Ltd.c | | | 116,751 | | | | 280,423 | |
| | | | | | | | |
Total India | | | | | | | 42,672,152 | |
| | | | | | | | |
| | | | | | | | |
| | | |
| TAIWAN: 14.5% | | | | | | | | |
| | |
Andes Technology Corp. | | | 383,000 | | | | 4,570,877 | |
| | |
Accton Technology Corp. | | | 394,000 | | | | 4,442,230 | |
| | |
Yageo Corp. | | | 228,000 | | | | 4,220,228 | |
| | |
ASMedia Technology, Inc. | | | 71,000 | | | | 3,977,841 | |
| | | | | | | | |
| | | Shares | | | Value | |
| | |
M31 Technology Corp. | | | 263,000 | | | | $3,168,380 | |
| | |
Formosa Sumco Technology Corp. | | | 643,000 | | | | 3,096,330 | |
| | |
Sporton International, Inc. | | | 309,000 | | | | 2,954,378 | |
| | |
Voltronic Power Technology Corp. | | | 48,001 | | | | 1,918,003 | |
| | |
Realtek Semiconductor Corp. | | | 123,000 | | | | 1,713,566 | |
| | | | | | | | |
Total Taiwan | | | | | | | 30,061,833 | |
| | | | | | | | |
| | | | | | | | |
| | | |
| SOUTH KOREA: 8.7% | | | | | | | | |
| | |
Hugel, Inc.c | | | 22,132 | | | | 3,828,960 | |
| | |
Eugene Technology Co., Ltd. | | | 96,713 | | | | 2,976,104 | |
| | |
Wonik IPS Co., Ltd.c | | | 71,518 | | | | 2,918,431 | |
| | |
Koh Young Technology, Inc. | | | 21,921 | | | | 2,120,908 | |
| | |
KINX, Inc. | | | 26,956 | | | | 1,785,454 | |
| | |
Vitzrocell Co., Ltd. | | | 113,644 | | | | 1,729,116 | |
| | |
ESR Kendall Square REIT Co., Ltd.c | | | 360,692 | | | | 1,683,428 | |
| | |
LEENO Industrial, Inc. | | | 8,238 | | | | 1,024,514 | |
| | | | | | | | |
Total South Korea | | | | | | | 18,066,915 | |
| | | | | | | | |
| | | | | | | | |
| | | |
| VIETNAM: 2.2% | | | | | | | | |
| | |
Nam Long Investment Corp. | | | 1,949,055 | | | | 2,489,392 | |
| | |
Saigon Cargo Service Corp. | | | 196,750 | | | | 1,091,428 | |
| | |
FPT Corp. | | | 406,460 | | | | 1,039,926 | |
| | | | | | | | |
Total Vietnam | | | | | | | 4,620,746 | |
| | | | | | | | |
| | | | | | | | |
| | | |
| INDONESIA: 1.5% | | | | | | | | |
| | |
PT Mitra Adiperkasac | | | 54,869,800 | | | | 3,087,681 | |
| | | | | | | | |
Total Indonesia | | | | | | | 3,087,681 | |
| | | | | | | | |
| | | | | | | | |
| | | |
| PHILIPPINES: 1.3% | | | | | | | | |
| | |
Wilcon Depot, Inc. | | | 7,940,500 | | | | 2,800,357 | |
| | | | | | | | |
Total Philippines | | | | | | | 2,800,357 | |
| | | | | | | | |
| | | | | | | | |
| | | |
| THAILAND: 1.3% | | | | | | | | |
| | |
Kasikornbank Public Co., Ltd. | | | 662,900 | | | | 2,499,469 | |
| | |
Humanica Public Co., Ltd. | | | 642,400 | | | | 191,798 | |
| | | | | | | | |
Total Thailand | | | | | | | 2,691,267 | |
| | | | | | | | |
| | | | | | | | |
| | | |
| UNITED STATES: 1.0% | | | | | | | | |
| | |
Legend Biotech Corp. ADRc | | | 70,659 | | | | 1,989,757 | |
| | | | | | | | |
Total United States | | | | | | | 1,989,757 | |
| | | | | | | | |
| | | | | | | | |
| | | |
| SINGAPORE: 0.9% | | | | | | | | |
| | |
Keppel DC, REIT | | | 846,600 | | | | 1,802,774 | |
| | | | | | | | |
Total Singapore | | | | | | | 1,802,774 | |
| | | | | | | | |
| | | | | | | | |
| | | |
| MALAYSIA: 0.3% | | | | | | | | |
| | |
MR DIY Group M BHDb,d | | | 788,100 | | | | 611,280 | |
| | | | | | | | |
Total Malaysia | | | | | | | 611,280 | |
| | | | | | | | |
| | | | | | | | |
| | | |
| TOTAL INVESTMENTS: 99.8% | | | | | | | 206,757,725 | |
(Cost $140,393,406) | | | | | | | | |
| | | | | | | | |
| | |
CASH AND OTHER ASSETS,
LESS LIABILITIES: 0.2% | | | | | | | 384,551 | |
| | | | | | | | |
| | |
NET ASSETS: 100.0% | | | | | | | $207,142,276 | |
| | | | | | | | |
Matthews Asia Small Companies Fund
December 31, 2020
Schedule of Investmentsa (continued)
| a | Certain securities were fair valued under the valuation policies approved by the Board of Trustees (Note 2-A). |
| b | Security exempt from registration under Rule 144A of the Securities Act of 1933, as amended. The security may be resold in transactions exempt from registration normally to qualified institutional buyers. The security has been determined to be liquid in accordance with procedures adopted by the Funds’ Board of Trustees. At December 31, 2020, the aggregate value is $40,848,253, which is 19.72% of net assets. |
| c | Non-income producing security. |
| d | The securities may be resold to qualified foreign investors and foreign institutional buyers under Regulation S of the Securities Act of 1933. |
| ADR | American Depositary Receipt |
| REIT | Real Estate Investment Trust |
See accompanying notes to financial statements.
| | | | |
| matthewsasia.com | 800.789.ASIA | | | 87 | |
| | | | |
| PORTFOLIO MANAGERS | | |
| | |
| Winnie Chwang* | | | | |
Lead Manager | | | | |
| | |
| Andrew Mattock, CFA* | | | | |
Lead Manager | | | | |
|
* As of August 31, 2020 |
| |
| FUND FACTS | | |
| | |
| | | Investor | | Institutional |
Ticker | | MCSMX | | MICHX |
CUSIP | | 577125404 | | 577125842 |
Inception | | 5/31/11 | | 11/30/17 |
NAV | | $19.86 | | $19.90 |
Initial Investment | | $2,500 | | $100,000 |
Gross Expense Ratio1 | | 1.52% | | 1.37% |
After Fee Waiver and Reimbursement2 | | 1.43% | | 1.20% |
Portfolio Statistics | | |
Total # of Positions | | 58 |
Net Assets | | $383.8 million |
Weighted Average Market Cap | | $6.0 billion |
Portfolio Turnover3 | | 152.9% |
Benchmark | | |
MSCI China Small Cap Index |
OBJECTIVE
Long-term capital appreciation.
STRATEGY
Under normal market conditions, the Fund seeks to achieve its investment objective by investing at least 80% of its net assets, which include borrowings for investment purposes, in the common and preferred stocks of Small Companies located in China. China includes its administrative and other districts, such as Hong Kong. The Fund defines Small Companies as companies with market capitalization no higher than the greater of $5 billion or the market capitalization of the largest company included in the Fund’s primary benchmark, the MSCI China Small Cap Index.
Matthews China Small Companies Fund
Portfolio Manager Commentary (unaudited)
For the year ending December 31, 2020, the Matthews China Small Companies Fund returned 82.52% (Investor Class) and 82.89% (Institutional Class), outperforming its benchmark, the MSCI China Small Cap Index, which returned 27.21% over the same period. For the fourth quarter of the year, the Fund returned 13.65% (Investor Class) and 13.73% (Institutional Class), versus 16.86% for the Index.
Market Environment:
From a global perspective, small companies generally faced greater challenges amid the pandemic than their larger peers, as larger companies tend to have more access to liquidity and resources during periods of economic strain. Nonetheless, small companies in China were strong performers in 2020, providing global investors with meaningful diversification and attractive equity price returns. One reason that China small companies stood out in the year was their focus on domestic demand and opportunities. China’s effective handling of the pandemic meant that its domestic economy re-opened much more quickly than other large economies globally. With the coronavirus pandemic held in check across China, cities, governments, businesses and schools remain open for regular, daily activities. Government micro-reforms in areas such as health care, education and housing continue to support sustainable growth in economic activity.
In addition, as domestic Chinese investors’ sentiment continued to improve throughout the year, the recovery in equity prices quickly broadened to include small and mid-size businesses. The rapid changes brought about by the pandemic created opportunities for innovative businesses to grow and consolidate market share. Trends accelerated by the pandemic included increased e-commerce sales, as well as higher demand for streaming and digital content and entertainment. The pandemic also underscored the need for greater workforce productivity and flexibility, as well as demand for more flexible and scalable health care solutions for a population of over a billion people. While the year began with a great deal of economic uncertainty, it ended on a strong note of optimism by an economy that has experience adapting to rapid change.
Performance Contributors and Detractors:
Stock selection in industrials and information technology were notable contributors in the full year. The only sector that was a slight detractor was materials, where stock selection was negative for the year.
Among individual securities, a contributor was Ginlong Technology Co., a company that manufactures solar inverters for solar energy production. China is very close to achieving grid parity, where the price of renewable energy becomes more competitive with the price of energy produced through fossil fuels. The trajectory of renewable energy expansion in China is very clear in our view and we expect continued solar growth in China given the government’s supportive policies, such as a goal of carbon neutrality by 2060. The solar inverters are a critical component in solar modules and may have more pricing protection when compared to other solar module components given a more consolidated market structure.
(continued)
| 1 | Actual 2020 expense ratios. |
| 2 | Matthews has contractually agreed (i) to waive fees and reimburse expenses to the extent needed to limit Total Annual Fund Operating Expenses (excluding Rule 12b-1 fees, taxes, interest, brokerage commissions, short sale dividend expenses, expenses incurred in connection with any merger or reorganization or extraordinary expenses such as litigation) of the Institutional Class to 1.20% first by waiving class specific expenses (i.e., shareholder service fees specific to a particular class) of the Institutional Class and then, to the extent necessary, by waiving non-class specific expenses (e.g., custody fees) of the Institutional Class, and (ii) if any Fund-wide expenses (i.e., expenses that apply to both the Institutional Class and the Investor Class) are waived for the Institutional Class to maintain the 1.20% expense limitation, to waive an equal amount (in annual percentage terms) of those same expenses for the Investor Class. The Total Annual Fund Operating Expenses After Fee Waiver and Expense Reimbursement for the Investor Class may vary from year to year and will in some years exceed 1.20%. If the operating expenses fall below the expense limitation in a year within three years after Matthews has made a waiver or reimbursement, the Fund may reimburse Matthews up to an amount that does not cause the expenses for that year to exceed the lesser of (i) the expense limitation applicable at the time of that fee waiver and/or expense reimbursement or (ii) the expense limitation in effect at the time of recoupment. This agreement will remain in place until April 30, 2022 and may be terminated at any time by the Board of Trustees on behalf of the Fund on 60 days’ written notice to Matthews. Matthews may decline to renew this agreement by written notice to the Trust at least 30 days before its annual expiration date. |
| 3 | The lesser of fiscal year 2020 long-term purchase costs or sales proceeds divided by the average monthly market value of long-term securities. |
| | | | | | | | | | | | | | | | | | | | | | | | |
| | | | | | | |
| PERFORMANCE AS OF DECEMBER 31, 2020 | | | | | | | | | | | | | | | | | | |
| | | | | | | | | Average Annual Total Returns | | | | |
| | | 3 Months | | | 1 Year | | | 3 Years | | | 5 Years | | | Since
Inception | | | Inception
date | |
Investor Class (MCSMX) | | | 13.65% | | | | 82.52% | | | | 26.71% | | | | 25.05% | | | | 12.48% | | | | 05/31/11 | |
Institutional Class (MICHX) | | | 13.73% | | | | 82.89% | | | | 26.99% | | | | n.a. | | | | 28.63% | | | | 11/30/17 | |
MSCI China Small Cap Index4 | | | 16.86% | | | | 27.21% | | | | 2.96% | | | | 5.05% | | | | 2.37% | 5 | | | | |
Performance assumes reinvestment of all dividends and/or distributions before taxes. All performance quoted represents past performance and is no guarantee of future results. Investment return and principal value will fluctuate with market conditions so that when redeemed, shares may be worth more or less than their original cost. Current performance may be lower or higher than the return figures quoted. Returns would have been lower if certain of the Fund’s fees and expenses had not been waived. For the Fund’s most recent month-end performance, visit matthewsasia.com.
GROWTH OF A HYPOTHETICAL $10,000 INVESTMENT SINCE INCEPTION—INVESTOR CLASS

Plotted monthly. The performance data and graph do not reflect the deduction of taxes that a shareholder would pay on dividends, capital gains distributions or redemption of Fund shares. Values are in US$.
| | 4 | It is not possible to invest directly in an index. Source: Index data from Morgan Stanley Capital International and Bloomberg; total return calculations performed by BNY Mellon Investment Servicing (US) Inc. Please see page 93 for index definition. |
| | | | | | | | |
| | | | |
| TOP TEN HOLDINGS6 | | | | | | | |
| | | Sector | | | | % of Net Assets | |
SITC International Holdings Co., Ltd. | | Industrials | | | | | 4.7% | |
Weimob, Inc. | | Information Technology | | | | | 3.8% | |
Bilibili, Inc. | | Communication Services | | | | | 3.3% | |
Silergy Corp. | | Information Technology | | | | | 3.0% | |
Ever Sunshine Lifestyle Services Group, Ltd. | | Industrials | | | | | 2.9% | |
Flat Glass Group Co., Ltd. | | Information Technology | | | | | 2.9% | |
Jiumaojiu International Holdings, Ltd. | | Consumer Discretionary | | | | | 2.7% | |
Asia Cement China Holdings Corp. | | Materials | | | | | 2.6% | |
China Meidong Auto Holdings, Ltd. | | Consumer Discretionary | | | | | 2.6% | |
Times China Holdings, Ltd. | | Real Estate | | | | | 2.5% | |
% OF ASSETS IN TOP 10 | | | | | | | 31.0% | |
| | 6 | Holdings may combine more than one security from same issuer and related depositary receipts. |
| | | | |
| matthewsasia.com | 800.789.ASIA | | | 89 | |
Matthews China Small Companies Fund
Portfolio Manager Commentary (unaudited) (continued)
On the other hand, a slight detractor was Times China, which focuses on developments in the Greater Bay Area in Guangdong province. China’s policymakers have earmarked the region for further development in high-value-adding sectors such as the technology and financial industries, and is likely to see growth in infrastructure connectivity over time. The real estate industry has been sluggish as the pandemic has disrupted sales in China, but we continue to like the company’s long-term prospects in land banking, as well as its attractive valuations.
Notable Portfolio Changes:
During the fourth quarter, we added a position to Estun Automation Co., China’s leading robot manufacturer with strong technical capabilities and an 80% overall rate in component self-sufficiency. Amid recovery in the industrial automation industry in China, the company has seen a rebound in orders, creating positive sentiment and leading to stock price gains in the month. We believe local companies, through price competitiveness and improving quality, stand to gain market share against foreign competitors in this industry, where foreigners still hold the lion’s share of the market.
We also initiated a position in China Yongda Automobiles Services Holdings, a luxury auto dealer carrying brands such as BMW and Porsche. Yongda is also seeking to expand and broaden its product portfolio to include other strong performing luxury brands such as Mercedes and Lexus. Overall luxury brands are still growing strongly in China, and the company continues to have the opportunity to deliver more aftermarket sales to a growing base of luxury cars. Yongda also trades at an attractive valuation in our view.
Outlook:
Looking ahead, we expect domestic consumption and services to continue driving China’s economic growth. Expansion of consumer buying power in lower-tier cities will remain a key theme we are following. With the coronavirus pandemic held in check across China, cities, governments, businesses and schools remain open for regular, daily activities. Government micro-reforms in areas such as health care, education and housing continue to support sustainable growth in economic activity. Regardless of the potential for U.S.—China trade tensions to ease under the incoming Biden administration, we expect that the local information technology ecosystem and supply chain within China will continue to develop under its own momentum. While some sectors of China’s equity markets are starting to look expensive, there is still a lot of untapped value that can be uncovered through an active approach to security selection. China is not immune from the potential impact of a slowdown in the global economy, but it may be better positioned to weather any such slowdown by drawing on domestic growth drivers.
| | | | |
| |
| COUNTRY ALLOCATION (%)7 | |
| China/Hong Kong | | | 91.6 | |
| Taiwan | | | 5.8 | |
| Cash and Other Assets, Less Liabilities | | | 2.6 | |
| | | | |
| |
| SECTOR ALLOCATION (%)7 | |
| Information Technology | | | 25.4 | |
| Industrials | | | 22.8 | |
| Health Care | | | 11.8 | |
| Consumer Discretionary | | | 11.7 | |
| Real Estate | | | 8.1 | |
| Materials | | | 6.3 | |
| Consumer Staples | | | 4.4 | |
| Financials | | | 3.6 | |
| Communication Services | | | 3.3 | |
| Cash and Other Assets, Less Liabilities | | | 2.6 | |
| | | | |
| | |
| MARKET CAP EXPOSURE (%)7,8 | | | |
| Mega Cap (over $25B) | | | 3.3 | |
| Large Cap ($10B–$25B) | | | 10.8 | |
| Mid Cap ($3B–10B) | | | 58.9 | |
| Small Cap (under $3B) | | | 24.4 | |
| Cash and Other Assets, Less Liabilities | | | 2.6 | |
| 7 | Source: FactSet Research Systems. Percentage values in data are rounded to the nearest tenth of one percent, so the values may not sum to 100% due to rounding. Country allocations and percentage values may be derived from different data sources and may not be consistent with other Fund literature. |
| 8 | The Fund defines Small Companies as companies with market capitalization no higher than the greater of $5 billion or the market capitalization of the largest company included in the Fund’s primary benchmark, the MSCI China Small Cap Index. |
Matthews China Small Companies Fund
December 31, 2020
Schedule of Investmentsa
COMMON EQUITIES: 97.4%
| | | | | | | | |
| | | Shares | | | Value | |
| | |
| INFORMATION TECHNOLOGY: 25.4% | | | | | | | | |
Semiconductors & Semiconductor Equipment: 9.8% | |
| | |
Silergy Corp. | | | 133,000 | | | | $11,446,204 | |
| | |
Flat Glass Group Co., Ltd. H Shares | | | 2,616,000 | | | | 11,035,123 | |
| | |
WIN Semiconductors Corp. | | | 619,000 | | | | 7,640,555 | |
| | |
StarPower Semiconductor, Ltd. A Shares | | | 199,292 | | | | 7,362,114 | |
| | | | | | | | |
| | | | | | | 37,483,996 | |
| | | | | | | | |
| | | | | | | | |
Software: 9.1% | | | | | | | | |
| | |
Weimob, Inc.b,c,d | | | 8,144,000 | | | | 14,681,218 | |
| | |
China Youzan, Ltd.c | | | 29,684,000 | | | | 8,865,187 | |
| | |
Kingdee International Software Group Co., Ltd. | | | 1,875,000 | | | | 7,654,798 | |
| | |
Ming Yuan Cloud Group Holdings, Ltd.c | | | 606,000 | | | | 3,732,067 | |
| | | | | | | | |
| | | | | | | 34,933,270 | |
| | | | | | | | |
| | | | | | | | |
IT Services: 4.8% | | | | | | | | |
| | |
21Vianet Group, Inc. ADRc | | | 230,600 | | | | 7,999,514 | |
| | |
Chinasoft International, Ltd. | | | 6,668,000 | | | | 7,452,255 | |
| | |
Shanghai AtHub Co., Ltd. A Shares | | | 305,562 | | | | 2,829,130 | |
| | | | | | | | |
| | | | | | | 18,280,899 | |
| | | | | | | | |
| | | | | | | | |
Communications Equipment: 1.7% | | | | | | | | |
| | |
Accton Technology Corp. | | | 588,000 | | | | 6,629,521 | |
| | | | | | | | |
| | | | | | | | |
Electronic Equipment, Instruments & Components: 0.0% | |
| | |
China High Precision Automation Group, Ltd.c,e | | | 195,000 | | | | 252 | |
| | | | | | | | |
Total Information Technology | | | | | | | 97,327,938 | |
| | | | | | | | |
| | | | | | | | |
| | | |
| INDUSTRIALS: 22.8% | | | | | | | | |
Machinery: 6.4% | | | | | | | | |
| | |
Airtac International Group | | | 260,000 | | | | 8,356,563 | |
| | |
Leader Harmonious Drive Systems Co., Ltd. A Sharesc | | | 334,582 | | | | 7,501,143 | |
| | |
Hefei Meiya Optoelectronic Technology, Inc. A Shares | | | 661,400 | | | | 4,507,260 | |
| | |
Estun Automation Co., Ltd. A Sharesc | | | 910,100 | | | | 4,177,668 | |
| | | | | | | | |
| | | | | | | 24,542,634 | |
| | | | | | | | |
| | | | | | | | |
Electrical Equipment: 5.6% | | | | | | | | |
| | |
Ginlong Technologies Co., Ltd. A Shares | | | 407,610 | | | | 9,316,401 | |
| | |
Hongfa Technology Co., Ltd. A Shares | | | 879,955 | | | | 7,351,609 | |
| | |
Zhejiang HangKe Technology, Inc., Co. A Shares | | | 390,800 | | | | 4,968,185 | |
| | | | | | | | |
| | | | | | | 21,636,195 | |
| | | | | | | | |
| | | | | | | | |
Marine: 4.7% | | | | | | | | |
| | |
SITC International Holdings Co., Ltd. | | | 8,328,500 | | | | 17,986,729 | |
| | | | | | | | |
| | | | | | | | |
Commercial Services & Supplies: 2.9% | | | | | | | | |
| | |
Ever Sunshine Lifestyle Services Group, Ltd.d | | | 5,048,000 | | | | 11,086,248 | |
| | | | | | | | |
| | | | | | | | |
Transportation Infrastructure: 1.7% | | | | | | | | |
| | |
Hainan Meilan International Airport Co., Ltd. H Sharesc | | | 1,224,000 | | | | 6,474,742 | |
| | | | | | | | |
Professional Services: 1.5% | | | | | | | | |
| | |
Centre Testing International Group Co., Ltd. A Shares | | | 1,359,959 | | | | 5,723,141 | |
| | | | | | | | |
Total Industrials | | | | | | | 87,449,689 | |
| | | | | | | | |
| | | | | | | | |
| | | | | | | | |
| | | Shares | | | Value | |
| | |
| HEALTH CARE: 11.8% | | | | | | | | |
Health Care Equipment & Supplies: 3.9% | | | | | | | | |
| | |
Peijia Medical, Ltd.b,c,d | | | 1,526,000 | | | | $5,568,292 | |
| | |
China Isotope & Radiation Corp. | | | 1,325,000 | | | | 4,602,532 | |
| | |
Kangji Medical Holdings, Ltd.c | | | 1,264,000 | | | | 2,451,045 | |
| | |
AK Medical Holdings, Ltd.b,d | | | 1,390,000 | | | | 2,409,690 | |
| | | | | | | | |
| | | | | | | 15,031,559 | |
| | | | | | | | |
| | | | | | | | |
Life Sciences Tools & Services: 2.3% | | | | | | | | |
| | |
Pharmaron Beijing Co., Ltd. H Sharesb,d | | | 510,900 | | | | 8,637,645 | |
| | | | | | | | |
| | | | | | | | |
Biotechnology: 1.9% | | | | | | | | |
| | |
Innovent Biologics, Inc.b,c,d | | | 267,000 | | | | 2,819,550 | |
| | |
Shenzhen New Industries Biomedical | | | | | | | | |
| | |
Engineering Co., Ltd. A Shares | | | 138,650 | | | | 2,807,083 | |
| | |
Amoy Diagnostics Co., Ltd. A Shares | | | 143,285 | | | | 1,723,073 | |
| | | | | | | | |
| | | | | | | 7,349,706 | |
| | | | | | | | |
| | | | | | | | |
Pharmaceuticals: 1.4% | | | | | | | | |
| | |
Asymchem Laboratories (Tianjin) Co., Ltd. A Shares | | | 118,737 | | | | 5,465,943 | |
| | | | | | | | |
| | | | | | | | |
Health Care Providers & Services: 1.4% | | | | | | | | |
| | |
Dian Diagnostics Group Co., Ltd. A Shares | | | 1,029,652 | | | | 5,425,286 | |
| | | | | | | | |
| | | | | | | | |
Health Care Technology: 0.9% | | | | | | | | |
| | |
Winning Health Technology Group Co., Ltd. A Shares | | | 1,263,327 | | | | 3,403,450 | |
| | | | | | | | |
Total Health Care | | | | | | | 45,313,589 | |
| | | | | | | | |
| | | | | | | | |
| | | |
| CONSUMER DISCRETIONARY: 11.7% | | | | | | | | |
Specialty Retail: 4.9% | | | | | | | | |
| | |
China Meidong Auto Holdings, Ltd. | | | 2,424,000 | | | | 9,867,098 | |
| | |
China Yongda Automobiles Services Holdings, Ltd. | | | 4,422,500 | | | | 7,333,541 | |
| | |
Pou Sheng International Holdings, Ltd.c | | | 7,441,000 | | | | 1,767,252 | |
| | | | | | | | |
| | | | | | | 18,967,891 | |
| | | | | | | | |
| | | | | | | | |
Hotels, Restaurants & Leisure: 2.7% | | | | | | | | |
| | |
Jiumaojiu International Holdings, Ltd.b,c,d | | | 3,344,000 | | | | 10,189,527 | |
| | | | | | | | |
| | | | | | | | |
Diversified Consumer Services: 2.0% | | | | | | | | |
| | |
China Yuhua Education Corp., Ltd.b,d | | | 8,940,000 | | | | 7,796,329 | |
| | | | | | | | |
| | | | | | | | |
Household Durables: 1.1% | | | | | | | | |
| | |
Joyoung Co., Ltd. A Shares | | | 848,058 | | | | 4,186,815 | |
| | | | | | | | |
| | | | | | | | |
Internet & Direct Marketing Retail: 1.0% | | | | | | | | |
| | |
Tongcheng-Elong Holdings, Ltd.c,d | | | 2,028,000 | | | | 3,930,544 | |
| | | | | | | | |
Total Consumer Discretionary | | | | | | | 45,071,106 | |
| | | | | | | | |
| | | | | | | | |
| | | |
| REAL ESTATE: 8.1% | | | | | | | | |
Real Estate Management & Development: 8.1% | | | | | |
| | |
Times China Holdings, Ltd. | | | 6,833,000 | | | | 9,514,021 | |
| | |
KWG Group Holdings, Ltd. | | | 6,405,000 | | | | 8,751,001 | |
| | |
KWG Living Group Holdings, Ltd.c,d | | | 5,805,000 | | | | 4,717,412 | |
| | |
Powerlong Real Estate Holdings, Ltd. | | | 6,602,000 | | | | 4,564,783 | |
| | |
China Overseas Property Holdings, Ltd. | | | 6,505,000 | | | | 3,389,795 | |
| | | | | | | | |
Total Real Estate | | | | | | | 30,937,012 | |
| | | | | | | | |
| | | | | | | | |
| | | | |
| matthewsasia.com | 800.789.ASIA | | | 91 | |
Matthews China Small Companies Fund
December 31, 2020
Schedule of Investmentsa (continued)
COMMON EQUITIES (continued)
| | | | | | | | |
| | | Shares | | | Value | |
| | |
| MATERIALS: 6.3% | | | | | | | | |
Chemicals: 3.7% | | | | | | | | |
| | |
ENN Natural Gas Co., Ltd. A Shares | | | 4,154,242 | | | | $8,689,142 | |
| | |
Zhejiang Juhua Co., Ltd. A Shares | | | 4,451,343 | | | | 5,558,314 | |
| | | | | | | | |
| | | | | | | 14,247,456 | |
| | | | | | | | |
| | | | | | | | |
Construction Materials: 2.6% | | | | | | | | |
| | |
Asia Cement China Holdings Corp. | | | 10,961,500 | | | | 10,002,719 | |
| | | | | | | | |
Total Materials | | | | | | | 24,250,175 | |
| | | | | | | | |
| | | | | | | | |
| | | |
| CONSUMER STAPLES: 4.4% | | | | | | | | |
Food Products: 4.4% | | | | | | | | |
| | |
Yantai China Pet Foods Co., Ltd. A Shares | | | 1,022,499 | | | | 8,997,292 | |
| | |
Kemen Noodle Manufacturing Co., Ltd. A Shares | | | 1,249,100 | | | | 3,404,128 | |
| | |
Sichuan Teway Food Group Co., Ltd. A Shares | | | 178,306 | | | | 2,258,203 | |
| | |
Yihai International Holding, Ltd. | | | 143,000 | | | | 2,123,668 | |
| | | | | | | | |
Total Consumer Staples | | | | | | | 16,783,291 | |
| | | | | | | | |
| | | | | | | | |
| | | |
| FINANCIALS: 3.6% | | | | | | | | |
Diversified Financial Services: 2.1% | | | | | | | | |
Chailease Holding Co., Ltd. | | | 1,329,000 | | | | 7,954,756 | |
| | | | | | | | |
Capital Markets: 1.5% | | | | | | | | |
| | |
Haitong International Securities Group, Ltd. | | | 16,262,000 | | | | 3,922,036 | |
| | |
China Renaissance Holdings, Ltd.b,d | | | 1,011,700 | | | | 2,069,094 | |
| | | | | | | | |
| | | | | | | 5,991,130 | |
| | | | | | | | |
Total Financials | | | | | | | 13,945,886 | |
| | | | | | | | |
| | | | | | | | |
| | | |
| COMMUNICATION SERVICES: 3.3% | | | | | | | | |
Entertainment: 3.3% | | | | | | | | |
| | |
Bilibili, Inc. ADRc | | | 148,100 | | | | 12,695,132 | |
| | | | | | | | |
Total Communication Services | | | | | | | 12,695,132 | |
| | | | | | | | |
| | | | | | | | |
| | | |
| TOTAL INVESTMENTS: 97.4% | | | | | | | 373,773,818 | |
(Cost $284,676,317) | | | | | | | | |
| | | | | | | | |
| | |
CASH AND OTHER ASSETS,
LESS LIABILITIES: 2.6% | | | | | | | 9,995,401 | |
| | | | | | | | |
| | |
NET ASSETS: 100.0% | | | | | | | $383,769,219 | |
| | | | | | | | |
| a | Certain securities were fair valued under the valuation policies approved by the Board of Trustees (Note 2-A). |
| b | Security exempt from registration under Rule 144A of the Securities Act of 1933, as amended. The security may be resold in transactions exempt from registration normally to qualified institutional buyers. The security has been determined to be liquid in accordance with procedures adopted by the Funds’ Board of Trustees. At December 31, 2020, the aggregate value is $54,171,345, which is 14.12% of net assets. |
| c | Non-income producing security. |
| d | The securities may be resold to qualified foreign investors and foreign institutional buyers under Regulation S of the Securities Act of 1933. |
| e | Security is valued using significant unobservable inputs and is classified as Level 3 in the fair value hierarchy. The aggregate value of Level 3 security is $252 and 0.00% of net assets. |
| ADR | American Depositary Receipt |
See accompanying notes to financial statements.
Index Definitions
The MSCI Emerging Markets Index is a free float-adjusted market capitalization-weighted index of the stock markets of Argentina, Brazil, Chile, China, Colombia, Czech Republic, Egypt, Greece, Hungary, India, Indonesia, Kuwait, Malaysia, Mexico, Pakistan, Peru, Philippines, Poland, Qatar, Russia, Saudi Arabia, South Africa, South Korea, Taiwan, Thailand, Turkey and United Arab Emirates.
The Markit iBoxx Asian Local Bond Index (ALBI) tracks the total return performance of a bond portfolio consisting of local currency denominated, high quality and liquid bonds in Asia ex Japan. The ALBI includes bonds from the following countries: China, Hong Kong, India, Indonesia, Malaysia, Philippines, Singapore, South Korea, Taiwan and Thailand.
The J.P. Morgan Asia Credit Index (JACI) tracks the total return performance of the Asia fixed-rate dollar bond market. JACI is a market capitalization-weighted index comprising sovereign, quasi-sovereign and corporate bonds and is partitioned by country, sector and credit rating. JACI includes bonds from the following countries: China, Hong Kong, India, Indonesia, Malaysia, Philippines, Singapore, South Korea and Thailand.
The MSCI All Country Asia ex Japan Index is a free float-adjusted market capitalization-weighted index of the stock markets of China, Hong Kong, India, Indonesia, Malaysia, Pakistan, Philippines, Singapore, South Korea, Taiwan and Thailand.
The MSCI All Country Asia Pacific Index is a free float-adjusted market capitalization-weighted index of the stock markets of Australia, China, Hong Kong, India, Indonesia, Japan, Malaysia, New Zealand, Pakistan, Philippines, Singapore, South Korea, Taiwan and Thailand.
The MSCI China Index is a free float-adjusted market capitalization-weighted index of Chinese equities that includes H shares listed on the Hong Kong exchange, B shares listed on the Shanghai and Shenzhen exchanges, Hong Kong-listed securities known as Red Chips (issued by entities owned by national or local governments in China) and P Chips (issued by companies
controlled by individuals in China and deriving substantial revenues in China), and foreign listings (e.g., ADRs).
The MSCI Emerging Markets (EM) Asia Index is a free float-adjusted market capitalization-weighted index of the stock markets of China, India, Indonesia, Malaysia, Pakistan, Philippines, South Korea, Taiwan and Thailand.
The MSCI China All Shares Index captures large and mid-cap representation across China A shares, B shares, H shares, Red Chips (issued by entities owned by national or local governments in China), P Chips (issued by companies controlled by individuals in China and deriving substantial revenues in China), and foreign listings (e.g., ADRs). The index aims to reflect the opportunity set of China share classes listed in Hong Kong, Shanghai, Shenzhen and outside of China.
The S&P Bombay Stock Exchange (BSE) 100 Index is a free float-adjusted market capitalization-weighted index of the 100 stocks listed on the Bombay Stock Exchange.
The MSCI Japan Index is a free float-adjusted market capitalization-weighted index of Japanese equities listed in Japan.
The Korea Composite Stock Price Index (KOSPI) is a market capitalization-weighted index of all common stocks listed on the Korea Stock Exchange.
The MSCI All Country Asia ex Japan Small Cap Index is a free float-adjusted market capitalization-weighted small cap index of the stock markets of China, Hong Kong, India, Indonesia, Malaysia, Pakistan, Philippines, Singapore, South Korea, Taiwan and Thailand.
The MSCI China Small Cap Index is a free float-adjusted market capitalization-weighted small cap index of the Chinese equity securities markets, including H shares listed on the Hong Kong exchange, B shares listed on the Shanghai and Shenzhen exchanges, and Hong Kong-listed securities known as Red Chips (issued by entities owned by national or local governments in China) and P Chips (issued by companies controlled by individuals in China and deriving substantial revenues in China), and foreign listings (e.g., ADRs).
| | | | |
| matthewsasia.com | 800.789.ASIA | | | 93 | |
Disclosures
Fund Holdings: The Fund holdings shown in this report are as of December 31, 2020. Holdings are subject to change at any time, so holdings shown in this report may not reflect current Fund holdings. The Funds file complete schedules of portfolio holdings with the Securities and Exchange Commission (the “SEC”) for the first and third quarters of each fiscal year on Form N-PORT. The Funds’ Forms N-PORT are available on the SEC’s website at www.sec.gov. Complete schedules of investments are also available without charge, upon request, from the Funds by calling us at 800.789.ASIA (2742).
Proxy Voting Record: The Funds’ Statement of Additional Information containing a description of the policies and procedures that the Funds have used to vote proxies relating to portfolio securities, along with each Fund’s proxy voting record relating
to portfolio securities held during the most recent 12-month period ended June 30, is available upon request, at no charge, at the Funds’ website at matthewsasia.com or by calling 800.789.ASIA (2742), or on the SEC’s website at www.sec.gov.
Shareholder Reports and Prospectuses: To reduce the Funds’ expenses, we try to identify related shareholders in a household and send only one copy of the Funds’ prospectus and financial reports to that address. This process, called “householding,” will continue indefinitely unless you instruct us otherwise. At any time you may view the Funds’ current prospectus, summary prospectus and financial reports on our website. If you prefer to receive individual copies of the Funds’ prospectus or financial reports, please call us at 800.789.ASIA (2742).
Disclosure of Fund Expenses (unaudited)
We believe it is important for you to understand the impact of fees regarding your investment. All mutual funds have operating expenses. As a shareholder of a mutual fund, you incur ongoing costs, which include costs for portfolio management, administrative services, and shareholder reports (like this one), among others. Operating expenses, which are deducted from a fund’s gross income, directly reduce the investment return of the fund. A fund’s operating expenses are expressed as a percentage of its average net assets. This figure is known as the expense ratio. The following examples are intended to help you understand the ongoing fees (in dollars) of investing in your fund and to compare these costs with those of other mutual funds. The examples are based on an investment of $1,000 made at the beginning of the period shown and held for the entire period.
This table illustrates your fund’s costs in two ways:
Actual Fund Return: This section helps you to estimate the actual operating expenses, after any applicable fee waivers, that you paid over the period. The “Ending Account Value” shown is derived from the fund’s actual return for the past six month period, the “Expense Ratio” column shows the period’s annualized expense ratio, and the “Operating Expenses Paid During Period” column shows the dollar amount that would have been paid by an investor who started with $1,000 in the fund at the beginning of the period. You may use the information here, together with your account value, to estimate the expenses that you paid over the period. To do so, simply divide your account value by $1,000 (for example, an $8,600 account value divided
by $1,000 = 8.6), then multiply the result by the number given for your fund in the first line under the heading entitled “Operating Expenses Paid During Period.”
Hypothetical 5% Return: This section is intended to help you compare your fund’s costs with those of other mutual funds. It assumes that the fund had an annual return of 5% before operating expenses, but that the expense ratio is unchanged. In this case, because the return used is not the fund’s actual return, the results do not apply to your investment. This example is useful in making comparisons to other mutual funds because the Securities and Exchange Commission requires all mutual funds to calculate expenses based on an assumed 5% annual return. You can assess your fund’s costs by comparing this hypothetical example with the hypothetical examples that appear in shareholder reports of other funds.
Please note that the operating expenses shown in the table are meant to highlight and help you compare your ongoing costs only and do not reflect any transactional costs such as sales charges (loads), redemption fees, or exchange fees.
Matthews Asia Funds does not charge any sales loads, exchange fees, or 12b-1 fees, but these may be present in other funds to which you compare this data. Therefore, the hypothetical portions of the table are useful in comparing ongoing costs only, and will not help you determine the relative total costs of owning different funds.
| | | | |
| matthewsasia.com | 800.789.ASIA | | | 95 | |
December 31, 2020
Disclosure of Fund Expenses (unaudited) (continued)
| | | | | | | | | | | | | | | | | | | | | | | | | | | | | | | | | | | | |
| | | INVESTOR | | | | | | INSTITUTIONAL | |
| | | Beginning
Account Value
7/1/20 | | | Ending
Account Value
12/31/20 | | | Expense
Ratio | | | Operating
Expenses
Paid During
Period
7/1/20–
12/31/201 | | | | | | Beginning
Account Value
7/1/20 | | | Ending
Account Value
12/31/20 | | | Expense
Ratio | | | Operating
Expenses
Paid During
Period
7/1/20–
12/31/201 | |
| GLOBAL EMERGING MARKETS STRATEGY | | | | | | | | | | | | | | | | | | | | | | | | | | | | | | | | | | | | |
Matthews Emerging Markets Equity Fund | | | | | | | | | | | | | | | | | | | | | | | | | | | | | | | | | | | | |
Actual Fund Return | | | $1,000.00 | | | | $1,381.60 | | | | 1.07% | | | | $6.41 | | | | | | | | $1,000.00 | | | | $1,384.30 | | | | 0.90% | | | | $5.39 | |
Hypothetical 5% Returns | | | $1,000.00 | | | | $1,019.76 | | | | 1.07% | | | | $5.43 | | | | | | | | $1,000.00 | | | | $1,020.61 | | | | 0.90% | | | | $4.57 | |
| | | | | | | | | |
| ASIA FIXED INCOME STRATEGIES | | | | | | | | | | | | | | | | | | | | | | | | | | | | | | | | | | | | |
Matthews Asia Total Return Bond Fund | | | | | | | | | | | | | | | | | | | | | | | | | | | | | | | | | | | | |
Actual Fund Return | | | $1,000.00 | | | | $1,093.60 | | | | 1.12% | | | | $5.89 | | | | | | | | $1,000.00 | | | | $1,094.80 | | | | 0.90% | | | | $4.74 | |
Hypothetical 5% Returns | | | $1,000.00 | | | | $1,019.51 | | | | 1.12% | | | | $5.69 | | | | | | | | $1,000.00 | | | | $1,020.61 | | | | 0.90% | | | | $4.57 | |
Matthews Asia Credit Opportunities Fund | | | | | | | | | | | | | | | | | | | | | | | | | | | | | | | | | | | | |
Actual Fund Return | | | $1,000.00 | | | | $1,068.60 | | | | 1.13% | | | | $5.88 | | | | | | | | $1,000.00 | | | | $1,070.00 | | | | 0.90% | | | | $4.68 | |
Hypothetical 5% Returns | | | $1,000.00 | | | | $1,019.46 | | | | 1.13% | | | | $5.74 | | | | | | | | $1,000.00 | | | | $1,020.61 | | | | 0.90% | | | | $4.57 | |
| | | | | | | | | |
| ASIA GROWTH AND INCOME STRATEGIES | | | | | | | | | | | | | | | | | | | | | | | | | | | | | | | | | | | | |
Matthews Asian Growth and Income Fund | | | | | | | | | | | | | | | | | | | | | | | | | | | | | | | | | | | | |
Actual Fund Return | | | $1,000.00 | | | | $1,246.70 | | | | 1.05% | | | | $5.93 | | | | | | | | $1,000.00 | | | | $1,246.90 | | | | 0.95% | | | | $5.37 | |
Hypothetical 5% Returns | | | $1,000.00 | | | | $1,019.86 | | | | 1.05% | | | | $5.33 | | | | | | | | $1,000.00 | | | | $1,020.36 | | | | 0.95% | | | | $4.82 | |
Matthews Asia Dividend Fund | | | | | | | | | | | | | | | | | | | | | | | | | | | | | | | | | | | | |
Actual Fund Return | | | $1,000.00 | | | | $1,347.80 | | | | 0.97% | | | | $5.72 | | | | | | | | $1,000.00 | | | | $1,347.50 | | | | 0.88% | | | | $5.19 | |
Hypothetical 5% Returns | | | $1,000.00 | | | | $1,020.26 | | | | 0.97% | | | | $4.93 | | | | | | | | $1,000.00 | | | | $1,020.71 | | | | 0.88% | | | | $4.47 | |
Matthews China Dividend Fund | | | | | | | | | | | | | | | | | | | | | | | | | | | | | | | | | | | | |
Actual Fund Return | | | $1,000.00 | | | | $1,194.20 | | | | 1.13% | | | | $6.23 | | | | | | | | $1,000.00 | | | | $1,194.90 | | | | 1.01% | | | | $5.57 | |
Hypothetical 5% Returns | | | $1,000.00 | | | | $1,019.46 | | | | 1.13% | | | | $5.74 | | | | | | | | $1,000.00 | | | | $1,020.06 | | | | 1.01% | | | | $5.13 | |
| | | | | | | | | |
| ASIA GROWTH STRATEGIES | | | | | | | | | | | | | | | | | | | | | | | | | | | | | | | | | | | | |
Matthews Asia Growth Fund | | | | | | | | | | | | | | | | | | | | | | | | | | | | | | | | | | | | |
Actual Fund Return | | | $1,000.00 | | | | $1,353.50 | | | | 1.06% | | | | $6.27 | | | | | | | | $1,000.00 | | | | $1,354.90 | | | | 0.93% | | | | $5.51 | |
Hypothetical 5% Returns | | | $1,000.00 | | | | $1,019.81 | | | | 1.06% | | | | $5.38 | | | | | | | | $1,000.00 | | | | $1,020.46 | | | | 0.93% | | | | $4.72 | |
Matthews Pacific Tiger Fund | | | | | | | | | | | | | | | | | | | | | | | | | | | | | | | | | | | | |
Actual Fund Return | | | $1,000.00 | | | | $1,352.30 | | | | 1.01% | | | | $5.97 | | | | | | | | $1,000.00 | | | | $1,353.50 | | | | 0.89% | | | | $5.27 | |
Hypothetical 5% Returns | | | $1,000.00 | | | | $1,020.06 | | | | 1.01% | | | | $5.13 | | | | | | | | $1,000.00 | | | | $1,020.66 | | | | 0.89% | | | | $4.52 | |
Matthews Asia ESG Fund | | | | | | | | | | | | | | | | | | | | | | | | | | | | | | | | | | | | |
Actual Fund Return | | | $1,000.00 | | | | $1,419.80 | | | | 1.37% | | | | $8.33 | | | | | | | | $1,000.00 | | | | $1,421.00 | | | | 1.20% | | | | $7.30 | |
Hypothetical 5% Returns | | | $1,000.00 | | | | $1,018.25 | | | | 1.37% | | | | $6.95 | | | | | | | | $1,000.00 | | | | $1,019.10 | | | | 1.20% | | | | $6.09 | |
Matthews Emerging Asia Fund | | | | | | | | | | | | | | | | | | | | | | | | | | | | | | | | | | | | |
Actual Fund Return | | | $1,000.00 | | | | $1,305.00 | | | | 1.34% | | | | $7.76 | | | | | | | | $1,000.00 | | | | $1,305.60 | | | | 1.18% | | | | $6.84 | |
Hypothetical 5% Returns | | | $1,000.00 | | | | $1,018.40 | | | | 1.34% | | | | $6.80 | | | | | | | | $1,000.00 | | | | $1,019.20 | | | | 1.18% | | | | $5.99 | |
Matthews Asia Innovators Fund | | | | | | | | | | | | | | | | | | | | | | | | | | | | | | | | | | | | |
Actual Fund Return | | | $1,000.00 | | | | $1,470.10 | | | | 1.09% | | | | $6.77 | | | | | | | | $1,000.00 | | | | $1,471.20 | | | | 0.95% | | | | $5.90 | |
Hypothetical 5% Returns | | | $1,000.00 | | | | $1,019.66 | | | | 1.09% | | | | $5.53 | | | | | | | | $1,000.00 | | | | $1,020.36 | | | | 0.95% | | | | $4.82 | |
Matthews China Fund | | | | | | | | | | | | | | | | | | | | | | | | | | | | | | | | | | | | |
Actual Fund Return | | | $1,000.00 | | | | $1,273.90 | | | | 1.07% | | | | $6.12 | | | | | | | | $1,000.00 | | | | $1,274.00 | | | | 0.93% | | | | $5.32 | |
Hypothetical 5% Returns | | | $1,000.00 | | | | $1,019.76 | | | | 1.07% | | | | $5.43 | | | | | | | | $1,000.00 | | | | $1,020.46 | | | | 0.93% | | | | $4.72 | |
Matthews India Fund | | | | | | | | | | | | | | | | | | | | | | | | | | | | | | | | | | | | |
Actual Fund Return | | | $1,000.00 | | | | $1,444.40 | | | | 1.04% | | | | $6.39 | | | | | | | | $1,000.00 | | | | $1,445.90 | | | | 0.92% | | | | $5.66 | |
Hypothetical 5% Returns | | | $1,000.00 | | | | $1,019.91 | | | | 1.04% | | | | $5.28 | | | | | | | | $1,000.00 | | | | $1,020.51 | | | | 0.92% | | | | $4.67 | |
Matthews Japan Fund | | | | | | | | | | | | | �� | | | | | | | | | | | | | | | | | | | | | | | |
Actual Fund Return | | | $1,000.00 | | | | $1,297.60 | | | | 0.90% | | | | $5.20 | | | | | | | | $1,000.00 | | | | $1,297.90 | | | | 0.89% | | | | $5.14 | |
Hypothetical 5% Returns | | | $1,000.00 | | | | $1,020.61 | | | | 0.90% | | | | $4.57 | | | | | | | | $1,000.00 | | | | $1,020.66 | | | | 0.89% | | | | $4.52 | |
Matthews Korea Fund | | | | | | | | | | | | | | | | | | | | | | | | | | | | | | | | | | | | |
Actual Fund Return | | | $1,000.00 | | | | $1,468.00 | | | | 1.13% | | | | $7.01 | | | | | | | | $1,000.00 | | | | $1,470.90 | | | | 0.89% | | | | $5.53 | |
Hypothetical 5% Returns | | | $1,000.00 | | | | $1,019.46 | | | | 1.13% | | | | $5.74 | | | | | | | | $1,000.00 | | | | $1,020.66 | | | | 0.89% | | | | $4.52 | |
| 1 | Operating expenses are equal to the Fund’s annualized expense ratio multiplied by the average account value over the period, multiplied by 184 days, then divided by 366. |
December 31, 2020
Disclosure of Fund Expenses (unaudited) (continued)
| | | | | | | | | | | | | | | | | | | | | | | | | | | | | | | | | | | | |
| | | INVESTOR | | | | | | INSTITUTIONAL | |
| | | Beginning
Account Value
7/1/20 | | | Ending
Account Value
12/31/20 | | | Expense
Ratio | | | Operating
Expenses
Paid During
Period
7/1/20–
12/31/201 | | | | | | Beginning
Account Value
7/1/20 | | | Ending
Account Value
12/31/20 | | | Expense
Ratio | | | Operating
Expenses
Paid During
Period
7/1/20–
12/31/201 | |
| | | | | | | | | |
| ASIA SMALL COMPANY STRATEGIES | | | | | | | | | | | | | | | | | | | | | | | | | | | | | | | | | | | | |
Matthews Asia Small Companies Fund | | | | | | | | | | | | | | | | | | | | | | | | | | | | | | | | | | | | |
Actual Fund Return | | | $1,000.00 | | | | $1,304.90 | | | | 1.36% | | | | $7.88 | | | | | | | | $1,000.00 | | | | $1,306.00 | | | | 1.20% | | | | $6.96 | |
Hypothetical 5% Returns | | | $1,000.00 | | | | $1,018.30 | | | | 1.36% | | | | $6.90 | | | | | | | | $1,000.00 | | | | $1,019.10 | | | | 1.20% | | | | $6.09 | |
Matthews China Small Companies Fund | | | | | | | | | | | | | | | | | | | | | | | | | | | | | | | | | | | | |
Actual Fund Return | | | $1,000.00 | | | | $1,157.90 | | | | 1.47% | | | | $7.97 | | | | | | | | $1,000.00 | | | | $1,159.70 | | | | 1.20% | | | | $6.51 | |
Hypothetical 5% Returns | | | $1,000.00 | | | | $1,017.75 | | | | 1.47% | | | | $7.46 | | | | | | | | $1,000.00 | | | | $1,019.10 | | | | 1.20% | | | | $6.09 | |
| 1 | Operating expenses are equal to the Fund’s annualized expense ratio multiplied by the average account value over the period, multiplied by 184 days, then divided by 366. |
| | | | |
| matthewsasia.com | 800.789.ASIA | | | 97 | |
| | |
| Statements of Assets and Liabilities | | December 31, 2020 |
| | | | | | | | | | | | |
| | | Matthews Emerging
Markets Equity Fund1 | | | Matthews Asia
Total Return
Bond Fund | | | Matthews Asia
Credit
Opportunities Fund | |
| | | |
ASSETS: | | | | | | | | | | | | |
| | | |
Investments at value (A) (Note 2-A and 7): | | | | | | | | | | | | |
| | | |
Unaffiliated issuers | | | $42,993,154 | | | | $103,765,224 | | | | $84,040,787 | |
| | | |
Cash | | | 1,883,950 | | | | 9,163,629 | | | | 3,038,178 | |
| | | |
Segregated foreign currency at value | | | 37,769 | | | | 21,431 | | | | 7,582 | |
| | | |
Foreign currency at value (B) | | | 66,961 | | | | 783 | | | | 281 | |
| | | |
Dividends, interest and other receivable | | | 55,457 | | | | 1,890,855 | | | | 1,554,690 | |
| | | |
Receivable for securities sold | | | 248 | | | | — | | | | 424,980 | |
| | | |
Receivable for capital shares sold | | | 2,361,410 | | | | 215,314 | | | | 2,230,718 | |
| | | |
Due from Advisor (Note 5) | | | 32,974 | | | | — | | | | — | |
| | | |
Unrealized appreciation on forward foreign currency exchange contracts | | | — | | | | 1,990,746 | | | | — | |
| | | |
Unrealized appreciation on interest rate swaps | | | — | | | | 704,897 | | | | — | |
| | | |
Prepaid expenses | | | — | | | | 20,049 | | | | 8,548 | |
TOTAL ASSETS | | | 47,431,923 | | | | 117,772,928 | | | | 91,305,764 | |
| | | |
LIABILITIES: | | | | | | | | | | | | |
| | | |
Cash received as collateral for forward foreign currency exchange contracts | | | — | | | | 2,290,000 | | | | — | |
| | | |
Payable for securities purchased | | | 2,483,382 | | | | — | | | | — | |
| | | |
Payable for capital shares redeemed | | | — | | | | 114,533 | | | | 57,547 | |
| | | |
Unrealized depreciation on forward foreign currency exchange contracts | | | — | | | | 280,505 | | | | — | |
| | | |
Deferred foreign capital gains tax liability (Note 2-F) | | | 68,673 | | | | 75,369 | | | | — | |
| | | |
Due to Advisor (Note 5) | | | — | | | | 35,129 | | | | 33,319 | |
| | | |
Administration and accounting fees payable (Note 5) | | | 816 | | | | 2,943 | | | | 2,399 | |
| | | |
Administration and shareholder servicing fees payable (Note 5) | | | 4,390 | | | | 13,383 | | | | 10,351 | |
| | | |
Custodian fees payable | | | 20,889 | | | | 12,485 | | | | 6,742 | |
| | | |
Intermediary service fees payable (Note 5) | | | 2,174 | | | | 17,658 | | | | 15,944 | |
| | | |
Professional fees payable | | | 15,135 | | | | 54,726 | | | | 53,478 | |
| | | |
Transfer agent fees payable | | | 326 | | | | 1,402 | | | | 502 | |
| | | |
Accrued other expenses payable | | | 44,041 | | | | 26,555 | | | | 18,046 | |
TOTAL LIABILITIES | | | 2,639,826 | | | | 2,924,688 | | | | 198,328 | |
| | | |
NET ASSETS | | | $44,792,097 | | | | $114,848,240 | | | | $91,107,436 | |
| | | |
NET ASSETS: | | | | | | | | | | | | |
| | | |
Investor Class | | | $9,851,383 | | | | $40,422,483 | | | | $8,855,714 | |
| | | |
Institutional Class | | | 34,940,714 | | | | 74,425,757 | | | | 82,251,722 | |
TOTAL | | | $44,792,097 | | | | $114,848,240 | | | | $91,107,436 | |
| 1 | The Fund commenced operations on April 30, 2020. |
See accompanying notes to financial statements.
| | |
| Statements of Assets and Liabilities (continued) | | December 31, 2020 |
| | | | | | | | | | | | |
| | | Matthews Emerging
Markets Equity Fund1 | | | Matthews Asia
Total Return
Bond Fund | | | Matthews Asia
Credit
Opportunities Fund | |
SHARES OUTSTANDING: | | | | | | | | | | | | |
| | | |
(shares of beneficial interest issued and outstanding, respectively, unlimited number of shares authorized with a $0.001 par value) | | | | | | | | | | | | |
| | | |
Investor Class | | | 624,899 | | | | 3,593,488 | | | | 862,378 | |
| | | |
Institutional Class | | | 2,216,056 | | | | 6,615,315 | | | | 8,010,654 | |
TOTAL | | | 2,840,955 | | | | 10,208,803 | | | | 8,873,032 | |
| | | |
NET ASSET VALUE: | | | | | | | | | | | | |
Investor Class, offering price and redemption price | | | $15.76 | | | | $11.25 | | | | $10.27 | |
Institutional Class, offering price and redemption price | | | $15.77 | | | | $11.25 | | | | $10.27 | |
| | | |
NET ASSETS CONSISTS OF: | | | | | | | | | | | | |
| | | |
Capital paid-in | | | $37,126,118 | | | | $112,099,328 | | | | $92,707,235 | |
| | | |
Total distributable earnings/(accumulated loss) | | | 7,665,979 | | | | 2,748,912 | | | | (1,599,799 | ) |
NET ASSETS | | | $44,792,097 | | | | $114,848,240 | | | | $91,107,436 | |
| | | |
(A) Investments at cost: | | | | | | | | | | | | |
| | | |
Unaffiliated Issuers | | | $36,019,580 | | | | $99,699,487 | | | | $83,362,761 | |
| | | |
(B) Foreign Currency at Cost | | | $66,961 | | | | $784 | | | | $282 | |
| 1 | The Fund commenced operations on April 30, 2020. |
See accompanying notes to financial statements.
| | | | |
| matthewsasia.com | 800.789.ASIA | | | 99 | |
| | |
| Statements of Assets and Liabilities (continued) | | December 31, 2020 |
| | | | | | | | | | | | |
| | | Matthews Asian
Growth and
Income Fund | | | Matthews Asia
Dividend Fund | | | Matthews China
Dividend Fund | |
| | | |
ASSETS: | | | | | | | | | | | | |
| | | |
Investments at value (A) (Note 2-A and 7): | | | | | | | | | | | | |
| | | |
Unaffiliated issuers | | | $1,446,568,521 | | | | $4,215,591,235 | | | | $373,619,675 | |
| | | |
Affiliated issuers | | | — | | | | 825,791,333 | | | | — | |
| | | |
Cash | | | 52,043,257 | | | | 85,129,719 | | | | 6,025,285 | |
| | | |
Segregated foreign currency at value | | | — | | | | 176,144 | | | | 26,619 | |
| | | |
Foreign currency at value (B) | | | — | | | | 66,995,844 | | | | 3,299,369 | |
| | | |
Dividends, interest and other receivable | | | 2,587,172 | | | | 6,950,088 | | | | 675,322 | |
| | | |
Receivable for securities sold | | | 3,610 | | | | 10,333,979 | | | | 1,542,381 | |
| | | |
Receivable for capital shares sold | | | 1,415,117 | | | | 10,495,313 | | | | 713,532 | |
| | | |
Prepaid expenses | | | 42,778 | | | | 44,472 | | | | 20,187 | |
TOTAL ASSETS | | | 1,502,660,455 | | | | 5,221,508,127 | | | | 385,922,370 | |
| | | |
LIABILITIES: | | | | | | | | | | | | |
| | | |
Foreign currency overdraft | | | 102 | | | | — | | | | — | |
| | | |
Payable for securities purchased | | | 2,127,827 | | | | 10,997,740 | | | | 376,780 | |
| | | |
Payable for capital shares redeemed | | | 1,503,958 | | | | 4,837,833 | | | | 446,082 | |
| | | |
Deferred foreign capital gains tax liability (Note 2-F) | | | 1,834,628 | | | | 52,247 | | | | — | |
| | | |
Due to Advisor (Note 5) | | | 816,367 | | | | 2,800,656 | | | | 206,062 | |
| | | |
Administration and accounting fees payable (Note 5) | | | 36,913 | | | | 123,644 | | | | 9,429 | |
| | | |
Administration and shareholder servicing fees payable (Note 5) | | | 171,692 | | | | 574,732 | | | | 43,356 | |
| | | |
Custodian fees payable | | | 44,238 | | | | 163,779 | | | | 26,586 | |
| | | |
Intermediary service fees payable (Note 5) | | | 179,743 | | | | 576,852 | | | | 59,760 | |
| | | |
Professional fees payable | | | 49,375 | | | | 65,786 | | | | 46,867 | |
| | | |
Transfer agent fees payable | | | 13,753 | | | | 19,655 | | | | 3,663 | |
| | | |
Accrued other expenses payable | | | 126,955 | | | | 359,282 | | | | 60,826 | |
TOTAL LIABILITIES | | | 6,905,551 | | | | 20,572,206 | | | | 1,279,411 | |
| | | |
NET ASSETS | | | $1,495,754,904 | | | | $5,200,935,921 | | | | $384,642,959 | |
| | | |
NET ASSETS: | | | | | | | | | | | | |
| | | |
Investor Class | | | $673,576,064 | | | | $2,292,262,037 | | | | $269,191,714 | |
| | | |
Institutional Class | | | 822,178,840 | | | | 2,908,673,884 | | | | 115,451,245 | |
TOTAL | | | $1,495,754,904 | | | | $5,200,935,921 | | | | $384,642,959 | |
See accompanying notes to financial statements.
| | |
| Statements of Assets and Liabilities (continued) | | December 31, 2020 |
| | | | | | | | | | | | |
| | | Matthews Asian
Growth and
Income Fund | | | Matthews Asia
Dividend Fund | | | Matthews China
Dividend Fund | |
SHARES OUTSTANDING: | | | | | | | | | | | | |
| | | |
(shares of beneficial interest issued and outstanding, respectively, unlimited number of shares authorized with a $0.001 par value) | | | | | | | | | | | | |
| | | |
Investor Class | | | 37,313,103 | | | | 101,304,386 | | | | 13,706,779 | |
| | | |
Institutional Class | | | 45,628,521 | | | | 128,560,302 | | | | 5,878,667 | |
TOTAL | | | 82,941,624 | | | | 229,864,688 | | | | 19,585,446 | |
| | | |
NET ASSET VALUE: | | | | | | | | | | | | |
Investor Class, offering price and redemption price | | | $18.05 | | | | $22.63 | | | | $19.64 | |
Institutional Class, offering price and redemption price | | | $18.02 | | | | $22.62 | | | | $19.64 | |
| | | |
NET ASSETS CONSISTS OF: | | | | | | | | | | | | |
| | | |
Capital paid-in | | | $1,142,163,409 | | | | $3,312,645,463 | | | | $304,703,583 | |
| | | |
Total distributable earnings/(accumulated loss) | | | 353,591,495 | | | | 1,888,290,458 | | | | 79,939,376 | |
NET ASSETS | | | $1,495,754,904 | | | | $5,200,935,921 | | | | $384,642,959 | |
| | | |
(A) Investments at cost: | | | | | | | | | | | | |
| | | |
Unaffiliated Issuers | | | $1,064,007,550 | | | | $2,723,629,989 | | | | $290,469,962 | |
| | | |
Affiliated Issuers | | | — | | | | 427,978,825 | | | | — | |
| | | |
(B) Foreign Currency at Cost | | | $— | | | | $65,026,797 | | | | $3,221,937 | |
See accompanying notes to financial statements.
| | | | |
| matthewsasia.com | 800.789.ASIA | | | 101 | |
| | |
| Statements of Assets and Liabilities (continued) | | December 31, 2020 |
| | | | | | | | | | | | |
| | | Matthews Asia
Growth Fund | | | Matthews Pacific
Tiger Fund | | | Matthews Asia
ESG Fund | |
| | | |
ASSETS: | | | | | | | | | | | | |
| | | |
Investments at value (A) (Note 2-A and 7): | | | | | | | | | | | | |
| | | |
Unaffiliated issuers | | | $1,933,434,652 | | | | $8,629,639,021 | | | | $86,605,270 | |
| | | |
Cash | | | 129,295,028 | | | | 146,385,071 | | | | 2,171,054 | |
| | | |
Segregated foreign currency at value | | | — | | | | 254,107 | | | | 829 | |
| | | |
Foreign currency at value (B) | | | 14,131 | | | | 295,266 | | | | 10,026 | |
| | | |
Dividends, interest and other receivable | | | 574,915 | | | | 11,646,539 | | | | 87,416 | |
| | | |
Receivable for securities sold | | | 620 | | | | 4,663,437 | | | | — | |
| | | |
Receivable for capital shares sold | | | 7,742,926 | | | | 8,427,270 | | | | 301,065 | |
| | | |
Prepaid expenses | | | 27,000 | | | | 37,887 | | | | 6,676 | |
TOTAL ASSETS | | | 2,071,089,272 | | | | 8,801,348,598 | | | | 89,182,336 | |
| | | |
LIABILITIES: | | | | | | | | | | | | |
| | | |
Payable for securities purchased | | | 13,285,876 | | | | 12,045 | | | | 459,513 | |
| | | |
Payable for capital shares redeemed | | | 1,202,369 | | | | 7,656,943 | | | | 62,316 | |
| | | |
Deferred foreign capital gains tax liability (Note 2-F) | | | 1,074,790 | | | | 27,461,055 | | | | 469,545 | |
| | | |
Due to Advisor (Note 5) | | | 1,072,124 | | | | 4,673,211 | | | | 51,858 | |
| | | |
Administration and accounting fees payable (Note 5) | | | 43,889 | | | | 210,859 | | | | 1,902 | |
| | | |
Administration and shareholder servicing fees payable (Note 5) | | | 225,381 | | | | 922,653 | | | | 9,629 | |
| | | |
Custodian fees payable | | | 76,967 | | | | 408,348 | | | | 16,342 | |
| | | |
Intermediary service fees payable (Note 5) | | | 180,907 | | | | 860,196 | | | | 7,424 | |
| | | |
Professional fees payable | | | 46,332 | | | | 90,900 | | | | 46,499 | |
| | | |
Transfer agent fees payable | | | 10,262 | | | | 26,176 | | | | 441 | |
| | | |
Accrued other expenses payable | | | 82,724 | | | | 376,674 | | | | 30,027 | |
TOTAL LIABILITIES | | | 17,301,621 | | | | 42,699,060 | | | | 1,155,496 | |
| | | |
NET ASSETS | | | $2,053,787,651 | | | | $8,758,649,538 | | | | $88,026,840 | |
| | | |
NET ASSETS: | | | | | | | | | | | | |
| | | |
Investor Class | | | $784,085,456 | | | | $2,585,654,445 | | | | $37,384,597 | |
| | | |
Institutional Class | | | 1,269,702,195 | | | | 6,172,995,093 | | | | 50,642,243 | |
TOTAL | | | $2,053,787,651 | | | | $8,758,649,538 | | | | $88,026,840 | |
See accompanying notes to financial statements.
| | |
| Statements of Assets and Liabilities (continued) | | December 31, 2020 |
| | | | | | | | | | | | |
| | | Matthews Asia
Growth Fund | | | Matthews Pacific
Tiger Fund | | | Matthews Asia
ESG Fund | |
SHARES OUTSTANDING: | | | | | | | | | | | | |
| | | |
(shares of beneficial interest issued and outstanding, respectively, unlimited number of shares authorized with a $0.001 par value) | | | | | | | | | | | | |
| | | |
Investor Class | | | 19,878,490 | | | | 73,997,566 | | | | 2,502,110 | |
| | | |
Institutional Class | | | 31,888,536 | | | | 176,865,608 | | | | 3,393,661 | |
TOTAL | | | 51,767,026 | | | | 250,863,174 | | | | 5,895,771 | |
| | | |
NET ASSET VALUE: | | | | | | | | | | | | |
Investor Class, offering price and redemption price | | | $39.44 | | | | $34.94 | | | | $14.94 | |
Institutional Class, offering price and redemption price | | | $39.82 | | | | $34.90 | | | | $14.92 | |
| | | |
NET ASSETS CONSISTS OF: | | | | | | | | | | | | |
| | | |
Capital paid-in | | | $1,230,738,886 | | | | $4,681,344,298 | | | | $64,746,235 | |
| | | |
Total distributable earnings/(accumulated loss) | | | 823,048,765 | | | | 4,077,305,240 | | | | 23,280,605 | |
NET ASSETS | | | $2,053,787,651 | | | | $8,758,649,538 | | | | $88,026,840 | |
| | | |
(A) Investments at cost: | | | | | | | | | | | | |
| | | |
Unaffiliated Issuers | | | $1,136,293,667 | | | | $4,903,246,584 | | | | $61,504,285 | |
| | | |
(B) Foreign Currency at Cost | | | $14,133 | | | | $289,348 | | | | $10,007 | |
See accompanying notes to financial statements.
| | | | |
| matthewsasia.com | 800.789.ASIA | | | 103 | |
| | |
| Statements of Assets and Liabilities (continued) | | December 31, 2020 |
| | | | | | | | | | | | |
| | | Matthews Emerging
Asia Fund | | | Matthews Asia
Innovators Fund | | | Matthews
China Fund | |
| | | |
ASSETS: | | | | | | | | | | | | |
| | | |
Investments at value (A) (Note 2-A and 7): | | | | | | | | | | | | |
| | | |
Unaffiliated issuers | | | $190,020,668 | | | | $1,661,923,564 | | | | $1,500,049,113 | |
| | | |
Cash | | | 4,806,577 | | | | 52,173,828 | | | | 4,242,823 | |
| | | |
Segregated foreign currency at value | | | — | | | | 31,886 | | | | 36,761 | |
| | | |
Foreign currency at value (B) | | | 3,152,115 | | | | 12,388,266 | | | | 9,417 | |
| | | |
Dividends, interest and other receivable | | | 101,561 | | | | 886,205 | | | | — | |
| | | |
Receivable for securities sold | | | 1,828 | | | | 8,023,739 | | | | 4,011,476 | |
| | | |
Receivable for capital shares sold | | | 958,528 | | | | 16,090,335 | | | | 4,125,651 | |
| | | |
Prepaid expenses | | | 9,081 | | | | 32,659 | | | | 25,411 | |
TOTAL ASSETS | | | 199,050,358 | | | | 1,751,550,482 | | | | 1,512,500,652 | |
| | | |
LIABILITIES: | | | | | | | | | | | | |
| | | |
Payable for securities purchased | | | — | | | | 16,628,531 | | | | 707 | |
| | | |
Payable for capital shares redeemed | | | 776,277 | | | | 1,974,622 | | | | 2,070,464 | |
| | | |
Deferred foreign capital gains tax liability (Note 2-F) | | | 1,126,666 | | | | 6,115,527 | | | | — | |
| | | |
Due to Advisor (Note 5) | | | 169,035 | | | | 881,320 | | | | 813,355 | |
| | | |
Administration and accounting fees payable (Note 5) | | | 4,829 | | | | 34,187 | | | | 35,721 | |
| | | |
Administration and shareholder servicing fees payable (Note 5) | | | 22,674 | | | | 185,210 | | | | 171,082 | |
| | | |
Custodian fees payable | | | 70,178 | | | | 43,484 | | | | 45,608 | |
| | | |
Intermediary service fees payable (Note 5) | | | 27,183 | | | | 123,038 | | | | 167,316 | |
| | | |
Professional fees payable | | | 48,114 | | | | 46,286 | | | | 45,594 | |
| | | |
Transfer agent fees payable | | | 2,738 | | | | 6,711 | | | | 21,021 | |
| | | |
Accrued other expenses payable | | | 49,489 | | | | 54,581 | | | | 258,627 | |
TOTAL LIABILITIES | | | 2,297,183 | | | | 26,093,497 | | | | 3,629,495 | |
| | | |
NET ASSETS | | | $196,753,175 | | | | $1,725,456,985 | | | | $1,508,871,157 | |
| | | |
NET ASSETS: | | | | | | | | | | | | |
| | | |
Investor Class | | | $54,789,084 | | | | $631,101,238 | | | | $962,713,744 | |
| | | |
Institutional Class | | | 141,964,091 | | | | 1,094,355,747 | | | | 546,157,413 | |
TOTAL | | | $196,753,175 | | | | $1,725,456,985 | | | | $1,508,871,157 | |
See accompanying notes to financial statements.
| | |
| Statements of Assets and Liabilities (continued) | | December 31, 2020 |
| | | | | | | | | | | | |
| | | Matthews Emerging
Asia Fund | | | Matthews Asia
Innovators Fund | | | Matthews
China Fund | |
SHARES OUTSTANDING: | | | | | | | | | | | | |
| | | |
(shares of beneficial interest issued and outstanding, respectively, unlimited number of shares authorized with a $0.001 par value) | | | | | | | | | | | | |
| | | |
Investor Class | | | 4,714,656 | | | | 23,638,273 | | | | 35,660,234 | |
| | | |
Institutional Class | | | 12,151,764 | | | | 40,671,552 | | | | 20,269,500 | |
TOTAL | | | 16,866,420 | | | | 64,309,825 | | | | 55,929,734 | |
| | | |
NET ASSET VALUE: | | | | | | | | | | | | |
Investor Class, offering price and redemption price | | | $11.62 | | | | $26.70 | | | | $27.00 | |
Institutional Class, offering price and redemption price | | | $11.68 | | | | $26.91 | | | | $26.94 | |
| | | |
NET ASSETS CONSISTS OF: | | | | | | | | | | | | |
| | | |
Capital paid-in | | | $272,856,233 | | | | $1,047,411,853 | | | | $1,029,340,617 | |
| | | |
Total distributable earnings/(accumulated loss) | | | (76,103,058 | ) | | | 678,045,132 | | | | 479,530,540 | |
NET ASSETS | | | $196,753,175 | | | | $1,725,456,985 | | | | $1,508,871,157 | |
| | | |
(A) Investments at cost: | | | | | | | | | | | | |
| | | |
Unaffiliated Issuers | | | $174,705,066 | | | | $1,072,224,881 | | | | $1,061,317,626 | |
| | | |
(B) Foreign Currency at Cost | | | $3,139,413 | | | | $12,019,800 | | | | $9,417 | |
See accompanying notes to financial statements.
| | | | |
| matthewsasia.com | 800.789.ASIA | | | 105 | |
| | |
| Statements of Assets and Liabilities (continued) | | December 31, 2020 |
| | | | | | | | | | | | |
| | | Matthews
India Fund | | | Matthews
Japan Fund | | | Matthews
Korea Fund | |
| | | |
ASSETS: | | | | | | | | | | | | |
| | | |
Investments at value (A) (Note 2-A and 7): | | | | | | | | | | | | |
| | | |
Unaffiliated issuers | | | $724,152,738 | | | | $1,630,696,714 | | | | $151,545,238 | |
| | | |
Cash | | | 1,990,421 | | | | 14,573,556 | | | | 1,259,440 | |
| | | |
Foreign currency at value (B) | | | 199,396 | | | | 38,466 | | | | — | |
| | | |
Dividends, interest and other receivable | | | 3,189,573 | | | | 395,891 | | | | 1,423,567 | |
| | | |
Receivable for securities sold | | | 1,947,750 | | | | 1,192,047 | | | | — | |
| | | |
Receivable for capital shares sold | | | 989,938 | | | | 6,776,069 | | | | 159,987 | |
| | | |
Prepaid expenses | | | 20,896 | | | | 14,184 | | | | 14,233 | |
TOTAL ASSETS | | | 732,490,712 | | | | 1,653,686,927 | | | | 154,402,465 | |
| | | |
LIABILITIES: | | | | | | | | | | | | |
| | | |
Payable for securities purchased | | | 274,436 | | | | 1,395 | | | | — | |
| | | |
Payable for capital shares redeemed | | | 1,823,203 | | | | 1,342,545 | | | | 79,665 | |
| | | |
Deferred foreign capital gains tax liability (Note 2-F) | | | 21,574,211 | | | | — | | | | — | |
| | | |
Due to Advisor (Note 5) | | | 386,188 | | | | 907,972 | | | | 81,695 | |
| | | |
Administration and accounting fees payable (Note 5) | | | 17,158 | | | | 40,376 | | | | 3,374 | |
| | | |
Administration and shareholder servicing fees payable (Note 5) | | | 81,028 | | | | 190,937 | | | | 17,163 | |
| | | |
Custodian fees payable | | | 65,712 | | | | 21,541 | | | | 5,463 | |
| | | |
Foreign capital gains tax payable (Note 2-F) | | | 5,560 | | | | — | | | | — | |
| | | |
Intermediary service fees payable (Note 5) | | | 101,664 | | | | 156,959 | | | | 16,017 | |
| | | |
Professional fees payable | | | 70,648 | | | | 49,357 | | | | 43,489 | |
| | | |
Transfer agent fees payable | | | 19,279 | | | | 32,629 | | | | 5,648 | |
| | | |
Accrued other expenses payable | | | 110,345 | | | | 155,405 | | | | 27,214 | |
TOTAL LIABILITIES | | | 24,529,432 | | | | 2,899,116 | | | | 279,728 | |
| | | |
NET ASSETS | | | $707,961,280 | | | | $1,650,787,811 | | | | $154,122,737 | |
| | | |
NET ASSETS: | | | | | | | | | | | | |
| | | |
Investor Class | | | $617,908,225 | | | | $1,101,819,512 | | | | $141,930,573 | |
| | | |
Institutional Class | | | 90,053,055 | | | | 548,968,299 | | | | 12,192,164 | |
TOTAL | | | $707,961,280 | | | | $1,650,787,811 | | | | $154,122,737 | |
See accompanying notes to financial statements.
| | |
| Statements of Assets and Liabilities (continued) | | December 31, 2020 |
| | | | | | | | | | | | |
| | | Matthews
India Fund | | | Matthews
Japan Fund | | | Matthews
Korea Fund | |
SHARES OUTSTANDING: | | | | | | | | | | | | |
| | | |
(shares of beneficial interest issued and outstanding, respectively, unlimited number of shares authorized with a $0.001 par value) | | | | | | | | | | | | |
| | | |
Investor Class | | | 23,503,611 | | | | 43,600,905 | | | | 23,200,750 | |
| | | |
Institutional Class | | | 3,379,580 | | | | 21,678,823 | | | | 1,976,807 | |
TOTAL | | | 26,883,191 | | | | 65,279,728 | | | | 25,177,557 | |
| | | |
NET ASSET VALUE: | | | | | | | | | | | | |
Investor Class, offering price and redemption price | | | $26.29 | | | | $25.27 | | | | $6.12 | |
Institutional Class, offering price and redemption price | | | $26.65 | | | | $25.32 | | | | $6.17 | |
| | | |
NET ASSETS CONSISTS OF: | | | | | | | | | | | | |
| | | |
Capital paid-in | | | $564,761,720 | | | | $1,117,809,679 | | | | $102,244,035 | |
| | | |
Total distributable earnings/(accumulated loss) | | | 143,199,560 | | | | 532,978,132 | | | | 51,878,702 | |
NET ASSETS | | | $707,961,280 | | | | $1,650,787,811 | | | | $154,122,737 | |
| | | |
(A) Investments at cost: | | | | | | | | | | | | |
| | | |
Unaffiliated Issuers | | | $529,772,817 | | | | $1,139,085,719 | | | | $90,921,600 | |
| | | |
(B) Foreign Currency at Cost | | | $199,033 | | | | $38,470 | | | | $— | |
See accompanying notes to financial statements.
| | | | |
| matthewsasia.com | 800.789.ASIA | | | 107 | |
| | |
| Statements of Assets and Liabilities (continued) | | December 31, 2020 |
| | | | | | | | |
| | | Matthews Asia
Small Companies
Fund | | | Matthews China
Small Companies
Fund | |
| | |
ASSETS: | | | | | | | | |
| | |
Investments at value (A) (Note 2-A and 7): | | | | | | | | |
| | |
Unaffiliated issuers | | | $206,757,725 | | | | $373,773,818 | |
| | |
Cash | | | 1,311,988 | | | | 5,869,605 | |
| | |
Segregated foreign currency at value | | | 8,051 | | | | 50,518 | |
| | |
Foreign currency at value (B) | | | 348,861 | | | | 2,787,267 | |
| | |
Dividends, interest and other receivable | | | 365,091 | | | | 351,421 | |
| | |
Receivable for securities sold | | | 61 | | | | 4,319,328 | |
| | |
Receivable for capital shares sold | | | 387,959 | | | | 3,889,051 | |
| | |
Prepaid expenses | | | 13,714 | | | | 33,313 | |
TOTAL ASSETS | | | 209,193,450 | | | | 391,074,321 | |
| | |
LIABILITIES: | | | | | | | | |
| | |
Payable for securities purchased | | | 344,905 | | | | 4,508,869 | |
| | |
Payable for capital shares redeemed | | | 229,233 | | | | 2,333,233 | |
| | |
Deferred foreign capital gains tax liability (Note 2-F) | | | 1,144,578 | | | | — | |
| | |
Due to Advisor (Note 5) | | | 151,173 | | | | 219,893 | |
| | |
Administration and accounting fees payable (Note 5) | | | 4,754 | | | | 9,732 | |
| | |
Administration and shareholder servicing fees payable (Note 5) | | | 22,511 | | | | 42,512 | |
| | |
Custodian fees payable | | | 28,119 | | | | 32,627 | |
| | |
Intermediary service fees payable (Note 5) | | | 28,891 | | | | 68,788 | |
| | |
Professional fees payable | | | 50,075 | | | | 45,785 | |
| | |
Transfer agent fees payable | | | 3,985 | | | | 5,165 | |
| | |
Accrued other expenses payable | | | 42,950 | | | | 38,498 | |
TOTAL LIABILITIES | | | 2,051,174 | | | | 7,305,102 | |
| | |
NET ASSETS | | | $207,142,276 | | | | $383,769,219 | |
| | |
NET ASSETS: | | | | | | | | |
| | |
Investor Class | | | $99,572,939 | | | | $285,716,953 | |
| | |
Institutional Class | | | 107,569,337 | | | | 98,052,266 | |
TOTAL | | | $207,142,276 | | | | $383,769,219 | |
See accompanying notes to financial statements.
| | |
| Statements of Assets and Liabilities (continued) | | December 31, 2020 |
| | | | | | | | |
| | | Matthews Asia
Small Companies
Fund | | | Matthews China
Small Companies
Fund | |
SHARES OUTSTANDING: | | | | | | | | |
| | |
(shares of beneficial interest issued and outstanding, respectively, unlimited number of shares authorized with a $0.001 par value) | | | | | | | | |
| | |
Investor Class | | | 3,840,657 | | | | 14,385,518 | |
| | |
Institutional Class | | | 4,158,353 | | | | 4,926,635 | |
TOTAL | | | 7,999,010 | | | | 19,312,153 | |
| | |
NET ASSET VALUE: | | | | | | | | |
Investor Class, offering price and redemption price | | | $25.93 | | | | $19.86 | |
Institutional Class, offering price and redemption price | | | $25.87 | | | | $19.90 | |
| | |
NET ASSETS CONSISTS OF: | | | | | | | | |
| | |
Capital paid-in | | | $147,326,097 | | | | $291,148,474 | |
| | |
Total distributable earnings/(accumulated loss) | | | 59,816,179 | | | | 92,620,745 | |
NET ASSETS | | | $207,142,276 | | | | $383,769,219 | |
| | |
(A) Investments at cost: | | | | | | | | |
| | |
Unaffiliated Issuers | | | $140,393,406 | | | | $284,676,317 | |
| | |
(B) Foreign Currency at Cost | | | $338,073 | | | | $2,790,944 | |
See accompanying notes to financial statements.
| | | | |
| matthewsasia.com | 800.789.ASIA | | | 109 | |
| | |
| Statements of Operations | | Year Ended December 31, 2020 |
| | | | | | | | | | | | |
| | | Matthews Emerging
Markets Equity Fund1 | | | Matthews Asia
Total Return
Bond Fund | | | Matthews Asia
Credit
Opportunities Fund | |
| | | |
INVESTMENT INCOME: | | | | | | | | | | | | |
| | | |
Dividends—Unaffiliated Issuers | | | $211,089 | | | | $11,862 | | | | $9,470 | |
| | | |
Interest | | | — | | | | 6,061,839 | | | | 5,431,283 | |
| | | |
Foreign withholding tax | | | (28,859 | ) | | | (163,527 | ) | | | (148,217 | ) |
TOTAL INVESTMENT INCOME | | | 182,230 | | | | 5,910,174 | | | | 5,292,536 | |
| | | |
EXPENSES: | | | | | | | | | | | | |
| | | |
Investment advisory fees (Note 5) | | | 88,411 | | | | 596,035 | | | | 511,917 | |
| | | |
Administration and accounting fees (Note 5) | | | 1,064 | | | | 8,670 | | | | 7,446 | |
| | | |
Administration and shareholder servicing fees (Note 5) | | | 19,089 | | | | 157,891 | | | | 135,783 | |
| | | |
Accounting out-of-pocket fees | | | 24,578 | | | | 30,178 | | | | 24,300 | |
| | | |
Custodian fees | | | 68,087 | | | | 44,963 | | | | 28,412 | |
| | | |
Printing fees | | | 14,490 | | | | 32,515 | | | | 36,956 | |
| | | |
Intermediary service fees (Note 5) | | | 10,501 | | | | 137,687 | | | | 86,012 | |
| | | |
Professional fees | | | 89,234 | | | | 68,220 | | | | 44,822 | |
| | | |
Registration fees | | | 31,113 | | | | 40,385 | | | | 38,059 | |
| | | |
Transfer agent fees | | | 736 | | | | 5,531 | | | | 2,034 | |
| | | |
Trustees fees | | | 268 | | | | 6,153 | | | | 5,024 | |
| | | |
Other expenses | | | 7,051 | | | | 11,300 | | | | 5,167 | |
TOTAL EXPENSES | | | 354,622 | | | | 1,139,528 | | | | 925,932 | |
| | | |
Advisory fees waived and expenses waived or reimbursed (Note 5) | | | (231,409 | ) | | | (79,780 | ) | | | (62,980 | ) |
NET EXPENSES | | | 123,213 | | | | 1,059,748 | | | | 862,952 | |
| | | |
NET INVESTMENT INCOME (LOSS) | | | 59,017 | | | | 4,850,426 | | | | 4,429,584 | |
| | | |
| REALIZED AND UNREALIZED GAIN (LOSS) ON INVESTMENTS, FORWARD FOREIGN CURRENCY EXCHANGE CONTRACTS, FOREIGN CURRENCY RELATED TRANSACTIONS, SWAPS, AND FOREIGN CAPITAL GAINS TAXES: | | | | | | | | | | | | |
| | | |
Net realized gain (loss) on investments—Unaffiliated Issuers | | | 1,629,672 | | | | (1,713,313 | ) | | | (2,419,003 | ) |
| | | |
Net realized gain (loss) on forward foreign currency exchange contracts | | | — | | | | (695,797 | ) | | | — | |
| | | |
Net realized gain (loss) on swaps | | | — | | | | 108,731 | | | | — | |
| | | |
Net realized foreign capital gains tax | | | (13,013 | ) | | | (29,129 | ) | | | — | |
| | | |
Net realized gain (loss) on foreign currency related transactions | | | (4,312 | ) | | | (109,935 | ) | | | (653 | ) |
| | | |
Net change in unrealized appreciation/depreciation on investments—Unaffiliated Issuers | | | 6,973,574 | | | | 577,135 | | | | (858,598 | ) |
| | | |
Net change in unrealized appreciation/depreciation on forward foreign currency exchange contracts | | | — | | | | 1,571,854 | | | | — | |
| | | |
Net change in unrealized appreciation/depreciation on swaps | | | — | | | | 537,033 | | | | — | |
| | | |
Net change in deferred foreign capital gains taxes on unrealized appreciation/depreciation | | | (68,673 | ) | | | (13,642 | ) | | | — | |
| | | |
Net change in unrealized appreciation/depreciation on foreign currency related translations | | | (212 | ) | | | 9,783 | | | | (7,154 | ) |
Net realized and unrealized gain (loss) on investments, forward foreign currency exchange contracts, foreign currency related transactions, swaps, and foreign capital gains taxes | | | 8,517,036 | | | | 242,720 | | | | (3,285,408 | ) |
| | | |
NET INCREASE (DECREASE) IN NET ASSETS FROM OPERATIONS | | | $8,576,053 | | | | $5,093,146 | | | | $1,144,176 | |
| 1 | The Fund commenced operations on April 30, 2020. |
See accompanying notes to financial statements.
| | |
| Statements of Operations (continued) | | Year Ended December 31, 2020 |
| | | | | | | | | | | | |
| | | Matthews Asian
Growth and
Income Fund | | | Matthews Asia
Dividend Fund | | | Matthews China
Dividend Fund | |
| | | |
INVESTMENT INCOME: | | | | | | | | | | | | |
| | | |
Dividends—Unaffiliated Issuers | | | $34,764,379 | | | | $70,476,727 | | | | $10,422,477 | |
| | | |
Dividends—Affiliated Issuers (Note 7) | | | — | | | | 16,647,513 | | | | — | |
| | | |
Interest | | | 1,322,962 | | | | — | | | | — | |
| | | |
Foreign withholding tax | | | (3,037,765 | ) | | | (6,568,392 | ) | | | (509,790 | ) |
TOTAL INVESTMENT INCOME | | | 33,049,576 | | | | 80,555,848 | | | | 9,912,687 | |
| | | |
EXPENSES: | | | | | | | | | | | | |
| | | |
Investment advisory fees (Note 5) | | | 8,900,674 | | | | 28,948,556 | | | | 2,257,142 | |
| | | |
Administration and accounting fees (Note 5) | | | 106,962 | | | | 347,938 | | | | 27,125 | |
| | | |
Administration and shareholder servicing fees (Note 5) | | | 1,947,630 | | | | 6,325,613 | | | | 493,764 | |
| | | |
Accounting out-of-pocket fees | | | 47,383 | | | | 46,029 | | | | 39,389 | |
| | | |
Custodian fees | | | 378,790 | | | | 1,017,993 | | | | 147,972 | |
| | | |
Printing fees | | | 131,671 | | | | 216,639 | | | | 65,202 | |
| | | |
Intermediary service fees (Note 5) | | | 1,776,779 | | | | 4,663,841 | | | | 561,437 | |
| | | |
Professional fees | | | 71,368 | | | | 134,801 | | | | 52,948 | |
| | | |
Registration fees | | | 86,555 | | | | 67,871 | | | | 78,395 | |
| | | |
Transfer agent fees | | | 55,103 | | | | 79,571 | | | | 14,513 | |
| | | |
Trustees fees | | | 75,590 | | | | 253,509 | | | | 18,937 | |
| | | |
Other expenses | | | 65,377 | | | | 233,385 | | | | 15,029 | |
TOTAL EXPENSES | | | 13,643,882 | | | | 42,335,746 | | | | 3,771,853 | |
| | | |
Advisory fees waived and expenses waived or reimbursed (Note 5) | | | — | | | | (134,924 | ) | | | — | |
| | | |
Administration fees waived (Note 5) | | | — | | | | (134,924 | ) | | | — | |
NET EXPENSES | | | 13,643,882 | | | | 42,065,898 | | | | 3,771,853 | |
| | | |
NET INVESTMENT INCOME (LOSS) | | | 19,405,694 | | | | 38,489,950 | | | | 6,140,834 | |
| | | |
| REALIZED AND UNREALIZED GAIN (LOSS) ON INVESTMENTS, FOREIGN CURRENCY RELATED TRANSACTIONS, AND FOREIGN CAPITAL GAINS TAXES: | | | | | | | | | | | | |
| | | |
Net realized gain (loss) on investments—Unaffiliated Issuers | | | (22,085,203 | ) | | | 119,890,432 | | | | 4,853,480 | |
| | | |
Net realized gain (loss) on investments—Affiliated Issuers | | | — | | | | 3,079,936 | | | | — | |
| | | |
Net realized foreign capital gains tax | | | (130,314 | ) | | | — | | | | — | |
| | | |
Net realized gain (loss) on foreign currency related transactions | | | (517,944 | ) | | | (1,667,312 | ) | | | 33,158 | |
| | | |
Net change in unrealized appreciation/depreciation on investments—Unaffiliated Issuers | | | 194,734,231 | | | | 686,455,548 | | | | 58,871,551 | |
| | | |
Net change in unrealized appreciation/depreciation on investments—Affiliated Issuers | | | — | | | | 185,495,961 | | | | — | |
| | | |
Net change in deferred foreign capital gains taxes on unrealized appreciation/depreciation | | | (1,175,119 | ) | | | (52,247 | ) | | | — | |
| | | |
Net change in unrealized appreciation/depreciation on foreign currency related translations | | | (366,751 | ) | | | 1,835,007 | | | | 90,060 | |
Net realized and unrealized gain (loss) on investments, foreign currency related transactions, and foreign capital gains taxes | | | 170,458,900 | | | | 995,037,325 | | | | 63,848,249 | |
| | | |
NET INCREASE (DECREASE) IN NET ASSETS FROM OPERATIONS | | | $189,864,594 | | | | $1,033,527,275 | | | | $69,989,083 | |
See accompanying notes to financial statements.
| | | | |
| matthewsasia.com | 800.789.ASIA | | | 111 | |
| | |
| Statements of Operations (continued) | | Year Ended December 31, 2020 |
| | | | | | | | | | | | |
| | | Matthews Asia
Growth Fund | | | Matthews Pacific
Tiger Fund | | | Matthews Asia
ESG Fund | |
| | | |
INVESTMENT INCOME: | | | | | | | | | | | | |
| | | |
Dividends—Unaffiliated Issuers | | | $ 9,537,092 | | | | $ 102,117,586 | | | | $860,501 | |
| | | |
Dividends—Affiliated Issuers (Note 7) | | | 1,018,954 | | | | 13,601,464 | | | | — | |
| | | |
Foreign withholding tax | | | (838,325 | ) | | | (12,533,873 | ) | | | (90,134 | ) |
TOTAL INVESTMENT INCOME | | | 9,717,721 | | | | 103,185,177 | | | | 770,367 | |
| | | |
EXPENSES: | | | | | | | | | | | | |
| | | |
Investment advisory fees (Note 5) | | | 8,959,032 | | | | 49,413,522 | | | | 396,225 | |
| | | |
Administration and accounting fees (Note 5) | | | 107,687 | | | | 593,894 | | | | 4,763 | |
| | | |
Administration and shareholder servicing fees (Note 5) | | | 1,955,912 | | | | 10,799,024 | | | | 86,489 | |
| | | |
Accounting out-of-pocket fees | | | 41,978 | | | | 43,378 | | | | 40,737 | |
| | | |
Custodian fees | | | 517,376 | | | | 2,635,923 | | | | 82,335 | |
| | | |
Printing fees | | | 94,444 | | | | 320,419 | | | | 20,070 | |
| | | |
Intermediary service fees (Note 5) | | | 1,506,579 | | | | 7,767,785 | | | | 59,513 | |
| | | |
Professional fees | | | 68,185 | | | | 216,062 | | | | 52,118 | |
| | | |
Registration fees | | | 66,741 | | | | 97,544 | | | | 33,495 | |
| | | |
Transfer agent fees | | | 38,627 | | | | 104,754 | | | | 1,652 | |
| | | |
Trustees fees | | | 68,124 | | | | 422,838 | | | | 3,061 | |
| | | |
Other expenses | | | 59,618 | | | | 339,627 | | | | 16,108 | |
TOTAL EXPENSES | | | 13,484,303 | | | | 72,754,770 | | | | 796,566 | |
| | | |
Advisory fees waived and expenses waived or reimbursed (Note 5) | | | — | | | | (648,059 | ) | | | (40,676 | ) |
| | | |
Administration fees waived (Note 5) | | | — | | | | (648,059 | ) | | | — | |
NET EXPENSES | | | 13,484,303 | | | | 71,458,652 | | | | 755,890 | |
| | | |
NET INVESTMENT INCOME (LOSS) | | | (3,766,582 | ) | | | 31,726,525 | | | | 14,477 | |
| | | |
| REALIZED AND UNREALIZED GAIN (LOSS) ON INVESTMENTS, FOREIGN CURRENCY RELATED TRANSACTIONS, AND FOREIGN CAPITAL GAINS TAXES: | | | | | | | | | | | | |
| | | |
Net realized gain (loss) on investments—Unaffiliated Issuers | | | 133,071,515 | | | | 1,120,358,395 | | | | 3,649,164 | |
| | | |
Net realized gain (loss) on investments—Affiliated Issuers | | | (12,745,980 | ) | | | (306,879,579 | ) | | | — | |
| | | |
Net realized foreign capital gains tax | | | — | | | | (151,563 | ) | | | (27,656 | ) |
| | | |
Net realized gain (loss) on foreign currency related transactions | | | (455,959 | ) | | | (3,257,080 | ) | | | 5,874 | |
| | | |
Net change in unrealized appreciation/depreciation on investments—Unaffiliated Issuers | | | 489,646,086 | | | | 590,298,039 | | | | 21,301,063 | |
| | | |
Net change in unrealized appreciation/depreciation on investments—Affiliated Issuers | | | 943,316 | | | | 339,576,201 | | | | — | |
| | | |
Net change in deferred foreign capital gains taxes on unrealized appreciation/depreciation | | | (828,093 | ) | | | 3,154,260 | | | | (371,525 | ) |
| | | |
Net change in unrealized appreciation/depreciation on foreign currency related translations | | | 23,121 | | | | 540,652 | | | | 2,049 | |
Net realized and unrealized gain (loss) on investments, foreign currency related transactions, and foreign capital gains taxes | | | 609,654,006 | | | | 1,743,639,325 | | | | 24,558,969 | |
| | | |
NET INCREASE (DECREASE) IN NET ASSETS FROM OPERATIONS | | | $605,887,424 | | | | $1,775,365,850 | | | | $24,573,446 | |
See accompanying notes to financial statements.
| | |
| Statements of Operations (continued) | | Year Ended December 31, 2020 |
| | | | | | | | | | | | |
| | | Matthews Emerging
Asia Fund | | | Matthews Asia
Innovators Fund | | | Matthews
China Fund | |
| | | |
INVESTMENT INCOME: | | | | | | | | | | | | |
| | | |
Dividends—Unaffiliated Issuers | | | $5,762,681 | | | | $4,729,088 | | | | $15,556,862 | |
| | | |
Foreign withholding tax | | | (574,089 | ) | | | (577,348 | ) | | | (981,184 | ) |
TOTAL INVESTMENT INCOME | | | 5,188,592 | | | | 4,151,740 | | | | 14,575,678 | |
| | | |
EXPENSES: | | | | | | | | | | | | |
| | | |
Investment advisory fees (Note 5) | | | 1,966,515 | | | | 5,427,554 | | | | 7,375,807 | |
| | | |
Administration and accounting fees (Note 5) | | | 15,732 | | | | 65,258 | | | | 88,649 | |
| | | |
Administration and shareholder servicing fees (Note 5) | | | 285,929 | | | | 1,181,104 | | | | 1,611,615 | |
| | | |
Accounting out-of-pocket fees | | | 43,463 | | | | 34,032 | | | | 35,543 | |
| | | |
Custodian fees | | | 514,909 | | | | 298,124 | | | | 336,489 | |
| | | |
Printing fees | | | 39,465 | | | | 67,180 | | | | 108,421 | |
| | | |
Intermediary service fees (Note 5) | | | 218,871 | | | | 934,333 | | | | 1,679,644 | |
| | | |
Professional fees | | | 77,523 | | | | 62,043 | | | | 61,943 | |
| | | |
Registration fees | | | 46,313 | | | | 56,735 | | | | 63,021 | |
| | | |
Transfer agent fees | | | 11,307 | | | | 23,932 | | | | 82,185 | |
| | | |
Trustees fees | | | 13,653 | | | | 31,659 | | | | 54,783 | |
| | | |
Other expenses | | | 26,344 | | | | 35,907 | | | | 42,977 | |
TOTAL EXPENSES | | | 3,260,024 | | | | 8,217,861 | | | | 11,541,077 | |
| | | |
Advisory fees waived and expenses waived or reimbursed (Note 5) | | | (801,181 | ) | | | — | | | | — | |
NET EXPENSES | | | 2,458,843 | | | | 8,217,861 | | | | 11,541,077 | |
| | | |
NET INVESTMENT INCOME (LOSS) | | | 2,729,749 | | | | (4,066,121 | ) | | | 3,034,601 | |
| | | |
| REALIZED AND UNREALIZED GAIN (LOSS) ON INVESTMENTS, FOREIGN CURRENCY RELATED TRANSACTIONS, AND FOREIGN CAPITAL GAINS TAXES: | | | | | | | | | | | | |
| | | |
Net realized gain (loss) on investments—Unaffiliated Issuers | | | (53,194,494 | ) | | | 126,826,325 | | | | 92,626,200 | |
| | | |
Net realized gain (loss) on investments—Affiliated Issuers | | | (6,677,322 | ) | | | — | | | | — | |
| | | |
Net realized foreign capital gains tax | | | (2,633 | ) | | | (270,226 | ) | | | — | |
| | | |
Net realized gain (loss) on foreign currency related transactions | | | (738,826 | ) | | | 303,356 | | | | (29,268 | ) |
| | | |
Net change in unrealized appreciation/depreciation on investments—Unaffiliated Issuers | | | 23,517,521 | | | | 522,266,664 | | | | 327,402,892 | |
| | | |
Net change in unrealized appreciation/depreciation on investments—Affiliated Issuers | | | 4,883,817 | | | | — | | | | — | |
| | | |
Net change in deferred foreign capital gains taxes on unrealized appreciation/depreciation | | | 618,729 | | | | (5,114,598 | ) | | | — | |
| | | |
Net change in unrealized appreciation/depreciation on foreign currency related translations | | | 30,497 | | | | 364,542 | | | | (140 | ) |
Net realized and unrealized gain (loss) on investments, foreign currency related transactions, and foreign capital gains taxes | | | (31,562,711 | ) | | | 644,376,063 | | | | 419,999,684 | |
| | | |
NET INCREASE (DECREASE) IN NET ASSETS FROM OPERATIONS | | | ($28,832,962 | ) | | | $640,309,942 | | | | $423,034,285 | |
See accompanying notes to financial statements.
| | | | |
| matthewsasia.com | 800.789.ASIA | | | 113 | |
| | |
| Statements of Operations (continued) | | Year Ended December 31, 2020 |
| | | | | | | | | | | | |
| | | Matthews
India Fund | | | Matthews
Japan Fund | | | Matthews
Korea Fund | |
| | | |
INVESTMENT INCOME: | | | | | | | | | | | | |
| | | |
Dividends—Unaffiliated Issuers | | | $8,531,318 | | | | $22,398,551 | | | | $2,334,856 | |
| | | |
Dividends—Affiliated Issuers (Note 7) | | | 680,966 | | | | — | | | | — | |
| | | |
Foreign withholding tax | | | (1,177,977 | ) | | | (2,219,081 | ) | | | (383,988 | ) |
TOTAL INVESTMENT INCOME | | | 8,034,307 | | | | 20,179,470 | | | | 1,950,868 | |
| | | |
EXPENSES: | | | | | | | | | | | | |
| | | |
Investment advisory fees (Note 5) | | | 4,415,150 | | | | 10,928,444 | | | | 786,229 | |
| | | |
Administration and accounting fees (Note 5) | | | 53,069 | | | | 131,327 | | | | 9,450 | |
| | | |
Administration and shareholder servicing fees (Note 5) | | | 964,516 | | | | 2,392,640 | | | | 171,771 | |
| | | |
Accounting out-of-pocket fees | | | 42,901 | | | | 41,799 | | | | 33,302 | |
| | | |
Custodian fees | | | 339,628 | | | | 151,015 | | | | 36,509 | |
| | | |
Printing fees | | | 116,054 | | | | 134,885 | | | | 24,046 | |
| | | |
Intermediary service fees (Note 5) | | | 1,171,454 | | | | 1,128,153 | | | | 204,073 | |
| | | |
Professional fees | | | 174,397 | | | | 73,280 | | | | 46,578 | |
| | | |
Registration fees | | | 50,269 | | | | 49,389 | | | | 34,928 | |
| | | |
Transfer agent fees | | | 76,629 | | | | 126,998 | | | | 21,894 | |
| | | |
Trustees fees | | | 44,081 | | | | 104,575 | | | | 6,903 | |
| | | |
Other expenses | | | 46,519 | | | | 81,739 | | | | 9,427 | |
TOTAL EXPENSES | | | 7,494,667 | | | | 15,344,244 | | | | 1,385,110 | |
| | | |
NET INVESTMENT INCOME (LOSS) | | | 539,640 | | | | 4,835,226 | | | | 565,758 | |
| | | |
| REALIZED AND UNREALIZED GAIN (LOSS) ON INVESTMENTS, FOREIGN CURRENCY RELATED TRANSACTIONS, AND FOREIGN CAPITAL GAINS TAXES: | | | | | | | | | | | | |
| | | |
Net realized gain (loss) on investments—Unaffiliated Issuers | | | (35,147,631 | ) | | | 224,879,709 | | | | (2,612,290 | ) |
| | | |
Net realized gain (loss) on investments—Affiliated Issuers | | | 9,190,775 | | | | — | | | | — | |
| | | |
Net realized foreign capital gains tax | | | (3,488,659 | ) | | | — | | | | — | |
| | | |
Net realized gain (loss) on foreign currency related transactions | | | (539,655 | ) | | | 71,001 | | | | (238,911 | ) |
| | | |
Net change in unrealized appreciation/depreciation on investments—Unaffiliated Issuers | | | 96,721,496 | | | | 85,971,127 | | | | 44,813,135 | |
| | | |
Net change in unrealized appreciation/depreciation on investments—Affiliated Issuers | | | (17,867,496 | ) | | | — | | | | — | |
| | | |
Net change in deferred foreign capital gains taxes on unrealized appreciation/depreciation | | | (8,262,561 | ) | | | — | | | | — | |
| | | |
Net change in unrealized appreciation/depreciation on foreign currency related translations | | | 63,359 | | | | (9,986 | ) | | | 5,823 | |
Net realized and unrealized gain (loss) on investments, foreign currency related transactions, and foreign capital gains taxes | | | 40,669,628 | | | | 310,911,851 | | | | 41,967,757 | |
| | | |
NET INCREASE (DECREASE) IN NET ASSETS FROM OPERATIONS | | | $41,209,268 | | | | $315,747,077 | | | | $42,533,515 | |
See accompanying notes to financial statements.
| | |
| Statements of Operations (continued) | | Year Ended December 31, 2020 |
| | | | | | | | |
| | | Matthews Asia
Small Companies
Fund | | | Matthews China
Small Companies
Fund | |
| | |
INVESTMENT INCOME: | | | | | | | | |
| | |
Dividends—Unaffiliated Issuers | | | $2,429,178 | | | | $3,939,139 | |
| | |
Dividends—Affiliated Issuers (Note 7) | | | — | | | | — | |
| | |
Foreign withholding tax | | | (257,675 | ) | | | (113,841 | ) |
TOTAL INVESTMENT INCOME | | | 2,171,503 | | | | 3,825,298 | |
| | |
EXPENSES: | | | | | | | | |
| | |
Investment advisory fees (Note 5) | | | 1,697,281 | | | | 2,880,688 | |
| | |
Administration and accounting fees (Note 5) | | | 13,578 | | | | 23,046 | |
| | |
Administration and shareholder servicing fees (Note 5) | | | 247,096 | | | | 419,631 | |
| | |
Accounting out-of-pocket fees | | | 48,728 | | | | 42,861 | |
| | |
Custodian fees | | | 158,654 | | | | 165,513 | |
| | |
Printing fees | | | 40,961 | | | | 56,430 | |
| | |
Intermediary service fees (Note 5) | | | 230,526 | | | | 490,126 | |
| | |
Professional fees | | | 51,032 | | | | 50,607 | |
| | |
Registration fees | | | 38,952 | | | | 57,154 | |
| | |
Transfer agent fees | | | 15,850 | | | | 16,446 | |
| | |
Trustees fees | | | 9,594 | | | | 13,058 | |
| | |
Other expenses | | | 27,078 | | | | 11,857 | |
TOTAL EXPENSES | | | 2,579,330 | | | | 4,227,417 | |
| | |
Advisory fees waived and expenses waived or reimbursed (Note 5) | | | (378,868 | ) | | | (362,019 | ) |
NET EXPENSES | | | 2,200,462 | | | | 3,865,398 | |
| | |
NET INVESTMENT INCOME (LOSS) | | | (28,959 | ) | | | (40,100 | ) |
| | |
| REALIZED AND UNREALIZED GAIN (LOSS) ON INVESTMENTS, FOREIGN CURRENCY RELATED TRANSACTIONS, AND FOREIGN CAPITAL GAINS TAXES: | | | | | | | | |
| | |
Net realized gain (loss) on investments—Unaffiliated Issuers | | | (3,473,489 | ) | | | 80,724,170 | |
| | |
Net realized foreign capital gains tax | | | (384,457 | ) | | | — | |
| | |
Net realized gain (loss) on foreign currency related transactions | | | (64,430 | ) | | | 411,134 | |
| | |
Net change in unrealized appreciation/depreciation on investments—Unaffiliated Issuers | | | 66,275,173 | | | | 77,853,972 | |
| | |
Net change in deferred foreign capital gains taxes on unrealized appreciation/depreciation | | | (85,816 | ) | | | — | |
| | |
Net change in unrealized appreciation/depreciation on foreign currency related translations | | | 9,840 | | | | 14,256 | |
Net realized and unrealized gain (loss) on investments, foreign currency related transactions, and foreign capital gains taxes | | | 62,276,821 | | | | 159,003,532 | |
| | |
NET INCREASE (DECREASE) IN NET ASSETS FROM OPERATIONS | | | $62,247,862 | | | | $158,963,432 | |
See accompanying notes to financial statements.
| | | | |
| matthewsasia.com | 800.789.ASIA | | | 115 | |
Statements of Changes in Net Assets
| | | | |
| MATTHEWS EMERGING MARKETS EQUITY FUND | | For the Period Ended
December 31, 20201 | |
| |
OPERATIONS: | | | | |
| |
Net investment income (loss) | | | $59,017 | |
| |
Net realized gain (loss) on investments and foreign currency related transactions | | | 1,612,347 | |
| |
Net unrealized appreciation/depreciation on investments and foreign currency related translations | | | 6,973,362 | |
| |
Net foreign capital gains taxes on unrealized appreciation/depreciation | | | (68,673 | ) |
Net increase (decrease) in net assets resulting from operations | | | 8,576,053 | |
| |
DISTRIBUTIONS TO SHAREHOLDERS: | | | | |
| |
Investor Class | | | (142,733 | ) |
| |
Institutional Class | | | (739,402 | ) |
Net decrease in net assets resulting from distributions | | | (882,135 | ) |
CAPITAL SHARE TRANSACTIONS (net) (Note 4) | | | 37,098,179 | |
Total increase (decrease) in net assets | | | 44,792,097 | |
| |
NET ASSETS: | | | | |
| |
Beginning of period | | | — | |
End of period | | | $44,792,097 | |
| |
1 The Fund commenced operations on April 30, 2020. | | | | |
| | | | | | | | |
| MATTHEWS ASIA TOTAL RETURN BOND FUND | | Year Ended
December 31, 2020 | | | Year Ended
December 31, 2019 | |
| | |
OPERATIONS: | | | | | | | | |
| | |
Net investment income (loss) | | | $4,850,426 | | | | $5,275,508 | |
| | |
Net realized gain (loss) on investments and foreign currency related transactions | | | (2,439,443 | ) | | | 2,760,825 | |
| | |
Net change in unrealized appreciation/depreciation on investments and foreign currency related translations | | | 2,158,772 | | | | 5,339,732 | |
| | |
Net change on foreign capital gains taxes on unrealized appreciation/depreciation | | | (13,642 | ) | | | (61,630 | ) |
| | |
Net change in unrealized appreciation/depreciation on swaps | | | 537,033 | | | | 167,864 | |
Net increase (decrease) in net assets resulting from operations | | | 5,093,146 | | | | 13,482,299 | |
| | |
DISTRIBUTIONS TO SHAREHOLDERS: | | | | | | | | |
| | |
Investor Class | | | (1,534,269 | ) | | | (1,587,247 | ) |
| | |
Institutional Class | | | (3,044,458 | ) | | | (3,115,399 | ) |
Net decrease in net assets resulting from distributions | | | (4,578,727 | ) | | | (4,702,646 | ) |
CAPITAL SHARE TRANSACTIONS (net) (Note 4) | | | (2,379,843 | ) | | | 7,218,828 | |
Total increase (decrease) in net assets | | | (1,865,424 | ) | | | 15,998,481 | |
NET ASSETS: | | | | | | | | |
| | |
Beginning of year | | | 116,713,664 | | | | 100,715,183 | |
End of year | | | $114,848,240 | | | | $116,713,664 | |
See accompanying notes to financial statements.
Statements of Changes in Net Assets (continued)
| | | | | | | | |
| MATTHEWS ASIA CREDIT OPPORTUNITIES FUND | | Year Ended December 31, 2020 | | | Year Ended
December 31, 2019 | |
| | |
OPERATIONS: | | | | | | | | |
| | |
Net investment income (loss) | | | $4,429,584 | | | | $2,714,178 | |
| | |
Net realized gain (loss) on investments and foreign currency related transactions | | | (2,419,656 | ) | | | 1,177,604 | |
| | |
Net change in unrealized appreciation/depreciation on investments and foreign currency related translations | | | (865,752 | ) | | | 2,960,665 | |
Net increase (decrease) in net assets resulting from operations | | | 1,144,176 | | | | 6,852,447 | |
| | |
DISTRIBUTIONS TO SHAREHOLDERS: | | | | | | | | |
| | |
Investor Class | | | (461,510 | ) | | | (524,567 | ) |
| | |
Institutional Class | | | (4,015,909 | ) | | | (2,481,265 | ) |
Net decrease in net assets resulting from distributions | | | (4,477,419 | ) | | | (3,005,832 | ) |
CAPITAL SHARE TRANSACTIONS (net) (Note 4) | | | 2,005,951 | | | | 48,835,145 | |
Total increase (decrease) in net assets | | | (1,327,292 | ) | | | 52,681,760 | |
NET ASSETS: | | | | | | | | |
| | |
Beginning of year | | | 92,434,728 | | | | 39,752,968 | |
End of year | | | $91,107,436 | | | | $92,434,728 | |
| | |
| MATTHEWS ASIAN GROWTH AND INCOME FUND | | Year Ended
December 31, 2020 | | | Year Ended
December 31, 2019 | |
| | |
OPERATIONS: | | | | | | | | |
| | |
Net investment income (loss) | | | $19,405,694 | | | | $24,839,454 | |
| | |
Net realized gain (loss) on investments and foreign currency related transactions | | | (22,733,461 | ) | | | 33,418,182 | |
| | |
Net change in unrealized appreciation/depreciation on investments and foreign currency related translations | | | 194,367,480 | | | | 169,842,257 | |
| | |
Net change on foreign capital gains taxes on unrealized appreciation/depreciation | | | (1,175,119 | ) | | | (415,629 | ) |
Net increase (decrease) in net assets resulting from operations | | | 189,864,594 | | | | 227,684,264 | |
| | |
DISTRIBUTIONS TO SHAREHOLDERS: | | | | | | | | |
| | |
Investor Class | | | (6,537,575 | ) | | | (27,564,628 | ) |
| | |
Institutional Class | | | (8,649,109 | ) | | | (26,611,609 | ) |
Net decrease in net assets resulting from distributions | | | (15,186,684 | ) | | | (54,176,237 | ) |
CAPITAL SHARE TRANSACTIONS (net) (Note 4) | | | (146,689,345 | ) | | | (101,433,061 | ) |
Total increase (decrease) in net assets | | | 27,988,565 | | | | 72,074,966 | |
NET ASSETS: | | | | | | | | |
| | |
Beginning of year | | | 1,467,766,339 | | | | 1,395,691,373 | |
End of year | | | $1,495,754,904 | | | | $1,467,766,339 | |
See accompanying notes to financial statements.
| | | | |
| matthewsasia.com | 800.789.ASIA | | | 117 | |
Statements of Changes in Net Assets (continued)
| | | | | | | | |
| MATTHEWS ASIA DIVIDEND FUND | | Year Ended
December 31, 2020 | | | Year Ended
December 31, 2019 | |
| | |
OPERATIONS: | | | | | | | | |
| | |
Net investment income (loss) | | | $38,489,950 | | | | $102,330,702 | |
| | |
Net realized gain (loss) on investments and foreign currency related transactions | | | 121,303,056 | | | | (18,513,511 | ) |
| | |
Net change in unrealized appreciation/depreciation on investments and foreign currency related translations | | | 873,786,516 | | | | 510,591,484 | |
| | |
Net change on foreign capital gains taxes on unrealized appreciation/depreciation | | | (52,247 | ) | | | 4,810,331 | |
Net increase (decrease) in net assets resulting from operations | | | 1,033,527,275 | | | | 599,219,006 | |
| | |
DISTRIBUTIONS TO SHAREHOLDERS: | | | | | | | | |
| | |
Investor Class | | | (23,374,306 | ) | | | (53,870,328 | ) |
| | |
Institutional Class | | | (30,156,523 | ) | | | (70,646,662 | ) |
Net decrease in net assets resulting from distributions | | | (53,530,829 | ) | | | (124,516,990 | ) |
CAPITAL SHARE TRANSACTIONS (net) (Note 4) | | | (1,149,516,399 | ) | | | (872,071,489 | ) |
Total increase (decrease) in net assets | | | (169,519,953 | ) | | | (397,369,473 | ) |
NET ASSETS: | | | | | | | | |
| | |
Beginning of year | | | 5,370,455,874 | | | | 5,767,825,347 | |
End of year | | | $5,200,935,921 | | | | $5,370,455,874 | |
| | |
| MATTHEWS CHINA DIVIDEND FUND | | Year Ended
December 31, 2020 | | | Year Ended
December 31, 2019 | |
| | |
OPERATIONS: | | | | | | | | |
| | |
Net investment income (loss) | | | $6,140,834 | | | | $7,645,006 | |
| | |
Net realized gain (loss) on investments and foreign currency related transactions | | | 4,886,638 | | | | (4,537,088 | ) |
| | |
Net change in unrealized appreciation/depreciation on investments and foreign currency related translations | | | 58,961,611 | | | | 39,016,746 | |
Net increase (decrease) in net assets resulting from operations | | | 69,989,083 | | | | 42,124,664 | |
| | |
DISTRIBUTIONS TO SHAREHOLDERS: | | | | | | | | |
| | |
Investor Class | | | (5,445,025 | ) | | | (4,319,260 | ) |
| | |
Institutional Class | | | (2,410,206 | ) | | | (1,789,894 | ) |
Net decrease in net assets resulting from distributions | | | (7,855,231 | ) | | | (6,109,154 | ) |
CAPITAL SHARE TRANSACTIONS (net) (Note 4) | | | (58,231,512 | ) | | | 75,065,788 | |
Total increase (decrease) in net assets | | | 3,902,340 | | | | 111,081,298 | |
NET ASSETS: | | | | | | | | |
| | |
Beginning of year | | | 380,740,619 | | | | 269,659,321 | |
End of year | | | $384,642,959 | | | | $380,740,619 | |
See accompanying notes to financial statements.
Statements of Changes in Net Assets (continued)
| | | | | | | | |
| MATTHEWS ASIA GROWTH FUND | | Year Ended
December 31, 2020 | | | Year Ended
December 31, 2019 | |
| | |
OPERATIONS: | | | | | | | | |
| | |
Net investment income (loss) | | | ($3,766,582 | ) | | | ($715,202 | ) |
| | |
Net realized gain (loss) on investments and foreign currency related transactions | | | 119,869,576 | | | | 19,441,989 | |
| | |
Net change in unrealized appreciation/depreciation on investments and foreign currency related translations | | | 490,612,523 | | | | 228,921,472 | |
| | |
Net change on foreign capital gains taxes on unrealized appreciation/depreciation | | | (828,093 | ) | | | 511,519 | |
Net increase (decrease) in net assets resulting from operations | | | 605,887,424 | | | | 248,159,778 | |
| | |
DISTRIBUTIONS TO SHAREHOLDERS: | | | | | | | | |
| | |
Investor Class | | | (32,572,017 | ) | | | (4,892,092 | ) |
| | |
Institutional Class | | | (52,522,805 | ) | | | (6,690,700 | ) |
Net decrease in net assets resulting from distributions | | | (85,094,822 | ) | | | (11,582,792 | ) |
CAPITAL SHARE TRANSACTIONS (net) (Note 4) | | | 329,660,660 | | | | 36,423,847 | |
Total increase (decrease) in net assets | | | 850,453,262 | | | | 273,000,833 | |
NET ASSETS: | | | | | | | | |
| | |
Beginning of year | | | 1,203,334,389 | | | | 930,333,556 | |
End of year | | | $2,053,787,651 | | | | $1,203,334,389 | |
| | |
| MATTHEWS PACIFIC TIGER FUND | | Year Ended
December 31, 2020 | | | Year Ended
December 31, 2019 | |
| | |
OPERATIONS: | | | | | | | | |
| | |
Net investment income (loss) | | | $31,726,525 | | | | $66,894,383 | |
| | |
Net realized gain (loss) on investments and foreign currency related transactions | | | 810,070,173 | | | | 216,614,527 | |
| | |
Net change in unrealized appreciation/depreciation on investments and foreign currency related translations | | | 930,414,892 | | | | 599,062,809 | |
| | |
Net change on foreign capital gains taxes on unrealized appreciation/depreciation | | | 3,154,260 | | | | (14,695,530 | ) |
Net increase (decrease) in net assets resulting from operations | | | 1,775,365,850 | | | | 867,876,189 | |
| | |
DISTRIBUTIONS TO SHAREHOLDERS: | | | | | | | | |
| | |
Investor Class | | | (141,488,071 | ) | | | (85,396,598 | ) |
| | |
Institutional Class | | | (348,163,643 | ) | | | (218,660,671 | ) |
Net decrease in net assets resulting from distributions | | | (489,651,714 | ) | | | (304,057,269 | ) |
CAPITAL SHARE TRANSACTIONS (net) (Note 4) | | | (1,252,923,288 | ) | | | (145,194,433 | ) |
Total increase (decrease) in net assets | | | 32,790,848 | | | | 418,624,487 | |
NET ASSETS: | | | | | | | | |
| | |
Beginning of year | | | 8,725,858,690 | | | | 8,307,234,203 | |
End of year | | | $8,758,649,538 | | | | $8,725,858,690 | |
See accompanying notes to financial statements.
| | | | |
| matthewsasia.com | 800.789.ASIA | | | 119 | |
Statements of Changes in Net Assets (continued)
| | | | | | | | |
| MATTHEWS ASIA ESG FUND | | Year Ended
December 31, 2020 | | | Year Ended
December 31, 2019 | |
| | |
OPERATIONS: | | | | | | | | |
| | |
Net investment income (loss) | | | $14,477 | | | | $222,042 | |
| | |
Net realized gain (loss) on investments and foreign currency related transactions | | | 3,627,382 | | | | 918,570 | |
| | |
Net change in unrealized appreciation/depreciation on investments and foreign currency related translations | | | 21,303,112 | | | | 3,585,929 | |
| | |
Net change on foreign capital gains taxes on unrealized appreciation/depreciation | | | (371,525 | ) | | | (64,762 | ) |
Net increase (decrease) in net assets resulting from operations | | | 24,573,446 | | | | 4,661,779 | |
| | |
DISTRIBUTIONS TO SHAREHOLDERS: | | | | | | | | |
| | |
Investor Class | | | (1,972,642 | ) | | | (254,181 | ) |
| | |
Institutional Class | | | (2,742,259 | ) | | | (519,330 | ) |
Net decrease in net assets resulting from distributions | | | (4,714,901 | ) | | | (773,511 | ) |
CAPITAL SHARE TRANSACTIONS (net) (Note 4) | | | 12,869,463 | | | | 18,878,771 | |
Total increase (decrease) in net assets | | | 32,728,008 | | | | 22,767,039 | |
NET ASSETS: | | | | | | | | |
| | |
Beginning of year | | | 55,298,832 | | | | 32,531,793 | |
End of year | | | $88,026,840 | | | | $55,298,832 | |
| | |
| MATTHEWS EMERGING ASIA FUND | | Year Ended
December 31, 2020 | | | Year Ended
December 31, 2019 | |
| | |
OPERATIONS: | | | | | | | | |
| | |
Net investment income (loss) | | | $2,729,749 | | | | $5,409,950 | |
| | |
Net realized gain (loss) on investments and foreign currency related transactions | | | (60,613,275 | ) | | | (28,825,183 | ) |
| | |
Net change in unrealized appreciation/depreciation on investments and foreign currency related translations | | | 28,431,835 | | | | 15,008,562 | |
| | |
Net change on foreign capital gains taxes on unrealized appreciation/depreciation | | | 618,729 | | | | 825,523 | |
Net increase (decrease) in net assets resulting from operations | | | (28,832,962 | ) | | | (7,581,148 | ) |
| | |
DISTRIBUTIONS TO SHAREHOLDERS: | | | | | | | | |
| | |
Investor Class | | | (896,152 | ) | | | (2,211,813 | ) |
| | |
Institutional Class | | | (2,554,661 | ) | | | (6,143,721 | ) |
Net decrease in net assets resulting from distributions | | | (3,450,813 | ) | | | (8,355,534 | ) |
CAPITAL SHARE TRANSACTIONS (net) (Note 4) | | | (91,145,049 | ) | | | (39,111,583 | ) |
REDEMPTION FEES | | | — | | | | 55,503 | |
Total increase (decrease) in net assets | | | (123,428,824 | ) | | | (54,992,762 | ) |
NET ASSETS: | | | | | | | | |
| | |
Beginning of year | | | 320,181,999 | | | | 375,174,761 | |
End of year | | | $196,753,175 | | | | $320,181,999 | |
See accompanying notes to financial statements.
Statements of Changes in Net Assets (continued)
| | | | | | | | |
| MATTHEWS ASIA INNOVATORS FUND | | Year Ended
December 31, 2020 | | | Year Ended
December 31, 2019 | |
| | |
OPERATIONS: | | | | | | | | |
| | |
Net investment income (loss) | | | ($4,066,121 | ) | | | $46,812 | |
| | |
Net realized gain (loss) on investments and foreign currency related transactions | | | 126,859,455 | | | | 2,617,309 | |
| | |
Net change in unrealized appreciation/depreciation on investments and foreign currency related translations | | | 522,631,206 | | | | 68,307,210 | |
| | |
Net change on foreign capital gains taxes on unrealized appreciation/depreciation | | | (5,114,598 | ) | | | (579,902 | ) |
Net increase (decrease) in net assets resulting from operations | | | 640,309,942 | | | | 70,391,429 | |
| | |
DISTRIBUTIONS TO SHAREHOLDERS: | | | | | | | | |
| | |
Investor Class | | | (10,021,958 | ) | | | (517,344 | ) |
| | |
Institutional Class | | | (17,156,013 | ) | | | (360,553 | ) |
Net decrease in net assets resulting from distributions | | | (27,177,971 | ) | | | (877,897 | ) |
CAPITAL SHARE TRANSACTIONS (net) (Note 4) | | | 807,775,835 | | | | (9,182,208 | ) |
Total increase (decrease) in net assets | | | 1,420,907,806 | | | | 60,331,324 | |
NET ASSETS: | | | | | | | | |
| | |
Beginning of year | | | 304,549,179 | | | | 244,217,855 | |
End of year | | | $1,725,456,985 | | | | $304,549,179 | |
| | |
| MATTHEWS CHINA FUND | | Year Ended
December 31, 2020 | | | Year Ended
December 31, 2019 | |
| | |
OPERATIONS: | | | | | | | | |
| | |
Net investment income (loss) | | | $3,034,601 | | | | $8,157,012 | |
| | |
Net realized gain (loss) on investments and foreign currency related transactions | | | 92,596,932 | | | | (10,571,367 | ) |
| | |
Net change in unrealized appreciation/depreciation on investments and foreign currency related translations | | | 327,402,752 | | | | 228,077,121 | |
Net increase (decrease) in net assets resulting from operations | | | 423,034,285 | | | | 225,662,766 | |
| | |
DISTRIBUTIONS TO SHAREHOLDERS: | | | | | | | | |
| | |
Investor Class | | | (11,917,229 | ) | | | (8,017,681 | ) |
| | |
Institutional Class | | | (7,418,452 | ) | | | (2,383,141 | ) |
Net decrease in net assets resulting from distributions | | | (19,335,681 | ) | | | (10,400,822 | ) |
CAPITAL SHARE TRANSACTIONS (net) (Note 4) | | | 202,777,528 | | | | 74,020,367 | |
Total increase (decrease) in net assets | | | 606,476,132 | | | | 289,282,311 | |
NET ASSETS: | | | | | | | | |
| | |
Beginning of year | | | 902,395,025 | | | | 613,112,714 | |
End of year | | | $1,508,871,157 | | | | $902,395,025 | |
See accompanying notes to financial statements.
| | | | |
| matthewsasia.com | 800.789.ASIA | | | 121 | |
Statements of Changes in Net Assets (continued)
| | | | | | | | |
| MATTHEWS INDIA FUND | | Year Ended
December 31, 2020 | | | Year Ended
December 31, 2019 | |
| | |
OPERATIONS: | | | | | | | | |
| | |
Net investment income (loss) | | | $539,640 | | | | $26,423 | |
| | |
Net realized gain (loss) on investments and foreign currency related transactions | | | (29,985,170 | ) | | | 32,455,342 | |
| | |
Net change in unrealized appreciation/depreciation on investments and foreign currency related translations | | | 78,917,359 | | | | (48,195,961 | ) |
| | |
Net change on foreign capital gains taxes on unrealized appreciation/depreciation | | | (8,262,561 | ) | | | (1,438,891 | ) |
Net increase (decrease) in net assets resulting from operations | | | 41,209,268 | | | | (17,153,087 | ) |
| | |
DISTRIBUTIONS TO SHAREHOLDERS: | | | | | | | | |
| | |
Investor Class | | | (18,432,815 | ) | | | (88,576,196 | ) |
| | |
Institutional Class | | | (2,686,572 | ) | | | (20,261,209 | ) |
Net decrease in net assets resulting from distributions | | | (21,119,387 | ) | | | (108,837,405 | ) |
CAPITAL SHARE TRANSACTIONS (net) (Note 4) | | | (276,535,505 | ) | | | (451,382,627 | ) |
Total increase (decrease) in net assets | | | (256,445,624 | ) | | | (577,373,119 | ) |
NET ASSETS: | | | | | | | | |
| | |
Beginning of year | | | 964,406,904 | | | | 1,541,780,023 | |
End of year | | | $707,961,280 | | | | $964,406,904 | |
| | |
| MATTHEWS JAPAN FUND | | Year Ended
December 31, 2020 | | | Year Ended
December 31, 2019 | |
| | |
OPERATIONS: | | | | | | | | |
| | |
Net investment income (loss) | | | $4,835,226 | | | | $13,902,590 | |
| | |
Net realized gain (loss) on investments and foreign currency related transactions | | | 224,950,710 | | | | 120,429,499 | |
| | |
Net change in unrealized appreciation/depreciation on investments and foreign currency related translations | | | 85,961,141 | | | | 491,227,271 | |
Net increase (decrease) in net assets resulting from operations | | | 315,747,077 | | | | 625,559,360 | |
| | |
DISTRIBUTIONS TO SHAREHOLDERS: | | | | | | | | |
| | |
Investor Class | | | (104,936,797 | ) | | | (120,196,392 | ) |
| | |
Institutional Class | | | (51,294,781 | ) | | | (74,901,937 | ) |
Net decrease in net assets resulting from distributions | | | (156,231,578 | ) | | | (195,098,329 | ) |
CAPITAL SHARE TRANSACTIONS (net) (Note 4) | | | (815,396,878 | ) | | | (995,366,160 | ) |
Total increase (decrease) in net assets | | | (655,881,379 | ) | | | (564,905,129 | ) |
NET ASSETS: | | | | | | | | |
| | |
Beginning of year | | | 2,306,669,190 | | | | 2,871,574,319 | |
End of year | | | $1,650,787,811 | | | | $2,306,669,190 | |
See accompanying notes to financial statements.
Statements of Changes in Net Assets (continued)
| | | | | | | | |
| MATTHEWS KOREA FUND | | Year Ended
December 31, 2020 | | | Year Ended
December 31, 2019 | |
| | |
OPERATIONS: | | | | | | | | |
| | |
Net investment income (loss) | | | $565,758 | | | | $413,405 | |
| | |
Net realized gain (loss) on investments and foreign currency related transactions | | | (2,851,201 | ) | | | (2,970,527 | ) |
| | |
Net change in unrealized appreciation/depreciation on investments and foreign currency related translations | | | 44,818,958 | | | | 7,136,355 | |
| | |
Net increase (decrease) in net assets resulting from operations | | | 42,533,515 | | | | 4,579,233 | |
| | |
DISTRIBUTIONS TO SHAREHOLDERS: | | | | | | | | |
| | |
Investor Class | | | (1,006,275 | ) | | | (9,142,261 | ) |
| | |
Institutional Class | | | (97,392 | ) | | | (1,778,394 | ) |
Net decrease in net assets resulting from distributions | | | (1,103,667 | ) | | | (10,920,655 | ) |
CAPITAL SHARE TRANSACTIONS (net) (Note 4) | | | (24,121,054 | ) | | | (3,301,705 | ) |
Total increase (decrease) in net assets | | | 17,308,794 | | | | (9,643,127 | ) |
NET ASSETS: | | | | | | | | |
| | |
Beginning of year | | | 136,813,943 | | | | 146,457,070 | |
End of year | | | $154,122,737 | | | | $136,813,943 | |
| | |
| MATTHEWS ASIA SMALL COMPANIES FUND | | Year Ended
December 31, 2020 | | | Year Ended
December 31, 2019 | |
| | |
OPERATIONS: | | | | | | | | |
| | |
Net investment income (loss) | | | ($28,959 | ) | | | $1,449,817 | |
| | |
Net realized gain (loss) on investments and foreign currency related transactions | | | (3,922,376 | ) | | | (465,246 | ) |
| | |
Net change in unrealized appreciation/depreciation on investments and foreign currency related translations | | | 66,285,013 | | | | 29,646,396 | |
| | |
Net change on foreign capital gains taxes on unrealized appreciation/depreciation | | | (85,816 | ) | | | (61,919 | ) |
| | |
Net increase (decrease) in net assets resulting from operations | | | 62,247,862 | | | | 30,569,048 | |
| | |
DISTRIBUTIONS TO SHAREHOLDERS: | | | | | | | | |
| | |
Investor Class | | | (273,613 | ) | | | (493,289 | ) |
| | |
Institutional Class | | | (457,565 | ) | | | (598,845 | ) |
Net decrease in net assets resulting from distributions | | | (731,178 | ) | | | (1,092,134 | ) |
CAPITAL SHARE TRANSACTIONS (net) (Note 4) | | | (35,608,664 | ) | | | (34,658,494 | ) |
REDEMPTION FEES | | | — | | | | 25,416 | |
Total increase (decrease) in net assets | | | 25,908,020 | | | | (5,156,164 | ) |
NET ASSETS: | | | | | | | | |
| | |
Beginning of year | | | 181,234,256 | | | | 186,390,420 | |
End of year | | | $207,142,276 | | | | $181,234,256 | |
See accompanying notes to financial statements.
| | | | |
| matthewsasia.com | 800.789.ASIA | | | 123 | |
Statements of Changes in Net Assets (continued)
| | | | | | | | |
| MATTHEWS CHINA SMALL COMPANIES FUND | | Year Ended
December 31, 2020 | | | Year Ended
December 31, 2019 | |
| | |
OPERATIONS: | | | | | | | | |
| | |
Net investment income (loss) | | | ($40,100 | ) | | | $966,048 | |
| | |
Net realized gain (loss) on investments and foreign currency related transactions | | | 81,135,304 | | | | (928,242 | ) |
| | |
Net change in unrealized appreciation/depreciation on investments and foreign currency related translations | | | 77,868,228 | | | | 22,074,402 | |
Net increase (decrease) in net assets resulting from operations | | | 158,963,432 | | | | 22,112,208 | |
| | |
DISTRIBUTIONS TO SHAREHOLDERS: | | | | | | | | |
| | |
Investor Class | | | (41,538,891 | ) | | | (636,765 | ) |
| | |
Institutional Class | | | (14,619,496 | ) | | | (367,639 | ) |
Net decrease in net assets resulting from distributions | | | (56,158,387 | ) | | | (1,004,404 | ) |
CAPITAL SHARE TRANSACTIONS (net) (Note 4) | | | 185,155,881 | | | | 12,164,538 | |
REDEMPTION FEES | | | — | | | | 56,296 | |
Total increase (decrease) in net assets | | | 287,960,926 | | | | 33,328,638 | |
NET ASSETS: | | | | | | | | |
| | |
Beginning of year | | | 95,808,293 | | | | 62,479,655 | |
End of year | | | $383,769,219 | | | | $95,808,293 | |
See accompanying notes to financial statements.
(This Page Intentionally Left Blank)
| | | | |
| matthewsasia.com | 800.789.ASIA | | | 125 | |
Financial Highlights
Matthews Emerging Markets Equity Fund
The tables below set forth financial data for a share of beneficial interest outstanding throughout each period presented.
| | | | |
| INVESTOR CLASS | | Period Ended
Dec. 311 | |
Net Asset Value, beginning of period | | | $10.00 | |
INCOME (LOSS) FROM INVESTMENT OPERATIONS: | | | | |
Net investment income (loss)2 | | | 0.04 | |
Net realized gain (loss) and unrealized appreciation/depreciation on investments, foreign currency related transactions and foreign capital gains taxes | | | 6.08 | |
Total from investment operations | | | 6.12 | |
LESS DISTRIBUTIONS FROM: | | | | |
Net realized gains on investments | | | (0.36 | ) |
Net Asset Value, end of period | | | $15.76 | |
TOTAL RETURN | | | 61.23% | 3 |
| |
RATIOS/SUPPLEMENTAL DATA | | | | |
Net assets, end of period (in 000’s) | | | $9,851 | |
Ratio of expenses to average net assets before any reimbursement, waiver or recapture of expenses by Advisor and Administrator (Note 5) | | | 2.76% | 4 |
Ratio of expenses to average net assets after any reimbursement, waiver or recapture of expenses by Advisor and Administrator | | | 1.08% | 4 |
Ratio of net investment income (loss) to average net assets | | | 0.45% | 4 |
Portfolio turnover5 | | | 62.30% | 3 |
| |
| INSTITUTIONAL CLASS | | Period Ended
Dec. 311 | |
Net Asset Value, beginning of period | | | $10.00 | |
INCOME (LOSS) FROM INVESTMENT OPERATIONS: | | | | |
Net investment income (loss)2 | | | 0.04 | |
Net realized gain (loss) and unrealized appreciation/depreciation on investments, foreign currency related transactions and foreign capital gains taxes | | | 6.11 | |
Total from investment operations | | | 6.15 | |
LESS DISTRIBUTIONS FROM: | | | | |
Net investment income | | | (0.02 | ) |
Net realized gains on investments | | | (0.36 | ) |
Total distributions | | | (0.38 | ) |
Net Asset Value, end of period | | | $15.77 | |
TOTAL RETURN | | | 61.55% | 3 |
| |
RATIOS/SUPPLEMENTAL DATA | | | | |
Net assets, end of period (in 000’s) | | | $34,941 | |
Ratio of expenses to average net assets before any reimbursement, waiver or recapture of expenses by Advisor and Administrator (Note 5) | | | 2.65% | 4 |
Ratio of expenses to average net assets after any reimbursement, waiver or recapture of expenses by Advisor and Administrator | | | 0.90% | 4 |
Ratio of net investment income (loss) to average net assets | | | 0.44% | 4 |
Portfolio turnover5 | | | 62.30% | 3 |
| 1 | The Fund commenced operations on April 30, 2020. |
| 2 | Calculated using the average daily shares method. |
| 5 | The portfolio turnover rate is calculated on the Fund as a whole without distinguishing between classes of shares issued. |
See accompanying notes to financial statements.
Financial Highlights (continued)
Matthews Asia Total Return Bond Fund
The tables below set forth financial data for a share of beneficial interest outstanding throughout each period presented.
| | | | | | | | | | | | | | | | | | | | |
| | | Year Ended Dec. 31 | |
| INVESTOR CLASS | | 2020 | | | 2019 | | | 2018 | | | 2017 | | | 2016 | |
Net Asset Value, beginning of year | | | $11.12 | | | | $10.25 | | | | $10.98 | | | | $10.43 | | | | $9.96 | |
INCOME (LOSS) FROM INVESTMENT OPERATIONS: | | | | | | | | | | | | | | | | | | | | |
Net investment income (loss)1 | | | 0.46 | | | | 0.50 | | | | 0.40 | | | | 0.51 | | | | 0.50 | |
Net realized gain (loss) and unrealized appreciation/depreciation on investments, forward foreign currency exchange contracts, swaps, foreign currency related transactions, and foreign capital gains taxes | | | 0.11 | | | | 0.81 | | | | (0.84 | ) | | | 0.46 | | | | 0.38 | |
Total from investment operations | | | 0.57 | | | | 1.31 | | | | (0.44 | ) | | | 0.97 | | | | 0.88 | |
LESS DISTRIBUTIONS FROM: | | | | | | | | | | | | | | | | | | | | |
Net investment income | | | (0.44 | ) | | | (0.44 | ) | | | (0.25 | ) | | | (0.42 | ) | | | (0.41 | ) |
Return of capital | | | — | | | | — | | | | (0.04 | ) | | | — | | | | — | |
Total distributions | | | (0.44 | ) | | | (0.44 | ) | | | (0.29 | ) | | | (0.42 | ) | | | (0.41 | ) |
Net Asset Value, end of year | | | $11.25 | | | | $11.12 | | | | $10.25 | | | | $10.98 | | | | $10.43 | |
TOTAL RETURN | | | 5.36% | | | | 13.00% | | | | (4.05% | ) | | | 9.40% | | | | 8.85% | |
| | | | | |
RATIOS/SUPPLEMENTAL DATA | | | | | | | | | | | | | | | | | | | | |
Net assets, end of year (in 000’s) | | | $40,422 | | | | $39,485 | | | | $40,698 | | | | $63,437 | | | | $55,409 | |
Ratio of expenses to average net assets before any reimbursement, waiver or recapture of expenses by Advisor and Administrator (Note 5) | | | 1.15% | | | | 1.08% | | | | 1.23% | | | | 1.29% | | | | 1.33% | |
Ratio of expenses to average net assets after any reimbursement, waiver or recapture of expenses by Advisor and Administrator | | | 1.12% | | | | 1.07% | | | | 1.15% | | | | 1.15% | | | | 1.15% | |
Ratio of net investment income (loss) to average net assets | | | 4.32% | | | | 4.61% | | | | 3.76% | | | | 4.70% | | | | 4.85% | |
Portfolio turnover2 | | | 39.71% | | | | 84.38% | | | | 82.32% | | | | 36.58% | | | | 71.50% | |
| | | Year Ended Dec. 31 | |
| INSTITUTIONAL CLASS | | 2020 | | | 2019 | | | 2018 | | | 2017 | | | 2016 | |
Net Asset Value, beginning of year | | | $11.12 | | | | $10.25 | | | | $10.97 | | | | $10.42 | | | | $9.96 | |
INCOME (LOSS) FROM INVESTMENT OPERATIONS: | | | | | | | | | | | | | | | | | | | | |
Net investment income (loss)1 | | | 0.49 | | | | 0.52 | | | | 0.42 | | | | 0.53 | | | | 0.53 | |
Net realized gain (loss) and unrealized appreciation/depreciation on investments, forward foreign currency exchange contracts, swaps, foreign currency related transactions, and foreign capital gains taxes | | | 0.10 | | | | 0.81 | | | | (0.83 | ) | | | 0.47 | | | | 0.36 | |
Total from investment operations | | | 0.59 | | | | 1.33 | | | | (0.41 | ) | | | 1.00 | | | | 0.89 | |
LESS DISTRIBUTIONS FROM: | | | | | | | | | | | | | | | | | | | | |
Net investment income | | | (0.46 | ) | | | (0.46 | ) | | | (0.27 | ) | | | (0.45 | ) | | | (0.43 | ) |
Return of capital | | | — | | | | — | | | | (0.04 | ) | | | — | | | | — | |
Total distributions | | | (0.46 | ) | | | (0.46 | ) | | | (0.31 | ) | | | (0.45 | ) | | | (0.43 | ) |
Net Asset Value, end of year | | | $11.25 | | | | $11.12 | | | | $10.25 | | | | $10.97 | | | | $10.42 | |
TOTAL RETURN | | | 5.60% | | | | 13.20% | | | | (3.78% | ) | | | 9.67% | | | | 9.02% | |
| | | | | |
RATIOS/SUPPLEMENTAL DATA | | | | | | | | | | | | | | | | | | | | |
Net assets, end of year (in 000’s) | | | $74,426 | | | | $77,228 | | | | $60,017 | | | | $31,155 | | | | $13,398 | |
Ratio of expenses to average net assets before any reimbursement, waiver or recapture of expenses by Advisor and Administrator (Note 5) | | | 1.00% | | | | 0.97% | | | | 1.04% | | | | 1.08% | | | | 1.12% | |
Ratio of expenses to average net assets after any reimbursement, waiver or recapture of expenses by Advisor and Administrator | | | 0.90% | | | | 0.90% | | | | 0.90% | | | | 0.90% | | | | 0.90% | |
Ratio of net investment income (loss) to average net assets | | | 4.56% | | | | 4.81% | | | | 4.03% | | | | 4.93% | | | | 5.13% | |
Portfolio turnover2 | | | 39.71% | | | | 84.38% | | | | 82.32% | | | | 36.58% | | | | 71.50% | |
| 1 | Calculated using the average daily shares method. |
| 2 | The portfolio turnover rate is calculated on the Fund as a whole without distinguishing between classes of shares issued. |
See accompanying notes to financial statements.
| | | | |
| matthewsasia.com | 800.789.ASIA | | | 127 | |
Financial Highlights (continued)
Matthews Asia Credit Opportunities Fund
The tables below set forth financial data for a share of beneficial interest outstanding throughout each period presented.
| | | | | | | | | | | | | | | | | | | | |
| | | Year Ended Dec. 31 | | | Period Ended
Dec. 31, 20161 | |
| INVESTOR CLASS | | 2020 | | | 2019 | | | 2018 | | | 2017 | |
Net Asset Value, beginning of period | | | $10.57 | | | | $9.76 | | | | $10.39 | | | | $10.13 | | | | $10.00 | |
INCOME (LOSS) FROM INVESTMENT OPERATIONS: | | | | | | | | | | | | | | | | | | | | |
Net investment income (loss)2 | | | 0.46 | | | | 0.47 | | | | 0.37 | | | | 0.44 | | | | 0.29 | |
Net realized gain (loss) and unrealized appreciation/depreciation on investments, swaps, and foreign currency related transactions | | | (0.29 | ) | | | 0.82 | | | | (0.67 | ) | | | 0.35 | | | | 0.18 | |
Total from investment operations | | | 0.17 | | | | 1.29 | | | | (0.30 | ) | | | 0.79 | | | | 0.47 | |
LESS DISTRIBUTIONS FROM: | | | | | | | | | | | | | | | | | | | | |
Net investment income | | | (0.44 | ) | | | (0.44 | ) | | | (0.33 | ) | | | (0.43 | ) | | | (0.32 | ) |
Net realized gains on investments | | | (0.03 | ) | | | (0.04 | ) | | | — | | | | (0.10 | ) | | | (0.02 | ) |
Total distributions | | | (0.47 | ) | | | (0.48 | ) | | | (0.33 | ) | | | (0.53 | ) | | | (0.34 | ) |
Net Asset Value, end of period | | | $10.27 | | | | $10.57 | | | | $9.76 | | | | $10.39 | | | | $10.13 | |
TOTAL RETURN | | | 1.80% | | | | 13.34% | | | | (2.88% | ) | | | 7.86% | | | | 4.66% | 3 |
| | | | | |
RATIOS/SUPPLEMENTAL DATA | | | | | | | | | | | | | | | | | | | | |
Net assets, end of period (in 000’s) | | | $8,856 | | | | $12,997 | | | | $8,668 | | | | $10,201 | | | | $10,119 | |
Ratio of expenses to average net assets before any reimbursement, waiver or recapture of expenses by Advisor and Administrator (Note 5) | | | 1.14% | | | | 1.24% | | | | 1.44% | | | | 1.86% | | | | 2.24% | 4 |
Ratio of expenses to average net assets after any reimbursement, waiver or recapture of expenses by Advisor and Administrator | | | 1.14% | | | | 1.12% | | | | 1.15% | | | | 1.15% | | | | 1.15% | 4 |
Ratio of net investment income (loss) to average net assets | | | 4.53% | | | | 4.55% | | | | 3.62% | | | | 4.17% | | | | 4.12% | 4 |
Portfolio turnover5 | | | 48.46% | | | | 81.08% | | | | 49.06% | | | | 27.86% | | | | 18.80% | 3 |
| | |
| | | Year Ended Dec. 31 | | | Period Ended
Dec. 31, 20161 | |
| INSTITUTIONAL CLASS | | 2020 | | | 2019 | | | 2018 | | | 2017 | |
Net Asset Value, beginning of period | | | $10.57 | | | | $9.75 | | | | $10.39 | | | | $10.13 | | | | $10.00 | |
INCOME (LOSS) FROM INVESTMENT OPERATIONS: | | | | | | | | | | | | | | | | | | | | |
Net investment income (loss)2 | | | 0.48 | | | | 0.50 | | | | 0.39 | | | | 0.46 | | | | 0.30 | |
Net realized gain (loss) and unrealized appreciation/depreciation on investments, swaps, and foreign currency related transactions | | | (0.29 | ) | | | 0.82 | | | | (0.67 | ) | | | 0.36 | | | | 0.18 | |
Total from investment operations | | | 0.19 | | | | 1.32 | | | | (0.28 | ) | | | 0.82 | | | | 0.48 | |
LESS DISTRIBUTIONS FROM: | | | | | | | | | | | | | | | | | | | | |
Net investment income | | | (0.46 | ) | | | (0.46 | ) | | | (0.36 | ) | | | (0.46 | ) | | | (0.33 | ) |
Net realized gains on investments | | | (0.03 | ) | | | (0.04 | ) | | | — | | | | (0.10 | ) | | | (0.02 | ) |
Total distributions | | | (0.49 | ) | | | (0.50 | ) | | | (0.36 | ) | | | (0.56 | ) | | | (0.35 | ) |
Net Asset Value, end of period | | | $10.27 | | | | $10.57 | | | | $9.75 | | | | $10.39 | | | | $10.13 | |
TOTAL RETURN | | | 2.05% | | | | 13.69% | | | | (2.75% | ) | | | 8.13% | | | | 4.82% | 3 |
| | | | | |
RATIOS/SUPPLEMENTAL DATA | | | | | | | | | | | | | | | | | | | | |
Net assets, end of period (in 000’s) | | | $82,252 | | | | $79,438 | | | | $31,085 | | | | $21,491 | | | | $6,205 | |
Ratio of expenses to average net assets before any reimbursement, waiver or recapture of expenses by Advisor and Administrator (Note 5) | | | 0.98% | | | | 1.07% | | | | 1.25% | | | | 1.62% | | | | 1.99% | 4 |
Ratio of expenses to average net assets after any reimbursement, waiver or recapture of expenses by Advisor and Administrator | | | 0.90% | | | | 0.90% | | | | 0.90% | | | | 0.90% | | | | 0.90% | 4 |
Ratio of net investment income (loss) to average net assets | | | 4.79% | | | | 4.79% | | | | 3.90% | | | | 4.45% | | | | 4.28% | 4 |
Portfolio turnover5 | | | 48.46% | | | | 81.08% | | | | 49.06% | | | | 27.86% | | | | 18.80% | 3 |
| 1 | Commenced operations on April, 29 2016. |
| 2 | Calculated using the average daily shares method. |
| 5 | The portfolio turnover rate is calculated on the Fund as a whole without distinguishing between classes of shares issued. |
See accompanying notes to financial statements.
Financial Highlights (continued)
Matthews Asian Growth And Income Fund
The tables below set forth financial data for a share of beneficial interest outstanding throughout each period presented.
| | | | | | | | | | | | | | | | | | | | |
| | | Year Ended Dec. 31 | |
| INVESTOR CLASS | | 2020 | | | 2019 | | | 2018 | | | 2017 | | | 2016 | |
Net Asset Value, beginning of year | | | $15.73 | | | | $13.92 | | | | $17.46 | | | | $14.94 | | | | $16.03 | |
INCOME (LOSS) FROM INVESTMENT OPERATIONS: | | | | | | | | | | | | | | | | | | | | |
Net investment income (loss)1 | | | 0.21 | | | | 0.25 | | | | 0.32 | | | | 0.33 | | | | 0.32 | |
Net realized gain (loss) and unrealized appreciation/depreciation on investments, foreign currency related transactions and foreign capital gains taxes | | | 2.27 | | | | 2.13 | | | | (2.20 | ) | | | 2.92 | | | | (0.06 | ) |
Total from investment operations | | | 2.48 | | | | 2.38 | | | | (1.88 | ) | | | 3.25 | | | | 0.26 | |
LESS DISTRIBUTIONS FROM: | | | | | | | | | | | | | | | | | | | | |
Net investment income | | | (0.16 | ) | | | (0.35 | ) | | | (0.32 | ) | | | (0.46 | ) | | | (0.48 | ) |
Net realized gains on investments | | | — | 2 | | | (0.22 | ) | | | (1.34 | ) | | | (0.27 | ) | | | (0.87 | ) |
Total distributions | | | (0.16 | ) | | | (0.57 | ) | | | (1.66 | ) | | | (0.73 | ) | | | (1.35 | ) |
Paid-in capital from redemption fees (Note 4) | | | — | | | | — | | | | — | | | | — | 2 | | | — | |
Net Asset Value, end of year | | | $18.05 | | | | $15.73 | | | | $13.92 | | | | $17.46 | | | | $14.94 | |
TOTAL RETURN | | | 16.00% | | | | 17.26% | | | | (10.96% | ) | | | 21.85% | | | | 1.34% | |
| | | | | |
RATIOS/SUPPLEMENTAL DATA | | | | | | | | | | | | | | | | | | | | |
Net assets, end of year (in 000’s) | | | $673,576 | | | | $723,815 | | | | $799,328 | | | | $1,535,746 | | | | $1,684,987 | |
Ratio of expenses to average net assets | | | 1.09% | | | | 1.08% | | | | 1.08% | | | | 1.07% | | | | 1.09% | |
Ratio of net investment income (loss) to average net assets | | | 1.38% | | | | 1.67% | | | | 1.95% | | | | 1.95% | | | | 1.90% | |
Portfolio turnover3 | | | 36.27% | | | | 21.89% | | | | 32.24% | | | | 23.23% | | | | 15.64% | |
| |
| | | Year Ended Dec. 31 | |
| INSTITUTIONAL CLASS | | 2020 | | | 2019 | | | 2018 | | | 2017 | | | 2016 | |
Net Asset Value, beginning of year | | | $15.70 | | | | $13.89 | | | | $17.43 | | | | $14.92 | | | | $16.02 | |
INCOME (LOSS) FROM INVESTMENT OPERATIONS: | | | | | | | | | | | | | | | | | | | | |
Net investment income (loss)1 | | | 0.23 | | | | 0.27 | | | | 0.35 | | | | 0.36 | | | | 0.34 | |
Net realized gain (loss) and unrealized appreciation/depreciation on investments, foreign currency related transactions and foreign capital gains taxes | | | 2.27 | | | | 2.14 | | | | (2.20 | ) | | | 2.91 | | | | (0.07 | ) |
Total from investment operations | | | 2.50 | | | | 2.41 | | | | (1.85 | ) | | | 3.27 | | | | 0.27 | |
LESS DISTRIBUTIONS FROM: | | | | | | | | | | | | | | | | | | | | |
Net investment income | | | (0.18 | ) | | | (0.38 | ) | | | (0.35 | ) | | | (0.49 | ) | | | (0.50 | ) |
Net realized gains on investments | | | — | 2 | | | (0.22 | ) | | | (1.34 | ) | | | (0.27 | ) | | | (0.87 | ) |
Total distributions | | | (0.18 | ) | | | (0.60 | ) | | | (1.69 | ) | | | (0.76 | ) | | | (1.37 | ) |
Paid-in capital from redemption fees (Note 4) | | | — | | | | — | | | | — | | | | — | 2 | | | — | |
Net Asset Value, end of year | | | $18.02 | | | | $15.70 | | | | $13.89 | | | | $17.43 | | | | $14.92 | |
TOTAL RETURN | | | 16.18% | | | | 17.46% | | | | (10.84% | ) | | | 22.00% | | | | 1.44% | |
| | | | | |
RATIOS/SUPPLEMENTAL DATA | | | | | | | | | | | | | | | | | | | | |
Net assets, end of year (in 000’s) | | | $822,179 | | | | $743,951 | | | | $596,364 | | | | $1,310,168 | | | | $809,254 | |
Ratio of expenses to average net assets | | | 0.96% | | | | 0.94% | | | | 0.93% | | | | 0.93% | | | | 0.94% | |
Ratio of net investment income (loss) to average net assets | | | 1.51% | | | | 1.80% | | | | 2.14% | | | | 2.16% | | | | 2.06% | |
Portfolio turnover3 | | | 36.27% | | | | 21.89% | | | | 32.24% | | | | 23.23% | | | | 15.64% | |
| 1 | Calculated using the average daily shares method. |
| 2 | Less than $0.01 per share. |
| 3 | The portfolio turnover rate is calculated on the Fund as a whole without distinguishing between classes of shares issued. |
See accompanying notes to financial statements.
| | | | |
| matthewsasia.com | 800.789.ASIA | | | 129 | |
Financial Highlights (continued)
Matthews Asia Dividend Fund
The tables below set forth financial data for a share of beneficial interest outstanding throughout each period presented.
| | | | | | | | | | | | | | | | | | | | |
| | | Year Ended Dec. 31 | |
| INVESTOR CLASS | | 2020 | | | 2019 | | | 2018 | | | 2017 | | | 20161 | |
Net Asset Value, beginning of year | | | $17.47 | | | | $16.05 | | | | $19.74 | | | | $15.52 | | | | $15.36 | |
INCOME (LOSS) FROM INVESTMENT OPERATIONS: | | | | | | | | | | | | | | | | | | | | |
Net investment income (loss)2 | | | 0.15 | | | | 0.28 | | | | 0.37 | | | | 0.31 | | | | 0.28 | |
Net realized gain (loss) and unrealized appreciation/depreciation on investments, foreign currency related transactions and foreign capital gains taxes | | | 5.23 | | | | 1.50 | | | | (2.83 | ) | | | 5.02 | | | | 0.37 | |
Total from investment operations | | | 5.38 | | | | 1.78 | | | | (2.46 | ) | | | 5.33 | | | | 0.65 | |
LESS DISTRIBUTIONS FROM: | | | | | | | | | | | | | | | | | | | | |
Net investment income | | | (0.22 | ) | | | (0.36 | ) | | | (0.31 | ) | | | (0.69 | ) | | | (0.29 | ) |
Net realized gains on investments | | | — | | | | — | | | | (0.92 | ) | | | (0.42 | ) | | | (0.11 | ) |
Return of capital | | | — | | | | — | | | | — | | | | — | | | | (0.09 | ) |
Total distributions | | | (0.22 | ) | | | (0.36 | ) | | | (1.23 | ) | | | (1.11 | ) | | | (0.49 | ) |
Paid-in capital from redemption fees (Note 4) | | | — | | | | — | | | | — | | | | — | 3 | | | — | |
Net Asset Value, end of year | | | $22.63 | | | | $17.47 | | | | $16.05 | | | | $19.74 | | | | $15.52 | |
TOTAL RETURN | | | 31.25% | | | | 11.17% | | | | (12.72% | ) | | | 34.69% | | | | 4.13% | |
| | | | | |
RATIOS/SUPPLEMENTAL DATA | | | | | | | | | | | | | | | | | | | | |
Net assets, end of year (in 000’s) | | | $2,292,262 | | | | $2,312,560 | | | | $2,728,599 | | | | $3,713,276 | | | | $2,650,611 | |
Ratio of expenses to average net assets before any reimbursement, waiver or recapture of expenses by Advisor and Administrator (Note 5) | | | 1.03% | | | | 1.03% | | | | 1.02% | | | | 1.03% | | | | 1.06% | |
Ratio of expenses to average net assets after any reimbursement, waiver or recapture of expenses by Advisor and Administrator | | | 1.02% | | | | 1.02% | | | | 1.01% | | | | 1.02% | | | | 1.06% | |
Ratio of net investment income (loss) to average net assets | | | 0.85% | | | | 1.68% | | | | 1.97% | | | | 1.67% | | | | 1.79% | |
Portfolio turnover4 | | | 37.73% | | | | 30.32% | | | | 39.75% | | | | 28.11% | | | | 39.76% | |
| |
| | | Year Ended Dec. 31 | |
| INSTITUTIONAL CLASS | | 2020 | | | 2019 | | | 2018 | | | 2017 | | | 20161 | |
Net Asset Value, beginning of year | | | $17.47 | | | | $16.04 | | | | $19.73 | | | | $15.52 | | | | $15.35 | |
INCOME (LOSS) FROM INVESTMENT OPERATIONS: | | | | | | | | | | | | | | | | | | | | |
Net investment income (loss)2 | | | 0.16 | | | | 0.30 | | | | 0.39 | | | | 0.33 | | | | 0.30 | |
Net realized gain (loss) and unrealized appreciation/depreciation on investments, foreign currency related transactions and foreign capital gains taxes | | | 5.22 | | | | 1.50 | | | | (2.83 | ) | | | 5.01 | | | | 0.38 | |
Total from investment operations | | | 5.38 | | | | 1.80 | | | | (2.44 | ) | | | 5.34 | | | | 0.68 | |
LESS DISTRIBUTIONS FROM: | | | | | | | | | | | | | | | | | | | | |
Net investment income | | | (0.23 | ) | | | (0.37 | ) | | | (0.33 | ) | | | (0.71 | ) | | | (0.31 | ) |
Net realized gains on investments | | | — | | | | — | | | | (0.92 | ) | | | (0.42 | ) | | | (0.11 | ) |
Return of capital | | | — | | | | — | | | | — | | | | — | | | | (0.09 | ) |
Total distributions | | | (0.23 | ) | | | (0.37 | ) | | | (1.25 | ) | | | (1.13 | ) | | | (0.51 | ) |
Paid-in capital from redemption fees (Note 4) | | | — | | | | — | | | | — | | | | — | 3 | | | — | |
Net Asset Value, end of year | | | $22.62 | | | | $17.47 | | | | $16.04 | | | | $19.73 | | | | $15.52 | |
TOTAL RETURN | | | 31.29% | | | | 11.35% | | | | (12.64% | ) | | | 34.77% | | | | 4.33% | |
| | | | | |
RATIOS/SUPPLEMENTAL DATA | | | | | | | | | | | | | | | | | | | | |
Net assets, end of year (in 000’s) | | | $2,908,674 | | | | $3,057,896 | | | | $3,039,226 | | | | $3,284,070 | | | | $2,034,276 | |
Ratio of expenses to average net assets before any reimbursement, waiver or recapture of expenses by Advisor and Administrator (Note 5) | | | 0.93% | | | | 0.93% | | | | 0.91% | | | | 0.92% | | | | 0.94% | |
Ratio of expenses to average net assets after any reimbursement, waiver or recapture of expenses by Advisor and Administrator | | | 0.93% | | | | 0.92% | | | | 0.90% | | | | 0.91% | | | | 0.93% | |
Ratio of net investment income (loss) to average net assets | | | 0.91% | | | | 1.80% | | | | 2.09% | | | | 1.81% | | | | 1.91% | |
Portfolio turnover4 | | | 37.73% | | | | 30.32% | | | | 39.75% | | | | 28.11% | | | | 39.76% | |
| 1 | Consolidated Financial Highlights. See Note 2-C. |
| 2 | Calculated using the average daily shares method. |
| 3 | Less than $0.01 per share. |
| 4 | The portfolio turnover rate is calculated on the Fund as a whole without distinguishing between classes of shares issued. |
See accompanying notes to financial statements.
Financial Highlights (continued)
Matthews China Dividend Fund
The tables below set forth financial data for a share of beneficial interest outstanding throughout each period presented.
| | | | | | | | | | | | | | | | | | | | |
| | | Year Ended Dec. 31 | |
| INVESTOR CLASS | | 2020 | | | 2019 | | | 2018 | | | 2017 | | | 2016 | |
Net Asset Value, beginning of year | | | $16.20 | | | | $14.32 | | | | $17.61 | | | | $14.09 | | | | $13.79 | |
INCOME (LOSS) FROM INVESTMENT OPERATIONS: | | | | | | | | | | | | | | | | | | | | |
Net investment income (loss)1 | | | 0.30 | | | | 0.34 | | | | 0.41 | | | | 0.35 | | | | 0.31 | |
Net realized gain (loss) and unrealized appreciation/depreciation on investments and foreign currency related transactions | | | 3.54 | | | | 1.80 | | | | (2.09 | ) | | | 4.85 | | | | 0.47 | |
Total from investment operations | | | 3.84 | | | | 2.14 | | | | (1.68 | ) | | | 5.20 | | | | 0.78 | |
LESS DISTRIBUTIONS FROM: | | | | | | | | | | | | | | | | | | | | |
Net investment income | | | (0.40 | ) | | | (0.26 | ) | | | (0.40 | ) | | | (0.49 | ) | | | (0.28 | ) |
Net realized gains on investments | | | — | | | | — | | | | (1.21 | ) | | | (1.19 | ) | | | (0.20 | ) |
Total distributions | | | (0.40 | ) | | | (0.26 | ) | | | (1.61 | ) | | | (1.68 | ) | | | (0.48 | ) |
Net Asset Value, end of year | | | $19.64 | | | | $16.20 | | | | $14.32 | | | | $17.61 | | | | $14.09 | |
TOTAL RETURN | | | 24.22% | | | | 15.00% | | | | (9.98% | ) | | | 37.69% | | | | 5.70% | |
| | | | | |
RATIOS/SUPPLEMENTAL DATA | | | | | | | | | | | | | | | | | | | | |
Net assets, end of year (in 000’s) | | | $269,192 | | | | $258,111 | | | | $196,626 | | | | $260,593 | | | | $160,400 | |
Ratio of expenses to average net assets | | | 1.15% | | | | 1.15% | | | | 1.15% | | | | 1.19% | | | | 1.22% | |
Ratio of net investment income (loss) to average net assets | | | 1.79% | | | | 2.14% | | | | 2.33% | | | | 2.12% | | | | 2.28% | |
Portfolio turnover2 | | | 81.79% | | | | 65.69% | | | | 66.47% | | | | 69.14% | | | | 72.96% | |
| |
| | | Year Ended Dec. 31 | |
| INSTITUTIONAL CLASS | | 2020 | | | 2019 | | | 2018 | | | 2017 | | | 2016 | |
Net Asset Value, beginning of year | | | $16.20 | | | | $14.32 | | | | $17.61 | | | | $14.09 | | | | $13.79 | |
INCOME (LOSS) FROM INVESTMENT OPERATIONS: | | | | | | | | | | | | | | | | | | | | |
Net investment income (loss)1 | | | 0.31 | | | | 0.35 | | | | 0.42 | | | | 0.37 | | | | 0.29 | |
Net realized gain (loss) and unrealized appreciation/depreciation on investments and foreign currency related transactions | | | 3.55 | | | | 1.81 | | | | (2.07 | ) | | | 4.85 | | | | 0.51 | |
Total from investment operations | | | 3.86 | | | | 2.16 | | | | (1.65 | ) | | | 5.22 | | | | 0.80 | |
LESS DISTRIBUTIONS FROM: | | | | | | | | | | | | | | | | | | | | |
Net investment income | | | (0.42 | ) | | | (0.28 | ) | | | (0.43 | ) | | | (0.51 | ) | | | (0.30 | ) |
Net realized gains on investments | | | — | | | | — | | | | (1.21 | ) | | | (1.19 | ) | | | (0.20 | ) |
Total distributions | | | (0.42 | ) | | | (0.28 | ) | | | (1.64 | ) | | | (1.70 | ) | | | (0.50 | ) |
Net Asset Value, end of year | | | $19.64 | | | | $16.20 | | | | $14.32 | | | | $17.61 | | | | $14.09 | |
TOTAL RETURN | | | 24.37% | | | | 15.16% | | | | (9.83% | ) | | | 37.88% | | | | 5.90% | |
| | | | | |
RATIOS/SUPPLEMENTAL DATA | | | | | | | | | | | | | | | | | | | | |
Net assets, end of year (in 000’s) | | | $115,451 | | | | $122,630 | | | | $73,033 | | | | $54,147 | | | | $27,758 | |
Ratio of expenses to average net assets | | | 1.02% | | | | 1.01% | | | | 1.01% | | | | 1.04% | | | | 1.06% | |
Ratio of net investment income (loss) to average net assets | | | 1.85% | | | | 2.25% | | | | 2.44% | | | | 2.25% | | | | 2.09% | |
Portfolio turnover2 | | | 81.79% | | | | 65.69% | | | | 66.47% | | | | 69.14% | | | | 72.96% | |
| 1 | Calculated using the average daily shares method. |
| 2 | The portfolio turnover rate is calculated on the Fund as a whole without distinguishing between classes of shares issued. |
See accompanying notes to financial statements.
| | | | |
| matthewsasia.com | 800.789.ASIA | | | 131 | |
Financial Highlights (continued)
Matthews Asia Growth Fund
The tables below set forth financial data for a share of beneficial interest outstanding throughout each period presented.
| | | | | | | | | | | | | | | | | | | | |
| | | Year Ended Dec. 31 | |
| INVESTOR CLASS | | 2020 | | | 2019 | | | 2018 | | | 2017 | | | 2016 | |
Net Asset Value, beginning of year | | | $28.10 | | | | $22.49 | | | | $27.25 | | | | $21.05 | | | | $21.09 | |
INCOME (LOSS) FROM INVESTMENT OPERATIONS: | | | | | | | | | | | | | | | | | | | | |
Net investment income (loss)1 | | | (0.11 | ) | | | (0.03 | ) | | | — | 2 | | | 0.04 | | | | 0.06 | |
Net realized gain (loss) and unrealized appreciation/depreciation on investments, foreign currency related transactions and foreign capital gains taxes | | | 13.16 | | | | 5.91 | | | | (4.41 | ) | | | 8.14 | | | | 0.13 | |
Total from investment operations | | | 13.05 | | | | 5.88 | | | | (4.41 | ) | | | 8.18 | | | | 0.19 | |
LESS DISTRIBUTIONS FROM: | | | | | | | | | | | | | | | | | | | | |
Net investment income | | | (0.15 | ) | | | — | | | | (0.03 | ) | | | (0.16 | ) | | | (0.23 | ) |
Net realized gains on investments | | | (1.56 | ) | | | (0.27 | ) | | | (0.32 | ) | | | (1.82 | ) | | | — | |
Total distributions | | | (1.71 | ) | | | (0.27 | ) | | | (0.35 | ) | | | (1.98 | ) | | | (0.23 | ) |
Net Asset Value, end of year | | | $39.44 | | | | $28.10 | | | | $22.49 | | | | $27.25 | | | | $21.05 | |
TOTAL RETURN | | | 46.76% | | | | 26.18% | | | | (16.25% | ) | | | 39.39% | | | | 0.92% | |
| | | | | |
RATIOS/SUPPLEMENTAL DATA | | | | | | | | | | | | | | | | | | | | |
Net assets, end of year (in 000’s) | | | $784,085 | | | | $504,538 | | | | $463,600 | | | | $554,309 | | | | $419,516 | |
Ratio of expenses to average net assets | | | 1.08% | | | | 1.09% | | | | 1.10% | | | | 1.12% | | | | 1.14% | |
Ratio of net investment income (loss) to average net assets | | | (0.35% | ) | | | (0.14% | ) | | | —% | 3 | | | 0.16% | | | | 0.30% | |
Portfolio turnover4 | | | 42.78% | | | | 38.05% | | | | 12.12% | | | | 23.19% | | | | 13.61% | |
| |
| | | Year Ended Dec. 31 | |
| INSTITUTIONAL CLASS | | 2020 | | | 2019 | | | 2018 | | | 2017 | | | 2016 | |
Net Asset Value, beginning of year | | | $28.34 | | | | $22.65 | | | | $27.45 | | | | $21.19 | | | | $21.24 | |
INCOME (LOSS) FROM INVESTMENT OPERATIONS: | | | | | | | | | | | | | | | | | | | | |
Net investment income (loss)1 | | | (0.07 | ) | | | — | 2 | | | 0.05 | | | | 0.09 | | | | 0.10 | |
Net realized gain (loss) and unrealized appreciation/depreciation on investments, foreign currency related transactions and foreign capital gains taxes | | | 13.30 | | | | 5.96 | | | | (4.45 | ) | | | 8.20 | | | | 0.13 | |
Total from investment operations | | | 13.23 | | | | 5.96 | | | | (4.40 | ) | | | 8.29 | | | | 0.23 | |
LESS DISTRIBUTIONS FROM: | | | | | | | | | | | | | | | | | | | | |
Net investment income | | | (0.19 | ) | | | — | | | | (0.08 | ) | | | (0.21 | ) | | | (0.28 | ) |
Net realized gains on investments | | | (1.56 | ) | | | (0.27 | ) | | | (0.32 | ) | | | (1.82 | ) | | | — | |
Total distributions | | | (1.75 | ) | | | (0.27 | ) | | | (0.40 | ) | | | (2.03 | ) | | | (0.28 | ) |
Net Asset Value, end of year | | | $39.82 | | | | $28.34 | | | | $22.65 | | | | $27.45 | | | | $21.19 | |
TOTAL RETURN | | | 47.01% | | | | 26.34% | | | | (16.10% | ) | | | 39.64% | | | | 1.06% | |
| | | | | |
RATIOS/SUPPLEMENTAL DATA | | | | | | | | | | | | | | | | | | | | |
Net assets, end of year (in 000’s) | | | $1,269,702 | | | | $698,797 | | | | $466,733 | | | | $296,253 | | | | $195,949 | |
Ratio of expenses to average net assets | | | 0.95% | | | | 0.94% | | | | 0.93% | | | | 0.93% | | | | 0.96% | |
Ratio of net investment income (loss) to average net assets | | | (0.23% | ) | | | —% | 3 | | | 0.17% | | | | 0.35% | | | | 0.47% | |
Portfolio turnover4 | | | 42.78% | | | | 38.05% | | | | 12.12% | | | | 23.19% | | | | 13.61% | |
| 1 | Calculated using the average daily shares method. |
| 2 | Less than $0.01 per share. |
| 4 | The portfolio turnover rate is calculated on the Fund as a whole without distinguishing between classes of shares issued. |
See accompanying notes to financial statements.
Financial Highlights (continued)
Matthews Pacific Tiger Fund
The tables below set forth financial data for a share of beneficial interest outstanding throughout each period presented.
| | | | | | | | | | | | | | | | | | | | |
| | | Year Ended Dec. 31 | |
| INVESTOR CLASS | | 2020 | | | 2019 | | | 2018 | | | 2017 | | | 2016 | |
Net Asset Value, beginning of year | | | $28.74 | | | | $26.86 | | | | $31.66 | | | | $22.92 | | | | $23.54 | |
INCOME (LOSS) FROM INVESTMENT OPERATIONS: | | | | | | | | | | | | | | | | | | | | |
Net investment income (loss)1 | | | 0.10 | | | | 0.19 | | | | 0.24 | | | | 0.17 | | | | 0.11 | |
Net realized gain (loss) and unrealized appreciation/depreciation on investments, foreign currency related transactions and foreign capital gains taxes | | | 8.10 | | | | 2.68 | | | | (3.75 | ) | | | 8.96 | | | | (0.13 | ) |
Total from investment operations | | | 8.20 | | | | 2.87 | | | | (3.51 | ) | | | 9.13 | | | | (0.02 | ) |
LESS DISTRIBUTIONS FROM: | | | | | | | | | | | | | | | | | | | | |
Net investment income | | | (0.08 | ) | | | (0.15 | ) | | | (0.21 | ) | | | (0.17 | ) | | | (0.13 | ) |
Net realized gains on investments | | | (1.92 | ) | | | (0.84 | ) | | | (1.08 | ) | | | (0.22 | ) | | | (0.47 | ) |
Total distributions | | | (2.00 | ) | | | (0.99 | ) | | | (1.29 | ) | | | (0.39 | ) | | | (0.60 | ) |
Paid-in capital from redemption fees (Note 4) | | | — | | | | — | 2 | | | — | | | | — | 2 | | | — | |
Net Asset Value, end of year | | | $34.94 | | | | $28.74 | | | | $26.86 | | | | $31.66 | | | | $22.92 | |
TOTAL RETURN | | | 28.83% | | | | 10.72% | | | | (11.11% | ) | | | 39.96% | | | | (0.16% | ) |
| | | | | |
RATIOS/SUPPLEMENTAL DATA | | | | | | | | | | | | | | | | | | | | |
Net assets, end of year (in 000’s) | | | $2,585,654 | | | | $2,536,844 | | | | $2,618,155 | | | | $3,335,795 | | | | $2,445,183 | |
Ratio of expenses to average net assets before any reimbursement, waiver or recapture of expenses by Advisor and Administrator (Note 5) | | | 1.08% | | | | 1.08% | | | | 1.07% | | | | 1.08% | | | | 1.09% | |
Ratio of expenses to average net assets after any reimbursement, waiver or recapture of expenses by Advisor and Administrator | | | 1.06% | | | | 1.05% | | | | 1.04% | | | | 1.06% | | | | 1.08% | |
Ratio of net investment income (loss) to average net assets | | | 0.35% | | | | 0.66% | | | | 0.79% | | | | 0.63% | | | | 0.47% | |
Portfolio turnover3 | | | 38.11% | | | | 17.08% | | | | 11.48% | | | | 9.18% | | | | 5.73% | |
| |
| | | Year Ended Dec. 31 | |
| INSTITUTIONAL CLASS | | 2020 | | | 2019 | | | 2018 | | | 2017 | | | 2016 | |
Net Asset Value, beginning of year | | | $28.71 | | | | $26.83 | | | | $31.63 | | | | $22.90 | | | | $23.52 | |
INCOME (LOSS) FROM INVESTMENT OPERATIONS: | | | | | | | | | | | | | | | | | | | | |
Net investment income (loss)1 | | | 0.13 | | | | 0.23 | | | | 0.28 | | | | 0.22 | | | | 0.16 | |
Net realized gain (loss) and unrealized appreciation/depreciation on investments, foreign currency related transactions and foreign capital gains taxes | | | 8.11 | | | | 2.68 | | | | (3.74 | ) | | | 8.95 | | | | (0.14 | ) |
Total from investment operations | | | 8.24 | | | | 2.91 | | | | (3.46 | ) | | | 9.17 | | | | 0.02 | |
LESS DISTRIBUTIONS FROM: | | | | | | | | | | | | | | | | | | | | |
Net investment income | | | (0.13 | ) | | | (0.19 | ) | | | (0.26 | ) | | | (0.22 | ) | | | (0.17 | ) |
Net realized gains on investments | | | (1.92 | ) | | | (0.84 | ) | | | (1.08 | ) | | | (0.22 | ) | | | (0.47 | ) |
Total distributions | | | (2.05 | ) | | | (1.03 | ) | | | (1.34 | ) | | | (0.44 | ) | | | (0.64 | ) |
Paid-in capital from redemption fees (Note 4) | | | — | | | | — | 2 | | | — | | | | — | 2 | | | — | |
Net Asset Value, end of year | | | $34.90 | | | | $28.71 | | | | $26.83 | | | | $31.63 | | | | $22.90 | |
TOTAL RETURN | | | 28.98% | | | | 10.90% | | | | (10.94% | ) | | | 40.17% | | | | 0.03% | |
| | | | | |
RATIOS/SUPPLEMENTAL DATA | | | | | | | | | | | | | | | | | | | | |
Net assets, end of year (in 000’s) | | | $6,172,995 | | | | $6,189,015 | | | | $5,689,079 | | | | $6,389,242 | | | | $4,207,508 | |
Ratio of expenses to average net assets before any reimbursement, waiver or recapture of expenses by Advisor and Administrator (Note 5) | | | 0.94% | | | | 0.93% | | | | 0.90% | | | | 0.91% | | | | 0.91% | |
Ratio of expenses to average net assets after any reimbursement, waiver or recapture of expenses by Advisor and Administrator | | | 0.92% | | | | 0.91% | | | | 0.88% | | | | 0.89% | | | | 0.90% | |
Ratio of net investment income (loss) to average net assets | | | 0.46% | | | | 0.80% | | | | 0.95% | | | | 0.80% | | | | 0.65% | |
Portfolio turnover3 | | | 38.11% | | | | 17.08% | | | | 11.48% | | | | 9.18% | | | | 5.73% | |
| 1 | Calculated using the average daily shares method. |
| 2 | Less than $0.01 per share. |
| 3 | The portfolio turnover rate is calculated on the Fund as a whole without distinguishing between classes of shares issued. |
See accompanying notes to financial statements.
| | | | |
| matthewsasia.com | 800.789.ASIA | | | 133 | |
Financial Highlights (continued)
Matthews Asia ESG Fund
The tables below set forth financial data for a share of beneficial interest outstanding throughout each period presented.
| | | | | | | | | | | | | | | | | | | | |
| | | Year Ended Dec. 31 | |
| INVESTOR CLASS | | 2020 | | | 2019 | | | 2018 | | | 2017 | | | 2016 | |
Net Asset Value, beginning of year | | | $11.08 | | | | $9.98 | | | | $11.56 | | | | $8.97 | | | | $9.23 | |
INCOME (LOSS) FROM INVESTMENT OPERATIONS: | | | | | | | | | | | | | | | | | | | | |
Net investment income (loss)1 | | | (0.01 | ) | | | 0.04 | | | | 0.03 | | | | 0.05 | | | | 0.07 | |
Net realized gain (loss) and unrealized appreciation/depreciation on investments, foreign currency related transactions and foreign capital gains taxes | | | 4.72 | | | | 1.21 | | | | (1.16 | ) | | | 2.97 | | | | (0.20 | ) |
Total from investment operations | | | 4.71 | | | | 1.25 | | | | (1.13 | ) | | | 3.02 | | | | (0.13 | ) |
LESS DISTRIBUTIONS FROM: | | | | | | | | | | | | | | | | | | | | |
Net investment income | | | (0.01 | ) | | | (0.03 | ) | | | (0.02 | ) | | | (0.27 | ) | | | (0.13 | ) |
Net realized gains on investments | | | (0.84 | ) | | | (0.12 | ) | | | (0.43 | ) | | | (0.16 | ) | | | — | |
Total distributions | | | (0.85 | ) | | | (0.15 | ) | | | (0.45 | ) | | | (0.43 | ) | | | (0.13 | ) |
Net Asset Value, end of year | | | $14.94 | | | | $11.08 | | | | $9.98 | | | | $11.56 | | | | $8.97 | |
TOTAL RETURN | | | 42.87% | | | | 12.55% | | | | (9.73% | ) | | | 33.79% | | | | (1.40% | ) |
| | | | | |
RATIOS/SUPPLEMENTAL DATA | | | | | | | | | | | | | | | | | | | | |
Net assets, end of year (in 000’s) | | | $37,385 | | | | $19,291 | | | | $9,283 | | | | $10,695 | | | | $5,376 | |
Ratio of expenses to average net assets before any reimbursement, waiver or recapture of expenses by Advisor and Administrator (Note 5) | | | 1.42% | | | | 1.54% | | | | 2.20% | | | | 2.65% | | | | 3.54% | |
Ratio of expenses to average net assets after any reimbursement, waiver or recapture of expenses by Advisor and Administrator | | | 1.38% | | | | 1.42% | | | | 1.50% | | | | 1.50% | | | | 1.48% | |
Ratio of net investment income (loss) to average net assets | | | (0.08% | ) | | | 0.41% | | | | 0.27% | | | | 0.45% | | | | 0.77% | |
Portfolio turnover2 | | | 84.60% | | | | 29.67% | | | | 22.93% | | | | 28.82% | | | | 16.10% | |
| |
| | | Year Ended Dec. 31 | |
| INSTITUTIONAL CLASS | | 2020 | | | 2019 | | | 2018 | | | 2017 | | | 2016 | |
Net Asset Value, beginning of year | | | $11.06 | | | | $9.96 | | | | $11.50 | | | | $8.92 | | | | $9.17 | |
INCOME (LOSS) FROM INVESTMENT OPERATIONS: | | | | | | | | | | | | | | | | | | | | |
Net investment income (loss)1 | | | 0.01 | | | | 0.06 | | | | 0.06 | | | | 0.08 | | | | 0.09 | |
Net realized gain (loss) and unrealized appreciation/depreciation on investments, foreign currency related transactions and foreign capital gains taxes | | | 4.72 | | | | 1.21 | | | | (1.16 | ) | | | 2.95 | | | | (0.19 | ) |
Total from investment operations | | | 4.73 | | | | 1.27 | | | | (1.10 | ) | | | 3.03 | | | | (0.10 | ) |
LESS DISTRIBUTIONS FROM: | | | | | | | | | | | | | | | | | | | | |
Net investment income | | | (0.03 | ) | | | (0.05 | ) | | | (0.01 | ) | | | (0.29 | ) | | | (0.15 | ) |
Net realized gains on investments | | | (0.84 | ) | | | (0.12 | ) | | | (0.43 | ) | | | (0.16 | ) | | | — | |
Total distributions | | | (0.87 | ) | | | (0.17 | ) | | | (0.44 | ) | | | (0.45 | ) | | | (0.15 | ) |
Net Asset Value, end of year | | | $14.92 | | | | $11.06 | | | | $9.96 | | | | $11.50 | | | | $8.92 | |
TOTAL RETURN | | | 43.13% | | | | 12.74% | | | | (9.52% | ) | | | 34.11% | | | | (1.16% | ) |
| | | | | |
RATIOS/SUPPLEMENTAL DATA | | | | | | | | | | | | | | | | | | | | |
Net assets, end of year (in 000’s) | | | $50,642 | | | | $36,008 | | | | $23,249 | | | | $7,359 | | | | $3,382 | |
Ratio of expenses to average net assets before any reimbursement, waiver or recapture of expenses by Advisor and Administrator (Note 5) | | | 1.29% | | | | 1.41% | | | | 2.01% | | | | 2.46% | | | | 3.36% | |
Ratio of expenses to average net assets after any reimbursement, waiver or recapture of expenses by Advisor and Administrator | | | 1.20% | | | | 1.24% | | | | 1.25% | | | | 1.25% | | | | 1.25% | |
Ratio of net investment income (loss) to average net assets | | | 0.09% | | | | 0.54% | | | | 0.55% | | | | 0.71% | | | | 0.97% | |
Portfolio turnover2 | | | 84.60% | | | | 29.67% | | | | 22.93% | | | | 28.82% | | | | 16.10% | |
| 1 | Calculated using the average daily shares method. |
| 2 | The portfolio turnover rate is calculated on the Fund as a whole without distinguishing between classes of shares issued. |
See accompanying notes to financial statements.
Financial Highlights (continued)
Matthews Emerging Asia Fund
The tables below set forth financial data for a share of beneficial interest outstanding throughout each period presented.
| | | | | | | | | | | | | | | | | | | | |
| | | Year Ended Dec. 31 | |
| INVESTOR CLASS | | 2020 | | | 2019 | | | 2018 | | | 2017 | | | 2016 | |
Net Asset Value, beginning of year | | | $12.07 | | | | $12.50 | | | | $15.51 | | | | $13.18 | | | | $11.27 | |
INCOME (LOSS) FROM INVESTMENT OPERATIONS: | | | | | | | | | | | | | | | | | | | | |
Net investment income (loss)1 | | | 0.12 | | | | 0.14 | | | | 0.10 | | | | 0.07 | | | | 0.15 | |
Net realized gain (loss) and unrealized appreciation/depreciation on investments, foreign currency related transactions and foreign capital gains taxes | | | (0.38 | ) | | | (0.27 | ) | | | (2.82 | ) | | | 2.35 | | | | 2.01 | |
Total from investment operations | | | (0.26 | ) | | | (0.13 | ) | | | (2.72 | ) | | | 2.42 | | | | 2.16 | |
LESS DISTRIBUTIONS FROM: | | | | | | | | | | | | | | | | | | | | |
Net investment income | | | (0.19 | ) | | | — | | | | (0.10 | ) | | | (0.04 | ) | | | (0.13 | ) |
Net realized gains on investments | | | — | | | | (0.30 | ) | | | (0.19 | ) | | | (0.05 | ) | | | (0.13 | ) |
Total distributions | | | (0.19 | ) | | | (0.30 | ) | | | (0.29 | ) | | | (0.09 | ) | | | (0.26 | ) |
Paid-in capital from redemption fees (Note 4) | | | — | | | | — | 2 | | | — | 3 | | | — | 3 | | | 0.01 | |
Net Asset Value, end of year | | | $11.62 | | | | $12.07 | | | | $12.50 | | | | $15.51 | | | | $13.18 | |
TOTAL RETURN | | | (2.16% | ) | | | (1.01% | ) | | | (17.58% | ) | | | 18.42% | | | | 19.25% | |
| | | | | |
RATIOS/SUPPLEMENTAL DATA | | | | | | | | | | | | | | | | | | | | |
Net assets, end of year (in 000’s) | | | $54,789 | | | | $84,543 | | | | $118,505 | | | | $219,596 | | | | $145,164 | |
Ratio of expenses to average net assets before any reimbursement, waiver or recapture of expenses by Advisor and Administrator (Note 5) | | | 1.75% | | | | 1.65% | | | | 1.66% | | | | 1.70% | | | | 1.77% | |
Ratio of expenses to average net assets after any reimbursement, waiver or recapture of expenses by Advisor and Administrator | | | 1.40% | | | | 1.46% | | | | 1.48% | | | | 1.48% | | | | 1.47% | |
Ratio of net investment income (loss) to average net assets | | | 1.24% | | | | 1.15% | | | | 0.72% | | | | 0.49% | | | | 1.26% | |
Portfolio turnover4 | | | 29.80% | | | | 18.77% | | | | 26.09% | | | | 7.74% | | | | 34.90% | |
| |
| | | Year Ended Dec. 31 | |
| INSTITUTIONAL CLASS | | 2020 | | | 2019 | | | 2018 | | | 2017 | | | 2016 | |
Net Asset Value, beginning of year | | | $12.13 | | | | $12.54 | | | | $15.57 | | | | $13.22 | | | | $11.29 | |
INCOME (LOSS) FROM INVESTMENT OPERATIONS: | | | | | | | | | | | | | | | | | | | | |
Net investment income (loss)1 | | | 0.15 | | | | 0.17 | | | | 0.14 | | | | 0.10 | | | | 0.21 | |
Net realized gain (loss) and unrealized appreciation/depreciation on investments, foreign currency related transactions and foreign capital gains taxes | | | (0.39 | ) | | | (0.28 | ) | | | (2.85 | ) | | | 2.37 | | | | 1.99 | |
Total from investment operations | | | (0.24 | ) | | | (0.11 | ) | | | (2.71 | ) | | | 2.47 | | | | 2.20 | |
LESS DISTRIBUTIONS FROM: | | | | | | | | | | | | | | | | | | | | |
Net investment income | | | (0.21 | ) | | | — | | | | (0.13 | ) | | | (0.07 | ) | | | (0.15 | ) |
Net realized gains on investments | | | — | | | | (0.30 | ) | | | (0.19 | ) | | | (0.05 | ) | | | (0.13 | ) |
Total distributions | | | (0.21 | ) | | | (0.30 | ) | | | (0.32 | ) | | | (0.12 | ) | | | (0.28 | ) |
Paid-in capital from redemption fees (Note 4) | | | — | | | | — | 2 | | | — | 3 | | | — | 3 | | | 0.01 | |
Net Asset Value, end of year | | | $11.68 | | | | $12.13 | | | | $12.54 | | | | $15.57 | | | | $13.22 | |
TOTAL RETURN | | | (1.94% | ) | | | (0.85% | ) | | | (17.41% | ) | | | 18.70% | | | | 19.61% | |
| | | | | |
RATIOS/SUPPLEMENTAL DATA | | | | | | | | | | | | | | | | | | | | |
Net assets, end of year (in 000’s) | | | $141,964 | | | | $235,639 | | | | $256,669 | | | | $275,233 | | | | $95,724 | |
Ratio of expenses to average net assets before any reimbursement, waiver or recapture of expenses by Advisor and Administrator (Note 5) | | | 1.62% | | | | 1.51% | | | | 1.50% | | | | 1.52% | | | | 1.62% | |
Ratio of expenses to average net assets after any reimbursement, waiver or recapture of expenses by Advisor and Administrator | | | 1.19% | | | | 1.25% | | | | 1.25% | | | | 1.25% | | | | 1.25% | |
Ratio of net investment income (loss) to average net assets | | | 1.45% | | | | 1.39% | | | | 0.97% | | | | 0.70% | | | | 1.72% | |
Portfolio turnover4 | | | 29.80% | | | | 18.77% | | | | 26.09% | | | | 7.74% | | | | 34.90% | |
| 1 | Calculated using the average daily shares method. |
| 2 | The Fund charged redemption fees through October 31, 2019. |
| 3 | Less than $0.01 per share. |
| 4 | The portfolio turnover rate is calculated on the Fund as a whole without distinguishing between classes of shares issued. |
See accompanying notes to financial statements.
| | | | |
| matthewsasia.com | 800.789.ASIA | | | 135 | |
Financial Highlights (continued)
Matthews Asia Innovators Fund
The tables below set forth financial data for a share of beneficial interest outstanding throughout each period presented.
| | | | | | | | | | | | | | | | | | | | |
| | | Year Ended Dec. 31 | |
| INVESTOR CLASS | | 2020 | | | 2019 | | | 2018 | | | 2017 | | | 2016 | |
Net Asset Value, beginning of year | | | $14.55 | | | | $11.26 | | | | $14.19 | | | | $10.10 | | | | $12.32 | |
INCOME (LOSS) FROM INVESTMENT OPERATIONS: | | | | | | | | | | | | | | | | | | | | |
Net investment income (loss)1 | | | (0.11 | ) | | | (0.01 | ) | | | (0.01 | ) | | | (0.02 | ) | | | (0.02 | ) |
Net realized gain (loss) and unrealized appreciation/depreciation on investments, foreign currency related transactions and foreign capital gains taxes | | | 12.71 | | | | 3.34 | | | | (2.62 | ) | | | 5.31 | | | | (1.07 | ) |
Total from investment operations | | | 12.60 | | | | 3.33 | | | | (2.63 | ) | | | 5.29 | | | | (1.09 | ) |
LESS DISTRIBUTIONS FROM: | | | | | | | | | | | | | | | | | | | | |
Net investment income | | | — | | | | — | | | | (0.04 | ) | | | (0.24 | ) | | | — | |
Net realized gains on investments | | | (0.45 | ) | | | (0.04 | ) | | | (0.26 | ) | | | (0.96 | ) | | | (1.13 | ) |
Total distributions | | | (0.45 | ) | | | (0.04 | ) | | | (0.30 | ) | | | (1.20 | ) | | | (1.13 | ) |
Net Asset Value, end of year | | | $26.70 | | | | $14.55 | | | | $11.26 | | | | $14.19 | | | | $10.10 | |
TOTAL RETURN | | | 86.72% | | | | 29.60% | | | | (18.62% | ) | | | 52.88% | | | | (9.10% | ) |
| | | | | |
RATIOS/SUPPLEMENTAL DATA | | | | | | | | | | | | | | | | | | | | |
Net assets, end of year (in 000’s) | | | $631,101 | | | | $177,639 | | | | $152,449 | | | | $175,331 | | | | $83,926 | |
Ratio of expenses to average net assets | | | 1.10% | | | | 1.19% | | | | 1.19% | | | | 1.24% | | | | 1.24% | |
Ratio of net investment income (loss) to average net assets | | | (0.60% | ) | | | (0.04% | ) | | | (0.07% | ) | | | (0.18% | ) | | | (0.19% | ) |
Portfolio turnover2 | | | 119.81% | | | | 80.10% | | | | 85.73% | | | | 66.51% | | | | 92.25% | |
| |
| | | Year Ended Dec. 31 | |
| INSTITUTIONAL CLASS | | 2020 | | | 2019 | | | 2018 | | | 2017 | | | 2016 | |
Net Asset Value, beginning of year | | | $14.64 | | | | $11.32 | | | | $14.26 | | | | $10.14 | | | | $12.34 | |
INCOME (LOSS) FROM INVESTMENT OPERATIONS: | | | | | | | | | | | | | | | | | | | | |
Net investment income (loss)1 | | | (0.09 | ) | | | 0.01 | | | | 0.01 | | | | 0.01 | | | | 0.01 | |
Net realized gain (loss) and unrealized appreciation/depreciation on investments, foreign currency related transactions and foreign capital gains taxes | | | 12.81 | | | | 3.35 | | | | (2.62 | ) | | | 5.33 | | | | (1.08 | ) |
Total from investment operations | | | 12.72 | | | | 3.36 | | | | (2.61 | ) | | | 5.34 | | | | (1.07 | ) |
LESS DISTRIBUTIONS FROM: | | | | | | | | | | | | | | | | | | | | |
Net investment income | | | — | | | | — | | | | (0.07 | ) | | | (0.26 | ) | | | — | |
Net realized gains on investments | | | (0.45 | ) | | | (0.04 | ) | | | (0.26 | ) | | | (0.96 | ) | | | (1.13 | ) |
Total distributions | | | (0.45 | ) | | | (0.04 | ) | | | (0.33 | ) | | | (1.22 | ) | | | (1.13 | ) |
Net Asset Value, end of year | | | $26.91 | | | | $14.64 | | | | $11.32 | | | | $14.26 | | | | $10.14 | |
TOTAL RETURN | | | 87.01% | | | | 29.71% | | | | (18.40% | ) | | | 53.18% | | | | (8.92% | ) |
| | | | | |
RATIOS/SUPPLEMENTAL DATA | | | | | | | | | | | | | | | | | | | | |
Net assets, end of year (in 000’s) | | | $1,094,356 | | | | $126,911 | | | | $91,769 | | | | $30,957 | | | | $16,545 | |
Ratio of expenses to average net assets | | | 0.95% | | | | 1.05% | | | | 1.02% | | | | 1.05% | | | | 1.01% | |
Ratio of net investment income (loss) to average net assets | | | (0.44% | ) | | | 0.10% | | | | 0.07% | | | | 0.06% | | | | 0.06% | |
Portfolio turnover2 | | | 119.81% | | | | 80.10% | | | | 85.73% | | | | 66.51% | | | | 92.25% | |
| 1 | Calculated using the average daily shares method. |
| 2 | The portfolio turnover rate is calculated on the Fund as a whole without distinguishing between classes of shares issued. |
See accompanying notes to financial statements.
Financial Highlights (continued)
Matthews China Fund
The tables below set forth financial data for a share of beneficial interest outstanding throughout each period presented.
| | | | | | | | | | | | | | | | | | | | |
| | | Year Ended Dec. 31 | |
| INVESTOR CLASS | | 2020 | | | 2019 | | | 2018 | | | 2017 | | | 20161 | |
Net Asset Value, beginning of year | | | $19.12 | | | | $14.37 | | | | $22.20 | | | | $15.47 | | | | $18.42 | |
INCOME (LOSS) FROM INVESTMENT OPERATIONS: | | | | | | | | | | | | | | | | | | | | |
Net investment income (loss)2 | | | 0.05 | | | | 0.16 | | | | 0.21 | | | | 0.16 | | | | 0.21 | |
Net realized gain (loss) and unrealized appreciation/depreciation on investments and foreign currency related transactions | | | 8.17 | | | | 4.80 | | | | (4.84 | ) | | | 8.86 | | | | (1.04 | ) |
Total from investment operations | | | 8.22 | | | | 4.96 | | | | (4.63 | ) | | | 9.02 | | | | (0.83 | ) |
LESS DISTRIBUTIONS FROM: | | | | | | | | | | | | | | | | | | | | |
Net investment income | | | (0.06 | ) | | | (0.21 | ) | | | (0.29 | ) | | | (0.37 | ) | | | (0.26 | ) |
Net realized gains on investments | | | (0.28 | ) | | | — | | | | (2.91 | ) | | | (1.92 | ) | | | (1.29 | ) |
Return of capital | | | — | | | | — | | | | — | | | | — | | | | (0.57 | ) |
Total distributions | | | (0.34 | ) | | | (0.21 | ) | | | (3.20 | ) | | | (2.29 | ) | | | (2.12 | ) |
Paid-in capital from redemption fees (Note 4) | | | — | | | | — | | | | — | | | | — | | | | — | 3 |
Net Asset Value, end of year | | | $27.00 | | | | $19.12 | | | | $14.37 | | | | $22.20 | | | | $15.47 | |
TOTAL RETURN | | | 43.05% | | | | 34.56% | | | | (21.42% | ) | | | 59.37% | | | | (5.18% | ) |
| | | | | |
RATIOS/SUPPLEMENTAL DATA | | | | | | | | | | | | | | | | | | | | |
Net assets, end of year (in 000’s) | | | $962,714 | | | | $718,633 | | | | $566,456 | | | | $843,508 | | | | $495,900 | |
Ratio of expenses to average net assets | | | 1.09% | | | | 1.09% | | | | 1.10% | | | | 1.09% | | | | 1.18% | |
Ratio of net investment income (loss) to average net assets | | | 0.22% | | | | 0.96% | | | | 1.00% | | | | 0.78% | | | | 1.24% | |
Portfolio turnover4 | | | 52.64% | | | | 68.93% | | | | 96.98% | | | | 78.74% | | | | 83.82% | |
| |
| | | Year Ended Dec. 31 | |
| INSTITUTIONAL CLASS | | 2020 | | | 2019 | | | 2018 | | | 2017 | | | 20161 | |
Net Asset Value, beginning of year | | | $19.08 | | | | $14.33 | | | | $22.17 | | | | $15.44 | | | | $18.39 | |
INCOME (LOSS) FROM INVESTMENT OPERATIONS: | | | | | | | | | | | | | | | | | | | | |
Net investment income (loss)2 | | | 0.09 | | | | 0.20 | | | | 0.33 | | | | 0.21 | | | | 0.22 | |
Net realized gain (loss) and unrealized appreciation/depreciation on investments and foreign currency related transactions | | | 8.15 | | | | 4.80 | | | | (4.93 | ) | | | 8.84 | | | | (1.03 | ) |
Total from investment operations | | | 8.24 | | | | 5.00 | | | | (4.60 | ) | | | 9.05 | | | | (0.81 | ) |
LESS DISTRIBUTIONS FROM: | | | | | | | | | | | | | | | | | | | | |
Net investment income | | | (0.10 | ) | | | (0.25 | ) | | | (0.33 | ) | | | (0.40 | ) | | | (0.28 | ) |
Net realized gains on investments | | | (0.28 | ) | | | — | | | | (2.91 | ) | | | (1.92 | ) | | | (1.29 | ) |
Return of capital | | | — | | | | — | | | | — | | | | — | | | | (0.57 | ) |
Total distributions | | | (0.38 | ) | | | (0.25 | ) | | | (3.24 | ) | | | (2.32 | ) | | | (2.14 | ) |
Paid-in capital from redemption fees (Note 4) | | | — | | | | — | | | | — | | | | — | | | | — | 3 |
Net Asset Value, end of year | | | $26.94 | | | | $19.08 | | | | $14.33 | | | | $22.17 | | | | $15.44 | |
TOTAL RETURN | | | 43.23% | | | | 34.90% | | | | (21.32% | ) | | | 59.71% | | | | (5.06% | ) |
| | | | | |
RATIOS/SUPPLEMENTAL DATA | | | | | | | | | | | | | | | | | | | | |
Net assets, end of year (in 000’s) | | | $546,157 | | | | $183,762 | | | | $46,657 | | | | $61,975 | | | | $15,874 | |
Ratio of expenses to average net assets | | | 0.93% | | | | 0.91% | | | | 0.91% | | | | 0.93% | | | | 1.03% | |
Ratio of net investment income (loss) to average net assets | | | 0.40% | | | | 1.17% | | | | 1.53% | | | | 0.99% | | | | 1.32% | |
Portfolio turnover4 | | | 52.64% | | | | 68.93% | | | | 96.98% | | | | 78.74% | | | | 83.82% | |
| 1 | Consolidated Financial Highlights. See Note 2-C. |
| 2 | Calculated using the average daily shares method. |
| 3 | Less than $0.01 per share. |
| 4 | The portfolio turnover rate is calculated on the Fund as a whole without distinguishing between classes of shares issued. |
See accompanying notes to financial statements.
| | | | |
| matthewsasia.com | 800.789.ASIA | | | 137 | |
Financial Highlights (continued)
Matthews India Fund
The tables below set forth financial data for a share of beneficial interest outstanding throughout each period presented.
| | | | | | | | | | | | | | | | | | | | |
| | | Year Ended Dec. 31 | |
| INVESTOR CLASS | | 2020 | | | 2019 | | | 2018 | | | 2017 | | | 2016 | |
Net Asset Value, beginning of year | | | $23.27 | | | | $26.32 | | | | $34.31 | | | | $25.65 | | | | $26.43 | |
INCOME (LOSS) FROM INVESTMENT OPERATIONS: | | | | | | | | | | | | | | | | | | | | |
Net investment income (loss)1 | | | 0.01 | | | | (0.01 | ) | | | (0.05 | ) | | | (0.09 | ) | | | 0.01 | |
Net realized gain (loss) and unrealized appreciation/depreciation on investments, foreign currency related transactions and foreign capital gains taxes | | | 3.81 | | | | (0.24 | ) | | | (3.60 | ) | | | 9.24 | | | | (0.33 | ) |
Total from investment operations | | | 3.82 | | | | (0.25 | ) | | | (3.65 | ) | | | 9.15 | | | | (0.32 | ) |
LESS DISTRIBUTIONS FROM: | | | | | | | | | | | | | | | | | | | | |
Net realized gains on investments | | | (0.80 | ) | | | (2.80 | ) | | | (4.34 | ) | | | (0.49 | ) | | | (0.46 | ) |
Net Asset Value, end of year | | | $26.29 | | | | $23.27 | | | | $26.32 | | | | $34.31 | | | | $25.65 | |
TOTAL RETURN | | | 16.51% | | | | (0.88% | ) | | | (10.09% | ) | | | 35.79% | | | | (1.23% | ) |
| | | | | |
RATIOS/SUPPLEMENTAL DATA | | | | | | | | | | | | | | | | | | | | |
Net assets, end of year (in 000’s) | | | $617,908 | | | | $786,881 | | | | $1,077,990 | | | | $1,484,045 | | | | $967,009 | |
Ratio of expenses to average net assets | | | 1.15% | | | | 1.11% | | | | 1.09% | | | | 1.09% | | | | 1.12% | |
Ratio of net investment income (loss) to average net assets | | | 0.05% | | | | (0.03% | ) | | | (0.16% | ) | | | (0.30% | ) | | | 0.02% | |
Portfolio turnover2 | | | 57.38% | | | | 24.00% | | | | 20.87% | | | | 16.81% | | | | 15.76% | |
| |
| | | Year Ended Dec. 31 | |
| INSTITUTIONAL CLASS | | 2020 | | | 2019 | | | 2018 | | | 2017 | | | 2016 | |
Net Asset Value, beginning of year | | | $23.55 | | | | $26.56 | | | | $34.51 | | | | $25.77 | | | | $26.49 | |
INCOME (LOSS) FROM INVESTMENT OPERATIONS: | | | | | | | | | | | | | | | | | | | | |
Net investment income (loss)1 | | | 0.05 | | | | 0.02 | | | | 0.01 | | | | (0.03 | ) | | | 0.04 | |
Net realized gain (loss) and unrealized appreciation/depreciation on investments, foreign currency related transactions and foreign capital gains taxes | | | 3.85 | | | | (0.23 | ) | | | (3.62 | ) | | | 9.29 | | | | (0.30 | ) |
Total from investment operations | | | 3.90 | | | | (0.21 | ) | | | (3.61 | ) | | | 9.26 | | | | (0.26 | ) |
LESS DISTRIBUTIONS FROM: | | | | | | | | | | | | | | | | | | | | |
Net investment income | | | — | | | | — | | | | — | | | | (0.03 | ) | | | — | |
Net realized gains on investments | | | (0.80 | ) | | | (2.80 | ) | | | (4.34 | ) | | | (0.49 | ) | | | (0.46 | ) |
Total distributions | | | (0.80 | ) | | | (2.80 | ) | | | (4.34 | ) | | | (0.52 | ) | | | (0.46 | ) |
Net Asset Value, end of year | | | $26.65 | | | | $23.55 | | | | $26.56 | | | | $34.51 | | | | $25.77 | |
TOTAL RETURN | | | 16.65% | | | | (0.76% | ) | | | (9.92% | ) | | | 36.05% | | | | (1.00% | ) |
| | | | | |
RATIOS/SUPPLEMENTAL DATA | | | | | | | | | | | | | | | | | | | | |
Net assets, end of year (in 000’s) | | | $90,053 | | | | $177,526 | | | | $463,790 | | | | $788,388 | | | | $551,202 | |
Ratio of expenses to average net assets | | | 1.03% | | | | 0.94% | | | | 0.90% | | | | 0.89% | | | | 0.91% | |
Ratio of net investment income (loss) to average net assets | | | 0.24% | | | | 0.09% | | | | 0.02% | | | | (0.08% | ) | | | 0.16% | |
Portfolio turnover2 | | | 57.38% | | | | 24.00% | | | | 20.87% | | | | 16.81% | | | | 15.76% | |
| 1 | Calculated using the average daily shares method. |
| 2 | The portfolio turnover rate is calculated on the Fund as a whole without distinguishing between classes of shares issued. |
See accompanying notes to financial statements.
Financial Highlights (continued)
Matthews Japan Fund
The tables below set forth financial data for a share of beneficial interest outstanding throughout each period presented.
| | | | | | | | | | | | | | | | | | | | |
| | | Year Ended Dec. 31 | |
| INVESTOR CLASS | | 2020 | | | 2019 | | | 2018 | | | 2017 | | | 2016 | |
Net Asset Value, beginning of year | | | $21.51 | | | | $18.53 | | | | $24.12 | | | | $18.83 | | | | $18.97 | |
INCOME (LOSS) FROM INVESTMENT OPERATIONS: | | | | | | | | | | | | | | | | | | | | |
Net investment income (loss)1 | | | 0.07 | | | | 0.11 | | | | 0.09 | | | | 0.09 | | | | 0.08 | |
Net realized gain (loss) and unrealized appreciation/depreciation on investments and foreign currency related transactions | | | 6.25 | | | | 4.73 | | | | (4.91 | ) | | | 6.13 | | | | (0.01 | ) |
Total from investment operations | | | 6.32 | | | | 4.84 | | | | (4.82 | ) | | | 6.22 | | | | 0.07 | |
LESS DISTRIBUTIONS FROM: | | | | | | | | | | | | | | | | | | | | |
Net investment income | | | (0.13 | ) | | | (0.12 | ) | | | (0.06 | ) | | | (0.20 | ) | | | (0.16 | ) |
Net realized gains on investments | | | (2.43 | ) | | | (1.74 | ) | | | (0.71 | ) | | | (0.73 | ) | | | (0.05 | ) |
Total distributions | | | (2.56 | ) | | | (1.86 | ) | | | (0.77 | ) | | | (0.93 | ) | | | (0.21 | ) |
Net Asset Value, end of year | | | $25.27 | | | | $21.51 | | | | $18.53 | | | | $24.12 | | | | $18.83 | |
TOTAL RETURN | | | 29.82% | | | | 26.08% | | | | (20.18% | ) | | | 33.14% | | | | 0.40% | |
| | | | | |
RATIOS/SUPPLEMENTAL DATA | | | | | | | | | | | | | | | | | | | | |
Net assets, end of year (in 000’s) | | | $1,101,820 | | | | $1,466,194 | | | | $1,704,102 | | | | $2,155,280 | | | | $1,685,872 | |
Ratio of expenses to average net assets before any reimbursement, waiver or recapture of expenses by Advisor and Administrator (Note 5) | | | 0.95% | | | | 0.93% | | | | 0.91% | | | | 0.95% | | | | 0.98% | |
Ratio of expenses to average net assets after any reimbursement, waiver or recapture of expenses by Advisor and Administrator | | | 0.95% | | | | 0.93% | | | | 0.91% | | | | 0.94% | | | | 0.98% | |
Ratio of net investment income (loss) to average net assets | | | 0.31% | | | | 0.51% | | | | 0.40% | | | | 0.40% | | | | 0.43% | |
Portfolio turnover2 | | | 62.03% | | | | 25.42% | | | | 46.11% | | | | 44.34% | | | | 55.15% | |
| |
| | | Year Ended Dec. 31 | |
| INSTITUTIONAL CLASS | | 2020 | | | 2019 | | | 2018 | | | 2017 | | | 2016 | |
Net Asset Value, beginning of year | | | $21.55 | | | | $18.57 | | | | $24.16 | | | | $18.86 | | | | $19.00 | |
INCOME (LOSS) FROM INVESTMENT OPERATIONS: | | | | | | | | | | | | | | | | | | | | |
Net investment income (loss)1 | | | 0.05 | | | | 0.11 | | | | 0.11 | | | | 0.10 | | | | 0.10 | |
Net realized gain (loss) and unrealized appreciation/depreciation on investments and foreign currency related transactions | | | 6.29 | | | | 4.74 | | | | (4.91 | ) | | | 6.14 | | | | — | 3 |
Total from investment operations | | | 6.34 | | | | 4.85 | | | | (4.80 | ) | | | 6.24 | | | | 0.10 | |
LESS DISTRIBUTIONS FROM: | | | | | | | | | | | | | | | | | | | | |
Net investment income | | | (0.14 | ) | | | (0.13 | ) | | | (0.08 | ) | | | (0.21 | ) | | | (0.19 | ) |
Net realized gains on investments | | | (2.43 | ) | | | (1.74 | ) | | | (0.71 | ) | | | (0.73 | ) | | | (0.05 | ) |
Total distributions | | | (2.57 | ) | | | (1.87 | ) | | | (0.79 | ) | | | (0.94 | ) | | | (0.24 | ) |
Net Asset Value, end of year | | | $25.32 | | | | $21.55 | | | | $18.57 | | | | $24.16 | | | | $18.86 | |
TOTAL RETURN | | | 29.85% | | | | 26.10% | | | | (20.08% | ) | | | 33.23% | | | | 0.51% | |
| | | | | |
RATIOS/SUPPLEMENTAL DATA | | | | | | | | | | | | | | | | | | | | |
Net assets, end of year (in 000’s) | | | $548,968 | | | | $840,476 | | | | $1,167,472 | | | | $1,957,214 | | | | $1,302,317 | |
Ratio of expenses to average net assets before any reimbursement, waiver or recapture of expenses by Advisor and Administrator (Note 5) | | | 0.91% | | | | 0.88% | | | | 0.85% | | | | 0.87% | | | | 0.88% | |
Ratio of expenses to average net assets after any reimbursement, waiver or recapture of expenses by Advisor and Administrator | | | 0.91% | | | | 0.88% | | | | 0.84% | | | | 0.86% | | | | 0.88% | |
Ratio of net investment income (loss) to average net assets | | | 0.25% | | | | 0.53% | | | | 0.46% | | | | 0.46% | | | | 0.54% | |
Portfolio turnover2 | | | 62.03% | | | | 25.42% | | | | 46.11% | | | | 44.34% | | | | 55.15% | |
| 1 | Calculated using the average daily shares method. |
| 2 | The portfolio turnover rate is calculated on the Fund as a whole without distinguishing between classes of shares issued. |
| 3 | Less than $0.01 per share. |
See accompanying notes to financial statements.
| | | | |
| matthewsasia.com | 800.789.ASIA | | | 139 | |
Financial Highlights (continued)
Matthews Korea Fund
The tables below set forth financial data for a share of beneficial interest outstanding throughout each period presented.
| | | | | | | | | | | | | | | | | | | | |
| | | Year Ended Dec. 31 | |
| INVESTOR CLASS | | 2020 | | | 2019 | | | 2018 | | | 2017 | | | 2016 | |
Net Asset Value, beginning of year | | | $4.38 | | | | $4.58 | | | | $6.91 | | | | $5.25 | | | | $6.15 | |
INCOME (LOSS) FROM INVESTMENT OPERATIONS: | | | | | | | | | | | | | | | | | | | | |
Net investment income (loss)1 | | | 0.02 | | | | 0.01 | | | | 0.06 | | | | 0.06 | | | | 0.02 | |
Net realized gain (loss) and unrealized appreciation/depreciation on investments and foreign currency related transactions | | | 1.76 | | | | 0.16 | | | | (1.61 | ) | | | 2.22 | | | | (0.41 | ) |
Total from investment operations | | | 1.78 | | | | 0.17 | | | | (1.55 | ) | | | 2.28 | | | | (0.39 | ) |
LESS DISTRIBUTIONS FROM: | | | | | | | | | | | | | | | | | | | | |
Net investment income | | | (0.04 | ) | | | — | | | | (0.13 | ) | | | (0.29 | ) | | | (0.08 | ) |
Net realized gains on investments | | | — | | | | (0.37 | ) | | | (0.65 | ) | | | (0.33 | ) | | | (0.43 | ) |
Total distributions | | | (0.04 | ) | | | (0.37 | ) | | | (0.78 | ) | | | (0.62 | ) | | | (0.51 | ) |
Net Asset Value, end of year | | | $6.12 | | | | $4.38 | | | | $4.58 | | | | $6.91 | | | | $5.25 | |
TOTAL RETURN | | | 40.77% | | | | 3.80% | | | | (22.21% | ) | | | 43.70% | | | | (6.32% | ) |
| | | | | |
RATIOS/SUPPLEMENTAL DATA | | | | | | | | | | | | | | | | | | | | |
Net assets, end of year (in 000’s) | | | $141,931 | | | | $113,388 | | | | $127,080 | | | | $192,431 | | | | $142,726 | |
Ratio of expenses to average net assets | | | 1.19% | | | | 1.15% | | | | 1.14% | | | | 1.15% | | | | 1.15% | |
Ratio of net investment income (loss) to average net assets | | | 0.50% | | | | 0.28% | | | | 1.01% | | | | 0.90% | | | | 0.41% | |
Portfolio turnover2 | | | 39.62% | | | | 36.63% | | | | 35.60% | | | | 25.37% | | | | 34.73% | |
| |
| | | Year Ended Dec. 31 | |
| INSTITUTIONAL CLASS | | 2020 | | | 2019 | | | 2018 | | | 2017 | | | 2016 | |
Net Asset Value, beginning of year | | | $4.42 | | | | $4.61 | | | | $6.95 | | | | $5.27 | | | | $6.18 | |
INCOME (LOSS) FROM INVESTMENT OPERATIONS: | | | | | | | | | | | | | | | | | | | | |
Net investment income (loss)1 | | | 0.01 | | | | 0.01 | | | | 0.04 | | | | 0.10 | | | | (0.02 | ) |
Net realized gain (loss) and unrealized appreciation/depreciation on investments and foreign currency related transactions | | | 1.79 | | | | 0.17 | | | | (1.60 | ) | | | 2.21 | | | | (0.37 | ) |
Total from investment operations | | | 1.80 | | | | 0.18 | | | | (1.56 | ) | | | 2.31 | | | | (0.39 | ) |
LESS DISTRIBUTIONS FROM: | | | | | | | | | | | | | | | | | | | | |
Net investment income | | | (0.05 | ) | | | — | | | | (0.13 | ) | | | (0.30 | ) | | | (0.09 | ) |
Net realized gains on investments | | | — | | | | (0.37 | ) | | | (0.65 | ) | | | (0.33 | ) | | | (0.43 | ) |
Total distributions | | | (0.05 | ) | | | (0.37 | ) | | | (0.78 | ) | | | (0.63 | ) | | | (0.52 | ) |
Net Asset Value, end of year | | | $6.17 | | | | $4.42 | | | | $4.61 | | | | $6.95 | | | | $5.27 | |
TOTAL RETURN | | | 40.76% | | | | 4.01% | | | | (22.15% | ) | | | 44.11% | | | | (6.31% | ) |
| | | | | |
RATIOS/SUPPLEMENTAL DATA | | | | | | | | | | | | | | | | | | | | |
Net assets, end of year (in 000’s) | | | $12,192 | | | | $23,426 | | | | $19,377 | | | | $32,587 | | | | $7,462 | |
Ratio of expenses to average net assets | | | 1.05% | | | | 1.05% | | | | 1.02% | | | | 1.01% | | | | 0.97% | |
Ratio of net investment income (loss) to average net assets | | | 0.28% | | | | 0.29% | | | | 0.67% | | | | 1.51% | | | | (0.31% | ) |
Portfolio turnover2 | | | 39.62% | | | | 36.63% | | | | 35.60% | | | | 25.37% | | | | 34.73% | |
| 1 | Calculated using the average daily shares method. |
| 2 | The portfolio turnover rate is calculated on the Fund as a whole without distinguishing between classes of shares issued. |
See accompanying notes to financial statements.
Financial Highlights (continued)
Matthews Asia Small Companies Fund
The tables below set forth financial data for a share of beneficial interest outstanding throughout each period presented.
| | | | | | | | | | | | | | | | | | | | |
| | | Year Ended Dec. 31 | |
| INVESTOR CLASS | | 2020 | | | 2019 | | | 2018 | | | 2017 | | | 2016 | |
Net Asset Value, beginning of year | | | $18.10 | | | | $15.50 | | | | $22.89 | | | | $19.05 | | | | $19.41 | |
INCOME (LOSS) FROM INVESTMENT OPERATIONS: | | | | | | | | | | | | | | | | | | | | |
Net investment income (loss)1 | | | (0.02 | ) | | | 0.12 | | | | 0.12 | | | | 0.02 | | | | 0.09 | |
Net realized gain (loss) and unrealized appreciation/depreciation on investments, foreign currency related transactions and foreign capital gains taxes | | | 7.92 | | | | 2.57 | | | | (4.20 | ) | | | 5.68 | | | | (0.37 | ) |
Total from investment operations | | | 7.90 | | | | 2.69 | | | | (4.08 | ) | | | 5.70 | | | | (0.28 | ) |
LESS DISTRIBUTIONS FROM: | | | | | | | | | | | | | | | | | | | | |
Net investment income | | | (0.05 | ) | | | (0.09 | ) | | | (0.08 | ) | | | (0.10 | ) | | | (0.08 | ) |
Net realized gains on investments | | | (0.02 | ) | | | — | | | | (3.23 | ) | | | (1.76 | ) | | | — | |
Total distributions | | | (0.07 | ) | | | (0.09 | ) | | | (3.31 | ) | | | (1.86 | ) | | | (0.08 | ) |
Paid-in capital from redemption fees (Note 4) | | | — | | | | — | 2 | | | — | 3 | | | — | 3 | | | — | 3 |
Net Asset Value, end of year | | | $25.93 | | | | $18.10 | | | | $15.50 | | | | $22.89 | | | | $19.05 | |
TOTAL RETURN | | | 43.68% | | | | 17.38% | | | | (18.05% | ) | | | 30.59% | | | | (1.44% | ) |
| | | | | |
RATIOS/SUPPLEMENTAL DATA | | | | | | | | | | | | | | | | | | | | |
Net assets, end of year (in 000’s) | | | $99,573 | | | | $96,229 | | | | $111,456 | | | | $208,339 | | | | $254,226 | |
Ratio of expenses to average net assets before any reimbursement, waiver or recapture of expenses by Advisor and Administrator (Note 5) | | | 1.57% | | | | 1.60% | | | | 1.51% | | | | 1.49% | | | | 1.49% | |
Ratio of expenses to average net assets after any reimbursement, waiver or recapture of expenses by Advisor and Administrator | | | 1.39% | | | | 1.45% | | | | 1.46% | | | | 1.46% | | | | 1.47% | |
Ratio of net investment income (loss) to average net assets | | | (0.11% | ) | | | 0.72% | | | | 0.53% | | | | 0.09% | | | | 0.45% | |
Portfolio turnover4 | | | 111.87% | | | | 59.10% | | | | 69.79% | | | | 67.13% | | | | 44.44% | |
| |
| | | Year Ended Dec. 31 | |
| INSTITUTIONAL CLASS | | 2020 | | | 2019 | | | 2018 | | | 2017 | | | 2016 | |
Net Asset Value, beginning of year | | | $18.06 | | | | $15.46 | | | | $22.86 | | | | $19.03 | | | | $19.40 | |
INCOME (LOSS) FROM INVESTMENT OPERATIONS: | | | | | | | | | | | | | | | | | | | | |
Net investment income (loss)1 | | | 0.01 | | | | 0.15 | | | | 0.16 | | | | 0.07 | | | | 0.12 | |
Net realized gain (loss) and unrealized appreciation/depreciation on investments, foreign currency related transactions and foreign capital gains taxes | | | 7.91 | | | | 2.58 | | | | (4.19 | ) | | | 5.67 | | | | (0.36 | ) |
Total from investment operations | | | 7.92 | | | | 2.73 | | | | (4.03 | ) | | | 5.74 | | | | (0.24 | ) |
LESS DISTRIBUTIONS FROM: | | | | | | | | | | | | | | | | | | | | |
Net investment income | | | (0.09 | ) | | | (0.13 | ) | | | (0.14 | ) | | | (0.15 | ) | | | (0.13 | ) |
Net realized gains on investments | | | (0.02 | ) | | | — | | | | (3.23 | ) | | | (1.76 | ) | | | — | |
Total distributions | | | (0.11 | ) | | | (0.13 | ) | | | (3.37 | ) | | | (1.91 | ) | | | (0.13 | ) |
Paid-in capital from redemption fees (Note 4) | | | — | | | | — | 2 | | | — | 3 | | | — | 3 | | | — | 3 |
Net Asset Value, end of year | | | $25.87 | | | | $18.06 | | | | $15.46 | | | | $22.86 | | | | $19.03 | |
TOTAL RETURN | | | 43.90% | | | | 17.65% | | | | (17.86% | ) | | | 30.85% | | | | (1.24% | ) |
| | | | | |
RATIOS/SUPPLEMENTAL DATA | | | | | | | | | | | | | | | | | | | | |
Net assets, end of year (in 000’s) | | | $107,569 | | | | $85,006 | | | | $74,935 | | | | $232,954 | | | | $174,962 | |
Ratio of expenses to average net assets before any reimbursement, waiver or recapture of expenses by Advisor and Administrator (Note 5) | | | 1.47% | | | | 1.46% | | | | 1.37% | | | | 1.35% | | | | 1.34% | |
Ratio of expenses to average net assets after any reimbursement, waiver or recapture of expenses by Advisor and Administrator | | | 1.20% | | | | 1.24% | | | | 1.25% | | | | 1.25% | | | | 1.25% | |
Ratio of net investment income (loss) to average net assets | | | 0.08% | | | | 0.85% | | | | 0.73% | | | | 0.34% | | | | 0.64% | |
Portfolio turnover4 | | | 111.87% | | | | 59.10% | | | | 69.79% | | | | 67.13% | | | | 44.44% | |
| 1 | Calculated using the average daily shares method. |
| 2 | The Fund charged redemption fees through October 31, 2019. |
| 3 | Less than $0.01 per share. |
| 4 | The portfolio turnover rate is calculated on the Fund as a whole without distinguishing between classes of shares issued. |
See accompanying notes to financial statements.
| | | | |
| matthewsasia.com | 800.789.ASIA | | | 141 | |
Financial Highlights (continued)
Matthews China Small Companies Fund
The tables below set forth financial data for a share of beneficial interest outstanding throughout each period presented.
| | | | | | | | | | | | | | | | | | | | |
| | | Year Ended Dec. 31 | |
| INVESTOR CLASS | | 2020 | | | 2019 | | | 2018 | | | 2017 | | | 2016 | |
Net Asset Value, beginning of year | | | $12.84 | | | | $9.58 | | | | $11.89 | | | | $8.21 | | | | $8.79 | |
INCOME (LOSS) FROM INVESTMENT OPERATIONS: | | | | | | | | | | | | | | | | | | | | |
Net investment income (loss)1 | | | (0.03 | ) | | | 0.14 | | | | 0.09 | | | | 0.07 | | | | 0.10 | |
Net realized gain (loss) and unrealized appreciation/depreciation on investments and foreign currency related transactions | | | 10.42 | | | | 3.24 | | | | (2.23 | ) | | | 4.27 | | | | (0.28 | ) |
Total from investment operations | | | 10.39 | | | | 3.38 | | | | (2.14 | ) | | | 4.34 | | | | (0.18 | ) |
LESS DISTRIBUTIONS FROM: | | | | | | | | | | | | | | | | | | | | |
Net investment income | | | (0.13 | ) | | | (0.13 | ) | | | (0.05 | ) | | | (0.11 | ) | | | (0.03 | ) |
Net realized gains on investments | | | (3.24 | ) | | | — | | | | (0.16 | ) | | | (0.56 | ) | | | (0.37 | ) |
Total distributions | | | (3.37 | ) | | | (0.13 | ) | | | (0.21 | ) | | | (0.67 | ) | | | (0.40 | ) |
Paid-in capital from redemption fees (Note 4) | | | — | | | | 0.01 | 2 | | | 0.04 | | | | 0.01 | | | | — | 3 |
Net Asset Value, end of year | | | $19.86 | | | | $12.84 | | | | $9.58 | | | | $11.89 | | | | $8.21 | |
TOTAL RETURN | | | 82.52% | | | | 35.41% | | | | (17.68% | ) | | | 53.88% | | | | (2.35% | ) |
| | | | | |
RATIOS/SUPPLEMENTAL DATA | | | | | | | | | | | | | | | | | | | | |
Net assets, end of year (in 000’s) | | | $285,717 | | | | $63,432 | | | | $41,740 | | | | $35,209 | | | | $16,101 | |
Ratio of expenses to average net assets before any reimbursement, waiver or recapture of expenses by Advisor and Administrator (Note 5) | | | 1.52% | | | | 1.62% | | | | 1.97% | | | | 2.34% | | | | 2.24% | |
Ratio of expenses to average net assets after any reimbursement, waiver or recapture of expenses by Advisor and Administrator | | | 1.43% | | | | 1.42% | | | | 1.50% | | | | 1.50% | | | | 1.50% | |
Ratio of net investment income (loss) to average net assets | | | (0.14% | ) | | | 1.25% | | | | 0.78% | | | | 0.66% | | | | 1.17% | |
Portfolio turnover4 | | | 152.86% | | | | 68.17% | | | | 76.67% | | | | 67.22% | | | | 63.15% | |
| | | | | | | | | | | | | | | | |
| | | Year Ended Dec. 31 | | | Period Ended
Dec. 31, 20175 | |
| INSTITUTIONAL CLASS | | 2020 | | | 2019 | | | 2018 | |
Net Asset Value, beginning of period | | | $12.86 | | | | $9.59 | | | | $11.87 | | | | $11.90 | |
INCOME (LOSS) FROM INVESTMENT OPERATIONS: | | | | | | | | | | | | | | | | |
Net investment income (loss)1 | | | 0.04 | | | | 0.15 | | | | 0.11 | | | | (0.01 | ) |
Net realized gain (loss) and unrealized appreciation/depreciation on investments and foreign currency related transactions | | | 10.42 | | | | 3.26 | | | | (2.21 | ) | | | 0.67 | |
Total from investment operations | | | 10.46 | | | | 3.41 | | | | (2.10 | ) | | | 0.66 | |
LESS DISTRIBUTIONS FROM: | | | | | | | | | | | | | | | | |
Net investment income | | | (0.18 | ) | | | (0.15 | ) | | | (0.05 | ) | | | (0.13 | ) |
Net realized gains on investments | | | (3.24 | ) | | | — | | | | (0.16 | ) | | | (0.56 | ) |
Total distributions | | | (3.42 | ) | | | (0.15 | ) | | | (0.21 | ) | | | (0.69 | ) |
Paid-in capital from redemption fees (Note 4) | | | — | | | | 0.01 | 2 | | | 0.03 | | | | — | |
Net Asset Value, end of period | | | $19.90 | | | | $12.86 | | | | $9.59 | | | | $11.87 | |
TOTAL RETURN | | | 82.89% | | | | 35.68% | | | | (17.48% | ) | | | 6.19% | 6 |
| | | | |
RATIOS/SUPPLEMENTAL DATA | | | | | | | | | | | | | | | | |
Net assets, end of period (in 000’s) | | | $98,052 | | | | $32,376 | | | | $20,740 | | | | $476 | |
Ratio of expenses to average net assets before any reimbursement, waiver or recapture of expenses by Advisor and Administrator (Note 5) | | | 1.37% | | | | 1.51% | | | | 1.79% | | | | 2.09% | 7 |
Ratio of expenses to average net assets after any reimbursement, waiver or recapture of expenses by Advisor and Administrator | | | 1.20% | | | | 1.24% | | | | 1.25% | | | | 1.25% | 7 |
Ratio of net investment income (loss) to average net assets | | | 0.20% | | | | 1.34% | | | | 1.05% | | | | (1.20% | )7 |
Portfolio turnover4 | | | 152.86% | | | | 68.17% | | | | 76.67% | | | | 67.22% | 6 |
| 1 | Calculated using the average daily shares method. |
| 2 | The Fund charged redemption fees through October 31, 2019. |
| 3 | Less than $0.01 per share. |
| 4 | The portfolio turnover rate is calculated on the Fund as a whole without distinguishing between classes of shares issued. |
| 5 | Commenced operations on November 30, 2017. |
See accompanying notes to financial statements.
Notes to Financial Statements
Matthews Asia Funds (the “Trust”) is an open-end management investment company registered under the Investment Company Act of 1940, as amended (the “1940 Act”). The Trust currently issues seventeen separate series of shares (each a “Fund”, and collectively, the “Funds”): Matthews Emerging Markets Equity Fund, Matthews Asia Total Return Bond Fund, Matthews Asia Credit Opportunities Fund, Matthews Asian Growth and Income Fund, Matthews Asia Dividend Fund, Matthews China Dividend Fund, Matthews Asia Growth Fund, Matthews Pacific Tiger Fund, Matthews Asia ESG Fund, Matthews Emerging Asia Fund, Matthews Asia Innovators Fund, Matthews China Fund, Matthews India Fund, Matthews Japan Fund, Matthews Korea Fund, Matthews Asia Small Companies Fund, and Matthews China Small Companies Fund. The Matthews Emerging Markets Equity Fund commenced investment operations on April 30, 2020. Each Fund currently offers two classes of shares: Investor Class and Institutional Class. Each class of shares has identical voting, dividend, liquidation and other rights and the same terms and conditions, except each class may be subject to different class expenses as outlined in the relevant prospectus and each class has exclusive voting rights with respect to matters solely affecting such class.
| 2. | SIGNIFICANT ACCOUNTING POLICIES |
The following is a summary of significant accounting policies consistently followed by the Funds in preparation of their financial statements. Each Fund follows the investment company accounting and reporting guidance of the Financial Accounting Standards Board (FASB) Accounting Standard Codification Topic 946 Financial Services—Investment Companies. The accounting policies are in conformity with accounting principles generally accepted in the United States of America (“U.S. GAAP”).
| A. | SECURITY VALUATION: The value of the Trust’s securities is based on market quotations for those securities, or on their fair value determined by the valuation policies approved by the Funds’ Board of Trustees (the “Board”). Market quotations and valuation information are provided by commercial pricing services or securities dealers that are independent of the Funds and Matthews International Capital Management, LLC (“Matthews”), in accordance with procedures established by the Funds’ Board. Foreign exchange-traded securities are valued as of the close of trading on the primary exchange on which they trade. Securities that trade in over-the-counter markets, including most debt securities (bonds), may be valued by other third-party vendors or by using indicative bid quotations from dealers or market makers, or other available market information. Market values for securities are determined based on quotations, market data or other information from the principal (or most advantageous) market on which the security is traded. Market quotations for equity securities used by the Funds include last reported sale prices, or, if such prices are not reported or available, bid and ask prices. Swap agreements are valued utilizing quotes received daily by the Funds’ pricing service or through brokers, which are derived using daily swap curves and models that incorporate a number of market data factors, such as discounted cash flows, trades and values of the underlying reference instruments. Foreign currency exchange contracts are valued at the mean between the bid and ask prices and are determined at the close of business on the New York Stock Exchange (“NYSE”). Interpolated values are derived when the settlement date of the contract is an interim date for which quotations are not available. The Funds may also utilize independent pricing services to assist them in determining a current market value for each security based on sources believed to be reliable. |
The Board has delegated to the Board’s Valuation Committee the responsibility for oversight of the fair valuation process under the Trust’s Pricing and Valuation Policy. The Board’s Valuation Committee, in turn, has delegated the determination of fair value prices under Matthews’ Pricing and Valuation Procedures to Matthews’ Valuation Committee (the “Valuation Committee”). The Board’s Valuation Committee will review and approve fair value determinations by Matthews’ Valuation Committee in accordance with the Pricing and Valuation Policy. When fair value pricing is employed, the prices of securities used by a Fund to calculate its Net Asset Value (“NAV”) may differ from any quoted or published prices for the same securities for that day. All fair value determinations are made subject to the Board’s oversight. Events affecting the value of foreign investments may occur between the time at which they are determined and when the Funds calculate their NAV, which is normally the close of trading on the NYSE. If such events render market quotations unreliable, and the impact of such events can be reasonably determined, the investments will be valued at their fair value in accordance with pricing policies. The fair value of a security held by the Funds may be determined using the services of third-party pricing services to assist in this process.
The books and records of the Funds are maintained in U.S. dollars. Transactions, portfolio securities, and assets and liabilities denominated in a foreign currency are translated and recorded in U.S. dollars at the prevailing exchange rate as of the close of trading on the NYSE. The Fund does not isolate the effect of changes in foreign exchange rates from changes in market prices on securities held. Accordingly, such changes are included within Change in net unrealized appreciation/depreciation on investments on the Statement of Operations. Translation gains or losses resulting from changes in the exchange rate during the reporting period and realized gains and losses on the settlement of foreign currency transactions are reported in the results of operations for the current period. The Funds isolate that portion of gains and losses on investments in fixed income securities that is due to changes in foreign exchange rate from that which is due to changes in market prices of securities.
Foreign securities held by the Funds may be traded on days and at times when the NYSE is closed. Accordingly, the value of the Funds may be significantly affected on days when shareholders have no access to the Funds.
| B. | FAIR VALUE MEASUREMENTS: The Funds follow a fair value hierarchy that distinguishes between market data obtained from independent sources (observable inputs) and the Funds’ own market assumptions (unobservable inputs). These inputs are used in determining the value of the Funds’ financial instruments and are summarized in the following fair value hierarchy: |
Level 1: Unadjusted quoted prices in active markets for identical securities (foreign securities that are valued based on market quotations).
Level 2: Other significant observable inputs. Certain foreign securities may be fair valued by Matthews using information such as quoted prices for similar securities, interest rates, prepayment speeds, credit risk, and foreign exchange. Additionally, external pricing services are used when the Funds determine that events affecting the value of foreign securities which occur between the time at which they are determined and the close of trading on the NYSE render market quotations unreliable.
Level 3: Significant unobservable inputs. Level 3 securities are valued based on significant unobservable inputs as determined under the direction of the Board. Characterization of such securities as Level 3 securities are not necessarily an indication of their liquidity or the risk associated with investing in these securities. A significant change in the unobservable inputs could result in a significantly lower or higher value in such Level 3 securities and could impact overall Fund performance. Level 3 securities consisted of equities that, as of December 31, 2020, were suspended from trading.
The input levels are not necessarily an indication of the risk or liquidity associated with financial instruments at that level.
| | | | |
| matthewsasia.com | 800.789.ASIA | | | 143 | |
Notes to Financial Statements (continued)
Levels for Multi-Country Funds (1 of 2):
Summary of inputs used to determine the fair valuation of multi-country Funds’ investments as of December 31, 2020.
| | | | | | | | | | | | | | | | | | | | | | | | |
| | | Matthews
Emerging Markets
Equity Fund | | | Matthews Asia
Total Return
Bond Fund | | | Matthews Asia
Credit
Opportunities Fund | | | Matthews Asian
Growth and
Income Fund | | | Matthews Asia
Dividend Fund | | | Matthews Asia
Growth Fund | |
| Assets: | | | | | | | | | | | | | | | | | | | | | | | | |
| | | | | | |
| Investments: | | | | | | | | | | | | | | | | | | | | | | | | |
Level 1: Quoted Prices | | | | | | | | | | | | | | | | | | | | | | | | |
Common Equities: | | | | | | | | | | | | | | | | | | | | | | | | |
Argentina | | | $587,547 | | | | $— | | | | $— | | | | $— | | | | $— | | | | $— | |
Bangladesh | | | — | | | | — | | | | — | | | | — | | | | 57,913,199 | | | | 16,865,150 | |
Brazil | | | 1,241,180 | | | | — | | | | — | | | | — | | | | — | | | | — | |
China/Hong Kong | | | 3,434,244 | | | | — | | | | — | | | | 51,910,375 | | | | — | | | | 441,725,030 | |
India | | | 1,916,239 | | | | — | | | | — | | | | — | | | | — | | | | — | |
Mexico | | | 1,414,637 | | | | — | | | | — | | | | — | | | | — | | | | — | |
Netherlands | | | 907,893 | | | | — | | | | — | | | | — | | | | — | | | | — | |
Peru | | | 590,472 | | | | — | | | | — | | | | — | | | | — | | | | — | |
Poland | | | 1,390,223 | | | | — | | | | — | | | | — | | | | — | | | | — | |
Russia | | | 730,590 | | | | — | | | | — | | | | — | | | | — | | | | — | |
Singapore | | | 557,340 | | | | — | | | | — | | | | — | | | | — | | | | 18,352,410 | |
Sri Lanka | | | — | | | | — | | | | — | | | | — | | | | — | | | | 9,607,985 | |
Switzerland | | | — | | | | — | | | | — | | | | — | | | | — | | | | 7,666,395 | |
Taiwan | | | — | | | | — | | | | — | | | | — | | | | 125,116,857 | | | | 39,287,112 | |
United States | | | — | | | | — | | | | — | | | | 30,912,210 | | | | — | | | | 68,384,978 | |
Zambia | | | 723,431 | | | | — | | | | — | | | | — | | | | — | | | | — | |
Level 2: Other Significant Observable Inputs | | | | | | | | | | | | | | | | | | | | | | | | |
Foreign Government Obligationsa | | | — | | | | 28,499,935 | | | | 6,219,140 | | | | — | | | | — | | | | — | |
Non-Convertible Corporate Bondsa | | | — | | | | 64,480,563 | | | | 65,927,466 | | | | — | | | | — | | | | — | |
Convertible Corporate Bondsa | | | — | | | | 10,784,726 | | | | 11,894,181 | | | | 135,516,027 | | | | — | | | | — | |
Common Equities: | | | | | | | | | | | | | | | | | | | | | | | | |
Australia | | | — | | | | — | | | | — | | | | 38,075,367 | | | | 422,218,785 | | | | 56,678,139 | |
Bangladesh | | | — | | | | — | | | | — | | | | — | | | | — | | | | 12,736,275 | |
Brazil | | | 1,598,969 | | | | — | | | | — | | | | — | | | | — | | | | — | |
China/Hong Kong | | | 9,995,815 | | | | — | | | | — | | | | 488,112,986 | | | | 1,599,760,118 | | | | 501,809,466 | |
France | | | 1,149,339 | | | | — | | | | — | | | | 52,761,481 | | | | — | | | | — | |
India | | | 3,092,960 | | | | — | | | | — | | | | 111,394,565 | | | | 129,909,987 | | | | 94,638,816 | |
Indonesia | | | 739,780 | | | | — | | | | — | | | | 36,772,968 | | | | — | | | | 71,674,629 | |
Japan | | | — | | | | — | | | | — | | | | — | | | | 1,599,085,900 | | | | 576,363,251 | |
Mexico | | | 283,380 | | | | — | | | | — | | | | — | | | | — | | | | — | |
Philippines | | | 565,079 | | | | — | | | | — | | | | 19,140,324 | | | | 77,409,997 | | | | — | |
Russia | | | 1,875,657 | | | | — | | | | — | | | | — | | | | — | | | | — | |
Singapore | | | 908,145 | | | | — | | | | — | | | | 114,825,734 | | | | 277,975,703 | | | | — | |
South Africa | | | 490,169 | | | | — | | | | — | | | | — | | | | — | | | | — | |
South Korea | | | 2,731,428 | | | | — | | | | — | | | | 147,199,206 | | | | 209,866,744 | | | | — | |
Taiwan | | | 2,610,611 | | | | — | | | | — | | | | 158,349,378 | | | | 196,378,182 | | | | — | |
Thailand | | | — | | | | — | | | | — | | | | 14,088,319 | | | | 60,416,517 | | | | — | |
United Kingdom | | | 537,623 | | | | — | | | | — | | | | — | | | | — | | | | — | |
Vietnam | | | 309,358 | | | | — | | | | — | | | | 20,359,776 | | | | — | | | | 17,645,016 | |
Preferred Equities: | | | | | | | | | | | | | | | | | | | | | | | | |
South Korea | | | 2,611,045 | | | | — | | | | — | | | | 27,149,805 | | | | 285,330,579 | | | | — | |
Total Market Value of Investments | | | $42,993,154 | | | | $103,765,224 | | | | $84,040,787 | | | | $1,446,568,521 | | | | $5,041,382,568 | | | | $1,933,434,652 | |
| a | Industry, countries, or security types are disclosed on the Schedule of Investments. |
Notes to Financial Statements (continued)
Levels for Multi-Country Funds (2 of 2):
Summary of inputs used to determine the fair valuation of multi-country Funds’ investments as of December 31, 2020.
| | | | | | | | | | | | | | | | | | | | |
| | | Matthews Pacific
Tiger Fund | | | Matthews
Asia ESG
Fund | | | Matthews
Emerging Asia
Fund | | | Matthews Asia
Innovators Fund | | | Matthews Asia
Small Companies
Fund | |
| Assets: | | | | | | | | | | | | | | | | | | | | |
| | | | | |
| Investments: | | | | | | | | | | | | | | | | | | | | |
Level 1: Quoted Prices | | | | | | | | | | | | | | | | | | | | |
Common Equities: | | | | | | | | | | | | | | | | | | | | |
Bangladesh | | | $— | | | | $1,308,541 | | | | $13,823,420 | | | | $— | | | | $— | |
China/Hong Kong | | | 379,027,932 | | | | 4,055,354 | | | | 18,083,424 | | | | 329,021,009 | | | | 6,215,132 | |
India | | | — | | | | — | | | | — | | | | — | | | | 645,051 | |
Malaysia | | | — | | | | — | | | | 38,782 | | | | — | | | | 611,280 | |
Pakistan | | | — | | | | — | | | | 16,151,521 | | | | — | | | | — | |
Singapore | | | 80,097,720 | | | | — | | | | — | | | | 88,019,910 | | | | — | |
South Korea | | | — | | | | — | | | | — | | | | — | | | | 1,683,428 | |
Sri Lanka | | | — | | | | — | | | | 16,561,110 | | | | — | | | | — | |
Taiwan | | | — | | | | 1,722,832 | | | | — | | | | — | | | | — | |
United States | | | — | | | | 3,366,628 | | | | — | | | | 32,901,084 | | | | 1,989,757 | |
Level 2: Other Significant Observable Inputs | | | | | | | | | | | | | | | | | | | | |
Common Equities: | | | | | | | | | | | | | | | | | | | | |
Australia | | | — | | | | — | | | | 4,274,666 | | | | — | | | | — | |
Bangladesh | | | — | | | | 1,841,864 | | | | 7,675,240 | | | | — | | | | — | |
China/Hong Kong | | | 3,970,121,216 | | | | 27,097,044 | | | | 3,432,303 | | | | 741,907,812 | | | | 92,137,831 | |
France | | | — | | | | — | | | | — | | | | 59,774,372 | | | | — | |
India | | | 994,241,110 | | | | 18,733,415 | | | | 22,809,184 | | | | 149,975,622 | | | | 42,027,101 | |
Indonesia | | | 285,895,889 | | | | 89,964 | | | | 24,630,085 | | | | 33,306,996 | | | | 3,087,681 | |
Japan | | | — | | | | 5,051,208 | | | | — | | | | — | | | | — | |
Malaysia | | | 69,519,421 | | | | — | | | | — | | | | — | | | | — | |
Pakistan | | | — | | | | — | | | | 5,074,805 | | | | — | | | | — | |
Philippines | | | 163,181,240 | | | | — | | | | 16,236,114 | | | | — | | | | 2,800,357 | |
Singapore | | | 137,325,771 | | | | 2,276,716 | | | | 2,100,765 | | | | — | | | | 1,802,774 | |
South Korea | | | 1,131,218,110 | | | | 1,023,679 | | | | — | | | | 135,952,129 | | | | 16,383,487 | |
Taiwan | | | 1,194,020,773 | | | | 8,546,650 | | | | — | | | | 85,658,316 | | | | 30,061,833 | |
Thailand | | | 132,426,632 | | | | 1,119,029 | | | | 4,897,225 | | | | — | | | | 2,691,267 | |
Vietnam | | | 92,563,207 | | | | 647,388 | | | | 34,232,024 | | | | 5,406,314 | | | | 4,620,746 | |
Preferred Equities: | | | | | | | | | | | | | | | | | | | | |
South Korea | | | — | | | | 9,724,958 | | | | — | | | | — | | | | — | |
Total Market Value of Investments | | | $8,629,639,021 | | | | $86,605,270 | | | | $190,020,668 | | | | $1,661,923,564 | | | | $206,757,725 | |
| | | | |
| matthewsasia.com | 800.789.ASIA | | | 145 | |
Notes to Financial Statements (continued)
Levels for Single Country Funds:
Summary of inputs used to determine the fair valuation of the single country Funds’ investments as of December 31, 2020.
| | | | | | | | | | | | | | | | | | | | | | | | |
| | | Matthews China
Dividend Fund | | | Matthews
China Fund | | | Matthews
India Fund | | | Matthews
Japan Fund | | | Matthews
Korea Fund | | | Matthews
China Small
Companies
Fund | |
| Assets: | | | | | | | | | | | | | | | | | | | | | | | | |
| | | | | | |
| Investments: | | | | | | | | | | | | | | | | | | | | | | | | |
Level 1: Quoted Prices | | | | | | | | | | | | | | | | | | | | | | | | |
Common Equities: | | | | | | | | | | | | | | | | | | | | | | | | |
Communication Services | | | $— | | | | $49,940,472 | | | | $— | | | | $8,507,508 | | | | $— | | | | $12,695,132 | |
Consumer Discretionary | | | 10,079,357 | | | | 82,191,734 | | | | 5,604,207 | | | | 8,404,678 | | | | — | | | | — | |
Financials | | | — | | | | — | | | | — | | | | — | | | | 977,862 | | | | — | |
Information Technology | | | — | | | | — | | | | — | | | | 11,997,850 | | | | — | | | | 7,999,514 | |
Real Estate | | | 11,975,466 | | | | — | | | | — | | | | — | | | | — | | | | 4,717,412 | |
Level 2: Other Significant Observable Inputs | | | | | | | | | | | | | | | | | | | | | | | | |
Common Equities: | | | | | | | | | | | | | | | | | | | | | | | | |
Communication Services | | | 56,612,941 | | | | 158,471,045 | | | | 44,578,061 | | | | 117,853,156 | | | | 17,960,762 | | | | — | |
Consumer Discretionary | | | 70,855,213 | | | | 307,303,495 | | | | 53,427,477 | | | | 268,949,952 | | | | 13,587,257 | | | | 45,071,106 | |
Consumer Staples | | | 24,244,901 | | | | 52,996,605 | | | | 84,314,748 | | | | — | | | | 9,101,386 | | | | 16,783,291 | |
Energy | | | 10,031,161 | | | | — | | | | 54,024,955 | | | | — | | | | — | | | | — | |
Financials | | | 40,557,133 | | | | 287,583,080 | | | | 268,769,711 | | | | 140,651,656 | | | | 10,839,808 | | | | 13,945,886 | |
Health Care | | | 18,483,723 | | | | 130,494,946 | | | | 45,287,671 | | | | 276,550,260 | | | | 9,142,371 | | | | 45,313,589 | |
Industrials | | | 54,200,959 | | | | 93,888,282 | | | | 25,866,204 | | | | 325,456,987 | | | | 3,339,716 | | | | 87,449,689 | |
Information Technology | | | 39,113,580 | | | | 188,966,815 | | | | 115,784,585 | | | | 356,625,514 | | | | 34,494,993 | | | | 89,328,172 | |
Materials | | | 18,415,890 | | | | 63,712,925 | | | | 26,495,119 | | | | 115,699,153 | | | | 3,148,482 | | | | 24,250,175 | |
Real Estate | | | 10,990,919 | | | | 69,050,795 | | | | — | | | | — | | | | — | | | | 26,219,600 | |
Utilities | | | 8,058,432 | | | | 15,448,919 | | | | — | | | | — | | | | — | | | | — | |
Preferred Equities: | | | | | | | | | | | | | | | | | | | | | | | | |
Consumer Discretionary | | | — | | | | — | | | | — | | | | — | | | | 5,329,739 | | | | — | |
Consumer Staples | | | — | | | | — | | | | — | | | | — | | | | 6,379,628 | | | | — | |
Information Technology | | | — | | | | — | | | | — | | | | — | | | | 29,878,316 | | | | — | |
Materials | | | — | | | | — | | | | — | | | | — | | | | 7,364,918 | | | | — | |
Level 3: Significant Unobservable Inputs | | | | | | | | | | | | | | | | | | | | | | | | |
Common Equities: | | | | | | | | | | | | | | | | | | | | | | | | |
Information Technology | | | — | | | | — | | | | — | | | | — | | | | — | | | | 252 | |
Total Market Value of Investments | | | $373,619,675 | | | | $1,500,049,113 | | | | $724,152,738 | | | | $1,630,696,714 | | | | $151,545,238 | | | | $373,773,818 | |
Levels for Derivatives Financial Instruments:
Summary of inputs used to determine the fair valuation of the Funds’ derivative financial instruments as of December 31, 2020.
| | | | |
| | | Matthews Asia
Total Return
Bond Fund | |
Derivative Financial Instruments1 | | | | |
Assets | | | | |
| Level 2: Other Significant Observable Inputs | | | | |
| |
Forward Foreign Currency Exchange Contracts | | | $1,990,746 | |
| |
Interest Rate Swaps | | | 704,897 | |
| | | | |
| | | $2,695,643 | |
| | | | |
| |
Liabilities | | | | |
| Level 2: Other Significant Observable Inputs | | | | |
| |
Forward Foreign Currency Exchange Contracts | | | ($280,505) | |
| | | | |
| 1 | Derivative financial instruments are forward foreign currency exchange contracts and interest rate swaps. Forward foreign currency exchange contracts and interest rate swaps are valued at the unrealized appreciation/depreciation on the instrument. |
Notes to Financial Statements (continued)
Changes in the Balances of Level 3 Securities:
The Funds’ policy is to recognize transfers in and transfers out of Level 3 during the reporting period.
| | | | |
| | | Matthews
China Small
Companies Fund | |
| | | Common
Equities —
Information
Technology | |
| Balance as of 12/31/19 (market value) | | $ | 250 | |
| |
| Accrued discounts/premiums | | | — | |
| |
| Realized gain/(loss) | | | — | |
| |
| Change in unrealized appreciation/ (depreciation) | | | 2 | |
| |
| Purchases | | | — | |
| |
| Sales | | | — | |
| |
| Transfers in to Level 3 | | | — | |
| |
| Transfer out of Level 3 | | | — | |
| Balance as of 12/31/20 (market value) | | $ | 252 | |
| Net change in unrealized appreciation/depreciation on Level 3 investments held as of 12/31/20* | | $ | 2 | |
| * | Included in the related amounts on the Statements of Operations. |
| C. | BASIS OF CONSOLIDATION: The accompanying consolidated financial highlights of Matthews China Fund and Matthews Asia Dividend Fund (the “Investing Funds”) for the 2016 period include the accounts of the Matthews CF-U Series and Matthews ADF-U Series (the “U Series Funds”), respectively. The U Series Funds were series of Matthews A Share Selections Fund, LLC, a Delaware limited liability company registered under the 1940 Act. All of the interests offered by U Series Funds were exclusively owned by the Investing Funds. The U Series Funds primarily invested in the stocks of Chinese companies listed on Mainland China Stock Exchanges, and traded and denominated in the currency of China, the Renminbi. To allow U Series Funds to invest in China A Shares Matthews applied for and received a license from the China Securities Regulatory Commission as a Qualified Foreign Investor (“QFI”) and had been allocated by the State Administration of Foreign Exchange of China an initial quota of $100 million in June 2014, and an additional quota of $440 million in July 2015, representing the equivalent value in Renminbi of China A Shares that the Funds could purchase. Access to the quota was subject to Matthews’ trade allocation procedures and access allocation procedures. The U Series Funds were subject to the same investment policies and restrictions that apply to Investing Funds. Intercompany accounts and transactions had been eliminated in the consolidation process. The U Series Funds were intended to be disregarded entities for tax purposes. Therefore, no federal tax provision was required. Consolidated financial statements included expenses that were accrued for and paid by the Investing Funds. These included on-going operational costs as well as costs in connection with the launching of the U Series Funds. |
In September 2016, the Board of Directors of the Matthews A Share Selections Fund, LLC adopted resolutions authorizing the termination and liquidation of the Matthews A Share Selections Fund, LLC. Consequently, as of September 30, 2016, the U Series Funds sold their securities and effectively ceased investment operations. The outstanding interests of each U Series Fund were redeemed by its respective Investing Fund. The Matthews A Share Selections Fund, LLC filed an initial application for deregistration as a registered investment company with the U.S. Securities and Exchange Commission in October 2016, which was subsequently granted in February 2017.
| D. | RISKS ASSOCIATED WITH NON-U.S. COMPANIES: Investments by the Funds in the securities of non-U.S. companies may involve investment risks not typically associated with investments in U.S. issuers. These risks include possible political, economic, social and religious instability, inadequate investor protection; changes in laws or regulations of countries within the Asia Pacific region (including in countries where the Funds may invest, as well as in the broader region); international relations with other nations; natural disasters; corruption; and military activity. Foreign securities may be subject to greater fluctuations in price than securities of domestic corporations or the U.S. government. Foreign investing may also include the risk of expropriation or confiscatory taxation, limitation on the removal of funds or other assets, currency crises and exchange controls, the imposition of foreign withholding tax on the interest income payable on such instruments, the possible seizure or nationalization of foreign deposits or assets, or the adoption of other foreign government restrictions that might adversely affect the foreign securities held by the Funds. Additionally, Asia Pacific countries may utilize formal or informal currency exchange controls or “capital controls” that may limit the ability to repatriate investments or income or adversely affect the value of portfolio investments. The economies of many Asia Pacific countries differ from the economies of more developed countries in many respects, such as their rate of growth, inflation, capital reinvestment, resource self-sufficiency and dependence on other economies, financial system stability, the national balance of payments position and sensitivity to changes in global trade. |
Certain Asia Pacific countries are highly dependent upon and may be affected by developments in the economies of other countries. Non-U.S. companies are subject to different accounting, auditing, and financial reporting standards, practices, and requirements than U.S. companies. There is generally less government regulation of stock exchanges, brokers, and listed companies abroad than in the United States, which may result in less transparency with respect to a company’s operations, and make obtaining information about them more difficult (or such information may be unavailable).
Among other risks of investing in foreign markets are the variable quality and reliability of financial information and related audits of companies. In some cases, financial information and related audits can be unreliable and not subject to verification. Auditing firms in some of these markets are not subject to independent inspection or oversight of audit quality. For example, China does not allow the Public Company Accounting Oversight Board to inspect the work that auditors perform in China for Chinese companies that sell stock into U.S. markets. This can result in investment decisions being made based on flawed or misleading information.
Foreign stock markets may not be as developed or efficient as those in the United States, and the absence of negotiated brokerage commissions in certain countries may result in higher brokerage fees. The time between the trade and settlement dates of securities transactions on foreign exchanges ranges from one day to four weeks or longer and may result in higher custody charges. Custodial arrangements may be less well developed than in
| | | | |
| matthewsasia.com | 800.789.ASIA | | | 147 | |
Notes to Financial Statements (continued)
the United States. Foreign securities are generally denominated and pay distributions in foreign currencies, exposing the Funds to changes in foreign currency exchange rates. Investing in any country in the Asia Pacific region will also entail risks specific and unique to that country, and these risks can be significant and change rapidly.
Changes in interest rates in each of the countries in which the Funds may invest, as well as interest rates in more-developed countries, may cause a decline in the market value of an investment. Generally, fixed income securities will decrease in value when interest rates rise and can be expected to rise in value when interest rates decline. As interest rates decline, debt issuers may repay or refinance their loans or obligations earlier than anticipated. The issuers of fixed income securities may, therefore, repay principal in advance. This would force the Funds to reinvest the proceeds from the principal prepayments at lower rates, which reduces the Funds’ income.
| E. | DISTRIBUTIONS TO SHAREHOLDERS: It is the policy of Matthews Asian Growth and Income Fund and Matthews China Dividend Fund to distribute net investment income on a semi-annual basis and capital gains, if any, annually. It is the policy of Matthews Asia Dividend Fund to distribute net investment income on a quarterly basis and capital gains, if any, annually. It is the policy of Matthews Asia Total Return Bond Fund and Matthews Asia Credit Opportunities Fund to distribute net investment income on a monthly basis and capital gains, if any, annually. Each of the other Funds distributes a net investment income and capital gains, if any, annually. Distributions to shareholders are recorded on the ex-dividend date. Income and capital gain distributions are determined in accordance with income tax regulations which may differ from U.S. GAAP. |
The tax character of distributions paid for the fiscal years ended December 31, 2020 and December 31, 2019 were as follows:
| | | | | | | | | | | | |
| YEAR ENDED DECEMBER 31, 2020 | | Ordinary
Income | | | Net Long-Term
Capital Gains | | | Total Taxable
Distributions | |
| Matthews Emerging Markets Equity Fund | | | $882,135 | | | | $— | | | | $882,135 | |
| Matthews Asia Total Return Bond Fund | | | 4,578,727 | | | | — | | | | 4,578,727 | |
| Matthews Asia Credit Opportunities Fund | | | 4,477,419 | | | | — | | | | 4,477,419 | |
| Matthews Asian Growth and Income Fund | | | 14,794,758 | | | | 391,926 | | | | 15,186,684 | |
| Matthews Asia Dividend Fund | | | 53,530,829 | | | | — | | | | 53,530,829 | |
| Matthews China Dividend Fund | | | 7,855,231 | | | | — | | | | 7,855,231 | |
| Matthews Asia Growth Fund | | | 16,807,423 | | | | 68,287,399 | | | | 85,094,822 | |
| Matthews Pacific Tiger Fund | | | 129,852,518 | | | | 359,799,196 | | | | 489,651,714 | |
| Matthews Asia ESG Fund | | | 2,311,656 | | | | 2,403,245 | | | | 4,714,901 | |
| Matthews Emerging Asia Fund | | | 3,450,813 | | | | — | | | | 3,450,813 | |
| Matthews Asia Innovators Fund | | | 8,251,347 | | | | 18,926,624 | | | | 27,177,971 | |
| Matthews China Fund | | | 13,513,444 | | | | 5,822,237 | | | | 19,335,681 | |
| Matthews India Fund | | | 4,523,843 | | | | 16,595,544 | | | | 21,119,387 | |
| Matthews Japan Fund | | | 8,236,537 | | | | 147,995,041 | | | | 156,231,578 | |
| Matthews Korea Fund | | | 1,103,667 | | | | — | | | | 1,103,667 | |
| Matthews Asia Small Companies Fund | | | 596,420 | | | | 134,758 | | | | 731,178 | |
| Matthews China Small Companies Fund | | | 34,983,716 | | | | 21,174,671 | | | | 56,158,387 | |
| | | | | | | | | | | | |
| YEAR ENDED DECEMBER 31, 2019 | | Ordinary
Income | | | Net Long-Term
Capital Gains | | | Total Taxable
Distributions | |
| Matthews Asia Total Return Bond Fund | | | $4,702,646 | | | | $— | | | | $4,702,646 | |
| Matthews Asia Credit Opportunities Fund | | | 2,963,829 | | | | 42,003 | | | | 3,005,832 | |
| Matthews Asian Growth and Income Fund | | | 35,418,572 | | | | 22,400,844 | | | | 57,819,416 | |
| Matthews Asia Dividend Fund | | | 124,516,990 | | | | — | | | | 124,516,990 | |
| Matthews China Dividend Fund | | | 6,111,641 | | | | — | | | | 6,111,641 | |
| Matthews Asia Growth Fund | | | 373,187 | | | | 12,060,061 | | | | 12,433,248 | |
| Matthews Pacific Tiger Fund | | | 59,773,643 | | | | 269,683,012 | | | | 329,456,655 | |
| Matthews Asia ESG Fund | | | 204,697 | | | | 588,349 | | | | 793,046 | |
| Matthews Emerging Asia Fund | | | 244 | | | | 8,355,290 | | | | 8,355,534 | |
| Matthews Asia Innovators Fund | | | — | | | | 976,006 | | | | 976,006 | |
| Matthews China Fund | | | 10,400,822 | | | | — | | | | 10,400,822 | |
| Matthews India Fund | | | 1,864,672 | | | | 115,678,091 | | | | 117,542,763 | |
| Matthews Japan Fund | | | 14,895,033 | | | | 190,758,914 | | | | 205,653,947 | |
| Matthews Korea Fund | | | 133 | | | | 10,920,522 | | | | 10,920,655 | |
| Matthews Asia Small Companies Fund | | | 1,036,516 | | | | 79,318 | | | | 1,115,834 | |
| Matthews China Small Companies Fund | | | 1,012,660 | | | | — | | | | 1,012,660 | |
| F. | INVESTMENT TRANSACTIONS AND INCOME: Securities transactions are accounted for on the date the securities are purchased or sold or on the following business day. Financial statements reflect security transactions on trade date. Gains or losses on the sale of securities are determined on the identified cost basis. Interest income is recorded on the accrual basis. Interest income, including amortization and accretion of premiums and discounts on debt securities, is recognized daily on an accrual basis. Dividend income is generally recorded on the ex-dividend date net of any foreign taxes withheld at the source. Dividend income for certain issuers headquartered in countries which the Funds invest may not be recorded until approved by the shareholders (which may occur after the ex-dividend date) if, in the judgment of management, such dividends are not reasonably determined as of the ex-dividend date. Income and realized and unrealized gains or losses on investments are allocated to each class of shares based on its relative net assets. |
Notes to Financial Statements (continued)
The Funds may be subject to foreign taxation related to income received, capital gains on the sale of securities and certain foreign currency trans- actions in the foreign jurisdictions in which they invest. Foreign taxes, if any, are recorded based on the tax regulations and rates that exist in the foreign markets in which the Funds invest. When a capital gain tax is determined to apply, the Funds record an estimated deferred tax liability in an amount that may be payable if the securities were disposed of on the valuation date.
| G. | FUND EXPENSE ALLOCATIONS: The Funds account separately for the assets, liabilities and operations of each Fund. Estimated expenses are accrued daily. Direct expenses of each Fund or class are charged to that Fund or class while general expenses are allocated pro-rata among the Funds based on net assets or other appropriate methods. |
| H. | CASH, CASH OVERDRAFTS, AND FOREIGN CURRENCY: QFI accounts (i.e., the accounts through which the QFI quota is accessed) are required by the local market to maintain a cash reserve. The cash reserve is based upon a fixed ratio of the QFI’s approved investment quota, which is defined as the amount remitted into its special Renminbi (RMB) cash account. These amounts, if any, are included in “Segregated foreign currency at value” |
on the Statements of Assets and Liabilities. The fixed ratio is set at 0.08 percent for the Shanghai and 0.06 percent for the Shenzhen market. When any of the Funds’ cash balances are overdrawn, a Fund is charged an overdraft fee by the custodian of 1.00% above the 30-day LIBOR rate on outstanding balances. These amounts, if any, are included in “Other expenses” on the Statements of Operations.
| I. | USE OF ESTIMATES: The preparation of financial statements in conformity with U.S. GAAP requires management to make estimates and assumptions that affect the amounts reported in the financial statements and accompanying notes. Actual results may differ from those estimates. |
| J. | RECENT ACCOUNTING GUIDANCE: In March 2020, the Financial Accounting Standards Board (FASB) issued Accounting Standards Update (ASU) No. 2020-04, Reference Rate Reform (Topic 848)—Facilitation of the Effects of Reference Rate Reform on Financial Reporting. The amendments in the ASU provide optional temporary financial reporting relief from the effect of certain types of contract modifications due to the planned discontinuation of the London Interbank Offered Rate (LIBOR) and other interbank-offered based reference rates as of the end of 2021. The ASU is effective for certain reference rate-related contract modifications that occur during the period March 12, 2020 through December 31, 2022. Management is currently evaluating the impact, if any, of applying this ASU. |
| 3. | DERIVATIVE FINANCIAL INSTRUMENTS |
Each of the Matthews Asia Total Return Bond Fund and the Matthews Asia Credit Opportunities Fund may engage in derivative transactions for a variety of purposes, including managing interest rate, currency and credit exposure. Derivative transactions in which each Fund may engage include financial futures contracts, swaps and/or forward foreign currency exchange contracts.
Certain derivative transactions may result in each Fund’s exposure to a currency to exceed the value of the Fund’s assets and the Fund could be exposed to currency risk whether or not it holds a bond or other instrument denominated in that currency. The gross notional value of derivative financial instruments and transactions could exceed the value of the Fund’s net assets, although the net market value of these instruments and transactions, on a marked-to-market basis, at most times, is expected to be substantially lower.
The primary risks associated with the use of derivative financial instruments are: (i) Matthews may not correctly predict the direction of currency exchange rates, interest rates, security prices, or other economic factors; (ii) Matthews may not correctly predict changes in the value of derivative financial instruments and related underlying instruments or assets, which may result in disproportionately increased losses and/or reduced opportunities for gains; (iii) imperfect correlation between the change in market value of the securities held by a Fund and the price of financial futures contracts and credit default swaps contracts; (iv) the lack of, or a reduction in the liquidity of, any secondary market for the instrument, and the resulting inability to close the position (or exit the position) when desired; (v) losses, which are potentially unlimited, due to unanticipated market movements; (vi) the value of the instrument may change unfavorably due to movements in the value of the referenced foreign currencies; (vii) a Fund may suffer disproportionately heavy losses relative to the amount invested; (viii) changes in the value of the derivatives may not match or fully offset changes in the value of hedged or related portfolio securities, thereby failing to achieve the hedging or investment purpose for the derivative transaction; and (ix) the other party to the instrument may fail to fulfill its obligation.
Forward Foreign Currency Exchange Contracts: The Matthews Asia Total Return Bond Fund and the Matthews Asia Credit Opportunities Fund may enter into forward foreign currency exchange contracts to gain or reduce exposure to foreign currency exchange rate risk. A forward foreign currency exchange contract is an agreement between two parties to buy and sell a currency at a set exchange rate on a future date. The contract is marked-to-market daily and the change in market value is recorded by the Fund as an unrealized gain or loss. When the contract is closed, the Fund records a realized gain or loss equal to the difference between the value at the time it was opened and the value at the time it was closed. The Matthews Asia Total Return Bond Fund and the Matthews Asia Credit Opportunities Fund do not offset financial assets and financial liabilities on forward foreign currency contacts in the Statements of Assets and Liabilities as they are not subject to netting arrangements.
Swaps: The Matthews Asia Total Return Bond Fund and the Matthews Asia Credit Opportunities Fund may enter into swap contracts to manage exposure to issuers, markets and securities to reduce their risk exposure to defaults of corporate and/or sovereign issuers or to create exposure to corporate and/or sovereign issuers to which they are not otherwise exposed (credit risk). Such contracts are agreements between the Funds and a counterparty to make periodic net payments on a specified notional amount or a net payment upon termination. Swap agreements are privately negotiated in the OTC market and may be entered into as a bilateral contract (“OTC Swaps”) or centrally cleared (“centrally cleared swaps”).
For OTC swaps, any upfront premiums paid and any upfront fees received are shown as swap premiums paid and swap premiums received, respectively, in the Statements of Assets and Liabilities and amortized over the term of the contract. The daily fluctuation in market value is recorded as unrealized appreciation (depreciation) on OTC Swaps in the Statements of Assets and Liabilities. Payments received or paid are recorded in the Statements of Operations as realized gains or losses, respectively. When an OTC swap is terminated, a realized gain or loss is recorded in the Statements of Operations equal to the difference between the proceeds from (or cost of) the closing transaction and the Funds’ basis in the contract, if any. Generally, the basis of the contract is the amortized premium received or paid.
The Funds may buy credit default swaps on single-name issuers (corporate or sovereign), a combination or basket of single-name issuers or traded indexes. Credit default swaps are agreements in which the protection buyer pays fixed periodic payments to the seller in consideration for a promise from the protection seller to make a specific payment should a negative credit event take place with respect to the referenced entity (e.g., bankruptcy, failure to pay, obligation acceleration, repudiation, moratorium or restructuring). As a buyer, if an underlying credit event occurs, the Funds will either (i) receive from the seller an amount equal to the notional amount of the swap and deliver the referenced security or underlying securities comprising the index, or (ii) receive a net settlement of cash equal to the notional amount of the swap less the recovery value of the security or underlying securities comprising the index.
The Funds may enter into interest rate swaps to gain or reduce exposure to interest rates or to manage duration, the yield curve or interest rate (interest rate risk).
| | | | |
| matthewsasia.com | 800.789.ASIA | | | 149 | |
Notes to Financial Statements (continued)
Interest rate swaps are agreements to exchange cash flows based on the difference between specified interest rates applied to a notional principal amount for a specified period of time. Risks related to the use of interest rate swaps include the potential for unanticipated movements in interest or currency rates, the possible failure of a counterparty to perform in accordance with the terms of the swap agreements and potential government regulation that could adversely affect the Funds’ swap investments.
Counterparty Credit Risk: A derivative contract may suffer a mark to market loss if the value of the contract decreases due to an unfavorable change in the market rates or values of the underlying instrument. Losses can also occur if the counterparty does not perform under the contract.
A Fund’s risk of loss from counterparty credit risk on OTC derivatives is generally limited to the aggregate unrealized gain netted against any collateral held by such Fund.
With exchange traded futures and centrally cleared swaps, there is less counterparty credit risk to the Funds since the exchange or clearinghouse, as counterparty to such instruments, guarantees against a possible default. The clearinghouse stands between the buyer and the seller of the contract; therefore, the credit risk is limited to failure of the clearinghouse. While offset rights may exist under applicable law, a Fund does not have a contractual right of offset against a clearing broker or clearinghouse in the event of a default (including the bankruptcy or insolvency) of the clearing broker or clearinghouse. Additionally, credit risk exists in exchange traded futures and centrally cleared swaps with respect to initial and variation margin that is held in a clearing broker’s customer accounts. While clearing brokers are required to segregate customer margin from their own assets, in the event that a clearing broker becomes insolvent or goes into bankruptcy and at that time there is a shortfall in the aggregate amount of margin held by the clearing broker for all its clients, typically the shortfall would be allocated on a pro rata basis across all the clearing broker’s customers, potentially resulting in losses to the Funds.
In order to better define its contractual rights and to secure rights that will help the Funds mitigate their counterparty risk, a Fund may enter into an International Swaps and Derivatives Association, Inc. Master Agreement (“ISDA Master Agreement”) or similar agreement with its derivative contract counterparties. An ISDA Master Agreement is a bilateral agreement between each Fund and a counterparty that governs OTC derivatives and typically contains, among other things, collateral posting terms and netting provisions in the event of a default and/or termination event. Under an ISDA Master Agreement, each Fund may, under certain circumstances, offset with the counterparty certain derivative financial instruments’ payables and/or receivables with collateral held and/or posted and create one single net payment. The provisions of the ISDA Master Agreement typically permit a single net payment in the event of default including the bankruptcy or insolvency of the counterparty. However, bankruptcy or insolvency laws of a particular jurisdiction may impose restrictions on or prohibitions against the right of offset in bankruptcy, insolvency or other events. In addition, certain ISDA Master Agreements allow counterparties to OTC derivatives to terminate derivative contracts prior to maturity in the event a Fund’s net assets decline by a stated percentage or the Fund fails to meet the terms of its ISDA Master Agreements, which would cause the Fund to accelerate payment of any net liability owed to the counterparty.
Collateral requirements: For derivatives traded under an ISDA Master Agreement, the collateral requirements are typically calculated by netting the mark to market amount for each transaction under such agreement and comparing that amount to the value of any collateral currently pledged by a Fund and the counterparty. Cash collateral that has been pledged to cover obligations of a Fund, if any, is reported separately on the Statements of Assets and Liabilities as cash pledged as collateral. Non-cash collateral pledged by a Fund, if any, is noted in the Schedules of Investments.
For financial reporting purposes, the Funds do not offset derivative assets and derivative liabilities that are subject to netting arrangements in the Statements of Assets and Liabilities.
The Funds have implemented the disclosure requirements pursuant to FASB Accounting Standards update No. 2011-11, Disclosures about Offsetting Assets and Liabilities, that requires disclosures to make financial statements that are prepared under U.S. GAAP more comparable to those prepared under International Financial Reporting Standards. Under this guidance the Funds disclose in the Statements of Assets and Liabilities both gross and net information about instruments and transactions eligible for offset such as instruments and transactions subject to an agreement similar to a master netting arrangement. In addition, the Funds disclose collateral received and posted in connection with master netting agreements or similar arrangements.
As of December 31, 2020, the Matthews Asia Total Return Bond Fund had $704,897 in gross/net assets in the Statements of Assets and Liabilities for OTC Interest Rate Swaps and gross assets of $1,990,746 and gross liabilities of $280,505 for the Forward foreign currency exchange contracts with Bank of America, N.A. The Fund received cash collateral of $2,290,000 from Bank of America, N.A. for the open OTC Interest Rate Swaps and Forward foreign currency exchange contracts.
Levels for Derivative Financial Instruments:
For the fiscal year ended December 31, 2020, the effects of derivative financial instruments on the statement of Assets and Liabilities was as follows:
| | | | | | | | | | |
| | | Statements of Assets and Liabilities Location | | | | | Matthews Asia
Total Return
Bond Fund | |
| | Asset Derivatives | | | | | | | | |
| | Unrealized appreciation on forward foreign | | | | | | | | |
| Forward foreign currency exchange contracts | | currency exchange contracts | | | | | | | $1,990,746 | |
| Interest rate contracts | | Unrealized appreciation on Swaps | | | | | | | $704,897 | |
| | | | | | | | | | |
| | Total | | | | | | | $2,695,643 | |
| | | | | | | | | | |
| | Liability Derivatives | | | | | | | | |
| | Unrealized depreciation on forward foreign | | | | | | | | |
| Forward foreign currency exchange contracts | | currency exchange contracts | | | | | | | ($280,505 | ) |
| | | | | | | | | | |
Notes to Financial Statements (continued)
For the fiscal year ended December 31, 2020, the effects of derivative financial instruments on the Statements of Operations were as follows:
| | | | | | | | | | |
| Derivative type | | Statements of Operations Location | | | | | Matthews Asia
Total Return
Bond Fund | |
Net Realized Gain (Loss) | | | | | | | | | | |
| Foreign currency contracts: | | | | | | | | | | |
| | | |
Forward foreign currency exchange contracts | | Net realized gain (loss) on forward foreign | | | | | | | | |
| | currency exchange contracts | | | | | | | ($695,797 | ) |
| Interest rate swaps: | | | | | | | | | | |
| | | |
Interest rate contracts | | Net realized gain (loss) on swaps | | | | | | | 108,731 | |
| | | | | | | | | | |
| | Total | | | | | | | ($587,066 | ) |
| | | | | | | | | | |
Net Change In Unrealized Appreciation (Depreciation) | | | | | | | | | | |
| Foreign currency contracts: | | | | | | | | | | |
| | | |
Forward foreign currency exchange contracts | | Net change in unrealized appreciation/ | | | | | | | | |
| | depreciation on forward foreign currency | | | | | | | | |
| | exchange contracts | | | | | | | $1,571,854 | |
| Interest rate swaps: | | | | | | | | | | |
| | | |
Interest rate contracts | | Net change in unrealized appreciation/ | | | | | | | | |
| | depreciation on swaps | | | | | | | 537,033 | |
| | | | | | | | | | |
| | Total | | | | | | | $2,108,887 | |
| | | | | | | | | | |
In regards to the forward foreign currency exchange contracts entered into by the Matthews Asia Total Return Bond Fund, the average notional ending quarterly amounts purchased in USD were $3,390,616 and the average notional ending quarterly amounts sold in USD were $28,292,973. In regards to the interest rate swap contracts entered into by the Matthews Asia Total Return Bond Fund, where the Fund receives the fixed rate and pays the floating rate, the average notional ending quarterly amounts in USD was $18,783,633.
| 4. | CAPITAL SHARE TRANSACTIONS |
| | | | | | | | | | | | | | | | |
| | | For the Period Ended
December 31, 2020 | | | | | | | |
| | | Shares | | | Amount | | | | | | | |
MATTHEWS EMERGING MARKETS EQUITY FUND1 | | | | | | | | | | | | | | | | |
| | | | |
Investor Class | | | | | | | | | | | | | | | | |
| | | | |
Shares sold | | | 686,270 | | | | $9,426,163 | | | | | | | | | |
| | | | |
Shares issued through reinvestment of distributions | | | 9,155 | | | | 141,361 | | | | | | | | | |
| | | | |
Shares redeemed | | | (70,526 | ) | | | (932,459 | ) | | | | | | | | |
Net increase | | | 624,899 | | | | $8,635,065 | | | | | | | | | |
Institutional Class | | | | | | | | | | | | | | | | |
| | | | |
Shares sold | | | 2,223,270 | | | | $28,523,375 | | | | | | | | | |
| | | | |
Shares issued through reinvestment of distributions | | | 35,661 | | | | 550,602 | | | | | | | | | |
| | | | |
Shares redeemed | | | (42,875 | ) | | | (610,863 | ) | | | | | | | | |
Net increase | | | 2,216,056 | | | | $28,463,114 | | | | | | | | | |
| | |
| | | Year Ended December 31, 2020 | | | Year Ended December 31, 2019 | |
| | | Shares | | | Amount | | | Shares | | | Amount | |
MATTHEWS ASIA TOTAL RETURN BOND FUND | | | | | | | | | | | | | | | | |
| | | | |
Investor Class | | | | | | | | | | | | | | | | |
| | | | |
Shares sold | | | 1,083,279 | | | | $11,623,935 | | | | 531,369 | | | | $5,763,612 | |
| | | | |
Shares issued through reinvestment of distributions | | | 141,335 | | | | 1,519,805 | | | | 145,300 | | | | 1,576,564 | |
| | | | |
Shares redeemed | | | (1,183,090 | ) | | | (12,428,981 | ) | | | (1,094,258 | ) | | | (11,768,876 | ) |
Net increase (decrease) | | | 41,524 | | | | $714,759 | | | | (417,589 | ) | | | ($4,428,700 | ) |
Institutional Class | | | | | | | | | | | | | | | | |
| | | | |
Shares sold | | | 1,515,846 | | | | $16,313,403 | | | | 1,930,123 | | | | $20,678,547 | |
| | | | |
Shares issued through reinvestment of distributions | | | 266,617 | | | | 2,867,164 | | | | 247,825 | | | | 2,689,277 | |
| | | | |
Shares redeemed | | | (2,113,734 | ) | | | (22,275,169 | ) | | | (1,084,707 | ) | | | (11,720,296 | ) |
Net increase (decrease) | | | (331,271 | ) | | | ($3,094,602 | ) | | | 1,093,241 | | | | $11,647,528 | |
| 1 | The Fund commenced operations on April 30, 2020. |
| | | | |
| matthewsasia.com | 800.789.ASIA | | | 151 | |
Notes to Financial Statements (continued)
| | | | | | | | | | | | | | | | |
| | |
| | | Year Ended December 31, 2020 | | | Year Ended December 31, 2019 | |
| | | Shares | | | Amount | | | Shares | | | Amount | |
MATTHEWS ASIA CREDIT OPPORTUNITIES FUND | | | | | | | | | | | | | | | | |
| | | | |
Investor Class | | | | | | | | | | | | | | | | |
| | | | |
Shares sold | | | 336,236 | | | | $3,381,135 | | | | 539,096 | | | | $5,563,787 | |
| | | | |
Shares issued through reinvestment of distributions | | | 45,500 | | | | 454,092 | | | | 50,305 | | | | 523,714 | |
| | | | |
Shares redeemed | | | (748,744 | ) | | | (7,561,725 | ) | | | (248,407 | ) | | | (2,552,245 | ) |
Net increase (decrease) | | | (367,008 | ) | | | ($3,726,498 | ) | | | 340,994 | | | | $3,535,256 | |
Institutional Class | | | | | | | | | | | | | | | | |
| | | | |
Shares sold | | | 2,782,828 | | | | $28,528,306 | | | | 4,598,478 | | | | $48,037,680 | |
| | | | |
Shares issued through reinvestment of distributions | | | 357,209 | | | | 3,561,328 | | | | 188,769 | | | | 1,969,854 | |
| | | | |
Shares redeemed | | | (2,644,333 | ) | | | (26,357,185 | ) | | | (459,087 | ) | | | (4,707,645 | ) |
Net increase | | | 495,704 | | | | $5,732,449 | | | | 4,328,160 | | | | $45,299,889 | |
MATTHEWS ASIAN GROWTH AND INCOME FUND | | | | | | | | | | | | | | | | |
| | | | |
Investor Class | | | | | | | | | | | | | | | | |
| | | | |
Shares sold | | | 3,961,184 | | | | $60,658,602 | | | | 4,872,266 | | | | $72,535,793 | |
| | | | |
Shares issued through reinvestment of distributions | | | 414,608 | | | | 6,411,390 | | | | 1,729,925 | | | | 26,744,737 | |
| | | | |
Shares redeemed | | | (13,087,303 | ) | | | (193,520,450 | ) | | | (18,009,566 | ) | | | (272,354,103 | ) |
Net (decrease) | | | (8,711,511 | ) | | | ($126,450,458 | ) | | | (11,407,375 | ) | | | ($173,073,573 | ) |
Institutional Class | | | | | | | | | | | | | | | | |
| | | | |
Shares sold | | | 16,675,711 | | | | $241,076,588 | | | | 25,459,302 | | | | $387,665,569 | |
| | | | |
Shares issued through reinvestment of distributions | | | 539,050 | | | | 8,348,939 | | | | 1,643,462 | | | | 25,409,900 | |
| | | | |
Shares redeemed | | | (18,977,781 | ) | | | (269,664,414 | ) | | | (22,634,082 | ) | | | (341,434,957 | ) |
Net increase (decrease) | | | (1,763,020 | ) | | | ($20,238,887 | ) | | | 4,468,682 | | | | $71,640,512 | |
MATTHEWS ASIA DIVIDEND FUND | | | | | | | | | | | | | | | | |
| | | | |
Investor Class | | | | | | | | | | | | | | | | |
| | | | |
Shares sold | | | 18,393,530 | | | | $327,832,632 | | | | 23,080,251 | | | | $386,877,636 | |
| | | | |
Shares issued through reinvestment of distributions | | | 1,364,682 | | | | 22,897,673 | | | | 3,039,442 | | | | 51,047,011 | |
| | | | |
Shares redeemed | | | (50,820,426 | ) | | | (839,219,405 | ) | | | (63,800,331 | ) | | | (1,067,632,982 | ) |
Net (decrease) | | | (31,062,214 | ) | | | ($488,489,100 | ) | | | (37,680,638 | ) | | | ($629,708,335 | ) |
Institutional Class | | | | | | | | | | | | | | | | |
| | | | |
Shares sold | | | 27,263,064 | | | | $494,209,691 | | | | 47,879,707 | | | | $804,748,356 | |
| | | | |
Shares issued through reinvestment of distributions | | | 1,601,889 | | | | 26,818,513 | | | | 3,784,649 | | | | 63,570,444 | |
| | | | |
Shares redeemed | | | (75,380,880 | ) | | | (1,182,055,503 | ) | | | (66,039,551 | ) | | | (1,110,681,954 | ) |
Net (decrease) | | | (46,515,927 | ) | | | ($661,027,299 | ) | | | (14,375,195 | ) | | | ($242,363,154 | ) |
MATTHEWS CHINA DIVIDEND FUND | | | | | | | | | | | | | | | | |
| | | | |
Investor Class | | | | | | | | | | | | | | | | |
| | | | |
Shares sold | | | 5,086,753 | | | | $83,510,641 | | | | 8,109,547 | | | | $128,681,746 | |
| | | | |
Shares issued through reinvestment of distributions | | | 324,393 | | | | 5,319,517 | | | | 266,077 | | | | 4,182,441 | |
| | | | |
Shares redeemed | | | (7,641,018 | ) | | | (122,487,729 | ) | | | (6,173,811 | ) | | | (97,098,245 | ) |
Net increase (decrease) | | | (2,229,872 | ) | | | ($33,657,571 | ) | | | 2,201,813 | | | | $35,765,942 | |
Institutional Class | | | | | | | | | | | | | | | | |
| | | | |
Shares sold | | | 2,188,458 | | | | $36,200,262 | | | | 4,062,893 | | | | $64,306,979 | |
| | | | |
Shares issued through reinvestment of distributions | | | 141,907 | | | | 2,334,298 | | | | 113,134 | | | | 1,780,502 | |
| | | | |
Shares redeemed | | | (4,022,936 | ) | | | (63,108,501 | ) | | | (1,706,106 | ) | | | (26,787,635 | ) |
Net increase (decrease) | | | (1,692,571 | ) | | | ($24,573,941 | ) | | | 2,469,921 | | | | $39,299,846 | |
MATTHEWS ASIA GROWTH FUND | | | | | | | | | | | | | | | | |
| | | | |
Investor Class | | | | | | | | | | | | | | | | |
| | | | |
Shares sold | | | 6,332,050 | | | | $199,075,749 | | | | 4,541,007 | | | | $115,967,177 | |
| | | | |
Shares issued through reinvestment of distributions | | | 841,073 | | | | 31,582,289 | | | | 171,836 | | | | 4,780,476 | |
| | | | |
Shares redeemed | | | (5,251,278 | ) | | | (155,528,257 | ) | | | (7,367,330 | ) | | | (188,876,592 | ) |
Net increase (decrease) | | | 1,921,845 | | | | $75,129,781 | | | | (2,654,487 | ) | | | ($68,128,939 | ) |
Institutional Class | | | | | | | | | | | | | | | | |
| | | | |
Shares sold | | | 11,686,984 | | | | $374,999,073 | | | | 7,619,976 | | | | $196,483,749 | |
| | | | |
Shares issued through reinvestment of distributions | | | 1,035,121 | | | | 39,231,079 | | | | 173,818 | | | | 4,875,584 | |
| | | | |
Shares redeemed | | | (5,490,464 | ) | | | (159,699,273 | ) | | | (3,742,483 | ) | | | (96,806,547 | ) |
Net increase | | | 7,231,641 | | | | $254,530,879 | | | | 4,051,311 | | | | $104,552,786 | |
Notes to Financial Statements (continued)
| | | | | | | | | | | | | | | | |
| | | Year Ended December 31, 2020 | | | Year Ended December 31, 2019 | |
| | | Shares | | | Amount | | | Shares | | | Amount | |
MATTHEWS PACIFIC TIGER FUND | | | | | | | | | | | | | | | | |
| | | | |
Investor Class | | | | | | | | | | | | | | | | |
| | | | |
Shares sold | | | 11,494,193 | | | | $323,117,327 | | | | 14,430,758 | | | | $406,894,363 | |
| | | | |
Shares issued through reinvestment of distributions | | | 4,049,821 | | | | 136,114,507 | | | | 2,845,287 | | | | 81,033,776 | |
| | | | |
Shares redeemed | | | (29,801,297 | ) | | | (804,232,720 | ) | | | (26,486,333 | ) | | | (742,801,344 | ) |
Net (decrease) | | | (14,257,283 | ) | | | ($345,000,886 | ) | | | (9,210,288 | ) | | | ($254,873,205 | ) |
Institutional Class | | | | | | | | | | | | | | | | |
| | | | |
Shares sold | | | 32,673,931 | | | | $930,496,306 | | | | 49,951,152 | | | | $1,407,060,783 | |
| | | | |
Shares issued through reinvestment of distributions | | | 9,489,700 | | | | 318,569,231 | | | | 6,705,677 | | | | 190,776,524 | |
| | | | |
Shares redeemed | | | (80,886,550 | ) | | | (2,156,987,939 | ) | | | (53,091,456 | ) | | | (1,488,158,535 | ) |
Net increase (decrease) | | | (38,722,919 | ) | | | ($907,922,402 | ) | | | 3,565,373 | | | | $109,678,772 | |
MATTHEWS ASIA ESG FUND | | | | | | | | | | | | | | | | |
| | | | |
Investor Class | | | | | | | | | | | | | | | | |
| | | | |
Shares sold | | | 1,158,839 | | | | $13,647,419 | | | | 1,184,049 | | | | $12,826,439 | |
| | | | |
Shares issued through reinvestment of distributions | | | 137,055 | | | | 1,944,810 | | | | 22,962 | | | | 252,585 | |
| | | | |
Shares redeemed | | | (534,956 | ) | | | (5,887,129 | ) | | | (395,976 | ) | | | (4,181,719 | ) |
Net increase | | | 760,938 | | | | $9,705,100 | | | | 811,035 | | | | $8,897,305 | |
Institutional Class | | | | | | | | | | | | | | | | |
| | | | |
Shares sold | | | 926,661 | | | | $10,601,157 | | | | 1,081,878 | | | | $11,684,318 | |
| | | | |
Shares issued through reinvestment of distributions | | | 130,435 | | | | 1,848,265 | | | | 31,337 | | | | 344,077 | |
| | | | |
Shares redeemed | | | (919,166 | ) | | | (9,285,059 | ) | | | (191,932 | ) | | | (2,046,929 | ) |
Net increase | | | 137,930 | | | | $3,164,363 | | | | 921,283 | | | | $9,981,466 | |
MATTHEWS EMERGING ASIA FUND | | | | | | | | | | | | | | | | |
| | | | |
Investor Class | | | | | | | | | | | | | | | | |
| | | | |
Shares sold | | | 1,355,070 | | | | $13,153,567 | | | | 1,977,945 | | | | $25,017,512 | |
| | | | |
Shares issued through reinvestment of distributions | | | 77,283 | | | | 889,530 | | | | 184,599 | | | | 2,200,419 | |
| | | | |
Shares redeemed | | | (3,724,899 | ) | | | (37,271,230 | ) | | | (4,636,314 | ) | | | (57,325,455 | ) |
Net (decrease) | | | (2,292,546 | ) | | | ($23,228,133 | ) | | | (2,473,770 | ) | | | ($30,107,524 | ) |
Institutional Class | | | | | | | | | | | | | | | | |
| | | | |
Shares sold | | | 5,256,576 | | | | $50,319,287 | | | | 10,746,157 | | | | $135,847,255 | |
| | | | |
Shares issued through reinvestment of distributions | | | 217,150 | | | | 2,512,428 | | | | 496,581 | | | | 5,949,041 | |
| | | | |
Shares redeemed | | | (12,750,832 | ) | | | (120,748,631 | ) | | | (12,287,844 | ) | | | (150,800,355 | ) |
Net (decrease) | | | (7,277,106 | ) | | | ($67,916,916 | ) | | | (1,045,106 | ) | | | ($9,004,059 | ) |
MATTHEWS ASIA INNOVATORS FUND | | | | | | | | | | | | | | | | |
| | | | |
Investor Class | | | | | | | | | | | | | | | | |
| | | | |
Shares sold | | | 16,759,785 | | | | $327,955,742 | | | | 3,537,078 | | | | $45,933,297 | |
| | | | |
Shares issued through reinvestment of distributions | | | 382,354 | | | | 9,734,744 | | | | 34,901 | | | | 503,279 | |
| | | | |
Shares redeemed | | | (5,711,686 | ) | | | (102,327,504 | ) | | | (4,901,397 | ) | | | (63,792,703 | ) |
Net increase (decrease) | | | 11,430,453 | | | | $235,362,982 | | | | (1,329,418 | ) | | | ($17,356,127 | ) |
Institutional Class | | | | | | | | | | | | | | | | |
| | | | |
Shares sold | | | 35,927,684 | | | | $638,421,510 | | | | 2,497,746 | | | | $33,297,458 | |
| | | | |
Shares issued through reinvestment of distributions | | | 641,718 | | | | 16,460,072 | | | | 24,526 | | | | 355,872 | |
| | | | |
Shares redeemed | | | (4,565,306 | ) | | | (82,468,729 | ) | | | (1,965,087 | ) | | | (25,479,411 | ) |
Net increase | | | 32,004,096 | | | | $572,412,853 | | | | 557,185 | | | | $8,173,919 | |
MATTHEWS CHINA FUND | | | | | | | | | | | | | | | | |
| | | | |
Investor Class | | | | | | | | | | | | | | | | |
| | | | |
Shares sold | | | 12,452,138 | | | | $271,393,461 | | | | 9,307,763 | | | | $160,049,101 | |
| | | | |
Shares issued through reinvestment of distributions | | | 439,212 | | | | 11,437,067 | | | | 413,049 | | | | 7,823,154 | |
| | | | |
Shares redeemed | | | (14,817,095 | ) | | | (306,488,611 | ) | | | (11,566,339 | ) | | | (197,267,770 | ) |
Net (decrease) | | | (1,925,745 | ) | | | ($23,658,083 | ) | | | (1,845,527 | ) | | | ($29,395,515 | ) |
Institutional Class | | | | | | | | | | | | | | | | |
| | | | |
Shares sold | | | 14,433,258 | | | | $305,009,425 | | | | 8,093,642 | | | | $133,433,967 | |
| | | | |
Shares issued through reinvestment of distributions | | | 150,149 | | | | 3,902,370 | | | | 47,201 | | | | 892,099 | |
| | | | |
Shares redeemed | | | (3,946,034 | ) | | | (82,476,184 | ) | | | (1,765,278 | ) | | | (30,910,184 | ) |
Net increase | | | 10,637,373 | | | | $226,435,611 | | | | 6,375,565 | | | | $103,415,882 | |
| | | | |
| matthewsasia.com | 800.789.ASIA | | | 153 | |
Notes to Financial Statements (continued)
| | | | | | | | | | | | | | | | |
| | | Year Ended December 31, 2020 | | | Year Ended December 31, 2019 | |
| | | Shares | | | Amount | | | Shares | | | Amount | |
MATTHEWS INDIA FUND | | | | | | | | | | | | | | | | |
| | | | |
Investor Class | | | | | | | | | | | | | | | | |
| | | | |
Shares sold | | | 3,731,964 | | | | $77,035,488 | | | | 7,731,394 | | | | $200,765,536 | |
| | | | |
Shares issued through reinvestment of distributions | | | 701,233 | | | | 17,909,487 | | | | 3,684,970 | | | | 85,638,714 | |
| | | | |
Shares redeemed | | | (14,741,778 | ) | | | (293,039,660 | ) | | | (18,554,986 | ) | | | (473,744,143 | ) |
Net (decrease) | | | (10,308,581 | ) | | | ($198,094,685 | ) | | | (7,138,622 | ) | | | ($187,339,893 | ) |
Institutional Class | | | | | | | | | | | | | | | | |
| | | | |
Shares sold | | | 1,492,567 | | | | $31,919,210 | | | | 6,857,047 | | | | $178,913,179 | |
| | | | |
Shares issued through reinvestment of distributions | | | 67,204 | | | | 1,739,240 | | | | 607,390 | | | | 14,279,727 | |
| | | | |
Shares redeemed | | | (5,718,773 | ) | | | (112,099,270 | ) | | | (17,386,942 | ) | | | (457,235,640 | ) |
Net (decrease) | | | (4,159,002 | ) | | | ($78,440,820 | ) | | | (9,922,505 | ) | | | ($264,042,734 | ) |
MATTHEWS JAPAN FUND | | | | | | | | | | | | | | | | |
| | | | |
Investor Class | | | | | | | | | | | | | | | | |
| | | | |
Shares sold | | | 8,852,810 | | | | $182,401,034 | | | | 14,040,067 | | | | $281,660,571 | |
| | | | |
Shares issued through reinvestment of distributions | | | 4,158,146 | | | | 101,541,934 | | | | 5,462,457 | | | | 117,661,321 | |
| | | | |
Shares redeemed | | | (37,589,119 | ) | | | (763,750,870 | ) | | | (43,276,411 | ) | | | (904,215,429 | ) |
Net (decrease) | | | (24,578,163 | ) | | | ($479,807,902 | ) | | | (23,773,887 | ) | | | ($504,893,537 | ) |
Institutional Class | | | | | | | | | | | | | | | | |
| | | | |
Shares sold | | | 7,824,784 | | | | $169,693,016 | | | | 10,666,389 | | | | $222,188,400 | |
| | | | |
Shares issued through reinvestment of distributions | | | 1,657,417 | | | | 40,556,999 | | | | 1,514,104 | | | | 32,674,366 | |
| | | | |
Shares redeemed | | | (26,813,590 | ) | | | (545,838,991 | ) | | | (36,054,972 | ) | | | (745,335,389 | ) |
Net (decrease) | | | (17,331,389 | ) | | | ($335,588,976 | ) | | | (23,874,479 | ) | | | ($490,472,623 | ) |
MATTHEWS KOREA FUND | | | | | | | | | | | | | | | | |
| | | | |
Investor Class | | | | | | | | | | | | | | | | |
| | | | |
Shares sold | | | 5,337,759 | | | | $24,520,467 | | | | 2,059,086 | | | | $9,109,614 | |
| | | | |
Shares issued through reinvestment of distributions | | | 169,261 | | | | 990,180 | | | | 2,084,515 | | | | 8,984,260 | |
| | | | |
Shares redeemed | | | (8,176,532 | ) | | | (36,303,789 | ) | | | (6,006,394 | ) | | | (26,550,755 | ) |
Net (decrease) | | | (2,669,512 | ) | | | ($10,793,142 | ) | | | (1,862,793 | ) | | | ($8,456,881 | ) |
Institutional Class | | | | | | | | | | | | | | | | |
| | | | |
Shares sold | | | 611,636 | | | | $2,752,528 | | | | 3,918,143 | | | | $17,759,942 | |
| | | | |
Shares issued through reinvestment of distributions | | | 16,173 | | | | 95,256 | | | | 393,829 | | | | 1,709,218 | |
| | | | |
Shares redeemed | | | (3,952,334 | ) | | | (16,175,696 | ) | | | (3,210,203 | ) | | | (14,313,984 | ) |
Net increase (decrease) | | | (3,324,525 | ) | | | ($13,327,912 | ) | | | 1,101,769 | | | | $5,155,176 | |
MATTHEWS ASIA SMALL COMPANIES FUND | | | | | | | | | | | | | | | | |
| | | | |
Investor Class | | | | | | | | | | | | | | | | |
| | | | |
Shares sold | | | 912,505 | | | | $17,527,272 | | | | 1,052,343 | | | | $17,606,463 | |
| | | | |
Shares issued through reinvestment of distributions | | | 10,897 | | | | 265,676 | | | | 26,715 | | | | 477,400 | |
| | | | |
Shares redeemed | | | (2,398,390 | ) | | | (43,904,418 | ) | | | (2,952,819 | ) | | | (50,877,217 | ) |
Net (decrease) | | | (1,474,988 | ) | | | ($26,111,470 | ) | | | (1,873,761 | ) | | | ($32,793,354 | ) |
Institutional Class | | | | | | | | | | | | | | | | |
| | | | |
Shares sold | | | 1,801,293 | | | | $34,711,625 | | | | 2,286,863 | | | | $38,931,702 | |
| | | | |
Shares issued through reinvestment of distributions | | | 17,873 | | | | 434,666 | | | | 31,309 | | | | 558,232 | |
| | | | |
Shares redeemed | | | (2,368,411 | ) | | | (44,643,485 | ) | | | (2,456,706 | ) | | | (41,355,074 | ) |
Net (decrease) | | | (549,245 | ) | | | ($9,497,194 | ) | | | (138,534 | ) | | | ($1,865,140 | ) |
MATTHEWS CHINA SMALL COMPANIES FUND | | | | | | | | | | | | | | | | |
| | | | |
Investor Class | | | | | | | | | | | | | | | | |
| | | | |
Shares sold | | | 17,317,321 | | | | $313,524,452 | | | | 2,414,807 | | | | $28,243,922 | |
| | | | |
Shares issued through reinvestment of distributions | | | 2,174,869 | | | | 40,735,303 | | | | 48,885 | | | | 626,223 | |
| | | | |
Shares redeemed | | | (10,047,670 | ) | | | (187,020,006 | ) | | | (1,880,948 | ) | | | (20,832,077 | ) |
Net increase | | | 9,444,520 | | | | $167,239,749 | | | | 582,744 | | | | $8,038,068 | |
Institutional Class | | | | | | | | | | | | | | | | |
| | | | |
Shares sold | | | 8,861,679 | | | | $147,262,680 | | | | 1,234,398 | | | | $13,977,800 | |
| | | | |
Shares issued through reinvestment of distributions | | | 733,518 | | | | 13,768,124 | | | | 25,389 | | | | 325,995 | |
| | | | |
Shares redeemed | | | (7,186,555 | ) | | | (143,114,672 | ) | | | (904,930 | ) | | | (10,177,325 | ) |
Net increase | | | 2,408,642 | | | | $17,916,132 | | | | 354,857 | | | | $4,126,470 | |
Notes to Financial Statements (continued)
| 5. | INVESTMENT ADVISORY FEES AND OTHER TRANSACTIONS WITH AFFILIATES |
Matthews, a registered investment advisor under the 1940 Act, provides the Funds with investment management services. Pursuant to the prior Investment Advisory Agreement dated August 13, 2004, as amended (the “Prior Advisory Agreement”) and the current Investment Advisory Agreement dated February 1, 2016, as amended (the “Current Advisory Agreement,” and together with the Prior Advisory Agreement, the “Advisory Agreement”), the Funds pay Matthews (i) for management and advisory services; and (ii) for certain administrative services, an annual fee as a percentage of average daily net assets. Under the Advisory Agreement each of the Funds, other than Matthews Asia Total Return Bond Fund, Matthews Asia Credit Opportunities Fund, Matthews Emerging Asia Fund, Matthews Asia Small Companies Fund, and Matthews China Small Companies Fund (the “Family-Priced Funds”), pays Matthews 0.75% of their aggregate average daily net assets up to $2 billion, 0.6834% of their aggregate average daily net assets over $2 billion up to $5 billion, 0.65% of their aggregate average daily net assets over $5 billion up to $25 billion, 0.64% of their aggregate average daily net assets over $25 billion up to $30 billion, 0.63% of their aggregate average daily net assets over $30 billion up to $35 billion, 0.62% of their aggregate average daily net assets over $35 billion up to $40 billion, 0.61% of their aggregate average daily net assets over $40 billion up to $45 billion, and 0.60% of their aggregate average daily net assets over $45 billion. Each of the Matthews Asia Total Return Bond Fund and Matthews Asia Credit Opportunities Fund paid Matthews an annual fee of 0.55% of such Fund’s annual average daily net assets pursuant to the Advisory Agreement. Each of the Matthews Emerging Asia Fund, Matthews Asia Small Companies Fund, and the Matthews China Small Companies Fund pays Matthews an annual fee of 1.00% of the average daily net assets of such Fund up to $1 billion and 0.95% of the average daily net assets of such Fund over $1 billion pursuant to the Advisory Agreement. Each Fund pays Matthews a monthly fee at the annual rate using the applicable management fee calculated based on the actual number of days of that month and based on the Fund’s average daily net asset value for the month.
Pursuant to a fee waiver letter agreement, effective as of September 1, 2014, between the Trust, on behalf of the Family-Priced Funds, and Matthews (as amended from time to time, the “Fee Waiver Agreement”), for each Family-Priced Fund, Matthews has agreed to waive a portion of the fee payable under the Advisory Agreement and a portion of the fee payable under the Administration and Shareholder Services Agreement, if any Family-Priced Fund’s average daily net assets are over $3 billion, as follows: for every $2.5 billion average daily net assets of a Family-Priced Fund that are over $3 billion, the fee rates that otherwise would be applied for calculating fees payable under the Advisory Agreement and the Administration and Shareholder Services Agreement for such Family-Priced Fund with respect to such excess average daily net assets will be each reduced by 0.01%, in each case without reducing such fee rate below 0.00%.
Investment advisory fees charged, waived fees and reimbursed additional expenses for the year ended December 31, 2020, were as follows:
| | | | | | | | | | | | |
| | | Gross Advisory Fees | | | Advisory Fees
Waived and
Expenses Waived or
Reimbursed in
Excess of the
Expense Limitation | | | Net Advisory Fee/
(Net Reimbursement) | |
| Matthews Emerging Markets Equity Fund | | | $88,411 | | | | ($231,409 | ) | | | ($142,998 | ) |
| Matthews Asia Total Return Bond Fund | | | 596,035 | | | | (79,780 | ) | | | 516,255 | |
| Matthews Asia Credit Opportunities Fund | | | 511,917 | | | | (62,980 | ) | | | 448,937 | |
| Matthews Asian Growth and Income Fund | | | 8,900,674 | | | | — | | | | 8,900,674 | |
| Matthews Asia Dividend Fund | | | 28,948,556 | | | | (134,924 | ) | | | 28,813,632 | |
| Matthews China Dividend Fund | | | 2,257,142 | | | | — | | | | 2,257,142 | |
| Matthews Asia Growth Fund | | | 8,959,032 | | | | — | | | | 8,959,032 | |
| Matthews Pacific Tiger Fund | | | 49,413,522 | | | | (648,059 | ) | | | 48,765,463 | |
| Matthews Asia ESG Fund | | | 396,225 | | | | (40,676 | ) | | | 355,549 | |
| Matthews Emerging Asia Fund | | | 1,966,515 | | | | (801,181 | ) | | | 1,165,334 | |
| Matthews Asia Innovators Fund | | | 5,427,554 | | | | — | | | | 5,427,554 | |
| Matthews China Fund | | | 7,375,807 | | | | — | | | | 7,375,807 | |
| Matthews India Fund | | | 4,415,150 | | | | — | | | | 4,415,150 | |
| Matthews Japan Fund | | | 10,928,444 | | | | — | | | | 10,928,444 | |
| Matthews Korea Fund | | | 786,229 | | | | — | | �� | | 786,229 | |
| Matthews Asia Small Companies Fund | | | 1,697,281 | | | | (378,868 | ) | | | 1,318,413 | |
| Matthews China Small Companies Fund | | | 2,880,688 | | | | (362,019 | ) | | | 2,518,669 | |
Under a written agreement between the Funds and Matthews (the “Operating Expense Agreement”), Matthews agrees to waive fees and reimburse expenses to a Fund if its expense ratio exceeds a certain percentage level. Effective April 30, 2020 for all Funds, except the Matthews Emerging Markets Equity Fund, the Matthews Asia Total Return Bond Fund and the Matthews Asia Credit Opportunities Fund, this level is 1.20% for the Institutional Class. Prior to April 30, 2020, Matthews had agreed to voluntarily reduce the expense limitation to 1.20% for the Institutional Class beginning on November 1, 2019. Matthews agrees to reduce the expense ratio by waiving an equal amount of non-class specific expenses (e.g., custody fees) for the Investor Class. Effective December 1, 2020 for the Matthews Emerging Asia Fund, Matthews voluntarily reduced this expense limitation to 1.10% for the Institutional Class and waived a corresponding amount (in annual percentage terms) for the Investor Class. Because certain expenses of the Investor Class may be higher than those of the Institutional Class and because class specific expenses may be waived solely for the Institutional Class, total annual Fund expenses for the Investor Class may exceed 1.20%. For the Matthews Emerging Markets Equity Fund, the Matthews Asia Total Return Bond Fund and the Matthews Asia Credit Opportunities Fund this level is 0.90% for the Institutional Class. Matthews agrees to reduce the expense ratio by waiving an equal amount of non-class specific expenses (e.g., custody fees) for the Investor Class. Because certain expenses of the Investor Class may be higher than those of the Institutional Class and because class specific expenses may be waived solely for the Institutional Class, total annual Fund expenses for the Investor Class may exceed 0.90%. In turn, if the expenses of a Fund, other than the Matthews Asia Total Return Bond Fund and the Matthews Asia Credit Opportunities Fund, fall below the level noted within three years after Matthews has made such a reimbursement, the Fund may reimburse Matthews up to an amount of the recoupment available not to exceed the lesser of (i) the expense limitation applicable at the time of that fee waiver and/or expense reimbursement or (ii) the expense limitation in effect at the time of recoupment. For the Matthews Asia Total Return Bond Fund and the Matthews Asia Credit Opportunities Fund, any amount waived for prior fiscal years is not subject to recoupment. This agreement will continue through April 30, 2021, may be extended for additional periods not exceeding one year, and may be terminated at any time by the Board of Trustees on behalf of the Fund on 60 days’ written notice to Matthews. Matthews may decline to renew this agreement by written notice to the Trust at least 30 days before its annual expiration date.
| | | | |
| matthewsasia.com | 800.789.ASIA | | | 155 | |
Notes to Financial Statements (continued)
Waived Fees Subject to Possible Future Recoupment:
On December 31, 2020, the amounts expired and subject to possible future recoupment under the expense limitation agreement are as follows:
| | | | | | | | | | | | | | | | | | | | |
| | | Expired December 31, | | | | | | Expiring December 31, | |
| | | 2020 | | | | | | 2021 | | | 2022 | | | 2023 | |
| Matthews Emerging Markets Equity Fund | | | $— | | | | | | | | $— | | | | $— | | | | $231,409 | |
| Matthews Asia ESG Fund | | | 156,429 | | | | | | | | 156,459 | | | | 67,253 | | | | 40,676 | |
| Matthews Emerging Asia Fund | | | 878,171 | | | | | | | | 1,073,964 | | | | 997,574 | | | | 801,181 | |
| Matthews Asia Small Companies Fund | | | 272,597 | | | | | | | | 308,001 | | | | 336,966 | | | | 378,868 | |
| Matthews China Small Companies Fund | | | 184,162 | | | | | | | | 275,220 | | | | 167,178 | | | | 362,019 | |
The Funds have an Administration and Shareholder Services Agreement dated August 13, 2004, as amended (the “Shareholder Services Agreement” or “Services Agreement”), in which the Funds pay an annual administration and shareholder servicing fee to Matthews, as a percentage of the average daily net assets of each Fund in aggregate, computed and prorated on a daily basis. Under the Shareholder Services Agreement, the Funds in the aggregate pay Matthews 0.25% of their aggregate average daily net assets up to $2 billion, 0.1834% of their aggregate average daily net assets over $2 billion up to $5 billion, 0.15% of their aggregate average daily net assets over $5 billion up to $7.5 billion, 0.125% of their aggregate average daily net assets over $7.5 billion up to $15 billion, 0.11% of their aggregate average daily net assets over $15 billion up to $22.5 billion, 0.10% of their aggregate average daily net assets over $22.5 billion up to $25 billion, 0.09% of their aggregate average daily net assets over $25 billion up to $30 billion, 0.08% of their aggregate average daily net assets over $30 billion up to $35 billion, 0.07% of their aggregate average daily net assets over $35 billion up to $40 billion, 0.06% of their aggregate average daily net assets over $40 billion up to $45 billion, and 0.05% of their aggregate average daily net assets over $45 billion.
Administration and shareholder servicing fees charged, for the year ended December 31, 2020, were as follows:
| | | | | | | | | | | | |
| | | Gross
Administration and
Shareholder
Servicing Fees | | | Administration and
Shareholder
Servicing Fees
Waived in Excess of
Expense Limitation | | | Net
Administration and
Shareholder
Servicing Fees | |
| Matthews Emerging Markets Equity Fund | | | $19,089 | | | | $— | | | | $19,089 | |
| Matthews Asia Total Return Bond Fund | | | 157,891 | | | | — | | | | 157,891 | |
| Matthews Asia Credit Opportunities Fund | | | 135,783 | | | | — | | | | 135,783 | |
| Matthews Asian Growth and Income Fund | | | 1,947,630 | | | | — | | | | 1,947,630 | |
| Matthews Asia Dividend Fund | | | 6,325,613 | | | | (134,924 | ) | | | 6,190,689 | |
| Matthews China Dividend Fund | | | 493,764 | | | | — | | | | 493,764 | |
| Matthews Asia Growth Fund | | | 1,955,912 | | | | — | | | | 1,955,912 | |
| Matthews Pacific Tiger Fund | | | 10,799,024 | | | | (648,059 | ) | | | 10,150,965 | |
| Matthews Asia ESG Fund | | | 86,489 | | | | — | | | | 86,489 | |
| Matthews Emerging Asia Fund | | | 285,929 | | | | — | | | | 285,929 | |
| Matthews Asia Innovators Fund | | | 1,181,104 | | | | — | | | | 1,181,104 | |
| Matthews China Fund | | | 1,611,615 | | | | — | | | | 1,611,615 | |
| Matthews India Fund | | | 964,516 | | | | — | | | | 964,516 | |
| Matthews Japan Fund | | | 2,392,640 | | | | — | | | | 2,392,640 | |
| Matthews Korea Fund | | | 171,771 | | | | — | | | | 171,771 | |
| Matthews Asia Small Companies Fund | | | 247,096 | | | | — | | | | 247,096 | |
| Matthews China Small Companies Fund | | | 419,631 | | | | — | | | | 419,631 | |
In addition to the fees paid to the Funds’ transfer agent, the Funds bear the cost of fees paid to certain service providers or intermediaries, including supermarkets, which provide transfer agency, record-keeping and shareholder servicing to certain shareholders. These fees are referred to as intermediary service fees on the Statements of Assets and Liabilities as well as the Statements of Operations. Additional information concerning these services and fees is contained in the Funds’ prospectuses.
BNY Mellon Investment Servicing (US) Inc. (“BNY Mellon”), an indirect wholly owned subsidiary of The Bank of New York Mellon Corporation, serves as the Funds’ administrator, and in that capacity, performs various administrative and accounting services for each Fund. BNY Mellon also serves as the Funds’ transfer agent, dividend disbursing agent and registrar. An officer of BNY Mellon serves as Assistant Treasurer to the Funds. Total fees incurred by the Funds for administration and accounting services for the year ended December 31, 2020 were as follows:
| | | | |
| | | Administration and
Accounting fees | |
| Matthews Emerging Markets Equity Fund | | | $1,064 | |
| Matthews Asia Total Return Bond Fund | | | 8,670 | |
| Matthews Asia Credit Opportunities Fund | | | 7,446 | |
| Matthews Asian Growth and Income Fund | | | 106,962 | |
| Matthews Asia Dividend Fund | | | 347,938 | |
| Matthews China Dividend Fund | | | 27,125 | |
| Matthews Asia Growth Fund | | | 107,687 | |
| Matthews Pacific Tiger Fund | | | 593,894 | |
| Matthews Asia ESG Fund | | | 4,763 | |
Notes to Financial Statements (continued)
| | | | |
| | | Administration and
Accounting fees | |
| Matthews Emerging Asia Fund | | | $15,732 | |
| Matthews Asia Innovators Fund | | | 65,258 | |
| Matthews China Fund | | | 88,649 | |
| Matthews India Fund | | | 53,069 | |
| Matthews Japan Fund | | | 131,327 | |
| Matthews Korea Fund | | | 9,450 | |
| Matthews Asia Small Companies Fund | | | 13,578 | |
| Matthews China Small Companies Fund | | | 23,046 | |
As of December 31, 2020, Matthews and its affiliates held significant shares in the Funds as follows:
| | | | | | | | |
| | | Shares held by Matthews
and its Affiliates | | | Percentage of
Outstanding Shares | |
| Matthews Emerging Markets Equity Fund | | | 620,331 | | | | 22% | |
| Matthews Asia Credit Opportunities Fund | | | 876,880 | | | | 10% | |
| Matthews Asia ESG Fund | | | 1,050,642 | | | | 18% | |
Certain officers and Trustees of the Funds are also officers and directors of Matthews. All officers serve without compensation from the Funds. The Funds paid the Independent Trustees $1,109,740 in aggregate for regular compensation during the year ended December 31, 2020.
The value of investment transactions made for affiliated and unaffiliated holdings for the year ended December 31, 2020 were as follows:
| | | | | | | | | | | | | | | | |
| | | Affiliated Purchases | | | Proceeds from
Affiliated Sales | | | Unaffiliated
Purchases | | | Proceeds from
Unaffiliated Sales | |
| Matthews Emerging Markets Equity Fund | | | $— | | | | $— | | | | $46,036,835 | | | | $11,646,928 | |
| Matthews Asia Total Return Bond Fund | | | — | | | | — | | | | 40,741,724 | | | | 47,766,774 | |
| Matthews Asia Credit Opportunities Fund | | | — | | | | — | | | | 43,161,838 | | | | 39,256,943 | |
| Matthews Asian Growth and Income Fund | | | — | | | | — | | | | 468,649,264 | | | | 631,633,741 | |
| Matthews Asia Dividend Fund | | | 2,837,881 | | | | 38,122,537 | | | | 1,630,584,215 | | | | 2,857,688,490 | |
| Matthews China Dividend Fund | | | — | | | | — | | | | 267,015,693 | | | | 327,690,467 | |
| Matthews Asia Growth Fund | | | — | | | | — | | | | 706,549,644 | | | | 555,318,350 | |
| Matthews Pacific Tiger Fund | | | — | | | | — | | | | 2,793,332,591 | | | | 4,607,081,501 | |
| Matthews Asia ESG Fund | | | — | | | | — | | | | 57,552,869 | | | | 50,507,089 | |
| Matthews Emerging Asia Fund | | | — | | | | — | | | | 56,663,769 | | | | 154,181,589 | |
| Matthews Asia Innovators Fund | | | — | | | | — | | | | 1,665,434,621 | | | | 954,382,308 | |
| Matthews China Fund | | | — | | | | — | | | | 752,761,014 | | | | 566,906,289 | |
| Matthews India Fund | | | — | | | | — | | | | 383,426,758 | | | | 673,968,570 | |
| Matthews Japan Fund | | | — | | | | — | | | | 981,836,744 | | | | 1,913,598,704 | |
| Matthews Korea Fund | | | — | | | | — | | | | 45,541,918 | | | | 70,371,066 | |
| Matthews Asia Small Companies Fund | | | — | | | | — | | | | 182,054,165 | | | | 210,625,453 | |
| Matthews China Small Companies Fund | | | — | | | | — | | | | 531,188,456 | | | | 401,641,796 | |
| 7. | HOLDINGS OF 5% VOTING SHARES OF PORTFOLIO COMPANIES |
The 1940 Act defines “affiliated companies” to include investments in portfolio companies in which a fund owns 5% or more of the outstanding voting shares. During the year ended December 31, 2020, the Funds below held 5% or more of the outstanding voting shares of the noted portfolio companies. During this period, other Funds in the Trust may also have held voting shares of the issuers at levels below 5%.
Investments in affiliates:
A summary of transactions in securities of issuers affiliated with a Fund for the year ended December 31, 2020 is as follows:
| | | | | | | | | | | | | | | | | | | | | | | | | | | | | | | | |
| | | Value at
Dec. 31, 2019 | | | Purchases | | | Sales | | | Net Realized
Gain (Loss)
Jan. 1, 2020–
Dec. 31, 2020 | | | Net Change in
Unrealized
Appreciation
(Depreciation) | | | Value at
Dec. 31, 2020 | | | Shares
Dec. 31, 2020 | | | Dividend Income Jan. 1, 2020– Dec. 31, 2020 | |
| | | | | | | |
| MATTHEWS ASIA DIVIDEND FUND | | | | | | | | | | | | | | | | | | | | | | | | | | | | | |
| | | | | | | | |
| Name of Issuer: | | | | | | | | | | | | | | | | | | | | | | | | | | | | | | | | |
| | | | | | | | |
Anritsu Corp.† | | | $164,799,203 | | | | $ — | | | | $55,129,579 | | | | $30,302,846 | | | | ($18,051,257 | ) | | | $ — | | | | — | | | | $2,023,412 | |
BELLSYSTEM24 Holdings, Inc. | | | 87,951,535 | | | | — | | | | 6,879,993 | | | | (1,791,027 | ) | | | (90,756 | ) | | | 79,189,759 | | | | 5,045,500 | | | | 2,020,057 | |
Breville Group, Ltd. | | | 96,607,872 | | | | — | | | | 3,947,919 | | | | 1,725,889 | | | | 54,498,824 | | | | 148,884,666 | | | | 7,564,257 | | | | 2,160,462 | |
China Steel Chemical Corp.† | | | 58,070,775 | | | | — | | | | 48,274,052 | | | | (23,275,873 | ) | | | 13,479,150 | | | | — | | | | — | | | | 649,364 | |
Eiken Chemical Co., Ltd.† | | | 67,587,182 | | | | — | | | | 63,144,440 | | | | (16,403,538 | ) | | | 11,960,796 | | | | — | | | | — | | | | 473,876 | |
KATITAS Co., Ltd. | | | 92,256,441 | | | | 2,542,270 | †† | | | 3,150,744 | | | | 760,288 | | | | 42,691,649 | | | | 135,099,904 | | | | 4,186,900 | | | | 1,060,556 | |
Minda Industries, Ltd. | | | 71,216,192 | | | | 295,611 | †† | | | 3,848,324 | | | | 504,104 | | | | 6,375,435 | | | | 74,543,018 | | | | 13,619,268 | | | | 79,287 | |
Minth Group, Ltd. | | | 238,203,085 | | | | — | | | | 19,551,577 | | | | 10,979,532 | | | | 94,438,870 | | | | 324,069,910 | | | | 61,253,000 | | | | 5,636,386 | |
Yuexiu Transport Infrastructure, Ltd. | | | 84,277,091 | | | | — | | | | 743,980 | | | | 277,715 | | | | (19,806,750 | ) | | | 64,004,076 | | | | 93,902,000 | | | | 2,544,113 | |
| | | | | | | | | | | | | | | | | | | | | | | | |
Total Affiliates | | | | | | | | | | | | | | | $3,079,936 | | | | $185,495,961 | | | | $825,791,333 | | | | | | | | $16,647,513 | |
| | | | | | | | | | | | | | | | | | | | | | | | |
| | | | |
| matthewsasia.com | 800.789.ASIA | | | 157 | |
Notes to Financial Statements (continued)
| | | | | | | | | | | | | | | | | | | | | | | | | | | | | | | | |
| | | Value at
Dec. 31, 2019 | | | Purchases | | | Sales | | | Net Realized
Gain (Loss)
Jan. 1, 2020–
Dec. 31, 2020 | | | Net Change in
Unrealized
Appreciation
(Depreciation) | | | Value at
Dec. 31, 2020 | | | Shares
Dec. 31, 2020 | | | Dividend Income Jan. 1, 2020– Dec. 31, 2020 | |
| | | | | | | |
| MATTHEWS ASIA GROWTH FUND | | | | | | | | | | | | | | | | | | | | | | | | | | | | | |
| | | | | | | | |
| Name of Issuer: | | | | | | | | | | | | | | | | | | | | | | | | | | | | | | | | |
| | | | | | | | |
Rozetta Corp.† | | | $18,601,381 | | | | $— | | | | $11,551,303 | | | | ($6,338,554 | ) | | | ($711,524 | ) | | | $— | | | | — | | | | $— | |
Sampath Bank PLC† | | | 19,610,214 | | | | — | | | | 5,249,643 | | | | (6,407,426 | ) | | | 1,654,840 | | | | — | | | | — | | | | 1,018,954 | |
| | | | | | | | | | | | | | | | | | | | | | | | |
Total Affiliates | | | | | | | | | | | | | | | ($12,745,980) | | | | $943,316 | | | | $— | | | | | | | | $1,018,954 | |
| | | | | | | | | | | | | | | | | | | | | | | | |
| | | | | | | |
| MATTHEWS PACIFIC TIGER FUND | | | | | | | | | | | | | | | | | | | | | | | | | | | | | |
| | | | | | | | |
| Name of Issuer: | | | | | | | | | | | | | | | | | | | | | | | | | | | | | | | | |
| | | | | | | | |
DKSH Holding AG† | | | $219,652,228 | | | | $— | | | | $247,193,456 | | | | ($40,131,262 | ) | | | $67,672,491 | | | | $— | | | | — | | | | $3,885,186 | |
Fuyao Glass Industry Group Co., Ltd. H Shares† | | | 150,920,324 | | | | — | | | | 108,734,391 | | | | 11,942,321 | | | | 10,256,574 | | | | — | | | | — | | | | 2,666,816 | |
Guotai Junan Securities Co., Ltd. H Shares† | | | 145,823,286 | | | | — | | | | 120,619,098 | | | | (58,158,513 | ) | | | 32,954,325 | | | | — | | | | — | | | | 3,641,895 | |
Orion Holdings Corp.† | | | 86,931,374 | | | | — | | | | 62,047,221 | | | | (182,118,564 | ) | | | 157,234,411 | | | | — | | | | — | | | | — | |
Tata Power Co., Ltd.† | | | 142,780,167 | | | | — | | | | 11,881,993 | | | | (38,413,561 | ) | | | 71,458,400 | | | | — | | | | — | | | | 3,407,567 | |
| | | | | | | | | | | | | | | | | | | | | | | | |
Total Affiliates | | | | | | | | | | | | | | | ($306,879,579) | | | | $339,576,201 | | | | $— | | | | | | | | $13,601,464 | |
| | | | | | | | | | | | | | | | | | | | | | | | |
| | | | | | | |
| MATTHEWS EMERGING ASIA FUND | | | | | | | | | | | | | | | | | | | | | | | | | | | | | |
| | | | | | | | |
| Name of Issuer: | | | | | | | | | | | | | | | | | | | | | | | | | | | | | | | | |
| | | | | | | | |
PAK Suzuki Motor Co., Ltd.† | | | $7,778,239 | | | | $— | | | | $1,991,545 | | | | ($6,037,981 | ) | | | $5,326,093 | | | | $— | | | | — | | | | $— | |
Vietnam National Seed Group JSC† | | | 4,375,315 | | | | — | | | | 3,293,698 | | | | (639,341 | ) | | | (442,276 | ) | | | — | | | | — | | | | — | |
| | | | | | | | | | | | | | | | | | | | | | | | |
Total Affiliates | | | | | | | | | | | | | | | ($6,677,322 | ) | | | $4,883,817 | | | | $— | | | | | | | | $— | |
| | | | | | | | | | | | | | | | | | | | | | | | |
| | | | | | | |
| MATTHEWS INDIA FUND | | | | | | | | | | | | | | | | | | | | | | | | | | | | | |
| | | | | | | | |
| Name of Issuer: | | | | | | | | | | | | | | | | | | | | | | | | | | | | | | | | |
| | | | | | | | |
VST Industries, Ltd.† | | | $48,471,387 | | | | — | | | | $22,235,967 | | | | $9,190,775 | | | | ($17,867,496 | ) | | | $— | | | | — | | | | $680,966 | |
| | | | | | | | | | | | | | | | | | | | | | | | |
Total Affiliates | | | | | | | | | | | | | | | $9,190,775 | | | | ($17,867,496 | ) | | | $— | | | | | | | | $680,966 | |
| | | | | | | | | | | | | | | | | | | | | | | | |
| † | Issuer was not an affiliated company as of December 31, 2020. |
| †† | Includes equity offering and stock dividend during the period. |
It is the policy of the Funds to comply with all requirements of the Internal Revenue Code of 1986, as amended (“the Code”), applicable to regulated investment companies and to distribute substantially all of their taxable income to their shareholders. The Funds have met the requirements of the Code applicable to regulated investment companies for the year ended December 31, 2020. Therefore, no federal income tax provision is required.
Management has analyzed the Funds’ tax positions taken on federal income tax returns for all open tax years (current and prior three tax years), and has concluded that no provision for federal income tax is required in the Funds’ financial statements. The Funds’ federal and state income and federal excise tax returns for tax years for which the applicable statutes of limitations have not expired are subject to examination by the Internal Revenue Service and state departments of revenue.
As of December 31, 2020, the components of accumulated earnings/deficit on tax basis were as follows:
| | | | | | | | | | | | |
| | | Undistributed
Ordinary Income | | | Undistributed
Long-Term
Capital Gains | | | Capital Loss
Carryforwards | |
| Matthews Emerging Markets Equity Fund | | | $ 811,325 | | | | $ — | | | | $ — | |
| Matthews Asia Total Return Bond Fund | | | 213,010 | | | | — | | | | (2,010,677 | ) |
| Matthews Asia Credit Opportunities Fund | | | 240,577 | | | | — | | | | (2,459,194 | ) |
| Matthews Asian Growth and Income Fund | | | 3,940,181 | | | | — | | | | (24,031,922 | ) |
| Matthews Asia Dividend Fund | | | 20,010,000 | | | | 35,767,994 | | | | — | |
| Matthews China Dividend Fund | | | 1,532,371 | | | | — | | | | (4,675,538 | ) |
| Matthews Asia Growth Fund | | | 26,665,170 | | | | 16,872,519 | | | | — | |
| Matthews Pacific Tiger Fund | | | 24,527,644 | | | | 354,104,228 | | | | — | |
| Matthews Asia ESG Fund | | | 683,012 | | | | 317,352 | | | | — | |
| Matthews Emerging Asia Fund | | | 1,988,171 | | | | — | | | | (92,267,599 | ) |
| Matthews Asia Innovators Fund | | | 70,648,640 | | | | 27,155,008 | | | | — | |
| Matthews China Fund | | | 37,519,561 | | | | 10,044,226 | | | | — | |
| Matthews India Fund | | | — | | | | — | | | | (12,607,260 | ) |
| Matthews Japan Fund | | | 1,848,353 | | | | 43,023,810 | | | | — | |
| Matthews Korea Fund | | | 444,906 | | | | — | | | | (7,494,179 | ) |
| Matthews Asia Small Companies Fund | | | 284,010 | | | | — | | | | (4,292,103 | ) |
| Matthews China Small Companies Fund | | | 5,076,626 | | | | 2,815,707 | | | | — | |
Notes to Financial Statements (continued)
| | | | | | | | | | | | | | | | |
| | | Late Year
Losses* | | | Other Temporary
Differences | | | Unrealized
Appreciation
(Depreciation)** | | | Total Accumulated
Earnings/(Deficit) | |
| Matthews Emerging Markets Equity Fund | | | $— | | | | $— | | | | $6,854,654 | | | | $ 7,665,979 | |
| Matthews Asia Total Return Bond Fund | | | — | | | | — | | | | 4,546,579 | | | | 2,748,912 | |
| Matthews Asia Credit Opportunities Fund | | | — | | | | — | | | | 618,818 | | | | (1,599,799 | ) |
| Matthews Asian Growth and Income Fund | | | — | | | | — | | | | 373,683,236 | | | | 353,591,495 | |
| Matthews Asia Dividend Fund | | | — | | | | — | | | | 1,832,512,464 | | | | 1,888,290,458 | |
| Matthews China Dividend Fund | | | — | | | | — | | | | 83,082,543 | | | | 79,939,376 | |
| Matthews Asia Growth Fund | | | — | | | | — | | | | 779,511,076 | | | | 823,048,765 | |
| Matthews Pacific Tiger Fund | | | — | | | | — | | | | 3,698,673,368 | | | | 4,077,305,240 | |
| Matthews Asia ESG Fund | | | — | | | | — | | | | 22,280,241 | | | | 23,280,605 | |
| Matthews Emerging Asia Fund | | | — | | | | — | | | | 14,176,370 | | | | (76,103,058 | ) |
| Matthews Asia Innovators Fund | | | — | | | | — | | | | 580,241,484 | | | | 678,045,132 | |
| Matthews China Fund | | | — | | | | — | | | | 431,966,753 | | | | 479,530,540 | |
| Matthews India Fund | | | 1,611,640 | | | | — | | | | 157,418,460 | | | | 146,422,840 | |
| Matthews Japan Fund | | | — | | | | — | | | | 488,105,969 | | | | 532,978,132 | |
| Matthews Korea Fund | | | — | | | | — | | | | 58,927,975 | | | | 51,878,702 | |
| Matthews Asia Small Companies Fund | | | — | | | | — | | | | 63,824,272 | | | | 59,816,179 | |
| Matthews China Small Companies Fund | | | — | | | | — | | | | 84,728,412 | | | | 92,620,745 | |
| * | The Funds have elected to defer certain qualified late-year losses and recognize such losses in the next fiscal year. |
| ** | The differences between book-basis and tax-basis unrealized appreciation/depreciation is attributable primarily to the tax deferral of losses on wash sales and passive foreign investment company (PFIC) mark to market adjustments. |
As of December 31, 2020, the Funds have capital loss carryforwards available to offset future realized capital gains through the indicated expiration dates as follows:
| | | | | | | | | | | | |
| | | Amount With No Expiration | | | | |
| | | Short-term
Losses | | | Long-term
Losses | | | Total | |
| Matthews Asia Total Return Bond Fund | | | $1,879,869 | | | | $ 130,808 | | | | $2,010,677 | |
| Matthews Asia Credit Opportunities Fund | | | 1,503,334 | | | | 955,860 | | | | 2,459,194 | |
| Matthews Asian Growth and Income Fund | | | — | | | | 24,031,922 | | | | 24,031,922 | |
| Matthews China Dividend Fund | | | 2,259,438 | | | | 2,416,100 | | | | 4,675,538 | |
| Matthews Emerging Asia Fund | | | 659,043 | | | | 91,608,556 | | | | 92,267,599 | |
| Matthews India Fund | | | — | | | | 12,607,260 | | | | 12,607,260 | |
| Matthews Korea Fund | | | 1,420,024 | | | | 6,074,155 | | | | 7,494,179 | |
| Matthews Asia Small Companies Fund | | | — | | | | 4,292,103 | | | | 4,292,103 | |
The following Funds utilized capital loss carryforwards in the current year:
| | | | |
| | | Utilized
Capital Loss
Carryforwards | |
| Matthews Asia Dividend Fund | | | $82,955,984 | |
| Matthews China Fund | | | 24,326,229 | |
| Matthews China Small Companies Fund | | | 453,542 | |
Under the Regulated Investment Company Modernization Act of 2010, the Funds are permitted to carry forward capital losses incurred in taxable years beginning after December 22, 2010 for an unlimited period. However, any losses incurred during those future taxable years will be required to be utilized prior to any losses incurred in pre-enactment taxable years, which generally expire after eight years from when they are incurred. Additionally, post-enactment capital losses that are carried forward will retain their character as either short-term or long-term capital losses rather than being considered all short-term as under previous law.
U.S. GAAP requires that certain components of net assets be reclassified between financial and tax reporting. These reclassifications have no effect on net assets or NAV. The permanent differences are primarily attributable to investments in PFICs, non-deductible expenses, foreign currency reclassification, NOL (net operating loss) adjustments, capital gains tax, distributions in excess of current earnings and profits, re-characterization of distributions, investment in swaps, adjustments on distributions related to taxable spinoffs and the utilization of accumulated earnings and profits distributed to shareholders on redemptions of shares as part of the dividends paid deduction for income tax purposes. For the year ended
| | | | |
| matthewsasia.com | 800.789.ASIA | | | 159 | |
Notes to Financial Statements (continued)
December 31, 2020, permanent differences in book and tax accounting have been reclassified to paid-in capital, undistributed net investment income (loss) and accumulated realized gain (loss) as follows:
| | | | | | | | |
| | | Increase/
(Decrease)
Capital paid-in | | | Increase/
(Decrease)
Total Distributable
Earnings/
(Accumulated Loss) | |
| Matthews Emerging Markets Equity Fund | | | $ 27,939 | | | | $ (27,939) | |
| Matthews Asia Total Return Bond Fund | | | — | | | | — | |
| Matthews Asia Credit Opportunities Fund | | | — | | | | — | |
| Matthews Asian Growth and Income Fund | | | — | | | | — | |
| Matthews Asia Dividend Fund | | | — | | | | — | |
| Matthews China Dividend Fund | | | — | | | | — | |
| Matthews Asia Growth Fund | | | 7,557,524 | | | | (7,557,524 | ) |
| Matthews Pacific Tiger Fund | | | 40,647,963 | | | | (40,647,963 | ) |
| Matthews Asia ESG Fund | | | 293,638 | | | | (293,638 | ) |
| Matthews Emerging Asia Fund | | | — | | | | — | |
| Matthews Asia Innovators Fund | | | 2,939,588 | | | | (2,939,588 | ) |
| Matthews China Fund | | | 2,827,341 | | | | (2,827,341 | ) |
| Matthews India Fund | | | (1,878,668 | ) | | | 1,878,668 | |
| Matthews Japan Fund | | | 19,003,275 | | | | (19,003,275 | ) |
| Matthews Korea Fund | | | — | | | | — | |
| Matthews Asia Small Companies Fund | | | — | | | | — | |
| Matthews China Small Companies Fund | | | 20,433,671 | | | | (20,433,671 | ) |
As of December 31, 2020, the tax cost of investments, including derivatives, and the related net unrealized appreciation and depreciation were as follows:
| | | | | | | | | | | | | | | | |
| | | Tax Cost | | | Gross
Unrealized
Appreciation | | | Gross
Unrealized
Depreciation | | | Net Unrealized
Appreciation
(Depreciation) | |
| Matthews Emerging Markets Equity Fund | | | $ 36,069,615 | | | | $ 7,573,335 | | | | $ (649,796) | | | | $ 6,923,539 | |
| Matthews Asia Total Return Bond Fund | | | 100,242,096 | | | | 9,341,795 | | | | (4,441,190 | ) | | | 4,900,605 | |
| Matthews Asia Credit Opportunities Fund | | | 83,414,506 | | | | 3,631,666 | | | | (3,005,385 | ) | | | 626,281 | |
| Matthews Asian Growth and Income Fund | | | 1,070,696,705 | | | | 452,248,603 | | | | (76,376,787 | ) | | | 375,871,816 | |
| Matthews Asia Dividend Fund | | | 3,210,808,781 | | | | 1,984,392,872 | | | | (153,819,085) | | | | 1,830,573,787 | |
| Matthews China Dividend Fund | | | 290,630,123 | | | | 96,308,918 | | | | (13,319,366 | ) | | | 82,989,552 | |
| Matthews Asia Growth Fund | | | 1,152,845,532 | | | | 846,306,156 | | | | (65,717,036) | | | | 780,589,120 | |
| Matthews Pacific Tiger Fund | | | 4,904,135,204 | | | | 3,931,145,911 | | | | (205,642,094 | ) | | | 3,725,503,817 | |
| Matthews Asia ESG Fund | | | 63,857,021 | | | | 27,284,849 | | | | (4,536,600) | | | | 22,748,249 | |
| Matthews Emerging Asia Fund | | | 174,724,787 | | | | 41,920,104 | | | | (26,624,223 | ) | | | 15,295,881 | |
| Matthews Asia Innovators Fund | | | 1,075,955,841 | | | | 596,228,620 | | | | (10,260,897) | | | | 585,967,723 | |
| Matthews China Fund | | | 1,068,082,191 | | | | 458,015,755 | | | | (26,048,833 | ) | | | 431,966,922 | |
| Matthews India Fund | | | 545,052,036 | | | | 251,374,330 | | | | (72,273,628) | | | | 179,100,702 | |
| Matthews Japan Fund | | | 1,142,593,271 | | | | 500,346,356 | | | | (12,242,913 | ) | | | 488,103,443 | |
| Matthews Korea Fund | | | 92,630,755 | | | | 61,909,090 | | | | (2,994,607) | | | | 58,914,483 | |
| Matthews Asia Small Companies Fund | | | 141,775,705 | | | | 70,585,616 | | | | (5,603,596 | ) | | | 64,982,020 | |
| Matthews China Small Companies Fund | | | 289,059,930 | | | | 106,567,698 | | | | (21,853,810) | | | | 84,713,888 | |
| 9. | PUBLIC HEALTH EMERGENCY RISKS |
Pandemics and other public health emergencies, including outbreaks of infectious diseases such as the current outbreak of the novel coronavirus (“COVID-19”), can result, and in the case of COVID-19 is resulting, in market volatility and disruption, and materially and adversely impact economic conditions in ways that cannot be predicted, all of which could result in substantial investment losses. Containment efforts and related restrictive actions by governments and businesses have significantly diminished and disrupted global economic activity across many industries. Less developed countries and their health systems may be more vulnerable to these impacts. The ultimate impact of COVID-19 or other health emergencies on global economic conditions and businesses is impossible to predict accurately. Ongoing and potential additional material adverse economic effects of indeterminate duration and severity are possible. The resulting adverse impact on the value of investment in the Funds could be significant and prolonged.
Notes to Financial Statements (continued)
On February 12, 2021, the Board of Trustees of the Matthews International Funds (d/b/a Matthews Asia Funds) approved the tax-free reorganization (the “Reorganization”) of the Matthews Emerging Asia Fund (the “Target Fund”) into the Matthews Asia Small Companies Fund (the “Acquiring Fund”), which is expected to be renamed the Matthews Emerging Markets Small Companies Fund on or about April 30, 2021. To effectuate the Reorganization, the Target Fund will transfer all of its assets to the Acquiring Fund, and the Acquiring Fund will assume all of the liabilities of the Target Fund. On the date of the closing of the Reorganization, shareholders of the Target Fund will receive Institutional Class or Investor Class shares, as applicable, of the Acquiring Fund equal in aggregate net asset value to the value of their shares of the Target Fund, in exchange for their shares of the Target Fund. The Reorganization is expected to be effective on or about April 29, 2021. After such date, the Target Fund will be terminated as a series of the Trust.
| | | | |
| matthewsasia.com | 800.789.ASIA | | | 161 | |
Report of Independent Registered Public Accounting Firm
To the Board of Trustees of Matthews Asia Funds and Shareholders of each of the seventeen funds listed in the table below
Opinions on the Financial Statements
We have audited the accompanying statements of assets and liabilities, including the schedules of investments, of each of the funds indicated in the table below (constituting Matthews Asia Funds, hereafter collectively referred to as the “Funds”) as of December 31, 2020, the related statements of operations and of changes in net assets for each of the periods indicated in the table below, including the related notes, and the financial highlights for each of the periods indicated therein (collectively referred to as the “financial statements”). In our opinion, the financial statements present fairly, in all material respects, the financial position of each of the Funds as of December 31, 2020, the results of each of their operations and changes in each of their net assets for each of the periods indicated in the table below, and each of the financial highlights for each of the periods indicated therein in conformity with accounting principles generally accepted in the United States of America.
| | | | |
| Fund | | Statement of Operations | | Statement of Changes in Net Assets |
| Matthews Emerging Markets Equity Fund | | For the period April 30, 2020 (commencement of operations) to December 31, 2020 | | For the period April 30, 2020 (commencement of operations) to December 31, 2020 |
Matthews Asia Total Return Bond Fund (formerly known as Matthews Asia Strategic Income Fund) | | For the year ended December 31, 2020 | | For each of the two years in the period ended December 31, 2020 |
| Matthews Asia Credit Opportunities Fund | | | | |
| Matthews Asian Growth and Income Fund | | | | |
| Matthews Asia Dividend Fund | | | | |
| Matthews China Dividend Fund | | | | |
| Matthews Asia Growth Fund | | | | |
| Matthews Pacific Tiger Fund | | | | |
| Matthews Asia ESG Fund | | | | |
| Matthews Emerging Asia Fund | | | | |
| Matthews Asia Innovators Fund | | | | |
| Matthews China Fund | | | | |
| Matthews India Fund | | | | |
| Matthews Japan Fund | | | | |
| Matthews Korea Fund | | | | |
| Matthews Asia Small Companies Fund | | | | |
| Matthews China Small Companies Fund | | | | |
Basis for Opinions
These financial statements are the responsibility of the Funds’ management. Our responsibility is to express an opinion on the Funds’ financial statements based on our audits. We are a public accounting firm registered with the Public Company Accounting Oversight Board (United States) (PCAOB) and are required to be independent with respect to the Funds in accordance with the U.S. federal securities laws and the applicable rules and regulations of the Securities and Exchange Commission and the PCAOB.
We conducted our audits of these financial statements in accordance with the standards of the PCAOB. Those standards require that we plan and perform the audit to obtain reasonable assurance about whether the financial statements are free of material misstatement, whether due to error or fraud.
Our audits included performing procedures to assess the risks of material misstatement of the financial statements, whether due to error or fraud, and performing procedures that respond to those risks. Such procedures included examining, on a test basis, evidence regarding the amounts and disclosures in the financial statements. Our audits also included evaluating the accounting principles used and significant estimates made by management, as well as evaluating the overall presentation of the financial statements. Our procedures included confirmation of securities owned as of December 31, 2020 by correspondence with the custodian and brokers; when replies were not received from brokers, we performed other auditing procedures. We believe that our audits provide a reasonable basis for our opinions.
PricewaterhouseCoopers LLP
San Francisco, CA
February 25, 2021
We have served as the auditor of one or more investment companies in Matthews Asia Funds since 2007.
Tax Information (unaudited)
For shareholders who do not have a December 31, 2020 tax year-end, this notice is for informational purposes. For the period January 1, 2020 to December 31, 2020, the Funds report the following items with regard to distributions paid during the period. All reports are based on financial information available as of the date of this annual report and, accordingly, are subject to change. For each item, it is the intention of each Fund to report the maximum amount permitted under the Internal Revenue Code and the regulations thereunder.
1. Qualified Dividend Income
The Funds report a portion of the ordinary income distributed during the year ended December 31, 2020 as Qualified Dividend Income (“QDI”) as defined in the Internal Revenue code as follows:
| | | | |
| | | QDI Portion | |
| Matthews Emerging Markets Equity Fund | | | 8.23% | |
| Matthews Asia Total Return Bond Fund | | | 0.00% | |
| Matthews Asia Credit Opportunities Fund | | | 0.00% | |
| Matthews Asian Growth and Income Fund | | | 67.10% | |
| Matthews Asia Dividend Fund | | | 71.87% | |
| Matthews China Dividend Fund | | | 64.19% | |
| Matthews Asia Growth Fund | | | 59.38% | |
| Matthews Pacific Tiger Fund | | | 36.42% | |
| Matthews Asia ESG Fund | | | 19.25% | |
| Matthews Emerging Asia Fund | | | 100.00% | |
| Matthews Asia Innovators Fund | | | 3.29% | |
| Matthews China Fund | | | 18.16% | |
| Matthews India Fund | | | 100.00% | |
| Matthews Japan Fund | | | 100.00% | |
| Matthews Korea Fund | | | 100.00% | |
| Matthews Asia Small Companies Fund | | | 66.12% | |
| Matthews China Small Companies Fund | | | 0.93% | |
2. Dividends Received Deduction
The Funds report a Dividend Received Deduction pursuant to Section 854 of the Internal Revenue Code for the year ended December 31, 2020 as follows:
| | | | |
| Matthews Emerging Markets Equity Fund | | | 0.06% | |
| Matthews Asia Total Return Bond Fund | | | 0.00% | |
| Matthews Asia Credit Opportunities Fund | | | 0.00% | |
| Matthews Asian Growth and Income Fund | | | 5.43% | |
| Matthews Asia Dividend Fund | | | 0.00% | |
| Matthews China Dividend Fund | | | 0.00% | |
| Matthews Asia Growth Fund | | | 0.00% | |
| Matthews Pacific Tiger Fund | | | 0.51% | |
| Matthews Asia ESG Fund | | | 0.00% | |
| Matthews Emerging Asia Fund | | | 0.00% | |
| Matthews Asia Innovators Fund | | | 0.00% | |
| Matthews China Fund | | | 0.00% | |
| Matthews India Fund | | | 5.77% | |
| Matthews Japan Fund | | | 0.00% | |
| Matthews Korea Fund | | | 0.00% | |
| Matthews Asia Small Companies Fund | | | 0.00% | |
| Matthews China Small Companies Fund | | | 0.00% | |
| | | | |
| matthewsasia.com | 800.789.ASIA | | | 163 | |
Tax Information (unaudited) (continued)
3. Long-Term Capital Gain Distributions
The Funds report Long-Term Capital Gain distributions pursuant to Section 852(b)(3) of the Internal Revenue Code for the year ended December 31, 2020 as follows:
| | | | |
| | | Long-Term Capital Gains | |
| Matthews Emerging Markets Equity Fund | | | $ — | |
| Matthews Asia Total Return Bond Fund | | | — | |
| Matthews Asia Credit Opportunities Fund | | | — | |
| Matthews Asian Growth and Income Fund | | | 391,926 | |
| Matthews Asia Dividend Fund | | | — | |
| Matthews China Dividend Fund | | | — | |
| Matthews Asia Growth Fund | | | 68,287,399 | |
| Matthews Pacific Tiger Fund | | | 359,799,196 | |
| Matthews Asia ESG Fund | | | 2,403,245 | |
| Matthews Emerging Asia Fund | | | — | |
| Matthews Asia Innovators Fund | | | 18,926,624 | |
| Matthews China Fund | | | 5,822,237 | |
| Matthews India Fund | | | 16,595,544 | |
| Matthews Japan Fund | | | 147,995,041 | |
| Matthews Korea Fund | | | — | |
| Matthews Asia Small Companies Fund | | | 134,758 | |
| Matthews China Small Companies Fund | | | 21,174,671 | |
4. Foreign Taxes Paid
The Funds have elected to pass through to their shareholders the foreign taxes paid for year ended December 31, 2020 as follows:
| | | | | | | | |
| | | Foreign Source Income | | | Foreign Taxes Paid | |
| Matthews Emerging Markets Equity Fund | | | $209,817 | | | | $25,933 | |
| Matthews Asia Total Return Bond Fund | | | 5,514,337 | | | | 163,527 | |
| Matthews Asia Credit Opportunities Fund | | | — | | | | — | |
| Matthews Asian Growth and Income Fund | | | 35,356,958 | | | | 2,848,820 | |
| Matthews Asia Dividend Fund | | | 87,019,756 | | | | 6,242,017 | |
| Matthews China Dividend Fund | | | 12,022,968 | | | | 509,790 | |
| Matthews Asia Growth Fund | | | 10,542,564 | | | | 838,325 | |
| Matthews Pacific Tiger Fund | | | 114,957,646 | | | | 12,533,873 | |
| Matthews Asia ESG Fund | | | 829,038 | | | | 89,619 | |
| Matthews Emerging Asia Fund | | | 5,718,417 | | | | 574,090 | |
| Matthews Asia Innovators Fund | | | 4,690,144 | | | | 516,657 | |
| Matthews China Fund | | | 15,506,829 | | | | 981,184 | |
| Matthews India Fund | | | — | | | | — | |
| Matthews Japan Fund | | | 22,208,773 | | | | 2,219,081 | |
| Matthews Korea Fund | | | 2,331,516 | | | | 383,988 | |
| Matthews Asia Small Companies Fund | | | 2,309,698 | | | | 257,675 | |
| Matthews China Small Companies Fund | | | 5,479,049 | | | | 113,841 | |
5. Qualified Interest Income
The Funds report a portion of the net income dividends distributed during the year ended December 31, 2020, as Qualified Interest Income (QII), as defined in the Internal Revenue Code as follows:
| | | | |
| | | QII Portion | |
| Matthews Emerging Markets Equity Fund | | | 0.01% | |
| Matthews Asia Total Return Bond Fund | | | 0.13% | |
| Matthews Asia Credit Opportunities Fund | | | 0.18% | |
| Matthews Asian Growth and Income Fund | | | 0.27% | |
| Matthews Asia Dividend Fund | | | 0.30% | |
| Matthews China Dividend Fund | | | 0.62% | |
| Matthews Asia Growth Fund | | | 0.20% | |
| Matthews Pacific Tiger Fund | | | 0.10% | |
| Matthews Asia ESG Fund | | | 0.01% | |
| Matthews Emerging Asia Fund | | | 1.29% | |
| Matthews Asia Innovators Fund | | | 0.00% | |
| Matthews China Fund | | | 0.10% | |
| Matthews India Fund | | | 0.00% | |
| Matthews Japan Fund | | | 1.69% | |
| Matthews Korea Fund | | | 1.44% | |
| Matthews Asia Small Companies Fund | | | 0.60% | |
| Matthews China Small Companies Fund | | | 0.14% | |
6. Qualified Short-Term Capital Gain Dividends
The Funds designate a portion of the short term capital gain dividends distributed during the year ended December 31, 2020, as Qualified Short Term Gain, as defined in the Internal Revenue Code as follows:
| | | | |
| | | Short-Term Gains | |
| Matthews Emerging Markets Equity Fund | | | 100.00% | |
| Matthews Asia Total Return Bond Fund | | | 0.00% | |
| Matthews Asia Credit Opportunities Fund | | | 100.00% | |
| Matthews Asian Growth and Income Fund | | | 0.00% | |
| Matthews Asia Dividend Fund | | | 0.00% | |
| Matthews China Dividend Fund | | | 0.00% | |
| Matthews Asia Growth Fund | | | 100.00% | |
| Matthews Pacific Tiger Fund | | | 100.00% | |
| Matthews Asia ESG Fund | | | 100.00% | |
| Matthews Emerging Asia Fund | | | 0.00% | |
| Matthews Asia Innovators Fund | | | 100.00% | |
| Matthews China Fund | | | 100.00% | |
| Matthews India Fund | | | 100.00% | |
| Matthews Japan Fund | | | 0.00% | |
| Matthews Korea Fund | | | 0.00% | |
| Matthews Asia Small Companies Fund | | | 0.00% | |
| Matthews China Small Companies Fund | | | 100.00% | |
| | | | |
| matthewsasia.com | 800.789.ASIA | | | 165 | |
Approval of Investment Advisory Agreement (unaudited)
The Funds, which are series of the Trust, have retained Matthews International Capital Management, LLC (“Matthews”) to manage their assets pursuant to an Investment Advisory Agreement dated as of February 1, 2016, as amended (the “Advisory Agreement”), which has been approved by the Board of Trustees of the Funds, including all of the Trustees who are not “interested persons” (“Independent Trustees”), within the meaning of the Investment Company Act of 1940, as amended (the “1940 Act”), as well as by the shareholders of each Fund in accordance with the requirements of the 1940 Act. Following an initial two-year term with respect to each Fund, the Advisory Agreement continues in effect from year-to-year provided that the continuance is specifically approved at least annually by the vote of the holders of at least a majority of the outstanding shares of the Funds, or by the Board of Trustees, and, in either event, by a majority of the Independent Trustees of the Trust casting votes in person at a meeting called for that purpose (the “Annual 15(c) Process”).
At a meeting held on August 25-27, 2020 (the “Meeting”), the Board, including the Independent Trustees, approved the continuation of the Advisory Agreement for an additional one-year term beginning February 1, 2021 with respect to each Fund including the Matthews Emerging Markets Equity Fund. Although that Fund commenced operations on April 30, 2020 and the Advisory Agreement did not need to be renewed for that Fund, it was included as part of the approval in order to coordinate the renewal schedule for all Funds.
At the Meeting and at prior meetings, the Board received and considered information (both written and oral) provided to assist it in the review of the Advisory Agreement and made assessments with respect to each Fund. The Independent Trustees were advised by independent legal counsel with respect to these matters. In addition, the Board received in-person presentations about the Funds throughout the year. Among the information considered by the Board were responses to a detailed information request sent on behalf of the Independent Trustees by their independent legal counsel. Matthews furnished extensive information in response to this request with respect to many subjects relating to the Advisory Agreement and addressed many of the factors discussed below, including but not limited to information about the services provided by Matthews, its structure, organization, operations and personnel, the financial condition of Matthews and the profitability to Matthews from the Advisory Agreement, compliance procedures and resources, investment performance of the Funds, expenses of the Funds, brokerage and portfolio transactions, distribution and marketing of the Funds, shareholder services and relationships with intermediaries, and other information considered relevant.
In considering information relating to management fee levels, which the Board considers to be the advisory and administrative fees both separately and on a combined basis, the Board considered, among other things, information provided by Matthews as to Fund management services and fees as compared to advisory services and fees charged by Matthews
to its institutional clients and pooled vehicles organized outside of the United States. The Trustees also considered information provided by an independent data provider, Broadridge, comparing the investment performance and the fee and expense levels of each Fund to appropriate peer groups of mutual funds, as well as performance data provided by Matthews with respect to unmanaged benchmarks and pooled vehicles or other accounts managed by Matthews with similar investment objectives and/or strategies to the Funds, as applicable.
The Independent Trustees also considered that they had previously engaged an Independent Consultant (“Independent Consultant”) with substantial industry experience in providing fund boards with analysis to assist them in their Annual 15(c) Process. The Independent Trustees considered the work and analysis performed by the Independent Consultant in that engagement to review the process for selecting appropriate peer groups for the Funds as helpful in their review for the Annual 15(c) Process. Furthermore, throughout the course of the year, the Board received a wide variety of materials relating to the services provided by Matthews, including reports on each Fund’s investment results, portfolio composition, portfolio trading practices, shareholder services, and other information relating to the nature, extent, and quality of services provided by Matthews to the Funds. The Board also took into account that, under the Administration and Shareholder Services Agreement, Matthews provides additional services to the Funds that are essential to the operation of the Funds and that, although Matthews is separately compensated under that agreement, these additional services are provided in connection with Matthews’ advisory relationship with the Funds.
In addition to the information furnished by Matthews, the Trustees were provided with a legal memorandum from their independent legal counsel discussing their fiduciary duties related to their approval of the continuation of the Advisory Agreement and discussed these matters with their counsel.
Prior to the Meeting, a working group of Independent Trustees and independent legal counsel had met with representatives of Matthews to review relevant information in connection with the Annual 15(c) Process. Thereafter, all of the Independent Trustees had met separately with their independent legal counsel to review all of the information provided in connection with the Annual 15(c) Process. At these sessions, the Independent Trustees asked Matthews to provide certain additional information and to respond to certain additional questions at the Meeting. The Independent Trustees then reviewed this supplemental information, which was provided prior to and at the Meeting. The Independent Trustees discussed the renewal of the Advisory Agreement with representatives of Matthews and among themselves in private sessions on various occasions at which no representatives of Matthews were present.
The Trustees’ determinations at the Meeting were made on the basis of each Trustee’s business judgment after consideration of all the information presented. In deciding to recommend the renewal of the Advisory Agreement with
Approval of Investment Advisory Agreement (unaudited) (continued)
respect to each Fund, the Independent Trustees did not identify any single factor or particular piece of information that, in isolation, was controlling. Each Independent Trustee may also have weighed factors differently. This summary describes the most important, but not all, of the factors considered by the Board and the Independent Trustees.
| 1. | The nature, extent and quality of the services provided by Matthews under the Advisory Agreement. |
The Trustees considered the overall financial strength and stability of Matthews and its ability to provide a high level and quality of services to the Funds. The Trustees considered the experience and qualifications of the executive and portfolio management personnel at Matthews who are responsible for providing services to the Funds and who are responsible for the daily management of the Funds’ portfolios. The Trustees noted that Matthews has expanded its professional staff at both senior and junior levels over the past several years. They also reviewed recent personnel developments relevant to certain of the Funds and efforts by Matthews to provide appropriate support to those Funds, including, but not limited to, Matthews’ recent hirings to further strengthen or maintain current capabilities and to support future potential growth of assets and the expansion of its business. Among the improved capabilities noted by the Independent Trustees over the past several years are enhanced risk analytical resources and related professionals, including the appointment of a new Global Head of Risk and Compliance and ongoing enhancements to compliance, risk management, technology, business infrastructure, operations, marketing and client service, as well as enhancements to financial intermediary oversight and valuation practices.
The Trustees considered Matthews as well positioned to continue to provide high quality services to the Funds under various market conditions, as demonstrated by past periods of volatile and challenging securities markets that have caused either contracting revenues or rapidly expanding assets at different times, including the recent market volatility relating to the COVID-19 pandemic. The Trustees attributed much of that past stability to Matthews’ emphasis on preserving and enhancing portfolio management team resources, careful business planning and management, as well as its solid financial condition and strong cash reserves.
As in past years, the Trustees considered the technical capabilities of Matthews, including the design and implementation of its disaster recovery and business continuity infrastructure. In this regard, the Trustees took into account the operation of Matthews’ business continuity plan during the current COVID-19 pandemic, the oversight it has provided to the operation of the business continuity plans of major Trust service providers, and Matthews’ reporting to the Board regarding all of these matters. The Trustees also considered the Chief Compliance Officer’s report regarding Matthews’ compliance resources, risk assessment and other compliance initiatives and programs. The Trustees concluded that Matthews has implemented a robust and diligent compliance process, and demonstrates a strong commitment to a culture of compliance. The Independent Trustees took into
consideration Matthews’ description of its supervision of the activities of the Funds’ various service providers, as well as supporting the Independent Trustees’ responsibilities and requests and its responsiveness to questions and/or concerns raised by the Trustees throughout the year.
The Trustees noted the significant role played by Matthews with respect to the valuation of portfolio securities, including research and analysis related to fair valued securities and due diligence and oversight of pricing vendors. In particular the Trustees took into account the work performed by Matthews over the past year in connection with securities that were principally traded on markets that had been temporarily closed due to the COVID-19 pandemic.
The Trustees concluded that Matthews had the quality of personnel and other investment resources essential to performing its duties under the Advisory Agreement, and that the nature, overall quality, cost and extent of such management services are fully satisfactory.
| 2. | The investment performance of the Funds. |
The Trustees reviewed the short-term and long-term performance of each Fund on both an absolute basis and in comparison to appropriate peer funds and benchmark indices for various periods ending June 30, 2020. The Trustees considered investment results in light of each Fund’s objective, strategies and market conditions, noting periods during which there were challenging investment conditions in various Asian markets. The Trustees also noted the difficulty of fairly benchmarking performance for certain of the Funds as well as the difficulty of establishing appropriate peer groups or benchmark indices for certain of the Funds because of the lack of other funds with a similar investment focus and of unmanaged benchmarks that closely match the Funds’ portfolios. The Independent Trustees reviewed information as to peer group selections presented by Broadridge and took into account the work previously done by the Independent Consultant in reviewing the peer group selection process.
When reviewing the Funds’ performance against unmanaged benchmarks, the Trustees took into account that the Funds, because they are actively managed, may have significant differences in portfolio construction than unmanaged benchmarks as well as significant differences in objectives and risks. For these reasons, the Trustees placed greater emphasis on a Fund’s performance against peers as opposed to the unmanaged benchmarks.
The Trustees reviewed each Fund’s performance on a case-by-case basis and noted that some Funds had outperformed their Performance Universe over certain periods and/or exceeded the return of their respective benchmark while others underperformed their Performance Universe over certain periods and/or trailed the return of their respective benchmark. In considering each Fund’s investment results, the Board placed greater emphasis on each Fund’s long-term performance track record rather than shorter-term performance. The Board also took into account that each Fund’s track record was measured as of a specific ending date, and that track records can vary as of different measurement dates.
| | | | |
| matthewsasia.com | 800.789.ASIA | | | 167 | |
Approval of Investment Advisory Agreement (unaudited) (continued)
Therefore, in reviewing a Fund that is currently underperforming, the Trustees also considered the broader perspective of the Fund’s performance over varying time periods, the market conditions experienced during the periods under review, as well as the outlook for the Fund going forward in light of expected future market conditions.
The Trustees discussed with Matthews the fact that certain periods of underperformance may be transitory while other periods of underperformance may be caused by factors that warrant further consideration. To the extent of any concerns about performance with respect to any particular period for a Fund, the Trustees noted that Matthews had provided an explanation for that performance and explained its reasons for maintaining a consistent investment philosophy. In addition, the Trustees recognized actions taken by Matthews from time to time in response to performance concerns, such as changes to members of a portfolio management team. A summary of each Fund’s performance track record is provided below.
For Matthews Pacific Tiger Fund, the Trustees noted that the Fund’s performance was very strong for the since-inception period, ranking in the first quintile against the peer group, in the third quintile for five years, fourth quintile for three years and fifth quintile for one year. The Trustees also noted that the Fund outperformed the median of its peer group for the five-year and since-inception periods and underperformed the median for the one-year and three-year periods. The Board considered Matthews’ discussion regarding the factors contributing to the recent underperformance and took into account recent changes implemented in the portfolio designed to help improve performance.
For Matthews Asian Growth and Income Fund, the Trustees noted that the Fund has experienced difficult performance since inception, ranking in the fifth quintile for the one-year and three-year periods against the peer group and in the fourth quintile for the five-year and since-inception periods. The Trustees further noted that the Fund underperformed its peer group median for each of those periods. The Trustees considered Matthews’ view as to reasons for the Fund’s underperformance. The Board also took into account recent changes implemented in the portfolio that were designed to improve performance and noted the very recent improved performance over the short-term. The Board also noted that the Fund had generally experienced less volatility compared to the peer group.
For Matthews Korea Fund, the Trustees noted that the Fund performed at or above the median of its peer group for the one-year, three-year, five-year and since-inception periods. The Trustees took into account, however, that the peer universe for the Fund was very small, with only a few comparable funds and that, therefore, relative peer performance was less useful than if the peer universe were larger.
For Matthews China Fund, the Trustees noted that the Fund’s performance had ranked in the second quintile for the one-year and since-inception periods and the first quintile for the three-year and five-year periods. The Trustees also noted that the Fund outperformed the median of its peer funds over each of those periods.
For Matthews Japan Fund, the Trustees noted that the Fund’s performance had ranked in the first quintile for the one- and three-year periods and in the second quintile for the five-year and since-inception periods. The Trustees also noted that the Fund outperformed the median of its peer funds over each of those periods.
For Matthews Asia Innovators Fund, the Trustees noted that the Fund has ranked in the first quintile for each of the one-year, three-year, five-year and since-inception periods. The Trustees also noted that the Fund outperformed the median of its peer funds over each of those periods.
For Matthews Asia Growth Fund, the Trustees noted that the Fund had strong performance over all time periods, ranking in the first quintile for the one-year, three-year and five-year periods and outperforming the median of its peer group for the one-year, three-year, five-year and since-inception periods. The Trustees took into account, however, that principally due to the Fund’s exposure to Japan, the peer universe for the Fund was small, with only a few comparable funds and that therefore relative peer performance was of less use than if the peer universe were larger.
For Matthews India Fund, the Trustees noted that the Fund ranked in the fifth quintile for the one- and three-year periods and fourth quintile for the five-year period, underperforming the median of its peer group for each of those periods, but outperformed the median of its peer funds and ranked in the first quintile for the since-inception period. The Trustees took into consideration Matthews’ discussions regarding the factors that had contributed to the Fund’s underperformance. They also consider management’s effort to improve performance such as the engagement of a new portfolio manager and changes in portfolio construction. They noted very recent improved short-term performance.
For Matthews Asia Dividend Fund, the Trustees noted that the Fund outperformed the median of its peer group and ranked in the second quintile for the one-year, three-year, five-year and since-inception periods. The Trustees took into account, however, that principally due to the Fund’s exposure to Japan, the peer universe for the Fund was small, with only a few comparable funds and that therefore relative peer performance was of less use than if the peer universe were larger.
For Matthews Asia Small Companies Fund, the Trustees noted that the Fund ranked above the median for the one-year, three-year, five-year and since-inception periods, with only three funds in the peer group. The Trustees considered further that one of the three peer group funds was not focused on Asian small cap investments and, therefore, was considered to be of limited use in evaluating the Fund’s performance.
For Matthews China Dividend Fund, the Trustees noted that the Fund ranked in the fourth quintile of its peer group over the one-year period but had strong relative performance over all longer time periods, ranking in the second quintile for the three-year and five-year periods and first quintile for the since-inception period. The Trustees also noted that the Fund had underperformed its peer group median for the one-year period but outperformed its peer group median for the three-year,
Approval of Investment Advisory Agreement (unaudited) (continued)
five-year and since-inception periods. The Trustees took into consideration Matthews’ discussions regarding the factors that had contributed to the recent underperformance and also took into account recent changes implemented in the portfolio that were designed to improve performance.
For Matthews China Small Companies Fund, the Trustees noted that the Fund’s performance was above its peer group for the one-year period and since-inception period, but took into account the very small size of the peer group, with only three funds in the peer group.
For Matthews Asia Total Return Bond Fund, the Trustees noted that the Fund’s performance had ranked in the second quintile for the one-year, three-year and five-year periods and the third quintile for the since-inception period. The Trustees noted that the Fund had outperformed its peer group median for the one-year, three-year and five-year periods and slightly underperformed that median for the since-inception period. The Trustees recognized that the peer groups included mostly broader emerging market hard currency debt funds not focused on Asia, making the peer group less useful in comparing relative performance than if their principal investment strategies were more closely aligned with the Fund’s investment focus. The Trustees also considered that the Fund’s name and principal investment strategy had changed effective January 31, 2020.
For Matthews Emerging Asia Fund, the Trustees noted that the Fund had experienced difficult relative performance for the one-year, three-year, five-year and since-inception periods, ranking in the fifth quintile among its peer funds for each of those periods. The Trustees took into account Matthews’ explanation of the reasons for the Fund’s relative poor performance, noting that performance was recently negatively impacted by events surrounding the COVID-19 pandemic. They also considered Matthews’ view that the Fund was unique and differs from most funds in its peer group due to its investment focus on frontier countries, such as Pakistan. After reviewing the Fund’s performance, the Trustees requested that management consider a voluntary and temporary reduction in the Fund’s total net operating expenses and further review the Fund to determine if other changes would be appropriate.
For Matthews Asia ESG Fund, the Trustees noted that the Fund had outperformed its peer group median for the one-year, three-year, five-year and since-inception periods and had ranked in the second quintile for each of those periods. The Trustees noted that the peer group funds did not have a similar ESG strategy as the Fund.
For Matthews Asia Value Fund, the Trustees noted that the Fund’s performance had ranked in the fifth quintile for the one-year and three-year periods and in the third quintile for the since-inception period. The Trustees also noted that the Fund had underperformed the peer group median for each of those periods. The Trustees further noted that, as previously approved by the Board, the Fund had ceased the sale of shares as of August 25, 2020, and would be liquidated on or about September 30, 2020.
For Matthews Asia Credit Opportunities Funds, the Trustees noted that the Fund’s performance had ranked in the fifth quintile for the one-year and three-year periods and in the second quintile for the since-inception period. The Trustees also noted that the Fund had outperformed the peer group median for the since-inception period but had underperformed that median for the one-year and three-year periods. The Trustees took into consideration Matthews’ discussions regarding the factors that had contributed to the shorter-term underperformance. The Trustees took into account, however, that the peer universe for the Fund was small, with only a few comparable funds, and that therefore relative peer performance was of less use than if the peer universe were larger.
After review, the Trustees concluded that each Fund’s overall performance was satisfactory or was being addressed as needed. The Trustees also reviewed Matthews’ trading policies and efforts to obtain best overall execution for the Funds in the various markets in which the Funds trade securities. The Trustees noted the relatively low turnover rates in the various equity Funds and Matthews’ consistent adherence to its long-standing investment approach, which emphasizes fundamental bottom-up driven investment selection in light of its view of regional economic conditions.
| 3. | The extent to which Matthews realizes economies of scale as the Funds grow larger and whether Fund investors benefit from any economies of scale. |
The Trustees first noted the substantial work done over recent years between the Board and Matthews to establish fee structures for both the Advisory Agreement and other agreements that recognize the sharing of economies of scale that can arise as assets in the Funds grow through the use of breakpoints. In particular, they noted that the management fee structure contains breakpoints for the group-priced Funds as well as for certain individually priced Funds. That structure enhances the ability of the Funds and their shareholders to benefit from past and potential future economies of scale. They discussed the structure and level of these breakpoints and concluded that they continue to be appropriate given the sizes of the Funds and potential future growth. The Trustees further noted that additional economies of scale have been and will continue to be shared with shareholders of the Funds through fee waivers and/or expense reimbursements pursuant to the Operating Expenses Agreement, fee waivers pursuant to the Fee Waiver Agreement, and the breakpoints in the fees payable under the Services Agreement. The Trustees also noted that the Advisor had recommended, and the Trustees agreed, to remove redemption fees from the Matthews Emerging Asia Fund, Matthews Asia Small Companies Fund and Matthews China Small Companies Fund in an effort to promote asset growth. As another example of economies of scale, the Trustees noted that Matthews was successful in negotiating lower fees with the Funds’ custodian, first in 2014 and again in 2019, resulting in additional savings to the Funds.
The Trustees next discussed Matthews’ ongoing investment in its technology, systems, staffing and other aspects of its business that can benefit the Funds, noting that all these
| | | | |
| matthewsasia.com | 800.789.ASIA | | | 169 | |
Approval of Investment Advisory Agreement (unaudited) (continued)
endeavors are a means by which Matthews is sharing economies of scale with the Funds and their shareholders through reinvestment in products and services that are designed to benefit the Funds and their shareholders. The Trustees considered the new personnel hired over recent years, as well as planned hiring, and the extent to which that hiring could be expected to benefit shareholders. The Trustees also recognize that the Funds’ total assets have fluctuated, especially in certain strategies. Those fluctuations affect any economies of scale that could be enjoyed. As a result, the Trustees remain satisfied about the extent to which economies of scale have been and will continue to be shared with the Funds and their shareholders.
| 4. | The costs of the services provided by Matthews and others. |
The Trustees considered the management fees and total fees and expenses of each Fund in comparison to the management and advisory fees and other fees and expenses of other funds in each Fund’s relevant peer group. The Trustees reviewed information developed by Broadridge as to appropriate peer groups for each Fund for these purposes and took into account the work previously done by the Independent Consultant in reviewing these peer groups. The Board placed greater emphasis on management fees, which include both advisory and administrative fees, as the basis of comparison rather than advisory fees alone.
The Trustees considered both the gross management fee rates charged by Matthews, as well as the effective management fee rates after taking into consideration the fees waived and expenses reimbursed pursuant to the Operating Expenses Agreement and the Fee Waiver Agreement. The Trustees considered that the contractual advisory rates (excluding administrative services) for the Funds were generally very competitive and often lower than those of the relevant peer group averages. The Trustees also considered that the total expense ratios paid by shareholders of the Funds, which are most representative of a shareholder’s net investment results, were also very competitive, with all but the relatively newer or smaller Funds ranking below the peer group averages. The Trustees noted that Matthews’ continued efforts in recent years had resulted in, for many of the Funds, reduced expenses over time. The Trustees also noted that, as an example of those efforts, in 2019 the Advisor had agreed to lower the level of the expense cap for the Institutional Class of each Fund (other than the Matthews Asia Total Return Bond Fund and Matthews Asia Credit Opportunities Fund) by 5 basis points to 1.20%, thereby effectively lowering the expenses for the Investor Class of those Funds by the same amount, resulting in cost reductions for the Matthews Emerging Asia Fund, Matthews Asia Small Companies Fund, Matthews China Small Companies Fund, Matthews Asia ESG Fund and Matthews Asia Value Fund. It was noted that the larger Funds already operate under the reduced expense cap but now have additional downside protection in the event that their assets decrease.
The Trustees also compared Matthews’ advisory fees with those of Matthews’ separate accounts and other investment
products, noting that the Funds’ advisory expenses were not disadvantageous (not being substantially higher than the separate accounts’ rates). The Trustees agreed that advisory fees for the Funds appeared to be appropriate in comparison and taking into account the differences in services between these products and the Funds, including the differences in the frequency of net asset value calculations and other operational and compliance activities.
The Trustees’ overall assessment with respect to each Fund was that, taking into account the considerations noted below, the contractual advisory fee rates, the total expense ratio, and the effective or net advisory fee rates were fair and reasonable.
For the Matthews Asia Total Return Bond Fund and the Matthews Asia Credit Opportunities Fund, actual management fees were above the peer group medians, but the contractual management fees were below the peer group medians. The Trustees noted that in 2018 Matthews had agreed to a reduction in its advisory fee rate from 0.65% to 0.55% and to forego recovery of any fees waived prior to that reduction.
For the Matthews Asia Small Companies Fund, Matthews Asia Value Fund, Matthews China Small Companies Fund and Matthews Emerging Asia Fund, the actual management fees were above the peer group medians due to their small size, but the contractual management fee for the Matthews Asia Value Fund was below its peer group median while the contractual management fees for the Matthews Asia Small Companies Fund, Matthews China Small Companies Fund and Matthews Emerging Asia Fund were above their respective peer group medians. The Trustees considered that these Funds each had breakpoints in its management fee schedule and noted that in 2019 the Advisor had recommended, and the Trustees agreed, to remove redemption fees from the Matthews Emerging Asia Fund, Matthews Asia Small Companies Fund and Matthews China Small Companies Fund in order to promote asset growth and realize economies of scale. With respect to the Matthews Asia Value Fund, the Trustees took into account that the Fund was scheduled to be liquidated on or about September 30, 2020. With respect to the Matthews Emerging Asia Fund, the Trustees noted that they had asked management to consider a voluntary and temporary reduction in the Fund’s total net operating expenses and further review the Fund to determine whether other actions would be appropriate.
For the Matthews Japan Fund, Matthews Korea Fund, Matthews Pacific Tiger Fund, Matthews Growth and Income Fund and Matthews Asia Innovators Fund, the actual management fees were equal to or above peer group medians, but the contractual management fees were near or below the peer group medians.
For the Matthews Japan Fund, the actual management fee was below the peer group median, but the contractual management fee was above the peer group median.
For the Matthews China Fund, Matthews Asia Growth Fund, Matthews India Fund, Matthews Asia Dividend Fund, Matthews China Dividend Fund and Matthews Asia ESG Fund, both the actual management fees and the contractual management fees were below the respective peer group medians.
Approval of Investment Advisory Agreement (unaudited) (continued)
| 5. | The profits to be realized by Matthews and its affiliates from the relationships with the Funds. |
The Trustees reviewed information provided by Matthews regarding the costs of sponsoring and operating the Funds and information regarding the profitability to Matthews of the Advisory Agreement both on a fund-by-fund basis and overall for the family of Funds. In considering profitability, the Trustees discussed and considered the methodology employed by Matthews in calculating profit margins but also considered other elements relevant to discussions of profitability, such as the entrepreneurial risk undertaken by Matthews in sponsoring and maintaining the Funds and risks associated with commitments to maintain Fund expense ratios. The Trustees also reviewed information provided regarding the structure and manner in which Matthews’ investment professionals were compensated and their respective views of the relationship of such compensation to the attraction and retention of quality personnel. The Trustees considered Matthews’ willingness to invest in technology, infrastructure and professional staff to reinforce and offer services and to accommodate changing regulatory requirements and industry practices.
The Trustees noted that Matthews appeared to be sufficiently profitable to operate as a viable investment management firm, able to honor its obligations as a sponsor of the Funds, including the Funds that did not generate a profit for Matthews, without earning excessive profits from any particular Fund or from the overall relationship with the Funds. The Trustees noted that, with fluctuations in asset levels in some prior years, volatility in revenues and profitability could be expected from time to time in the future, but they also noted the continued expenditures on personnel and other resources. The Board also considered information relating to the profitability of a limited number of publicly traded investment advisers, although the Board noted that this information was of limited utility because it was comprised of a limited universe of advisers, did not provide any information as to how profitability was determined and did not limit profitability analysis to the performance of advisory services to registered investment companies. The Board further noted that these advisers differed significantly from Matthews because they were not solely dedicated to investment in the Asian markets.
Based on information received, the Trustees noted that Matthews’ overall profitability from the Advisory Agreement appeared not to be excessive at the current time, whether considered inclusive or exclusive of distribution costs.
The Trustees requested and received from Matthews information concerning other benefits received by Matthews as a result of its respective relationship with the Funds, including various service arrangements with Matthews. These potential benefits included, among other things, the use of soft dollars as well as potential benefits resulting from the structure of compensation arrangements between the Trust, the Adviser and financial intermediaries in the areas of shareholder servicing and sub-transfer agency services. The Board concluded that such benefits were consistent with those generally derived by investment advisers to mutual funds or were otherwise not unusual.
Based on their review, including their consideration of each of the factors referred to above, and assisted by the advice of independent counsel to the Independent Trustees, the Board, including the Independent Trustees, concluded that the Advisory Agreement was fair and reasonable with respect to each Fund and its shareholders, and that the renewal of the Advisory Agreement would be in the best interests of each Fund and its shareholders. The Board did not indicate that any single factor was determinative of its decision to approve the Advisory Agreement, but indicated that the Board based its determination on the total mix of information available to it.
| | | | |
| matthewsasia.com | 800.789.ASIA | | | 171 | |
Statement Regarding Liquidity Risk Management Program
The Securities and Exchange Commission adopted Rule 22e-4 under the Investment Company Act of 1940, as amended (the “Liquidity Rule”) to promote effective liquidity risk management throughout the open-end investment company industry.
The Board of Trustees (the “Board”) of the Matthews International Funds, (the “Funds”) met on November 17-19, 2020 (the “Meeting”) to review the Liquidity Risk Management Program (the “Program”) of the Funds, in accordance with the requirements of the Liquidity Rule. The Board has appointed the Liquidity Risk Management Committee (“LRMC”), a sub-committee of the Enterprise Risk Management Committee of Matthews International Capital Management, LLC, as Program Administrator.
At the Meeting, the LRMC provided the Board with a report that addressed the operation of the Program and assessed its adequacy and effectiveness of implementation, including the operation of each Fund’s Highly Liquid Investment Minimum (“HLIM”) where applicable, and any material changes to the Program (the “Report”). The Report covered the period from October 1, 2019 through September 30, 2020 (the “Program Reporting Period”).
The Report included a Portfolio Liquidity Profile of each Fund as of September 30, 2020. The Report also discussed the methodology utilized in establishing a Fund’s HLIM and Reasonably Anticipated Trading Size (“RATS”) and noted applicable changes during the period as well as proposed changes suggested by the LRMC to the HLIM or RATS for certain Funds. The Report also discussed the impact to the Program as a result of worldwide market disruptions which occurred in conjunction with the COVID-19 pandemic, and in particular as a result of extended exchange closures in Bangladesh and Sri Lanka.
There were no material changes to the Program during the Program Reporting Period. The Report provided to the Board stated that the LRMC concluded that based on the operation of the functions, as described in the Report, the Program is adequately designed and implemented and is operating effectively pursuant to the requirements of the Liquidity Rule.
Trustees and Officers of the Funds (unaudited)
The operations of each Fund are under the direction of the Board of Trustees. The Board of Trustees establishes each Fund’s policies and oversees and reviews the management of each Fund. The Board meets regularly to review the activities of the officers, who are responsible for the day-to-day operations of the Funds. The Statement of Additional Information, which includes additional information about Fund Trustees, is available without charge by calling 800.789.2742 or by visiting the Funds’ website, matthewsasia.com. The Trustees and executive officers of the Funds, their year of birth, business address, principal occupations during the past five years and other trusteeships/directorships are set forth below:
| | | | | | | | |
Name, Year of Birth, Address and Position(s) Held with Trust | | Term of
Office and
Length of
Time Served1 | | Principal Occupation(s) During Past 5 Years | | Number of
Portfolios in
Fund Complex
Overseen by
Trustee | | Other Trusteeships/Directorships (number of portfolios) Held by Trustee |
| INDEPENDENT TRUSTEES | | | | | | |
| | | | |
JONATHAN F. ZESCHIN Born 1953 Four Embarcadero Center Suite 550 San Francisco, CA 94111 Chairman of the Board of Trustees and Trustee | | Trustee since 2007 and Chairman of the Board since 2014 | | Partner (since 2009), Essential Investment Partners, LLC (investment advisory and wealth management). | | 17 | | Trustee (2019), Russell Investment Funds (9 portfolios) and Russell Investment Company (32 portfolios). |
| | | | |
TOSHI SHIBANO Born 1950 Four Embarcadero Center Suite 550 San Francisco, CA 94111 Trustee | | Since 2003 | | Faculty (since 2000), General Electric’s John F. Welch Leadership Center; President (since 1995), Executive Financial Literacy, Inc. (financial executive development programs); Faculty Director and Executive Education Lecturer (1995–2016), Center for Executive Education, Haas School of Business, UC Berkeley; Adjunct Professor (2000–2011), Columbia Graduate School of Business; Associate Professor (2001–2005), Thunderbird School of Global Management; Visiting Assistant Professor (2000), Stanford Graduate School of Business; Assistant Professor (1995–2000), University of Chicago Graduate School of Business; Assistant Professor (1988–1995), Haas School of Business, UC Berkeley. | | 17 | | |
| | | | |
RHODA ROSSMAN Born 1958 Four Embarcadero Center Suite 550 San Francisco, CA 94111 Trustee | | Since 2006 | | Council Member (since 2019), California Catastrophe Response Council; Vice President, Corporate Investment Officer (2007–2010), Senior Vice President and Treasurer (2003–2007), The PMI Group, Inc. (mortgage insurer). | | 17 | | |
| | | | |
RICHARD K. LYONS Born 1961 Four Embarcadero Center Suite 550 San Francisco, CA 94111 Trustee | | Since 2010 | | Chief Innovation and Entrepreneurship Officer (since 2020), UC Berkeley; Dean (2008–2018), Haas School of Business, UC Berkeley; Chief Learning Officer (2006–2008), Goldman Sachs (investment banking and investment management); Executive Associate Dean (2005–2006), Haas School of Business, UC Berkeley. | | 17 | | Trustee (since 2018), Syntax ETF Trust; Trustee (2001–2006), Barclays Global Investor Funds and Master Investment Portfolios (15 Portfolios); Trustee (2000–2006), iShares, Inc. (24 Portfolios) and iShares Trust (over 70 Portfolios); Trustee (1994–2006) and Chairman of the Board (2000–2006), Matthews Asia Funds (9 Portfolios). |
| 1 | Each Trustee serves for an indefinite term, until retirement age or until his/her successor is elected. Officers serve at the pleasure of the Board of Trustees. |
| | | | |
| matthewsasia.com | 800.789.ASIA | | | 173 | |
| | | | | | | | |
Name, Year of Birth, Address and Position(s) Held with Trust | | Term of
Office and
Length of
Time Served1 | | Principal Occupation(s) During Past 5 Years | | Number of
Portfolios in
Fund Complex
Overseen by
Trustee | | Other Trusteeships/Directorships (number of portfolios) Held by Trustee |
| INDEPENDENT TRUSTEES | | | | | | |
| | | | |
CHRISTOPHER LEE Born 1967 Four Embarcadero Center Suite 550 San Francisco, CA 94111 Trustee | | Since 2015 | | Consultant and Associate Professor (since 2017), Hong Kong University of Science and Technology; Lecturer (part-time) (2013-2019), The Chinese University of Hong Kong; Private Investor and Partner (since 2012), FAA Investments (financial holding company); Managing Director, Asia Region, and Head of Global Markets Investment Products & db-X (2010– 2012), Deutsche Bank AG (financial services); Managing Director, Equity Risk Management Products, and Head of Intermediary Business (2002–2010), UBS AG (financial services); Vice President, Global Markets & Investment Bank (2000–2002), Vice President, International Private Clients Group (1997–2000), Associate, Debt and Equity Markets Group (1995–1997), Merrill Lynch & Co., Inc. (brokerage and investment management). | | 17 | | Director (since 2017), Hong Kong Securities and Investment Institute; Director (2013–2018), Asian Master Funds (Australia) (1 Portfolio); Trustee (since 2013), African Wildlife Foundation; Trustee (2010-2016), Oakland Museum of California. |
| | | | |
GALE K. CARUSO Born 1957 Four Embarcadero Center Suite 550 San Francisco, CA 94111 Trustee | | Since 2015 | | Formerly President and Chief Executive Officer (1999–2003), Zurich Kemper Life (life insurance and annuities); Chairman, President and Chief Executive Officer (1994–1999), Scudder Canada Investor Services, Ltd. (investment management); Managing Director (1986–1999), Scudder Kemper Investments, Inc. (investment management). | | 17 | | Trustee (since 2006), Pacific Select Fund (57 Portfolios) and Pacific Funds Series Trust (39 Portfolios); Director (2005– 2012), Make-A-Wish Foundation of Maine; Director (2005–2009), LandAmerica Financial Group, Inc. |
| | | | |
Name, Year of Birth, Address and Position(s) Held with Trust | | Term of
Office and
Length of
Time Served1 | | Principal Occupation(s) During Past 5 Years | | Number of
Portfolios in
Fund Complex
Overseen by
Trustee | | Other Trusteeships/Directorships (number of portfolios) Held by Trustee |
| INTERESTED TRUSTEES2 | | | | | | |
| | | | |
WILLIAM J. HACKETT Born 1967 Four Embarcadero Center Suite 550 San Francisco, CA 94111 Trustee and President | | President since 2008 and Trustee since 2015 | | Director (since 2016), Chief Executive Officer (since 2009), President (since 2008) and Secretary (2007-2016), Matthews (investment management); President (2013-2017), Matthews A Share Selections Fund, LLC (registered investment company); Director (2010–2020), Matthews Global Investors S.à r.l. (Luxembourg) (investment management); Director (since 2010), Matthews Global Investors (Hong Kong) Limited (investment management); Partner (2002–2007), Deloitte & Touche, LLP (accounting). | | 17 | | Chairman (since 2010), Director (since 2009), Matthews Asia Funds SICAV (Luxembourg) (12 Portfolios); Director (since 2009), Matthews Asian Selections Funds, PLC (Ireland) (1 Portfolio). |
| | | | |
ROBERT J. HORROCKS, PhD Born 1968 Four Embarcadero Center Suite 550 San Francisco, CA 94111 Trustee and Vice President | | Vice President since 2009 and Trustee since 2018 | | Chief Investment Officer (since 2009), Director of Research (2008–2009), Matthews (investment management); Head of Research (2006–2008), Mirae Asset Management (investment management); Chief Investment Officer (2003–2006), Everbright Pramerica (investment management). | | 17 | | None |
| 1 | Each trustee serves for an indefinite term, until retirement age or until his/her successor is elected. Officers serve at the pleasure of the Board of Trustees. |
| 2 | A trustee is considered an “interested person” of the Trust as defined under the 1940 Act because of an ownership interest in the Advisor or an office held with the Trust or the Advisor. |
| | | | | | |
Name, Year of Birth, Address and Position(s) Held with Trust | | Term of Office
and Length of
Time Served1 | | Principal Occupation(s) During Past 5 Years | | Other Trusteeships/
Directorships
(number of
portfolios)
Held by Officer |
| OFFICERS WHO ARE NOT TRUSTEES | | |
| | | |
JOHN P. McGOWAN Born 1964 Four Embarcadero Center Suite 550 San Francisco, CA 94111 Vice President and Secretary | | Since 2005 | | Head of Fund Administration (since 2009), Chief Administrative Officer (2007– 2008), Chief Operating Officer (2004–2007), Matthews (investment management); Vice President and Secretary (2013-2017), Matthews A Share Selections Fund, LLC (registered investment company); Director (since 2010), Matthews Asia Funds SICAV (Luxembourg) (investments); Director (2010–2020), Matthews Global Investors S.à r.l. (Luxembourg) (investment management); Director (since 2004), Matthews Asian Selections Funds, PLC (Ireland) (investments). | | Director, Matthews Asian Selections Funds Plc (1 Portfolio); Director, Matthews Asia Funds SICAV (Luxembourg) (12 Portfolios). |
| | | |
SHAI A. MALKA Born 1973 Four Embarcadero Center Suite 550 San Francisco, CA 94111 Treasurer | | Since 2005 | | Vice President of Fund Accounting and Operations (since 2010), Senior Manager of Fund Accounting and Operations (2004–2009), Matthews (investment management); Treasurer (2013-2017), Matthews A Share Selections Fund, LLC (registered investment company). | | None |
| | | |
DAVID MONROE Born 1963 Four Embarcadero Center Suite 550 San Francisco, CA 94111 Vice President | | Since 2014 | | General Counsel (since 2015), Deputy General Counsel (2014), Matthews (investment management); Chief Legal Officer (2006–2013), Nikko Asset Management Co., Ltd. (investment management). | | None |
| | | |
GAZALA KHAN Born 1969 Four Embarcadero Center Suite 550 San Francisco, CA 94111 Chief Compliance Officer and Anti-Money Laundering Officer | | Since 2019 | | Chief Compliance Officer and Anti-Money Laundering Officer (since 2019), Matthews Asia Funds (registered investment company); Chief Compliance Officer (2009-2019), Goldman Sachs Trust and Variable Insurance Trust (registered investment company). | | None |
| 1 | Each trustee serves for an indefinite term, until retirement age or until his/her successor is elected. Officers serve at the pleasure of the Board of Trustees. |
| | | | |
| matthewsasia.com | 800.789.ASIA | | | 175 | |
| | | | |
| Matthews Asia Funds | | | | |
| | |
INVESTMENT ADVISOR Matthews International Capital Management, LLC Four Embarcadero Center, Suite 550 San Francisco, CA 94111 800.789.ASIA CUSTODIAN Brown Brothers Harriman & Co. 50 Post Office Square Boston, MA 02110 | | ACCOUNT SERVICES Matthews Asia Funds P.O. Box 9791 Providence, RI 02940 800.789.ASIA LEGAL COUNSEL Paul Hastings LLP 101 California Street, 48th Floor San Francisco, CA 94111 | | ADMINISTRATOR & TRANSFER AGENT BNY Mellon 760 Moore Road King of Prussia, PA 19406 |

P.O. Box 9791 | Providence, RI 02940 | matthewsasia.com | 800.789.ASIA (2742)
Matthews Asia Funds are distributed in the United States by Foreside Funds Distributors LLC, Berwyn, Pennsylvania
Matthews Asia Funds are distributed in Latin America by HMC Partners

AR-1220
(b) Not applicable.
| | (a) | The registrant, as of the end of the period covered by this report, has adopted a code of ethics that applies to the registrant’s principal executive officer, principal financial officer, principal accounting officer or controller, or persons performing similar functions, regardless of whether these individuals are employed by the registrant or a third party. |
| | (c) | There have been no amendments, during the period covered by this report, to a provision of the code of ethics that applies to the registrant’s principal executive officer, principal financial officer, principal accounting officer or controller, or persons performing similar functions, regardless of whether these individuals are employed by the registrant or a third party, and that relates to any element of the code of ethics description. |
| | (d) | The registrant has not granted any waivers, including an implicit waiver, from a provision of the code of ethics that applies to the registrant’s principal executive officer, principal financial officer, principal accounting officer or controller, or persons performing similar functions, regardless of whether these individuals are employed by the registrant or a third party, that relates to one or more of the items set forth in paragraph (b) of this item’s instructions. |
| Item 3. | Audit Committee Financial Expert. |
| | (a) | As of the end of the period covered by the report, the registrant’s board of directors has determined that the registrant has four audit committee financial experts serving on its audit committee, Toshi Shibano, Jonathan F. Zeschin, Richard K. Lyons and Christopher F. Lee, each of whom is “independent.” |
| | (b) | Prof. Shibano is a member of the Faculty of the General Electric Corporate Leadership Development Center. He has served as an Executive Education Lecturer at the Haas School of Business at the University of California, Berkeley, an Adjunct Professor at the Columbia Graduate School of Business, and on the faculties of Thunderbird American Graduate School of International Management, Stanford Graduate School of Business, the University of Chicago School of Business and the Australian Graduate School of Management at the University of New South Wales. He regularly reviews current research in accounting both for use in instruction of courses and for internal faculty evaluation. He has experience analyzing and evaluating financial statements at the appropriate level of complexity through his professional activities on the educational faculties referenced above. |
Prof. Shibano also has extensive experience in executive education worldwide (Hong Kong, Taiwan, Singapore, Finland, Italy, Mexico, India) and has developed innovative new programs in financial analysis, management control systems and strategy implementation. Prof. Shibano has published in the Journal of Accounting Research, the Journal of Accounting and Economics, the Rand Journal of Economics, and the Journal of Applied Corporate Finance, on the topics of strategic audit risk, accounting standard setting, international accounting standards, tax minimization, foreign currency risk management, and organizational structure. Prof. Shibano received his MBA from the Haas School at UC Berkeley and earned his PhD at the Stanford Graduate School of Business, earning the highest academic honors in both programs. Prof. Shibano has gained additional accounting expertise as a member and former Chair of the Audit Committee of Matthews International Funds.
Mr. Zeschin is Partner of Essential Investment Partners, LLC, a wealth management and investment advisory firm. He is also the portfolio manager for that firm’s Essential Growth Portfolio. Essential Investment Partners, LLC succeeded to the business of Essential Advisers, Inc. Prior to forming Essential Advisers, Inc., Mr. Zeschin held senior executive positions with Founders Asset Management, Inc., Invesco Funds Group, and Stein Roe & Farnham, Inc. Mr. Zeschin holds a Masters of Management from the Kellogg School at Northwestern University, with majors in Finance and Marketing, and a Bachelor in Business Administration in Accounting with distinction from the University of Michigan. He holds a Certified Public Accountant license from the state of Colorado and is a Certified Financial Planner certificant. Mr. Zeschin is a former chair of the ICI’s Accounting Treasurer’s Committee and a former member of the AICPA Investment Companies committee. Mr. Zeschin was previously the chairman of the Board of Trustees of two NYSE listed closed-end funds. He has served on the audit committees of mutual fund boards since 2002. He has experience analyzing and evaluating financial statements at the appropriate level of complexity through his professional activities referenced above. Mr. Zeschin has gained additional accounting expertise as a member of the Audit Committee of Matthews International Funds.
Mr. Lyons is a Professor of Finance and Economics at the Haas School of Business at the University of California, Berkeley, and has served as the university’s Chief Innovation and
Entrepreneurship Officer since 2020. Mr. Lyons oversaw the accounting and finance functions at the Haas School of Business when he served as Dean from 2008 to 2018. From 2006 to 2008 Mr. Lyons was on leave from UC Berkeley to serve as Chief Learning Officer at Goldman Sachs. In that role he interacted regularly with the leadership of the Securities Division, which oversees all Sales and Trading at Goldman Sachs. His teaching is primarily in International Finance and Currency Markets in both the MBA and Master’s in Financial Engineering programs. These courses include content on international accounting standards. His research for over two decades has been on the functioning of currency markets and, more recently, on the functioning of cryptocurrency markets.
Mr. Lee is an associate professor (part-time) of science practice in financial mathematics at the Hong Kong University of Science & Technology where he teaches courses in capital markets and risk management. In addition, Mr. Lee was the chairman and currently is a member of the Audit Committee of Hong Kong Securities and Investment Institute (HKSI). HKSI conducts all the licensing examinations and professional development of securities professionals in Hong Kong. Since HKSI receives funding from the Securities and Futures Commission and the Financial Services & Treasury Bureau of Hong Kong, the Audit Committee must provide the oversight in selecting professional auditing firms and preparing annual financial reports that are in compliance with government rules and regulations. Furthermore, Mr. Lee has served as a member of the Audit Committee at other large organizations such as the Oakland Museum of California and the Washington DC based African Wildlife Foundation. Mr. Lee was designated as Chair of the Audit Committee of Matthews International Funds on November 19, 2020.
| Item 4. | Principal Accountant Fees and Services. |
Audit Fees
| | (a) | The aggregate fees billed for each of the last two fiscal years for professional services rendered by the principal accountant for the audit of the registrant’s annual financial statements or services that are normally provided by the accountant in connection with statutory and regulatory filings or engagements for those fiscal years are $575,080 in 2019 and $569,330 in 2020. |
Audit-Related Fees
| | (b) | The aggregate fees billed in each of the last two fiscal years for assurance and related services by the principal accountant that are reasonably related to the performance of the audit of the registrant’s financial statements and are not reported under paragraph (a) of this Item are $0 in 2019 and $0 in 2020. |
Tax Fees
| | (c) | The aggregate fees billed in each of the last two fiscal years for professional services rendered by the principal accountant for tax compliance, tax advice, and tax planning are $150,170 in 2019 and $155,322 in 2020. Tax fees include services provided by the principal accountant for tax return preparations. |
All Other Fees
| | (d) | The aggregate fees billed in each of the last two fiscal years for products and services provided by the principal accountant, other than the services reported in paragraphs (a) through (c) of this Item are $0 in 2019 and $0 in 2020. |
| | (e)(1) | Disclose the audit committee’s pre-approval policies and procedures described in paragraph (c)(7) of Rule 2-01 of Regulation S-X. |
Pre-Approval of Auditor Services.
Pre-Approval Requirements. Before the Auditor is engaged by the Trust to render audit related or permissible non-audit services, either:
| | (i) | The Audit Committee shall pre-approve all audit related services and permissible non-audit services (e.g., tax services) to be provided to the Trust; or |
| | (ii) | The Audit Committee shall establish policies and procedures governing the Auditor’s engagement. Any such policies and procedures must (1) be detailed as to the particular service and (2) not involve any delegation of the Audit Committee’s responsibilities to the Adviser. The Audit Committee may delegate to one or more of its members the authority to grant pre-approvals. The pre-approval policies and procedures shall include the requirement that the decisions of any member to whom authority is delegated under this Section 4(e) shall be presented to the full Audit Committee at its next scheduled meeting. |
De Minimis Exceptions to Pre-Approval Requirements. Pre-approval for a service provided to the Trust other than audit, review or attest services is not required if: (1) the aggregate amount of all such non-audit services provided to the Trust constitutes not more than 5 percent of the total amount of revenues paid by the Trust to the Auditor during the fiscal year in which the non-audit services are provided; (2) such services were not recognized by the Trust at the time of the engagement to be non-audit services; and (3) such services are promptly brought to the attention of the Audit Committee and are approved by the Audit Committee or by one or more members of the Audit Committee to whom authority to grant such approvals has been delegated by the Audit Committee.
Pre-Approval of Non-Audit Services Provided to the Adviser and Certain Control Persons. With respect to services that have a direct impact on the operations or financial reporting of the Trust, the Audit Committee shall pre-approve all such non-audit services proposed to be provided by the Auditor to (i) the Adviser and (ii) any entity controlling, controlled by, or under common control with the Adviser that provides ongoing services to the Trust.
Application of De Minimis Exception: The de minimis exceptions set forth above under Section 4(e)(ii) apply to pre-approvals under this Section 4(e)(iii) as well, except that the “total amount of revenues” calculation for Section 4(e)(iii) services is based on the total amount of revenues paid to the Auditor by the Trust and any other entity that has its services approved under this Section (i.e., the Adviser or any control person).
| | (e)(2) | The percentage of services described in each of paragraphs (b) through (d) of this Item that were approved by the audit committee pursuant to paragraph (c)(7)(i)(C) of Rule 2-01 of Regulation S-X are as follows: |
| | (f) | The percentage of hours expended on the principal accountant’s engagement to audit the registrant’s financial statements for the most recent fiscal year that were attributed to work performed by persons other than the principal accountant’s full-time, permanent employees was 0%. |
| | (g) | The aggregate non-audit fees billed by the registrant’s accountant for services rendered to the registrant, and rendered to the registrant’s investment adviser (not including any sub-adviser whose role is primarily portfolio management and is subcontracted with or overseen by another investment adviser), and any entity controlling, controlled by, or under common control with the adviser that provides ongoing services to the registrant for each of the last two fiscal years of the registrant was $582,960 in 2019 and $564,492 in 2020. |
| | (h) | The registrant’s audit committee of the board of directors has considered whether the provision of non-audit services that were rendered to the registrant’s investment adviser (not including any sub-adviser whose role is primarily portfolio management and is subcontracted with or overseen by another investment adviser), and any entity controlling, controlled by, or under common control with the investment adviser that provides ongoing services to the registrant that were not pre-approved pursuant to paragraph (c)(7)(ii) of Rule 2-01 of Regulation S-X is compatible with maintaining the principal accountant’s independence. |
| Item 5. | Audit Committee of Listed Registrants. |
Not applicable.
| (a) | Schedule of Investments in securities of unaffiliated issuers as of the close of the reporting period is included as part of the report to shareholders filed under Item 1(a) of this form. |
| Item 7. | Disclosure of Proxy Voting Policies and Procedures for Closed-End Management Investment Companies. |
Not applicable.
| Item 8. | Portfolio Managers of Closed-End Management Investment Companies. |
Not applicable.
| Item 9. | Purchases of Equity Securities by Closed-End Management Investment Company and Affiliated Purchasers. |
Not applicable.
| Item 10. | Submission of Matters to a Vote of Security Holders. |
There have been no material changes to the procedures by which the shareholders may recommend nominees to the registrant’s board of directors, where those changes were implemented after the registrant last provided disclosure in response to the requirements of Item 407(c)(2)(iv) of Regulation S-K (17 CFR 229.407) (as required by Item 22(b)(15) of Schedule 14A (17 CFR 240.14a-101)), or this Item.
| Item 11. | Controls and Procedures. |
| | (a) | The registrant’s principal executive and principal financial officers, or persons performing similar functions, have concluded that the registrant’s disclosure controls and procedures (as defined in Rule 30a-3(c) under the Investment Company Act of 1940, as amended (the “1940 Act”) (17 CFR 270.30a-3(c))) are effective, as of a date within 90 days of the filing date of the report that includes the disclosure required by this paragraph, based on their evaluation of these controls and procedures required by Rule 30a-3(b) under the 1940 Act (17 CFR 270.30a-3(b)) and Rules 13a-15(b) or 15d-15(b) under the Securities Exchange Act of 1934, as amended (17 CFR 240.13a-15(b) or 240.15d-15(b)). |
| | (b) | There were no changes in the registrant’s internal control over financial reporting (as defined in Rule 30a-3(d) under the 1940 Act (17 CFR 270.30a-3(d))) that occurred during the period covered by this report that has materially affected, or is reasonably likely to materially affect, the registrant’s internal control over financial reporting. |
| Item 12. | Disclosure of Securities Lending Activities for Closed-End Management Investment Companies. |
Not applicable.
SIGNATURES
Pursuant to the requirements of the Securities Exchange Act of 1934 and the Investment Company Act of 1940, the registrant has duly caused this report to be signed on its behalf by the undersigned, thereunto duly authorized.
| | | | |
| (Registrant) | | Matthews International Funds | | |
| | |
| By (Signature and Title)* | | /s/ William J. Hackett | | |
| | William J. Hackett, President | | |
| | (principal executive officer) | | |
| | |
| Date | | March 5, 2021 | | |
Pursuant to the requirements of the Securities Exchange Act of 1934 and the Investment Company Act of 1940, this report has been signed below by the following persons on behalf of the registrant and in the capacities and on the dates indicated.
| | | | |
| By (Signature and Title)* | | /s/ William J. Hackett | | |
| | William J. Hackett, President | | |
| | (principal executive officer) | | |
| | |
| Date | | March 5, 2021 | | |
| | |
| By (Signature and Title)* | | /s/ Shai Malka | | |
| | Shai Malka, Treasurer | | |
| | (principal financial officer) | | |
| | |
| Date | | March 5, 2021 | | |
| * | Print the name and title of each signing officer under his or her signature. |