UNITED STATES
SECURITIES AND EXCHANGE COMMISSION
Washington, D.C. 20549
FORM N-CSR
CERTIFIED SHAREHOLDER REPORT OF REGISTERED MANAGEMENT
INVESTMENT COMPANIES
Investment Company Act File Number 811-08572
Bishop Street Funds
(Exact name of registrant as specified in charter)
SEI Investments
One Freedom Valley Drive
Oaks, PA 19456
(Address of principal executive offices)
c/o SEI Investments
One Freedom Valley Drive
Oaks, PA 19456
(Name and address of agent for service)
Registrant’s telephone number, including area code: 1-800-262-9565
Date of fiscal year end: December 31, 2021
Date of reporting period: December 31, 2021
| Item 1. | Reports to Stockholders. |
A copy of the report transmitted to stockholders pursuant to Rule 30e-1 under the Investment Company Act or 1940, as amended (the “Act”) (17 CFR § 270.30e-1), is attached hereto.
The Fund files its complete schedule of investments with the Securities and Exchange Commission (the “SEC”) for the first and third quarters of each fiscal year as an exhibit to its reports on Form N-PORT (Form N-Q for filings prior to March 31, 2020). The Fund’s Forms N-Q and N-PORT reports are available on the SEC’s website at http://www.sec.gov, and may be reviewed and copied at the SEC’s Public Reference Room in Washington, DC. Information on the operation of the Public Reference Room may be obtained by calling 1-800-SEC-0330.
A description of the policies and procedures that the Fund uses to determine how to vote proxies (if any) relating to portfolio securities is available without charge, by calling 1-800-262-9565 or by visiting the SEC’s website at http://www.sec.gov. Information regarding how the Fund voted proxies relating to portfolio securities during the most recent twelve-month period ended June 30 is available without charge, by calling 1-800-262-9565 or by visiting the Fund’s website at http://www.bishopstreetfunds. com or the website of the Securities and Exchange Commission.
| 2 | ||||
| 4 | ||||
| Hawaii Municipal Bond Fund | ||||
| 5 | ||||
| 8 | ||||
| 18 | ||||
| 19 | ||||
| 20 | ||||
| 22 | ||||
| 24 | ||||
| 34 | ||||
| 36 | ||||
| 38 | ||||
| 40 | ||||
1

Dear Shareholder:
2021 was in many ways a year for the economic and financial record books, but will be remembered, sadly, as the second devastating chapter of the COVID pandemic. In last year’s edition of this letter, with the emergence of mass vaccinations and more effective therapies for COVID, we held out hope for continued economic recovery and an end to the pandemic. Looking back, our hopes for the economy and financial markets were more than fulfilled, but with the pandemic death toll continuing to rise and everyday life still dominated by the public health emergency, we confess to little appetite for celebration.
The facts, however, speak for themselves. Last year the U.S. economy grew 5.5% (adjusted for inflation), the fastest rate since 1984, and added 6.7 million jobs, the highest ever recorded. Including dividends, the S&P 500 Index of U.S. stocks returned a very strong 28.7% and has notched an average return of 18.5% annually over the past three years. Astoundingly, at the end of the year the S&P 500 had returned over 800% since the 2009 market bottom associated with the Great Financial Crisis. The bond market has been correspondingly subdued, losing about 1.5% in 2021 as interest rates pushed higher (bond prices are inversely related to interest rates).
Early in 2022, the stock market has given back some of its gains even as bonds continue to be pressured by higher rates, due largely to fears of high inflation and the prospect of tightening Fed monetary policy. Such fears are well-founded, as headline inflation has reached 7.5% and shows signs of spreading beyond the sectors impacted by supply-demand imbalances associated with the pandemic. We remain optimistic, however, that inflation will moderate before the Fed is forced into such aggressive monetary that it precipitates a “hard landing” for the economy. We are also encouraged by expected above-trend economic growth in 2022, boosted by the financial windfall of trillions of dollars of fiscal stimulus over the past two years that remains largely unspent.
If the economy is able to avoid worst-case scenarios due to inflation, the pandemic, and geopolitics, we are likely to see a decent year in the stock market and an indifferent year for bonds. These, however, are big “ifs”, and in our view most investors should continue to hold high-grade bonds as part of a diversified portfolio as a hedge against economic risk. As always, thank you for your continued trust and confidence.
| Bishop Street Funds |
2

Sincerely,

Ken Miller, CFA
Chairman, Chief Executive Officer and Chief Investment Officer
Bishop Street Capital Management
February 7, 2022
The performance data quoted represents past performance. Past performance does not guarantee future results. Index returns are for illustrative purposes only and do not represent actual Fund performance. Index performance returns do not reflect any management fees, transaction costs or expenses. Indexes are unmanaged and one cannot invest directly in an index.
Investing involves risk including possible loss of principal. Diversification does not protect against market loss.
| December 31, 2021 | www.bishopstreetfunds.com |
3
Definition of Comparative Index
The ICE BofAML 1-22 Year U.S. Municipal Securities Index is a subset of the ICE BofAML U.S. Municipal Securities Index including all securities with a remaining term to final maturity greater than or equal to 1 years and less than 22 years.
Ratings are measured on a scale that generally ranges from AAA (highest) to D (lowest).
| Bishop Street Funds |
4
Hawaii Municipal Bond Fund
By the end of 2021, the U.S. was in another wave of COVID-19, Congress recently passed a $1 trillion bipartisan infrastructure bill and the Federal Reserve had to react to inflationary pressures that were no longer transitory. Despite higher rates causing security prices to move lower during the year, municipals posted positive total returns in 2021. Municipals had a muted response to the Federal Reserve as strong demand from investors for tax free income coincided with a shrinking supply, as bonds called or matured outpaced new issuance.
The Hawaii economy continues to recover as tourism returns to the islands. By May of 2021, our visitor arrivals surpassed 2019 numbers, although expenditures have yet to rebound to pre-pandemic levels. The State of Hawaii Department of Budget and Finance projects Hawaii’s real gross domestic product to increase by 3.0% in 2022 and 2.3% in 2023 and the average annual unemployment rate to be 6.0% in 2022 and 5.2% in 2023. The strong return of tourism combined with recent Federal Stimulus should allow the financial position of Hawaii’s municipalities to continue to remain stable going forward.
The Bishop Street Hawaii Municipal Bond Fund returned 0.62% for the year, underperforming the ICE BofAML 1-22 Yr. US Municipal Securities Index which returned 1.23%. The Fund’s revenue bond allocation made positive contributions to performance while its short duration positioning and allocation to Hawaii bonds relative to the benchmark detracted from performance on a relative basis. The fund is positioned nicely for a rise in interest rates, relative to the benchmark, and continues to provide a steady stream of tax-exempt income from Federal and State income tax for Hawaii residents.
One basis point is 1/100 of one percent.
| December 31, 2021 | www.bishopstreetfunds.com |
5
The performance data quoted represents past performance. Past performance does not guarantee future results. The investment return and principal value of an investment will fluctuate so that an investor’s shares, when redeemed, may be worth more or less than their original cost and current performance may be higher or lower than the performance quoted. For performance data current to the most recent month end, please visit www.bishopstreetfunds.com or call 1-800-262-9565.
Index returns are for illustrative purposes only and do not represent actual Fund performance. Index performance returns do not reflect any management fees, transaction costs or expenses. Indexes are unmanaged and one cannot invest directly in an index.
This material represents an assessment of the market environment at a specific time and is not intended to be a forecast of future events or a guarantee of future results. This information should not be relied upon by the reader as research or investment advice regarding the funds or any security in particular.
Investing involves risk including possible loss of principal. Diversification does not protect against market loss.
| Bishop Street Funds |
6
| Hawaii Municipal Bond Fund |
Performance Comparison
Comparison of Change in the Value of a $1,000,000 Investment in the Hawaii Municipal Bond Fund, Class I*, versus the ICE BofAML 1-22 Year US Municipal Securities Index.
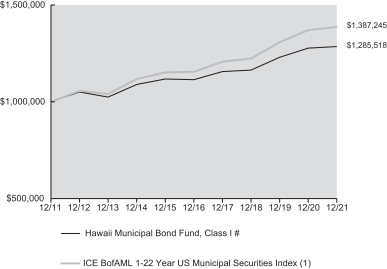
# Account value if you reinvested income and capital gains.
(1) See page 4 for definition of comparative index.
* The graph is based on only Class I Shares; performance for Class A would be different due to differences in fee structures.
| Average Annual Total Returns† | ||||||||||||||||
| One Year Return | Annualized 3 Year Return | Annualized 5 Year Return | Annualized 10 Year Return | |||||||||||||
| 0.62 | % | 3.37 | % | 2.89 | % | 2.54 | % | Hawaii Municipal Bond Fund, Class I | ||||||||
| 0.27 | % | 3.06 | % | 2.59 | % | 2.27 | % | Hawaii Municipal Bond Fund, Class A | ||||||||
| (2.76 | )% | 2.03 | % | 1.97 | % | 1.95 | % | Hawaii Municipal Bond Fund, Class A, withload** | ||||||||
| 1.23 | % | 4.27 | % | 3.73 | % | 3.33 | % | ICE BofAML 1-22 Year US Municipal Securities Index | ||||||||
| ** | Reflects 3.00% sales charge. |
| † | Returns shown do not reflect the deduction of taxes that a shareholder would pay on Fund distributions or the redemption of Fund shares. Fee waivers are in effect; if they had not been in effect, performance would have been lower. |
| December 31, 2021 | www.bishopstreetfunds.com |
7
| Hawaii Municipal Bond Fund |
Top Ten Holdings (Unaudited)†
| Coupon Rate | Maturity Date | Percentage of Investments | ||||||||||||||
| ||||||||||||||||
| 1. | Hawaii State, Department of Budget & Finance, Ser A | 5.000% | 07/01/35 | 2.7% | ||||||||||||
| ||||||||||||||||
| 2. | University of Hawaii, Ser F | 5.000% | 10/01/35 | 2.2% | ||||||||||||
| ||||||||||||||||
| 3. | Hawaii State, Department of Budget & Finance | 3.200% | 07/01/39 | 2.1% | ||||||||||||
| ||||||||||||||||
| 4. | Hawaii State, Ser FW | 5.000% | 01/01/37 | 1.9% | ||||||||||||
| ||||||||||||||||
| 5. | Hawaii State, Ser FK | 5.000% | 05/01/29 | 1.7% | ||||||||||||
| ||||||||||||||||
| 6. | Hawaii State, Airports System Authority, Ser A, AMT | 5.000% | 07/01/45 | 1.7% | ||||||||||||
| ||||||||||||||||
| 7. | Hawaii State, Ser ET | 4.000% | 10/01/26 | 1.7% | ||||||||||||
| ||||||||||||||||
| 8. | Hawaii State, Department of Transportation, Airports Division Lease Revenue, AMT | 5.000% | 08/01/28 | 1.7% | ||||||||||||
| ||||||||||||||||
| 9. | Maui County | 5.000% | 03/01/34 | 1.5% | ||||||||||||
| ||||||||||||||||
| 10. | Honolulu Hawaii City & County, Ser C | 5.000% | 08/01/44 | 1.3% | ||||||||||||
| † | Percentages based on total investments. Top ten holdings do not include short-term investments |
Face | Value (000) | |||||||
| MUNICIPAL BONDS — 97.6% | ||||||||
Alabama — 0.1% | ||||||||
| City of Phenix City Alabama, Ser A, GO | ||||||||
| $ | 75 | 3.000%, 02/01/22 | $ | 75 | ||||
|
| |||||||
Arkansas — 0.0% | ||||||||
| Little Rock School District, Sub-Ser, GO, ST AID WITHHLDG Insured | ||||||||
| 50 | 3.000%, 02/01/22 | 50 | ||||||
|
| |||||||
| Bishop Street Funds |
8
| Hawaii Municipal Bond Fund |
Schedule of Investments
Face | Value (000) | |||||||
California — 1.2% | ||||||||
| California State, GO | ||||||||
| $ | 90 | 3.000%, 03/01/22 | $ | 90 | ||||
| Milpitas Unified School District, Ser A, GO | ||||||||
| 35 | 5.000%, 08/01/22, Pre-Refunded @ 100 (A) | 36 | ||||||
| North Orange County, Community College District, Ser B, GO | ||||||||
| 75 | 4.000%, 08/01/22 | 77 | ||||||
| Orange County, Water District, Ser A, RB | ||||||||
| 1,000 | 5.000%, 08/15/23, Pre-Refunded @ 100 (A) | 1,077 | ||||||
| San Mateo Foster City, School District, Ser C, GO | ||||||||
| 35 | 3.500%, 08/01/22, Pre-Refunded @ 100 (A) | 36 | ||||||
| University of California, Ser AF, RB | ||||||||
| 255 | 5.000%, 05/15/23, Pre-Refunded @ 100 (A) | 271 | ||||||
|
| |||||||
| 1,587 | ||||||||
|
| |||||||
Colorado — 0.1% | ||||||||
| Denver City & County, School District No. 1, Ser B, GO, ST AID WITHHLDG Insured | ||||||||
| 100 | 5.000%, 12/01/22, Pre-Refunded @ 100 (A) | 104 | ||||||
| University of Colorado, Ser A-2, RB | ||||||||
| 45 | 5.000%, 06/01/22, Pre-Refunded @ 100 (A) | 46 | ||||||
|
| |||||||
| 150 | ||||||||
|
| |||||||
Florida — 0.2% | ||||||||
| Miami-Dade County, School Board, Ser D, COP | ||||||||
| 205 | 5.000%, 02/01/27 | 240 | ||||||
|
| |||||||
Hawaii — 92.1% | ||||||||
| Hawaii County, Ser A, GO | ||||||||
| 250 | 5.000%, 09/01/23 | 269 | ||||||
| 180 | 5.000%, 09/01/24 | 202 | ||||||
| 600 | 5.000%, 09/01/26 | 708 | ||||||
| 100 | 5.000%, 09/01/27 | 118 | ||||||
| 510 | 5.000%, 09/01/30 | 596 | ||||||
| 440 | 5.000%, 09/01/33 | 528 | ||||||
| 30 | 5.000%, 09/01/35 | 36 | ||||||
| 300 | 5.000%, 09/01/36 | 358 | ||||||
| 1,500 | 4.000%, 09/01/35 | 1,671 | ||||||
| 130 | 4.000%, 09/01/36 | 157 | ||||||
| Hawaii County, Ser C, GO | ||||||||
| 450 | 5.000%, 09/01/24 | 505 | ||||||
| 110 | 5.000%, 09/01/27 | 129 | ||||||
| Hawaii County, Ser D, GO | ||||||||
| 200 | 5.000%, 09/01/25 | 233 | ||||||
| 300 | 5.000%, 09/01/27 | 353 | ||||||
| December 31, 2021 | www.bishopstreetfunds.com |
9
| Hawaii Municipal Bond Fund |
Schedule of Investments
Face | Value (000) | |||||||
Hawaii — (continued) | ||||||||
| Hawaii State, Airports System Authority, Ser A, RB, AMT | ||||||||
| $ | 115 | 5.000%, 07/01/31 | $ | 140 | ||||
| 2,000 | 5.000%, 07/01/45 | 2,268 | ||||||
| Hawaii State, Airports System Authority, Ser D, RB | ||||||||
| 100 | 5.000%, 07/01/28 | 125 | ||||||
| 1,025 | 5.000%, 07/01/29 | 1,309 | ||||||
| 450 | 5.000%, 07/01/33 | 581 | ||||||
| 260 | 4.000%, 07/01/39 | 307 | ||||||
| Hawaii State, Airports System Authority, RB, AMT | ||||||||
| 665 | 5.000%, 07/01/24 | 684 | ||||||
| 1,000 | 4.125%, 07/01/24 | 1,003 | ||||||
| Hawaii State, Department of Budget & Finance, Pacific Health Project, Ser A, RB | ||||||||
| 820 | 6.000%, 07/01/33 | 888 | ||||||
| 310 | 4.000%, 01/01/24 | 328 | ||||||
| Hawaii State, Department of Budget & Finance, RB | ||||||||
| 100 | 5.500%, 07/01/43 | 107 | ||||||
| 475 | 5.125%, 07/01/31 | 507 | ||||||
| 300 | 5.000%, 07/01/26 | 320 | ||||||
| 100 | 5.000%, 07/01/28 | 107 | ||||||
| 200 | 5.000%, 07/01/29 | 213 | ||||||
| 50 | 4.625%, 07/01/27 | 53 | ||||||
| 140 | 4.000%, 01/01/26 | 155 | ||||||
| 250 | 4.000%, 01/01/31 | 290 | ||||||
| 350 | 3.250%, 01/01/25 | 373 | ||||||
| 2,615 | 3.200%, 07/01/39 | 2,852 | ||||||
| Hawaii State, Department of Budget & Finance, Ser A, RB | ||||||||
| 250 | 5.000%, 07/01/22 | 256 | ||||||
| 575 | 5.000%, 07/01/26 | 613 | ||||||
| 350 | 5.000%, 07/01/27 | 402 | ||||||
| 75 | 5.000%, 07/01/29 | 86 | ||||||
| 815 | 5.000%, 07/01/30 | 933 | ||||||
| 3,135 | 5.000%, 07/01/35 | 3,566 | ||||||
| 1,130 | 4.000%, 07/01/40 | 1,229 | ||||||
| Hawaii State, Department of Budget & Finance, Ser B, RB | ||||||||
| 775 | 5.000%, 07/01/28 | 826 | ||||||
| Hawaii State, Department of Hawaiian Home Lands, Kapolie Office Facilities, Ser A, COP, AGM | ||||||||
| 500 | 5.000%, 11/01/26 | 600 | ||||||
| Hawaii State, Department of Hawaiian Home Lands, RB | ||||||||
| 240 | 5.000%, 04/01/24 | 264 | ||||||
| 580 | 5.000%, 04/01/25 | 662 | ||||||
| 500 | 5.000%, 04/01/27 | 607 | ||||||
| 30 | 5.000%, 04/01/29 | 36 | ||||||
| 65 | 5.000%, 04/01/31 | 77 | ||||||
| Bishop Street Funds |
10
| Hawaii Municipal Bond Fund |
Schedule of Investments
Face | Value (000) | |||||||
Hawaii — (continued) | ||||||||
| Hawaii State, Department of Hawaiian Home Lands, Ser A, RB | ||||||||
| $ | 350 | 4.000%, 11/01/22 | $ | 361 | ||||
| Hawaii State, Department of Transportation, Airports Division Lease Revenue, COP, AMT | ||||||||
| 1,045 | 5.000%, 08/01/27 | 1,117 | ||||||
| 2,075 | 5.000%, 08/01/28 | 2,218 | ||||||
| Hawaii State, Department of Transportation, COP, AMT | ||||||||
| 500 | 5.250%, 08/01/25 | 536 | ||||||
| Hawaii State, Harbor System Revenue, Ser A, RB, AMT | ||||||||
| 1,000 | 5.000%, 07/01/24 | 1,108 | ||||||
| 1,000 | 5.000%, 07/01/26 | 1,183 | ||||||
| 450 | 4.000%, 07/01/36 | 537 | ||||||
| Hawaii State, Harbor System Revenue, Ser C, RB | ||||||||
| 1,250 | 4.000%, 07/01/32 | 1,519 | ||||||
| 75 | 4.000%, 07/01/38 | 90 | ||||||
| 1,000 | 4.000%, 07/01/39 | 1,195 | ||||||
| 800 | 4.000%, 07/01/40 | 954 | ||||||
| Hawaii State, Highway Revenue, RB | ||||||||
| 1,080 | 5.000%, 01/01/37 | 1,413 | ||||||
| 355 | 5.000%, 01/01/40 | 462 | ||||||
| Hawaii State, Highway Revenue, Ser A, RB | ||||||||
| 500 | 5.000%, 01/01/22, Pre-Refunded @ 100 (A) | 500 | ||||||
| 125 | 5.000%, 01/01/24 | 137 | ||||||
| 215 | 5.000%, 01/01/25 | 239 | ||||||
| 965 | 5.000%, 01/01/30 | 1,153 | ||||||
| 1,045 | 5.000%, 01/01/33 | 1,158 | ||||||
| 1,200 | 4.000%, 01/01/26 | 1,200 | ||||||
| 500 | 4.000%, 01/01/32 | 568 | ||||||
| 250 | 4.000%, 01/01/36 | 283 | ||||||
| Hawaii State, Highway Revenue, Ser B, RB | ||||||||
| 205 | 5.000%, 01/01/24 | 224 | ||||||
| Hawaii State, Housing Finance & Development, Kuhio Park Terrace Multi-Family Housing, Ser A, RB | ||||||||
| 200 | 3.900%, 04/01/22 | 201 | ||||||
| Hawaii State, Housing Finance & Development, Wilikina Apartments Project, Ser A, RB | ||||||||
| 1,000 | 5.000%, 05/01/34 | 1,007 | ||||||
| Hawaii State, Ser EE, GO | ||||||||
| 185 | 5.000%, 11/01/22, Pre-Refunded @ 100 (A) | 193 | ||||||
| Hawaii State, Ser EE-2017, GO | ||||||||
| 85 | 5.000%, 11/01/22, Pre-Refunded @ 100 (A) | 88 | ||||||
| Hawaii State, Ser EF, GO | ||||||||
| 1,090 | 5.000%, 11/01/22, Pre-Refunded @ 100 (A) | 1,134 | ||||||
| December 31, 2021 | www.bishopstreetfunds.com |
11
| Hawaii Municipal Bond Fund |
Schedule of Investments
Face | Value (000) | |||||||
Hawaii — (continued) | ||||||||
| Hawaii State, Ser EH, GO | ||||||||
| $ | 975 | 5.000%, 08/01/23, Pre-Refunded @ 100 (A) | $ | 1,047 | ||||
| Hawaii State, Ser EH-2017, GO | ||||||||
| 95 | 5.000%, 08/01/23 (B) | 102 | ||||||
| Hawaii State, Ser EO, GO | ||||||||
| 1,460 | 5.000%, 08/01/24, Pre-Refunded @ 100 (A) | 1,633 | ||||||
| 1,195 | 5.000%, 08/01/29 | 1,330 | ||||||
| 1,105 | 5.000%, 08/01/30 | 1,230 | ||||||
| Hawaii State, Ser EP, GO | ||||||||
| 75 | 5.000%, 08/01/24, Pre-Refunded @ 100 (A) | 84 | ||||||
| Hawaii State, Ser ET, GO | ||||||||
| 450 | 5.000%, 10/01/25, Pre-Refunded @ 100 (A) | 525 | ||||||
| 2,000 | 4.000%, 10/01/26 | 2,258 | ||||||
| Hawaii State, Ser FB, GO | ||||||||
| 50 | 4.000%, 04/01/29 | 57 | ||||||
| 450 | 3.000%, 04/01/35 | 481 | ||||||
| Hawaii State, Ser FG, GO | ||||||||
| 95 | 5.000%, 10/01/27 | 114 | ||||||
| 85 | 5.000%, 10/01/28 | 102 | ||||||
| 500 | 5.000%, 10/01/30 | 598 | ||||||
| 210 | 5.000%, 10/01/31 | 251 | ||||||
| Hawaii State, Ser FH, GO | ||||||||
| 100 | 5.000%, 10/01/27 | 120 | ||||||
| 75 | 4.000%, 10/01/31 | 86 | ||||||
| Hawaii State, Ser FK, GO | ||||||||
| 1,915 | 5.000%, 05/01/29 | 2,332 | ||||||
| Hawaii State, Ser FN-REF, GO | ||||||||
| 685 | 5.000%, 10/01/30 | 842 | ||||||
| Hawaii State, Ser FT, GO | ||||||||
| 170 | 5.000%, 01/01/30 | 210 | ||||||
| 835 | 5.000%, 01/01/31 | 1,028 | ||||||
| Hawaii State, Ser FW, GO | ||||||||
| 975 | 5.000%, 01/01/30 | 1,239 | ||||||
| 2,040 | 5.000%, 01/01/37 | 2,559 | ||||||
| 1,210 | 5.000%, 01/01/39 | 1,513 | ||||||
| Hawaii State, Ser GG, GO | ||||||||
| 1,000 | 0.247%, 08/01/22 | 999 | ||||||
| Honolulu Hawaii City & County, Board of Water Supply, Ser A, RB | ||||||||
| 680 | 5.000%, 07/01/22, Pre-Refunded @ 100 (A) | 696 | ||||||
| 235 | 5.000%, 07/01/23 | 252 | ||||||
| 525 | 5.000%, 07/01/24 | 584 | ||||||
| 250 | 5.000%, 07/01/24, Pre-Refunded @ 100 (A) | 279 | ||||||
| Bishop Street Funds |
12
| Hawaii Municipal Bond Fund |
Schedule of Investments
Face | Value (000) | |||||||
Hawaii — (continued) | ||||||||
| $ | 1,000 | 5.000%, 07/01/25 | $ | 1,113 | ||||
| 500 | 5.000%, 07/01/26 | 596 | ||||||
| 100 | 5.000%, 07/01/27 | 123 | ||||||
| 50 | 4.500%, 07/01/22, Pre-Refunded @ 100 (A) | 51 | ||||||
| 1,000 | 4.000%, 07/01/38 | 1,233 | ||||||
| 1,000 | 4.000%, 07/01/40 | 1,229 | ||||||
| Honolulu Hawaii City & County, GO | ||||||||
| 65 | 5.000%, 09/01/23 | 70 | ||||||
| 250 | 4.000%, 09/01/33 | 295 | ||||||
| 690 | 3.000%, 07/01/33 | 782 | ||||||
| 1,330 | 3.000%, 07/01/34 | 1,504 | ||||||
| 1,000 | 3.000%, 07/01/37 | 1,119 | ||||||
| Honolulu Hawaii City & County, Ser A, GO | ||||||||
| 50 | 5.000%, 11/01/22, Pre-Refunded @ 100 (A) | 52 | ||||||
| 1,000 | 5.000%, 10/01/23 | 1,082 | ||||||
| 350 | 5.000%, 10/01/29 | 406 | ||||||
| 800 | 5.000%, 10/01/31 | 924 | ||||||
| 530 | 5.000%, 09/01/32 | 647 | ||||||
| 1,420 | 5.000%, 10/01/32 | 1,639 | ||||||
| 200 | 5.000%, 10/01/36 | 230 | ||||||
| 1,500 | 5.000%, 10/01/37 | 1,722 | ||||||
| 1,175 | 5.000%, 09/01/38 | 1,460 | ||||||
| 25 | 4.000%, 11/01/22, Pre-Refunded @ 100 (A) | 26 | ||||||
| 750 | 4.000%, 07/01/34 | 933 | ||||||
| Honolulu Hawaii City & County, Ser B, GO | ||||||||
| 40 | 5.000%, 09/01/22 | 41 | ||||||
| 280 | 5.000%, 11/01/22 | 291 | ||||||
| 200 | 5.000%, 11/01/24 | 208 | ||||||
| 1,010 | 5.000%, 11/01/25 | 1,049 | ||||||
| Honolulu Hawaii City & County, Ser C, GO | ||||||||
| 730 | 5.000%, 08/01/34 | 935 | ||||||
| 1,400 | 5.000%, 08/01/44 | 1,763 | ||||||
| 225 | 4.000%, 08/01/22 | 230 | ||||||
| 1,200 | 4.000%, 08/01/23 | 1,271 | ||||||
| 1,400 | 4.000%, 10/01/32 | 1,589 | ||||||
| 145 | 3.000%, 10/01/28 | 156 | ||||||
| Honolulu Hawaii City & County, Ser D, GO | ||||||||
| 805 | 5.000%, 07/01/23 | 862 | ||||||
| Honolulu Hawaii City & County, Ser F, GO | ||||||||
| 625 | 5.000%, 07/01/33 | 817 | ||||||
| Honolulu Hawaii City & County, Wastewater System Revenue, RB | ||||||||
| 1,000 | 5.000%, 07/01/25, Pre-Refunded @ 100 (A) | 1,157 | ||||||
| 500 | 5.000%, 07/01/39 | 632 | ||||||
| December 31, 2021 | www.bishopstreetfunds.com |
13
| Hawaii Municipal Bond Fund |
Schedule of Investments
Face | Value (000) | |||||||
Hawaii — (continued) | ||||||||
| Honolulu Hawaii City & County, Wastewater System Revenue, Ser A, RB | ||||||||
| $ | 50 | 5.000%, 07/01/22 | $ | 51 | ||||
| 115 | 5.000%, 07/01/22, Pre-Refunded @ 100 (A) | 117 | ||||||
| 300 | 5.000%, 07/01/24 | 334 | ||||||
| 775 | 5.000%, 07/01/26 | 894 | ||||||
| 575 | 5.000%, 07/01/49 | 716 | ||||||
| 1,420 | 4.000%, 07/01/39 | 1,689 | ||||||
| Honolulu Hawaii City & County, Wastewater System Revenue, Ser B, RB | ||||||||
| 730 | 5.000%, 07/01/23 | 782 | ||||||
| 25 | 4.000%, 07/01/22, Pre-Refunded @ 100 (A) | 25 | ||||||
| 100 | 4.000%, 07/01/32 | 113 | ||||||
| 710 | 4.000%, 07/01/33 | 804 | ||||||
| Honolulu Hawaii City & County, Wastewater System Revenue, Ser S, RB | ||||||||
| 125 | 5.000%, 07/01/24 | 139 | ||||||
| 105 | 5.000%, 07/01/27 | 121 | ||||||
| Kauai County, GO | ||||||||
| 150 | 5.000%, 08/01/26 | 179 | ||||||
| 25 | 5.000%, 08/01/30 | 31 | ||||||
| 250 | 5.000%, 08/01/37 | 302 | ||||||
| Kauai County, Ser A, GO | ||||||||
| 500 | 5.000%, 08/01/22, Pre-Refunded @ 100 (A) | 514 | ||||||
| 315 | 4.000%, 08/01/22, Pre-Refunded @ 100 (A) | 322 | ||||||
| Maui County, GO | ||||||||
| 460 | 5.000%, 03/01/24 | 506 | ||||||
| 430 | 5.000%, 03/01/27 | 525 | ||||||
| 450 | 5.000%, 03/01/29 | 577 | ||||||
| 1,550 | 5.000%, 03/01/34 | 2,050 | ||||||
| 450 | 4.000%, 03/01/36 | 552 | ||||||
| Maui County, RB | ||||||||
| 1,500 | 3.250%, 09/01/36 | 1,664 | ||||||
| University of Hawaii, Ser B, RB | ||||||||
| 500 | 5.000%, 10/01/27 | 618 | ||||||
| 1,500 | 5.000%, 10/01/34 | 1,728 | ||||||
| 1,000 | 4.000%, 10/01/23 | 1,064 | ||||||
| University of Hawaii, Ser D, RB | ||||||||
| 575 | 5.000%, 10/01/25 | 670 | ||||||
| 700 | 4.000%, 10/01/32 | 855 | ||||||
| University of Hawaii, Ser E, RB | ||||||||
| 1,485 | 5.000%, 10/01/25 | 1,731 | ||||||
| 1,375 | 5.000%, 10/01/32 | 1,634 | ||||||
| Bishop Street Funds |
14
| Hawaii Municipal Bond Fund |
Schedule of Investments
Face | Value (000) | |||||||
Hawaii — (continued) | ||||||||
| University of Hawaii, Ser F, RB | ||||||||
| $ | 100 | 5.000%, 10/01/27 | $ | 124 | ||||
| 2,425 | 5.000%, 10/01/35 | 2,968 | ||||||
|
| |||||||
| 124,595 | ||||||||
|
| |||||||
Indiana — 0.0% | ||||||||
| Indiana State, Municipal Power Agency, Ser A, RB | ||||||||
| 55 | 5.000%, 01/01/22 | 55 | ||||||
|
| |||||||
Kentucky — 0.1% | ||||||||
| Kentucky State, Public Energy Authority, Ser B, RB | ||||||||
| 200 | 4.000%, 07/01/22 | 204 | ||||||
|
| |||||||
Massachusetts — 0.1% | ||||||||
| Massachusetts Port Authority, Ser B, RB | ||||||||
| 50 | 4.000%, 07/01/22 (B) | 51 | ||||||
| Massachusetts School Building Authority, Ser A, RB | ||||||||
| 70 | 4.000%, 08/15/22 (B) | 72 | ||||||
|
| |||||||
| 123 | ||||||||
|
| |||||||
Michigan — 0.1% | ||||||||
| Michigan State, Strategic Fund, RB, CNTY GTD insured | ||||||||
| 105 | 5.000%, 03/01/22 | 106 | ||||||
|
| |||||||
New Jersey — 0.0% | ||||||||
| Camden County, Improvement Authority, RB | ||||||||
| 50 | 5.000%, 01/15/22, Pre-Refunded @ 100 (A) | 50 | ||||||
|
| |||||||
New York — 1.1% | ||||||||
| Metropolitan Transportation Authority, Ser B, RB | ||||||||
| 50 | 5.000%, 11/15/23 | 54 | ||||||
| Metropolitan Transportation Authority, Ser C, RB | ||||||||
| 55 | 5.000%, 11/15/22 (B) | 57 | ||||||
| New York City, Trust for Cultural Resources, Ser S, RB | ||||||||
| 1,000 | 5.000%, 07/01/41 | 1,102 | ||||||
| New York City, Water & Sewer System, RB | ||||||||
| 85 | 5.000%, 06/15/22, Pre-Refunded @ 100 (A) | 87 | ||||||
| New York City, Water & Sewer System, Ser EE, RB | ||||||||
| 50 | 4.000%, 06/15/22, Pre-Refunded @ 100 (A) | 51 | ||||||
| New York State, Bridge Authority, RB | ||||||||
| 100 | 4.000%, 01/01/22, Pre-Refunded @ 100 (A) | 100 | ||||||
| Triborough, Bridge & Tunnel Authority, Ser A, RB | ||||||||
| 60 | 5.000%, 01/01/22, Pre-Refunded @ 100 (A) | 60 | ||||||
|
| |||||||
| 1,511 | ||||||||
|
| |||||||
| December 31, 2021 | www.bishopstreetfunds.com |
15
| Hawaii Municipal Bond Fund |
Schedule of Investments
Face | Value (000) | |||||||
Oklahoma — 0.5% | ||||||||
| Comanche County, Educational Facilities Authority, Ser A, RB | ||||||||
| $ | 500 | 5.000%, 12/01/30 | $ | 610 | ||||
| Oklahoma State, Development Finance Authority, RB | ||||||||
| 19 | 5.000%, 06/01/44 | 21 | ||||||
|
| |||||||
| 631 | ||||||||
|
| |||||||
Oregon — 0.1% | ||||||||
| City of Portland Oregon, Oregon Limited Tax Revenue Bonds, Oregon Convention Center Completion Project, Ser B, GO | ||||||||
| 100 | 0.130%, 06/01/22 (C) | 100 | ||||||
|
| |||||||
South Dakota — 0.0% | ||||||||
| Sioux Falls, School District No. 49-5, GO | ||||||||
| 50 | 3.500%, 01/01/22, Pre-Refunded @ 100 (A) | 50 | ||||||
|
| |||||||
Tennessee — 0.3% | ||||||||
| Crossville Tennessee, Water & Sewer Revenue, Ser C, RB | ||||||||
| 350 | 4.000%, 06/01/22 | 355 | ||||||
|
| |||||||
Texas — 1.0% | ||||||||
| City of Killeen, GO | ||||||||
| 55 | 5.000%, 08/01/22, Pre-Refunded @ 100 (A) | 57 | ||||||
| City of San Antonio, GO | ||||||||
| 60 | 4.000%, 08/01/22, Pre-Refunded @ 100 (A) | 61 | ||||||
| Dallas, Independent School District, GO, PSF-GTD Insured | ||||||||
| 90 | 5.000%, 02/15/22, Pre-Refunded @ 100 (A)(D) | 90 | ||||||
| Tomball City, Independent School District, GO, PSF-GTD Insured | ||||||||
| 1,000 | 5.000%, 02/15/28 | 1,135 | ||||||
|
| |||||||
| 1,343 | ||||||||
|
| |||||||
Utah — 0.4% | ||||||||
| Utah State, Charter School Finance Authority, Ser A, RB, UT CSCE Insured | ||||||||
| 450 | 4.000%, 10/15/40 | 480 | ||||||
|
| |||||||
Washington — 0.2% | ||||||||
| Grant & Douglas Counties, School District No. 165-55J Ephrata, GO, SCH BD GTY Insured | ||||||||
| 200 | 5.000%, 12/01/22 | 208 | ||||||
| Grant County, Public Utility District No. 2 Electric Revenue, Ser 2017-O, RB | ||||||||
| 100 | 5.000%, 01/01/22 | 100 | ||||||
|
| |||||||
| 308 | ||||||||
|
| |||||||
| TOTAL MUNICIPAL BONDS (Cost $128,543) | 132,013 | |||||||
|
| |||||||
| Bishop Street Funds |
16
| Hawaii Municipal Bond Fund |
Schedule of Investments
Shares | Value (000) | |||||||
| CASH EQUIVALENT — 1.0% | ||||||||
| 1,434,835 | First American Treasury Obligations Fund, Cl X, 0.010% (E) (Cost $1,435) | $ | 1,435 | |||||
|
| |||||||
| TOTAL INVESTMENTS (Cost $129,978) — 98.6% | $ | 133,448 | ||||||
|
| |||||||
Percentages are based on Net Assets of $135,296 (000).
| (A) | Pre-Refunded Security — The maturity date shown is the pre-refunded date. |
| (B) | Security is escrowed to maturity. |
| (C) | Zero coupon security. The rate reported on the Schedule of Investments is the effective yield at time of purchase. |
| (D) | Variable or floating rate security, the interest rate of which adjusts periodically based prevailing interest rates. |
| (E) | The rate reported is the 7-day effective yield as of December 31, 2021. |
AGM — Assured Guaranty Municipal
AMT — Alternative Minimum Tax
COP — Certificate of Participation
GO — General Obligation
PSF-GTD — Guaranteed by Permanent School Fund
RB — Revenue Bond
Ser — Series
UT CSCE — Utah Charter School Enhancement Program
Cost figures are shown in thousands.
The following is a summary of the inputs used as of December 31, 2021, in valuing the Fund’s investments carried at value (000):
| Hawaii Municipal Bond Fund | ||||||||||||||||
| Investments in Securities | Level 1 | Level 2 | Level 3 | Total | ||||||||||||
Municipal Bonds | $ | — | $ | 132,013 | $ | — | $ | 132,013 | ||||||||
Cash Equivalent | 1,435 | — | — | 1,435 | ||||||||||||
|
| |||||||||||||||
Total Investments in Securities | $ | 1,435 | $ | 132,013 | $ | — | $ | 133,448 | ||||||||
|
| |||||||||||||||
For the year ended December 31, 2021, there were no transfers in or out of Level 3.
Amounts designated as “—” are $0.
For more information on valuation inputs, see Note 2 in the Notes to Financial Statements.
The accompanying notes are an integral part of the financial statements.
| December 31, 2021 | www.bishopstreetfunds.com |
17
| Bishop Street Funds |
Statement of Assets and Liabilities (000)
December 31, 2021
| Hawaii Municipal Bond Fund | ||||
Assets: | ||||
Investments, at Cost | $ | 129,978 | ||
| ||||
Investments, at Value | $ | 133,448 | ||
Dividends and Interest Receivable | 2,082 | |||
Receivable from Distributor | 10 | |||
Prepaid Expenses | 3 | |||
| ||||
Total Assets | 135,543 | |||
| ||||
Liabilities: | ||||
Income Distribution Payable | 131 | |||
Payable for Investment Securities Purchased | 43 | |||
Advisory Fees Payable | 10 | |||
Administrative Fees Payable | 5 | |||
Distribution Fees Payable, Class A | 4 | |||
Payable for Fund Shares Redeemed | 2 | |||
Chief Compliance Officer Fees Payable | 2 | |||
Audit Expense Payable | 14 | |||
Transfer Agent Fees Payable | 17 | |||
Other Accrued Expenses Payable | 19 | |||
| ||||
Total Liabilities | 247 | |||
| ||||
Net Assets | $ | 135,296 | ||
| ||||
Paid-in Capital | $ | 131,852 | ||
Total Distributable Earnings | 3,444 | |||
| ||||
Net Assets | $ | 135,296 | ||
| ||||
Class I Shares: | ||||
Net Assets | $ | 118,341 | ||
Outstanding Shares of Beneficial Interest | 10,983 | |||
Net Asset Value, Offering and Redemption Price Per Share — Class I | $ | 10.78 | * | |
| ||||
Class A Shares: | ||||
Net Assets | $ | 16,955 | ||
Outstanding Shares of Beneficial Interest | 1,574 | |||
Net Asset Value, Offering and Redemption Price Per Share — Class A | $ | 10.77 | ||
| ||||
Maximum Offering Price Per Shares — Class A ($10.77/ 97.00%) | $ | 11.10 | ||
| ||||
| * | Net Assets divided by Shares do not calculate to the stated NAV because Net Assets are shown rounded. |
The accompanying notes are an integral part of the financial statements.
| Bishop Street Funds |
18
| Bishop Street Funds |
For the year ended December 31, 2021
| Hawaii Municipal Bond Fund | ||||
Investment Income: | ||||
Interest Income | $ | 2,661 | ||
Dividend Income | 1 | |||
| ||||
Total Investment Income | 2,662 | |||
| ||||
Expenses: | ||||
Investment Adviser Fees | 456 | |||
Shareholder Servicing Fees | 286 | |||
Administrative Fees | 257 | |||
Distribution Fees, Class A | 43 | |||
Chief Compliance Officer Fees | 8 | |||
Transfer Agent Fees | 100 | |||
Legal Fees | 55 | |||
Printing Fees | 46 | |||
Audit Fees | 33 | |||
Trustees’ Fees | 29 | |||
Pricing Fees | 24 | |||
Registration Fees | 10 | |||
Custody Fees | 8 | |||
Miscellaneous Expenses | 30 | |||
| ||||
Total Expenses | 1,385 | |||
| ||||
Less Waivers: | ||||
Investment Adviser Fees | (275 | ) | ||
Shareholder Servicing Fees | (195 | ) | ||
Administrative Fees | (156 | ) | ||
| ||||
Total Waivers | (626 | ) | ||
| ||||
Total Net Expenses | 759 | |||
| ||||
Net Investment Income | 1,903 | |||
| ||||
Net Realized Gain on Investments | 132 | |||
Net Change in Unrealized Depreciation on Investments | (1,338 | ) | ||
| ||||
Net Realized and Unrealized Loss on Investments | (1,206 | ) | ||
| ||||
Increase in Net Assets Resulting from Operations | $ | 697 | ||
| ||||
The accompanying notes are an integral part of the financial statements.
| December 31, 2021 | www.bishopstreetfunds.com |
19
| Bishop Street Funds |
Statements of Changes in Net Assets (000)
For the year ended December 31,
| Hawaii Municipal Bond Fund | ||||||||
| 2021 | 2020 | |||||||
Investment Activities from Operations: | ||||||||
Net Investment Income | $ | 1,903 | $ | 2,283 | ||||
Net Realized Gain on Investments | 132 | 522 | ||||||
Net Change in Unrealized Appreciation (Depreciation) on Investments | (1,338 | ) | 1,660 | |||||
| ||||||||
Increase in Net Assets Resulting from Operations | 697 | 4,465 | ||||||
| ||||||||
Distributions: | ||||||||
Class I Shares | (1,959 | ) | (2,405 | ) | ||||
Class A Shares | (251 | ) | (331 | ) | ||||
| ||||||||
Total Distributions | (2,210 | ) | (2,736 | ) | ||||
| ||||||||
Capital Share Transactions: | ||||||||
Class I Shares: | ||||||||
Proceeds from Shares Issued | 24,979 | 10,745 | ||||||
Reinvestments of Cash Distributions | 284 | 331 | ||||||
Cost of Shares Redeemed | (14,317 | ) | (15,097 | ) | ||||
| ||||||||
Total Class I Capital Share Transactions | 10,946 | (4,021 | ) | |||||
| ||||||||
Class A Shares: | ||||||||
Proceeds from Shares Issued | 878 | 64 | ||||||
Reinvestments of Cash Distributions | 190 | 249 | ||||||
Cost of Shares Redeemed | (649 | ) | (890 | ) | ||||
| ||||||||
Total Class A Capital Share Transactions | 419 | (577 | ) | |||||
| ||||||||
Net Increase (Decrease) in Net Assets from Capital Share Transactions | 11,365 | (4,598 | ) | |||||
| ||||||||
Total Increase (Decrease) in Net Assets | 9,852 | (2,869 | ) | |||||
| ||||||||
Net Assets: | ||||||||
Beginning of Year | 125,444 | 128,313 | ||||||
| ||||||||
End of Year | $ | 135,296 | $ | 125,444 | ||||
| ||||||||
Share Transactions: | ||||||||
Class I Shares: | ||||||||
Shares Issued | 2,302 | 992 | ||||||
Shares Issued in Lieu of Cash Distributions | 26 | 31 | ||||||
Shares Redeemed | (1,323 | ) | (1,409 | ) | ||||
| ||||||||
Total Class I Transactions | 1,005 | (386 | ) | |||||
| ||||||||
Class A Shares: | ||||||||
Shares Issued | 81 | 6 | ||||||
Shares Issued in Lieu of Cash Distributions | 18 | 23 | ||||||
Shares Redeemed | (60 | ) | (83 | ) | ||||
| ||||||||
Total Class A Transactions | 39 | (54 | ) | |||||
| ||||||||
Net Increase (Decrease) in Shares Outstanding from Share Transactions | 1,044 | (440 | ) | |||||
| ||||||||
The accompanying notes are an integral part of the financial statements.
| Bishop Street Funds |
20
This page intentionally left blank.
| Bishop Street Funds |
For a share outstanding throughout the year ended December 31,
| Net Asset Value, Beginning of Year | Investment Activities | Total Investment Activities from Operations | Dividends and Distributions | Total Dividends and Distributions | |||||||||||||||||||||||||||||||
| Net Investment Income (Loss)(1) | Net Realized and Unrealized Gain(Loss) on Investments | Net Investment Income | Capital Gains | ||||||||||||||||||||||||||||||||
HAWAII MUNICIPAL BOND FUND | |||||||||||||||||||||||||||||||||||
Class I Shares: | |||||||||||||||||||||||||||||||||||
2021 | $ | 10.90 | $ | 0.16 | $ | (0.10 | ) | $ | 0.06 | $ | (0.16 | ) | $ | (0.02 | ) | $ | (0.18 | ) | |||||||||||||||||
2020 | 10.73 | 0.20 | 0.21 | 0.41 | (0.20 | ) | (0.04 | ) | (0.24 | ) | |||||||||||||||||||||||||
2019 | 10.39 | 0.25 | 0.34 | 0.59 | (0.25 | ) | — | (0.25 | ) | ||||||||||||||||||||||||||
2018 | 10.58 | 0.26 | (0.19 | ) | 0.07 | (0.26 | ) | — | ^ | (0.26 | ) | ||||||||||||||||||||||||
2017 | 10.45 | 0.25 | 0.14 | 0.39 | (0.25 | ) | (0.01 | ) | (0.26 | ) | |||||||||||||||||||||||||
Class A Shares: | |||||||||||||||||||||||||||||||||||
2021 | $ | 10.90 | $ | 0.14 | $ | (0.11 | ) | $ | 0.03 | $ | (0.14 | ) | $ | (0.02 | ) | $ | (0.16 | ) | |||||||||||||||||
2020 | 10.74 | 0.17 | 0.20 | 0.37 | (0.17 | ) | (0.04 | ) | (0.21 | ) | |||||||||||||||||||||||||
2019 | 10.39 | 0.22 | 0.35 | 0.57 | (0.22 | ) | — | (0.22 | ) | ||||||||||||||||||||||||||
2018 | 10.58 | 0.23 | (0.20 | ) | 0.03 | (0.22 | ) | — | ^ | (0.22 | ) | ||||||||||||||||||||||||
2017 | 10.45 | 0.23 | 0.13 | 0.36 | (0.22 | ) | (0.01 | ) | (0.23 | ) | |||||||||||||||||||||||||
| (1) | Per share net investment income calculated using average shares. |
| † | Total return is for the period indicated and has not been annualized. Returns shown do not reflect the deduction of taxes that a shareholder would pay on Fund distributions or the redemption of Fund shares. Fee waivers are in effect; if they had not been in effect, performance would have been lower. |
| ^ | Amount is less than 0.005. |
Amounts designated as “—” are either $0 or have been rounded to $0.
| Bishop Street Funds |
22
| Net Asset Value, End of Year | Total Return† | Net Assets End of Year (000) | Ratio of Expenses to Average Net Assets | Ratio of Expenses to Average Net Assets (Excluding Waivers) | Ratio of Net Investments Income to Average Net Assets | Portfolio Turnover Rate | |||||||||||||||||||||||||||
| $ | 10.78 | 0.62 | % | $ | 118,341 | 0.55 | % | 1.03 | % | 1.49 | % | 14 | % | ||||||||||||||||||||
| 10.90 | 3.85 | 108,718 | 0.55 | 1.04 | 1.85 | 31 | |||||||||||||||||||||||||||
| 10.73 | 5.69 | 111,254 | 0.55 | 1.04 | 2.31 | 36 | |||||||||||||||||||||||||||
| 10.39 | 0.66 | 109,130 | 0.55 | 1.07 | 2.47 | 21 | |||||||||||||||||||||||||||
| 10.58 | 3.74 | 117,285 | 0.55 | 1.04 | 2.39 | 25 | |||||||||||||||||||||||||||
| $ | 10.77 | 0.27 | % | $ | 16,955 | 0.80 | % | 1.28 | % | 1.25 | % | 14 | % | ||||||||||||||||||||
| 10.90 | 3.50 | 16,726 | 0.80 | 1.29 | 1.60 | 31 | |||||||||||||||||||||||||||
| 10.74 | 5.48 | 17,059 | 0.80 | 1.29 | 2.06 | 36 | |||||||||||||||||||||||||||
| 10.39 | 0.34 | 17,130 | 0.80 | 1.32 | 2.21 | 21 | |||||||||||||||||||||||||||
| 10.58 | 3.46 | 20,335 | 0.80 | 1.29 | 2.14 | 25 | |||||||||||||||||||||||||||
The accompanying notes are an integral part of the financial statements.
| December 31, 2021 | www.bishopstreetfunds.com |
23
| Bishop Street Funds |
December 31, 2021
The amounts included in the Notes to Financial Statements are in thousands unless otherwise noted.
| 1. | ORGANIZATION |
The Bishop Street Funds (the “Trust”) is registered under the Investment Company Act of 1940, as amended, as an open-end, management investment company. The Bishop Street Fund consists of the Hawaii Municipal Bond Funds (the “Fund”). The Fund is non-diversified. Class A Shares of the Fund are subject to a sales load as disclosed in the prospectus. The assets of the Fund are segregated, and a shareholder’s interest is limited to the Fund in which shares are held. The Fund’s prospectus provides a description of the Fund’s investment objectives, policies and strategies.
The Board of Trustees of the Trust, at the recommendation of Bishop Street Capital Management approved a plan of liquidation providing for the liquidation of the Bishop Street High Grade Income Fund’s assets and the distribution of the net proceeds pro rata to the Fund’s shareholders. The Fund was closed to investments from new and existing shareholders effective as of the Fund’s close of business on July 1, 2021. The distribution of the Fund’s assets occurred and the Fund ceased operations and liquidated on July 29, 2021.
| 2. | SIGNIFICANT ACCOUNTING POLICIES |
The following are significant accounting policies, which are consistently followed in the preparation of the financial statements of the Fund. The Fund is an investment company that applies the accounting and reporting guidance issued in Topic 946 by the U.S. Financial Accounting Standards Board (“FASB”).
Use of Estimates in the Preparation of Financial Statements
The preparation of financial statements in conformity with U.S. generally accepted accounting principles (“U.S. GAAP”) requires management to make estimates and assumptions that affect the fair value of assets, the reported amount of assets and liabilities and disclosure of contingent assets and liabilities at the date of the financial statements and the reported amounts of increases and decreases in net assets from operations during the reporting period. Actual results could differ from those estimates and such differences could be material.
Security Valuation
The Fund’s investments in equity securities listed on a securities exchange, market or automated quotation system for which quotations are readily available (except for securities traded on the NASDAQ Stock Market (the “NASDAQ”)) including securities traded over the counter, are valued at the last quoted sale price on an exchange or market (foreign or domestic) on which they are traded on valuation date (or at approximately 4:00 pm ET if a security’s primary exchange is normally open at that time), or, if there is no such reported sale on the valuation date, at the most recent quoted bid price.
| Bishop Street Funds |
24
For securities traded on NASDAQ, the NASDAQ Official Closing Price will be used. Debt securities are priced based upon valuations provided by independent, third-party pricing agents, if available. Investment companies are valued at Net Asset Value.
Such values generally reflect the last reported sales price in the most advantageous market, if the security is actively traded. The third-party pricing agents may also value debt securities at an evaluated bid price by employing methodologies that utilize actual market transactions, broker-supplied valuations, or other methodologies designed to identify the fair value for such securities. Such methodologies typically include matrix systems which reflect such factors as security prices, yields, maturities and ratings. Debt obligations with remaining maturities of sixty days or less may be valued at their amortized cost, which approximates market value provided that it is determined the amortized cost continues to approximate fair value. Should existing credit, liquidity or interest rate conditions in the relevant markets and issuer specific circumstances suggest that amortized cost does not approximate fair value, then the amortized cost method may not be used. Prices for most securities held in the Fund is provided daily by recognized independent pricing agents.
If a security price cannot be obtained from an independent, third-party pricing agent, the Fund seeks to obtain a bid price from at least one independent broker.
Securities for which market prices are not “readily available” are valued in accordance with Fair Value Procedures established by the Fund’s Board of Trustees (the “Board”). The Fund’s Fair Value Procedures are implemented through a Fair Value Pricing Committee (the “Committee”) designated by the Fund’s Board. Some of the more common reasons that may necessitate that a security be valued using Fair Value Procedures include: the security’s trading has been halted or suspended; the security has been delisted from a national exchange; the security’s primary trading market is temporarily closed at a time when under normal conditions it would be open; or the security’s primary pricing source is not able or willing to provide a price. When a security is valued in accordance with the Fair Value Procedures, the Committee will determine the value after taking into consideration relevant information reasonably available to the Committee.
In accordance with the authoritative guidance on fair value measurement under U.S. GAAP, the Fund discloses fair value of its investments in a hierarchy that prioritizes the inputs to valuation techniques used to measure the fair value. The objective of a fair value measurement is to determine the price that would be received to sell an asset or paid to transfer a liability in an orderly transaction between market participants at the measurement date (an exit price). Accordingly, the fair value hierarchy gives the highest priority to quoted prices (unadjusted) in active markets for identical assets or liabilities
| December 31, 2021 | www.bishopstreetfunds.com |
25
| Bishop Street Funds |
(Level 1) and the lowest priority to unobservable inputs (Level 3). The three levels of the fair value hierarchy are described below:
| • | Level 1 — Unadjusted quoted prices in active markets for identical, unrestricted assets or liabilities that the Fund has the ability to access at the measurement date; |
| • | Level 2 — Other significant observable inputs (including quoted prices for similar securities, interest rates, prepayment speeds, credit risk, referenced indices, quoted prices in inactive markets, adjusted quoted prices in active markets, etc.); and |
| • | Level 3 — Prices, inputs or modeling techniques which are both significant to the fair value measurement and unobservable (supported by little or no market activity). |
Investments are classified within the level of the lowest significant input considered in determining fair value. Investments classified within Level 3 whose fair value measurement considers several inputs may include Level 1 or Level 2 inputs as components of the overall fair value measurement.
For the year ended December 31, 2021, there have been no changes to the Fund’s fair value methodologies.
Federal Income Taxes
It is the Fund’s intention to continue to qualify as a regulated investment company for Federal income tax purposes by complying with the appropriate provisions of Sub-chapter M of the Internal Revenue Code of 1986, as amended, and to distribute substantially all of its income to shareholders. Accordingly, no provision for Federal income taxes has been made in the financial statements.
The Fund evaluates tax positions taken or expected to be taken in the course of preparing the Fund’s tax returns to determine whether it is “more-likely-than-not” (i.e., greater than 50-percent) that each tax position will be sustained upon examination by a taxing authority based on the technical merits of the position. Tax positions not deemed to meet the more-likely-than-not threshold are recorded as a tax benefit or expense in the current year. The Fund did not record any tax provision in the current period. However, management’s conclusions regarding tax positions taken may be subject to review and adjustment at a later date based on factors including, but not limited to, examination by tax authorities (i.e., the last 3 open tax year ends, as applicable), on-going analysis of and changes to tax laws, regulations and interpretations thereof.
Security Transactions and Investment Income
Security transactions are accounted for on trade date. Costs used in determining net realized capital gains and losses on the sale of securities are on the basis of specific identification. Interest income is recorded on the accrual basis from settlement date and dividend income is recorded on ex-dividend date.
| Bishop Street Funds |
26
Discounts and premiums are accreted or amortized using the effective interest method over the life of each security and are recorded as interest income. Realized gains (losses) on paydowns of mortgage-backed and asset-backed securities are recorded as an adjustment to interest income.
Classes
Class-specific expenses are borne by the applicable class of shares. Income, realized and unrealized gains/losses and non-class-specific expenses are allocated to the respective class on the basis of relative daily net assets. Distribution fees are the only class-specific expense.
Expenses
Expenses that are directly related to the Fund are charged directly to that Fund. Other operating expenses of the Trust are prorated to the Fund on the basis of relative net assets.
Dividends and Distributions to Shareholders
Dividends from net investment income are declared daily and paid on a monthly basis for the Fund. Any net realized capital gains will be distributed at least annually for the Fund. Distributions to shareholders are recorded on the ex-dividend date.
Front-End Sales Commission
Front-end sales commissions (the “sales charges”) are not recorded as expenses of the Fund. Sales charges are deducted from proceeds from the sales of Fund shares prior to investment in Class A Shares.
Cash Overdraft Charges
U.S. Bank, N.A. serves as custodian (the “Custodian”) for the Fund. The Custodian plays no role in determining the investment policies of the Fund or which securities are to be purchased or sold by the Fund. Prior to July 31, 2021, MUFG Union Bank, N.A. acted as the Fund’s custodian. If the Fund has a cash overdraft on a given day, it will be assessed an overdraft charge of the Prime Rate plus 4.00%. Cash overdraft charges are included in miscellaneous expenses on the Statements of Operations. For the year ended December 31, 2021, there were no cash overdraft charges.
| 3. | INVESTMENT ADVISORY AGREEMENT |
Investment advisory services are provided to the Fund by Bishop Street Capital Management (the “Adviser”), a registered adviser and wholly owned subsidiary of First Hawaiian Bank. First Hawaiian Bank is a wholly owned subsidiary of First Hawaiian Inc. The Adviser is entitled to receive an annual fee of 0.35% of the average daily net assets of the Fund. The Adviser has contractually agreed, through April 30, 2022, to waive a
| December 31, 2021 | www.bishopstreetfunds.com |
27
| Bishop Street Funds |
portion of its advisory fee (excluding interest, taxes, brokerage commissions, acquired fund fees and expenses and extraordinary expenses (collectively, excluded expenses) to the extent necessary to keep operating expenses at or below certain percentages of the respective average daily net assets.
The contractual expense limitations are as follows:
Hawaii Municipal Bond Fund, Class I Shares | 0.55 | % | ||
Hawaii Municipal Bond Fund, Class A Shares | 0.80 | % |
If at any point it becomes unnecessary for the Adviser to reduce fees and make expense reimbursements, the Board may permit the Adviser to retain the difference between the Total Annual Fund Operating Expenses and contractual expense limitations to recapture all or a portion of its prior expense reductions or reimbursements made during the preceding three year period during which this agreement was in place. During the year ended December 31, 2021, the Adviser did not recapture any previously waived fees.
As of December 31, 2021, fees which were previously waived by the Investment Manager which may be subject to possible future reimbursement to the Adviser were as follows:
Hawaii | Expires | |||||||
| $ | 287 | 12/31/2022 | ||||||
| 280 | 12/31/2023 | |||||||
| 275 | 12/31/2024 | |||||||
| 4. | ADMINISTRATIVE, CUSTODIAN, TRANSFER AGENT, DISTRIBUTION AND SHAREHOLDER SERVICES |
The Fund and the Administrator are parties to an Administration Agreement under which the Administrator provides administrative services to the Fund. For these services, the Administrator is paid an asset based fee which will vary depending on the number of share classes and the average daily net assets of the Fund. The Administrator has voluntarily agreed to waive a portion of its fee equal to 0.12% of the Fund’s average daily net assets. These fee waivers are voluntary and may be discontinued at any time. For the year ended December 31, 2021, the Fund was charged $257 for these services. For the year ended December 31, 2021, the Administrator waived $156 for these services to the Fund. These fees and waivers are labeled as “Administrative Fees/Waivers” on the Statements of Operations.
| Bishop Street Funds |
28
The Custodian plays no role in determining the investment policies of the Fund or which securities are to be purchased or sold by the Fund. These fees are labeled on the Statements of Operations as “Custody Fees.”
DST Systems, Inc. (“DST”) acts as the Transfer Agent of the Fund. As such, DST provides transfer agency, dividend disbursing and shareholder services to the Fund. These fees are disclosed on the Statements of Operations as “Transfer Agent Fees.”
SEI Investments Distribution Co. (“SIDCO”), the “Distributer” a wholly owned subsidiary of SEI Investments Company, acts as the Trust’s Distributor pursuant to the distribution agreement. The Fund has adopted a Distribution Plan (the “Plan”) on behalf of Class A Shares pursuant to Rule 12b-1 under the Investment Company Act of 1940. The Plan provides that Class A Shares will bear the cost of their distribution expenses. SIDCO, as compensation for its services under the Plan, receives a distribution fee, computed daily and payable monthly, of 0.25% of the average daily net assets attributable to the Fund’s Class A Shares. This fee is disclosed as “Distribution Fees, Class A” on the Statements of Operations.
The Trust has adopted and entered into a shareholder service plan and agreement with SIDCO. The Fund pays to SIDCO a shareholder servicing fee not to exceed an annual rate of 0.25% of the average daily net asset value of all shares of the fund, which is computed daily and paid monthly. Under the shareholder service plan, SIDCO may perform, or may compensate other service providers for performing various shareholder and administrative services. SIDCO may also retain as profit any difference between the fee it receives and amount it pays to third parties. For the year, SIDCO paid the entire amount of fees received under the shareholder service plan to First Hawaiian Bank, the Parent Company of Bishop Street Capital Management, for shareholder services performed by First Hawaiian Bank on behalf of SIDCO for the benefit of certain shareholders to the Fund. SIDCO has voluntarily agreed to waive a portion its fee equal 0.15% of average daily net asset value. These fees and waivers are represented as “Shareholder Servicing Fees/Waivers” on the Statements of Operations.
| 5. | TRANSACTIONS WITH AFFILIATES |
Certain officers of the Trust are also officers of SEI Investments Global Funds Services (the “Administrator”), a wholly owned subsidiary of SEI Investments Company, and/or SIDCO. Such officers are paid no fees by the Trust other than the Chief Compliance Officer (“CCO”) as described below, for serving as officers of the Trust.
A portion of the services provided by the CCO and his staff, who are employees of the Administrator, are paid for by the Trust as incurred. The services include regulatory oversight of the Trust’s Advisers and service providers as required by SEC regulations. The
| December 31, 2021 | www.bishopstreetfunds.com |
29
| Bishop Street Funds |
CCO’s services and expenses have been approved by and are reviewed by the Board. These fees are disclosed on the Statements of Operations as “Chief Compliance Officer Fees.”
| 6. | INVESTMENT TRANSACTIONS |
The cost of security purchases and the proceeds from the sale and maturities of securities, other than short-term investments, for the year ended December 31, 2021 are presented below for the Fund.
Purchases | ||||
Other | $ | 27,812 | ||
Sales and Maturities | ||||
Other | $ | 17,729 |
For the year ended December 31, 2021, there were no purchases or sales of long-term U.S. Government securities.
| 7. | FEDERAL TAX INFORMATION |
The amount and character of income and capital gain distributions to be paid, if any, are determined in accordance with Federal income tax regulations, which may differ from U.S. GAAP.
As a result, net investment income (loss) and net realized gain (loss) on investment transactions for a reporting period may differ significantly from distributions during such period. These book/tax differences may be temporary or permanent. To the extent these differences are permanent in nature, they are charged or credited to undistributed net investment income (loss), accumulated net realized gain (loss) or paid in capital, as appropriate, in the period that the differences arise.
The tax character of dividends and distributions declared during the years ended December 31, 2021 and 2020 were as follows:
| Ordinary Income | Tax Exempt Income | Long Term Capital Gain | Total | |||||||||||||
2021 | $ | 7 | $ | 1,895 | $ | 308 | $ | 2,210 | ||||||||
2020 | 80 | 2,276 | 380 | 2,736 | ||||||||||||
As of December 31, 2021, the components of Distributable Earnings on a tax basis were as follows:
Undistributed Tax-Exempt Income | $ | 7 | ||
Post October Losses | (34 | ) | ||
Unrealized Appreciation | 3,470 | |||
Other Temporary Differences | 1 | |||
|
| |||
Total Distributable Earnings | $ | 3,444 | ||
|
|
| Bishop Street Funds |
30
For Federal income tax purposes, capital losses incurred may be carried forward and applied against future capital gains. Under the Regulated Investment Company Modernization Act of 2010, Funds are permitted to carry forward capital losses for an unlimited period and they will retain their character as either short-term or long-term capital losses. As of December 31, 2021, the Fund had no capital loss carryforwards.
For Federal income tax purposes, the cost of securities owned at December 31, 2021 is different from amounts reported for financial reporting purposes. The Federal tax cost and aggregate gross unrealized appreciation and depreciation for the investments held by the Fund at December 31, 2021, were as follows:
Federal Tax Cost | $ | 129,978 | ||
|
| |||
Gross Unrealized Appreciation | 3,658 | |||
Gross Unrealized Depreciation | (188 | ) | ||
|
| |||
Net Unrealized Appreciation | $ | 3,470 | ||
|
|
| 8. | RISKS |
The Fund invests primarily in debt instruments in the state of Hawaii. The issuers’ ability to meet their obligations may be affected by economic developments in that state. In addition, the Fund’s investments in debt securities are subject to “credit risk,” which is the risk that an issuer will be unable, or will be perceived to be unable, to repay its obligations at maturity and “interest rate risk” which is the potential for fluctuations in bond prices due to changing interest rates. Funds that invest primarily in high quality debt securities generally are subject to less credit risk than funds that invest in lower quality debt securities.
Certain debt securities are backed by credit enhancements from various financial institutions and financial guarantee assurance agencies. These credit enhancements reinforce the credit quality of the individual securities; however, if any of the financial institutions or financial guarantee assurance agencies’ credit quality should deteriorate, it could cause the individual security’s credit quality to change. Additionally, if the Fund concentrates its credit enhancements in any one financial institution, the risk of credit quality deterioration increases. The following tables provide detail on the approximate percentage of the Fund’s investments in securities with these types of enhancements, as well as the name of the entity providing the largest proportion of enhancements in the Fund.
% of investments in securities with credit enhancements or liquidity enhancements | 1.61% | |
Largest % of investments in securities with credit enhancements or liquidity enhancements from a single institution | 0.91% | |
| (Public School Fund Guarantee) |
| December 31, 2021 | www.bishopstreetfunds.com |
31
| Bishop Street Funds |
The value of asset-backed securities may be affected by the credit risk of the servicing agent for the pool, the originator of the loans or receivables, or the financial institution(s) providing the credit support. In addition to credit risk, asset-backed securities and other securities with early redemption features are subject to pre-payment risk. During periods of declining interest rates, prepayment of loans underlying asset-backed securities can be expected to accelerate or an issuer may retire an outstanding bond early to reduce interest costs. The Fund’s ability to maintain positions in such securities will be affected by reductions in the principal amount of such securities resulting from prepayments, and its ability to reinvest the returns of principal at comparable yields is subject to the general prevailing interest rates at that time.
The market value of the Fund’s investments in fixed income securities may change in response to interest rate changes and other factors. During periods of falling interest rates, the values of fixed income securities generally rise. Conversely, during periods of rising interest rates, the values of such securities generally decline. Changes by recognized rating agencies in the ratings of any fixed income security and in the ability of an issuer to make payments of interest and principal may also affect the value of these investments.
In the normal course of business, the Fund enters into contracts that provide general indemnifications. The Fund’s maximum exposure under these arrangements is dependent on future claims that may be made against the Fund and, therefore, cannot be established; however, based on experience, the risk of loss from such claims is considered remote.
| 9. | LINE OF CREDIT |
Through December 31, 2021, the Fund, had entered into an agreement which enabled it to participate in a $5 million unsecured committed revolving line of credit on a first come, first served basis, with U.S. Bank, N.A. (the “Bank”). The proceeds from the borrowings are permitted to be used to finance the Fund’s short term general working capital requirements, including the funding of shareholder redemptions.
For the year ended December 31, 2021 the Fund did not have borrowings under the line of credit.
| 10. | OTHER |
At December 31, 2021, the percentage of total shares outstanding held by share-holders owning 10% or greater of total shares outstanding of the Fund, which comprised omnibus accounts that were held on behalf of several individual shareholders, was as follows:
| Number of Shareholders | % of Outstanding Shares | |||||||
Hawaii Municipal Bond Fund, Class I Shares | 1 | 80.72 | ||||||
Hawaii Municipal Bond Fund, Class A Shares | — | — | ||||||
| Bishop Street Funds |
32
| 11. | SUBSEQUENT EVENTS |
The Fund has evaluated the need for additional disclosures and/or adjustments resulting from subsequent events through the date the financial statements were issued. Based on this evaluation, no adjustments were required to the financial statements.
| December 31, 2021 | www.bishopstreetfunds.com |
33
| Bishop Street Funds |
Report of Independent Registered Public Accounting Firm
To the Board of Trustees of Bishop Street Funds and Shareholders of Hawaii Municipal Bond Fund
Opinion on the Financial Statements
We have audited the accompanying statement of assets and liabilities, including the schedule of investments, of Hawaii Municipal Bond Fund (constituting Bishop Street Funds, referred to hereafter as the “Fund”) as of December 31, 2021, the related statement of operations for the year ended December 31, 2021, the statement of changes in net assets for each of the two years in the period ended December 31, 2021, including the related notes, and the financial highlights for each of the five years in the period ended December 31, 2021 (collectively referred to as the “financial statements”). In our opinion, the financial statements present fairly, in all material respects, the financial position of the Fund as of December 31, 2021, the results of its operations for the year then ended, the changes in its net assets for each of the two years in the period ended December 31, 2021 and the financial highlights for each of the five years in the period ended December 31, 2021 in conformity with accounting principles generally accepted in the United States of America.
Basis for Opinion
These financial statements are the responsibility of the Fund’s management. Our responsibility is to express an opinion on the Fund’s financial statements based on our audits. We are a public accounting firm registered with the Public Company Accounting Oversight Board (United States) (PCAOB) and are required to be independent with respect to the Fund in accordance with the U.S. federal securities laws and the applicable rules and regulations of the Securities and Exchange Commission and the PCAOB.
We conducted our audits of these financial statements in accordance with the standards of the PCAOB. Those standards require that we plan and perform the audit to obtain reasonable assurance about whether the financial statements are free of material misstatement, whether due to error or fraud.
Our audits included performing procedures to assess the risks of material misstatement of the financial statements, whether due to error or fraud, and performing procedures that respond to those risks. Such procedures included examining, on a test basis, evidence regarding the amounts and disclosures in the financial statements. Our audits also included evaluating the accounting principles used and significant estimates made by management, as well as evaluating the overall presentation of the financial statements. Our procedures included confirmation of securities owned as of December 31, 2021 by correspondence with the custodian, transfer agent and brokers; when replies were not received from brokers, we performed other auditing procedures. We believe that our audits provide a reasonable basis for our opinion.
/s/ PricewaterhouseCoopers LLP
Philadelphia, Pennsylvania
March 1, 2022
We have served as the auditor of one or more investment companies in Bishop Street Capital Management since 1998.
| Bishop Street Funds |
34
This page intentionally left blank.
| Bishop Street Funds |
All mutual funds have operating expenses. As a shareholder of a mutual fund you incur two types of costs: (1) transaction costs, including applicable sales charges (loads); and (2) ongoing costs, which include (among others) costs for portfolio management, administrative services, distribution and service (12b-1), shareholder service fees, and shareholder reports like this one. It is important for you to understand the impact of these costs on your investment returns.
Operating expenses such as these are deducted from a mutual fund’s gross income and directly reduce its final investment return. These expenses are expressed as a percentage of the mutual fund’s average net assets; this percentage is known as the mutual fund’s expense ratio.
The following examples use the expense ratio and are intended to help you understand the ongoing costs (in dollars) of investing in your Fund and to compare these costs with those of other mutual funds. The examples are based on an investment of $1,000 made at the beginning of the period shown and held for the entire period from July 1, 2021 to December 31, 2021.
The table on the next page illustrates your Fund’s costs in two ways:
| • | Actual Fund Return. This section helps you to estimate the actual expenses after fee waivers that your Fund incurred over the period. The “Expenses Paid During Period” column shows the actual dollar expense cost incurred by a $1,000 investment in the Fund, and the “Ending Account Value” number is derived from deducting that expense cost from the Fund’s gross investment return. |
You can use this information, together with the actual amount you invested in the Fund, to estimate the expenses you paid over that period. Simply divide your actual account value by $1,000 to arrive at a ratio (for example, an $8,600 account value divided by $1,000 = 8.6), then multiply that ratio by the number shown for your Fund under “Expenses Paid During Period.”
| • | Hypothetical 5% Return. This section helps you compare your Fund’s costs with those of other mutual funds. It assumes that the Fund had an annual 5% return before expenses during the year, but that the expense ratio (Column 3) for the period is unchanged. This example is useful in making comparisons because the Securities and Exchange Commission requires all mutual funds to make this 5% calculation. You can assess your Fund’s comparative cost by comparing the hypothetical result for your Fund in the “Expenses Paid During Period” column with those that appear in the same charts in the shareholder reports for other funds. |
Note: Because the return is set at 5% for comparison purposes — NOT your Fund’s actual return — the account values shown may not apply to your specific investment.
| Bishop Street Funds |
36
| (unaudited) |
| Beginning Account Value 7/1/21 | Ending Account Value 12/31/21 | Annualized Expense Ratios | Expenses Paid During Period* | |||||||||||||
Hawaii Municipal Bond Fund — Class I | ||||||||||||||||
| ||||||||||||||||
Actual Fund Return | $ | 1,000.00 | $ | 1,002.10 | 0.55 | % | $ | 2.78 | ||||||||
Hypothetical 5% Return | 1,000.00 | 1,022.43 | 0.55 | 2.80 | ||||||||||||
| ||||||||||||||||
Hawaii Municipal Bond Fund — Class A | ||||||||||||||||
| ||||||||||||||||
Actual Fund Return | $ | 1,000.00 | $ | 999.90 | 0.80 | % | $ | 4.03 | ||||||||
Hypothetical 5% Return | 1,000.00 | 1,021.17 | 0.80 | 4.08 | ||||||||||||
| ||||||||||||||||
| * | Expenses are equal to the Fund’s annualized expense ratio multiplied by the average account value over the period, multiplied by 184/365 (to reflect the one-half year period). |
| December 31, 2021 | www.bishopstreetfunds.com |
37
| Bishop Street Funds |
Notice to Shareholders of Bishop Street Funds
For shareholders that do not have a December 31, 2021 taxable year end, this notice is for informational purposes only. For shareholders with a December 31, 2021 tax year end, please consult your tax adviser as to the pertinence of this notice.
| (A)* Long Term Capital Gains Distributions (Tax Basis) | B* Ordinary Income Distributions (Tax Basis) | C* Tax Exempt Interest | (A+B+C) (D) Total Distributions (Tax Basis) | |||||||||||
| 13.93 | % | 0.31 | % | 85.76 | % | 100.00 | % | |||||||
| * | Items (A), (B) and (C) are based on the percentage of each fund’s total distribution. |
| (1) | Qualifying dividends represent dividends which qualify for the corporate dividends received deduction and is reflected as a percentage of ordinary income distributions (the total of short-term capital gain and net investment income distributions). |
| (2) | The percentage in this column represents the amount of “Qualifying Dividend Income” as created by the Jobs and Growth Tax Relief Reconciliation Act of 2003 and is reflected as a percentage of “Ordinary Income Distributions” (the total of short term capital gain and net investment income distributions). It is the intention of the Fund to designate the maximum amount permitted by the law. |
| (3) | “U.S. Government Interest” represents the amount of interest that was derived from direct U.S. Government Obligations and distributed during the fiscal year. This amount is reflected as a percentage of total ordinary income distributions (the total of short term capital gain and net investment income distributions). Generally, interest from direct U.S. Government Obligations is exempt from state income tax. However, for residents of California, Connecticut and New York, the statutory threshold requirements were not satisfied to permit exemption of these amounts from state income. |
| Bishop Street Funds |
38
| (unaudited) |
For the fiscal year ended December 31, 2021, each fund has designated the following items with regard to distributions paid during the year.
Qualifying | Qualifying Dividend Income(2) | U.S. Government Interest(3) | Interest Related Dividends(4) | Short-Term Capital Gain Dividends(5) | ||||||||||||||
| 0.00 | % | 0.00 | % | 0.00 | % | 0.00 | % | 0.00 | % | |||||||||
| (4) | The percentage in this column represents the amount of “Interest Related Dividends” as created by the American Jobs Creation Act of 2004 and is reflected as a percentage of net investment income distributions that is exempt from U.S. withholding tax when paid to foreign investors. |
| (5) | The percentage in this column represents the amount of “Short-Term Capital Gain Dividends” as created by the American Jobs Creation Act of 2004 and is reflected as a percentage of short-term capital gain distributions that is exempt from U.S. withholding tax when paid to foreign investors. |
For California income tax purposes, for the fiscal year ended December 31, 2021, the Hawaii Municipal Bond Fund designated 1.06% of their distributions paid from net investment income as exempt interest dividends under Section 17145 of the California Revenue and Taxation Code.
| December 31, 2021 | www.bishopstreetfunds.com |
39
| Bishop Street Funds |
Board of Trustees and Officers
Set forth below are the names, years of birth, positions with the Trust, length of term of office, and the principal occupations for the last five years of each of the persons currently serving as Trustees and Officers of the Trust. Unless otherwise noted, the business address of each Trustee is SEI Investments Company, 1 Freedom Valley Drive, Oaks, Pennsylvania 19456. Trustees who are deemed not to be “interested persons” of the Trust are referred to as “Independent Trustees.” Messrs. Nesher and Klauder are Trustees who may be deemed to be
| Name and Year of Birth | Position with Trust and Length of Time Served1 | Principal Occupations in the Past Five Years | ||
| INTERESTED TRUSTEES3,4 | ||||
| ROBERT NESHER (Born: 1946) | Chairman of the Board of Trustees (since 1991) | SEI employee 1974 to present; currently performs various services on behalf of SEI Investments for which Mr. Nesher is compensated. President, Chief Executive Officer and Trustee of SEI Daily Income Trust, SEI Tax Exempt Trust, SEI Institutional Managed Trust, SEI Institutional International Trust, SEI Institutional Investments Trust, SEI Asset Allocation Trust, Adviser Managed Trust, New Covenant Funds, SEI Insurance Products Trust and SEI Catholic Values Trust. President and Director of SEI Structured Credit Fund, LP. Vice Chairman of O’Connor EQUUS (closed-end investment company) to 2016. President, Chief Executive Officer and Trustee of SEI Liquid Asset Trust to 2016. Vice Chairman of Winton Series Trust to 2017. Vice Chairman of Winton Diversified Opportunities Fund (closed-end investment company), The Advisors’ Inner Circle Fund III, Gallery Trust, Schroder Series Trust and Schroder Global Series Trust to 2018. | ||
| N. JEFFREY KLAUDER (Born: 1952) | Trustee (since 2018) | Senior Advisor of SEI Investments since 2018. Executive Vice President and General Counsel of SEI Investments, 2004 to 2018.
| ||
| 1 | Each Trustee shall hold office during the lifetime of this Trust until the election and qualification of his or her successor, or until he or she sooner dies, resigns, or is removed in accordance with the Trust’s Declaration of Trust |
| 2 | Directorships of Companies required to report to the Securities and Exchange Commission under the Securities Exchange act of 1934 (i.e., “public companies”) or other investment companies under the 1940 act. |
| 3 | Denotes Trustees who may be deemed to be “interested” persons of the Fund as that term is defined in the 1940 Act by virtue of their affiliation with the Distributor and/or its affiliates. |
| 4 | Trustees oversee 1 fund in the Bishop Street Funds. |
| Bishop Street Funds |
40
| (unaudited) |
“interested” persons of the Trust as that term is defined in the 1940 Act by virtue of their affiliation with the Trust’s Distributor. The Trust’s Statement of Additional Information (“SAI”) includes additional information about the Trustees and Officers. The SAI may be obtained without charge by calling 1-800-262-9565. The following chart lists Trustees and Officers as of December 31, 2021.
| Other Directorships Held in the Past Five Years2 |
Current Directorships: Trustee of The Advisors’ Inner Circle Fund II, Catholic Responsible Investments Funds, SEI Daily Income Trust, SEI Institutional International Trust, SEI Institutional Investments Trust, SEI Institutional Managed Trust, SEI Asset Allocation Trust, SEI Tax Exempt Trust, Adviser Managed Trust, New Covenant Funds, SEI Insurance Products Trust and SEI Catholic Values Trust. Director of SEI Structured Credit Fund, LP, SEI Global Master Fund plc, SEI Global Assets Fund plc, SEI Global Investments Fund plc, SEI Investments — Global Funds Services, Limited, SEI Investments Global, Limited, SEI Investments (Europe) Ltd., SEI Investments — Unit Trust Management (UK) Limited, SEI Multi-Strategy Funds PLC and SEI Global Nominee Ltd.
Former Directorships: Trustee of The KP Funds to 2021. Trustee of SEI Liquid Asset Trust to 2016.
|
Current Directorships: Trustee of The Advisors’ Inner Circle Fund II, The KP Funds, Frost Family of Funds and Catholic Responsible Investments Funds. Director of SEI Private Trust Company, SEI Global Fund Services Ltd., SEI Investments Global Limited, SEI Global Master Fund, SEI Global Investments Fund, SEI Global Assets Fund and SEI Investments - Guernsey Limited.
Former Directorships: Trustee of The KP Funds to 2021. Trustee of SEI Investments Management Corporation, SEI Trust Company, SEI Investments (South Africa), Limited and SEI Investments (Canada) Company to 2018. |
| December 31, 2021 | www.bishopstreetfunds.com |
41
| Bishop Street Funds |
Board of Trustees and Officers
| Name and Year of Birth | Position with Trust and Length of Time Served1 | Principal Occupations in the Past Five Years | ||
| INDEPENDENT TRUSTEES3 | ||||
| JOSEPH T. GRAUSE, JR. (Born: 1952) | Trustee (since 2011) Lead Independent Trustee (since 2018) | Self-Employed Consultant since 2012. Director of Endowments and Foundations, Morningstar Investment Management, Morningstar, Inc., 2010 to 2011. Director of International Consulting and Chief Executive Officer of Morningstar Associates Europe Limited, Morningstar, Inc., 2007 to 2010. Country Manager — Morningstar UK Limited, Morningstar, Inc., 2005 to 2007. | ||
| MITCHELL A. JOHNSON (Born: 1942) | Trustee (since 2005) | Retired. Private Investor since 1994.
| ||
| BETTY L. KRIKORIAN (Born: 1943) | Trustee (since 2005) | Vice President, Compliance, AARP Financial Inc., from 2008 to 2010. Self-Employed Legal and Financial Services Consultant since 2003. Counsel (in-house) for State Street Bank from 1995 to 2003. | ||
| ROBERT MULHALL (Born: 1958) | Trustee
| Partner, Ernst & Young LLP, from 1998 to 2018. | ||
| BRUCE SPECA (Born: 1956) | Trustee (since 2011) | Global Head of Asset Allocation, Manulife Asset Management (subsidiary of Manulife Financial), 2010 to 2011. Executive Vice President — Investment Management Services, John Hancock Financial Services (subsidiary of Manulife Financial), 2003 to 2010.
| ||
| 1 | Each Trustee shall hold office during the lifetime of this Trust until the election and qualification of his or her successor, or until he or she sooner dies, resigns, or is removed in accordance with the Trust’s Declaration of Trust. |
| 2 | Directorships of Companies required to report to the Securities and Exchange Commission under the Securities Exchange Act of 1934 (i.e., “public companies”) or other investment companies under the 1940 Act. |
| 3 | Trustees oversee 1 fund in the Bishop Street Funds. |
| Bishop Street Funds |
42
| (unaudited) |
| Other Directorships Held in the Past Five Years2 |
Current Directorships: Trustee of The Advisors’ Inner Circle Fund II, Frost Family of Funds, and Catholic Responsible Investments Funds. Director of RQSI GAA Systematic Global Macro Fund, Ltd.
Former Directorships: Trustee of The KP Funds to 2021. Director of The Korea Fund, Inc. to 2019.
|
Current Directorships: Trustee of The Advisors’ Inner Circle Fund II, Catholic Responsible Investments Funds, SEI Asset Allocation Trust, SEI Daily Income Trust, SEI Institutional International Trust, SEI Institutional Managed Trust, SEI Institutional Investments Trust, SEI Tax Exempt Trust, Adviser Managed Trust, New Covenant Funds, SEI Insurance Products Trust and SEI Catholic Values Trust. Director of Federal Agricultural Mortgage Corporation (Farmer Mac) since 1997 and RQSI GAA Systematic Global Macro Fund, Ltd.
Former Directorships: Trustee of The KP Funds to 2021. Trustee of SEI Liquid Asset Trust to 2016. |
Current Directorships: Trustee of The Advisors’ Inner Circle Fund II, and Catholic Responsible Investments Funds. Director of RQSI GAA Systematic Global Macro Fund, Ltd.
Former Directorships: Trustee of The KP Funds to 2021.
|
Current Directorships: Trustee of The Advisors’ Inner Circle Fund II, Frost Family of Funds and Catholic Responsible Investments Funds. Director of RQSI GAA Systematic Global Macro Fund, Ltd.
Former Directorships: Trustee of The KP Funds to 2021. Trustee of Villanova University Alumni Board of Directors to 2018. |
Current Directorships: Trustee of The Advisors’ Inner Circle Fund II, Frost Family of Funds and Catholic Responsible Investments Funds. Director of Stone Harbor Investments Funds (8 Portfolios), Stone Harbor Emerging Markets Income Fund (closed-end fund) and Stone Harbor Emerging Markets Total Income Fund (closed-end fund). Director of RQSI GAA Systematic Global Macro Fund, Ltd.
Former Directorships: Trustee of The KP Funds to 2021. |
| December 31, 2021 | www.bishopstreetfunds.com |
43
| Bishop Street Funds |
Board of Trustees and Officers
| Name and Year of Birth | Position with Trust and Length of Time Served | Principal Occupations in the Past Five Years | ||
| OFFICERS | ||||
| MICHAEL BEATTIE (Born: 1965) | President (since 2011) | Director of Client Service, SEI Investments, since 2004. | ||
| JAMES BERNSTEIN (Born: 1962) | Vice President and Assistant Secretary (since 2017) | Attorney, SEI Investments, since 2017.
Prior Positions: Self-employed consultant, 2017. Associate General Counsel & Vice President, Nationwide Funds Group and Nationwide Mutual Insurance Company, from 2002 to 2016. Assistant General Counsel & Vice President, Market Street Funds and Provident Mutual Insurance Company, from 1999 to 2002. | ||
| JOHN BOURGEOIS (Born: 1973) | Assistant Treasurer (since 2017) | Fund Accounting Manager, SEI Investments, since 2000. | ||
| RUSSELL EMERY (Born: 1962) | Chief Compliance Officer (since 2006) | Chief Compliance Officer of SEI Structured Credit Fund, LP since 2007. Chief Compliance Officer of The Advisors’ Inner Circle Fund II, Frost Family of Funds, Catholic Responsible Investments Funds, The Advisors’ Inner Circle Fund III, Gallery Trust, Schroder Series Trust, Schroder Global Series Trust, Delaware Wilshire Private Markets Master Fund, Delaware Wilshire Private Markets Fund, Delaware Wilshire Private Markets Tender Fund, SEI Institutional Managed Trust, SEI Asset Allocation Trust, SEI Institutional International Trust, SEI Institutional Investments Trust, SEI Daily Income Trust, SEI Tax Exempt Trust, Adviser Managed Trust, New Covenant Funds, SEI Insurance Products Trust and SEI Catholic Values Trust. Chief Compliance Officer of O’Connor EQUUS (closed-end investment company) to 2016. Chief Compliance Officer of SEI Liquid Asset Trust to 2016. Chief Compliance Officer of Winton Series Trust to 2017. Chief Compliance Officer of Winton Diversified Opportunities Fund (closed-end investment company) to 2018. Chief Compliance Officer of The KP Funds to 2021. | ||
| ERIC C. GRIFFITH (Born: 1969) | Vice President and Assistant Secretary (since 2019) | Counsel at SEI Investments since 2019. Vice President and Assistant General Counsel, JPMorgan Chase & Co., from 2012 to 2018. | ||
| Bishop Street Funds |
44
| (unaudited) |
| Other Directorships Held in the Past Five Years |
None.
|
None.
|
None.
|
None.
|
None.
|
| December 31, 2021 | www.bishopstreetfunds.com |
45
| Bishop Street Funds |
Board of Trustees and Officers
| Name and Year of Birth | Position with Trust and Length of Time Served | Principal Occupations in the Past Five Years | ||
| OFFICERS (continued) | ||||
| MATTHEW M. MAHER (Born: 1975) | Vice President (since 2018) Secretary (since 2020) | Counsel at SEI Investments since 2018. Attorney, Blank Rome LLP, from 2015 to 2018. Assistant Counsel & Vice President, Bank of New York Mellon, from 2013 to 2014. Attorney, Dilworth Paxson LLP, from 2006 to 2013. | ||
| ANDREW METZGER (Born: 1980) | Treasurer, Controller and Chief Financial Officer (since 2021) | Director of Fund Accounting, SEI Investments, since 2020. Senior Director, Embark, from 2019 to 2020. Senior Manager, PricewaterhouseCoopers LLP, from 2002 to 2019. | ||
| ROBERT MORROW (Born: 1968) | Vice President (since 2017) | Account Manager, SEI Investments, since 2007. | ||
| ALEXANDER F. SMITH (Born: 1977) | Vice President and Assistant Secretary (since 2020) | Counsel at SEI Investments since 2020. Associate Counsel & Manager, Vanguard, 2012 to 2020. Attorney, Stradley Ronon Stevens & Young, LLP, 2008 to 2012. | ||
| BRIDGET E. SUDALL (Born: 1980) | Anti-Money Laundering Compliance Officer and Privacy Officer (since 2015) | Senior Associate and AML Officer, Morgan Stanley Alternative Investment Partners, from 2011 to 2015. Investor Services Team Lead, Morgan Stanley Alternative Investment Partners, from 2007 to 2011. | ||
| Bishop Street Funds |
46
| (unaudited) |
| Other Directorships Held in the Past Five Years |
None.
|
None.
|
None.
|
None.
|
None.
|
| December 31, 2021 | www.bishopstreetfunds.com |
47
INVESTMENT ADVISER
BISHOP STREET CAPITAL MANAGEMENT
HONOLULU, HI 96813
ADMINISTRATOR
SEI INVESTMENTS GLOBAL FUNDS SERVICES
ONE FREEDOM VALLEY DRIVE
OAKS, PA 19456
DISTRIBUTOR
SEI INVESTMENTS DISTRIBUTION CO.
ONE FREEDOM VALLEY DRIVE
OAKS, PA 19456
TRANSFER AGENT
DST SYSTEMS, INC.
KANSAS CITY, MO 64121
CUSTODIAN
U.S. BANK, N.A.
MILWAUKIE, OR 97222
LEGAL COUNSEL
MORGAN, LEWIS & BOCKIUS LLP
PHILADELPHIA, PA 19103
INDEPENDENT REGISTERED PUBLIC ACCOUNTING FIRM
PRICEWATERHOUSECOOPERS LLP
PHILADELPHIA, PA 19103

FORMOREINFORMATIONABOUT BISHOP STREET FUNDS,CALL 1-800-262-9565ORYOUR INVESTMENT SPECIALISTVISITUSONLINEATWWW.BISHOPSTREETFUNDS.COM
 | BISHOP STREET FUNDS P.O. BOX 219721 KANSAS CITY, MO 64121-9721 |
THISREPORTANDTHEFINANCIALSTATEMENTSCONTAINEDHEREINARESUBMITTEDFORTHEGENERALINFORMATIONOF BISHOP STREET FUNDS’SHAREHOLDERS. THISREPORTISNOTAUTHORIZEDFORDISTRIBUTIONTOPROSPECTIVEINVESTORSUNLESSPRECEDEDORACCOMPANIEDBYANEFFECTIVEPROSPECTUS.
SHARESOF BISHOP STREET FUNDSARE NOTDEPOSITSOROBLIGATIONSOF,ORGUARANTEEDBY FIRST HAWAIIAN BANKORANYOFITSAFFILIATES. SUCHSHARESAREALSO NOTFEDERALLYINSUREDBYTHE FEDERAL DEPOSIT INSURANCE CORPORATION, THE FEDERAL RESERVE BOARD,ORANYOTHERAGENCY. INVESTMENTINSHARESOFMUTUALFUNDSINVOLVESRISK,INCLUDINGTHEPOSSIBLELOSSOFPRINCIPAL. THE BISHOP STREET FUNDSAREDISTRIBUTEDBY SEI INVESTMENTS DISTRIBUTION CO.,WHICHIS NOTAFFILIATEDWITH FIRST HAWAIIAN BANK, BANKOFTHE WESTOR BANCWEST CORPORATION. BANCWEST CORPORATIONISAWHOLLY-OWNEDSUBSIDIARYOF BNP PARIBAS.
BSF-AR-006-2700
| Item 2. | Code of Ethics. |
The Registrant has adopted a code of ethics that applies to the Registrant’s principal executive officer, principal financial officer, controller or principal accounting officer, and any person who performs a similar function. There have been no amendments to or waivers granted to this code of ethics during the period covered by this report.
| Item 3. | Audit Committee Financial Expert. |
(a)(1) The Registrant’s board of trustees has determined that the Registrant has at least one audit committee financial expert serving on the audit committee.
(a)(2) The Registrant’s audit committee financial expert is Robert Mulhall. Mr. Hulhall is considered to be “independent”, as defined in Form N-CSR Item 3 (a)(2).
| Item 4. | Principal Accountant Fees and Services. |
Fees billed by PricewaterhouseCoopers LLP (PwC) related to the Trust.
PwC billed the Trust aggregate fees for services rendered to the Trust for the last two fiscal years as follows:
| 2021 | 2020 | |||||||||||||
| All fees and services to the Trust that were pre-approved | All fees and services to service affiliates that were pre-approved | All other fees and services to service affiliates that did not require pre-approval | All fees and services to the Trust that were pre-approved | All fees and services to service affiliates that were pre-approved | All other fees and services to service affiliates that did not require pre-approval | |||||||||
(a) | Audit Fees(1) | $27,600 | N/A | N/A | $55,200 | N/A | N/A | |||||||
(b) | Audit-Related Fees | N/A | N/A | N/A | N/A | N/A | N/A | |||||||
(c) | Tax Fees | N/A | N/A | N/A | N/A | N/A | N/A | |||||||
(d) | All Other Fees | N/A | N/A | N/A | N/A | N/A | N/A | |||||||
Notes:
| (1) | Audit fees include amounts related to the audit of the Registrant’s annual financial statements and services normally provided by the accountant in connection with statutory and regulatory filings. |
(e)(1) The Trust’s Audit Committee has adopted and the Board of Trustees has ratified an Audit and Non-Audit Services Pre-Approval Policy (the “Policy”), which sets forth the procedures and the conditions pursuant to which services proposed to be performed by the independent auditor of the Funds may be pre-approved.
The Policy provides that all requests or applications for proposed services to be provided by the independent auditor must be submitted to the Registrant’s Chief Financial Officer (“CFO”) and must include a detailed description of the services proposed to be rendered. The CFO will determine whether such services:
(1) require specific pre-approval; (2) are included within the list of services that have received the general pre-approval of the Audit Committee pursuant to the Policy; or (3) have been previously pre-approved in connection with the independent auditor’s annual engagement letter for the applicable year or otherwise. In any instance where services require pre-approval, the Audit Committee will consider whether such services are consistent with SEC’s rules and whether the provision of such services would impair the auditor’s independence.
Requests or applications to provide services that require specific pre-approval by the Audit Committee will be submitted to the Audit Committee by the CFO. The Audit Committee will be informed by the CFO on a quarterly basis of all services rendered by the independent auditor. The Audit Committee has delegated specific pre-approval authority to either the Audit Committee Chair or financial expert, provided that the estimated fee for any such proposed pre-approved service does not exceed $100,000 and any pre-approval decisions are reported to the Audit Committee at its next regularly scheduled meeting.
Services that have received the general pre-approval of the Audit Committee are identified and described in the Policy. In addition, the Policy sets forth a maximum fee per engagement with respect to each identified service that has received general pre-approval.
All services to be provided by the independent auditor shall be provided pursuant to a signed written engagement letter with the Registrant, the investment adviser, or applicable control affiliate (except that matters as to which an engagement letter would be impractical because of timing issues or because the matter is small may not be the subject of an engagement letter) that sets forth both the services to be provided by the independent auditor and the total fees to be paid to the independent auditor for those services.
In addition, the Audit Committee has determined to take additional measures on an annual basis to meet the Audit Committee’s responsibility to oversee the work of the independent auditor and to assure the auditor’s independence from the Registrant, such as (a) reviewing a formal written statement from the independent auditor delineating all relationships between the independent auditor and the Registrant, and (b) discussing with the independent auditor the independent auditor’s methods and procedures for ensuring independence.
(e)(2) Percentage of fees billed applicable to non-audit services pursuant to (c)(7)(i)(C) of Rule 2-01 of Regulation S-X, waiver of pre-approval requirement were as follows:
| 2021 | 2020 | |||
| Audit-Related Fees | N/A | N/A | ||
Tax Fees | N/A | N/A |
All Other Fees | N/A | N/A |
(f) Not applicable.
(g) The aggregate non-audit fees and services billed by PwC for services rendered to the Registrant, and rendered to the Registrant’s investment adviser (not including any sub-adviser whose role is primarily portfolio management and is subcontracted with or overseen by another investment adviser), and any entity controlling, controlled by, or under common control with the adviser that provides ongoing services to the Registrant for the last two fiscal years were $0 and $0 for 2021 and 2020, respectively.
(h) During the past fiscal year, all non-audit services provided by the Registrant’s principal accountant to either the Registrant’s investment adviser or to any entity controlling, controlled by, or under common control with the Registrant’s investment adviser that provides ongoing services to the Registrant were pre-approved by the Audit Committee of Registrant’s Board of Trustees. Included in the Audit Committee’s pre-approval of these non-audit service were the review and consideration as to whether the provision of these non-audit services is compatible with maintaining the principal accountant’s independence.
| Item 5. | Audit Committee of Listed Registrants. |
Not applicable to open-end management investment companies.
| Item 6. | Schedule of Investments. |
Schedule of Investments is included as part of the Report to Shareholders filed under Item 1 of this form.
| Item 7. | Disclosure of Proxy Voting Policies and Procedures for Closed-End Management Investment Companies. |
Not applicable to open-end management investment companies.
| Item 8. | Portfolio Managers of Closed-End Management Investment Companies. |
Not applicable to open-end management investment companies.
| Item 9. | Purchases of Equity Securities by Closed-End Management Company and Affiliated Purchasers. |
Not applicable to open-end management investment companies.
| Item 10. | Submission of Matters to a Vote of Security Holders. |
There have been no changes to the procedures by which shareholders may recommend nominees to the Registrant’s Board of Trustees during the period covered by this report.
| Item 11. | Controls and Procedures. |
(a) The Registrant’s principal executive and principal financial officers, or persons performing similar functions, have concluded that the Registrant’s disclosure controls and procedures, as defined in Rule 30a-3(c) under the Act (17 CFR § 270.30a-3(c)), as of a date within 90 days of the filing date of the report, are effective based on the evaluation of these controls and procedures
required by Rule 30a-3(b) under the Act (17 CFR § 270.30a-3(b)) and Rule 13a-15(b) or Rule 15d-15(b) under the Exchange Act (17 CFR § 240.13a-15(b) or § 240.15d-15(b)).
(b) There has been no change in the Registrant’s internal control over financial reporting (as defined in Rule 30a-3(d) under the Act (17 CFR § 270.30a-3(d)) that occurred during the period covered by this report that has materially affected, or is reasonably likely to materially affect, the Registrant’s internal control over financial reporting.
| Item 12. | Disclosure of Securities Lending Activities for Closed-End Management Investment Companies. |
Not applicable to open-end management investment companies.
| Item 13. | Exhibits. |
SIGNATURES
Pursuant to the requirements of the Securities Exchange Act of 1934 and the Investment Company Act of 1940, the Registrant has duly caused this report to be signed on its behalf by the undersigned, thereunto duly authorized.
| (Registrant) | Bishop Street Funds | |||||
| By (Signature and Title) | /s/ Michael Beattie | |||||
| Michael Beattie | ||||||
| President | ||||||
Date: March 11, 2022
Pursuant to the requirements of the Securities Exchange Act of 1934 and the Investment Company Act of 1940, this report has been signed below by the following persons on behalf of the Registrant and in the capacities and on the dates indicated.
| By (Signature and Title) | /s/ Michael Beattie | |||||
| Michael Beattie | ||||||
| President |
Date: March 11, 2022
| By (Signature and Title) | /s/ Andrew Metzger | |||||
| Andrew Metzger | ||||||
| Treasurer, Controller, and CFO |
Date: March 11, 2022