UNITED STATES
SECURITIES AND EXCHANGE COMMISSION
Washington, D.C. 20549
FORM N-CSR
CERTIFIED SHAREHOLDER REPORT OF REGISTERED
MANAGEMENT INVESTMENT COMPANIES
Investment Company Act File Number 811-08614
Brandes Investment Trust
(Exact name of registrant as specified in charter)
11988 El Camino Real, Suite 600
San Diego, CA 92130
(Address of principal executive offices) (Zip code)
Lea Anne Copenhefer
Morgan, Lewis & Bockius LLP
One Federal Street
Boston, MA 02110-1726
(Name and address of agent for service)
(800) 331-2979
Registrant’s telephone number, including area code
Date of fiscal year end: September 30
Date of reporting period: March 31, 2021
Item 1. Reports to Stockholders.
(a) The following is a copy of the reports transmitted to shareholders pursuant to Rule 30e-1 under the Investment Company Act of 1940 (the “Act”) (17 CFR 270.30e-1):
GLOBAL EQUITY FUND


| • | a possible increase in inflation and interest rates; and |
| • | a likely pickup in economic growth as global economies begin to reopen and potentially benefit from government stimulus. |

| Average Annual Total Return Periods Ended March 31, 2021 | |||||||
| One Year | Five Years | Ten Years | Since Inception(1) | ||||
| Brandes International Equity Fund | |||||||
Class A* | 53.99% | 6.02% | 4.31% | 7.27% | |||
Class A *(with maximum sales charge) | 45.14% | 4.77% | 3.69% | 7.01% | |||
Class C* | 52.94% | 5.24% | 3.52% | 6.46% | |||
Class C *(with maximum sales charge) | 51.94% | 5.24% | 3.52% | 6.46% | |||
Class I | 54.53% | 6.27% | 4.52% | 7.51% | |||
Class R6* | 54.66% | 6.43% | 4.63% | 7.59% | |||
MSCI EAFE (Europe, Australasia and Far East) Index | 44.57% | 8.85% | 5.52% | 5.12% | |||
| (1) | The inception date is January 2, 1997. |
| * | Performance shown prior to January 31, 2011 for Class A shares reflects the performance of Class I shares adjusted to reflect Class A expenses. Performance shown prior to January 31, 2013 for Class C shares reflects the performance of Class I shares adjusted to reflect Class C expenses. Performance shown prior to February 1, 2016 for Class R6 shares reflects the performance of Class I shares adjusted to reflect Class R6 expenses. |

| Average Annual Total Return Periods Ended March 31, 2021 | |||||||
| One Year | Five Years | Ten Years | Since Inception(1) | ||||
| Brandes Global Equity Fund | |||||||
Class A* | 61.77% | 8.79% | 6.61% | 7.14% | |||
Class A *(with maximum sales charge) | 52.46% | 7.50% | 5.99% | 6.63% | |||
Class C* | 60.55% | 7.96% | 5.82% | 6.32% | |||
Class C *(with maximum sales charge) | 59.55% | 7.96% | 5.82% | 6.32% | |||
Class I | 62.17% | 9.05% | 6.88% | 7.39% | |||
MSCI World Index | 54.03% | 13.36% | 9.88% | 10.21% | |||
| (1) | The inception date is October 6, 2008. |
| * | Performance shown prior to January 31, 2011 for Class A shares reflects the performance of Class I shares adjusted to reflect Class A expenses. Performance shown prior to January 31, 2013 for Class C shares reflects the performance of Class I shares adjusted to reflect Class C expenses. |

| • | an increase in inflation and interest rates; |
| • | pickup in economic growth as global economies begin to reopen and potentially benefit from government stimulus; and |
| • | the prospect of increased government regulation of technology companies, which make up a meaningful portion of growth indices (e.g., 25% of MSCI EM Growth vs. 17% of MSCI EM Value as of March 31). |

| Average Annual Total Return Periods Ended March 31, 2021* | |||||||
| One Year | Five Years | Ten Years | Since Inception(1) | ||||
| Brandes Emerging Markets Value Fund | |||||||
Class A | 47.25% | 5.99% | 0.77% | 6.70% | |||
Class A (with maximum sales charge) | 38.78% | 4.75% | 0.18% | 6.45% | |||
Class C** | 46.25% | 5.22% | 0.04% | 5.88% | |||
Class C **(with maximum sales charge) | 45.25% | 5.22% | 0.04% | 5.88% | |||
Class I | 47.66% | 6.24% | 1.03% | 6.94% | |||
Class R6** | 47.79% | 6.40% | 1.14% | 7.02% | |||
MSCI Emerging Markets Index | 58.39% | 12.07% | 3.65% | 6.70% | |||
| (1) | The inception date is August 20, 1996. |
| * | Prior to January 31, 2011, the Advisor managed a private investment fund with an investment objective, investment policies and strategies that were, in all material respects, equivalent to those of the Brandes Emerging Markets Value Fund. The performance information shown for the Class I shares for periods before January 31, 2011 is that of the private investment fund and reflects the net expenses of the private investment fund. The performance of the private investment fund prior to January 31, 2011 is based on a calculation method that is different from the standardized calculation method prescribed by the SEC. The performance information shown for the Class A shares has been adjusted to reflect the differences in the net expense ratios between the Class I and A shares. The private investment fund was not registered under the Investment Company Act of 1940 (“1940 Act”) and was not subject to certain investment |
| limitations, diversification requirements, and other restrictions imposed by the 1940 Act and the Internal Revenue Code of 1986, which, if applicable, may have adversely affected its performance. | |
| ** | Performance shown prior to January 31, 2013 for Class C shares reflects the performance of Class I shares adjusted to reflect Class C expenses. Performance shown prior to July 11, 2016 for Class R6 shares reflects the performance of Class I shares adjusted to reflect Class R6 expenses. |

| • | a probable increase in inflation and interest rates; and |
| • | a likely pickup in economic growth as global economies begin to reopen and potentially benefit from government stimulus. |

| Average Annual Total Return Periods Ended March 31, 2021* | |||||||
| One Year | Five Years | Ten Years | Since Inception(1) | ||||
| Brandes International Small Cap Equity Fund | |||||||
Class A | 64.61% | 3.07% | 4.99% | 8.59% | |||
Class A (with maximum sales charge) | 55.15% | 1.86% | 4.37% | 8.33% | |||
Class C** | 63.36% | 2.30% | 4.21% | 7.78% | |||
Class C **(with maximum sales charge) | 62.36% | 2.30% | 4.21% | 7.78% | |||
Class I | 64.76% | 3.28% | 5.21% | 8.84% | |||
Class R6** | 64.94% | 3.40% | 5.30% | 8.91% | |||
S&P Developed Ex-U.S. SmallCap Index | 66.31% | 10.14% | 7.17% | 7.16% | |||
| (1) | The inception date is August 19, 1996. |
| * | Prior to February 1, 2012, the Advisor managed a private investment fund with an investment objective, investment policies and strategies that were, in all material respects, equivalent to those of the Brandes International Small Cap Fund. The performance information shown for the Class I shares for periods before February 1, 2012 is that of the private investment fund and reflects the net expenses of the private investment fund. The performance of the private investment fund prior to February 1, 2012 is based on a calculation method that is different from the standardized calculation method prescribed by the SEC. The performance information shown for the Class A shares has been adjusted to reflect the differences in the net expense ratios between the Class I and A shares. The private investment fund was not registered under the Investment Company Act of 1940 (“1940 Act”) and was not subject to certain investment |
| limitations, diversification requirements, and other restrictions imposed by the 1940 Act and the Internal Revenue Code of 1986, which, if applicable, may have adversely affected its performance. | |
| ** | Performance shown prior to January 31, 2013 for Class C shares reflects the performance of Class I shares adjusted to reflect Class C expenses. Performance shown prior to June 27, 2016 for Class R6 shares reflects the performance of Class I shares adjusted to reflect Class R6 expenses. |

| Average Annual Total Return Periods Ended March 31, 2021* | |||||||
| One Year | Five Years | Ten Years | Since Inception(1) | ||||
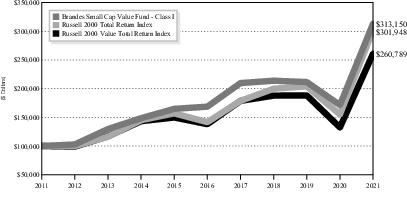
| Brandes Small Cap Value Fund | |||||||
Class A | 82.23% | 12.86% | 11.81% | 7.65% | |||
Class A (with maximum sales charge) | 71.79% | 11.54% | 11.15% | 7.38% | |||
Class I | 82.75% | 13.19% | 12.09% | 7.92% | |||
Class R6** | 83.39% | 11.78% | 11.39% | 7.63% | |||
Russell 2000 Total Return Index | 94.85% | 16.35% | 11.68% | 8.41% | |||
Russell 2000 Value Total Return Index | 97.05% | 13.56% | 10.06% | 8.75% | |||
| (1) | The inception date is September 30, 1997. |
| * | Prior to January 2, 2018, the Advisor managed a private investment fund with an investment objective, investment policies and strategies that were, in all material respects, equivalent to those of the Brandes Small Cap Value Fund. The performance information shown for the Class I shares for periods before January 2, 2018 is that of the private investment fund and reflects the net expenses of the private investment fund. The performance of the private investment fund prior to January 2, 2018 is based on a calculation method that is different from the standardized calculation method prescribed by the SEC. The performance information shown for the Class A shares has been adjusted to reflect the differences in the net expense ratios between the Class I and A shares. |
| ** | Performance shown prior to January 2, 2018 for Class R6 shares reflects the performance of Class I shares. The private investment fund was not registered under the Investment Company Act of 1940 (“1940 Act”) |
| and was not subject to certain investment limitations, diversification requirements, and other restrictions imposed by the 1940 Act and the Internal Revenue Code of 1986, which, if applicable, may have adversely affected its performance. |

| • | enormous central-bank and fiscal accommodation; |
| • | pandemic-related supply chain bottlenecks; |
| • | de-globalization of supply chains in response to pandemic-related disruptions and shortages; |
| • | increasing commodity price pressures; and |
| • | U.S. savings rate near a 60-year high, indicating strong pent-up demand. |

| Average Annual Total Return Periods Ended March 31, 2021 | |||||||
| One Year | Five Years | Ten Years | Since Inception(1) | ||||
| Brandes Core Plus Fixed Income Fund | |||||||
Class A* | 2.54% | 2.86% | 3.19% | 3.46% | |||
Class A *(with maximum sales charge) | -1.30% | 2.07% | 2.79% | 3.16% | |||
Class I | 2.74% | 3.13% | 3.51% | 3.77% | |||
Class R6* | 3.97% | 3.77% | 3.85% | 4.04% | |||
Bloomberg Barclays U.S. Aggregate Bond Index | 0.71% | 3.10% | 3.44% | 3.98% | |||
| (1) | The inception date is December 28, 2007. |
| * | Performance shown prior to January 31, 2013 for Class A shares reflects the performance of Class I shares adjusted to reflect Class A expenses. Performance shown prior to October 10, 2017 for Class R6 shares reflects the performance of Class I shares adjusted to reflect Class R6 expenses. |
| Class A | ||||||||
| Fund | Beginning Account Value | Ending Account Value | Annualized Expense Ratio | Expenses Paid During the Period* | ||||
International Equity Fund | $1,000.00 | $1,327.80 | 1.11% | $6.43 | ||||
Global Equity Fund | $1,000.00 | $1,374.50 | 1.25% | $7.39 | ||||
Emerging Markets Value Fund | $1,000.00 | $1,259.90 | 1.30% | $7.35 | ||||
International Small Cap Fund | $1,000.00 | $1,380.80 | 1.32% | $7.86 | ||||
Small Cap Value Fund | $1,000.00 | $1,477.90 | 1.15% | $7.10 | ||||
Core Plus Fixed Income Fund | $1,000.00 | $ 988.00 | 0.50% | $2.47 | ||||
| Class C | ||||||||
| Fund | Beginning Account Value | Ending Account Value | Annualized Expense Ratio | Expenses Paid During the Period* | ||||
International Equity Fund | $1,000.00 | $1,322.90 | 1.86% | $10.76 | ||||
Global Equity Fund | $1,000.00 | $1,368.80 | 2.00% | $11.80 | ||||
Emerging Markets Value Fund | $1,000.00 | $1,255.30 | 2.05% | $11.55 | ||||
International Small Cap Fund | $1,000.00 | $1,375.10 | 2.07% | $12.29 | ||||
| Class I | ||||||||
| Fund | Beginning Account Value | Ending Account Value | Annualized Expense Ratio | Expenses Paid During the Period* | ||||
International Equity Fund | $1,000.00 | $1,329.80 | 0.85% | $4.93 | ||||
Global Equity Fund | $1,000.00 | $1,376.20 | 1.00% | $5.92 | ||||
Emerging Markets Value Fund | $1,000.00 | $1,263.10 | 1.12% | $6.31 | ||||
International Small Cap Fund | $1,000.00 | $1,382.00 | 1.14% | $6.74 | ||||
Small Cap Value Fund | $1,000.00 | $1,479.90 | 0.90% | $5.56 | ||||
Core Plus Fixed Income Fund | $1,000.00 | $ 989.20 | 0.30% | $1.49 | ||||
| Class R6 | ||||||||
| Fund | Beginning Account Value | Ending Account Value | Annualized Expense Ratio | Expenses Paid During the Period* | ||||
International Equity Fund | $1,000.00 | $1,330.60 | 0.75% | $4.35 | ||||
Emerging Markets Value Fund | $1,000.00 | $1,263.00 | 0.97% | $5.47 | ||||
International Small Cap Fund | $1,000.00 | $1,383.70 | 1.00% | $5.93 | ||||
Small Cap Value Fund | $1,000.00 | $1,485.40 | 0.72% | $4.46 | ||||
Core Plus Fixed Income Fund | $1,000.00 | $ 996.70 | 0.30% | $1.49 | ||||
| * | The Fund’s expenses are equal to the Fund’s expense ratio for the period, multiplied by the average account value over the period, multiplied by 182/365 (to reflect the one half-year period). |
| Class A | ||||||||
| Fund | Beginning Account Value | Ending Account Value | Annualized Expense Ratio | Expenses Paid During the Period* | ||||
International Equity Fund | $1,000.00 | $1,019.40 | 1.11% | $5.58 | ||||
Global Equity Fund | $1,000.00 | $1,018.71 | 1.25% | $6.28 | ||||
Emerging Markets Value Fund | $1,000.00 | $1,018.43 | 1.30% | $6.56 | ||||
International Small Cap Fund | $1,000.00 | $1,018.33 | 1.32% | $6.66 | ||||
Small Cap Value Fund | $1,000.00 | $1,019.20 | 1.15% | $5.78 | ||||
Core Plus Fixed Income Fund | $1,000.00 | $1,022.44 | 0.50% | $2.52 | ||||
| Class C | ||||||||
| Fund | Beginning Account Value | Ending Account Value | Annualized Expense Ratio | Expenses Paid During the Period* | ||||
International Equity Fund | $1,000.00 | $1,015.67 | 1.86% | $ 9.34 | ||||
Global Equity Fund | $1,000.00 | $1,014.97 | 2.00% | $10.03 | ||||
Emerging Markets Value Fund | $1,000.00 | $1,014.69 | 2.05% | $10.32 | ||||
International Small Cap Fund | $1,000.00 | $1,014.59 | 2.07% | $10.42 | ||||
| Class I | ||||||||
| Fund | Beginning Account Value | Ending Account Value | Annualized Expense Ratio | Expenses Paid During the Period* | ||||
International Equity Fund | $1,000.00 | $1,020.70 | 0.85% | $4.28 | ||||
Global Equity Fund | $1,000.00 | $1,019.95 | 1.00% | $5.03 | ||||
Emerging Markets Value Fund | $1,000.00 | $1,019.36 | 1.12% | $5.63 | ||||
International Small Cap Fund | $1,000.00 | $1,019.27 | 1.14% | $5.71 | ||||
Small Cap Value Fund | $1,000.00 | $1,020.45 | 0.90% | $4.53 | ||||
Core Plus Fixed Income Fund | $1,000.00 | $1,023.44 | 0.30% | $1.51 | ||||
| Class R6 | ||||||||
| Fund | Beginning Account Value | Ending Account Value | Annualized Expense Ratio | Expenses Paid During the Period* | ||||
International Equity Fund | $1,000.00 | $1,021.20 | 0.75% | $3.77 | ||||
Emerging Markets Value Fund | $1,000.00 | $1,020.10 | 0.97% | $4.88 | ||||
International Small Cap Fund | $1,000.00 | $1,019.95 | 1.00% | $5.03 | ||||
Small Cap Value Fund | $1,000.00 | $1,021.34 | 0.72% | $3.63 | ||||
Core Plus Fixed Income Fund | $1,000.00 | $1,023.44 | 0.30% | $1.51 | ||||
| * | The Fund’s expenses are equal to the Fund’s expense ratio for the period, multiplied by the average account value over the period, multiplied by 182/365 (to reflect the one half-year period). |
| Shares | Value | |
| COMMON STOCKS – 94.42% | ||
| Belgium – 1.10% | ||
| 108,008 | Anheuser-Busch InBev SA/NV | $ 6,789,690 |
| Brazil – 4.28% | ||
| 2,961,200 | Ambev SA | 8,043,980 |
| 925,447 | Embraer SA Sponsored – ADR(a) | 9,263,724 |
| 1,150,100 | Telefonica Brasil SA | 9,037,500 |
| 26,345,204 | ||
| Canada – 0.69% | ||
| 257,078 | Cameco Corp. | 4,270,065 |
| France – 19.93% | ||
| 170,605 | BNP Paribas SA(a) | 10,394,846 |
| 811,721 | Carrefour SA | 14,696,703 |
| 195,425 | Cie de Saint-Gobain(a) | 11,540,149 |
| 168,325 | Danone SA | 11,521,521 |
| 809,027 | Engie SA(a) | 11,492,492 |
| 852,807 | Orange SA | 10,494,609 |
| 272,138 | Publicis Groupe SA | 16,595,606 |
| 109,350 | Renault SA(a) | 4,728,496 |
| 155,731 | Sanofi | 15,399,328 |
| 109,119 | Societe BIC SA | 6,387,271 |
| 203,578 | Total SE | 9,490,760 |
| 122,741,781 | ||
| Germany – 6.86% | ||
| 88,582 | BASF SE | 7,361,428 |
| 247,227 | Fresenius & Co. KGaA | 11,016,532 |
| 163,623 | HeidelbergCement AG | 14,866,452 |
| 91,017 | Henkel AG & Co. KGaA | 9,017,267 |
| 42,261,679 | ||
| Hong Kong – 0.64% | ||
| 11,842,000 | First Pacific Co. Ltd. | 3,915,222 |
| Ireland – 1.26% | ||
| 165,736 | CRH Plc | 7,769,770 |
| Italy – 5.99% | ||
| 1,040,160 | Eni SpA | 12,817,072 |
| 4,158,760 | Intesa Sanpaolo SpA(a) | 11,268,466 |
| 20,990,411 | Telecom Italia Rsp | 12,069,966 |
| 1,365,052 | Telecom Italia SpA | 738,470 |
| 36,893,974 | ||
| Shares | Value | |
| Japan – 13.34% | ||
| 243,700 | Dai Nippon Printing Co. Ltd. | $ 5,111,748 |
| 311,800 | Honda Motor Co. Ltd. | 9,399,376 |
| 2,132,500 | Mitsubishi UFJ Financial Group, Inc. | 11,403,098 |
| 345,899 | MS&AD Insurance Group Holdings, Inc. | 10,174,961 |
| 983,300 | Nissan Motor Co. Ltd.(a) | 5,493,355 |
| 283,500 | Sumitomo Mitsui Trust Holdings, Inc. | 9,891,177 |
| 118,300 | Taisho Pharmaceutical Holdings Co. Ltd. | 7,644,657 |
| 632,083 | Takeda Pharmaceutical Co. Ltd. | 23,040,798 |
| 82,159,170 | ||
| Mexico – 5.56% | ||
| 1,413,992 | Cemex SAB de CV Sponsored – ADR(a) | 9,855,524 |
| 12,910,084 | Fibra Uno Administracion SA de CV | 15,089,504 |
| 123,412 | Fomento Economico Mexicano SAB de CV – ADR | 9,296,626 |
| 34,241,654 | ||
| Netherlands – 1.09% | ||
| 1,411,784 | Aegon NV | 6,707,783 |
| South Korea – 4.35% | ||
| 157,131 | Hana Financial Group, Inc. | 5,943,163 |
| 26,804 | Hyundai Mobis Co. Ltd. | 6,952,740 |
| 99,249 | KT&G Corp. | 7,149,565 |
| 23,883 | POSCO | 6,767,397 |
| 26,812,865 | ||
| Spain – 1.25% | ||
| 619,579 | Repsol SA | 7,690,195 |
| Switzerland – 9.49% | ||
| 1,091,773 | Credit Suisse Group AG Registered | 11,550,264 |
| 143,252 | Novartis AG Registered | 12,245,284 |
| Shares | Value | |
| 16,342 | Swatch Group AG Bearer | $ 4,705,491 |
| 119,343 | Swatch Group AG Registered | 6,654,604 |
| 94,693 | Swiss Re AG | 9,312,404 |
| 903,408 | UBS Group AG Registered | 13,977,067 |
| 58,445,114 | ||
| Taiwan – 1.02% | ||
| 481,000 | Asustek Computer, Inc. | 6,310,601 |
| United Kingdom – 17.57% | ||
| 3,660,794 | Barclays Plc | 9,375,005 |
| 3,059,491 | BP Plc | 12,427,520 |
| 966,701 | GlaxoSmithKline Plc | 17,113,337 |
| 400,385 | Imperial Brands Plc | 8,208,263 |
| 3,637,517 | J Sainsbury Plc | 12,163,819 |
| 2,225,208 | Kingfisher Plc(a) | 9,753,180 |
| 3,811,873 | Marks & Spencer Group Plc(a) | 7,923,277 |
| 2,396,264 | Tesco Plc | 7,565,555 |
| Shares | Value | |
| 3,080,264 | Wm Morrison Supermarkets Plc | $ 7,747,084 |
| 1,250,278 | WPP Plc | 15,932,892 |
| 108,209,932 | ||
| TOTAL COMMON STOCKS (Cost $601,315,055) | $581,564,699 | |
| PREFERRED STOCKS – 5.14% | ||
| Brazil – 1.55% | ||
| 2,233,200 | Petroleo Brasileiro SA, 3.28%(b) | $ 9,561,817 |
| Russia – 1.43% | ||
| 15,780,039 | Surgutneftegas PJSC, 2.31%(b) | 8,765,529 |
| Spain – 2.16% | ||
| 777,959 | Grifols SA – Class B, 2.21%(b) | 13,321,823 |
| TOTAL PREFERRED STOCKS (Cost $28,330,638) | $ 31,649,169 | |
| Shares | Value | |
| SHORT-TERM INVESTMENTS – 1.06% | ||
| Money Market Funds — 1.06% | ||
Northern Institutional Funds - Treasury Portfolio (Premier), 0.01%(c) | 6,524,877 | $ 6,524,877 |
TOTAL SHORT-TERM INVESTMENTS (Cost $6,524,877) | $ 6,524,877 | |
Total Investments (Cost $636,170,570) – 100.62% | $619,738,745 | |
Liabilities in Excess of Other Assets – (0.62)% | (3,806,210) | |
TOTAL NET ASSETS – 100.00% | $615,932,535 | |
| Percentages are stated as a percent of net assets. | ||
| ADR American Depositary Receipt | ||
| (a) | Non-income producing security. |
| (b) | Current yield is disclosed. Dividends are calculated based on a percentage of the issuer’s net income. |
| (c) | The rate shown is the annualized seven day yield as of March 31, 2021. |
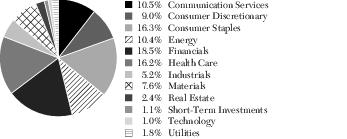
| COMMON STOCKS | |
Aerospace & Defense | 1.50% |
Auto Components | 1.13% |
Automobiles | 3.19% |
Banks | 9.46% |
Beverages | 3.92% |
Building Products | 1.87% |
Capital Markets | 4.15% |
Chemicals | 1.20% |
Commercial Services & Supplies | 1.87% |
Construction Materials | 5.27% |
Diversified Financial Services | 0.64% |
Diversified Telecommunication Services | 5.25% |
Equity Real Estate Investment Trusts | 2.45% |
Food & Staples Retailing | 6.85% |
Food Products | 1.87% |
Health Care Providers & Services | 1.79% |
Household Products | 1.46% |
Insurance | 4.25% |
Media | 5.28% |
Metals & Mining | 1.10% |
Multiline Retail | 1.29% |
Multi-Utilities | 1.87% |
Oil, Gas & Consumable Fuels | 7.58% |
Pharmaceuticals | 12.25% |
Specialty Retail | 1.58% |
Technology Hardware, Storage & Peripherals | 1.02% |
Textiles, Apparel & Luxury Goods | 1.84% |
Tobacco | 2.49% |
TOTAL COMMON STOCKS | 94.42% |
| PREFERRED STOCKS | |
Biotechnology | 2.16% |
Oil, Gas & Consumable Fuels | 2.98% |
TOTAL PREFERRED STOCKS | 5.14% |
SHORT-TERM INVESTMENTS | 1.06% |
TOTAL INVESTMENTS | 100.62% |
Liabilities in Excess of Other Assets | (0.62)% |
TOTAL NET ASSETS | 100.00% |
| Shares | Value | |
| COMMON STOCKS – 97.77% | ||
| Austria – 1.95% | ||
| 23,579 | Erste Group Bank AG(a) | $ 798,817 |
| Brazil – 1.26% | ||
| 154,720 | Embraer SA(a) | 385,106 |
| 12,908 | Embraer SA Sponsored – ADR(a) | 129,209 |
| 514,315 | ||
| China – 1.96% | ||
| 28,200 | Alibaba Group Holding Ltd.(a) | 801,236 |
| France – 11.28% | ||
| 21,495 | Carrefour SA | 389,180 |
| 25,147 | Engie SA(a) | 357,222 |
| 31,200 | Engie SA (Prime Fidelite 2019)(a) | 443,206 |
| 15,151 | Publicis Groupe SA | 923,943 |
| 11,990 | Sanofi | 1,185,621 |
| 3,056 | Schneider Electric SE | 465,536 |
| 18,112 | Total SE | 844,377 |
| 4,609,085 | ||
| Germany – 2.20% | ||
| 9,903 | HeidelbergCement AG | 899,766 |
| Ireland – 1.33% | ||
| 11,612 | CRH Plc | 544,375 |
| Italy – 1.18% | ||
| 39,071 | Eni SpA | 481,441 |
| Japan – 1.26% | ||
| 17,100 | Honda Motor Co. Ltd. | 515,489 |
| Malaysia – 1.56% | ||
| 523,900 | Genting Berhad | 636,018 |
| Mexico – 2.66% | ||
| 603,134 | Fibra Uno Administracion SA de CV | 704,952 |
| 5,080 | Fomento Economico Mexicano SAB de CV – ADR | 382,677 |
| 1,087,629 | ||
| South Korea – 5.82% | ||
| 2,301 | Hyundai Mobis Co. Ltd. | 596,861 |
| 3,619 | Hyundai Motor Co. | 701,389 |
| Shares | Value | |
| 4,813 | KT&G Corp. | $ 346,712 |
| 10,141 | Samsung Electronics Co. Ltd. | 733,647 |
| 2,378,609 | ||
| Spain – 1.31% | ||
| 42,988 | Repsol SA | 533,566 |
| Switzerland – 3.52% | ||
| 49,369 | Credit Suisse Group AG Registered | 522,292 |
| 59,244 | UBS Group AG Registered | 916,593 |
| 1,438,885 | ||
| United Kingdom – 15.30% | ||
| 147,402 | Barclays Plc | 377,485 |
| 204,270 | BP Plc | 829,736 |
| 54,464 | GlaxoSmithKline Plc | 964,167 |
| 38,224 | Imperial Brands Plc | 783,627 |
| 177,095 | J Sainsbury Plc | 592,204 |
| 154,830 | Kingfisher Plc(a) | 678,626 |
| 10,818 | Royal Dutch Shell Plc – ADR – Class B | 398,427 |
| 145,629 | Tesco Plc | 459,784 |
| 145,089 | Wm Morrison Supermarkets Plc | 364,909 |
| 62,874 | WPP Plc | 801,234 |
| 6,250,199 | ||
| United States – 45.18% | ||
| 1,746 | Amdocs Ltd. | 122,482 |
| 13,200 | American International Group, Inc. | 609,972 |
| 30,151 | Bank of America Corp. | 1,166,542 |
| 13,678 | Bank of New York Mellon Corp. | 646,833 |
| 12,049 | Cardinal Health, Inc. | 731,977 |
| 24,036 | Change Healthcare, Inc.(a) | 531,196 |
| 2,910 | Cigna Corp. | 703,463 |
| 17,550 | Citigroup, Inc. | 1,276,762 |
| 12,480 | Comcast Corp. – Class A | 675,293 |
| 11,340 | Corteva, Inc. | 528,671 |
| 8,496 | CVS Health Corp. | 639,154 |
| 5,508 | Emerson Electric Co. | 496,932 |
| 2,127 | FedEx Corp. | 604,153 |
| 2,939 | General Dynamics Corp. | 533,605 |
| 19,290 | Halliburton Co. | 413,963 |
| 3,338 | HCA Healthcare, Inc. | 628,679 |
| 4,558 | Ingredion, Inc. | 409,855 |
| Shares | Value | |
| 3,040 | JPMorgan Chase & Co. | $ 462,779 |
| 2,198 | Laboratory Corp. of America Holdings(a) | 560,556 |
| 4,165 | McKesson Corp. | 812,342 |
| 10,954 | Merck & Co., Inc. | 844,444 |
| 3,846 | Mohawk Industries, Inc.(a) | 739,624 |
| 20,899 | Old Republic International Corp. | 456,434 |
| 8,335 | OneMain Holdings, Inc. | 447,756 |
| 19,831 | Pfizer, Inc. | 718,477 |
| 1,185 | PNC Financial Services Group, Inc. | 207,861 |
| 7,368 | State Street Corp. | 618,986 |
| 9,436 | Textron, Inc. | 529,171 |
| Shares | Value | |
| 7,627 | Truist Financial Corp. | $ 444,807 |
| 22,993 | Wells Fargo & Co. | 898,336 |
| 18,461,105 | ||
| TOTAL COMMON STOCKS (Cost $31,532,279) | $39,950,535 | |
| PREFERRED STOCKS – 0.49% | ||
| South Korea – 0.49% | ||
| 3,072 | Samsung Electronics Co. Ltd., 1.864%(b) | $ 198,968 |
| TOTAL PREFERRED STOCKS (Cost $90,995) | $ 198,968 | |
| Shares | Value | |
| SHORT-TERM INVESTMENTS – 2.54% | ||
| Money Market Funds — 2.54% | ||
Northern Institutional Funds - Treasury Portfolio (Premier), 0.01%(c) | 1,039,632 | $ 1,039,632 |
TOTAL SHORT-TERM INVESTMENTS (Cost $1,039,632) | $ 1,039,632 | |
Total Investments (Cost $32,662,906) – 100.80% | $41,189,135 | |
Liabilities in Excess of Other Assets – (0.80)% | (328,497) | |
TOTAL NET ASSETS – 100.00% | $40,860,638 | |
| Percentages are stated as a percent of net assets. | ||
| ADR American Depositary Receipt | ||
| (a) | Non-income producing security. |
| (b) | Current yield is disclosed. Dividends are calculated based on a percentage of the issuer’s net income. |
| (c) | The rate shown is the annualized seven day yield as of March 31, 2021. |
| COMMON STOCKS | |
Aerospace & Defense | 3.87% |
Air Freight & Logistics | 1.48% |
Auto Components | 1.46% |
Automobiles | 2.98% |
Banks | 13.78% |
Beverages | 0.94% |
Capital Markets | 6.61% |
Chemicals | 1.29% |
Construction Materials | 3.53% |
Consumer Finance | 1.10% |
Electrical Equipment | 2.36% |
Energy Equipment & Services | 1.01% |
Equity Real Estate Investment Trusts | 1.72% |
Food & Staples Retailing | 4.42% |
Food Products | 1.00% |
Health Care Providers & Services | 9.97% |
Health Care Technology | 1.30% |
Hotels, Restaurants & Leisure | 1.56% |
Household Durables | 1.81% |
Insurance | 2.61% |
Internet & Direct Marketing Retail | 1.96% |
IT Services | 0.30% |
Media | 5.87% |
Multi-Utilities | 1.96% |
Oil, Gas & Consumable Fuels | 7.57% |
Pharmaceuticals | 9.09% |
Specialty Retail | 1.66% |
Technology Hardware, Storage & Peripherals | 1.79% |
Tobacco | 2.77% |
TOTAL COMMON STOCKS | 97.77% |
| PREFERRED STOCKS | |
Technology Hardware, Storage & Peripherals | 0.49% |
TOTAL PREFERRED STOCKS | 0.49% |
SHORT-TERM INVESTMENTS | 2.54% |
TOTAL INVESTMENTS | 100.80% |
Liabilities in Excess of Other Assets | (0.80)% |
TOTAL NET ASSETS | 100.00% |
| Shares | Value | |
| COMMON STOCKS – 95.50% | ||
| Argentina – 1.44% | ||
| 1,176,931 | Adecoagro SA(a) | $ 9,250,677 |
| 2,415,979 | YPF SA Sponsored – ADR(a) | 9,929,674 |
| 19,180,351 | ||
| Brazil – 6.45% | ||
| 6,258,400 | Cogna Educacao(a) | 4,425,294 |
| 3,339,780 | Embraer SA Sponsored – ADR(a) | 33,431,198 |
| 1,548,600 | Sendas Distribuidora SA(a) | 20,315,462 |
| 1,125,300 | Telefonica Brasil SA | 8,842,621 |
| 630,648 | Telefonica Brasil SA – ADR | 4,963,200 |
| 6,051,000 | TIM SA(a) | 13,620,703 |
| 85,598,478 | ||
| Chile – 2.15% | ||
| 2,336,679 | Empresa Nacional de Telecomunicaciones SA | 14,669,753 |
| 102,629,673 | Enel Chile SA | 7,988,884 |
| 1,509,388 | Enel Chile SA Sponsored – ADR | 5,916,801 |
| 28,575,438 | ||
| China – 21.55% | ||
| 2,320,000 | Alibaba Group Holding Ltd.(a) | 65,917,292 |
| 10,745,000 | China Education Group Holdings Ltd. | 19,170,956 |
| 25,636,136 | China Railway Signal & Communication Corp. Ltd. – Class H(b) | 10,527,172 |
| 5,259,728 | China South Publishing & Media Group Co. Ltd. – Class A | 8,419,324 |
| 2,074,000 | Galaxy Entertainment Group Ltd.(a) | 18,749,659 |
| Shares | Value | |
| 21,333,500 | Genertec Universal Medical Group Co. Ltd.(b) | $ 17,530,769 |
| 2,128,614 | Gree Electric Appliances, Inc. of Zhuhai – Class A | 20,392,603 |
| 33,944,000 | PetroChina Co. Ltd. – Class H | 12,306,744 |
| 2,035,500 | Ping An Insurance Group Co. of China Ltd. – Class H | 24,347,341 |
| 11,240,200 | Shanghai Pharmaceuticals Holding Co. Ltd. – Class H | 22,093,355 |
| 10,868,000 | TravelSky Technology Ltd. – Class H | 25,496,246 |
| 10,355,400 | Wynn Macau Ltd.(a) | 20,146,717 |
| 724,569 | ZTO Express Cayman, Inc. – ADR | 21,121,186 |
| 286,219,364 | ||
| Czech Republic – 0.46% | ||
| 521,469 | O2 Czech Republic AS | 6,068,402 |
| Greece – 0.54% | ||
| 444,037 | Hellenic Telecommunications Organization SA | 7,124,716 |
| Hong Kong – 4.24% | ||
| 1,754,400 | AIA Group Ltd. | 21,468,190 |
| 28,461,920 | First Pacific Co. Ltd. | 9,410,127 |
| 10,597,500 | Lifestyle International Holdings Ltd.(a) | 9,258,256 |
| 5,860,000 | Luk Fook Holdings International Ltd. | 16,163,110 |
| 56,299,683 | ||
| India – 6.49% | ||
| 1,087,855 | HDFC Bank Ltd.(a) | 22,268,112 |
| 4,433,431 | Indus Towers Ltd. | 14,905,659 |
| Shares | Value | |
| 7,535,312 | Power Grid Corp. of India Ltd. | $ 22,269,465 |
| 9,582,906 | Zee Entertainment Enterprises Ltd. | 26,752,801 |
| 86,196,037 | ||
| Indonesia – 4.54% | ||
| 61,066,800 | Bank Rakyat Indonesia Persero Tbk PT(a) | 18,526,709 |
| 6,759,412 | Gudang Garam Tbk PT(a) | 16,855,630 |
| 23,202,900 | Indofood Sukses Makmur Tbk PT | 10,568,231 |
| 99,025,715 | XL Axiata Tbk PT | 14,286,836 |
| 60,237,406 | ||
| Malaysia – 1.92% | ||
| 21,002,200 | Genting Berhad | 25,496,790 |
| Mexico – 9.71% | ||
| 31,044,840 | America Movil SAB de CV | 21,203,355 |
| 4,321,770 | Cemex SAB de CV Sponsored – ADR(a) | 30,122,737 |
| 30,944,403 | Fibra Uno Administracion SA de CV | 36,168,291 |
| 191,371 | Fomento Economico Mexicano SAB de CV – ADR | 14,415,978 |
| 4,099,700 | Macquarie Mexico Real Estate Management SA de CV(b) | 5,112,716 |
| 14,553,184 | PLA Administradora Industrial S de RL de CV | 21,687,907 |
| 512,122 | Urbi Desarrollos Urbanos SAB de CV(a) | 205,455 |
| 128,916,439 | ||
| Shares | Value | |
| Panama – 2.07% | ||
| 644,836 | Banco Latinoamericano de Comercio Exterior SA – Class E | $ 9,756,369 |
| 219,291 | Copa Holdings SA – Class A(a) | 17,716,520 |
| 27,472,889 | ||
| Philippines – 1.44% | ||
| 11,369,764 | Bank of the Philippine Islands | 19,125,516 |
| Russia – 6.09% | ||
| 175,358 | Lukoil PJSC Sponsored – ADR | 14,209,767 |
| 4,751,561 | Mobile TeleSystems PJSC | 19,864,680 |
| 8,476,466 | Sberbank of Russia PJSC | 32,540,392 |
| 1,571,174 | Sistema PJSFC Sponsored – GDR | 14,203,103 |
| 80,817,942 | ||
| South Africa – 1.13% | ||
| 1,760,684 | Absa Group Ltd. | 15,041,007 |
| South Korea – 11.47% | ||
| 468,867 | KT&G Corp. | 33,775,605 |
| 158,079 | POSCO | 44,792,670 |
| 115,629 | S-1 Corp. | 8,347,152 |
| 610,691 | Samsung Electronics Co. Ltd. | 44,180,210 |
| 636,890 | Shinhan Financial Group Co. Ltd. | 21,152,412 |
| 152,248,049 | ||
| Spain – 0.79% | ||
| 11,548,879 | Prosegur Cash SA(b) | 10,544,879 |
| Taiwan – 8.05% | ||
| 256,000 | Largan Precision Co. Ltd. | 28,953,753 |
| 2,263,000 | Taiwan Semiconductor Manufacturng Co. Ltd. | 47,656,996 |
| 1,022,000 | Wiwynn Corp. | 30,297,112 |
| 106,907,861 | ||
| Shares | Value | |
| Thailand – 3.93% | ||
| 1,578,500 | Bangkok Bank PCL – Class F | $ 6,375,479 |
| 1,578,500 | Bangkok Bank PCL – NVDR | 6,381,591 |
| 88,047,881 | Jasmine Broadband Internet Infrastructure Fund – Class F | 27,060,343 |
| 3,474,400 | Siam Commercial Bank PCL – Class F | 12,412,000 |
| 52,229,413 | ||
| United Kingdom – 1.04% | ||
| 10,376,419 | Vivo Energy Plc(b) | 13,875,785 |
| TOTAL COMMON STOCKS (Cost $1,345,553,466) | $1,268,176,445 | |
| PREFERRED STOCKS – 3.02% | ||
| Brazil – 1.59% | ||
| 4,920,700 | Petroleo Brasileiro SA, 3.276%(c) | $ 21,068,794 |
| Shares | Value | |
| Russia – 1.43% | ||
| 205,610 | Surgutneftegas PJSC Sponsored – ADR, 2.398%(c) | $ 1,143,500 |
| 32,081,832 | Surgutneftegas PJSC, 2.310%(c) | 17,820,883 |
| 18,964,383 | ||
| TOTAL PREFERRED STOCKS (Cost $41,816,635) | $ 40,033,177 | |
| PARTICIPATORY NOTES – 0.39% | ||
| China – 0.39% | ||
| 3,247,557 | China South Publishing & Media Group Co. Ltd.(d) | $ 5,189,166 |
| TOTAL PARTICIPATORY NOTES (Cost $5,613,680) | $ 5,189,166 | |
| Shares | Value | |
| SHORT-TERM INVESTMENTS – 0.91% | ||
| Money Market Funds — 0.91% | ||
Northern Institutional Funds - Treasury Portfolio (Premier), 0.01%(e) | 12,063,445 | $ 12,063,445 |
TOTAL SHORT-TERM INVESTMENTS (Cost $12,063,445) | $ 12,063,445 | |
Total Investments (Cost $1,405,047,226) – 99.82% | $1,325,462,233 | |
Other Assets in Excess of Liabilities – 0.18% | 2,441,811 | |
TOTAL NET ASSETS – 100.00% | $1,327,904,044 | |
| Percentages are stated as a percent of net assets. | ||
| ADR American Depositary Receipt | ||
| GDR Global Depositary Receipt | ||
| NVDR Non-Voting Depositary Receipt | ||
| (a) | Non-income producing security. |
| (b) | Acquired in a transaction exempt from registration under Rule 144A or Section 4(a)(2) of the Securities Act of 1933. May be resold in the U.S. in transactions exempt from registration, normally to qualified institutional buyers. The total value of all such securities was $57,591,321 which represented 4.34% of the net assets of the Fund. |
| (c) | Current yield is disclosed. Dividends are calculated based on a percentage of the issuer’s net income. |
| (d) | Represents the underlying security of a participatory note with HSBC Bank Plc. China South Publishing & Media Group Co. Ltd. has a maturity date of November 23, 2021. |
| (e) | The rate shown is the annualized seven day yield as of March 31, 2021. |
| COMMON STOCKS | |
Aerospace & Defense | 2.52% |
Air Freight & Logistics | 1.59% |
Airlines | 1.33% |
Banks | 11.57% |
Beverages | 1.09% |
Commercial Services & Supplies | 1.42% |
Construction Materials | 2.27% |
Diversified Consumer Services | 1.77% |
Diversified Financial Services | 1.45% |
Diversified Telecommunication Services | 3.16% |
Electric Utilities | 2.73% |
Electronic Equipment, Instruments & Components | 2.97% |
Equity Real Estate Investment Trusts | 4.73% |
Food & Staples Retailing | 1.53% |
Food Products | 1.49% |
Health Care Providers & Services | 2.98% |
Hotels, Restaurants & Leisure | 4.85% |
Household Durables | 1.56% |
Insurance | 3.44% |
Internet & Direct Marketing Retail | 4.96% |
IT Services | 1.92% |
Media | 2.65% |
Metals & Mining | 3.37% |
Multiline Retail | 0.70% |
Oil, Gas & Consumable Fuels | 2.75% |
Semiconductors & Semiconductor Equipment | 3.59% |
Specialty Retail | 2.26% |
Technology Hardware, Storage & Peripherals | 5.61% |
Tobacco | 3.82% |
Wireless Telecommunication Services | 9.42% |
TOTAL COMMON STOCKS | 95.50% |
| PREFERRED STOCKS | |
Oil, Gas & Consumable Fuels | 3.02% |
TOTAL PREFERRED STOCKS | 3.02% |
| PARTICIPATORY NOTES | |
Media | 0.39% |
TOTAL PARTICIPATORY NOTES | 0.39% |
SHORT-TERM INVESTMENTS | 0.91% |
TOTAL INVESTMENTS | 99.82% |
Other Assets in Excess of Liabilities | 0.18% |
TOTAL NET ASSETS | 100.00% |
| Shares | Value | |
| COMMON STOCKS – 96.75% | ||
| Austria – 0.93% | ||
| 243,798 | Addiko Bank AG(a) | $ 3,630,954 |
| Brazil – 4.32% | ||
| 6,739,240 | Embraer SA(a) | 16,774,316 |
| Canada – 6.83% | ||
| 438,723 | Cameco Corp. | 7,287,189 |
| 265,929 | Corby Spirit and Wine Ltd. | 3,717,970 |
| 533,960 | Dorel Industries, Inc. – Class B(a) | 5,391,862 |
| 5,781 | E-L Financial Corp. Ltd. | 4,255,132 |
| 395,438 | Sierra Wireless, Inc.(a) | 5,840,619 |
| 26,492,772 | ||
| China – 1.85% | ||
| 12,512,900 | Boyaa Interactive International Ltd.(a) | 917,451 |
| 241,205 | China Yuchai International Ltd. | 3,733,853 |
| 9,469,000 | Weiqiao Textile Co. – Class H | 2,521,299 |
| 7,172,603 | ||
| France – 6.31% | ||
| 636,642 | Elior Group SA(b) | 4,717,821 |
| 72,977 | Savencia SA(a) | 6,230,233 |
| 148,323 | Societe BIC SA | 8,682,074 |
| 99,979 | Vicat SA | 4,851,883 |
| 24,482,011 | ||
| Germany – 1.01% | ||
| 51,795 | Draegerwerk AG & Co. KGaA | 3,928,052 |
| Greece – 0.62% | ||
| 236,992 | Sarantis SA | 2,406,792 |
| Hong Kong – 5.06% | ||
| 4,180,050 | APT Satellite Holdings Ltd. | 1,272,131 |
| 2,059,500 | Dickson Concepts International Ltd. | 1,099,939 |
| 70,600,000 | Emperor Watch & Jewellery Ltd.(a) | 1,282,501 |
| Shares | Value | |
| 20,663,000 | First Pacific Co. Ltd. | $ 6,831,635 |
| 8,440,000 | PAX Global Technology Ltd. | 9,134,925 |
| 19,621,131 | ||
| Hungary – 2.18% | ||
| 6,434,230 | Magyar Telekom Telecommunications Plc | 8,475,851 |
| Ireland – 6.56% | ||
| 3,839,514 | AIB Group Plc(a) | 10,072,857 |
| 517,024 | Avadel Pharmaceuticals Plc – ADR(a) | 4,673,897 |
| 2,772,645 | C&C Group Plc(a) | 10,716,501 |
| 25,463,255 | ||
| Israel – 0.93% | ||
| 48,896 | Taro Pharmaceutical Industries Ltd.(a) | 3,606,080 |
| Italy – 4.11% | ||
| 160,158 | Buzzi Unicem SpA | 4,160,105 |
| 722,111 | Credito Emiliano SpA(a) | 4,214,873 |
| 357,331 | Danieli & C Officine Meccaniche SpA | 5,472,689 |
| 1,985,069 | Safilo Group SpA(a) | 2,119,544 |
| 15,967,211 | ||
| Japan – 16.03% | ||
| 1,211,500 | Concordia Financial Group Ltd. | 4,913,930 |
| 384,800 | Fuji Media Holdings, Inc. | 4,717,388 |
| 160,500 | Futaba Corp. | 1,412,809 |
| 1,579,800 | Hachijuni Bank Ltd. | 5,752,700 |
| 1,252,200 | Hyakugo Bank Ltd. | 3,778,296 |
| 295,600 | Japan Petroleum Exploration Co. Ltd. | 5,495,932 |
| 271,800 | Kissei Pharmaceutical Co. Ltd. | 6,025,622 |
| 1,144,744 | Komori Corp. | 7,765,989 |
| 529,200 | Kyushu Financial Group, Inc. | 2,272,059 |
| 166,400 | Mitsubishi Shokuhin Co. Ltd. | 4,659,856 |
| 147,400 | Nichiban Co. Ltd. | 2,550,190 |
| Shares | Value | |
| 88,800 | Nippon Seiki Co. Ltd. | $ 1,032,538 |
| 85,700 | Oita Bank Ltd. | 1,669,762 |
| 106,600 | Sankyo Co. Ltd. | 2,827,016 |
| 247,800 | Tachi-S Co. Ltd. | 2,692,399 |
| 290,000 | TSI Holdings Co. Ltd.(a) | 842,526 |
| 170,600 | Yodogawa Steel Works Ltd. | 3,786,760 |
| 62,195,772 | ||
| Malaysia – 1.22% | ||
| 3,902,000 | Genting Berhad | 4,737,050 |
| Mexico – 6.75% | ||
| 475,905 | Cemex SAB de CV Sponsored – ADR(a) | 3,317,058 |
| 27,839,278 | Consorcio ARA SAB de CV(a) | 6,115,529 |
| 279,501,983 | Desarrolladora Homex SAB de CV(a),(c) | 423,913 |
| 10,894,848 | Fibra Uno Administracion SA de CV | 12,734,065 |
| 2,642,515 | Macquarie Mexico Real Estate Management SA de CV(b) | 3,295,467 |
| 806,929 | Urbi Desarrollos Urbanos SAB de CV(a),(c) | 323,727 |
| 26,209,759 | ||
| Panama – 1.49% | ||
| 382,470 | Banco Latinoamericano de Comercio Exterior SA – Class E | 5,786,771 |
| Philippines – 0.59% | ||
| 1,581,332 | First Philippines Holdings Corp. | 2,274,056 |
| Slovenia – 1.61% | ||
| 474,148 | Nova Ljubljanska Banka – GDR(a),(b) | 5,838,350 |
| 33,305 | Nova Ljubljanska Banka dd Registered – GDR(a) | 410,096 |
| 6,248,446 | ||
| Shares | Value | |
| South Korea – 5.38% | ||
| 95,834 | Binggrae Co. Ltd. | $ 5,076,584 |
| 43,488 | Lotte Chilsung Beverage Co. Ltd. | 5,255,993 |
| 35,424 | Lotte Confectionery Co. Ltd. | 4,170,050 |
| 10,751 | Namyang Dairy Products Co. Ltd. | 2,878,967 |
| 50,208 | Samchully Co. Ltd. | 3,483,962 |
| 20,865,556 | ||
| Spain – 5.47% | ||
| 1,402,369 | Atresmedia Corp de Medios de Comunicacion SA(a) | 5,785,321 |
| 716,097 | Bankinter SA | 4,983,337 |
| 1,234,863 | CaixaBank SA | 3,833,987 |
| 1,106,026 | Lar Espana Real Estate Socimi SA | 6,614,887 |
| 21,217,532 | ||
| United Kingdom – 17.50% | ||
| 1,455,270 | Balfour Beatty Plc(a) | 5,921,890 |
| 2,501,936 | De La Rue Plc(a) | 7,126,041 |
| 3,567,587 | J Sainsbury Plc | 11,929,974 |
| 1,275,544 | LSL Property Services Plc(a) | 5,363,319 |
| 2,305,844 | Marks & Spencer Group Plc(a) | 4,792,878 |
| 14,349,096 | Mitie Group Plc(a) | 12,442,668 |
| 2,963,874 | Premier Foods Plc(a) | 3,889,869 |
| 4,728,021 | Wm Morrison Supermarkets Plc | 11,891,310 |
| 1,214,542 | Yellow Cake Plc(a),(b) | 4,562,525 |
| 67,920,474 | ||
| TOTAL COMMON STOCKS (Cost $364,332,304) | $375,476,444 | |
| PREFERRED STOCKS – 1.58% | ||
| Germany – 1.58% | ||
| 76,013 | Draegerwerk AG & Co. KGaA, 0.28%(d) | $ 6,115,035 |
| TOTAL PREFERRED STOCKS (Cost $4,889,447) | $ 6,115,035 | |
| Shares | Value | |
| SHORT-TERM INVESTMENTS – 2.05% | ||
| Money Market Funds — 2.05% | ||
Northern Institutional Funds - Treasury Portfolio (Premier), 0.01%(e) | 7,968,459 | $ 7,968,459 |
TOTAL SHORT-TERM INVESTMENTS (Cost $7,968,459) | $ 7,968,459 | |
Total Investments (Cost $377,190,210) – 100.38% | $389,559,938 | |
Liabilities in Excess of Other Assets – (0.38)% | (1,468,765) | |
TOTAL NET ASSETS – 100.00% | $388,091,173 | |
| Percentages are stated as a percent of net assets. | ||
| ADR American Depositary Receipt | ||
| GDR Global Depositary Receipt | ||
| (a) | Non-income producing security. |
| (b) | Acquired in a transaction exempt from registration under Rule 144A or Section 4(a)(2) of the Securities Act of 1933. May be resold in the U.S. in transactions exempt from registration, normally to qualified institutional buyers. The total value of all such securities was $18,414,163 which represented 4.75% of the net assets of the Fund. |
| (c) | Affiliated issuer. See Note 3 in the Notes to Financial Statements. |
| (d) | Current yield is disclosed. Dividends are calculated based on a percentage of the issuer’s net income. |
| (e) | The rate shown is the annualized seven day yield as of March 31, 2021. |
| COMMON STOCKS | |
Aerospace & Defense | 4.32% |
Auto Components | 0.96% |
Banks | 13.22% |
Beverages | 5.07% |
Commercial Services & Supplies | 7.95% |
Communications Equipment | 1.50% |
Construction & Engineering | 1.53% |
Construction Materials | 3.17% |
Diversified Financial Services | 3.25% |
Diversified Telecommunication Services | 2.51% |
Electric Utilities | 0.59% |
Electrical Equipment | 0.36% |
Electronic Equipment, Instruments & Components | 2.36% |
Entertainment | 0.24% |
Equity Real Estate Investment Trusts | 5.84% |
Food & Staples Retailing | 7.33% |
Food Products | 5.73% |
Gas Utilities | 0.90% |
Health Care Equipment & Supplies | 1.01% |
Hotels, Restaurants & Leisure | 2.44% |
Household Durables | 3.16% |
Insurance | 1.10% |
Leisure Products | 0.73% |
Machinery | 4.37% |
Media | 2.71% |
Metals & Mining | 0.98% |
Multiline Retail | 1.23% |
Oil, Gas & Consumable Fuels | 3.30% |
Personal Products | 0.62% |
Pharmaceuticals | 3.68% |
Real Estate Management & Development | 1.38% |
Specialty Retail | 0.61% |
Textiles, Apparel & Luxury Goods | 1.42% |
Trading Companies & Distributors | 1.18% |
TOTAL COMMON STOCKS | 96.75% |
| PREFERRED STOCKS | |
Health Care Equipment & Supplies | 1.58% |
TOTAL PREFERRED STOCKS | 1.58% |
SHORT-TERM INVESTMENTS | 2.05% |
TOTAL INVESTMENTS | 100.38% |
Liabilities in Excess of Other Assets | (0.38)% |
TOTAL NET ASSETS | 100.00% |
| Shares | Value | |
| COMMON STOCKS – 87.23% | ||
| Aerospace & Defense – 9.26% | ||
| 6,121 | Embraer SA Sponsored – ADR(a) | $ 61,271 |
| 555 | National Presto Industries, Inc. | 56,649 |
| 4,945 | Park Aerospace Corp. | 65,373 |
| 481 | Textron, Inc. | 26,974 |
| 210,267 | ||
| Automobiles – 0.49% | ||
| 277 | Harley-Davidson, Inc. | 11,108 |
| Banks – 2.64% | ||
| 551 | ACNB Corp. | 16,144 |
| 445 | Eagle Bancorp Montana, Inc. | 10,823 |
| 931 | National Bankshares, Inc. | 33,060 |
| 60,027 | ||
| Biotechnology – 6.23% | ||
| 1,625 | Eagle Pharmaceuticals, Inc.(a) | 67,827 |
| 11,508 | PDL BioPharma, Inc.(a),(b) | 28,425 |
| 270 | United Therapeutics Corp.(a) | 45,163 |
| 141,415 | ||
| Communications Equipment – 5.19% | ||
| 1,754 | NETGEAR, Inc.(a) | 72,089 |
| 3,101 | Sierra Wireless, Inc.(a) | 45,802 |
| 117,891 | ||
| Construction & Engineering – 2.06% | ||
| 7,693 | Orion Group Holdings, Inc.(a) | 46,697 |
| Electric Utilities – 1.14% | ||
| 385 | ALLETE, Inc. | 25,868 |
| Electronic Equipment, Instruments & Components – 2.52% | ||
| 1,817 | Arlo Technologies, Inc.(a) | 11,411 |
| 1,105 | Avnet, Inc. | 45,868 |
| 57,279 | ||
| Energy Equipment & Services – 4.67% | ||
| 1,373 | Dril-Quip, Inc.(a) | 45,625 |
| 755 | Halliburton Co. | 16,202 |
| 1,638 | Helmerich & Payne, Inc. | 44,161 |
| 105,988 | ||
| Shares | Value | |
| Equity Real Estate Investment Trusts – 2.90% | ||
| 2,369 | Equity Commonwealth | $ 65,858 |
| Food & Staples Retailing – 1.40% | ||
| 516 | Ingles Markets, Inc. – Class A | 31,811 |
| Food Products – 1.84% | ||
| 556 | Cal-Maine Foods, Inc.(a) | 21,362 |
| 131 | Sanderson Farms, Inc. | 20,407 |
| 41,769 | ||
| Health Care Equipment & Supplies – 3.95% | ||
| 1,295 | Invacare Corp. | 10,386 |
| 1,477 | LENSAR, Inc.(a) | 10,723 |
| 531 | Utah Medical Products, Inc. | 45,984 |
| 1,102 | Varex Imaging Corp.(a) | 22,580 |
| 89,673 | ||
| Health Care Providers & Services – 2.82% | ||
| 1,354 | MEDNAX, Inc.(a) | 34,486 |
| 1,130 | Triple–S Management Corp. – Class B(a) | 29,414 |
| 63,900 | ||
| Health Care Technology – 0.54% | ||
| 550 | Change Healthcare, Inc.(a) | 12,155 |
| Household Durables – 2.38% | ||
| 2,419 | Dorel Industries, Inc. – Class B(a) | 24,427 |
| 962 | Taylor Morrison Home Corp.(a) | 29,639 |
| 54,066 | ||
| Insurance – 8.62% | ||
| 562 | American National Group, Inc. | 60,623 |
| 3,671 | Crawford & Co. – Class A | 39,096 |
| 215 | National Western Life Group, Inc. – Class A | 53,535 |
| 1,938 | Old Republic International Corp. | 42,326 |
| 195,580 | ||
| Machinery – 5.45% | ||
| 3,996 | Graham Corp. | 56,903 |
| 1,029 | Hurco Companies, Inc. | 36,323 |
| 1,703 | L.B. Foster Co. – Class A(a) | 30,484 |
| 123,710 | ||
| Shares | Value | |
| Media – 1.20% | ||
| 904 | Scholastic Corp. | $ 27,219 |
| Multi-Utilities – 1.01% | ||
| 482 | Avista Corp. | 23,016 |
| Oil, Gas & Consumable Fuels – 4.72% | ||
| 1,433 | Chesapeake Energy Corp.(a) | 62,178 |
| 1,274 | World Fuel Services Corp. | 44,845 |
| 107,023 | ||
| Personal Products – 4.28% | ||
| 2,452 | Edgewell Personal Care Co. | 97,099 |
| Pharmaceuticals – 6.06% | ||
| 3,020 | Avadel Pharmaceuticals Plc – ADR(a) | 27,301 |
| 2,095 | Phibro Animal Health Corp. – Class A | 51,118 |
| 1,344 | Prestige Consumer Healthcare, Inc.(a) | 59,243 |
| 137,662 | ||
| Professional Services – 2.95% | ||
| 993 | Kelly Services, Inc. – Class A(a) | 22,114 |
| 3,312 | Resources Connection, Inc. | 44,845 |
| 66,959 | ||
| Shares | Value | |
| Textiles, Apparel & Luxury Goods – 1.19% | ||
| 950 | Movado Group, Inc. | $ 27,028 |
| Thrifts & Mortgage Finance – 0.93% | ||
| 799 | Territorial Bancorp, Inc. | 21,142 |
| Trading Companies & Distributors – 0.79% | ||
| 3,414 | Houston Wire & Cable Co.(a) | 17,821 |
| TOTAL COMMON STOCKS (Cost $1,725,518) | $1,980,031 | |
| WARRANTS – 1.15% | ||
| Oil, Gas & Consumable Fuels – 1.15% | ||
| 615 | Chesapeake Energy Corp., Exp. 2/9/2026, Strike $27.63(a) | $ 12,681 |
| 683 | Chesapeake Energy Corp., Exp. 2/9/2026, Strike $32.13(a) | 13,483 |
| 26,164 | ||
| TOTAL WARRANTS (Cost $12,994) | $ 26,164 | |
| Principal Amount | Value | |
| CORPORATE BONDS – 1.18% | ||
| Food & Staples Retailing – 0.58% | ||
Ingles Markets, Inc. 5.750%, 6/15/2023 | $ 13,000 | $ 13,097 |
| Multi-Utilities – 0.60% | ||
Avista Corp. 5.125%, 4/1/2022 | 13,000 | 13,595 |
TOTAL CORPORATE BONDS (Cost $26,820) | $ 26,692 | |
| Shares | Value | |
| SHORT-TERM INVESTMENTS – 11.16% | ||
Northern Institutional Funds - Treasury Portfolio (Premier), 0.010%, (c) | 253,314 | $ 253,314 |
TOTAL SHORT-TERM INVESTMENTS (Cost $253,314) | $ 253,314 | |
Total Investments (Cost $2,018,646) – 100.72% | $ 2,286,201 | |
Liabilities in Excess of Other Assets – (0.72)% | (16,339) | |
TOTAL NET ASSETS – 100.00% | $ 2,269,862 | |
| Percentages are stated as a percent of net assets. | ||
| ADR American Depositary Receipt | ||
| (a) | Non-income producing security. |
| (b) | The price for this security was derived from an estimate of fair market value using methods approved by the Fund’s Board of Trustees. This security represents $28,425 or 1.25% of the Fund’s net assets and is classified as a Level 3 security. See Note 2 in the Notes to Financial Statements. |
| (c) | The rate shown is the annualized seven day yield as of March 31, 2021. |
| COMMON STOCKS | |
Brazil | 2.70% |
Canada | 3.10% |
Ireland | 1.20% |
United States | 80.23% |
TOTAL COMMON STOCKS | 87.23% |
| CORPORATE BONDS | |
United States | 1.18% |
TOTAL CORPORATE BONDS | 1.18% |
| WARRANTS | |
United States | 1.15% |
TOTAL WARRANTS | 1.15% |
SHORT-TERM INVESTMENTS | 11.16% |
TOTAL INVESTMENTS | 100.72% |
Liabilities in Excess of Other Assets | (0.72)% |
TOTAL NET ASSETS | 100.00% |
| Shares | Value | |
| COMMON STOCKS – 0.00% | ||
| Household Durables – 0.00% | ||
Urbi Desarrollos Urbanos SAB de CV (a) | 1,564 | $ 627 |
TOTAL COMMON STOCKS (Cost $292,050) | $ 627 | |
| Principal Amount | Value | |
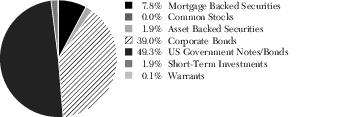
| FEDERAL AND FEDERALLY SPONSORED CREDITS – 7.79% | ||
| Federal Home Loan Mortgage Corporation – 2.58% | ||
Pool A9-3505 4.500%, 8/1/2040 | 64,970 | $ 72,903 |
Pool G0-6018 6.500%, 4/1/2039 | 18,031 | 20,809 |
Pool G1-8578 3.000%, 12/1/2030 | 884,333 | 935,478 |
Pool SD-8001 3.500%, 7/1/2049 | 395,544 | 417,263 |
Pool SD-8003 4.000%, 7/1/2049 | 470,640 | 504,678 |
| 1,951,131 | ||
| Federal National Mortgage Association – 5.21% | ||
Pool 934124 5.500%, 7/1/2038 | 38,505 | 44,908 |
Pool AL9865 3.000%, 2/1/2047 | 1,032,811 | 1,084,484 |
Pool AS6201 3.500%, 11/1/2045 | 398,220 | 427,533 |
Pool BJ2553 3.500%, 12/1/2047 | 332,507 | 352,949 |
Pool BN6683 3.500%, 6/1/2049 | 738,589 | 779,636 |
Pool CA1624 3.000%, 4/1/2033 | 663,713 | 705,725 |
Pool MA0918 4.000%, 12/1/2041 | 152,719 | 169,069 |
Pool MA3687 4.000%, 6/1/2049 | 343,798 | 368,616 |
| 3,932,920 | ||
TOTAL FEDERAL AND FEDERALLY SPONSORED CREDITS (Cost $5,573,174) | $ 5,884,051 | |
| OTHER MORTGAGE RELATED SECURITIES – 0.00% | ||
| Collateralized Mortgage Obligations – 0.00% | ||
Wells Fargo Mortgage Backed Securities Trust Series 2006-AR14 3.080%, 10/25/2036(b) | 606 | $ 580 |
TOTAL OTHER MORTGAGE RELATED SECURITIES (Cost $597) | $ 580 | |
| US GOVERNMENTS – 49.43% | ||
| Sovereign – 49.43% | ||
United States Treasury Note | ||
2.375%, 8/15/2024 | 6,360,000 | $ 6,766,941 |
2.250%, 2/15/2027 | 10,075,000 | 10,695,636 |
2.375%, 5/15/2029 | 9,900,000 | 10,512,562 |
United States Treasury Bond | ||
4.750%, 2/15/2037 | 5,775,000 | 7,886,484 |
3.500%, 2/15/2039 | 1,250,000 | 1,495,752 |
| Principal Amount | Value | |
TOTAL US GOVERNMENTS (Cost $36,157,313) | $ 37,357,375 | |
| CORPORATE BONDS – 39.02% | ||
| Automobiles – 1.52% | ||
Ford Motor Credit Co. LLC | ||
5.875%, 8/2/2021 | 410,000 | $ 415,515 |
3.350%, 11/1/2022 | 370,000 | 377,474 |
3.375%, 11/13/2025 | 350,000 | 355,950 |
| 1,148,939 | ||
| Banks – 6.98% | ||
Fifth Third Bancorp 8.250%, 3/1/2038 | 175,000 | 281,981 |
Goldman Sachs Group, Inc. 3.000%, 4/26/2022 | 780,000 | 781,220 |
JPMorgan Chase & Co. 3.682% (3M LIBOR + 3.470%), Perpetual(c) | 1,317,000 | 1,314,695 |
USB Capital IX 3.500% (3M LIBOR + 1.020%, minimum of 3.500%), Perpetual(c) | 1,830,000 | 1,756,800 |
Wells Fargo & Co. 2.100%, 7/26/2021 | 1,130,000 | 1,136,447 |
| 5,271,143 | ||
| Commercial Services & Supplies – 3.15% | ||
Iron Mountain, Inc. 4.875%, 9/15/2027(d) | 645,000 | 659,915 |
Prime Security Services Borrower LLC | ||
5.750%, 4/15/2026(d) | 715,000 | 771,646 |
6.250%, 1/15/2028(d) | 915,000 | 952,506 |
| 2,384,067 | ||
| Consumer Products – 3.23% | ||
Avon Products, Inc. 6.500%, 3/15/2023 | 1,625,000 | 1,730,625 |
Travel + Leisure Co. 3.900%, 3/1/2023 | 690,000 | 711,425 |
| 2,442,050 | ||
| Containers & Packaging – 0.58% | ||
Sealed Air Corp. 4.000%, 12/1/2027(d) | 430,000 | 440,213 |
| Electric Utilities – 0.73% | ||
Commonwealth Edison Co. 5.900%, 3/15/2036 | 175,000 | 232,719 |
| Principal Amount | Value | |
FirstEnergy Corp. 7.375%, 11/15/2031 | 240,000 | $ 320,930 |
| 553,649 | ||
| Equipment – 0.03% | ||
Continental Airlines Pass Through Trust Series 2007-1 5.983%, 4/19/2022 | 20,751 | 21,181 |
| Food, Beverage & Tobacco – 2.25% | ||
Pilgrim's Pride Corp. | ||
5.750%, 3/15/2025(d) | 835,000 | 852,201 |
5.875%, 9/30/2027(d) | 210,000 | 225,057 |
4.250%, 4/15/2031(d) | 625,000 | 622,644 |
| 1,699,902 | ||
| Health Care Facilities & Services – 1.78% | ||
Tenet Healthcare Corp. | ||
5.125%, 5/1/2025 | 270,000 | 273,793 |
4.875%, 1/1/2026(d) | 1,030,000 | 1,070,541 |
| 1,344,334 | ||
| Homebuilders – 2.61% | ||
PulteGroup, Inc. 5.500%, 3/1/2026 | 980,000 | 1,143,439 |
Toll Brothers Finance Corp. 4.875%, 11/15/2025 | 745,000 | 829,744 |
| 1,973,183 | ||
| Media – 0.93% | ||
Charter Communications Operating LLC 4.908%, 7/23/2025 | 295,000 | 334,577 |
Netflix, Inc. 4.375%, 11/15/2026 | 330,000 | 368,692 |
| 703,269 | ||
| Oil, Gas & Consumable Fuels – 9.20% | ||
BP Capital Markets Plc 3.506%, 3/17/2025 | 810,000 | 882,761 |
Chevron Corp. 2.100%, 5/16/2021 | 1,150,000 | 1,151,427 |
Continental Resources, Inc. | ||
4.500%, 4/15/2023 | 355,000 | 367,673 |
4.375%, 1/15/2028 | 215,000 | 227,051 |
Exxon Mobil Corp. 2.397%, 3/6/2022 | 945,000 | 960,413 |
Kinder Morgan, Inc. 4.300%, 6/1/2025 | 1,054,000 | 1,176,606 |
| Principal Amount | Value | |
Occidental Petroleum Corp. | ||
1.644% (3M LIBOR + 1.450%), 8/15/2022(c) | 365,000 | $ 361,150 |
3.500%, 6/15/2025 | 555,000 | 549,450 |
Range Resources Corp. 5.000%, 3/15/2023 | 1,256,000 | 1,276,410 |
| 6,952,941 | ||
| Technology – 3.10% | ||
Microsoft Corp. 2.400%, 2/6/2022 | 1,000,000 | 1,016,470 |
VMware, Inc. | ||
4.500%, 5/15/2025 | 215,000 | 239,712 |
3.900%, 8/21/2027 | 995,000 | 1,085,782 |
| 2,341,964 | ||
| Telecommunications – 2.93% | ||
AT&T, Inc. 3.000%, 6/30/2022 | 1,630,000 | 1,675,310 |
Telecom Italia Capital SA 6.375%, 11/15/2033 | 185,000 | 219,225 |
T-Mobile USA, Inc. 4.750%, 2/1/2028 | 300,000 | 320,595 |
| 2,215,130 | ||
TOTAL CORPORATE BONDS (Cost $27,975,898) | $ 29,491,965 | |
| ASSET BACKED SECURITIES – 1.89% | ||
| Student Loan – 1.89% | ||
SLM Private Credit Student Loan Trust Series 2007-A, 0.424%, (3M LIBOR + 0.240%), 12/16/2041(c) | 226,890 | $ 220,924 |
SLM Private Credit Student Loan Trust Series 2004-B, 0.614%, (3M LIBOR + 0.430%), 9/15/2033(c) | 300,000 | 291,750 |
SLM Private Credit Student Loan Trust Series 2005-A, 0.494%, (3M LIBOR + 0.310%), 12/15/2038(c) | 358,636 | 353,385 |
SLM Private Credit Student Loan Trust Series 2006-A, 0.474%, (3M LIBOR + 0.290%), 6/15/2039(c) | 571,808 | 558,648 |
TOTAL ASSET BACKED SECURITIES (Cost $1,345,778) | $ 1,424,707 | |
| Shares | Value | |
| WARRANTS – 0.12% | ||
| Oil, Gas & Consumable Fuels – 0.12% | ||
Chesapeake Energy Corp., Exp. 02/09/2026, Strike $27.63 (a) | 4,411 | $ 90,955 |
TOTAL WARRANTS (Cost $20,554) | $ 90,955 | |
| Shares | Value | |
| SHORT-TERM INVESTMENTS – 1.92% | ||
| Money Market Funds – 1.92% | ||
Northern Institutional Funds - Treasury Portfolio (Premier), 0.01%(e) | 1,453,280 | $ 1,453,280 |
TOTAL SHORT-TERM INVESTMENTS (Cost $1,453,280) | $ 1,453,280 | |
Total Investments (Cost $72,818,644) – 100.17% | $75,703,540 | |
Liabilities in Excess of Other Assets – (0.17)% | (127,502) | |
Total Net Assets – 100.00% | $75,576,038 | |
| Percentages are stated as a percent of net assets. | ||
| LIBOR London Interbank Offered Rate | ||
| (a) | Non-income producing security. |
| (b) | Variable rate security. The coupon is based on an underlying pool of loans. |
| (c) | Variable rate security. The coupon is based on a reference index and spread index. |
| (d) | Acquired in a transaction exempt from registration under Rule 144A or Section 4(a)(2) of the Securities Act of 1933. May be resold in the U.S. in transactions exempt from registration, normally to qualified institutional buyers. The total value of all such securities was $5,594,722 which represented 7.40% of the net assets of the Fund. |
| (e) | The rate shown is the annualized seven day yield as of March 31, 2021. |
| Brandes International Equity Fund | Brandes Global Equity Fund | ||
| ASSETS | |||
| Investment in securities, at value(1) | |||
Unaffiliated issuers | $ 619,738,745 | $41,189,135 | |
Affiliated issuers | — | — | |
Foreign Currency(1) | 238,392 | 25,299 | |
| Receivables: | |||
Securities sold | 1,731,063 | — | |
Fund shares sold | 174,758 | 6,117 | |
Dividends and interest | 2,406,821 | 130,111 | |
Tax reclaims | 1,329,024 | 60,360 | |
Securities lending | 7,116 | — | |
Due from Advisor | 24,525 | 6,741 | |
Receivable from service providers | 33,650 | 1,696 | |
Prepaid expenses and other assets | 56,698 | 33,249 | |
Total Assets | 625,740,792 | 41,452,708 | |
| LIABILITIES | |||
| Payables: | |||
Securities purchased | 3,461,786 | 279,186 | |
Fund shares redeemed | 5,333,256 | 181,765 | |
Due to Advisor | 393,462 | 27,653 | |
12b-1 Fee | 11,797 | 735 | |
Trustee Fees | 18,141 | 1,213 | |
Custodian Fee Payable | 25,367 | 2,420 | |
Foreign capital gains taxes | — | — | |
Dividends payable | 191,891 | 2,373 | |
Accrued expenses | 372,557 | 96,725 | |
Total Liabilities | 9,808,257 | 592,070 | |
NET ASSETS | $ 615,932,535 | $40,860,638 | |
| COMPONENTS OF NET ASSETS | |||
Paid in Capital | $ 719,714,733 | $31,947,315 | |
Total distributable earnings (loss) | (103,782,198) | 8,913,323 | |
Total Net Assets | $ 615,932,535 | $40,860,638 | |
| Net asset value, offering price and redemption proceeds per share | |||
| Class A Shares | |||
Net Assets | $ 27,209,611 | $ 735,971 | |
Shares outstanding (unlimited shares authorized without par value) | 1,527,519 | 28,392 | |
Offering and redemption price | $ 17.81 | $ 25.92 | |
Maximum offering price per share* | $ 18.90 | $ 27.50 | |
| Class C Shares | |||
Net Assets | $ 9,459,912 | $ 913,133 | |
Shares outstanding (unlimited shares authorized without par value) | 541,136 | 35,526 | |
Offering and redemption price | $ 17.48 | $ 25.70 | |
| Class I Shares | |||
Net Assets | $ 524,955,241 | $39,211,534 | |
Shares outstanding (unlimited shares authorized without par value) | 29,331,189 | 1,499,465 | |
Offering and redemption price | $ 17.90 | $ 26.15 | |
| Class R6 Shares | |||
Net Assets | $ 54,307,771 | $ N/A | |
Shares outstanding (unlimited shares authorized without par value) | 3,017,468 | N/A | |
Offering and redemption price | $ 18.00 | $ N/A | |
| (1)Cost of: | |||
| Investments in securities | |||
Unaffiliated issuers | $ 636,170,570 | $32,662,906 | |
Affiliated issuers | — | — | |
Foreign currency | 238,392 | 25,299 |
| * | Includes a sales load of 5.75% for the International, Global, Emerging Markets, International Small Cap, and Small Cap Value Funds and 3.75% for the Core Plus Fund. (see Note 7 of the Notes to Financial Statements) |
| Brandes Emerging Markets Value Fund | Brandes International Small Cap Equity Fund | Brandes Small Cap Value Fund | Brandes Core Plus Fixed Income Fund | ||||
| $1,325,462,233 | $ 388,812,298 | $2,286,201 | $75,703,540 | ||||
| — | 747,640 | — | — | ||||
| 313,641 | 141 | — | — | ||||
| 1,452,544 | 8,552,546 | 4,908 | — | ||||
| 1,965,375 | 21,567 | 4,001 | 98,671 | ||||
| 4,963,095 | 1,182,714 | 1,769 | 553,514 | ||||
| 119,255 | 481,976 | — | — | ||||
| — | — | — | — | ||||
| 4,737 | 694 | 8,683 | 21,183 | ||||
| 67,922 | 16,936 | 24 | 3,773 | ||||
| 88,241 | 51,352 | 32,447 | 36,328 | ||||
| 1,334,437,043 | 399,867,864 | 2,338,033 | 76,417,009 | ||||
| 856,024 | 56,132 | 28,479 | 618,712 | ||||
| 1,359,703 | 10,995,979 | 471 | 69,247 | ||||
| 1,081,215 | 319,599 | 1,222 | 22,596 | ||||
| 54,390 | 17,226 | 48 | 249 | ||||
| 41,141 | 12,240 | 44 | 2,649 | ||||
| 78,312 | 22,183 | 1,862 | 2,175 | ||||
| 2,377,946 | — | — | — | ||||
| — | 816 | 1 | 3,730 | ||||
| 684,268 | 352,516 | 36,044 | 121,613 | ||||
| 6,532,999 | 11,776,691 | 68,171 | 840,971 | ||||
| $1,327,904,044 | $ 388,091,173 | $2,269,862 | $75,576,038 | ||||
| $1,530,001,927 | $ 550,003,148 | $2,105,491 | $74,423,702 | ||||
| (202,097,883) | (161,911,975) | 164,371 | 1,152,336 | ||||
| $1,327,904,044 | $ 388,091,173 | $2,269,862 | $75,576,038 | ||||
| $ 218,085,406 | $ 65,637,925 | $ 293,166 | $ 1,099,604 | ||||
| 24,575,515 | 5,111,682 | 23,629 | 118,583 | ||||
| $ 8.87 | $ 12.84 | $ 12.41 | $ 9.27 | ||||
| $ 9.41 | $ 13.62 | $ 13.17 | $ 9.63 | ||||
| $ 11,984,242 | $ 5,241,744 | $ N/A | $ N/A | ||||
| 1,361,222 | 423,361 | N/A | N/A | ||||
| $ 8.80 | $ 12.38 | $ N/A | $ N/A | ||||
| $1,023,087,423 | $ 304,107,406 | $1,976,550 | $74,476,334 | ||||
| 114,568,565 | 23,573,790 | 158,068 | 7,963,897 | ||||
| $ 8.93 | $ 12.90 | $ 12.50 | $ 9.35 | ||||
| $ 74,746,973 | $ 13,104,098 | $ 146 | $ 100 | ||||
| 8,324,530 | 1,013,038 | 12 | 10 | ||||
| $ 8.98 | $ 12.94 | $ 11.70 | $ 9.36 | ||||
| $1,405,047,226 | $ 346,307,336 | $2,018,646 | $72,818,644 | ||||
| — | 30,882,874 | — | — | ||||
| 313,641 | 142 | — | — | ||||
| $ — | $ — | $ — | $— |
| Brandes International Equity Fund | Brandes Global Equity Fund | ||
| INVESTMENT INCOME | |||
| Income | |||
| Dividend income | |||
Unaffiliated issuers | $ 9,336,978 | $ 653,682 | |
Non Cash Dividends | — | — | |
Less: Foreign taxes withheld | (562,722) | (24,263) | |
Interest income | — | 11 | |
Income from securities lending | 85,087 | 1,258 | |
Total Income | 8,859,343 | 630,688 | |
| Expenses | |||
Advisory fees (Note 3) | 2,044,566 | 144,372 | |
Custody fees | 28,709 | 2,388 | |
Administration fees (Note 3) | 62,642 | 8,802 | |
Insurance expense | 10,072 | 601 | |
Legal fees | 21,911 | 1,446 | |
Printing fees | 21,464 | 2,135 | |
Miscellaneous | 37,145 | 4,906 | |
Registration expense | 35,759 | 25,143 | |
Trustees fees | 33,085 | 2,183 | |
Transfer agent fees | 57,657 | 3,817 | |
12b-1 Fees – Class A | 31,557 | 878 | |
12b-1 Fees – Class C | 32,353 | 3,076 | |
Shareholder Service Fees – Class C | 10,784 | 1,026 | |
Sub-Transfer Agency Fees – Class I | 114,400 | 8,643 | |
Auditing fees | 23,862 | 21,668 | |
Total expenses | 2,565,966 | 231,084 | |
Expenses waived by Advisor | (165,818) | (43,939) | |
Expenses recouped | — | — | |
Expenses waived by Service Providers | (33,650) | (1,696) | |
Total net expenses | 2,366,498 | 185,449 | |
Net investment income | 6,492,845 | 445,239 | |
| REALIZED AND UNREALIZED GAIN (LOSS) ON INVESTMENTS | |||
| Net realized gain (loss) on: | |||
Unaffiliated investments | (16,445,606) | 1,029,057 | |
Affiliated investments | — | — | |
Foreign currency transactions | 43,671 | (35) | |
Net realized gain (loss) | (16,401,935) | 1,029,022 | |
| Net change in unrealized appreciation (depreciation) on: | |||
Unaffiliated investments (net of increase in estimated foreign capital gains taxes of $2,377,946 for the Emerging Markets Fund) | 160,999,356 | 9,737,958 | |
Affiliated investments | — | — | |
Foreign currency transactions | (55,216) | (2,484) | |
Net change in unrealized appreciation (depreciation) | 160,944,140 | 9,735,474 | |
Net realized and unrealized gain (loss) on investments and foreign currency transactions | 144,542,205 | 10,764,496 | |
Net increase (decrease) in net assets resulting from operations | $151,035,050 | $11,209,735 |
| Brandes Emerging Markets Value Fund | Brandes International Small Cap Equity Fund | Brandes Small Cap Value Fund | Brandes Core Plus Fixed Income Fund | |||
| $ 16,061,565 | $ 3,490,168 | $ 11,050 | $ 45 | |||
| — | — | 3,038 | — | |||
| (2,659,825) | (336,550) | — | — | |||
| — | — | 171 | 1,051,044 | |||
| — | 9,639 | — | — | |||
| 13,401,740 | 3,163,257 | 14,259 | 1,051,089 | |||
| 5,855,843 | 1,755,521 | 4,127 | 143,982 | |||
| 92,716 | 24,577 | 1,303 | 1,649 | |||
| 135,361 | 44,072 | 5,110 | 13,689 | |||
| 21,222 | 6,050 | — | 1,446 | |||
| 49,840 | 14,958 | 87 | 3,444 | |||
| 53,449 | 15,132 | 1,306 | 6,382 | |||
| 86,985 | 31,127 | 2,438 | 7,852 | |||
| 50,410 | 30,274 | 19,074 | 22,864 | |||
| 75,243 | 22,595 | 68 | 5,186 | |||
| 130,376 | 39,086 | 125 | 8,704 | |||
| 254,991 | 69,608 | 96 | 1,601 | |||
| 45,646 | 18,612 | — | — | |||
| 15,215 | 6,204 | — | — | |||
| 236,746 | 74,238 | 275 | 20,249 | |||
| 22,311 | 21,888 | 19,853 | 21,364 | |||
| 7,126,354 | 2,173,942 | 53,862 | 258,412 | |||
| (29,705) | (4,589) | (48,402) | (109,447) | |||
| 66,402 | 14,808 | — | — | |||
| (67,922) | (16,936) | (24) | (24,342) | |||
| 7,095,129 | 2,167,225 | 5,436 | 124,623 | |||
| 6,306,611 | 996,032 | 8,823 | 926,466 | |||
| 12,073,598 | 7,433,093 | 74,941 | 2,018,377 | |||
| — | (1,197) | — | — | |||
| (36,686) | (59,970) | (30) | — | |||
| 12,036,912 | 7,371,926 | 74,911 | 2,018,377 | |||
| 256,486,444 | 111,409,639 | 297,496 | (3,702,825) | |||
| — | (261,936) | — | — | |||
| (128,640) | (27,614) | — | — | |||
| 256,357,804 | 111,120,089 | 297,496 | (3,702,825) | |||
| 268,394,716 | 118,492,015 | 372,407 | (1,684,448) | |||
| $274,701,327 | $119,488,047 | $381,230 | $ (757,982) |
| Brandes International Equity Fund | Brandes Global Equity Fund | ||||||
| Six Months Ended March 31, 2021 (Unaudited) | Year Ended September 30, 2020 | Six Months Ended March 31, 2021 (Unaudited) | Year Ended September 30, 2020 | ||||
| INCREASE (DECREASE) IN NET ASSETS FROM: | |||||||
| OPERATIONS | |||||||
Net investment income | $ 6,492,845 | $ 11,973,556 | $ 445,239 | $ 582,146 | |||
| Net realized gain (loss) on: | |||||||
Investments | (16,445,606) | (61,359,277) | 1,029,057 | 982,919 | |||
Foreign currency transactions | 43,671 | (151,301) | (35) | (7,480) | |||
| Net unrealized appreciation (depreciation) on: | |||||||
Investments | 160,999,356 | (53,936,184) | 9,737,958 | (4,789,985) | |||
Foreign currency transactions | (55,216) | 130,348 | (2,484) | 4,758 | |||
Net increase (decrease) in net assets resulting from operations | 151,035,050 | (103,342,858) | 11,209,735 | (3,227,642) | |||
| DISTRIBUTIONS TO SHAREHOLDERS | |||||||
| Distributions to shareholders | |||||||
Class A | (194,338) | (633,619) | (15,770) | (23,271) | |||
Class C | (40,324) | (193,760) | (17,104) | (11,406) | |||
Class I | (4,134,001) | (13,239,310) | (854,185) | (643,170) | |||
Class R6 | (453,270) | (1,236,134) | N/A | N/A | |||
Decrease in net assets from distributions | (4,821,933) | (15,302,823) | (887,059) | (677,847) | |||
| CAPITAL SHARE TRANSACTIONS | |||||||
Proceeds from shares sold | 99,351,532 | 238,453,291 | 2,936,635 | 902,634 | |||
Net asset value of shares issued on reinvestment of distributions | 4,576,160 | 14,391,141 | 879,300 | 670,579 | |||
Cost of shares redeemed | (113,401,077) | (358,370,424) | (3,484,346) | (3,533,160) | |||
Net increase (decrease) in net assets from capital share transactions | (9,473,385) | (105,525,992) | 331,589 | (1,959,947) | |||
Total increase (decrease) in net assets | 136,739,732 | (224,171,673) | 10,654,265 | (5,865,436) | |||
| NET ASSETS | |||||||
Beginning of the Period | 479,192,803 | 703,364,476 | 30,206,373 | 36,071,809 | |||
End of the Period | $ 615,932,535 | $ 479,192,803 | $40,860,638 | $30,206,373 | |||
| Brandes Emerging Markets Value Fund | Brandes International Small Cap Equity Fund | ||||||
| Six Months Ended March 31, 2021 (Unaudited) | Year Ended September 30, 2020 | Six Months Ended March 31, 2021 (Unaudited) | Year Ended September 30, 2020 | ||||
| INCREASE (DECREASE) IN NET ASSETS FROM: | |||||||
| OPERATIONS | |||||||
Net investment income | $ 6,306,611 | $ 22,914,468 | $ 996,032 | $ 3,010,129 | |||
| Net realized gain (loss) on: | |||||||
Investments | 12,073,598 | (108,076,408) | 7,431,896 | (45,423,208) | |||
Foreign currency transactions | (36,686) | (910,849) | (59,970) | 44,369 | |||
| Net unrealized appreciation (depreciation) on: | |||||||
Investments | 256,486,444 | (154,143,873) | 111,147,703 | 15,180,645 | |||
Foreign currency transactions | (128,640) | 10,413 | (27,614) | 34,389 | |||
Net increase (decrease) in net assets resulting from operations | 274,701,327 | (240,206,249) | 119,488,047 | (27,153,676) | |||
| DISTRIBUTIONS TO SHAREHOLDERS | |||||||
| Distributions to shareholders | |||||||
Class A | — | (4,338,344) | (200,774) | (283,816) | |||
Class C | — | (208,593) | (15,307) | (29,177) | |||
Class I | — | (22,968,401) | (1,193,611) | (2,517,835) | |||
Class R6 | — | (1,065,052) | (52,305) | (119,547) | |||
Decrease in net assets from distributions | — | (28,580,390) | (1,461,997) | (2,950,375) | |||
| CAPITAL SHARE TRANSACTIONS | |||||||
Proceeds from shares sold | 215,649,919 | 506,169,480 | 38,445,778 | 97,928,290 | |||
Net asset value of shares issued on reinvestment of distributions | — | 26,396,697 | 1,456,141 | 2,829,694 | |||
Cost of shares redeemed | (221,601,349) | (623,820,599) | (81,399,836) | (244,687,795) | |||
Net increase (decrease) in net assets from capital share transactions | (5,951,430) | (91,254,422) | (41,497,917) | (143,929,811) | |||
Total increase (decrease) in net assets | 268,749,897 | (360,041,061) | 76,528,133 | (174,033,862) | |||
| NET ASSETS | |||||||
Beginning of the Period | 1,059,154,147 | 1,419,195,208 | 311,563,040 | 485,596,902 | |||
End of the Period | $1,327,904,044 | $1,059,154,147 | $388,091,173 | $ 311,563,040 | |||
| Brandes Small Cap Value Fund | Brandes Core Plus Fixed Income Fund | ||||||
| Six Months Ended March 31, 2021 (Unaudited) | Year Ended September 30, 2020 | Six Months Ended March 31, 2021 (Unaudited) | Year Ended September 30, 2020 | ||||
| INCREASE (DECREASE) IN NET ASSETS FROM: | |||||||
| OPERATIONS | |||||||
Net investment income | $ 8,823 | $ 8,325 | $ 926,466 | $ 2,050,242 | |||
| Net realized gain (loss) on: | |||||||
Investments | 74,941 | 21,006 | 2,018,377 | (1,658,866) | |||
Foreign currency transactions | (30) | 156 | — | — | |||
| Net unrealized appreciation (depreciation) on: | |||||||
Investments | 297,496 | (22,544) | (3,702,825) | 4,583,064 | |||
Foreign currency transactions | — | — | — | — | |||
Net increase (decrease) in net assets resulting from operations | 381,230 | 6,943 | (757,982) | 4,974,440 | |||
| DISTRIBUTIONS TO SHAREHOLDERS | |||||||
| Distributions to shareholders | |||||||
Class A | (934) | (95) | (19,202) | (37,997) | |||
Class C | N/A | N/A | N/A | N/A | |||
Class I | (17,768) | (2,749) | (1,274,029) | (1,911,433) | |||
Class R6 | (2) | N/A | (2) | (3) | |||
Decrease in net assets from distributions | (18,704) | (2,844) | (1,293,233) | (1,949,433) | |||
| CAPITAL SHARE TRANSACTIONS | |||||||
Proceeds from shares sold | 1,418,690 | 125,305 | 12,369,711 | 12,809,224 | |||
Net asset value of shares issued on reinvestment of distributions | 18,702 | 2,844 | 1,263,057 | 1,913,508 | |||
Cost of shares redeemed | (79,651) | (63,782) | (22,816,690) | (17,487,590) | |||
Net increase (decrease) in net assets from capital share transactions | 1,357,741 | 64,367 | (9,183,922) | (2,764,858) | |||
Total increase (decrease) in net assets | 1,720,267 | 68,466 | (11,235,137) | 260,149 | |||
| NET ASSETS | |||||||
Beginning of the Period | 549,595 | 481,129 | 86,811,175 | 86,551,026 | |||
End of the Period | $2,269,862 | $549,595 | $ 75,576,038 | $ 86,811,175 | |||
| Net asset value, beginning of period | Net investment income(1) | Net realized and unrealized gain (loss) on investments | Total from investment operations | Dividends from net investment income | Net asset value, end of period | |
| Brandes International Equity Fund | ||||||
| Class A | ||||||
3/31/2021 (Unaudited) | $13.51 | 0.17 | 4.26 | 4.43 | (0.13) | $17.81 |
9/30/2020 | $16.02 | 0.26 | (2.40) | (2.14) | (0.37) | $13.51 |
9/30/2019 | $17.71 | 0.53 | (1.59) | (1.06) | (0.63) | $16.02 |
9/30/2018 | $17.48 | 0.36 | 0.17 | 0.53 | (0.30) | $17.71 |
9/30/2017 | $15.70 | 0.29 | 2.03 | 2.32 | (0.54) | $17.48 |
9/30/2016 | $14.90 | 0.35 | 0.81 | 1.16 | (0.36) | $15.70 |
| Class C | ||||||
3/31/2021 (Unaudited) | $13.27 | 0.11 | 4.17 | 4.28 | (0.07) | $17.48 |
9/30/2020 | $15.76 | 0.13 | (2.33) | (2.20) | (0.29) | $13.27 |
9/30/2019 | $17.47 | 0.40 | (1.58) | (1.18) | (0.53) | $15.76 |
9/30/2018 | $17.30 | 0.22 | 0.18 | 0.40 | (0.23) | $17.47 |
9/30/2017 | $15.58 | 0.17 | 2.00 | 2.17 | (0.45) | $17.30 |
9/30/2016 | $14.79 | 0.23 | 0.81 | 1.04 | (0.25) | $15.58 |
| Class I | ||||||
3/31/2021 (Unaudited) | $13.57 | 0.19 | 4.28 | 4.47 | (0.14) | $17.90 |
9/30/2020 | $16.07 | 0.27 | (2.37) | (2.10) | (0.40) | $13.57 |
9/30/2019 | $17.76 | 0.56 | (1.60) | (1.04) | (0.65) | $16.07 |
9/30/2018 | $17.52 | 0.40 | 0.16 | 0.56 | (0.32) | $17.76 |
9/30/2017 | $15.72 | 0.33 | 2.04 | 2.37 | (0.57) | $17.52 |
9/30/2016 | $14.92 | 0.38 | 0.81 | 1.19 | (0.39) | $15.72 |
| Class R6 | ||||||
3/31/2021 (Unaudited) | $13.64 | 0.20 | 4.31 | 4.51 | (0.15) | $18.00 |
9/30/2020 | $16.15 | 0.36 | (2.47) | (2.11) | (0.40) | $13.64 |
9/30/2019 | $17.83 | 0.59 | (1.61) | (1.02) | (0.66) | $16.15 |
9/30/2018 | $17.56 | 0.42 | 0.18 | 0.60 | (0.33) | $17.83 |
9/30/2017 | $15.74 | 0.35 | 2.04 | 2.39 | (0.57) | $17.56 |
2/1/2016(9) – 9/30/2016 | $14.41 | 0.27 | 1.39 | 1.66 | (0.33) | $15.74 |
| (1) | Net investment income per share has been calculated based on average shares outstanding during the period. |
| (2) | The total return calculation does not reflect the sales loads that may be imposed on Class A or C shares (see Note 7 of the Notes to Financial Statements). |
| (3) | After fees waived and expenses absorbed or recouped by the Advisor, where applicable. |
| (4) | Not annualized. |
| (5) | Annualized. |
| (6) | Includes expenses not covered by the Trust’s expense limitation agreement. |
| (7) | As of June 30, 2019, the expense cap for the class changed from 1.00% to 0.85%. |
| (8) | As of June 30, 2019, the expense cap for the class changed from 0.82% to 0.75%. |
| (9) | Commencement of operations. |
| (10) | The total return figure is the since inception return for the class. |
| Total return(2) | Net assets, end of period (millions) | Ratio of net expenses to average net assets(3) | Ratio of net investment income to average net assets(3) | Ratio of expenses (prior to reimburse-ments) to average net assets | Ratio of net investment income (prior to reimburse-ments) to average net assets | Portfolio turnover rate |
| 32.78% (4) | $ 27.2 | 1.11% (5) | 2.09% (5) | 1.12% (5) | 2.08% (5) | 18.00% (4) |
| (13.42)% | $ 22.1 | 1.13% | 1.80% | 1.14% | 1.79% | 23.20% |
| (5.98)% | $ 32.0 | 1.16% | 3.21% | 1.16% | 3.21% | 14.43% |
| 3.02% | $ 34.9 | 1.16% | 2.00% | 1.16% | 2.00% | 20.37% |
| 15.07% | $ 31.5 | 1.18% (6) | 1.77% | 1.18% (6) | 1.77% | 33.82% |
| 7.90% | $ 14.3 | 1.18% | 2.30% | 1.18% | 2.30% | 17.60% |
| 32.29% (4) | $ 9.5 | 1.86% (5) | 1.35% (5) | 1.87% (5) | 1.34% (5) | 18.00% (4) |
| (14.06)% | $ 7.6 | 1.88% | 1.01% | 1.89% | 1.00% | 23.20% |
| (6.73)% | $ 13.1 | 1.91% | 2.46% | 1.91% | 2.46% | 14.43% |
| 2.31% | $ 18.3 | 1.91% | 1.25% | 1.91% | 1.25% | 20.37% |
| 14.19% | $ 17.9 | 1.93% (6) | 1.01% | 1.93% (6) | 1.01% | 33.82% |
| 7.10% | $ 13.1 | 1.93% | 1.55% | 1.93% | 1.55% | 17.60% |
| 32.98% (4) | $525.0 | 0.85% (5) | 2.40% (5) | 0.92% (5) | 2.33% (5) | 18.00% (4) |
| (13.13)% | $401.7 | 0.85% | 2.03% | 0.94% | 1.94% | 23.20% |
| (5.82)% | $622.4 | 0.94% (7) | 3.43% | 0.96% (7) | 3.41% | 14.43% |
| 3.23% | $664.7 | 0.96% | 2.20% | 0.96% | 2.20% | 20.37% |
| 15.33% | $523.1 | 0.98% (6) | 1.96% | 0.98% (6) | 1.96% | 33.82% |
| 8.10% | $648.3 | 1.00% | 2.48% | 0.98% | 2.50% | 17.60% |
| 33.06% (4) | $ 54.3 | 0.75% (5) | 2.47% (5) | 0.87% (5) | 2.35% (5) | 18.00% (4) |
| (13.08)% | $ 47.8 | 0.75% | 2.35% | 0.89% | 2.21% | 23.20% |
| (5.69)% | $ 35.9 | 0.80% (8) | 3.57% | 0.91% (8) | 3.46% | 14.43% |
| 3.44% | $ 24.6 | 0.82% | 2.34% | 0.91% | 2.25% | 20.37% |
| 15.48% | $ 38.5 | 0.83% (6) | 2.12% | 0.93% (6) | 2.02% | 33.82% |
| 11.60% (10) | $ 27.7 | 0.82% (5) | 2.67% (5) | 0.93% (5) | 2.56% (5) | 17.60% (4) |
| Net asset value, beginning of period | Net investment income(1) | Net realized and unrealized gain (loss) on investments | Total from investment operations | Dividends from net investment income | Dividends from net realized gains | |
| Brandes Global Equity Fund | ||||||
| Class A | ||||||
3/31/2021 (Unaudited) | $19.30 | 0.24 | 6.94 | 7.18 | (0.26) | (0.30) |
9/30/2020 | $21.75 | 0.28 | (2.33) | (2.05) | (0.40) | — |
9/30/2019 | $24.61 | 0.47 | (1.80) | (1.33) | (0.48) | (1.05) |
9/30/2018 | $24.42 | 0.43 | 0.69 | 1.12 | (0.42) | (0.51) |
9/30/2017 | $21.21 | 0.34 | 3.28 | 3.62 | (0.41) | — |
9/30/2016 | $21.85 | 0.40 | 0.67 | 1.07 | (0.42) | (1.29) |
| Class C | ||||||
3/31/2021 (Unaudited) | $19.16 | 0.17 | 6.85 | 7.02 | (0.18) | (0.30) |
9/30/2020 | $21.60 | 0.17 | (2.35) | (2.18) | (0.26) | — |
9/30/2019 | $24.45 | 0.30 | (1.78) | (1.48) | (0.32) | (1.05) |
9/30/2018 | $24.28 | 0.24 | 0.69 | 0.93 | (0.25) | (0.51) |
9/30/2017 | $21.09 | 0.18 | 3.25 | 3.43 | (0.24) | — |
9/30/2016 | $21.73 | 0.25 | 0.66 | 0.91 | (0.26) | (1.29) |
| Class I | ||||||
3/31/2021 (Unaudited) | $19.46 | 0.29 | 6.98 | 7.27 | (0.28) | (0.30) |
9/30/2020 | $21.91 | 0.38 | (2.39) | (2.01) | (0.44) | — |
9/30/2019 | $24.77 | 0.53 | (1.81) | (1.28) | (0.53) | (1.05) |
9/30/2018 | $24.57 | 0.49 | 0.70 | 1.19 | (0.48) | (0.51) |
9/30/2017 | $21.33 | 0.41 | 3.30 | 3.71 | (0.47) | — |
9/30/2016 | $21.95 | 0.46 | 0.67 | 1.13 | (0.46) | (1.29) |
| (1) | Net investment income per share has been calculated based on average shares outstanding during the period. |
| (2) | The total return figure is the since inception return for the class. |
| (3) | After fees waived and expenses absorbed or recouped by the Advisor, where applicable. |
| (4) | Not annualized. |
| (5) | Annualized. |
| (6) | Includes expenses not covered by the Trust’s expense limitation agreement. |
| Net asset value, end of period | Total return(2) | Net assets, end of period (millions) | Ratio of net expenses to average net assets(3) | Ratio of net investment income to average net assets(3) | Ratio of expenses (prior to reimburse-ments) to average net assets | Ratio of net investment income (prior to reimburse-ments) to average net assets | Portfolio turnover rate |
| $25.92 | 37.45% (4) | $ 0.7 | 1.25% (5) | 2.12% (5) | 1.46% (5) | 1.91% (5) | 14.09% (4) |
| $19.30 | (9.41)% | $ 0.9 | 1.25% | 1.56% | 1.58% | 1.23% | 17.16% |
| $21.75 | (5.22)% | $ 1.5 | 1.25% | 2.11% | 1.56% | 1.81% | 12.11% |
| $24.61 | 4.68% | $ 3.4 | 1.25% | 1.72% | 1.40% | 1.57% | 8.89% |
| $24.42 | 17.20% | $ 5.8 | 1.26% (6) | 1.52% | 1.45% (6) | 1.33% | 17.42% |
| $21.21 | 5.01% | $ 4.6 | 1.25% | 1.95% | 1.58% | 1.62% | 15.68% |
| $25.70 | 36.88% (4) | $ 0.9 | 2.00% (5) | 1.47% (5) | 2.20% (5) | 1.27% (5) | 14.09% (4) |
| $19.16 | (10.08)% | $ 0.7 | 2.00% | 0.84% | 2.32% | 0.52% | 17.16% |
| $21.60 | (5.91)% | $ 1.2 | 2.00% | 1.37% | 2.32% | 1.05% | 12.11% |
| $24.45 | 3.88% | $ 1.6 | 2.00% | 0.97% | 2.15% | 0.82% | 8.89% |
| $24.28 | 16.31% | $ 1.7 | 2.01% (6) | 0.77% | 2.21% (6) | 0.57% | 17.42% |
| $21.09 | 4.20% | $ 2.0 | 2.00% | 1.20% | 2.32% | 0.88% | 15.68% |
| $26.15 | 37.62% (4) | $39.2 | 1.00% (5) | 2.49% (5) | 1.25% (5) | 2.24% (5) | 14.09% (4) |
| $19.46 | (9.18)% | $28.6 | 1.00% | 1.83% | 1.36% | 1.47% | 17.16% |
| $21.91 | (4.98)% | $33.4 | 1.00% | 2.37% | 1.36% | 2.00% | 12.11% |
| $24.77 | 4.95% | $62.6 | 1.00% | 1.97% | 1.20% | 1.77% | 8.89% |
| $24.57 | 17.48% | $61.7 | 1.01% (6) | 1.77% | 1.26% (6) | 1.52% | 17.42% |
| $21.33 | 5.26% | $47.3 | 1.00% | 2.20% | 1.38% | 1.82% | 15.68% |
| Net asset value, beginning of period | Net investment income(1) | Net realized and unrealized gain (loss) on investments | Total from investment operations | Dividends from net investment income | Net asset value, end of period | |
| Brandes Emerging Markets Value Fund | ||||||
| Class A | ||||||
3/31/2021 (Unaudited) | $7.04 | 0.04 | 1.79 | 1.83 | — | $8.87 |
9/30/2020 | $8.57 | 0.13 | (1.49) | (1.36) | (0.17) | $7.04 |
9/30/2019 | $8.46 | 0.19 | 0.07 | 0.26 | (0.15) | $8.57 |
9/30/2018 | $9.47 | 0.15 | (1.01) | (0.86) | (0.15) | $8.46 |
9/30/2017 | $7.91 | 0.10 | 1.60 | 1.70 | (0.14) | $9.47 |
9/30/2016 | $6.19 | 0.12 | 1.69 | 1.81 | (0.09) | $7.91 |
| Class C | ||||||
3/31/2021 (Unaudited) | $7.01 | 0.01 | 1.78 | 1.79 | — | $8.80 |
9/30/2020 | $8.53 | 0.07 | (1.48) | (1.41) | (0.11) | $7.01 |
9/30/2019 | $8.44 | 0.13 | 0.06 | 0.19 | (0.10) | $8.53 |
9/30/2018 | $9.43 | 0.08 | (0.99) | (0.91) | (0.08) | $8.44 |
9/30/2017 | $7.86 | 0.05 | 1.58 | 1.63 | (0.06) | $9.43 |
9/30/2016 | $6.15 | 0.07 | 1.67 | 1.74 | (0.03) | $7.86 |
| Class I | ||||||
3/31/2021 (Unaudited) | $7.07 | 0.04 | 1.82 | 1.86 | — | $8.93 |
9/30/2020 | $8.62 | 0.14 | (1.50) | (1.36) | (0.19) | $7.07 |
9/30/2019 | $8.50 | 0.21 | 0.08 | 0.29 | (0.17) | $8.62 |
9/30/2018 | $9.51 | 0.17 | (1.01) | (0.84) | (0.17) | $8.50 |
9/30/2017 | $7.94 | 0.13 | 1.60 | 1.73 | (0.16) | $9.51 |
9/30/2016 | $6.21 | 0.14 | 1.70 | 1.84 | (0.11) | $7.94 |
| Class R6 | ||||||
3/31/2021 (Unaudited) | $7.11 | 0.05 | 1.82 | 1.87 | — | $8.98 |
9/30/2020 | $8.65 | 0.16 | (1.51) | (1.35) | (0.19) | $7.11 |
9/30/2019 | $8.53 | 0.23 | 0.07 | 0.30 | (0.18) | $8.65 |
9/30/2018 | $9.53 | 0.19 | (1.02) | (0.83) | (0.17) | $8.53 |
9/30/2017 | $7.93 | 0.15 | 1.62 | 1.77 | (0.17) | $9.53 |
7/11/2016(7) – 9/30/2016 | $7.54 | 0.04 | 0.38 | 0.42 | (0.03) | $7.93 |
| (1) | Net investment income per share has been calculated based on average shares outstanding during the period. |
| (2) | The total return calculation does not reflect the sales loads that may be imposed on Class A or C shares (see Note 7 of the Notes to Financial Statements). |
| (3) | After fees waived and expenses absorbed or recouped by the Advisor, where applicable. |
| (4) | Not annualized. |
| (5) | Annualized. |
| (6) | Includes expenses not covered by the Trust’s expense limitation agreement. |
| (7) | Commencement of operations. |
| (8) | The total return figure is the since inception return for the class. |
| (9) | Amount is less than $50,000. |
| Total return(2) | Net assets, end of period (millions) | Ratio of net expenses to average net assets(3) | Ratio of net investment income to average net assets(3) | Ratio of expenses (prior to reimburse-ments) to average net assets | Ratio of net investment income (prior to reimburse-ments) to average net assets | Portfolio turnover rate |
| 25.99% (4) | $ 218.1 | 1.30% (5) | 0.87% (5) | 1.31% (5) | 0.86% (5) | 18.59% (4) |
| (16.10)% | $ 174.2 | 1.33% | 1.75% | 1.34% | 1.74% | 34.39% |
| 3.10% | $ 235.9 | 1.35% | 2.23% | 1.35% | 2.23% | 22.09% |
| (9.14)% | $ 258.8 | 1.37% | 1.62% | 1.34% | 1.65% | 37.66% |
| 21.78% | $ 319.2 | 1.42% (6) | 1.27% | 1.40% (6) | 1.29% | 23.67% |
| 29.38% | $ 305.0 | 1.37% | 1.74% | 1.39% | 1.72% | 26.48% |
| 25.53% (4) | $ 12.0 | 2.05% (5) | 0.15% (5) | 2.06% (5) | 0.14% (5) | 18.59% (4) |
| (16.63)% | $ 11.1 | 2.08% | 0.90% | 2.09% | 0.89% | 34.39% |
| 2.27% | $ 18.0 | 2.10% | 1.48% | 2.10% | 1.48% | 22.09% |
| (9.70)% | $ 22.8 | 2.10% | 0.89% | 2.09% | 0.90% | 37.66% |
| 20.83% | $ 28.2 | 2.17% (6) | 0.52% | 2.14% (6) | 0.55% | 23.67% |
| 28.38% | $ 22.4 | 2.12% | 0.99% | 2.14% | 0.97% | 26.48% |
| 26.31% (4) | $1,023.1 | 1.12% (5) | 1.05% (5) | 1.12% (5) | 1.05% (5) | 18.59% (4) |
| (15.96)% | $ 834.8 | 1.12% | 1.88% | 1.14% | 1.86% | 34.39% |
| 3.41% | $1,117.7 | 1.12% | 2.46% | 1.15% | 2.43% | 22.09% |
| (8.91)% | $1,162.1 | 1.12% | 1.88% | 0.14% | 1.86% | 37.66% |
| 22.07% | $1,311.5 | 1.17% (6) | 1.51% | 1.20% (6) | 1.48% | 23.67% |
| 29.70% | $ 829.0 | 1.12% | 1.99% | 1.19% | 1.92% | 26.48% |
| 26.30% (4) | $ 74.7 | 0.97% (5) | 1.19% (5) | 1.06% (5) | 1.10% (5) | 18.59% (4) |
| (15.74)% | $ 39.1 | 0.97% | 2.07% | 1.09% | 1.95% | 34.39% |
| 3.45% | $ 47.6 | 0.97% | 2.61% | 1.10% | 2.48% | 22.09% |
| (8.74)% | $ 33.6 | 0.97% | 2.02% | 1.08% | 1.91% | 37.66% |
| 22.53% | $ 97.4 | 1.02% (6) | 1.68% | 1.17% (6) | 1.53% | 23.67% |
| 5.59% (8) | $ —(9) | 0.97% (5) | 2.14% (5) | 1.14% (5) | 1.97% (5) | 26.48% (4) |
| Net asset value, beginning of period | Net investment income (loss)(1) | Net realized and unrealized gain (loss) on investments | Total from investment operations | Dividends from net investment income | Dividends from net realized gains | |
| Brandes International Small Cap Equity Fund | ||||||
| Class A | ||||||
3/31/2021 (Unaudited) | $ 9.33 | 0.02 | 3.53 | 3.55 | (0.04) | — |
9/30/2020 | $10.22 | 0.07 | (0.88) | (0.81) | (0.08) | — |
9/30/2019 | $12.10 | 0.15 | (1.60) | (1.45) | (0.30) | (0.13) |
9/30/2018 | $14.30 | 0.14 | (1.32) | (1.18) | (0.54) | (0.48) |
9/30/2017 | $13.46 | 0.14 | 1.32 | 1.46 | (0.34) | (0.28) |
9/30/2016 | $12.58 | 0.09 | 1.22 | 1.31 | (0.23) | (0.20) |
| Class C | ||||||
3/31/2021 (Unaudited) | $ 9.03 | (0.02) | 3.40 | 3.38 | (0.03) | — |
9/30/2020 | $ 9.94 | (0.01) | (0.85) | (0.86) | (0.05) | — |
9/30/2019 | $11.81 | 0.06 | (1.55) | (1.49) | (0.25) | (0.13) |
9/30/2018 | $14.03 | 0.04 | (1.28) | (1.24) | (0.50) | (0.48) |
9/30/2017 | $13.24 | 0.04 | 1.30 | 1.34 | (0.27) | (0.28) |
9/30/2016 | $12.42 | — (7) | 1.19 | 1.19 | (0.17) | (0.20) |
| Class I | ||||||
3/31/2021 (Unaudited) | $ 9.37 | 0.03 | 3.54 | 3.57 | (0.04) | — |
9/30/2020 | $10.25 | 0.09 | (0.88) | (0.79) | (0.09) | — |
9/30/2019 | $12.14 | 0.17 | (1.61) | (1.44) | (0.32) | (0.13) |
9/30/2018 | $14.35 | 0.17 | (1.32) | (1.15) | (0.58) | (0.48) |
9/30/2017 | $13.50 | 0.17 | 1.32 | 1.49 | (0.36) | (0.28) |
9/30/2016 | $12.61 | 0.12 | 1.22 | 1.34 | (0.25) | (0.20) |
| Class R6 | ||||||
3/31/2021 (Unaudited) | $ 9.39 | 0.04 | 3.56 | 3.60 | (0.05) | — |
9/30/2020 | $10.27 | 0.07 | (0.86) | (0.79) | (0.09) | — |
9/30/2019 | $12.15 | 0.18 | (1.61) | (1.43) | (0.32) | (0.13) |
9/30/2018 | $14.36 | 0.18 | (1.33) | (1.15) | (0.58) | (0.48) |
9/30/2017 | $13.50 | 0.18 | 1.33 | 1.51 | (0.37) | (0.28) |
6/27/2016(8) – 9/30/2016 | $12.38 | 0.04 | 1.13 | 1.17 | (0.05) | — |
| (1) | Net investment income per share has been calculated based on average shares outstanding during the period. |
| (2) | The total return calculation does not reflect the sales loads that may be imposed on Class A or C shares (see Note 7 of the Notes to Financial Statements). |
| (3) | After fees waived and expenses absorbed or recouped by the Advisor, where applicable. |
| (4) | Not annualized. |
| (5) | Annualized. |
| (6) | Includes expenses not covered by the Trust’s expense limitation agreement. |
| (7) | Amount is less than $0.01 per share. |
| (8) | Commencement of operations. |
| (9) | The total return figure is the since inception return for the class. |
| Net asset value, end of period | Total return(2) | Net assets, end of period (millions) | Ratio of net expenses to average net assets(3) | Ratio of net investment income to average net assets(3) | Ratio of expenses (prior to reimburse-ments) to average net assets | Ratio of net investment income (prior to reimburse-ments) to average net assets | Portfolio turnover rate |
| $12.84 | 38.08% (4) | $ 65.6 | 1.32% (5) | 0.44% (5) | 1.33% (5) | 0.43% (5) | 11.52% (4) |
| $ 9.33 | (7.95)% | $ 35.8 | 1.35% | 0.77% | 1.36% | 0.76% | 39.28% |
| $10.22 | (12.04)% | $ 43.5 | 1.35% | 1.34% | 1.35% | 1.34% | 22.52% |
| $12.10 | (8.88)% | $ 80.9 | 1.30% | 1.05% | 1.30% | 1.05% | 21.97% |
| $14.30 | 11.29% | $ 176.9 | 1.30% (6) | 1.04% | 1.30% (6) | 1.04% | 21.37% |
| $13.46 | 10.60% | $ 121.1 | 1.32% | 0.71% | 1.31% | 0.72% | 21.00% |
| $12.38 | 37.51% (4) | $ 5.2 | 2.07% (5) | (0.38)% (5) | 2.08% (5) | (0.39)% (5) | 11.52% (4) |
| $ 9.03 | (8.64)% | $ 4.5 | 2.11% | (0.06)% | 2.12% | (0.07)% | 39.28% |
| $ 9.94 | (12.69)% | $ 6.9 | 2.10% | 0.59% | 2.10% | 0.59% | 22.52% |
| $11.81 | (9.55)% | $ 14.5 | 2.05% | 0.30% | 2.05% | 0.30% | 21.97% |
| $14.03 | 10.52% | $ 27.2 | 2.05% (6) | 0.29% | 2.05% (6) | 0.29% | 21.37% |
| $13.24 | 9.78% | $ 19.8 | 2.06% | (0.03)% | 2.06% | (0.03)% | 21.00% |
| $12.90 | 38.20% (4) | $ 304.1 | 1.14% (5) | 0.56% (5) | 1.13% (5) | 0.57% (5) | 11.52% (4) |
| $ 9.37 | (7.69)% | $ 260.8 | 1.15% | 0.93% | 1.16% | 0.92% | 39.28% |
| $10.25 | (11.93)% | $ 414.8 | 1.15% | 1.54% | 1.15% | 1.54% | 22.52% |
| $12.14 | (8.70)% | $ 963.8 | 1.10% | 1.25% | 1.10% | 1.25% | 21.97% |
| $14.35 | 11.54% | $1,543.9 | 1.10% (6) | 1.24% | 1.10% (6) | 1.24% | 21.37% |
| $13.50 | 10.85% | $1,212.4 | 1.13% | 0.90% | 1.11% | 0.92% | 21.00% |
| $12.94 | 38.37% (4) | $ 13.1 | 1.00% (5) | 0.72% (5) | 1.08% (5) | 0.64% (5) | 11.52% (4) |
| $ 9.39 | (7.72)% | $ 10.5 | 1.00% | 0.83% | 1.12% | 0.71% | 39.28% |
| $10.27 | (11.80)% | $ 20.4 | 1.00% | 1.69% | 1.10% | 1.59% | 22.52% |
| $12.15 | (8.64)% | $ 72.5 | 1.00% | 1.35% | 1.05% | 1.30% | 21.97% |
| $14.36 | 11.67% | $ 76.1 | 1.01% (6) | 1.33% | 1.05% (6) | 1.29% | 21.37% |
| $13.50 | 9.49% (9) | $16.5 | 1.00% (5) | 1.03% (5) | 1.06% (5) | 0.97% (5) | 21.00% (4) |
| Net asset value, beginning of period | Net investment income | Net realized and unrealized gain (loss) on investments | Total from investment operations | Dividends from net investment income(1) | Dividends from net realized gains | |
| Brandes Small Cap Value Fund | ||||||
| Class A | ||||||
3/31/2021 (Unaudited) | $ 8.52 | 0.10 (4) | 3.95 | 4.05 | (0.16) | — |
9/30/2020 | $ 8.58 | 0.15 | (0.16) | (0.01) | (0.05) | — |
9/30/2019 | $10.27 | 0.05 | (0.95) | (0.90) | (0.10) | (0.69) |
1/2/2018(8) – 9/30/2018 | $10.00 | 0.02 | 0.27 | 0.29 | (0.02) | — |
| Class I | ||||||
3/31/2021 (Unaudited) | $ 8.58 | 0.08 (4) | 4.00 | 4.08 | (0.16) | — |
9/30/2020 | $ 8.62 | 0.14 | (0.13) | 0.01 | (0.05) | — |
9/30/2019 | $10.27 | 0.07 | (0.92) | (0.85) | (0.11) | (0.69) |
1/2/2018(8) – 9/30/2018 | $10.00 | 0.04 | 0.27 | 0.31 | (0.04) | — |
| Class R6 | ||||||
3/31/2021 (Unaudited) | $ 8.00 | 0.19 (4) | 3.67 | 3.86 | (0.16) | — |
9/30/2020 | $ 7.97 | 0.26 | (0.18) | 0.08 | (0.05) | — |
9/30/2019 | $10.32 | 0.09 | (1.63) | (1.54) | (0.12) | (0.69) |
1/2/2018(8) – 9/30/2018 | $10.00 | 0.05 | 0.31 | 0.36 | (0.04) | — |
| (1) | Net investment income per share has been calculated based on average shares outstanding during the period. |
| (2) | The total return calculation does not reflect the sales loads that may be imposed on Class A shares (see Note 7 of the Notes to Financial Statements). |
| (3) | After fees waived and expenses absorbed or recouped by the Advisor, where applicable. |
| (4) | Net investment income per share and the ratio of net investment income to average net assets include $0.03 and 0.51% for Class A, $0.03 and 0.51% for Class I and $0.03 and 0.51% for Class R6, respectively, resulting from a special dividend from PDL BioPharma, Inc. in October 2020. |
| (5) | Not annualized. |
| (6) | Annualized. |
| (7) | Amount is less than $50,000. |
| (8) | Commencement of operations. |
| Net asset value, end of period | Total return(2) | Net assets, end of period (millions) | Ratio of net expenses to average net assets(3) | Ratio of net investment income to average net assets(3) | Ratio of expenses (prior to reimburse-ments) to average net assets | Ratio of net investment income (prior to reimburse-ments) to average net assets | Portfolio turnover rate |
| $12.41 | 47.79% (5) | $0.3 | 1.15% (6) | 1.72% (4)(6) | 8.49% (6) | (5.62)% (6) | 32.57% (5) |
| $ 8.52 | (0.02)% | $ —(7) | 1.15% | 1.06% | 27.37% | (25.16)% | 80.65% |
| $ 8.58 | (8.53)% | $ —(7) | 1.15% | 0.55% | 7.18% | (5.48)% | 54.30% |
| $10.27 | 2.92% | $0.1 | 1.15% (6) | 0.28% (6) | 3.21% (6) | (1.78)% (6) | 41.02% (5) |
| $12.50 | 47.99% (5) | $2.0 | 0.90% (6) | 1.47% (4)(6) | 9.11% (6) | (6.74)% (6) | 32.57% (5) |
| $ 8.58 | 0.10% | $0.5 | 0.90% | 1.65% | 30.12% | (27.57)% | 80.65% |
| $ 8.62 | (8.13)% | $0.5 | 0.90% | 0.81% | 4.18% | (2.47)% | 54.30% |
| $10.27 | 3.09% | $5.4 | 0.90% (6) | 0.53% (6) | 3.67% (6) | (2.24)% (6) | 41.02% (5) |
| $11.70 | 48.54% (5) | $ —(7) | 0.72% (6) | 2.20% (4)(6) | 9.43% (6) | (6.51)% (6) | 32.57% (5) |
| $ 8.00 | 1.11% | $ —(7) | 0.72% | 0.87% | 29.17% | (27.58)% | 80.65% |
| $ 7.97 | (15.36)% | $ —(7) | 0.72% | 0.98% | 3.16% | (1.46)% | 54.30% |
| $10.32 | 3.63% | $4.8 | 0.72% (6) | 0.71% (6) | 2.99% (6) | (1.56)% (6) | 41.02% (5) |
| Net asset value, beginning of period | Net investment income(1) | Net realized and unrealized gain (loss) on investments | Total from investment operations | Dividends from net investment income | Dividends from net realized gains | |
| Brandes Core Plus Fixed Income Fund | ||||||
| Class A | ||||||
3/31/2021 (Unaudited) | $9.52 | 0.10 | (0.21) | (0.11) | (0.14) | — |
9/30/2020 | $9.18 | 0.19 | 0.34 | 0.53 | (0.19) | — |
9/30/2019 | $8.85 | 0.24 | 0.33 | 0.57 | (0.24) | — |
9/30/2018 | $9.18 | 0.23 | (0.33) | (0.10) | (0.23) | — |
9/30/2017 | $9.39 | 0.20 | (0.18) | 0.02 | (0.21) | (0.02) |
9/30/2016 | $9.14 | 0.22 | 0.26 | 0.48 | (0.22) | (0.01) |
| Class I | ||||||
3/31/2021 (Unaudited) | $9.60 | 0.11 | (0.21) | (0.10) | (0.15) | — |
9/30/2020 | $9.26 | 0.22 | 0.33 | 0.55 | (0.21) | — |
9/30/2019 | $8.92 | 0.26 | 0.34 | 0.60 | (0.26) | — |
9/30/2018 | $9.25 | 0.25 | (0.33) | (0.08) | (0.25) | — |
9/30/2017 | $9.44 | 0.22 | (0.16) | 0.06 | (0.23) | (0.02) |
9/30/2016 | $9.20 | 0.24 | 0.25 | 0.49 | (0.24) | (0.01) |
| Class R6 | ||||||
3/31/2021 (Unaudited) | $9.60 | 0.16 | (0.19) | (0.03) | (0.21) | — |
9/30/2020 | $9.26 | 0.29 | 0.34 | 0.63 | (0.29) | — |
9/30/2019 | $8.93 | 0.09 | 0.56 | 0.65 | (0.32) | — |
10/10/2017(11) – 9/30/2018 | $9.25 | 0.06 | (0.06) | — | (0.32) | — |
| (1) | Net investment income per share has been calculated based on average shares outstanding during the period. |
| (2) | The total return calculation does not reflect the sales loads that may be imposed on Class A shares (see Note 7 of the Notes to Financial Statements). |
| (3) | After fees waived and expenses absorbed or recouped by the Advisor, where applicable. |
| (4) | Not annualized. |
| (5) | Annualized. |
| (6) | As of August 24, 2020, the expense cap for the class changed from 0.70% to 0.50%. |
| (7) | Includes expenses not covered by the Trust’s expense limitation agreement. |
| (8) | As of August 24, 2020, the expense cap for the class changed from 0.50% to 0.30%. |
| (9) | Amount is less than $50,000. |
| (10) | As of August 24, 2020, the expense cap for the class changed from 0.35% to 0.30%. |
| (11) | Commencement of operations. |
| (12) | The total return figure is the since inception return for the class. |
| Net asset value, end of period | Total return(2) | Net assets, end of period (millions) | Ratio of net expenses to average net assets(3) | Ratio of net investment income to average net assets(3) | Ratio of expenses (prior to reimburse-ments) to average net assets | Ratio of net investment income (prior to reimburse-ments) to average net assets | Portfolio turnover rate |
| $9.27 | (1.20)% (4) | $ 1.1 | 0.50% (5) | 2.05% (5) | 0.83% (5) | 1.72% (5) | 12.46% (4) |
| $9.52 | 5.89% | $ 1.2 | 0.68% (6) | 2.30% | 0.86% | 2.12% | 20.59% |
| $9.18 | 6.56% | $ 3.2 | 0.70% | 2.72% | 0.93% | 2.49% | 18.54% |
| $8.85 | (1.08)% | $ 1.8 | 0.70% | 2.57% | 0.87% | 2.40% | 47.73% |
| $9.18 | 0.28% | $ 3.3 | 0.71% (7) | 2.25% | 0.85% (7) | 2.11% | 35.10% |
| $9.39 | 5.32% | $ 2.0 | 0.70% | 2.38% | 0.93% | 2.15% | 35.88% |
| $9.35 | (1.08)% (4) | $74.5 | 0.30% (5) | 2.25% (5) | 0.62% (5) | 1.93% (5) | 12.46% (4) |
| $9.60 | 6.07% | $85.6 | 0.48% (8) | 2.41% | 0.65% | 2.24% | 20.59% |
| $9.26 | 6.85% | $83.4 | 0.50% | 2.91% | 0.73% | 2.68% | 18.54% |
| $8.92 | (0.85)% | $89.7 | 0.50% | 2.78% | 0.68% | 2.60% | 47.73% |
| $9.25 | 0.71% | $97.9 | 0.51% (7) | 2.45% | 0.66% (7) | 2.30% | 35.10% |
| $9.44 | 5.43% | $97.2 | 0.50% | 2.58% | 0.72% | 2.36% | 35.88% |
| $9.36 | (0.33)% (4) | $ —(9) | 0.30% (5) | 3.49% (5) | 0.30% (5) | 3.49% (5) | 12.46% (4) |
| $9.60 | 6.89% | $ —(9) | 0.30% (10) | 3.19% | 0.30% | 3.19% | 20.59% |
| $9.26 | 7.40% | $ —(9) | 0.35% | 0.97% | 0.35% | 0.97% | 18.54% |
| $8.93 | 0.04% (12) | $—(9) | 0.35% (5) | 0.69% (5) | 0.35% (5) | 0.69% (5) | 47.73% (4) |
| A. | Repurchase Agreements. Each Fund may enter into repurchase agreements with government securities dealers recognized by the Federal Reserve Board, with member banks of the Federal Reserve System or with other brokers or dealers that meet the credit guidelines established by the Board of Trustees. Each Fund will always receive and maintain, as collateral, U.S. Government securities whose market value, including accrued interest (which is recorded in the Schedules of Investments), will be at least equal to 100% of the dollar amount invested by the Fund in each agreement, and the Fund will make payment for such securities only upon physical delivery or upon evidence of book entry transfer to the account of the Fund’s custodian. If the term of any repurchase transaction exceeds one business day, the value of the collateral is marked-to-market on a daily basis to ensure the adequacy of the collateral. Before causing a Fund to enter into a repurchase agreement with any other party, the investment advisor will determine that such party does not have any apparent risk of becoming involved in bankruptcy proceedings within the time frame contemplated by the repurchase agreement. If the seller defaults and the value of the collateral declines, or if bankruptcy proceedings are commenced with respect to the seller of the security, realization of the collateral by the Fund may be delayed or limited. At March 31, 2021, the Funds did not invest in repurchase agreements. |
| B. | Foreign Currency Translation and Transactions. Values of investments denominated in foreign currencies are converted into U.S. dollars using the spot market rates of exchange at the time of valuation. Purchases and sales of investments and dividend and interest income are translated into U.S. dollars using the spot market rates of exchange prevailing on the respective dates of such translations. The gain or loss resulting from changes in foreign exchange rates is included with net realized and unrealized gain or loss from investments, as appropriate. Foreign securities and currency transactions may involve certain considerations and risks not typically associated with those of domestic origin. |
| Foreign securities are recorded in the financial statements after translation to U.S. dollars based on the applicable exchange rate at the end of the period. The Funds report certain foreign currency-related transactions as components of realized gains or losses for financial reporting purposes, whereas such components are treated as ordinary income for federal income tax purposes. | |
| C. | Delayed Delivery Securities. The Funds may purchase securities on a when issued or delayed delivery basis. “When-issued” or delayed delivery refers to |
| securities whose terms are available and for which a market exists, but that have not been issued. For a when-issued or delayed delivery transaction, no payment is made until delivery date, which is typically longer than the normal course of settlement. When a Fund enters into an agreement to purchase securities on a when-issued or delayed delivery basis, the Fund segregates cash or liquid securities, of any type or maturity, equal in value to the Fund’s commitment. Losses may arise if the market value of the underlying securities changes, if the counterparty does not perform under the contract, or if the issuer does not issue the securities due to political, economic, or other factors. The Funds did not have any open commitments on delayed delivery securities as of March 31, 2021. | |
| D. | Participatory Notes. The International, Global, Emerging Markets, International Small Cap and Small Cap Value Funds may invest in participatory notes. Participatory notes are derivative securities which are designed to provide synthetic exposure to one or more underlying securities, subject to the credit risk of the issuing financial institution. |
| Investments in participatory notes involve risks normally associated with a direct investment in the underlying securities. In addition, participatory notes are subject to counterparty risk, which is the risk that the broker-dealer or bank that issues the notes will not fulfill its contractual obligation to complete the transaction with the Trust. Participatory notes constitute general unsecured, unsubordinated contractual obligations of the banks or broker-dealers that issue them and generally are issued as an actual note from the financial intermediary or an equity linked warrant (commonly known as a low exercise price option). The Trust is relying on the creditworthiness of such banks or broker-dealers and has no rights under a participatory note against the issuer of the securities underlying such participatory note. The investment advisor has established guidelines for monitoring participatory note exposure for the Funds. Prior to investment in a participatory note, the investment advisor will complete an analysis of the prospective counterparties and once purchased, will continue to monitor creditworthiness on a quarterly basis. The investment advisor requires a minimum credit rating for such counterparties (as determined by rating agencies such as Moody’s, Fitch and S&P) of A. | |
| The Funds record counterparty credit risk valuation adjustments, if material, on the participatory notes in order to appropriately reflect the credit quality of the counterparty. | |
| The International, Global, International Small Cap and Small Cap Value Funds did not invest in any participatory notes at March 31, 2021. The Emerging Markets Fund invested in one participatory note with HSBC Bank Plc, an investment vehicle that provides an alternate means to gain exposure to the underlying security of China South Publishing & Media Group Co. Ltd, |
| which was held from the beginning of the fiscal year through the end of the period. The average monthly market value of this security was $6,407,592 during the period. There was no realized gain or loss in participatory notes recognized by the Emerging Markets Fund for the period ended March 31, 2021. The market value of China South Publishing & Media Group Co. Plc on March 31, 2021 was $5,189,166 and can be found in the Emerging Markets Fund’s Schedule of Investments. | |
| E. | Investment Transactions, Dividends and Distributions. Investment transactions are accounted for on the trade dates. Realized gains and losses are evaluated on the basis of identified costs. Dividend income and distributions to shareholders are recorded on the ex-dividend dates. Interest is recorded on an accrual basis. Withholding taxes on foreign dividends and capital gains, which are included as a component of net investment income and realized gain (loss) on investments, respectively, have been provided for in accordance with the Trust’s understanding of the applicable country’s tax rules and rates. Each Fund’s investment income, expenses, other than class specific expenses, and realized and unrealized gains and losses are allocated daily to each class of the Fund’s shares based upon the relative net asset values of outstanding shares of each class of shares at the beginning of the day (after adjusting for the current capital shares activity of the respective class). Expenses common to the Funds’ portfolios are allocated among the Funds based upon their relative net asset values or other appropriate allocation methods. The Funds amortize premiums and accrete discounts using the constant yield method. |
| F. | Concentration of Risk. As of March 31, 2021, the International, Global, Emerging Markets and International Small Cap Funds held significant portions of their assets in foreign securities. Certain price and foreign exchange fluctuations as well as economic and political situations in the foreign jurisdictions could have an impact on the International, Global, Emerging Markets and International Small Cap Funds’ net assets. The investment advisor monitors these off-balance sheet risks. |
| G. | Use of Estimates. The preparation of financial statements in conformity with GAAP requires management to make estimates and assumptions that affect the reported amounts of assets and liabilities at the date of the financial statements and reported amounts of income and expenses during the reporting period. Actual results could differ from those estimates and assumptions. |
| H. | Securities Lending. The Funds may lend their portfolio securities to banks, brokers and dealers. Lending Fund securities exposes the Fund to risks such as the following: (i) the borrower may fail to return the loaned securities, (ii) |
| the borrower may not be able to provide additional collateral, or (iii) the Funds may experience delays in recovery of the loaned securities or loss of rights in the collateral if the borrower fails financially. | |
| To minimize these risks, the borrower must agree to maintain collateral with the Fund’s custodian, marked to market daily, in the form of U.S. Government obligations, in an amount at least equal to 102% (105% in the case of loans of foreign securities not denominated in U.S. dollars) of the market value of the loaned securities. As of March 31, 2021, the Emerging Markets Fund, Small Cap Value Fund and Core Plus Fund did not have any securities on loan. The International Fund, Global Fund and International Small Cap Fund did not have any securities on loan as of March 31, 2021, but had activity during the period. Non-cash collateral received by the Fund may not be sold or re-pledged except to satisfy a borrower default. Therefore, non-cash collateral is not included on the Fund’s Schedule of Investments or Statement of Assets and Liabilities. | |
| I. | Indemnification Obligations. Under the Trust’s organizational documents, its current and former officers and trustees are indemnified against certain liabilities arising out of the performance of their duties to the Trust. The Trust has indemnified its trustees against any expenses actually and reasonably incurred by the trustees in any proceeding arising out of or in connection with the trustees’ service to the Trust. In addition, in the normal course of business, the Trust enters into contracts that contain a variety of representations and warranties and provide general indemnifications. The Funds' maximum exposure under these arrangements is unknown as this would involve future claims that may be made against the Funds that have not yet occurred or that would be covered by other parties. |
| J. | Accounting for Uncertainty in Income Taxes. Each Fund has elected to be taxed as a “regulated investment company” and intends to distribute substantially all its taxable income to its shareholders and otherwise comply with the provisions of the Internal Revenue Code applicable to regulated investment companies. The Funds may be subject to a nondeductible excise tax calculated as a percentage of certain undistributed amounts of net investment income and net capital gains. The Funds intend to distribute their net investment income and capital gains as necessary to avoid this excise tax. Therefore, no provision for federal income taxes or excise taxes has been made. |
| The Trust analyzes all open tax years, as defined by the applicable statute of limitations, for all major jurisdictions. Open tax years for the Funds are those that are open for exam by taxing authorities (2017 through 2020). As of March 31, 2021 the Trust has no examinations in progress. |
| Management has analyzed the Trust’s tax positions, and has concluded that no liability should be recorded related to uncertain tax positions expected to be taken on the tax return for the fiscal year-ended September 30, 2020. | |
| The Trust identifies its major tax jurisdictions as the U.S. Government and the State of California. The Funds are not aware of any tax positions for which it is reasonably possible that the total amounts of unrecognized tax benefits will significantly change in the next twelve months. | |
| K. | Fair Value Measurements. The Trust has adopted GAAP accounting principles related to fair value accounting standards which establish a definition of fair value and set out a hierarchy for measuring fair value. These standards require additional disclosures about the various inputs and valuation techniques used to develop the measurements of fair value and a discussion of changes in valuation techniques and related inputs during the period. These inputs are summarized in the three broad levels listed below: |
| Level 1—Fair value measurement within Level 1 should be based on an unadjusted quoted price in an active market that the Funds have the ability to access for the asset or liability at the measurement date. Because a quoted price alone forms the basis for the measurement, the access requirement within Level 1 limits discretion in pricing the asset or liability, including in situations in which there are multiple markets for the asset or liability with different prices and no single market represents a principal market for the asset or liability. Importantly, the FASB has indicated that when a quoted price in an active market for a security is available, that price should be used to measure fair value without regard to an entity’s intent to transact at that price. | |
| Level 2—Fair value measurement within Level 2 should be based on all inputs other than unadjusted quoted prices included within Level 1 that are observable for the asset or liability. Other significant observable market inputs include quoted prices for similar instruments in active markets, quoted adjusted prices in active markets, quoted prices for identical or similar instruments in markets that are not active, and model derived valuations in which the majority of significant inputs and significant value drivers are observable in active markets. | |
| Level 3—Fair value measurement within Level 3 should be based on unobservable inputs in such cases where markets do not exist or are illiquid. Significant unobservable inputs include model derived valuations in which the majority of significant inputs or significant value drivers are unobservable. Unobservable inputs are those inputs that reflect the Fund’s own assumptions that market participants would use to price the asset or liability based on the best available information. |
| L. | Security Valuation. Common and preferred stocks, exchange-traded funds and financial derivative instruments, such as futures contracts and options contracts that are traded on a national securities or commodities exchange, are valued at the last reported sales price at the close of regular trading on each day the exchange is open for trading, in the case of common stocks and exchange-traded funds, or, in the case of futures contracts or options contracts, the settlement price determined by the relevant exchange. Securities listed on the NASDAQ National Market System for which market quotations are readily available are valued using the NASDAQ Official Closing Price. To the extent these securities are actively traded and valuation adjustments are not applied, they are categorized as Level 1 of the fair value hierarchy. |
| Equity securities traded on an exchange for which there have been no sales on the valuation date are generally valued at the mean between last bid and ask price on such day and are categorized as Level 2 of the fair value hierarchy, or are fair valued by the Fair Valuation Committee. | |
| Investments in registered open-end management investment companies are valued based upon the Net Asset Values (“NAVs”) of such investments and are categorized as Level 1 of the fair value hierarchy. | |
| Valuation adjustments may be applied to certain common and preferred stocks that are solely traded on a foreign exchange to account for the market movement between the close of the foreign market and the close of the New York Stock Exchange (“NYSE”). These securities are generally valued using pricing service providers that consider the correlation of the trading patterns of the foreign securities to the intraday trading in the U.S. markets for investments. Securities using these valuation adjustments are categorized as Level 2 of the fair value hierarchy. As of March 31, 2021, the International Fund, Global Fund, Emerging Markets Fund and International Small Cap Fund had securities with market values of $530,029,599, $19,688,027, $831,227,418 and $228,066,788 that represent 86.05%, 48.18%, 62.60%, and 58.77% of each Fund’s net assets, respectively, that were fair valued using these valuation adjustments. | |
| Fixed income securities (other than repurchase agreements and demand notes) including corporate, convertible and municipal bonds and notes, U.S. government agencies, U.S. Treasury obligations, sovereign issues, bank loans, convertible preferred securities, fixed income securities purchased on a delayed delivery basis and non-U.S. bonds are normally valued on the basis of quotes obtained from brokers and dealers or independent pricing services or sources. Independent pricing services typically use information provided by market makers or estimates of market values obtained from yield data relating to investments or securities with similar characteristics. The service providers’ |
| internal models use inputs that are observable such as, among other things, issuer details, interest rates, yield curves, prepayment speeds, credit risks/ spreads, default rates and quoted prices for similar assets. Securities that use similar valuation techniques and inputs as described above are categorized as Level 2 of the fair value hierarchy. | |
| Rights that are traded on a national securities exchange are valued at the last reported sales price at the close of regular trading on each day the exchange is open. A right is a privilege offered by a corporation to its shareholders pro rata to subscribe to a certain security at a specified price, often for a short period. Rights may or may not be transferable. | |
| Mortgage and asset-backed securities are usually issued as separate tranches, or classes, of securities within each package of underlying securities. These securities are also normally valued by pricing service providers that use broker-dealer quotations or valuation estimates from their internal pricing models. The pricing models for these securities usually consider tranche level attributes, estimated cash flows and market based yield spreads for each tranche, and current market data and incorporate packaged collateral performance, as available. Mortgage and asset-backed securities that use such valuation techniques and inputs are categorized as Level 2 of the fair value hierarchy. | |
| Repurchase agreements and demand notes, for which neither vendor pricing nor market maker prices are available, are valued at amortized cost on the day of valuation, unless Brandes Investment Partners, L.P. (the “Advisor”) determines that the use of amortized cost valuation on such day is not appropriate (in which case such instrument is fair valued in accordance with the fair value procedures of the Trust). | |
| Certain securities may be fair valued in accordance with the fair valuation procedures approved by the Board of Trustees. The Fair Valuation Committee is generally responsible for overseeing the day-to-day valuation processes and reports periodically to the Board. The Fair Valuation Committee is authorized to make all necessary determinations of the fair value of portfolio securities and other assets for which market quotations are not readily available or if it is deemed that the prices obtained from brokers and dealers or independent pricing services are unreliable. The securities fair valued by the Fair Valuation Committee are indicated in the Schedules of Investments and are categorized as Level 2 or Level 3 of the fair value hierarchy. Certain vendor priced securities may also be considered Level 3 if significant unobservable inputs are used by the vendors. |
| In using fair value pricing, each Fund attempts to establish the price that it might reasonably have expected to receive upon a sale of the security at 4:00 p.m. Eastern time. Valuing securities at fair value involves greater reliance on judgment than valuation of securities based on readily available market quotations. A Fund using fair value to price securities may value those securities higher or lower than another fund using market quotations or fair value to price the same securities. Further, there can be no assurance that the Fund could obtain the fair value assigned to a security if it were to sell the security at approximately the time at which the Fund determines its net asset value. |
| Description | Level 1 | Level 2 | Level 3 | Total | ||||
| Investments in Securities | ||||||||
| International Fund | ||||||||
Common Stocks | ||||||||
Communication Services | $ 9,037,500 | $ 55,831,543 | $ — | $ 64,869,043 | ||||
Consumer Discretionary | — | 55,610,519 | — | 55,610,519 | ||||
Consumer Staples | 17,340,606 | 84,859,467 | — | 102,200,073 | ||||
Energy | 4,270,065 | 42,425,547 | — | 46,695,612 | ||||
Financials | — | 113,913,456 | — | 113,913,456 | ||||
Health Care | — | 86,459,936 | — | 86,459,936 | ||||
Industrials | 9,263,724 | 23,039,168 | — | 32,302,892 | ||||
Materials | 9,855,524 | 36,765,047 | — | 46,620,571 | ||||
Real Estate | 15,089,504 | — | — | 15,089,504 | ||||
Technology | — | 6,310,601 | — | 6,310,601 | ||||
Utilities | — | 11,492,492 | — | 11,492,492 | ||||
Total Common Stocks | 64,856,923 | 516,707,776 | — | 581,564,699 | ||||
Preferred Stocks | ||||||||
Energy | 18,327,346 | — | — | 18,327,346 | ||||
Health Care | — | 13,321,823 | — | 13,321,823 | ||||
Total Preferred Stocks | 18,327,346 | 13,321,823 | — | 31,649,169 | ||||
Short-Term Investments | 6,524,877 | — | — | 6,524,877 | ||||
Total Investments in Securities | $ 89,709,146 | $530,029,599 | $ — | $ 619,738,745 |
| Description | Level 1 | Level 2 | Level 3 | Total | ||||
| Global Fund | ||||||||
Common Stocks | ||||||||
Communication Services | $ 675,293 | $ 1,725,177 | $ — | $ 2,400,470 | ||||
Consumer Discretionary | 739,624 | 3,929,619 | — | 4,669,243 | ||||
Consumer Staples | 792,532 | 2,936,416 | — | 3,728,948 | ||||
Energy | 812,390 | 2,689,120 | — | 3,501,510 | ||||
Financials | 7,237,068 | 2,615,187 | — | 9,852,255 | ||||
Health Care | 6,170,288 | 2,149,788 | — | 8,320,076 | ||||
Industrials | 2,678,176 | 465,536 | — | 3,143,712 | ||||
Materials | 528,671 | 1,444,141 | — | 1,972,812 | ||||
Real Estate | 704,952 | — | — | 704,952 | ||||
Technology | 122,482 | 733,647 | — | 856,129 | ||||
Utilities | — | 800,428 | — | 800,428 | ||||
Total Common Stocks | 20,461,476 | 19,489,059 | — | 39,950,535 | ||||
Preferred Stocks | ||||||||
Technology | — | 198,968 | — | 198,968 | ||||
Short-Term Investments | 1,039,632 | — | — | 1,039,632 | ||||
Total Investments in Securities | $ 21,501,108 | $ 19,688,027 | $ — | $ 41,189,135 | ||||
| Emerging Markets Fund | ||||||||
Common Stocks | ||||||||
Communication Services | $ 74,562,961 | $127,422,535 | $ — | $ 201,985,496 | ||||
Consumer Discretionary | 18,506,534 | 195,295,383 | — | 213,801,917 | ||||
Consumer Staples | 43,982,117 | 61,199,466 | — | 105,181,583 | ||||
Energy | 9,929,674 | 26,516,511 | — | 36,446,185 | ||||
Financials | 42,296,761 | 176,508,484 | — | 218,805,245 | ||||
Health Care | — | 39,624,124 | — | 39,624,124 | ||||
Industrials | 80,616,056 | 10,544,879 | — | 91,160,935 | ||||
Materials | 30,122,737 | 44,792,670 | — | 74,915,407 | ||||
Real Estate | 62,968,914 | — | — | 62,968,914 | ||||
Technology | — | 187,111,489 | — | 187,111,489 | ||||
Utilities | 13,905,685 | 22,269,465 | — | 36,175,150 | ||||
Total Common Stocks | 376,891,439 | 891,285,006 | — | 1,268,176,445 | ||||
Preferred Stocks | ||||||||
Energy | 38,889,677 | 1,143,500 | — | 40,033,177 | ||||
Participatory Notes | ||||||||
Communication Services | — | 5,189,166 | — | 5,189,166 | ||||
Short-Term Investments | 12,063,445 | — | — | 12,063,445 | ||||
Total Investments in Securities | $427,844,561 | $897,617,672 | $ — | $1,325,462,233 |
| Description | Level 1 | Level 2 | Level 3 | Total | ||||
| International Small Cap Fund | ||||||||
Common Stocks | ||||||||
Communication Services | $ 917,451 | $ 20,250,691 | $ — | $ 21,168,142 | ||||
Consumer Discretionary | 16,895,874 | 24,024,668 | — | 40,920,542 | ||||
Consumer Staples | 16,244,864 | 56,579,235 | — | 72,824,099 | ||||
Energy | 7,287,189 | 5,495,932 | — | 12,783,121 | ||||
Financials | 14,082,953 | 54,161,786 | — | 68,244,739 | ||||
Health Care | 8,279,977 | 9,953,674 | — | 18,233,651 | ||||
Industrials | 38,423,526 | 38,021,518 | — | 76,445,044 | ||||
Materials | 3,317,058 | 12,798,748 | — | 16,115,806 | ||||
Real Estate | 28,007,738 | — | — | 28,007,738 | ||||
Technology | 5,840,619 | 9,134,925 | — | 14,975,544 | ||||
Utilities | 2,274,056 | 3,483,962 | — | 5,758,018 | ||||
Total Common Stocks | 141,571,305 | 233,905,139 | — | 375,476,444 | ||||
Preferred Stocks | ||||||||
Health Care | 6,115,035 | — | — | 6,115,035 | ||||
Short-Term Investments | 7,968,459 | — | — | 7,968,459 | ||||
Total Investments in Securities | $155,654,799 | $233,905,139 | $ — | $ 389,559,938 | ||||
| Small Cap Value Fund | ||||||||
Common Stocks | ||||||||
Communication Services | $ 27,219 | $ — | $ — | $ 27,219 | ||||
Consumer Discretionary | 92,202 | — | — | 92,202 | ||||
Consumer Staples | 170,679 | — | — | 170,679 | ||||
Energy | 213,011 | — | — | 213,011 | ||||
Financials | 276,749 | — | — | 276,749 | ||||
Health Care | 416,380 | — | 28,425 | 444,805 | ||||
Industrials | 465,454 | — | — | 465,454 | ||||
Real Estate | 65,858 | — | — | 65,858 | ||||
Technology | 175,170 | — | — | 175,170 | ||||
Utilities | 48,884 | — | — | 48,884 | ||||
Total Common Stocks | 1,951,606 | — | 28,425 | 1,980,031 | ||||
Corporate Bonds | — | 26,692 | — | 26,692 | ||||
Warrants | 26,164 | — | — | 26,164 | ||||
Short-Term Investments | 253,314 | — | — | 253,314 | ||||
Total Investments in Securities | $ 2,231,084 | $ 26,692 | $28,425 | $ 2,286,201 |
| Description | Level 1 | Level 2 | Level 3 | Total | ||||
| Core Plus Fund | ||||||||
Common Stocks | ||||||||
Consumer Discretionary | $ 627 | $ — | $ — | $ 627 | ||||
Asset Backed Securities | — | 1,424,707 | — | 1,424,707 | ||||
Corporate Bonds | — | 29,491,965 | — | 29,491,965 | ||||
Government Securities | — | 37,357,375 | — | 37,357,375 | ||||
Mortgage Backed Securities | — | 5,884,631 | — | 5,884,631 | ||||
Warrants | 90,955 | — | — | 90,955 | ||||
Short-Term Investments | 1,453,280 | — | — | 1,453,280 | ||||
Total Investments in Securities | $ 1,544,862 | $ 74,158,678 | $ — | $ 75,703,540 |
| A. | Advisor Fee. The Advisor provides the Funds with investment management services under an Investment Advisory Agreement. The Advisor furnishes all investment advice, office space and certain administrative services, and provides certain personnel, needed by the Funds. As compensation for its services, the Advisor is entitled to a monthly fee. The Advisor received a monthly fee at the annual rate of 0.75% of the first $2.5 billion of average daily net assets, 0.70% on average daily net assets from $2.5 billion to $5.0 billion, and 0.67% of the average daily net assets greater than $5.0 billion, of the International Fund. The Advisor received a monthly fee at the annual rate of 0.95% of the first $2.5 billion of average daily net assets, 0.90% on average daily net assets from $2.5 billion to $5.0 billion, and 0.85% of the amount of average daily net assets greater than $5.0 billion, of the Emerging Markets Fund. The Advisor received a monthly fee at the annual rate of 0.95% of the first $1.0 billion of average daily net assets, and 0.90% of the average daily net assets greater than $1.0 billion, of the International Small Cap Fund. The Global Fund, Small Cap Value Fund and Core Plus Fund incurred a monthly fee at the annual rate of 0.80%, 0.70%, and 0.35% based upon their average daily net assets, respectively. The Advisor has contractually agreed to limit the Management Fee of each share class of the Core Plus Fund to 0.30% pursuant to an Investment Advisory Fee Waiver Agreement in effect until January 28, 2022. For the six months ended March 31, 2021, the International Fund, the Global Fund, the Emerging Markets Fund, the International |
| Small Cap Fund, the Small Cap Value Fund and the Core Plus Fund incurred $2,044,566, $144,372, $5,855,843, $1,755,521, $4,127, and $143,982 in advisory fees, respectively. | |
| Certain officers and trustees of the Trust are also officers of the Advisor and receive no compensation directly from the Funds for serving in their role. | |
| The Funds are responsible for their own operating expenses. The Advisor contractually agreed to limit each Fund’s annual operating expenses, including repayment of previous waivers, to the following percentages of the Fund’s average daily net assets attributable to the specific classes through January 31, 2021, except for the Core Plus Fund Class A and Class I which is through January 28, 2022 (the “Expense Cap Agreement”): |
| Fund | Class A | Class C | Class I | Class R6 | ||||
International Fund | 1.20% | 1.95% | 0.85% | 0.75% | ||||
Global Fund | 1.25% | 2.00% | 1.00% | 0.82%* | ||||
Emerging Markets Fund | 1.37% | 2.12% | 1.12% | 0.97% | ||||
International Small Cap Fund | 1.40% | 2.15% | 1.15% | 1.00% | ||||
Small Cap Value Fund | 1.15% | N/A | 0.90% | 0.72% | ||||
Core Plus Fund | 0.50% | N/A | 0.30% | 0.30% |
| Fund | Six Months Ended September 30, 2021 | Year Ended September 30, 2022 | Year Ended September 30, 2023 | Six Months Ended March 31, 2024 | ||||
International Fund | $ 11,337 | $202,211 | $464,613 | $165,818 | ||||
Global Fund | 69,116 | 171,380 | 112,731 | 43,939 | ||||
Emerging Markets Fund | 217,245 | 352,747 | 126,168 | 29,705 | ||||
International Small Cap Fund | 23,133 | 58,771 | 25,918 | 4,589 | ||||
Small Cap Value Fund | 111,254 | 198,545 | 148,291 | 48,402 | ||||
Core Plus Fund | 93,559 | 192,970 | 136,785 | 109,447 |
| Fund | Class I | |
Emerging Markets Fund | $66,402 | |
International Small Cap Fund | 14,808 |
| B. | Administration Fee. The Northern Trust Company (the “Administrator”) acts as administrator for the Funds. The Administrator prepares various federal and state regulatory filings; prepares reports and materials to be supplied to the Trustees; monitors the activities of the Funds’ custodian, transfer agent and accountant; coordinates the preparation and payment of Fund expenses; and reviews the Funds’ expense accruals. For these services, each Fund pays the administrator monthly a fee accrued daily and based on the Fund’s average daily net assets. The Funds may also reimburse the Administrator for out-of-pocket expenses incurred by the Administrator in the performance of its duties. The amounts paid directly to the Administrator by the Funds for administrative services are included in the Administration fees in the Statements of Operations. |
| The Administrator has agreed to waive a portion of their administration and custody fees for the Funds for a period of two years from February 1, 2020 through January 31, 2022. The amounts waived are included in Expenses reduced by Service Providers in the Statements of Operations and are not subject to recoupment. | |
| C. | Distribution and Servicing Fees. ALPS Distributors, LLC (the “Distributor”), a registered broker-dealer, acts as the Funds’ principal underwriter in a continuous public offering of the Funds’ shares. A portion of the Funds’ distribution expenses is paid by the Advisor. |
| The Funds have adopted a Distribution Plan (the “Plan”) pursuant to Rule 12b-1 under the Investment Company Act of 1940 for the Funds’ Class A and C shares. The Plan is designed to reimburse the Distributor or dealers for certain promotional and other sales related costs associated with |
| sales of such Fund shares. Unreimbursed amounts may be carried forward and paid in a subsequent year, to the extent that total expenses under the Plan do not exceed 0.25% and 0.75% of the average daily net assets of each Fund’s Class A and C shares, respectively. During the six months ended March 31, 2021, the Funds paid to the Distributor and each dealer a monthly fee at the annual rate of 0.25% of the average daily net assets of Class A shares and 0.75% of the average daily net assets of Class C shares beneficially owned by the Distributor’s and each dealer’s existing brokerage clients. The Plan may be continued in effect from year to year if such continuance is approved annually by the Board of Trustees of the Trust, including the vote of a majority of the Independent Trustees. For the six months ended March 31, 2021, the following Funds incurred expenses pursuant to the Plan: |
| Fund | Class A | Class C | ||
International Fund | $ 31,557 | $32,353 | ||
Global Fund | 878 | 3,076 | ||
Emerging Markets Fund | 254,991 | 45,646 | ||
International Small Cap Fund | 69,608 | 18,612 | ||
Small Cap Value Fund | 96 | N/A | ||
Core Plus Fund | 1,601 | N/A |
| Fund | Class C | Class I | ||
International Fund | $10,784 | $114,400 | ||
Global Fund | 1,026 | 8,643 | ||
Emerging Markets Fund | 15,215 | 236,746 | ||
International Small Cap Fund | 6,204 | 74,238 | ||
Small Cap Value Fund | N/A | 275 | ||
Core Plus Fund | N/A | 20,249 |
| U.S. Government | Other | |||||||
| Fund | Purchases | Sales | Purchases | Sales | ||||
International Fund | $ — | $ — | $ 94,738,226 | $103,252,917 | ||||
Global Fund | $ — | $ — | $ 4,853,255 | $ 5,167,374 | ||||
Emerging Markets Fund | $ — | $ — | $220,995,280 | $227,895,879 | ||||
International Small Cap Fund | $ — | $ — | $ 40,815,579 | $ 87,075,979 | ||||
Small Cap Value Fund | $ — | $ — | $ 1,474,883 | $ 354,832 | ||||
Core Plus Fund | $9,785,293 | $19,212,048 | $ — | $ — | ||||
| International Fund | Global Fund | ||||||||||||||
| Six Months Ended 3/31/2021 | Year Ended 9/30/2020 | Six Months Ended 3/31/2021 | Year Ended 9/30/2020 | ||||||||||||
| Shares | Amount | Shares | Amount | Shares | Amount | Shares | Amount | ||||||||
| Shares Sold | |||||||||||||||
Class A | 129 | $ 2,102 | 517 | $ 7,187 | 1 | $ 17 | 7 | $ 152 | |||||||
Class C | 35 | 592 | 77 | 1,090 | — | — | 1 | 25 | |||||||
Class I | 5,502 | 91,712 | 13,849 | 199,257 | 135 | 2,920 | 37 | 726 | |||||||
Class R6 | 299 | 4,946 | 1,937 | 30,919 | N/A | N/A | N/A | N/A | |||||||
| Issued on Reinvestment of Distributions | |||||||||||||||
Class A | 11 | 190 | 44 | 617 | 1 | 15 | 1 | 23 | |||||||
Class C | 2 | 40 | 14 | 191 | 1 | 16 | 1 | 11 | |||||||
Class I | 221 | 3,893 | 877 | 12,347 | 35 | 848 | 33 | 637 | |||||||
Class R6 | 26 | 453 | 90 | 1,236 | N/A | N/A | N/A | N/A | |||||||
| Shares Redeemed | |||||||||||||||
Class A | (247) | (4,029) | (926) | (13,330) | (21) | (405) | (29) | (543) | |||||||
Class C | (68) | (1,085) | (348) | (4,819) | (3) | (55) | (20) | (413) | |||||||
Class I | (5,991) | (94,796) | (23,848) | (328,952) | (139) | (3,024) | (125) | (2,578) | |||||||
Class R6 | (810) | (13,491) | (747) | (11,269) | N/A | N/A | N/A | N/A | |||||||
Net Increase/(Decrease) Resulting from Fund Share Transactions | (891) | $ (9,473) | (8,464) | $(105,526) | 10 | $ 332 | (94) | $(1,960) | |||||||
| Emerging Markets Fund | International Small Cap Fund | ||||||||||||||
| Six Months Ended 3/31/2021 | Year Ended 9/30/2020 | Six Months Ended 3/31/2021 | Year Ended 9/30/2020 | ||||||||||||
| Shares | Amount | Shares | Amount | Shares | Amount | Shares | Amount | ||||||||
| Shares Sold | |||||||||||||||
Class A | 1,179 | $ 9,870 | 12,328 | $ 86,647 | 1,816 | $ 17,310 | 1,887 | $ 17,065 | |||||||
Class C | 66 | 570 | 131 | 1,089 | 7 | 74 | 62 | 536 | |||||||
Class I | 20,409 | 172,214 | 55,592 | 403,667 | 1,831 | 20,266 | 8,571 | 77,529 | |||||||
Class R6 | 4,353 | 32,996 | 1,974 | 14,767 | 71 | 796 | 303 | 2,798 | |||||||
| Issued on Reinvestment of Distributions | |||||||||||||||
Class A | — | — | 512 | 3,895 | 18 | 200 | 20 | 191 | |||||||
Class C | — | — | 25 | 200 | 1 | 15 | 3 | 29 | |||||||
Class I | — | — | 2,773 | 21,237 | 102 | 1,189 | 270 | 2,491 | |||||||
Class R6 | — | — | 139 | 1,065 | 4 | 52 | 13 | 120 | |||||||
| Shares Redeemed | |||||||||||||||
Class A | (1,360) | (11,409) | (15,590) | (111,643) | (559) | (6,034) | (2,323) | (21,923) | |||||||
Class C | (294) | (2,479) | (682) | (5,144) | (87) | (931) | (256) | (2,455) | |||||||
Class I | (23,860) | (194,597) | (70,044) | (492,196) | (6,193) | (72,366) | (21,459) | (210,550) | |||||||
Class R6 | (1,528) | (13,116) | (2,116) | (14,838) | (177) | (2,069) | (1,191) | (9,760) | |||||||
Net Increase/(Decrease) Resulting from Fund Share Transactions | (1,035) | $ (5,951) | (14,958) | $ (91,254) | (3,166) | $(41,498) | (14,100) | $(143,929) | |||||||
| Small Cap Value Fund | Core Plus Fund | ||||||||||||||
| Six Months Ended 3/31/2021 | Year Ended 9/30/2020 | Six Months Ended 3/31/2021 | Year Ended 9/30/2020 | ||||||||||||
| Shares | Amount | Shares | Amount | Shares | Amount | Shares | Amount | ||||||||
| Shares Sold | |||||||||||||||
Class A | 20 | $ 246 | 2 | $ 20 | 42 | $ 402 | 42 | $ 420 | |||||||
Class C | N/A | N/A | N/A | N/A | N/A | N/A | N/A | N/A | |||||||
Class I | 103 | 1,173 | 13 | 105 | 1,255 | 11,968 | 1,315 | 12,389 | |||||||
Class R6 | — | — | —* | —* | — | — | —* | —* | |||||||
| Issued on Reinvestment of Distributions | |||||||||||||||
Class A | —* | 1 | —* | —* | 2 | 15 | 4 | 32 | |||||||
Class C | N/A | N/A | N/A | N/A | N/A | N/A | N/A | N/A | |||||||
Class I | 2 | 18 | —* | 3 | 131 | 1,248 | 200 | 1,882 | |||||||
Class R6 | —* | —* | —* | —* | —* | —* | —* | —* | |||||||
| Shares Redeemed | |||||||||||||||
Class A | — | — | —* | (1) | (55) | (522) | (267) | (2,446) | |||||||
Class C | N/A | N/A | N/A | N/A | N/A | N/A | N/A | N/A | |||||||
Class I | (7) | (80) | (7) | (63) | (2,337) | (22,295) | (1,602) | (15,042) | |||||||
Class R6 | — | — | —* | —* | — | — | —* | —* | |||||||
Net Increase/(Decrease) Resulting from Fund Share Transactions | 118 | $1,358 | 8 | $ 64 | (962) | $ (9,184) | (308) | $ (2,765) | |||||||
| * | Value calculated is less than 500 shares/dollars. |
| Undistributed Net Investment Income/(Loss) | Accumulated Net Realized Gain/(Loss) | Paid-In Capital | |||
International Fund | $ (151,301) | $ 151,301 | $— | ||
Global Fund | 24,490 | (24,490) | — | ||
Emerging Markets Fund | (418,951) | 418,951 | — | ||
International Small Cap Fund | 1,086,211 | (1,086,211) | — | ||
Small Cap Value Fund | 156 | (156) | — | ||
Core Plus Fund | 136,423 | (136,423) | — |
| International Fund | Global Fund | ||
Cost of investments for tax purposes | $ 657,041,010 | $31,404,923 | |
Gross tax unrealized appreciation | 15,545,170 | 5,107,335 | |
Gross tax unrealized depreciation | (195,202,632) | (6,506,846) | |
Net unrealized appreciation (depreciation) on investments and foreign currency | (179,657,462) | (1,399,511) | |
Distributable ordinary income | — | — | |
Distributable long-term capital gains | — | — | |
Total distributable earnings | — | — | |
Other accumulated gains/(losses) | (70,337,853) | (9,842) | |
Total accumulated earnings | $(249,995,315) | $ (1,409,353) |
| Emerging Markets Fund | International Small Cap Fund | Small Cap Value Fund | Core Plus Fund | ||||
Cost of investments for tax purposes | $1,398,731,893 | $ 423,997,788 | $ 597,334 | $81,407,473 | |||
Gross tax unrealized appreciation | 73,032,583 | 22,569,434 | 53,075 | 7,210,163 | |||
Gross tax unrealized depreciation | (415,131,855) | (137,159,570) | (89,909) | (646,694) | |||
Net unrealized appreciation (depreciation) on investments and foreign currency | (342,099,272) | (114,590,136) | (36,834) | 6,563,469 | |||
Distributable ordinary income | — | 1,249,064 | 5,292 | 314,642 | |||
Distributable long-term capital gains | — | — | — | — | |||
Total distributable earnings | — | 1,249,064 | 5,292 | 314,642 | |||
Other accumulated gains/(losses) | (134,699,938) | (166,596,953) | (166,613) | (3,674,560) | |||
Total accumulated earnings | $ (476,799,210) | $(279,938,025) | $(198,155) | $ 3,203,551 |
| Ordinary Income | Long Term Capital Gains | ||||||
| 2020 | 2019 | 2020 | 2019 | ||||
International Fund | $15,302,823 | $28,827,055 | $— | $ — | |||
Global Fund | 677,847 | 1,021,928 | — | 2,856,903 | |||
Emerging Markets Fund | 28,580,390 | 27,484,796 | — | — | |||
International Small Cap Fund | 2,950,375 | 18,353,209 | — | 9,532,372 | |||
Small Cap Value Fund | 2,844 | 581,016 | — | 165,379 | |||
Core Plus Fund | 1,949,433 | 2,430,949 | — | — | |||
| Indefinite | Utilized | ||
International Fund | $ (69,936,348) | $ — | |
Global Fund | — | (950,950) | |
Emerging Markets Fund | (127,922,186) | — | |
International Small Cap Fund | (166,571,306) | — | |
Small Cap Value Fund | (162,620) | (29,483) | |
Core Plus Fund | (3,674,560) | — |
| International Small Cap Fund | ||||||||||||||
| Issuer Name | Value At October 1, 2020 | Purchases | Sales Proceeds | Realized Gain/(Loss) | Unrealized Appreciation/(Depreciation) | Value At March 31, 2021 | Dividend Income | |||||||
| Desarrolladora Homex SAB de CV | $ 530,904 | $ — | $— | $ — | $(106,991) | $423,913 | $— | |||||||
| Urbi Desarrollos Urbanos SAB de CV | 476,764 | 3,105 | — | (1,197) | (154,945) | 323,727 | — | |||||||
| $1,007,668 | $3,105 | $— | $(1,197) | $(261,936) | $747,640 | $— | ||||||||
| Global Fund | |
| Class I | |
Shares | 334,767 |
% of Total Outstanding Shares | 22.33% |
| Small Cap Value Fund | Core Plus Fund | |||||||
| Class I | Class R6 | Class I | Class R6 | |||||
Shares | 46,359 | 12 | 2,190,726 | 10 | ||||
% of Total Outstanding Shares | 29.33% | 100.00% | 27.51% | 100.00% | ||||
| • | Emerging Markets Value: below median for the one- and three-year periods and since inception, and at median for the five-year period, and underperformed the benchmark for all periods; |
| • | International Equity: below median, and underperformed the benchmark, for one-, three-, five-, and ten-year periods, and above median and outperformed the benchmark since inception; |
| • | International Small Cap Equity: below median, and underperformed the benchmark, for all periods; |
| • | Global Equity: below median, and underperformed the benchmark, for all periods; |
| • | Small Cap Value: above median, and underperformed the benchmark, for the one- year period and since inception; and |
| • | Core Plus Fixed Income: below median, and underperformed the benchmark, for the one-, three- and five-year periods and since inception, and at median, and outperformed the benchmark, for the ten-year period. |
| • | The Funds’ contractual advisory fees are below the median advisory fees of the funds in their respective peer groups with the exception of the Global Equity Fund (where the advisory fee is four basis points above the median). |
| • | The advisory fees charged by the Advisor to comparable institutional and other accounts. The Trustees considered that these fees generally are lower than the fees charged the Funds, and noted the information provided by the Advisor regarding the additional risks, responsibilities and expenses that the Advisor incurs in sponsoring and operating the Funds. |
| • | Total expenses represent the amount actually paid by Fund shareholders. |
| • | All of the Funds are subject to expense caps. |
| • | The Funds’ actual total expenses are below the median total expenses of the funds in their respective peer groups with the exception of the Global Equity Fund (where the actual total expenses fee are six basis points above the median). |
| Name, Address and Age | Position(s) Held with Trust | Term of Office and Length of Time Served(1) | Principal Occupation During Past 5 Years | Number of Trust Series Overseen by Trustee | Other Directorships/Trusteeships Held by Trustee | |||||
| Independent Trustees(2) | ||||||||||
| Gregory Bishop, CFA 11988 El Camino Real, Suite 600 San Diego, CA 92130 (1961) | Trustee | Since January 2017 | Retired. Previously Executive Vice President and Head of Retail Business, PIMCO Investments, from 1997 to 2014 | 7 | None | |||||
| Robert M. Fitzgerald 11988 El Camino Real, Suite 600 San Diego, CA 92130 (1952) | Trustee | Since April 2008 | Retired from 2002-2005 and since 2007; Chief Financial Officer of National Retirement Partners from 2005 to 2007. | 7 | Hotchkis and Wiley Mutual Funds (10 Funds) | |||||
| Craig Wainscott, CFA 11988 El Camino Real, Suite 600 San Diego, CA 92130 (1961) | Trustee and (beginning January 2018) Chairman of the Board | Since February 2012 | Retired from Russell Investments, Managing Director, US Mutual Funds; Currently Partner with The Paradigm Project and advisor to early-stage companies. | 7 | None | |||||
| Name, Address and Age | Position(s) Held with Trust | Term of Office and Length of Time Served(1) | Principal Occupation During Past 5 Years | Number of Trust Series Overseen by Trustee | Other Directorships/Trusteeships Held by Trustee | |||||
| “Interested” Trustees(3) | ||||||||||
| Jeff Busby, CFA 11988 El Camino Real, Suite 600 San Diego, CA 92130 (1961) | Trustee and President | Since July 2006 Since February 2012 | Executive Director of the Advisor since January 2004. | 7 | None | |||||
| Oliver Murray 11988 El Camino Real, Suite 600 San Diego, CA 92130 (1961) | Trustee | Since February 2012 | CEO, Brandes Investment Partners & Co. since 2002; Managing Director -PCPM of the Advisor since 2011. | 7 | None | |||||
| Officers of the Trust | ||||||||||
| Thomas M. Quinlan 11988 El Camino Real, Suite 600 San Diego, CA 92130 (1970) | Secretary | Since June 2003 | Associate General Counsel of the Advisor since January 2006. | N/A | N/A | |||||
| Gary Iwamura, CPA 11988 El Camino Real, Suite 600 San Diego, CA 92130 (1956) | Treasurer | Since September 1997 | Finance Director of the Advisor. | N/A | N/A | |||||
| Roberta Loubier 11988 El Camino Real, Suite 600 San Diego, CA 92130 (1971) | Chief Compliance Officer | Since September 2015 | Global Head of Compliance of the Advisor. | N/A | N/A | |||||
| (1) | Trustees and officers of the Fund serve until their resignation, removal or retirement. |
| (2) | Not “interested persons” of the Trust as defined in the 1940 Act. |
| (3) | “Interested persons” of the Trust as defined in the 1940 Act. Jeff Busby is an interested person of the Trust because he is the President of the Trust and the Executive Director of the Advisor. Oliver Murray is an interested person of the Trust, because he is the Managing Director of the Advisor. |
| • | Information we receive about you on applications or other forms; |
| • | Information you give us orally; and |
| • | Information about your transactions with us. |


| • | enormous central-bank and fiscal accommodation; |
| • | pandemic-related supply chain bottlenecks; |
| • | de-globalization of supply chains in response to pandemic-related disruptions and shortages; |
| • | increasing commodity price pressures; and |
| • | U.S. savings rate near a 60-year high, indicating strong pent-up demand. |
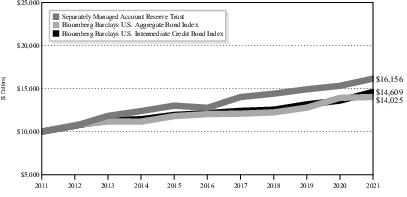
| Average Annual Total Return Periods Ended March 31, 2021(1) | |||||||
| One Year | Five Years | Ten Years | Since Inception | ||||
Brandes Separately Managed Account Reserve Trust | 5.45% | 4.81% | 4.91% | 5.19% | |||
Bloomberg Barclays U.S. Aggregate Bond Index | 0.71% | 3.10% | 3.44% | 4.17% | |||
Bloomberg Barclays U.S. Intermediate Credit Bond Index | 7.39% | 3.75% | 3.86% | 4.54% | |||
| (1) | The inception date is October 3, 2005. |
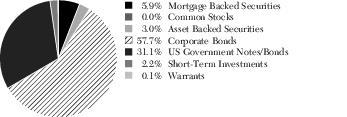
| Fund | Beginning Account Value | Ending Account Value | Annualized Expense Ratio | Expenses Paid During the Period* | |||
Seperately Managed Account Reserve Trust** | $1,000.00 | $991.80 | 0.00% | $0.00 |
| * | The Fund’s expenses are equal to the Fund’s expense ratio for the period, multiplied by the average account value over the period, multiplied by 182/365 (to reflect the one half-year period). |
| ** | No expenses have been charged to the Brandes Separately Managed Account Reserve Trust (“SMART Fund”) over the period, as the SMART Fund participates in a wrap-fee program sponsored by investment advisors unaffiliated with the SMART Fund. See Note 3 to the Financial Statements. Fees and expenses are charged at the wrap account level. |
| Fund | Beginning Account Value | Ending Account Value | Annualized Expense Ratio | Expenses Paid During the Period* | |||
Seperately Managed Account Reserve Trust** | $1,000.00 | $1,024.93 | 0.00% | $0.00 |
| * | The Fund’s expenses are equal to the Fund’s expense ratio for the period, multiplied by the average account value over the period, multiplied by 182/365 (to reflect the one half-year period). |
| ** | No expenses have been charged to the Brandes Separately Managed Account Reserve Trust (“SMART Fund”) over the period, as the SMART Fund participates in a wrap-fee program sponsored by investment advisors unaffiliated with the SMART Fund. See Note 3 to the Financial Statements. Fees and expenses are charged at the wrap account level. |
| Shares | Value | |
| COMMON STOCKS – 0.00% | ||
| Household Durables – 0.00% | ||
Urbi Desarrollos Urbanos SAB de CV (a) | 8,806 | $ 3,533 |
TOTAL COMMON STOCKS (Cost $1,887,388) | $ 3,533 | |
| Principal Amount | Value | |
| FEDERAL AND FEDERALLY SPONSORED CREDITS – 5.99% | ||
| Federal Home Loan Mortgage Corporation – 2.25% | ||
Pool G1-8578 3.000%, 12/1/2030 | 1,197,356 | $ 1,266,604 |
Pool SD-8001 3.500%, 7/1/2049 | 1,749,699 | 1,845,778 |
Pool SD-8003 4.000%, 7/1/2049 | 923,520 | 990,312 |
| 4,102,694 | ||
| Federal National Mortgage Association – 3.74% | ||
Pool AL9865 3.000%, 2/1/2047 | 960,754 | 1,008,822 |
Pool AS6201 3.500%, 11/1/2045 | 579,619 | 622,286 |
Pool BN6683 3.500%, 6/1/2049 | 1,360,558 | 1,436,172 |
Pool CA1624 3.000%, 4/1/2033 | 1,592,911 | 1,693,741 |
Pool MA3687 4.000%, 6/1/2049 | 1,913,235 | 2,051,347 |
| 6,812,368 | ||
TOTAL FEDERAL AND FEDERALLY SPONSORED CREDITS (Cost $10,433,544) | $ 10,915,062 | |
| OTHER MORTGAGE RELATED SECURITIES – 0.00% | ||
| Collateralized Mortgage Obligations – 0.00% | ||
Wells Fargo Mortgage Backed Securities Trust Series 2006-AR14 3.080%, 10/25/2036(b) | 2,105 | $ 2,014 |
TOTAL OTHER MORTGAGE RELATED SECURITIES (Cost $2,105) | $ 2,014 | |
| US GOVERNMENTS – 31.53% | ||
| Sovereign – 31.53% | ||
United States Treasury Bond | ||
4.750%, 2/15/2037 | 19,535,000 | $ 26,677,485 |
3.500%, 2/15/2039 | 16,750,000 | 20,043,076 |
United States Treasury Note 2.375%, 5/15/2029 | 10,135,000 | 10,762,103 |
TOTAL US GOVERNMENTS (Cost $55,263,092) | $ 57,482,664 | |
| CORPORATE BONDS – 58.35% | ||
| Automobiles – 3.01% | ||
Ford Motor Credit Co. LLC | ||
5.875%, 8/2/2021 | 1,850,000 | $ 1,874,882 |
3.350%, 11/1/2022 | 1,925,000 | 1,963,885 |
| Principal Amount | Value | |
3.375%, 11/13/2025 | 1,625,000 | $ 1,652,625 |
| 5,491,392 | ||
| Banks – 11.11% | ||
Goldman Sachs Group, Inc. 3.000%, 4/26/2022 | 3,405,000 | 3,410,323 |
JPMorgan Chase & Co. 3.682% (3M LIBOR + 3.470%), Perpetual(c) | 6,083,000 | 6,072,355 |
USB Capital IX 3.500% (3M LIBOR + 1.020%, minimum of 3.500%), Perpetual(c) | 8,525,000 | 8,184,000 |
Wells Fargo & Co. 2.100%, 7/26/2021 | 2,577,000 | 2,591,704 |
| 20,258,382 | ||
| Commercial Services & Supplies – 5.86% | ||
Iron Mountain, Inc. 4.875%, 9/15/2027(d) | 2,925,000 | 2,992,641 |
Prime Security Services Borrower LLC | ||
5.750%, 4/15/2026(d) | 3,620,000 | 3,906,794 |
6.250%, 1/15/2028(d) | 3,635,000 | 3,783,999 |
| 10,683,434 | ||
| Consumer Products – 5.29% | ||
Avon Products, Inc. 6.500%, 3/15/2023 | 5,925,000 | 6,310,125 |
Travel + Leisure Co. 3.900%, 3/1/2023 | 3,225,000 | 3,325,136 |
| 9,635,261 | ||
| Containers & Packaging – 1.12% | ||
Sealed Air Corp. 4.000%, 12/1/2027(d) | 1,990,000 | 2,037,263 |
| Electric Utilities – 0.79% | ||
FirstEnergy Corp. 7.375%, 11/15/2031 | 1,075,000 | 1,437,501 |
| Food, Beverage & Tobacco – 4.18% | ||
Pilgrim's Pride Corp. | ||
5.750%, 3/15/2025(d) | 3,875,000 | 3,954,825 |
5.875%, 9/30/2027(d) | 720,000 | 771,624 |
4.250%, 4/15/2031(d) | 2,905,000 | 2,894,048 |
| 7,620,497 | ||
| Health Care Facilities & Services – 3.43% | ||
Tenet Healthcare Corp. | ||
5.125%, 5/1/2025 | 1,270,000 | 1,287,843 |
| Principal Amount | Value | |
4.875%, 1/1/2026(d) | 4,780,000 | $ 4,968,141 |
| 6,255,984 | ||
| Homebuilders – 3.55% | ||
PulteGroup, Inc. 5.500%, 3/1/2026 | 3,920,000 | 4,573,758 |
Toll Brothers Finance Corp. 4.875%, 11/15/2025 | 1,710,000 | 1,904,512 |
| 6,478,270 | ||
| Media – 1.88% | ||
Charter Communications Operating LLC 4.908%, 7/23/2025 | 1,325,000 | 1,502,761 |
Netflix, Inc. 4.375%, 11/15/2026 | 1,725,000 | 1,927,256 |
| 3,430,017 | ||
| Oil, Gas & Consumable Fuels – 10.38% | ||
BP Capital Markets Plc 3.506%, 3/17/2025 | 3,375,000 | 3,678,172 |
Chevron Corp. 2.100%, 5/16/2021 | 1,460,000 | 1,461,812 |
Continental Resources, Inc. | ||
4.500%, 4/15/2023 | 1,845,000 | 1,910,866 |
4.375%, 1/15/2028 | 1,105,000 | 1,166,935 |
Kinder Morgan, Inc. 4.300%, 6/1/2025 | 1,921,000 | 2,144,459 |
Occidental Petroleum Corp. | ||
1.644% (3M LIBOR + 1.450%), 8/15/2022(c) | 2,195,000 | 2,171,847 |
3.500%, 6/15/2025 | 1,705,000 | 1,687,950 |
Range Resources Corp. 5.000%, 3/15/2023 | 4,630,000 | 4,705,238 |
| 18,927,279 | ||
| Technology – 3.37% | ||
VMware, Inc. | ||
4.500%, 5/15/2025 | 1,430,000 | 1,594,365 |
3.900%, 8/21/2027 | 4,176,000 | 4,557,010 |
| 6,151,375 | ||
| Telecommunications – 4.38% | ||
AT&T, Inc. 3.000%, 6/30/2022 | 5,235,000 | 5,380,519 |
Telecom Italia Capital SA 6.375%, 11/15/2033 | 906,000 | 1,073,610 |
| Principal Amount | Value | |
T-Mobile USA, Inc. 4.750%, 2/1/2028 | 1,435,000 | $ 1,533,513 |
| 7,987,642 | ||
TOTAL CORPORATE BONDS (Cost $101,399,126) | $ 106,394,297 | |
| ASSET BACKED SECURITIES – 3.02% | ||
| Student Loan – 3.02% | ||
SLM Private Credit Student Loan Trust Series 2004-B, 0.614%, (3M LIBOR + 0.430%), 9/15/2033(c) | 1,500,000 | $ 1,458,749 |
SLM Private Credit Student Loan Trust Series 2005-A, 0.494%, (3M LIBOR + 0.310%), 12/15/2038(c) | 1,672,142 | 1,647,657 |
SLM Private Credit Student Loan Trust Series 2006-A, 0.474%, (3M LIBOR + 0.290%), 6/15/2039(c) | 2,465,747 | 2,408,999 |
TOTAL ASSET BACKED SECURITIES (Cost $5,244,642) | $ 5,515,405 | |
| Shares | Value | |
| WARRANTS – 0.11% | ||
| Oil, Gas & Consumable Fuels – 0.11% | ||
Chesapeake Energy Corp., Exp. 2/9/2026, Strike $27.63, 0.000, (a) | 9,406 | $ 193,952 |
TOTAL WARRANTS (Cost $43,828) | $ 193,952 | |
| SHORT-TERM INVESTMENTS – 2.22% | ||
| Money Market Funds – 2.22% | ||
Northern Institutional Funds - Treasury Portfolio (Premier), 0.01%(e) | 4,045,045 | $ 4,045,044 |
TOTAL SHORT-TERM INVESTMENTS (Cost $4,045,044) | $ 4,045,044 | |
Total Investments (Cost $178,318,769) – 101.22% | $184,551,971 | |
Liabilities in Excess of Other Assets – (1.22)% | (2,232,995) | |
Total Net Assets – 100.00% | $182,318,976 | |
| Percentages are stated as a percent of net assets. | ||
| LIBOR London Interbank Offered Rate | ||
| (a) | Non-income producing security. |
| (b) | Variable rate security. The coupon is based on an underlying pool of loans. |
| (c) | Variable rate security. The coupon is based on a reference index and spread index. |
| (d) | Acquired in a transaction exempt from registration under Rule 144A or Section 4(a)(2) of the Securities Act of 1933. May be resold in the U.S. in transactions exempt from registration, normally to qualified institutional buyers. The total value of all such securities was $25,309,335 which represented 13.88% of the net assets of the Fund. |
| (e) | The rate shown is the annualized seven day yield as of March 31, 2021. |
| ASSETS | |
Investment in securities, at cost | $178,318,769 |
Investment in securities, at value | $184,551,971 |
| Receivables: | |
Fund shares sold | 46,881 |
Interest | 1,104,743 |
Total Assets | 185,703,595 |
| LIABILITIES | |
| Payables: | |
Payable for securities purchased | 2,875,775 |
Fund shares redeemed | 468,673 |
Dividends payable | 40,171 |
Total Liabilities | 3,384,619 |
NET ASSETS | $182,318,976 |
| COMPONENTS OF NET ASSETS | |
Paid-in Capital | $185,753,305 |
Total distributable earnings (loss) | (3,434,329) |
Total Net Assets | $182,318,976 |
| Net asset value, offering price and redemption proceeds per share | |
Net Assets | $182,318,976 |
Shares outstanding (unlimited shares authorized without par value) | 20,991,722 |
Offering and redemption price | $ 8.69 |
| INVESTMENT INCOME | |
| Income | |
Dividend income | $ 136 |
Interest income | 2,798,429 |
Total Income | 2,798,565 |
| Expenses (Note 3) | |
Total expenses | — |
Total net expenses | — |
Net investment income | 2,798,565 |
| REALIZED AND UNREALIZED GAIN (LOSS) ON INVESTMENTS: | |
Net realized gain (loss) on investments | 2,338,557 |
Net change in unrealized appreciation (depreciation) on investments | (6,700,398) |
Net realized and unrealized loss on investments | (4,361,841) |
Net decrease in net assets resulting from operations | $(1,563,276) |
| Six Months Ended March 31, 2021 | Year Ended September 30, 2020 | ||
| INCREASE IN NET ASSETS FROM: | |||
| OPERATIONS | |||
Net investment income | $ 2,798,565 | $ 6,349,385 | |
Net realized gain (loss) on investments | 2,338,557 | (7,821,691) | |
Net change in unrealized appreciation (depreciation) on investments | (6,700,398) | 12,127,547 | |
Net increase (decrease) in net assets resulting from operations | (1,563,276) | 10,655,241 | |
| DISTRIBUTIONS TO SHAREHOLDERS | |||
Distributions to Shareholders | (3,705,992) | (6,313,021) | |
Decrease in net assets from distributions | (3,705,992) | (6,313,021) | |
| CAPITAL SHARE TRANSACTIONS | |||
Proceeds from shares sold | 22,021,251 | 35,721,282 | |
Net asset value of shares issued on reinvestment of distributions | 3,408,847 | 5,886,403 | |
Cost of shares redeemed | (19,066,404) | (41,757,830) | |
Net increase (decrease) in net assets from capital share transactions | 6,363,694 | (150,145) | |
Total increase in net assets | 1,094,426 | 4,192,075 | |
| NET ASSETS | |||
Beginning of the Period | 181,224,550 | 177,032,475 | |
End of the Period | $182,318,976 | $181,224,550 |
| Six Months Ended March 31, | Year Ended September 30, | ||||||||||
| 2021 | 2020 | 2019 | 2018 | 2017 | 2016 | ||||||
Net asset value, beginning of period | $ 8.94 | $ 8.73 | $ 8.65 | $ 8.94 | $ 9.02 | $ 8.69 | |||||
| Total from investment operations: | |||||||||||
Net investment income(1) | 0.14 | 0.31 | 0.36 | 0.39 | 0.39 | 0.44 | |||||
Net realized and unrealized gain/(loss) on investments | (0.21) | 0.21 | 0.08 | (0.29) | (0.08) | 0.33 | |||||
Total from investment operations | (0.07) | 0.52 | 0.44 | 0.10 | 0.31 | 0.77 | |||||
| Less dividends and distributions: | |||||||||||
Dividends from net investment income | (0.18) | (0.31) | (0.36) | (0.39) | (0.39) | (0.44) | |||||
Total dividends and distributions | (0.18) | (0.31) | (0.36) | (0.39) | (0.39) | (0.44) | |||||
Net asset value, end of period | $ 8.69 | $ 8.94 | $ 8.73 | $ 8.65 | $ 8.94 | $ 9.02 | |||||
Total return | (0.82%) (2) | 6.05% | 5.29% | 1.12% | 3.57% | 9.24% | |||||
Net assets, end of period (millions) | $182.3 | $181.2 | $177.0 | $176.6 | $176.7 | $163.9 | |||||
Ratio of expenses to average net assets(3) | 0.00% (4) | 0.00% | 0.00% | 0.00% | 0.00% | 0.00% | |||||
Ratio of net investment income to average net assets(3) | 3.07% (4) | 3.52% | 4.27% | 4.43% | 4.39% | 5.12% | |||||
Portfolio turnover rate | 22.60% (2) | 32.24% | 35.99% | 42.90% | 39.74% | 53.60% | |||||
| (1) | Net investment income per share has been calculated based on average shares outstanding during the period. |
| (2) | Not annualized. |
| (3) | Reflects the fact that no fees or expenses are incurred by the Fund. The Fund is an integral part of “wrap-fee” programs sponsored by investment advisors and/or broker-dealers unaffiliated with the Fund or the Advisor. Participants in these programs pay a “wrap” fee to the sponsor of the program. |
| (4) | Annualized. |
| A. | Repurchase Agreements. The Fund may enter into repurchase agreements with government securities dealers recognized by the Federal Reserve Board, with member banks of the Federal Reserve System or with other brokers or dealers that meet the credit guidelines established by the Board of Trustees. Each Fund will always receive and maintain, as collateral, U.S. Government securities whose market value, including accrued interest (which is recorded in the Schedules of Investments), will be at least equal to 100% of the dollar amount invested by the Fund in each agreement, and the Fund will make payment for such securities only upon physical delivery or upon evidence of book entry transfer to the account of the Fund’s custodian. If the term of any repurchase transaction exceeds one business day, the value of the collateral is marked-to-market on a daily basis to ensure the adequacy of the collateral. Before causing the Fund to enter into a repurchase agreement with any other party, the investment advisor will determine that such party does not have any apparent risk of becoming involved in bankruptcy proceedings within the time frame contemplated by the repurchase agreement. If the seller defaults and the value of the collateral declines, or if bankruptcy proceedings are commenced with respect to the seller of the security, realization of the collateral by the Fund may be delayed or limited. At March 31, 2021, the Fund did not invest in repurchase agreements. |
| B. | Foreign Currency Translation and Transactions. Values of investments denominated in foreign currencies are converted into U.S. dollars using the spot market rates of exchange at the time of valuation. Purchases and sales of investments and dividend and interest income are translated into U.S. dollars using the spot market rates of exchange prevailing on the respective dates of such translations. The gain or loss resulting from changes in foreign exchange |
| rates is included with net realized and unrealized gain or loss from investments, as appropriate. Foreign securities and currency transactions may involve certain considerations and risks not typically associated with those of domestic origin. | |
| Foreign securities are recorded in the financial statements after translation to U.S. dollars based on the applicable exchange rate at the end of the period. The Fund reports certain foreign currency-related transactions as components of realized gains or losses for financial reporting purposes, whereas such components are treated as ordinary income for federal income tax purposes. | |
| C. | Delayed Delivery Securities. The Fund may purchase securities on a when issued or delayed delivery basis. “When-issued” or delayed delivery refers to securities whose terms are available and for which a market exists, but that have not been issued. For a when-issued or delayed delivery transaction, no payment is made until delivery date, which is typically longer than the normal course of settlement. When the Fund enters into an agreement to purchase securities on a when-issued or delayed delivery basis, the Fund segregates cash or liquid securities, of any type or maturity, equal in value to the Fund’s commitment. Losses may arise if the market value of the underlying securities change, if the counterparty does not perform under the contract, or if the issuer does not issue the securities due to political, economic, or other factors. The Fund did not have any open commitments on delayed delivery securities as of March 31, 2021. |
| D. | Security Transactions, Dividends and Distributions. Security transactions are accounted for on the trade dates. Realized gains and losses are evaluated on the basis of identified costs. Distributions from net investment income are declared daily and paid monthly. Distributions of net realized gains, if any, are declared at least annually. Dividend income and distributions to shareholders are recorded on the ex-dividend dates. Interest is recorded on an accrual basis. The Fund amortizes premiums and accretes discounts using the constant yield method. |
| E. | Use of Estimates. The preparation of financial statements in conformity with GAAP requires management to make estimates and assumptions that affect the reported amounts of assets and liabilities at the date of the financial statements and reported amounts of income and expenses during the reporting period. Actual results could differ from those estimates and assumptions. |
| F. | Indemnification Obligations. Under the Trust’s organizational documents, its current and former officers and trustees are indemnified against certain liabilities arising out of the performance of their duties to the Trust. The Trust |
| has indemnified its trustees against any expenses actually and reasonably incurred by the trustees in any proceeding arising out of or in connection with the trustees’ service to the Trust. In addition, in the normal course of business, the Trust enters into contracts that contain a variety of representations and warranties and provide general indemnifications. The Fund's maximum exposure under these arrangements is unknown as this would involve future claims that may be made against the Fund that have not yet occurred or that would be covered by other parties. | |
| G. | Accounting for Uncertainty in Income Taxes. The Fund has elected to be taxed as a “regulated investment company” and intends to distribute substantially all its taxable income to its shareholders and otherwise comply with the provisions of the Internal Revenue Code applicable to regulated investment companies. The Fund may be subject to a nondeductible excise tax calculated as a percentage of certain undistributed amounts of net investment income and net capital gains. The Fund intends to distribute its net investment income and capital gains as necessary to avoid this excise tax. Therefore, no provision for federal income taxes or excise taxes has been made. |
| The Trust analyzes all open tax years, as defined by the applicable statute of limitations, for all major jurisdictions. Open tax years for the Fund are those that are open for exam by taxing authorities (2017 through 2020). As of March 31, 2021 the Trust has no examinations in progress. | |
| Management has analyzed the Trust’s tax positions, and has concluded that no liability should be recorded related to uncertain tax positions expected to be taken on the tax return for the fiscal year-ended September 30, 2020. | |
| The Trust identifies its major tax jurisdictions as the U.S. Government and the State of California. The Fund is not aware of any tax positions for which it is reasonably possible that the total amounts of unrecognized tax benefits will significantly change in the next twelve months. | |
| H. | Fair Value Measurements. The Trust has adopted GAAP accounting principles related to fair value accounting standards which establish a definition of fair value and set out a hierarchy for measuring fair value. These standards require additional disclosures about the various inputs and valuation techniques used to develop the measurements of fair value and a discussion of changes in valuation techniques and related inputs during the period. These inputs are summarized in the three broad levels listed below: |
| Level 1—Fair value measurement within Level 1 should be based on an unadjusted quoted price in an active market that the Fund has the ability to access for the asset or liability at the measurement date. Because a quoted price alone forms the basis for the measurement, the access requirement |
| within Level 1 limits discretion in pricing the asset or liability, including in situations in which there are multiple markets for the asset or liability with different prices and no single market represents a principal market for the asset or liability. Importantly, the FASB has indicated that when a quoted price in an active market for a security is available, that price should be used to measure fair value without regard to an entity’s intent to transact at that price. | |
| Level 2—Fair value measurement within Level 2 should be based on all inputs other than unadjusted quoted prices included within Level 1 that are observable for the asset or liability. Other significant observable market inputs include quoted prices for similar instruments in active markets, quoted adjusted prices in active markets, quoted prices for identical or similar instruments in markets that are not active, and model derived valuations in which the majority of significant inputs and significant value drivers are observable in active markets. | |
| Level 3—Fair value measurement within Level 3 should be based on unobservable inputs in such cases where markets do not exist or are illiquid. Significant unobservable inputs include model derived valuations in which the majority of significant inputs or significant value drivers are unobservable. Unobservable inputs are those inputs that reflect the Fund’s own assumptions that market participants would use to price the asset or liability based on the best available information. | |
| I. | Security Valuation. Bonds and other fixed-income securities (other than repurchase agreements and demand notes) are valued using the bid price on the day of the valuation provided by an independent pricing service. |
| Securities traded on a national securities exchange are valued at the last reported sale price at the close of regular trading on each day the exchange is open for trading. Securities listed on the NASDAQ National Market System for which market quotations are readily available are valued using the NASDAQ Official Closing Price. Securities traded on an exchange for which there has been no sales on the valuation date are valued at the mean between last bid and ask price on such day. Securities for which quotations are not readily available are valued at their respective fair values as determined in good faith pursuant to procedures adopted by the Board of Trustees. | |
| Repurchase agreements and demand notes, for which neither vendor pricing nor market maker prices are available, are valued at amortized cost on the day of valuation, unless Brandes Investment Partners, L.P. (the “Advisor”) determines that the use of amortized cost valuation on such day is not appropriate (in which case such instrument is fair valued in accordance with the fair value procedures of the Trust). |
| The Trust has adopted valuation procedures that allow for fair value pricing for use in appropriate circumstances. For example, such circumstances may arise when trading in a security has been halted or suspended or a security has been delisted from a national exchange, a security has not been traded for an extended period of time, or a significant event with respect to a security occurs after the close of the market or exchange on which the security principally trades and before the time the Fund calculates its own share price. If no price, or in the Advisor’s determination no price representing fair value, is provided for a security held by the Fund by an independent pricing agent, then the security will be fair valued. Thinly traded securities and certain foreign securities may be impacted more by the use of fair valuations than other securities. | |
| In using fair value pricing, the Fund attempts to establish the price that it might reasonably have expected to receive upon a sale of the security at 4:00 p.m. Eastern time. Valuing securities at fair value involves greater reliance on judgment than valuation of securities based on readily available market quotations. When using fair value to price securities, the Fund may value those securities higher or lower than another fund using market quotations or fair value to price the same securities. Further, there can be no assurance that the Fund could obtain the fair value assigned to a security if it were to sell the security at approximately the time at which the Fund determines its net asset value. | |
| Foreign securities are recorded in the financial statements after translation to U.S. dollars based on the applicable exchange rate at the end of the period. The Fund reports certain foreign currency-related transactions as components of realized gains or losses for financial reporting purposes, whereas such components are treated as ordinary income for federal income tax purposes. | |
| Fixed income securities including corporate, convertible and municipal bonds and notes, U.S. government agencies, U.S. Treasury obligations, sovereign issues, bank loans, convertible preferred securities and non-U.S. bonds are normally valued on the basis of quotes obtained from brokers and dealers or independent pricing services or sources. Independent pricing services typically use information provided by market makers or estimates of market values obtained from yield data relating to investments or securities with similar characteristics. The service providers’ internal models use inputs that are observable such as, among other things, issuer details, interest rates, yield curves, prepayment speeds, credit risks/ spreads, default rates and quoted prices for similar assets. Securities that use similar valuation techniques and inputs as described above are categorized as Level 2 of the fair value hierarchy. |
| Fixed income securities purchased on a delayed-delivery basis are typically marked to market daily until settlement at the forward settlement date. | |
| Mortgage and asset-backed securities are usually issued as separate tranches, or classes, of securities within each package of underlying securities. These securities are also normally valued by pricing service providers that use broker-dealer quotations or valuation estimates from their internal pricing models. The pricing models for these securities usually consider tranche level attributes, estimated cash flows and marketbased yield spreads for each tranche, current market data and packaged collateral performance, as available. Mortgage and asset-backed securities that use such valuation techniques and inputs are categorized as Level 2 of the fair value hierarchy only if there are significant observable inputs used. | |
| Common stocks, exchange-traded fund shares and financial derivative instruments, such as futures contracts or options contracts that are traded on a national securities or commodities exchange, are valued at the last reported sales price, in the case of common stocks and exchange-traded fund shares, or, in the case of futures contracts or options contracts, the settlement price determined by the relevant exchange. To the extent these securities are actively traded and valuation adjustments are not applied, they are categorized as Level 1 of the fair value hierarchy. | |
| Valuation adjustments may be applied to certain securities that are solely traded on a foreign exchange to account for the market movement between the close of the foreign market and the close of the New York Stock Exchange (“NYSE”). These securities are generally valued using pricing service providers that consider the correlation of the trading patterns of the foreign security to the intraday trading in the U.S. markets for investments. Securities using these valuation adjustments are categorized as Level 2 of the fair value hierarchy. None of the Fund’s securities were fair valued utilizing this method as of March 31, 2021. | |
| Investments in registered open-end management investment companies are valued based upon the Net Asset Values (“NAVs”) of such investments and are categorized as Level 1 of the fair value hierarchy. If, on a particular day, a share price of an investment company is not readily available, such securities are fair valued in accordance with the fair value procedures of the Trust. | |
| Certain securities may be fair valued in accordance with the fair valuation procedures approved by the Board of Trustees. The Fair Valuation Committee is generally responsible for overseeing the day to day valuation processes and reports periodically to the Board. The Fair Valuation Committee is authorized to make all necessary determinations of the fair |
| value of portfolio securities and other assets for which market quotations are not readily available or if it is deemed that the prices obtained from brokers and dealers or independent pricing services are unreliable. |
| Description | Level 1 | Level 2 | Level 3 | Total | ||||
| Seperately Managed Account Reserve Trust | ||||||||
Common Stocks | $ 3,533 | $ — | $— | $ 3,533 | ||||
Asset Backed Securities | — | 5,515,405 | — | 5,515,405 | ||||
Corporate Bonds | — | 106,394,297 | — | 106,394,297 | ||||
Government Securities | — | 57,482,664 | — | 57,482,664 | ||||
Warrants | 193,952 | — | — | 193,952 | ||||
Mortgage Backed Securities | — | 10,917,076 | — | 10,917,076 | ||||
Short-Term Investments | 4,045,044 | — | — | 4,045,044 | ||||
Total Investments in Securities | $4,242,529 | $180,309,442 | $— | $184,551,971 |
| A. | Advisor Fee. The Advisor provides the Fund with investment management services under an Investment Advisory Agreement. The Advisor receives no advisory fee or other fee from the Fund. The financial statements of the Fund reflect the fact that no fees or expenses are incurred by the Fund. It should be understood, however, that the Fund is an integral part of “wrap-fee” programs sponsored by investment advisors unaffiliated with the Fund and the Advisor. Typically, participants in these programs pay a “wrap-fee” to their investment advisors. Although the Fund does not compensate the Advisor directly for its service under the Investment Advisory Agreement, the Advisor benefits from its relationships with the sponsors of wrap-fee programs for which the Fund is an investment option. Certain officers and Trustees of the Trust are also officers of the Advisor. |
| B. | Administration Fee. The Northern Trust Company (the "Administrator") acts as the administrator for the fund. The Administrator prepares various federal and state regulatory filings; prepares reports and materials to be supplied to the Trustees; monitors the activities of the Fund’s custodian, transfer agent and accountant; coordinates the preparation and payment of Fund expenses; |
| and prepares several Fund reports. The Advisor compensates the Administrator on behalf of the Fund for the services the Administrator performs for the Fund. | |
| C. | Distribution Fees. ALPS Distributors, Inc. (the “Distributor”), a registered broker-dealer, acts as the Fund’s principal underwriter in a continuous public offering of the Fund’s shares. All of the Fund’s distribution fees are paid by the Advisor. |
| U.S. Government | Other | |||||
| Purchases | Sales | Purchases | Sales | |||
| $20,847,402 | $21,283,150 | $23,553,165 | $18,460,254 | |||
| Six Months Ended 3/31/2021 | Year Ended 9/30/2020 | ||||||
| Shares | Amount | Shares | Amount | ||||
Shares Sold | 2,480 | $ 22,021 | 4,091 | $ 35,721 | |||
Issued on Reinvestment of Distributions | 385 | 3,409 | 672 | 5,886 | |||
Shares Redeemed | (2,148) | (19,067) | (4,775) | (41,757) | |||
Net Increase/(Decrease) Resulting from Fund Share Transactions | 717 | $ 6,363 | (12) | $ (150) | |||
| Undistributed Net Investment Income | Accumulated Net Realized Loss | Paid-In Capital | ||
| $462,693 | $(462,693) | $— |
Cost of investments for tax purposes | $169,952,701 |
Gross tax unrealized appreciation | 15,862,137 |
Gross tax unrealized depreciation | (2,928,537) |
Net unrealized appreciation (depreciation) | 12,933,600 |
Distributable ordinary income | 748,247 |
Distributable long-term capital gains | — |
Total distributable earnings | 748,247 |
Other accumulated losses | (11,846,908) |
Total accumulated gains | $ 1,834,939 |
| Ordinary Income | Long Term Capital Gains | |||||
| 2020 | 2019 | 2020 | 2019 | |||
| $6,313,021 | $7,370,935 | $— | $— | |||
| Name, Address and Age | Position(s) Held with Trust | Term of Office and Length of Time Served(1) | Principal Occupation During Past 5 Years | Number of Trust Series Overseen by Trustee | Other Directorships/Trusteeships Held by Trustee | |||||
| Independent Trustees(2) | ||||||||||
| Gregory Bishop, CFA 11988 El Camino Real, Suite 600 San Diego, CA 92130 (1961) | Trustee | Since January 2017 | Retired. Previously Executive Vice President and Head of Retail Business, PIMCO Investments, from 1997 to 2014 | 7 | None | |||||
| Robert M. Fitzgerald 11988 El Camino Real, Suite 600 San Diego, CA 92130 (1952) | Trustee | Since April 2008 | Retired from 2002-2005 and since 2007; Chief Financial Officer of National Retirement Partners from 2005 to 2007. | 7 | Hotchkis and Wiley Mutual Funds (10 Funds) | |||||
| Craig Wainscott, CFA 11988 El Camino Real, Suite 600 San Diego, CA 92130 (1961) | Trustee and (beginning January 2018) Chairman of the Board | Since February 2012 | Retired from Russell Investments, Managing Director, US Mutual Funds; Currently Partner with The Paradigm Project and advisor to early-stage companies. | 7 | None | |||||
| Name, Address and Age | Position(s) Held with Trust | Term of Office and Length of Time Served(1) | Principal Occupation During Past 5 Years | Number of Trust Series Overseen by Trustee | Other Directorships/Trusteeships Held by Trustee | |||||
| “Interested” Trustees(3) | ||||||||||
| Jeff Busby, CFA 11988 El Camino Real, Suite 600 San Diego, CA 92130 (1961) | Trustee and President | Since July 2006 Since February 2012 | Executive Director of the Advisor since January 2004. | 7 | None | |||||
| Oliver Murray 11988 El Camino Real, Suite 600 San Diego, CA 92130 (1961) | Trustee | Since February 2012 | CEO, Brandes Investment Partners & Co. since 2002; Managing Director -PCPM of the Advisor since 2011. | 7 | None | |||||
| Officers of the Trust | ||||||||||
| Thomas M. Quinlan 11988 El Camino Real, Suite 600 San Diego, CA 92130 (1970) | Secretary | Since June 2003 | Associate General Counsel of the Advisor since January 2006. | N/A | N/A | |||||
| Gary Iwamura, CPA 11988 El Camino Real, Suite 600 San Diego, CA 92130 (1956) | Treasurer | Since September 1997 | Finance Director of the Advisor. | N/A | N/A | |||||
| Roberta Loubier 11988 El Camino Real, Suite 600 San Diego, CA 92130 (1971) | Chief Compliance Officer | Since September 2015 | Global Head of Compliance of the Advisor. | N/A | N/A | |||||
| (1) | Trustees and officers of the Fund serve until their resignation, removal or retirement. |
| (2) | Not “interested persons” of the Trust as defined in the 1940 Act. |
| (3) | “Interested persons” of the Trust as defined in the 1940 Act. Jeff Busby is an interested person of the Trust because he is the President of the Trust and the Executive Director of the Advisor. Oliver Murray is an interested person of the Trust, because he is the Managing Director of the Advisor. |
| • | Information we receive about you on applications or other forms; |
| • | Information you give us orally; and |
| • | Information about your transactions with us. |
(b) Not applicable.
Item 2. Code of Ethics.
Not applicable for semi-annual reports.
Item 3. Audit Committee Financial Expert.
Not applicable for semi-annual reports.
Item 4. Principal Accountant Fees and Services.
Not applicable for semi-annual reports.
Item 5. Audit Committee of Listed Registrants.
Not applicable to registrants who are not listed issuers (as defined in Rule 10A-3 under the Securities Exchange Act of 1934).
Item 6. Schedule of Investments.
| (a) | Schedule of Investments is included as part of the reports to shareholders filed under Item 1 of this Form. |
| (b) | Not applicable. |
Item 7. Disclosure of Proxy Voting Policies and Procedures for Closed-End Management Investment Companies.
Not applicable to open-end investment companies.
Item 8. Portfolio Managers of Closed-End Management Investment Companies.
Not applicable to open-end investment companies.
Item 9. Purchases of Equity Securities by Closed-End Management Investment Company and Affiliated Purchasers.
Not applicable to open-end investment companies.
Item 10. Submission of Matters to a Vote of Security Holders.
There have been no material changes to the procedures by which shareholders may recommend nominees to the registrant’s Board of Trustees.
Item 11. Controls and Procedures.
| (a) | The registrant’s President and Treasurer have reviewed the Registrant’s disclosure controls and procedures (as defined in Rule 30a-3(c) of the Investment Company Act of 1940 (“the Act”)) as of a date within 90 days of the filing date of this report, as required by 30a-3(b) under the Act and Rules |
| 13a-15(b) or 15d-15(b) under the Securities Exchange Act of 1934. Based on their review, such officers have concluded that the disclosure controls and procedures are effective in ensuring that information required to be disclosed in this report is appropriately recorded, processed, summarized and reported and made known to them by others within the Registrant and by the Registrant’s service provider. |
| (b) | No changes in the registrant’s internal control over financial reporting (as defined in Rule 30a-3(d) under the Act) occurred during the period covered by this report that materially affected or are reasonably likely to materially affect, the registrant’s internal control over financial reporting. |
Item 12. Disclosure of Securities Lending Activities for Closed-End Management Investment Companies.
Not applicable to open-end investment companies.
Item 13. Exhibits.
(a)(1) Not applicable – only for annual reports.
(a)(2) Filed herewith.
(a)(3) Not applicable to open-end investment companies.
(a)(4) There has been no change to the registrant’s independent public accountant.
(b) Certifications pursuant to Section 906 of the Sarbanes-Oxley Act of 2002. Filed herewith.
SIGNATURES
Pursuant to the requirements of the Securities Exchange Act of 1934 and the Investment Company Act of 1940, the registrant has duly caused this report to be signed on its behalf by the undersigned, thereunto duly authorized.
Brandes Investment Trust
| By: | /s/ Jeff Busby | |
| Jeff Busby | ||
| President and Principal Executive Officer |
Date: June 3, 2021
Pursuant to the requirements of the Securities Exchange Act of 1934 and the Investment Company Act of 1940, this report has been signed below by the following persons on behalf of the registrant and in the capacities and on the dates indicated.
| By: | /s/ Jeff Busby | |
| Jeff Busby | ||
| President and Principal Executive Officer |
Date: June 3, 2021
| By: | /s/ Gary Iwamura | |
| Gary Iwamura | ||
| Treasurer and Principal Financial Officer |
Date: June 3, 2021