UNITED STATES
SECURITIES AND EXCHANGE COMMISSION
Washington, D.C. 20549
FORM N-CSR
CERTIFIED SHAREHOLDER REPORT OF REGISTERED
MANAGEMENT INVESTMENT COMPANIES
Investment Company Act File Number 811-08614
Brandes Investment Trust
(Exact name of registrant as specified in charter)
4275 Executive Square, 5th Floor
La Jolla, CA 92037
(Address of principal executive offices) (Zip code)
Lea Anne Copenhefer
Morgan, Lewis & Bockius LLP
One Federal Street
Boston, MA 02110-1726
(Name and address of agent for service)
(858) 755-0239
Registrant’s telephone number, including area code
Date of fiscal year end: September 30
Date of reporting period: March 31, 2022
Item 1. Reports to Stockholders.
(a) The following is a copy of the reports transmitted to shareholders pursuant to Rule 30e-1 under the Investment Company Act of 1940 (the “Act”) (17 CFR 270.30e-1):
SEMI-ANNUAL REPORT INTERNATIONAL EQUITY FUND GLOBAL EQUITY FUND EMERGING MARKETS VALUE FUND INTERNATIONAL SMALL CAP EQUITY FUND SMALL CAP VALUE FUND U.S. VALUE FUND CORE PLUS FIXED INCOME FUND For the six months ended March 31, 2022

Table of Contents
1
Brandes International Equity Fund
Dear Fellow Investor,
The net asset value of the Brandes International Equity Fund (Class I Shares) declined 3.39% in the six months ended March 31, 2022. During the same period, the MSCI EAFE Index declined 3.38%.
From a country perspective, holdings in Brazil helped performance, led by Telefonica Brasil and Petroleo Brasileiro (Petrobras). Select holdings in the United Kingdom (e.g., pharmaceutical firm GlaxoSmithKline) and Switzerland (e.g., financial services company UBS Group) also did well.
From an industry perspective, beverage companies Ambev (Brazil) and Anheuser-Busch InBev (Belgium) aided returns. The Fund also saw positive contributions from select insurance holdings, notably Swiss Re and AEGON (Netherlands), as they benefited from improved prospects for increased interest rates and strengthening business results.
Furthermore, our underweight to technology aided relative returns as the sector declined significantly more than the broader market (MSCI EAFE).
The most significant detractors were our holdings in Russia (Mobile TeleSystems and Surgutneftegas). Our thoughts continue to be with the people of Ukraine, as well as those in Russia that are advocating for peace. The events that have unfolded since the start of the Russian invasion of Ukraine in February have significantly elevated the risks and uncertainties associated with investments in Russian securities.
Other detractors included consumer-related holdings, namely Germany-based Henkel and France-based Danone, as well as U.K.-based Marks & Spencer, J Sainsbury and Kingfisher.
Furthermore, Brazilian regional jet manufacturer Embraer gave back some of its strong performance over the past 18 months as it declined on lowered short- term margin guidance. We believe the market underappreciates the ongoing cycle recovery across Embraer’s products, which have seen their order backlog rise above pre-COVID levels. As the market is heavily focused on short-term, one-off item margin distortions, Embraer now trades at a wide discount to our estimate of its intrinsic value.
Select Portfolio Activity
The investment committee initiated new positions in Japan-based SoftBank Group and U.K-based TechnipFMC during the period.
TechnipFMC (FTI) is the product of a 2016 merger between Technip, a leading engineering, procurement and construction company (EPC), and FMC, a leading provider of subsea production and processing equipment. The rationale of the merger was to combine equipment manufacturing with engineering and construction of subsea oilfields. In 2021, the company completed a long-planned separation of its onshore EPC business, making it purely focused on offshore oilfield exploration and development.
With an over 40% market share, FTI is the industry leader in subsea systems, highly engineered capital goods that reside on the seabed producing and processing
| | |
| 2 | | Past Performance is not a guarantee of future results. |
Brandes International Equity Fund
hydrocarbons. The subsea industry has been in a multi-year slump following a decade of high oil prices. Capital expenditures (capex) among upstream oil and gas companies (FTI’s customer base) reached highs in 2014 and are estimated to be less than half of the peak levels in 2021. In addition to the collapse in capex, there has been a shift of investment to unconventional opportunities on land. The overall effect has been a sustained period of low manufacturing utilization, high price competition and distressed profitability for the subsea industry.
While a return to peak capex is unlikely, we believe a gradual increase in offshore activity is in the cards given two main factors: 1) global demand growth has been stable or growing; and 2) poor returns from onshore unconventional production over the past decade may be an indication that more capital should flow elsewhere (or oil prices need to be substantially higher). In our view, FTI is well positioned to benefit from the potentially improved offshore activity considering its industry-leading position in subsea equipment and engineering, as well as its fully integrated business model. Furthermore, we appreciate that FTI has made several investments to capitalize on its offshore development expertise and seek to benefit from a global energy transition, including subsea carbon transportation and storage, floating renewable power generation (offshore wind) and hydrogen production, storage and re-electrification.
SoftBank Group is a holding company whose primary assets include technology and wireless companies, such as internet company Alibaba, semiconductor firm Arm and wireless telecommunication company Softbank Corp, as well as its two Vision funds, which are venture capital funds that invest in technology companies. SoftBank’s stock fell at the beginning of the year due to Alibaba’s share-price decline, as well as a widening discount to its net asset value (NAV). SoftBank now trades near its largest NAV discount in its history (as of March 31).
Other major portfolio activity included the divestments of German chemical company BASF, Ireland-based building materials business CRH and Canadian uranium company Cameco, which appreciated significantly on a potentially improved uranium outlook.
Looking Forward
As of March 31, 2022, the Brandes International Equity Fund held its key overweights to communication services, health care, energy and consumer staples, while maintaining significantly lower allocations to technology and industrials than the benchmark. Geographically, we continued to have overweight positions in France and emerging markets, and underweight positions in Australia and Japan. We believe the differences between our Fund and the benchmark continue to make it an attractive complement to index-tracking or growth-oriented alternatives.
Value stocks (as measured by the MSCI EAFE Value Index) outperformed the broader market (MSCI EAFE Index) noticeably at the start of the year when rising inflation and interest rates caused the valuations of many high-flying growth companies to compress.
3
Brandes International Equity Fund
Geopolitical developments in the second half of the quarter (i.e., the Russia/Ukraine conflict) have exacerbated inflationary trends and triggered concerns about an economic slowdown, raising the potential for a “stagflationary” environment (low economic growth and elevated inflation).
In the beginning of 2022, we were optimistic that improving economic growth and an uptick in inflation (after a decade-plus of weak growth and almost no inflation before COVID-19) would benefit value stocks—especially given the historically wide valuation discounts at which value stocks traded relative to growth (MSCI EAFE Growth Index). However, with inflation persisting and economic growth potentially slowing, we are often asked if these factors change our outlook for value stocks. While it is true that weaker growth may present a headwind for value stocks (all else being equal), it has not always been the case. In fact, two of the best periods for value versus growth were the post-Nifty Fifty era in the 1970s (during which the term “stagflation” was first widely used) and the post-tech bubble correction of the early 2000s. These periods shared common attributes that catalyzed the favorable environment for value: they were preceded by a period of elevated general market valuations and historically wide discount levels for value relative to growth.
Today, even after outperforming growth in the past 18 months, value stocks continue to trade at historically high discount levels relative to growth stocks, leading us to believe that the current environment still bodes well for value despite diminished optimism about economic growth.
We remain optimistic about the prospects of the Brandes International Equity Fund and appreciate your continued trust.
Thank you for the trust you have placed in us.
Sincerely yours,
The Brandes International Large-Cap Investment Committee
Brandes Investment Trust
Dividend Yield: Dividends per share divided by price per share.
Net Asset Value: A company’s total assets minus its liabilities, divided by the number of outstanding shares.
Nifty Fifty: A popular name in the 1960s and 70s for a group of the largest U.S. companies.
Return on Invested Capital: Net income minus dividends divided by total capital; used to assess a company’s efficiency at allocating the capital under its control to profitable investments.
Stagflation: Combination of slow economic growth and high inflation.
Diversification does not assure a profit or protect against a loss in a declining market.
Brandes International Equity Fund
Because the values of the Fund’s investments will fluctuate with market conditions, so will the value of your investment in the Fund. You could lose money on your investment in the Fund, or the Fund could underperform other investments. The values of the Fund’s investments fluctuate in response to the activities of individual companies and general stock market and economic conditions. In addition, the performance of foreign securities depends on the political and economic environments and other overall economic conditions in the countries where the Fund invests. Emerging country markets involve greater risk and volatility than more developed markets. Some emerging markets countries may have fixed or managed currencies that are not free-floating against the U.S. dollar. Certain of these currencies have experienced, and may experience in the future, substantial fluctuations or a steady devaluation relative to the U.S. dollar. Value stocks typically are less volatile than growth stocks; however, issues of value stocks typically have a lower expected growth rate in earnings and sales than issues of growth stocks.
Please refer to the Schedule of Investments in the report for complete holdings information. Fund holdings, geographic allocations and/or sector allocations are subject to change at any time and are not considered a recommendation to buy or sell any security.
The foregoing reflects the thoughts and opinions of Brandes Investment Partners® exclusively and is subject to change without notice.
Brandes Investment Partners® is a registered trademark of Brandes Investment Partners, L.P. in the United States and Canada.
Must be preceded or accompanied by a prospectus.
Index Guide
The MSCI EAFE Index with net dividends captures large and mid cap representation of developed market countries excluding the U.S. and Canada.
The MSCI EAFE Value Index with gross dividends captures large and mid cap securities across developed market countries, excluding the United States and Canada, exhibiting value style characteristics, defined using book value to price, 12-month forward earnings to price, and dividend yield.
The MSCI EAFE Growth Index with gross dividends captures large and mid cap securities across developed market countries, excluding the United States and Canada, exhibiting growth style characteristics, defined using long-term forward earnings per share (EPS) growth rate, short-term forward EPS growth rate, current internal growth rate, long-term historical EPS growth trend, and long-term historical sales per share growth trend.
MSCI has not approved, reviewed or produced this report, makes no express or implied warranties or representations and is not liable whatsoever for any data in the report. You may not redistribute the MSCI data or use it as a basis for other indices or investment products.
5
Brandes International Equity Fund
One cannot invest directly in an index.
The Brandes International Equity Fund is distributed by ALPS Distributors, Inc.
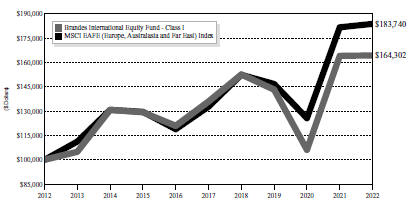
The following chart compares the value of a hypothetical $100,000 investment in the Brandes International Equity Fund – Class I from March 31, 2012 to March 31, 2022 with the value of such an investment in the MSCI EAFE (Europe, Australasia and Far East) Index for the same period.
Value of $100,000 Investment vs MSCI
EAFE (Europe, Australasia and Far East) Index (Unaudited)
| | | | | | | | | | | | | | | | |
| | | Average Annual Total Return | |
| | | Periods Ended March 31, 2022 | |
| | | One | | | Five | | | Ten | | | Since | |
| | | Year | | | Years | | | Years | | | Inception(1) | |
Brandes International Equity Fund | | | | | | | | | | | | | | | | |
Class A(2) | | | -0.07 | % | | | 3.60 | % | | | 4.87 | % | | | 6.97% | |
Class A (2) (with maximum sales charge) | | | -5.84 | % | | | 2.37 | % | | | 4.25 | % | | | 6.72% | |
Class C(3) | | | -0.55 | % | | | 2.88 | % | | | 4.23 | % | | | 6.17% | |
Class C (3) (with maximum sales charge) | | | -1.51 | % | | | 2.88 | % | | | 4.23 | % | | | 6.17% | |
Class I | | | 0.16 | % | | | 3.86 | % | | | 5.09 | % | | | 7.21% | |
Class R6(4) | | | 0.23 | % | | | 3.97 | % | | | 5.20 | % | | | 7.28% | |
MSCI EAFE (Europe, Australasia and Far East) Index | | | 1.16 | % | | | 6.72 | % | | | 6.27 | % | | | 4.96% | |
| (1) | The inception date is January 2, 1997. |
| (2) | Performance shown prior to January 31, 2011 for Class A shares reflects the performance of Class I shares adjusted to reflect Class A expenses. |
6
Brandes International Equity Fund
| (3) | Performance shown prior to January 31, 2013 for Class C shares reflects the performance of Class I shares adjusted to reflect Class C expenses. Class C shares automatically convert to Class A shares if held for 8 years. The Class C shares’ average annual total return for the 10-year period assumes that Class C shares automatically converted to Class A shares on January 1, 2021. The Class C shares’ average annual total return for the since inception period does not reflect the automatic conversion to Class A shares, as Class A shares did not yet exist 8 years after the Fund’s inception date. |
| (4) | Performance shown prior to February 1, 2016 for Class R6 shares reflects the performance of Class I shares adjusted to reflect Class R6 expenses. |
Performance data quoted represents past performance; past performance does not indicate future results. The investment return and principal value of an investment will fluctuate so that an investor’s shares, when redeemed, may be worth more or less than their original cost. Current performance of the Fund may be lower or higher than the performance quoted. Performance data current to the most recent month end may be obtained by calling 800-331-2979.
The returns shown do not reflect the deduction of taxes that a shareholder would pay on Fund distributions or the redemption of Fund shares. Brandes Investment Partners, L.P., the Advisor, has a fee waiver arrangement in place to limit the Fund’s annual operating expenses.
Sector Allocation as a Percentage of Total Investments as of
March 31, 2022 (Unaudited)
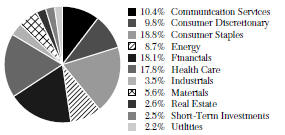
The sector classifications represented in the graph above are in accordance with Global Industry Classification Standard (GICS®), which was developed by and/or is the exclusive property of MSCI, Inc. and Standard & Poor’s Financial Services LLC.
7
Brandes Global Equity Fund
Dear Fellow Investor,
The net asset value of the Brandes Global Equity Fund (Class I Shares) increased 0.86% in the six months ended March 31, 2022. During the same period, the MSCI World Index increased 2.21%.
Rising energy prices benefited our oil-related holdings, including integrated oil firms Shell and BP, as well as oil field services company Halliburton. Additionally, financial firms UBS Group, Wells Fargo and AIG rose.
Other contributors included aerospace and defense company General Dynamics and several of our health care holdings, notably McKesson, Pfizer, GlaxoSmithKline and Merck.
As geopolitical concerns increased in lock step with worries about sustained increased inflation and the potential for slowing economic growth, European markets and emerging markets experienced the deepest decline. The impact was primarily led by technology and consumer discretionary companies because their valuations are materially influenced by rising interest rates and consumer companies are likely to see the largest demand impact from rising inflation. Our largest detractors included several of our consumer holdings, such as U.S. flooring company Mohawk Industries, U.K. home retailer Kingfisher, South Korean auto manufacturer Hyundai Motor and Chinese major appliance manufacturer Gree Electric.
We had no direct exposure to securities in Russia or Ukraine; while some of our holdings have indirect exposure, our overall portfolio revenue exposure is less than those in the MSCI World Index. Excluding energy-related holdings, Mohawk has the highest exposure to Russia at about 4% of total sales. The company has also confronted significant cost inflation, which we expect to blunt its short-term margins. Longer term, we believe Mohawk is well positioned and can contend with cost inflation. After its recent stock price decline, it now trades at a single digit multiple of earnings.
Other detractors included Embraer, Citigroup and Alibaba Group. Embraer saw its stock decline on its reduced short-term margin guidance. However, over the longer term, we believe the market is missing the ongoing cycle recovery across the company’s portfolio. While the market is heavily focused on short-term, one-off item margin distortions, Embraer’s order backlog has already risen above pre-COVID levels. The company is therefore trading at a wide discount to our estimate of its long-term intrinsic value.
Select Portfolio Activity
The investment committee initiated a position in U.K.-based bank NatWest, while selling our holdings in U.K-based Barclays.
NatWest, formerly RBS, is the U.K.’s fourth-largest bank. Since its government bailout during the financial crisis, the company has pursued its turnaround to become a financial institution focused on retail and commercial banking. The bank has de-risked its balance sheet, built capital and focused on reducing costs. The U.K. government still owns just over half of its outstanding shares, but NatWest has targeted fully exiting its majority government ownership over the next three to four years. Through its
| | |
| 8 | | Past Performance is not a guarantee of future results. |
Brandes Global Equity Fund
simplified positioning, we believe NatWest could benefit from a rise in interest rates as it is likely the most interest rate-sensitive of the U.K.-listed banks.
NatWest trades at what we believe to be an attractive valuation of less than 80% of tangible book, and a single digit multiple of earnings that have not yet been materially affected by increasing interest rates. In our opinion, it offers a very strong capital position, has plans to distribute about 15 to 20% of its current market cap to shareholders over the next few years and currently offers a 7% dividend yield.
We therefore decided to sell our stake in Barclays, which has tended to be less rate sensitive and more complex given its corporate and investment banking exposure, and bought a position in NatWest.
The investment committee also added China-based sportswear retailer Topsports Holdings International to the Fund, while divesting Mexican beverage firm Fomento Economico Mexicano(FEMSA) and U.S. food products company Ingredion as they reached our estimates of their intrinsic value.
The investment committee bought Ingredion during the market downturn of early 2020. The company’s share price came under pressure due to concerns around global trade, as well as the risk of a significant recession as COVID-19 began to spread globally. However, we thought Ingredion offered an attractive long-term opportunity as it had exposure to the growing specialty ingredients market and at its valuation, it also offered a significant margin of safety. Over our holding period, the company has executed well and its share price climbed significantly in 2021. When it reached our estimate of its intrinsic value, we divested.
Looking Forward
Value stocks (as measured by the MSCI World Value Index) outperformed the broader market (MSCI World Index) noticeably at the start of the year when rising inflation and interest rates caused many high-flying growth company valuations to compress. Geopolitical developments in the second half of the quarter (i.e., the invasion of Ukraine) have exacerbated inflationary trends and increased worries about a slowdown in growth, raising the potential for a “stagflationary” environment (low economic growth and elevated inflation).
Heading into 2022, we were optimistic that improving economic growth and an uptick in inflation (after a decade-plus of weak growth and almost no inflation before COVID-19) would benefit value stocks—especially against the wide valuation discounts value stocks traded at relative to growth. With inflation persisting and growth potentially slowing, we are often asked if these factors change our outlook for value stocks. Weaker growth may be a headwind for value stocks all else being equal, but that has rarely been the case. In fact, two of the best periods for value versus growth were in the 1970s post-“Nifty Fifty” era (during which the term “stagflation” was first widely used) and the post-tech bubble correction of the early 2000s.
The common factors of these two periods resulting in highly favorable value environments were: markets were in a state of elevated valuations and the spread
9
Brandes Global Equity Fund
between value and growth was at historically wide levels. The 1970s experienced one of the strongest value performance relative to growth of any decade in the Ken French Data Library (data from 1930 to 2020)1—and it was a period of weak real U.S. GDP (gross domestic product) growth and elevated U.S. inflation. However, and significantly for our analysis, it was preceded by a wide divergence between value and growth stock valuations—just like today. The tailwinds for value that were driving relative returns earlier this year still appear evident to us. Valuation spreads are almost as wide as they have ever been, and we are as bullish about value as we have been for more than a decade.
From an industry/sector standpoint, the Fund’s largest relative overweight positions remained in three main areas. These are: the economically sensitive financials and energy sector, and the more defensive, but (from our perspective) meaningfully undervalued, health care sector. Besides many of the attractive defensive and high-quality characteristics of many of our health care holdings, some also show potential for a cyclical rebound from a pick-up in demand for elective procedures, which had been restricted during the pandemic. We expect our financial holdings to benefit from an increase in interest rates, which is finally starting to occur and will affect their net interest margins.
Our most significant underweights were in technology, consumer staples, and communication services, which appear generally expensive to us, excluding a few specific value opportunities. These areas include several appealingly priced companies that have exposure to robust secular trends, such as 5G, AI, and fintech. They include semiconductor companies, like Samsung and SK Hynix, which trade at much more attractive valuations than a company like Nvidia, yet should benefit from the growth in artificial intelligence and the Internet of Things proliferation. Additionally, instead of holding fintech darling Square (now called Block), whose high valuation reflects market admiration, we invested in Fiserv, which owns Square competitor, Clover, and trades at much more appealing valuation levels.
We are also being careful with our exposure to companies that may be hurt by continued inflation. Generally, these include businesses with low margins, low returns on equity, low pricing power, or high labor cost, as well as those with balance sheet leverage.
From a country/region perspective, we remained overweight in the United Kingdom, France and emerging markets; we were underweight in the United States and Japan.
Looking ahead for the remainder of this year and beyond, we remain optimistic about the prospects for the Global Equity Fund given its history of outperforming the MSCI World Value Index during periods of strong value performance. Furthermore, we are encouraged by the potential for earnings recoveries among our holdings, as well as their attractive valuation discounts relative to growth stocks and the broad market.
10
Brandes Global Equity Fund
We believe the differences between the Fund and the broader market continue to make it an intelligent complement to index-tracking or growth-oriented alternatives. We remain excited about the Fund’s potential, and we thank you for the trust you have placed in us.
Sincerely yours,
The Brandes Global Large-Cap Investment Committee
Brandes Investment Trust
1Dec. 31, 1929 to Dec. 31, 2019. Based on the Ken French Data Library. Value stocks represented by the cheapest quintile of the universe – all listed NYSE, AMEX, and Nasdaq stocks – on a book to price basis, relative to growth stocks represented by the most expensive quintile of the universe on a book to price basis.
Dividend Yield: Dividends per share divided by price per share.
Margin of Safety: The discount of a security’s market price to what the firm believes is the intrinsic value of that security.
Market Capitalization (Cap): The number of common shares outstanding multiplied by the current market price per common share.
Nifty Fifty: A popular name in the 1960s and ‘70s for a group of the largest U.S. companies.
Return on Equity: Net income divided by shareholder’s equity.
Stagflation: Combination of slow economic growth and high inflation.
Tangible Book Value: Book value minus intangible assets (e.g., goodwill).
Yield: Annual income from the investment (dividend, interest, etc.) divided by the current market price of the investment.
Diversification does not assure a profit or protect against a loss in a declining market.
Because the values of the Fund’s investments will fluctuate with market conditions, so will the value of your investment in the Fund. You could lose money on your investment in the Fund, or the Fund could underperform other investments. The values of the Fund’s investments fluctuate in response to the activities of individual companies and general stock market and economic conditions. In addition, the performance of foreign securities depends on the political and economic environments and other overall economic conditions in the countries where the Fund invests. Emerging country markets involve greater risk and volatility than more developed markets. Some emerging markets countries may have fixed or managed currencies that are not free-floating against the U.S. dollar. Certain of these currencies have experienced, and may experience in the future, substantial fluctuations or a steady devaluation relative to the U.S. dollar. Value stocks typically are less volatile than growth stocks; however, issues of value stocks typically have a lower expected growth rate in earnings and sales than issues of growth stocks.
11
Brandes Global Equity Fund
Please refer to the Schedule of Investments in the report for complete holdings information. Fund holdings, geographic allocations and/or sector allocations are subject to change at any time and are not considered a recommendation to buy or sell any security.
The foregoing reflects the thoughts and opinions of Brandes Investment Partners® exclusively and is subject to change without notice.
Brandes Investment Partners® is a registered trademark of Brandes Investment Partners, L.P. in the United States and Canada.
Must be preceded or accompanied by a prospectus.
Index Guide
The MSCI World Index with net dividends captures large and mid cap representation of developed markets.
The MSCI World Value Index with gross dividends captures large and mid cap securities across developed market countries exhibiting value style characteristics, defined using book value to price, 12-month forward earnings to price, and dividend yield.
MSCI has not approved, reviewed or produced this report, makes no express or implied warranties or representations and is not liable whatsoever for any data in the report. You may not redistribute the MSCI data or use it as a basis for other indices or investment products.
One cannot invest directly in an index.
The Brandes Global Equity Fund is distributed by ALPS Distributors, Inc.
12
Brandes Global Equity Fund
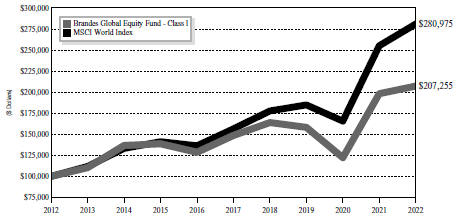
The following chart compares the value of a hypothetical $100,000 investment in the Brandes Global Equity Fund – Class I from March 31, 2012 to March 31, 2022 with the value of such an investment in the MSCI World Index for the same period.
Value of $100,000 Investment vs MSCI
World Index (Unaudited)
| | | | | | | | | | | | | | | | |
| | | Average Annual Total Return
Periods Ended March 31, 2022 | |
| | | One
Year | | | Five
Years | | | Ten
Years | | | Since
Inception(1) | |
Brandes Global Equity Fund | | | | | | | | | | | | | | | | |
Class A (2) | | | 4.31 | % | | | 6.62 | % | | | 7.29 | % | | | 6.93% | |
Class A (2) (with maximum sales charge) | | | -1.68 | % | | | 5.36 | % | | | 6.66 | % | | | 6.46% | |
Class C(3) | | | 3.54 | % | | | 5.83 | % | | | 6.66 | % | | | 6.11% | |
Class C (3) (with maximum sales charge) | | | 2.56 | % | | | 5.83 | % | | | 6.66 | % | | | 6.11% | |
Class I | | | 4.56 | % | | | 6.89 | % | | | 7.56 | % | | | 7.17% | |
MSCI World Index | | | 10.12 | % | | | 12.42 | % | | | 10.88 | % | | | 10.21% | |
| (1) | The inception date is October 6, 2008. |
| (2) | Performance shown prior to January 31, 2011 for Class A shares reflects the performance of Class I shares adjusted to reflect Class A expenses. |
| (3) | Performance shown prior to January 31, 2013 for Class C shares reflects the performance of Class I shares adjusted to reflect Class C expenses. Class C shares automatically convert to Class A shares if held for 8 years. The Class C shares’ average annual total return for the 10-year period assumes that Class C shares automatically converted to Class A shares on January 1, 2021. The Class C shares’ average annual total return for the since inception period does not reflect the automatic conversion to Class A shares. |
Performance data quoted represents past performance; past performance does not indicate future results. The investment return and principal value of an investment will fluctuate so that an investor’s shares, when redeemed, may be worth more or less than their original cost. Current performance of the Fund may be lower or higher than the
13
Brandes Global Equity Fund
performance quoted. Performance data current to the most recent month end may be obtained by calling 800-331-2979.
The returns shown do not reflect the deduction of taxes that a shareholder would pay on fund distributions or the redemption of fund shares. Brandes Investment Partners, L.P., the Advisor, has a fee waiver arrangement in place to limit the Fund’s annual operating expenses.
Sector Allocation as a Percentage of Total Investments as of
March 31, 2022 (Unaudited)

The sector classifications represented in the graph above are in accordance with Global Industry Classification Standard (GICS®), which was developed by and/or is the exclusive property of MSCI, Inc. and Standard & Poor’s Financial Services LLC.
14
Brandes Emerging Markets Value Fund
Dear Fellow Investor,
The net asset value of the Brandes Emerging Markets Value Fund (Class I Shares) declined 11.23% in the six months ended March 31, 2022. During the same period, the MSCI Emerging Markets Index declined 8.20%.
At the onset, we are deeply saddened by the loss of life and the disruption being forced upon the people of Ukraine. Our thoughts continue to be with the people of Ukraine, as well as those in Russia that are advocating for peace. The events that have unfolded since the start of the Russian invasion of Ukraine in February have significantly elevated the risks and uncertainties associated with investments in Russian securities. The most significant detractors in the Fund during the period were our holdings domiciled in Russia, including Lukoil, Mobile TeleSystems and Sberbank.
Beyond Russia, we have also observed increased volatility within the Chinese equity market. Fresh COVID-related lockdowns and geopolitical issues (e.g., relations with Russia and Taiwan) were notable overhangs. Continued investor unease with ADRs (American depositary receipts) and overseas listings further pressured the market, along with regulatory risk on technology-related companies, property market instability, and concerns about economic growth. In mid-March, Vice Premier Liu He announced that the government would introduce policies that are expected to be favorable to the market. While the statement stabilized China’s financial markets momentarily, several of our holdings there performed poorly in recent months, most notably China Education Group, Chinasoft International, Midea and Weichai Power.
Other poor performers included Brazilian regional jet manufacturer Embraer and Mexican cement company Cemex. Embraer’s shares declined on lowered short-term margin guidance. We believe the market underappreciates the ongoing cycle recovery across Embraer’s products, which have seen their order backlog rise above pre-COVID levels. As the market is heavily focused on short-term, one-off item margin distortions, Embraer now trades at a wide discount to our estimate of its intrinsic value.
Additionally, our underweight to non-Russian commodities-oriented companies and allocation to the financials sector weighed on returns relative to the MSCI Emerging Markets Index.
Strong performers in the Fund included Brazilian holdings such as oil and gas firm Petrobras, Telefonica Brasil and wireless telecommunication services company TIM. Additionally, China based Wens Foodstuff Group saw its shares rise as strong peak-season demand led hog prices to increase materially from October 2021’s lows.
Although our overall exposure to the financials sector hurt relative returns, select bank holdings performed well. These included Bank Rakyat Indonesia, Thailand-based Bangkok Bank, Bank of the Philippine Islands, and newly added Erste Group Bank. Furthermore, the Fund’s underweight to China helped returns relative to the benchmark.
Select Portfolio Activity
| | | | |
| | | Past Performance is not a guarantee of future results. | | 15 |
Brandes Emerging Markets Value Fund
The emerging markets investment committee initiated several positions, including Erste Group Bank and LG Household & Healthcare.
Erste is a bank that we know well, having held it on multiple occasions, most recently in early 2020. While it is domiciled in Austria, the company operates throughout emerging Europe with a strong market position. Erste fell nearly 50% amid the Russia/Ukraine conflict, despite having no direct exposure to Russia, Ukraine, and Belarus. The company has performed stress-testing on its loans to account for the energy price increases and concluded there was no need for materially higher provisions, highlighting the strength of its loan portfolio.
LG Household & Health Care (LGHH) is a diversified consumer goods company based in South Korea. The company has enjoyed consistent growth, with revenues growing at a 10-year compounded rate of 13% annually (pre-pandemic) and operating profit at 18%, leading it to become South Korea’s top player in all three of its divisions: Beauty (cosmetic products), Health (health care and household products) and Refreshment (beverages).
LGHH’s flagship luxury cosmetics brand, The History of Whoo, has steadily been gaining share in the Chinese beauty market (its main market) as it benefited from the shift in consumer preferences from value to premium products, a trend that is expected to continue in the foreseeable future. Recently, however, sales have started to slow down, mainly due to the strict lockdowns in China and the related decline in the duty-free sales channel. As a result, LGHH’s shares fell over 30% in 2021.
We believe the market is applying an overly harsh scenario of permanently slower sales growth of LGHH’s cosmetic products, providing us with an opportunity to invest in a company with a solid market presence at appealing valuations. In our opinion, LGHH remains well positioned to benefit from the premiumization of China’s beauty market and from a rebound in sales as mobility restrictions ease in its main markets.
The emerging markets investment committee also took advantage of the increased volatility in China to add Topsports International Holdings to the Fund.
As China’s largest sportwear retailer, Topsports partners with international brands to sell their products through the company’s directly operated stores. Topsports’ largest and most significant partners are Nike and Adidas, two highly popular brands in China that account for nearly half of the country’s sportswear market in terms of sales. Topsports is Adidas’ largest global partner and Nike’s second-largest global partner, representing roughly half of Nike’s total sales in China.
In March 2021, Topsports’ shares reached highs after Nike reported strong sales in China, suggesting that the post-COVID demand recovery was underway. Since then, however, Topsports’ shares have declined materially on several factors:
• Short-term concerns around inventory shortages due to government-mandated production shutdowns;
• Increased geopolitical risks for Western brands selling in China;
• Tension over labor treatment in cotton-growing Xinjiang region;
16
Brandes Emerging Markets Value Fund
• Fresh lockdowns triggered by the Delta variant;
• Worries about the spillover effects of the property market downturn on consumption.
We believe these concerns have been accounted for in Topsports’ share price. Topsports is one of two Chinese sportwear companies (the other one being Pou Sheng International) with a national network of retail outlets. Over the past five years, it has outpaced its rival, achieving better topline growth and higher average operating margins. It is our view that the current manufacturing challenges will eventually subside and that Topsports is well positioned to benefit from China’s sportswear market growth, which is expected to be double-digit annually over the medium term. Furthermore, Adidas and Nike are looking to consolidate their retail partnerships, and we believe Topsports should be a beneficiary of this trend given its strong position in China and its established relationships with both brands.
Other major activity included the full sells of Thailand-based Siam Commercial Bank, India-based media company Zee Entertainment Enterprises, and Mexican beverage company Fomento Economico Mexicano (FEMSA). The committee also exited the Fund’s positions in China-based Wens Foodstuff, Argentina’s YPF and O2 Czech Republic, as well as Greece’s Hellenic Telecommunications. We exited these positions as the shares appreciated toward our estimates of their intrinsic values.
Looking Forward
As of March 31, 2022, the Fund held large sector overweights in real estate (note that we do not own any real estate holdings in China) and consumer discretionary, and key underweights to materials and financials. From a country perspective, even though Chinese companies made up the Fund’s largest allocation, we remained underweight relative to the benchmark. We also continued to be underweight India and Taiwan, while having a significant overweight to companies in Mexico, Indonesia and Brazil.
The world has changed significantly in the past couple months. With so many moving parts and ever-changing news flow, it is easy to get lost in the myriad of topical questions. It would be impossible to predict the outcomes of current world events and their impact on investment portfolios.
Looking forward, we believe the Brandes Emerging Markets Value Fund offers a diversified portfolio with exposure to the following factors:
• Post-COVID economic reopening/normalization: We believe our holdings in air travel, casino gaming and luxury retail, as well as those in China, Southeast Asia, and Latin America from a geographic standpoint, will benefit assuming the pandemic’s economic impact continues to ease.
• Inflation: While we make no attempt to forecast inflation, we believe the portfolio is well positioned for a rising inflation environment through our holdings in financials and real estate investment trusts with inflation-indexed rents, as well as high-yielding businesses. These holdings may benefit from net interest margin expansion should the
17
Brandes Emerging Markets Value Fund
yield curve steepen. Additionally, we have reduced the exposure to financial leverage among our non-financial holdings, which we believe is prudent given the potential impact of rising interest rates on the cash flows of these businesses.
• Long-term growth drivers in emerging markets: Our positions in consumer-related fields (e.g., e-commerce, food products, appliances, sportswear, cosmetics, education) provide exposure to the growing middle-class consumption in emerging markets.
We believe this positioning, combined with the Fund’s overall attractive valuation levels, bodes well for the Fund’s returns in the long term.
Sincerely yours,
The Brandes Emerging Markets Investment Committee
Brandes Investment Trust
American Depositary Receipt: A negotiable certificate issued by a U.S. depositary bank representing a specified number of shares—usually one share—of a foreign company’s stock.
Cash Flow: The amount of cash generated minus the amount of cash used by a company in a given period.
Net Interest Margin: Interest income generated by a financial institution minus the amount of interest paid to its lenders, divided by average earning assets.
Operating Margin: Operating income divided by net sales; used to measure a company’s operating efficiency.
Operating Profit: Earnings before interests and taxes.
Yield Curve: A yield curve shows the relation between the yield on debt instruments (i.e., annual income from the investment, divided by the current market price of the investment) and their times to maturity. A typical yield curve slopes upward to reflect higher interest rates for longer maturities.
Diversification does not assure a profit or protect against a loss in a declining market.
Because the values of the Fund’s investments will fluctuate with market conditions, so will the value of your investment in the Fund. You could lose money on your investment in the Fund, or the Fund could underperform other investments. The values of the Fund’s investments fluctuate in response to the activities of individual companies and general stock market and economic conditions. In addition, the performance of foreign securities depends on the political and economic environments and other overall economic conditions in the countries where the Fund invests. Emerging markets involve greater risk and volatility than more developed markets. Some emerging markets may have fixed or managed currencies that are not free-floating against the U.S. dollar. Certain of these currencies have experienced, and may experience in the future, substantial fluctuations or a steady devaluation relative to the U.S. dollar. Investments in small and medium capitalization companies tend to have limited liquidity and greater price volatility than investments in larger capitalization companies. Value
18
Brandes Emerging Markets Value Fund
stocks typically are less volatile than growth stocks; however, issues of value stocks typically have a lower expected growth rate in earnings and sales than issues of growth stocks.
Please refer to the Schedule of Investments in the report for complete holdings information. Fund holdings, geographic allocations and/or sector allocations are subject to change at any time and are not considered a recommendation to buy or sell any security.
The foregoing reflects the thoughts and opinions of Brandes Investment Partners® exclusively and is subject to change without notice.
Brandes Investment Partners® is a registered trademark of Brandes Investment Partners, L.P. in the United States and Canada.
Must be preceded or accompanied by a prospectus.
Index Guide
The MSCI Emerging Markets Index with net dividends captures large and mid cap representation of emerging market countries.
MSCI has not approved, reviewed or produced this report, makes no express or implied warranties or representations and is not liable whatsoever for any data in the report. You may not redistribute the MSCI data or use it as a basis for other indices or investment products.
One cannot invest directly in an index.
The Brandes Emerging Markets Value Fund is distributed by ALPS Distributors, Inc.
19
Brandes Emerging Markets Value Fund
The following chart compares the value of a hypothetical $100,000 investment in the Brandes Emerging Markets Value Fund – Class I from March 31, 2012 to March 31, 2022 with the value of such an investment in the MSCI Emerging Markets Index for the same period.
Value of $100,000 Investment vs MSCI
Emerging Markets Index (Unaudited)

| | | | | | | | | | | | | | | | |
| | | Average Annual Total Return | |
| | | Periods Ended March 31, 2022(1) | |
| | | One | | | Five | | | Ten | | | Since | |
| | | Year | | | Years | | | Years | | | Inception(2) | |
Brandes Emerging Markets Value Fund | | | | | | | | | | | | | | | | |
Class A | | | -12.39 | % | | | -0.78 | % | | | 0.25 | % | | | 5.89% | |
Class A (with maximum sales charge) | | | -17.42 | % | | | -1.94 | % | | | -0.34 | % | | | 5.65% | |
Class C(3) | | | -12.70 | % | | | -1.43 | % | | | -0.34 | % | | | 5.08% | |
Class C (3) (with maximum sales charge) | | | -13.55 | % | | | -1.43 | % | | | -0.34 | % | | | 5.08% | |
Class I | | | -12.35 | % | | | -0.58 | % | | | 0.48 | % | | | 6.11% | |
Class R6(4) | | | -12.18 | % | | | -0.42 | % | | | 0.60 | % | | | 6.20% | |
MSCI Emerging Markets Index | | | -11.37 | % | | | 5.98 | % | | | 3.36 | % | | | 5.93% | |
| (1) | Prior to January 31, 2011, the Advisor managed a private investment fund with an investment objective, investment policies and strategies that were, in all material respects, equivalent to those of the Brandes Emerging Markets Value Fund. The performance information shown for the Class I shares for periods before January 31, 2011 is that of the private investment fund and reflects the net expenses of the private investment fund. The performance of the private investment fund prior to January 31, 2011 is based on a calculation method that is different from the standardized calculation method prescribed by the SEC. The performance information shown for the Class A shares has been adjusted to reflect the differences in the net expense ratios between the Class I and A shares. The private investment fund was not registered under the Investment Company Act of 1940 (“1940 Act”) and was not subject to certain investment limitations, diversification requirements, and other restrictions imposed by the 1940 Act and the Internal Revenue Code of 1986, which, if applicable, may have adversely affected its performance. |
20
Brandes Emerging Markets Value Fund
| (2) | The inception date is August 20, 1996. |
| (3) | Performance shown prior to January 31, 2013 for Class C shares reflects the performance of Class I shares adjusted to reflect Class C expenses. Class C shares automatically convert to Class A shares if held for 8 years. The Class C shares’ average annual total return for the 10-year period assumes that Class C shares automatically converted to Class A shares on January 1, 2021. The Class C shares’ average annual total return for the since inception period does not reflect the automatic conversion to Class A shares, as Class A shares did not yet exist 8 years after the Fund’s inception date. |
| (4) | Performance shown prior to July 11, 2016 for Class R6 shares reflects the performance of Class I shares adjusted to reflect Class R6 expenses. |
Performance data quoted represents past performance; past performance does not indicate future results. The investment return and principal value of an investment will fluctuate so that an investor’s shares, when redeemed, may be worth more or less than their original cost. Current performance of the Fund may be lower or higher than the performance quoted. Performance data current to the most recent month end may be obtained by calling 800-331-2979.
The returns shown do not reflect the deduction of taxes that a shareholder would pay on fund distributions or the redemption of fund shares. Brandes Investment Partners, L.P., the Advisor, has a fee waiver arrangement in place to limit the Fund’s annual operating expenses.
Sector Allocation as a Percentage of Total Investments as of
March 31, 2022 (Unaudited)
The sector classifications represented in the graph above are in accordance with Global Industry Classification Standard (GICS®), which was developed by and/or is the exclusive property of MSCI, Inc. and Standard & Poor’s Financial Services LLC.
21
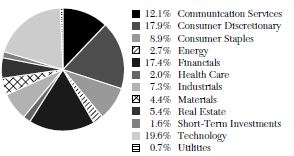
Brandes International Small Cap Equity Fund
Dear Fellow Investor,
The net asset value of the Brandes International Small Cap Equity Fund (Class I Shares) fell 10.21% in the six months ended March 31, 2022. During the same period, the S&P Developed Ex-U.S. SmallCap Index fell 8.52%.
From a country perspective, holdings in Canada contributed meaningfully to performance, led by Dorel Industries and uranium companies Cameco Corporation and Sprott Physical Uranium Trust, which both benefited from a sharp increase in commodity prices.
Other notable positive contributors included South Korean gas utility Samchully,U.K. energy equipment company TechnipFMC, Mexican real estate investment trust Fibra Uno,and Japan Petroleum Exploration. Additionally, Italian defense company Leonardo SpA, a new addition in the first quarter, saw its share price increase on the prospect for higher defense spending in Europe.
European markets and emerging markets experienced the steepest decline in the period as geopolitical concerns related to the Russia/Ukraine conflict exacerbated inflationary trends and triggered worries about an economic slowdown. The Fund does not have any direct investments in Russia or Ukraine. While select holdings do have some indirect exposure to the countries, our overall portfolio revenue exposure is less than that of the S&P Developed ex-U.S. SmallCap Index.
Among the Fund’s largest detractors were several of our consumer and construction materials-related holdings, led by French catering services provider Elior Group and U.K. retailer Marks & Spencer, as well as cement companies Buzzi Unicem (Italy), Cemex (Mexico) and Vicat (France). Elior suspended its earnings guidance in January, citing a lack of visibility regarding the impact of the strict health protocols implemented to stifle the Omicron COVID variant. In early March, the company’s chief executive officer unexpectedly resigned. We believe that these challenges are temporary in nature and that the company warrants a continued inclusion in the Fund’s portfolio.
Other detractors included industrial holdings Embraer and De La Rue,German health care equipment supplier Draegerwerk, and Hong Kong-based payment services provider PAX Global Technology Limited.
Brazilian jet manufacturer Embraer gave back some of its strong performance over the past 18 months as it declined on lowered short-term margin guidance. We believe the market underappreciates the ongoing cycle recovery across Embraer’s products, which have seen their order backlog rise above pre-COVID levels. As the market is heavily focused on short-term, one-off item margin distortions, Embraer now trades at a wide discount to our estimate of its intrinsic value.
Select Portfolio Activity
The small-cap investment committee initiated positions in Hong Kong-based YueYuen, U.K. defense technology company QinetiQ, Ireland-based food products company Greencore Group, Japanese entertainment business DeNA,
| | | | |
| 22 | | Past Performance is not a guarantee of future results. | | |
Brandes International Small Cap Equity Fund
U.K.-domiciled energy equipment company TechnipFMC, as well as the aforementioned Leonardo SpA.
Founded in 1988, Yue Yuen is the world’s largest manufacturer of branded athletic and casual footwear, producing nearly 250 million pairs of shoes in the fiscal year 2020 as an original equipment manufacturer for major brands such as Nike and Adidas, which together account for almost two-thirds of Yue Yuen’s sales, as well as Reebok, Asics, New Balance, and Puma. The company also has a majority stake in sportswear (athletic shoes and apparel) retailer Pou Sheng.
We see significant value potential in Yue Yuen. While volume growth has been muted in recent years as key customers have been working to reduce inventories and demanding shorter lead times, Yue Yuen has maintained a strong pricing power which is attributable to increased popularity of athletic shoes and a style shift toward more complex designs. Provided COVID-related conditions continue to improve, the industry is expected to grow at mid-single digits. Furthermore, we believe Yue Yuen is well positioned to expand its operating margins, which have been negatively affected by forced factory closures and occupancy reductions (for social distancing). Although the timing of the recovery is impossible to predict, it is our opinion that Yue Yuen’s current share price is overly discounted, providing us with what we consider a compelling entry point for an investment.
TechnipFMC (FTI) is the product of a 2016 merger between Technip, a leading engineering, procurement and construction company (EPC), and FMC, a leading provider of subsea production and processing equipment. The rationale of the merger was to combine equipment manufacturing with engineering and construction of subsea oilfields. Earlier this year, the company completed a long-planned separation of its onshore EPC business, making it purely focused on offshore oilfield exploration and development.
With an over 40% market share, FTI is the industry leader in subsea systems, highly engineered capital goods that reside on the seabed producing and processing hydrocarbons. The subsea industry has been in a multi-year slump following a decade of high oil prices. Capital expenditures (capex) among upstream oil and gas companies (FTI’s customer base) reached highs in 2014 and are estimated to be less than half of the peak levels in 2021. In addition to the collapse in capex, there has been a shift of investment to unconventional opportunities on land. The overall effect has been a sustained period of low manufacturing utilization, high price competition and distressed profitability for the subsea industry.
While a return to peak capex is unlikely, we believe a gradual increase in offshore activity is in the cards given two main factors: 1) global demand growth has been stable or growing; and 2) poor returns from onshore unconventional production over the past decade may be an indication that more capital should flow elsewhere (or oil prices need to be substantially higher). In our view, FTI is well positioned to benefit from the potentially improved offshore activity considering its industry-leading position in subsea equipment and engineering, as well as its fully integrated business model.
23
Brandes International Small Cap Equity Fund
Furthermore, we appreciate that FTI has made several investments to capitalize on its offshore development expertise and seek to benefit from a global energy transition, including subsea carbon transportation and storage, floating renewable power generation (offshore wind) and hydrogen production, storage and re-electrification.
During the period, the investment committee exited several positions in Spain, namely Atresmedia, Bankinter, CaixaBank and Linea Directa Aseguradora. Other full sells were Canadian Corby Spirit and Wine and insurer E-L Financial, utility First Philippine Holdings, and South Korea-based Lotte Confectionary.
Looking Forward
Value stocks (as measured by the S&P Developed ex-U.S. SmallCap Value Index) outperformed the broader market (S&P Developed ex-U.S. SmallCap Index) noticeably at the start of the year when rising inflation and interest rates caused the valuations of many high-flying growth companies to compress. Geopolitical developments in the second half of the quarter (i.e., the Russia/Ukraine conflict) have exacerbated inflationary trends and triggered concerns about an economic slowdown, raising the potential for a “stagflationary” environment (low economic growth and elevated inflation).
In the beginning of 2022, we were optimistic that improving economic growth and an uptick in inflation (after a decade-plus of weak growth and almost no inflation before COVID-19) would benefit value stocks—especially given the historically wide valuation discounts at which value stocks traded relative to growth (S&P Developed ex-U.S. SmallCap Growth Index). However, with inflation persisting and economic growth potentially slowing, we are often asked if these factors change our outlook for value stocks. While it is true that weaker growth may present a headwind for value stocks (all else being equal), it is not always the case. In fact, two of the best periods for value versus growth were the post-Nifty Fifty era in the 1970s (during which the term “stagflation” was first widely used) and the post-tech bubble correction of the early 2000s. These periods shared common attributes that catalyzed the favorable environment for value: they were preceded by a period of elevated general market valuations and historically wide discount levels for value relative to growth.
In terms of portfolio positioning, there were no wholesale changes in the period. From a sector standpoint, the Fund held its largest weights in industrials (although underweight relative to the benchmark), consumer staples and financials. While returns for the industrials sector were negative in the quarter, the Fund’s weighting to industrials increased slightly with the additions of defense companies Leonardo SpA and QinetiQ. The Fund maintained underweights in technology and materials, and continued to have significant exposure to Japan, the U.K., and emerging markets.
We remain excited about the prospects of the Brandes International Small Cap Equity Fund and appreciate your continued trust.
24
Brandes International Small Cap Equity Fund
Sincerely yours,
The Brandes Small-Cap Investment Committee
Brandes Investment Trust
Dividend Yield: Dividends per share divided by price per share.
Nifty Fifty: A popular name in the 1960s and 70s for a group of the largest US companies.
Operating Margin: Operating income divided by net sales; used to measure a company’s operating efficiency.
Stagflation: Combination of slow economic growth and high inflation.
Diversification does not assure a profit or protect against a loss in a declining market.
Because the values of the Fund’s investments will fluctuate with market conditions, so will the value of your investment in the Fund. You could lose money on your investment in the Fund, or the Fund could underperform other investments. The values of the Fund’s investments fluctuate in response to the activities of individual companies and general stock market and economic conditions. In addition, the performance of foreign securities depends on the political and economic environments and other overall economic conditions in the countries where the Fund invests. Emerging country markets involve greater risk and volatility than more developed markets. Some emerging markets countries may have fixed or managed currencies that are not free-floating against the U.S. dollar. Certain of these currencies have experienced, and may experience in the future, substantial fluctuations or a steady devaluation relative to the U.S. dollar. Investments in small and medium capitalization companies tend to have limited liquidity and greater price volatility than investments in larger capitalization companies. Value stocks typically are less volatile than growth stocks; however, issues of value stocks typically have a lower expected growth rate in earnings and sales than issues of growth stocks.
Please refer to the Schedule of Investments in the report for complete holdings information. Fund holdings, geographic allocations and/or sector allocations are subject to change at any time and are not considered a recommendation to buy or sell any security.
The foregoing reflects the thoughts and opinions of Brandes Investment Partners® exclusively and is subject to change without notice.
Brandes Investment Partners® is a registered trademark of Brandes Investment Partners, L.P. in the United States and Canada.
Must be preceded or accompanied by a prospectus.
Index Guide
The S&P Developed Ex-U.S. SmallCap Index with net dividends measures the equity performance of small-capitalization companies from developed markets excluding the United States.
25
Brandes International Small Cap Equity Fund
The S&P Developed Ex U.S. SmallCap Value Index with net dividends measures the equity performance of small cap companies in developed markets excluding the United States, which are classified as value stocks by book value-to-price, sales-to-price, cash flow-to-price, and dividend yield.
The S&P Developed Ex-U.S. SmallCap Growth Index measures the equity performance of small cap companies in developed markets excluding the United States, which are classified as growth stocks by 5-year historical earnings per share growth, 5-year historical sales per share growth, and 5-year average annual internal growth rate.
One cannot invest directly in an index.
The Brandes International Small Cap Equity Fund is distributed by ALPS Distributors, Inc.
26
Brandes International Small Cap Equity Fund
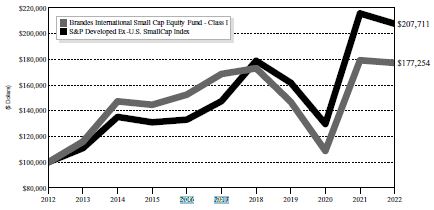
The following chart compares the value of a hypothetical $100,000 investment in the Brandes International Small Cap Fund – Class I from March 31, 2012 to March 31, 2022 with the value of such an investment in the S&P Developed Ex-U.S. SmallCap Index for the same period.
Value of $100,000 Investment vs S&P Developed
Ex-U.S. SmallCap Index (Unaudited)
| | | | | | | | | | | | | | | | |
| | | Average Annual Total Return | |
| | | Periods Ended March 31, 2022(1) | |
| | | One | | | Five | | | Ten | | | Since | |
| | | Year | | | Years | | | Years | | | Inception(2) | |
Brandes International Small Cap Equity Fund | | | | | | | | | | | | | | | | |
Class A | | | -1.28 | % | | | 0.80 | % | | | 5.66 | % | | | 8.19% | |
Class A (with maximum sales charge) | | | -6.95 | % | | | -0.38 | % | | | 5.04 | % | | | 7.94% | |
Class C(3) | | | -1.52 | % | | | 0.15 | % | | | 5.05 | % | | | 7.40% | |
Class C (3) (with maximum sales charge) | | | -2.45 | % | | | 0.15 | % | | | 5.05 | % | | | 7.40% | |
Class I | | | -1.14 | % | | | 1.00 | % | | | 5.89 | % | | | 8.43% | |
Class R6(4) | | | -1.06 | % | | | 1.10 | % | | | 5.98 | % | | | 8.50% | |
S&P Developed Ex-U.S. SmallCap Index | | | -3.72 | % | | | 7.09 | % | | | 7.58 | % | | | 6.71% | |
| (1) | Prior to February 1, 2012, the Advisor managed a private investment fund with an investment objective, investment policies and strategies that were, in all material respects, equivalent to those of the Brandes International Small Cap Fund. The performance information shown for the Class I shares for periods before February 1, 2012 is that of the private investment fund and reflects the net expenses of the private investment fund. The performance of the private investment fund prior to February 1, 2012 is based on a calculation method that is different from the standardized calculation method prescribed by the SEC. The performance information shown for the Class A shares has been adjusted to reflect the differences in the net expense ratios between the Class I and A shares. The private investment fund was not registered under the Investment Company Act of 1940 (“1940 Act”) and was not subject to certain investment |
Brandes International Small Cap Equity Fund
| | limitations, diversification requirements, and other restrictions imposed by the 1940 Act and the Internal Revenue Code of 1986, which, if applicable, may have adversely affected its performance. |
| (2) | The inception date is August 19, 1996. |
| (3) | Performance shown prior to January 31, 2013 for Class C shares reflects the performance of Class I shares adjusted to reflect Class C expenses. Class C shares automatically convert to Class A shares if held for 8 years. The Class C shares’ average annual total return for the 10-year period assumes that Class C shares automatically converted to Class A shares on January 1, 2021. The Class C shares’ average annual total return for the since inception period does not reflect the automatic conversion to Class A shares, as Class A shares did not yet exist 8 years after the Fund’s inception date. |
| (4) | Performance shown prior to June 27, 2016 for Class R6 shares reflects the performance of Class I shares adjusted to reflect Class R6 expenses. |
Performance data quoted represents past performance; past performance does not indicate future results. The investment return and principal value of an investment will fluctuate so that an investor’s shares, when redeemed, may be worth more or less than their original cost. Current performance of the Fund may be lower or higher than the performance quoted. Performance data current to the most recent month end may be obtained by calling 800-331-2979.
The returns shown do not reflect the deduction of taxes that a shareholder would pay on fund distributions or the redemption of fund shares. Brandes Investment Partners, L.P., the Advisor, has a fee waiver arrangement in place to limit the Fund’s annual operating expenses.
Sector Allocation as a Percentage of Total Investments as of
March 31, 2022 (Unaudited)
The sector classifications represented in the graph above are in accordance with Global Industry Classification Standard (GICS®), which was developed by and/or is the exclusive property of MSCI, Inc. and Standard & Poor’s Financial Services LLC.
28
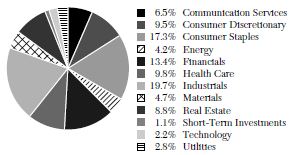
Brandes Small Cap Value Fund
Dear Fellow Investor,
The net asset value of the Brandes Small Cap Value Fund (Class I Shares) rose 2.58% in the six months ended March 31, 2022. During the same period, the Russell 2000 Index fell 5.55%.
Given the recent sharp increase in commodity prices, the strongest performers were companies that directly benefitted from that increase. Oil- and gas-related companies performed exceptionally well, led by Dril-Quip, Helmerich & Payne, Chesapeake Energy and Halliburton. Uranium company Sprott Physical Uranium Trust also performed well.
Other strong contributors included Canadian household durables manufacturer Dorel Industries, machinery business Flowserve, professional services companies Kelly Services and Science Applications International (SAIC).
As geopolitical concerns increased in lock step with worries about inflation and the potential for “stagflation,” the broad U.S. small cap market (as measured by the Russell 2000 Index) declined. The impact was primarily led by technology companies because their valuations tend to be materially influenced by rising interest rates. For the Fund, major detractors included communications equipment companies Ribbon Communications and NETGEAR.
Other detractors included holdings in the industrials sector, namely aircraft manufacturer Embraer, vacuum and heat transfer equipment manufacturer Graham Corporation and Orion Group. Embraer saw its stock decline on its reduced short-term margin guidance. However, over the longer term, we believe the market is missing the ongoing cycle recovery across the company’s portfolio. While the market is heavily focused on short-term, one-off item margin distortions, Embraer’s order backlog has already risen above pre-COVID levels. The company is trading at a wide discount to our estimate of its long-term intrinsic value, and we added to our position.
Select Portfolio Activity
We sold our stakes in Varex Imaging Corporation, Utah Medical Products, Halliburton and Helmerich & Payne.
During the period, the small-cap investment committee initiated positions in Kelly Services, Science Applications International Corporation, office furniture company Kimball International, Ribbon Communications, commercial services & supplies provider Steelcase, and machinery business Flowserve. We also took advantage of share price weakness and added to our investments in consumer products company Edgewell Personal Care, computer networking company NETGEAR.
Founded in 1946, Kelly Services has evolved from a U.S.-based company concentrating primarily on traditional office staffing into a global workforce solutions provider. Kelly Services is the fourth-largest staffing company in the U.S. Most of its operations are still derived from lower-end office services, education, contact center, light industrial and
| | | | |
| | | Past Performance is not a guarantee of future results. | | 29 |
Brandes Small Cap Value Fund
electronic assembly staffing. It has also been attempting to expand into more complex areas and claims to have a unique talent supply chain management approach to help many of the world’s largest companies plan for and manage their workforces. Those areas involve outsourcing, consulting, recruitment, career transition and vendor management services.
Kelly Services had begun to recover from the unemployment peak (revenues and unemployment have typically been inversely related) caused by COVID-19 and had proceeded with its plan to expand into higher-margin, specialty businesses. However, the share price was down in the second half of 2021 and early 2022, likely due to COVID spikes derailing the path to a more normal business environment. We believe this offered an opportunity to purchase one of the top players in the professional services industry trading at a discount to tangible book value with a strong net cash balance sheet, enabling it to weather economic volatility.
Science Applications International Corporation is the fifth-largest government IT services contractor and operates a capital-light business model that has generated strong free cash flow. We believe that SAIC trades at an attractive valuation and should continue to be a defensive business with at least low single-digit organic growth driven by greater alignment with budget priorities of the defense and civilian agencies. Continued solid free cash flow generation would allow it to deleverage its balance sheet over the next few years, and it also has a track record of returning some excess free cash flow to shareholders via buybacks and dividends.
Under the name of a predecessor entity, Flowserve was founded in 1912. Today, the firm develops and manufactures precision-engineered equipment integral to the movement, control and protection of the flow of materials in critical processes and also provides aftermarket services for these complex systems. Flowserve has underperformed during the past year due to the cyclical aspects of its business; recent results were also hampered by supply chain issues affecting many businesses around the world. However, we believe these challenges are temporary and have created a buying opportunity.
Looking Forward
Value stocks (as measured by the Russell 2000 Value Index) outperformed the broader market (Russell 2000 Index) noticeably at the start of the year when rising inflation and interest rates caused many high-flying growth company valuations to compress. Geopolitical developments in the second half of the quarter (i.e., the invasion of Ukraine) have exacerbated inflationary trends and increased worries about a slowdown in growth, raising the potential for a “stagflationary” environment (low economic growth and elevated inflation).
In the beginning of 2022, we were optimistic that improving economic growth and an uptick in inflation (after a decade-plus of weak growth and almost no inflation before COVID-19) would benefit value stocks—especially against the preferable valuation
30
Brandes Small Cap Value Fund
discounts value stocks traded at relative to growth. With inflation persisting and growth potentially slowing, we are often asked if these factors change our outlook for value stocks. Weaker growth may be a headwind for value stocks all else being equal, but that has rarely been the case. In fact, two of the best periods for value versus growth were the post-Nifty Fifty era in the 1970s (during which the term “stagflation” was first widely used) and the post-tech bubble correction of the early 2000s. The common factors of these two periods resulting in highly favorable value environments were: markets were in a state of elevated valuations and the spread between value and growth was at historical levels.
From a positioning standpoint, our largest sector overweights were in industrials and energy, and we continued to find value in health care companies, although we are underweight relative to the Russell 2000 Index. We are markedly underweight companies in the financials, real estate, information technology and consumer discretionary sectors.
In our opinion, the differences between the Brandes Small Cap Value Fund and the broader market continue to make it an attractive complement to other small-cap offerings. The Fund exhibits lower valuations than the Russell 2000 Index. We believe our holdings have strong balance sheets, compelling growth prospects and are able to generate durable free cash flow. Compared with the Russell 2000 Value Index, the Fund has significantly less exposure to financials and real estate.
As always, we appreciate the trust you have placed in us.
Sincerely yours,
The Brandes Small-Cap Investment Committee
Brandes Investment Trust
Book Value: Assets minus liabilities. Also known as shareholders’ equity.
Cash Flow: The amount of cash generated minus the amount of cash used by a company in a given period.
Free Cash Flow: Total cash flow from operations less capital expenditures.
Forward Price/Earnings: Price per share divided by earnings per share expected over the next 12 months.
Net Cash: Total cash minus total debt.
Nifty Fifty: A popular name in the 1960s and ‘70s for a group of the largest U.S. companies.
Stagflation: Combination of slow economic growth and high inflation.
Tangible Book Value: Book value minus intangible assets (e.g., goodwill).
Diversification does not assure a profit or protect against a loss in a declining market.
31
Brandes Small Cap Value Fund
Because the values of the Fund’s investments will fluctuate with market conditions, so will the value of your investment in the Fund. You could lose money on your investment in the Fund, or the Fund could underperform other investments. The values of the Fund’s investments fluctuate in response to the activities of individual companies and general stock market and economic conditions. Investments in small and medium capitalization companies tend to have limited liquidity and greater price volatility than investments in larger capitalization companies. Value stocks typically are less volatile than growth stocks; however, issues of value stocks typically have a lower expected growth rate in earnings and sales than issues of growth stocks.
Please refer to the Schedule of Investments in the report for complete holdings information. Fund holdings, geographic allocations and/or sector allocations are subject to change at any time and are not considered a recommendation to buy or sell any security.
The foregoing reflects the thoughts and opinions of Brandes Investment Partners® exclusively and is subject to change without notice.
Brandes Investment Partners® is a registered trademark of Brandes Investment Partners, L.P. in the United States and Canada.
Must be preceded or accompanied by a prospectus.
Index Guide
The Russell 2000 Index with gross dividends measures the performance of the small cap segment of the U.S. equity universe.
The Russell 2000 Value Index with gross dividends measures performance of the small cap value segment of the U.S. equity universe. Securities are categorized as growth or value based on their relative book-to-price ratios, historical sales growth, and expected earnings growth.
One cannot invest directly in an index.
The Brandes Small Cap Value Fund is distributed by ALPS Distributors, Inc.
32
Brandes Small Cap Value Fund
The following chart compares the value of a hypothetical $100,000 investment in the Brandes Small Cap Value Fund – Class I from March 31, 2012 to March 31, 2022 with the value of such an investment in the Russell 2000 Total Return Index and Russell 2000 Value Total Return Index for the same period.
Value of $100,000 Investment vs Russell 1000 Total
Return Index & Russell 1000 Value Total
Return Index(Unaudited)
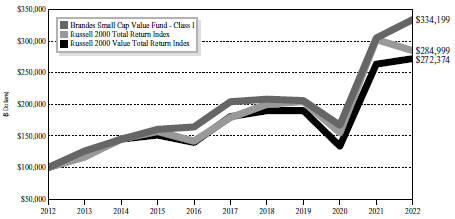
| | | | | | | | | | | | | | | | |
| | | Average Annual Total Return
Periods Ended March 31, 2022(2) | |
| | | One
Year | | | Five
Years | | | Ten
Years | | | Since
Inception(1) | |
Brandes Small Cap Value Fund | | | | | | | | | | | | | | | | |
Class A | | | 9.23 | % | | | 10.03 | % | | | 12.53 | % | | | 7.71% | |
Class A (with maximum sales charge) | | | 2.92 | % | | | 8.75 | % | | | 11.88 | % | | | 7.45% | |
Class I | | | 9.58 | % | | | 10.36 | % | | | 12.82 | % | | | 7.99% | |
Class R6(3) | | | 10.17 | % | | | 9.10 | % | | | 12.18 | % | | | 7.73% | |
Russell 2000 Total Return Index | | | -5.79 | % | | | 9.74 | % | | | 11.04 | % | | | 7.79% | |
Russell 2000 Value Total Return Index | | | 3.32 | % | | | 8.57 | % | | | 10.54 | % | | | 8.52% | |
| (1) | The inception date is September 30, 1997. |
| (2) | Prior to January 2, 2018, the Advisor managed a private investment fund with an investment objective, investment policies and strategies that were, in all material respects, equivalent to those of the Brandes Small Cap Value Fund. The performance information shown for the Class I shares for periods before January 2, 2018 is that of the private investment fund and reflects the net expenses of the private investment fund. The performance of the private investment fund prior to January 2, 2018 is based on a calculation method that is different from the standardized calculation method prescribed by the SEC. The performance information shown for the Class A shares has been adjusted to reflect the differences in the net expense ratios between the Class I and A shares. |
| (3) | Performance shown prior to January 2, 2018 for Class R6 shares reflects the performance of Class I shares. The private investment fund was not registered under the Investment Company Act of 1940 (“1940 Act”) |
33
Brandes Small Cap Value Fund
| | and was not subject to certain investment limitations, diversification requirements, and other restrictions imposed by the 1940 Act and the Internal Revenue Code of 1986, which, if applicable, may have adversely affected its performance. |
Performance data quoted represents past performance; past performance does not indicate future results. The investment return and principal value of an investment will fluctuate so that an investor’s shares, when redeemed, may be worth more or less than their original cost. Current performance of the Fund may be lower or higher than the performance quoted. Performance data current to the most recent month end may be obtained by calling 800-331-2979.
The returns shown do not reflect the deduction of taxes that a shareholder would pay on Fund distributions or the redemption of Fund shares. Brandes Investment Partners, L.P., the Advisor, has a fee waiver arrangement in place to limit the Fund’s annual operating expenses.
Sector Allocation as a Percentage of Total Investments as of
March 31, 2022 (Unaudited)
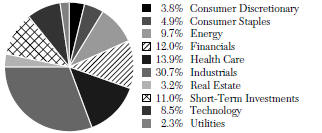
The sector classifications represented in the graph above are in accordance with Global Industry Classification Standard (GICS®), which was developed by and/or is the exclusive property of MSCI, Inc. and Standard & Poor’s Financial Services LLC.
34
Brandes U.S. Value Fund
Dear Fellow Investor,
The net asset value of the Brandes U.S. Value Fund (Class I Shares) gained 6.14% in the six months ended March 31, 2022. During the same period, the Russell 1000 Value Index gained 5.65% and the Russell 1000 Index increased 2.97%.
Rising energy prices benefited our oil-related companies, including integrated oil firm Chevron and oil field services company Halliburton. Rising commodity prices also aided our materials investments, namely Corteva and Westlake.
Other contributors included pharmaceutical distributor McKesson, advertising agency Omnicom, and aerospace and defense company General Dynamics.
As geopolitical concerns increased in lock step with worries about inflation and the potential for “stagflation” during the first quarter, the broad U.S. market (as measured by the Russell 1000 Index) declined. During the six months ending March 31, 2022, the Fund’s largest detractors were holdings in the banking, household durables and consumer finance industries. Citigroup, flooring company Mohawk Industries and OneMain Holdings were among the worst performers.
Among the Fund’s holdings, Mohawk has the highest exposure to Russia at about 4% of total sales, although the company does have some manufacturing facilities in Eastern European countries such as Poland. As a flooring manufacturer and distributor, Mohawk has experienced material cost inflation which could pressure short-term margins, but over the longer term we believe its advantaged position should enable it to manage these costs better than many competitors. After its recent decline, the stock trades at a single digit multiple of earnings, which we believe allows for an attractive return over time.
While household durables company Taylor Morrison Home performed well during the previous year’s strong housing market, the shares have pulled back recently amid anxiety about the consequences of rising mortgage rates. However, at the company’s current valuation of only 3x forward earnings, and given the lack of new housing built over the past decade, we believe these factors are fully reflected in Taylor Morrison’s share price.
Select Portfolio Activity
The investment committee initiated positions in semiconductor firm Qorvo, insurance broker and benefits firm Willis Towers Watson (WTW) and industrial equipment firm Gates Industrial.
Qorvo was formed in 2015 via the merger of TriQuint Semiconductor and RF Micro Devices. The company is now the second-largest independent radio frequency (RF) front-end component supplier and offers products that are critical for transmitting radio signals to, and receiving them from, a smartphone’s cellular modem.
Most of Qorvo’s revenue comes from the smartphone market. It has a strong competitive position and should continue to benefit from the transition to 5G-enabled
| | | | |
| | | Past Performance is not a guarantee of future results. | | 35 |
Brandes U.S. Value Fund
phones, which include significantly more RF components per phone (3G phones average $8 of RF components versus 5G at $25). Additionally, the company earns almost one-third of its revenue outside of smartphone end-markets, and will likely derive a benefit from the growing Internet of Things (IoT) applications for internet-connected appliances and devices.
Qorvo’s shares have declined due to concerns about supply chain constraints and a slowdown in the smartphone market, especially in China which accounts for the largest share of Qorvo’s revenue. Over the longer term, we believe that Qorvo’s supply chain constraints will be resolved and that it offers an appealing way to benefit from the growth of RF content per 5G phone, as well as the proliferation of internet-connected devices globally. At a current valuation of less than 10x our estimate of normalized earnings, we feel the company offers a desirable risk/reward tradeoff.
Willis Towers Watson (WTW) is the third-largest retail insurance broker in the United States. The company offers insurance brokerage, actuarial support, consulting, pension plan design, risk broking and benefits outsourcing. WTW’s share price declined over the past year when an intended acquisition by Aon fell through for anti-trust reasons. WTW is now working to turn around its standalone business, with a new management team and a reconstituted board of directors.
Overall, we believe WTW is an appealing business with good cash flow generation and a strong balance sheet that trades at an attractive valuation level, especially as it works on raising its margins closer to those of its insurance broker peers. Additionally, several activist investors have bought WTW shares to push for its turnaround, and WTW has announced it will be returning a significant amount of excess cash to shareholders over the next 18 months, equal to about 15% of its market cap.
We also initiated a position in Gates Industrial, a global manufacturer of power transmission and fluid power solutions used across a variety of industrial applications. The company is the market leader in belts, hoses, hydraulics and engine systems used by automobile manufacturers, heavy duty trucks, construction and mining, as well as industrial and oil and gas end markets. Demand for its products is largely driven by replacement demand and the cost of product failure is high relative to the component cost, giving Gates pricing power that would be beneficial in an inflationary environment.
Gates was fully owned by private equity firm Blackstone until it went public in 2018, and Blackstone still owns roughly two-thirds of the company today. Blackstone’s partial ownership divestment likely created some overhang on Gates’ stock price, contributing to its recent underperformance. Additionally, Gates has suffered from the well-publicized supply chain issues which have kept the company from meeting end-demand. We feel Gates now trades at an attractive valuation and should benefit from an improvement in economic and industrial activity, as well as the resolution of supply-chain constraints.
36
Brandes U.S. Value Fund
During the period, the investment committee divested the Fund’s holdings in biotechnology firm Gilead Sciences and real estate investment trust Mid-America Apartment Communities (MAA). Real estate markets and rents have continued to see strong price appreciation, which has significantly benefited MAA. We divested MAA when its share price reached our estimate of its intrinsic value. Additionally, we sold long-time holding in beverage and snack company PepsiCo., the world’s second-largest food and beverage company, as the stock price exceeded our estimate of intrinsic value.
Looking Forward
Value stocks (as measured by the Russell 1000 Value Index) outperformed the broader market (Russell 1000 Index) noticeably at the start of the year when rising inflation and interest rates caused many high-flying growth company valuations to compress. Geopolitical developments in the second half of the quarter (i.e., the invasion of Ukraine) have exacerbated inflationary trends, increased worries about a slowdown in growth, and raised the potential for a “stagflationary” environment (low economic growth and elevated inflation).
Heading into 2022, we were optimistic that improving economic growth and an uptick in inflation (after a decade-plus of weak growth coupled with low and declining interest rates) would benefit value stocks—especially against the valuation discounts value stocks traded at relative to growth stocks. With inflation persisting and growth potentially slowing, we are often asked if these factors change our outlook for value stocks. While weaker growth may be a headwind for value stocks all else being equal, it’s rarely “all else equal.” In fact, two of the best periods for value stocks relative to growth stocks were during the 1970s following the “Nifty Fifty” era (during which the term “stagflation” was first widely used) and the post-tech bubble correction of the early 2000s.
The common factors leading up to these two periods of significant value outperformance were a) U.S. stocks in general were trading at very elevated valuations, and b) the valuation spreads between value and growth stocks were at historically elevated levels – both of which we are experiencing today.
From an industry/sector standpoint, the Fund’s largest relative overweight positions remained in the economically sensitive financials sector, the more defensive health care sector and various areas within the technology sector that are exposed to secular growth at what we consider to be reasonable valuations.
While we feel our health care holdings generally exhibit defensive and high-quality characteristics, many also show the potential to benefit from the resumption of elective procedures that may have been delayed during the pandemic. With regard to our financial holdings, in addition to the tailwind from loan growth and capital returns, many of them should also benefit from the increase in interest rates that we are now starting to experience. Finally, our overweight to the technology sector includes several
37
Brandes U.S. Value Fund
companies with exposure to secular megatrends like artificial intelligence, fintech, and 5G (companies such as Micron, Fiserv and Qorvo) at what we consider to be very reasonable valuations.
Our most significant underweights are in consumer staples, utilities and real estate, which appear generally expensive to us other than a few specific opportunities.
We believe the differences between the Brandes U.S. Value Fund and the broader market continue to make the Fund an attractive complement to more index-like or growth-oriented alternatives.
Looking ahead to this year and beyond, we remain optimistic about the Fund’s prospects given what we consider to be an attractive environment for value investing, and the Fund’s historic tendency to outperform the Russell 1000 Value Index during periods of value outperformance (Russell 1000 Value vs. Russell 1000).
As always, we thank you for the trust you have placed in us.
Sincerely yours,
The Brandes Global Large-Cap Investment Committee
Brandes Investment Trust
Cash Flow: The amount of cash generated minus the amount of cash used by a company in a given period.
Forward Price/Earnings: Price per share divided by earnings per share expected over the next 12 months.
Market Capitalization (Cap): The number of common shares outstanding multiplied by the current market price per common share.
Nifty Fifty: A popular term in the 1960s and ‘70s for a group of the largest U.S. companies.
Normalized Earnings: Earnings adjusted based on economic cycles.
Price/Earnings: Price per share divided by earnings per share.
Stagflation: Combination of slow economic growth and high inflation.
Diversification does not assure a profit or protect against a loss in a declining market.
Because the values of the Fund’s investments will fluctuate with market conditions, so will the value of your investment in the Fund. You could lose money on your investment in the Fund, or the Fund could underperform other investments. The values of the Fund’s investments fluctuate in response to the activities of individual companies and general stock market and economic conditions. Investments in small and medium capitalization companies tend to have limited liquidity and greater price volatility than investments in larger capitalization companies. Value stocks typically are less volatile than growth stocks; however, issues of value stocks typically have a lower expected growth rate in earnings and sales than issues of growth stocks.
38
Brandes U.S. Value Fund
Please refer to the Schedule of Investments in the report for complete holdings information. Fund holdings, geographic allocations and/or sector allocations are subject to change at any time and are not considered a recommendation to buy or sell any security.
The foregoing reflects the thoughts and opinions of Brandes Investment Partners® exclusively and is subject to change without notice.
Brandes Investment Partners® is a registered trademark of Brandes Investment Partners, L.P. in the United States and Canada.
Must be preceded or accompanied by a prospectus.
Index Guide
The Russell 1000 Value Index with gross dividends measures performance of the large cap segment of the U.S. equity universe. Securities are categorized as growth or value based on their relative book-to-price ratios, historical sales growth, and expected earnings growth.
The Russell 1000 Index with gross dividends measures performance of the large cap segment of the U.S. equity universe.
One cannot invest directly in an index.
The Brandes U.S. Value Fund is distributed by ALPS Distributors, Inc.
39
Brandes U.S. Value Fund
The following chart compares the value of a hypothetical $100,000 investment in the Brandes U.S. Value Fund – Class I from October 1, 2021 to March 31, 2022 with the value of such an investment in the Russell 1000 Total Return Index and Russell 1000 Value Total Return Index for the same period.
Value of $100,000 Investment vs Russell 1000 Total
Return Index & Russell 1000 Value Total
Return Index(Unaudited)
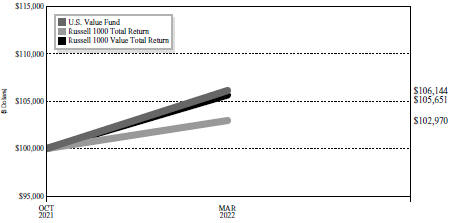
| | | | | | | | |
| | | Average Annual Total Return
Periods Ended March 31, 2022 | |
| | | YTD | | | Since
InceptionR |
Brandes U.S. Value Fund | | | | | | | | |
Class A | | | -0.10% | | | | 6.35% | |
Class A (with maximum sales charge) | | | -5.87% | | | | 0.24% | |
Class I | | | -0.11% | | | | 6.14% | |
Class R6 | | | -0.28% | | | | 6.16% | |
Russell 1000 Total Return | | | -5.13% | | | | 2.97% | |
Russell 1000 Value Total Return | | | -0.74% | | | | 5.65% | |
| R | Commencement of operations on October 1, 2021. |
Performance data quoted represents past performance; past performance does not indicate future results. The investment return and principal value of an investment will fluctuate so that an investor’s shares, when redeemed, may be worth more or less than their original cost. Current performance of the Fund may be lower or higher than the performance quoted. Performance data current to the most recent month end may be obtained by calling 800-331-2979.
The returns shown do not reflect the deduction of taxes that a shareholder would pay on Fund distributions or the redemption of Fund shares. Brandes
40
Brandes U.S. Value Fund
Investment Partners, L.P., the Advisor, has a fee waiver arrangement in place to limit the Fund’s annual operating expenses.
Sector Allocation as a Percentage of Total Investments as of
March 31, 2022 (Unaudited)
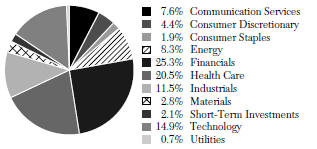
The sector classifications represented in the graph above are in accordance with Global Industry Classification Standard (GICS®), which was developed by and/or is the exclusive property of MSCI, Inc. and Standard & Poor’s Financial Services LLC.
41
Brandes Core Plus Fixed Income Fund
Dear Fellow Investor,
In the six months ended March 31, 2022, the Brandes Core Plus Fixed Income Fund (Class I Shares) declined 5.27%, while its benchmark, the Bloomberg Barclays U.S. Aggregate Bond Index, declined 5.92%.
Boxing great Mike Tyson once said: “Everyone has a plan until they get punched in the mouth.” The swift repricing of fixed income markets in the first quarter 2022, the likes which we have not seen since the 1970s, appeared to knock the Federal Reserve (Fed) and many investors on their heels.
During this time, the Fed was forced to quickly pivot from their plan of slowly and methodically winding down the most accommodative monetary policy in their history, to aggressively updating their forecasts for future rate hikes and balance sheet reductions.
In mid-December 2021 the Fed released its closely watched “dot plot”1, which pegged the median forecast for the fed funds rate at 0.81% for year-end 2022 and 1.65% for year-end 2023. The updated March dot plot pegged the median fed funds rate at 2.05% for year-end 2022 and 2.81% for year-end 2023. This represents an abrupt upward shift in just three months and is particularly interesting in the context of the Fed’s view that the long-term normalized fed funds rate is 2.5%. The updated dot plot forecasts imply that the Fed believes that they will have to aggressively tighten above the projected long-term normalized rate to tame inflation. That is a considerable about-face from the transitory narrative that dominated their thinking for the better part of the past two years.
Market expectations have abruptly changed as well. During the fourth quarter 2021 we observed the disconnect between the Fed’s forward interest rate guidance and market expectations, noting that market expectations for the terminal fed funds rate were much lower than Fed guidance. As the market has reset future expectations guided by the newly hawkish Fed, rates have swiftly moved higher to levels not seen in several years.
After two years of a global health pandemic, during recent months the world has had to grapple with the worst outbreak of European military violence since World War II. Navigating monetary policy through this turbulent time has undoubtedly been a difficult task, but history will likely show that the Fed has simply waited too long to begin policy normalization and hence has run the risk of falling well behind the curve on inflation. Many commentators (including ourselves) have made this accusation, and we finally feel like we are no longer the old man yelling at the clouds when it comes to expressing concerns about inflation.
We have previously accused the Fed of being guilty of policy inertia and we have hoped that inertia would not lead to a policy error. It increasingly looks like the Fed has indeed made a policy error with its continuation of unprecedented stimulus well after the initial shock of the pandemic receded. As a result, taming inflation while achieving a
| | |
| 42 | | Past Performance is not a guarantee of future results. |
Brandes Core Plus Fixed Income Fund
soft landing for the economy has become decidedly more difficult and could lead to additional market volatility.
During the trailing six-month period ending March 31, 2022, holdings in energy (Range Resources & Occidental Petroleum), services (Prime Security Services) and healthcare (Tenet Healthcare) aided returns.
Select holdings in banking (U.S. Bank & Goldman Sachs) and telecom (Telecom Italia) detracted from returns.
The fund’s underweight to agency mortgage-backed securities (MBS) aided performance during the period.
Term-structure positioning was a positive factor in performance as interest rates rose sharply. The fund was positioned near the bottom of its duration-controlled band during the period, helping to mitigate the impact of rising rates on a relative basis.
Select Portfolio Activity
During the period, the Fund added new positions in Mauser Packaging (7.25% coupon, maturing 4/15/25, rated Caa3/CCC), Charles Schwab Inc. (5.375% coupon, perpetual, callable 6/1/25, rated Baa2/BBB), Citigroup Inc. (4.40% coupon, maturing 6/10/25, rated Baa2/BBB), Methanex Corp (5.125% coupon, maturing 10/15/27, rated Ba1/BB), Coty Inc. secured debt (5.00% coupon, maturing 4/15/26, rated B1/B+) and American Transmission System (2.65% coupon, maturing 1/15/32, rated A3/BBB).
We believe that the Charles Schwab bond that we purchased is a good example of a situation where the distinctive structure of the security presents an attractive value opportunity. This bond is a junior subordinated security – it ranks lower in the company’s capital structure. It pays a fixed-rate coupon until June 2025. If the bond is not called in June 2025, it will become a perpetual security, and its coupon will revert to a floating rate based on the 5-year U.S. Treasury rate plus 4.97% - with a quarterly reset. The reset rate will be at a yield spread that is similar to where low-quality high yield bonds generally trade.
The distinctive feature of this bond is that if Charles Schwab chooses not to call the security in June 2025, the company does not have the option to call it again for an additional five years. At today’s interest rates the coupon would reset to nearly 7%. Given the relatively high cost of a coupon reset and the limited flexibility offered to the company for future calls, we believe that this bond is best treated as a bullet security with a 3-year maturity.
Charles Schwab issued this bond in April 2020 during the early stages of the pandemic, which we believe is the likely explanation of why the bond’s structure is not representative of the strong underlying credit quality of the company. As a result, this represents an attractive value opportunity to us.
43
Brandes Core Plus Fixed Income Fund
Coty Inc. is a world leader in beauty with 75 brands and is home to well-known brands such as CoverGirl, Clairol and Max Factor. The company experienced turnover in the chief executive officer’s (CEO’s) chair with four different CEOs in 2020. Additionally, the pandemic affected revenues as beauty sales suffered in a world dominated by Zoom calls.
However, Coty is in the early stages of an operational turnaround centered on three key initiatives: 1) shifting the mix toward prestige brands with a focus on clean and green—i.e., CoverGirl Clean Fresh vegan makeup; 2) stabilizing its mass market beauty portfolio; and 3) reducing leverage through applying strong operational cash flows to paying down debt and divesting non-core brands.
As the pandemic recedes and more people can return to the office, travel, and engage in leisure activities, we believe Coty is well positioned to benefit from positive industry trends, as well as specific steps the company has taken to strengthen its balance sheet and product portfolio.
American Transmission System is a regulated operating company of First Energy. We believe the company’s bonds offer an attractive higher-quality position within the First Energy capital structure.
The Fund also added to existing positions in MicroStrategy, Netflix, Allison Transmission and Telecom Italia.
The Fund exited our full position in Occidental Petroleum (3.50% coupon, maturing 6/15/25, rated Ba1/BB+), experienced a full call in Range Resources (9.25% coupon, maturing 2/1/26, rated B1/BB-), and saw maturities in Microsoft Corp. and ExxonMobil.
Outlook
From a total return perspective, the performance of virtually the entire fixed income universe was quite painful during the first quarter of 2022. Interest rates moved up swiftly from a very low base, leading to negative returns across the fixed income spectrum.
As the second quarter of 2022 begins, higher yields in the market and in the Fund can help cushion some of the impact if we are in the midst of secular change to a higher rate environment. With any investment, and in particular fixed income, time horizon is important. In the short-term, interest rate increases can cause negative total returns. However, over a longer time horizon, higher rates should allow a diversified portfolio to generate a higher level of income.
For a considerable period now, we have attempted to tilt the Brandes Core Plus Fixed Income Fund into what we believe is a defensive posture in order to mitigate some of the detrimental impact of higher interest rates and wider yield spreads. The Fund continues to favor shorter-maturity corporate bonds and those that we believe exhibit strong, tangible asset coverage. We are managing duration toward the shorter end of
44
Brandes Core Plus Fixed Income Fund
our duration-controlled range. We have a substantial allocation to U.S. Treasuries and if recent market uncertainty and volatility continues to cause credit fundamentals to become mispriced relative to our estimates of intrinsic value, then we will look to redeploy some of those Treasury holdings thoughtfully and effectively to take advantage of opportunities.
We remain underweight Agency mortgage-backed securities. In March, the Fed finally wrapped up their temporary support for a market where they have been making outright purchases since 2008. We are cautious on this market, given that the Fed owns 37% of the universe and has been absorbing nearly 50% of supply since March 2020.2
While the amount of Agency mortgage-backed securities supply could slow if interest rates continue to move higher, it remains to be seen how the market will respond to the withdrawal of explicit central bank support.
As we move forward, we believe prudence dictates that we continue our search for value at the margins while continuing to tilt the Fund to what we believe is a relatively defensive posture.
As always, thank you for your business and continued trust.
Sincerely yours,
The Brandes Fixed Income Investment Committee
Brandes Investment Trust
1 Bloomberg, Federal Reserve, 12/15/21, and 3/17/22
2 Mortgage QE 2020-22: A Look Back and Ahead, Bloomberg Intelligence, 3/14/22
Agency mortgage-backed securities (MBS): An MBS issued by one of three quasi-governmental agencies: The Government National Mortgage Association (GNMA or Ginnie Mae), the Federal National Mortgage Association (FNMA or Fannie Mae), and the Federal Home Loan Mortgage Corporation (Freddie Mac). A MBS is an investment similar to a bond that is made up of a bundle of home loans bought from the banks that issued them.
Asset Coverage: Measures how well a company can repay its debts by selling or liquidating its assets.
Bullet security: a debt investment whose entire principal value is paid in one lump sum on its maturity date, rather than amortized over its lifetime.
Cash Flow: The amount of cash generated minus the amount of cash used by a company in a given period.
Coupon: The annual interest rate paid on a bond, expressed as a percentage of the face value and paid from issue date until maturity.
Dot Plot: Data points that are plotted on a graph and is used by the Federal Reserve to show its projected interest-rate outlook. Source: Investopedia
45
Brandes Core Plus Fixed Income Fund
Duration: The weighted maturity of a fixed-income investment’s cash flows, used in the estimation of the price sensitivity of fixed-income securities for a given change in interest rates.
Mortgage-Backed Security: A type of asset-backed security which is secured by a mortgage or collection of mortgages.
Secured Debt: Debt that is backed by collateral to reduce the risk associated with lending. Source: Investopedia
Total Return: Income plus capital appreciation.
Yield: Annual income from the investment (dividend, interest, etc.) divided by the current market price of the investment.
Yield Spread: The net difference between two interest-bearing instruments of varying maturities, credit ratings, issuer or risk level.
Short-term debt refers to fixed income securities set to mature in 1 to 5 years from the issue or purchase date. Long-term debt refers to fixed income securities set to mature more than 10 years from the issue or purchase date.
Diversification does not assure a profit or protect against a loss in a declining market.
Because the values of the fund’s investments will fluctuate with market conditions, so will the value of your investment in the fund. You could lose money on your investment in the fund, or the fund could underperform other investments. The values of the fund’s investments fluctuate in response to the activities of individual companies and general bond market and economic conditions. Investments in small and medium capitalization companies tend to have limited liquidity and greater price volatility than large capitalization companies.
As with most fixed income funds, the income on and value of your shares in the fund will fluctuate along with interest rates. When interest rates rise, the market prices of the debt securities the fund owns usually decline. When interest rates fall, the prices of these securities usually increase. Generally, the longer the fund’s average portfolio maturity and the lower the average quality of its portfolio, the greater the price fluctuation. The price of any security owned by the fund may also fall in response to events affecting the issuer of the security, such as its ability to continue to make principal and interest payments or its credit rating. Below investment grade debt securities are speculative and involve a greater risk of default and price change due to changes in the issuer’s creditworthiness than higher grade debt. The market prices of these debt securities may fluctuate more than the market prices of investment grade debt securities and may decline significantly in periods of general economic difficulty.
Credit ratings are measured on a scale that generally ranges from AAA (highest) to D (lowest). All Fund securities except for those labeled “Not Rated” and “Other” have been
46
Brandes Core Plus Fixed Income Fund
rated by Moody’s, S&P or Fitch, which are each a Nationally Recognized Statistical Rating Organization. All Index securities except for those labeled “Not Rated” have been rated by Moody’s or S&P. Credit ratings are subject to change.
Index securities except for those labeled “Not Rated” have been rated by Moody’s or S&P. Credit ratings are subject to change.
Please refer to the Schedule of Investments in the report for complete holdings information. Fund holdings, geographic allocations and/or sector allocations are subject to change at any time and are not considered a recommendation to buy or sell any security.
The foregoing reflects the thoughts and opinions of Brandes Investment Partners® exclusively and is subject to change without notice.
Brandes Investment Partners® is a registered trademark of Brandes Investment Partners, L.P. in the United States and Canada.
Must be preceded or accompanied by a prospectus.
Index Guide
The Bloomberg Barclays U.S. Aggregate Bond Index is a broad-based benchmark that measures the investment grade, U.S. dollar-denominated, fixed-rate taxable bond market. This index is a total return index which reflects the price changes and interest of each bond in the index.
One cannot invest directly in an index.
The Brandes Core Plus Fixed Income Fund is distributed by ALPS Distributors, Inc.
47
Brandes Core Plus Fixed Income Fund
The following chart compares the value of a hypothetical $100,000 investment in the Brandes Core Plus Fixed Income Fund – Class I from March 31, 2012 to March 31, 2022 with the value of such an investment in the Bloomberg U.S. Aggregate Bond Index for the same period.
Value of $100,000 Investment vs Bloomberg
U.S. Aggregate Bond Index (Unaudited)

| | | | | | | | | | | | | | | | |
| | | Average Annual Total Return | |
| | | Periods Ended March 31, 2022 | |
| | | One | | | Five | | | Ten | | | Since | |
| | | Year | | | Years | | | Years | | | Inception(1) | |
Brandes Core Plus Fixed Income Fund | | | | | | | | | | | | | | | | |
Class A(2) | | | -3.63 | % | | | 1.54 | % | | | 2.20 | % | | | 2.95% | |
Class A (2) (with maximum sales charge) | | | -7.23 | % | | | 0.76 | % | | | 1.82 | % | | | 2.67% | |
Class I | | | -3.39 | % | | | 1.82 | % | | | 2.52 | % | | | 3.25% | |
Class R6(2) | | | -2.21 | % | | | 2.68 | % | | | 2.98 | % | | | 3.59% | |
Bloomberg Barclays U.S. Aggregate Bond Index | | | -4.15 | % | | | 2.14 | % | | | 2.24 | % | | | 3.39% | |
| (1) | The inception date is December 28, 2007. |
| (2) | Performance shown prior to January 31, 2013 for Class A shares reflects the performance of Class I shares adjusted to reflect Class A expenses. Performance shown prior to October 10, 2017 for Class R6 shares reflects the performance of Class I shares adjusted to reflect Class R6 expenses. |
Performance data quoted represents past performance; past performance does not indicate future results. The investment return and principal value of an investment will fluctuate so that an investor’s shares, when redeemed, may be worth more or less than their original cost. Current performance of the Fund may be lower or higher than the performance quoted. Performance data current to the most recent month end may be obtained by calling 800-331-2979.
48
Brandes Core Plus Fixed Income Fund
The returns shown do not reflect the deduction of taxes that a shareholder would pay on fund distributions or the redemption of Fund shares. Brandes Investment Partners, L.P., the Advisor, has a fee waiver arrangement in place to limit the Fund’s annual operating expenses.
Asset Allocation as a Percentage of Total Investments as of
March 31, 2022 (Unaudited)
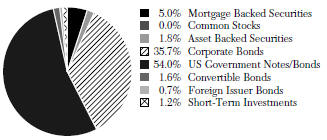
49
Brandes Investment Trust
Expense Example (Unaudited)
As a shareholder of a Fund, you incur ongoing costs, including investment advisory and administrative fees and other fund expenses. The examples below are intended to help you understand your ongoing costs (in dollars) of investing in the Funds and to compare these costs with ongoing costs of investing in other mutual funds.
The examples are based on an investment of $1,000 invested at the beginning of the period and held for the entire period from October 1, 2021 to March 31, 2022 (the “Period”).
Actual Expenses
This section provides information about actual account values and actual expenses. The “Ending Account Value” shown is derived from each Fund’s actual return. You may use the information in this section, together with the amount you invested, to estimate the expenses that you paid over the period. Simply divide your account value by $1,000 (for example, an $8,600 account value divided by $1,000 = 8.6), then multiply the result by the number given for the Fund under the heading “Expenses Paid During Period” to estimate the expenses you paid on your account during this period.
| | | | | | | | | | | | | | | | |
| | | Class A |
Fund | | Beginning
Account
Value | | | Ending
Account
Value | | | Annualized
Expense
Ratio | | Expenses
Paid
During
the Period |
International Equity Fund | | $ | 1,000.00 | | | $ | 964.60 | | | 1.11% | | | | | | $5.44R |
Global Equity Fund | | $ | 1,000.00 | | | $ | 1,007.50 | | | 1.25% | | | | | | $6.26R |
Emerging Markets Value Fund | | $ | 1,000.00 | | | $ | 887.30 | | | 1.31% | | | | | | $6.16R |
International Small Cap Fund | | $ | 1,000.00 | | | $ | 897.40 | | | 1.35% | | | | | | $6.39R |
Small Cap Value Fund | | $ | 1,000.00 | | | $ | 1,024.60 | | | 1.15% | | | | | | $5.80R |
U.S. Value Fund | | $ | 1,000.00 | | | $ | 1,063.50 | | | 0.95% | | | | | | $4.86RR |
Core Plus Fixed Income Fund | | $ | 1,000.00 | | | $ | 945.80 | | | 0.50% | | | | | | $2.43R |
| |
| | | Class C |
Fund | | Beginning
Account
Value | | | Ending
Account
Value | | | Annualized
Expense
Ratio | | Expenses
Paid
During
the Period |
International Equity Fund | | $ | 1,000.00 | | | $ | 961.00 | | | 1.86% | | | | | | $9.09R |
Global Equity Fund | | $ | 1,000.00 | | | $ | 1,003.60 | | | 2.00% | | | | | | $9.99R |
Emerging Markets Value Fund | | $ | 1,000.00 | | | $ | 883.80 | | | 2.06% | | | | | | $9.67R |
International Small Cap Fund | | $ | 1,000.00 | | | $ | 893.80 | | | 2.10% | | | | | | $9.92R |
50
Brandes Investment Trust
| | | | | | | | | | | | | | | | |
| | | Class I |
Fund | | Beginning
Account
Value | | | Ending
Account
Value | | | Annualized
Expense
Ratio | | Expenses
Paid
During
the Period |
International Equity Fund | | $ | 1,000.00 | | | $ | 966.10 | | | 0.85% | | | | | | $4.17R |
Global Equity Fund | | $ | 1,000.00 | | | $ | 991.40 | | | 1.00% | | | | | | $4.96R |
Emerging Markets Value Fund | | $ | 1,000.00 | | | $ | 887.70 | | | 1.12% | | | | | | $5.27R |
International Small Cap Fund | | $ | 1,000.00 | | | $ | 897.90 | | | 1.15% | | | | | | $5.44R |
Small Cap Value Fund | | $ | 1,000.00 | | | $ | 1,025.80 | | | 0.90% | | | | | | $4.55R |
U.S. Value Fund | | $ | 1,000.00 | | | $ | 1,061.40 | | | 0.70% | | | | | | $3.58RR |
Core Plus Fixed Income Fund | | $ | 1,000.00 | | | $ | 947.40 | | | 0.30% | | | | | | $1.46R |
| |
| | | Class R6 |
Fund | | Beginning
Account
Value | | | Ending
Account
Value | | | Annualized
Expense
Ratio | | Expenses
Paid
During
the Period |
International Equity Fund | | $ | 1,000.00 | | | $ | 966.20 | | | 0.75% | | | | | | $3.68R |
Emerging Markets Value Fund | | $ | 1,000.00 | | | $ | 889.10 | | | 0.97% | | | | | | $4.57R |
International Small Cap Fund | | $ | 1,000.00 | | | $ | 898.30 | | | 1.00% | | | | | | $4.73R |
Small Cap Value Fund | | $ | 1,000.00 | | | $ | 1,027.70 | | | 0.72% | | | | | | $3.64R |
U.S. Value Fund | | $ | 1,000.00 | | | $ | 1,061.60 | | | 0.60% | | | | | | $3.07RR |
Core Plus Fixed Income Fund | | $ | 1,000.00 | | | $ | 953.40 | | | 0.30% | | | | | | $1.46R |
| R | The Fund’s expenses are equal to the Fund’s expense ratio for the period, multiplied by the average account value over the period, multiplied by 182/365 (to reflect the one half-year period). |
| RR | The Fund’s expenses are equal to the Fund’s expense ratio for the period, multiplied by the average account value over the period, multiplied by 181/365 (to reflect the one half-year period). |
Hypothetical Example for Comparison Purposes
This section provides information about hypothetical account values and hypothetical expenses based on the Funds’ actual expense ratios and an assumed rate of return of 5% per year before expenses, which are not the Funds’ actual returns. The hypothetical account values and expenses may not be used to estimate the actual ending account balance or expenses you paid for the period. You may use this information to compare the ongoing costs of investing in the Funds and other mutual funds. To do so, compare this 5% hypothetical example with the 5% hypothetical examples that appear in the shareholder reports of the other mutual funds.
Please note that the expenses shown in the table are meant to highlight your ongoing costs only and do not reflect any transaction costs, such as brokerage commissions on purchase and sales of Fund shares. Therefore, the last column of the table is useful in comparing ongoing costs only, and will not help you determine the relative total costs of owning different funds. In addition, if these transactional costs were included, your costs would have been higher.
51
Brandes Investment Trust
| | | | | | | | | | | | | | | | |
| | | Class A |
Fund | | Beginning
Account
Value | | | Ending
Account
Value | | | Annualized
Expense
Ratio | | Expenses
Paid
During
the Period |
International Equity Fund | | $ | 1,000.00 | | | $ | 1,019.40 | | | 1.11% | | | | | | $5.59R |
Global Equity Fund | | $ | 1,000.00 | | | $ | 1,018.70 | | | 1.25% | | | | | | $6.29R |
Emerging Markets Value Fund | | $ | 1,000.00 | | | $ | 1,018.40 | | | 1.31% | | | | | | $6.59R |
International Small Cap Fund | | $ | 1,000.00 | | | $ | 1,018.20 | | | 1.35% | | | | | | $6.79R |
Small Cap Value Fund | | $ | 1,000.00 | | | $ | 1,019.20 | | | 1.15% | | | | | | $5.79R |
U.S. Value Fund | | $ | 1,000.00 | | | $ | 1,020.08 | | | 0.95% | | | | | | $4.76RR |
Core Plus Fixed Income Fund | | $ | 1,000.00 | | | $ | 1,022.44 | | | 0.50% | | | | | | $2.52R |
| |
| | | Class C |
Fund | | Beginning
Account
Value | | | Ending
Account
Value | | | Annualized
Expense
Ratio | | Expenses
Paid
During
the Period |
International Equity Fund | | $ | 1,000.00 | | | $ | 1,015.66 | | | 1.86% | | | | | | $ 9.35R |
Global Equity Fund | | $ | 1,000.00 | | | $ | 1,014.96 | | | 2.00% | | | | | | $10.05R |
Emerging Markets Value Fund | | $ | 1,000.00 | | | $ | 1,014.66 | | | 2.06% | | | | | | $10.35R |
International Small Cap Fund | | $ | 1,000.00 | | | $ | 1,014.46 | | | 2.10% | | | | | | $10.55R |
| |
| | | Class I |
Fund | | Beginning
Account
Value | | | Ending
Account
Value | | | Annualized
Expense
Ratio | | Expenses
Paid
During
the Period |
International Equity Fund | | $ | 1,000.00 | | | $ | 1,020.69 | | | 0.85% | | | | | | $4.28R |
Global Equity Fund | | $ | 1,000.00 | | | $ | 1,019.95 | | | 1.00% | | | | | | $5.04R |
Emerging Markets Value Fund | | $ | 1,000.00 | | | $ | 1,019.35 | | | 1.12% | | | | | | $5.64R |
International Small Cap Fund | | $ | 1,000.00 | | | $ | 1,019.20 | | | 1.15% | | | | | | $5.79R |
Small Cap Value Fund | | $ | 1,000.00 | | | $ | 1,020.44 | | | 0.90% | | | | | | $4.53R |
U.S. Value Fund | | $ | 1,000.00 | | | $ | 1,021.32 | | | 0.70% | | | | | | $3.51RR |
Core Plus Fixed Income Fund | | $ | 1,000.00 | | | $ | 1,023.44 | | | 0.30% | | | | | | $1.51R |
| |
| | | Class R6 |
Fund | | Beginning
Account
Value | | | Ending
Account
Value | | | Annualized
Expense
Ratio | | Expenses
Paid
During
the Period |
International Equity Fund | | $ | 1,000.00 | | | $ | 1,021.19 | | | 0.75% | | | | | | $3.78R |
Emerging Markets Value Fund | | $ | 1,000.00 | | | $ | 1,020.09 | | | 0.97% | | | | | | $4.89R |
International Small Cap Fund | | $ | 1,000.00 | | | $ | 1,019.95 | | | 1.00% | | | | | | $5.04R |
Small Cap Value Fund | | $ | 1,000.00 | | | $ | 1,021.34 | | | 0.72% | | | | | | $3.63R |
U.S. Value Fund | | $ | 1,000.00 | | | $ | 1,021.82 | | | 0.60% | | | | | | $3.01RR |
Core Plus Fixed Income Fund | | $ | 1,000.00 | | | $ | 1,023.44 | | | 0.30% | | | | | | $1.51R |
| R | The Fund’s expenses are equal to the Fund’s expense ratio for the period, multiplied by the average account value over the period, multiplied by 182/365 (to reflect the one half-year period). |
52
Brandes Investment Trust
| RR | The Fund’s expenses are equal to the Fund’s expense ratio for the period, multiplied by the average account value over the period, multiplied by 181/365 (to reflect the one half-year period). |
53
Brandes International Equity Fund
SCHEDULE OF INVESTMENTS — March 31, 2022 (Unaudited)
| | | | | | | | |
| Shares | | | | | Value | |
| | COMMON STOCKS – 91.74% | |
| | Belgium – 1.49% | |
| | 164,338 | | | Anheuser-Busch InBev SA/NV | | $ | 9,825,459 | |
| | | | | | | | |
|
| | Brazil – 5.55% | |
| | 3,441,600 | | | Ambev SA | | | 11,132,132 | |
| | 907,636 | | | Embraer SA Sponsored – ADR(a) | | | 11,445,290 | |
| | 1,250,800 | | | Telefonica Brasil SA | | | 14,105,177 | |
| | | | | | | | |
| | | | | | | 36,682,599 | |
| | | | | | | | |
|
| | China – 2.49% | |
| | 1,203,500 | | | Alibaba Group Holding Ltd.(a) | | | 16,423,819 | |
| | | | | | | | |
|
| | France – 18.28% | |
| | 182,548 | | | BNP Paribas SA | | | 10,431,645 | |
| | 852,822 | | | Carrefour SA | | | 18,559,174 | |
| | 260,289 | | | Danone SA | | | 14,379,145 | |
| | 1,096,002 | | | Engie SA | | | 14,409,141 | |
| | 1,082,792 | | | Orange SA | | | 12,821,665 | |
| | 238,165 | | | Publicis Groupe SA | | | 14,455,106 | |
| | 124,687 | | | Renault SA(a) | | | 3,259,326 | |
| | 159,487 | | | Sanofi | | | 16,305,896 | |
| | 144,167 | | | Societe BIC SA | | | 7,283,765 | |
| | 175,660 | | | TotalEnergies SE | | | 8,888,318 | |
| | | | | | | | |
| | | | | | | 120,793,181 | |
| | | | | | | | |
|
| | Germany – 5.92% | |
| | 339,841 | | | Fresenius & Co. KGaA | | | 12,477,763 | |
| | 219,159 | | | HeidelbergCement AG | | | 12,420,660 | |
| | 215,587 | | | Henkel AG & Co. KGaA | | | 14,229,747 | |
| | | | | | | | |
| | |
| | | | | | | 39,128,170 | |
| | | | | | | | |
|
| | Hong Kong – 0.73% | |
| | 11,842,000 | | | First Pacific Co. Ltd. | | | 4,784,616 | |
| | | | | | | | |
|
| | Italy – 5.39% | |
| | 450,604 | | | Buzzi Unicem SpA | | | 8,338,501 | |
| | 666,439 | | | Eni SpA | | | 9,718,831 | |
| | 5,256,037 | | | Intesa Sanpaolo SpA | | | 12,029,838 | |
| | 16,264,983 | | | Telecom Italia Rsp | | | 5,516,594 | |
| | | | | | | | |
| | | | | | | 35,603,764 | |
| | | | | | | | |
|
| | Japan – 14.59% | |
| | 199,800 | | | Dai Nippon Printing Co. Ltd. | | | 4,684,345 | |
| | | | | | | | |
| Shares | | | | | Value | |
| | 362,200 | | | Honda Motor Co. Ltd. | | $ | 10,266,864 | |
| | 2,132,500 | | | Mitsubishi UFJ Financial Group, Inc.(b) | | | 13,181,282 | |
| | 400,799 | | | MS&AD Insurance Group Holdings, Inc. | | | 13,013,117 | |
| | 1,200,000 | | | Nissan Motor Co. Ltd.(a) | | | 5,331,992 | |
| | 156,900 | | | SoftBank Group Corp. | | | 7,014,944 | |
| | 299,200 | | | Sumitomo Mitsui Trust Holdings, Inc. | | | 9,737,356 | |
| | 190,900 | | | Taisho Pharmaceutical Holdings Co. Ltd. | | | 8,861,886 | |
| | 853,683 | | | Takeda Pharmaceutical Co. Ltd. | | | 24,323,327 | |
| | | | | | | | |
| | | | | | | 96,415,113 | |
| | | | | | | | |
| |
| | Mexico – 4.10% | | | | |
| | 1,893,829 | | | Cemex SAB de CV Sponsored – ADR(a) | | | 10,018,355 | |
| | 14,564,736 | | | Fibra Uno Administracion SA de CV | | | 17,061,757 | |
| | | | | | | | |
| | | | | | | 27,080,112 | |
| | | | | | | | |
| |
| | Netherlands – 1.03% | | | | |
| | 1,283,691 | | | Aegon NV | | | 6,805,016 | |
| | | | | | | | |
| |
| | Russia – 0.20% | | | | |
| | 1,013,133 | | | Mobile TeleSystems Public Joint Stock Company(c) | | | 1,344,897 | |
| | | | | | | | |
| |
| | South Korea – 4.35% | | | | |
| | 150,417 | | | Hana Financial Group, Inc. | | | 5,982,561 | |
| | 46,455 | | | Hyundai Mobis Co. Ltd. | | | 8,187,722 | |
| | 129,701 | | | KT&G Corp. | | | 8,629,015 | |
| | 24,810 | | | POSCO | | | 5,951,267 | |
| | | | | | | | |
| | | | | | | 28,750,565 | |
| | | | | | | | |
| |
| | Spain – 0.96% | | | | |
| | 485,099 | | | Repsol SA | | | 6,354,410 | |
| | | | | | | | |
| |
| | Switzerland – 10.98% | | | | |
| | 1,836,533 | | | Credit Suisse Group AG Registered | | | 14,457,400 | |
| | 192,185 | | | Novartis AG Registered | | | 16,872,220 | |
The accompanying notes to financial statements are an integral part of these Schedule of Investments.
54
Brandes International Equity Fund
SCHEDULE OF INVESTMENTS — March 31, 2022 (Unaudited) (continued)
| | | | | | | | |
| Shares | | | | | Value | |
| | 16,342 | | | Swatch Group AG Bearer | | $ | 4,633,349 | |
| | 171,045 | | | Swatch Group AG Registered | | | 9,307,632 | |
| | 107,656 | | | Swiss Re AG | | | 10,248,200 | |
| | 872,235 | | | UBS Group AG Registered | | | 17,044,613 | |
| | | | | | | | |
| | | | | | | 72,563,414 | |
| | | | | | | | |
| |
| | United Kingdom – 15.68% | | | | |
| | 3,210,487 | | | Barclays Plc | | | 6,223,454 | |
| | 1,919,259 | | | BP Plc | | | 9,408,942 | |
| | 997,306 | | | GlaxoSmithKline Plc | | | 21,578,666 | |
| | 400,385 | | | Imperial Brands Plc | | | 8,434,009 | |
| | 3,445,836 | | | J Sainsbury Plc | | | 11,404,985 | |
| | 1,902,868 | | | Kingfisher Plc | | | 6,351,103 | |
| | 3,252,132 | | | Marks & Spencer Group Plc(a) | | | 6,563,976 | |
| | 57,832 | | | Reckitt Benckiser Group Plc | | | 4,411,770 | |
| | 691,451 | | | TechnipFMC Plc(a) | | | 5,358,745 | |
| | | | | | | | |
| Shares | | | | | Value | |
| | 3,044,705 | | | Tesco Plc | | $ | 11,022,764 | |
| | 979,508 | | | WPP Plc | | | 12,819,896 | |
| | | | | | | | |
| | | | | | | 103,578,310 | |
| | | | | | | | |
| |
| TOTAL COMMON STOCKS
(Cost $653,594,119) | | $ | 606,133,445 | |
| | | | | | | | |
| | PREFERRED STOCKS – 5.09% | | | | |
| |
| | Brazil – 2.37% | | | | |
| | 2,233,200 | | | Petroleo Brasileiro SA, 8.75%(d) | | $ | 15,689,930 | |
| | | | | | | | |
| |
| | Russia – 0.21% | | | | |
| | 21,512,699 | | | Surgutneftegas PJSC, 0%(c),(d) | | | 1,407,942 | |
| | | | | | | | |
| |
| | Spain – 2.51% | | | | |
| | 1,399,701 | | | Grifols SA – Class B, 6.46%(d) | | | 16,552,778 | |
| | | | | | | | |
| |
| TOTAL PREFERRED STOCKS
(Cost $39,763,184) | | $ | 33,650,650 | |
| | | | | | | | |
| | | | | | | | |
| | | Shares | | | Value | |
| | |
SHORT-TERM INVESTMENTS – 2.49% | | | | | | | | |
| | |
Money Market Funds — 2.49% | | | | | | | | |
Northern Institutional Funds - Treasury Portfolio (Premier), 0.12%(e) | | | 16,421,449 | | | $ | 16,421,449 | |
| | | | | | | | |
| | |
TOTAL SHORT-TERM INVESTMENTS
(Cost $16,421,449) | | | | | | $ | 16,421,449 | |
| | | | | | | | |
| | |
Total Investments
(Cost $709,778,752) – 99.32% | | | | | | $ | 656,205,544 | |
Other Assets in Excess of Liabilities – 0.68% | | | | | | | 4,522,204 | |
| | | | | | | | |
TOTAL NET ASSETS – 100.00% | | | | | | $ | 660,727,748 | |
| | | | | | | | |
Percentages are stated as a percent of net assets.
ADR American Depositary Receipt
| (a) | Non-income producing security. |
| (b) | All or a portion of this security is on loan. See Note 2 in the Notes to Financial Statements. |
| (d) | Current yield is disclosed. Dividends are calculated based on a percentage of the issuer’s net income. |
| (e) | The rate shown is the annualized seven day yield as of March 31, 2022. |
The accompanying notes to financial statements are an integral part of these Schedule of Investments.
55
Brandes International Equity Fund
| | |
| SCHEDULE OF INVESTMENTS BY INDUSTRY — March 31, 2022 | | |
| | | | |
COMMON STOCKS | | | | |
Aerospace & Defense | | | 1.73 | % |
Auto Components | | | 1.24 | % |
Automobiles | | | 2.85 | % |
Banks | | | 8.71 | % |
Beverages | | | 3.18 | % |
Capital Markets | | | 4.77 | % |
Commercial Services & Supplies | | | 1.81 | % |
Construction Materials | | | 4.66 | % |
Diversified Telecommunication Services | | | 4.91 | % |
Energy Equipment & Services | | | 0.81 | % |
Equity Real Estate Investment Trusts | | | 2.58 | % |
Food & Staples Retailing | | | 7.20 | % |
Food Products | | | 2.91 | % |
Health Care Providers & Services | | | 1.89 | % |
Household Products | | | 2.82 | % |
Insurance | | | 4.55 | % |
Internet & Direct Marketing Retail | | | 2.49 | % |
Media | | | 4.13 | % |
Metals & Mining | | | 0.90 | % |
Multi-Utilities | | | 2.18 | % |
Oil, Gas & Consumable Fuels | | | 5.19 | % |
Pharmaceuticals | | | 13.31 | % |
Specialty Retail | | | 0.96 | % |
Textiles, Apparel & Luxury Goods | | | 2.11 | % |
Tobacco | | | 2.59 | % |
Wireless Telecommunication Services | | | 1.26 | % |
| | | | |
| |
TOTAL COMMON STOCKS | | | 91.74 | % |
| | | | |
| |
PREFERRED STOCKS | | | | |
Biotechnology | | | 2.51 | % |
Oil, Gas & Consumable Fuels | | | 2.58 | % |
| | | | |
| |
TOTAL PREFERRED STOCKS | | | 5.09 | % |
| | | | |
| |
SHORT-TERM INVESTMENTS | | | 2.49 | % |
| | | | |
| |
TOTAL INVESTMENTS | | | 99.32 | % |
Other Assets in Excess of Liabilities | | | 0.68 | % |
| | | | |
| |
TOTAL NET ASSETS | | | 100.00 | % |
| | | | |
The accompanying notes to financial statements are an integral part of these Schedule of Investments.
56
Brandes International Equity Fund
SCHEDULE OF INVESTMENTS BY INDUSTRY — March 31, 2022 (continued)
The industry classifications represented in the Schedule of Investments are in accordance with Global Industry Classification Standards (GICS®), which was developed by and/or is the exclusive property of MSCI, Inc. and Standard & Poor’s Financial Services LLC or were otherwise determined by the Advisor to be appropriate. This information is unaudited.
The accompanying notes to financial statements are an integral part of these Schedule of Investments.
57
Brandes Global Equity Fund
SCHEDULE OF INVESTMENTS — March 31, 2022 (Unaudited)
| | | | | | | | |
| Shares | | | | | Value | |
| | COMMON STOCKS – 98.10% | |
|
| | Austria – 2.63% | |
| | 33,629 | | | Erste Group Bank AG | | $ | 1,226,332 | |
| | | | | | | | |
| |
| | Brazil – 1.48% | | | | |
| | 168,020 | | | Embraer SA(a) | | | 527,946 | |
| | 12,908 | | | Embraer SA Sponsored – ADR(a) | | | 162,770 | |
| | | | | | | | |
| | |
| | | | | | | 690,716 | |
| | | | | | | | |
| |
| | Chile – 0.36% | | | | |
| | 5,632,734 | | | Enel Chile SA | | | 168,237 | |
| | | | | | | | |
| |
| | China – 3.70% | | | | |
| | 62,300 | | | Alibaba Group Holding Ltd.(a) | | | 850,190 | |
| | 104,698 | | | Gree Electric Appliances, Inc. of Zhuhai – Class A | | | 529,744 | |
| | 413,000 | | | Topsports International Holdings Ltd. | | | 343,261 | |
| | | | | | | | |
| | |
| | | | | | | 1,723,195 | |
| | | | | | | | |
| |
| | France – 10.52% | | | | |
| | 29,890 | | | Carrefour SA | | | 650,468 | |
| | 28,638 | | | Engie SA | | | 376,504 | |
| | 31,200 | | | Engie SA(a) | | | 410,187 | |
| | 15,034 | | | Publicis Groupe SA | | | 912,469 | |
| | 11,262 | | | Sanofi | | | 1,151,423 | |
| | 2,650 | | | Schneider Electric SE | | | 444,909 | |
| | 19,013 | | | TotalEnergies SE | | | 962,049 | |
| | | | | | | | |
| | |
| | | | | | | 4,908,009 | |
| | | | | | | | |
| |
| | Germany – 1.66% | | | | |
| | 13,695 | | | HeidelbergCement AG | | | 776,153 | |
| | | | | | | | |
| |
| | Ireland – 0.82% | | | | |
| | 9,567 | | | CRH Plc | | | 382,122 | |
| | | | | | | | |
| |
| | Italy – 1.29% | | | | |
| | 41,240 | | | Eni SpA | | | 601,412 | |
| | | | | | | | |
| |
| | Japan – 1.29% | | | | |
| | 21,200 | | | Honda Motor Co. Ltd. | | | 600,932 | |
| | | | | | | | |
| |
| | Malaysia – 1.43% | | | | |
| | 600,000 | | | Genting Berhad | | | 666,163 | |
| | | | | | | | |
| |
| | Mexico – 1.68% | | | | |
| | 668,608 | | | Fibra Uno Administracion SA de CV | | | 783,236 | |
| | | | | | | | |
| | | | | | | | |
| Shares | | | | | Value | |
| | South Korea – 5.75% | |
| | 2,433 | | | Hyundai Mobis Co. Ltd. | | $ | 428,818 | |
| | 3,846 | | | Hyundai Motor Co. | | | 567,442 | |
| | 4,388 | | | KT&G Corp. | | | 291,934 | |
| | 15,353 | | | Samsung Electronics Co. Ltd. | | | 878,544 | |
| | 5,365 | | | SK Hynix, Inc. | | | 516,109 | |
| | | | | | | | |
| | |
| | | | | | | 2,682,847 | |
| | | | | | | | |
| |
| | Spain – 1.27% | | | | |
| | 45,360 | | | Repsol SA | | | 594,180 | |
| | | | | | | | |
| |
| | Switzerland – 3.25% | | | | |
| | 77,518 | | | UBS Group AG Registered | | | 1,514,803 | |
| | | | | | | | |
| |
| | United Kingdom – 14.20% | | | | |
| | 215,586 | | | BP Plc | | | 1,056,885 | |
| | 56,721 | | | GlaxoSmithKline Plc | | | 1,227,270 | |
| | 40,460 | | | Imperial Brands Plc | | | 852,280 | |
| | 98,722 | | | J Sainsbury Plc | | | 326,749 | |
| | 164,394 | | | Kingfisher Plc | | | 548,689 | |
| | 165,615 | | | NatWest Group Plc | | | 467,753 | |
| | 14,819 | | | Shell Plc – ADR | | | 814,007 | |
| | 126,932 | | | Tesco Plc | | | 459,533 | |
| | 66,573 | | | WPP Plc | | | 871,314 | |
| | | | | | | | |
| | |
| | | | | | | 6,624,480 | |
| | | | | | | | |
| |
| | United States – 46.77% | | | | |
| | 8,073 | | | Amdocs Ltd. | | | 663,681 | |
| | 14,017 | | | American International Group, Inc. | | | 879,847 | |
| | 28,633 | | | Bank of America Corp. | | | 1,180,252 | |
| | 9,412 | | | Bank of New York Mellon Corp. | | | 467,118 | |
| | 11,964 | | | Cardinal Health, Inc. | | | 678,359 | |
| | 15,020 | | | Change Healthcare, Inc.(a) | | | 327,436 | |
| | 4,593 | | | Cigna Corp. | | | 1,100,529 | |
| | 19,954 | | | Citigroup, Inc. | | | 1,065,544 | |
| | 17,564 | | | Comcast Corp. – Class A | | | 822,346 | |
| | 8,509 | | | CVS Health Corp. | | | 861,196 | |
| | 4,807 | | | Emerson Electric Co. | | | 471,326 | |
| | 3,158 | | | FedEx Corp. | | | 730,730 | |
| | 8,120 | | | Fiserv, Inc.(a) | | | 823,368 | |
| | 3,110 | | | General Dynamics Corp. | | | 750,070 | |
| | 20,471 | | | Halliburton Co. | | | 775,237 | |
| | 2,628 | | | HCA Healthcare, Inc. | | | 658,629 | |
| | 3,238 | | | JPMorgan Chase & Co. | | | 441,404 | |
The accompanying notes to financial statements are an integral part of these Schedule of Investments.
58
Brandes Global Equity Fund
SCHEDULE OF INVESTMENTS — March 31, 2022 (Unaudited) (continued)
| | | | | | | | |
| Shares | | | | | Value | |
| | 1,669 | | | Laboratory Corp. of America Holdings(a) | | $ | 440,049 | |
| | 4,009 | | | McKesson Corp. | | | 1,227,275 | |
| | 14,370 | | | Merck & Co., Inc. | | | 1,179,058 | |
| | 3,316 | | | Mohawk Industries, Inc.(a) | | | 411,847 | |
| | 18,621 | | | Old Republic International Corp. | | | 481,725 | |
| | 13,977 | | | OneMain Holdings, Inc. | | | 662,650 | |
| | 21,182 | | | Pfizer, Inc. | | | 1,096,592 | |
| | 2,517 | | | PNC Financial Services Group, Inc. | | | 464,261 | |
| | 7,272 | | | State Street Corp. | | | 633,537 | |
| | 9,352 | | | Textron, Inc. | | | 695,602 | |
| | 10,604 | | | Truist Financial Corp. | | | 601,247 | |
| | 25,275 | | | Wells Fargo & Co. | | | 1,224,826 | |
| | | | | | | | |
| | |
| | | | | | | 21,815,741 | |
| | | | | | | | |
| TOTAL COMMON STOCKS
(Cost $37,819,337) | | $ | 45,758,558 | |
| | | | | | | | |
| | | | | | | | |
| Shares | | | | | Value | |
| | PREFERRED STOCKS – 1.34% | | | | |
| |
| | South Korea – 0.34% | | | | |
| | 3,072 | | | Samsung Electronics Co. Ltd., 2.308%(b) | | $ | 159,177 | |
| | | | | | | | |
| |
| | Spain – 1.00% | | | | |
| | 39,892 | | | Grifols SA – ADR, 7.503%(b) | | | 465,939 | |
| | | | | | | | |
| TOTAL PREFERRED STOCKS
(Cost $722,660) | | $ | 625,116 | |
| | | | | | | | |
| | | | | | | | |
| | | Shares | | | Value | |
SHORT-TERM INVESTMENTS – 0.45% | | | | | | | | |
Money Market Funds — 0.45% | | | | | | | | |
Northern Institutional Funds - Treasury Portfolio (Premier), 0.12%(c) | | | 209,674 | | | $ | 209,674 | |
| | | | | | | | |
| | |
TOTAL SHORT-TERM INVESTMENTS
(Cost $209,674) | | | | | | $ | 209,674 | |
| | | | | | | | |
| | |
Total Investments
(Cost $38,751,671) – 99.89% | | | | | | $ | 46,593,348 | |
Other Assets in Excess of Liabilities – 0.11% | | | | | | | 50,542 | |
| | | | | | | | |
| | |
TOTAL NET ASSETS – 100.00% | | | | | | $ | 46,643,890 | |
| | | | | | | | |
Percentages are stated as a percent of net assets.
ADR American Depositary Receipt
| (a) | Non-income producing security. |
| (b) | Current yield is disclosed. Dividends are calculated based on a percentage of the issuer’s net income. |
| (c) | The rate shown is the annualized seven day yield as of March 31, 2022. |
The accompanying notes to financial statements are an integral part of these Schedule of Investments.
59
Brandes Global Equity Fund
SCHEDULE OF INVESTMENTS BY INDUSTRY — March 31, 2022
| | | | |
COMMON STOCKS | | | | |
Aerospace & Defense | | | 4.58 | % |
Air Freight & Logistics | | | 1.57 | % |
Auto Components | | | 0.92 | % |
Automobiles | | | 2.51 | % |
Banks | | | 14.31 | % |
Capital Markets | | | 5.61 | % |
Construction Materials | | | 2.48 | % |
Consumer Finance | | | 1.42 | % |
Electric Utilities | | | 0.36 | % |
Electrical Equipment | | | 1.96 | % |
Energy Equipment & Services | | | 1.66 | % |
Equity Real Estate Investment Trusts | | | 1.68 | % |
Food & Staples Retailing. | | | 3.07 | % |
Health Care Providers & Services | | | 10.64 | % |
Health Care Technology | | | 0.70 | % |
Hotels, Restaurants & Leisure | | | 1.43 | % |
Household Durables | | | 2.02 | % |
Insurance | | | 2.92 | % |
Internet & Direct Marketing Retail | | | 1.82 | % |
IT Services | | | 3.19 | % |
Media | | | 5.59 | % |
Multi-Utilities | | | 1.69 | % |
Oil, Gas & Consumable Fuels | | | 8.63 | % |
Pharmaceuticals | | | 9.98 | % |
Semiconductors & Semiconductor Equipment | | | 1.11 | % |
Specialty Retail | | | 1.92 | % |
Technology Hardware, Storage & Peripherals | | | 1.88 | % |
Tobacco | | | 2.45 | % |
| | | | |
| |
TOTAL COMMON STOCKS | | | 98.10 | % |
| | | | |
| |
PREFERRED STOCKS | | | | |
Biotechnology | | | 1.00 | % |
Technology Hardware, Storage & Peripherals | | | 0.34 | % |
| | | | |
| |
TOTAL PREFERRED STOCKS | | | 1.34 | % |
| | | | |
| |
SHORT-TERM INVESTMENTS | | | 0.45 | % |
| | | | |
| |
TOTAL INVESTMENTS | | | 99.89 | % |
Other Assets in Excess of Liabilities | | | 0.11 | % |
| | | | |
| |
TOTAL NET ASSETS | | | 100.00 | % |
| | | | |
The accompanying notes to financial statements are an integral part of these Schedule of Investments.
60
Brandes Global Equity Fund
SCHEDULE OF INVESTMENTS BY INDUSTRY — March 31, 2022 (continued)
The industry classifications represented in the Schedule of Investments are in accordance with Global Industry Classification Standards (GICS®), which was developed by and/or is the exclusive property of MSCI, Inc. and Standard & Poor’s Financial Services LLC or were otherwise determined by the Advisor to be appropriate. This information is unaudited.
The accompanying notes to financial statements are an integral part of these Schedule of Investments.
61
Brandes Emerging Markets Value Fund
SCHEDULE OF INVESTMENTS — March 31, 2022 (Unaudited)
| | | | | | | | |
| Shares | | | | | Value | |
| | COMMON STOCKS – 96.18% | | | | |
| |
| | Austria – 0.98% | | | | |
| | 287,562 | | | Erste Group Bank AG | | $ | 10,486,381 | |
| | | | | | | | |
| |
| | Brazil – 7.66% | | | | |
| | 2,591,574 | | | Embraer SA Sponsored – ADR(a) | | | 32,679,748 | |
| | 5,171,400 | | | Sendas Distribuidora SA | | | 17,694,018 | |
| | 1,125,300 | | | Telefonica Brasil SA | | | 12,689,923 | |
| | 163,109 | | | Telefonica Brasil SA – ADR | | | 1,834,976 | |
| | 5,908,900 | | | TIM SA(a) | | | 17,114,656 | |
| | | | | | | | |
| | |
| | | | | | | 82,013,321 | |
| | | | | | | | |
| |
| | Chile – 1.82% | | | | |
| | 2,807,269 | | | Empresa Nacional de Telecomunicaciones SA | | | 12,270,206 | |
| | 161,104,262 | | | Enel Chile SA | | | 4,811,833 | |
| | 1,509,388 | | | Enel Chile SA Sponsored – ADR | | | 2,384,833 | |
| | | | | | | | |
| | |
| | | | | | | 19,466,872 | |
| | | | | | | | |
| |
| | China – 25.66% | | | | |
| | 3,344,000 | | | Alibaba Group Holding Ltd.(a) | | | 45,634,608 | |
| | 18,035,000 | | | China Education Group Holdings Ltd. | | | 15,518,191 | |
| | 2,145,591 | | | China South Publishing & Media Group Co. Ltd. – Class A | | | 3,192,808 | |
| | 19,718,000 | | | Chinasoft International Ltd.(a) | | | 16,162,064 | |
| | 4,999,000 | | | Galaxy Entertainment Group Ltd. | | | 29,581,004 | |
| | 20,832,500 | | | Genertec Universal Medical Group Co. Ltd.(b) | | | 13,651,410 | |
| | 3,515,396 | | | Gree Electric Appliances, Inc. of Zhuhai – Class A | | | 17,786,976 | |
| | | | | | | | |
| Shares | | | | | Value | |
| | 1,881,646 | | | Midea Group Co. Ltd. – Class A | | $ | 16,751,346 | |
| | 3,512,000 | | | Ping An Insurance Group Co of China Ltd. – Class H | | | 24,552,619 | |
| | 10,976,200 | | | Shanghai Pharmaceuticals Holding Co. Ltd. – Class H | | | 21,075,397 | |
| | 18,742,000 | | | Topsports International Holdings Ltd. | | | 15,577,223 | |
| | 15,236,000 | | | TravelSky Technology Ltd. – Class H | | | 21,856,715 | |
| | 6,589,000 | | | Weichai Power Co. Ltd. – Class H | | | 10,327,579 | |
| | 10,112,200 | | | Wynn Macau Ltd.(a) | | | 7,328,132 | |
| | 630,090 | | | ZTO Express Cayman, Inc. – ADR | | | 15,752,250 | |
| | | | | | | | |
| | |
| | | | | | | 274,748,322 | |
| | | | | | | | |
| |
| | Hong Kong – 4.35% | | | | |
| | 2,298,800 | | | AIA Group Ltd. | | | 24,003,807 | |
| | 17,315,920 | | | First Pacific Co. Ltd. | | | 6,996,286 | |
| | 10,348,500 | | | Lifestyle International Holdings Ltd.(a) | | | 4,955,215 | |
| | 4,392,200 | | | Luk Fook Holdings International Ltd. | | | 10,651,030 | |
| | | | | | | | |
| | |
| | | | | | | 46,606,338 | |
| | | | | | | | |
| |
| | India – 3.99% | | | | |
| | 1,062,300 | | | HDFC Bank Ltd. | | | 20,459,714 | |
| | 7,638,169 | | | Indus Towers Ltd.(a) | | | 22,266,022 | |
| | | | | | | | |
| | |
| | | | | | | 42,725,736 | |
| | | | | | | | |
| |
| | Indonesia – 6.54% | | | | |
| | 78,235,411 | | | Bank Rakyat Indonesia Persero Tbk PT | | | 25,268,844 | |
| | 6,612,112 | | | Gudang Garam Tbk PT | | | 14,547,797 | |
The accompanying notes to financial statements are an integral part of these Schedule of Investments.
62
Brandes Emerging Markets Value Fund
SCHEDULE OF INVESTMENTS — March 31, 2022 (Unaudited) (continued)
| | | | | | | | |
| Shares | | | | | Value | |
| | 36,825,900 | | | Indofood Sukses Makmur Tbk PT | | $ | 15,240,633 | |
| | 81,651,015 | | | XL Axiata Tbk PT | | | 15,026,767 | |
| | | | | | | | |
| | |
| | | | | | | 70,084,041 | |
| | | | | | | | |
| |
| | Malaysia – 2.16% | | | | |
| | 20,807,000 | | | Genting Berhad | | | 23,101,417 | |
| | | | | | | | |
| |
| | Mexico – 8.16% | | | | |
| | 6,744,605 | | | America Movil SAB de CV | | | 7,161,692 | |
| | 3,981,000 | | | Cemex SAB de CV Sponsored – ADR(a) | | | 21,059,490 | |
| | 30,775,129 | | | Fibra Uno Administracion SA de CV | | | 36,051,307 | |
| | 4,086,997 | | | Macquarie Mexico Real Estate Management SA de CV(b) | | | 4,892,479 | |
| | 12,836,544 | | | PLA Administradora Industrial S de RL de CV | | | 18,077,003 | |
| | 512,122 | | | Urbi Desarrollos Urbanos SAB de CV(a) | | | 173,411 | |
| | | | | | | | |
| | |
| | | | | | | 87,415,382 | |
| | | | | | | | |
| |
| | Panama – 2.16% | | | | |
| | 643,993 | | | Banco Latinoamericano de Comercio Exterior SA – Class E | | | 10,033,411 | |
| | 156,141 | | | Copa Holdings SA – Class A(a) | | | 13,059,633 | |
| | | | | | | | |
| | |
| | | | | | | 23,093,044 | |
| | | | | | | | |
| |
| | Philippines – 1.75% | | | | |
| | 9,718,404 | | | Bank of the Philippine Islands | | | 18,706,214 | |
| | | | | | | | |
| |
| | Russia – 1.76% | | | | |
| | 11,121,093 | | | Detsky Mir PJSC(c) | | | 5,377,449 | |
| | 236,429 | | | Lukoil PJSC Sponsored – ADR(c) | | | 2,111,675 | |
| | | | | | | | |
| Shares | | | | | Value | |
| | 4,858,073 | | | Mobile TeleSystems Public Joint Stock Company(c) | | $ | 6,448,912 | |
| | 7,919,891 | | | Sberbank of Russia PJSC(c) | | | 19,800 | |
| | 1,571,174 | | | Sistema PJSFC Sponsored – GDR(c) | | | 4,937,139 | |
| | | | | | | | |
| | |
| | | | | | | 18,894,975 | |
| | | | | | | | |
| |
| | South Korea – 14.59% | | | | |
| | 394,434 | | | KT&G Corp. | | | 26,241,717 | |
| | 22,168 | | | LG Household & Health Care Ltd. | | | 15,637,573 | |
| | 108,324 | | | POSCO | | | 25,984,081 | |
| | 764,342 | | | Samsung Electronics Co. Ltd. | | | 43,737,929 | |
| | 621,928 | | | Shinhan Financial Group Co. Ltd. | | | 21,126,110 | |
| | 244,956 | | | SK Hynix, Inc. | | | 23,564,574 | |
| | | | | | | | |
| | |
| | | | | | | 156,291,984 | |
| | | | | | | | |
| |
| | Spain – 0.61% | | | | |
| | 9,996,309 | | | Prosegur Cash SA(b) | | | 6,535,524 | |
| | | | | | | | |
| |
| | Taiwan – 9.84% | | | | |
| | 3,036,000 | | | Accton Technology Corp. | | | 23,343,844 | |
| | 93,000 | | | Largan Precision Co. Ltd. | | | 6,079,356 | |
| | 2,624,000 | | | Taiwan Semiconductor Manufacturng Co. Ltd. | | | 53,827,480 | |
| | 626,000 | | | Wiwynn Corp. | | | 22,083,029 | |
| | | | | | | | |
| | |
| | | | | | | 105,333,709 | |
| | | | | | | | |
| |
| | Thailand – 4.15% | | | | |
| | 1,989,200 | | | Bangkok Bank PCL – Class F | | | 8,141,800 | |
The accompanying notes to financial statements are an integral part of these Schedule of Investments.
63
Brandes Emerging Markets Value Fund
SCHEDULE OF INVESTMENTS — March 31, 2022 (Unaudited) (continued)
| | | | | | | | |
| Shares | | | | | Value | |
| | 76,811,481 | | | Jasmine Broadband Internet Infrastructure Fund – Class F | | $ | 25,411,317 | |
| | 2,263,900 | | | Kasikornbank PCL – Class F | | | 10,926,505 | |
| | | | | | | | |
| | |
| | | | | | | 44,479,622 | |
| | | | | | | | |
| |
| TOTAL COMMON STOCKS
(Cost $1,266,886,473) | | $ | 1,029,982,882 | |
| | | | | | | | |
| | | | | | | | |
| Shares | | | | | Value | |
| | PREFERRED STOCKS – 2.53% | | | | |
| |
| | Brazil – 2.53% | | | | |
| | 3,864,700 | | | Petroleo Brasileiro SA, 8.749%(d) | | $ | 27,152,459 | |
| | | | | | | | |
| |
| TOTAL PREFERRED STOCKS
(Cost $15,633,904) | | $ | 27,152,459 | |
| | | | | | | | |
| | | | | | | | |
| | | Shares | | | Value | |
SHORT-TERM INVESTMENTS – 1.58% | | | | | | | | |
| | |
Money Market Funds — 1.58% | | | | | | | | |
Northern Institutional Funds - Treasury Portfolio (Premier), 0.12%(e) | | | 16,878,075 | | | $ | 16,878,075 | |
| | | | | | | | |
| | |
TOTAL SHORT-TERM INVESTMENTS
(Cost $16,878,075) | | | | | | $ | 16,878,075 | |
| | | | | | | | |
| | |
Total Investments
(Cost $1,299,398,452) – 100.29% | | | | | | $ | 1,074,013,416 | |
Liabilities in Excess of Other Assets – (0.29)% | | | | | | | (3,119,237 | ) |
| | | | | | | | |
| | |
TOTAL NET ASSETS – 100.00% | | | | | | $ | 1,070,894,179 | |
| | | | | | | | |
Percentages are stated as a percent of net assets.
ADR American Depositary Receipt
GDR Global Depositary Receipt
| (a) | Non-income producing security. |
| (b) | Acquired in a transaction exempt from registration under Rule 144A or Section 4(a)(2) of the Securities Act of 1933. May be resold in the U.S. in transactions exempt from registration, normally to qualified institutional buyers. The total value of all such securities was $40,656,636 which represented 3.80% of the net assets of the Fund. |
| (c) | The price for this security was derived from an estimate of fair market value using methods approved by the Fund’s Board of Trustees. This security represents $18,894,975 or 1.76% of the Fund’s net assets and is classified as a Level 3 security. See Note 2 in the Notes to Financial Statements. |
| (d) | Current yield is disclosed. Dividends are calculated based on a percentage of the issuer’s net income. |
| (e) | The rate shown is the annualized seven day yield as of March 31, 2022. |
The accompanying notes to financial statements are an integral part of these Schedule of Investments.
64
Brandes Emerging Markets Value Fund
SCHEDULE OF INVESTMENTS BY INDUSTRY — March 31, 2022
| | | | |
COMMON STOCKS | | | | |
Aerospace & Defense | | | 3.05 | % |
Air Freight & Logistics | | | 1.47 | % |
Airlines | | | 1.22 | % |
Banks | | | 10.75 | % |
Commercial Services & Supplies | | | 0.61 | % |
Communications Equipment | | | 2.18 | % |
Construction Materials | | | 1.97 | % |
Diversified Consumer Services | | | 1.45 | % |
Diversified Financial Services | | | 2.22 | % |
Diversified Telecommunication Services | | | 5.81 | % |
Electric Utilities | | | 0.67 | % |
Electronic Equipment, Instruments & Components | | | 0.57 | % |
Equity Real Estate Investment Trusts | | | 5.51 | % |
Food & Staples Retailing | | | 1.65 | % |
Food Products | | | 2.07 | % |
Health Care Providers & Services | | | 1.97 | % |
Hotels, Restaurants & Leisure | | | 5.60 | % |
Household Durables | | | 3.23 | % |
Insurance | | | 4.53 | % |
Internet & Direct Marketing Retail | | | 4.26 | % |
IT Services | | | 3.55 | % |
Machinery | | | 0.97 | % |
Media | | | 0.30 | % |
Metals & Mining | | | 2.43 | % |
Multiline Retail | | | 0.46 | % |
Oil, Gas & Consumable Fuels | | | 0.20 | % |
Personal Products | | | 1.46 | % |
Semiconductors & Semiconductor Equipment | | | 7.23 | % |
Specialty Retail | | | 2.96 | % |
Technology Hardware, Storage & Peripherals | | | 6.14 | % |
Tobacco | | | 3.81 | % |
Wireless Telecommunication Services | | | 5.88 | % |
| | | | |
| |
TOTAL COMMON STOCKS | | | 96.18 | % |
| | | | |
| |
PREFERRED STOCKS | | | | |
Oil, Gas & Consumable Fuels | | | 2.53 | % |
| | | | |
| |
TOTAL PREFERRED STOCKS | | | 2.53 | % |
| | | | |
| |
SHORT-TERM INVESTMENTS | | | 1.58 | % |
| | | | |
| |
TOTAL INVESTMENTS | | | 100.29 | % |
Liabilities in Excess of Other Assets | | | (0.29 | )% |
| | | | |
| |
TOTAL NET ASSETS | | | 100.00 | % |
| | | | |
The accompanying notes to financial statements are an integral part of these Schedule of Investments.
65
Brandes Emerging Markets Value Fund
SCHEDULE OF INVESTMENTS BY INDUSTRY — March 31, 2022 (continued)
The industry classifications represented in the Schedule of Investments are in accordance with Global Industry Classification Standards (GICS®), which was developed by and/or is the exclusive property of MSCI, Inc. and Standard & Poor’s Financial Services LLC or were otherwise determined by the Advisor to be appropriate. This information is unaudited.
The accompanying notes to financial statements are an integral part of these Schedule of Investments.
66
Brandes International Small Cap Equity Fund
SCHEDULE OF INVESTMENTS — March 31, 2022 (Unaudited)
| | | | | | | | |
| Shares | | | | | Value | |
| | COMMON STOCKS – 95.68% | | | | |
| |
| | Austria – 0.83% | | | | |
| | 216,981 | | | Addiko Bank AG | | $ | 2,856,419 | |
| | | | | | | | |
| |
| | Belgium – 0.97% | | | | |
| | 456,862 | | | Ontex Group NV(a) | | | 3,334,401 | |
| | | | | | | | |
| |
| | Brazil – 5.10% | | | | |
| | 5,580,440 | | | Embraer SA(a) | | | 17,534,658 | |
| | | | | | | | |
| |
| | Canada – 2.97% | | | | |
| | 118,787 | | | Cameco Corp. | | | 3,456,702 | |
| | 789,544 | | | Dorel Industries, Inc. – Class B | | | 6,113,495 | |
| | 35,395 | | | Sierra Wireless, Inc.(a) | | | 638,526 | |
| | | | | | | | |
| | |
| | | | | | | 10,208,723 | |
| | | | | | | | |
| |
| | Chile – 1.79% | | | | |
| | 205,562,931 | | | Enel Chile SA | | | 6,139,716 | |
| | | | | | | | |
| |
| | China – 1.96% | | | | |
| | 12,512,900 | | | Boyaa Interactive International Ltd.(a) | | | 743,329 | |
| | 300,880 | | | China Yuchai International Ltd. | | | 3,505,252 | |
| | 8,397,000 | | | Weiqiao Textile Co. – Class H | | | 2,476,232 | |
| | | | | | | | |
| | |
| | | | | | | 6,724,813 | |
| | | | | | | | |
| |
| | France – 4.78% | | | | |
| | 570,514 | | | Elior Group SA(a),(b) | | | 1,912,520 | |
| | 50,890 | | | Savencia SA | | | 3,422,862 | |
| | 134,780 | | | Societe BIC SA | | | 6,809,504 | |
| | 126,443 | | | Vicat SA | | | 4,285,437 | |
| | | | | | | | |
| | |
| | | | | | | 16,430,323 | |
| | | | | | | | |
| |
| | Germany – 0.73% | | | | |
| | 46,766 | | | Draegerwerk AG & Co. KGaA | | | 2,519,009 | |
| | | | | | | | |
| |
| | Greece – 0.55% | | | | |
| | 236,992 | | | Sarantis SA | | | 1,877,025 | |
| | | | | | | | |
| |
| | Hong Kong – 7.58% | | | | |
| | 4,180,050 | | | APT Satellite Holdings Ltd. | | | 1,264,083 | |
| | 2,059,500 | | | Dickson Concepts International Ltd. | | | 1,051,664 | |
| | 66,630,000 | | | Emperor Watch & Jewellery Ltd. | | | 1,605,061 | |
| | 18,613,000 | | | First Pacific Co. Ltd. | | | 7,520,355 | |
| | | | | | | | |
| Shares | | | | | Value | |
| | 8,314,020 | | | PAX Global Technology Ltd. | | $ | 6,794,644 | |
| | 25,232,000 | | | Pico Far East Holdings Ltd. | | | 3,492,353 | |
| | 2,670,500 | | | Yue Yuen Industrial Holdings Ltd.(a) | | | 4,309,183 | |
| | | | | | | | |
| | |
| | | | | | | 26,037,343 | |
| | | | | | | | |
| |
| | Hungary – 2.05% | | | | |
| | 5,792,540 | | | Magyar Telekom Telecommunications Plc | | | 7,036,110 | |
| | | | | | | | |
| |
| | Ireland – 6.38% | | | | |
| | 3,146,582 | | | AIB Group Plc | | | 6,930,680 | |
| | 496,596 | | | Avadel Pharmaceuticals Plc – ADR(a) | | | 3,391,751 | |
| | 2,826,375 | | | C&C Group Plc(a) | | | 7,277,221 | |
| | 2,569,148 | | | Greencore Group Plc(a) | | | 4,336,825 | |
| | | | | | | | |
| | |
| | | | | | | 21,936,477 | |
| | | | | | | | |
| |
| | Israel – 1.18% | | | | |
| | 93,929 | | | Taro Pharmaceutical Industries Ltd.(a) | | | 4,063,369 | |
| | | | | | | | |
| |
| | Italy – 3.28% | | | | |
| | 278,717 | | | Buzzi Unicem SpA | | | 5,157,704 | |
| | 549,590 | | | Credito Emiliano SpA | | | 3,613,286 | |
| | 251,174 | | | Leonardo SpA(a) | | | 2,495,960 | |
| | | | | | | | |
| | |
| | | | | | | 11,266,950 | |
| | | | | | | | |
| |
| | Japan – 21.22% | | | | |
| | 874,600 | | | Concordia Financial Group Ltd. | | | 3,254,959 | |
| | 284,800 | | | DeNa Co. Ltd. | | | 4,326,450 | |
| | 458,900 | | | Fuji Media Holdings, Inc. | | | 4,394,305 | |
| | 38,900 | | | Fukuda Denshi Co. Ltd. | | | 2,485,232 | |
| | 301,300 | | | Futaba Corp. | | | 1,618,701 | |
| | 1,703,300 | | | Hachijuni Bank Ltd. | | | 5,643,482 | |
| | 1,335,300 | | | Hyakugo Bank Ltd. | | | 3,645,665 | |
| | 281,600 | | | Japan Petroleum Exploration Co. Ltd. | | | 5,930,778 | |
| | 96,200 | | | Kaken Pharmaceutical Co. Ltd. | | | 3,059,224 | |
The accompanying notes to financial statements are an integral part of these Schedule of Investments.
67
Brandes International Small Cap Equity Fund
SCHEDULE OF INVESTMENTS — March 31, 2022 (Unaudited) (continued)
| | | | | | | | |
| Shares | | | | | Value | |
| | 324,900 | | | Kissei Pharmaceutical Co. Ltd. | | $ | 6,771,995 | |
| | 293,200 | | | Koatsu Gas Kogyo Co. Ltd. | | | 1,582,232 | |
| | 1,156,844 | | | Komori Corp. | | | 6,868,767 | |
| | 534,000 | | | Kyushu Financial Group, Inc. | | | 1,745,848 | |
| | 189,600 | | | Mitsubishi Shokuhin Co. Ltd. | | | 4,669,618 | |
| | 119,700 | | | Nichiban Co. Ltd. | | | 1,664,057 | |
| | 183,200 | | | Oita Bank Ltd. | | | 2,863,144 | |
| | 92,600 | | | Sankyo Co. Ltd. | | | 2,567,997 | |
| | 226,600 | | | Tachi-S Co. Ltd. | | | 1,837,754 | |
| | 100,200 | | | Taisho Pharmaceutical Holdings Co. Ltd. | | | 4,651,445 | |
| | 154,400 | | | Yodogawa Steel Works Ltd. | | | 3,313,057 | |
| | | | | | | | |
| | |
| | | | | | | 72,894,710 | |
| | | | | | | | |
| |
| | Malaysia – 1.40% | | | | |
| | 4,333,200 | | | Genting Berhad | | | 4,811,028 | |
| | | | | | | | |
| |
| | Mexico – 7.63% | | | | |
| | 357,715 | | | Cemex SAB de CV Sponsored – ADR(a) | | | 1,892,312 | |
| | 24,958,198 | | | Consorcio ARA SAB de CV | | | 5,094,534 | |
| | 279,501,983 | | | Desarrolladora Homex SAB de CV(a),(c) | | | 604,253 | |
| | 11,123,149 | | | Fibra Uno Administracion SA de CV | | | 13,030,134 | |
| | 4,448,928 | | | Macquarie Mexico Real Estate Management SA de CV(b) | | | 5,325,741 | |
| | 806,929 | | | Urbi Desarrollos Urbanos SAB de CV(a),(c) | | | 273,236 | |
| | | | | | | | |
| | |
| | | | | | | 26,220,210 | |
| | | | | | | | |
| |
| | Panama – 1.58% | | | | |
| | 348,146 | | | Banco Latinoamericano de Comercio Exterior SA – Class E | | | 5,424,115 | |
| | | | | | | | |
| | | | | | | | |
| Shares | | | | | Value | |
| |
| | Slovenia – 2.09% | | | | |
| | 474,148 | | | Nova Ljubljanska Banka – GDR(b) | | $ | 7,186,009 | |
| | | | | | | | |
| |
| | South Korea – 2.82% | | | | |
| | 102,219 | | | Binggrae Co. Ltd. | | | 4,542,020 | |
| | 5,097 | | | Namyang Dairy Products Co. Ltd. | | | 1,686,314 | |
| | 39,595 | | | Samchully Co. Ltd. | | | 3,461,314 | |
| | | | | | | | |
| | |
| | | | | | | 9,689,648 | |
| | | | | | | | |
| |
| | Spain – 2.01% | | | | |
| | 1,262,982 | | | Lar Espana Real Estate Socimi SA | | | 6,905,047 | |
| | | | | | | | |
| |
| | Turkey – 1.08% | | | | |
| | 3,558,239 | | | Ulker Biskuvi Sanayi AS | | | 3,717,880 | |
| | | | | | | | |
| |
| | United Kingdom – 15.70% | | | | |
| | 1,565,145 | | | Balfour Beatty Plc | | | 5,274,116 | |
| | 2,373,448 | | | De La Rue Plc(a) | | | 3,365,660 | |
| | 752,668 | | | ITV Plc(a) | | | 809,978 | |
| | 2,806,878 | | | J Sainsbury Plc | | | 9,290,170 | |
| | 903,776 | | | LSL Property Services Plc | | | 4,606,512 | |
| | 2,554,535 | | | Marks & Spencer Group Plc(a) | | | 5,155,973 | |
| | 11,438,501 | | | Mitie Group Plc | | | 8,207,415 | |
| | 1,698,234 | | | Premier Foods Plc | | | 2,543,209 | |
| | 819,654 | | | QinetiQ Group Plc | | | 3,257,230 | |
| | 641,649 | | | TechnipFMC Plc(a) | | | 4,972,780 | |
| | 1,244,657 | | | Yellow Cake Plc(a),(b) | | | 6,442,037 | |
| | | | | | | | |
| | |
| | | | | | | 53,925,080 | |
| | | | | | | | |
| |
| TOTAL COMMON STOCKS
(Cost $356,660,668) | | $ | 328,739,063 | |
| | | | | | | | |
| |
| | PREFERRED STOCKS – 1.89% | | | | |
| |
| | Germany – 1.89% | | | | |
| | 117,368 | | | Draegerwerk AG & Co. KGaA, 0.37%(d) | | $ | 6,494,548 | |
| | | | | | | | |
| |
| TOTAL PREFERRED STOCKS
(Cost $7,288,587) | | $ | 6,494,548 | |
| | | | | | | | |
The accompanying notes to financial statements are an integral part of these Schedule of Investments.
68
Brandes International Small Cap Equity Fund
SCHEDULE OF INVESTMENTS — March 31, 2022 (Unaudited) (continued)
| | | | | | | | |
| Shares | | | | | Value | |
|
| | INVESTMENT COMPANIES – 0.86% | |
| |
| | Canada – 0.86% | | | | |
| | 196,492 | | | Sprott Physical Uranium Trust(a) | | $ | 2,959,600 | |
| | | | | | | | |
| |
| TOTAL INVESTMENT COMPANIES
(Cost $1,814,617) | | $ | 2,959,600 | |
| | | | | | | | |
| | | | | | | | |
| | | Shares | | | Value | |
| | |
SHORT-TERM INVESTMENTS – 1.15% | | | | | | | | |
| | |
Money Market Funds — 1.15% | | | | | | | | |
| Northern Institutional Funds - Treasury Portfolio (Premier), 0.12%(e) | | | 3,945,685 | | | $ | 3,945,685 | |
| | | | | | | | |
| | |
TOTAL SHORT-TERM INVESTMENTS
(Cost $3,945,685) | | | | | | $ | 3,945,685 | |
| | | | | | | | |
| | |
Total Investments
(Cost $369,709,557) – 99.58% | | | | | | $ | 342,138,896 | |
| | |
Other Assets in Excess of Liabilities – 0.42% | | | | | | | 1,452,096 | |
| | | | | | | | |
| | |
TOTAL NET ASSETS – 100.00% | | | | | | $ | 343,590,992 | |
| | | | | | | | |
Percentages are stated as a percent of net assets.
ADR American Depositary Receipt
GDR Global Depositary Receipt
| (a) | Non-income producing security. |
| (b) | Acquired in a transaction exempt from registration under Rule 144A or Section 4(a)(2) of the Securities |
| | Act of 1933. May be resold in the U.S. in transactions exempt from registration, normally to qualified institutional buyers. The total value of all such securities was $20,866,306 which represented 6.07% of the net assets of the Fund. |
| (c) | Affiliated issuer. See Note 3 in the Notes to Financial Statements. |
| (d) | Current yield is disclosed. Dividends are calculated based on a percentage of the issuer’s net income. |
| (e) | The rate shown is the annualized seven day yield as of March 31, 2022. |
The accompanying notes to financial statements are an integral part of these Schedule of Investments.
69
Brandes International Small Cap Equity Fund
SCHEDULE OF INVESTMENTS BY INDUSTRY — March 31, 2022
| | | | |
COMMON STOCKS | | | | |
Aerospace & Defense | | | 6.78 | % |
Auto Components | | | 0.54 | % |
Banks | | | 10.97 | % |
Beverages | | | 2.12 | % |
Chemicals | | | 0.46 | % |
Commercial Services & Supplies | | | 5.84 | % |
Communications Equipment | | | 0.18 | % |
Construction & Engineering | | | 1.54 | % |
Construction Materials | | | 3.30 | % |
Diversified Financial Services | | | 1.58 | % |
Diversified Telecommunication Services | | | 2.42 | % |
Electric Utilities | | | 1.79 | % |
Electrical Equipment | | | 0.47 | % |
Electronic Equipment, Instruments & Components | | | 1.98 | % |
Energy Equipment & Services | | | 1.45 | % |
Entertainment | | | 1.48 | % |
Equity Real Estate Investment Trusts | | | 7.35 | % |
Food & Staples Retailing | | | 5.56 | % |
Food Products | | | 8.07 | % |
Gas Utilities | | | 1.01 | % |
Health Care Equipment & Supplies | | | 1.45 | % |
Hotels, Restaurants & Leisure | | | 1.96 | % |
Household Durables | | | 3.52 | % |
Leisure Products | | | 0.75 | % |
Machinery | | | 3.02 | % |
Media | | | 2.54 | % |
Metals & Mining | | | 0.96 | % |
Oil, Gas & Consumable Fuels | | | 2.74 | % |
Personal Products | | | 1.52 | % |
Pharmaceuticals | | | 6.38 | % |
Real Estate Management & Development | | | 1.34 | % |
Specialty Retail | | | 0.77 | % |
Textiles, Apparel & Luxury Goods | | | 1.97 | % |
Trading Companies & Distributors | | | 1.87 | % |
| | | | |
| |
TOTAL COMMON STOCKS | | | 95.68 | % |
| | | | |
| |
PREFERRED STOCKS | | | | |
Health Care Equipment & Supplies | | | 1.89 | % |
| | | | |
| |
TOTAL PREFERRED STOCKS | | | 1.89 | % |
| | | | |
| |
INVESTMENT COMPANIES | | | | |
Trading Companies & Distributors | | | 0.86 | % |
| | | | |
| |
TOTAL INVESTMENT COMPANIES | | | 0.86 | % |
| | | | |
The accompanying notes to financial statements are an integral part of these Schedule of Investments.
70
Brandes International Small Cap Equity Fund
SCHEDULE OF INVESTMENTS BY INDUSTRY — March 31, 2022 (continued)
| | | | |
SHORT-TERM INVESTMENTS | | | 1.15 | % |
| | | | |
| |
TOTAL INVESTMENTS | | | 99.58 | % |
Other Assets in Excess of Liabilities | | | 0.42 | % |
| | | | |
| |
TOTAL NET ASSETS | | | 100.00 | % |
| | | | |
The accompanying notes to financial statements are an integral part of these Schedule of Investments.
71
Brandes International Small Cap Equity Fund
SCHEDULE OF INVESTMENTS BY INDUSTRY — March 31, 2022 (continued)
The industry classifications represented in the Schedule of Investments are in accordance with Global Industry Classification Standards (GICS®), which was developed by and/or is the exclusive property of MSCI, Inc. and Standard & Poor’s Financial Services LLC or were otherwise determined by the Advisor to be appropriate. This information is unaudited.
The accompanying notes to financial statements are an integral part of these Schedule of Investments.
72
Brandes Small Cap Value Fund
SCHEDULE OF INVESTMENTS — March 31, 2022 (Unaudited)
| | | | | | | | |
| Shares | | | | | Value | |
| |
| | COMMON STOCKS – 86.12% | | | | |
| |
| | Aerospace & Defense – 12.49% | | | | |
| | 11,205 | | | Embraer SA Sponsored – ADR(a) | | $ | 141,295 | |
| | 1,449 | | | Moog, Inc. – Class A | | | 127,222 | |
| | 1,153 | | | National Presto Industries, Inc. | | | 88,723 | |
| | 8,392 | | | Park Aerospace Corp. | | | 109,516 | |
| | | | | | | | |
| | |
| | | | | | | 466,756 | |
| | | | | | | | |
| |
| | Banks – 3.51% | | | | |
| | 1,053 | | | ACNB Corp. | | | 36,802 | |
| | 787 | | | Eagle Bancorp Montana, Inc. | | | 17,574 | |
| | 2,063 | | | National Bankshares, Inc. | | | 76,723 | |
| | | | | | | | |
| | |
| | | | | | | 131,099 | |
| | | | | | | | |
| |
| | Biotechnology – 5.28% | | | | |
| | 1,993 | | | Eagle Pharmaceuticals, Inc.(a) | | | 98,633 | |
| | 11,508 | | | PDL BioPharma, Inc.(a),(b) | | | 28,425 | |
| | 392 | | | United Therapeutics Corp.(a) | | | 70,329 | |
| | | | | | | | |
| | |
| | | | | | | 197,387 | |
| | | | | | | | |
|
| | Commercial Services & Supplies – 1.86% | |
| | 3,977 | | | Kimball International, Inc. – Class B | | | 33,606 | |
| | 2,994 | | | Steelcase, Inc. – Class A | | | 35,778 | |
| | | | | | | | |
| | |
| | | | | | | 69,384 | |
| | | | | | | | |
| |
| | Communications Equipment – 4.68% | | | | |
| | 5,972 | | | NETGEAR, Inc.(a) | | | 147,389 | |
| | 8,918 | | | Ribbon Communications, Inc.(a) | | | 27,557 | |
| | | | | | | | |
| | |
| | | | | | | 174,946 | |
| | | | | | | | |
| |
| | Construction & Engineering – 2.13% | | | | |
| | 32,119 | | | Orion Group Holdings, Inc.(a) | | | 79,655 | |
| | | | | | | | |
| |
| | Electric Utilities – 1.01% | | | | |
| | 562 | | | ALLETE, Inc. | | | 37,643 | |
| | | | | | | | |
| |
| | Electronic Equipment, Instruments & | | | | |
| |
| | Components – 2.87% | | | | |
| | 6,173 | | | Arlo Technologies, Inc.(a) | | | 54,693 | |
| | 1,298 | | | Avnet, Inc. | | | 52,686 | |
| | | | | | | | |
| | |
| | | | | | | 107,379 | |
| | | | | | | | |
| | | | | | | | |
| Shares | | | | | Value | |
|
| | Energy Equipment & Services – 4.89% | |
| | 4,895 | | | Dril-Quip, Inc.(a) | | $ | 182,828 | |
| | | | | | | | |
|
| | Equity Real Estate Investment Trusts – 3.22% | |
| | 4,270 | | | Equity Commonwealth(a) | | | 120,457 | |
| | | | | | | | |
| |
| | Food & Staples Retailing – 0.80% | | | | |
| | 337 | | | Ingles Markets, Inc. – Class A | | | 30,010 | |
| | | | | | | | |
|
| | Health Care Equipment & Supplies – 0.63% | |
| | 1,354 | | | Invacare Corp.(a) | | | 1,909 | |
| | 2,918 | | | LENSAR, Inc.(a) | | | 21,593 | |
| | | | | | | | |
| | |
| | | | | | | 23,502 | |
| | | | | | | | |
|
| | Health Care Providers & Services – 2.42% | |
| | 2,328 | | | MEDNAX, Inc.(a) | | | 54,662 | |
| | 1,007 | | | Premier, Inc. – Class A | | | 35,839 | |
| | | | | | | | |
| | | | | | | 90,501 | |
| | | | | | | | |
| |
| | Household Durables – 3.74% | | | | |
| | 9,253 | | | Dorel Industries, Inc. – Class B | | | 71,647 | |
| | 2,497 | | | Taylor Morrison Home Corp.(a) | | | 67,968 | |
| | | | | | | | |
| | |
| | | | | | | 139,615 | |
| | | | | | | | |
| |
| | Insurance – 6.34% | | | | |
| | 373 | | | American National Group, Inc. | | | 70,530 | |
| | 7,695 | | | Crawford & Co. – Class A | | | 58,174 | |
| | 514 | | | National Western Life Group, Inc. – Class A | | | 108,146 | |
| | | | | | | | |
| | |
| | | | | | | 236,850 | |
| | | | | | | | |
| |
| | IT Services – 0.48% | | | | |
| | 1,340 | | | SolarWinds Corp. | | | 17,835 | |
| | | | | | | | |
| |
| | Machinery – 10.91% | | | | |
| | 3,431 | | | Flowserve Corp. | | | 123,173 | |
| | 14,874 | | | Graham Corp. | | | 114,678 | |
| | 2,613 | | | Hurco Companies, Inc. | | | 82,362 | |
| | 5,689 | | | L.B. Foster Co. – Class A(a) | | | 87,440 | |
| | | | | | | | |
| | |
| | | | | | | 407,653 | |
| | | | | | | | |
| |
| | Multi-Utilities – 0.97% | | | | |
| | 798 | | | Avista Corp. | | | 36,030 | |
| | | | | | | | |
| |
| | Oil, Gas & Consumable Fuels – 4.79% | | | | |
| | 983 | | | Chesapeake Energy Corp. | | | 85,521 | |
| | 3,457 | | | World Fuel Services Corp. | | | 93,477 | |
| | | | | | | | |
| | |
| | | | | | | 178,998 | |
| | | | | | | | |
The accompanying notes to financial statements are an integral part of these Schedule of Investments.
73
Brandes Small Cap Value Fund
SCHEDULE OF INVESTMENTS — March 31, 2022 (Unaudited) (continued)
| | | | | | | | |
| Shares | | | | | Value | |
| |
| | Personal Products – 4.03% | | | | |
| | 4,111 | | | Edgewell Personal Care Co. | | $ | 150,750 | |
| | | | | | | | |
| |
| | Pharmaceuticals – 5.56% | | | | |
| | 4,197 | | | Avadel Pharmaceuticals Plc –ADR(a) | | | 28,666 | |
| | 4,621 | | | Phibro Animal Health Corp. – Class A | | | 92,189 | |
| | 1,644 | | | Prestige Consumer Healthcare, Inc.(a) | | | 87,033 | |
| | | | | | | | |
| | |
| | | | | | | 207,888 | |
| | | | | | | | |
| |
| | Professional Services – 3.08% | | | | |
| | 1,916 | | | Kelly Services, Inc. – Class A | | | 41,558 | |
| | 2,162 | | | Resources Connection, Inc. | | | 37,057 | |
| | 395 | | | Science Applications International Corp. | | | 36,407 | |
| | | | | | | | |
| | |
| | | | | | | 115,022 | |
| | | | | | | | |
| | | | | | | | |
| Shares | | | | | Value | |
| |
| | Software – 0.43% | | | | |
| | 1,781 | | | N-Able, Inc.(a) | | $ | 16,207 | |
| | | | | | | | |
| |
| TOTAL COMMON STOCKS
(Cost $ 3,015,966) | | $ | 3,218,395 | |
| | | | | | | | |
|
| | INVESTMENT COMPANIES – 2.10% | |
|
| | Trading Companies & Distributors – 2.10% | |
| | 5,206 | | | Sprott Physical Uranium Trust(a) | | $ | 78,413 | |
| | | | | | | | |
| |
| TOTAL INVESTMENT COMPANIES
(Cost $ 52,994) | | $ | 78,413 | |
| | | | | | | | |
| | | | | | | | |
| | | Principal
Amount | | | Value | |
| | |
CORPORATE BONDS – 0.35% | | | | | | | | |
| | |
Multi-Utilities – 0.35% | | | | | | | | |
Avista Corp.
5.125%, 4/1/2022 | | $ | 13,000 | | | $ | 13,000 | |
| | | | | | | | |
| | |
TOTAL CORPORATE BONDS
(Cost $13,000) | | | | | | $ | 13,000 | |
| | | | | | | | |
| | |
| | | Shares | | | Value | |
| | |
SHORT-TERM INVESTMENTS – 10.92% | | | | | | | | |
Northern Institutional Funds - Treasury Portfolio (Premier), 0.12%, (c) | | | 408,112 | | | $ | 408,112 | |
| | | | | | | | |
| | |
TOTAL SHORT-TERM INVESTMENTS
(Cost $408,112) | | | | | | $ | 408,112 | |
| | | | | | | | |
| | |
Total Investments (Cost $3,490,072) – 99.49% | | | | | | $ | 3,717,920 | |
Other Assets in Excess of Liabilities – 0.51% | | | | | | | 18,932 | |
| | | | | | | | |
| | |
TOTAL NET ASSETS – 100.00% | | | | | | $ | 3,736,852 | |
| | | | | | | | |
Percentages are stated as a percent of net assets.
ADR American Depositary Receipt
| (a) | Non-income producing security. |
| (b) | The price for this security was derived from an estimate of fair market value using methods approved by the Fund’s Board of Trustees. This security represents $28,425 or 0.76% of the Fund’s net assets and is classified as a Level 3 security. See Note 2 in the Notes to Financial Statements. |
| (c) | The rate shown is the annualized seven day yield as of March 31, 2022. |
The accompanying notes to financial statements are an integral part of these Schedule of Investments.
74
Brandes Small Cap Value Fund
SCHEDULE OF INVESTMENTS — March 31, 2022 (Unaudited) (continued)
The industry classifications represented in the Schedule of Investments are in accordance with Global Industry Classification Standards (GICS®), which was developed by and/or is the exclusive property of MSCI, Inc. and Standard & Poor’s Financial Services LLC or were otherwise determined by the Advisor to be appropriate. This information is unaudited.
The accompanying notes to financial statements are an integral part of these Schedule of Investments.
75
Brandes Small Cap Value Fund
SCHEDULE OF INVESTMENTS BY COUNTRY — March 31, 2022
| | | | |
COMMON STOCKS | | | | |
Brazil | | | 3.78 | % |
Canada | | | 1.92 | % |
Ireland | | | 0.77 | % |
United States | | | 79.65 | % |
| | | | |
| |
TOTAL COMMON STOCKS | | | 86.12 | % |
| | | | |
| |
CORPORATE BONDS | | | | |
United States | | | 0.35 | % |
| | | | |
| |
TOTAL CORPORATE BONDS | | | 0.35 | % |
| | | | |
| |
INVESTMENT COMPANIES | | | | |
Canada | | | 2.10 | % |
| | | | |
| |
TOTAL INVESTMENT COMPANIES | | | 2.10 | % |
| | | | |
| |
SHORT-TERM INVESTMENTS | | | 10.92 | % |
| | | | |
| |
TOTAL INVESTMENTS | | | 99.49 | % |
Other Assets in Excess of Liabilities | | | 0.51 | % |
| | | | |
| |
TOTAL NET ASSETS | | | 100.00 | % |
| | | | |
The accompanying notes to financial statements are an integral part of these Schedule of Investments.
76
Brandes U.S. Value Fund
SCHEDULE OF INVESTMENTS — March 31, 2022 (Unaudited)
| | | | | | | | |
| Shares | | | | | Value | |
| |
| | COMMON STOCKS – 98.02% | | | | |
| |
| | Aerospace & Defense – 4.35% | | | | |
| | 493 | | | General Dynamics Corp. | | $ | 118,902 | |
| | 1,376 | | | Textron, Inc. | | | 102,347 | |
| | | | | | | | |
| | |
| | | | | | | 221,249 | |
| | | | | | | | |
| |
| | Air Freight & Logistics – 2.51% | | | | |
| | 552 | | | FedEx Corp. | | | 127,727 | |
| | | | | | | | |
| |
| | Banks – 12.92% | | | | |
| | 3,266 | | | Bank of America Corp. | | | 134,625 | |
| | 2,304 | | | Citigroup, Inc. | | | 123,034 | |
| | 591 | | | JPMorgan Chase & Co. | | | 80,565 | |
| | 470 | | | PNC Financial Services Group, Inc. | | | 86,691 | |
| | 1,739 | | | Truist Financial Corp. | | | 98,601 | |
| | 2,744 | | | Wells Fargo & Co. | | | 132,974 | |
| | | | | | | | |
| | |
| | | | | | | 656,490 | |
| | | | | | | | |
| |
| | Building Products – 1.04% | | | | |
| | 806 | | | Johnson Controls International Plc | | | 52,849 | |
| | | | | | | | |
| |
| | Capital Markets – 3.24% | | | | |
| | 1,763 | | | Bank of New York Mellon Corp. | | | 87,498 | |
| | 887 | | | State Street Corp. | | | 77,275 | |
| | | | | | | | |
| | |
| | | | | | | 164,773 | |
| | | | | | | | |
| |
| | Chemicals – 2.83% | | | | |
| | 1,626 | | | Corteva, Inc. | | | 93,463 | |
| | 408 | | | Westlake Corp. | | | 50,347 | |
| | | | | | | | |
| | |
| | | | | | | 143,810 | |
| | | | | | | | |
| |
| | Communications Equipment – 1.15% | | | | |
| | 1,047 | | | Cisco Systems, Inc. | | | 58,381 | |
| | | | | | | | |
| |
| | Consumer Finance – 1.92% | | | | |
| | 2,062 | | | OneMain Holdings, Inc. | | | 97,759 | |
| | | | | | | | |
|
| | Diversified Financial Services – 1.51% | |
| | 218 | | | Berkshire Hathaway, Inc. – Class B(a) | | | 76,934 | |
| | | | | | | | |
| |
| | Electric Utilities – 0.74% | | | | |
| | 562 | | | ALLETE, Inc. | | | 37,643 | |
| | | | | | | | |
| |
| | Electrical Equipment – 1.93% | | | | |
| | 1,001 | | | Emerson Electric Co. | | | 98,148 | |
| | | | | | | | |
| | | | | | | | |
| Shares | | | | | Value | |
| |
| | Electronic Equipment, Instruments & Components – 2.60% | | | | |
| | 1,233 | | | Avnet, Inc. | | $ | 50,048 | |
| | 4,415 | | | Flex Ltd.(a) | | | 81,898 | |
| | | | | | | | |
| | |
| | | | | | | 131,946 | |
| | | | | | | | |
|
| | Energy Equipment & Services – 2.86% | |
| | 3,841 | | | Halliburton Co. | | | 145,459 | |
| | | | | | | | |
| |
| | Food Products – 1.93% | | | | |
| | 1,126 | | | Ingredion, Inc. | | | 98,131 | |
| | | | | | | | |
|
| | Health Care Providers & Services – 12.34% | |
| | 1,430 | | | Cardinal Health, Inc. | | | 81,081 | |
| | 574 | | | Cigna Corp. | | | 137,536 | |
| | 1,294 | | | CVS Health Corp. | | | 130,966 | |
| | 284 | | | HCA Healthcare, Inc. | | | 71,176 | |
| | 243 | | | Laboratory Corp. of America Holdings(a) | | | 64,070 | |
| | 464 | | | McKesson Corp. | | | 142,044 | |
| | | | | | | | |
| | |
| | | | | | | 626,873 | |
| | | | | | | | |
| |
| | Health Care Technology – 1.08% | | | | |
| | 2,525 | | | Change Healthcare, Inc.(a) | | | 55,045 | |
| | | | | | | | |
| |
| | Household Durables – 3.01% | | | | |
| | 638 | | | Mohawk Industries, Inc.(a) | | | 79,239 | |
| | 2,708 | | | Taylor Morrison Home Corp.(a) | | | 73,712 | |
| | | | | | | | |
| | |
| | | | | | | 152,951 | |
| | | | | | | | |
| |
| | Industrial Conglomerates – 0.84% | | | | |
| | 286 | | | 3M Co. | | | 42,580 | |
| | | | | | | | |
| |
| | Insurance – 5.92% | | | | |
| | 1,923 | | | American International Group, Inc. | | | 120,707 | |
| | 817 | | | Loews Corp. | | | 52,958 | |
| | 2,830 | | | Old Republic International Corp. | | | 73,212 | |
| | 229 | | | Willis Towers Watson Plc | | | 54,094 | |
| | | | | | | | |
| | |
| | | | | | | 300,971 | |
| | | | | | | | |
| |
| | Interactive Media & Services – 1.27% | | | | |
| | 23 | | | Alphabet, Inc. – Class C(a) | | | 64,239 | |
| | | | | | | | |
| |
| | IT Services – 6.83% | | | | |
| | 1,604 | | | Amdocs Ltd. | | | 131,865 | |
| | 1,046 | | | Cognizant Technology Solutions Corp. – Class A | | | 93,795 | |
| | 1,197 | | | Fiserv, Inc.(a) | | | 121,376 | |
| | | | | | | | |
| | |
| | | | | | | 347,036 | |
| | | | | | | | |
The accompanying notes to financial statements are an integral part of these Schedule of Investments.
77
Brandes U.S. Value Fund
SCHEDULE OF INVESTMENTS — March 31, 2022 (Unaudited) (continued)
| | | | | | | | |
| Shares | | | | | Value | |
| |
| | Machinery – 0.99% | | | | |
| | 3,322 | | | Gates Industrial Corp. Plc(a) | | $ | 50,029 | |
| | | | | | | | |
| |
| | Media – 6.32% | | | | |
| | 2,950 | | | Comcast Corp. – Class A | | | 138,119 | |
| | 2,003 | | | Fox Corp. – Class B | | | 72,669 | |
| | 1,300 | | | Omnicom Group, Inc. | | | 110,344 | |
| | | | | | | | |
| | |
| | | | | | | 321,132 | |
| | | | | | | | |
| |
| | Oil, Gas & Consumable Fuels – 5.34% | | | | |
| | 1,144 | | | Chevron Corp. | | | 186,278 | |
| | 3,154 | | | World Fuel Services Corp. | | | 85,284 | |
| | | | | | | | |
| | |
| | | | | | | 271,562 | |
| | | | | | | | |
| |
| | Pharmaceuticals – 7.01% | | | | |
| | 528 | | | Johnson & Johnson | | | 93,577 | |
| | 1,648 | | | Merck & Co., Inc. | | | 135,218 | |
| | 2,463 | | | Pfizer, Inc. | | | 127,510 | |
| | | | | | | | |
| | |
| | | | | | | 356,305 | |
| | | | | | | | |
| | | | | | | | |
| Shares | | | | | Value | |
|
| | Semiconductors & Semiconductor Equipment – 3.09% | |
| | 240 | | | Applied Materials, Inc. | | $ | 31,632 | |
| | 839 | | | Micron Technology, Inc. | | | 65,350 | |
| | 483 | | | Qorvo, Inc.(a) | | | 59,940 | |
| | | | | | | | |
| | |
| | | | | | | 156,922 | |
| | | | | | | | |
| |
| | Software – 1.12% | | | | |
| | 92 | | | Microsoft Corp. | | | 28,364 | |
| | 346 | | | Oracle Corp. | | | 28,625 | |
| | | | | | | | |
| | |
| | | | | | | 56,989 | |
| | | | | | | | |
| |
| | Specialty Retail – 1.33% | | | | |
| | 33 | | | AutoZone, Inc.(a) | | | 67,471 | |
| | | | | | | | |
| |
| TOTAL COMMON STOCKS
(Cost $ 5,098,686) | | $ | 4,981,404 | |
| | | | | | | | |
| | | | | | | | |
| | | Shares | | | Value | |
| | |
SHORT-TERM INVESTMENTS – 2.10% | | | | | | | | |
Northern Institutional Funds - Treasury Portfolio (Premier), 0.12%, (b) | | | 106,638 | | | $ | 106,638 | |
| | | | | | | | |
| | |
TOTAL SHORT-TERM INVESTMENTS
(Cost $106,638) | | | | | | $ | 106,638 | |
| | | | | | | | |
| | |
Total Investments (Cost $5,205,324) – 100.12% | | | | | | $ | 5,088,042 | |
| | |
Liabilities in Excess of Other Assets – (0.12)% | | | | | | | (6,006 | ) |
| | | | | | | | |
| | |
TOTAL NET ASSETS – 100.00% | | | | | | $ | 5,082,036 | |
| | | | | | | | |
Percentages are stated as a percent of net assets.
| (a) | Non-income producing security. |
| (b) | The rate shown is the annualized seven day yield as of March 31, 2022. |
The industry classifications represented in the Schedule of Investments are in accordance with Global Industry Classification Standards (GICS® ), which was developed by and/or is the exclusive property of MSCI, Inc. and Standard & Poor’s Financial Services LLC or were otherwise determined by the Advisor to be appropriate. This information is unaudited.
The accompanying notes to financial statements are an integral part of these Schedule of Investments.
78
Brandes U.S. Value Fund
SCHEDULE OF INVESTMENTS BY COUNTRY — March 31, 2022
| | | | |
COMMON STOCKS | | | | |
Ireland | | | 2.10 | % |
Singapore | | | 1.61 | % |
United Kingdom | | | 0.99 | % |
United States | | | 93.32 | % |
| | | | |
| |
TOTAL COMMON STOCKS | | | 98.02 | % |
| | | | |
| |
SHORT-TERM INVESTMENTS | | | 2.10 | % |
| | | | |
| |
TOTAL INVESTMENTS | | | 100.12 | % |
Liabilities in Excess of Other Assets | | | (0.12 | )% |
| | | | |
| |
TOTAL NET ASSETS | | | 100.00 | % |
| | | | |
The accompanying notes to financial statements are an integral part of these Schedule of Investments.
79
Brandes Core Plus Fixed Income Fund
SCHEDULE OF INVESTMENTS — March 31, 2022 (Unaudited)
| | | | | | | | |
| | | Shares | | | Value | |
COMMON STOCKS – 0.00% | | | | | | | | |
Household Durables – 0.00% | | | | | | | | |
Urbi Desarrollos Urbanos SAB de CV (a) | | | 1,564 | | | $ | 530 | |
| | | | | | | | |
| | |
TOTAL COMMON STOCKS (Cost $292,050) | | | | | | $ | 530 | |
| | | | | | | | |
| | |
| | | Principal Amount | | | Value | |
FEDERAL AND FEDERALLY SPONSORED CREDITS – 4.99% | | | | | | | | |
Federal Home Loan Mortgage Corporation – 1.62% | | | | | | | | |
Pool A9-3505 4.500%, 8/1/2040 | | $ | 44,524 | | | $ | 47,413 | |
Pool G0-6018 6.500%, 4/1/2039 | | | 13,934 | | | | 15,152 | |
Pool G1-8578 3.000%, 12/1/2030 | | | 607,749 | | | | 613,067 | |
Pool SD-8001 3.500%, 7/1/2049 | | | 194,701 | | | | 195,763 | |
Pool SD-8003 4.000%, 7/1/2049 | | | 240,630 | | | | 245,938 | |
| | | | | | | | |
| | |
| | | | | | | 1,117,333 | |
| | | | | | | | |
| | |
Federal National Mortgage Association – 3.37% | | | | | | | | |
Pool 934124 5.500%, 7/1/2038 | | | 35,932 | | | | 39,595 | |
Pool AL9865 3.000%, 2/1/2047 | | | 713,596 | | | | 708,464 | |
Pool AS6201 3.500%, 11/1/2045 | | | 237,549 | | | | 242,071 | |
Pool BJ2553 3.500%, 12/1/2047 | | | 198,956 | | | | 201,411 | |
Pool BN6683 3.500%, 6/1/2049 | | | 393,514 | | | | 395,553 | |
Pool CA1624 3.000%, 4/1/2033 | | | 472,120 | | | | 477,031 | |
Pool MA0918 4.000%, 12/1/2041 | | | 95,053 | | | | 99,194 | |
Pool MA3687 4.000%, 6/1/2049 | | | 162,315 | | | | 165,897 | |
| | | | | | | | |
| | |
| | | | | | | 2,329,216 | |
| | | | | | | | |
| | |
TOTAL FEDERAL AND FEDERALLY SPONSORED CREDITS (Cost $3,425,361) | | | | | | $ | 3,446,549 | |
| | | | | | | | |
| | |
OTHER MORTGAGE RELATED SECURITIES – 0.00% | | | | | | | | |
Collateralized Mortgage Obligations – 0.00% | | | | | | | | |
Wells Fargo Mortgage Backed Securities Trust Series 2006-AR14 2.915%, 10/25/2036(b) | | $ | 423 | | | $ | 395 | |
| | | | | | | | |
| | |
TOTAL OTHER MORTGAGE RELATED SECURITIES (Cost $416) | | | | | | $ | 395 | |
| | | | | | | | |
| | |
US GOVERNMENTS – 53.68% | | | | | | | | |
Sovereign – 53.68% | | | | | | | | |
United States Treasury Note | | | | | | | | |
2.375%, 8/15/2024 | | $ | 2,660,000 | | | $ | 2,653,870 | |
2.250%, 2/15/2027 | | | 9,075,000 | | | | 8,979,996 | |
2.375%, 5/15/2029 | | | 15,900,000 | | | | 15,854,039 | |
| | |
United States Treasury Bond | | | | | | | | |
4.750%, 2/15/2037 | | | 5,775,000 | | | | 7,534,570 | |
3.500%, 2/15/2039 | | | 1,750,000 | | | | 2,004,980 | |
| | | | | | | | |
The accompanying notes to financial statements are an integral part of these Schedule of Investments.
80
Brandes Core Plus Fixed Income Fund
SCHEDULE OF INVESTMENTS — March 31, 2022 (Unaudited) (continued)
| | | | | | | | |
| | | Principal
Amount | | | Value | |
| | |
TOTAL US GOVERNMENTS (Cost $ 38,323,129) | | | | | | $ | 37,027,455 | |
| | | | | | | | |
| | |
CONVERTIBLE BONDS – 1.59% | | | | | | | | |
Technology – 1.59% | | | | | | | | |
MicroStrategy, Inc. 0.000%, 2/15/2027(c) | | $ | 1,540,000 | | | $ | 1,100,142 | |
| | | | | | | | |
| | |
TOTAL CONVERTIBLE BONDS (Cost $ 1,137,176) | | | | | | $ | 1,100,142 | |
| | | | | | | | |
| | |
CORPORATE BONDS – 35.50% | | | | | | | | |
Banks – 7.06% | | | | | | | | |
Charles Schwab Corp. 5.375% (U.S. Treasury Yield Curve Rate CMT 5Y + 4.971%), Perpetual(d) | | $ | 465,000 | | | $ | 478,950 | |
Citigroup, Inc. 4.400%, 6/10/2025 | | | 730,000 | | | | 750,949 | |
Fifth Third Bancorp 8.250%, 3/1/2038 | | | 175,000 | | | | 258,537 | |
Goldman Sachs Group, Inc. 3.800% (U.S. Treasury Yield Curve Rate CMT 5Y + 2.969%), Perpetual(d) | | | 585,000 | | | | 542,222 | |
JPMorgan Chase & Co. 3.769% (3M LIBOR + 3.470%), Perpetual(d) | | | 1,317,000 | | | | 1,317,000 | |
USB Capital IX 3.500% (3M LIBOR + 1.020%, minimum of 3.500%), Perpetual(d) | | | 1,830,000 | | | | 1,520,037 | |
| | | | | | | | |
| | |
| | | | | | | 4,867,695 | |
| | | | | | | | |
| | |
Commercial Services & Supplies – 1.94% | | | | | | | | |
Iron Mountain, Inc. 4.875%, 9/15/2027(e) | | | 645,000 | | | | 637,744 | |
Travel + Leisure Co. 6.625%, 7/31/2026(e) | | | 670,000 | | | | 698,475 | |
| | | | | | | | |
| | |
| | | | | | | 1,336,219 | |
| | | | | | | | |
| | |
Consumer Products – 8.34% | | | | | | | | |
Avon Products, Inc. 6.500%, 3/15/2023 | | | 1,625,000 | | | | 1,639,332 | |
Coty, Inc. 5.000%, 4/15/2026(e) | | | 821,000 | | | | 799,449 | |
Ford Motor Credit Co. LLC | | | | | | | | |
3.350%, 11/1/2022 | | | 370,000 | | | | 370,851 | |
3.375%, 11/13/2025 | | | 350,000 | | | | 342,106 | |
| | |
Pilgrim’s Pride Corp. | | | | | | | | |
5.875%, 9/30/2027(e) | | | 210,000 | | | | 211,972 | |
4.250%, 4/15/2031(e) | | | 625,000 | | | | 578,125 | |
| | |
PulteGroup, Inc. 5.500%, 3/1/2026 | | | 980,000 | | | | 1,042,583 | |
The accompanying notes to financial statements are an integral part of these Schedule of Investments.
81
Brandes Core Plus Fixed Income Fund
SCHEDULE OF INVESTMENTS — March 31, 2022 (Unaudited) (continued)
| | | | | | | | |
| | | Principal
Amount | | | Value | |
| | |
Toll Brothers Finance Corp. 4.875%, 11/15/2025 | | $ | 745,000 | | | $ | 767,166 | |
| | | | | | | | |
| | |
| | | | | | | 5,751,584 | |
| | | | | | | | |
| | |
Containers & Packaging – 0.61% | | | | | | | | |
| | |
Sealed Air Corp. 4.000%, 12/1/2027(e) | | | 430,000 | | | | 419,250 | |
| | | | | | | | |
| | |
Electric Utilities – 1.54% | | | | | | | | |
| | |
American Transmission Systems, Inc. 2.650%, 1/15/2032(e) | | | 600,000 | | | | 554,518 | |
Commonwealth Edison Co. 5.900%, 3/15/2036 | | | 175,000 | | | | 214,801 | |
FirstEnergy Corp. 7.375%, 11/15/2031 | | | 240,000 | | | | 296,007 | |
| | | | | | | | |
| | |
| | | | | | | 1,065,326 | |
| | | | | | | | |
| | |
Hardware – 0.45% | | | | | | | | |
| | |
Mauser Packaging Solutions Holding Co. 7.250%, 4/15/2025(e) | | | 310,000 | | | | 307,244 | |
| | | | | | | | |
| | |
Health Care Facilities & Services – 1.51% | | | | | | | | |
Tenet Healthcare Corp. 4.875%, 1/1/2026(e) | | | 1,030,000 | | | | 1,039,013 | |
| | | | | | | | |
| | |
Industrial Services – 2.36% | | | | | | | | |
Continental Airlines Pass Through Trust Series 2007-1 5.983%, 4/19/2022 | | | 6,008 | | | | 6,017 | |
Prime Security Services Borrower LLC | | | | | | | | |
5.750%, 4/15/2026(e) | | | 715,000 | | | | 729,425 | |
6.250%, 1/15/2028(e) | | | 915,000 | | | | 895,414 | |
| | | | | | | | |
| | |
| | | | | | | 1,630,856 | |
| | | | | | | | |
| | |
Media – 1.53% | | | | | | | | |
Charter Communications Operating LLC 4.908%, 7/23/2025 | | | 295,000 | | | | 305,918 | |
Netflix, Inc. 4.375%, 11/15/2026 | | | 720,000 | | | | 748,753 | |
| | | | | | | | |
| | |
| | | | | | | 1,054,671 | |
| | | | | | | | |
| | |
Oil, Gas & Consumable Fuels – 3.44% | | | | | | | | |
BP Capital Markets Plc 3.506%, 3/17/2025 | | | 810,000 | | | | 825,421 | |
Continental Resources, Inc. | | | | | | | | |
4.500%, 4/15/2023 | | | 355,000 | | | | 359,260 | |
4.375%, 1/15/2028 | | | 215,000 | | | | 217,967 | |
The accompanying notes to financial statements are an integral part of these Schedule of Investments.
82
Brandes Core Plus Fixed Income Fund
SCHEDULE OF INVESTMENTS — March 31, 2022 (Unaudited) (continued)
| | | | | | | | |
| | | Principal
Amount | | | Value | |
Range Resources Corp.
4.875%, 5/15/2025 | | $ | 960,000 | | | $ | 971,679 | |
| | | | | | | | |
| | |
| | | | | | | 2,374,327 | |
| | | | | | | | |
| | |
| Technology – 1.78% | | | | | | | | |
VMware, Inc.
4.500%, 5/15/2025 | | | 215,000 | | | | 221,470 | |
| 3.900%, 8/21/2027 | | | 995,000 | | | | 1,007,859 | |
| | | | | | | | |
| | |
| | | | | | | 1,229,329 | |
| | | | | | | | |
| | |
| Telecommunications – 4.40% | | | | | | | | |
AT&T, Inc.
3.000%, 6/30/2022 | | | 1,630,000 | | | | 1,631,878 | |
Sprint Spectrum Co. LLC
5.152%, 3/20/2028(e) | | | 415,000 | | | | 436,993 | |
Telecom Italia Capital SA
6.375%, 11/15/2033 | | | 695,000 | | | | 664,232 | |
T-Mobile USA, Inc.
4.750%, 2/1/2028 | | | 300,000 | | | | 304,920 | |
| | | | | | | | |
| | |
| | | | | | | 3,038,023 | |
| | | | | | | | |
| | |
| Transportation & Logistics – 0.54% | | | | | | | | |
| Allison Transmission, Inc. 4.750%, 10/1/2027(e) | | | 380,000 | | | | 373,825 | |
| | | | | | | | |
| | |
TOTAL CORPORATE BONDS (Cost $24,720,007) | | | | | | $ | 24,487,362 | |
| | | | | | | | |
| | |
| ASSET BACKED SECURITIES – 1.75% | | | | | | | | |
| Student Loan – 1.75% | | | | | | | | |
| SLM Private Credit Student Loan Trust Series 2007-A, 1.066%, (3M LIBOR + 0.240%), 12/16/2041(d) | | $ | 179,794 | | | $ | 174,314 | |
| SLM Private Credit Student Loan Trust Series 2004-B, 1.256%, (3M LIBOR + 0.430%), 9/15/2033(d) | | | 300,000 | | | | 289,381 | |
| SLM Private Credit Student Loan Trust Series 2005-A, 1.136%, (3M LIBOR + 0.310%), 12/15/2038(d) | | | 293,220 | | | | 286,952 | |
| SLM Private Credit Student Loan Trust Series 2006-A, 1.116%, (3M LIBOR + 0.290%), 6/15/2039(d) | | | 477,182 | | | | 458,843 | |
| | | | | | | | |
| | |
TOTAL ASSET BACKED SECURITIES
(Cost $1,160,817) | | | | | | $ | 1,209,490 | |
| | | | | | | | |
| | |
| FOREIGN ISSUER BONDS – 0.65% | | | | | | | | |
| Materials – 0.37% | | | | | | | | |
Methanex Corp.,
5.125%, 10/15/2027 | | $ | 250,000 | | | $ | 251,250 | |
| | | | | | | | |
| | |
| Telecommunications – 0.28% | | | | | | | | |
SoftBank Group Corp.,
4.750%, 9/19/2024 | | | 200,000 | | | | 195,000 | |
| | | | | | | | |
| | |
TOTAL FOREIGN ISSUER BONDS
(Cost $458,519) | | | | | | $ | 446,250 | |
| | | | | | | | |
The accompanying notes to financial statements are an integral part of these Schedule of Investments.
83
Brandes Core Plus Fixed Income Fund
SCHEDULE OF INVESTMENTS — March 31, 2022 (Unaudited) (continued)
| | | | | | | | |
| | | Shares | | | Value | |
| | |
SHORT-TERM INVESTMENTS – 1.23% | | | | | | | | |
Money Market Funds – 1.23% | | | | | | | | |
Northern Institutional Funds - Treasury Portfolio (Premier), 0.12%(f) | | | 846,688 | | | $ | 846,688 | |
| | | | | | | | |
| | |
TOTAL SHORT-TERM INVESTMENTS (Cost $846,688) | | | | | | $ | 846,688 | |
| �� | | | | | | | |
| | |
Total Investments (Cost $70,364,163) – 99.39% | | | | | | $ | 68,564,861 | |
Other Assets in Excess of Liabilities – 0.61% | | | | | | | 417,431 | |
| | | | | | | | |
| | |
Total Net Assets – 100.00% | | | | | | $ | 68,982,292 | |
| | | | | | | | |
Percentages are stated as a percent of net assets.
LIBOR London Interbank Offered Rate
| (a) | Non-income producing security. |
| (b) | Variable rate security. The coupon is based on an underlying pool of loans. |
| (d) | Variable rate security. The coupon is based on a reference index and spread index. |
| (e) | Acquired in a transaction exempt from registration under Rule 144A or Section 4(a)(2) of the Securities Act of 1933. May be resold in the U.S. in transactions exempt from registration, normally to qualified institutional buyers. The total value of all such securities was $7,681,446 which represented 11.14% of the net assets of the Fund. |
| (f) | The rate shown is the annualized seven day yield as of March 31, 2022. |
The accompanying notes to financial statements are an integral part of these Schedule of Investments.
84
Brandes Core Plus Fixed Income Fund
SCHEDULE OF INVESTMENTS — March 31, 2022 (Unaudited) (continued)
The industry classifications represented in the Schedule of Investments are in accordance with Bloomberg Industry Classification Standards (BICS) or were otherwise determined by the Advisor to be appropriate. This information is unaudited.
The accompanying notes to financial statements are an integral part of these Schedule of Investments.
85
Brandes Investment Trust
STATEMENTS OF ASSETS AND LIABILITIES — March 31, 2022 (Unaudited)
| | | | | | | | |
| | | Brandes
International
Equity Fund | | | Brandes
Global
Equity Fund |
| | |
ASSETS | | | | | | | | |
Investment in securities, at value(1), (2) | | | | | | | | |
Unaffiliated issuers | | $ | 656,205,544 | | | $ | 46,593,348 | |
Affiliated issuers | | | — | | | | — | |
Foreign Currency(1) | | | 255,001 | | | | 25,767 | |
Receivables: | | | | | | | | |
Securities sold | | | — | | | | — | |
Fund shares sold | | | 386,368 | | | | 1,557 | |
Dividends and interest | | | 3,561,842 | | | | 141,289 | |
Tax reclaims | | | 1,695,468 | | | | 51,883 | |
Securities lending | | | 1,612 | | | | 104 | |
Receivable from service providers | | | 12,573 | | | | 476 | |
Prepaid expenses and other assets | | | 92,201 | | | | 36,489 | |
Due from Advisor | | | — | | | | — | |
| | | | | | | | |
Total Assets | | | 662,210,609 | | | | 46,850,913 | |
| | | | | | | | |
| | |
LIABILITIES | | | | | | | | |
Payables: | | | | | | | | |
Securities purchased | | | 74 | | | | 7 | |
Fund shares redeemed | | | 821,868 | | | | 94,092 | |
12b-1 Fee | | | 13,996 | | | | 694 | |
Trustee Fees | | | 19,151 | | | | 1,351 | |
Custodian Fee | | | 19,842 | | | | 1,461 | |
Foreign capital gains taxes | | | — | | | | — | |
Dividends payable | | | 28,008 | | | | 927 | |
Accrued expenses | | | 206,861 | | | | 84,159 | |
Due to Advisor | | | 373,061 | | | | 24,332 | |
| | | | | | | | |
Total Liabilities | | | 1,482,861 | | | | 207,023 | |
| | | | | | | | |
| | |
NET ASSETS | | $ | 660,727,748 | | | $ | 46,643,890 | |
| | | | | | | | |
| | |
COMPONENTS OF NET ASSETS | | | | | | | | |
Paid in Capital | | $ | 787,809,016 | | | $ | 38,646,614 | |
Total distributable earnings (loss) | | | (127,081,268 | ) | | | 7,997,276 | |
| | | | | | | | |
Total Net Assets | | $ | 660,727,748 | | | $ | 46,643,890 | |
| | | | | | | | |
| | |
Net asset value, offering price and redemption proceeds per share | | | | | | | | |
Class A Shares | | | | | | | | |
Net Assets | | $ | 45,730,851 | | | $ | 868,697 | |
Shares outstanding (unlimited shares authorized without par value) | | | 2,659,081 | | | | 33,960 | |
Offering and redemption price | | $ | 17.20 | | | $ | 25.58 | |
| | | | | | | | |
Maximum offering price per share* | | $ | 18.25 | | | $ | 27.14 | |
| | | | | | | | |
| | |
Class C Shares | | | | | | | | |
Net Assets | | $ | 8,211,196 | | | $ | 800,469 | |
Shares outstanding (unlimited shares authorized without par value) | | | 486,546 | | | | 31,686 | |
Offering and redemption price | | $ | 16.88 | | | $ | 25.26 | |
| | | | | | | | |
| | |
Class I Shares | | | | | | | | |
Net Assets | | $ | 554,269,978 | | | $ | 44,974,724 | |
Shares outstanding (unlimited shares authorized without par value) | | | 31,972,320 | | | | 1,738,897 | |
Offering and redemption price | | $ | 17.34 | | | $ | 25.86 | |
| | | | | | | | |
| | |
Class R6 Shares | | | | | | | | |
Net Assets | | $ | 52,515,723 | | | $ | N/A | |
Shares outstanding (unlimited shares authorized without par value) | | | 3,007,584 | | | | N/A | |
Offering and redemption price | | $ | 17.46 | | | $ | N/A | |
| | | | | | | | |
(1) Cost of: | | | | | | | | |
Investments in securities | | | | | | | | |
Unaffiliated issuers | | $ | 709,778,752 | | | $ | 38,751,671 | |
Affiliated issuers | | | — | | | | — | |
Foreign currency | | | 254,966 | | | | 25,767 | |
(2) Market value of securities loaned of: | | $ | 13,224,469 | | | $ | — | |
| * | Includes a sales load of 5.75% for the International, Global, Emerging Markets, International Small Cap, Small Cap Value, and U.S. Value Funds and 3.75% for the Core Plus Fund. (see Note 7 of the Notes to Financial Statements) |
The accompanying notes to financial statements are an integral part of this statement.
86
Brandes Investment Trust
STATEMENTS OF ASSETS AND LIABILITIES — March 31, 2022 (Unaudited) (continued)
| | | | | | | | | | | | | | | | | | |
Brandes Emerging Markets Value Fund | | | Brandes
International
Small Cap
Equity Fund | | | Brandes
Small Cap
Value Fund | | | Brandes
U.S. Value
Fund | | | Brandes
Core Plus Fixed
Income Fund |
| | | | |
| | | | | | | | | | | | | | | | | | |
| $ | 1,074,013,416 | | | $ | 341,261,407 | | | $ | 3,717,920 | | | $ | 5,088,042 | | | $ | 68,564,861 | |
| | — | | | | 877,489 | | | | — | | | | — | | | | — | |
| | 182,722 | | | | 132 | | | | — | | | | — | | | | — | |
| | | | |
| | 8,230,337 | | | | 1,542,437 | | | | 27,509 | | | | — | | | | — | |
| | 867,153 | | | | 213,957 | | | | 28,468 | | | | 5,582 | | | | 90,903 | |
| | 6,059,674 | | | | 1,883,153 | | | | 3,697 | | | | 6,014 | | | | 497,736 | |
| | 184,109 | | | | 393,952 | | | | — | | | | 117 | | | | — | |
| | — | | | | 7,487 | | | | — | | | | — | | | | — | |
| | 25,412 | | | | 5,189 | | | | — | | | | — | | | | 1,308 | |
| | 130,617 | | | | 70,919 | | | | 33,961 | | | | 934 | | | | 35,351 | |
| | — | | | | — | | | | 6,620 | | | | 5,564 | | | | — | |
| | | | | | | | | | | | | | | | | | |
| | 1,089,693,440 | | | | 346,256,122 | | | | 3,818,175 | | | | 5,106,253 | | | | 69,190,159 | |
| | | | | | | | | | | | | | | | | | |
| | | | |
| | | | | | | | | | | | | | | | | | |
| | | | |
| | | | | | | | | | | | | | | | | | |
| | 10,992,831 | | | | 1,257,401 | | | | 30,079 | | | | — | | | | — | |
| | 4,229,047 | | | | 879,103 | | | | 14,479 | | | | — | | | | 76,074 | |
| | 43,042 | | | | 15,682 | | | | 181 | | | | 22 | | | | 178 | |
| | 33,908 | | | | 10,686 | | | | 87 | | | | 10 | | | | 2,155 | |
| | 57,628 | | | | 18,018 | | | | — | | | | 90 | | | | 886 | |
| | 926,804 | | | | — | | | | — | | | | — | | | | — | |
| | 1,280,304 | | | | 9,815 | | | | 1 | | | | — | | | | 1,692 | |
| | 384,327 | | | | 195,105 | | | | 36,496 | | | | 24,095 | | | | 126,157 | |
| | 851,370 | | | | 279,320 | | | | — | | | | — | | | | 725 | |
| | | | | | | | | | | | | | | | | | |
| | 18,799,261 | | | | 2,665,130 | | | | 81,323 | | | | 24,217 | | | | 207,867 | |
| | | | | | | | | | | | | | | | | | |
| $ | 1,070,894,179 | | | $ | 343,590,992 | | | $ | 3,736,852 | | | $ | 5,082,036 | | | $ | 68,982,292 | |
| | | | | | | | | | | | | | | | | | |
| | | | |
| | | | | | | | | | | | | | | | | | |
| $ | 1,466,166,758 | | | $ | 526,087,041 | | | $ | 3,528,407 | | | $ | 5,192,726 | | | $ | 72,155,859 | |
| | (395,272,579 | ) | | | (182,496,049 | ) | | | 208,445 | | | | (110,690 | ) | | | (3,173,567 | ) |
| | | | | | | | | | | | | | | | | | |
| $ | 1,070,894,179 | | | $ | 343,590,992 | | | $ | 3,736,852 | | | $ | 5,082,036 | | | $ | 68,982,292 | |
| | | | | | | | | | | | | | | | | | |
| | | | |
| | | | | | | | | | | | | | | | | | |
| $ | 177,146,654 | | | $ | 60,348,689 | | | $ | 889,280 | | | $ | 105,948 | | | $ | 818,095 | |
| | 23,442,039 | | | | 5,018,225 | | | | 69,231 | | | | 10,026 | | | | 93,533 | |
| $ | 7.56 | | | $ | 12.03 | | | $ | 12.85 | | | $ | 10.57 | | | $ | 8.75 | |
| | | | | | | | | | | | | | | | | | |
| $ | 8.02 | | | $ | 12.76 | | | $ | 13.63 | | | $ | 11.21 | | | $ | 9.09 | |
| | | | | | | | | | | | | | | | | | |
| | | | |
| | | | | | | | | | | | | | | | | | |
| $ | 7,845,447 | | | $ | 4,411,821 | | | $ | N/A | | | $ | N/A | | | $ | N/A | |
| | 1,048,641 | | | | 381,248 | | | | N/A | | | | N/A | | | | N/A | |
| $ | 7.48 | | | $ | 11.57 | | | $ | N/A | | | $ | N/A | | | $ | N/A | |
| | | | | | | | | | | | | | | | | | |
| | | | |
| | | | | | | | | | | | | | | | | | |
| $ | 827,656,545 | | | $ | 266,173,255 | | | $ | 2,847,411 | | | $ | 4,975,982 | | | $ | 68,164,099 | |
| | 108,865,383 | | | | 22,010,888 | | | | 219,362 | | | | 471,520 | | | | 7,717,282 | |
| $ | 7.60 | | | $ | 12.09 | | | $ | 12.98 | | | $ | 10.55 | | | $ | 8.83 | |
| | | | | | | | | | | | | | | | | | |
| | | | |
| | | | | | | | | | | | | | | | | | |
| $ | 58,245,533 | | | $ | 12,657,227 | | | $ | 161 | | | $ | 106 | | | $ | 98 | |
| | 7,603,714 | | | | 1,043,171 | | | | 13 | | | | 10 | | | | 11 | |
| $ | 7.66 | | | $ | 12.13 | | | $ | 12.18 | | | $ | 10.57 | | | $ | 8.83 | |
| | | | | | | | | | | | | | | | | | |
| | | | |
| | | | | | | | | | | | | | | | | | |
| $ | 1,299,398,452 | | | $ | 338,826,683 | | | $ | 3,490,072 | | | $ | 5,205,324 | | | $ | 70,364,163 | |
| | — | | | | 30,882,874 | | | | — | | | | — | | | | — | |
| | 182,729 | | | | 132 | | | | — | | | | — | | | | — | |
| $ | — | | | $ | — | | | $ | — | | | $ | — | | | $ | — | |
The accompanying notes to financial statements are an integral part of this statement.
87
Brandes Investment Trust
STATEMENTS OF OPERATIONS — For the Six Months Ended March 31, 2022 (Unaudited)
| | | | | | | | |
| | | Brandes
International
Equity Fund | | Brandes
Global
Equity Fund |
| | |
INVESTMENT INCOME | | | | | | | | |
| | |
Income | | | | | | | | |
Dividend income | | | | | | | | |
Unaffiliated issuers | | $ | 9,720,871 | | | $ | 609,762 | |
Non Cash Dividends | | | — | | | | — | |
Less: Foreign taxes withheld | | | (802,218 | ) | | | (28,203 | ) |
Interest income | | | — | | | | 249 | |
Income from securities lending | | | 30,143 | | | | 709 | |
| | | | | | | | |
Total Income | | | 8,948,796 | | | | 582,517 | |
| | | | | | | | |
| | |
Expenses | | | | | | | | |
Advisory fees (Note 3) | | | 2,489,665 | | | | 193,838 | |
Custody fees | | | 39,305 | | | | 2,454 | |
Administration fees (Note 3) | | | 78,484 | | | | 13,660 | |
Insurance expense | | | 11,102 | | | | 811 | |
Legal fees | | | 32,823 | | | | 2,376 | |
Printing fees | | | 17,352 | | | | 758 | |
Miscellaneous | | | 41,186 | | | | 6,298 | |
Registration expense | | | 42,252 | | | | 27,631 | |
Trustees fees | | | 37,149 | | | | 2,679 | |
Transfer agent fees | | | 69,928 | | | | 5,104 | |
12b-1 Fees – Class A | | | 49,698 | | | | 1,068 | |
12b-1 Fees – Class C | | | 32,401 | | | | 3,286 | |
Shareholder Service Fees – Class C | | | 10,800 | | | | 1,095 | |
Sub-Transfer Agency Fees – Class I | | | 139,662 | | | | 11,683 | |
Auditing fees | | | 23,213 | | | | 22,111 | |
| | | | | | | | |
Total expenses | | | 3,115,020 | | | | 294,852 | |
Expenses waived by Advisor | | | (201,868 | ) | | | (45,819 | ) |
Expenses recouped | | | — | | | | — | |
Expenses waived by Service Providers | | | (23,528 | ) | | | (1,255 | ) |
| | | | | | | | |
Total net expenses | | | 2,889,624 | | | | 247,778 | |
| | | | | | | | |
Net investment income | | | 6,059,172 | | | | 334,739 | |
| | | | | | | | |
| | |
REALIZED AND UNREALIZED GAIN (LOSS) ON INVESTMENTS | | | | | | | | |
Net realized gain (loss) on: | | | | | | | | |
Unaffiliated investments | | | 1,060,378 | | | | 677,818 | |
Foreign currency transactions | | | (153,166 | ) | | | (2,010 | ) |
| | | | | | | | |
Net realized gain (loss) | | | 907,212 | | | | 675,808 | |
| | | | | | | | |
Net change in unrealized appreciation (depreciation) on: | | | | | | | | |
Unaffiliated investments (net of increase in estimated foreign capital gains taxes of $3,797,746 for the Emerging Markets Fund) | | | (30,843,777 | ) | | | (625,011 | ) |
Affiliated investments | | | — | | | | — | |
Foreign currency transactions | | | 25,817 | | | | (2,231 | ) |
| | | | | | | | |
Net change in unrealized appreciation (depreciation) | | | (30,817,960 | ) | | | (627,242 | ) |
| | | | | | | | |
Net realized and unrealized gain (loss) on investments and foreign currency transactions | | | (29,910,748 | ) | | | 48,566 | |
| | | | | | | | |
Net increase (decrease) in net assets resulting from operations | | $ | (23,851,576 | ) | | $ | 383,305 | |
| | | | | | | | |
| * | Commencement of operations on October 1, 2021. |
The accompanying notes to financial statements are an integral part of this statement.
88
Brandes Investment Trust
STATEMENTS OF OPERATIONS — For the Six Months Ended March 31, 2022 (Unaudited) (continued)
| | | | | | | | | | | | | | | | | | |
Brandes
Emerging
Markets
Value Fund | | | Brandes
International
Small Cap
Equity Fund | | Brandes
Small Cap
Value Fund | | Brandes
U.S. Value
Fund* | | Brandes
Core Plus Fixed
Income Fund |
| | | | |
| | | | | | | | | | | | | | | | | | |
| | | | |
| | | | | | | | | | | | | | | | | | |
| | | | | | | | | | | | | | | | | | |
| $ | 20,726,166 | | | $ | 12,298,478 | | | $ | 66,832 | | | $ | 18,004 | | | $ | 85 | |
| | — | | | | — | | | | — | | | | — | | | | — | |
| | (3,342,561 | ) | | | (1,728,430 | ) | | | (6,806 | ) | | | — | | | | (2 | ) |
| | — | | | | — | | | | 25 | | | | — | | | | 1,008,366 | |
| | — | | | | 229,264 | | | | — | | | | — | | | | — | |
| | | | | | | | | | | | | | | | | | |
| | 17,383,605 | | | | 10,799,312 | | | | 60,051 | | | | 18,004 | | | | 1,008,449 | |
| | | | | | | | | | | | | | | | | | |
| | | | |
| | | | | | | | | | | | | | | | | | |
| | 5,824,500 | | | | 1,768,638 | | | | 10,289 | | | | 4,353 | | | | 134,302 | |
| | 110,448 | | | | 38,099 | | | | 3,122 | | | | 467 | | | | 1,732 | |
| | 137,735 | | | | 47,782 | | | | 8,865 | | | | 4,523 | | | | 16,640 | |
| | 22,228 | | | | 6,712 | | | | 42 | | | | 5 | | | | 1,388 | |
| | 62,991 | | | | 19,191 | | | | 133 | | | | 11 | | | | 3,866 | |
| | 48,823 | | | | 14,773 | | | | 75 | | | | 262 | | | | 2,174 | |
| | 89,523 | | | | 35,924 | | | | 2,900 | | | | 17,207 | | | | 6,840 | |
| | 49,719 | | | | 40,342 | | | | 27,703 | | | | 2,587 | | | | 27,803 | |
| | 70,378 | | | | 21,250 | | | | 156 | | | | 18 | | | | 4,333 | |
| | 129,180 | | | | 39,226 | | | | 310 | | | | 166 | | | | 8,084 | |
| | 257,993 | | | | 80,812 | | | | 871 | | | | 34 | | | | 2,223 | |
| | 35,237 | | | | 18,240 | | | | — | | | | — | | | | — | |
| | 11,746 | | | | 6,080 | | | | — | | | | — | | | | — | |
| | 236,084 | | | | 72,448 | | | | 561 | | | | 236 | | | | 18,742 | |
| | 23,864 | | | | 22,917 | | | | 20,465 | | | | 21,032 | | | | 21,578 | |
| | | | | | | | | | | | | | | | | | |
| | 7,110,449 | | | | 2,232,434 | | | | 75,492 | | | | 50,901 | | | | 249,705 | |
| | (39,535 | ) | | | (6,384 | ) | | | (61,320 | ) | | | (45,211 | ) | | | (111,043 | ) |
| | 36,235 | | | | — | | | | — | | | | — | | | | — | |
| | (47,208 | ) | | | (12,077 | ) | | | (28 | ) | | | — | | | | (21,811 | ) |
| | | | | | | | | | | | | | | | | | |
| | 7,059,941 | | | | 2,213,973 | | | | 14,144 | | | | 5,690 | | | | 116,851 | |
| | | | | | | | | | | | | | | | | | |
| | 10,323,664 | | | | 8,585,339 | | | | 45,907 | | | | 12,314 | | | | 891,598 | |
| | | | | | | | | | | | | | | | | | |
| | | | |
| | | | | | | | | | | | | | | | | | |
| | | | | | | | | | | | | | | | | | |
| | (37,139,257 | ) | | | 10,252,949 | | | | 55,307 | | | | 4,452 | | | | 157,346 | |
| | (178,667 | ) | | | (19,714 | ) | | | 376 | | | | — | | | | — | |
| | | | | | | | | | | | | | | | | | |
| | (37,317,924 | ) | | | 10,233,235 | | | | 55,683 | | | | 4,452 | | | | 157,346 | |
| | | | | | | | | | | | | | | | | | |
| | | | |
| | | | | | | | | | | | | | | | | | |
| | (112,600,286 | ) | | | (58,584,189 | ) | | | (43,007 | ) | | | (117,282 | ) | | | (5,107,510 | ) |
| | — | | | | (418,431 | ) | | | — | | | | — | | | | — | |
| | (20,722 | ) | | | (24,231 | ) | | | 15 | | | | — | | | | — | |
| | | | | | | | | | | | | | | | | | |
| | (112,621,008 | ) | | | (59,026,851 | ) | | | (42,992 | ) | | | (117,282 | ) | | | (5,107,510 | ) |
| | | | | | | | | | | | | | | | | | |
| | (149,938,932 | ) | | | (48,793,616 | ) | | | 12,691 | | | | (112,830 | ) | | | (4,950,164 | ) |
| | | | | | | | | | | | | | | | | | |
| $ | (139,615,268 | ) | | $ | (40,208,277 | ) | | $ | 58,598 | | | $ | (100,516 | ) | | $ | (4,058,566 | ) |
| | | | | | | | | | | | | | | | | | |
The accompanying notes to financial statements are an integral part of this statement.
89
Brandes Investment Trust
STATEMENT OF CHANGES IN NET ASSETS
| | | | | | | | | | | | | | | | |
| | | Brandes International Equity | | Brandes Global |
| | | Fund | | Equity Fund |
| | | Six Months Ended
March 31,
2022
(Unaudited) | �� | Year Ended
September 30,
2021 | | Six Months Ended
March 31,
2022
(Unaudited) | | Year Ended
September 30,
2021 |
| | | | |
INCREASE (DECREASE) IN NET ASSETS FROM: | | | | | | | | | | | | | | | | |
| | | | |
OPERATIONS | | | | | | | | | | | | | | | | |
Net investment income | | $ | 6,059,172 | | | $ | 19,498,943 | | | $ | 334,739 | | | $ | 1,021,630 | |
Net realized gain (loss) on: | | | | | | | | | | | | | | | | |
Investments | | | 1,060,378 | | | | (474,713 | ) | | | 677,818 | | | | 1,871,263 | |
Foreign currency transactions | | | (153,166 | ) | | | (131,250 | ) | | | (2,010 | ) | | | (4,557 | ) |
Net unrealized appreciation (depreciation) on: | | | | | | | | | | | | | | | | |
Investments | | | (30,843,777 | ) | | | 154,701,750 | | | | (625,011 | ) | | | 9,678,417 | |
Foreign currency transactions | | | 25,817 | | | | (29,853 | ) | | | (2,231 | ) | | | (3,044 | ) |
| | | | | | | | | | | | | | | | |
Net increase (decrease) in net assets resulting from operations | | | (23,851,576 | ) | | | 173,564,877 | | | | 383,305 | | | | 12,563,709 | |
| | | | | | | | | | | | | | | | |
| | | | |
DISTRIBUTIONS TO SHAREHOLDERS | | | | | | | | | | | | | | | | |
Distributions to shareholders | | | | | | | | | | | | | | | | |
Class A | | | (647,712 | ) | | | (867,045 | ) | | | (36,642 | ) | | | (24,398 | ) |
Class C | | | (104,154 | ) | | | (203,047 | ) | | | (36,326 | ) | | | (26,196 | ) |
Class I | | | (8,025,880 | ) | | | (14,614,616 | ) | | | (2,009,739 | ) | | | (1,407,084 | ) |
Class R6 | | | (760,201 | ) | | | (1,576,599 | ) | | | N/A | | | | N/A | |
| | | | | | | | | | | | | | | | |
| | | | |
Decrease in net assets from distributions | | | (9,537,947 | ) | | | (17,261,307 | ) | | | (2,082,707 | ) | | | (1,457,678 | ) |
| | | | | | | | | | | | | | | | |
| | | | |
CAPITAL SHARE TRANSACTIONS | | | | | | | | | | | | | | | | |
Proceeds from shares sold | | | 95,338,830 | | | | 181,449,754 | | | | 2,378,740 | | | | 9,162,908 | |
Net asset value of shares issued on reinvestment of distributions | | | 9,351,063 | | | | 16,741,706 | | | | 2,069,801 | | | | 1,446,229 | |
Cost of shares redeemed | | | (68,656,645 | ) | | | (175,603,810 | ) | | | (3,319,730 | ) | | | (4,707,060 | ) |
| | | | | | | | | | | | | | | | |
Net increase (decrease) in net assets from capital share transactions | | | 36,033,248 | | | | 22,587,650 | | | | 1,128,811 | | | | 5,902,077 | |
| | | | | | | | | | | | | | | | |
Total increase (decrease) in net assets | | | 2,643,725 | | | | 178,891,220 | | | | (570,591 | ) | | | 17,008,108 | |
| | | | | | | | | | | | | | | | |
| | | | |
NET ASSETS | | | | | | | | | | | | | | | | |
Beginning of the Period | | | 658,084,023 | | | | 479,192,803 | | | | 47,214,481 | | | | 30,206,373 | |
| | | | | | | | | | | | | | | | |
End of the Period | | $ | 660,727,748 | | | $ | 658,084,023 | | | $ | 46,643,890 | | | $ | 47,214,481 | |
| | | | | | | | | | | | | | | | |
The accompanying notes to financial statements are an integral part of this statement.
90
Brandes Investment Trust
STATEMENT OF CHANGES IN NET ASSETS (continued)
| | | | | | | | | | | | | | | | |
| | | Brandes Emerging Markets | | Brandes International Small |
| | | Value Fund | | Cap Equity Fund |
| | | Six Months Ended
March 31, 2022 | | Year Ended
September 30,
2021 | | Six Months Ended
March 31, 2022 | | Year Ended
September 30,
2021 |
| | | (Unaudited) | | | | (Unaudited) | | |
| | | | |
INCREASE (DECREASE) IN NET ASSETS FROM: | | | | | | | | | | | | | | | | |
| | | | |
OPERATIONS | | | | | | | | | | | | | | | | |
Net investment income | | $ | 10,323,664 | | | $ | 28,600,598 | | | $ | 8,585,339 | | | $ | 4,725,118 | |
Net realized gain (loss) on: | | | | | | | | | | | | | | | | |
Investments | | | (37,139,257 | ) | | | 3,896,861 | | | | 10,252,949 | | | | 23,489,024 | |
Foreign currency transactions | | | (178,667 | ) | | | (265,591 | ) | | | (19,714 | ) | | | (86,203 | ) |
Net unrealized appreciation (depreciation) on: | | | | | | | | | | | | | | | | |
Investments | | | (112,600,286 | ) | | | 224,737,828 | | | | (59,002,620 | ) | | | 130,209,934 | |
Foreign currency transactions | | | (20,722 | ) | | | 73,348 | | | | (24,231 | ) | | | (27,266 | ) |
| | | | | | | | | | | | | | | | |
Net increase (decrease) in net assets resulting from operations | | | (139,615,268 | ) | | | 257,043,044 | | | | (40,208,277 | ) | | | 158,310,607 | |
| | | | | | | | | | | | | | | | |
| | | | |
DISTRIBUTIONS TO | | | | | | | | | | | | | | | | |
SHAREHOLDERS | | | | | | | | | | | | | | | | |
Distributions to shareholders | | | | | | | | | | | | | | | | |
Class A | | | (3,221,170 | ) | | | (2,477,613 | ) | | | (2,751,254 | ) | | | (775,482 | ) |
Class C | | | (128,667 | ) | | | (132,067 | ) | | | (192,412 | ) | | | (75,830 | ) |
Class I | | | (15,338,947 | ) | | | (12,653,014 | ) | | | (12,328,933 | ) | | | (3,791,449 | ) |
Class R6 | | | (1,078,028 | ) | | | (871,639 | ) | | | (585,337 | ) | | | (159,657 | ) |
| | | | | | | | | | | | | | | | |
Decrease in net assets from distributions | | | (19,766,812 | ) | | | (16,134,333 | ) | | | (15,857,936 | ) | | | (4,802,418 | ) |
| | | | | | | | | | | | | | | | |
| | | | |
CAPITAL SHARE TRANSACTIONS | | | | | | | | | | | | | | | | |
Proceeds from shares sold | | | 183,328,234 | | | | 362,787,961 | | | | 27,180,271 | | | | 66,727,719 | |
Net asset value of shares issued on reinvestment of distributions | | | 16,340,485 | | | | 15,194,734 | | | | 15,826,755 | | | | 4,783,873 | |
Cost of shares redeemed | | | (267,886,937 | ) | | | (379,551,076 | ) | | | (48,183,750 | ) | | | (131,748,892 | ) |
| | | | | | | | | | | | | | | | |
Net increase (decrease) in net assets from capital share transactions | | | (68,218,218 | ) | | | (1,568,381 | ) | | | (5,176,724 | ) | | | (60,237,300 | ) |
| | | | | | | | | | | | | | | | |
Total increase (decrease) in net assets | | | (227,600,298 | ) | | | 239,340,330 | | | | (61,242,937 | ) | | | 93,270,889 | |
| | | | | | | | | | | | | | | | |
| | | | |
NET ASSETS | | | | | | | | | | | | | | | | |
Beginning of the Period | | | 1,298,494,477 | | | | 1,059,154,147 | | | | 404,833,929 | | | | 311,563,040 | |
| | | | | | | | | | | | | | | | |
End of the Period | | $ | 1,070,894,179 | | | $ | 1,298,494,477 | | | $ | 343,590,992 | | | $ | 404,833,929 | |
| | | | | | | | | | | | | | | | |
The accompanying notes to financial statements are an integral part of this statement.
91
Brandes Investment Trust
STATEMENT OF CHANGES IN NET ASSETS (continued)
| | | | | | | | | | | | |
| | | | | | | Brandes |
| | | | | | | U.S. Value |
| | | Brandes Small Cap Value Fund | | Fund |
| | | Six Months Ended
March 31, 2022 | | Year Ended
September 30,
2021 | | Period Ended
March 31,
2022(1) |
| | | (Unaudited) | | | | (Unaudited) |
| | | |
INCREASE (DECREASE) IN NET ASSETS FROM: | | | | | | | | | | | | |
| | | |
OPERATIONS | | | | | | | | | | | | |
Net investment income | | $ | 45,907 | | | $ | 11,005 | | | $ | 12,314 | |
Net realized gain (loss) on: | | | | | | | | | | | | |
Investments | | | 55,307 | | | | 217,309 | | | | 4,452 | |
Foreign currency transactions | | | 376 | | | | (305 | ) | | | — | |
Net unrealized appreciation (depreciation) on: | | | | | | | | | | | | |
Investments | | | (43,007 | ) | | | 300,796 | | | | (117,282 | ) |
Foreign currency transactions | | | 15 | | | | (15 | ) | | | — | |
| | | | | | | | | | | | |
Net increase (decrease) in net assets resulting from operations | | | 58,598 | | | | 528,790 | | | | (100,516 | ) |
| | | | | | | | | | | | |
| | | |
DISTRIBUTIONS TO SHAREHOLDERS | | | | | | | | | | | | |
Distributions to shareholders | | | | | | | | | | | | |
Class A | | | (37,530 | ) | | | (1,309 | ) | | | (194 | ) |
Class C | | | N/A | | | | N/A | | | | N/A | |
Class I | | | (122,555 | ) | | | (19,384 | ) | | | (9,980 | ) |
Class R6 | | | (8 | ) | | | (2 | ) | | | N/A | |
| | | | | | | | | | | | |
Decrease in net assets from distributions | | | (160,093 | ) | | | (20,695 | ) | | | (10,174 | ) |
| | | | | | | | | | | | |
| | | |
CAPITAL SHARE TRANSACTIONS | | | | | | | | | | | | |
Proceeds from shares sold | | | 2,957,105 | | | | 2,067,659 | | | | 5,320,733 | |
Net asset value of shares issued on reinvestment of distributions | | | 160,024 | | | | 20,693 | | | | 10,174 | |
Cost of shares redeemed | | | (1,408,313 | ) | | | (1,016,511 | ) | | | (138,181 | ) |
| | | | | | | | | | | | |
Net increase (decrease) in net assets from capital share transactions | | | 1,708,816 | | | | 1,071,841 | | | | 5,192,726 | |
| | | | | | | | | | | | |
Total increase (decrease) in net assets | | | 1,607,321 | | | | 1,579,936 | | | | 5,082,036 | |
| | | | | | | | | | | | |
| | | |
NET ASSETS | | | | | | | | | | | | |
Beginning of the Period | | | 2,129,531 | | | | 549,595 | | | | — | |
| | | | | | | | | | | | |
End of the Period | | $ | 3,736,852 | | | $ | 2,129,531 | | | $ | 5,082,036 | |
| | | | | | | | | | | | |
| (1) | Commencement of operations on October 1, 2021. |
The accompanying notes to financial statements are an integral part of this statement.
92
Brandes Investment Trust
STATEMENT OF CHANGES IN NET ASSETS (continued)
| | | | | | | | |
| | | Brandes Core Plus Fixed |
| | | Income Fund |
| | | Six Months Ended
March 31, 2022 | | Year Ended
September 30,
2021 |
| | | (Unaudited) | | |
| | |
INCREASE (DECREASE) IN NET ASSETS FROM: | | | | | | | | |
OPERATIONS | | | | | | | | |
Net investment income | | $ | 891,598 | | | $ | 1,794,678 | |
Net realized gain (loss) on: | | | | | | | | |
Investments | | | 157,346 | | | | 2,224,588 | |
Foreign currency transactions | | | — | | | | — | |
Net unrealized appreciation (depreciation) on: | | | | | | | | |
Investments | | | (5,107,510 | ) | | | (3,279,513 | ) |
Foreign currency transactions | | | — | | | | — | |
| | | | | | | | |
Net increase (decrease) in net assets resulting from operations | | | (4,058,566 | ) | | | 739,753 | |
| | | | | | | | |
| | |
DISTRIBUTIONS TO SHAREHOLDERS | | | | | | | | |
Distributions to shareholders | | | | | | | | |
Class A | | | (18,783 | ) | | | (29,720 | ) |
Class C | | | N/A | | | | N/A | |
Class I | | | (871,460 | ) | | | (2,138,336 | ) |
Class R6 | | | (2 | ) | | | (4 | ) |
| | | �� | | | | | |
Decrease in net assets from distributions | | | (890,245 | ) | | | (2,168,060 | ) |
| | | | | | | | |
| | |
CAPITAL SHARE TRANSACTIONS | | | | | | | | |
Proceeds from shares sold | | | 7,054,292 | | | | 19,386,128 | |
Net asset value of shares issued on reinvestment of distributions | | | 879,280 | | | | 2,121,069 | |
Cost of shares redeemed | | | (13,118,900 | ) | | | (27,773,634 | ) |
| | | | | | | | |
Net increase (decrease) in net assets from capital share transactions | | | (5,185,328 | ) | | | (6,266,437 | ) |
| | | | | | | | |
Total increase (decrease) in net assets | | | (10,134,139 | ) | | | (7,694,744 | ) |
| | | | | | | | |
| | |
NET ASSETS | | | | | | | | |
Beginning of the Period | | | 79,116,431 | | | | 86,811,175 | |
| | | | | | | | |
End of the Period | | $ | 68,982,292 | | | $ | 79,116,431 | |
| | | | | | | | |
The accompanying notes to financial statements are an integral part of this statement.
93
Brandes Investment Trust
FINANCIAL HIGHLIGHTS For a capital share outstanding for the period ended:
| | | | | | | | | | | | | | | | | | | | | | | | |
| | | Net asset
value,
beginning
of period | | | Net
investment
income(1) | | | Net
realized and unrealized
gain (loss) on
investments | | | Total from investment operations | | | Dividends
from net
investment
income | | | Net asset
value, end
of period | |
| | | | |
Brandes International Equity Fund | | | | | | | | | | | | | | | | | |
Class A | | | | | | | | | | | | | | | | | | | | | | | | |
3/31/2022 (Unaudited) | | | $18.12 | | | | 0.15 | | | | (0.78) | | | | (0.63) | | | | (0.29) | | | | $17.20 | |
9/30/2021 | | | $13.51 | | | | 0.53 | | | | 4.54 | | | | 5.07 | | | | (0.46) | | | | $18.12 | |
9/30/2020 | | | $16.02 | | | | 0.26 | | | | (2.40) | | | | (2.14) | | | | (0.37) | | | | $13.51 | |
9/30/2019 | | | $17.71 | | | | 0.53 | | | | (1.59) | | | | (1.06) | | | | (0.63) | | | | $16.02 | |
9/30/2018 | | | $17.48 | | | | 0.36 | | | | 0.17 | | | | 0.53 | | | | (0.30) | | | | $17.71 | |
9/30/2017 | | | $15.70 | | | | 0.29 | | | | 2.03 | | | | 2.32 | | | | (0.54) | | | | $17.48 | |
Class C | | | | | | | | | | | | | | | | | | | | | | | | |
3/31/2022 (Unaudited) | | | $17.78 | | | | 0.07 | | | | (0.76) | | | | (0.69) | | | | (0.21) | | | | $16.88 | |
9/30/2021 | | | $13.27 | | | | 0.43 | | | | 4.47 | | | | 4.90 | | | | (0.39) | | | | $17.78 | |
9/30/2020 | | | $15.76 | | | | 0.13 | | | | (2.33) | | | | (2.20) | | | | (0.29) | | | | $13.27 | |
9/30/2019 | | | $17.47 | | | | 0.40 | | | | (1.58) | | | | (1.18) | | | | (0.53) | | | | $15.76 | |
9/30/2018 | | | $17.30 | | | | 0.22 | | | | 0.18 | | | | 0.40 | | | | (0.23) | | | | $17.47 | |
9/30/2017 | | | $15.58 | | | | 0.17 | | | | 2.00 | | | | 2.17 | | | | (0.45) | | | | $17.30 | |
Class I | | | | | | | | | | | | | | | | | | | | | | | | |
3/31/2022 (Unaudited) | | | $18.21 | | | | 0.17 | | | | (0.78) | | | | (0.61) | | | | (0.26) | | | | $17.34 | |
9/30/2021 | | | $13.57 | | | | 0.57 | | | | 4.57 | | | | 5.14 | | | | (0.50) | | | | $18.21 | |
9/30/2020 | | | $16.07 | | | | 0.27 | | | | (2.37) | | | | (2.10) | | | | (0.40) | | | | $13.57 | |
9/30/2019 | | | $17.76 | | | | 0.56 | | | | (1.60) | | | | (1.04) | | | | (0.65) | | | | $16.07 | |
9/30/2018 | | | $17.52 | | | | 0.40 | | | | 0.16 | | | | 0.56 | | | | (0.32) | | | | $17.76 | |
9/30/2017 | | | $15.72 | | | | 0.33 | | | | 2.04 | | | | 2.37 | | | | (0.57) | | | | $17.52 | |
Class R6 | | | | | | | | | | | | | | | | | | | | | | | | |
3/31/2022 (Unaudited) | | | $18.32 | | | | 0.18 | | | | (0.79) | | | | (0.61) | | | | (0.25) | | | | $17.46 | |
9/30/2021 | | | $13.64 | | | | 0.57 | | | | 4.62 | | | | 5.19 | | | | (0.51) | | | | $18.32 | |
9/30/2020 | | | $16.15 | | | | 0.36 | | | | (2.47) | | | | (2.11) | | | | (0.40) | | | | $13.64 | |
9/30/2019 | | | $17.83 | | | | 0.59 | | | | (1.61) | | | | (1.02) | | | | (0.66) | | | | $16.15 | |
9/30/2018 | | | $17.56 | | | | 0.42 | | | | 0.18 | | | | 0.60 | | | | (0.33) | | | | $17.83 | |
9/30/2017 | | | $15.74 | | | | 0.35 | | | | 2.04 | | | | 2.39 | | | | (0.57) | | | | $17.56 | |
| (1) | Net investment income per share has been calculated based on average shares outstanding during the period. |
| (2) | The total return calculation does not reflect the sales loads that may be imposed on Class A or C shares (see Note 7 of the Notes to Financial Statements). |
| (3) | After fees waived and expenses absorbed or recouped by the Advisor, where applicable. |
| (6) | Includes expenses not covered by the Trust’s expense limitation agreement. |
| (7) | As of June 30, 2019, the expense cap for the class changed from 1.00% to 0.85%. |
| (8) | As of June 30, 2019, the expense cap for the class changed from 0.82% to 0.75%. |
The accompanying notes to financial statements are an integral part of this statement.
94
Brandes Investment Trust
FINANCIAL HIGHLIGHTS For a capital share outstanding for the period ended:
| | | | | | | | | | | | | | | | | | | | | | | | | | | | | | | | | |
Total return(2) | | Net assets,
end of
period
(millions) | | Ratio of
net expenses
to average
net assets(3) | | Ratio of net
investment
income to
average net assets(3) | | Ratio of
expenses (prior
to reimburse-
ments) to
average net assets | | Ratio of net
investment
income (prior
to reimburse-
ments) to
average net assets | | Portfolio
turnover
rate |
| | | | | | |
| | | | | | | | | | | | | | | | | | | | | | | | | | | | | | | | | | |
| | | | | | | | | | | | | | | | | | | | | | | | | | | | | | | | | | |
| | | (3.54) | %(4) | | | $ | 45.7 | | | | | 1.11 | %(5) | | | | 1.62 | %(5) | | | | 1.12 | %(5) | | | | 1.61 | %(5) | | | | 11.02 | %(4) |
| | | 37.55 | % | | | $ | 38.2 | | | | | 1.10 | % | | | | 3.03 | % | | | | 1.11 | % | | | | 3.02 | % | | | | 30.41 | % |
| | | (13.42) | % | | | $ | 22.1 | | | | | 1.13 | % | | | | 1.80 | % | | | | 1.14 | % | | | | 1.79 | % | | | | 23.20 | % |
| | | (5.98) | % | | | $ | 32.0 | | | | | 1.16 | % | | | | 3.21 | % | | | | 1.16 | % | | | | 3.21 | % | | | | 14.43 | % |
| | | 3.02 | % | | | $ | 34.9 | | | | | 1.16 | % | | | | 2.00 | % | | | | 1.16 | % | | | | 2.00 | % | | | | 20.37 | % |
| | | 15.07 | % | | | $ | 31.5 | | | | | 1.18 | %(6) | | | | 1.77 | % | | | | 1.18 | %(6) | | | | 1.77 | % | | | | 33.82 | % |
| | | | | | | | | | | | | | | | | | | | | | | | | | | | | | | | | | |
| | | (3.90) | %(4) | | | $ | 8.2 | | | | | 1.86 | %(5) | | | | 0.82 | %(5) | | | | 1.87 | %(5) | | | | 0.81 | %(5) | | | | 11.02 | %(4) |
| | | 36.90 | % | | | $ | 8.8 | | | | | 1.54 | % | | | | 2.51 | % | | | | 1.56 | % | | | | 2.49 | % | | | | 30.41 | % |
| | | (14.06) | % | | | $ | 7.6 | | | | | 1.88 | % | | | | 1.01 | % | | | | 1.89 | % | | | | 1.00 | % | | | | 23.20 | % |
| | | (6.73) | % | | | $ | 13.1 | | | | | 1.91 | % | | | | 2.46 | % | | | | 1.91 | % | | | | 2.46 | % | | | | 14.43 | % |
| | | 2.31 | % | | | $ | 18.3 | | | | | 1.91 | % | | | | 1.25 | % | | | | 1.91 | % | | | | 1.25 | % | | | | 20.37 | % |
| | | 14.19 | % | | | $ | 17.9 | | | | | 1.93 | %(6) | | | | 1.01 | % | | | | 1.93 | %(6) | | | | 1.01 | % | | | | 33.82 | % |
| | | | | | | | | | | | | | | | | | | | | | | | | | | | | | | | | | |
| | | (3.39) | %(4) | | | $ | 554.3 | | | | | 0.85 | %(5) | | | | 1.85 | %(5) | | | | 0.92 | %(5) | | | | 1.78 | %(5) | | | | 11.02 | %(4) |
| | | 37.87 | % | | | $ | 552.2 | | | | | 0.85 | % | | | | 3.25 | % | | | | 0.91 | % | | | | 3.19 | % | | | | 30.41 | % |
| | | (13.13) | % | | | $ | 401.7 | | | | | 0.85 | % | | | | 2.03 | % | | | | 0.94 | % | | | | 1.94 | % | | | | 23.20 | % |
| | | (5.82) | % | | | $ | 622.4 | | | | | 0.94 | %(7) | | | | 3.43 | % | | | | 0.96 | %(7) | | | | 3.41 | % | | | | 14.43 | % |
| | | 3.23 | % | | | $ | 664.7 | | | | | 0.96 | % | | | | 2.20 | % | | | | 0.96 | % | | | | 2.20 | % | | | | 20.37 | % |
| | | 15.33 | % | | | $ | 523.1 | | | | | 0.98 | %(6) | | | | 1.96 | % | | | | 0.98 | %(6) | | | | 1.96 | % | | | | 33.82 | % |
| | | | | | | | | | | | | | | | | | | | | | | | | | | | | | | | | | |
| | | (3.38) | %(4) | | | $ | 52.5 | | | | | 0.75 | %(5) | | | | 1.94 | %(5) | | | | 0.87 | %(5) | | | | 1.82 | %(5) | | | | 11.02 | %(4) |
| | | 38.03 | % | | | $ | 58.8 | | | | | 0.75 | % | | | | 3.28 | % | | | | 0.86 | % | | | | 3.17 | % | | | | 30.41 | % |
| | | (13.08) | % | | | $ | 47.8 | | | | | 0.75 | % | | | | 2.35 | % | | | | 0.89 | % | | | | 2.21 | % | | | | 23.20 | % |
| | | (5.69) | % | | | $ | 35.9 | | | | | 0.80 | %(8) | | | | 3.57 | % | | | | 0.91 | %(8) | | | | 3.46 | % | | | | 14.43 | % |
| | | 3.44 | % | | | $ | 24.6 | | | | | 0.82 | % | | | | 2.34 | % | | | | 0.91 | % | | | | 2.25 | % | | | | 20.37 | % |
| | | 15.48 | % | | | $ | 38.5 | | | | | 0.83 | %(6) | | | | 2.12 | % | | | | 0.93 | %(6) | | | | 2.02 | % | | | | 33.82 | % |
The accompanying notes to financial statements are an integral part of this statement.
95
Brandes Investment Trust
FINANCIAL HIGHLIGHTS For a capital share outstanding for the period ended:
| | | | | | | | | | | | | | | | | | | | | | | | | | | | | | |
| | | | | | |
| | | | | | | Net | | | | | | |
| | | Net asset | | | | realized and | | | | Dividends | | Dividends |
| | | value, | | Net | | unrealized | | Total from | | from net | | from net |
| | | beginning | | investment | | gain (loss) on | | investment | | investment | | realized |
| | | of period | | income(1) | | investments | | operations | | income | | gains |
Brandes Global Equity Fund | | | | | | | | | | | | | | | | | | | | | | | | | | | | | | |
Class A | | | | | | | | | | | | | | | | | | | | | | | | | | | | | | |
3/31/2022 (Unaudited) | | | $ | 26.53 | | | | | 0.15 | | | | | 0.07 | | | | | 0.22 | | | | | (0.27 | ) | | | | (0.90 | ) |
9/30/2021 | | | $ | 19.30 | | | | | 0.55 | | | | | 7.54 | | | | | 8.09 | | | | | (0.56 | ) | | | | (0.30 | ) |
9/30/2020 | | | $ | 21.75 | | | | | 0.28 | | | | | (2.33 | ) | | | | (2.05 | ) | | | | (0.40 | ) | | | | — | |
9/30/2019 | | | $ | 24.61 | | | | | 0.47 | | | | | (1.80 | ) | | | | (1.33 | ) | | | | (0.48 | ) | | | | (1.05 | ) |
9/30/2018 | | | $ | 24.42 | | | | | 0.43 | | | | | 0.69 | | | | | 1.12 | | | | | (0.42 | ) | | | | (0.51 | ) |
9/30/2017 | | | $ | 21.21 | | | | | 0.34 | | | | | 3.28 | | | | | 3.62 | | | | | (0.41 | ) | | | | — | |
Class C | | | | | | | | | | | | | | | | | | | | | | | | | | | | | | |
3/31/2022 (Unaudited) | | | $ | 26.25 | | | | | 0.05 | | | | | 0.06 | | | | | 0.11 | | | | | (0.20 | ) | | | | (0.90 | ) |
9/30/2021 | | | $ | 19.16 | | | | | 0.37 | | | | | 7.47 | | | | | 7.84 | | | | | (0.45 | ) | | | | (0.30 | ) |
9/30/2020 | | | $ | 21.60 | | | | | 0.17 | | | | | (2.35 | ) | | | | (2.18 | ) | | | | (0.26 | ) | | | | — | |
9/30/2019 | | | $ | 24.45 | | | | | 0.30 | | | | | (1.78 | ) | | | | (1.48 | ) | | | | (0.32 | ) | | | | (1.05 | ) |
9/30/2018 | | | $ | 24.28 | | | | | 0.24 | | | | | 0.69 | | | | | 0.93 | | | | | (0.25 | ) | | | | (0.51 | ) |
9/30/2017 | | | $ | 21.09 | | | | | 0.18 | | | | | 3.25 | | | | | 3.43 | | | | | (0.24 | ) | | | | — | |
Class I | | | | | | | | | | | | | | | | | | | | | | | | | | | | | | |
3/31/2022 (Unaudited) | | | $ | 26.78 | | | | | 0.19 | | | | | 0.06 | | | | | 0.25 | | | | | (0.27 | ) | | | | (0.90 | ) |
9/30/2021 | | | $ | 19.46 | | | | | 0.64 | | | | | 7.59 | | | | | 8.23 | | | | | (0.61 | ) | | | | (0.30 | ) |
9/30/2020 | | | $ | 21.91 | | | | | 0.38 | | | | | (2.39 | ) | | | | (2.01 | ) | | | | (0.44 | ) | | | | — | |
9/30/2019 | | | $ | 24.77 | | | | | 0.53 | | | | | (1.81 | ) | | | | (1.28 | ) | | | | (0.53 | ) | | | | (1.05 | ) |
9/30/2018 | | | $ | 24.57 | | | | | 0.49 | | | | | 0.70 | | | | | 1.19 | | | | | (0.48 | ) | | | | (0.51 | ) |
9/30/2017 | | | $ | 21.33 | | | | | 0.41 | | | | | 3.30 | | | | | 3.71 | | | | | (0.47 | ) | | | | — | |
| (1) | Net investment income per share has been calculated based on average shares outstanding during the period. |
| (2) | After fees waived and expenses absorbed or recouped by the Advisor, where applicable. |
| (5) | Includes expenses not covered by the Trust’s expense limitation agreement. |
The accompanying notes to financial statements are an integral part of this statement.
96
Brandes Investment Trust
FINANCIAL HIGHLIGHTS For a capital share outstanding for the period ended:
| | | | | | | | | | | | | | | | | | | | | | | | | | | | | | | | | | | | | | |
Net asset value, end of period | | Total
return | | Net assets,
end of
period
(millions) | | Ratio of
net expenses
to average
net assets(2) | | Ratio of net
investment
income to
average
net assets(2) | | Ratio of
expenses (prior
to reimburse-
ments) to
average
net assets | | Ratio of net
investment
income (prior
to reimburse-
ments) to
average
net assets | | Portfolio
turnover
rate |
| | | | | | | | | | | | | | | | | | | | | | | | | | | | | | | | | | | | | | | |
| | | | | | | | | | | | | | | | | | | | | | | | | | | | | | | | | | | | | | | |
| | $ | 25.58 | | | | | 0.75 | % | | | $ | 0.9 | | | | | 1.25 | %(3) | | | | 1.15 | %(3) | | | | 1.40 | %(3) | | | | 1.00 | %(3) | | | | 7.27 | %(4) |
| | $ | 26.53 | | | | | 42.30 | % | | | $ | 0.8 | | | | | 1.25 | % | | | | 2.21 | % | | | | 1.41 | % | | | | 2.05 | % | | | | 20.46 | % |
| | $ | 19.30 | | | | | (9.41 | )% | | | $ | 0.9 | | | | | 1.25 | % | | | | 1.56 | % | | | | 1.58 | % | | | | 1.23 | % | | | | 17.16 | % |
| | $ | 21.75 | | | | | (5.22 | )% | | | $ | 1.5 | | | | | 1.25 | % | | | | 2.11 | % | | | | 1.56 | % | | | | 1.81 | % | | | | 12.11 | % |
| | $ | 24.61 | | | | | 4.68 | % | | | $ | 3.4 | | | | | 1.25 | % | | | | 1.72 | % | | | | 1.40 | % | | | | 1.57 | % | | | | 8.89 | % |
| | $ | 24.42 | | | | | 17.20 | % | | | $ | 5.8 | | | | | 1.26 | %(5) | | | | 1.52 | % | | | | 1.45 | %(5) | | | | 1.33 | % | | | | 17.42 | % |
| | | | | | | | | | | | | | | | | | | | | | | | | | | | | | | | | | | | | | | |
| | $ | 25.26 | | | | | 0.36 | % | | | $ | 0.8 | | | | | 2.00 | %(3) | | | | 0.39 | %(3) | | | | 2.15 | %(3) | | | | 0.24 | %(3) | | | | 7.27 | %(4) |
| | $ | 26.25 | | | | | 41.21 | % | | | $ | 0.9 | | | | | 2.00 | % | | | | 1.50 | % | | | | 1.78 | % | | | | 1.72 | % | | | | 20.46 | % |
| | $ | 19.16 | | | | | (10.08 | )% | | | $ | 0.7 | | | | | 2.00 | % | | | | 0.84 | % | | | | 2.32 | % | | | | 0.52 | % | | | | 17.16 | % |
| | $ | 21.60 | | | | | (5.91 | )% | | | $ | 1.2 | | | | | 2.00 | % | | | | 1.37 | % | | | | 2.32 | % | | | | 1.05 | % | | | | 12.11 | % |
| | $ | 24.45 | | | | | 3.88 | % | | | $ | 1.6 | | | | | 2.00 | % | | | | 0.97 | % | | | | 2.15 | % | | | | 0.82 | % | | | | 8.89 | % |
| | $ | 24.28 | | | | | 16.31 | % | | | $ | 1.7 | | | | | 2.01 | %(5) | | | | 0.77 | % | | | | 2.21 | %(5) | | | | 0.57 | % | | | | 17.42 | % |
| | | | | | | | | | | | | | | | | | | | | | | | | | | | | | | | | | | | | | | |
| | $ | 25.86 | | | | | 0.86 | % | | | $ | 45.0 | | | | | 1.00 | %(3) | | | | 1.41 | %(3) | | | | 1.20 | %(3) | | | | 1.21 | %(3) | | | | 7.27 | %(4) |
| | $ | 26.78 | | | | | 42.67 | % | | | $ | 45.5 | | | | | 1.00 | % | | | | 2.52 | % | | | | 1.20 | % | | | | 2.32 | % | | | | 20.46 | % |
| | $ | 19.46 | | | | | (9.18 | )% | | | $ | 28.6 | | | | | 1.00 | % | | | | 1.83 | % | | | | 1.36 | % | | | | 1.47 | % | | | | 17.16 | % |
| | $ | 21.91 | | | | | (4.98 | )% | | | $ | 33.4 | | | | | 1.00 | % | | | | 2.37 | % | | | | 1.36 | % | | | | 2.00 | % | | | | 12.11 | % |
| | $ | 24.77 | | | | | 4.95 | % | | | $ | 62.6 | | | | | 1.00 | % | | | | 1.97 | % | | | | 1.20 | % | | | | 1.77 | % | | | | 8.89 | % |
| | $ | 24.57 | | | | | 17.48 | % | | | $ | 61.7 | | | | | 1.01 | %(5) | | | | 1.77 | % | | | | 1.26 | %(5) | | | | 1.52 | % | | | | 17.42 | % |
The accompanying notes to financial statements are an integral part of this statement.
97
Brandes Investment Trust
FINANCIAL HIGHLIGHTS For a capital share outstanding for the period ended:
| | | | | | | | | | | | | | | | | | | | | | | | | | | | | | |
| | | | | | |
| | | | | | | Net | | | | | | |
| | | Net asset | | | | realized and | | | | Dividends | | |
| | | value, | | Net | | unrealized | | Total from | | from net | | Net asset |
| | | beginning | | investment | | gain (loss) on | | investment | | investment | | value, end |
| | | of period | | income(1) | | investments | | operations | | income | | of period |
Brandes Emerging Markets Value Fund | | | | | | | | | | | | | | | | | | | | | | | | | | | | | | |
Class A | | | | | | | | | | | | | | | | | | | | | | | | | | | | | | |
3/31/2022 (Unaudited) | | | $ | 8.66 | | | | | 0.06 | | | | | (1.03 | ) | | | | (0.97 | ) | | | | (0.13 | ) | | | $ | 7.56 | |
9/30/2021 | | | $ | 7.04 | | | | | 0.18 | | | | | 1.54 | | | | | 1.72 | | | | | (0.10 | ) | | | $ | 8.66 | |
9/30/2020 | | | $ | 8.57 | | | | | 0.13 | | | | | (1.49 | ) | | | | (1.36 | ) | | | | (0.17 | ) | | | $ | 7.04 | |
9/30/2019 | | | $ | 8.46 | | | | | 0.19 | | | | | 0.07 | | | | | 0.26 | | | | | (0.15 | ) | | | $ | 8.57 | |
9/30/2018 | | | $ | 9.47 | | | | | 0.15 | | | | | (1.01 | ) | | | | (0.86 | ) | | | | (0.15 | ) | | | $ | 8.46 | |
9/30/2017 | | | $ | 7.91 | | | | | 0.10 | | | | | 1.60 | | | | | 1.70 | | | | | (0.14 | ) | | | $ | 9.47 | |
Class C | | | | | | | | | | | | | | | | | | | | | | | | | | | | | | |
3/31/2022 (Unaudited) | | | $ | 8.59 | | | | | 0.03 | | | | | (1.02 | ) | | | | (0.99 | ) | | | | (0.12 | ) | | | $ | 7.48 | |
9/30/2021 | | | $ | 7.01 | | | | | 0.14 | | | | | 1.55 | | | | | 1.69 | | | | | (0.11 | ) | | | $ | 8.59 | |
9/30/2020 | | | $ | 8.53 | | | | | 0.07 | | | | | (1.48 | ) | | | | (1.41 | ) | | | | (0.11 | ) | | | $ | 7.01 | |
9/30/2019 | | | $ | 8.44 | | | | | 0.13 | | | | | 0.06 | | | | | 0.19 | | | | | (0.10 | ) | | | $ | 8.53 | |
9/30/2018 | | | $ | 9.43 | | | | | 0.08 | | | | | (0.99 | ) | | | | (0.91 | ) | | | | (0.08 | ) | | | $ | 8.44 | |
9/30/2017 | | | $ | 7.86 | | | | | 0.05 | | | | | 1.58 | | | | | 1.63 | | | | | (0.06 | ) | | | $ | 9.43 | |
Class I | | | | | | | | | | | | | | | | | | | | | | | | | | | | | | |
3/31/2022 (Unaudited) | | | $ | 8.71 | | | | | 0.07 | | | | | (1.04 | ) | | | | (0.97 | ) | | | | (0.14 | ) | | | $ | 7.60 | |
9/30/2021 | | | $ | 7.07 | | | | | 0.20 | | | | | 1.55 | | | | | 1.75 | | | | | (0.11 | ) | | | $ | 8.71 | |
9/30/2020 | | | $ | 8.62 | | | | | 0.14 | | | | | (1.50 | ) | | | | (1.36 | ) | | | | (0.19 | ) | | | $ | 7.07 | |
9/30/2019 | | | $ | 8.50 | | | | | 0.21 | | | | | 0.08 | | | | | 0.29 | | | | | (0.17 | ) | | | $ | 8.62 | |
9/30/2018 | | | $ | 9.51 | | | | | 0.17 | | | | | (1.01 | ) | | | | (0.84 | ) | | | | (0.17 | ) | | | $ | 8.50 | |
9/30/2017 | | | $ | 7.94 | | | | | 0.13 | | | | | 1.60 | | | | | 1.73 | | | | | (0.16 | ) | | | $ | 9.51 | |
Class R6 | | | | | | | | | | | | | | | | | | | | | | | | | | | | | | |
3/31/2022 (Unaudited) | | | $ | 8.76 | | | | | 0.08 | | | | | (1.04 | ) | | | | (0.96 | ) | | | | (0.14 | ) | | | $ | 7.66 | |
9/30/2021 | | | $ | 7.11 | | | | | 0.20 | | | | | 1.56 | | | | | 1.76 | | | | | (0.11 | ) | | | $ | 8.76 | |
9/30/2020 | | | $ | 8.65 | | | | | 0.16 | | | | | (1.51 | ) | | | | (1.35 | ) | | | | (0.19 | ) | | | $ | 7.11 | |
9/30/2019 | | | $ | 8.53 | | | | | 0.23 | | | | | 0.07 | | | | | 0.30 | | | | | (0.18 | ) | | | $ | 8.65 | |
9/30/2018 | | | $ | 9.53 | | | | | 0.19 | | | | | (1.02 | ) | | | | (0.83 | ) | | | | (0.17 | ) | | | $ | 8.53 | |
9/30/2017 | | | $ | 7.93 | | | | | 0.15 | | | | | 1.62 | | | | | 1.77 | | | | | (0.17 | ) | | | $ | 9.53 | |
| (1) | Net investment income per share has been calculated based on average shares outstanding during the period. |
| (2) | The total return calculation does not reflect the sales loads that may be imposed on Class A or C shares (see Note 7 of the Notes to Financial Statements). |
| (3) | After fees waived and expenses absorbed or recouped by the Advisor, where applicable. |
| (6) | Includes expenses not covered by the Trust’s expense limitation agreement. |
The accompanying notes to financial statements are an integral part of this statement.
98
Brandes Investment Trust
FINANCIAL HIGHLIGHTS For a capital share outstanding for the period ended:
| | | | | | | | | | | | | | | | | | | | | | | | | | | | | | | | | |
Total return(2) | | Net assets,
end of
period
(millions) | | Ratio of
net expenses
to average
net assets(3) | | Ratio of net
investment
income to
average
net assets(3) | | Ratio of
expenses (prior
to reimburse-
ments) to
average
net assets | | Ratio of net
investment
income (prior
to reimburse-
ments) to
average
net assets | | Portfolio
turnover
rate |
| | | | | | | | | | | | | | | | | | | | | | | | | | | | | | | | | | |
| | | | | | | | | | | | | | | | | | | | | | | | | | | | | | | | | | |
| | | (11.27 | )% | | | $ | 177.1 | | | | | 1.31 | %(4) | | | | 1.51 | %(4) | | | | 1.32 | %(4) | | | | 1.50 | %(4) | | | | 14.03 | %(5) |
| | | 24.41 | % | | | $ | 216.2 | | | | | 1.30 | % | | | | 2.02 | % | | | | 1.31 | % | | | | 2.01 | % | | | | 34.97 | % |
| | | (16.10 | )% | | | $ | 174.2 | | | | | 1.33 | % | | | | 1.75 | % | | | | 1.34 | % | | | | 1.74 | % | | | | 34.39 | % |
| | | 3.10 | % | | | $ | 235.9 | | | | | 1.35 | % | | | | 2.23 | % | | | | 1.35 | % | | | | 2.23 | % | | | | 22.09 | % |
| | | (9.14 | )% | | | $ | 258.8 | | | | | 1.37 | % | | | | 1.62 | % | | | | 1.34 | % | | | | 1.65 | % | | | | 37.66 | % |
| | | 21.78 | % | | | $ | 319.2 | | | | | 1.42 | %(6) | | | | 1.27 | % | | | | 1.40 | %(6) | | | | 1.29 | % | | | | 23.67 | % |
| | | | | | | | | | | | | | | | | | | | | | | | | | | | | | | | | | |
| | | (11.62 | )% | | | $ | 7.8 | | | | | 2.06 | %(4) | | | | 0.77 | %(4) | | | | 2.07 | %(4) | | | | 0.76 | %(4) | | | | 14.03 | %(5) |
| | | 24.01 | % | | | $ | 10.3 | | | | | 1.59 | % | | | | 1.66 | % | | | | 1.60 | % | | | | 1.65 | % | | | | 34.97 | % |
| | | (16.63 | )% | | | $ | 11.1 | | | | | 2.08 | % | | | | 0.90 | % | | | | 2.09 | % | | | | 0.89 | % | | | | 34.39 | % |
| | | 2.27 | % | | | $ | 18.0 | | | | | 2.10 | % | | | | 1.48 | % | | | | 2.10 | % | | | | 1.48 | % | | | | 22.09 | % |
| | | (9.70 | )% | | | $ | 22.8 | | | | | 2.10 | % | | | | 0.89 | % | | | | 2.09 | % | | | | 0.90 | % | | | | 37.66 | % |
| | | 20.83 | % | | | $ | 28.2 | | | | | 2.17 | %(6) | | | | 0.52 | % | | | | 2.14 | %(6) | | | | 0.55 | % | | | | 23.67 | % |
| | | | | | | | | | | | | | | | | | | | | | | | | | | | | | | | | | |
| | | (11.23 | )% | | | $ | 827.7 | | | | | 1.12 | %(4) | | | | 1.72 | %(4) | | | | 1.12 | %(4) | | | | 1.72 | %(4) | | | | 14.03 | %(5) |
| | | 24.71 | % | | | $ | 1,003.8 | | | | | 1.12 | % | | | | 2.24 | % | | | | 1.11 | % | | | | 2.25 | % | | | | 34.97 | % |
| | | (15.96 | )% | | | $ | 834.8 | | | | | 1.12 | % | | | | 1.88 | % | | | | 1.14 | % | | | | 1.86 | % | | | | 34.39 | % |
| | | 3.41 | % | | | $ | 1,117.7 | | | | | 1.12 | % | | | | 2.46 | % | | | | 1.15 | % | | | | 2.43 | % | | | | 22.09 | % |
| | | (8.91 | )% | | | $ | 1,162.1 | | | | | 1.12 | % | | | | 1.88 | % | | | | 0.14 | % | | | | 1.86 | % | | | | 37.66 | % |
| | | 22.07 | % | | | $ | 1,311.5 | | | | | 1.17 | %(6) | | | | 1.51 | % | | | | 1.20 | %(6) | | | | 1.48 | % | | | | 23.67 | % |
| | | | | | | | | | | | | | | | | | | | | | | | | | | | | | | | | | |
| | | (11.09 | )% | | | $ | 58.2 | | | | | 0.97 | %(4) | | | | 1.88 | %(4) | | | | 1.07 | %(4) | | | | 1.78 | %(4) | | | | 14.03 | %(5) |
| | | 24.74 | % | | | $ | 68.1 | | | | | 0.97 | % | | | | 2.32 | % | | | | 1.06 | % | | | | 2.23 | % | | | | 34.97 | % |
| | | (15.74 | )% | | | $ | 39.1 | | | | | 0.97 | % | | | | 2.07 | % | | | | 1.09 | % | | | | 1.95 | % | | | | 34.39 | % |
| | | 3.45 | % | | | $ | 47.6 | | | | | 0.97 | % | | | | 2.61 | % | | | | 1.10 | % | | | | 2.48 | % | | | | 22.09 | % |
| | | (8.74 | )% | | | $ | 33.6 | | | | | 0.97 | % | | | | 2.02 | % | | | | 1.08 | % | | | | 1.91 | % | | | | 37.66 | % |
| | | 22.53 | % | | | $ | 97.4 | | | | | 1.02 | %(6) | | | | 1.68 | % | | | | 1.17 | %(6) | | | | 1.53 | % | | | | 23.67 | % |
The accompanying notes to financial statements are an integral part of this statement.
99
Brandes Investment Trust
FINANCIAL HIGHLIGHTS For a capital share outstanding for the period ended:
| | | | | | | | | | | | | | | | | | | | | | | | | | | | | | |
| | | | | | |
| | | | | | | Net | | | | | | |
| | | Net asset | | Net | | realized and | | | | Dividends | | Dividends |
| | | value, | | investment | | unrealized | | Total from | | from net | | from net |
| | | beginning | | income | | gain (loss) on | | investment | | investment | | realized |
| | | of period | | (loss)(1) | | investments | | operations | | income | | gains |
Brandes International Small Cap Equity Fund | | | | | | | | | | | | | | | | | | | | | | | | | | | | | | |
Class A | | | | | | | | | | | | | | | | | | | | | | | | | | | | | | |
3/31/2022 (Unaudited) | | | $ | 14.01 | | | | | 0.30 | | | | | (1.72 | ) | | | | (1.42 | ) | | | | (0.56 | ) | | | | — | |
9/30/2021 | | | $ | 9.33 | | | | | 0.14 | | | | | 4.69 | | | | | 4.83 | | | | | (0.15 | ) | | | | — | |
9/30/2020 | | | $ | 10.22 | | | | | 0.07 | | | | | (0.88 | ) | | | | (0.81 | ) | | | | (0.08 | ) | | | | — | |
9/30/2019 | | | $ | 12.10 | | | | | 0.15 | | | | | (1.60 | ) | | | | (1.45 | ) | | | | (0.30 | ) | | | | (0.13 | ) |
9/30/2018 | | | $ | 14.30 | | | | | 0.14 | | | | | (1.32 | ) | | | | (1.18 | ) | | | | (0.54 | ) | | | | (0.48 | ) |
9/30/2017 | | | $ | 13.46 | | | | | 0.14 | | | | | 1.32 | | | | | 1.46 | | | | | (0.34 | ) | | | | (0.28 | ) |
Class C | | | | | | | | | | | | | | | | | | | | | | | | | | | | | | |
3/31/2022 (Unaudited) | | | $ | 13.49 | | | | | 0.23 | | | | | (1.64 | ) | | | | (1.41 | ) | | | | (0.51 | ) | | | | — | |
9/30/2021 | | | $ | 9.03 | | | | | 0.10 | | | | | 4.54 | | | | | 4.64 | | | | | (0.18 | ) | | | | — | |
9/30/2020 | | | $ | 9.94 | | | | | (0.01 | ) | | | | (0.85 | ) | | | | (0.86 | ) | | | | (0.05 | ) | | | | — | |
9/30/2019 | | | $ | 11.81 | | | | | 0.06 | | | | | (1.55 | ) | | | | (1.49 | ) | | | | (0.25 | ) | | | | (0.13 | ) |
9/30/2018 | | | $ | 14.03 | | | | | 0.04 | | | | | (1.28 | ) | | | | (1.24 | ) | | | | (0.50 | ) | | | | (0.48 | ) |
9/30/2017 | | | $ | 13.24 | | | | | 0.04 | | | | | 1.30 | | | | | 1.34 | | | | | (0.27 | ) | | | | (0.28 | ) |
Class I | | | | | | | | | | | | | | | | | | | | | | | | | | | | | | |
3/31/2022 (Unaudited) | | | $ | 14.09 | | | | | 0.31 | | | | | (1.73 | ) | | | | (1.42 | ) | | | | (0.58 | ) | | | | — | |
9/30/2021 | | | $ | 9.37 | | | | | 0.15 | | | | | 4.73 | | | | | 4.88 | | | | | (0.16 | ) | | | | — | |
9/30/2020 | | | $ | 10.25 | | | | | 0.09 | | | | | (0.88 | ) | | | | (0.79 | ) | | | | (0.09 | ) | | | | — | |
9/30/2019 | | | $ | 12.14 | | | | | 0.17 | | | | | (1.61 | ) | | | | (1.44 | ) | | | | (0.32 | ) | | | | (0.13 | ) |
9/30/2018 | | | $ | 14.35 | | | | | 0.17 | | | | | (1.32 | ) | | | | (1.15 | ) | | | | (0.58 | ) | | | | (0.48 | ) |
9/30/2017 | | | $ | 13.50 | | | | | 0.17 | | | | | 1.32 | | | | | 1.49 | | | | | (0.36 | ) | | | | (0.28 | ) |
Class R6 | | | | | | | | | | | | | | | | | | | | | | | | | | | | | | |
3/31/2022 (Unaudited) | | | $ | 14.14 | | | | | 0.33 | | | | | (1.75 | ) | | | | (1.42 | ) | | | | (0.59 | ) | | | | — | |
9/30/2021 | | | $ | 9.39 | | | | | 0.17 | | | | | 4.74 | | | | | 4.91 | | | | | (0.16 | ) | | | | — | |
9/30/2020 | | | $ | 10.27 | | | | | 0.07 | | | | | (0.86 | ) | | | | (0.79 | ) | | | | (0.09 | ) | | | | — | |
9/30/2019 | | | $ | 12.15 | | | | | 0.18 | | | | | (1.61 | ) | | | | (1.43 | ) | | | | (0.32 | ) | | | | (0.13 | ) |
9/30/2018 | | | $ | 14.36 | | | | | 0.18 | | | | | (1.33 | ) | | | | (1.15 | ) | | | | (0.58 | ) | | | | (0.48 | ) |
9/30/2017 | | | $ | 13.50 | | | | | 0.18 | | | | | 1.33 | | | | | 1.51 | | | | | (0.37 | ) | | | | (0.28 | ) |
| (1) | Net investment income per share has been calculated based on average shares outstanding during the period. |
| (2) | The total return calculation does not reflect the sales loads that may be imposed on Class A or C shares (see Note 7 of the Notes to Financial Statements). |
| (3) | After fees waived and expenses absorbed or recouped by the Advisor, where applicable. |
| (6) | Includes expenses not covered by the Trust’s expense limitation agreement. |
The accompanying notes to financial statements are an integral part of this statement.
100
Brandes Investment Trust
FINANCIAL HIGHLIGHTS For a capital share outstanding for the period ended:
| | | | | | | | | | | | | | | | | | | | | | | | | | | | | | | | | | | | | | |
Net asset
value, end
of period | | Total
return(2) | | Net assets,
end of
period
(millions) | | Ratio of
net expenses
to average
net assets(3) | | Ratio of net
investment
income to
average
net assets(3) | | Ratio of
expenses (prior
to reimburse-
ments) to
average
net assets | | Ratio of net
investment
income (prior
to reimburse-
ments) to
average
net assets | | Portfolio
turnover
rate |
| | | | | | | | | | | | | | | | | | | | | | | | | | | | | | | | | | | | | | | |
| | | | | | | | | | | | | | | | | | | | | | | | | | | | | | | | | | | | | | | |
| | $ | 12.03 | | | | | (10.26 | )% | | | $ | 60.3 | | | | | 1.35 | %(4) | | | | 4.48 | %(4) | | | | 1.35 | %(4) | | | | 4.48 | %(4) | | | | 18.51 | %(5) |
| | $ | 14.01 | | | | | 51.91 | % | | | $ | 68.0 | | | | | 1.32 | % | | | | 1.10 | % | | | | 1.33 | % | | | | 1.09 | % | | | | 26.16 | % |
| | $ | 9.33 | | | | | (7.95 | )% | | | $ | 35.8 | | | | | 1.35 | % | | | | 0.77 | % | | | | 1.36 | % | | | | 0.76 | % | | | | 39.28 | % |
| | $ | 10.22 | | | | | (12.04 | )% | | | $ | 43.5 | | | | | 1.35 | % | | | | 1.34 | % | | | | 1.35 | % | | | | 1.34 | % | | | | 22.52 | % |
| | $ | 12.10 | | | | | (8.88 | )% | | | $ | 80.9 | | | | | 1.30 | % | | | | 1.05 | % | | | | 1.30 | % | | | | 1.05 | % | | | | 21.97 | % |
| | $ | 14.30 | | | | | 11.29 | % | | | $ | 176.9 | | | | | 1.30 | %(6) | | | | 1.04 | % | | | | 1.30 | %(6) | | | | 1.04 | % | | | | 21.37 | % |
| | | | | | | | | | | | | | | | | | | | | | | | | | | | | | | | | | | | | | | |
| | $ | 11.57 | | | | | (10.62 | )% | | | $ | 4.4 | | | | | 2.10 | %(4) | | | | 3.62 | %(4) | | | | 2.10 | %(4) | | | | 3.62 | %(4) | | | | 18.51 | %(5) |
| | $ | 13.49 | | | | | 51.52 | % | | | $ | 5.3 | | | | | 1.49 | % | | | | 0.86 | % | | | | 1.50 | % | | | | 0.85 | % | | | | 26.16 | % |
| | $ | 9.03 | | | | | (8.64 | )% | | | $ | 4.5 | | | | | 2.11 | % | | | | (0.06 | )% | | | | 2.12 | % | | | | (0.07 | )% | | | | 39.28 | % |
| | $ | 9.94 | | | | | (12.69 | )% | | | $ | 6.9 | | | | | 2.10 | % | | | | 0.59 | % | | | | 2.10 | % | | | | 0.59 | % | | | | 22.52 | % |
| | $ | 11.81 | | | | | (9.55 | )% | | | $ | 14.5 | | | | | 2.05 | % | | | | 0.30 | % | | | | 2.05 | % | | | | 0.30 | % | | | | 21.97 | % |
| | $ | 14.03 | | | | | 10.52 | % | | | $ | 27.2 | | | | | 2.05 | %(6) | | | | 0.29 | % | | | | 2.05 | %(6) | | | | 0.29 | % | | | | 21.37 | % |
| | | | | | | | | | | | | | | | | | | | | | | | | | | | | | | | | | | | | | | |
| | $ | 12.09 | | | | | (10.21 | )% | | | $ | 266.2 | | | | | 1.15 | %(4) | | | | 4.64 | %(4) | | | | 1.15 | %(4) | | | | 4.64 | %(4) | | | | 18.51 | %(5) |
| | $ | 14.09 | | | | | 52.15 | % | | | $ | 318.0 | | | | | 1.12 | % | | | | 1.23 | % | | | | 1.13 | % | | | | 1.22 | % | | | | 26.16 | % |
| | $ | 9.37 | | | | | (7.69 | )% | | | $ | 260.8 | | | | | 1.15 | % | | | | 0.93 | % | | | | 1.16 | % | | | | 0.92 | % | | | | 39.28 | % |
| | $ | 10.25 | | | | | (11.93 | )% | | | $ | 414.8 | | | | | 1.15 | % | | | | 1.54 | % | | | | 1.15 | % | | | | 1.54 | % | | | | 22.52 | % |
| | $ | 12.14 | | | | | (8.70 | )% | | | $ | 963.8 | | | | | 1.10 | % | | | | 1.25 | % | | | | 1.10 | % | | | | 1.25 | % | | | | 21.97 | % |
| | $ | 14.35 | | | | | 11.54 | % | | | $ | 1,543.9 | | | | | 1.10 | %(6) | | | | 1.24 | % | | | | 1.10 | %(6) | | | | 1.24 | % | | | | 21.37 | % |
| | | | | | | | | | | | | | | | | | | | | | | | | | | | | | | | | | | | | | | |
| | $ | 12.13 | | | | | (10.17 | )% | | | $ | 12.7 | | | | | 1.00 | %(4) | | | | 4.94 | %(4) | | | | 1.10 | %(4) | | | | 4.84 | %(4) | | | | 18.51 | %(5) |
| | $ | 14.14 | | | | | 52.39 | % | | | $ | 13.5 | | | | | 1.00 | % | | | | 1.37 | % | | | | 1.08 | % | | | | 1.29 | % | | | | 26.16 | % |
| | $ | 9.39 | | | | | (7.72 | )% | | | $ | 10.5 | | | | | 1.00 | % | | | | 0.83 | % | | | | 1.12 | % | | | | 0.71 | % | | | | 39.28 | % |
| | $ | 10.27 | | | | | (11.80 | )% | | | $ | 20.4 | | | | | 1.00 | % | | | | 1.69 | % | | | | 1.10 | % | | | | 1.59 | % | | | | 22.52 | % |
| | $ | 12.15 | | | | | (8.64 | )% | | | $ | 72.5 | | | | | 1.00 | % | | | | 1.35 | % | | | | 1.05 | % | | | | 1.30 | % | | | | 21.97 | % |
| | $ | 14.36 | | | | | 11.67 | % | | | $ | 76.1 | | | | | 1.01 | %(6) | | | | 1.33 | % | | | | 1.05 | %(6) | | | | 1.29 | % | | | | 21.37 | % |
The accompanying notes to financial statements are an integral part of this statement.
101
Brandes Investment Trust
FINANCIAL HIGHLIGHTS For a capital share outstanding for the period ended:
| | | | | | | | | | | | | | | | | | | | | | | | | | | | | | |
| | | | | | |
| | | | | | | Net | | | | | | |
| | | Net asset | | | | realized and | | | | Dividends | | Dividends |
| | | value, | | Net | | unrealized | | Total from | | from net | | from net |
| | | beginning | | investment | | gain (loss) on | | investment | | investment | | realized |
| | | of period | | income | | investments | | operations | | income | | gains |
Brandes Small Cap Value Fund | | | | | | | | | | | | | | | | | | | | | | | | | | | | | | |
Class A | | | | | | | | | | | | | | | | | | | | | | | | | | | | | | |
3/31/2022 (Unaudited) | | | $ | 13.22 | | | | | 0.21 | (3) | | | | 0.12 | | | | | 0.33 | | | | | (0.19 | ) | | | | (0.51 | ) |
9/30/2021 | | | $ | 8.52 | | | | | 0.02 | | | | | 4.51 | | | | | 4.53 | | | | | 0.17 | | | | | — | |
9/30/2020 | | | $ | 8.58 | | | | | 0.15 | | | | | (0.16 | ) | | | | (0.01 | ) | | | | (0.05 | ) | | | | — | |
9/30/2019 | | | $ | 10.27 | | | | | 0.05 | | | | | (0.95 | ) | | | | (0.90 | ) | | | | (0.10 | ) | | | | (0.69 | ) |
1/2/2018(7) – 9/30/2018 | | | $ | 10.00 | | | | | 0.02 | | | | | 0.27 | | | | | 0.29 | | | | | (0.02 | ) | | | | — | |
Class I | | | | | | | | | | | | | | | | | | | | | | | | | | | | | | |
3/31/2022 (Unaudited) | | | $ | 13.34 | | | | | 0.20 | (3) | | | | 0.14 | | | | | 0.34 | | | | | (0.19 | ) | | | | (0.51 | ) |
9/30/2021 | | | $ | 8.58 | | | | | 0.09 | | | | | 4.50 | | | | | 4.59 | | | | | 0.17 | | | | | — | |
9/30/2020 | | | $ | 8.62 | | | | | 0.14 | | | | | (0.13 | ) | | | | 0.01 | | | | | (0.05 | ) | | | | — | |
9/30/2019 | | | $ | 10.27 | | | | | 0.07 | | | | | (0.92 | ) | | | | (0.85 | ) | | | | (0.11 | ) | | | | (0.69 | ) |
1/2/2018(7) – 9/30/2018 | | | $ | 10.00 | | | | | 0.04 | | | | | 0.27 | | | | | 0.31 | | | | | (0.04 | ) | | | | — | |
Class R6 | | | | | | | | | | | | | | | | | | | | | | | | | | | | | | |
3/31/2022 (Unaudited) | | | $ | 12.53 | | | | | 0.20 | | | | | 0.14 | | | | | 0.34 | | | | | (0.18 | ) | | | | (0.51 | ) |
9/30/2021 | | | $ | 8.00 | | | | | 0.18 | | | | | 4.18 | | | | | 4.36 | | | | | 0.17 | | | | | — | |
9/30/2020 | | | $ | 7.97 | | | | | 0.26 | | | | | (0.18 | ) | | | | 0.08 | | | | | (0.05 | ) | | | | — | |
9/30/2019 | | | $ | 10.32 | | | | | 0.09 | | | | | (1.63 | ) | | | | (1.54 | ) | | | | (0.12 | ) | | | | (0.69 | ) |
1/2/2018(7) – 9/30/2018 | | | $ | 10.00 | | | | | 0.05 | | | | | 0.31 | | | | | 0.36 | | | | | (0.04 | ) | | | | — | |
| (1) | The total return calculation does not reflect the sales loads that may be imposed on Class A shares (see Note 7 of the Notes to Financial Statements). |
| (2) | After fees waived and expenses absorbed or recouped by the Advisor, where applicable. |
| (3) | Net investment income per share has been calculated based on average shares outstanding during the period. |
| (6) | Amount is less than $50,000. |
| (7) | Commencement of operations. |
The accompanying notes to financial statements are an integral part of this statement.
102
Brandes Investment Trust
FINANCIAL HIGHLIGHTS For a capital share outstanding for the period ended:
| | | | | | | | | | | | | | | | | | | | | | | | | | | | | | | | | | | | | | |
Net asset
value, end
of period | | Total
return(1) | | Net assets,
end of
period
(millions) | | Ratio of net expenses
to average
net assets(2) | | Ratio of net
investment
income to
average
net assets(2) | | Ratio of
expenses (prior
to reimburse-
ments) to
average
net assets | | Ratio of net
investment
income (prior
to reimburse-
ments) to
average
net assets | | Portfolio
turnover
rate |
| | | | | | | | | | | | | | | | | | | | | | | | | | | | | | | | | | | | | | | |
| | | | | | | | | | | | | | | | | | | | | | | | | | | | | | | | | | | | | | | |
| | $ | 12.85 | | | | | 2.46 | % | | | $ | 0.9 | | | | | 1.15 | %(4) | | | | 3.23 | %(4) | | | | 5.30 | %(4) | | | | (0.92 | )%(4) | | | | 49.67 | %(5) |
| | $ | 13.22 | | | | | 57.55 | % | | | $ | 0.5 | | | | | 1.15 | % | | | | 0.19 | % | | | | 5.78 | % | | | | (4.44 | )% | | | | 90.71 | % |
| | $ | 8.52 | | | | | (0.02 | )% | | | $ | — | (6) | | | | 1.15 | % | | | | 1.06 | % | | | | 27.37 | % | | | | (25.16 | )% | | | | 80.65 | % |
| | $ | 8.58 | | | | | (8.53 | )% | | | $ | — | (6) | | | | 1.15 | % | | | | 0.55 | % | | | | 7.18 | % | | | | (5.48 | )% | | | | 54.30 | % |
| | $ | 10.27 | | | | | 2.92 | % | | | $ | 0.1 | | | | | 1.15 | %(4) | | | | 0.28 | %(4) | | | | 3.21 | %(4) | | | | (1.78 | )%(4) | | | | 41.02 | %(5) |
| | | | | | | | | | | | | | | | | | | | | | | | | | | | | | | | | | | | | | | |
| | $ | 12.98 | | | | | 2.58 | % | | | $ | 2.8 | | | | | 0.90 | %(4) | | | | 3.08 | %(4) | | | | 5.07 | %(4) | | | | (1.09 | )%(4) | | | | 49.67 | %(5) |
| | $ | 13.34 | | | | | 58.09 | % | | | $ | 1.6 | | | | | 0.90 | % | | | | 0.70 | % | | | | 6.66 | % | | | | (5.06 | )% | | | | 90.71 | % |
| | $ | 8.58 | | | | | 0.10 | % | | | $ | 0.5 | | | | | 0.90 | % | | | | 1.65 | % | | | | 30.12 | % | | | | (27.57 | )% | | | | 80.65 | % |
| | $ | 8.62 | | | | | (8.13 | )% | | | $ | 0.5 | | | | | 0.90 | % | | | | 0.81 | % | | | | 4.18 | % | | | | (2.47 | )% | | | | 54.30 | % |
| | $ | 10.27 | | | | | 3.09 | % | | | $ | 5.4 | | | | | 0.90 | %(4) | | | | 0.53 | %(4) | | | | 3.67 | %(4) | | | | (2.24 | )%(4) | | | | 41.02 | %(5) |
| | | | | | | | | | | | | | | | | | | | | | | | | | | | | | | | | | | | | | | |
| | $ | 12.18 | | | | | 2.77 | % | | | $ | — | (6) | | | | 0.72 | %(4) | | | | 3.14 | %(4) | | | | 4.33 | %(4) | | | | (0.47 | )%(4) | | | | 49.67 | %(5) |
| | $ | 12.53 | | | | | 59.25 | % | | | $ | — | (6) | | | | 0.72 | % | | | | 0.86 | % | | | | 6.62 | % | | | | (5.04 | )% | | | | 90.71 | % |
| | $ | 8.00 | | | | | 1.11 | % | | | $ | — | (6) | | | | 0.72 | % | | | | 0.87 | % | | | | 29.17 | % | | | | (27.58 | )% | | | | 80.65 | % |
| | $ | 7.97 | | | | | (15.36 | )% | | | $ | — | (6) | | | | 0.72 | % | | | | 0.98 | % | | | | 3.16 | % | | | | (1.46 | )% | | | | 54.30 | % |
| | $ | 10.32 | | | | | 3.63 | % | | | $ | 4.8 | | | | | 0.72 | %(4) | | | | 0.71 | %(4) | | | | 2.99 | %(4) | | | | (1.56 | )%(4) | | | | 41.02 | %(5) |
The accompanying notes to financial statements are an integral part of this statement.
103
Brandes Investment Trust
FINANCIAL HIGHLIGHTS For a capital share outstanding for the period ended:
| | | | | | | | | | | | | | | | | | | | | | | | | | | | | | |
| | | | | | |
| | | | | | | Net | | | | | | |
| | | Net asset | | | | realized and | | | | Dividends | | Dividends |
| | | value, | | Net | | unrealized | | Total from | | from net | | from net |
| | | beginning | | investment | | gain (loss) on | | investment | | investment | | realized |
| | | of period | | income(1) | | investments | | operations | | income | | gains |
Brandes U.S. Value Fund | | | | | | | | | | | | | | | | | | | | | | | | | | | | | | |
Class A | | | | | | | | | | | | | | | | | | | | | | | | | | | | | | |
10/1/2021(4) – 3/31/2022 (Unaudited) | | | $ | 10.00 | | | | | 0.07 | | | | | 0.56 | | | | | 0.63 | | | | | (0.05 | ) | | | | (0.01 | ) |
Class I | | | | | | | | | | | | | | | | | | | | | | | | | | | | | | |
10/1/2021(4) – 3/31/2022 (Unaudited) | | | $ | 10.00 | | | | | 0.08 | | | | | 0.53 | | | | | 0.61 | | | | | (0.05 | ) | | | | (0.01 | ) |
Class R6 | | | | | | | | | | | | | | | | | | | | | | | | | | | | | | |
10/1/2021(4) – 3/31/2022 (Unaudited) | | | $ | 10.00 | | | | | 0.07 | | | | | 0.54 | | | | | 0.61 | | | | | (0.03 | ) | | | | (0.01 | ) |
| (1) | Net investment income per share has been calculated based on average shares outstanding during the period. |
| (2) | The total return calculation does not reflect the sales loads that may be imposed on Class A shares (see Note 7 of the Notes to Financial Statements). |
| (3) | After fees waived and expenses absorbed or recouped by the Advisor, where applicable. |
| (4) | Commencement of operations on October 1, 2021. |
| (7) | Amount is less than $50,000. |
The accompanying notes to financial statements are an integral part of this statement.
104
Brandes Investment Trust
FINANCIAL HIGHLIGHTS For a capital share outstanding for the period ended:
| | | | | | | | | | | | | | | | | | | | | | | | | | | | | | | | | | | | | | |
Net asset
value, end
of period | | Total
return(2) | | Net assets,
end of
period
(millions) | | Ratio of
net expenses
to average
net assets(3) | | Ratio of net
investment
income to
average
net assets(3) | | Ratio of
expenses (prior
to reimburse-
ments) to
average
net assets | | Ratio of net
investment
income (prior
to reimburse-
ments) to
average
net assets | | Portfolio
turnover
rate |
| | | | | | | | | | | | | | | | | | | | | | | | | | | | | | | | | | | | | | | |
| | | | | | | | | | | | | | | | | | | | | | | | | | | | | | | | | | | | | | | |
| | $ | 10.57 | | | | | 6.35 | % | | | $ | 0.1 | | | | | 0.95 | %(5) | | | | 1.28 | %(5) | | | | 2.81 | %(5) | | | | (0.58 | )%(5) | | | | 6.92 | %(6) |
| | | | | | | | | | | | | | | | | | | | | | | | | | | | | | | | | | | | | | | |
| | $ | 10.55 | | | | | 6.14 | % | | | $ | 5.0 | | | | | 0.70 | %(5) | | | | 1.53 | %(5) | | | | 6.38 | %(5) | | | | (4.15 | )%(5) | | | | 6.92 | %(6) |
| | | | | | | | | | | | | | | | | | | | | | | | | | | | | | | | | | | | | | | |
| | $ | 10.57 | | | | | 6.16 | % | | | $ | — | (7) | | | | 0.60 | %(5) | | | | 1.22 | %(5) | | | | 21.69 | %(5) | | | | (19.87 | )%(5) | | | | 6.92 | %(6) |
The accompanying notes to financial statements are an integral part of this statement.
105
Brandes Investment Trust
FINANCIAL HIGHLIGHTS For a capital share outstanding for the period ended:
| | | | | | | | | | | | | | | | | | | | | | | | | | | | | | |
| | | | | | |
| | | | | | | Net | | | | | | |
| | | Net asset | | | | realized and | | | | Dividends | | Dividends |
| | | value, | | Net | | unrealized | | Total from | | from net | | from net |
| | | beginning | | investment | | gain (loss) on | | investment | | investment | | realized |
| | | of period | | income(1) | | investments | | operations | | income | | gains |
Brandes Core Plus Fixed Income Fund | | | | | | | | | | | | | | | | | | | | | | | | | | | | | | |
Class A | | | | | | | | | | | | | | | | | | | | | | | | | | | | | | |
3/31/2022 (Unaudited) | | | $ | 9.35 | | | | | 0.10 | | | | | (0.60 | ) | | | | (0.50 | ) | | | | (0.10 | ) | | | | — | |
9/30/2021 | | | $ | 9.52 | | | | | 0.18 | | | | | (0.12 | ) | | | | 0.06 | | | | | (0.23 | ) | | | | — | |
9/30/2020 | | | $ | 9.18 | | | | | 0.19 | | | | | 0.34 | | | | | 0.53 | | | | | (0.19 | ) | | | | — | |
9/30/2019 | | | $ | 8.85 | | | | | 0.24 | | | | | 0.33 | | | | | 0.57 | | | | | (0.24 | ) | | | | — | |
9/30/2018 | | | $ | 9.18 | | | | | 0.23 | | | | | (0.33 | ) | | | | (0.10 | ) | | | | (0.23 | ) | | | | — | |
9/30/2017 | | | $ | 9.39 | | | | | 0.20 | | | | | (0.18 | ) | | | | 0.02 | | | | | (0.21 | ) | | | | (0.02 | ) |
Class I | | | | | | | | | | | | | | | | | | | | | | | | | | | | | | |
3/31/2022 (Unaudited) | | | $ | 9.43 | | | | | 0.11 | | | | | (0.60 | ) | | | | (0.49 | ) | | | | (0.11 | ) | | | | — | |
9/30/2021 | | | $ | 9.60 | | | | | 0.21 | | | | | (0.13 | ) | | | | 0.08 | | | | | (0.25 | ) | | | | — | |
9/30/2020 | | | $ | 9.26 | | | | | 0.22 | | | | | 0.33 | | | | | 0.55 | | | | | (0.21 | ) | | | | — | |
9/30/2019 | | | $ | 8.92 | | | | | 0.26 | | | | | 0.34 | | | | | 0.60 | | | | | (0.26 | ) | | | | — | |
9/30/2018 | | | $ | 9.25 | | | | | 0.25 | | | | | (0.33 | ) | | | | (0.08 | ) | | | | (0.25 | ) | | | | — | |
9/30/2017 | | | $ | 9.44 | | | | | 0.22 | | | | | (0.16 | ) | | | | 0.06 | | | | | (0.23 | ) | | | | (0.02 | ) |
Class R6 | | | | | | | | | | | | | | | | | | | | | | | | | | | | | | |
3/31/2022 (Unaudited) | | | $ | 9.43 | | | | | 0.17 | | | | | (0.60 | ) | | | | (0.43 | ) | | | | (0.17 | ) | | | | — | |
9/30/2021 | | | $ | 9.60 | | | | | 0.34 | | | | | (0.13 | ) | | | | 0.21 | | | | | (0.38 | ) | | | | — | |
9/30/2020 | | | $ | 9.26 | | | | | 0.29 | | | | | 0.34 | | | | | 0.63 | | | | | (0.29 | ) | | | | — | |
9/30/2019 | | | $ | 8.93 | | | | | 0.09 | | | | | 0.56 | | | | | 0.65 | | | | | (0.32 | ) | | | | — | |
10/10/2017(10) – 9/30/2018 | | | $ | 9.25 | | | | | 0.06 | | | | | (0.06 | ) | | | | — | | | | | (0.32 | ) | | | | — | |
| (1) | Net investment income per share has been calculated based on average shares outstanding during the period. |
| (2) | The total return calculation does not reflect the sales loads that may be imposed on Class A shares (see Note 7 of the Notes to Financial Statements). |
| (3) | After fees waived and expenses absorbed or recouped by the Advisor, where applicable. |
| (5) | As of August 24, 2020, the expense cap for the class changed from 0.70% to 0.50%. |
| (6) | Includes expenses not covered by the Trust’s expense limitation agreement. |
| (7) | As of August 24, 2020, the expense cap for the class changed from 0.50% to 0.30%. |
| (8) | Amount is less than $50,000. |
| (9) | As of August 24, 2020, the expense cap for the class changed from 0.35% to 0.30%. |
| (10) | Commencement of operations. |
| (11) | The total return calculation does not reflect the sales loads that may be imposed on Class A or C shares (see Note 7 of the Notes to Financial Statements). |
The accompanying notes to financial statements are an integral part of this statement.
106
Brandes Investment Trust
FINANCIAL HIGHLIGHTS For a capital share outstanding for the period ended:
| | | | | | | | | | | | | | | | | | | | | | | | | | | | | | | | | | | | | | |
Net asset
value, end
of period | | Total
return(2) | | Net assets,
end of
period
(millions) | | Ratio of
net expenses
to average
net assets(3) | | Ratio of net
investment
income to
average
net assets(3) | | Ratio of
expenses (prior
to reimburse-
ments) to
average
net assets | | Ratio of net
investment
income (prior
to reimburse-
ments) to
average
net assets | | Portfolio
turnover
rate |
| | | | | | | | | | | | | | | | | | | | | | | | | | | | | | | | | | | | | | | |
| | | | | | | | | | | | | | | | | | | | | | | | | | | | | | | | | | | | | | | |
| | $ | 8.75 | | | | | (5.42 | )% | | | $ | 0.8 | | | | | 0.50 | %(4) | | | | 2.12 | %(4) | | | | 0.85 | %(4) | | | | 1.77 | %(4) | | | | 8.64 | % |
| | $ | 9.35 | | | | | 0.67 | % | | | $ | 1.0 | | | | | 0.50 | % | | | | 1.95 | % | | | | 0.83 | % | | | | 1.62 | % | | | | 27.13 | % |
| | $ | 9.52 | | | | | 5.89 | % | | | $ | 1.2 | | | | | 0.68 | %(5) | | | | 2.30 | % | | | | 0.86 | % | | | | 2.12 | % | | | | 20.59 | % |
| | $ | 9.18 | | | | | 6.56 | % | | | $ | 3.2 | | | | | 0.70 | % | | | | 2.72 | % | | | | 0.93 | % | | | | 2.49 | % | | | | 18.54 | % |
| | $ | 8.85 | | | | | (1.08 | )% | | | $ | 1.8 | | | | | 0.70 | % | | | | 2.57 | % | | | | 0.87 | % | | | | 2.40 | % | | | | 47.73 | % |
| | $ | 9.18 | | | | | 0.28 | % | | | $ | 3.3 | | | | | 0.71 | %(6) | | | | 2.25 | % | | | | 0.85 | %(6) | | | | 2.11 | % | | | | 35.10 | % |
| | | | | | | | | | | | | | | | | | | | | | | | | | | | | | | | | | | | | | | |
| | $ | 8.83 | | | | | (5.26 | )% | | | $ | 68.2 | | | | | 0.30 | %(4) | | | | 2.33 | %(4) | | | | 0.65 | %(4) | | | | 1.98 | %(4) | | | | 8.64 | % |
| | $ | 9.43 | | | | | 0.89 | % | | | $ | 78.1 | | | | | 0.30 | % | | | | 2.23 | % | | | | 0.63 | % | | | | 1.90 | % | | | | 27.13 | % |
| | $ | 9.60 | | | | | 6.07 | % | | | $ | 85.6 | | | | | 0.48 | %(7) | | | | 2.41 | % | | | | 0.65 | % | | | | 2.24 | % | | | | 20.59 | % |
| | $ | 9.26 | | | | | 6.85 | % | | | $ | 83.4 | | | | | 0.50 | % | | | | 2.91 | % | | | | 0.73 | % | | | | 2.68 | % | | | | 18.54 | % |
| | $ | 8.92 | | | | | (0.85 | )% | | | $ | 89.7 | | | | | 0.50 | % | | | | 2.78 | % | | | | 0.68 | % | | | | 2.60 | % | | | | 47.73 | % |
| | $ | 9.25 | | | | | 0.71 | % | | | $ | 97.9 | | | | | 0.51 | %(6) | | | | 2.45 | % | | | | 0.66 | %(6) | | | | 2.30 | % | | | | 35.10 | % |
| | | | | | | | | | | | | | | | | | | | | | | | | | | | | | | | | | | | | | | |
| | $ | 8.83 | | | | | (4.66 | )% | | | $ | — | (8) | | | | 0.30 | %(4) | | | | 3.61 | %(4) | | | | 0.30 | %(4) | | | | 3.61 | %(4) | | | | 8.64 | % |
| | $ | 9.43 | | | | | 2.23 | % | | | $ | — | (8) | | | | 0.30 | % | | | | 3.54 | % | | | | 0.30 | % | | | | 3.54 | % | | | | 27.13 | % |
| | $ | 9.60 | | | | | 6.89 | % | | | $ | — | (8) | | | | 0.30 | %(9) | | | | 3.19 | % | | | | 0.30 | % | | | | 3.19 | % | | | | 20.59 | % |
| | $ | 9.26 | | | | | 7.40 | % | | | $ | — | (8) | | | | 0.35 | % | | | | 0.97 | % | | | | 0.35 | % | | | | 0.97 | % | | | | 18.54 | % |
| | $ | 8.93 | | | | | 0.04 | %(11) | | | $ | — | (8) | | | | 0.35 | %(4) | | | | 0.69 | %(4) | | | | 0.35 | %(4) | | | | 0.69 | %(4) | | | | 47.73 | %(12) |
The accompanying notes to financial statements are an integral part of this statement.
107
Brandes Investment Trust
NOTES TO FINANCIAL STATEMENTS
NOTE 1 – ORGANIZATION
The Brandes International Equity Fund (the “International Fund”), the Brandes Global Equity Fund (the “Global Fund”), the Brandes Emerging Markets Value Fund (the “Emerging Markets Fund”), the Brandes International Small Cap Equity Fund (the “International Small Cap Fund”), the Brandes Small Cap Value Fund (the “Small Cap Value Fund”), the Brandes U.S. Value Fund (the “U.S. Value Fund”) and the Brandes Core Plus Fixed Income Fund (the “Core Plus Fund”) (each a “Fund” and collectively the “Funds”) are series of Brandes Investment Trust (the “Trust”). The Trust is registered under the Investment Company Act of 1940, as amended (the “1940 Act”), as a diversified, open-end management investment company.
The International Fund, Global Fund, Emerging Markets Fund, International Small Cap Fund, Small Cap Value Fund, U.S. Value Fund and Core Plus Fund began operations on January 2, 1997, October 6, 2008, January 31, 2011, February 1, 2012, January 2, 2018, October 1, 2021 and December 28, 2007, respectively. Prior to January 31, 2011 for the Emerging Markets Fund, February 1, 2012 for the International Small Cap and January 2, 2018 for the Small Cap Value Fund, these Funds’ portfolios were managed as private investment funds with investment objectives, investment policies and strategies that were, in all material respects, equivalent to those of the Emerging Markets Fund, International Small Cap Fund and Small Cap Value Fund, respectively.
The International Fund, Emerging Markets Fund and International Small Cap Fund have four classes of shares: Class A, Class C, Class I and Class R6. The Global Fund has three classes of shares: Class A, Class C and Class I. The Small Cap Value Fund, U.S. Value Fund and Core Plus Fund have three classes of shares: Class A, Class I and Class R6.
The International Fund and Global Fund invest their assets primarily in equity securities of issuers with market capitalizations greater than $5 billion. The International, International Small Cap and Emerging Markets Funds invest their assets in securities of foreign companies, while the Global Fund invests its assets in securities of foreign and domestic companies. The Small Cap Value Fund invests primarily in U.S. equity securities of issuers with market capitalizations less than $5 billion. The U.S. Value Fund invests primarily in U.S. equity securities of issuers with market capitalizations greater than $5 billion. The Core Plus Fund invests predominantly in debt securities issued by U.S. and foreign companies and debt obligations issued or guaranteed by the U.S. Government and foreign governments and their agencies and instrumentalities.
108
Brandes Investment Trust
NOTES TO FINANCIAL STATEMENTS — (continued)
NOTE 2 – SIGNIFICANT ACCOUNTING POLICIES
Each Fund is an investment company that applies the accounting and reporting guidance issued in Topic 946, “Financial Services-Investment Companies”, by the Financial Accounting Standards Board (“FASB”). The following is a summary of significant accounting policies consistently followed by the Funds. These policies are in conformity with generally accepted accounting principles (“GAAP”) in the United States of America.
| | A. | Repurchase Agreements. Each Fund may enter into repurchase agreements with government securities dealers recognized by the Federal Reserve Board, with member banks of the Federal Reserve System or with other brokers or dealers that meet the credit guidelines established by the Board of Trustees. Each Fund will always receive and maintain, as collateral, U.S. Government securities whose market value, including accrued interest (which is recorded in the Schedules of Investments), will be at least equal to 100% of the dollar amount invested by the Fund in each agreement, and the Fund will make payment for such securities only upon physical delivery or upon evidence of book entry transfer to the account of the Fund’s custodian. If the term of any repurchase transaction exceeds one business day, the value of the collateral is marked-to-market on a daily basis to ensure the adequacy of the collateral. Before causing a Fund to enter into a repurchase agreement with any other party, the investment advisor will determine that such party does not have any apparent risk of becoming involved in bankruptcy proceedings within the time frame contemplated by the repurchase agreement. If the seller defaults and the value of the collateral declines, or if bankruptcy proceedings are commenced with respect to the seller of the security, realization of the collateral by the Fund may be delayed or limited. At March 31, 2022, the Funds did not invest in repurchase agreements. |
| | B. | Foreign Currency Translation and Transactions. Values of investments denominated in foreign currencies are converted into U.S. dollars using the spot market rates of exchange at the time of valuation. Purchases and sales of investments and dividend and interest income are translated into U.S. dollars using the spot market rates of exchange prevailing on the respective dates of such translations. The gain or loss resulting from changes in foreign exchange rates is included with net realized and unrealized gain or loss from investments, as appropriate. Foreign securities and currency transactions may involve certain considerations and risks not typically associated with those of domestic origin. |
Foreign securities are recorded in the financial statements after translation to U.S. dollars based on the applicable exchange rate at the end of the period. The Funds report certain foreign currency-related transactions as
109
Brandes Investment Trust
NOTES TO FINANCIAL STATEMENTS — (continued)
components of realized gains or losses for financial reporting purposes, whereas such components are treated as ordinary income for federal income tax purposes.
| | C. | Delayed Delivery Securities. The Funds may purchase securities on a when issued or delayed delivery basis. “When-issued” or delayed delivery refers to securities whose terms are available and for which a market exists, but that have not been issued. For a when-issued or delayed delivery transaction, no payment is made until delivery date, which is typically longer than the normal course of settlement. When a Fund enters into an agreement to purchase securities on a when-issued or delayed delivery basis, the Fund segregates cash or liquid securities, of any type or maturity, equal in value to the Fund’s commitment. Losses may arise if the market value of the underlying securities changes, if the counterparty does not perform under the contract, or if the issuer does not issue the securities due to political, economic, or other factors. The Funds did not have any open commitments on delayed delivery securities as of March 31, 2022. |
| | D. | Zero Coupon Bonds. The Funds may invest without limit in so-called zero coupon bonds. Zero coupon bonds are issued at a significant discount from their principal amount in lieu of paying interest periodically. Because zero coupon bonds do not pay current interest in cash, their value is subject to greater fluctuation in response to changes in market interest rates than bonds that pay interest currently. Zero coupon bonds allow an issuer to avoid the need to generate cash to meet current interest payments. Accordingly, such bonds may involve greater credit risks than bonds paying interest currently in cash. A Fund is required to accrue interest income on such investments and to distribute such amounts at least annually to shareholders even though the investments do not make any current interest payments. The daily market quotations of the original bonds may include the accrued interest (referred to as a dirty price) and require a pro rata adjustment, if any, from the unrealized appreciation (depreciation) on investments to interest receivable on the Statements of Assets and Liabilities. |
| | E. | Participatory Notes. The International, Global, Emerging Markets, International Small Cap, Small Cap Value and U.S. Value Funds may invest in participatory notes. Participatory notes are derivative securities which are designed to provide synthetic exposure to one or more underlying securities, subject to the credit risk of the issuing financial institution. |
Investments in participatory notes involve risks normally associated with a direct investment in the underlying securities. In addition, participatory notes are subject to counterparty risk, which is the risk that the broker-dealer or bank that issues the notes will not fulfill its contractual obligation to complete the transaction with the Trust. Participatory notes constitute general
110
Brandes Investment Trust
NOTES TO FINANCIAL STATEMENTS — (continued)
unsecured, unsubordinated contractual obligations of the banks or broker-dealers that issue them and generally are issued as an actual note from the financial intermediary or an equity linked warrant (commonly known as a low exercise price option). The Trust is relying on the creditworthiness of such banks or broker-dealers and has no rights under a participatory note against the issuer of the securities underlying such participatory note. The investment advisor has established guidelines for monitoring participatory note exposure for the Funds. Prior to investment in a participatory note, the investment advisor will complete an analysis of the prospective counterparties and once purchased, will continue to monitor creditworthiness on a quarterly basis. The investment advisor requires a minimum credit rating for such counterparties (as determined by rating agencies such as Moody’s, Fitch and S&P) of A.
The Funds record counterparty credit risk valuation adjustments, if material, on the participatory notes in order to appropriately reflect the credit quality of the counterparty.
The International, Global, Emerging Markets, International Small Cap, Small Cap Value and U.S. Value Funds did not invest in any participatory notes at March 31, 2022.
| | F. | Investment Transactions, Dividends and Distributions. Investment transactions are accounted for on the trade dates. Realized gains and losses are evaluated on the basis of identified costs. Dividend income and distributions to shareholders are recorded on the ex-dividend dates. Interest is recorded on an accrual basis. Other non-cash dividends are recognized as investment income at the fair value of the investment received. Withholding taxes on foreign dividends and capital gains, which are included as a component of net investment income and realized gain (loss) on investments, respectively, have been provided for in accordance with the Trust’s understanding of the applicable country’s tax rules and rates. Each Fund’s investment income, expenses, other than class specific expenses, and realized and unrealized gains and losses are allocated daily to each class of the Fund’s shares based upon the relative net asset values of outstanding shares of each class of shares at the beginning of the day (after adjusting for the current capital shares activity of the respective class). Expenses common to the Funds’ portfolios are allocated among the Funds based upon their relative net asset values or other appropriate allocation methods. The Funds amortize premiums and accrete discounts using the constant yield method. |
| | G. | Concentration of Risk. As of March 31, 2022, the International, Global, Emerging Markets and International Small Cap Funds held significant portions of their assets in foreign securities. Certain price and foreign exchange fluctuations as well as economic and political situations in the |
111
Brandes Investment Trust
NOTES TO FINANCIAL STATEMENTS — (continued)
foreign jurisdictions could have an impact on the International, Global, Emerging Markets and International Small Cap Funds’ net assets. The investment advisor monitors these off-balance sheet risks.
| | H. | Use of Estimates. The preparation of financial statements in conformity with GAAP requires management to make estimates and assumptions that affect the reported amounts of assets and liabilities at the date of the financial statements and reported amounts of income and expenses during the reporting period. Actual results could differ from those estimates and assumptions. |
| | I. | Securities Lending. The Funds may lend their portfolio securities to banks, brokers and dealers. Lending Fund securities exposes the Fund to risks such as the following: (i) the borrower may fail to return the loaned securities, (ii) the borrower may not be able to provide additional collateral, or (iii) the Funds may experience delays in recovery of the loaned securities or loss of rights in the collateral if the borrower fails financially. |
To minimize these risks, the borrower must agree to maintain collateral with the Fund’s custodian, marked to market daily, in the form of U.S. Government obligations, in an amount at least equal to 102% (105% in the case of loans of foreign securities not denominated in U.S. dollars) of the market value of the loaned securities. As of March 31, 2022, the Global Fund, Emerging Markets Fund, International Small Cap, Small Cap Value Fund and Core Plus Fund did not have any securities on loan. The International Fund had securities on loan as of March 31, 2022. The market value of securities loaned is $13,224,469. The Fund received non-cash collateral for the loans in the amount of $14,201,973. Non-cash collateral received by the Fund may not be sold or re-pledged except to satisfy a borrower default. Therefore, non-cash collateral is not included on the Funds’ Schedules of Investments or Statement of Assets and Liabilities.
| | J. | Indemnification Obligations. Under the Trust’s organizational documents, its current and former officers and trustees are indemnified against certain liabilities arising out of the performance of their duties to the Trust. The Trust has indemnified its trustees against any expenses actually and reasonably incurred by the trustees in any proceeding arising out of or in connection with the trustees’ service to the Trust. In addition, in the normal course of business, the Trust enters into contracts that contain a variety of representations and warranties and provide general indemnifications. The Funds’ maximum exposure under these arrangements is unknown as this would involve future claims that may be made against the Funds that have not yet occurred or that would be covered by other parties. |
112
Brandes Investment Trust
NOTES TO FINANCIAL STATEMENTS — (continued)
| | K. | Accounting for Uncertainty in Income Taxes. Each Fund has elected to be taxed as a “regulated investment company” and intends to distribute substantially all its taxable income to its shareholders and otherwise comply with the provisions of the Internal Revenue Code applicable to regulated investment companies. The Funds may be subject to a nondeductible excise tax calculated as a percentage of certain undistributed amounts of net investment income and net capital gains. The Funds intend to distribute their net investment income and capital gains as necessary to avoid this excise tax. Therefore, no provision for federal income taxes or excise taxes has been made. |
The Trust analyzes all open tax years, as defined by the applicable statute of limitations, for all major jurisdictions. Open tax years for the Funds are those that are open for exam by taxing authorities (2018 through 2021). As of March 31, 2022 the Trust has no examinations in progress.
Management has analyzed the Trust’s tax positions, and has concluded that no liability should be recorded related to uncertain tax positions expected to be taken on the tax return for the fiscal year-ended September 30, 2021.
The Trust identifies its major tax jurisdictions as the U.S. Government and the State of California. The Funds are not aware of any tax positions for which it is reasonably possible that the total amounts of unrecognized tax benefits will significantly change in the next twelve months.
| | L. | Fair Value Measurements. The Trust has adopted GAAP accounting principles related to fair value accounting standards which establish a definition of fair value and set out a hierarchy for measuring fair value. These standards require additional disclosures about the various inputs and valuation techniques used to develop the measurements of fair value and a discussion of changes in valuation techniques and related inputs during the period. These inputs are summarized in the three broad levels listed below: |
Level 1—Fair value measurement within Level 1 should be based on an unadjusted quoted price in an active market that the Funds have the ability to access for the asset or liability at the measurement date. Because a quoted price alone forms the basis for the measurement, the access requirement within Level 1 limits discretion in pricing the asset or liability, including in situations in which there are multiple markets for the asset or liability with different prices and no single market represents a principal market for the asset or liability. Importantly, the FASB has indicated that when a quoted price in an active market for a security is available, that price should be used to measure fair value without regard to an entity’s intent to transact at that price.
113
Brandes Investment Trust
NOTES TO FINANCIAL STATEMENTS — (continued)
Level 2—Fair value measurement within Level 2 should be based on all inputs other than unadjusted quoted prices included within Level 1 that are observable for the asset or liability. Other significant observable market inputs include quoted prices for similar instruments in active markets, quoted adjusted prices in active markets, quoted prices for identical or similar instruments in markets that are not active, and model derived valuations in which the majority of significant inputs and significant value drivers are observable in active markets.
Level 3—Fair value measurement within Level 3 should be based on unobservable inputs in such cases where markets do not exist or are illiquid. Significant unobservable inputs include model derived valuations in which the majority of significant inputs or significant value drivers are unobservable. Unobservable inputs are those inputs that reflect the Fund’s own assumptions that market participants would use to price the asset or liability based on the best available information.
| | M. | Security Valuation. Common and preferred stocks, exchange-traded funds and financial derivative instruments, such as futures contracts and options contracts that are traded on a national securities or commodities exchange, are valued at the last reported sales price at the close of regular trading on each day the exchange is open for trading, in the case of common stocks and exchange-traded funds, or, in the case of futures contracts or options contracts, the settlement price determined by the relevant exchange. Securities listed on the NASDAQ National Market System for which market quotations are readily available are valued using the NASDAQ Official Closing Price. To the extent these securities are actively traded and valuation adjustments are not applied, they are categorized as Level 1 of the fair value hierarchy. |
Equity securities traded on an exchange for which there have been no sales on the valuation date are generally valued at the mean between last bid and ask price on such day and are categorized as Level 2 of the fair value hierarchy, or are fair valued by the Fair Valuation Committee.
Investments in registered open-end management investment companies are valued based upon the Net Asset Values (“NAVs”) of such investments and are categorized as Level 1 of the fair value hierarchy.
Valuation adjustments may be applied to certain common and preferred stocks that are solely traded on a foreign exchange to account for the market movement between the close of the foreign market and the close of the New York Stock Exchange (“NYSE”). These securities are generally valued using pricing service providers that consider the correlation of the trading patterns of the foreign securities to the intraday trading in the U.S. markets for
114
Brandes Investment Trust
NOTES TO FINANCIAL STATEMENTS — (continued)
investments. Securities using these valuation adjustments are categorized as Level 2 of the fair value hierarchy. As of March 31, 2022, the International Fund, Global Fund, Emerging Markets Fund and International Small Cap Fund had securities with market values of $539,398,204, $21,645,798, $743,557,502 and $207,492,729 that represent 81.64%, 46.41%, 69.43%, and 60.65% of each Fund’s net assets, respectively, that were fair valued using these valuation adjustments.
Fixed income securities (other than repurchase agreements and demand notes) including corporate, convertible and municipal bonds and notes, U.S. government agencies, U.S. Treasury obligations, sovereign issues, bank loans, convertible preferred securities, fixed income securities purchased on a delayed delivery basis and non-U.S. bonds are normally valued on the basis of quotes obtained from brokers and dealers or independent pricing services or sources. Independent pricing services typically use information provided by market makers or estimates of market values obtained from yield data relating to investments or securities with similar characteristics. The service providers’ internal models use inputs that are observable such as, among other things, issuer details, interest rates, yield curves, prepayment speeds, credit risks/ spreads, default rates and quoted prices for similar assets. Securities that use similar valuation techniques and inputs as described above are categorized as Level 2 of the fair value hierarchy.
Rights that are traded on a national securities exchange are valued at the last reported sales price at the close of regular trading on each day the exchange is open. A right is a privilege offered by a corporation to its shareholders pro rata to subscribe to a certain security at a specified price, often for a short period. Rights may or may not be transferable. Rights that use such valuation techniques and inputs are categorized as Level 2 of the fair value hierarchy.
Mortgage and asset-backed securities are usually issued as separate tranches, or classes, of securities within each package of underlying securities. These securities are also normally valued by pricing service providers that use broker-dealer quotations or valuation estimates from their internal pricing models. The pricing models for these securities usually consider tranche level attributes, estimated cash flows and market based yield spreads for each tranche, and current market data and incorporate packaged collateral performance, as available. Mortgage and asset-backed securities that use such valuation techniques and inputs are categorized as Level 2 of the fair value hierarchy.
Repurchase agreements and demand notes, for which neither vendor pricing nor market maker prices are available, are valued at amortized cost on the day of valuation, unless Brandes Investment Partners, L.P. (the “Advisor”) determines that the use of amortized cost valuation on such day is not
115
Brandes Investment Trust
NOTES TO FINANCIAL STATEMENTS — (continued)
appropriate (in which case such instrument is fair valued in accordance with the fair value procedures of the Trust). Repurchase agreements and demand notes that use such valuation techniques and inputs are categorized as Level 2 of the fair value hierarchy.
Certain securities may be fair valued in accordance with the fair valuation procedures approved by the Board of Trustees. The Fair Valuation Committee is generally responsible for overseeing the day-to-day valuation processes and reports periodically to the Board. The Fair Valuation Committee is authorized to make all necessary determinations of the fair value of portfolio securities and other assets for which market quotations are not readily available or if it is deemed that the prices obtained from brokers and dealers or independent pricing services are unreliable. The securities fair valued by the Fair Valuation Committee are indicated in the Schedules of Investments and are categorized as Level 2 or Level 3 of the fair value hierarchy. Certain vendor priced securities may also be considered Level 3 if significant unobservable inputs are used by the vendors.
In using fair value pricing, each Fund attempts to establish the price that it might reasonably have expected to receive upon a sale of the security at 4:00 p.m. Eastern time. Valuing securities at fair value involves greater reliance on judgment than valuation of securities based on readily available market quotations. A Fund using fair value to price securities may value those securities higher or lower than another fund using market quotations or fair value to price the same securities. Further, there can be no assurance that the Fund could obtain the fair value assigned to a security if it were to sell the security at approximately the time at which the Fund determines its net asset value.
116
Brandes Investment Trust
NOTES TO FINANCIAL STATEMENTS — (continued)
The following is a summary of the level inputs used, as of March 31, 2022, involving the Funds’ assets carried at fair value. The inputs used for valuing securities may not be an indication of the risk associated with investing in those securities.
| | | | | | | | | | | | | | | | |
Description | | Level 1 | | | Level 2 | | | Level 3 | | | Total | |
Investments in Securities | | | | | | | | | | | | | | | | |
International Fund | | | | | | | | | | | | | | | | |
Common Stocks | | | | | | | | | | | | | | | | |
Communication Services | | $ | 26,926,842 | | | $ | 39,806,540 | | | $ | 1,344,897 | | | $ | 68,078,279 | |
Consumer Discretionary | | | — | | | | 63,761,807 | | | | — | | | | 63,761,807 | |
Consumer Staples | | | 11,132,132 | | | | 112,244,660 | | | | — | | | | 123,376,792 | |
Energy | | | 5,358,745 | | | | 34,370,501 | | | | — | | | | 39,729,246 | |
Financials | | | — | | | | 119,154,482 | | | | — | | | | 119,154,482 | |
Health Care | | | — | | | | 100,419,758 | | | | — | | | | 100,419,758 | |
Industrials | | | 11,445,290 | | | | 11,968,110 | | | | — | | | | 23,413,400 | |
Materials | | | 10,018,355 | | | | 26,710,428 | | | | — | | | | 36,728,783 | |
Real Estate | | | 17,061,757 | | | | — | | | | — | | | | 17,061,757 | |
Utilities | | | — | | | | 14,409,141 | | | | — | | | | 14,409,141 | |
| | | | | | | | | | | | | | | | |
Total Common Stocks | | | 81,943,121 | | | | 522,845,427 | | | | 1,344,897 | | | | 606,133,445 | |
| | | | | | | | | | | | | | | | |
Preferred Stocks | | | | | | | | | | | | | | | | |
Energy | | | 15,689,930 | | | | — | | | | 1,407,942 | | | | 17,097,872 | |
Health Care | | | — | | | | 16,552,778 | | | | — | | | | 16,552,778 | |
| | | | | | | | | | | | | | | | |
Total Preferred Stocks | | | 15,689,930 | | | | 16,552,778 | | | | 1,407,942 | | | | 33,650,650 | |
| | | | | | | | | | | | | | | | |
Short-Term Investments | | | 16,421,449 | | | | — | | | | — | | | | 16,421,449 | |
| | | | | | | | | | | | | | | | |
Total Investments in Securities | | $ | 114,054,500 | | | $ | 539,398,205 | | | $ | 2,752,839 | | | $ | 656,205,544 | |
| | | | | | | | | | | | | | | | |
| | | | |
Global Fund | | | | | | | | | | | | | | | | |
Common Stocks | | | | | | | | | | | | | | | | |
Communication Services | | $ | 822,346 | | | $ | 1,783,783 | | | $ | — | | | $ | 2,606,129 | |
Consumer Discretionary | | | 411,847 | | | | 4,535,239 | | | | — | | | | 4,947,086 | |
Consumer Staples | | | — | | | | 2,580,964 | | | | — | | | | 2,580,964 | |
Energy | | | 1,589,244 | | | | 3,214,526 | | | | — | | | | 4,803,770 | |
Financials | | | 8,102,411 | | | | 3,208,888 | | | | — | | | | 11,311,299 | |
Health Care | | | 7,569,123 | | | | 2,378,693 | | | | — | | | | 9,947,816 | |
Industrials | | | 3,338,444 | | | | 444,909 | | | | — | | | | 3,783,353 | |
Materials | | | — | | | | 1,158,275 | | | | — | | | | 1,158,275 | |
Real Estate | | | 783,236 | | | | — | | | | — | | | | 783,236 | |
Technology | | | 1,487,049 | | | | 1,394,653 | | | | — | | | | 2,881,702 | |
Utilities | | | 168,237 | | | | 786,691 | | | | — | | | | 954,928 | |
| | | | | | | | | | | | | | | | |
Total Common Stocks | | | 24,271,937 | | | | 21,486,621 | | | | — | | | | 45,758,558 | |
| | | | | | | | | | | | | | | | |
Preferred Stocks | | | | | | | | | | | | | | | | |
Health Care | | | 465,939 | | | | — | | | | — | | | | 465,939 | |
Technology | | | — | | | | 159,177 | | | | — | | | | 159,177 | |
| | | | | | | | | | | | | | | | |
Total Preferred Stocks | | | 465,939 | | | | 159,177 | | | | — | | | | 625,116 | |
| | | | | | | | | | | | | | | | |
Short-Term Investments | | | 209,674 | | | | — | | | | — | | | | 209,674 | |
| | | | | | | | | | | | | | | | |
Total Investments in Securities | | $ | 24,947,550 | | | $ | 21,645,798 | | | $ | — | | | $ | 46,593,348 | |
| | | | | | | | | | | | | | | | |
117
Brandes Investment Trust
NOTES TO FINANCIAL STATEMENTS — (continued)
| | | | | | | | | | | | | | | | |
Description | | Level 1 | | | Level 2 | | | Level 3 | | | Total | |
| | | | |
Emerging Markets Fund | | | | | | | | | | | | | | | | |
Common Stocks | | | | | | | | | | | | | | | | |
Communication Services | | $ | 51,071,453 | | | $ | 65,896,914 | | | $ | 11,386,051 | | | $ | 128,354,418 | |
Consumer Discretionary | | | 173,411 | | | | 186,885,142 | | | | 5,377,449 | | | | 192,436,002 | |
Consumer Staples | | | 32,241,815 | | | | 64,116,209 | | | | — | | | | 96,358,024 | |
Energy | | | — | | | | — | | | | 2,111,675 | | | | 2,111,675 | |
Financials | | | 28,739,625 | | | | 158,617,190 | | | | 19,800 | | | | 187,376,615 | |
Health Care | | | — | | | | 21,075,397 | | | | — | | | | 21,075,397 | |
Industrials | | | 68,027,155 | | | | 10,327,579 | | | | — | | | | 78,354,734 | |
Materials | | | 21,059,490 | | | | 25,984,081 | | | | — | | | | 47,043,571 | |
Real Estate | | | 59,020,789 | | | | — | | | | — | | | | 59,020,789 | |
Technology | | | — | | | | 210,654,991 | | | | — | | | | 210,654,991 | |
Utilities | | | 7,196,666 | | | | — | | | | — | | | | 7,196,666 | |
| | | | | | | | | | | | | | | | |
Total Common Stocks | | | 267,530,404 | | | | 743,557,503 | | | | 18,894,975 | | | | 1,029,982,882 | |
| | | | | | | | | | | | | | | | |
Preferred Stocks | | | | | | | | | | | | | | | | |
Energy | | | 27,152,459 | | | | — | | | | — | | | | 27,152,459 | |
Short-Term Investments | | | 16,878,075 | | | | — | | | | — | | | | 16,878,075 | |
| | | | | | | | | | | | | | | | |
Total Investments in Securities | | $ | 311,560,938 | | | $ | 743,557,503 | | | $ | 18,894,975 | | | $ | 1,074,013,416 | |
| | | | | | | | | | | | | | | | |
| | | | |
International Small Cap Fund | | | | | | | | | | | | | | | | |
Common Stocks | | | | | | | | | | | | | | | | |
Communication Services | | $ | 809,978 | | | $ | 21,256,630 | | | $ | — | | | $ | 22,066,608 | |
Consumer Discretionary | | | 19,922,597 | | | | 12,734,360 | | | | — | | | | 32,656,957 | |
Consumer Staples | | | 22,984,311 | | | | 36,389,562 | | | | — | | | | 59,373,873 | |
Energy | | | 8,429,482 | | | | 5,930,778 | | | | — | | | | 14,360,260 | |
Financials | | | 8,280,534 | | | | 34,883,073 | | | | — | | | | 43,163,607 | |
Health Care | | | 7,455,120 | | | | 19,486,905 | | | | — | | | | 26,942,025 | |
Industrials | | | 21,039,910 | | | | 46,003,447 | | | | — | | | | 67,043,357 | |
Materials | | | 1,892,312 | | | | 14,338,430 | | | | — | | | | 16,230,742 | |
Real Estate | | | 22,962,387 | | | | 6,905,047 | | | | — | | | | 29,867,434 | |
Technology | | | 638,526 | | | | 6,794,644 | | | | — | | | | 7,433,170 | |
Utilities | | | 6,139,716 | | | | 3,461,314 | | | | — | | | | 9,601,030 | |
| | | | | | | | | | | | | | | | |
Total Common Stocks | | | 120,554,873 | | | | 208,184,190 | | | | — | | | | 328,739,063 | |
| | | | | | | | | | | | | | | | |
Preferred Stocks | | | | | | | | | | | | | | | | |
Health Care | | | — | | | | 6,494,548 | | | | — | | | | 6,494,548 | |
Investment Companies | | | | | | | | | | | | | | | | |
Financials | | | 2,959,600 | | | | — | | | | — | | | | 2,959,600 | |
Short-Term Investments | | | 3,945,685 | | | | — | | | | — | | | | 3,945,685 | |
| | | | | | | | | | | | | | | | |
Total Investments in Securities | | $ | 127,460,158 | | | $ | 214,678,738 | | | $ | — | | | $ | 342,138,896 | |
| | | | | | | | | | | | | | | | |
118
Brandes Investment Trust
NOTES TO FINANCIAL STATEMENTS — (continued)
| | | | | | | | | | | | | | | | |
Description | | Level 1 | | | Level 2 | | | Level 3 | | | Total | |
| | | | |
Small Cap Value Fund | | | | | | | | | | | | | | | | |
Common Stocks | | | | | | | | | | | | | | | | |
Consumer Discretionary | | $ | 139,615 | | | $ | — | | | $ | — | | | $ | 139,615 | |
Consumer Staples | | | 180,760 | | | | — | | | | — | | | | 180,760 | |
Energy | | | 361,826 | | | | — | | | | — | | | | 361,826 | |
Financials | | | 367,949 | | | | — | | | | — | | | | 367,949 | |
Health Care | | | 490,853 | | | | — | | | | 28,425 | | | | 519,278 | |
Industrials | | | 1,138,470 | | | | — | | | | — | | | | 1,138,470 | |
Real Estate | | | 120,457 | | | | — | | | | — | | | | 120,457 | |
Technology | | | 316,367 | | | | — | | | | — | | | | 316,367 | |
Utilities | | | 73,673 | | | | — | | | | — | | | | 73,673 | |
| | | | | | | | | | | | | | | | |
Total Common Stocks | | | 3,189,970 | | | | — | | | | 28,425 | | | | 3,218,395 | |
| | | | | | | | | | | | | | | | |
Corporate Bonds | | | — | | | | 13,000 | | | | — | | | | 13,000 | |
Investment Companies | | | | | | | | | | | | | | | | |
Financials | | | 78,413 | | | | — | | | | — | | | | 78,413 | |
Short-Term Investments | | | 408,112 | | | | — | | | | — | | | | 408,112 | |
| | | | | | | | | | | | | | | | |
Total Investments in Securities | | $ | 3,676,495 | | | $ | 13,000 | | | $ | 28,425 | | | $ | 3,717,920 | |
| | | | | | | | | | | | | | | | |
| | | | |
U.S. Value Fund | | | | | | | | | | | | | | | | |
Common Stocks | | | | | | | | | | | | | | | | |
Communication Services | | $ | 385,371 | | | $ | — | | | $ | — | | | $ | 385,371 | |
Consumer Discretionary | | | 220,423 | | | | — | | | | — | | | | 220,423 | |
Consumer Staples | | | 98,131 | | | | — | | | | — | | | | 98,131 | |
Energy | | | 417,021 | | | | — | | | | — | | | | 417,021 | |
Financials | | | 1,296,927 | | | | — | | | | — | | | | 1,296,927 | |
Health Care | | | 1,038,221 | | | | — | | | | — | | | | 1,038,221 | |
Industrials | | | 592,584 | | | | — | | | | — | | | | 592,584 | |
Materials | | | 143,809 | | | | — | | | | — | | | | 143,809 | |
Technology | | | 751,274 | | | | — | | | | — | | | | 751,274 | |
Utilities | | | 37,643 | | | | — | | | | — | | | | 37,643 | |
| | | | | | | | | | | | | | | | |
Total Common Stocks | | | 4,981,404 | | | | — | | | | — | | | | 4,981,404 | |
| | | | | | | | | | | | | | | | |
Short-Term Investments | | | 106,638 | | | | — | | | | — | | | | 106,638 | |
| | | | | | | | | | | | | | | | |
Total Investments in Securities | | $ | 5,088,042 | | | $ | — | | | $ | — | | | $ | 5,088,042 | |
| | | | | | | | | | | | | | | | |
119
Brandes Investment Trust
NOTES TO FINANCIAL STATEMENTS — (continued)
| | | | | | | | | | | | | | | | |
Description | | Level 1 | | | Level 2 | | | Level 3 | | | Total | |
Core Plus Fund | | | | | | | | | | | | | | | | |
Common Stocks | | | | | | | | | | | | | | | | |
Consumer Discretionary | | $ | 530 | | | $ | — | | | $ | — | | | $ | 530 | |
Asset Backed Securities | | | — | | | | 1,209,490 | | | | — | | | | 1,209,490 | |
Corporate Bonds | | | — | | | | 24,487,362 | | | | — | | | | 24,487,362 | |
Government Securities | | | — | | | | 37,027,455 | | | | — | | | | 37,027,455 | |
Convertible Bonds | | | | | | | | | | | | | | | | |
Technology | | | — | | | | 1,100,142 | | | | — | | | | 1,100,142 | |
Foreign Issuer Bonds | | | | | | | | | | | | | | | | |
Materials | | | — | | | | 251,250 | | | | — | | | | 251,250 | |
Telecommunications | | | — | | | | 195,000 | | | | — | | | | 195,000 | |
| | | | | | | | | | | | | | | | |
Total Foreign Issuer Bonds | | | — | | | | 446,250 | | | | — | | | | 446,250 | |
| | | | | | | | | | | | | | | | |
Mortgage Backed Securities | | | — | | | | 3,446,944 | | | | — | | | | 3,446,944 | |
Short-Term Investments | | | 846,688 | | | | — | | | | — | | | | 846,688 | |
| | | | | | | | | | | | | | | | |
Total Investments in Securities | | $ | 847,218 | | | $ | 67,717,643 | | | $ | — | | | $ | 68,564,861 | |
| | | | | | | | | | | | | | | | |
There were no Level 3 securities in the Global, International Small Cap, U.S. Value and Core Plus Funds at the beginning or during the periods presented. Management has determined that the amounts of Level 3 securities in the Small Cap Value and International Funds compared to the total net assets are not material; therefore, the reconciliation of Level 3 securities and assumptions are not shown for the period ended March 31, 2022.
The following is a reconciliation of investments in which significant unobservable inputs (Level 3) were used in determining fair value in the Emerging Markets Value Fund:
| | | | | | | | | | | | | | | | | | |
| | | Balance
As Of
9/30/21 | | Realized
Gain
(Loss)
(000s) | | Change In
Unrealized
Appreciation
(Depreciation)
(000s) | | Purchases
(000s) | | Sales
(000s) | | Transfers
Into
Level 3
(000s) | | Transfers
Out Of
Level 3
(000s) | | Balance
As Of
3/31/22 | | Change In
Unrealized
Appreciation
(Depreciation)
(000s) |
Common Stocks Russia | | $— | | $— | | $— | | $— | | $— | | $18,894,975 | | $— | | $18,894,975 | | $— |
| | | | | | | | | | | | | | | | | | |
Total | | $— | | $— | | $— | | $— | | $— | | $18,894,975 | | $— | | $18,894,975 | | $— |
| | | | | | | | | | | | | | | | | | |
The Emerging Market Value fund held five level 3 securities with a fair value of $18,894,975 at 3/31/2022. The valuation technique used for four of the securities was the last observable price of similar securities and the unobservable inputs used were the price movements of other financial instruments. The valuation technique used for one of the securities was an estimate of fair value determined by management.
NOTE 3 – INVESTMENT ADVISORY FEE AND OTHER TRANSACTIONS WITH AFFILIATES
| | A. | Advisor Fee. The Advisor provides the Funds with investment management services under an Investment Advisory Agreement. The Advisor furnishes all |
120
Brandes Investment Trust
NOTES TO FINANCIAL STATEMENTS — (continued)
investment advice, office space and certain administrative services, and provides certain personnel, needed by the Funds. As compensation for its services, the Advisor is entitled to a monthly fee. The Advisor received a monthly fee at the annual rate of 0.75% of the first $2.5 billion of average daily net assets, 0.70% on average daily net assets from $2.5 billion to $5.0 billion, and 0.67% of the average daily net assets greater than $5.0 billion, of the International Fund. The Advisor received a monthly fee at the annual rate of 0.95% of the first $2.5 billion of average daily net assets, 0.90% on average daily net assets from $2.5 billion to $5.0 billion, and 0.85% of the amount of average daily net assets greater than $5.0 billion, of the Emerging Markets Fund. The Advisor received a monthly fee at the annual rate of 0.95% of the first $1.0 billion of average daily net assets, and 0.90% of the average daily net assets greater than $1.0 billion, of the International Small Cap Fund. The Global Fund, Small Cap Value Fund, U.S. Value Fund, and Core Plus Fund incurred a monthly fee at the annual rate of 0.80%, 0.70%, 0.55%, and 0.35% based upon their average daily net assets, respectively. The Advisor has contractually agreed to limit the Management Fee of each share class of the Core Plus Fund to 0.30% pursuant to an Investment Advisory Fee Waiver Agreement in effect until January 28, 2023. For the six months ended March 31, 2022, the International Fund, the Global Fund, the Emerging Markets Fund, the International Small Cap Fund, the Small Cap Value Fund, the U.S. Value Fund and the Core Plus Fund incurred $2,489,665, $193,838, $5,824,500, $1,768,638, $10,289, $4,353, and $134,302 in advisory fees, respectively.
Certain officers and trustees of the Trust are also officers of the Advisor and receive no compensation directly from the Funds for serving in their role.
The Funds are responsible for their own operating expenses. The Advisor contractually agreed to limit each Fund’s annual operating expenses, including repayment of previous waivers, to the following percentages of the Fund’s average daily net assets attributable to the specific classes through January 28, 2023 (the “Expense Cap Agreement”):
| | | | | | | | | | | | | | | | |
Fund | | Class A | | | Class C | | | Class I | | | Class R6 | |
International Fund | | | 1.20% | | | | 1.95% | | | | 0.85% | | | | 0.75% | |
Global Fund | | | 1.25% | | | | 2.00% | | | | 1.00% | | | | 0.82% | R |
Emerging Markets Fund | | | 1.37% | | | | 2.12% | | | | 1.12% | | | | 0.97% | |
International Small Cap Fund | | | 1.40% | | | | 2.15% | | | | 1.15% | | | | 1.00% | |
Small Cap Value Fund | | | 1.15% | | | | N/A | | | | 0.90% | | | | 0.72% | |
U.S. Value Fund | | | 0.95% | | | | N/A | | | | 0.70% | | | | 0.60% | |
Core Plus Fund | | | 0.50% | | | | N/A | | | | 0.30% | | | | 0.30% | |
| | | | |
R This class is not active. | | | | | | | | | | | | | | | | |
121
Brandes Investment Trust
NOTES TO FINANCIAL STATEMENTS — (continued)
The Funds may incur additional expenses not covered under the Expense Cap Agreement. These expenses include acquired fund fees and expenses, taxes, interest, broker commissions, and proxy expenses or other extraordinary expenses.
Any reimbursements of fee waivers made by the Advisor to a Fund are subject to repayment by the Fund, to the extent that the Fund is able to make the repayment within the expense limit specified in its Expense Cap Agreement. Under the Expense Cap Agreement that was in place during the period covered by this report, any such repayment must be made before the end of the thirty-six months after the month in which the related reimbursement or waiver occurred. The Trust has agreed to repay the expense reimbursement to the Advisor. However, the repayment of previously waived expenses is limited to amounts that do not cause the aggregate operating expenses of the Fund to exceed the current expense cap or the expense cap in place at the time the waiver was generated. For the six months ended March 31, 2022, the Advisor waived expenses and/or reimbursed the Funds $201,868, $45,819, $39,535, $6,384, $61,320, $45,211, and $111,043 for the International Fund, Global Fund, Emerging Markets Fund, International Small Cap Fund, Small Cap Value Fund, U.S. Value Fund and Core Plus Fund, respectively. Repayment rights expire as follows:
| | | | | | | | | | | | | | | | | | | | | | | | | | | | | | | | | | | | | | | | | | | | | | | | | | | | | | | | | | | | |
Fund | | Six Months
Ended
September 30,
2022 | | Year Ended
September 30,
2023 | | Year Ended
September 30,
2024 | | Six Months
Ended
March 31,
2025 |
International Fund | | | | | | | | | 174,544 | | | | | | | | | | | | | | $ | 480,294 | | | | | | | | | | | | | | $ | 311,474 | | | | | | | | | | | | | | $ | 201,868 | | | | | | |
Global Fund | | | | | | | | | 87,403 | | | | | | | | | | | | | | | 112,977 | | | | | | | | | | | | | | | 78,902 | | | | | | | | | | | | | | | 45,819 | | | | | | |
Emerging Markets Fund | | | | | | | | | 123,926 | | | | | | | | | | | | | | | 310,558 | | | | | | | | | | | | | | | 56,334 | | | | | | | | | | | | | | | 39,532 | | | | | | |
International Small Cap Fund | | | | | | | | | 30,144 | | | | | | | | | | | | | | | 24,612 | | | | | | | | | | | | | | | 8,859 | | | | | | | | | | | | | | | 6,384 | | | | | | |
Small Cap Value Fund | | | | | | | | | 96,383 | | | | | | | | | | | | | | | 148,291 | | | | | | | | | | | | | | | 100,743 | | | | | | | | | | | | | | | 61,320 | | | | | | |
U.S. Value Fund | | | | | | | | | — | | | | | | | | | | | | | | | — | | | | | | | | | | | | | | | — | | | | | | | | | | | | | | | 45,211 | | | | | | |
Core Plus Fund | | | | | | | | | 92,267 | | | | | | | | | | | | | | | 138,161 | | | | | | | | | | | | | | | 216,372 | | | | | | | | | | | | | | | 111,043 | | | | | | |
The Advisor did not recoup any fees previously waived or reimbursed for the International Fund, Global Fund, International Small Cap Fund, Small Cap Value Fund, U.S. Value Fund and Core Plus Fund. For the six months ended March 31, 2022, the Advisor recouped fees previously waived or reimbursed in the following amounts:
| | | | |
Fund | | Class I | |
Emerging Markets Fund | | $ | 36,235 | |
| | B. | Administration Fee. The Northern Trust Company (the “Administrator”) acts as administrator for the Funds. The Administrator prepares various federal and state regulatory filings; prepares reports and materials to be supplied to the Trustees; monitors the activities of the Funds’ custodian, transfer agent and accountant; coordinates the preparation and payment of Fund expenses; |
122
Brandes Investment Trust
NOTES TO FINANCIAL STATEMENTS — (continued)
and reviews the Funds’ expense accruals. For these services, each Fund pays the administrator monthly a fee accrued daily and based on the Fund’s average daily net assets. The Funds may also reimburse the Administrator for out-of-pocket expenses incurred by the Administrator in the performance of its duties. The amounts paid directly to the Administrator by the Funds for administrative services are included in the Administration fees in the Statements of Operations.
The Administrator waived a portion of their administration and custody fees for the Funds from February 1, 2020 through January 31, 2022. The amounts waived are included in Receivable from Service Providers in the Statements of Assets and Liabilities and Expenses reduced by Service Providers in the Statements of Operations. These amounts are not subject to recoupment.
| | C. | Distribution and Servicing Fees. ALPS Distributors, Inc. (the “Distributor”), a registered broker-dealer, acts as the Funds’ principal underwriter in a continuous public offering of the Funds’ shares. A portion of the Funds’ distribution expenses is paid by the Advisor. |
The Funds have adopted a Distribution Plan (the “Plan”) pursuant to Rule 12b-1 under the 1940 Act for the Funds’ Class A and C shares. The Plan is designed to reimburse the Distributor or dealers for certain promotional and other sales related costs associated with sales of such Fund shares. Unreimbursed amounts may be carried forward and paid in a subsequent year, to the extent that total expenses under the Plan do not exceed 0.25% and 0.75% of the average daily net assets of each Fund’s Class A and C shares, respectively. During the six months ended March 31, 2022, the Funds paid to the Distributor and each dealer a monthly fee at the annual rate of 0.25% of the average daily net assets of Class A shares and 0.75% of the average daily net assets of Class C shares beneficially owned by the Distributor’s and each dealer’s existing brokerage clients. The Plan may be continued in effect from year to year if such continuance is approved annually by the Board of Trustees of the Trust, including the vote of a majority of the Independent Trustees. For the six months ended March 31, 2022, the following Funds incurred expenses pursuant to the Plan:
| | | | | | | | |
Fund | | Class A | | | Class C | |
International Fund | | $ | 49,698 | | | $ | 32,401 | |
Global Fund | | | 1,068 | | | | 3,286 | |
Emerging Markets Fund | | | 257,993 | | | | 35,237 | |
International Small Cap Fund | | | 80,812 | | | | 18,240 | |
Small Cap Value Fund | | | 871 | | | | N/A | |
U.S. Value Fund | | | 34 | | | | N/A | |
Core Plus Fund | | | 2,223 | | | | N/A | |
123
Brandes Investment Trust
NOTES TO FINANCIAL STATEMENTS — (continued)
The Funds have adopted a Shareholder Service Plan for Class C, and have authorized sub-transfer agency fee payments for Class I, to pay to securities broker-dealers, retirement plan sponsors and administrators, banks and their affiliates, and other institutions and service professionals, as shareholder servicing agents of the Funds, an annual fee for non-distribution sub-transfer agent and/or subaccounting services up to 0.25% and 0.05% of annual net assets attributable to Class C and Class I, respectively (the “Service Fees”). For the six months ended March 31, 2022, the Funds incurred the following Service Fees:
| | | | | | | | |
Fund | | Class C | | | Class I | |
International Fund | | $ | 10,800 | | | $ | 139,662 | |
Global Fund | | | 1,095 | | | | 11,683 | |
Emerging Markets Fund | | | 11,746 | | | | 236,084 | |
International Small Cap Fund | | | 6,080 | | | | 72,448 | |
Small Cap Value Fund | | | N/A | | | | 561 | |
U.S. Value Fund. | | | N/A | | | | 236 | |
Core Plus Fund | | | N/A | | | | 18,742 | |
NOTE 4 – PURCHASES AND SALES OF SECURITIES
The cost of purchases and the proceeds from sales of securities, excluding short term investments, were as follows for the six months ended March 31, 2022:
| | | | | | | | | | | | | | | | |
| | | U.S. Government | | | Other | |
Fund | | Purchases | | | Sales | | | Purchases | | | Sales | |
International Fund | | $ | — | | | $ | — | | | $ | 100,171,803 | | | $ | 70,535,982 | |
Global Fund | | $ | — | | | $ | — | | | $ | 3,521,155 | | | $ | 3,434,522 | |
Emerging Markets Fund | | $ | — | | | $ | — | | | $ | 167,600,153 | | | $ | 241,475,372 | |
International Small Cap Fund | | $ | — | | | $ | — | | | $ | 67,712,766 | | | $ | 77,667,829 | |
Small Cap Value Fund | | $ | — | | | $ | — | | | $ | 2,615,088 | | | $ | 1,274,536 | |
U.S. Value Fund | | $ | — | | | $ | — | | | $ | 5,224,062 | | | $ | 129,829 | |
Core Plus Fund. | | $ | 1,438,435 | | | $ | 6,163,389 | | | $ | 5,021,090 | | | $ | 4,702,017 | |
124
Brandes Investment Trust
NOTES TO FINANCIAL STATEMENTS — (continued)
NOTE 5 – CAPITAL STOCK TRANSACTIONS
Capital stock activity for each class of shares was as follows (shares and dollar amounts in thousands):
| | | | | | | | | | | | | | | | | | | | | | | | | | | | | | | | |
| | | International Fund | | Global Fund |
| | | | | | | | | | | | | | | | | | |
| | | Six Months
Ended
3/31/2022 | | Year Ended
9/30/2021 | | Six Months
Ended
3/31/2022 | | Year Ended
9/30/2021 |
| | | Shares | | Amount | | Shares | | Amount | | | Shares | | Amount | | Shares | | Amount |
Shares Sold | | | | | | | | | | | | | | | | | | | | | | | | | | | | | | | | |
Class A | | | 803 | | | $ | 14,155 | | | | 999 | | | $ | 18,421 | | | | 3 | | | $ | 71 | | | | 8 | | | $ | 215 | |
Class C | | | 23 | | | | 415 | | | | 56 | | | | 969 | | | | N/A | | | | N/A | | | | — | | | | — | |
Class I | | | 4,076 | | | | 73,962 | | | | 8,627 | | | | 149,853 | | | | 85 | | | | 2,308 | | | | 353 | | | | 8,948 | |
Class R6 | | | 376 | | | | 6,807 | | | | 683 | | | | 12,207 | | | | N/A | | | | N/A | | | | N/A | | | | N/A | |
Issued on Reinvestment of Distributions | | | | | | | | | | | | | | | | | | | | | | | | | | | | | | | | |
Class A | | | 36 | | | | 647 | | | | 46 | | | | 845 | | | | 1 | | | | 37 | | | | 1 | | | | 24 | |
Class C | | | 6 | | | | 104 | | | | 11 | | | | 202 | | | | 1 | | | | 36 | | | | 1 | | | | 25 | |
Class I | | | 437 | | | | 7,840 | | | | 771 | | | | 14,118 | | | | 76 | | | | 1,997 | | | | 55 | | | | 1,397 | |
Class R6 | | | 42 | | | | 760 | | | | 86 | | | | 1,577 | | | | N/A | | | | N/A | | | | N/A | | | | N/A | |
Shares Redeemed | | | | | | | | | | | | | | | | | | | | | | | | | | | | | | | | |
Class A | | | (290 | ) | | | (5,135 | ) | | | (569 | ) | | | (10,133 | ) | | | (1 | ) | | | (32 | ) | | | (25 | ) | | | (541 | ) |
Class C | | | (39 | ) | | | (699 | ) | | | (142 | ) | | | (2,439 | ) | | | (4 | ) | | | (106 | ) | | | (4 | ) | | | (97 | ) |
Class I | | | (2,857 | ) | | | (51,565 | ) | | | (8,682) | | | | (144,853 | ) | | | (120 | ) | | | (3,182 | ) | | | (177 | ) | | | (4,069 | ) |
Class R6 | | | (622 | ) | | | (11,258 | ) | | | (1,060 | ) | | | (18,179 | ) | | | N/A | | | | N/A | | | | N/A | | | | N/A | |
| | | | | | | | | | | | | | | | | | | | | | | | | | | | | | | | |
Net Increase/(Decrease) Resulting from Fund Share Transactions | | | 1,991 | | | $ | 36,033 | | | | 826 | | | $ | 22,588 | | | | 41 | | | $ | 1,129 | | | | 212 | | | $ | 5,902 | |
| | | | | | | | | | | | | | | | | | | | | | | | | | | | | | | | |
125
Brandes Investment Trust
NOTES TO FINANCIAL STATEMENTS — (continued)
| | | | | | | | | | | | | | | | | | | | | | | | | | | | | | | | |
| | | Emerging Markets Fund | | | International Small Cap Fund | |
| | | Six Months
Ended
3/31/2022 | | | Year Ended
9/30/2021 | | | Six Months
Ended
3/31/2022 | | | Year Ended
9/30/2021 | |
| | | Shares | | | Amount | | | Shares | | | Amount | | | Shares | | | Amount | | | Shares | | | Amount | |
Shares Sold | | | | | | | | | | | | | | | | | | | | | | | | | | | | | | | | |
Class A | | | 1,449 | | | $ | 11,993 | | | | 2,366 | | | $ | 20,691 | | | | 133 | | | $ | 1,776 | | | | 1,960 | | | $ | 19,289 | |
Class C | | | 40 | | | | 336 | | | | 140 | | | | 1,239 | | | | 2 | | | | 33 | | | | 22 | | | | 277 | |
Class I | | | 20,095 | | | | 163,182 | | | | 35,019 | | | | 305,038 | | | | 1,846 | | | | 24,226 | | | | 3,659 | | | | 45,709 | |
Class R6 | | | 912 | | | | 7,818 | | | | 4,660 | | | | 35,820 | | | | 85 | | | | 1,145 | | | | 118 | | | | 1,453 | |
Issued on Reinvestment of Distributions | | | | | | | | | | | | | | | | | | | | | | | | | | | | | | | | |
Class A | | | 100 | | | | 817 | | | | 267 | | | | 2,361 | | | | 218 | | | | 2,749 | | | | 58 | | | | 771 | |
Class C | | | 16 | | | | 128 | | | | 15 | | | | 131 | | | | 16 | | | | 192 | | | | 6 | | | | 75 | |
Class I | | | 1,812 | | | | 14,815 | | | | 1,373 | | | | 12,238 | | | | 972 | | | | 12,307 | | | | 286 | | | | 3,778 | |
Class R6 | | | 70 | | | | 580 | | | | 51 | | | | 465 | | | | 45 | | | | 579 | | | | 12 | | | | 160 | |
Shares Redeemed | | | | | | | | | | | | | | | | | | | | | | | | | | | | | | | | |
Class A | | | (3,087 | ) | | | (24,670 | ) | | | (2,410 | ) | | | (20,925 | ) | | | (187 | ) | | | (2,477 | ) | | | (1,001 | ) | | | (12,091 | ) |
Class C | | | (210 | ) | | | (1,750 | ) | | | (541 | ) | | | (4,694 | ) | | | (31 | ) | | | (403 | ) | | | (136 | ) | | | (1,579 | ) |
Class I | | | (28,296 | ) | | | (231,670 | ) | | | (39,158 | ) | | | (332,504 | ) | | | (3,371 | ) | | | (44,728 | ) | | | (9,214 | ) | | | (114,487 | ) |
Class R6 | | | (1,150 | ) | | | (9,797 | ) | | | (2,439 | ) | | | (21,428 | ) | | | (43 | ) | | | (576 | ) | | | (290 | ) | | | (3,592 | ) |
| | | | | | | | | | | | | | | | | | | | | | | | | | | | | | | | |
Net Increase/(Decrease) Resulting from Fund Share Transactions | | | (8,249 | ) | | $ | (68,218 | ) | | | (657 | ) | | $ | (1,568 | ) | | | (315 | ) | | $ | (5,177 | ) | | | (4,520 | ) | | $ | (60,237 | ) |
| | | | | | | | | | | | | | | | | | | | | | | | | | | | | | | | |
| | | | | | | | | | | | | | | | | | | | | | | | |
| | | Small Cap Value Fund | | U.S. Value Fund |
| | | Six Months
Ended
3/31/2022 | | Year Ended
9/30/2021 | | Since Inception
3/31/2022 |
| | | Shares | | Amount | | Shares | | Amount | | Shares | | Amount |
Shares Sold | | | | | | | | | | | | | | | | | | | | | | | | |
Class A | | | 72 | | | $ | 949 | | | | 66 | | | $ | 843 | | | | 10 | | | $ | 108 | |
Class C | | | N/A | | | | N/A | | | | N/A | | | | N/A | | | | N/A | | | | N/A | |
Class I | | | 152 | | | | 2,008 | | | | 107 | | | | 1,225 | | | | 484 | | | | 5,213 | |
Class R6 | | | N/A | | | | N/A | | | | — | | | | — | | | | — | R | | | — | R |
Issued on Reinvestment of Distributions | | | | | | | | | | | | | | | | | | | | | | | | |
Class A | | | 3 | | | | 37 | | | | — | R | | | 2 | | | | — | | | | — | |
Class C | | | N/A | | | | N/A | | | | N/A | | | | N/A | | | | N/A | | | | N/A | |
Class I | | | 9 | | | | 123 | | | | 2 | | | | 19 | | | | 1 | | | | 10 | |
Class R6 | | | — | R | | | — | R | | | — | R | | | — | R | | | N/A | | | | N/A | |
Shares Redeemed | | | | | | | | | | | | | | | | | | | | | | | | |
Class A | | | (44) | | | | (579) | | | | (31) | | | | (402) | | | | N/A | | | | N/A | |
Class C | | | N/A | | | | N/A | | | | N/A | | | | N/A | | | | N/A | | | | N/A | |
Class I | | | (63) | | | | (829) | | | | (47) | | | | (615) | | | | (13) | | | | (138) | |
Class R6 | | | N/A | | | | N/A | | | | — | | | | N/A | | | | N/A | | | | N/A | |
| | | | | | | | | | | | | | | | | | | | | | | | |
Net Increase/(Decrease) Resulting from Fund Share Transactions | | | 129 | | | $ | 1,709 | | | | 97 | | | $ | 1,072 | | | | 482 | | | $ | 5,193 | |
| | | | | | | | | | | | | | | | | | | | | | | | |
| R | Value calculated is less than 500 shares/dollars. |
126
Brandes Investment Trust
NOTES TO FINANCIAL STATEMENTS — (continued)
| | | | | | | | | | | | | | | | |
| | | Core Plus Fund | |
| | | Six Months
Ended
3/31/2022 | | | Year Ended
9/30/2021 | |
| | | Shares | | | Amount | | | Shares | | | Amount | |
Shares Sold | | | | | | | | | | | | | | | | |
Class A | | | 201 | | | $ | 1,870 | | | | 50 | | | $ | 473 | |
Class C | | | N/A | | | | N/A | | | | N/A | | | | N/A | |
Class I | | | 561 | | | | 5,184 | | | | 1,990 | | | | 18,913 | |
Class R6 | | | N/A | | | | N/A | | | | — | | | | — | |
Issued on Reinvestment of Distributions | | | | | | | | | | | | | | | | |
Class A | | | 2 | | | | 18 | | | | 2 | | | | 24 | |
Class C | | | N/A | | | | N/A | | | | N/A | | | | N/A | |
Class I | | | 94 | | | | 861 | | | | 221 | | | | 2,097 | |
Class R6 | | | — | R | | | — | R | | | — | | | | — | |
Shares Redeemed | | | | | | | | | | | | | | | | |
Class A | | | (217 | ) | | | (1,945 | ) | | | (75 | ) | | | (707 | ) |
Class C | | | N/A | | | | N/A | | | | N/A | | | | N/A | |
Class I | | | (1,222 | ) | | | (11,173 | ) | | | (2,840 | ) | | | (27,067 | ) |
Class R6 | | | N/A | | | | N/A | | | | — | | | | — | |
| | | | | | | | | | | | | | | | |
Net Increase/(Decrease) Resulting from Fund Share Transactions | | | (581 | ) | | $ | (5,185 | ) | | | (652 | ) | | $ | (6,267 | ) |
| | | | | | | | | | | | | | | | |
| R | Value calculated is less than 500 shares/dollars. |
NOTE 6 – FEDERAL INCOME TAX MATTERS
The Funds may be subject to taxes imposed by countries in which they invest. Such taxes are generally based on income and/or capital gains earned. Taxes are accrued based on net investment income, net realized gains and net unrealized appreciation as such income and/or gains are recorded. Taxes accrued on unrealized gains are reflected as a liability on the Statements of Assets and Liabilities under the caption “Foreign capital gains taxes”. When assets subject to capital gains tax are sold, accrued taxes are relieved, and the actual amount of the taxes paid is reflected on the Statements of Operations as a reduction in “Net realized gain (loss) on Investments”.
GAAP requires that certain components of net assets be reclassified between financial and tax reporting. Temporary differences do not require reclassification. Temporary and permanent differences have no effect on net assets or net asset value per share. For the year ended September 30, 2021, the Funds made the following permanent book-to-tax reclassifications primarily related to the treatment of foreign currency transactions, passive foreign investment companies, paydowns and difference between book and tax accretion methods for market premium:
127
Brandes Investment Trust
NOTES TO FINANCIAL STATEMENTS — (continued)
| | | | | | | | | | | | | | | |
| | | Undistributed Net
Investment
Income/(Loss) | | Accumulated
Net Realized
Gain/(Loss) | | Paid-In Capital |
International Fund | | | $ | 1,619,073 | | | | $ | (1,619,073 | ) | | | $ | — | |
Global Fund | | | | 98,676 | | | | | (98,676 | ) | | | | — | |
Emerging Markets Fund | | | | (793,696 | ) | | | | 793,696 | | | | | — | |
International Small Cap Fund | | | | 1,238,184 | | | | | (1,238,184 | ) | | | | — | |
Small Cap Value Fund | | | | 4,966 | | | | | (4,966 | ) | | | | — | |
Core Plus Fund | | | | 60,371 | | | | | (60,371 | ) | | | | — | |
As of September 30, 2021, the components of distributable earnings on a tax basis were as follows:
| | | | | | | | |
| | | International
Fund | | Global
Fund | |
Cost of investments for tax purposes | | $ | 687,960,693 | | | $ | 39,206,864 | |
| | | | | | | | |
Gross tax unrealized appreciation | | | 47,867,900 | | | | 10,620,182 | |
Gross tax unrealized depreciation | | | (75,102,980 | ) | | | (2,392,642 | ) |
| | | | | | | | |
Net unrealized appreciation (depreciation) on investments and foreign currency | | | (27,235,080 | ) | | | 8,227,540 | |
Distributable ordinary income | | | 5,338,597 | | | | 182,345 | |
Distributable long-term capital gains | | | — | | | | 1,291,555 | |
| | | | | | | | |
Total distributable earnings | | | 5,338,597 | | | | 1,473,900 | |
| | | | | | | | |
Other accumulated gains/(losses) | | | (71,795,262 | ) | | | (4,762 | ) |
| | | | | | | | |
Total accumulated earnings | | $ | (93,691,745 | ) | | $ | 9,696,678 | |
| | | | | | | | |
| | | | | | | | | | | | | | | | |
| | | Emerging
Markets
Fund | | | International
Small Cap
Fund | | | Small Cap
Value Fund | | | Core
Plus Fund | |
Cost of investments for tax purposes | | $ | 1,412,662,985 | | | $ | 392,979,822 | | | $ | 1,943,053 | | | $ | 77,741,555 | |
| | | | | | | | | | | | | | | | |
Gross tax unrealized appreciation | | | 164,531,478 | | | | 62,884,369 | | | | 273,490 | | | | 3,814,971 | |
Gross tax unrealized depreciation | | | (283,453,373 | ) | | | (52,768,497 | ) | | | (43,506 | ) | | | (531,015 | ) |
| | | | | | | | | | | | | | | | |
Net unrealized appreciation (depreciation) on investments and foreign currency | | | (118,921,895 | ) | | | 10,115,872 | | | | 229,984 | | | | 3,283,956 | |
Distributable ordinary income | | | 6,582,944 | | | | 9,032,331 | | | | 83,623 | | | | 1,631 | |
Distributable long-term capital gains | | | — | | | | — | | | | — | | | | — | |
| | | | | | | | | | | | | | | | |
Total distributable earnings | | | 6,582,944 | | | | 9,032,331 | | | | 83,623 | | | | 1,631 | |
| | | | | | | | | | | | | | | | |
Other accumulated gains/(losses) | | | (123,551,549 | ) | | | (145,578,039 | ) | | | (3,667 | ) | | | (1,510,343 | ) |
| | | | | | | | | | | | | | | | |
Total accumulated earnings | | $ | (235,890,500 | ) | | $ | (126,429,836 | ) | | $ | 309,940 | | | $ | 1,775,244 | |
| | | | | | | | | | | | | | | | |
The differences between book and tax basis distributable earnings are primarily related to foreign currency adjustments and the differences in classification of paydown gains and losses for tax purposes compared to book purposes. These differences are permanent.
128
Brandes Investment Trust
NOTES TO FINANCIAL STATEMENTS — (continued)
The tax composition of dividends for the years ended September 30, 2021 and September 30, 2020 for the Funds, were as follows:
| | | | | | | | | | | | | | | | |
| | | Ordinary Income | | | Long Term
Capital Gains |
| | | 2021 | | | 2020 | | | 2021 | | 2020 |
International Fund. | | $ | 17,261,308 | | | $ | 15,302,823 | | | | $— | | | | $— | |
Global Fund | | | 1,457,678 | | | | 677,847 | | | | — | | | | — | |
Emerging Markets Fund | | | 16,134,333 | | | | 28,580,390 | | | | — | | | | — | |
International Small Cap Fund | | | 4,802,418 | | | | 2,950,375 | | | | — | | | | — | |
Small Cap Value Fund | | | 20,695 | | | | 2,844 | | | | — | | | | — | |
Core Plus Fund | | | 2,168,060 | | | | 1,949,433 | | | | — | | | | — | |
At September 30, 2021 the Funds had capital loss carryforwards and capital loss carryforwards utilized as indicated below:
| | | | | | | | |
| | | Indefinite | | | Utilized | |
International Fund | | $ | (71,795,262 | ) | | $ | — | |
Global Fund | | | — | | | | — | |
Emerging Markets Fund | | | (123,485,638 | ) | | | (4,436,548 | ) |
International Small Cap Fund | | | (145,556,440 | ) | | | (21,014,866 | ) |
Small Cap Value Fund | | | — | | | | (162,620 | ) |
Core Plus Fund | | | (1,510,343 | ) | | | (2,164,217 | ) |
NOTE 7 – OFFERING PRICE PER SHARE
The public offering price for Class A shares is the net asset value per share plus a sales charge, which varies in accordance with the amount of the purchase up to a maximum of 5.75% for the International, Global, Emerging Markets, International Small Cap, Small Cap Value, and U.S. Value Funds, and 3.75% for the Core Plus Fund. A contingent deferred sales charge (“CDSC”) of 1.00% will be deducted with respect to Class A shares purchased without a sales load and redeemed within 12 months of purchase, unless waived, as discussed in the Prospectus. Any applicable CDSC will be 1.00% of the lesser of the original purchase price or the redemption value of the Class A shares redeemed. Class C shares include a 1.00% CDSC paid by redeeming shareholders within 12 months of purchase. As a result the redemption price may differ from the net asset value per share. The public offering prices for I shares are the respective net asset values. Sales charges are not an expense of the Funds and are not reflected in the financial statements of the Funds.
129
Brandes Investment Trust
NOTES TO FINANCIAL STATEMENTS — (continued)
NOTE 8 – TRANSACTIONS WITH AFFILIATES
The following issuers were affiliated with the International Small Cap Fund as defined in Section (2)(a)(3) of the 1940 Act, as these Funds held 5% or more of the outstanding voting securities of the following issuers during the six months from October 1, 2021 through March 31, 2022:
International Small Cap Fund
| | | | | | | | | | | | | | | | |
Issuer Name | | Value At
October 1,
2021 | | | Purchases | | Sales Proceeds | | Realized
Gain/(Loss) | | Unrealized
Appreciation/
(Depreciation) | | Value At
March 31,
2022 | | Dividend
Income |
Desarrolladora Homex SAB de CV | | $ | 934,314 | | | $— | | $— | | $— | | $(330,061) | | $604,253 | | $— |
Urbi Desarrollos Urbanos SAB de CV | | | 361,606 | | | — | | — | | — | | (88,370) | | 273,236 | | — |
| | | | | | | | | | | | | | | | |
| | $ | 1,295,920 | | | $— | | $— | | $— | | $(418,431) | | $877,489 | | $— |
| | | | | | | | | | | | | | | | |
NOTE 9 – OWNERSHIP BY AFFILIATED PARTIES
As of March 31, 2022, the Advisor, Trustees or affiliates of the Advisor beneficially owned more than 5% of shares in each class of the Funds as follows:
| | | | |
| | | Global
Fund | |
| | | Class I | |
Shares | | | 347,704 | |
% of Total Outstanding Shares | | | 20.00% | |
| | | | | | | | | | | | |
| | | Small Cap
Value Fund | | U.S. Value
Fund | | Core
Plus Fund |
| | | Class I | | Class R6 | | Class I | | Class R6 | | Class I | | Class R6 |
Shares | | 48,978 | | 13 | | 40,298 | | 10 | | 2,219,857 | | 11 |
% of Total Outstanding Shares | | 22.33% | | 100.00% | | 8.55% | | 100.00% | | 28.76% | | 100.00% |
NOTE 10 – RISK FACTORS
The respiratory illness COVID-19 caused by a novel coronavirus has resulted in a global pandemic and caused major disruptions to economies and markets around the world, including the United States. Financial markets have experienced and may continue to experience extreme volatility and severe losses, and trading in many instruments was and may continue to be disrupted as a result. Liquidity for many instruments was and may continue to be greatly reduced for extended periods of time. Some interest rates are very low and in some cases yields are negative. Some sectors of the economy and individual issuers have experienced and may continue to experience particularly large losses. These circumstances may continue for an extended period of time, and may continue to affect adversely the value and liquidity of the fund’s investments. The ultimate economic fallout from the pandemic, and the long-term impact on economies, markets, industries and individual issuers, are not known. Governments and central banks, including the Federal Reserve in the U.S., have taken extraordinary and unprecedented actions to support local and global economies and the
130
Brandes Investment Trust
NOTES TO FINANCIAL STATEMENTS — (continued)
financial markets. These actions have resulted in significant expansion of public debt, including in the United States. The long-term consequences of this level of public debt are not known. In addition, certain interest rates have been reduced to very low levels. The impact of these measures, and whether they will be effective to mitigate the economic and market disruption, will not be known for some time.
Recent events relating to the armed conflict in Ukraine and the global economic sanctions that have resulted may adversely impact global economic and market activity, and contribute to significant volatility in financial markets. The impact of the conflict has been rapidly evolving, and the ultimate economic fallout and long-term impact on economies, markets, industries and individual companies, are not known.
NOTE 11 – SUBSEQUENT EVENTS
In preparing these financial statements, the Trust has evaluated events and transactions for potential recognition or disclosure through the date the financial statements were available to be issued. The Trust has concluded that there are no subsequent events to note.
131
Brandes Investment Trust
ADDITIONAL INFORMATION — (Unaudited)
BOARD CONSIDERATIONS AND CONTINUATION OF INVESTMENT ADVISORY AGREEMENT
In November, 2021, the Board of Trustees of Brandes Investment Trust (“Trust”), including the independent Trustees, unanimously approved renewal of the Investment Advisory Agreement (“Agreement”) between the Trust and Brandes Investment Partners, L.P. (“Adviser”) for an additional one-year term with respect to the following series of the Trust (each, a “Fund”): Brandes Emerging Markets Value Fund, Brandes International Equity Fund, Brandes International Small Cap Equity Fund, Brandes Global Equity Fund, Brandes Small Cap Value Fund and Brandes Core Plus Fixed Income Fund.
Information Reviewed
During the course of each year, the Board receives and reviews a wide variety of materials relating to the nature, quality and extent of the services provided by the Adviser to the Funds, including reports on each Fund’s investment results, portfolio composition, portfolio trading practices, and other matters. In addition, in connection with the Board’s annual review of the Agreement, the Trustees requested and reviewed supplementary information from the Adviser that included materials and analysis about the Funds’ investment results and advisory fees; information about the services provided by the Adviser to the Funds, such as compliance monitoring and portfolio trading practices, and the risks assumed by the Adviser in connection with those services; information about the services provided and the fees charged by the Adviser to its institutional and other clients employing similar strategies, including comparisons of those services and fees to the services and fees for the Funds; financial and profitability information regarding the Adviser and its relationship with the Funds; and information about the Adviser’s investment and other personnel providing services to the Funds, as well as the Adviser’s practices to evaluate and compensate its investment personnel. The Trustees also obtained and reviewed information from FUSE Research Network LLC, an independent third party data provider, comparing the Funds’ investment results and fees and expenses to those of peer groups and categories of funds identified by FUSE as similar to the Funds.
In connection with the Board’s reviews, the Trustees received assistance and advice regarding legal and industry standards from counsel to the Trust and the independent Trustees. The Board discussed the approval of the Agreement with respect to each Fund with representatives of the Adviser at two Board meetings, and the independent Trustees discussed the Agreement in multiple private sessions with counsel at which no representatives of the Adviser were present. In deciding to approve the Agreement with respect to each Fund, the Board and the independent Trustees did not identify any single or particular piece of information that, in isolation, was the controlling factor, and each Trustee may have attributed different weight to each factor considered. This summary describes the most important, but not all, of the factors considered by the Board and the independent Trustees.
132
Brandes Investment Trust
ADDITIONAL INFORMATION — (Unaudited) (continued)
Nature, Quality and Extent of Services
The Trustees considered the overall nature, quality and extent of services provided by the Adviser to the Funds. They considered, among other things, the quality and depth of the Adviser’s investment, compliance and other personnel, the Adviser’s regulatory compliance resources and program, the Adviser’s business continuity and cyber-security programs, and the day-to-day administrative services provided to the Funds.
With respect to the Funds’ investment results, the Trustees reviewed and considered detailed information provided by FUSE, which utilized Morningstar data, comparing each Fund’s investment results to those of a peer group of similarly managed funds selected by FUSE, a larger group of funds selected by FUSE in the same investment classification as the subject fund, and the Fund’s benchmark index. The Trustees also met with representatives of FUSE, and discussed with them the methodology used by FUSE in determining the Funds’ peer groups and universes. The FUSE report included confirmation that FUSE had selected peer group and universe funds for comparison to the Funds independently of the Adviser. The Trustees noted that while the FUSE information covered both peer group and universe funds, the Trustees focused more on the peer group information because the peer group funds were more directly comparable to the Funds.
The Trustees considered that for the one-, three-, five- and ten-year periods ended September 30, 2021, as applicable, and since inception, the investment results of the Class I shares of the Funds were mixed versus the funds in their respective peer groups, as well as versus their respective benchmarks. The Trustees noted that the investment performance of the other share classes would differ, and generally be lower, as a result of the higher expenses paid by those share classes:
● Emerging Markets Value: at median for the one-year period and below median for all other periods and since inception, and outperformed the benchmark for the one-year period;
● International Equity: above median for the one-, five-, and ten-year periods and since inception, and outperformed the benchmark for the one-year period and since inception;
● International Small Cap Equity: above median for the one- and three-year periods, and outperformed the benchmark for the one-year period;
● Global Equity: above median for the one-, three- and five-year periods, and outperformed the benchmark for the one-year period;
● Small Cap Value: above median for the three-year period and since inception, and outperformed the benchmark for all periods; and
133
Brandes Investment Trust
ADDITIONAL INFORMATION — (Unaudited) (continued)
● Core Plus Fixed Income: below median for the one-, three- and five-year periods and since inception, and outperformed the benchmark for the one- and ten-year periods.
The Trustees considered, among other things, that the Small Cap Value Fund has a short operating history as a registered investment company; that the Global Equity and Small Cap Value Funds have very small assets; and that one or more Funds from time to time may hold significant cash positions, and that these positions may impact investment performance.
In evaluating the Funds’ performance, the Trustees generally considered long-term performance to be more important than short-term performance, but noted that short-term performance may be helpful in showing an improving trend. The Trustees noted the Adviser’s continued commitment to the Graham and Dodd value strategy of investment management and its lack of style drift compared to other value managers; considered that it is not unusual for the performance of funds managed with such a long-term strategy to fall below performance measurement indices for some periods; and noted the Adviser’s observations regarding the market environment in recent years, including the extended period that the value strategy has been out of favor in the market. They also noted that the Funds’ investment approach is fully described in the prospectus, enabling the Funds’ shareholders to decide if they are willing to accept the long-term outlook associated with the Adviser’s investment approach.
Based on these reviews, the Trustees determined that under all of the circumstances the nature and quality of the services provided by the Adviser were sufficient for renewal of the Funds’ investment advisory agreement.
Advisory Fees, Total Expenses, Profitability and Ancillary Benefits
With respect to advisory fees, the Trustees considered the following:
● The Funds’ contractual advisory fees are at or below the median advisory fees of the funds in their respective peer groups with the exception of the Global Equity Fund (where the advisory fee is five basis points above the median).
● The advisory fees charged by the Adviser to comparable institutional and other accounts. The Trustees considered that these fees generally are lower than the fees charged the Funds, and noted the information provided by the Adviser regarding the additional risks, responsibilities and expenses that the Adviser incurs in sponsoring and operating the Funds.
With respect to the total expenses of the Funds, the Trustees considered the following:
● Total expenses represent the amount actually paid by Fund shareholders.
● All of the Funds are subject to expense caps.
134
Brandes Investment Trust
ADDITIONAL INFORMATION — (Unaudited) (continued)
● The Funds’ actual total expenses are at or below the median total expenses of the funds in their respective peer groups with the exception of the Emerging Markets and Global Equity Funds (where the actual total expenses are four and nine basis points above the median, respectively).
The Trustees determined that the Funds’ advisory fees and total expense levels were fair and reasonable.
The Trustees considered that in the past the Adviser had agreed to add breakpoints to the fee schedules for Funds where appropriate. They considered that although the fee schedules for a number of the other Funds did not yet have breakpoints, it was premature to discuss economies of scale for those Funds when the Adviser is still subsidizing the Funds’ expenses, and that the matter could be discussed in the future as the Funds’ assets increase. The Trustees concluded that there was a reasonable sharing of any efficiencies or economies of scale at this time.
The Trustees reviewed and considered information about the Adviser’s financial capability to continue to provide services to the Funds, as well as an analysis of the profitability to the Adviser of its relationship with the Funds. The Trustees considered information regarding the ancillary benefits to the Adviser from its relationship with the Funds, which primarily related to the benefits of proprietary and third-party research provided by broker-dealers executing portfolio transactions on behalf of the Funds. The Trustees concluded that the Adviser’s profitability from its relationship with the Funds is not excessive and that any ancillary benefits received are reasonable under the circumstances.
Conclusions
Based on their review, including consideration of the factors identified above, the Board and the independent Trustees concluded in the exercise of their reasonable business judgment that the advisory fees contemplated by the Agreement are fair and reasonable to each Fund and its shareholders, and that renewal of the Agreement is in the best interests of each Fund and its shareholders.
BOARD CONSIDERATIONS AND APPROVAL OF INVESTMENT ADVISORY AGREEMENT - BRANDES U.S. VALUE FUND
In August, 2021, the Board of Trustees of Brandes Investment Trust (“Trust”), including the independent Trustees, approved an Investment Advisory Agreement (“Agreement”) between the Trust and Brandes Investment Partners, L.P. (“Advisor”) for an initial two-year term with respect to the Brandes U.S. Value Fund, a new series of the Trust (the “New Fund”).
Information Reviewed
During the course of each year, the Board receives and reviews a wide variety of materials relating to the nature, quality and extent of the services provided by the Advisor to the series of the Trust other than the Fund (collectively, the “Existing
135
Brandes Investment Trust
ADDITIONAL INFORMATION — (Unaudited) (continued)
Funds”), all of which are managed using the value style of investing to be utilized for the New Fund, including reports on each Existing Fund’s investment results, portfolio composition, portfolio trading practices, and other matters. In addition, in connection with the Board’s initial review of the Agreement, the Trustees requested and reviewed supplementary information from the Advisor that included materials and analysis about the investment results of other accounts managed by the Advisor using the strategy to be utilized for the New Fund; information about the services to be provided by the Advisor to the New Fund, such as compliance monitoring and portfolio trading practices, and the risks to be assumed by the Advisor in connection with those services; information about the services provided and the fees charged by the Advisor to its institutional and other clients employing similar strategies, including comparisons of those services and fees to the services and fees for the New Fund; financial and profitability information regarding the Advisor and its relationship with the New Fund; and information about the Advisor’s investment and other personnel providing services to the New Fund. The Trustees also obtained and reviewed information from FUSE Research Network LLC, an independent third party data provider, comparing the proposed fees and expenses for the New Fund to those of a peer group of funds identified by FUSE as similar to the New Fund. The materials and information received throughout the year were considered helpful background, contributing to the Trustees’ familiarity with the Advisor and the investment strategies and investment style to be utilized for the New Fund.
In connection with the Board’s review, the Trustees received assistance and advice regarding legal and industry standards from counsel to the Trust and the independent Trustees. The Board discussed the approval of the Agreement with respect to the New Fund with representatives of the Advisor at the Board meeting, and the independent Trustees discussed the Agreement in a private session with counsel at which no representatives of the Advisor were present. In deciding to approve the Agreement with respect to the New Fund, the Board and the independent Trustees did not identify any single or particular piece of information that, in isolation, was the controlling factor, and each Trustee may have attributed different weight to each factor considered. This summary describes the most important, but not all, of the factors considered by the Board and the independent Trustees.
Nature, Quality and Extent of Services
The Trustees considered the overall nature, quality and extent of services to be provided by the Advisor to the New Fund. They considered, among other things, the quality and depth of the Advisor’s investment, compliance and other personnel, the Advisor’s regulatory compliance resources and program, the Advisor’s business continuity and cyber-security programs, and the day-to-day administrative services to be provided to the New Fund. They noted their long familiarity with the Existing Funds, and the Advisor’s services to the Existing Funds, as well as how the New Fund would fit into the line-up of the Existing Funds.
136
Brandes Investment Trust
ADDITIONAL INFORMATION — (Unaudited) (continued)
With respect to investment results, the Trustees noted that the New Fund is newly organized and has no investment performance history at this time. The Trustees reviewed and considered information provided by the Advisor detailing the performance of other accounts managed by the Advisor using the same strategy to be utilized for the Fund. In evaluating this performance, the Trustees noted the Advisor’s continued commitment to the Graham and Dodd value strategy of investment management and its lack of style drift compared to other value managers; considered that it is not unusual for the performance of funds managed with such a long-term strategy to fall below performance measurement indices for some periods; and noted the Advisor’s observations regarding the market environment in recent years, including the extended period that the value strategy has been out of favor in the market. They also noted that the New Fund’s investment approach will be fully described in the prospectus, enabling shareholders to decide if they are willing to accept the long-term outlook associated with the Advisor’s investment approach.
Based on these reviews, the Trustees determined that the nature and quality of the services to be provided by the Advisor warrant approval of the investment advisory agreement for the New Fund.
Advisory Fees, Total Expenses, Profitability and Ancillary Benefits
With respect to advisory fees, the Trustees considered the proposed advisory fee rate payable by the New Fund. The Trustees considered information from FUSE, which utilized Morningstar data, comparing the proposed advisory fees and total expenses for the New Fund to those of a peer group of similarly managed funds selected by FUSE. The FUSE report included confirmation that FUSE had selected peer group funds for comparison to the New Fund independently of the Advisor. The Trustees determined that the New Fund’s advisory fees and total expense levels were fair and reasonable, including in relation to those of peer funds. The Trustees, noting the start-up nature of the New Fund, also concluded that they would have an opportunity in the future to consider whether there was a reasonable sharing of any efficiencies or economies of scale with respect to advisory fees.
The Trustees reviewed and considered information about the Advisor’s financial capability to provide services to the New Fund, as well as an analysis of the expected profitability to the Advisor of its relationship with the New Fund. The Trustees considered information regarding the ancillary benefits to the Advisor from its relationship with the New Fund. The Trustees concluded that the Advisor’s profitability from its relationship with the Fund is not excessive and that any ancillary benefits received are reasonable under the circumstances.
Conclusions
Based on their review, including consideration of the factors identified above, the Board and the independent Trustees concluded in the exercise of their reasonable business judgment that the Agreement is fair and reasonable to the New Fund and its
137
Brandes Investment Trust
ADDITIONAL INFORMATION — (Unaudited) (continued)
shareholders, and that approval of the Agreement is in the best interests of the New Fund and its shareholders.
PROXY VOTING PROCEDURES
The Advisor votes proxies relating to the Funds’ portfolio securities in accordance with procedures adopted by the Advisor. You may obtain a description of these procedures, free of charge, by calling toll-free 1-800-331-2979. This information is also available through the Commission’s website at http://www.sec.gov.
Information regarding how the Trust voted proxies relating to portfolio securities during the most recent 12-month period ended June 30 is available without charge, upon request, by calling 1-800-331-2979. This information is also available through the Commission’s website at http://www.sec.gov.
PORTFOLIO HOLDINGS DISCLOSURE
The Trust files the Funds’ complete schedules of portfolio holdings with the Commission for the first and third quarters of each fiscal year on Form N-PORT. The Trust’s Form N-PORT filings are available on the Commission’s website at http://www.sec.gov. Information regarding the Trust’s Form N-PORT filings is also available, without charge, by calling toll-free, 1-800-331-2979.
138
Brandes Investment Trust
TRUSTEES AND OFFICERS INFORMATION — (Unaudited)
The Board is responsible for the overall management of the Trust’s business. The Board approves all significant agreements between the Trust and persons or companies furnishing services to it, including the agreements with the Advisor, Administrator, the Trust’s Custodian, Distributor and Transfer Agent. The Board delegates the day-to-day operations of the Trust to its officers, subject to the Fund’s investment objective and policies and to general supervision by the Board. The Trust’s Statement of Additional Information includes additional information about the Trustees and is available, without charge, by calling 1-800-331-2979 or visiting www.brandes.com.
The Trustees and officers of the Trust, their business addresses and principal occupations during the past five years are:
| | | | | | | | | | |
Name, Address and Age | | Position(s) Held with Trust | | Term of Office and
Length of Time Served(1) | | Principal Occupation During Past 5 Years | | Number
of Trust
Series
Overseen
by Trustee | | Other Directorships/ Trusteeships Held by Trustee |
| | | | | | | | | | | |
Independent Trustees(2) | | | | | | |
| | | | | |
Gregory Bishop, CFA 4275 Executive Square, 5th Floor La Jolla, CA 92037 (1961) | | Trustee | | Since January 2017 | | Retired. Previously Executive Vice President and Head of Retail Business, PIMCO Investments, from 1997 to 2014 | | 8 | | None |
| | | | | |
Robert M. Fitzgerald 4275 Executive Square, 5th Floor La Jolla, CA 92037 (1952) | | Trustee | | Since April 2008 | | Retired from 2002- 2005 and since 2007; Chief Financial Officer of National Retirement Partners from 2005 to 2007. | | 8 | | Hotchkis and Wiley Funds (10 portfolios). |
| | | | | |
Craig Wainscott, CFA 4275 Executive Square, 5th Floor La Jolla, CA 92037 (1961) | | Trustee and (beginning January 2018) Chairman of the Board | | Since February 2012 | | Retired from Russell Investments, Managing Director, US Mutual Funds; Currently Partner with The Paradigm Project and advisor to early-stage companies. | | 8 | | None |
139
Brandes Investment Trust
TRUSTEES AND OFFICERS INFORMATION — (Unaudited) (continued)
| | | | | | | | | | |
Name, Address and Age | | Position(s) Held with Trust | | Term of Office and
Length of Time Served(1) | | Principal Occupation During Past 5 Years | | Number
of Trust
Series
Overseen
by Trustee | | Other Directorships/ Trusteeships Held by Trustee |
| | | | | | | | | | | |
“Interested” Trustees(3) | | | | | | |
| | | | | |
Jeff Busby, CFA 4275 Executive Square, 5th Floor La Jolla, CA 92037 (1961) | | Trustee and President | | Since July 2006 Since February 2012 | | Executive Director of the Advisor since January 2004. | | 8 | | None |
| | | | | |
Oliver Murray 4275 Executive Square, 5th Floor La Jolla, CA 92037 (1961) | | Trustee | | Since February 2012 | | CEO, Brandes Investment Partners & Co. since 2002; Managing Director - PCPM of the Advisor since 2011. | | 8 | | None |
| | | | | |
Officers of the Trust | | | | | | | | | | |
| | | | | |
Thomas M. Quinlan 4275 Executive Square, 5th Floor La Jolla, CA 92037 (1970) | | Secretary | | Since June 2003 | | Associate General Counsel of the Advisor since January 2006. | | N/A | | N/A |
| | | | | |
Gary Iwamura, CPA 4275 Executive Square, 5th Floor La Jolla, CA 92037 (1956) | | Treasurer | | Since September 1997 | | Consultant to the Advisor since January 2022; Finance Director of the Advisor from 1997 to 2021. | | N/A | | N/A |
| | | | | |
Roberta Loubier 4275 Executive Square, 5th Floor La Jolla, CA 92037 (1971) | | Chief Compliance Officer and Anti-Money Laundering Officer | | Since September 2015 | | Global Head of Compliance of the Advisor. | | N/A | | N/A |
| (1) | Trustees and officers of the Fund serve until their resignation, removal or retirement. |
| (2) | Not “interested persons” of the Trust as defined in the 1940 Act. |
| (3) | “Interested persons” of the Trust as defined in the 1940 Act. Jeff Busby is an interested person of the Trust because he is the President of the Trust and the Executive Director of the Advisor. Oliver Murray is an interested person of the Trust, because he is the Managing Director of the Advisor. |
140
Brandes Investment Trust
PRIVACY NOTICE
Brandes Investment Trust and Brandes Investment Partners, L.P. may collect non-public information about you from the following sources:
| ● | Information we receive about you on applications or other forms; |
| ● | Information you give us orally; and |
| ● | Information about your transactions with us. |
We do not disclose any non-public personal information about any shareholder or former shareholder of the Fund without the shareholder’s authorization, except as required by law or in response to inquiries from governmental authorities. We restrict access to your personal and account information to those employees who need to know that information to provide products and services to you. We also may disclose that information to unaffiliated third parties (such as to brokers or custodians) only as permitted by law and only as needed for us to provide agreed services to you. We maintain physical, electronic and procedural safeguards to guard your non-public personal information.
If you hold shares of the Fund through a financial intermediary, such as a broker-dealer, bank, or trust company, the privacy policy of your financial intermediary governs how your non-public personal information would be shared with nonaffiliated third parties.
141

ADVISOR
Brandes Investment Partners, L.P.
4275 Executive Square, 5th Floor
La Jolla, CA 92037
800.331.2979
DISTRIBUTOR
ALPS Distributors, Inc. 1290 Broadway, #1100 Denver, CO 80203
TRANSFER AGENT
The Northern Trust Company 333 South Wabash Avenue, W-38 Chicago, IL 60604
INDEPENDENT REGISTERED PUBLIC ACCOUNTING FIRM
PricewaterhouseCoopers LLP 601 South Figueroa Street Los Angeles, CA 90017
LEGAL COUNSEL
Morgan, Lewis & Bockius LLP One Federal Street Boston, MA 02110
This report is intended for shareholders of the Brandes International Equity Fund, the Brandes Global Equity Fund, the Brandes Emerging Markets Value Fund, the Brandes International Small Cap Equity Fund, the Brandes Small Cap Value Fund, the Brandes U.S. Value Fund and the Brandes Core Plus Fixed Income Fund and may not be used as sales literature unless preceded or accompanied by a current prospectus.
Statements and other information herein are dated and are subject to change.
SEMI-ANNUAL
REPORT
SEPARATELY MANAGED ACCOUNT
RESERVE TRUST
For the six months ended March 31, 2022
Table of Contents
1
Brandes Separately Managed Account Reserve Trust
Dear Fellow Investor,
In the six months ended March 31, 2022, the Brandes Separately Managed Account Reserve Trust Fund declined 5.03%, while its benchmark, the Bloomberg Barclays U.S. Aggregate Bond Index, declined 5.92%.
Boxing great Mike Tyson once said: “Everyone has a plan until they get punched in the mouth.” The swift repricing of fixed income markets in the first quarter 2022, the likes which we have not seen since the 1970s, appeared to knock the Federal Reserve (Fed) and many investors on their heels.
During this time, the Fed was forced to quickly pivot from their plan of slowly and methodically winding down the most accommodative monetary policy in their history, to aggressively updating their forecasts for future rate hikes and balance sheet reductions.
In mid-December 2021 the Fed released its closely watched “dot plot“1, which pegged the median forecast for the fed funds rate at 0.81% for year-end 2022 and 1.65% for year-end 2023. The updated March dot plot pegged the median fed funds rate at 2.05% for year-end 2022 and 2.81% for year-end 2023. This represents an abrupt upward shift in just three months and is particularly interesting in the context of the Fed’s view that the long-term normalized fed funds rate is 2.5%. The updated dot plot forecasts imply that the Fed believes that they will have to aggressively tighten above the projected long-term normalized rate to tame inflation. That is a considerable about-face from the transitory narrative that dominated their thinking for the better part of the past two years.
Market expectations have abruptly changed as well. During the fourth quarter 2021 we observed the disconnect between the Fed’s forward interest rate guidance and market expectations, noting that market expectations for the terminal fed funds rate were much lower than Fed guidance. As the market has reset future expectations guided by the newly hawkish Fed, rates have swiftly moved higher to levels not seen in several years.
After two years of a global health pandemic, during recent months the world has had to grapple with the worst outbreak of European military violence since World War II. Navigating monetary policy through this turbulent time has undoubtedly been a difficult task, but history will likely show that the Fed has simply waited too long to begin policy normalization and hence has run the risk of falling well behind the curve on inflation. Many commentators (including ourselves) have made this accusation, and we finally feel like we are no longer the old man yelling at the clouds when it comes to expressing concerns about inflation.
We have previously accused the Fed of being guilty of policy inertia and we have hoped that inertia would not lead to a policy error. It increasingly looks like the Fed has indeed made a policy error with its continuation of unprecedented stimulus well after the initial shock of the pandemic receded. As a result, taming inflation while achieving a
| 2 | Past Performance is not a guarantee of future results. |
Brandes Separately Managed Account Reserve Trust
soft landing for the economy has become decidedly more difficult and could lead to additional market volatility.
During the trailing six-month period ending March 31, 2022, holdings in energy (Range Resources & Occidental Petroleum), services (Prime Security Services) and healthcare (Tenet Healthcare) aided returns.
Select holdings in banking (U.S. Bank & Goldman Sachs) and telecom (Telecom Italia) detracted from returns.
The fund’s underweight to agency mortgage-backed securities (MBS) aided performance during the period.
Term-structure positioning was a positive factor in performance as interest rates rose sharply. The fund was positioned near the bottom of its duration-controlled band during the period, helping to mitigate the impact of rising rates on a relative basis.
Select Portfolio Activity
During the period, the Fund added new positions in Mauser Packaging (7.25% coupon, maturing 4/15/25, rated Caa3/CCC), Charles Schwab Inc. (5.375% coupon, perpetual, callable 6/1/25, rated Baa2/BBB), Citigroup Inc. (4.40% coupon, maturing 6/10/25, rated Baa2/BBB), Methanex Corp (5.125% coupon, maturing 10/15/27, rated Ba1/BB), Coty Inc. secured debt (5.00% coupon, maturing 4/15/26, rated B1/B+) and American Transmission System (2.65% coupon, maturing 1/15/32, rated A3/BBB).
We believe that the Charles Schwab bond that we purchased is a good example of a situation where the distinctive structure of the security presents an attractive value opportunity. This bond is a junior subordinated security – it ranks lower in the company’s capital structure. It pays a fixed-rate coupon until June 2025. If the bond is not called in June 2025, it will become a perpetual security, and its coupon will revert to a floating rate based on the 5-year U.S. Treasury rate plus 4.97% - with a quarterly reset. The reset rate will be at a yield spread that is similar to where low-quality high yield bonds generally trade.
The distinctive feature of this bond is that if Charles Schwab chooses not to call the security in June 2025, the company does not have the option to call it again for an additional five years. At today’s interest rates the coupon would reset to nearly 7%. Given the relatively high cost of a coupon reset and the limited flexibility offered to the company for future calls, we believe that this bond is best treated as a bullet security with a 3-year maturity.
Charles Schwab issued this bond in April 2020 during the early stages of the pandemic, which we believe is the likely explanation of why the bond’s structure is not representative of the strong underlying credit quality of the company. As a result, this represents an attractive value opportunity to us.
3
Brandes Separately Managed Account Reserve Trust
Coty Inc. is a world leader in beauty with 75 brands and is home to well-known brands such as CoverGirl, Clairol and Max Factor. The company experienced turnover in the chief executive officer’s (CEO’s) chair with four different CEOs in 2020. Additionally, the pandemic affected revenues as beauty sales suffered in a world dominated by Zoom calls.
However, Coty is in the early stages of an operational turnaround centered on three key initiatives: 1) shifting the mix toward prestige brands with a focus on clean and green—i.e., CoverGirl Clean Fresh vegan makeup; 2) stabilizing its mass market beauty portfolio; and 3) reducing leverage through applying strong operational cash flows to paying down debt and divesting non-core brands.
As the pandemic recedes and more people can return to the office, travel, and engage in leisure activities, we believe Coty is well positioned to benefit from positive industry trends, as well as specific steps the company has taken to strengthen its balance sheet and product portfolio.
American Transmission System is a regulated operating company of First Energy. We believe the company’s bonds offer an attractive higher-quality position within the First Energy capital structure.
The Fund also added to existing positions in MicroStrategy, Netflix, Allison Transmission and Telecom Italia.
The Fund exited our full position in Occidental Petroleum (3.50% coupon, maturing 6/15/25, rated Ba1/BB+), experienced a full call in Range Resources (9.25% coupon, maturing 2/1/26, rated B1/BB-), and saw maturities in Microsoft Corp. and ExxonMobil.
Outlook
From a total return perspective, the performance of virtually the entire fixed income universe was quite painful during the first quarter of 2022. Interest rates moved up swiftly from a very low base, leading to negative returns across the fixed income spectrum.
As the second quarter of 2022 begins, higher yields in the market and in the Fund can help cushion some of the impact if we are in the midst of secular change to a higher rate environment. With any investment, and in particular fixed income, time horizon is important. In the short-term, interest rate increases can cause negative total returns. However, over a longer time horizon, higher rates should allow a diversified portfolio to generate a higher level of income.
For a considerable period now, we have attempted to tilt Brandes Separately Managed Account Reserve Trust into what we believe is a defensive posture in order to mitigate some of the detrimental impact of higher interest rates and wider yield spreads. The Fund continues to favor shorter-maturity corporate bonds and those that we
4
Brandes Separately Managed Account Reserve Trust
believe exhibit strong, tangible asset coverage. We are managing duration toward the shorter end of our duration-controlled range.
We remain underweight Agency mortgage-backed securities. In March, the Fed finally wrapped up their temporary support for a market where they have been making outright purchases since 2008. We are cautious on this market, given that the Fed owns 37% of the universe and has been absorbing nearly 50% of supply since March 2020.2
While the amount of Agency mortgage-backed securities supply could slow if interest rates continue to move higher, it remains to be seen how the market will respond to the withdrawal of explicit central bank support.
As we move forward, we believe prudence dictates that we continue our search for value at the margins while continuing to tilt the Fund to what we believe is a relatively defensive posture.
As always, thank you for your business and continued trust.
Sincerely yours,
The Brandes Fixed Income Investment Committee
Brandes Investment Trust
1Bloomberg, Federal Reserve, 12/15/21, and 3/17/22
2Mortgage QE 2020-22: A Look Back and Ahead, Bloomberg Intelligence, 3/14/22
Agency mortgage-backed securities (MBS): An MBS issued by one of three quasi-governmental agencies: The Government National Mortgage Association (GNMA or Ginnie Mae), the Federal National Mortgage Association (FNMA or Fannie Mae), and the Federal Home Loan Mortgage Corporation (Freddie Mac). A MBS is an investment similar to a bond that is made up of a bundle of home loans bought from the banks that issued them.
Asset Coverage: Measures how well a company can repay its debts by selling or liquidating its assets.
Bullet security: a debt investment whose entire principal value is paid in one lump sum on its maturity date, rather than amortized over its lifetime.
Cash Flow: The amount of cash generated minus the amount of cash used by a company in a given period.
Coupon: The annual interest rate paid on a bond, expressed as a percentage of the face value and paid from issue date until maturity.
Dot Plot: Data points that are plotted on a graph and is used by the Federal Reserve to show its projected interest-rate outlook. Source: Investopedia Duration: The weighted maturity of a fixed-income investment’s cash flows, used in the estimation of the price sensitivity of fixed-income securities for a given change in interest rates.
5
Brandes Separately Managed Account Reserve Trust
Mortgage-Backed Security: A type of asset-backed security which is secured by a mortgage or collection of mortgages.
Secured Debt: Debt that is backed by collateral to reduce the risk associated with lending. Source: Investopedia
Total Return: Income plus capital appreciation.
Yield: Annual income from the investment (dividend, interest, etc.) divided by the current market price of the investment.
Yield Spread: The net difference between two interest-bearing instruments of varying maturities, credit ratings, issuer or risk level.
Short-term debt refers to fixed income securities set to mature in 1 to 5 years from the issue or purchase date. Long-term debt refers to fixed income securities set to mature more than 10 years from the issue or purchase date.
Diversification does not assure a profit or protect against a loss in a declining market.
Because the values of the fund’s investments will fluctuate with market conditions, so will the value of your investment in the fund. You could lose money on your investment in the fund, or the fund could underperform other investments. The values of the fund’s investments fluctuate in response to the activities of individual companies and general bond market and economic conditions. Investments in small and medium capitalization companies tend to have limited liquidity and greater price volatility than large capitalization companies.
As with most fixed income funds, the income on and value of your shares in the fund will fluctuate along with interest rates. When interest rates rise, the market prices of the debt securities the fund owns usually decline. When interest rates fall, the prices of these securities usually increase. Generally, the longer the fund’s average portfolio maturity and the lower the average quality of its portfolio, the greater the price fluctuation. The price of any security owned by the fund may also fall in response to events affecting the issuer of the security, such as its ability to continue to make principal and interest payments or its credit rating. Below investment grade debt securities are speculative and involve a greater risk of default and price change due to changes in the issuer’s creditworthiness than higher grade debt. The market prices of these debt securities may fluctuate more than the market prices of investment grade debt securities and may decline significantly in periods of general economic difficulty. Credit ratings are measured on a scale that generally ranges from AAA (highest) to D (lowest). All Fund securities except for those labeled “Not Rated” and “Other” have been rated by Moody’s, S&P or Fitch, which are each a Nationally Recognized Statistical Rating Organization. All Index securities except for those labeled “Not Rated” have been rated by Moody’s or S&P. Credit ratings are subject to change.
6
Brandes Separately Managed Account Reserve Trust
Please refer to the Schedule of Investments in the report for complete holdings information. Fund holdings, geographic allocations and/or sector allocations are subject to change at any time and are not considered a recommendation to buy or sell any security.
The foregoing reflects the thoughts and opinions of Brandes Investment Partners® exclusively and is subject to change without notice.
Brandes Investment Partners® is a registered trademark of Brandes Investment Partners, L.P. in the United States and Canada.
Must be preceded or accompanied by a prospectus.
Index Guide
The Bloomberg U.S. Aggregate Bond Index is a broad-based benchmark that measures the investment grade, U.S. dollar-denominated, fixed-rate taxable bond market. This index is a total return index which reflects the price changes and interest of each bond in the index.
One cannot invest directly in an index.
The Brandes Separately Managed Account Reserve Trust is distributed by ALPS Distributors, Inc.
7
Brandes Separately Managed Account Reserve Trust
The following chart compares the value of a hypothetical $100,000 investment in the Separately Managed Account Reserve Trust from September 30, 2011 to March 31, 2022 with the value of such an investment in the Bloomberg U.S. Aggregate Bond Index and Bloomberg U.S. Intermediate Credit Bond Index for the same period.
Value of $100,000 Investment vs Bloomberg U.S. Aggregate Bond
Index & Bloomberg U.S. Intermediate Credit Bond Index (Unaudited)
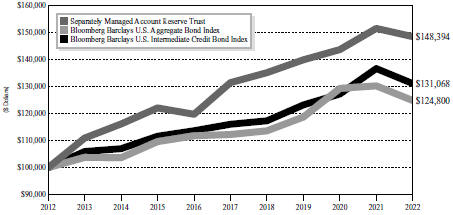
| | | | | | | | | | | | | | | | |
| | | Average Annual Total Return
Periods Ended March 31, 2022 | |
| | | One
Year | | | Five
Years | | | Ten
Years | | | Since
Inception | |
Brandes Separately Managed Account Reserve Trust | | | (2.01 | )% | | | 2.46% | | | | 4.03% | | | | 4.73% | |
Bloomberg Barclays U.S. Aggregate Bond Index | | | (4.15 | )% | | | 2.14% | | | | 2.24% | | | | 3.64% | |
Bloomberg Barclays U.S. Intermediate Credit Bond Index | | | (4.05 | )% | | | 2.47% | | | | 2.74% | | | | 4.00% | |
Performance data quoted represents past performance; past performance does not guarantee future results. The investment return and principal value of an investment will fluctuate so that an investor’s shares, when redeemed, may be worth more or less than their original cost. Current performance of the Fund may be lower or higher than the performance quoted. Performance data current to the most recent month end may be obtained by calling 800-331-2979.
8
Brandes Separately Managed Account Reserve Trust
The returns shown do not reflect the deduction of taxes that a shareholder would pay on fund distributions or the redemption of fund shares.
Asset Allocation as a Percentage of Total Investments as of
March 31, 2022 (Unaudited)
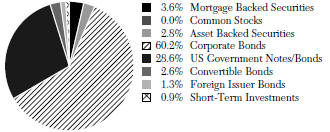
9
Brandes Separately Managed Account Reserve Trust
Expense Example (Unaudited)
As a shareholder of the Fund, you incur ongoing costs, including investment advisory and administrative fees and other Fund expenses. The example below is intended to help you understand your ongoing costs (in dollars) of investing in the Fund and to compare these costs with the ongoing costs of investing in other mutual funds. Note that for this Fund, which is used in wrap-fee programs, fees and expenses are paid at the wrap account level rather than the Fund level.
The example is based on an investment of $1,000 invested at the beginning of the period and held for the entire period from October 1, 2021 to March 31, 2022 (the “Period”).
Actual Expenses
This section provides information about actual account values and actual expenses. The “Ending Account Value” shown is derived from the Fund’s actual returns. You may use the information in this section, together with the amount you invested, to estimate the expenses that you paid over the period. Simply divide your account value by $1,000 (for example, an $8,600 account value divided by $1,000 = 8.6), then multiply the result by the number given for the Fund under the heading “Expenses Paid During Period” to estimate the expenses you paid on your account during this period.
| | | | | | | | |
| Fund | | Beginning
Account
Value | | Ending
Account
Value | | Annualized
Expense
Ratio | | Expenses
Paid
During
the PeriodR |
Seperately Managed Account Reserve TrustRR | | $1,000.00 | | $949.70 | | 0.00% | | $0.00 |
| R | The Fund’s expenses are equal to the Fund’s expense ratio for the period, multiplied by the average account value over the period, multiplied by 182/365 (to reflect the one half-year period). |
| RR | No expenses have been charged to the Brandes Separately Managed Account Reserve Trust (“SMART Fund”) over the period, as the SMART Fund participates in a wrap-fee program sponsored by investment advisors unaffiliated with the SMART Fund. See Note 3 to the Financial Statements. Fees and expenses are charged at the wrap account level. |
Hypothetical Example for Comparison Purposes
This section provides information about hypothetical account values and hypothetical expenses based on the Fund’s actual expense ratio and an assumed rate of return of 5% per year before expenses, which is not the Fund’s actual return. The hypothetical account values and expenses may not be used to estimate the actual ending account balance or expenses you paid for the period. You may use this information to compare the ongoing costs of investing in the Fund and other mutual funds. To do so, compare this 5% hypothetical example with the 5% hypothetical examples that appear in the shareholder reports of the other mutual funds.
10
Brandes Separately Managed Account Reserve Trust
Please note that the expenses shown in the table are meant to highlight your ongoing costs only and do not reflect any transaction costs, such as brokerage commissions on purchase and sales of Fund shares. Therefore, the last column of the table is useful in comparing ongoing costs only, and will not help you determine the relative total costs of owning different funds. In addition, if these transactional costs were included, your costs would have been higher.
| | | | | | | | |
| Fund | | Beginning
Account
Value | | Ending
Account
Value | | Annualized
Expense
Ratio | | Expenses
Paid
During
the PeriodR |
Seperately Managed Account Reserve TrustRR | | $1,000.00 | | $1,024.93 | | 0.00% | | $0.00 |
| R | The Fund’s expenses are equal to the Fund’s expense ratio for the period, multiplied by the average account value over the period, multiplied by 182/365 (to reflect the one half-year period). |
| RR | No expenses have been charged to the Brandes Separately Managed Account Reserve Trust (“SMART Fund”) over the period, as the SMART Fund participates in a wrap-fee program sponsored by investment advisors unaffiliated with the SMART Fund. See Note 3 to the Financial Statements. Fees and expenses are charged at the wrap account level. |
11
Brandes Separately Managed Account Reserve Trust
SCHEDULE OF INVESTMENTS — March 31, 2022 (Unaudited)
| | | | | | | | |
| | | Shares | | | Value | |
| | |
COMMON STOCKS – 0.00% | | | | | | | | |
| | |
Household Durables – 0.00% | | | | | | | | |
Urbi Desarrollos Urbanos SAB de CV (a) | | | 8,806 | | | $ | 2,982 | |
| | | | | | | | |
| | |
TOTAL COMMON STOCKS (Cost $1,887,387) | | | | | | $ | 2,982 | |
| | | | | | | | |
| | |
| | | Principal
Amount | | | Value | |
| | |
FEDERAL AND FEDERALLY SPONSORED CREDITS – 3.54% | | | | | | | | |
| | |
Federal Home Loan Mortgage Corporation – 1.29% | | | | | | | | |
Pool G1-8578 3.000%, 12/1/2030 | | $ | 822,871 | | | $ | 830,072 | |
Pool SD-8001 3.500%, 7/1/2049 | | | 861,268 | | | | 865,961 | |
Pool SD-8003 4.000%, 7/1/2049 | | | 472,179 | | | | 482,595 | |
| | | | | | | | |
| | |
| | | | | | | 2,178,628 | |
| | | | | | | | |
| | |
Federal National Mortgage Association – 2.25% | | | | | | | | |
Pool AL9865 3.000%, 2/1/2047 | | | 663,810 | | | | 659,036 | |
Pool AS6201 3.500%, 11/1/2045 | | | 345,758 | | | | 352,340 | |
Pool BN6683 3.500%, 6/1/2049 | | | 724,894 | | | | 728,650 | |
Pool CA1624 3.000%, 4/1/2033 | | | 1,133,089 | | | | 1,144,876 | |
Pool MA3687 4.000%, 6/1/2049 | | | 903,284 | | | | 923,215 | |
| | | | | | | | |
| | |
| | | | | | | 3,808,117 | |
| | | | | | | | |
| | |
TOTAL FEDERAL AND FEDERALLY SPONSORED CREDITS (Cost $5,998,715) | | | | | | $ | 5,986,745 | |
| | | | | | | | |
OTHER MORTGAGE RELATED SECURITIES – 0.00% | | | | | | | | |
| | |
Collateralized Mortgage Obligations – 0.00% | | | | | | | | |
Wells Fargo Mortgage Backed Securities Trust Series 2006-AR14 2.915%, 10/25/2036(b) | | $ | 1,470 | | | $ | 1,373 | |
| | | | | | | | |
TOTAL OTHER MORTGAGE RELATED SECURITIES (Cost $1,471) | | | | | | $ | 1,373 | |
| | | | | | | | |
US GOVERNMENTS – 28.48% | | | | | | | | |
| | |
Sovereign – 28.48% | | | | | | | | |
United States Treasury Bond | | | | | | | | |
4.750%, 2/15/2037 | | $ | 19,535,000 | | | $ | 25,487,070 | |
3.500%, 2/15/2039 | | | 19,250,000 | | | | 22,054,785 | |
| | |
United States Treasury Note 2.375%, 5/15/2029 | | | 635,000 | | | | 633,165 | |
| | | | | | | | |
| | |
TOTAL US GOVERNMENTS (Cost $48,037,202) | | | | | | $ | 48,175,020 | |
| | | | | | | | |
The accompanying notes to financial statements are an integral part of this Schedule of Investments.
12
Brandes Separately Managed Account Reserve Trust
SCHEDULE OF INVESTMENTS — March 31, 2022 (Unaudited) (continued)
| | | | | | | | |
| | | Principal
Amount | | | Value | |
| | |
CONVERTIBLE BONDS – 2.55% | | | | | | | | |
| | |
Technology – 2.55% | | | | | | | | |
MicroStrategy, Inc. 0.000%, 2/15/2027 | | $ | 6,045,000 | | | $ | 4,318,414 | |
| | | | | | | | |
| | |
TOTAL CONVERTIBLE BONDS (Cost $4,458,312) | | | | | | $ | 4,318,414 | |
| | | | | | | | |
CORPORATE BONDS – 59.86% | | | | | | | | |
| | |
Banks – 11.39% | | | | | | | | |
Charles Schwab Corp. 5.375% (U.S. Treasury Yield Curve Rate CMT 5Y + 4.971%), Perpetual(c) | | $ | 2,285,000 | | | $ | 2,353,550 | |
Citigroup, Inc. 4.400%, 6/10/2025 | | | 3,640,000 | | | | 3,744,459 | |
JPMorgan Chase & Co. 3.769% (3M LIBOR + 3.470%), Perpetual(c) | | | 6,083,000 | | | | 6,083,000 | |
USB Capital IX 3.500% (3M LIBOR + 1.020%, minimum of 3.500%), Perpetual(c) | | | 8,525,000 | | | | 7,081,045 | |
| | | | | | | | |
| | |
| | | | | | | 19,262,054 | |
| | | | | | | | |
| | |
Commercial Services & Supplies – 3.74% | | | | | | | | |
Iron Mountain, Inc. 4.875%, 9/15/2027(d) | | | 2,925,000 | | | | 2,892,094 | |
Travel + Leisure Co. 6.625%, 7/31/2026(d) | | | 3,295,000 | | | | 3,435,037 | |
| | | | | | | | |
| | |
| | | | | | | 6,327,131 | |
| | | | | | | | |
| | |
Consumer Products – 13.17% | | | | | | | | |
Avon Products, Inc. 6.500%, 3/15/2023 | | | 5,925,000 | | | | 5,977,258 | |
Coty, Inc. 5.000%, 4/15/2026(d) | | | 3,534,000 | | | | 3,441,232 | |
Ford Motor Credit Co. LLC | | | | | | | | |
3.350%, 11/1/2022 | | | 1,925,000 | | | | 1,929,428 | |
3.375%, 11/13/2025 | | | 1,625,000 | | | | 1,588,348 | |
Pilgrim’s Pride Corp. | | | | | | | | |
5.875%, 9/30/2027(d) | | | 720,000 | | | | 726,761 | |
4.250%, 4/15/2031(d) | | | 2,905,000 | | | | 2,687,125 | |
PulteGroup, Inc. 5.500%, 3/1/2026 | | | 3,920,000 | | | | 4,170,333 | |
Toll Brothers Finance Corp. 4.875%, 11/15/2025 | | | 1,710,000 | | | | 1,760,878 | |
| | | | | | | | |
| | |
| | | | | | | 22,281,363 | |
| | | | | | | | |
| | |
Containers & Packaging – 2.05% | | | | | | | | |
Mauser Packaging Solutions Holding Co. 7.250%, 4/15/2025(d) | | | 1,540,000 | | | | 1,526,309 | |
The accompanying notes to financial statements are an integral part of this Schedule of Investments.
13
Brandes Separately Managed Account Reserve Trust
SCHEDULE OF INVESTMENTS — March 31, 2022 (Unaudited) (continued)
| | | | | | | | |
| | | Principal
Amount | | | Value | |
| | |
Sealed Air Corp. 4.000%, 12/1/2027(d) | | $ | 1,990,000 | | | $ | 1,940,250 | |
| | | | | | | | |
| | |
| | | | | | | 3,466,559 | |
| | | | | | | | |
| | |
Electric Utilities – 2.38% | | | | | | | | |
American Transmission Systems, Inc. 2.650%, 1/15/2032(d) | | | 2,930,000 | | | | 2,707,897 | |
FirstEnergy Corp. 7.375%, 11/15/2031 | | | 1,075,000 | | | | 1,325,862 | |
| | | | | | | | |
| | |
| | | | | | | 4,033,759 | |
| | | | | | | | |
| | |
Health Care Facilities & Services – 2.85% | | | | | | | | |
Tenet Healthcare Corp. 4.875%, 1/1/2026(d) | | | 4,780,000 | | | | 4,821,825 | |
| | | | | | | | |
| | |
Industrial Services – 4.28% | | | | | | | | |
Prime Security Services Borrower LLC | | | | | | | | |
5.750%, 4/15/2026(d) | | | 3,620,000 | | | | 3,693,033 | |
6.250%, 1/15/2028(d) | | | 3,635,000 | | | | 3,557,193 | |
| | | | | | | | |
| | |
| | | | | | | 7,250,226 | |
| | | | | | | | |
| | |
Media – 3.01% | | | | | | | | |
Charter Communications Operating LLC 4.908%, 7/23/2025 | | | 1,325,000 | | | | 1,374,040 | |
Netflix, Inc. 4.375%, 11/15/2026 | | | 3,570,000 | | | | 3,712,568 | |
| | | | | | | | |
| | |
| | | | | | | 5,086,608 | |
| | | | | | | | |
| | |
Oil, Gas & Consumable Fuels – 6.74% | | | | | | | | |
BP Capital Markets Plc 3.506%, 3/17/2025 | | | 3,375,000 | | | | 3,439,252 | |
Continental Resources, Inc. | | | | | | | | |
4.500%, 4/15/2023 | | | 1,845,000 | | | | 1,867,140 | |
4.375%, 1/15/2028 | | | 1,105,000 | | | | 1,120,249 | |
Range Resources Corp. 4.875%, 5/15/2025 | | | 4,925,000 | | | | 4,984,918 | |
| | | | | | | | |
| | |
| | | | | | | 11,411,559 | |
| | | | | | | | |
| | |
Technology – 4.96% | | | | | | | | |
Goldman Sachs Group, Inc. 3.800% (U.S. Treasury Yield Curve Rate CMT 5Y + 2.969%), Perpetual(c) | | | 2,900,000 | | | | 2,687,938 | |
VMware, Inc. | | | | | | | | |
4.500%, 5/15/2025 | | | 1,430,000 | | | | 1,473,034 | |
3.900%, 8/21/2027 | | | 4,176,000 | | | | 4,229,970 | |
| | | | | | | | |
| | |
| | | | | | | 8,390,942 | |
| | | | | | | | |
The accompanying notes to financial statements are an integral part of this Schedule of Investments.
14
Brandes Separately Managed Account Reserve Trust
SCHEDULE OF INVESTMENTS — March 31, 2022 (Unaudited) (continued)
| | | | | | | | |
| | | Principal
Amount | | | Value | |
| | |
Telecommunications – 4.15% | | | | | | | | |
Sprint Spectrum Co. LLC 5.152%, 3/20/2028(d) | | $ | 1,988,000 | | | $ | 2,093,352 | |
Telecom Italia Capital SA 6.375%, 11/15/2033 | | | 3,626,000 | | | | 3,465,477 | |
T-Mobile USA, Inc. 4.750%, 2/1/2028 | | | 1,435,000 | | | | 1,458,534 | |
| | | | | | | | |
| | |
| | | | | | | 7,017,363 | |
| | | | | | | | |
| | |
Transportation & Logistics – 1.14% | | | | | | | | |
Allison Transmission, Inc. 4.750%, 10/1/2027(d) | | | 1,955,000 | | | | 1,923,231 | |
| | | | | | | | |
| | |
TOTAL CORPORATE BONDS (Cost $103,401,180) | | | | | | $ | 101,272,620 | |
| | | | | | | | |
ASSET BACKED SECURITIES – 2.81% | | | | | | | | |
| | |
Student Loan – 2.81% | | | | | | | | |
SLM Private Credit Student Loan Trust Series 2004-B, 1.256%, (3M LIBOR + 0.430%), 9/15/2033(c) | | $ | 1,500,000 | | | $ | 1,446,907 | |
SLM Private Credit Student Loan Trust Series 2005-A, 1.136%, (3M LIBOR + 0.310%), 12/15/2038(c) | | | 1,367,135 | | | | 1,337,912 | |
SLM Private Credit Student Loan Trust Series 2006-A, 1.116%, (3M LIBOR + 0.290%), 6/15/2039(c) | | | 2,057,703 | | | | 1,978,621 | |
| | | | | | | | |
| | |
TOTAL ASSET BACKED SECURITIES (Cost $4,603,797) | | | | | | $ | 4,763,440 | |
| | | | | | | | |
FOREIGN ISSUER BONDS – 1.31% | | | | | | | | |
| | |
Containers & Packaging – 0.74% | | | | | | | | |
Methanex Corp., 5.125%, 10/15/2027 | | $ | 1,249,000 | | | $ | 1,255,245 | |
| | | | | | | | |
| | |
Telecommunications – 0.57% | | | | | | | | |
SoftBank Group Corp., 4.750%, 9/19/2024 | | | 980,000 | | | | 955,500 | |
| | | | | | | | |
| | |
TOTAL FOREIGN ISSUER BONDS (Cost $2,270,748) | | | | | | $ | 2,210,745 | |
| | | | | | | | |
| | |
| | | Shares | | | Value | |
| | |
SHORT-TERM INVESTMENTS – 0.90% | | | | | | | | |
| | |
Money Market Funds – 0.90% | | | | | | | | |
Northern Institutional Funds - Treasury Portfolio (Premier), 0.12%(e) | | | 1,518,753 | | | $ | 1,518,753 | |
| | | | | | | | |
| | |
TOTAL SHORT-TERM INVESTMENTS (Cost $1,518,753) | | | | | | $ | 1,518,753 | |
| | | | | | | | |
Total Investments (Cost $172,177,565) – 99.45%. | | | | | | $ | 168,250,092 | |
Other Assets in Excess of Liabilities – 0.55% | | | | | | | 927,229 | |
| | | | | | | | |
| | |
Total Net Assets – 100.00% | | | | | | $ | 169,177,321 | |
| | | | | | | | |
Percentages are stated as a percent of net assets.
The accompanying notes to financial statements are an integral part of this Schedule of Investments.
15
Brandes Separately Managed Account Reserve Trust
SCHEDULE OF INVESTMENTS — March 31, 2022 (Unaudited) (continued)
LIBOR London Interbank Offered Rate
| (a) | Non-income producing security. |
| (b) | Variable rate security. The coupon is based on an underlying pool of loans. |
| (c) | Variable rate security. The coupon is based on a reference index and spread index. |
| (d) | Acquired in a transaction exempt from registration under Rule 144A or Section 4(a)(2) of the Securities Act of 1933. May be resold in the U.S. in transactions exempt from registration, normally to qualified institutional buyers. The total value of all such securities was $35,445,340 which represented 20.95% of the net assets of the Fund. |
| (e) | The rate shown is the annualized seven day yield as of March 31, 2022. |
The accompanying notes to financial statements are an integral part of this Schedule of Investments.
16
Brandes Separately Managed Account Reserve Trust
SCHEDULE OF INVESTMENTS — March 31, 2022 (Unaudited) (continued)
The industry classifications represented in the Schedule of Investments are in accordance with Bloomberg Industry Classification Standards (BICS) or were otherwise determined by the Advisor to be appropriate. This information is unaudited.
The accompanying notes to financial statements are an integral part of this Schedule of Investments.
17
Brandes Separately Managed Account Reserve Trust
STATEMENT OF ASSETS AND LIABILITIES — March 31, 2022 (Unaudited)
| | | | |
ASSETS | | | | |
Investment in securities, at cost | | $ | 172,177,565 | |
| | | | |
| |
Investment in securities, at value | | $ | 168,250,092 | |
Receivables: | | | | |
Fund shares sold | | | 15,791 | |
Interest | | | 1,410,401 | |
| | | | |
| |
Total Assets | | | 169,676,284 | |
| | | | |
| |
LIABILITIES | | | | |
Payables: | | | | |
Fund shares redeemed | | | 455,109 | |
Dividends payable | | | 43,854 | |
| | | | |
| |
Total Liabilities | | | 498,963 | |
| | | | |
| |
NET ASSETS | | $ | 169,177,321 | |
| | | | |
| |
COMPONENTS OF NET ASSETS | | | | |
Paid-in Capital | | $ | 181,655,975 | |
Total distributable earnings (loss) | | | (12,478,654 | ) |
| | | | |
| |
Total Net Assets | | $ | 169,177,321 | |
| | | | |
| |
Net asset value, offering price and redemption proceeds per share | | | | |
Net Assets | | $ | 169,177,321 | |
Shares outstanding (unlimited shares authorized without par value) | | | 20,514,706 | |
Offering and redemption price | | $ | 8.25 | |
| | | | |
The accompanying notes to financial statements are an integral part of this statement.
18
Brandes Separately Managed Account Reserve Trust
STATEMENT OF OPERATIONS — For the Six Months Ended March 31, 2022 (Unaudited)
| | | | |
INVESTMENT INCOME | | | | |
Income | | | | |
Dividend income | | $ | 108 | |
Less: Foreign taxes withheld | | | (10 | ) |
Interest income | | | 2,928,532 | |
| | | | |
| |
Total Income | | | 2,928,630 | |
| | | | |
Expenses (Note 3) | | | | |
Total expenses | | | — | |
| | | | |
| |
Total net expenses | | | — | |
| | | | |
| |
Net investment income | | | 2,928,630 | |
| | | | |
| |
REALIZED AND UNREALIZED GAIN (LOSS) ON INVESTMENTS: | | | | |
Net realized gain (loss) on investments | | | 455,276 | |
Net change in unrealized appreciation (depreciation) on investments | | | (12,558,098 | ) |
| | | | |
| |
Net realized and unrealized loss on investments | | | (12,102,822 | ) |
| | | | |
| |
Net decrease in net assets resulting from operations | | $ | (9,174,192 | ) |
| | | | |
The accompanying notes to financial statements are an integral part of this statement.
19
Brandes Separately Managed Account Reserve Trust
STATEMENT OF CHANGES IN NET ASSETS
| | | | | | | | |
| | | Six Months
Ended
March 31,
2022 | | | Year Ended
September 30,
2021 | |
INCREASE IN NET ASSETS FROM: | | | | | | | | |
OPERATIONS | | | | | | | | |
Net investment income | | $ | 2,928,630 | | | $ | 5,611,074 | |
Net realized gain (loss) on investments | | | 455,276 | | | | 3,030,095 | |
Net change in unrealized appreciation (depreciation) on investments | | | (12,558,098 | ) | | | (4,302,975 | ) |
| | | | | | | | |
| | |
Net increase (decrease) in net assets resulting from operations | | | (9,174,192 | ) | | | 4,338,194 | |
| | | | | | | | |
DISTRIBUTIONS TO SHAREHOLDERS | | | | | | | | |
Distributions to Shareholders | | | (2,931,448 | ) | | | (6,546,146 | ) |
| | | | | | | | |
| | |
Decrease in net assets from distributions | | | (2,931,448 | ) | | | (6,546,146 | ) |
| | | | | | | | |
CAPITAL SHARE TRANSACTIONS | | | | | | | | |
Proceeds from shares sold | | | 12,704,147 | | | | 34,103,567 | |
Net asset value of shares issued on reinvestment of distributions | | | 2,684,448 | | | | 6,013,966 | |
Cost of shares redeemed | | | (20,565,623 | ) | | | (32,674,142 | ) |
| | | | | | | | |
| | |
Net increase (decrease) in net assets from capital share transactions | | | (5,177,028 | ) | | | 7,443,391 | |
| | | | | | | | |
| | |
Total increase (decrease) in net assets | | | (17,282,668 | ) | | | 5,235,439 | |
| | | | | | | | |
NET ASSETS | | | | | | | | |
Beginning of the Period | | | 186,459,989 | | | | 181,224,550 | |
| | | | | | | | |
| | |
End of the Period | | $ | 169,177,321 | | | $ | 186,459,989 | |
| | | | | | | | |
The accompanying notes to financial statements are an integral part of this statement.
20
Brandes Separately Managed Account Reserve Trust
FINANCIAL HIGHLIGHTS
| | | | | | | | | | | | | | | | | | | | | | | | |
| | | Six Months
Ended
March 31, | | | Year Ended
September 30, | |
| | | 2022 | | | 2021 | | | 2020 | | | 2019 | | | 2018 | | | 2017 | |
Net asset value, beginning of period | | $ | 8.83 | | | $ | 8.94 | | | $ | 8.73 | | | $ | 8.65 | | | $ | 8.94 | | | $ | 9.02 | |
| | | | | | | | | | | | | | | | | | | | | | | | |
Total from investment operations: | | | | | | | | | | | | | | | | | | | | | | | | |
Net investment income(1) | | | 0.14 | | | | 0.27 | | | | 0.31 | | | | 0.36 | | | | 0.39 | | | | 0.39 | |
Net realized and unrealized gain/(loss) on investments | | | (0.58) | | | | (0.07 | ) | | | 0.21 | | | | 0.08 | | | | (0.29 | ) | | | (0.08 | ) |
| | | | | | | | | | | | | | | | | | | | | | | | |
| | | | | | |
Total from investment operations | | | (0.44) | | | | 0.20 | | | | 0.52 | | | | 0.44 | | | | 0.10 | | | | 0.31 | |
| | | | | | | | | | | | | | | | | | | | | | | | |
Less dividends and distributions: | | | | | | | | | | | | | | | | | | | | | | | | |
Dividends from net investment income | | | (0.14) | | | | (0.31 | ) | | | (0.31 | ) | | | (0.36 | ) | | | (0.39 | ) | | | (0.39 | ) |
| | | | | | | | | | | | | | | | | | | | | | | | |
| | | | | | |
Total dividends and distributions | | | (0.14) | | | | (0.31 | ) | | | (0.31 | ) | | | (0.36 | ) | | | (0.39 | ) | | | (0.39 | ) |
| | | | | | | | | | | | | | | | | | | | | | | | |
| | | | | | |
Net asset value, end of period | | $ | 8.25 | | | $ | 8.83 | | | $ | 8.94 | | | $ | 8.73 | | | $ | 8.65 | | | $ | 8.94 | |
| | | | | | | | | | | | | | | | | | | | | | | | |
Total return | | | (5.03%) | (2) | | | 2.33 | % | | | 6.05 | % | | | 5.29 | % | | | 1.12 | % | | | 3.57 | % |
Net assets, end of period (millions) | | $ | 169.2 | | | $ | 186.5 | | | $ | 181.2 | | | $ | 177.0 | | | $ | 176.6 | | | $ | 176.7 | |
Ratio of expenses to average net assets(3) | | | 0.00% | (4) | | | 0.00 | % | | | 0.00 | % | | | 0.00 | % | | | 0.00 | % | | | 0.00 | % |
Ratio of net investment income to average net assets(3) | | | 3.26% | (4) | | | 3.04 | % | | | 3.52 | % | | | 4.27 | % | | | 4.43 | % | | | 4.39 | % |
Portfolio turnover rate | | | 13.13% | (2) | | | 36.89 | % | | | 32.24 | % | | | 35.99 | % | | | 42.90 | % | | | 39.74 | % |
| (1) | Net investment income per share has been calculated based on average shares outstanding during the period. |
| (3) | Reflects the fact that no fees or expenses are incurred by the Fund. The Fund is an integral part of “wrap-fee” programs sponsored by investment advisors and/or broker-dealers unaffiliated with the Fund or the Advisor. Participants in these programs pay a “wrap” fee to the sponsor of the program. |
The accompanying notes to financial statements are an integral part of this statement.
21
Brandes Separately Managed Account Reserve Trust
NOTES TO FINANCIAL STATEMENTS
NOTE 1 – ORGANIZATION
The Separately Managed Account Reserve Trust (the “Fund”) is a series of Brandes Investment Trust (the “Trust”). The Trust is registered under the Investment Company Act of 1940, as amended (the “1940 Act”), as a diversified, open-end management investment company. The Fund began operations on October 3, 2005. The Fund invests its assets primarily in debt securities and seeks to maximize total return.
NOTE 2 – SIGNIFICANT ACCOUNTING POLICIES
The Fund is an investment company that applies the accounting and reporting guidance issued in Topic 946, “Financial Services-Investment Companies”, by the Financial Accounting Standards Board (“FASB”). The following is a summary of significant accounting policies consistently followed by the Fund. These policies are in conformity with generally accepted accounting principles (“GAAP”) in the United States of America.
| | A. | Repurchase Agreements. The Fund may enter into repurchase agreements with government securities dealers recognized by the Federal Reserve Board, with member banks of the Federal Reserve System or with other brokers or dealers that meet the credit guidelines established by the Board of Trustees. Each Fund will always receive and maintain, as collateral, U.S. Government securities whose market value, including accrued interest (which is recorded in the Schedules of Investments), will be at least equal to 100% of the dollar amount invested by the Fund in each agreement, and the Fund will make payment for such securities only upon physical delivery or upon evidence of book entry transfer to the account of the Fund’s custodian. If the term of any repurchase transaction exceeds one business day, the value of the collateral is marked-to-market on a daily basis to ensure the adequacy of the collateral. Before causing the Fund to enter into a repurchase agreement with any other party, the investment advisor will determine that such party does not have any apparent risk of becoming involved in bankruptcy proceedings within the time frame contemplated by the repurchase agreement. If the seller defaults and the value of the collateral declines, or if bankruptcy proceedings are commenced with respect to the seller of the security, realization of the collateral by the Fund may be delayed or limited. At March 31, 2022, the Fund did not invest in repurchase agreements. |
| | B. | Foreign Currency Translation and Transactions. Values of investments denominated in foreign currencies are converted into U.S. dollars using the spot market rates of exchange at the time of valuation. Purchases and sales of investments and dividend and interest income are translated into U.S. dollars using the spot market rates of exchange prevailing on the respective dates of such translations. The gain or loss resulting from changes in foreign exchange |
22
Brandes Separately Managed Account Reserve Trust
NOTES TO FINANCIAL STATEMENTS — (continued)
rates is included with net realized and unrealized gain or loss from investments, as appropriate. Foreign securities and currency transactions may involve certain considerations and risks not typically associated with those of domestic origin.
Foreign securities are recorded in the financial statements after translation to U.S. dollars based on the applicable exchange rate at the end of the period. The Fund reports certain foreign currency-related transactions as components of realized gains or losses for financial reporting purposes, whereas such components are treated as ordinary income for federal income tax purposes.
| C. | Delayed Delivery Securities. The Fund may purchase securities on a when issued or delayed delivery basis. “When-issued” or delayed delivery refers to securities whose terms are available and for which a market exists, but that have not been issued. For a when-issued or delayed delivery transaction, no payment is made until delivery date, which is typically longer than the normal course of settlement. When the Fund enters into an agreement to purchase securities on a when-issued or delayed delivery basis, the Fund segregates cash or liquid securities, of any type or maturity, equal in value to the Fund’s commitment. Losses may arise if the market value of the underlying securities change, if the counterparty does not perform under the contract, or if the issuer does not issue the securities due to political, economic, or other factors. The Fund did not have any open commitments on delayed delivery securities as of March 31, 2022. |
| D. | Security Transactions, Dividends and Distributions. Security transactions are accounted for on the trade dates. Realized gains and losses are evaluated on the basis of identified costs. Distributions from net investment income are declared daily and paid monthly. Distributions of net realized gains, if any, are declared at least annually. Dividend income and distributions to shareholders are recorded on the ex-dividend dates. Interest is recorded on an accrual basis. The Fund amortizes premiums and accretes discounts using the constant yield method. |
| E. | Use of Estimates. The preparation of financial statements in conformity with GAAP requires management to make estimates and assumptions that affect the reported amounts of assets and liabilities at the date of the financial statements and reported amounts of income and expenses during the reporting period. Actual results could differ from those estimates and assumptions. |
| F. | Indemnification Obligations. Under the Trust’s organizational documents, its current and former officers and trustees are indemnified against certain liabilities arising out of the performance of their duties to the Trust. The Trust |
23
Brandes Separately Managed Account Reserve Trust
NOTES TO FINANCIAL STATEMENTS — (continued)
has indemnified its trustees against any expenses actually and reasonably incurred by the trustees in any proceeding arising out of or in connection with the trustees’ service to the Trust. In addition, in the normal course of business, the Trust enters into contracts that contain a variety of representations and warranties and provide general indemnifications. The Fund’s maximum exposure under these arrangements is unknown as this would involve future claims that may be made against the Fund that have not yet occurred or that would be covered by other parties.
| G. | Accounting for Uncertainty in Income Taxes. The Fund has elected to be taxed as a “regulated investment company” and intends to distribute substantially all its taxable income to its shareholders and otherwise comply with the provisions of the Internal Revenue Code applicable to regulated investment companies. The Fund may be subject to a nondeductible excise tax calculated as a percentage of certain undistributed amounts of net investment income and net capital gains. The Fund intends to distribute its net investment income and capital gains as necessary to avoid this excise tax. Therefore, no provision for federal income taxes or excise taxes has been made. |
The Trust analyzes all open tax years, as defined by the applicable statute of limitations, for all major jurisdictions. Open tax years for the Fund are those that are open for exam by taxing authorities (2018 through 2021). As of March 31, 2022 the Trust has no examinations in progress.
Management has analyzed the Trust’s tax positions, and has concluded that no liability should be recorded related to uncertain tax positions expected to be taken on the tax return for the fiscal year-ended September 30, 2021.
The Trust identifies its major tax jurisdictions as the U.S. Government and the State of California. The Fund is not aware of any tax positions for which it is reasonably possible that the total amounts of unrecognized tax benefits will significantly change in the next twelve months.
| H. | Fair Value Measurements. The Trust has adopted GAAP accounting principles related to fair value accounting standards which establish a definition of fair value and set out a hierarchy for measuring fair value. These standards require additional disclosures about the various inputs and valuation techniques used to develop the measurements of fair value and a discussion of changes in valuation techniques and related inputs during the period. These inputs are summarized in the three broad levels listed below: |
Level 1—Fair value measurement within Level 1 should be based on an unadjusted quoted price in an active market that the Fund has the ability to access for the asset or liability at the measurement date. Because a quoted price alone forms the basis for the measurement, the access requirement
24
Brandes Separately Managed Account Reserve Trust
NOTES TO FINANCIAL STATEMENTS — (continued)
within Level 1 limits discretion in pricing the asset or liability, including in situations in which there are multiple markets for the asset or liability with different prices and no single market represents a principal market for the asset or liability. Importantly, the FASB has indicated that when a quoted price in an active market for a security is available, that price should be used to measure fair value without regard to an entity’s intent to transact at that price.
Level 2—Fair value measurement within Level 2 should be based on all inputs other than unadjusted quoted prices included within Level 1 that are observable for the asset or liability. Other significant observable market inputs include quoted prices for similar instruments in active markets, quoted adjusted prices in active markets, quoted prices for identical or similar instruments in markets that are not active, and model derived valuations in which the majority of significant inputs and significant value drivers are observable in active markets.
Level 3—Fair value measurement within Level 3 should be based on unobservable inputs in such cases where markets do not exist or are illiquid. Significant unobservable inputs include model derived valuations in which the majority of significant inputs or significant value drivers are unobservable. Unobservable inputs are those inputs that reflect the Fund’s own assumptions that market participants would use to price the asset or liability based on the best available information.
| I. | Security Valuation. Fixed income securities including corporate, convertible and municipal bonds and notes, U.S. government agencies, U.S. Treasury obligations, sovereign issues, bank loans, convertible preferred securities and non-U.S. bonds are normally valued on the basis of quotes obtained from brokers and dealers or independent pricing services or sources. Independent pricing services typically use information provided by market makers or estimates of market values obtained from yield data relating to investments or securities with similar characteristics. The service providers’ internal models use inputs that are observable such as, among other things, issuer details, interest rates, yield curves, prepayment speeds, credit risks/ spreads, default rates and quoted prices for similar assets. Securities that use similar valuation techniques and inputs as described above are categorized as Level 2 of the fair value hierarchy. |
Fixed income securities purchased on a delayed-delivery basis are typically marked to market daily until settlement at the forward settlement date.
Repurchase agreements and demand notes, for which neither vendor pricing nor market maker prices are available, are valued at amortized cost on the day of valuation, unless Brandes Investment Partners, L.P. (the “Advisor”)
25
Brandes Separately Managed Account Reserve Trust
NOTES TO FINANCIAL STATEMENTS — (continued)
determines that the use of amortized cost valuation on such day is not appropriate (in which case such instrument is fair valued in accordance with the fair value procedures of the Trust).
Mortgage and asset-backed securities are usually issued as separate tranches, or classes, of securities within each package of underlying securities. These securities are also normally valued by pricing service providers that use broker-dealer quotations or valuation estimates from their internal pricing models. The pricing models for these securities usually consider tranche level attributes, estimated cash flows and market based yield spreads for each tranche, current market data and packaged collateral performance, as available. Mortgage and asset-backed securities that use such valuation techniques and inputs are categorized as Level 2 of the fair value hierarchy only if there are significant observable inputs used.
Common stocks, exchange-traded fund shares and financial derivative instruments, such as futures contracts or options contracts that are traded on a national securities or commodities exchange, are valued at the last reported sales price, in the case of common stocks and exchange-traded fund shares, or, in the case of futures contracts or options contracts, the settlement price determined by the relevant exchange. Securities listed on the NASDAQ National Market System for which market quotations are readily available are valued using the NASDAQ Official Closing Price. To the extent these securities are actively traded and valuation adjustments are not applied, they are categorized as Level 1 of the fair value hierarchy.
Valuation adjustments may be applied to certain securities that are solely traded on a foreign exchange to account for the market movement between the close of the foreign market and the close of the New York Stock Exchange (“NYSE”). These securities are generally valued using pricing service providers that consider the correlation of the trading patterns of the foreign security to the intraday trading in the U.S. markets for investments. Securities using these valuation adjustments are categorized as Level 2 of the fair value hierarchy. None of the Fund’s securities were fair valued utilizing this method as of March 31, 2022.
Investments in registered open-end management investment companies are valued based upon the Net Asset Values (“NAVs”) of such investments and are categorized as Level 1 of the fair value hierarchy. If, on a particular day, a share price of an investment company is not readily available, such securities are fair valued in accordance with the fair value procedures of the Trust.
Certain securities may be fair valued in accordance with the fair valuation procedures approved by the Board of Trustees. The Fair Valuation Committee is generally responsible for overseeing the day to day valuation
26
Brandes Separately Managed Account Reserve Trust
NOTES TO FINANCIAL STATEMENTS — (continued)
processes and reports periodically to the Board. The Fair Valuation Committee is authorized to make all necessary determinations of the fair value of portfolio securities and other assets for which market quotations are not readily available or if it is deemed that the prices obtained from brokers and dealers or independent pricing services are unreliable.
In using fair value pricing, the Fund attempts to establish the price that it might reasonably have expected to receive upon a sale of the security at 4:00 p.m. Eastern time. Valuing securities at fair value involves greater reliance on judgment than valuation of securities based on readily available market quotations. When using fair value to price securities, the Fund may value those securities higher or lower than another fund using market quotations or fair value to price the same securities. Further, there can be no assurance that the Fund could obtain the fair value assigned to a security if it were to sell the security at approximately the time at which the Fund determines its net asset value.
The following is a summary of the level inputs used, as of March 31, 2022, involving the Fund’s assets carried at fair value. The inputs used for valuing securities may not be an indication of the risk associated with investing in those securities.
| | | | | | | | | | | | | | | | |
Description | | Level 1 | | | Level 2 | | | Level 3 | | | Total | |
Seperately Managed Account | | | | | | | | | | | | | | | | |
Reserve Trust | | | | | | | | | | | | | | | | |
Common Stocks | | $ | 2,982 | | | $ | — | | | | $— | | | $ | 2,982 | |
Asset Backed Securities | | | — | | | | 4,763,440 | | | | — | | | | 4,763,440 | |
Corporate Bonds | | | — | | | | 101,272,620 | | | | — | | | | 101,272,620 | |
Government Securities | | | — | | | | 48,175,020 | | | | — | | | | 48,175,020 | |
Convertible Bonds | | | — | | | | 4,318,414 | | | | — | | | | 4,318,414 | |
Foreign Issuer Bonds | | | — | | | | 2,210,745 | | | | — | | | | 2,210,745 | |
Mortgage Backed Securities | | | — | | | | 5,988,118 | | | | — | | | | 5,988,118 | |
Short-Term Investments | | | 1,518,753 | | | | — | | | | — | | | | 1,518,753 | |
| | | | | | | | | | | | | | | | |
| | | | |
Total Investments in Securities | | $ | 1,521,735 | | | $ | 166,728,357 | | | | $— | | | $ | 168,250,092 | |
| | | | | | | | | | | | | | | | |
There were no Level 3 securities in the Fund at the beginning or the end of the period ended March 31, 2022.
NOTE 3 – INVESTMENT ADVISORY FEE AND OTHER TRANSACTIONS WITH AFFILIATES
| | A. | Advisor Fee. The Advisor provides the Fund with investment management services under an Investment Advisory Agreement. The Advisor receives no advisory fee or other fee from the Fund. The financial statements of the Fund reflect the fact that no fees or expenses are incurred by the Fund. It should be understood, however, that the Fund is an integral part of “wrap-fee” programs sponsored by investment advisors unaffiliated with the Fund and the Advisor. |
27
Brandes Separately Managed Account Reserve Trust
NOTES TO FINANCIAL STATEMENTS — (continued)
Typically, participants in these programs pay a “wrap-fee” to their investment advisors. Although the Fund does not compensate the Advisor directly for its service under the Investment Advisory Agreement, the Advisor benefits from its relationships with the sponsors of wrap-fee programs for which the Fund is an investment option. Certain officers and Trustees of the Trust are also officers of the Advisor.
| | B. | Administration Fee. The Northern Trust Company (the “Administrator”) acts as the administrator for the Fund. The Administrator prepares various federal and state regulatory filings; prepares reports and materials to be supplied to the Trustees; monitors the activities of the Fund’s custodian, transfer agent and accountant; coordinates the preparation and payment of Fund expenses; and prepares several Fund reports. The Advisor compensates the Administrator on behalf of the Fund for the services the Administrator performs for the Fund. |
| | C. | Distribution Fees. ALPS Distributors, Inc. (the “Distributor”), a registered broker-dealer, acts as the Fund’s principal underwriter in a continuous public offering of the Fund’s shares. All of the Fund’s distribution fees are paid by the Advisor. |
NOTE 4 – PURCHASES AND SALES OF SECURITIES
The cost of purchases and the proceeds from sales of securities of the Fund,excluding short-term investments, were as follows for the period ended March 31, 2022:
| | | | | | |
| U.S. Government | | Other |
| Purchases | | Sales | | Purchases | | Sales |
| $— | | $13,217,617 | | $23,168,203 | | $11,938,630 |
NOTE 5 – CAPITAL STOCK TRANSACTIONS
The Fund’s capital stock activity in shares and dollars during the six month period ended March 31, 2022 and the year ended September 30, 2021, was as follows (shares and dollar amounts in thousands):
| | | | | | | | | | | | | | | | |
| | | Six Months
Ended
3/31/2022 | | | Year Ended
9/30/2021 | |
| | | Shares | | | Amount | | | Shares | | | Amount | |
Shares Sold | | | 1,478 | | | $ | 12,704 | | | | 3,846 | | | $ | 34,103 | |
Issued on Reinvestment of Distributions | | | 313 | | | | 2,684 | | | | 679 | | | | 6,014 | |
Shares Redeemed | | | (2,387 | ) | | | (20,565 | ) | | | (3,689 | ) | | | (32,674 | ) |
| | | | | | | | | | | | | | | | |
| | | | |
Net Increase/(Decrease) Resulting from Fund Share Transactions | | | (596 | ) | | $ | (5,177 | ) | | | 836 | | | $ | 7,443 | |
| | | | | | | | | | | | | | | | |
28
Brandes Separately Managed Account Reserve Trust
NOTES TO FINANCIAL STATEMENTS — (continued)
NOTE 6 – FEDERAL INCOME TAX MATTERS
GAAP requires that certain components of net assets be reclassified between financial and tax reporting. Temporary differences do not require reclassification. Temporary and permanent differences have no effect on net assets or net asset value per share. For the year ended September 30, 2021, the Fund made the following permanent book-to-tax reclassifications primarily related to the treatment of paydowns, the difference between book and tax accretion methods for market premium and the expiration of capital loss carryforwards:
| | | | |
Undistributed Net
Investment Income | | Accumulated Net
Realized Loss | | Paid-In Capital |
| $186,822 | | $(158,761) | | $(28,061) |
As of September 30, 2021, the Fund’s components of distributable earnings on a tax basis were as follows:
| | | | |
Cost of investments for tax purposes | | $ | 180,158,933 | |
| | | | |
| |
Gross tax unrealized appreciation | | | 10,614,300 | |
Gross tax unrealized depreciation | | | (1,983,675 | ) |
| | | | |
Net unrealized appreciation (depreciation) | | | 8,630,625 | |
Distributable ordinary income | | | — | |
Distributable long-term capital gains | | | — | |
| | | | |
| |
Total distributable earnings | | | — | |
| | | | |
| |
Other accumulated losses | | | (8,975,577 | ) |
| | | | |
| |
Total accumulated losses | | $ | (344,952 | ) |
| | | | |
The differences between book and tax basis distributable earnings are primarily related to the differences in classification of paydown gains and losses for tax purposes compared to book purposes. These differences are temporary.
As of September 30, 2021, the Fund had a capital loss carryforward with an indefinite expiration in the amount of $8,975,577. During the tax year ended September 30, 2021, the Fund utilized $2,871,334 in capital loss carryforwards. At September 30, 2021, the Fund did not have capital loss carryforwards expire.
The tax compositions of dividends for the years ended September 30, 2021 and September 30, 2020 for the Fund were as follows:
| | | | | | |
| Ordinary Income | | Long Term
Capital Gains |
| 2021 | | 2020 | | 2021 | | 2020 |
| $6,546,146 | | $6,313,021 | | $— | | $— |
29
Brandes Separately Managed Account Reserve Trust
NOTES TO FINANCIAL STATEMENTS — (continued)
NOTE 7 – RISK FACTORS
The respiratory illness COVID-19 caused by a novel coronavirus has resulted in a global pandemic and caused major disruptions to economies and markets around the world, including the United States. Financial markets have experienced and may continue to experience extreme volatility and severe losses, and trading in many instruments was and may continue to be disrupted as a result. Liquidity for many instruments was and may continue to be greatly reduced for extended periods of time. Some interest rates are very low and in some cases yields are negative. Some sectors of the economy and individual issuers have experienced and may continue to experience particularly large losses. These circumstances may continue for an extended period of time, and may continue to affect adversely the value and liquidity of the fund’s investments. The ultimate economic fallout from the pandemic, and the long-term impact on economies, markets, industries and individual issuers, are not known. Governments and central banks, including the Federal Reserve in the U.S., have taken extraordinary and unprecedented actions to support local and global economies and the financial markets. These actions have resulted in significant expansion of public debt, including in the United States. The long-term consequences of this level of public debt are not known. In addition, certain interest rates have been reduced to very low levels. The impact of these measures, and whether they will be effective to mitigate the economic and market disruption, will not be known for some time.
Recent events relating to the armed conflict in Ukraine and the global economic sanctions that have resulted may adversely impact global economic and market activity, and contribute to significant volatility in financial markets. The impact of the conflict has been rapidly evolving, and the ultimate economic fallout and long-term impact on economies, markets, industries and individual companies, are not known.
NOTE 8 – SUBSEQUENT EVENTS
In preparing these financial statements, the Trust has evaluated events and transactions for potential recognition or disclosure through the date the financial statements were available to be issued. The Trust has concluded that there are no subsequent events to note.
30
Brandes Separately Managed Account Reserve Trust
ADDITIONAL INFORMATION — (Unaudited)
BOARD CONSIDERATIONS AND CONTINUATION OF INVESTMENT ADVISORY AGREEMENT - SMART
In November, 2021, the Board of Trustees of Brandes Investment Trust (“Trust”), including the independent Trustees, unanimously approved renewal of the Investment Advisory Agreement (“Agreement”) between the Trust and Brandes Investment Partners, L.P. (“Adviser”) for an additional one-year term with respect to the Separately Managed Account Reserve Trust, a series of the Trust (the “Fund”).
Information Reviewed
During the course of each year, the Board receives and reviews a wide variety of materials relating to the nature, quality and extent of the services provided by the Adviser to the Fund, including reports on investment results, portfolio composition, portfolio trading practices, and other matters. In addition, in connection with the Board’s annual review of the Agreement, the Trustees requested and reviewed supplementary information from the Adviser that included materials and analysis about the Fund’s investment results and advisory fees; information about the services provided by the Adviser to the Fund, such as compliance monitoring and portfolio trading practices, and the risks assumed by the Adviser in connection with those services; information about the services provided and the fees charged by the Adviser to its institutional and other clients employing similar strategies, including comparisons of those services and fees to the services and fees for the Fund; financial and profitability information regarding the Adviser and its relationship with the Fund; and information about the Adviser’s investment and other personnel providing services to the Fund, as well as the Adviser’s practices to evaluate and compensate its investment personnel. The Trustees also obtained and reviewed information from FUSE Research Network LLC, an independent third party data provider, comparing the Fund’s investment results and fees and expenses to those of peer groups and categories of funds identified by FUSE as similar to the Fund.
In connection with the Board’s reviews, the Trustees received assistance and advice regarding legal and industry standards from counsel to the Trust and the independent Trustees. The Board discussed the approval of the Agreement with respect to the Fund with representatives of the Adviser at two Board meetings, and the independent Trustees discussed the Agreement in multiple private sessions with counsel at which no representatives of the Adviser were present. In deciding to approve the Agreement with respect to the Fund, the Board and the independent Trustees did not identify any single or particular piece of information that, in isolation, was the controlling factor, and each Trustee may have attributed different weight to each factor considered. This summary describes the most important, but not all, of the factors considered by the Board and the independent Trustees.
31
Brandes Separately Managed Account Reserve Trust
ADDITIONAL INFORMATION — (Unaudited) (continued)
Nature, Quality and Extent of Services
The Trustees considered the overall nature, quality and extent of services provided by the Adviser to the Fund. They considered, among other things, the quality and depth of the Adviser’s investment, compliance and other personnel, the Adviser’s regulatory compliance resources and program, the Adviser’s business continuity and cyber-security programs, and the day-to-day administrative services provided to the Fund.
With respect to the Fund’s investment results, the Trustees reviewed and considered detailed information provided by FUSE, which utilized Morningstar data, comparing the Fund’s investment results to those of a peer group of similarly managed funds selected by FUSE, a larger group of funds selected by FUSE in the same investment classification as the Fund, and the Fund’s benchmark index. The Trustees also met with representatives of FUSE, and discussed with them the methodology used by FUSE in determining the Fund’s peer group and category. The FUSE report included confirmation that FUSE had selected peer group and category funds for comparison to the Fund independently of the Adviser. The Trustees noted that while the FUSE information covered both peer group and universe funds, the Trustees focused more on the peer group information because the peer group funds were more directly comparable to the Fund.
The Trustees considered that for the one-, five- and ten-year periods ended September 30, 2021, and since inception, the investment results of the Fund’s single class of shares were above the median of the funds in its peer group and also ahead of benchmark.
In evaluating the Fund’s performance, the Trustees generally considered long-term performance to be more important than short-term performance, but noted that short-term performance may be helpful in showing an improving trend. The Trustees noted the Adviser’s continued commitment to the Graham and Dodd value strategy of investment management and its lack of style drift compared to other value managers; considered that it is not unusual for the performance of funds managed with such a long-term strategy to fall below performance measurement indices for some periods; and noted the Adviser’s observations regarding the market environment in recent years, including the extended period that the value strategy has been out of favor in the market. They also noted that the Fund’s investment approach is fully described in the prospectus, enabling Fund shareholders to decide if they are willing to accept the long-term outlook associated with the Adviser’s investment approach.
Based on these reviews, the Trustees determined that under all of the circumstances the nature and quality of the services provided by the Adviser were sufficient for renewal of the Fund’s investment advisory agreement.
32
Brandes Separately Managed Account Reserve Trust
ADDITIONAL INFORMATION — (Unaudited) (continued)
Advisory Fees, Total Expenses, Profitability and Ancillary Benefits
With respect to advisory fees, the Trustees considered that investors in the Fund must be clients of wrap account programs sponsored by broker-dealers which have agreements with the Adviser or certain other persons or entities. They considered that the Fund does not pay advisory fees or other expenses, all of which are borne by the Adviser, but that investors pay management fees and other expenses at the wrap account level, and that the Adviser receives compensation from the wrap program sponsors and others. The Trustees determined that the Fund’s advisory fees and total expense levels were fair and reasonable in light of the structure of the product. The Trustees also concluded that there was a reasonable sharing of any efficiencies or economies of scale at this time in light of the structure of the product.
The Trustees reviewed and considered information about the Adviser’s financial capability to continue to provide services to the Fund, as well as an analysis of the profitability to the Adviser of its relationship with the Fund. The Trustees considered information regarding the ancillary benefits to the Adviser from its relationship with the Fund, which primarily related to compensation from wrap program sponsors that offer the Fund. The Trustees concluded that the Adviser’s profitability from its relationship with the Fund is not excessive and that any ancillary benefits received are reasonable under the circumstances.
Conclusions
Based on their review, including consideration of the factors identified above, the Board and the independent Trustees concluded in the exercise of their reasonable business judgment that the Agreement is fair and reasonable to the Fund and its shareholders, and that renewal of the Agreement is in the best interests of the Fund and its shareholders.
PROXY VOTING PROCEDURES
The Advisor votes proxies relating to the Fund’s portfolio securities in accordance with procedures adopted by the Advisor. You may obtain a description of these procedures, free of charge, by calling toll-free 1-800-331-2979. This information is also available through the Commission’s website at http://www.sec.gov.
Information regarding how the Trust voted proxies relating to portfolio securities during the most recent 12-month period ended June 30 is available without charge, upon request, by calling 1-800-331-2979. This information is also available through the Commission’s website at http://www.sec.gov.
PORTFOLIO HOLDINGS DISCLOSURE
The Trust files the Fund’s complete schedule of portfolio holdings with the Commission for the first and third quarters of each fiscal year on Form N-PORT. The Trust’s Form N-PORT filings are available on the Commission’s website at
33
Brandes Separately Managed Account Reserve Trust
ADDITIONAL INFORMATION — (Unaudited) (continued)
http://www.sec.gov. Information regarding the Trust’s Form N-PORT filings is also available, without charge, by calling toll-free, 1-800-331-2979.
34
Brandes Separately Managed Account Reserve Trust
TRUSTEES AND OFFICERS INFORMATION — (Unaudited)
The Board is responsible for the overall management of the Trust’s business. The Board approves all significant agreements between the Trust and persons or companies furnishing services to it, including the agreements with the Advisor, Administrator, the Trust’s Custodian, Distributor and Transfer Agent. The Board delegates the day-to-day operations of the Trust to its officers, subject to the Fund’s investment objective and policies and to general supervision by the Board. The Trust’s Statement of Additional Information includes additional information about the Trustees and is available, without charge, by calling 1-800-331-2979 or visiting www.brandes.com.
The Trustees and officers of the Trust, their business addresses and principal occupations during the past five years are:
| | | | | | | | | | |
Name, Address and Age | | Position(s)
Held with
Trust | | Term of Office and Length of Time Served(1) | | Principal Occupation During Past 5 Years | | Number
of Trust
Series
Overseen
by Trustee | | Other
Directorships/
Trusteeships
Held by
Trustee |
| | | | | | | | | | | |
| Independent Trustees(2) | | | | | | |
| | | | | |
Gregory Bishop, CFA 4275 Executive Square, 5th Floor La Jolla, CA 92037 (1961) | | Trustee | | Since January 2017 | | Retired. Previously Executive Vice President and Head of Retail Business, PIMCO Investments, from 1997 to 2014 | | 8 | | None |
| | | | | |
Robert M. Fitzgerald 4275 Executive Square, 5th Floor La Jolla, CA 92037 (1952) | | Trustee | | Since April 2008 | | Retired from 2002- 2005 and since 2007; Chief Financial Officer of National Retirement Partners from 2005 to 2007. | | 8 | | Hotchkis
and Wiley
Funds (10
portfolios). |
| | | | | |
Craig Wainscott, CFA 4275 Executive Square, 5th Floor La Jolla, CA 92037 (1961) | | Trustee and
(beginning
January
2018)
Chairman
of the
Board | | Since February 2012 | | Retired from Russell Investments, Managing Director, US Mutual Funds; Currently Partner with The Paradigm Project and advisor to early-stage companies. | | 8 | | None |
35
Brandes Separately Managed Account Reserve Trust
TRUSTEES AND OFFICERS INFORMATION — (Unaudited) (continued)
| | | | | | | | | | |
Name, Address and Age | | Position(s)
Held with
Trust | | Term of Office and Length of Time Served(1) | | Principal Occupation During Past 5 Years | | Number
of Trust
Series
Overseen
by Trustee | | Other
Directorships/
Trusteeships
Held by
Trustee |
| | | | | | | | | | | |
“Interested” Trustees(3) | | | | | | |
| | | | | |
Jeff Busby, CFA 4275 Executive Square, 5th Floor La Jolla, CA 92037 (1961) | | Trustee and
President | | Since July 2006 Since February 2012 | | Executive Director of the Advisor since January 2004. | | 8 | | None |
| | | | | |
Oliver Murray 4275 Executive Square, 5th Floor La Jolla, CA 92037 (1961) | | Trustee | | Since February 2012 | | CEO, Brandes Investment Partners & Co. since 2002; Managing Director - PCPM of the Advisor since 2011. | | 8 | | None |
| | | | | |
Officers of the Trust | | | | | | | | | | |
| | | | | |
Thomas M. Quinlan 4275 Executive Square, 5th Floor La Jolla, CA 92037 (1970) | | Secretary | | Since June 2003 | | Associate General Counsel of the Advisor since January 2006. | | N/A | | N/A |
| | | | | |
Gary Iwamura, CPA 4275 Executive Square, 5th Floor La Jolla, CA 92037 (1956) | | Treasurer | | Since September 1997 | | Consultant to the Advisor since January 2022; Finance Director of the Advisor from 1997 to 2021. | | N/A | | N/A |
| | | | | |
Roberta Loubier 4275 Executive Square, 5th Floor La Jolla, CA 92037 (1971) | | Chief
Compliance
Officer and
Anti-
Money
Laundering
Officer | | Since September 2015 | | Global Head of Compliance of the Advisor. | | N/A | | N/A |
| (1) | Trustees and officers of the Fund serve until their resignation, removal or retirement. |
| (2) | Not “interested persons” of the Trust as defined in the 1940 Act. |
| (3) | “Interested persons” of the Trust as defined in the 1940 Act. Jeff Busby is an interested person of the Trust because he is the President of the Trust and the Executive Director of the Advisor. Oliver Murray is an interested person of the Trust, because he is the Managing Director of the Advisor. |
36
Brandes Separately Managed Account Reserve Trust
PRIVACY NOTICE
Brandes Investment Trust and Brandes Investment Partners, L.P. may collect non-public information about you from the following sources:
| ● | Information we receive about you on applications or other forms; |
| ● | Information you give us orally; and |
| ● | Information about your transactions with us. |
We do not disclose any non-public personal information about any shareholder or former shareholder of the Fund without the shareholder’s authorization, except as required by law or in response to inquiries from governmental authorities. We restrict access to your personal and account information to those employees who need to know that information to provide products and services to you. We also may disclose that information to unaffiliated third parties (such as to brokers or custodians) only as permitted by law and only as needed for us to provide agreed services to you. We maintain physical, electronic and procedural safeguards to guard your non-public personal information.
If you hold shares of the Fund through a financial intermediary, such as a broker-dealer, bank, or trust company, the privacy policy of your financial intermediary governs how your non-public personal information would be shared with nonaffiliated third parties.
37

ADVISOR
Brandes Investment Partners, L.P. 4275 Executive Square, 5th Floor La Jolla, CA 92037 800.331.2979
DISTRIBUTOR
ALPS Distributors, Inc. 1290 Broadway, #1100 Denver, CO 80203
TRANSFER AGENT
The Northern Trust Company 333 South Wabash Avenue, W-38 Chicago, IL 60604
INDEPENDENT REGISTERED PUBLIC ACCOUNTING FIRM
PricewaterhouseCoopers LLP 601 South Figueroa Street Los Angeles, CA 90017
LEGAL COUNSEL
Morgan, Lewis & Bockius LLP One Federal Street Boston, MA 02110
This report is intended for shareholders of the Brandes Separately Managed Account Reserve Trust and may not be used as sales literature unless preceded or accompanied by a current prospectus.
Statements and other information herein are dated and are subject to change.
BITS 03/31
(b) Not applicable.
Item 2. Code of Ethics.
Not applicable for semi-annual reports.
Item 3. Audit Committee Financial Expert.
Not applicable for semi-annual reports.
Item 4. Principal Accountant Fees and Services.
Not applicable for semi-annual reports.
Item 5. Audit Committee of Listed Registrants.
Not applicable to registrants who are not listed issuers (as defined in Rule 10A-3 under the Securities Exchange Act of 1934).
Item 6. Investments.
| (a) | Schedule I – Investments in securities of unaffiliated issuers is included as part of the reports to shareholders filed under Item 1 of this Form. |
Item 7. Disclosure of Proxy Voting Policies and Procedures for Closed-End Management Investment Companies.
Not applicable to open-end investment companies.
Item 8. Portfolio Managers of Closed-End Management Investment Companies.
Not applicable to open-end investment companies.
Item 9. Purchases of Equity Securities by Closed-End Management Investment Company and Affiliated Purchasers.
Not applicable to open-end investment companies.
1
Item 10. Submission of Matters to a Vote of Security Holders.
There have been no material changes to the procedures by which shareholders may recommend nominees to the registrant’s Board of Trustees.
Item 11. Controls and Procedures.
| (a) | The registrant’s President and Treasurer have reviewed the Registrant’s disclosure controls and procedures (as defined in Rule 30a-3(c) of the Investment Company Act of 1940 (“the Act”)) as of a date within 90 days of the filing date of this report, as required by 30a-3(b) under the Act and Rules 13a-15(b) or 15d-15(b) under the Securities Exchange Act of 1934. Based on their review, such officers have concluded that the disclosure controls and procedures are effective in ensuring that information required to be disclosed in this report is appropriately recorded, processed, summarized and reported and made known to them by others within the Registrant and by the Registrant’s service provider. |
| (b) | No changes in the registrant’s internal control over financial reporting (as defined in Rule 30a-3(d) under the Act) occurred during the period covered by this report that materially affected or are reasonably likely to materially affect, the registrant’s internal control over financial reporting. |
Item 12. Disclosure of Securities Lending Activities for Closed-End Management Investment Companies.
Not applicable to open-end investment companies.
Item 13. Exhibits.
| (a)(1) | Not applicable – only for annual reports. |
| (a)(3) | Not applicable to open-end investment companies. |
| (a)(4) | There has been no change to the registrant’s independent public accountant. |
2
SIGNATURES
Pursuant to the requirements of the Securities Exchange Act of 1934 and the Investment Company Act of 1940, the registrant has duly caused this report to be signed on its behalf by the undersigned, thereunto duly authorized.
Brandes Investment Trust
| | |
| By: | | /s/ Jeff Busby |
| | Jeff Busby |
| | President and Principal Executive Officer |
Date: June 3, 2022
Pursuant to the requirements of the Securities Exchange Act of 1934 and the Investment Company Act of 1940, this report has been signed below by the following persons on behalf of the registrant and in the capacities and on the dates indicated.
| | |
| By: | | /s/ Jeff Busby |
| | Jeff Busby |
| | President and Principal Executive Officer |
Date: June 3, 2022
| | |
| By: | | /s/ Gary Iwamura |
| | Gary Iwamura |
| | Treasurer and Principal Financial Officer |
Date: June 3, 2022
3