UNITED STATES
SECURITIES AND EXCHANGE COMMISSION
Washington, D.C. 20549
FORMN-CSR
CERTIFIED SHAREHOLDER REPORT OF REGISTERED
MANAGEMENT INVESTMENT COMPANIES
Investment Company Act file number811-08614
Brandes Investment Trust
(Exact name of registrant as specified in charter)
11988 El Camino Real, Suite 600
San Diego, CA 92130
(Address of principal executive offices) (Zip code)
Lea Anne Copenhefer
Morgan, Lewis & Bockius LLP
One Federal Street
Boston, MA 02110-1726
(Name and address of agent for service)
800-331-2979
Registrant’s telephone number, including area code
Date of fiscal year end: September 30, 2019
Date of reporting period: March 31, 2019
Item 1. Reports to Stockholders.
SEMI-ANNUAL REPORT INTERNATIONAL EQUITY FUND GLOBAL EQUITY FUND GLOBAL EQUITY INCOME FUND GLOBAL OPPORTUNITIES VALUE FUND EMERGING MARKETS VALUE FUND INTERNATIONAL SMALL CAP EQUITY FUND SMALL CAP VALUE FUND CORE PLUS FIXED INCOME FUND For the six months ended March 31, 2019 Beginning in January 2021, as permitted by regulations adopted by the U.S. Securities and Exchange Commission, paper copies of the Funds’ annual and semi-annual shareholder reports will no longer be sent by mail, unless you specifically request paper copies of the reports. Instead, the reports will be made available on the Funds’ website (http://www.brandesfunds.com/literature.html), and you will be notified by mail each time a report is posted and provided with a website link to access the report. If you already elected to receive shareholder reports electronically, you will not be affected by this change and you need not take any action. You may elect to receive shareholder reports and other communications from the Funds electronically anytime by contacting your financial intermediary (such as a broker-dealer or a bank) or, if you are a direct investor, by calling 1-800-395-3807, sending an e-mail request to info@brandesfunds.com, or by enrolling at http://www.brandesfunds.com/literature.html. You may elect to receive all future reports in paper free of charge. If you invest through a financial intermediary, you can contact your financial intermediary to request that you continue to receive paper copies of your shareholder reports. If you invest directly with the Funds, you can call 1-800-395-3807 or send an email request to info@brandesfunds.com to let the Funds know you wish to continue receiving paper copies of your shareholder reports. Your election to receive reports in paper will apply to all Funds held in your account with that intermediary if you invest through your financial intermediary or all Funds held with the fund complex if you invest directly with the Funds.

Table of Contents
1
Brandes International Equity Fund
Dear Fellow Investor,
The net asset value of the Brandes International Equity Fund (Class I Shares) declined 5.03% in the six months ending March 31, 2019. For the same period, the MSCI EAFE Index fell 3.81%.
Portfolio holdings in the Diversified Telecommunication Services, Equity Real Estate Investment Trusts and Oil, Gas & Consumable Fuels industries were contributors to performance, while holdings in Capital Markets, Banks and Food & Staples Retailing detracted from returns.
Holdings in Brazil, Russia and Finland contributed to performance, while results were hampered by holdings in the United Kingdom, Switzerland and Japan.
Three of the largest individual contributors to performance were Fibra Uno Administracion SA de CV (Mexico — Equity Real Estate Investment Trusts), Telefonica Brasil SA (Brazil — Diversified Telecommunication Services) and Petroleo Brasileiro SA (Brazil — Oil, Gas & Consumable Fuels). Conversely, WPP Plc (United Kingdom — Media), Cemex SAB de CV (Mexico — Construction Materials) and UBS Group AG (Switzerland — Capital Markets) were three of the largest detractors from performance.
At the close of the period, the Fund’s largest country weights were in the United Kingdom and France, and the Fund’s largest industry weights were in Pharmaceuticals and Oil, Gas & Consumable Fuels. Please note that while macro conditions are considered when we determine valuation estimates for individual companies, our country and industry weightings are aby-product ofbottom-up stock selection, not the result oftop-down observations.
For 45 years, Brandes Investment Partners has had the same goal: Seek better-than-market returns to help you pursue your long-term investment goals. We believe steadfast adherence to our value investing approach can help us achieve this aim because it compels us to invest in companies we view as strong yet appealingly priced. We thank you for your confidence and for investing with us.
Sincerely yours,
The Brandes InternationalLarge-Cap Investment Committee
Brandes Investment Trust
Because the values of the Fund’s investments will fluctuate with market conditions, so will the value of your investment in the Fund. You could lose money on your investment in the Fund, or the Fund could underperform other investments. The values of the Fund’s investments fluctuate in response to the activities of individual companies and general stock market and economic conditions. In addition, the performance of foreign securities depends on the political and economic environments and other overall economic conditions in the countries where the Fund invests. Emerging
2
Brandes International Equity Fund
country markets involve greater risk and volatility than more developed markets. Some emerging markets countries may have fixed or managed currencies that are not free-floating against the U.S. dollar. Certain of these currencies have experienced, and may experience in the future, substantial fluctuations or a steady devaluation relative to the U.S. dollar. Value stocks typically are less volatile than growth stocks; however, issues of value stocks typically have a lower expected growth rate in earnings and sales than issues of growth stocks.
Please refer to the Schedule of Investments in the report for complete holdings information. Fund holdings, geographic allocations and/or sector allocations are subject to change at any time and are not considered a recommendation to buy or sell any security.
The foregoing reflects the thoughts and opinions of Brandes Investment Partners® exclusively and is subject to change without notice.
Brandes Investment Partners® is a registered trademark of Brandes Investment Partners, L.P. in the United States and Canada.
Must be preceded or accompanied by a prospectus.
Index Guide
The MSCI EAFE Index with net dividends captures large and mid cap representation of developed market countries excluding the U.S. and Canada.
MSCI has not approved, reviewed or produced this report, makes no express or implied warranties or representations and is not liable whatsoever for any data in the report. You may not redistribute the MSCI data or use it as a basis for other indices or investment products.
One cannot invest directly in an index.
The Brandes International Equity Fund is distributed by ALPS Distributors, Inc.
3
Brandes International Equity Fund
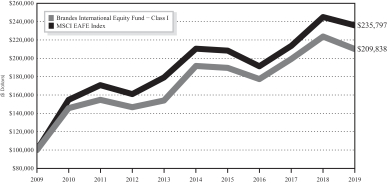
The following chart compares the value of a hypothetical $100,000 investment in the Brandes International Equity Fund – Class I from March 31, 2009 to March 31, 2019 with the value of such an investment in the MSCI EAFE (Europe, Australasia and Far East) Index for the same period.
Value of $100,000 Investment vs MSCI EAFE (Europe, Australasia and Far East) Index (Unaudited)
| | | | | | | | | | | | | | | | |
| | | Average Annual Total Return
Periods Ended March 31, 2019 | |
| | | One
Year | | | Five
Years | | | Ten
Years | | | Since
Inception(1) | |
Brandes International Equity Fund | | | | | | | | | | | | | | | | |
Class A* | | | -6.31 | % | | | 1.65 | % | | | 7.50 | % | | | 7.32 | % |
Class A* (with maximum sales charge) | | | -11.68 | % | | | 0.45 | % | | | 6.87 | % | | | 7.04 | % |
Class C* | | | -7.04 | % | | | 0.88 | % | | | 6.66 | % | | | 6.50 | % |
Class C* (with maximum sales charge) | | | -7.95 | % | | | 0.88 | % | | | 6.66 | % | | | 6.50 | % |
Class I | | | -6.14 | % | | | 1.83 | % | | | 7.69 | % | | | 7.55 | % |
Class R6* | | | -5.97 | % | | | 1.96 | % | | | 7.79 | % | | | 7.63 | % |
MSCI EAFE (Europe, Australasia, and Far East) Index | | | -3.71 | % | | | 2.33 | % | | | 8.96 | % | | | 4.54 | % |
| (1) | The inception date is January 2, 1997. |
| * | Performance shown prior to January 31, 2011 for Class A shares reflects the performance of Class I shares adjusted to reflect Class A expenses. Performance shown prior to January 31, 2013 for Class C shares reflects the performance of Class I shares adjusted to reflect Class C expenses. Performance shown prior to February 1, 2016 for Class R6 shares reflects the performance of Class I shares adjusted to reflect Class R6 expenses. |
Performance data quoted represents past performance; past performance does not indicate future results. The investment return and principal value of an investment will fluctuate so that an investor’s shares, when redeemed, may be worth more or less than their original cost. Current performance of the Fund may be lower or
4
Brandes International Equity Fund
higher than the performance quoted. Performance data current to the most recent month end may be obtained by calling 800-331-2979.
The returns shown do not reflect the deduction of taxes that a shareholder would pay on Fund distributions or the redemption of Fund shares. The Advisor has a fee waiver arrangement in place to limit the Fund’s annual operating expenses.
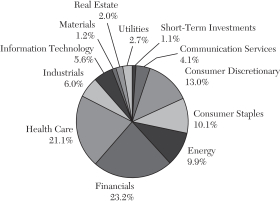
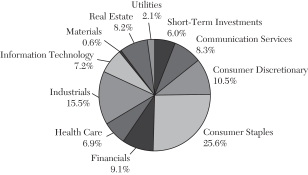
Sector Allocation as a Percentage of Total Investments as of
March 31, 2019 (Unaudited)
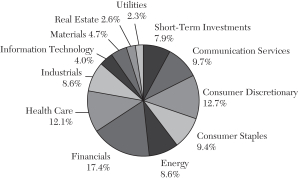
The sector classifications represented in the graph above are in accordance with Global Industry Classification Standard (GICS®), which was developed by and/or is the exclusive property of MSCI, Inc. and Standard & Poor Financial Services LLC.
5
Brandes Global Equity Fund
Dear Fellow Investor,
The net asset value of the Brandes Global Equity Fund (Class I Shares) fell 5.20% in the six months ending March 31, 2019. For the same period, the MSCI World Index declined 2.61%.
Portfolio holdings in the Pharmaceuticals, Equity Real Estate Investment Trusts and Construction Materials industries were contributors to performance, while holdings in Capital Markets, Banks and Oil, Gas & Consumable Fuels detracted from returns.
Holdings in Mexico, Ireland and Netherlands contributed to performance, while results were hampered by holdings in the United States, Switzerland and the United Kingdom.
Three of the largest individual contributors to performance were Merck & Co., Inc. (United States — Pharmaceuticals), Fibra Uno Administracion SA de CV (Mexico — Equity Real Estate Investment Trusts) and GlaxoSmithKline Plc (United Kingdom — Pharmaceuticals). Conversely, UBS Group AG (Switzerland — Capital Markets), Credit Suisse Group AG (Switzerland — Capital Markets) and Cigna Corp. (United States — Health Care Providers & Services) were three of the largest detractors from performance.
At the close of the period, the Fund’s largest country weights were in the United States and the United Kingdom, and the Fund’s largest industry weights were in Pharmaceuticals and Banks. Please note that while macro conditions are considered when we determine valuation estimates for individual companies, our country and industry weightings are aby-product ofbottom-up stock selection, not the result oftop-down observations.
Brandes Investment Partners has had the same goal since we started 45 years ago: Realize above-market gains to help you pursue your long-term investment objectives. We aim to do so by staying true to our value approach, which seeks fundamentally sound but potentially undervalued companies for the Fund. Thank you for investing with us.
Sincerely yours,
The Brandes GlobalLarge-Cap Investment Committee
Brandes Investment Trust
Because the values of the Fund’s investments will fluctuate with market conditions, so will the value of your investment in the Fund. You could lose money on your investment in the Fund, or the Fund could underperform other investments. The values of the Fund’s investments fluctuate in response to the activities of individual companies and general stock market and economic conditions. In addition, the performance of foreign securities depends on the political and economic environments and other overall
6
Brandes Global Equity Fund
economic conditions in the countries where the Fund invests. Emerging country markets involve greater risk and volatility than more developed markets. Some emerging markets countries may have fixed or managed currencies that are not free-floating against the U.S. dollar. Certain of these currencies have experienced, and may experience in the future, substantial fluctuations or a steady devaluation relative to the U.S. dollar. Value stocks typically are less volatile than growth stocks; however, issues of value stocks typically have a lower expected growth rate in earnings and sales than issues of growth stocks.
Please refer to the Schedule of Investments in the report for complete holdings information. Fund holdings, geographic allocations and/or sector allocations are subject to change at any time and are not considered a recommendation to buy or sell any security.
The foregoing reflects the thoughts and opinions of Brandes Investment Partners® exclusively and is subject to change without notice.
Brandes Investment Partners® is a registered trademark of Brandes Investment Partners, L.P. in the United States and Canada.
Must be preceded or accompanied by a prospectus.
Index Guide
The MSCI World Index with net dividends captures large and mid cap representation of developed markets.
MSCI has not approved, reviewed or produced this report, makes no express or implied warranties or representations and is not liable whatsoever for any data in the report. You may not redistribute the MSCI data or use it as a basis for other indices or investment products.
One cannot invest directly in an index.
The Brandes Global Equity Fund is distributed by ALPS Distributors, Inc.
7
Brandes Global Equity Fund
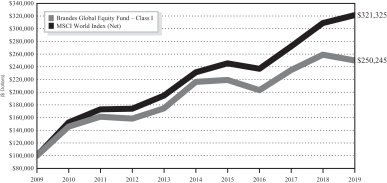
The following chart compares the value of a hypothetical $100,000 investment in the Brandes Global Equity Fund – Class I from March 31, 2009 to March 31, 2019 with the value of such an investment in the MSCI World Index for the same period.
Value of $100,000 Investment vs MSCI World Index (Unaudited)
| | | | | | | | | | | | | | | | |
| | | Average Annual Total Return
Periods Ended March 31, 2019 | |
| | | One
Year | | | Five
Years | | | Ten
Years | | | Since
Inception(1) | |
Brandes Global Equity Fund | | | | | | | | | | | | | | | | |
Class A* | | | -3.73 | % | | | 2.69 | % | | | 9.36 | % | | | 6.30 | % |
Class A* (with maximum sales charge) | | | -9.26 | % | | | 1.48 | % | | | 8.72 | % | | | 5.70 | % |
Class C* | | | -4.44 | % | | | 1.93 | % | | | 8.52 | % | | | 5.49 | % |
Class C* (with maximum sales charge) | | | -5.34 | % | | | 1.93 | % | | | 8.52 | % | | | 5.49 | % |
Class I | | | -3.48 | % | | | 2.95 | % | | | 9.61 | % | | | 6.54 | % |
MSCI World Index | | | 4.01 | % | | | 6.78 | % | | | 12.38 | % | | | 8.88 | % |
| (1) | The inception date is October 6, 2008. |
| * | Performance shown prior to January 31, 2011 for Class A shares reflects the performance of Class I shares adjusted to reflect Class A expenses. Performance shown prior to January 31, 2013 for Class C shares reflects the performance of Class I shares adjusted to reflect Class C expenses. |
Performance data quoted represents past performance; past performance does not indicate future results. The investment return and principal value of an investment will fluctuate so that an investor’s shares, when redeemed, may be worth more or less than their original cost. Current performance of the Fund may be lower or higher than the performance quoted. Performance data current to the most recent month end may be obtained by calling 800-331-2979.
8
Brandes Global Equity Fund
The returns shown do not reflect the deduction of taxes that a shareholder would pay on fund distributions or the redemption of fund shares. The Advisor has a fee waiver arrangement in place to limit the Fund’s annual operating expenses.
Sector Allocation as a Percentage of Total Investments as of
March 31, 2019 (Unaudited)
The sector classifications represented in the graph above are in accordance with Global Industry Classification Standard (GICS®), which was developed by and/or is the exclusive property of MSCI, Inc. and Standard & Poor Financial Services LLC.
9
Brandes Global Equity Income Fund
Dear Fellow Investor,
The net asset value of the Brandes Global Equity Income Fund (Class I Shares) declined 1.93% in the six months ending March 31, 2019. For the same period, the MSCI World Index fell 2.61%.
Portfolio holdings in the Electric Utilities, Diversified Telecommunication Services and Pharmaceuticals industries were contributors to performance, while holdings in Capital Markets, Banks and Oil, Gas & Consumable Fuels detracted from returns.
Holdings in Brazil, Mexico and Chile contributed to performance, while results were hampered by holdings in the United Kingdom, the United States and Switzerland.
Three of the largest individual contributors to performance were Companhia Paranaense de Energia (Brazil — Electric Utilities), Telefonica Brasil SA (Brazil — Diversified Telecommunication Services) and Merck & Co., Inc. (United States — Pharmaceuticals). WPP Plc (United Kingdom — Media), UBS Group AG (Switzerland — Capital Markets) and J Sainsbury Plc (United Kingdom — Food & Staples Retailing) were three of the largest detractors from performance.
At the close of the period, the Fund’s largest country weights were in the United States and the United Kingdom, and the Fund’s largest industry weights were in Pharmaceuticals and Capital Markets. Please note that while macro conditions are considered when we determine valuation estimates for individual companies, our country and industry weightings are aby-product ofbottom-up stock selection, not the result oftop-down observations.
After nearly a half-century of professional investing, Brandes Investment Partners remains fixed on its original goal. We pursue above-market returns to help you fulfill your long-term investment objectives. Our approach remains deeply rooted in the value philosophy and seeks to identify worthy but potentially underpriced companies. Thank you for your confidence in our approach.
Sincerely yours,
The Brandes GlobalLarge-Cap Investment Committee
Brandes Investment Trust
Because the values of the Fund’s investments will fluctuate with market conditions, so will the value of your investment in the Fund. You could lose money on your investment in the Fund, or the Fund could underperform other investments. The values of the Fund’s investments fluctuate in response to the activities of individual companies and general stock market and economic conditions. In addition, the performance of foreign securities depends on the political and economic environments and other overall economic conditions in the countries where the Fund invests. Emerging
10
Brandes Global Equity Income Fund
country markets involve greater risk and volatility than more developed markets. Some emerging markets countries may have fixed or managed currencies that are not free-floating against the U.S. dollar. Certain of these currencies have experienced, and may experience in the future, substantial fluctuations or a steady devaluation relative to the U.S. dollar. Value stocks typically are less volatile than growth stocks; however, issues of value stocks typically have a lower expected growth rate in earnings and sales than issues of growth stocks.
Please refer to the Schedule of Investments in the report for complete holdings information. Fund holdings, geographic allocations and/or sector allocations are subject to change at any time and are not considered a recommendation to buy or sell any security.
The foregoing reflects the thoughts and opinions of Brandes Investment Partners® exclusively and is subject to change without notice.
Brandes Investment Partners® is a registered trademark of Brandes Investment Partners, L.P. in the United States and Canada.
Must be preceded or accompanied by a prospectus.
Index Guide
The MSCI World Index with net dividends captures large and mid cap representation of developed markets.
MSCI has not approved, reviewed or produced this report, makes no express or implied warranties or representations and is not liable whatsoever for any data in the report. You may not redistribute the MSCI data or use it as a basis for other indices or investment products.
One cannot invest directly in an index.
The Brandes Global Equity Income Fund is distributed by ALPS Distributors, Inc.
11
Brandes Global Equity Income Fund
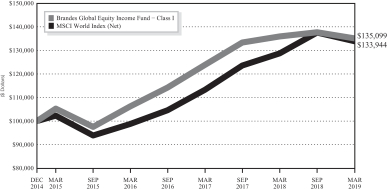
The following chart compares the value of a hypothetical $100,000 investment in the Brandes Global Equity Income Fund – Class I from its inception (December 31, 2014) to March 31, 2019 with the value of such an investment in the MSCI World Index for the same period.
Value of $100,000 Investment vs MSCI World Index (Unaudited)
| | | | | | | | | | | | |
| | | Average Annual Total Return
Periods Ended March 31, 2019 | |
| | | One
Year | | | Three
Years | | | Since
Inception(1) | |
Brandes Global Equity Income Fund | | | | | | | | | | | | |
Class A | | | -0.94 | % | | | 8.77 | % | | | 7.66 | % |
Class A (with maximum sales charge) | | | -6.63 | % | | | 6.65 | % | | | 6.17 | % |
Class C | | | -1.40 | % | | | 7.55 | % | | | 6.53 | % |
Class C (with maximum sales charge) | | | -2.33 | % | | | 7.55 | % | | | 6.53 | % |
Class I | | | -0.67 | % | | | 8.31 | % | | | 7.34 | % |
MSCI World Index | | | 4.01 | % | | | 10.68 | % | | | 7.12 | % |
| (1) | The inception date is December 31, 2014. |
Performance data quoted represents past performance; past performance does not indicate future results. The investment return and principal value of an investment will fluctuate so that an investor’s shares, when redeemed, may be worth more or less than their original cost. Current performance of the Fund may be lower or higher than the performance quoted. Performance data current to the most recent month end may be obtained by calling 800-331-2979.
12
Brandes Global Equity Income Fund
The returns shown do not reflect the deduction of taxes that a shareholder would pay on fund distributions or the redemption of fund shares. The Advisor has a fee waiver arrangement in place to limit the Fund’s annual operating expenses.
Sector Allocation as a Percentage of Total Investments as of March 31, 2019 (Unaudited)
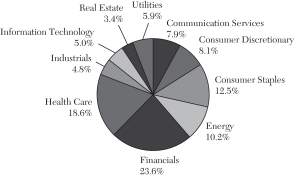
The sector classifications represented in the graph above are in accordance with Global Industry Classification Standard (GICS®), which was developed by and/or is the exclusive property of MSCI, Inc. and Standard & Poor Financial Services LLC.
13
Brandes Global Opportunities Value Fund
Dear Fellow Investor,
The net asset value of the Brandes Global Opportunities Value Fund (Class I Shares) fell 6.68% in the six months ending March 31, 2019. For the same period, the MSCI ACWI Index declined 2.13%.
Portfolio holdings in the Diversified Telecommunication Services, Oil, Gas & Consumable Fuels and Electric Utilities industries were contributors to performance, while holdings in Health Care Providers & Services, Capital Markets and Machinery detracted from returns.
Holdings in Brazil, Panama and Slovenia contributed to performance, while results were hampered by holdings in the United States, the United Kingdom and Mexico.
Three of the largest individual contributors to performance were Companhia Paranaense de Energia (Brazil — Electric Utilities), Telefonica Brasil SA (Brazil — Diversified Telecommunication Services) and Petroleo Brasileiro SA (Brazil — Oil, Gas & Consumable Fuels). Conversely, Owens & Minor, Inc. (United States — Health Care Providers & Services), Briggs & Stratton Corp. (United States — Machinery) and Engie SA (France — Multi-Utilities) were three of the largest detractors from performance.
At the close of the period, the Fund’s largest country weights were in the United Kingdom and the United States, and the Fund’s largest industry weights were in Oil, Gas & Consumable Fuels and Banks. Please note that while macro conditions are considered when we determine valuation estimates for individual companies, our country and industry weightings are aby-product ofbottom-up stock selection, not the result oftop-down observations.
In the45-plus years since Brandes Investment Partners was founded, our goal has remained the same: pursue above-market gains to help you move closer to your long-term investment objectives. We believe that our unwavering commitment to value investing will lead us to attractively priced, fundamentally sound companies worthy of inclusion in the Fund. Thank you for your business and continued trust.
Sincerely yours,
The BrandesAll-Cap Investment Committee
Brandes Investment Trust
Because the values of the Fund’s investments will fluctuate with market conditions, so will the value of your investment in the Fund. You could lose money on your investment in the Fund, or the Fund could underperform other investments. The values of the Fund’s investments fluctuate in response to the activities of individual companies and general stock market and economic conditions. In addition, the performance of foreign securities depends on the political and economic environments and other overall economic conditions in the countries where the Fund invests. Emerging
14
Brandes Global Opportunities Value Fund
country markets involve greater risk and volatility than more developed markets. Some emerging markets countries may have fixed or managed currencies that are not free-floating against the U.S. dollar. Certain of these currencies have experienced, and may experience in the future, substantial fluctuations or a steady devaluation relative to the U.S. dollar. Investments in small and medium capitalization companies tend to have limited liquidity and greater price volatility than investments in larger capitalization companies. Value stocks typically are less volatile than growth stocks; however, issues of value stocks typically have a lower expected growth rate in earnings and sales than issues of growth stocks.
Please refer to the Schedule of Investments in the report for complete holdings information. Fund holdings, geographic allocations and/or sector allocations are subject to change at any time and are not considered a recommendation to buy or sell any security.
The foregoing reflects the thoughts and opinions of Brandes Investment Partners® exclusively and is subject to change without notice.
Brandes Investment Partners® is a registered trademark of Brandes Investment Partners, L.P. in the United States and Canada.
Must be preceded or accompanied by a prospectus.
Index Guide
The MSCI ACWI Index with net dividends captures large and mid cap representation of developed and emerging markets.
MSCI has not approved, reviewed or produced this report, makes no express or implied warranties or representations and is not liable whatsoever for any data in the report. You may not redistribute the MSCI data or use it as a basis for other indices or investment products.
One cannot invest directly in an index.
The Brandes Global Opportunities Value Fund is distributed by ALPS Distributors, Inc.
15
Brandes Global Opportunities Value Fund
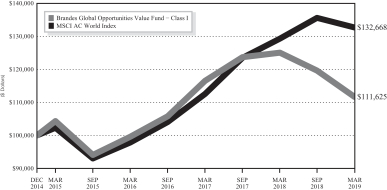
The following chart compares the value of a hypothetical $100,000 investment in the Brandes Global Opportunities Value Fund – Class I from its inception (December 31, 2014) to March 31, 2019 with the value of such an investment in the MSCI All Country World Index for the same period.
Value of $100,000 Investment vs MSCI All Country World Index (Unaudited)
| | | | | | | | | | | | |
| | | Average Annual Total Return
Periods Ended March 31, 2019 | |
| | | One
Year | | | Three
Years | | | Since
Inception(1) | |
Brandes Global Opportunities Value Fund | | | | | | | | | | | | |
Class A | | | -10.83 | % | | | 3.65 | % | | | 2.49 | % |
Class A (with maximum sales charge) | | | -15.99 | % | | | 1.64 | % | | | 1.07 | % |
Class C | | | -11.54 | % | | | 2.85 | % | | | 1.70 | % |
Class C (with maximum sales charge) | | | -12.36 | % | | | 2.85 | % | | | 1.70 | % |
Class I | | | -10.73 | % | | | 3.88 | % | | | 2.62 | % |
MSCI All Country World Index | | | 2.60 | % | | | 10.67 | % | | | 6.88 | % |
| (1) | The inception date is December 31, 2014. |
Performance data quoted represents past performance; past performance does not indicate future results. The investment return and principal value of an investment will fluctuate so that an investor’s shares, when redeemed, may be worth more or less than their original cost. Current performance of the Fund may be lower or higher than the performance quoted. Performance data current to the most recent month end may be obtained by calling 800-331-2979.
The returns shown do not reflect the deduction of taxes that a shareholder would pay on fund distributions or the redemption of fund shares. The Advisor has a fee waiver arrangement in place to limit the Fund’s annual operating expenses.
16
Brandes Global Opportunities Value Fund
Sector Allocation as a Percentage of Total Investments as of March 31, 2019 (Unaudited)
The sector classifications represented in the graph above are in accordance with Global Industry Classification Standard (GICS®), which was developed by and/or is the exclusive property of MSCI, Inc. and Standard & Poor Financial Services LLC.
17
Brandes Emerging Markets Value Fund
Dear Fellow Investor,
The net asset value of the Brandes Emerging Markets Value Fund (Class I Shares) increased 2.54% in the six months ending March 31, 2019. For the same period, the MSCI Emerging Markets Index gained 1.71%.
Portfolio holdings in the Banks, Electric Utilities and Textiles, Apparel & Luxury Goods industries were contributors to performance, while holdings in Construction Materials, Technology Hardware, Storage & Peripherals and Automobiles detracted from returns.
Holdings in Brazil, China and Indonesia contributed to performance, while results were hampered by holdings in Mexico, South Korea and Malaysia.
Three of the largest individual contributors to performance were Bank Rakyat Indonesia Persero Tbk PT (Indonesia — Banks), Companhia Paranaense de Energia (Brazil — Electric Utilities) and Petroleo Brasileiro SA (Brazil — Oil, Gas & Consumable Fuels). Conversely, Cemex SAB de CV (Mexico — Construction Materials), Genting Berhad (Malaysia — Hotels, Restaurants & Leisure) and Asustek Computer, Inc. (Taiwan — Technology Hardware, Storage & Peripherals) were three of the largest detractors from performance.
At the close of the period, the Fund’s largest country weights were in South Korea and Brazil, and the Fund’s largest industry weights were in Banks and Wireless Telecommunication Services. Please note that while macro conditions are considered when we determine valuation estimates for individual companies, our country and industry weightings are aby-product ofbottom-up stock selection, not the result oftop-down observations.
For 45 years, Brandes Investment Partners has had the same goal: Seek better-than-market returns to help you pursue your long-term investment goals. We believe steadfast adherence to our value investing approach can help us achieve this aim because it compels us to invest in companies we view as strong yet appealingly priced. We thank you for your confidence and for investing with us.
Sincerely yours,
The Brandes Emerging Markets Investment Committee
Brandes Investment Trust
Because the values of the Fund’s investments will fluctuate with market conditions, so will the value of your investment in the Fund. You could lose money on your investment in the Fund, or the Fund could underperform other investments. The values of the Fund’s investments fluctuate in response to the activities of individual companies and general stock market and economic conditions. In addition, the performance of foreign securities depends on the political and economic environments and other overall economic conditions in the countries where the Fund invests. Emerging
18
Brandes Emerging Markets Value Fund
country markets involve greater risk and volatility than more developed markets. Some emerging markets countries may have fixed or managed currencies that are not free-floating against the U.S. dollar. Certain of these currencies have experienced, and may experience in the future, substantial fluctuations or a steady devaluation relative to the U.S. dollar. Investments in small and medium capitalization companies tend to have limited liquidity and greater price volatility than investments in larger capitalization companies. Value stocks typically are less volatile than growth stocks; however, issues of value stocks typically have a lower expected growth rate in earnings and sales than issues of growth stocks.
Please refer to the Schedule of Investments in the report for complete holdings information. Fund holdings, geographic allocations and/or sector allocations are subject to change at any time and are not considered a recommendation to buy or sell any security.
The foregoing reflects the thoughts and opinions of Brandes Investment Partners® exclusively and is subject to change without notice.
Brandes Investment Partners® is a registered trademark of Brandes Investment Partners, L.P. in the United States and Canada.
Must be preceded or accompanied by a prospectus.
Index Guide
The MSCI Emerging Markets Index with net dividends captures large and mid cap representation of emerging market countries.
MSCI has not approved, reviewed or produced this report, makes no express or implied warranties or representations and is not liable whatsoever for any data in the report. You may not redistribute the MSCI data or use it as a basis for other indices or investment products.
One cannot invest directly in an index.
The Brandes Emerging Markets Value Fund is distributed by ALPS Distributors, Inc.
19
Brandes Emerging Markets Value Fund
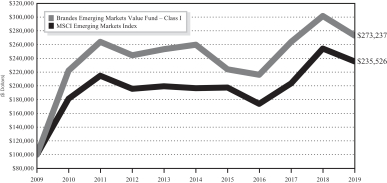
The following chart compares the value of a hypothetical $100,000 investment in the Brandes Emerging Markets Value Fund – Class I from March 31, 2009 to March 31, 2019 with the value of such an investment in the MSCI Emerging Markets Index for the same period.
Value of $100,000 Investment vs MSCI Emerging Markets Index (Unaudited)
| | | | | | | | | | | | | | | | |
| | | Average Annual Total Return
Periods Ended March 31, 2019** | |
| | | One
Year | | | Five
Years | | | Ten
Years | | | Since
Inception(1) | |
Brandes Emerging Markets Value Fund | | | | | | | | | | | | | | | | |
Class A | | | -9.64 | % | | | 0.71 | % | | | 10.30 | % | | | 6.98 | % |
Class A (with maximum sales charge) | | | -14.84 | % | | | -0.47 | % | | | 9.65 | % | | | 6.70 | % |
Class C* | | | -10.34 | % | | | -0.03 | % | | | 9.48 | % | | | 6.18 | % |
Class C* (with maximum sales charge) | | | -11.23 | % | | | -0.03 | % | | | 9.48 | % | | | 6.18 | % |
Class I | | | -9.36 | % | | | 1.00 | % | | | 10.57 | % | | | 7.25 | % |
Class R6* | | | -9.28 | % | | | 1.10 | % | | | 10.65 | % | | | 7.31 | % |
MSCI Emerging Markets Index | | | -7.41 | % | | | 3.68 | % | | | 8.94 | % | | | 6.13 | % |
| (1) | The inception date is August 20, 1996. |
| * | Performance shown prior to January 31, 2013 for Class C shares reflects the performance of Class I shares adjusted to reflect Class C expenses. Performance shown prior to July 11, 2016 for Class R6 shares reflects the performance of Class I shares adjusted to reflect Class R6 expenses. |
| ** | Prior to January 31, 2011, the Advisor managed a private investment fund with an investment objective, investment policies and strategies that were, in all material respects, equivalent to those of the Brandes Emerging Markets Value Fund. The performance information shown for the Class I shares for periods before January 31, 2011 is that of the private investment fund and reflects the net expenses of the private investment fund. The performance of the private investment fund prior to January 31, 2011 is based on a calculation method that is different from the standardized calculation method prescribed by the SEC. The performance information shown for the Class A shares has been adjusted to reflect the differences in the net expense ratios between the Class I and A shares. The private investment fund was not registered under the Investment Company Act of 1940 (“1940 Act”) and was not subject to certain |
20
Brandes Emerging Markets Value Fund
| | investment limitations, diversification requirements, and other restrictions imposed by the 1940 Act and the Internal Revenue Code of 1986, which, if applicable, may have adversely affected its performance. |
Performance data quoted represents past performance; past performance does not indicate future results. The investment return and principal value of an investment will fluctuate so that an investor’s shares, when redeemed, may be worth more or less than their original cost. Current performance of the Fund may be lower or higher than the performance quoted. Performance data current to the most recent month end may be obtained by calling 800-331-2979.
The returns shown do not reflect the deduction of taxes that a shareholder would pay on fund distributions or the redemption of fund shares. The Advisor has a fee waiver arrangement in place to limit the Fund’s annual operating expenses.
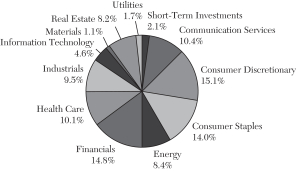
Sector Allocation as a Percentage of Total Investments as of
March 31, 2019 (Unaudited)
The sector classifications represented in the graph above are in accordance with Global Industry Classification Standard (GICS®), which was developed by and/or is the exclusive property of MSCI, Inc. and Standard & Poor Financial Services LLC.
21
Brandes International Small Cap Equity Fund
Dear Fellow Investor,
The net asset value of the Brandes International Small Cap Equity Fund (Class I Shares) fell 7.93% in the six months ending March 31, 2019. For the same period, the S&P DevelopedEx-U.S. SmallCap Index declined 8.04%.
Portfolio holdings in the Electric Utilities, Trading Companies & Distributors and Diversified Telecommunication Services industries were contributors to performance, while holdings in Household Durables, Food & Staples Retailing and Pharmaceuticals detracted from returns.
Holdings in Brazil, Hungary and Slovenia contributed to performance, while results were hampered by holdings in the United Kingdom, Canada and Japan.
Three of the largest individual contributors to performance were Companhia Paranaense de Energia (Brazil — Electric Utilities), Mills Estruturas e Servicos de Engenharia SA (Brazil — Trading Companies & Distributors) and Fibra Uno Administracion SA de CV (Brazil — Equity Real Estate Investment Trusts). Conversely, Dorel Industries, Inc. (Canada — Household Durables), J Sainsbury Plc (United Kingdom — Food & Staples Retailing) and Sierra Wireless, Inc. (Canada — Communications Equipment) were three of the largest detractors from performance.
At the close of the period, the Fund’s largest country weights were in Japan and the United Kingdom, and the Fund’s largest industry weights were in Food & Staples Retailing and Food Products. Please note that while macro conditions are considered when we determine valuation estimates for individual companies, our country and industry weightings are aby-product ofbottom-up stock selection, not the result oftop-down observations.
Brandes Investment Partners has had the same goal since we started 45 years ago: Realize above-market gains to help you pursue your long-term investment objectives. We aim to do so by staying true to our value approach, which seeks fundamentally sound but potentially undervalued companies for the Fund. Thank you for investing with us.
Sincerely yours,
The BrandesSmall-Cap Investment Committee
Brandes Investment Trust
Because the values of the Fund’s investments will fluctuate with market conditions, so will the value of your investment in the Fund. You could lose money on your investment in the Fund, or the Fund could underperform other investments. The values of the Fund’s investments fluctuate in response to the activities of individual companies and general stock market and economic conditions. In addition, the performance of foreign securities depends on the political and economic environments and other overall
22
Brandes International Small Cap Equity Fund
economic conditions in the countries where the Fund invests. Emerging country markets involve greater risk and volatility than more developed markets. Some emerging markets countries may have fixed or managed currencies that are not free-floating against the U.S. dollar. Certain of these currencies have experienced, and may experience in the future, substantial fluctuations or a steady devaluation relative to the U.S. dollar. Investments in small and medium capitalization companies tend to have limited liquidity and greater price volatility than investments in larger capitalization companies. Value stocks typically are less volatile than growth stocks; however, issues of value stocks typically have a lower expected growth rate in earnings and sales than issues of growth stocks.
Please refer to the Schedule of Investments in the report for complete holdings information. Fund holdings, geographic allocations and/or sector allocations are subject to change at any time and are not considered a recommendation to buy or sell any security.
The foregoing reflects the thoughts and opinions of Brandes Investment Partners® exclusively and is subject to change without notice.
Brandes Investment Partners® is a registered trademark of Brandes Investment Partners, L.P. in the United States and Canada.
Must be preceded or accompanied by a prospectus.
Index Guide
The S&P DevelopedEx-U.S. SmallCap Index with net dividends measures the equity performance of small-capitalization companies from developed markets excluding the United States.
One cannot invest directly in an index.
The Brandes International Equity Small Cap Equity Fund is distributed by ALPS Distributors, Inc.
23
Brandes International Small Cap Equity Fund
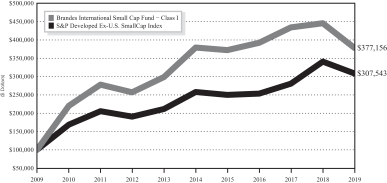
The following chart compares the value of a hypothetical $100,000 investment in the Brandes International Small Cap Fund – Class I from March 31, 2009 to March 31, 2019 with the value of such an investment in the S&P DevelopedEx-U.S. SmallCap Index for the same period.
Value of $100,000 Investment vs S&P Developed
Ex-U.S. SmallCap Index (Unaudited)
| | | | | | | | | | | | | | | | |
| | | Average Annual Total Return
Periods Ended March 31, 2019** | |
| | | One
Year | | | Five
Years | | | Ten
Years | | | Since
Inception(1) | |
Brandes International Small Cap Fund | | | | | | | | | | | | | | | | |
Class A | | | -15.27 | % | | | -0.26 | % | | | 13.94 | % | | | 8.44 | % |
Class A (with maximum sales charge) | | | -20.14 | % | | | -1.44 | % | | | 13.27 | % | | | 8.16 | % |
Class C* | | | -15.87 | % | | | -1.00 | % | | | 13.10 | % | | | 7.64 | % |
Class C* (with maximum sales charge) | | | -16.68 | % | | | -1.00 | % | | | 13.10 | % | | | 7.64 | % |
Class I | | | -15.08 | % | | | -0.05 | % | | | 14.20 | % | | | 8.70 | % |
Class R6* | | | -14.94 | % | | | 0.03 | % | | | 14.27 | % | | | 8.77 | % |
S&P Developed Ex-U.S. SmallCap Index | | | -9.55 | % | | | 3.65 | % | | | 11.89 | % | | | 6.45 | % |
| (1) | The inception date is August 19, 1996. |
| * | Performance shown prior to January 31, 2013 for Class C shares reflects the performance of Class I shares adjusted to reflect Class C expenses. Performance shown prior to June 27, 2016 for Class R6 shares reflects the performance of Class I shares adjusted to reflect Class R6 expenses. |
| ** | Prior to February 1, 2012, the Advisor managed a private investment fund with an investment objective, investment policies and strategies that were, in all material respects, equivalent to those of the Brandes International Small Cap Fund. The performance information shown for the Class I shares for periods before February 1, 2012 is that of the private investment fund and reflects the net expenses of the private investment fund. The performance of the private investment fund prior to February 1, 2012 is based on a calculation method that is different from the standardized calculation method prescribed by the SEC. The performance information shown for the Class A shares has been adjusted to reflect the differences in the net expense ratios between the Class I and A shares. The private investment fund was not registered under the Investment Company Act of 1940 (“1940 Act”) and was not subject to certain investment limitations, diversification requirements, and other restrictions imposed by the 1940 Act and the Internal Revenue Code of 1986, which, if applicable, may have adversely affected its performance. |
24
Brandes International Small Cap Equity Fund
Performance data quoted represents past performance; past performance does not indicate future results. The investment return and principal value of an investment will fluctuate so that an investor’s shares, when redeemed, may be worth more or less than their original cost. Current performance of the Fund may be lower or higher than the performance quoted. Performance data current to the most recent month end may be obtained by calling 800-331-2979.
The returns shown do not reflect the deduction of taxes that a shareholder would pay on fund distributions or the redemption of fund shares. The Advisor has a fee waiver arrangement in place to limit the Fund’s annual operating expenses.
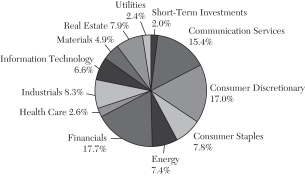
Sector Allocation as a Percentage of Total Investments as of
March 31, 2019 (Unaudited)
The sector classifications represented in the graph above are in accordance with Global Industry Classification Standard (GICS®), which was developed by and/or is the exclusive property of MSCI, Inc. and Standard & Poor Financial Services LLC.
25
Brandes Small Cap Value Fund
Dear Fellow Investor,
The net asset value of the Brandes Small Cap Value Fund (Class I Shares) declined 8.13% in the six months ending March 31, 2019. For the same period, the Russell 2000 Index fell 8.56%.
Portfolio holdings in the Biotechnology, Specialty Retail and Capital Markets industries were contributors to performance, while holdings in Machinery, Household Durables and Construction & Engineering detracted from returns.
Three of the largest individual contributors to performance were PDL BioPharma, Inc. (Biotechnology),Rent-A-Center, Inc. (Specialty Retail) and Federated Investors, Inc. (Capital Markets). Conversely, Briggs & Stratton Corp. (Machinery), Owens & Minor, Inc. (Health Care Providers & Services) and Orion Group Holdings, Inc. (Construction & Engineering) were three of the largest detractors from performance.
At the close of the period, the Fund’s largest industry weights were in Household Durables and Biotechnology. Please note that while macro conditions are considered when we determine valuation estimates for individual companies, our industry weightings are aby-product ofbottom-up stock selection, not the result oftop-down observations.
After nearly a half-century of professional investing, Brandes Investment Partners remains fixed on its original goal. We pursue above-market returns to help you fulfill your long-term investment objectives. Our approach remains deeply rooted in the value philosophy and seeks to identify worthy but potentially underpriced companies. Thank you for your confidence in our approach.
Sincerely yours,
The BrandesSmall-Cap Investment Committee
Brandes Investment Trust
Because the values of the Fund’s investments will fluctuate with market conditions, so will the value of your investment in the Fund. You could lose money on your investment in the Fund, or the Fund could underperform other investments. The values of the Fund’s investments fluctuate in response to the activities of individual companies and general stock market and economic conditions. Investments in small and medium capitalization companies tend to have limited liquidity and greater price volatility than investments in larger capitalization companies. Value stocks typically are less volatile than growth stocks; however, issues of value stocks typically have a lower expected growth rate in earnings and sales than issues of growth stocks.
26
Brandes Small Cap Value Fund
Please refer to the Schedule of Investments in the report for complete holdings information. Fund holdings, geographic allocations and/or sector allocations are subject to change at any time and are not considered a recommendation to buy or sell any security.
The foregoing reflects the thoughts and opinions of Brandes Investment Partners® exclusively and is subject to change without notice.
Brandes Investment Partners® is a registered trademark of Brandes Investment Partners, L.P. in the United States and Canada.
Must be preceded or accompanied by a prospectus.
Index Guide
The Russell 2000 Index with gross dividends measures the performance of the small cap segment of the U.S. equity universe.
One cannot invest directly in an index.
The Brandes Small Cap Value Fund is distributed by ALPS Distributors, Inc.
27
Brandes Small Cap Value Fund
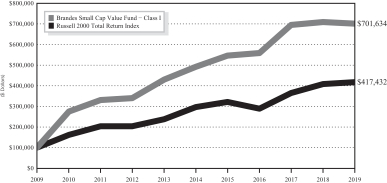
The following chart compares the value of a hypothetical $100,000 investment in the Brandes Small Cap Value Fund – Class I from March 31, 2009 to March 31, 2019 with the value of such an investment in the Russell 2000 Total Return Index for the same period.
Value of $100,000 Investment vs Russell 2000 Total Return Index (Unaudited)
| | | | | | | | | | | | | | | | |
| | | Average Annual Total Return
Periods Ended March 31, 2019* | |
| | | One
Year | | | Five
Years | | | Ten
Years | | | Since
Inception(1) | |
Brandes Small Cap Value Fund | | | | | | | | | | | | | | | | |
Class A | | | -1.29 | % | | | 7.05 | % | | | 21.20 | % | | | 6.46 | % |
Class A (with maximum sales charge) | | | -6.94 | % | | | 5.79 | % | | | 20.49 | % | | | 6.17 | % |
Class I | | | -1.10 | % | | | 7.33 | % | | | 21.51 | % | | | 6.73 | % |
Class R6 | | | -0.85 | % | | | 7.45 | % | | | 21.58 | % | | | 6.76 | % |
Russell 2000 Total Return Index | | | 2.05 | % | | | 7.05 | % | | | 15.36 | % | | | 7.25 | % |
| (1) | The inception date is September 30, 1997. |
| * | Prior to January 2, 2018, the Advisor managed a private investment fund with an investment objective, investment policies and strategies that were, in all material respects, equivalent to those of the Brandes Small Cap Value Fund. The performance information shown for the Class I shares for periods before January 2, 2018 is that of the private investment fund and reflects the net expenses of the private investment fund. The performance of the private investment fund prior to January 2, 2018 is based on a calculation method that is different from the standardized calculation method prescribed by the SEC. The performance information shown for the Class A shares has been adjusted to reflect the differences in the net expense ratios between the Class I and A shares. Performance shown prior to January 2, 2018 for Class R6 shares reflects the performance of Class I shares. The private investment fund was not registered under the Investment Company Act of 1940 (“1940 Act”) and was not subject to certain investment limitations, diversification requirements, and other restrictions imposed by the 1940 Act and the Internal Revenue Code of 1986, which, if applicable, may have adversely affected its performance. |
28
Brandes Small Cap Value Fund
Performance data quoted represents past performance; past performance does not indicate future results. The investment return and principal value of an investment will fluctuate so that an investor’s shares, when redeemed, may be worth more or less than their original cost. Current performance of the Fund may be lower or higher than the performance quoted. Performance data current to the most recent month end may be obtained by calling 800-331-2979.
The returns shown do not reflect the deduction of taxes that a shareholder would pay on Fund distributions or the redemption of Fund shares. The Advisor has a fee waiver arrangement in place to limit the Fund’s annual operating expenses.
Sector Allocation as a Percentage of Total Investments as of
March 31, 2019 (Unaudited)

The sector classifications represented in the graph above are in accordance with Global Industry Classification Standard (GICS®), which was developed by and/or is the exclusive property of MSCI, Inc. and Standard & Poor Financial Services LLC.
29
Brandes Core Plus Fixed Income Fund
Dear Fellow Investor,
The net asset value of the Brandes Core Plus Fixed Income Fund (Class I Shares) gained 3.34% in the six months ending March 31, 2019. For the same period, the Bloomberg Barclays Aggregate Bond Index increased 4.63%.
Portfolio holdings in select corporate bonds detracted from performance.
Within corporate bonds holdings in Metals & Mining (Cloud Peak Energy), Telecommunications (Frontier Communications Corp.) and Banks & Thrifts (USB Capital IX) detracted from performance.
An underweight to U.S. agency mortgage-backed securities (MBS) was a positive performance factor, while duration positioning detracted from returns.
At the close of the period, the Fund continues to favor short maturity corporate bonds and those that we believe exhibit strong, tangible asset coverage. The Fund is underweight agency MBS. The duration is positioned toward the shorter end of our duration-controlled range. The Fund has a high allocation, relative to the benchmark, to U.S. Treasuries that we will look to redeploy thoughtfully and efficiently — if and when market uncertainty and volatility cause credit fundamentals to become mispriced from our estimates of intrinsic value.
In the45-plus years since Brandes Investment Partners was founded, our goal has remained the same: pursue above-market gains to help you move closer to your long-term investment objectives. We believe that our unwavering commitment to value investing will lead us to attractively priced, fundamentally sound companies worthy of inclusion in the fund.
Sincerely Yours,
The Brandes Fixed Income Investment Committee
Brandes Investment Trust
Because the values of the Fund’s investments will fluctuate with market conditions, so will the value of your investment in the Fund. You could lose money on your investment in the Fund, or the Fund could underperform other investments. The values of the Fund’s investments fluctuate in response to the activities of individual companies and general stock market and economic conditions. In addition, the performance of foreign securities depends on the political and economic environments and other overall economic conditions in the countries where the Fund invests. Emerging country markets involve greater risk and volatility than more developed markets. Some emerging markets countries may have fixed or managed currencies that are not free-floating against the U.S. dollar. Certain of these currencies have experienced, and may experience in the future, substantial fluctuations or a steady devaluation relative to the U.S. dollar. It is not possible to invest directly in an index.
30
Brandes Core Plus Fixed Income Fund
As with most fixed income funds, the income on and value of your shares in the Fund will fluctuate along with interest rates. When interest rates rise, the market prices of the debt securities the Fund owns usually decline. When interest rates fall, the prices of these securities usually increase. Generally, the longer the Fund’s average portfolio maturity and the lower the average quality of its portfolio, the greater the price fluctuation. The price of any security owned by the Fund may also fall in response to events affecting the issuer of the security, such as its ability to continue to make principal and interest payments or its credit rating. Below investment grade debt securities are speculative and involve a greater risk of default and price change due to changes in the issuer’s creditworthiness. The market prices of these debt securities may fluctuate more than the market prices of investment grade debt securities and may decline significantly in periods of general economic difficulty.
Asset coverage: Assets available to cover debt obligations after all other liabilities have been satisfied.
Duration: The weighted maturity of a fixed-income investment’s cash flows, used in the estimation of the price sensitivity of fixed-income securities for a given change in interest rates.
Please refer to the Schedule of Investments in the report for complete holdings information. Fund holdings, geographic allocations and/or sector allocations are subject to change at any time and are not a recommendation to buy or sell any security.
The foregoing reflects the thoughts and opinions of Brandes Investment Partners® exclusively and is subject to change without notice.
Brandes Investment Partners® is a registered trademark of Brandes Investment Partners, L.P. in the United States and Canada.
Must be preceded or accompanied by a prospectus.
Index Guide
The Bloomberg Barclays U.S. Aggregate Bond Index is a broad-based benchmark that measures the investment grade, U.S. dollar-denominated, fixed-rate taxable bond market. This index is a total return index which reflects the price changes and interest of each bond in the index.
The Brandes Core Plus Fixed Income Fund is distributed by ALPS Distributors, Inc.
31
Brandes Core Plus Fixed Income Fund
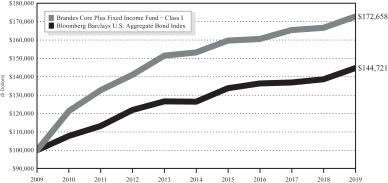
The following chart compares the value of a hypothetical $100,000 investment in the Brandes Core Plus Fixed Income Fund – Class I from March 31, 2009 to March 31, 2019 with the value of such an investment in the Bloomberg Barclays U.S. Aggregate Bond Index for the same period.
Value of $100,000 Investment vs Bloomberg Barclays U.S. Aggregate Bond Index (Unaudited)
| | | | | | | | | | | | | | | | |
| | | Average Annual Total Return
Periods Ended March 31, 2019 | |
| | | One
Year | | | Five
Years | | | Ten
Years | | | Since
Inception(1) | |
Brandes Core Plus Fixed Income Fund | | | | | | | | | | | | | | | | |
Class A* | | | 3.26 | % | | | 2.12 | % | | | 5.29 | % | | | 3.40 | % |
Class A* (with maximum sales charge) | | | -0.62 | % | | | 1.34 | % | | | 4.88 | % | | | 3.04 | % |
Class I | | | 3.58 | % | | | 2.41 | % | | | 5.61 | % | | | 3.70 | % |
Class R6* | | | 4.40 | % | | | 2.71 | % | | | 5.79 | % | | | 3.86 | % |
Bloomberg Barclays U.S. Aggregate Bond Index | | | 4.48 | % | | | 2.74 | % | | | 3.77 | % | | | 3.85 | % |
| (1) | The inception date is December 28, 2007. |
| * | Performance shown prior to January 31, 2013 for Class A shares reflects the performance of Class I shares adjusted to reflect Class A expenses. Performance shown prior to October 10, 2017 for Class R6 shares reflects the performance of Class I shares adjusted to reflect Class R6 expenses. |
Performance data quoted represents past performance; past performance does not indicate future results. The investment return and principal value of an investment will fluctuate so that an investor’s shares, when redeemed, may be worth more or less than their original cost. Current performance of the Fund may be lower or higher than the performance quoted. Performance data current to the most recent month end may be obtained by calling 800-331-2979.
32
Brandes Core Plus Fixed Income Fund
The returns shown do not reflect the deduction of taxes that a shareholder would pay on fund distributions or the redemption of Fund shares. The Advisor has a fee waiver arrangement in place to limit the Fund’s annual operating expenses.
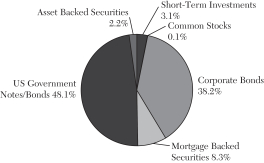
Asset Allocation as a Percentage of Total Investments as of
March 31, 2019 (Unaudited)
33
Brandes Investment Trust
Expense Example (Unaudited)
As a shareholder of a Fund, you incur ongoing costs, including investment advisory and administrative fees and other fund expenses. The examples below are intended to help you understand your ongoing costs (in dollars) of investing in the Funds and to compare these costs with ongoing costs of investing in other mutual funds.
The examples are based on an investment of $1,000 invested at the beginning of the period and held for the entire period from October 1, 2018 to March 31, 2019 (the “Period”).
Actual Expenses
This section provides information about actual account values and actual expenses. The “Ending Account Value” shown is derived from each Fund’s actual return. You may use the information in this section, together with the amount you invested, to estimate the expenses that you paid over the period. Simply divide your account value by $1,000 (for example, an $8,600 account value divided by $1,000 = 8.6), then multiply the result by the number given for the Fund under the heading “Expenses Paid During Period” to estimate the expenses you paid on your account during this period.
| | | | | | | | | | | | | | | | |
| | | Class A | |
Fund | | Beginning
Account
Value | | | Ending
Account
Value | | | Annual
Expense
Ratio | | | Expenses
Paid
During
the Period* | |
International Equity Fund | | $ | 1,000.00 | | | $ | 949.00 | | | | 1.16 | % | | $ | 5.64 | |
Global Equity Fund | | $ | 1,000.00 | | | $ | 946.50 | | | | 1.25 | % | | $ | 6.07 | |
Global Equity Income Fund | | $ | 1,000.00 | | | $ | 979.70 | | | | 1.25 | % | | $ | 6.17 | |
Global Opportunities Value Fund | | $ | 1,000.00 | | | $ | 932.10 | | | | 1.40 | % | | $ | 6.74 | |
Emerging Markets Value Fund | | $ | 1,000.00 | | | $ | 1,023.30 | | | | 1.36 | % | | $ | 6.86 | |
International Small Cap Fund | | $ | 1,000.00 | | | $ | 919.90 | | | | 1.36 | % | | $ | 6.51 | |
Small Cap Value Fund | | $ | 1,000.00 | | | $ | 917.10 | | | | 1.15 | % | | $ | 5.50 | |
Core Plus Fixed Income Fund | | $ | 1,000.00 | | | $ | 1,031.40 | | | | 0.70 | % | | $ | 3.55 | |
| | | | | | | | | | | | | | | | |
| | | Class C | |
Fund | | Beginning
Account
Value | | | Ending
Account
Value | | | Annual
Expense
Ratio | | | Expenses
Paid
During
the Period* | |
International Equity Fund | | $ | 1,000.00 | | | $ | 944.90 | | | | 1.91 | % | | $ | 9.26 | |
Global Equity Fund | | $ | 1,000.00 | | | $ | 943.20 | | | | 2.00 | % | | $ | 9.69 | |
Global Equity Income Fund | | $ | 1,000.00 | | | $ | 976.30 | | | | 2.00 | % | | $ | 9.85 | |
Global Opportunities Value Fund | | $ | 1,000.00 | | | $ | 928.60 | | | | 2.15 | % | | $ | 10.34 | |
Emerging Markets Value Fund | | $ | 1,000.00 | | | $ | 1,018.90 | | | | 2.10 | % | | $ | 10.57 | |
International Small Cap Fund | | $ | 1,000.00 | | | $ | 916.10 | | | | 2.11 | % | | $ | 10.08 | |
34
Brandes Investment Trust
| | | | | | | | | | | | | | | | |
| | | Class I | |
Fund | | Beginning
Account
Value | | | Ending
Account
Value | | | Annual
Expense
Ratio | | | Expenses
Paid
During
the Period* | |
International Equity Fund | | $ | 1,000.00 | | | $ | 949.70 | | | | 0.96 | % | | $ | 4.67 | |
Global Equity Fund | | $ | 1,000.00 | | | $ | 948.00 | | | | 1.00 | % | | $ | 4.86 | |
Global Equity Income Fund | | $ | 1,000.00 | | | $ | 980.70 | | | | 1.00 | % | | $ | 4.94 | |
Global Opportunities Value Fund | | $ | 1,000.00 | | | $ | 933.20 | | | | 1.15 | % | | $ | 5.54 | |
Emerging Markets Value Fund | | $ | 1,000.00 | | | $ | 1,025.40 | | | | 1.12 | % | | $ | 5.66 | |
International Small Cap Fund | | $ | 1,000.00 | | | $ | 920.70 | | | | 1.15 | % | | $ | 5.51 | |
Small Cap Value Fund | | $ | 1,000.00 | | | $ | 918.70 | | | | 0.90 | % | | $ | 4.31 | |
Core Plus Fixed Income Fund | | $ | 1,000.00 | | | $ | 1,033.40 | | | | 0.50 | % | | $ | 2.53 | |
| | | | | | | | | | | | | | | | |
| | | Class R6 | |
Fund | | Beginning
Account
Value | | | Ending
Account
Value | | | Annual
Expense
Ratio | | | Expenses
Paid
During
the Period* | |
International Equity Fund | | $ | 1,000.00 | | | $ | 950.10 | | | | 0.82 | % | | $ | 3.99 | |
Emerging Markets Value Fund | | $ | 1,000.00 | | | $ | 1,024.40 | | | | 0.97 | % | | $ | 4.90 | |
International Small Cap Fund | | $ | 1,000.00 | | | $ | 921.70 | | | | 1.00 | % | | $ | 4.79 | |
Small Cap Value Fund | | $ | 1,000.00 | | | $ | 919.30 | | | | 0.72 | % | | $ | 3.45 | |
Core Plus Fixed Income Fund | | $ | 1,000.00 | | | $ | 1,036.40 | | | | 0.35 | % | | $ | 1.78 | |
| * | Expenses are equal to the Fund’s expense ratio for the period, multiplied by the average account value over the period, multiplied by 182/365 (to reflect the one-half year period). |
Hypothetical Example for Comparison Purposes
This section provides information about hypothetical account values and hypothetical expenses based on the Funds’ actual expense ratios and an assumed rate of return of 5% per year before expenses, which are not the Funds’ actual returns. The hypothetical account values and expenses may not be used to estimate the actual ending account balance or expenses you paid for the period. You may use this information to compare the ongoing costs of investing in the Funds and other mutual funds. To do so, compare this 5% hypothetical example with the 5% hypothetical examples that appear in the shareholder reports of the other mutual funds.
Please note that the expenses shown in the table are meant to highlight your ongoing costs only and do not reflect any transaction costs, such as brokerage commissions on purchase and sales of Fund shares. Therefore, the last column of the table is useful in comparing ongoing costs only, and will not help you determine the relative total costs of owning different funds. In addition, if these transactional costs were included, your costs would have been higher.
35
Brandes Investment Trust
| | | | | | | | | | | | | | | | |
| | | Class A | |
Fund | | Beginning
Account
Value | | | Ending
Account
Value | | | Annual
Expense
Ratio | | | Expenses
Paid
During
the Period* | |
International Equity Fund | | $ | 1,000.00 | | | $ | 1,019.15 | | | | 1.16% | | | $ | 5.84 | |
Global Equity Fund | | $ | 1,000.00 | | | $ | 1,018.70 | | | | 1.25% | | | $ | 6.29 | |
Global Equity Income Fund | | $ | 1,000.00 | | | $ | 1,018.70 | | | | 1.25% | | | $ | 6.29 | |
Global Opportunities Value Fund | | $ | 1,000.00 | | | $ | 1,017.95 | | | | 1.40% | | | $ | 7.04 | |
Emerging Markets Value Fund | | $ | 1,000.00 | | | $ | 1,018.15 | | | | 1.36% | | | $ | 6.84 | |
International Small Cap Fund | | $ | 1,000.00 | | | $ | 1,018.15 | | | | 1.36% | | | $ | 6.84 | |
Small Cap Value Fund | | $ | 1,000.00 | | | $ | 1,019.20 | | | | 1.15% | | | $ | 5.79 | |
Core Plus Fixed Income Fund | | $ | 1,000.00 | | | $ | 1,021.44 | | | | 0.70% | | | $ | 3.53 | |
| | | | | | | | | | | | | | | | |
| | | Class C | |
Fund | | Beginning
Account
Value | | | Ending
Account
Value | | | Annual
Expense
Ratio | | | Expenses
Paid
During
the Period* | |
International Equity Fund | | $ | 1,000.00 | | | $ | 1,015.41 | | | | 1.91% | | | $ | 9.60 | |
Global Equity Fund | | $ | 1,000.00 | | | $ | 1,014.96 | | | | 2.00% | | | $ | 10.05 | |
Global Equity Income Fund | | $ | 1,000.00 | | | $ | 1,014.96 | | | | 2.00% | | | $ | 10.05 | |
Global Opportunities Value Fund | | $ | 1,000.00 | | | $ | 1,014.21 | | | | 2.15% | | | $ | 10.80 | |
Emerging Markets Value Fund | | $ | 1,000.00 | | | $ | 1,014.46 | | | | 2.10% | | | $ | 10.55 | |
International Small Cap Fund | | $ | 1,000.00 | | | $ | 1,014.41 | | | | 2.11% | | | $ | 10.60 | |
| | | | | | | | | | | | | | | | |
| | | Class I | |
Fund | | Beginning
Account
Value | | | Ending
Account
Value | | | Annual
Expense
Ratio | | | Expenses
Paid
During
the
Period* | |
International Equity Fund | | $ | 1,000.00 | | | $ | 1,020.14 | | | | 0.96 | % | | $ | 4.84 | |
Global Equity Fund | | $ | 1,000.00 | | | $ | 1,019.95 | | | | 1.00 | % | | $ | 5.04 | |
Global Equity Income Fund | | $ | 1,000.00 | | | $ | 1,019.95 | | | | 1.00 | % | | $ | 5.04 | |
Global Opportunities Value Fund | | $ | 1,000.00 | | | $ | 1,019.20 | | | | 1.15 | % | | $ | 5.79 | |
Emerging Markets Value Fund | | $ | 1,000.00 | | | $ | 1,019.35 | | | | 1.12 | % | | $ | 5.64 | |
International Small Cap Fund | | $ | 1,000.00 | | | $ | 1,019.20 | | | | 1.15 | % | | $ | 5.79 | |
Small Cap Value Fund | | $ | 1,000.00 | | | $ | 1,020.44 | | | | 0.90 | % | | $ | 4.53 | |
Core Plus Fixed Income Fund | | $ | 1,000.00 | | | $ | 1,022.44 | | | | 0.50 | % | | $ | 2.52 | |
36
Brandes Investment Trust
| | | | | | | | | | | | | | | | |
| | | Class R6 | |
Fund | | Beginning
Account
Value | | | Ending
Account
Value | | | Annual
Expense
Ratio | | | Expenses
Paid
During
the Period* | |
International Equity Fund | | $ | 1,000.00 | | | $ | 1,020.84 | | | | 0.82% | | | $ | 4.13 | |
Emerging Markets Value Fund | | $ | 1,000.00 | | | $ | 1,020.09 | | | | 0.97% | | | $ | 4.89 | |
International Small Cap Fund | | $ | 1,000.00 | | | $ | 1,019.95 | | | | 1.00% | | | $ | 5.04 | |
Small Cap Value Fund | | $ | 1,000.00 | | | $ | 1,021.34 | | | | 0.72% | | | $ | 3.63 | |
Core Plus Fixed Income Fund | | $ | 1,000.00 | | | $ | 1,023.19 | | | | 0.35% | | | $ | 1.77 | |
| * | Expenses are equal to the Fund’s expense ratio for the period, multiplied by the average account value over the period, multiplied by 182/365 (to reflect the one-half year period). |
37
Brandes International Equity Fund
SCHEDULE OF INVESTMENTS — March 31, 2019 (Unaudited)
| | | | | | | | |
| Shares | | | | | Value | |
| | COMMON STOCKS – 87.61% | |
|
| | Brazil – 1.78% | |
| | 748,399 | | | Embraer SA Sponsored – ADR | | $ | 14,227,065 | |
| | | | | | | | |
|
| | China – 1.58% | |
| | 1,241,000 | | | China Mobile Ltd. | | | 12,663,576 | |
| | | | | | | | |
|
| | Finland – 1.60% | |
| | 2,255,736 | | | Nokia OYJ | | | 12,850,134 | |
| | | | | | | | |
|
| | France – 16.69% | |
| | 1,054,578 | | | Carrefour SA | | | 19,696,592 | |
| | 416,063 | | | Compagnie de Saint-Gobain SA | | | 15,086,088 | |
| | 1,220,263 | | | Engie SA | | | 18,197,684 | |
| | 878,202 | | | Orange SA | | | 14,317,439 | |
| | 254,592 | | | Publicis Groupe SA | | | 13,631,420 | |
| | 119,629 | | | Renault SA | | | 7,909,635 | |
| | 329,123 | | | Sanofi | | | 29,102,563 | |
| | 158,566 | | | Schneider Electric SE | | | 12,445,680 | |
| | 36,882 | | | Societe BIC SA | | | 3,287,971 | |
| | | | | | | | |
| | | | | | | 133,675,072 | |
| | | | | | | | |
|
| | Germany – 1.01% | |
| | 109,498 | | | BASF SE | | | 8,075,167 | |
| | | | | | | | |
|
| | Hong Kong – 0.54% | |
| | 11,842,000 | | | First Pacific Co. Ltd. | | | 4,326,627 | |
| | | | | | | | |
|
| | Ireland – 1.60% | |
| | 412,717 | | | CRH Plc | | | 12,787,911 | |
| | | | | | | | |
|
| | Italy – 6.16% | |
| | 1,019,158 | | | Eni SpA | | | 18,007,110 | |
| | 5,328,543 | | | Intesa Sanpaolo SpA | | | 13,004,464 | |
| | 30,748,839 | | | Telecom Italia Rsp | | | 17,462,951 | |
| | 1,365,052 | | | Telecom Italia SpA(a) | | | 850,221 | |
| | | | | | | | |
| | | | | | | 49,324,746 | |
| | | | | | | | |
|
| | Japan – 13.66% | |
| | 542,400 | | | Dai Nippon Printing Co. Ltd. | | | 12,992,039 | |
| | 107,002 | | | Daiichi Sankyo
Co. Ltd. | | | 4,941,105 | |
| | 426,900 | | | Honda Motor Co. Ltd. | | | 11,594,936 | |
| | 1,042,900 | | | Mitsubishi Tanabe Pharma Corp. | | | 13,969,001 | |
| | 2,739,600 | | | Mitsubishi UFJ Financial Group, Inc. | | | 13,549,498 | |
| | | | | | | | |
| Shares | | | | | Value | |
| | 471,999 | | | MS&AD Insurance Group Holdings, Inc. | | $ | 14,381,139 | |
| | 760,700 | | | Nissan Motor Co. Ltd. | | | 6,246,981 | |
| | 364,800 | | | Sumitomo Mitsui Trust Holdings, Inc. | | | 13,110,588 | |
| | 45,500 | | | Taisho Pharmaceutical Holdings Co. Ltd. | | | 4,346,745 | |
| | 348,983 | | | Takeda Pharmaceutical
Co. Ltd. | | | 14,291,637 | |
| | | | | | | | |
| | | | | | | 109,423,669 | |
| | | | | | | | |
|
| | Mexico – 4.10% | |
| | 2,620,613 | | | Cemex SAB de CV Sponsored – ADR(a) | | | 12,159,644 | |
| | 14,973,608 | | | Fibra Uno Administracion SA de CV | | | 20,635,696 | |
| | | | | | | | |
| | | | | | | 32,795,340 | |
| | | | | | | | |
|
| | Netherlands – 2.31% | |
| | 2,056,796 | | | Aegon NV | | | 9,879,787 | |
| | 97,546 | | | NXP Semiconductors NV | | | 8,622,091 | |
| | | | | | | | |
| | | | | | | 18,501,878 | |
| | | | | | | | |
|
| | Russia – 1.25% | |
| | 1,556,496 | | | Mobile TeleSystems PJSC | | | 5,988,531 | |
| | 1,780,571 | | | Public Joint-Stock Co. Gazprom | | | 4,059,914 | |
| | | | | | | | |
| | | | | | | 10,048,445 | |
| | | | | | | | |
|
| | South Korea – 4.74% | |
| | 181,653 | | | Hana Financial Group, Inc. | | | 5,832,507 | |
| | 74,446 | | | Hyundai Mobis
Co. Ltd. | | | 13,690,196 | |
| | 60,185 | | | Hyundai Motor Co. | | | 6,345,731 | |
| | 85,611 | | | KT&G Corp. | | | 7,806,599 | |
| | 19,278 | | | POSCO | | | 4,304,775 | |
| | | | | | | | |
| | | | | | | 37,979,808 | |
| | | | | | | | |
|
| | Spain – 1.73% | |
| | 808,294 | | | Repsol SA | | | 13,828,584 | |
| | | | | | | | |
|
| | Switzerland – 6.76% | |
| | 1,430,909 | | | Credit Suisse Group AG | | | 16,679,277 | |
| | 20,996 | | | Swatch Group Ltd. Bearer | | | 6,013,291 | |
The accompanying notes to financial statements are an integral part of these Schedule of Investments.
38
Brandes International Equity Fund
SCHEDULE OF INVESTMENTS — March 31, 2019 (Unaudited) (continued)
| | | | | | | | |
| Shares | | | | | Value | |
| | 79,685 | | | Swatch Group Ltd. Registered | | $ | 4,412,249 | |
| | 105,291 | | | Swiss Resources AG | | | 10,291,692 | |
| | 1,377,705 | | | UBS Group AG | | | 16,716,452 | |
| | | | | | | | |
| | | | | | | 54,112,961 | |
| | | | | | | | |
|
| | Taiwan – 1.30% | |
| | 1,436,000 | | | Asustek Computer, Inc. | | | 10,405,742 | |
| | | | | | | | |
|
| | United Kingdom – 20.80% | |
| | 5,919,246 | | | Barclays Plc | | | 11,923,020 | |
| | 1,766,562 | | | BP Plc | | | 12,827,914 | |
| | 4,123,077 | | | G4S Plc | | | 9,866,402 | |
| | 1,400,888 | | | GlaxoSmithKline Plc | | | 29,104,717 | |
| | 959,386 | | | HSBC Holdings Plc | | | 7,795,873 | |
| | 273,504 | | | Imperial Brands Plc | | | 9,355,849 | |
| | 4,063,197 | | | J Sainsbury Plc | | | 12,468,630 | |
| | 4,889,136 | | | Kingfisher Plc | | | 14,993,667 | |
| | 4,179,971 | | | Marks & Spencer Group Plc | | | 15,170,347 | |
| | | | | | | | |
| Shares | | | | | Value | |
| | 4,544,469 | | | Tesco Plc | | $ | 13,753,894 | |
| | 3,807,408 | | | Wm Morrison Supermarkets Plc | | | 11,295,001 | |
| | 1,701,792 | | | WPP Plc | | | 17,977,917 | |
| | | | | | | | |
| | | | | | | 166,533,231 | |
| | | | | | | | |
| TOTAL COMMON STOCKS
(Cost $820,906,614) | | $ | 701,559,956 | |
| | | | | | | | |
| | PREFERRED STOCKS – 3.32% | |
|
| | Brazil – 1.83% | |
| | 1,028,300 | | | Petroleo Brasileiro SA | | $ | 7,309,076 | |
| | 602,600 | | | Telefonica Brasil SA | | | 7,310,585 | |
| | | | | | | | |
| | | | | | | 14,619,661 | |
| | | | | | | | |
|
| | Russia – 1.49% | |
| | 19,087,950 | | | Surgutneftegas PJSC | | | 11,921,417 | |
| | | | | | | | |
| TOTAL PREFERRED STOCKS
(Cost $18,585,933) | | $ | 26,541,078 | |
| | | | | | | | |
| | | | | | | | | | |
| | | Principal
Amount | | | Value | |
| REPURCHASE AGREEMENTS – 7.78% | | | | | | | | |
State Street Bank and Trust Repurchase Agreement,
(Dated 03/29/19), due 04/01/19, 1.20% [Collateralized
by $57,650,000 US Treasury Notes TIPS, 0.125%, 01/15/22,
(Market Value $63,554,455)] (proceeds $62,310,829) | | $ | 62,304,599 | | | $ | 62,304,599 | |
| | | | | | | | |
TOTAL REPURCHASE AGREEMENTS
(Cost $62,304,599) | | | | | | $ | 62,304,599 | |
| | | | | | | | |
Total Investments (Cost $901,797,146) – 98.71% | | | | | | $ | 790,405,633 | |
Other Assets in Excess of Liabilities – 1.29% | | | | | | | 10,338,130 | |
| | | | | | | | |
TOTAL NET ASSETS – 100.00% | | | | | | $ | 800,743,763 | |
| | | | | | | | |
Percentages are stated as a percent of net assets.
ADR American Depositary Receipt
TIPS Treasury Inflation-Protected Security
| (a) | Non-income producing security. |
The accompanying notes to financial statements are an integral part of these Schedule of Investments.
39
Brandes International Equity Fund
SCHEDULE OF INVESTMENTS BY INDUSTRY — March 31, 2019 (Unaudited)
| | | | |
COMMON STOCKS | | | | |
Aerospace & Defense | | | 1.78 | % |
Auto Components | | | 1.71 | % |
Automobiles | | | 4.01 | % |
Banks | | | 8.14 | % |
Building Products | | | 1.88 | % |
Capital Markets | | | 4.17 | % |
Chemicals | | | 1.01 | % |
Commercial Services & Supplies | | | 3.27 | % |
Communications Equipment | | | 1.60 | % |
Construction Materials | | | 3.12 | % |
Diversified Financial Services | | | 0.54 | % |
Diversified Telecommunication Services | | | 4.08 | % |
Electrical Equipment | | | 1.55 | % |
Equity Real Estate Investment Trusts | | | 2.58 | % |
Food & Staples Retailing | | | 7.15 | % |
Insurance | | | 4.31 | % |
Media | | | 3.95 | % |
Metals & Mining | | | 0.54 | % |
Multiline Retail | | | 1.89 | % |
Multi-Utilities | | | 2.27 | % |
Oil, Gas & Consumable Fuels | | | 6.08 | % |
Pharmaceuticals | | | 11.96 | % |
Semiconductors & Semiconductor Equipment | | | 1.08 | % |
Specialty Retail | | | 1.87 | % |
Technology Hardware, Storage & Peripherals | | | 1.30 | % |
Textiles, Apparel & Luxury Goods | | | 1.30 | % |
Tobacco | | | 2.14 | % |
Wireless Telecommunication Services | | | 2.33 | % |
| | | | |
TOTAL COMMON STOCKS | | | 87.61 | % |
| | | | |
| |
PREFERRED STOCKS | | | | |
Diversified Telecommunication Services | | | 0.92 | % |
Oil, Gas & Consumable Fuels | | | 2.40 | % |
| | | | |
TOTAL PREFERRED STOCKS | | | 3.32 | % |
| | | | |
| |
REPURCHASE AGREEMENTS | | | 7.78 | % |
| | | | |
| |
TOTAL INVESTMENTS | | | 98.71 | % |
Other Assets in Excess of Liabilities | | | 1.29 | % |
| | | | |
| |
TOTAL NET ASSETS | | | 100.00 | % |
| | | | |
The industry classifications represented in the Schedule of Investments are in accordance with Global Industry Classification Standards (GICS®), which was developed by and/or is the exclusive property of MSCI, Inc. and Standard & Poor Financial Services LLC. This information is unaudited.
The accompanying notes to financial statements are an integral part of these Schedule of Investments.
40
Brandes Global Equity Fund
SCHEDULE OF INVESTMENTS — March 31, 2019 (Unaudited)
| | | | | | | | |
| Shares | | | | | Value | |
| | COMMON STOCKS – 96.45% | |
|
| | Austria – 1.45% | |
| | 18,493 | | | Erste Group Bank AG | | $ | 679,689 | |
| | | | | | | | |
|
| | Brazil – 2.27% | |
| | 195,920 | | | Embraer SA | | | 927,722 | |
| | 7,378 | | | Embraer SA
Sponsored – ADR | | | 140,256 | |
| | | | | | | | |
| | | | | | | 1,067,978 | |
| | | | | | | | |
|
| | China – 1.46% | |
| | 67,000 | | | China Mobile Ltd. | | | 683,690 | |
| | | | | | | | |
|
| | Finland – 1.95% | |
| | 160,619 | | | Nokia OYJ | | | 914,990 | |
| | | | | | | | |
|
| | France – 13.14% | |
| | 26,736 | | | Carrefour SA | | | 499,354 | |
| | 30,367 | | | Engie SA | | | 452,861 | |
| | 31,200 | | | Engie SA Registered Shares (Prime Fidelite 2019) | | | 465,283 | |
| | 21,767 | | | Engie SA Registered Shares (Prime Fidelite 2021) | | | 324,609 | |
| | 12,618 | | | Publicis Groupe SA | | | 675,596 | |
| | 18,948 | | | Sanofi | | | 1,675,469 | |
| | 14,340 | | | Schneider Electric SE | | | 1,125,531 | |
| | 17,182 | | | Total SA | | | 956,171 | |
| | | | | | | | |
| | | | | | | 6,174,874 | |
| | | | | | | | |
|
| | Ireland – 1.19% | |
| | 17,978 | | | CRH Plc | | | 557,043 | |
| | | | | | | | |
|
| | Italy – 2.81% | |
| | 48,572 | | | Eni SpA | | | 858,200 | |
| | 812,896 | | | Telecom Italia Rsp | | | 461,662 | |
| | | | | | | | |
| | | | | | | 1,319,862 | |
| | | | | | | | |
|
| | Japan – 3.31% | |
| | 28,300 | | | Honda Motor Co. Ltd. | | | 768,650 | |
| | 95,900 | | | Nissan Motor Co. Ltd. | | | 787,545 | |
| | | | | | | | |
| | | | | | | 1,556,195 | |
| | | | | | | | |
|
| | Malaysia – 1.67% | |
| | 482,100 | | | Genting Berhad | | | 785,141 | |
| | | | | | | | |
|
| | Mexico – 1.99% | |
| | 680,082 | | | Fibra Uno Administracion SA de CV | | | 937,247 | |
| | | | | | | | |
|
| | Netherlands – 1.18% | |
| | 6,272 | | | NXP Semiconductors NV | | | 554,382 | |
| | | | | | | | |
| | | | | | | | |
| Shares | | | | | Value | |
|
| | Russia – 1.00% | |
| | 205,296 | | | Public Joint-Stock
Co. Gazprom | | $ | 468,099 | |
| | | | | | | | |
|
| | South Korea – 5.79% | |
| | 3,735 | | | Hyundai Mobis Co. Ltd. | | | 686,845 | |
| | 8,881 | | | Hyundai Motor Co. | | | 936,387 | |
| | 5,418 | | | KT&G Corp. | | | 494,050 | |
| | 15,403 | | | Samsung Electronics
Co. Ltd. | | | 607,539 | |
| | | | | | | | |
| | | | | | | 2,724,821 | |
| | | | | | | | |
|
| | Spain – 1.43% | |
| | 39,210 | | | Repsol SA | | | 670,819 | |
| | | | | | | | |
|
| | Switzerland – 4.73% | |
| | 71,631 | | | Credit Suisse Group AG | | | 834,961 | |
| | 5,050 | | | Swiss Resources AG | | | 493,613 | |
| | 73,650 | | | UBS Group AG | | | 893,636 | |
| | | | | | | | |
| | | | | | | 2,222,210 | |
| | | | | | | | |
|
| | United Kingdom – 19.32% | |
| | 177,585 | | | Barclays Plc | | | 357,706 | |
| | 170,710 | | | BP Plc | | | 1,239,613 | |
| | 84,308 | | | GlaxoSmithKline Plc | | | 1,751,575 | |
| | 55,265 | | | HSBC Holdings Plc | | | 449,078 | |
| | 36,785 | | | Imperial Brands Plc | | | 1,258,318 | |
| | 219,876 | | | J Sainsbury Plc | | | 674,728 | |
| | 243,914 | | | Kingfisher Plc | | | 748,019 | |
| | 162,252 | | | Marks & Spencer
Group Plc | | | 588,860 | |
| | 291,885 | | | Tesco Plc | | | 883,394 | |
| | 131,383 | | | Wm Morrison Supermarkets Plc | | | 389,759 | |
| | 69,527 | | | WPP Plc | | | 734,491 | |
| | | | | | | | |
| | | | | | | 9,075,541 | |
| | | | | | | | |
|
| | United States – 31.76% | |
| | 18,224 | | | American International Group, Inc. | | | 784,726 | |
| | 10,208 | | | Apache Corp. | | | 353,809 | |
| | 34,319 | | | Bank of America Corp. | | | 946,861 | |
| | 17,982 | | | Bank of New York Mellon Corp. | | | 906,832 | |
| | 21,209 | | | Cardinal Health, Inc. | | | 1,021,213 | |
| | 2,818 | | | Cigna Corp. | | | 453,191 | |
| | 24,277 | | | Citigroup, Inc. | | | 1,510,515 | |
| | 8,518 | | | CVS Health Corp. | | | 459,376 | |
| | 8,427 | | | Emerson Electric Co. | | | 576,997 | |
The accompanying notes to financial statements are an integral part of these Schedule of Investments.
41
Brandes Global Equity Fund
SCHEDULE OF INVESTMENTS — March 31, 2019 (Unaudited) (continued)
| | | | | | | | |
| Shares | | | | | Value | |
| | 4,044 | | | HCA Healthcare, Inc. | | $ | 527,256 | |
| | 24,063 | | | Jefferies Financial Group, Inc. | | | 452,144 | |
| | 3,564 | | | Laboratory Corp of America Holdings(a) | | | 545,221 | |
| | 8,630 | | | McKesson Corp. | | | 1,010,228 | |
| | 12,857 | | | Merck & Co., Inc. | | | 1,069,317 | |
| | 3,081 | | | Microsoft Corp. | | | 363,373 | |
| | 3,522 | | | PepsiCo, Inc. | | | 431,621 | |
| | 27,624 | | | Pfizer, Inc. | | | 1,173,191 | |
| | 4,750 | | | PNC Financial Services Group, Inc. | | | 582,635 | |
| | | | | | | | |
| Shares | | | | | Value | |
| | 10,958 | | | State Street Corp. | | $ | 721,146 | |
| | 21,432 | | | Wells Fargo & Co. | | | 1,035,594 | |
| | | | | | | | |
| | | | | | | 14,925,246 | |
| | | | | | | | |
| TOTAL COMMON STOCKS
(Cost $41,470,882) | | $ | 45,317,827 | |
| | | | | | | | |
| | PREFERRED STOCKS – 0.29% | |
|
| | South Korea – 0.29% | |
| | 4,331 | | | Samsung Electronics Co. Ltd. | | $ | 138,680 | |
| | | | | | | | |
| TOTAL PREFERRED STOCKS
(Cost $128,288) | | $ | 138,680 | |
| | | | | | | | |
| | | | | | | | |
| | | Principal
Amount | | | Value | |
| REPURCHASE AGREEMENTS – 1.03% | | | | | | | | |
State Street Bank and Trust Repurchase Agreement,
(Dated 03/29/19), due 04/01/19, 1.20% [Collateralized
by $490,000 US Treasury Notes, 2.500%, 02/15/22,
(Market Value $495,651)] (proceeds $484,096) | | $ | 484,047 | | | $ | 484,047 | |
| | | | | | | | |
TOTAL REPURCHASE AGREEMENTS
(Cost $484,047) | | | | | | $ | 484,047 | |
| | | | | | | | |
Total Investments (Cost $42,083,217) – 97.77% | | | | | | $ | 45,940,554 | |
Other Assets in Excess of Liabilities – 2.23% | | | | | | | 1,045,647 | |
| | | | | | | | |
TOTAL NET ASSETS – 100.00% | | | | | | $ | 46,986,201 | |
| | | | | | | | |
Percentages are stated as a percent of net assets.
ADR American Depositary Receipt
| (a) | Non-income producing security. |
The accompanying notes to financial statements are an integral part of these Schedule of Investments.
42
Brandes Global Equity Fund
SCHEDULE OF INVESTMENTS BY INDUSTRY — March 31, 2019 (Unaudited)
| | | | |
COMMON STOCKS | | | | |
Aerospace & Defense | | | 2.27 | % |
Auto Components | | | 1.46 | % |
Automobiles | | | 5.30 | % |
Banks | | | 11.84 | % |
Beverages | | | 0.92 | % |
Capital Markets | | | 7.14 | % |
Communications Equipment | | | 1.95 | % |
Construction Materials | | | 1.19 | % |
Diversified Financial Services | | | 0.96 | % |
Diversified Telecommunication Services | | | 0.98 | % |
Electrical Equipment | | | 3.62 | % |
Equity Real Estate Investment Trusts | | | 2.00 | % |
Food & Staples Retailing | | | 5.21 | % |
Health Care Providers & Services | | | 8.55 | % |
Hotels, Restaurants & Leisure | | | 1.67 | % |
Insurance | | | 2.72 | % |
Media | | | 3.00 | % |
Multiline Retail | | | 1.25 | % |
Multi-Utilities | | | 2.65 | % |
Oil, Gas & Consumable Fuels | | | 9.68 | % |
Pharmaceuticals | | | 12.07 | % |
Semiconductors & Semiconductor Equipment | | | 1.18 | % |
Software | | | 0.77 | % |
Specialty Retail | | | 1.59 | % |
Technology Hardware, Storage & Peripherals | | | 1.29 | % |
Tobacco | | | 3.73 | % |
Wireless Telecommunication Services | | | 1.46 | % |
| | | | |
TOTAL COMMON STOCKS | | | 96.45 | % |
| | | | |
| |
PREFERRED STOCKS | | | | |
Technology Hardware, Storage & Peripherals | | | 0.29 | % |
| | | | |
TOTAL PREFERRED STOCKS | | | 0.29 | % |
| | | | |
| |
REPURCHASE AGREEMENTS | | | 1.03 | % |
| | | | |
| |
TOTAL INVESTMENTS | | | 97.77 | % |
Other Assets in Excess of Liabilities | | | 2.23 | % |
| | | | |
| |
TOTAL NET ASSETS | | | 100.00 | % |
| | | | |
The industry classifications represented in the Schedule of Investments are in accordance with Global Industry Classification Standards (GICS®), which was developed by and/or is the exclusive property of MSCI, Inc. and Standard & Poor Financial Services LLC. This information is unaudited.
The accompanying notes to financial statements are an integral part of these Schedule of Investments.
43
Brandes Global Equity Income Fund
SCHEDULE OF INVESTMENTS — March 31, 2019 (Unaudited)
| | | | | | | | |
| Shares | | | | | Value | |
| | COMMON STOCKS – 87.95% | |
|
| | Brazil – 3.96% | |
| | 1,010 | | | Companhia Paranaense de Energia | | $ | 8,283 | |
| | 3,990 | | | Telefonica Brasil SA | | | 44,584 | |
| | | | | | | | |
| | | | | | | 52,867 | |
| | | | | | | | |
|
| | Chile – 1.75% | |
| | 222,225 | | | Enel Chile SA | | | 23,284 | |
| | | | | | | | |
|
| | China – 1.91% | |
| | 2,500 | | | China Mobile Ltd. | | | 25,511 | |
| | | | | | | | |
|
| | Finland – 1.93% | |
| | 4,519 | | | Nokia OYJ | | | 25,743 | |
| | | | | | | | |
|
| | France – 14.21% | |
| | 1,491 | | | Engie SA | | | 22,235 | |
| | 400 | | | Engie SA Registered Shares (Prime Fidelite 2019) | | | 5,965 | |
| | 1,092 | | | Engie SA Registered Shares (Prime Fidelite 2021) | | | 16,285 | |
| | 461 | | | Publicis Groupe SA | | | 24,683 | |
| | 551 | | | Sanofi | | | 48,722 | |
| | 528 | | | Schneider Electric SE | | | 41,443 | |
| | 543 | | | Total SA | | | 30,218 | |
| | | | | | | | |
| | | | | | | 189,551 | |
| | | | | | | | |
|
| | Italy – 2.73% | |
| | 2,057 | | | Eni SpA | | | 36,344 | |
| | | | | | | | |
|
| | Japan – 2.04% | |
| | 1,000 | | | Honda Motor Co. Ltd. | | | 27,161 | |
| | | | | | | | |
|
| | Mexico – 3.34% | |
| | 32,370 | | | Fibra Uno Administracion SA de CV | | | 44,610 | |
| | | | | | | | |
|
| | South Korea – 1.56% | |
| | 228 | | | KT&G Corp. | | | 20,791 | |
| | | | | | | | |
|
| | Switzerland – 5.31% | |
| | 1,738 | | | Credit Suisse Group AG | | | 20,259 | |
| | 240 | | | Swiss Resources AG | | | 23,459 | |
| | 2,237 | | | UBS Group AG | | | 27,143 | |
| | | | | | | | |
| | | | | | | 70,861 | |
| | | | | | | | |
|
| | United Kingdom – 24.74% | |
| | 5,500 | | | BP Plc | | | 39,938 | |
| | | | | | | | |
| Shares | | | | | Value | |
| | 403 | | | British American Tobacco Plc | | $ | 16,812 | |
| | 2,390 | | | GlaxoSmithKline Plc | | | 49,654 | |
| | 2,038 | | | HSBC Holdings Plc | | | 16,561 | |
| | 1,102 | | | Imperial Brands Plc | | | 37,696 | |
| | 6,646 | | | J Sainsbury Plc | | | 20,394 | |
| | 11,678 | | | Kingfisher Plc | | | 35,813 | |
| | 4,816 | | | Marks & Spencer Group Plc | | | 17,479 | |
| | 814 | | | Royal Dutch Shell Plc – Class A | | | 25,581 | |
| | 8,470 | | | Tesco Plc | | | 25,635 | |
| | 4,210 | | | Wm Morrison Supermarkets Plc | | | 12,489 | |
| | 3,024 | | | WPP Plc | | | 31,946 | |
| | | | | | | | |
| | | | | | | 329,998 | |
| | | | | | | | |
|
| | United States – 24.47% | |
| | 280 | | | Bank of New York Mellon Corp. | | | 14,120 | |
| | 234 | | | BB&T Corp. | | | 10,888 | |
| | 847 | | | Cardinal Health, Inc. | | | 40,783 | |
| | 466 | | | Citigroup, Inc. | | | 28,995 | |
| | 305 | | | Emerson Electric Co. | | | 20,883 | |
| | 166 | | | Johnson & Johnson | | | 23,205 | |
| | 475 | | | Merck & Co., Inc. | | | 39,506 | |
| | 129 | | | Microsoft Corp. | | | 15,214 | |
| | 118 | | | PepsiCo, Inc. | | | 14,461 | |
| | 934 | | | Pfizer, Inc. | | | 39,667 | |
| | 85 | | | PNC Financial Services Group, Inc. | | | 10,426 | |
| | 135 | | | Procter & Gamble Co. | | | 14,047 | |
| | 308 | | | State Street Corp. | | | 20,269 | |
| | 701 | | | Wells Fargo & Co. | | | 33,872 | |
| | | | | | | | |
| | | | | | | 326,336 | |
| | | | | | | | |
| TOTAL COMMON STOCKS
(Cost $1,151,795) | | $ | 1,173,057 | |
| | | | | | | | |
| | PREFERRED STOCKS – 9.19% | |
|
| | South Korea – 1.77% | |
| | 736 | | | Samsung Electronics Co. Ltd. | | $ | 23,567 | |
| | | | | | | | |
|
| | United States – 7.42% | |
| | 1,632 | | | Bank of America Corp., 4.000% (3M LIBOR + 0.500%, minimum of 4.000%)(a) | | | 34,272 | |
The accompanying notes to financial statements are an integral part of these Schedule of Investments.
44
Brandes Global Equity Income Fund
SCHEDULE OF INVESTMENTS — March 31, 2019 (Unaudited) (continued)
| | | | | | | | |
| Shares | | | | | Value | |
| | 1,701 | | | Goldman Sachs Group, Inc., 3.750% (3M LIBOR + 0.750%, minimum of 3.750%)(a) | | $ | 32,353 | |
| | 1,668 | | | Morgan Stanley, 4.000% (3M LIBOR + 0.700%, minimum of 4.000%)(a) | | | 32,276 | |
| | | | | | | | |
| | | | | | | 98,901 | |
| | | | | | | | |
| TOTAL PREFERRED STOCKS
(Cost $120,946) | | $ | 122,468 | |
| | | | | | | | |
| Total Investments
(Cost $1,272,741) – 97.14% | | $ | 1,295,525 | |
| Other Assets in Excess of
Liabilities – 2.86% | | | 38,152 | |
| | | | | | | | |
| | TOTAL NET ASSETS – 100.00% | | $ | 1,333,677 | |
| | | | | | | | |
Percentages are stated as a percent of net assets.
LIBOR London Inter-bank Offered Rate
| (a) | Variable rate security. This coupon is based on a reference index and spread. |
The accompanying notes to financial statements are an integral part of these Schedule of Investments.
45
Brandes Global Equity Income Fund
SCHEDULE OF INVESTMENTS BY INDUSTRY — March 31, 2019 (Unaudited)
| | | | |
COMMON STOCKS | | | | |
Automobiles | | | 2.04 | % |
Banks | | | 7.55 | % |
Beverages | | | 1.08 | % |
Capital Markets | | | 6.13 | % |
Communications Equipment | | | 1.93 | % |
Diversified Telecommunication Services | | | 3.34 | % |
Electric Utilities | | | 2.37 | % |
Electrical Equipment | | | 4.67 | % |
Equity Real Estate Investment Trusts | | | 3.34 | % |
Food & Staples Retailing | | | 4.39 | % |
Health Care Providers & Services | | | 3.06 | % |
Household Products | | | 1.05 | % |
Insurance | | | 1.76 | % |
Media | | | 4.25 | % |
Multiline Retail | | | 1.31 | % |
Multi-Utilities | | | 3.34 | % |
Oil, Gas & Consumable Fuels | | | 9.90 | % |
Pharmaceuticals | | | 15.05 | % |
Software | | | 1.14 | % |
Specialty Retail | | | 2.69 | % |
Tobacco | | | 5.65 | % |
Wireless Telecommunication Services | | | 1.91 | % |
| | | | |
TOTAL COMMON STOCKS | | | 87.95 | % |
| | | | |
| |
PREFERRED STOCKS | | | | |
Banks | | | 2.57 | % |
Capital Markets | | | 4.85 | % |
Technology Hardware, Storage & Peripherals | | | 1.77 | % |
| | | | |
TOTAL PREFERRED STOCKS | | | 9.19 | % |
| | | | |
| |
TOTAL INVESTMENTS | | | 97.14 | % |
Other Assets in Excess of Liabilities | | | 2.86 | % |
| | | | |
| |
TOTAL NET ASSETS | | | 100.00 | % |
| | | | |
The industry classifications represented in the Schedule of Investments are in accordance with Global Industry Classification Standards (GICS®), which was developed by and/or is the exclusive property of MSCI, Inc. and Standard & Poor Financial Services LLC. This information is unaudited.
The accompanying notes to financial statements are an integral part of these Schedule of Investments.
46
Brandes Global Opportunities Value Fund
SCHEDULE OF INVESTMENTS — March 31, 2019 (Unaudited)
| | | | | | | | |
| Shares | | | | | Value | |
| | COMMON STOCKS – 92.03% | | | | |
| |
| | Brazil – 6.12% | | | | |
| | 16,158 | | | Embraer SA Sponsored – ADR | | $ | 307,164 | |
| | 73,000 | | | Marfrig Global Foods SA (a) | | | 111,681 | |
| | 18,700 | | | Telefonica Brasil SA | | | 208,953 | |
| | | | | | | | |
| | | | | | | 627,798 | |
| | | | | | | | |
| |
| | Canada – 1.03% | | | | |
| | 8,560 | | | Sierra Wireless, Inc. (a) | | | 105,691 | |
| | | | | | | | |
| |
| | China – 3.14% | | | | |
| | 25,000 | | | China Mobile Ltd. | | | 255,108 | |
| | 4,224 | | | China Yuchai International Ltd. | | | 66,950 | |
| | | | | | | | |
| | | | | | | 322,058 | |
| | | | | | | | |
| |
| | France – 8.23% | | | | |
| | 9,805 | | | Carrefour SA | | | 183,130 | |
| | 3,845 | | | Engie SA | | | 57,340 | |
| | 4,400 | | | Engie SA Registered Shares (Prime Fidelite 2019) | | | 65,617 | |
| | 3,634 | | | Engie SA Registered Shares (Prime Fidelite 2021) | | | 54,194 | |
| | 2,864 | | | Publicis Groupe SA | | | 153,345 | |
| | 2,567 | | | Sanofi | | | 226,986 | |
| | 1,316 | | | Schneider Electric SE | | | 103,291 | |
| | | | | | | | |
| | | | | | | 843,903 | |
| | | | | | | | |
| |
| | Hong Kong – 0.71% | | | | |
| | 199,340 | | | First Pacific Co. Ltd. | | | 72,831 | |
| | | | | | | | |
| |
| | Hungary – 1.05% | | | | |
| | 66,514 | | | Magyar Telekom Telecommunications Plc | | | 107,421 | |
| | | | | | | | |
| |
| | Ireland – 1.62% | | | | |
| | 46,257 | | | C&C Group Plc | | | 166,045 | |
| | | | | | | | |
| |
| | Italy – 2.85% | | | | |
| | 6,616 | | | Eni SpA | | | 116,896 | |
| | 308,973 | | | Telecom Italia Rsp | | | 175,473 | |
| | | | | | | | |
| | | | | | | 292,369 | |
| | | | | | | | |
| | | | | | | | |
| Shares | | | | | Value | |
| |
| | Japan – 7.00% | | | | |
| | 6,300 | | | Honda Motor Co. Ltd. | | $ | 171,113 | |
| | 7,300 | | | Mitsubishi Tanabe Pharma Corp. | | | 97,779 | |
| | 20,500 | | | Nissan Motor Co. Ltd. | | | 168,349 | |
| | 2,200 | | | NuFlare Technology, Inc. | | | 122,295 | |
| | 6,700 | | | Tachi-S Co. Ltd. | | | 96,079 | |
| | 10,900 | | | TSI Holdings Co. Ltd. | | | 62,543 | |
| | | | | | | | |
| | | | | | | 718,158 | |
| | | | | | | | |
| |
| | Mexico – 7.06% | | | | |
| | 23,214 | | | Cemex SAB de CV Sponsored – ADR (a) | | | 107,713 | |
| | 665,517 | | | Consorcio ARA SAB de CV | | | 170,406 | |
| | 209,818 | | | Fibra Uno Administracion SA de CV | | | 289,158 | |
| | 143,570 | | | Macquarie Mexico Real Estate Management SA de CV (b) | | | 156,734 | |
| | | | | | | | |
| | | | | | | 724,011 | |
| | | | | | | | |
| |
| | Netherlands – 1.13% | | | | |
| | 1,309 | | | NXP Semiconductors NV | | | 115,703 | |
| | | | | | | | |
| |
| | Panama – 1.31% | | | | |
| | 6,733 | | | Banco Latinoamericano de Comercio Exterior SA – Class E | | | 134,122 | |
| | | | | | | | |
| |
| | Russia – 3.43% | | | | |
| | 31,027 | | | Public Joint-Stock Co. Gazprom Sponsored – ADR | | | 140,242 | |
| | 45,223 | | | Sberbank of Russia OJSC | | | 147,782 | |
| | 440,609 | | | Sistema PJSFC | | | 64,075 | |
| | | | | | | | |
| | | | | | | 352,099 | |
| | | | | | | | |
| |
| | Slovenia – 1.34% | | | | |
| | 10,071 | | | Nova Ljubljanska Banka – GDR (a)(b) | | | 137,826 | |
| | | | | | | | |
The accompanying notes to financial statements are an integral part of these Schedule of Investments.
47
Brandes Global Opportunities Value Fund
SCHEDULE OF INVESTMENTS — March 31, 2019 (Unaudited) (continued)
| | | | | | | | |
| Shares | | | | | Value | |
| |
| | South Korea – 5.41% | | | | |
| | 904 | | | Hyundai Mobis Co. Ltd. | | $ | 166,240 | |
| | 1,474 | | | KT&G Corp. | | | 134,409 | |
| | 32 | | | Lotte Chilsung Beverage Co. Ltd. | | | 49,927 | |
| | 1,754 | | | Lotte Corp. (a) | | | 76,451 | |
| | 3,253 | | | Samsung Electronics Co. Ltd. | | | 128,308 | |
| | | | | | | | |
| | | | | | | 555,335 | |
| | | | | | | | |
| |
| | Spain – 1.14% | | | | |
| | 24,871 | | | Atresmedia Corp de Medios de Comunicacion SA | | | 116,707 | |
| | | | | | | | |
| |
| | Switzerland – 3.22% | | | | |
| | 14,497 | | | Credit Suisse Group AG | | | 168,983 | |
| | 13,292 | | | UBS Group AG | | | 161,279 | |
| | | | | | | | |
| | | | | | | 330,262 | |
| | | | | | | | |
| |
| | United Kingdom – 20.25% | | | | |
| | 51,886 | | | Barclays Plc | | | 104,513 | |
| | 17,570 | | | BP Plc | | | 127,585 | |
| | 952,162 | | | Countrywide Plc (a) | | | 93,977 | |
| | 30,146 | | | De La Rue Plc | | | 151,362 | |
| | 12,222 | | | GlaxoSmithKline Plc | | | 253,923 | |
| | 5,857 | | | Imperial Brands Plc | | | 200,353 | |
| | 37,186 | | | J Sainsbury Plc | | | 114,112 | |
| | 58,923 | | | Kingfisher Plc | | | 180,701 | |
| | 32,134 | | | LSL Property Services Plc | | | 113,003 | |
| | 52,730 | | | Marks & Spencer Group Plc | | | 191,373 | |
| | 103,241 | | | Mitie Group Plc | | | 200,087 | |
| | 33,507 | | | Tesco Plc | | | 101,409 | |
| | 33,481 | | | Wm Morrison Supermarkets Plc | | | 99,324 | |
| | 13,865 | | | WPP Plc | | | 146,472 | |
| | | | | | | | |
| | | | | | | 2,078,194 | |
| | | | | | | | |
| | | | | | | | |
| Shares | | | | | Value | |
| |
| | United States – 15.99% | | | | |
| | 2,711 | | | American International Group, Inc. | | $ | 116,736 | |
| | 12,505 | | | Briggs & Stratton Corp. | | | 147,935 | |
| | 3,738 | | | Cardinal Health, Inc. | | | 179,984 | |
| | 2,944 | | | Citigroup, Inc. | | | 183,176 | |
| | 3,475 | | | Edgewell Personal Care Co. (a) | | | 152,518 | |
| | 3,722 | | | Jefferies Financial Group, Inc. | | | 69,936 | |
| | 1,449 | | | McKesson Corp. | | | 169,620 | |
| | 5,588 | | | Owens & Minor, Inc. | | | 22,911 | |
| | 11,768 | | | St. Joe Co. (a) | | | 194,055 | |
| | 1,711 | | | State Street Corp. | | | 112,601 | |
| | 2,397 | | | Wells Fargo & Co. | | | 115,823 | |
| | 6,082 | | | World Fuel Services Corp. | | | 175,708 | |
| | | | | | | | |
| | | | | | | 1,641,003 | |
| | | | | | | | |
| TOTAL COMMON STOCKS
(Cost $9,864,860) | | $ | 9,441,536 | |
| | | | | | | | |
| | PREFERRED STOCKS – 6.17% | | | | |
| |
| | Brazil – 1.43% | | | | |
| | 2,400 | | | Companhia Brasileira de Distribuicao | | $ | 55,744 | |
| | 12,840 | | | Petroleo Brasileiro SA | | | 91,266 | |
| | | | | | | | |
| | | | | | | 147,010 | |
| | | | | | | | |
| |
| | Germany – 0.91% | | | | |
| | 1,974 | | | Draegerwerk AG & Co. KGaA | | | 93,578 | |
| | | | | | | | |
| |
| | Russia – 1.97% | | | | |
| | 324,131 | | | Surgutneftegas PJSC | | | 202,436 | |
| | | | | | | | |
| |
| | South Korea – 1.86% | | | | |
| | 3,119 | | | Hyundai Motor Co. Ltd. | | | 190,388 | |
| | | | | | | | |
| TOTAL PREFERRED STOCKS
(Cost $579,482) | | $ | 633,412 | |
| | | | | | | | |
The accompanying notes to financial statements are an integral part of these Schedule of Investments.
48
Brandes Global Opportunities Value Fund
SCHEDULE OF INVESTMENTS — March 31, 2019 (Unaudited) (continued)
| | | | | | | | |
| | | Principal
Amount | | | Value | |
| REPURCHASE AGREEMENTS – 2.09% | | | | | | | | |
State Street Bank and Trust Repurchase Agreement,
(Dated 03/29/19), due 04/01/19, 1.20% [Collateralized
by $200,000 US Treasury Notes TIPS, 0.125%, 01/15/22,
(Market Value $220,484)] (proceeds $214,926) | | $ | 214,905 | | | $ | 214,905 | |
| | | | | | | | |
TOTAL REPURCHASE AGREEMENTS(Cost $214,905) | | | | | | $ | 214,905 | |
| | | | | | | | |
Total Investments (Cost $10,659,247) – 100.29% | | | | | | $ | 10,289,853 | |
Liabilities in Excess of Other Assets – (0.29)% | | | | | | | (29,868 | ) |
| | | | | | | | |
TOTAL NET ASSETS – 100.00% | | | | | | $ | 10,259,985 | |
| | | | | | | | |
Percentages are stated as a percent of net assets.
ADR American Depositary Receipt
GDR Global Depositary Receipt
TIPS Treasury Inflation-Protected Security
| (a) | Non-income producing security. |
| (b) | Acquired in a transaction exempt from registration under Rule 144A or Section 4(a)(2) of the Securities Act of 1933. May be resold in the U.S. in transactions exempt from registration, normally to qualified institutional buyers. The total value of all such securities was $294,560, which represented 2.87% of the net assets of the Fund. |
The accompanying notes to financial statements are an integral part of these Schedule of Investments.
49
Brandes Global Opportunities Value Fund
SCHEDULE OF INVESTMENTS BY INDUSTRY — March 31, 2019 (Unaudited)
| | | | |
COMMON STOCKS | | | | |
Aerospace & Defense | | | 2.99 | % |
Auto Components | | | 2.56 | % |
Automobiles | | | 3.31 | % |
Banks | | | 6.72 | % |
Beverages | | | 2.10 | % |
Capital Markets | | | 4.32 | % |
Commercial Services & Supplies | | | 3.43 | % |
Communications Equipment | | | 1.03 | % |
Construction Materials | | | 1.05 | % |
Diversified Financial Services | | | 2.70 | % |
Diversified Telecommunication Services | | | 4.79 | % |
Electrical Equipment | | | 1.01 | % |
Equity Real Estate Investment Trusts | | | 4.35 | % |
Food & Staples Retailing | | | 4.85 | % |
Food Products | | | 1.09 | % |
Health Care Providers & Services | | | 3.63 | % |
Household Durables | | | 1.66 | % |
Industrial Conglomerates | | | 0.74 | % |
Insurance | | | 1.14 | % |
Machinery | | | 2.09 | % |
Media | | | 4.06 | % |
Multiline Retail | | | 1.87 | % |
Multi-Utilities | | | 1.73 | % |
Oil, Gas & Consumable Fuels | | | 5.46 | % |
Personal Products | | | 1.49 | % |
Pharmaceuticals | | | 5.64 | % |
Real Estate Management & Development | | | 3.91 | % |
Semiconductors & Semiconductor Equipment | | | 2.32 | % |
Specialty Retail | | | 1.76 | % |
Technology Hardware, Storage & Peripherals | | | 1.25 | % |
Textiles, Apparel & Luxury Goods | | | 0.61 | % |
Tobacco | | | 3.26 | % |
Wireless Telecommunication Services | | | 3.11 | % |
| | | | |
TOTAL COMMON STOCKS | | | 92.03 | % |
| | | | |
| |
PREFERRED STOCKS | | | | |
Automobiles | | | 1.86 | % |
Food & Staples Retailing | | | 0.54 | % |
Health Care Equipment & Supplies | | | 0.91 | % |
Oil, Gas & Consumable Fuels | | | 2.86 | % |
| | | | |
TOTAL PREFERRED STOCKS | | | 6.17 | % |
| | | | |
| |
REPURCHASE AGREEMENTS | | | 2.09 | % |
| | | | |
| |
TOTAL INVESTMENTS | | | 100.29 | % |
Liabilities in Excess of Other Assets | | | (0.29 | )% |
| | | | |
| |
TOTAL NET ASSETS | | | 100.00 | % |
| | | | |
The industry classifications represented in the Schedule of Investments are in accordance with Global Industry Classification Standards (GICS®), which was developed by and/or is the exclusive property of MSCI, Inc. and Standard & Poor Financial Services LLC. This information is unaudited.
The accompanying notes to financial statements are an integral part of these Schedule of Investments.
50
Brandes Emerging Markets Value Fund
SCHEDULE OF INVESTMENTS — March 31, 2019 (Unaudited)
| | | | | | | | |
| Shares | | | | | Value | |
| | COMMON STOCKS – 88.90% | |
|
| | Argentina – 3.05% | |
| | 1,176,931 | | | Adecoagro SA(a) | | $ | 8,109,055 | |
| | 2,625,116 | | | YPF SA Sponsored – Class D – ADR | | | 36,777,875 | |
| | | | | | | | |
| | | | | | | 44,886,930 | |
| | | | | | | | |
|
| | Austria – 1.05% | |
| | 421,414 | | | Erste Group Bank AG | | | 15,488,576 | |
| | | | | | | | |
|
| | Brazil – 9.71% | |
| | 2,764,947 | | | AES Tiete Energia SA | | | 7,838,613 | |
| | 5,180,100 | | | Cielo SA | | | 12,529,032 | |
| | 297,783 | | | Companhia Paranaense de Energia | | | 2,442,135 | |
| | 2,748,762 | | | Embraer SA Sponsored – ADR | | | 52,253,966 | |
| | 4,202,093 | | | Estacio Participacoes SA | | | 28,515,870 | |
| | 1,243,200 | | | Hapvida Participacoes e Investimentos SA(c) | | | 9,782,776 | |
| | 5,600,500 | | | Kroton Educacional SA | | | 14,990,547 | |
| | 9,401,811 | | | Marfrig Global Foods SA(a) | | | 14,383,605 | |
| | | | | | | | |
| | | | | | | 142,736,544 | |
| | | | | | | | |
|
| | Chile – 1.48% | |
| | 1,339,920 | | | Empresa Nacional de Telecomunicaciones SA | | | 13,952,393 | |
| | 1,509,388 | | | Enel Chile SA Sponsored – ADR | | | 7,818,630 | |
| | | | | | | | |
| | | | | | | 21,771,023 | |
| | | | | | | | |
|
| | China – 11.36% | |
| | 25,571,000 | | | China Construction Bank Corp. – Class H | | | 21,949,345 | |
| | 6,243,900 | | | China Mobile Ltd. | | | 63,714,830 | |
| | | | | | | | |
| Shares | | | | | Value | |
| | 13,805,000 | | | China Railway Signal & Communication Corp. Ltd.(c) | | $ | 10,934,076 | �� |
| | 173,073 | | | China Yuchai International Ltd. | | | 2,743,207 | |
| | 34,409,000 | | | Dongfeng Motor Group Co. Ltd. – Class H | | | 34,519,697 | |
| | 18,143,000 | | | Genertec Universal Medical Group Co. Ltd.(c) | | | 16,520,215 | |
| | 5,423,200 | | | Shanghai Pharmaceuticals Holding Co. Ltd. – Class H | | | 11,819,960 | |
| | 12,307,077 | | | Weiqiao Textile Co. Ltd. – Class H | | | 4,877,758 | |
| | | | | | | | |
| | | | | | | 167,079,088 | |
| | | | | | | | |
|
| | Colombia – 1.13% | |
| | 2,127,094 | | | Grupo Aval Acciones y Valores Grupo Sponsored – ADR | | | 16,570,062 | |
| | | | | | | | |
|
| | Czech Republic – 0.46% | |
| | 626,829 | | | O2 Czech Republic AS | | | 6,796,363 | |
| | | | | | | | |
|
| | Greece – 0.73% | |
| | 798,672 | | | Hellenic Telecommunications Organization SA | | | 10,697,220 | |
| | | | | | | | |
|
| | Hong Kong – 3.45% | |
| | 28,461,920 | | | First Pacific Co. Ltd. | | | 10,398,928 | |
| | 9,809,500 | | | Lifestyle International Holdings Ltd. | | | 17,014,550 | |
| | 5,090,000 | | | Luk Fook Holdings International Ltd. | | | 17,152,023 | |
| | 1,779,000 | | | Yue Yuen Industrial Holdings Ltd. | | | 6,124,665 | |
| | | | | | | | |
| | | | | | | 50,690,166 | |
| | | | | | | | |
The accompanying notes to financial statements are an integral part of these Schedule of Investments.
51
Brandes Emerging Markets Value Fund
SCHEDULE OF INVESTMENTS — March 31, 2019 (Unaudited) (continued)
| | | | | | | | |
| Shares | | | | | Value | |
|
| | India – 1.15% | |
| | 5,904,971 | | | Power Grid Corp of India Ltd. | | $ | 16,869,248 | |
| | | | | | | | |
|
| | Indonesia – 4.65% | |
| | 136,241,600 | | | Bank Rakyat Indonesia Persero Tbk PT | | | 39,559,167 | |
| | 151,545,215 | | | PT XL Axiata Tbk(a) | | | 28,769,084 | |
| | | | | | | | |
| | | | | | | 68,328,251 | |
| | | | | | | | |
|
| | Malaysia – 1.92% | |
| | 17,329,800 | | | Genting Berhad | | | 28,223,060 | |
| | | | | | | | |
|
| | Mexico – 10.34% | |
| | 30,167,817 | | | America Movil SAB de CV | | | 21,557,044 | |
| | 9,361,546 | | | Cemex SAB de CV Sponsored – ADR(a) | | | 43,437,574 | |
| | 32,196,641 | | | Fibra Uno Administracion SA de CV | | | 44,371,409 | |
| | 17,287,809 | | | Fideicomiso PLA Administradora Industrial S de RL de CV | | | 26,488,038 | |
| | 14,203,330 | | | Macquarie Mexico Real Estate Management SA de CV(c) | | | 15,505,651 | |
| | 10,242,449 | | | Urbi Desarrollos Urbanos SA de CV(a)(d) | | | 717,648 | |
| | | | | | | | |
| | | | | | | 152,077,364 | |
| | | | | | | | |
|
| | Pakistan – 0.50% | |
| | 7,646,760 | | | Nishat Mills Ltd. | | | 7,313,182 | |
| | | | | | | | |
|
| | Panama – 2.43% | |
| | 644,836 | | | Banco Latinoamericano de Comercio Exterior SA – Class E | | | 12,845,133 | |
| | 283,222 | | | Copa Holdings SA – Class A | | | 22,830,525 | |
| | | | | | | | |
| | | | | | | 35,675,658 | |
| | | | | | | | |
| | | | | | | | |
| Shares | | | | | Value | |
|
| | Russia – 8.42% | |
| | 6,017,014 | | | Mobile TeleSystems PJSC | | $ | 23,150,124 | |
| | 5,318,206 | | | Public Joint-Stock Co. Gazprom | | | 12,126,143 | |
| | 3,281,891 | | | Public Joint-Stock Co. Gazprom Sponsored – ADR | | | 14,834,147 | |
| | 12,312,844 | | | Sberbank of Russia OJSC | | | 40,236,541 | |
| | 2,684,906 | | | Sistema JSFC Sponsored – GDR | | | 7,569,016 | |
| | 1,038,411 | | | X5 Retail Group NV – GDR | | | 25,877,202 | |
| | | | | | | | |
| | | | | | | 123,793,173 | |
| | | | | | | | |
|
| | Singapore – 1.79% | |
| | 2,637,874 | | | Flex Ltd.(a) | | | 26,378,740 | |
| | | | | | | | |
|
| | South Africa – 1.51% | |
| | 2,098,660 | | | Absa Group Ltd. | | | 22,209,861 | |
| | | | | | | | |
|
| | South Korea – 12.63% | |
| | 133,964 | | | Hyundai Mobis Co. Ltd. | | | 24,635,218 | |
| | 752,977 | | | KIA Motors Corp. | | | 23,466,688 | |
| | 431,744 | | | KT&G Corp. | | | 39,369,385 | |
| | 129,875 | | | POSCO | | | 29,001,069 | |
| | 260,480 | | | S-1 Corp. | | | 23,062,497 | |
| | 610,691 | | | Samsung Electronics Co. Ltd. | | | 24,087,444 | |
| | 592,275 | | | Shinhan Financial Group Co. Ltd. | | | 21,992,474 | |
| | | | | | | | |
| | | | | | | 185,614,775 | |
| | | | | | | | |
|
| | Spain – 1.47% | |
| | 9,775,356 | | | Prosegur Cash SA(c) | | | 21,595,350 | |
| | | | | | | | |
|
| | Taiwan – 1.59% | |
| | 3,216,000 | | | Asustek Computer, Inc. | | | 23,304,224 | |
| | | | | | | | |
|
| | Thailand – 3.09% | |
| | 1,984,500 | | | Bangkok Bank Plc – NVDR | | | 12,960,215 | |
The accompanying notes to financial statements are an integral part of these Schedule of Investments.
52
Brandes Emerging Markets Value Fund
SCHEDULE OF INVESTMENTS — March 31, 2019 (Unaudited) (continued)
| | | | | | | | |
| Shares | | | | | Value | |
| | 43,617,600 | | | Jasmine Broadband Internet Infrastructure – Class F | | $ | 14,156,650 | |
| | 4,410,700 | | | Siam Commercial Bank PCL – Class F | | | 18,349,495 | |
| | | | | | | | |
| | | | | | | 45,466,360 | |
| | | | | | | | |
|
| | Turkey – 2.45% | |
| | 10,120,663 | | | Akbank T.A.S.(a) | | | 11,523,700 | |
| | 54,766,538 | | | Emlak Konut Gayrimenkul Yatirim Ortakligi AG | | | 15,064,987 | |
| | 6,223,640 | | | Turkiye Garanti Bankasi Anonim Sirketi | | | 9,362,619 | |
| | | | | | | | |
| | | | | | | 35,951,306 | |
| | | | | | | | |
|
| | United Kingdom – 2.54% | |
| | 22,007,865 | | | ITE Group Plc | | | 20,065,000 | |
| | 10,376,419 | | | Vivo Energy Plc(c) | | | 17,342,235 | |
| | | | | | | | |
| | | | | | | 37,407,235 | |
| | | | | | | | |
| TOTAL COMMON STOCKS
(Cost $1,463,522,277) | | $ | 1,306,923,759 | |
| | | | | | | | |
| | PREFERRED STOCKS – 8.28% | |
|
| | Brazil – 3.84% | |
| | 1,166,900 | | | Companhia Brasileira de Distribuicao | | $ | 27,103,040 | |
| | 1,780,600 | | | Petroleo Brasileiro SA | | | 12,656,365 | |
| | | | | | | | |
| Shares | | | | | Value | |
| | 498,300 | | | Telefonica Brasil SA | | $ | 6,045,245 | |
| | 885,569 | | | Telefonica Brasil SA Sponsored – ADR | | | 10,688,818 | |
| | | | | | | | |
| | | | | | | 56,493,468 | |
| | | | | | | | |
|
| | Colombia – 0.53% | |
| | 20,018,115 | | | Grupo Aval Acciones y Valores SA | | | 7,754,749 | |
| | | | | | | | |
|
| | Russia – 2.19% | |
| | 32,081,832 | | | Surgutneftegas PJSC | | | 20,036,771 | |
| | 1,977,282 | | | Surgutneftegas PJSC Sponsored – ADR | | | 12,160,284 | |
| | | | | | | | |
| | | | | | | 32,197,055 | |
| | | | | | | | |
|
| | South Korea – 1.72% | |
| | 413,848 | | | Hyundai Motor Co. Ltd. | | | 25,261,861 | |
| | | | | | | | |
| TOTAL PREFERRED
STOCKS
(Cost $119,426,072) | | $ | 121,707,133 | |
| | | | | | | | |
| | PARTICIPATORY NOTES – 1.04% | |
|
| | China – 1.04% | |
| | 7,936,516 | | | China South Publishing & Media Group Co. Ltd.(a)(b)(c)(e) | | $ | 15,221,587 | |
| | | | | | | | |
| TOTAL PARTICIPATORY
NOTES
(Cost $15,164,834) | | $ | 15,221,587 | |
| | | | | | | | |
The accompanying notes to financial statements are an integral part of these Schedule of Investments.
53
Brandes Emerging Markets Value Fund
SCHEDULE OF INVESTMENTS — March 31, 2019 (Unaudited) (continued)
| | | | | | | | |
| | | Principal
Amount | | | Value | |
| REPURCHASE AGREEMENTS – 1.95% | | | | | | | | |
State Street Bank and Trust Repurchase Agreement,
(Dated 03/29/19), due 04/01/19, 1.20% [Collateralized
by $5,260,000 US Treasury Notes, 2.500%, 02/15/22,
(Market Value $5,320,664)] (proceeds $5,216,859) | | $ | 5,216,337 | | | $ | 5,216,337 | |
State Street Bank and Trust Repurchase Agreement,
(Dated 03/29/19), due 04/01/19, 1.20% [Collateralized
by $21,765,000 US Treasury Notes TIPS, 0.125%, 01/15/22,
(Market Value $23,994,150)] (proceeds $23,522,627) | | | 23,520,275 | | | | 23,520,275 | |
| | | | | | | | |
TOTAL REPURCHASE AGREEMENTS
(Cost $28,736,612) | | | | | | $ | 28,736,612 | |
| | | | | | | | |
Total Investments (Cost $1,626,849,795) –100.17% | | | | | | $ | 1,472,589,091 | |
Liabilities in Excess of Other Assets – (0.17)% | | | | | | | (2,461,587 | ) |
| | | | | | | | |
TOTAL NET ASSETS – 100.00% | | | | | | $ | 1,470,127,504 | |
| | | | | | | | |
Percentages are stated as a percent of net assets.
ADR American Depositary Receipt
GDR Global Depositary Receipt
NVDR Non-Voting Depositary Receipt
TIPS Treasury Inflation-Protected Security
| (a) | Non-income producing security. |
| (b) | The price for this security was derived from an estimate of fair market value using methods approved by the Fund's Board of Trustees. This security represents $15,221,587 or 1.04% of the Fund's net assets and is classified as a Level 2 security. See Note 2 in the Notes to Financial Statements. |
| (c) | Acquired in a transaction exempt from registration under Rule 144A or Section 4(a)(2) of the Securities Act of 1933. May be resold in the U.S. in transactions exempt from registration, normally to qualified institutional buyers. The total value of all such securities was $106,901,890, which represented 7.27% of the net assets of the Fund. |
| (d) | Affiliated issuer. See Note 8 in the Notes to Financial Statements. |
| (e) | Represents the underlying security of a participatory note with HSBC Bank Plc. China South Publishing & Media Group Co. Ltd. has a maturity date of November 23, 2021. See Note 5 in the Notes to Financial Statements. |
The accompanying notes to financial statements are an integral part of these Schedule of Investments.
54
Brandes Emerging Markets Value Fund
SCHEDULE OF INVESTMENTS BY INDUSTRY — March 31, 2019 (Unaudited)
| | | | |
COMMON STOCKS | | | | |
Aerospace & Defense | | | 3.55 | % |
Airlines | | | 1.55 | % |
Auto Components | | | 1.68 | % |
Automobiles | | | 3.94 | % |
Banks | | | 15.66 | % |
Commercial Services & Supplies | | | 3.04 | % |
Construction Materials | | | 2.95 | % |
Diversified Consumer Services | | | 2.96 | % |
Diversified Financial Services | | | 1.58 | % |
Diversified Telecommunication Services | | | 1.19 | % |
Electric Utilities | | | 1.85 | % |
Electronic Equipment, Instruments & Components | | | 2.54 | % |
Equity Real Estate Investment Trusts | | | 7.86 | % |
Food & Staples Retailing | | | 1.76 | % |
Food Products | | | 1.53 | % |
Health Care Providers & Services | | | 2.59 | % |
Hotels, Restaurants & Leisure | | | 1.92 | % |
Household Durables | | | 0.05 | % |
Independent Power & Renewable Electricity Producers | | | 0.53 | % |
IT Services | | | 0.85 | % |
Machinery | | | 0.19 | % |
Media | | | 1.36 | % |
Metals & Mining | | | 1.97 | % |
Multiline Retail | | | 1.16 | % |
Oil, Gas & Consumable Fuels | | | 4.34 | % |
Specialty Retail | | | 2.35 | % |
Technology Hardware, Storage & Peripherals | | | 3.22 | % |
Textiles, Apparel & Luxury Goods | | | 1.25 | % |
Tobacco | | | 2.68 | % |
Wireless Telecommunication Services | | | 10.80 | % |
| | | | |
TOTAL COMMON STOCKS | | | 88.90 | % |
| | | | |
| |
PREFERRED STOCKS | | | | |
Automobiles | | | 1.72 | % |
Banks | | | 0.53 | % |
Diversified Telecommunication Services | | | 1.14 | % |
Food & Staples Retailing | | | 1.84 | % |
Oil, Gas & Consumable Fuels | | | 3.05 | % |
| | | | |
TOTAL PREFERRED STOCKS | | | 8.28 | % |
| | | | |
| |
PARTICIPATORY NOTES | | | | |
Media | | | 1.04 | % |
| | | | |
TOTAL PARTICIPATORY NOTES | | | 1.04 | % |
| | | | |
The accompanying notes to financial statements are an integral part of these Schedule of Investments.
55
Brandes Emerging Markets Value Fund
SCHEDULE OF INVESTMENTS BY INDUSTRY — March 31, 2019 (Unaudited) (continued)
| | | | |
| |
REPURCHASE AGREEMENTS | | | 1.95 | % |
| | | | |
| |
TOTAL INVESTMENTS | | | 100.17 | % |
Liabilities in Excess of Other Assets | | | (0.17 | )% |
| | | | |
| |
TOTAL NET ASSETS | | | 100.00 | % |
| | | | |
The industry classifications represented in the Schedule of Investments are in accordance with Global Industry Classification Standards (GICS®), which was developed by and/or is the exclusive property of MSCI, Inc. and Standard & Poor Financial Services LLC. This information is unaudited.
The accompanying notes to financial statements are an integral part of these Schedule of Investments.
56
Brandes International Small Cap Equity Fund
SCHEDULE OF INVESTMENTS — March 31, 2019 (Unaudited)
| | | | | | | | |
Shares | | | | | Value | |
| | COMMON STOCKS – 91.44% | |
|
| | Argentina – 0.52% | |
| 499,564
|
| | Adecoagro SA(a) | | $ | 3,441,996 | |
| | | | | | | | |
|
| | Belgium – 1.02% | |
| 171,469
|
| | D’Ieteren SA | | | 6,792,399 | |
| | | | | | | | |
|
| | Brazil – 4.59% | |
| 5,619,547
|
| | Embraer SA | | | 26,609,729 | |
| 3,166,100
|
| | Mills Estruturas e Servicos de Engenharia SA(a) | | | 3,832,943 | |
| | | | | | | | |
| | | | | | | 30,442,672 | |
| | | | | | | | |
|
| | Canada – 4.87% | |
| 1,096,395
|
| | Celestica, Inc.(a) | | | 9,264,538 | |
| 1,081,817
|
| | Dorel Industries, Inc. – Class B(a) | | | 9,552,468 | |
| 1,092,216
|
| | Sierra Wireless, Inc.(a) | | | 13,485,661 | |
| | | | | | | | |
| | | | | | | 32,302,667 | |
| | | | | | | | |
|
| | China – 1.30% | |
| 19,938,900
|
| | Boyaa Interactive International Ltd. | | | 4,066,530 | |
| 11,485,500
|
| | Weiqiao Textile Co. Ltd. – Class H | | | 4,552,137 | |
| | | | | | | | |
| | | | | | | 8,618,667 | |
| | | | | | | | |
|
| | France – 1.71% | |
| 100,150
|
| | Savencia SA | | | 7,122,597 | |
| 47,490
|
| | Societe BIC SA | | | 4,233,657 | |
| | | | | | | | |
| | | | | | | 11,356,254 | |
| | | | | | | | |
|
| | Germany – 2.18% | |
| 124,701
|
| | Draegerwerk AG & Co. KGaA | | | 5,343,569 | |
| 317,426
|
| | Rhoen-Klinikum AG | | | 9,143,988 | |
| | | | | | | | |
| | | | | | | 14,487,557 | |
| | | | | | | | |
|
| | Greece – 0.50% | |
| 419,475
|
| | GR Sarantis SA | | | 3,315,769 | |
| | | | | | | | |
|
| | Hong Kong – 4.26% | |
| 10,778,050
|
| | APT Satellite Holdings Ltd. | | | 4,832,991 | |
| 5,791,500
|
| | Dickson Concepts International Ltd. | | | 3,017,501 | |
| 110,420,000
|
| | Emperor Watch & Jewellery Ltd. | | | 3,870,014 | |
| | | | | | | | |
Shares | | | | | Value | |
| 27,354,000
|
| | First Pacific Co. Ltd. | | $ | 9,994,135 | |
| 14,073,000
|
| | PAX Global Technology Ltd. | | | 6,533,393 | |
| | | | | | | | |
| | | | | | | 28,248,034 | |
| | | | | | | | |
|
| | Hungary – 2.12% | |
| 8,693,708
|
| | Magyar Telekom Telecommunications Plc | | | 14,040,478 | |
| | | | | | | | |
|
| | Indonesia – 1.11% | |
| 38,849,000
|
| | PT XL Axiata Tbk(a) | | | 7,375,028 | |
| | | | | | | | |
|
| | Ireland – 4.49% | |
| 1,520,567
|
| | Avadel Pharmaceuticals Plc Sponsored – ADR(a) | | | 2,189,617 | |
| 7,689,402
|
| | C&C Group Plc | | | 27,602,008 | |
| | | | | | | | |
| | | | | | | 29,791,625 | |
| | | | | | | | |
|
| | Italy – 1.31% | |
| 300,178
|
| | Buzzi Unicem SpA | | | 3,909,946 | |
| 5,938,906
|
| | Safilo Group SpA(a) | | | 4,756,667 | |
| | | | | | | | |
| | | | | | | 8,666,613 | |
| | | | | | | | |
|
| | Japan – 20.86% | |
| | 138,600 | | | Bank of Nagoya Ltd. | | | 4,477,918 | |
| | 134,900 | | | Denki Kogyo Co. Ltd. | | | 4,064,336 | |
| | 1,100,200 | | | Funai Electric Co. Ltd.(a)(d) | | | 7,443,608 | |
| | 139,000 | | | Futaba Corp. | | | 2,113,200 | |
| | 3,046,400 | | | Hachijuni Bank Ltd. | | | 12,645,673 | |
| | 2,852,800 | | | Hyakugo Bank Ltd. | | | 9,084,164 | |
| | 415,400 | | | Kato Sangyo Co. Ltd. | | | 13,720,832 | |
| | 442,100 | | | Kissei Pharmaceutical Co. Ltd. | | | 11,604,117 | |
| | 1,427,900 | | | Komori Corp. | | | 16,192,107 | |
| | 124,100 | | | Mitsubishi Shokuhin Co. Ltd. | | | 3,248,463 | |
| | 191,700 | | | Nippon Seiki Co. Ltd. | | | 3,101,084 | |
| | 108,400 | | | NuFlare Technology, Inc. | | | 6,025,863 | |
The accompanying notes to financial statements are an integral part of these Schedule of Investments.
57
Brandes International Small Cap Equity Fund
SCHEDULE OF INVESTMENTS — March 31, 2019 (Unaudited) (continued)
| | | | | | | | |
Shares | | | | | Value | |
| | 139,300 | | | Oita Bank Ltd. | | $ | 4,358,391 | |
| | 523,200 | | | Tachi-S Co. Ltd. | | | 7,502,745 | |
| | 305,100 | | | Torii Pharmaceutical Co. Ltd. | | | 6,139,517 | |
| | 529,400 | | | Toyo Suisan Kaisha Ltd. | | | 20,180,576 | |
| | 513,300 | | | TSI Holdings Co. Ltd. | | | 2,945,259 | |
| | 209,000 | | | Tsutsumi Jewelry Co. Ltd. | | | 3,551,728 | |
| | | | | | | | |
| | | | | | | 138,399,581 | |
| | | | | | | | |
|
| | Mexico – 5.95% | |
| | 30,020,811 | | | Consorcio ARA SAB de CV | | | 7,686,837 | |
| | 279,501,983 | | | Desarrolladora Homex SAB de CV(a)(c) | | | 2,159,957 | |
| | 14,425,246 | | | Fibra Uno Administracion SA de CV | | | 19,879,977 | |
| | 8,095,587 | | | Macquarie Mexico Real Estate Management SA de CV(b) | | | 8,837,881 | |
| | 12,867,533 | | | Urbi Desarrollos Urbanos SA de CV(a)(c) | | | 901,578 | |
| | | | | | | | |
| | | | | | | 39,466,230 | |
| | | | | | | | |
|
| | Philippines – 0.95% | |
| | 4,169,250 | | | First Philippine Holdings Corp. | | | 6,292,384 | |
| | | | | | | | |
|
| | Russia – 0.62% | |
| | 28,255,116 | | | Sistema PJSFC | | | 4,108,972 | |
| | | | | | | | |
|
| | Slovenia – 1.80% | |
| | 874,008 | | | Nova Ljubljanska Banka – GDR(a)(b) | | | 11,961,162 | |
| | | | | | | | |
|
| | South Korea – 8.60% | |
| | 106,914 | | | Binggrae Co. Ltd. | | | 6,320,086 | |
| | 861,828 | | | Korean Reinsurance Co. | | | 6,956,173 | |
| | 6,185 | | | Lotte Chilsung Beverage Co. Ltd. | | | 9,649,930 | |
| | 55,094 | | | Lotte Confectionery Co. Ltd. | | | 8,993,380 | |
| | | | | | | | |
Shares | | | | | Value | |
| | 317,794 | | | Lotte Corp.(a) | | $ | 13,851,563 | |
| | 6,540 | | | Namyang Dairy Products Co. Ltd. | | | 3,531,865 | |
| | 93,504 | | | Samchully Co. Ltd. | | | 7,769,933 | |
| | | | | | | | |
| | | | | | | 57,072,930 | |
| | | | | | | | |
|
| | Spain – 2.57% | |
| | 2,015,223 | | | Atresmedia Corp de Medios de Comunicacion SA | | | 9,456,447 | |
| | 908,948 | | | Lar Espana Real Estate Socimi SA | | | 7,588,631 | |
| | | | | | | | |
| | | | | | | 17,045,078 | |
| | | | | | | | |
|
| | United Kingdom – 20.11% | |
| | 1,987,175 | | | Balfour Beatty Plc | | | 6,790,399 | |
| | 3,453,644 | | | Chemring Group Plc | | | 6,243,530 | |
| | 77,195,504 | | | Countrywide Plc(a) | | | 7,619,107 | |
| 2,463,123
|
| | De La Rue Plc | | | 12,367,266 | |
| 26,819,043
|
| | Debenhams Plc | | | 942,428 | |
| | 3,390,490 | | | G4S Plc | | | 8,113,343 | |
| 11,987,787
|
| | ITE Group Plc | | | 10,929,499 | |
| 6,837,380
|
| | J Sainsbury Plc | | | 20,981,694 | |
| 2,886,404
|
| | LSL Property Services Plc | | | 10,150,422 | |
| 7,879,051
|
| | Mitie Group Plc | | | 15,270,036 | |
| 12,100,824
|
| | Premier Foods Plc(a) | | | 5,736,930 | |
| 3,648,998
|
| | Telit Communications Plc(a) | | | 7,642,279 | |
| 6,944,100
|
| | Wm Morrison Supermarkets Plc | | | 20,600,266 | |
| | | | | | | | |
| | | | | | | 133,387,199 | |
| | | | | | | | |
| TOTAL COMMON STOCKS
(Cost $695,714,940)
| | $ | 606,613,295 | |
| | | | | | | | |
| | PREFERRED STOCKS – 1.61% | |
|
| | Germany – 1.61% | |
| 225,010
|
| | Draegerwerk AG & Co. KGaA | | $ | 10,666,685 | |
| | | | | | | | |
| TOTAL PREFERRED
STOCKS
(Cost $14,940,922) | | $ | 10,666,685 | |
| | | | | |
The accompanying notes to financial statements are an integral part of these Schedule of Investments.
58
Brandes International Small Cap Equity Fund
SCHEDULE OF INVESTMENTS — March 31, 2019 (Unaudited) (continued)
| | | | | | | | |
| | | Principal
Amount | | | Value | |
| | |
| REPURCHASE AGREEMENTS – 5.96% | | | | | | | | |
State Street Bank and Trust Repurchase Agreement,
(Dated 03/29/19), due 04/01/19, 1.20% [Collateralized
by $39,890,000 US Treasury Notes, 2.500%, 02/15/22,
(Market Value $40,350,051)] (proceeds $39,559,337) | | $ | 39,555,382 | | | $ | 39,555,382 | |
| | | | | | | | |
TOTAL REPURCHASE AGREEMENTS
(Cost $39,555,382) | | | | | | $ | 39,555,382 | |
| | | | | | | | |
Total Investments (Cost $750,211,244) – 99.01% | | | | | | $ | 656,835,362 | |
Other Assets in Excess of Liabilities – 0.99% | | | | | | | 6,563,515 | |
| | | | | | | | |
TOTAL NET ASSETS – 100.00% | | | | | | $ | 663,398,877 | |
| | | | | | | | |
Percentages are stated as a percent of net assets.
ADR American Depositary Receipt
GDR Global Depositary Receipt
| (a) | Non-income producing security. |
| (b) | Acquired in a transaction exempt from registration under Rule 144A or Section 4(a)(2) of the Securities Act of 1933. May be resold in the U.S. in transactions exempt from registration, normally to qualified institutional buyers. The total value of all such securities was $20,799,043, which represented 3.14% of the net assets of the Fund. |
| (c) | Affiliated issuer. See Note 8 in the Notes to Financial Statements. |
| (d) | All or a portion of this security is on loan. See Note 2 in the Notes to Financial Statements. |
The accompanying notes to financial statements are an integral part of these Schedule of Investments.
59
Brandes International Small Cap Equity Fund
SCHEDULE OF INVESTMENTS BY INDUSTRY — March 31, 2019 (Unaudited)
| | | | |
COMMON STOCKS | | | | |
Aerospace & Defense | | | 4.95 | % |
Auto Components | | | 1.60 | % |
Banks | | | 6.41 | % |
Beverages | | | 5.62 | % |
Commercial Services & Supplies | | | 6.03 | % |
Communications Equipment | | | 3.80 | % |
Construction & Engineering | | | 1.02 | % |
Construction Materials | | | 0.59 | % |
Distributors | | | 1.02 | % |
Diversified Financial Services | | | 1.51 | % |
Diversified Telecommunication Services | | | 2.84 | % |
Electric Utilities | | | 0.95 | % |
Electrical Equipment | | | 0.32 | % |
Electronic Equipment, Instruments & Components | | | 2.38 | % |
Entertainment | | | 0.61 | % |
Equity Real Estate Investment Trusts | | | 5.47 | % |
Food & Staples Retailing | | | 8.83 | % |
Food Products | | | 8.34 | % |
Gas Utilities | | | 1.17 | % |
Health Care Equipment & Supplies | | | 0.81 | % |
Health Care Providers & Services | | | 1.38 | % |
Household Durables | | | 4.18 | % |
Industrial Conglomerates | | | 2.09 | % |
Insurance | | | 1.05 | % |
Machinery | | | 2.44 | % |
Media | | | 3.07 | % |
Multiline Retail | | | 0.14 | % |
Personal Products | | | 0.50 | % |
Pharmaceuticals | | | 3.00 | % |
Real Estate Management & Development | | | 2.68 | % |
Semiconductors & Semiconductor Equipment | | | 0.91 | % |
Specialty Retail | | | 1.04 | % |
Textiles, Apparel & Luxury Goods | | | 2.38 | % |
Trading Companies & Distributors | | | 0.58 | % |
Wireless Telecommunication Services | | | 1.73 | % |
| | | | |
TOTAL COMMON STOCKS | | | 91.44 | % |
| | | | |
| |
PREFERRED STOCKS | | | | |
Health Care Equipment & Supplies | | | 1.61 | % |
| | | | |
TOTAL PREFERRED STOCKS | | | 1.61 | % |
| | | | |
| |
REPURCHASE AGREEMENTS | | | 5.96 | % |
| | | | |
| |
TOTAL INVESTMENTS | | | 99.01 | % |
Other Assets in Excess of Liabilities | | | 0.99 | % |
| | | | |
| |
TOTAL NET ASSETS | | | 100.00 | % |
| | | | |
The accompanying notes to financial statements are an integral part of these Schedule of Investments.
60
Brandes International Small Cap Equity Fund
SCHEDULE OF INVESTMENTS BY INDUSTRY — March 31, 2019 (Unaudited) (continued)
The industry classifications represented in the Schedule of Investments are in accordance with Global Industry Classification Standards (GICS®), which was developed by and/or is the exclusive property of MSCI, Inc. and Standard & Poor Financial Services LLC. This information is unaudited.
The accompanying notes to financial statements are an integral part of these Schedule of Investments.
61
Brandes Small Cap Value Fund
SCHEDULE OF INVESTMENTS — March 31, 2019 (Unaudited)
| | | | | | | | |
| Shares | | | | | Value | |
| | COMMON STOCKS – 77.93% | |
|
| | Aerospace & Defense – 1.46% | |
| | 6,970 | | | Embraer SA Sponsored – ADR | | $ | 132,500 | |
| | | | | | | | |
|
| | Auto Components – 0.94% | |
| | 2,848 | | | Cooper Tire & Rubber Co. | | | 85,127 | |
| | | | | | | | |
|
| | Banks – 1.45% | |
| | 1,054 | | | National Bankshares, Inc. | | | 45,164 | |
| | 2,487 | | | Northrim BanCorp, Inc. | | | 85,602 | |
| | | | | | | | |
| | | | | | | 130,766 | |
| | | | | | | | |
|
| | Biotechnology – 7.43% | |
| | 5,604 | | | Eagle Pharmaceuticals, Inc.(a) | | | 282,946 | |
| | 104,650 | | | PDL BioPharma, Inc.(a) | | | 389,298 | |
| | | | | | | | |
| | | | | | | 672,244 | |
| | | | | | | | |
|
| | Capital Markets – 2.02% | |
| | 6,225 | | | Federated Investors, Inc. | | | 182,455 | |
| | | | | | | | |
|
| | Communications Equipment – 6.40% | |
| | 13,387 | | | Digi International, Inc.(a) | | | 169,613 | |
| | 7,943 | | | NETGEAR, Inc.(a) | | | 263,072 | |
| | 11,793 | | | Sierra Wireless, Inc.(a) | | | 145,880 | |
| | | | | | | | |
| | | | | | | 578,565 | |
| | | | | | | | |
|
| | Construction & Engineering – 1.09% | |
| | 33,864 | | | Orion Group Holdings, Inc.(a) | | | 98,883 | |
| | | | | | | | |
|
| Electronic Equipment, Instruments &
Components – 3.18% |
|
| | 7,111 | | | Arlo Technologies, Inc.(a) | | | 29,368 | |
| | 5,948 | | | Avnet, Inc. | | | 257,965 | |
| | | | | | | | |
| | | | | | | 287,333 | |
| | | | | | | | |
|
| | Equity Real Estate Investment Trusts – 0.75% | |
| | 2,684 | | | Alexander & Baldwin, Inc. | | | 68,281 | |
| | | | | | | | |
|
| | Food Products – 3.77% | |
| | 1,476 | | | Cal-Maine Foods, Inc. | | | 65,874 | |
| | 11,184 | | | Seneca Foods Corp. – Class A(a) | | | 275,126 | |
| | | | | | | | |
| | | | | | | 341,000 | |
| | | | | | | | |
|
| | Health Care Equipment & Supplies – 0.73% | |
| | 7,937 | | | Invacare Corp. | | | 66,433 | |
| | | | | | | | |
| | | | | | | | |
| Shares | | | | | Value | |
|
| | Health Care Providers & Services – 3.17% | |
| | 4,154 | | | Patterson Companies, Inc. | | $ | 90,765 | |
| | 8,594 | | | Triple-S Management Corp. – Class B(a) | | | 196,115 | |
| | | | | | | | |
| | | | | | | 286,880 | |
| | | | | | | | |
|
| | Hotels, Restaurants & Leisure – 2.31% | |
| | 2,817 | | | International Speedway Corp. – Class A | | | 122,906 | |
| | 5,931 | | | Speedway Motorsports, Inc. | | | 85,821 | |
| | | | | | | | |
| | | | | | | 208,727 | |
| | | | | | | | |
|
| | Household Durables – 9.54% | |
| | 3,867 | | | Beazer Homes USA, Inc.(a) | | | 44,509 | |
| | 14,846 | | | CSS Industries, Inc. | | | 88,927 | |
| | 12,921 | | | Dorel Industries, Inc. – Class B | | | 114,100 | |
| | 3,862 | | | M.D.C. Holdings, Inc. | | | 112,230 | |
| | 21,716 | | | Taylor Morrison Home Corp. – Class A(a) | | | 385,459 | |
| | 3,245 | | | Toll Brothers, Inc. | | | 117,469 | |
| | | | | | | | |
| | | | | | | 862,694 | |
| | | | | | | | |
|
| | Insurance – 3.65% | |
| | 918 | | | National Western Life Group, Inc. | | | 240,947 | |
| | 4,255 | | | Old Republic International Corp. | | | 89,015 | |
| | | | | | | | |
| | | | | | | 329,962 | |
| | | | | | | | |
|
| | Machinery – 4.52% | |
| | 34,572 | | | Briggs & Stratton Corp. | | | 408,987 | |
| | | | | | | | |
|
| | Multi-Utilities – 0.74% | |
| | 1,658 | | | Avista Corp. | | | 67,348 | |
| | | | | | | | |
|
| | Oil, Gas & Consumable Fuels – 5.02% | |
| | 26,866 | | | Chesapeake Energy Corp.(a) | | | 83,285 | |
| | 12,834 | | | World Fuel Services Corp. | | | 370,774 | |
| | | | | | | | |
| | | | | | | 454,059 | |
| | | | | | | | |
|
| | Personal Products – 4.64% | |
| | 9,553 | | | Edgewell Personal
Care Co.(a) | | | 419,281 | |
| | | | | | | | |
|
| | Pharmaceuticals – 0.57% | |
| | 35,764 | | | Avadel Pharmaceuticals Plc Sponsored – ADR(a) | | | 51,500 | |
| | | | | | | | |
The accompanying notes to financial statements are an integral part of these Schedule of Investments.
62
Brandes Small Cap Value Fund
SCHEDULE OF INVESTMENTS — March 31, 2019 (Unaudited) (continued)
| | | | | | | | |
| Shares | | | | | Value | |
|
| | Professional Services – 3.76% | |
| | 4,389 | | | Kelly Services, Inc. | | $ | 96,821 | |
| | 14,711 | | | Resources Connection, Inc. | | | 243,320 | |
| | | | | | | | |
| | | | | | | 340,141 | |
| | | | | | | | |
|
| Real Estate Management &
Development – 3.59% |
|
| | 19,680 | | | St. Joe Co.(a) | | | 324,523 | |
| | | | | | | | |
|
| | Software – 2.59% | |
| | 1,627 | | | MicroStrategy,
Inc. – Class A(a) | | | 234,695 | |
| | | | | | | | |
|
| | Specialty Retail – 2.17% | |
| | 9,383 | | | Rent-A-Center, Inc.(a) | | | 195,823 | |
| | | | | | | | |
| | | | | | | | |
| Shares | | | | | Value | |
|
| | Thrifts & Mortgage Finance – 0.90% | |
| | 3,021 | | | Territorial Bancorp, Inc. | | $ | 81,295 | |
| | | | | | | | |
|
| | Trading Companies & Distributors – 1.54% | |
| | 22,033 | | | Houston Wire & Cable Co.(a) | | | 139,469 | |
| | | | | | | | |
| TOTAL COMMON STOCKS
(Cost $7,980,614) | | $ | 7,048,971 | |
| | | | | | | | |
| | PREFERRED STOCKS – 1.55% | |
|
| | Oil, Gas & Consumable Fuels – 1.55% | |
| | 250 | | | Chesapeake Energy Corp., 5.750% | | $ | 140,000 | |
| | | | | | | | |
| TOTAL PREFERRED STOCKS
(Cost $145,900) | | $ | 140,000 | |
| | | | | | | | |
| | | | | | | | |
| | | Principal
Amount | | | Value | |
| CORPORATE BONDS – 5.17% | | | | | | | | |
| | |
| Containers & Packaging – 1.68% | | | | | | | | |
Bemis Co., Inc.
6.800%, 8/1/2019 | | $ | 150,000 | | | $ | 151,792 | |
| | | | | | | | |
| | |
| Electric Utilities – 2.27% | | | | | | | | |
Portland General Electric Co.
6.100%, 4/15/2019 | | | 205,000 | | | | 205,215 | |
| | | | | | | | |
| | |
| Household Durables – 0.91% | | | | | | | | |
Taylor Morrison Communities, Inc. / Taylor Morrison Holdings II, Inc. 5.250%, 4/15/2021 (b) | | | 82,000 | | | | 81,922 | |
| | | | | | | | |
| | |
| Water Utilities – 0.31% | | | | | | | | |
California Water Service Co.
5.875%, 5/1/2019 | | | 28,000 | | | | 28,067 | |
| | | | | | | | |
TOTAL CORPORATE BONDS(Cost $467,191) | | | | | | $ | 466,996 | |
| | | | | | | | |
| | |
| REPURCHASE AGREEMENTS – 14.86% | | | | | | | | |
State Street Bank and Trust Repurchase Agreement, (Dated 03/29/19), due 04/01/19, 1.20% [Collateralized by $1,245,000 US Treasury Notes TIPS, 0.125%, 01/15/22, (Market Value $1,372,512)] (proceeds $1,344,572) | | $ | 1,344,438 | | | $ | 1,344,438 | |
| | | | | | | | |
TOTAL REPURCHASE AGREEMENTS(Cost $1,344,438) | | | | | | $ | 1,344,438 | |
| | | | | | | | |
Total Investments (Cost $9,938,143) – 99.51% | | | | | | $ | 9,000,405 | |
Other Assets in Excess of Liabilities – 0.49% | | | | | | | 44,073 | |
| | | | | | | | |
TOTAL NET ASSETS – 100.00% | | | | | | $ | 9,044,478 | |
| | | | | | | | |
Percentages are stated as a percent of net assets.
The accompanying notes to financial statements are an integral part of these Schedule of Investments.
63
Brandes Small Cap Value Fund
SCHEDULE OF INVESTMENTS — March 31, 2019 (Unaudited) (continued)
ADR American Depositary Receipt
TIPS Treasury Inflation-Protected Security
| (a) | Non-income producing security. |
| (b) | Acquired in a transaction exempt from registration under Rule 144A or Section 4(a)(2) of the Securities Act of 1933. May be resold in the U.S. in transactions exempt from registration, normally to qualified institutional buyers. The total value of all such securities was $81,922, which represented 0.91% of the net assets of the Fund. |
The accompanying notes to financial statements are an integral part of these Schedule of Investments.
64
Brandes Small Cap Value Fund
SCHEDULE OF INVESTMENTS BY COUNTRY — March 31, 2019 (Unaudited)
| | | | |
COMMON STOCKS | | | | |
Brazil | | | 1.46 | % |
Canada | | | 2.87 | % |
Ireland | | | 0.57 | % |
United States | | | 73.03 | % |
| | | | |
TOTAL COMMON STOCKS | | | 77.93 | % |
| | | | |
| |
PREFERRED STOCKS | | | | |
United States | | | 1.55 | % |
| | | | |
TOTAL PREFERRED STOCKS | | | 1.55 | % |
| | | | |
| |
CORPORATE BONDS | | | | |
United States | | | 5.17 | % |
| | | | |
TOTAL CORPORATE BONDS | | | 5.17 | % |
| | | | |
| |
REPURCHASE AGREEMENTS | | | 14.86 | % |
| | | | |
| |
TOTAL INVESTMENTS | | | 99.51 | % |
Other Assets in Excess of Liabilities | | | 0.49 | % |
| | | | |
| |
TOTAL NET ASSETS | | | 100.00 | % |
| | | | |
The industry classifications represented in the Schedule of Investments are in accordance with Global Industry Classification Standards (GICS®), which was developed by and/or is the exclusive property of MSCI, Inc. and Standard & Poor Financial Services LLC. This information is unaudited.
The accompanying notes to financial statements are an integral part of these Schedule of Investments.
65
Brandes Core Plus Fixed Income Fund
SCHEDULE OF INVESTMENTS — March 31, 2019 (Unaudited)
| | | | | | | | |
| | | | Shares | | | | Value | |
| COMMON STOCKS – 0.00% | | | | | | | | |
| | |
| Household Durables – 0.00% | | | | | | | | |
Urbi Desarrollos Urbanos SA de CV(a) | | | 31,277 | | | $ | 2,191 | |
| | | | | | | | |
TOTAL COMMON STOCKS
(Cost $292,050) | | | | | | $ | 2,191 | |
| | | | | | | | |
| | |
| | | Principal
Amount | | | Value | |
| FEDERAL AND FEDERALLY SPONSORED CREDITS – 8.32% | | | | | | | | |
| | |
| Federal Home Loan Mortgage Corporation – 2.07% | | | | | | | | |
PoolG1-8578, 3.000%, 12/1/2030 | | $ | 1,524,647 | | | $ | 1,539,674 | |
PoolG0-6018, 6.500%, 4/1/2039 | | | 24,833 | | | | 28,300 | |
PoolA9-3505, 4.500%, 8/1/2040 | | | 117,010 | | | | 123,909 | |
| | | | | | | | |
| | | | | | | 1,691,883 | |
| | | | | | | | |
| | |
| Federal National Mortgage Association – 6.25% | | | | | | | | |
Pool CA1624, 3.000%, 4/1/2033 | | | 1,136,524 | | | | 1,148,237 | |
Pool 934124, 5.500%, 7/1/2038 | | | 45,170 | | | | 48,578 | |
Pool MA0918, 4.000%, 12/1/2041 | | | 268,135 | | | | 278,119 | |
Pool AS6201, 3.500%, 11/1/2045 | | | 1,030,173 | | | | 1,047,954 | |
Pool AL9865, 3.000%, 2/1/2047 | | | 1,865,151 | | | | 1,859,468 | |
Pool BJ2553, 3.500%, 12/1/2047 | | | 705,535 | | | | 716,521 | |
| | | | | | | | |
| | | | | | | 5,098,877 | |
| | | | | | | | |
TOTAL FEDERAL AND FEDERALLY SPONSORED CREDITS
(Cost $6,701,848) | | | | | | $ | 6,790,760 | |
| | | | | | | | |
| | |
| OTHER MORTGAGE RELATED SECURITIES – 0.02% | | | | | | | | |
| | |
| Collateralized Mortgage Obligations – 0.00% | | | | | | | | |
Wells Fargo Mortgage Backed Securities Trust
Series 2006-AR14, 4.669%, 10/25/2036(c) | | $ | 1,253 | | | $ | 1,215 | |
| | | | | | | | |
| | |
| Near Prime Mortgage – 0.02% | | | | | | | | |
Bear StearnsALT-A Trust
Series2004-11, 3.166% (1M LIBOR + 0.680%), 11/25/2034(d) | | | 14,501 | | | | 14,481 | |
| | | | | | | | |
TOTAL OTHER MORTGAGE RELATED SECURITIES
(Cost $15,159) | | | | | | $ | 15,696 | |
| | | | | | | | |
| | |
| US GOVERNMENTS – 48.22% | | | | | | | | |
| | |
| Sovereign – 48.22% | | | | | | | | |
United States Treasury Bond
4.750%, 2/15/2037 | | $ | 4,835,000 | | | $ | 6,344,615 | |
United States Treasury Note
2.000%, 11/15/2021 | | | 3,211,000 | | | | 3,191,182 | |
2.000%, 2/15/2023 | | | 4,140,000 | | | | 4,103,613 | |
2.375%, 8/15/2024 | | | 9,655,000 | | | | 9,703,652 | |
2.250%, 2/15/2027 | | | 16,100,000 | | | | 15,976,106 | |
| | | | | | | | |
TOTAL US GOVERNMENTS
(Cost $38,902,311) | | | | | | $ | 39,319,168 | |
| | | | | | | | |
The accompanying notes to financial statements are an integral part of these Schedule of Investments.
66
Brandes Core Plus Fixed Income Fund
SCHEDULE OF INVESTMENTS — March 31, 2019 (Unaudited) (continued)
| | | | | | | | |
| | |
| | | Principal
Amount | | | Value | |
| ASSET BACKED SECURITIES – 2.27% | | | | | | | | |
| | |
| Equipment – 0.04% | | | | | | | | |
Continental Airlines2007-1 Class A Pass Through Trust
Series2007-1, 5.983%, 4/19/2022 | | $ | 27,355 | | | $ | 28,775 | |
| | | | | | | | |
| | |
| Student Loan – 2.23% | | | | | | | | |
SLM Private Credit Student Loan Trust2004-B
Series2004-B, 3.041% (3M LIBOR + 0.430%), 9/15/2033(d) | | | 300,000 | | | | 287,797 | |
SLM Private Credit Student Loan Trust2005-A
Series2005-A, 2.921% (3M LIBOR + 0.310%), 12/15/2038(d) | | | 400,000 | | | | 386,997 | |
SLM Private Credit Student Loan Trust2006-A
Series2006-A, 2.901% (3M LIBOR + 0.290%), 6/15/2039(d) | | | 829,350 | | | | 806,035 | |
SLM Private Credit Student Loan Trust2007-A
Series2007-A, 2.851% (3M LIBOR + 0.240%), 12/16/2041(d) | | | 344,180 | | | | 335,966 | |
| | | | | | | | |
| | | | | | | 1,816,795 | |
| | | | | | | | |
TOTAL ASSET BACKED SECURITIES
(Cost $1,727,899) | | | | | | $ | 1,845,570 | |
| | | | | | | | |
| | |
| CORPORATE BONDS – 38.27% | | | | | | | | |
| | |
| Automobiles – 2.21% | | | | | | | | |
Ford Motor Credit Co. LLC
8.125%, 1/15/2020 | | $ | 780,000 | | | $ | 808,411 | |
General Motors Financial Co., Inc.
2.650%, 4/13/2020 | | | 1,000,000 | | | | 995,989 | |
| | | | | | | | |
| | | | | | | 1,804,400 | |
| | | | | | | | |
| | |
| Banks – 7.42% | | | | | | | | |
Citibank, N.A.
2.100%, 6/12/2020 | | | 1,650,000 | | | | 1,638,144 | |
Fifth Third Bancorp
8.250%, 3/1/2038 | | | 175,000 | | | | 243,754 | |
Goldman Sachs Group, Inc.
3.000%, 4/26/2022 | | | 780,000 | | | | 778,308 | |
JPMorgan Chase & Co.
6.221%, (3M LIBOR + 3.470%), Perpetual(d) | | | 1,639,000 | | | | 1,647,195 | |
USB Capital IX
3.807% (3M LIBOR + 1.020%, minimum of 3.500%), Perpetual(d) | | | 750,000 | | | | 588,750 | |
Wells Fargo & Co.
6.381% (3M LIBOR + 3.770%), Perpetual(d) | | | 1,150,000 | | | | 1,157,187 | |
| | | | | | | | |
| | | | | | | 6,053,338 | |
| | | | | | | | |
| | |
| Commercial Services & Supplies – 2.64% | | | | | | | | |
ADT Corp.
3.500%, 7/15/2022 | | | 1,830,000 | | | | 1,763,662 | |
Iron Mountain, Inc.
4.875%, 9/15/2027(b) | | | 410,000 | | | | 393,600 | |
| | | | | | | | |
| | | | | | | 2,157,262 | |
| | | | | | | | |
The accompanying notes to financial statements are an integral part of these Schedule of Investments.
67
Brandes Core Plus Fixed Income Fund
SCHEDULE OF INVESTMENTS — March 31, 2019 (Unaudited) (continued)
| | | | | | | | |
| | |
| | | Principal
Amount | | | Value | |
| | |
| Consumer Products – 1.79% | | | | | | | | |
Avon International Operations, Inc.
7.875%, 8/15/2022(b) | | $ | 925,000 | | | $ | 958,531 | |
Wyndham Destinations, Inc.
3.900%, 3/1/2023 | | | 510,000 | | | | 499,800 | |
| | | | | | | | |
| | | | | | | 1,458,331 | |
| | | | | | | | |
| | |
| Electric Utilities – 0.26% | | | | | | | | |
Commonwealth Edison Co.
5.900%, 3/15/2036 | | | 175,000 | | | | 214,166 | |
| | | | | | | | |
| | |
| Food, Beverage & Tobacco – 1.86% | | | | | | | | |
Mead Johnson Nutrition Co.
4.900%, 11/1/2019 | | | 775,000 | | | | 784,124 | |
Pilgrim’s Pride Corp.
5.750%, 3/15/2025(b) | | | 725,000 | | | | 732,250 | |
| | | | | | | | |
| | | | | | | 1,516,374 | |
| | | | | | | | |
| | |
| Health Care Providers & Services – 1.76% | | | | | | | | |
Tenet Healthcare Corp.
6.000%, 10/1/2020 | | | 1,385,000 | | | | 1,435,206 | |
| | | | | | | | |
| | |
| Homebuilders – 2.16% | | | | | | | | |
PulteGroup, Inc.
5.500%, 3/1/2026 | | | 980,000 | | | | 1,009,400 | |
Toll Brothers Finance Corp.
4.875%, 11/15/2025 | | | 745,000 | | | | 749,656 | |
| | | | | | | | |
| | | | | | | 1,759,056 | |
| | | | | | | | |
| | |
| Insurance – 1.21% | | | | | | | | |
American International Group, Inc.
6.400%, 12/15/2020 | | | 800,000 | | | | 845,996 | |
CNA Financial Corp.
5.875%, 8/15/2020 | | | 135,000 | | | | 140,383 | |
| | | | | | | | |
| | | | | | | 986,379 | |
| | | | | | | | |
| | |
| Media – 0.53% | | | | | | | | |
Netflix, Inc.
5.375%, 2/1/2021 | | | 420,000 | | | | 436,144 | |
| | | | | | | | |
| | |
| Metals & Mining – 0.11% | | | | | | | | |
Cloud Peak Energy Resources, LLC / Cloud Peak Energy Finance Corp.
12.000%, 11/1/2021(e) | | | 480,000 | | | | 86,400 | |
| | | | | | | | |
The accompanying notes to financial statements are an integral part of these Schedule of Investments.
68
Brandes Core Plus Fixed Income Fund
SCHEDULE OF INVESTMENTS — March 31, 2019 (Unaudited) (continued)
| | | | | | | | |
| | |
| | | Principal
Amount | | | Value | |
| | |
| Oil, Gas & Consumable Fuels – 9.20% | | | | | | | | |
BP Capital Markets Plc
3.506%, 3/17/2025 | | $ | 810,000 | | | $ | 825,750 | |
Chesapeake Energy Corp.
8.000%, 1/15/2025 | | | 1,245,000 | | | | 1,269,900 | |
Chevron Corp.
2.100%, 5/16/2021 | | | 1,150,000 | | | | 1,141,750 | |
Exxon Mobil Corp.
2.397%, 3/6/2022 | | | 945,000 | | | | 944,978 | |
Kinder Morgan, Inc.
4.300%, 6/1/2025 | | | 1,054,000 | | | | 1,099,308 | |
Occidental Petroleum Corp.
3.500%, 6/15/2025 | | | 555,000 | | | | 570,210 | |
Range Resources Corp.
5.000%, 3/15/2023 | | | 1,680,000 | | | | 1,646,400 | |
| | | | | | | | |
| | | | | | | 7,498,296 | |
| | | | | | | | |
| | |
| Retail – 1.28% | | | | | | | | |
JC Penney Corp, Inc.
5.875%, 7/1/2023(b) | | | 1,240,000 | | | | 1,044,700 | |
| | | | | | | | |
| | |
| Technology – 2.40% | | | | | | | | |
Microsoft Corp.
2.400%, 2/6/2022 | | | 1,000,000 | | | | 998,569 | |
VMware, Inc.
3.900%, 8/21/2027 | | | 995,000 | | | | 956,523 | |
| | | | | | | | |
| | | | | | | 1,955,092 | |
| | | | | | | | |
| | |
| Telecommunications – 3.44% | | | | | | | | |
AT&T, Inc.
3.000%, 6/30/2022 | | | 1,630,000 | | | | 1,637,186 | |
Frontier Communications Corp.
6.250%, 9/15/2021 | | | 1,320,000 | | | | 1,023,000 | |
Telefonica Emisiones SA
5.462%, 2/16/2021 | | | 135,000 | | | | 141,075 | |
| | | | | | | | |
| | | | | | | 2,801,261 | |
| | | | | | | | |
TOTAL CORPORATE BONDS
(Cost $31,299,075) | | | | | | $ | 31,206,405 | |
| | | | | | | | |
The accompanying notes to financial statements are an integral part of these Schedule of Investments.
69
Brandes Core Plus Fixed Income Fund
SCHEDULE OF INVESTMENTS — March 31, 2019 (Unaudited) (continued)
| | | | | | | | |
| | |
| | | Principal
Amount | | | Value | |
| REPURCHASE AGREEMENTS – 3.11% | | | | | | | | |
State Street Bank and Trust Repurchase Agreement,
(Dated 03/29/19), due 04/01/19, 1.20% [Collateralized
by $2,560,000 US Treasury Notes, 2.500%, 02/15/22,
(Market Value $2,589,524)] (proceeds $2,538,444) | | $ | 2,538,190 | | | $ | 2,538,190 | |
| | | | | | | | |
TOTAL REPURCHASE AGREEMENTS
(Cost $2,538,190) | | | | | | $ | 2,538,190 | |
| | | | | | | | |
Total Investments (Cost $81,476,532) – 100.21% | | | | | | $ | 81,717,980 | |
Liabilities in Excess of Other Assets – (0.21)% | | | | | | | (177,222 | ) |
| | | | | | | | |
TOTAL NET ASSETS – 100.00% | | | | | | $ | 81,540,758 | |
| | | | | | | | |
Percentages are stated as a percent of net assets.
LIBOR London Inter-bank Offered Rate
| (a) | Non-income producing security. |
| (b) | Acquired in a transaction exempt from registration under Rule 144A or Section 4(a)(2) of the Securities Act of 1933. May be resold in the U.S. in transactions exempt from registration, normally to qualified institutional buyers. The total value of all such securities was $3,129,081, which represented 3.84% of the net assets of the Fund. |
| (c) | Variable rate security. The coupon is based on an underlying pool of loans. |
| (d) | Variable rate security. The coupon is based on a reference index and spread index. |
| (e) | Issuer is in default of interest payments. |
The industry classifications represented in the Schedule of Investments are comprised in accordance with Global Industry Classification Standards (GICS®), which was developed by and/or is the exclusive property of MSCI, Inc. and Standard & Poor Financial Services LLC or were otherwise determined by the Adviser to be appropriate. This information is unaudited.
The accompanying notes to financial statements are an integral part of these Schedule of Investments.
70
(This Page Intentionally Left Blank.)
71
Brandes Investment Trust
STATEMENTS OF ASSETS AND LIABILITIES — March 31, 2019 (Unaudited)
| | | | | | | | |
| | | Brandes
International
Equity Fund | | | Brandes
Global
Equity Fund | |
ASSETS | | | | | | | | |
Investment in securities, at value(1) | | | | | | | | |
Unaffiliated issuers | | $ | 790,405,633 | | | $ | 45,940,554 | |
Affiliated issuers | | | — | | | | — | |
Cash | | | — | | | | — | |
Foreign Currency(1) | | | 407,887 | | | | 51,924 | |
Receivables: | | | | | | | | |
Securities sold | | | 3,945,991 | | | | 967,870 | |
Fund shares sold | | | 6,417,406 | | | | 23,777 | |
Dividends and interest | | | 4,525,662 | | | | 215,326 | |
Foreign currency spot trade | | | — | | | | — | |
Tax reclaims | | | 534,604 | | | | 32,850 | |
Securities lending | | | 796 | | | | 505 | |
Due from Advisor | | | — | | | | — | |
Prepaid expenses and other assets | | | 123,918 | | | | 24,136 | |
| | | | | | | | |
Total Assets | | | 806,361,897 | | | | 47,256,942 | |
| | | | | | | | |
LIABILITIES | | | | | | | | |
Payables: | | | | | | | | |
Securities purchased | | | 1,597,006 | | | | — | |
Fund shares redeemed | | | 2,421,007 | | | | 126,613 | |
Due to Advisor | | | 529,551 | | | | 17,999 | |
12b-1 Fee | | | 18,760 | | | | 1,259 | |
Trustee Fees | | | 10,500 | | | | 1,406 | |
Due to Custodian | | | 13,770 | | | | 1,456 | |
Dividends payable | | | 292,374 | | | | 2,768 | |
Foreign tax withholding | | | 455,542 | | | | 19,566 | |
Foreign currency spot trade payable | | | — | | | | 557 | |
Accrued expenses | | | 279,624 | | | | 99,117 | |
| | | | | | | | |
Total Liabilities | | | 5,618,134 | | | | 270,741 | |
| | | | | | | | |
NET ASSETS | | $ | 800,743,763 | | | $ | 46,986,201 | |
| | | | | | | | |
COMPONENTS OF NET ASSETS | | | | | | | | |
Capital Stock | | $ | 906,482,377 | | | $ | 44,019,222 | |
Total distributable earnings | | | (105,738,614 | ) | | | 2,966,979 | |
| | | | | | | | |
Total Net Assets | | $ | 800,743,763 | | | $ | 46,986,201 | |
| | | | | | | | |
Net asset value, offering price and redemption proceeds per share | | | | | | | | |
Class A Shares | | | | | | | | |
Net Assets | | $ | 36,167,675 | | | $ | 1,673,511 | |
Shares outstanding (unlimited shares authorized without par value) | | | 2,181,799 | | | | 75,998 | |
Offering and redemption price | | $ | 16.58 | | | $ | 22.02 | |
| | | | | | | | |
Maximum offering price per share* | | $ | 17.59 | | | $ | 23.36 | |
| | | | | | | | |
Class C Shares | | | | | | | | |
Net Assets | | $ | 17,053,748 | | | $ | 1,382,809 | |
Shares outstanding (unlimited shares authorized without par value) | | | 1,045,510 | | | | 63,230 | |
Offering and redemption price | | $ | 16.31 | | | $ | 21.87 | |
| | | | | | | | |
Class I Shares | | | | | | | | |
Net Assets | | $ | 713,630,937 | | | $ | 43,929,881 | |
Shares outstanding (unlimited shares authorized without par value) | | | 42,910,920 | | | | 1,980,701 | |
Offering and redemption price | | $ | 16.63 | | | $ | 22.18 | |
| | | | | | | | |
Class R6 Shares | | | | | | | | |
Net Assets | | $ | 33,891,403 | | | | N/A | |
Shares outstanding (unlimited shares authorized without par value) | | | 2,029,730 | | | | N/A | |
Offering and redemption price | | $ | 16.70 | | | | N/A | |
| | | | | | | | |
(1)Costof: | | | | | | | | |
Investments in securities | | | | | | | | |
Unaffiliated issuers | | $ | 901,797,146 | | | $ | 42,083,217 | |
Affiliated issuers | | | — | | | | — | |
Foreign currency | | | 408,181 | | | | 52,050 | |
| * | Includes a sales load of 5.75% for the International, Global, Global Equity Income, Global Opportunities Value, Emerging Markets Value, International Small Cap, and Small Cap Value Funds and 3.75% for the Core Plus Fixed Income Fund. (see Note 7 of the Notes to Financial Statements) |
The accompanying notes to financial statements are an integral part of these statements.
72
Brandes Investment Trust
STATEMENTS OF ASSETS AND LIABILITIES — March 31, 2019 (Unaudited) (continued)
| | | | | | | | | | | | | | | | | | | | | | |
Brandes
Global Equity
Income Fund | | | Brandes
Global
Opportunities
Value Fund | | | Brandes
Emerging
Markets
Value Fund | | | Brandes
International
Small Cap
Equity Fund | | | Brandes
Small Cap
Value Fund | | | Brandes
Core Plus Fixed
Income Fund | |
| | | | | | | | | | | | | | | | | | | | | | |
| | | | | | | | | | | | | | | | | | | | | | |
| $ | 1,295,525 | | | $ | 10,289,853 | | | $ | 1,471,871,443 | | | $ | 653,773,827 | | | $ | 9,000,405 | | | $ | 81,717,980 | |
| | — | | | | — | | | | 717,648 | | | | 3,061,535 | | | | — | | | | — | |
| | 52,413 | | | | — | | | | — | | | | — | | | | — | | | | 789,953 | |
| | 1,818 | | | | 7,602 | | | | — | | | | 63,578 | | | | — | | | | — | |
| | | | | | | | | | | | | | | | | | | | | | |
| | 1,625 | | | | — | | | | 407,691 | | | | 1,481,272 | | | | 24,918 | | | | — | |
| | — | | | | 1,160 | | | | 2,106,923 | | | | 4,783,716 | | | | — | | | | 114,869 | |
| | 8,807 | | | | 120,723 | | | | 8,137,336 | | | | 3,290,260 | | | | 17,626 | | | | 473,727 | |
| | 4 | | | | — | | | | 69,655 | | | | 7,167 | | | | — | | | | — | |
| | 470 | | | | 4,706 | | | | 337,224 | | | | 263,836 | | | | 194 | | | | — | |
| | — | | | | — | | | | — | | | | 8,434 | | | | — | | | | — | |
| | 13,176 | | | | 11,393 | | | | — | | | | — | | | | 10,824 | | | | — | |
| | 5,819 | | | | 18,684 | | | | 122,782 | | | | 65,768 | | | | 37,519 | | | | 31,773 | |
| | | | | | | | | | | | | | | | | | | | | | |
| | 1,379,657 | | | | 10,454,121 | | | | 1,483,770,702 | | | | 666,799,393 | | | | 9,091,486 | | | | 83,128,302 | |
| | | | | | | | | | | | | | | | | | | | | | |
| | | | | | | | | | | | | | | | | | | | | | |
| | | | | | | | | | | | | | | | | | | | | | |
| | — | | | | 41,668 | | | | 8,326,488 | | | | 699,566 | | | | — | | | | 1,294,597 | |
| | 138 | | | | 66,802 | | | | 1,540,457 | | | | 1,202,147 | | | | — | | | | 166,026 | |
| | — | | | | — | | | | 1,198,823 | | | | 537,115 | | | | — | | | | 7,014 | |
| | 11 | | | | 270 | | | | 70,914 | | | | 20,024 | | | | 4 | | | | 523 | |
| | 42 | | | | 702 | | | | 37,209 | | | | 39,327 | | | | — | | | | 1,941 | |
| | 367 | | | | 1,708 | | | | 207,126 | | | | 39,948 | | | | 515 | | | | 2,061 | |
| | 108 | | | | 1,936 | | | | 455,139 | | | | 59,384 | | | | — | | | | 16,458 | |
| | 953 | | | | 16,465 | | | | 1,318,821 | | | | 415,801 | | | | 291 | | | | — | |
| | — | | | | 147 | | | | — | | | | — | | | | — | | | | — | |
| | 44,361 | | | | 64,438 | | | | 488,221 | | | | 387,204 | | | | 46,198 | | | | 98,924 | |
| | | | | | | | | | | | | | | | | | | | | | |
| | 45,980 | | | | 194,136 | | | | 13,643,198 | | | | 3,400,516 | | | | 47,008 | | | | 1,587,544 | |
| | | | | | | | | | | | | | | | | | | | | | |
| $ | 1,333,677 | | | $ | 10,259,985 | | | $ | 1,470,127,504 | | | $ | 663,398,877 | | | $ | 9,044,478 | | | $ | 81,540,758 | |
| | | | | | | | | | | | | | | | | | | | | | |
| | | | | | | | | | | | | | | | | | | | | | |
| $ | 1,297,866 | | | $ | 13,961,035 | | | $ | 1,667,836,070 | | | $ | 885,279,386 | | | $ | 9,839,679 | | | $ | 82,985,604 | |
| | 35,811 | | | | (3,701,050 | ) | | | (197,708,566 | ) | | | (221,880,509 | ) | | | (795,201 | ) | | | (1,444,846 | ) |
| | | | | | | | | | | | | | | | | | | | | | |
| $ | 1,333,677 | | | $ | 10,259,985 | | | $ | 1,470,127,504 | | | $ | 663,398,877 | | | $ | 9,044,478 | | | $ | 81,540,758 | |
| | | | | | | | | | | | | | | | | | | | | | |
| | | | | | | | | | | | | | | | | | | | | | |
| | | | | | | | | | | | | | | | | | | | | | |
| $ | 30,797 | | | $ | 643,950 | | | $ | 260,093,096 | | | $ | 61,701,994 | | | $ | 16,247 | | | $ | 2,061,167 | |
| | 2,708 | | | | 68,095 | | | | 30,124,381 | | | | 5,757,549 | | | | 1,873 | | | | 228,916 | |
| $ | 11.37 | | | $ | 9.46 | | | $ | 8.63 | | | $ | 10.72 | | | $ | 8.67 | | | $ | 9.00 | |
| | | | | | | | | | | | | | | | | | | | | | |
| $ | 12.07 | | | $ | 10.03 | | | $ | 9.16 | | | $ | 11.37 | | | $ | 9.20 | | | $ | 9.36 | |
| | | | | | | | | | | | | | | | | | | | | | |
| | | | | | | | | | | | | | | | | | | | | | |
| $ | 5,005 | | | $ | 201,888 | | | $ | 20,541,812 | | | $ | 9,608,078 | | | | N/A | | | | N/A | |
| | 457 | | | | 21,428 | | | | 2,390,948 | | | | 921,234 | | | | N/A | | | | N/A | |
| $ | 10.95 | | | $ | 9.42 | | | $ | 8.59 | | | $ | 10.43 | | | | N/A | | | | N/A | |
| | | | | | | | | | | | | | | | | | | | | | |
| | | | | | | | | | | | | | | | | | | | | | |
| $ | 1,297,875 | | | $ | 9,414,147 | | | $ | 1,152,845,247 | | | $ | 530,242,705 | | | $ | 4,987,456 | | | $ | 79,479,487 | |
| | 119,838 | | | | 996,924 | | | | 132,885,686 | | | | 49,298,516 | | | | 574,772 | | | | 8,757,249 | |
| $ | 10.83 | | | $ | 9.44 | | | $ | 8.68 | | | $ | 10.76 | | | $ | 8.68 | | | $ | 9.08 | |
| | | | | | | | | | | | | | | | | | | | | | |
| | | | | | | | | | | | | | | | | | | | | | |
| | N/A | | | | N/A | | | $ | 36,647,349 | | | $ | 61,846,100 | | | | 4,040,775 | | | | 104 | |
| | N/A | | | | N/A | | | | 4,210,724 | | | | 5,738,800 | | | | 463,037 | | | | 12 | |
| | N/A | | | | N/A | | | $ | 8.70 | | | $ | 10.78 | | | $ | 8.73 | | | $ | 9.09 | |
| | | | | | | | | | | | | | | | | | | | | | |
| | | | | | | | | | | | | | | | | | | | | | |
| | | | | | | | | | | | | | | | | | | | | | |
| $ | 1,272,741 | | | $ | 10,659,247 | | | $ | 1,614,647,630 | | | $ | 719,496,424 | | | $ | 9,938,143 | | | $ | 81,476,532 | |
| | — | | | | — | | | | 12,202,165 | | | | 30,714,820 | | | | — | | | | — | |
| | 1,824 | | | | 7,620 | | | | — | | | | 63,753 | | | | — | | | | — | |
The accompanying notes to financial statements are an integral part of these statements.
73
Brandes Investment Trust
STATEMENTS OF OPERATIONS — For the Six Months Ended March 31, 2019 (Unaudited)
| | | | | | | | |
| | | Brandes
International
Equity Fund | | | Brandes
Global
Equity Fund | |
INVESTMENT INCOME | | | | | | | | |
Income | | | | | | | | |
Dividend income | | $ | 9,167,002 | | | $ | 779,775 | |
Less: Foreign taxes withheld | | | (735,165 | ) | | | (37,857 | ) |
Interest income | | | 197,368 | | | | 5,312 | |
Income from securities lending | | | 102,242 | | | | 4,685 | |
| | | | | | | | |
Total Income | | | 8,731,447 | | | | 751,915 | |
| | | | | | | | |
Expenses | | | | | | | | |
Advisory fees (Note 3) | | | 2,928,827 | | | | 223,006 | |
Custody fees | | | 40,124 | | | | 4,128 | |
Administration fees (Note 3) | | | 87,188 | | | | 13,804 | |
Insurance expense | | | 7,269 | | | | 728 | |
Legal fees | | | 15,662 | | | | 1,538 | |
Printing fees | | | 19,896 | | | | 2,822 | |
Miscellaneous | | | 12,627 | | | | 2,655 | |
Registration expense | | | 45,490 | | | | 22,984 | |
Trustee fees | | | 36,748 | | | | 4,288 | |
Transfer agent fees | | | 71,500 | | | | 24,564 | |
12b-1 Fees – Class A | | | 43,511 | | | | 3,188 | |
12b-1 Fees – Class C | | | 63,694 | | | | 5,469 | |
Shareholder Service Fees – Class C | | | 21,231 | | | | 1,823 | |
Sub-Transfer Agency Fees – Class I | | | 163,459 | | | | 12,936 | |
Accounting fees | | | 39,964 | | | | 28,940 | |
Auditing fees | | | 22,858 | | | | 19,854 | |
Organizational Costs | | | — | | | | — | |
| | | | | | | | |
Total expenses | | | 3,620,048 | | | | 372,727 | |
Expenses waived | | | (12,041 | ) | | | (83,490 | ) |
Expenses recouped | | | — | | | | — | |
| | | | | | | | |
Total net expenses | | | 3,608,007 | | | | 289,237 | |
| | | | | | | | |
Net investment income | | | 5,123,440 | | | | 462,678 | |
| | | | | | | | |
REALIZED AND UNREALIZED GAIN (LOSS) ON INVESTMENTS | | | | | | | | |
Net realized gain (loss) on: | | | | | | | | |
Unaffiliated investments | | | 12,400,366 | | | | (794,873 | ) |
Affiliated investments | | | — | | | | — | |
Foreign currency transactions | | | (35,828 | ) | | | (10,440 | ) |
| | | | | | | | |
Net realized gain (loss) | | | 12,364,538 | | | | (805,313 | ) |
| | | | | | | | |
Net change in unrealized appreciation (depreciation) on: | | | | | | | | |
Investments | | | (57,840,582 | ) | | | (3,501,839 | ) |
Foreign currency transactions | | | 988 | | | | (1,717 | ) |
| | | | | | | | |
Net unrealized depreciation | | | (57,839,594 | ) | | | (3,503,556 | ) |
| | | | | | | | |
Net realized and unrealized gain (loss) on investments and foreign currency transactions | | | (45,475,056 | ) | | | (4,308,869 | ) |
| | | | | | | | |
Net increase (decrease) in net assets resulting from operations | | $ | (40,351,616 | ) | | $ | (3,846,191 | ) |
| | | | | | | | |
The accompanying notes to financial statements are an integral part of these statements.
74
Brandes Investment Trust
STATEMENTS OF OPERATIONS — For the Six Months Ended March 31, 2019 (continued)
| | | | | | | | | | | | | | | | | | | | | | |
Brandes
Global Equity
Income Fund | | | Brandes
Global
Opportunities
Value Fund | | | Brandes
Emerging
Markets
Value Fund | | | Brandes
International
Small Cap
Equity Fund | | | Brandes
Small Cap
Value Fund | | | Brandes
Core Plus Fixed
Income Fund | |
| | | | | | | | | | | | | | | | | | | | | | |
| | | | | | | | | | | | | | | | | | | | | | |
| $ | 23,101 | | | $ | 265,594 | | | $ | 17,812,400 | | | $ | 6,665,157 | | | $ | 69,754 | | | $ | — | |
| | (1,387 | ) | | | (22,147 | ) | | | (2,219,556 | ) | | | (725,936 | ) | | | (2,641 | ) | | | — | |
| | — | | | | 1,331 | | | | 134,497 | | | | 201,803 | | | | 13,371 | | | | 1,490,549 | |
| | — | | | | — | | | | — | | | | 55,916 | | | | — | | | | — | |
| | | | | | | | | | | | | | | | | | | | | | |
| | 21,714 | | | | 244,778 | | | | 15,727,341 | | | | 6,196,940 | | | | 80,484 | | | | 1,490,549 | |
| | | | | | | | | | | | | | | | | | | | | | |
| | | | | | | | | | | | | | | | | | | | | | |
| | 5,229 | | | | 95,026 | | | | 6,764,107 | | | | 3,814,585 | | | | 32,244 | | | | 148,616 | |
| | 1,004 | | | | 4,120 | | | | 372,892 | | | | 104,342 | | | | 1,002 | | | | 6,258 | |
| | 6,660 | | | | 10,200 | | | | 172,452 | | | | 128,724 | | | | 7,622 | | | | 16,834 | |
| | — | | | | 272 | | | | 15,648 | | | | 13,354 | | | | 90 | | | | 994 | |
| | — | | | | 628 | | | | 37,574 | | | | 32,920 | | | | 374 | | | | 2,358 | |
| | 1,369 | | | | 2,182 | | | | 55,906 | | | | 36,434 | | | | 2,014 | | | | 3,812 | |
| | 1,286 | | | | 1,556 | | | | 26,766 | | | | 26,114 | | | | 732 | | | | 2,314 | |
| | 3,710 | | | | 28,796 | | | | 50,604 | | | | 38,964 | | | | 12,734 | | | | 29,156 | |
| | 834 | | | | 2,332 | | | | 78,940 | | | | 62,862 | | | | 1,072 | | | | 5,676 | |
| | 22,568 | | | | 23,538 | | | | 171,250 | | | | 111,632 | | | | 22,750 | | | | 25,832 | |
| | 38 | | | | 1,130 | | | | 314,884 | | | | 86,604 | | | | 31 | | | | 2,335 | |
| | 19 | | | | 832 | | | | 79,510 | | | | 42,309 | | | | N/A | | | | N/A | |
| | 6 | | | | 277 | | | | 26,503 | | | | 14,103 | | | | N/A | | | | N/A | |
| | 318 | | | | 4,720 | | | | 279,142 | | | | 164,458 | | | | 1,249 | | | | 20,764 | |
| | 28,134 | | | | 30,322 | | | | 45,428 | | | | 43,030 | | | | 25,260 | | | | 29,812 | |
| | 17,304 | | | | 18,390 | | | | 21,668 | | | | 20,394 | | | | 17,010 | | | | 20,120 | |
| | — | | | | — | | | | — | | | | — | | | | 15,691 | | | | — | |
| | | | | | | | | | | | | | | | | | | | | | |
| | 88,479 | | | | 224,321 | | | | 8,513,274 | | | | 4,740,829 | | | | 139,875 | | | | 314,881 | |
| | (81,880 | ) | | | (107,050 | ) | | | (175,367 | ) | | | (60,862 | ) | | | (102,161 | ) | | | (100,703 | ) |
| | — | | | | — | | | | 17,775 | | | | — | | | | — | | | | — | |
| | | | | | | | | | | | | | | | | | | | | | |
| | 6,599 | | | | 117,271 | | | | 8,355,682 | | | | 4,679,967 | | | | 37,714 | | | | 214,178 | |
| | | | | | | | | | | | | | | | | | | | | | |
| | 15,115 | | | | 127,507 | | | | 7,371,659 | | | | 1,516,973 | | | | 42,770 | | | | 1,276,371 | |
| | | | | | | | | | | | | | | | | | | | | | |
| | | | | | | | | | | | | | | | | | | | | | |
| | | | | | | | | | | | | | | | | | | | | | |
| | 12,545 | | | | (2,683,130 | ) | | | 6,942,745 | | | | (102,163,116 | ) | | | (48,481 | ) | | | (791,452 | ) |
| | — | | | | — | | | | — | | | | — | | | | — | | | | — | |
| | 14 | | | | (12,518 | ) | | | (235,475 | ) | | | 845 | | | | — | | | | — | |
| | | | | | | | | | | | | | | | | | | | | | |
| | 12,559 | | | | (2,695,648 | ) | | | 6,707,270 | | | | (102,162,271 | ) | | | (48,481 | ) | | | (791,452 | ) |
| | | | | | | | | | | | | | | | | | | | | | |
| | | | | | | | | | | | | | | | | | | | | | |
| | (55,853 | ) | | | 414,758 | | | | 13,186,703 | | | | 13,772,917 | | | | (847,278 | ) | | | 2,109,703 | |
| | 180 | | | | 1,104 | | | | (68,714 | ) | | | 5,039 | | | | — | | | | — | |
| | | | | | | | | | | | | | | | | | | | | | |
| | (55,673 | ) | | | 415,862 | | | | 13,117,989 | | | | 13,777,956 | | | | (847,278 | ) | | | 2,109,703 | |
| | | | | | | | | | | | | | | | | | | | | | |
|
(43,114 |
) | | | (2,279,786 | ) | | | 19,825,259 | | | | (88,384,315 | ) | | | (895,759 | ) | | | 1,318,251 | |
| | | | | | | | | | | | | | | | | | | | | | |
| $ | (27,999 | ) | | $ | (2,152,279 | ) | | $ | 27,196,918 | | | $ | (86,867,342 | ) | | $ | (852,989 | ) | | $ | 2,594,622 | |
| | | | | | | | | | | | | | | | | | | | | | |
The accompanying notes to financial statements are an integral part of these statements.
75
Brandes Investment Trust
STATEMENT OF CHANGES IN NET ASSETS
| | | | | | | | | | | | | | | | |
| | | Brandes International
Equity Fund | | | Brandes Global
Equity Fund | |
| | | Six Months
Ended March 31,
2019 | | | Year ended
September 30,
2018(1) | | | Six Months
Ended March 31,
2019 | | | Year ended
September 30,
2018(2) | |
| | | (Unaudited) | | | | | | (Unaudited) | | | | |
INCREASE (DECREASE) IN NET ASSETS FROM: | | | | | | | | | | | | | | | | |
OPERATIONS | | | | | | | | | | | | | | | | |
Net investment income | | $ | 5,123,440 | | | $ | 14,011,486 | | | $ | 462,678 | | | $ | 1,348,817 | |
Net realized gain (loss) on: | | | | | | | | | | | | | | | | |
Investments | | | 12,400,366 | | | | 25,391,080 | | | | (794,873 | ) | | | 2,874,455 | |
Foreign currency transactions | | | (35,828 | ) | | | (210,171 | ) | | | (10,440 | ) | | | (10,426 | ) |
Net unrealized appreciation (depreciation) on: | | | | | | | | | | | | | | | | |
Investments | | | (57,840,582 | ) | | | (17,141,192 | ) | | | (3,501,839 | ) | | | (732,898 | ) |
Foreign currency transactions | | | 988 | | | | (41,489 | ) | | | (1,717 | ) | | | (281 | ) |
| | | | | | | | | | | | | | | | |
Net increase (decrease) in net assets resulting from operations | | | (40,351,616 | ) | | | 22,009,714 | | | | (3,846,191 | ) | | | 3,479,667 | |
| | | | | | | | | | | | | | | | |
DISTRIBUTIONS TO SHAREHOLDERS | | | | | | | | | | | | | | | | |
Distributions to shareholders | | | | | | | | | | | | | | | | |
Class A | | | (473,856 | ) | | | (569,062 | ) | | | (152,514 | ) | | | (195,704 | ) |
Class C | | | (197,585 | ) | | | (240,746 | ) | | | (77,599 | ) | | | (48,710 | ) |
Class I | | | (9,147,549 | ) | | | (10,567,066 | ) | | | (3,105,899 | ) | | | (2,487,609 | ) |
Class R6 | | | (403,727 | ) | | | (440,184 | ) | | | N/A | | | | N/A | |
| | | | | | | | | | | | | | | | |
Decrease in net assets from distributions | | | (10,222,717 | ) | | | (11,817,058 | ) | | | (3,336,012 | ) | | | (2,732,023 | ) |
| | | | | | | | | | | | | | | | |
CAPITAL SHARE TRANSACTIONS | | | | | | | | | | | | | | | | |
Proceeds from shares sold | | | 261,834,458 | | | | 280,183,460 | | | | 5,204,041 | | | | 5,255,435 | |
Net asset value of shares issued on reinvestment of distributions | | | 9,614,754 | | | | 11,008,451 | | | | 3,304,635 | | | | 2,710,260 | |
Cost of shares redeemed | | | (162,669,957 | ) | | | (169,897,059 | ) | | | (21,953,055 | ) | | | (10,290,630 | ) |
| | | | | | | | | | | | | | | | |
Net increase (decrease) in net assets from capital share transactions | | | 108,779,255 | | | | 121,294,852 | | | | (13,444,379 | ) | | | (2,324,935 | ) |
| | | | | | | | | | | | | | | | |
Total increase (decrease) in net assets | | | 58,204,922 | | | | 131,487,508 | | | | (20,626,582 | ) | | | (1,577,291 | ) |
| | | | | | | | | | | | | | | | |
NET ASSETS | | | | | | | | | | | | | | | | |
Beginning of the Period | | | 742,538,841 | | | | 611,051,333 | | | | 67,612,783 | | | | 69,190,074 | |
| | | | | | | | | | | | | | | | |
End of the Period | | $ | 800,743,763 | | | $ | 742,538,841 | | | $ | 46,986,201 | | | $ | 67,612,783 | |
| | | | | | | | | | | | | | | | |
| (1) | Distributions to shareholders includes net investment income distributions of $569,062, $240,746, $10,567,066 and $440,184 for the A, C, I and R6 classes, respectively. End of period net assets includes accumulated undistributed net investment income of $1,537,706. |
| (2) | Distributions to shareholders includes net investment income distributions of $72,745, $15,982 and $1,223,998, and net realized gains distributions of $122,959, $32,728 and $1,263,611 for the A, C and I classes, respectively. End of period net assets includes accumulated undistributed net investment loss of $62,335. |
The accompanying notes to financial statements are an integral part of these statements.
76
Brandes Investment Trust
STATEMENT OF CHANGES IN NET ASSETS (continued)
| | | | | | | | | | | | | | | | |
| | | Brandes Global Equity
Income Fund | | | Brandes Global Opportunities
Value Fund | |
| | | Six Months
Ended March 31,
2019 | | | Year ended
September 30,
2018(1) | | | Six Months
Ended March 31,
2019 | | | Year ended
September 30,
2018(2) | |
| | | (Unaudited) | | | | | | (Unaudited) | | | | |
INCREASE (DECREASE) IN NET ASSETS FROM: | | | | | | | | | | | | | | | | |
OPERATIONS | | | | | | | | | | | | | | | | |
Net investment income | | $ | 15,115 | | | $ | 31,967 | | | $ | 127,507 | | | $ | 573,397 | |
Net realized gain (loss) on: | | | | | | | | | | | | | | | | |
Investments | | | 12,545 | | | | 53,581 | | | | (2,683,130 | ) | | | 1,518,371 | |
Foreign currency transactions | | | 14 | | | | (260 | ) | | | (12,518 | ) | | | (1,341 | ) |
Net unrealized appreciation (depreciation) on: | | | | | | | | | | | | | | | | |
Investments | | | (55,853 | ) | | | (48,419 | ) | | | 414,758 | | | | (3,226,983 | ) |
Foreign currency transactions | | | 180 | | | | (171 | ) | | | 1,104 | | | | (1,895 | ) |
| | | | | | | | | | | | | | | | |
Net increase (decrease) in net assets resulting from operations | | | (27,999 | ) | | | 36,698 | | | | (2,152,279 | ) | | | (1,138,451 | ) |
| | | | | | | | | | | | | | | | |
DISTRIBUTIONS TO SHAREHOLDERS | | | | | | | | | | | | | | | | |
Distributions to shareholders | | | | | | | | | | | | | | | | |
Class A | | | (1,297 | ) | | | (685 | ) | | | (61,728 | ) | | | (70,029 | ) |
Class C | | | (194 | ) | | | (21 | ) | | | (15,251 | ) | | | (6,750 | ) |
Class I | | | (56,470 | ) | | | (64,304 | ) | | | (1,755,309 | ) | | | (966,526 | ) |
| | | | | | | | | | | | | | | | |
Decrease in net assets from distributions | | | (57,961 | ) | | | (65,010 | ) | | | (1,832,288 | ) | | | (1,043,305 | ) |
| | | | | | | | | | | | | | | | |
CAPITAL SHARE TRANSACTIONS | | | | | | | | | | | | | | | | |
Proceeds from shares sold | | | 22,500 | | | | 339,640 | | | | 823,712 | | | | 4,818,934 | |
Net asset value of shares issued on reinvestment of distributions | | | 56,669 | | | | 62,888 | | | | 1,792,125 | | | | 1,010,828 | |
Cost of shares redeemed | | | (47,765 | ) | | | (28,697 | ) | | | (18,411,506 | ) | | | (5,250,648 | ) |
| | | | | | | | | | | | | | | | |
Net increase (decrease) in net assets from capital share transactions | | | 31,404 | | | | 373,831 | | | | (15,795,669 | ) | | | 579,114 | |
| | | | | | | | | | | | | | | | |
Total increase (decrease) in net assets | | | (54,556 | ) | | | 345,519 | | | | (19,780,236 | ) | | | (1,602,642 | ) |
| | | | | | | | | | | | | | | | |
NET ASSETS | | | | | | | | | | | | | | | | |
Beginning of the Period | | | 1,388,233 | | | | 1,042,714 | | | | 30,040,221 | | | | 31,642,863 | |
| | | | | | | | | | | | | | | | |
End of the Period | | $ | 1,333,677 | | | $ | 1,388,233 | | | $ | 10,259,985 | | | $ | 30,040,221 | |
| | | | | | | | | | | | | | | | |
| (1) | Distributions to shareholders includes net investment income distributions of $681, $17 and $30,179, and net realized gains distributions of $4, $4 and $34,125 for the A, C and I classes, respectively. End of period net assets includes accumulated undistributed net investment income of $953. |
| (2) | Distributions to shareholders includes net investment income distributions of $47,970, $4,499 and $719,259, and net realized gains distributions of $22,059, $2,251 and $247,267 for the A, C and I classes, respectively. End of period net assets includes accumulated undistributed net investment loss of $40,684. |
The accompanying notes to financial statements are an integral part of these statements.
77
Brandes Investment Trust
STATEMENT OF CHANGES IN NET ASSETS (continued)
| | | | | | | | | | | | | | | | |
| | | Brandes Emerging
Markets Value Fund | | | Brandes International
Small Cap Equity Fund | |
| | | Six Months
Ended March 31,
2019 | | | Year ended
September 30,
2018(1) | | | Six Months
Ended March 31,
2019 | | | Year ended
September 30,
2018(2) | |
| | | (Unaudited) | | | | | | (Unaudited) | | | | |
INCREASE (DECREASE) IN NET ASSETS FROM: | | | | | | | | | | | | | | | | |
OPERATIONS | | | | | | | | | | | | | | | | |
Net investment income | | $ | 7,371,659 | | | $ | 31,671,556 | | | $ | 1,516,973 | | | $ | 18,413,109 | |
Net realized gain (loss) on: | | | | | | | | | | | | | | | | |
Investments | | | 6,942,745 | | | | 101,866,689 | | | | (102,163,116 | ) | | | 76,959,441 | |
Foreign currency transactions | | | (235,475 | ) | | | (2,992,329 | ) | | | 845 | | | | (807,207 | ) |
Net unrealized appreciation (depreciation) on: | | | | | | | | | | | | | | | | |
Investments | | | 13,186,703 | | | | (297,507,481 | ) | | | 13,772,917 | | | | (212,419,367 | ) |
Foreign currency transactions | | | (68,714 | ) | | | 31,294 | | | | 5,039 | | | | 166,032 | |
| | | | | | | | | | | | | | | | |
Net increase (decrease) in net assets resulting from operations | | | 27,196,918 | | | | (166,930,271 | ) | | | (86,867,342 | ) | | | (117,687,992 | ) |
| | | | | | | | | | | | | | | | |
DISTRIBUTIONS TO SHAREHOLDERS | | | | | | | | | | | | | | | | |
Distributions to shareholders | | | | | | | | | | | | | | | | |
Class A | | | (801,531 | ) | | | (4,492,509 | ) | | | (2,451,868 | ) | | | (11,119,388 | ) |
Class C | | | (22,136 | ) | | | (224,759 | ) | | | (381,674 | ) | | | (1,848,988 | ) |
Class I | | | (4,630,709 | ) | | | (23,654,042 | ) | | | (20,776,555 | ) | | | (109,207,423 | ) |
Class R6 | | | (155,257 | ) | | | (1,345,870 | ) | | | (2,272,824 | ) | | | (5,700,213 | ) |
| | | | | | | | | | | | | | | | |
Decrease in net assets from distributions | | | (5,609,633 | ) | | | (29,717,180 | ) | | | (25,882,921 | ) | | | (127,876,012 | ) |
| | | | | | | | | | | | | | | | |
CAPITAL SHARE TRANSACTIONS | | | | | | | | | | | | | | | | |
Proceeds from shares sold | | | 310,136,115 | | | | 532,236,709 | | | | 129,843,752 | | | | 400,890,576 | |
Net asset value of shares issued on reinvestment of distributions | | | 5,082,996 | | | | 26,393,702 | | | | 24,616,866 | | | | 123,508,821 | |
Cost of shares redeemed | | | (343,986,917 | ) | | | (640,989,583 | ) | | | (510,039,784 | ) | | | (971,216,787 | ) |
| | | | | | | | | | | | | | | | |
Net decrease in net assets from capital share transactions | | | (28,767,806 | ) | | | (82,359,172 | ) | | | (355,579,166 | ) | | | (446,817,390 | ) |
| | | | | | | | | | | | | | | | |
Total decrease in net assets | | | (7,180,521 | ) | | | (279,006,623 | ) | | | (468,329,429 | ) | | | (692,381,394 | ) |
| | | | | | | | | | | | | | | | |
NET ASSETS | | | | | | | | | | | | | | | | |
Beginning of the Period | | | 1,477,308,025 | | | | 1,756,314,648 | | | | 1,131,728,306 | | | | 1,824,109,700 | |
| | | | | | | | | | | | | | | | |
End of the Period | | $ | 1,470,127,504 | | | $ | 1,477,308,025 | | | $ | 663,398,877 | | | $ | 1,131,728,306 | |
| | | | | | | | | | | | | | | | |
| (1) | Distributions to shareholders includes net investment income distributions of $4,492,509, $224,759, $23,654,042 and $1,345,870 for the A, C, I and R6 classes, respectively. End of period net assets includes accumulated undistributed net investment loss of $10,547,353. |
| (2) | Distributions to shareholders includes net investment income distributions of $5,950,910, $957,993, $60,072,418 and $3,193,839, and net realized gains distributions of $5,168,478, $890,995, $49,135,005 and $2,506,374 for the A, C, I and R6 classes, respectively. End of period net assets includes accumulated undistributed net investment loss of $11,039,962. |
The accompanying notes to financial statements are an integral part of these statements.
78
Brandes Investment Trust
STATEMENT OF CHANGES IN NET ASSETS (continued)
| | | | | | | | | | | | | | | | |
| | | Brandes Small Cap
Value Fund | | | Brandes Core Plus Fixed
Income Fund | |
| | | Six Months
Ended March 31,
2019 | | | Period ended
September 30,
2018(1)(2) | | | Six Months
Ended March 31,
2019 | | | Year ended
September 30,
2018(3) | |
| | | (Unaudited) | | | | | | (Unaudited) | | | | |
INCREASE (DECREASE) IN NET ASSETS FROM: | | | | | | | | | | | | | | | | |
OPERATIONS | | | | | | | | | | | | | | | | |
Net investment income | | $ | 42,770 | | | $ | 39,189 | | | $ | 1,276,371 | | | $ | 2,720,051 | |
Net realized gain (loss) on: | | | | | | | | | | | | | | | | |
Investments | | | (48,481 | ) | | | 500,680 | | | | (791,452 | ) | | | (734,191 | ) |
Foreign currency transactions | | | — | | | | — | | | | — | | | | — | |
Net unrealized appreciation (depreciation) on: | | | | | | | | | | | | | | | | |
Investments | | | (847,278 | ) | | | (90,460 | ) | | | 2,109,703 | | | | (2,975,754 | ) |
Foreign currency transactions | | | — | | | | — | | | | — | | | | — | |
| | | | | | | | | | | | | | | | |
Net increase (decrease) in net assets resulting from operations | | | (852,989 | ) | | | 449,409 | | | | 2,594,622 | | | | (989,894 | ) |
| | | | | | | | | | | | | | | | |
DISTRIBUTIONS TO SHAREHOLDERS | | | | | | | | | | | | | | | | |
Distributions to shareholders | | | | | | | | | | | | | | | | |
Class A | | | (1,842 | ) | | | (166 | ) | | | (26,433 | ) | | | (64,040 | ) |
Class I | | | (393,339 | ) | | | (20,004 | ) | | | (1,256,491 | ) | | | (2,657,099 | ) |
Class R6 | | | (333,613 | ) | | | (19,482 | ) | | | (2 | ) | | | (4 | ) |
| | | | | | | | | | | | | | | | |
Decrease in net assets from distributions | | | (728,794 | ) | | | (39,652 | ) | | | (1,282,926 | ) | | | (2,721,143 | ) |
| | | | | | | | | | | | | | | | |
CAPITAL SHARE TRANSACTIONS | | | | | | | | | | | | | | | | |
Proceeds from shares sold | | | — | | | | 1,813,264 | | | | 6,741,707 | | | | 34,243,797 | |
Proceeds from Transferin-kind (Note 10) | | | — | | | | 8,132,782 | | | | — | | | | — | |
Net asset value of shares issued on reinvestment of distributions | | | 728,795 | | | | 39,652 | | | | 1,250,360 | | | | 2,679,959 | |
Cost of shares redeemed | | | (432,369 | ) | | | (65,620 | ) | | | (19,265,928 | ) | | | (42,896,480 | ) |
| | | | | | | | | | | | | | | | |
Net increase (decrease) in net assets from capital share transactions | | | 296,426 | | | | 9,920,078 | | | | (11,273,861 | ) | | | (5,972,724 | ) |
| | | | | | | | | | | | | | | | |
Total increase (decrease) in net assets | | | (1,285,357 | ) | | | 10,329,835 | | | | (9,962,165 | ) | | | (9,683,761 | ) |
| | | | | | | | | | | | | | | | |
NET ASSETS | | | | | | | | | | | | | | | | |
Beginning of the Period | | | 10,329,835 | | | | — | | | | 91,502,923 | | | | 101,186,684 | |
| | | | | | | | | | | | | | | | |
End of the Period | | $ | 9,044,478 | | | $ | 10,329,835 | | | $ | 81,540,758 | | | $ | 91,502,923 | |
| | | | | | | | | | | | | | | | |
| (1) | Commenced operations on January 2, 2018. |
| (2) | Distributions to shareholders includes net investment income distributions of $166, $20,004 and $19,482 for the A, I and R6 classes, respectively. End of period net assets includes accumulated undistributed net investment income of $2,480. |
| (3) | Distributions to shareholders includes net investment income distributions of $64,040, $2,657,099 and $4 for the A, I and R6 classes, respectively. End of period net assets includes accumulated undistributed net investment income of $19,107. |
The accompanying notes to financial statements are an integral part of these statements.
79
Brandes Investment Trust
FINANCIAL HIGHLIGHTS For a capital share outstanding for the period ended:
| | | | | | | | | | | | | | | | | | | | |
| | | Net asset value, beginning
of period | | | Net
investment income(5) | | | Net
realized and unrealized gain (loss) on investments | | | Total from investment operations | | | Dividends from net investment income | |
Brandes International Equity Fund | | | | | | | | | | | | | |
Class A | | | | | | | | | | | | | | | | | | | | |
3/31/2019 (Unaudited) | | $ | 17.71 | | | | 0.10 | | | | (1.01 | ) | | | (0.91 | ) | | | (0.22 | ) |
9/30/2018 | | $ | 17.48 | | | | 0.36 | | | | 0.17 | | | | 0.53 | | | | (0.30 | ) |
9/30/2017 | | $ | 15.70 | | | | 0.29 | | | | 2.03 | | | | 2.32 | | | | (0.54 | ) |
9/30/2016 | | $ | 14.90 | | | | 0.35 | | | | 0.81 | | | | 1.16 | | | | (0.36 | ) |
9/30/2015 | | $ | 16.58 | | | | 0.35 | | | | (1.73 | ) | | | (1.38 | ) | | | (0.30 | ) |
9/30/2014 | | $ | 16.03 | | | | 0.33 | | | | 0.56 | | | | 0.89 | | | | (0.34 | ) |
Class C | | | | | | | | | | | | | | | | | | | | |
3/31/2019 (Unaudited) | | $ | 17.47 | | | | 0.04 | | | | (1.01 | ) | | | (0.97 | ) | | | (0.19 | ) |
9/30/2018 | | $ | 17.30 | | | | 0.22 | | | | 0.18 | | | | 0.40 | | | | (0.23 | ) |
9/30/2017 | | $ | 15.58 | | | | 0.17 | | | | 2.00 | | | | 2.17 | | | | (0.45 | ) |
9/30/2016 | | $ | 14.79 | | | | 0.23 | | | | 0.81 | | | | 1.04 | | | | (0.25 | ) |
9/30/2015 | | $ | 16.48 | | | | 0.24 | | | | (1.73 | ) | | | (1.49 | ) | | | (0.20 | ) |
9/30/2014 | | $ | 15.98 | | | | 0.20 | | | | 0.55 | | | | 0.75 | | | | (0.25 | ) |
Class I | | | | | | | | | | | | | | | | | | | | |
3/31/2019 (Unaudited) | | $ | 17.76 | | | | 0.12 | | | | (1.02 | ) | | | (0.90 | ) | | | (0.23 | ) |
9/30/2018 | | $ | 17.52 | | | | 0.40 | | | | 0.16 | | | | 0.56 | | | | (0.32 | ) |
9/30/2017 | | $ | 15.72 | | | | 0.33 | | | | 2.04 | | | | 2.37 | | | | (0.57 | ) |
9/30/2016 | | $ | 14.92 | | | | 0.38 | | | | 0.81 | | | | 1.19 | | | | (0.39 | ) |
9/30/2015 | | $ | 16.60 | | | | 0.35 | | | | (1.70 | ) | | | (1.35 | ) | | | (0.33 | ) |
9/30/2014 | | $ | 16.05 | | | | 0.36 | | | | 0.56 | | | | 0.92 | | | | (0.37 | ) |
Class R | | | | | | | | | | | | | | | | | | | | |
6 3/31/2019 (Unaudited) | | $ | 17.83 | | | | 0.13 | | | | (1.03 | ) | | | (0.90 | ) | | | (0.23 | ) |
9/30/2018 | | $ | 17.56 | | | | 0.42 | | | | 0.18 | | | | 0.60 | | | | (0.33 | ) |
9/30/2017 | | $ | 15.74 | | | | 0.35 | | | | 2.04 | | | | 2.39 | | | | (0.57 | ) |
2/1/2016(3) – 9/30/2016 | | $ | 14.41 | | | | 0.27 | | | | 1.39 | | | | 1.66 | | | | (0.33 | ) |
| (3) | Commencement of operations. |
| (4) | After fees waived and expenses absorbed or recouped by the Advisor, where applicable. |
| (5) | Net investment income per share has been calculated based on average shares outstanding during the period. |
| (6) | The total return calculation does not reflect the sales loads that may be imposed on Class A or C shares (see Note 7 of the Notes to Financial Statements). |
| (7) | The total return figure is the since inception return for the class. |
| (8) | Includes expenses not covered by the Trust’s expense limitation agreement. See Note 3 for more information. |
The accompanying notes to financial statements are an integral part of these statements.
80
Brandes Investment Trust
FINANCIAL HIGHLIGHTS For a capital share outstanding for the period ended:
| | | | | | | | | | | | | | | | | | | | | | | | | | | | | | |
Net asset
value, end of period | | | Total
return(6) | | | Net assets, end of
period (millions) | | | Ratio of
net expenses
to average
net assets(4) | | | Ratio of net
investment income to average net assets(4) | | | Ratio of expenses (prior
to reimburse-
ments) to
average
net assets | | | Ratio of net
investment
income (prior
to reimburse-
ments) to
average net
assets | | | Portfolio
turnover
rate | |
| | | | | | | | | | | | | | | | | | | | | | | | | | | | | | |
| | | | | | | | | | | | | | | | | | | | | | | | | | | | | | |
| $ | 16.58 | | | | -5.10 | %(1) | | $ | 36.2 | | | | 1.16 | %(2) | | | 1.22 | %(2) | | | 1.16 | %(2) | | | 1.22 | %(2) | | | 6.71 | %(1) |
| $ | 17.71 | | | | 3.02 | % | | $ | 34.9 | | | | 1.16 | % | | | 2.00 | % | | | 1.16 | % | | | 2.00 | % | | | 20.37 | % |
| $ | 17.48 | | | | 15.07 | % | | $ | 31.5 | | | | 1.18 | %(8) | | | 1.77 | % | | | 1.18 | %(8) | | | 1.77 | % | | | 33.82 | % |
| $ | 15.70 | | | | 7.90 | % | | $ | 14.3 | | | | 1.18 | % | | | 2.30 | % | | | 1.18 | % | | | 2.30 | % | | | 17.60 | % |
| $ | 14.90 | | | | -8.47 | % | | $ | 13.1 | | | | 1.18 | % | | | 2.08 | % | | | 1.18 | % | | | 2.08 | % | | | 27.50 | % |
| $ | 16.58 | | | | 5.47 | % | | $ | 9.0 | | | | 1.19 | % | | | 1.92 | % | | | 1.18 | % | | | 1.93 | % | | | 39.53 | % |
| | | | | | | | | | | | | | | | | | | | | | | | | | | | | | |
| $ | 16.31 | | | | -5.51 | %(1) | | $ | 17.0 | | | | 1.91 | %(2) | | | 0.47 | %(2) | | | 1.91 | %(2) | | | 0.47 | %(2) | | | 6.71 | %(1) |
| $ | 17.47 | | | | 2.31 | % | | $ | 18.3 | | | | 1.91 | % | | | 1.25 | % | | | 1.91 | % | | | 1.25 | % | | | 20.37 | % |
| $ | 17.30 | | | | 14.19 | % | | $ | 17.9 | | | | 1.93 | %(8) | | | 1.01 | % | | | 1.93 | %(8) | | | 1.01 | % | | | 33.82 | % |
| $ | 15.58 | | | | 7.10 | % | | $ | 13.1 | | | | 1.93 | % | | | 1.55 | % | | | 1.93 | % | | | 1.55 | % | | | 17.60 | % |
| $ | 14.79 | | | | -9.14 | % | | $ | 12.0 | | | | 1.93 | % | | | 1.43 | % | | | 1.93 | % | | | 1.43 | % | | | 27.50 | % |
| $ | 16.48 | | | | 4.64 | % | | $ | 4.3 | | | | 1.93 | % | | | 1.19 | % | | | 1.93 | % | | | 1.19 | % | | | 39.53 | % |
| | | | | | | | | | | | | | | | | | | | | | | | | | | | | | |
| $ | 16.63 | | | | -5.03 | %(1) | | $ | 713.6 | | | | 0.96 | %(2) | | | 1.43 | %(2) | | | 0.96 | %(2) | | | 1.43 | %(2) | | | 6.71 | %(1) |
| $ | 17.76 | | | | 3.23 | % | | $ | 664.7 | | | | 0.96 | % | | | 2.20 | % | | | 0.96 | % | | | 2.20 | % | | | 20.37 | % |
| $ | 17.52 | | | | 15.33 | % | | $ | 523.1 | | | | 0.98 | %(8) | | | 1.96 | % | | | 0.98 | %(8) | | | 1.96 | % | | | 33.82 | % |
| $ | 15.72 | | | | 8.10 | % | | $ | 648.3 | | | | 1.00 | % | | | 2.48 | % | | | 0.98 | % | | | 2.50 | % | | | 17.60 | % |
| $ | 14.92 | | | | -8.30 | % | | $ | 562.5 | | | | 1.00 | % | | | 2.10 | % | | | 0.98 | % | | | 2.12 | % | | | 27.50 | % |
| $ | 16.60 | | | | 5.61 | % | | $ | 521.9 | | | | 1.00 | % | | | 2.12 | % | | | 0.99 | % | | | 2.13 | % | | | 39.53 | % |
| | | | | | | | | | | | | | | | | | | | | | | | | | | | | | |
| $ | 16.70 | | | | -4.99 | %(1) | | $ | 33.9 | | | | 0.82 | %(2) | | | 1.57 | %(2) | | | 0.91 | %(2) | | | 1.48 | %(2) | | | 6.71 | %(1) |
| $ | 17.83 | | | | 3.44 | % | | $ | 24.6 | | | | 0.82 | % | | | 2.34 | % | | | 0.91 | % | | | 2.25 | % | | | 20.37 | % |
| $ | 17.56 | | | | 15.48 | % | | $ | 38.5 | | | | 0.83 | %(8) | | | 2.12 | % | | | 0.93 | %(8) | | | 2.02 | % | | | 33.82 | % |
| $ | 15.74 | | | | 11.60 | %(7) | | $ | 27.7 | | | | 0.82 | %(2) | | | 2.67 | %(2) | | | 0.93 | %(2) | | | 2.56 | %(2) | | | 17.60 | %(1) |
The accompanying notes to financial statements are an integral part of these statements.
81
Brandes Investment Trust
FINANCIAL HIGHLIGHTS For a capital share outstanding for the period ended:
| | | | | | | | | | | | | | | | | | | | | | | | |
| | | Net asset
value,
beginning
of period | | | Net
investment
income(2) | | | Net
realized and
unrealized
gain (loss) on
investments | | | Total from
investment
operations | | | Dividends
from net
investment
income | | | Dividends
from net
realized
gains | |
Brandes Global Equity Fund | | | | | | | | | | | | | | | | | | | | | |
Class A | | | | | | | | | | | | | | | | | | | | | | | | |
3/31/2019 (Unaudited) | | $ | 24.61 | | | | 0.16 | | | | (1.53 | ) | | | (1.37 | ) | | | (0.17 | ) | | | (1.05 | ) |
9/30/2018 | | $ | 24.42 | | | | 0.43 | | | | 0.69 | | | | 1.12 | | | | (0.42 | ) | | | (0.51 | ) |
9/30/2017 | | $ | 21.21 | | | | 0.34 | | | | 3.28 | | | | 3.62 | | | | (0.41 | ) | | | — | |
9/30/2016 | | $ | 21.85 | | | | 0.40 | | | | 0.67 | | | | 1.07 | | | | (0.42 | ) | | | (1.29 | ) |
9/30/2015 | | $ | 25.43 | | | | 0.27 | | | | (1.90 | ) | | | (1.63 | ) | | | (0.33 | ) | | | (1.62 | ) |
9/30/2014 | | $ | 24.20 | | | | 0.43 | | | | 2.00 | | | | 2.43 | | | | (0.44 | ) | | | (0.76 | ) |
Class C | | | | | | | | | | | | | | | | | | | | | | | | |
3/31/2019 (Unaudited) | | $ | 24.45 | | | | 0.08 | | | | (1.51 | ) | | | (1.43 | ) | | | (0.10 | ) | | | (1.05 | ) |
9/30/2018 | | $ | 24.28 | | | | 0.24 | | | | 0.69 | | | | 0.93 | | | | (0.25 | ) | | | (0.51 | ) |
9/30/2017 | | $ | 21.09 | | | | 0.18 | | | | 3.25 | | | | 3.43 | | | | (0.24 | ) | | | — | |
9/30/2016 | | $ | 21.73 | | | | 0.25 | | | | 0.66 | | | | 0.91 | | | | (0.26 | ) | | | (1.29 | ) |
9/30/2015 | | $ | 25.31 | | | | 0.16 | | | | (1.92 | ) | | | (1.76 | ) | | | (0.20 | ) | | | (1.62 | ) |
9/30/2014 | | $ | 24.14 | | | | 0.24 | | | | 1.99 | | | | 2.23 | | | | (0.30 | ) | | | (0.76 | ) |
Class I | | | | | | | | | | | | | | | | | | | | | | | | |
3/31/2019 (Unaudited) | | $ | 24.77 | | | | 0.19 | | | | (1.53 | ) | | | (1.34 | ) | | | (0.20 | ) | | | (1.05 | ) |
9/30/2018 | | $ | 24.57 | | | | 0.49 | | | | 0.70 | | | | 1.19 | | | | (0.48 | ) | | | (0.51 | ) |
9/30/2017 | | $ | 21.33 | | | | 0.41 | | | | 3.30 | | | | 3.71 | | | | (0.47 | ) | | | — | |
9/30/2016 | | $ | 21.95 | | | | 0.46 | | | | 0.67 | | | | 1.13 | | | | (0.46 | ) | | | (1.29 | ) |
9/30/2015 | | $ | 25.52 | | | | 0.39 | | | | (1.97 | ) | | | (1.58 | ) | | | (0.37 | ) | | | (1.62 | ) |
9/30/2014 | | $ | 24.26 | | | | 0.50 | | | | 2.00 | | | | 2.50 | | | | (0.48 | ) | | | (0.76 | ) |
| (1) | After fees waived and expenses absorbed or recouped by the Advisor, where applicable. |
| (2) | Net investment income per share has been calculated based on average shares outstanding during the period. |
| (3) | The total return calculation does not reflect the sales loads that may be imposed on Class A or C shares (see Note 7 of the Notes to Financial Statements). |
| (4) | Includes expenses not covered by the Trust’s expense limitation agreement. See Note 3 for more information. |
The accompanying notes to financial statements are an integral part of these statements.
82
Brandes Investment Trust
FINANCIAL HIGHLIGHTS For a capital share outstanding for the period ended:
| | | | | | | | | | | | | | | | | | | | | | | | | | | | | | |
Net asset
value, end
of period | | | Total
return(3) | | | Net assets,
end of
period
(millions) | | | Ratio of
net expenses
to average
net assets(1) | | | Ratio of net
investment
income to
average
net assets(1) | | | Ratio of
expenses (prior
to reimburse-
ments) to
average
net assets | | | Ratio of net
investment
income (prior
to reimburse-
ments) to
average
net assets | | | Portfolio
turnover
rate | |
| | | | | | | | | | | | | | | | | | | | | | | | | | | | | | |
| | | | | | | | | | | | | | | | | | | | | | | | | | | | | | |
| $ | 22.02 | | | | -5.35 | %(1) | | $ | 1.7 | | | | 1.25 | %(2) | | | 1.44 | %(2) | | | 1.50 | %(2) | | | 1.19 | %(2) | | | 9.13 | %(1) |
| $ | 24.61 | | | | 4.68 | % | | $ | 3.4 | | | | 1.25 | % | | | 1.72 | % | | | 1.40 | % | | | 1.57 | % | | | 8.89 | % |
| $ | 24.42 | | | | 17.20 | % | | $ | 5.8 | | | | 1.26 | %(4) | | | 1.52 | % | | | 1.45 | %(4) | | | 1.33 | % | | | 17.42 | % |
| $ | 21.21 | | | | 5.01 | % | | $ | 4.6 | | | | 1.25 | % | | | 1.95 | % | | | 1.58 | % | | | 1.62 | % | | | 15.68 | % |
| $ | 21.85 | | | | -6.99 | % | | $ | 1.8 | | | | 1.25 | % | | | 1.15 | % | | | 1.66 | % | | | 0.74 | % | | | 25.06 | % |
| $ | 25.43 | | | | 10.18 | % | | $ | 1.2 | | | | 1.25 | % | | | 1.67 | % | | | 1.71 | % | | | 1.21 | % | | | 30.33 | % |
| | | | | | | | | | | | | | | | | | | | | | | | | | | | | | |
| $ | 21.87 | | | | -5.68 | %(1) | | $ | 1.4 | | | | 2.00 | %(2) | | | 0.70 | %(2) | | | 2.26 | %(2) | | | 0.44 | %(2) | | | 9.13 | %(1) |
| $ | 24.45 | | | | 3.88 | % | | $ | 1.6 | | | | 2.00 | % | | | 0.97 | % | | | 2.15 | % | | | 0.82 | % | | | 8.89 | % |
| $ | 24.28 | | | | 16.31 | % | | $ | 1.7 | | | | 2.01 | %(4) | | | 0.77 | % | | | 2.21 | %(4) | | | 0.57 | % | | | 17.42 | % |
| $ | 21.09 | | | | 4.20 | % | | $ | 2.0 | | | | 2.00 | % | | | 1.20 | % | | | 2.32 | % | | | 0.88 | % | | | 15.68 | % |
| $ | 21.73 | | | | -7.62 | % | | $ | 2.4 | | | | 2.00 | % | | | 0.66 | % | | | 2.42 | % | | | 0.24 | % | | | 25.06 | % |
| $ | 25.31 | | | | 9.34 | % | | $ | 1.1 | | | | 2.00 | % | | | 0.92 | % | | | 2.46 | % | | | 0.46 | % | | | 30.33 | % |
| | | | | | | | | | | | | | | | | | | | | | | | | | | | | | |
| $ | 22.18 | | | | -5.20 | %(1) | | $ | 43.9 | | | | 1.00 | %(2) | | | 1.70 | %(2) | | | 1.30 | %(2) | | | 1.40 | %(2) | | | 9.13 | %(1) |
| $ | 24.77 | | | | 4.95 | % | | $ | 62.6 | | | | 1.00 | % | | | 1.97 | % | | | 1.20 | % | | | 1.77 | % | | | 8.89 | % |
| $ | 24.57 | | | | 17.48 | % | | $ | 61.7 | | | | 1.01 | %(4) | | | 1.77 | % | | | 1.26 | %(4) | | | 1.52 | % | | | 17.42 | % |
| $ | 21.33 | | | | 5.26 | % | | $ | 47.3 | | | | 1.00 | % | | | 2.20 | % | | | 1.38 | % | | | 1.82 | % | | | 15.68 | % |
| $ | 21.95 | | | | -6.75 | % | | $ | 46.0 | | | | 1.00 | % | | | 1.61 | % | | | 1.47 | % | | | 1.14 | % | | | 25.06 | % |
| $ | 25.52 | | | | 10.46 | % | | $ | 45.9 | | | | 1.00 | % | | | 1.93 | % | | | 1.53 | % | | | 1.40 | % | | | 30.33 | % |
The accompanying notes to financial statements are an integral part of these statements.
83
Brandes Investment Trust
FINANCIAL HIGHLIGHTS For a capital share outstanding for the period ended:
| | | | | | | | | | | | | | | | | | | | | | | | |
| | | Net asset
value,
beginning
of period | | | Net
investment
income(5) | | | Net
realized and
unrealized
gain (loss) on
investments | | | Total from
investment
operations | | | Dividends
from net
investment
income | | | Dividends
from net
realized
gains | |
Brandes Global Equity Income Fund | | | | | | | | | | | | | | | | | |
Class A | | | | | | | | | | | | | | | | | | | | | | | | |
3/31/2019 (Unaudited) | | $ | 12.12 | | | | 0.12 | | | | (0.39 | ) | | | (0.27 | ) | | | (0.12 | ) | | | (0.36 | ) |
9/30/2018 | | $ | 12.46 | | | | 0.30 | | | | 0.02 | | | | 0.32 | | | | (0.26 | ) | | | (0.40 | ) |
9/30/2017 | | $ | 10.79 | | | | 0.24 | | | | 1.73 | | | | 1.97 | | | | (0.04 | ) | | | (0.26 | ) |
9/30/2016 | | $ | 9.62 | | | | 0.28 | | | | 1.35 | | | | 1.63 | | | | (0.26 | ) | | | (0.20 | ) |
12/31/2014(3) – 9/30/2015 | | $ | 10.00 | | | | 0.23 | | | | (0.46 | ) | | | (0.23 | ) | | | (0.15 | ) | | | — | |
Class C | | | | | | | | | | | | | | | | | | | | | | | | |
3/31/2019 (Unaudited) | | $ | 11.69 | | | | 0.07 | | | | (0.37 | ) | | | (0.30 | ) | | | (0.08 | ) | | | (0.36 | ) |
9/30/2018 | | $ | 11.97 | | | | 0.20 | | | | 0.11 | | | | 0.31 | | | | (0.19 | ) | | | (0.40 | ) |
9/30/2017 | | $ | 10.72 | | | | 0.16 | | | | 1.50 | | | | 1.66 | | | | (0.15 | ) | | | (0.26 | ) |
9/30/2016 | | $ | 9.60 | | | | 0.20 | | | | 1.31 | | | | 1.51 | | | | (0.19 | ) | | | (0.20 | ) |
12/31/2014(3) – 9/30/2015 | | $ | 10.00 | | | | 0.23 | | | | (0.52 | ) | | | (0.29 | ) | | | (0.11 | ) | | | — | |
Class I | | | | | | | | | | | | | | | | | | | | | | | | |
3/31/2019 (Unaudited) | | $ | 11.57 | | | | 0.13 | | | | (0.38 | ) | | | (0.25 | ) | | | (0.13 | ) | | | (0.36 | ) |
9/30/2018 | | $ | 11.87 | | | | 0.32 | | | | 0.06 | | | | 0.38 | | | | (0.28 | ) | | | (0.40 | ) |
9/30/2017 | | $ | 10.68 | | | | 0.27 | | | | 1.45 | | | | 1.72 | | | | (0.27 | ) | | | (0.26 | ) |
9/30/2016 | | $ | 9.57 | | | | 0.29 | | | | 1.30 | | | | 1.59 | | | | (0.28 | ) | | | (0.20 | ) |
12/31/2014(3) – 9/30/2015 | | $ | 10.00 | | | | 0.23 | | | | (0.45 | ) | | | (0.22 | ) | | | (0.21 | ) | | | — | |
| (3) | Commencement of operations. |
| (4) | After fees waived and expenses absorbed or recouped by the Advisor, where applicable. |
| (5) | Net investment income per share has been calculated based on average shares outstanding during the period. |
| (6) | The total return calculation does not reflect the sales loads that may be imposed on Class A or C shares (see Note 7 of the Notes to Financial Statements). |
| (7) | The total return figure is the since inception return for the class. |
| (8) | Amount is less than $50,000. |
| (9) | Includes expenses not covered by the Trust’s expense limitation agreement. See Note 3 for more information. |
The accompanying notes to financial statements are an integral part of these statements.
84
Brandes Investment Trust
FINANCIAL HIGHLIGHTS For a capital share outstanding for the period ended:
| | | | | | | | | | | | | | | | | | | | | | | | | | | | | | |
Net asset
value, end
of period | | | Total
return(6) | | | Net assets,
end of
period
(millions) | | | Ratio of
net expenses
to average
net assets(4) | | | Ratio of net
investment
income to
average
net assets(4) | | | Ratio of
expenses (prior
to reimburse-
ments) to
average
net assets | | | Ratio of net
investment
income (prior
to reimburse-
ments) to
average
net assets | | | Portfolio
turnover
rate | |
| | | | | | | | | | | | | | | | | | | | | | | | | | | | | | |
| | | | | | | | | | | | | | | | | | | | | | | | | | | | | | |
| $ | 11.37 | | | | -2.03 | %(1) | | $ | — | (8) | | | 1.25 | %(2) | | | 2.07 | %(2) | | | 13.72 | %(2) | | | (10.40 | )%(2) | | | 5.55 | %(1) |
| $ | 12.12 | | | | 2.66 | % | | $ | — | (8) | | | 1.25 | % | | | 2.47 | % | | | 13.81 | % | | | (10.09 | )% | | | 16.42 | % |
| $ | 12.46 | | | | 18.81 | % | | $ | — | (8) | | | 1.27 | %(9) | | | 2.17 | % | | | 18.00 | %(9) | | | (14.56 | )% | | | 12.97 | % |
| $ | 10.79 | | | | 17.35 | % | | $ | — | (8) | | | 1.25 | % | | | 2.67 | % | | | 20.41 | % | | | (16.49 | )% | | | 22.38 | % |
| $ | 9.62 | | | | -2.44 | %(7) | | $ | — | (8) | | | 1.25 | %(2) | | | 2.90 | %(2) | | | 570.42 | %(2) | | | (566.27 | )%(2) | | | 16.78 | %(1) |
| | | | | | | | | | | | | | | | | | | | | | | | | | | | | | |
| $ | 10.95 | | | | -2.37 | %(1) | | $ | — | (8) | | | 2.00 | %(2) | | | 1.30 | %(2) | | | 14.47 | %(2) | | | (11.17 | )%(2) | | | 5.55 | %(1) |
| $ | 11.69 | | | | 2.64 | % | | $ | — | (8) | | | 2.00 | % | | | 1.68 | % | | | 15.76 | % | | | (12.08 | )% | | | 16.42 | % |
| $ | 11.97 | | | | 16.01 | % | | $ | — | (8) | | | 2.00 | %(9) | | | 1.44 | % | | | 17.88 | %(9) | | | (14.44 | )% | | | 12.97 | % |
| $ | 10.72 | | | | 16.01 | % | | $ | — | (8) | | | 2.00 | % | | | 1.91 | % | | | 21.51 | % | | | (17.60 | )% | | | 22.38 | % |
| $ | 9.60 | | | | -2.99 | %(7) | | $ | — | (8) | | | 2.00 | %(2) | | | 2.90 | %(2) | | | 572.75 | %(2) | | | (567.85 | )%(2) | | | 16.78 | %(1) |
| | | | | | | | | | | | | | | | | | | | | | | | | | | | | | |
| $ | 10.83 | | | | -1.93 | %(1) | | $ | 1.3 | | | | 1.00 | %(2) | | | 2.32 | %(2) | | | 13.53 | %(2) | | | (10.21 | )%(2) | | | 5.55 | %(1) |
| $ | 11.57 | | | | 3.33 | % | | $ | 1.4 | | | | 1.00 | % | | | 2.70 | % | | | 14.47 | % | | | (10.77 | )% | | | 16.42 | % |
| $ | 11.87 | | | | 16.71 | % | | $ | 1.0 | | | | 1.00 | %(9) | | | 2.45 | % | | | 16.88 | %(9) | | | (13.43 | )% | | | 12.97 | % |
| $ | 10.68 | | | | 16.98 | % | | $ | 0.9 | | | | 1.00 | % | | | 2.91 | % | | | 24.04 | % | | | (20.13 | )% | | | 22.38 | % |
| $ | 9.57 | | | | -2.36 | %(7) | | $ | 0.6 | | | | 1.00 | %(2) | | | 2.90 | %(2) | | | 37.61 | %(2) | | | (33.71 | )%(2) | | | 16.78 | %(1) |
The accompanying notes to financial statements are an integral part of these statements.
85
Brandes Investment Trust
FINANCIAL HIGHLIGHTS For a capital share outstanding for the period ended:
| | | | | | | | | | | | | | | | | | | | | | | | |
| | | Net asset
value,
beginning
of period | | | Net
investment
income(5) | | | Net
realized and
unrealized
gain (loss) on
investments | | | Total from
investment
operations | | | Dividends
from net
investment
income | | | Dividends
from net
realized
gains | |
Brandes Global Opportunities Value Fund | | | | | | | | | | | | | | | | | |
Class A | | | | | | | | | | | | | | | | | |
3/31/2019 (Unaudited) | | $ | 10.96 | | | | 0.06 | | | | (0.82 | ) | | | (0.76 | ) | | | (0.12 | ) | | | (0.62 | ) |
9/30/2018 | | $ | 11.70 | | | | 0.17 | | | | (0.57 | ) | | | (0.40 | ) | | | (0.24 | ) | | | (0.10 | ) |
9/30/2017 | | $ | 10.17 | | | | 0.15 | | | | 1.53 | | | | 1.68 | | | | (0.15 | ) | | | — | |
9/30/2016 | | $ | 9.36 | | | | 0.15 | | | | 0.96 | | | | 1.11 | | | | (0.21 | ) | | | (0.09 | ) |
12/31/2014(3) – 9/30/2015 | | $ | 10.00 | | | | 0.12 | | | | (0.68 | ) | | | (0.56 | ) | | | (0.08 | ) | | | — | |
Class C | | | | | | | | | | | | | | | | | | | | | | | | |
3/31/2019 (Unaudited) | | $ | 10.92 | | | | 0.01 | | | | (0.81 | ) | | | (0.80 | ) | | | (0.08 | ) | | | (0.62 | ) |
9/30/2018 | | $ | 11.67 | | | | 0.09 | | | | (0.58 | ) | | | (0.49 | ) | | | (0.16 | ) | | | (0.10 | ) |
9/30/2017 | | $ | 10.15 | | | | 0.07 | | | | 1.53 | | | | 1.60 | | | | (0.08 | ) | | | — | |
9/30/2016 | | $ | 9.33 | | | | 0.07 | | | | 0.98 | | | | 1.05 | | | | (0.14 | ) | | | (0.09 | ) |
12/31/2014(3) – 9/30/2015 | | $ | 10.00 | | | | 0.12 | | | | (0.75 | ) | | | (0.63 | ) | | | (0.04 | ) | | | — | |
Class I | | | | | | | | | | | | | | | | | | | | | | | | |
3/31/2019 (Unaudited) | | $ | 10.94 | | | | 0.06 | | | | (0.86 | ) | | | (0.80 | ) | | | (0.08 | ) | | | (0.62 | ) |
9/30/2018 | | $ | 11.68 | | | | 0.20 | | | | (0.57 | ) | | | (0.37 | ) | | | (0.27 | ) | | | (0.10 | ) |
9/30/2017 | | $ | 10.15 | | | | 0.19 | | | | 1.52 | | | | 1.71 | | | | (0.18 | ) | | | — | |
9/30/2016 | | $ | 9.33 | | | | 0.17 | | | | 0.97 | | | | 1.14 | | | | (0.23 | ) | | | (0.09 | ) |
12/31/2014(3) – 9/30/2015 | | $ | 10.00 | | | | 0.12 | | | | (0.71 | ) | | | (0.59 | ) | | | (0.08 | ) | | | — | |
| (3) | Commencement of operations. |
| (4) | After fees waived and expenses absorbed or recouped by the Advisor, where applicable. |
| (5) | Net investment income per share has been calculated based on average shares outstanding during the period. |
| (6) | The total return calculation does not reflect the sales loads that may be imposed on Class A or C shares (see Note 7 of the Notes to Financial Statements). |
| (7) | The total return figure is the since inception return for the class. |
| (8) | Amount is less than $50,000. |
| (9) | Includes expenses not covered by the Trust’s expense limitation agreement. See Note 3 for more information. |
The accompanying notes to financial statements are an integral part of these statements.
86
Brandes Investment Trust
FINANCIAL HIGHLIGHTS For a capital share outstanding for the period ended:
| | | | | | | | | | | | | | | | | | | | | | | | | | | | | | |
Net asset
value, end
of period | | | Total
return(6) | | | Net assets,
end of
period
(millions) | | | Ratio of
net expenses
to average
net assets(4) | | | Ratio of net
investment
income to
average
net assets(4) | | | Ratio of
expenses (prior
to reimburse-
ments) to
average
net assets | | | Ratio of net
investment
income (prior
to reimburse-
ments) to
average
net assets | | | Portfolio
turnover
rate | |
| | | | | | | | | | | | | | | | | | | | | | | | | | | | | | |
| | | | | | | | | | | | | | | | | | | | | | | | | | | | | | |
| $ | 9.46 | | | | -6.79 | %(1) | | $ | 0.7 | | | | 1.40 | %(2) | | | 1.05 | %(2) | | | 2.52 | %(2) | | | (0.07 | )%(2) | | | 7.77 | %(1) |
| $ | 10.96 | | | | -3.51 | % | | $ | 1.5 | | | | 1.40 | % | | | 1.50 | % | | | 1.88 | % | | | 1.02 | % | | | 29.12 | % |
| $ | 11.70 | | | | 16.66 | % | | $ | 2.8 | | | | 1.40 | %(9) | | | 1.36 | % | | | 2.43 | %(9) | | | 0.33 | % | | | 11.49 | % |
| $ | 10.17 | | | | 12.13 | % | | $ | 0.6 | | | | 1.40 | % | | | 1.53 | % | | | 4.57 | % | | | (1.64 | )% | | | 71.20 | % |
| $ | 9.36 | | | | -5.66 | %(7) | | $ | 0.3 | | | | 1.40 | %(2) | | | 1.29 | %(2) | | | 9.85 | %(2) | | | (7.16 | )%(2) | | | 15.12 | %(1) |
| | | | | | | | | | | | | | | | | | | | | | | | | | | | | | |
| $ | 9.42 | | | | -7.14 | %(1) | | $ | 0.2 | | | | 2.15 | %(2) | | | 0.31 | %(2) | | | 3.39 | %(2) | | | (0.93 | )%(2) | | | 7.77 | %(1) |
| $ | 10.92 | | | | -4.29 | % | | $ | 0.3 | | | | 2.15 | % | | | 0.75 | % | | | 2.64 | % | | | 0.26 | % | | | 29.12 | % |
| $ | 11.67 | | | | 15.80 | % | | $ | 0.2 | | | | 2.15 | %(9) | | | 0.62 | % | | | 3.16 | %(9) | | | (0.39 | )% | | | 11.49 | % |
| $ | 10.15 | | | | 11.42 | % | | $ | — | (8) | | | 2.15 | % | | | 0.78 | % | | | 5.32 | % | | | (2.39 | )% | | | 71.20 | % |
| $ | 9.33 | | | | -6.33 | %(7) | | $ | — | (8) | | | 2.15 | %(2) | | | 1.86 | %(2) | | | 13.79 | %(2) | | | (9.78 | )%(2) | | | 15.12 | %(1) |
| | | | | | | | | | | | | | | | | | | | | | | | | | | | | | |
| $ | 9.44 | | | | -6.68 | %(1) | | $ | 9.4 | | | | 1.15 | %(2) | | | 1.30 | %(2) | | | 2.22 | %(2) | | | 0.23 | %(2) | | | 7.77 | %(1) |
| $ | 10.94 | | | | -3.28 | % | | $ | 28.2 | | | | 1.15 | % | | | 1.75 | % | | | 1.69 | % | | | 1.21 | % | | | 29.12 | % |
| $ | 11.68 | | | | 16.91 | % | | $ | 28.6 | | | | 1.15 | %(9) | | | 1.62 | % | | | 2.05 | %(9) | | | 0.72 | % | | | 11.49 | % |
| $ | 10.15 | | | | 12.45 | % | | $ | 5.1 | | | | 1.15 | % | | | 1.78 | % | | | 4.25 | % | | | (1.32 | )% | | | 71.20 | % |
| $ | 9.33 | | | | -5.92 | %(7) | | $ | 3.0 | | | | 1.15 | %(2) | | | 1.55 | %(2) | | | 11.77 | %(2) | | | (9.07 | )%(2) | | | 15.12 | %(1) |
The accompanying notes to financial statements are an integral part of these statements.
87
Brandes Investment Trust
FINANCIAL HIGHLIGHTS For a capital share outstanding for the period ended:
| | | | | | | | | | | | | | | | | | | | | | | | |
| | | Net asset
value,
beginning
of period | | | Net
investment
income(5) | | | Net
realized and
unrealized
gain (loss) on
investments | | | Total from
investment
operations | | | Dividends
from net
investment
income | | | Dividends
from net
realized
gains | |
Brandes Emerging Markets Value Fund | | | | | | | | | | | | | | | | | |
Class A | | | | | | | | | | | | | | | | | | | | | | | | |
3/31/2019 (Unaudited) | | $ | 8.46 | | | | 0.04 | | | | 0.16 | | | | 0.20 | | | | (0.03 | ) | | | — | |
9/30/2018 | | $ | 9.47 | | | | 0.15 | | | | (1.01 | ) | | | (0.86 | ) | | | (0.15 | ) | | | — | |
9/30/2017 | | $ | 7.91 | | | | 0.10 | | | | 1.60 | | | | 1.70 | | | | (0.14 | ) | | | — | |
9/30/2016 | | $ | 6.19 | | | | 0.12 | | | | 1.69 | | | | 1.81 | | | | (0.09 | ) | | | — | |
9/30/2015 | | $ | 9.56 | | | | 0.11 | | | | (3.12 | ) | | | (3.01 | ) | | | (0.13 | ) | | | (0.23 | ) |
9/30/2014 | | $ | 9.23 | | | | 0.11 | | | | 0.53 | | | | 0.64 | | | | (0.10 | ) | | | (0.21 | ) |
Class C | | | | | | | | | | | | | | | | | | | | | | | | |
3/31/2019 (Unaudited) | | $ | 8.44 | | | | 0.00 | (10) | | | 0.16 | | | | 0.16 | | | | (0.01 | ) | | | — | |
9/30/2018 | | $ | 9.43 | | | | 0.08 | | | | (0.99 | ) | | | (0.91 | ) | | | (0.08 | ) | | | — | |
9/30/2017 | | $ | 7.86 | | | | 0.05 | | | | 1.58 | | | | 1.63 | | | | (0.06 | ) | | | — | |
9/30/2016 | | $ | 6.15 | | | | 0.07 | | | | 1.67 | | | | 1.74 | | | | (0.03 | ) | | | — | |
9/30/2015 | | $ | 9.51 | | | | 0.05 | | | | (3.10 | ) | | | (3.05 | ) | | | (0.08 | ) | | | (0.23 | ) |
9/30/2014 | | $ | 9.19 | | | | 0.03 | | | | 0.54 | | | | 0.57 | | | | (0.04 | ) | | | (0.21 | ) |
Class I | | | | | | | | | | | | | | | | | | | | | | | | |
3/31/2019 (Unaudited) | | $ | 8.50 | | | | 0.05 | | | | 0.17 | | | | 0.22 | | | | (0.04 | ) | | | — | |
9/30/2018 | | $ | 9.51 | | | | 0.17 | | | | (1.01 | ) | | | (0.84 | ) | | | (0.17 | ) | | | — | |
9/30/2017 | | $ | 7.94 | | | | 0.13 | | | | 1.60 | | | | 1.73 | | | | (0.16 | ) | | | — | |
9/30/2016 | | $ | 6.21 | | | | 0.14 | | | | 1.70 | | | | 1.84 | | | | (0.11 | ) | | | — | |
9/30/2015 | | $ | 9.58 | | | | 0.13 | | | | (3.12 | ) | | | (2.99 | ) | | | (0.15 | ) | | | (0.23 | ) |
9/30/2014 | | $ | 9.24 | | | | 0.13 | | | | 0.54 | | | | 0.67 | | | | (0.12 | ) | | | (0.21 | ) |
Class R6 | | | | | | | | | | | | | | | | | | | | | | | | |
3/31/2019 (Unaudited) | | $ | 8.53 | | | | 0.05 | | | | 0.16 | | | | 0.21 | | | | (0.04 | ) | | | — | |
9/30/2018 | | $ | 9.53 | | | | 0.19 | | | | (1.02 | ) | | | (0.83 | ) | | | (0.17 | ) | | | — | |
9/30/2017 | | $ | 7.93 | | | | 0.15 | | | | 1.62 | | | | 1.77 | | | | (0.17 | ) | | | — | |
7/11/2016(3) – 9/30/2016 | | $ | 7.54 | | | | 0.04 | | | | 0.38 | | | | 0.42 | | | | (0.03 | ) | | | — | |
| (3) | Commencement of operations. |
| (4) | After fees waived and expenses absorbed or recouped by the Advisor, where applicable. |
| (5) | Net investment income per share has been calculated based on average shares outstanding during the period. |
| (6) | The total return calculation does not reflect the sales loads that may be imposed on Class A or C shares (see Note 7 of the Notes to Financial Statements). |
| (7) | The total return figure is the since inception return for the class. |
| (8) | Amount is less than $50,000. |
| (9) | Includes expenses not covered by the Trust’s expense limitation agreement. See Note 3 for more information. |
| (10) | Amount is less than $0.01 per share. |
The accompanying notes to financial statements are an integral part of these statements.
88
Brandes Investment Trust
FINANCIAL HIGHLIGHTS For a capital share outstanding for the period ended:
| | | | | | | | | | | | | | | | | | | | | | | | | | | | | | |
Net asset
value, end
of period | | | Total
return(6) | | | Net assets,
end of
period
(millions) | | | Ratio of
net expenses
to average
net assets(4) | | | Ratio of net
investment
income to
average
net assets(4) | | | Ratio of
expenses (prior
to reimburse-
ments) to
average
net assets | | | Ratio of net
investment
income (prior
to reimburse-
ments) to
average
net assets | | | Portfolio
turnover
rate | |
| | | | | | | | | | | | | | | | | | | | | | | | | | | | | | |
| | | | | | | | | | | | | | | | | | | | | | | | | | | | | | |
| $ | 8.63 | | | | 2.33 | %(1) | | $ | 260.1 | | | | 1.36 | %(2) | | | 0.85 | %(2) | | | 1.35 | %(2) | | | 0.86 | %(2) | | | 14.24 | %(1) |
| $ | 8.46 | | | | -9.14 | % | | $ | 258.8 | | | | 1.37 | % | | | 1.62 | % | | | 1.34 | % | | | 1.65 | % | | | 37.66 | % |
| $ | 9.47 | | | | 21.78 | % | | $ | 319.2 | | | | 1.42 | %(9) | | | 1.27 | % | | | 1.40 | %(9) | | | 1.29 | % | | | 23.67 | % |
| $ | 7.91 | | | | 29.38 | % | | $ | 305.0 | | | | 1.37 | % | | | 1.74 | % | | | 1.39 | % | | | 1.72 | % | | | 26.48 | % |
| $ | 6.19 | | | | -32.32 | % | | $ | 295.6 | | | | 1.37 | % | | | 1.46 | % | | | 1.40 | % | | | 1.43 | % | | | 35.02 | % |
| $ | 9.56 | | | | 7.09 | % | | $ | 266.9 | | | | 1.37 | % | | | 1.10 | % | | | 1.37 | % | | | 1.10 | % | | | 22.54 | % |
| | | | | | | | | | | | | | | | | | | | | | | | | | | | | | |
| $ | 8.59 | | | | 1.89 | %(1) | | $ | 20.5 | | | | 2.10 | %(2) | | | 0.11 | %(2) | | | 2.10 | %(2) | | | 0.11 | %(2) | | | 14.24 | %(1) |
| $ | 8.44 | | | | -9.70 | % | | $ | 22.8 | | | | 2.10 | % | | | 0.89 | % | | | 2.09 | % | | | 0.90 | % | | | 37.66 | % |
| $ | 9.43 | | | | 20.83 | % | | $ | 28.2 | | | | 2.17 | %(9) | | | 0.52 | % | | | 2.14 | %(9) | | | 0.55 | % | | | 23.67 | % |
| $ | 7.86 | | | | 28.38 | % | | $ | 22.4 | | | | 2.12 | % | | | 0.99 | % | | | 2.14 | % | | | 0.97 | % | | | 26.48 | % |
| $ | 6.15 | | | | -32.83 | % | | $ | 18.4 | | | | 2.12 | % | | | 0.62 | % | | | 2.14 | % | | | 0.60 | % | | | 35.02 | % |
| $ | 9.51 | | | | 6.38 | % | | $ | 25.3 | | | | 2.12 | % | | | 0.35 | % | | | 2.13 | % | | | 0.34 | % | | | 22.54 | % |
| | | | | | | | | | | | | | | | | | | | | | | | | | | | | | |
| $ | 8.68 | | | | 2.54 | %(1) | | $ | 1,152.8 | | | | 1.12 | %(2) | | | 1.09 | %(2) | | | 1.15 | %(2) | | | 1.06 | %(2) | | | 14.24 | %(1) |
| $ | 8.50 | | | | -8.91 | % | | $ | 1,162.1 | | | | 1.12 | % | | | 1.88 | % | | | 1.14 | % | | | 1.86 | % | | | 37.66 | % |
| $ | 9.51 | | | | 22.07 | % | | $ | 1,311.5 | | | | 1.17 | %(9) | | | 1.51 | % | | | 1.20 | %(9) | | | 1.48 | % | | | 23.67 | % |
| $ | 7.94 | | | | 29.70 | % | | $ | 829.0 | | | | 1.12 | % | | | 1.99 | % | | | 1.19 | % | | | 1.92 | % | | | 26.48 | % |
| $ | 6.21 | | | | -32.13 | % | | $ | 725.1 | | | | 1.12 | % | | | 1.58 | % | | | 1.19 | % | | | 1.51 | % | | | 35.02 | % |
| $ | 9.58 | | | | 7.41 | % | | $ | 1,144.3 | | | | 1.12 | % | | | 1.34 | % | | | 1.18 | % | | | 1.28 | % | | | 22.54 | % |
| | | | | | | | | | | | | | | | | | | | | | | | | | | | | | |
| $ | 8.70 | | | | 2.44 | %(1) | | $ | 36.7 | | | | 0.97 | %(2) | | | 1.24 | %(2) | | | 1.10 | %(2) | | | 1.11 | %(2) | | | 14.24 | %(1) |
| $ | 8.53 | | | | -8.74 | % | | $ | 33.6 | | | | 0.97 | % | | | 2.02 | % | | | 1.08 | % | | | 1.91 | % | | | 37.66 | % |
| $ | 9.53 | | | | 22.53 | % | | $ | 97.4 | | | | 1.02 | %(9) | | | 1.68 | % | | | 1.17 | %(9) | | | 1.53 | % | | | 23.67 | % |
| $ | 7.93 | | | | 5.59 | %(7) | | $ | — | (8) | | | 0.97 | %(2) | | | 2.14 | %(2) | | | 1.14 | %(2) | | | 1.97 | %(2) | | | 26.48 | %(1) |
The accompanying notes to financial statements are an integral part of these statements.
89
Brandes Investment Trust
FINANCIAL HIGHLIGHTS For a capital share outstanding for the period ended:
| | | | | | | | | | | | | | | | | | | | | | | | |
| | | Net asset
value,
beginning
of period | | | Net
investment
income
(loss)(5) | | | Net realized and
unrealized
gain (loss) on
investments | | | Total from
investment
operations | | | Dividends
from net
investment
income | | | Dividends
from net
realized
gains | |
Brandes International Small Cap Equity Fund | | | | | |
Class A | | | | | | | | | | | | | | | | | | | | | | | | |
3/31/2019 (Unaudited) | | $ | 12.10 | | | | 0.01 | | | | (0.99 | ) | | | (0.98 | ) | | | (0.27 | ) | | | (0.13 | ) |
9/30/2018 | | $ | 14.30 | | | | 0.14 | | | | (1.32 | ) | | | (1.18 | ) | | | (0.54 | ) | | | (0.48 | ) |
9/30/2017 | | $ | 13.46 | | | | 0.14 | | | | 1.32 | | | | 1.46 | | | | (0.34 | ) | | | (0.28 | ) |
9/30/2016 | | $ | 12.58 | | | | 0.09 | | | | 1.22 | | | | 1.31 | | | | (0.23 | ) | | | (0.20 | ) |
9/30/2015 | | $ | 13.55 | | | | 0.04 | | | | (0.43 | ) | | | (0.39 | ) | | | (0.17 | ) | | | (0.41 | ) |
9/30/2014 | | $ | 13.72 | | | | 0.06 | | | | 1.02 | | | | 1.08 | | | | (0.36 | ) | | | (0.89 | ) |
Class C | | | | | | | | | | | | | | | | | | | | | | | | |
3/31/2019 (Unaudited) | | $ | 11.81 | | | | (0.03 | ) | | | (0.97 | ) | | | (1.00 | ) | | | (0.25 | ) | | | (0.13 | ) |
9/30/2018 | | $ | 14.03 | | | | 0.04 | | | | (1.28 | ) | | | (1.24 | ) | | | (0.50 | ) | | | (0.48 | ) |
9/30/2017 | | $ | 13.24 | | | | 0.04 | | | | 1.30 | | | | 1.34 | | | | (0.27 | ) | | | (0.28 | ) |
9/30/2016 | | $ | 12.42 | | | | 0.00 | (9) | | | 1.19 | | | | 1.19 | | | | (0.17 | ) | | | (0.20 | ) |
9/30/2015 | | $ | 13.45 | | | | (0.04 | ) | | | (0.44 | ) | | | (0.48 | ) | | | (0.14 | ) | | | (0.41 | ) |
9/30/2014 | | $ | 13.68 | | | | (0.04 | ) | | | 1.02 | | | | 0.98 | | | | (0.32 | ) | | | (0.89 | ) |
Class I | | | | | | | | | | | | | | | | | | | | | | | | |
3/31/2019 (Unaudited) | | $ | 12.14 | | | | 0.01 | | | | (0.99 | ) | | | (0.98 | ) | | | (0.27 | ) | | | (0.13 | ) |
9/30/2018 | | $ | 14.35 | | | | 0.17 | | | | (1.32 | ) | | | (1.15 | ) | | | (0.58 | ) | | | (0.48 | ) |
9/30/2017 | | $ | 13.50 | | | | 0.17 | | | | 1.32 | | | | 1.49 | | | | (0.36 | ) | | | (0.28 | ) |
9/30/2016 | | $ | 12.61 | | | | 0.12 | | | | 1.22 | | | | 1.34 | | | | (0.25 | ) | | | (0.20 | ) |
9/30/2015 | | $ | 13.58 | | | | 0.08 | | | | (0.44 | ) | | | (0.36 | ) | | | (0.20 | ) | | | (0.41 | ) |
9/30/2014 | | $ | 13.74 | | | | 0.09 | | | | 1.03 | | | | 1.12 | | | | (0.39 | ) | | | (0.89 | ) |
Class R6 | | | | | | | | | | | | | | | | | | | | | | | | |
3/31/2019 (Unaudited) | | $ | 12.15 | | | | 0.03 | | | | (0.99 | ) | | | (0.96 | ) | | | (0.28 | ) | | | (0.13 | ) |
9/30/2018 | | $ | 14.36 | | | | 0.18 | | | | (1.33 | ) | | | (1.15 | ) | | | (0.58 | ) | | | (0.48 | ) |
9/30/2017 | | $ | 13.50 | | | | 0.18 | | | | 1.33 | | | | 1.51 | | | | (0.37 | ) | | | (0.28 | ) |
6/27/2016(3) – 9/30/2016 | | $ | 12.38 | | | | 0.04 | | | | 1.13 | | | | 1.17 | | | | (0.05 | ) | | | — | |
| (3) | Commencement of operations. |
| (4) | After fees waived and expenses absorbed or recouped by the Advisor, where applicable. |
| (5) | Net investment income per share has been calculated based on average shares outstanding during the period. |
| (6) | The total return calculation does not reflect the sales loads that may be imposed on Class A or C shares (see Note 7 of the Notes to Financial Statements). |
| (7) | The total return figure is the since inception return for the class. |
| (8) | Includes expenses not covered by the Trust’s expense limitation agreement. See Note 3 for more information. |
| (9) | Amount is less than $0.01 per share. |
The accompanying notes to financial statements are an integral part of these statements.
90
Brandes Investment Trust
FINANCIAL HIGHLIGHTS For a capital share outstanding for the period ended:
| | | | | | | | | | | | | | | | | | | | | | | | | | | | | | |
Net asset
value, end
of period | | | Total
return(6) | | | Net assets,
end of
period
(millions) | | | Ratio of
net expenses
to average
net assets(4) | | | Ratio of net
investment
income to
average
net assets(4) | | | Ratio of
expenses (prior
to reimburse-
ments) to
average
net assets | | | Ratio of net
investment
income (prior
to reimburse-
ments) to
average
net assets | | | Portfolio
turnover
rate | |
| | | | | | | | | | | | | | | | | | | | | | | | | | | | | | |
| | | | | | | | | | | | | | | | | | | | | | | | | | | | | | |
| $ | 10.72 | | | | -8.01 | %(1) | | $ | 61.7 | | | | 1.36 | %(2) | | | 0.19 | %(2) | | | 1.36 | %(2) | | | 0.19 | %(2) | | | 11.16 | %(1) |
| $ | 12.10 | | | | -8.88 | % | | $ | 80.9 | | | | 1.30 | % | | | 1.05 | % | | | 1.30 | % | | | 1.05 | % | | | 21.97 | % |
| $ | 14.30 | | | | 11.29 | % | | $ | 176.9 | | | | 1.30 | %(8) | | | 1.04 | % | | | 1.30 | %(8) | | | 1.04 | % | | | 21.37 | % |
| $ | 13.46 | | | | 10.60 | % | | $ | 121.1 | | | | 1.32 | % | | | 0.71 | % | | | 1.31 | % | | | 0.72 | % | | | 21.00 | % |
| $ | 12.58 | | | | -2.76 | % | | $ | 79.1 | | | | 1.40 | % | | | 0.35 | % | | | 1.32 | % | | | 0.43 | % | | | 24.82 | % |
| $ | 13.55 | | | | 8.36 | % | | $ | 50.1 | | | | 1.40 | % | | | 0.42 | % | | | 1.39 | % | | | 0.43 | % | | | 24.30 | % |
| | | | | | | | | | | | | | | | | | | | | | | | | | | | | | |
| $ | 10.43 | | | | -8.39 | %(1) | | $ | 9.6 | | | | 2.11 | %(2) | | | (0.56 | )%(2) | | | 2.11 | %(2) | | | (0.56 | )%(2) | | | 11.16 | %(1) |
| $ | 11.81 | | | | -9.55 | % | | $ | 14.5 | | | | 2.05 | % | | | 0.30 | % | | | 2.05 | % | | | 0.30 | % | | | 21.97 | % |
| $ | 14.03 | | | | 10.52 | % | | $ | 27.2 | | | | 2.05 | %(8) | | | 0.29 | % | | | 2.05 | %(8) | | | 0.29 | % | | | 21.37 | % |
| $ | 13.24 | | | | 9.78 | % | | $ | 19.8 | | | | 2.06 | % | | | (0.03 | )% | | | 2.06 | % | | | (0.03 | )% | | | 21.00 | % |
| $ | 12.42 | | | | -3.49 | % | | $ | 15.1 | | | | 2.07 | % | | | (0.34 | )% | | | 2.07 | % | | | (0.34 | )% | | | 24.82 | % |
| $ | 13.45 | | | | 7.60 | % | | $ | 12.3 | | | | 2.14 | % | | | (0.32 | )% | | | 2.14 | % | | | (0.32 | )% | | | 24.30 | % |
| | | | | | | | | | | | | | | | | | | | | | | | | | | | | | |
| $ | 10.76 | | | | -7.93 | %(1) | | $ | 530.2 | | | | 1.15 | %(2) | | | 0.40 | %(2) | | | 1.15 | %(2) | | | 0.40 | %(2) | | | 11.16 | %(1) |
| $ | 12.14 | | | | -8.70 | % | | $ | 963.8 | | | | 1.10 | % | | | 1.25 | % | | | 1.10 | % | | | 1.25 | % | | | 21.97 | % |
| $ | 14.35 | | | | 11.54 | % | | $ | 1,543.9 | | | | 1.10 | %(8) | | | 1.24 | % | | | 1.10 | %(8) | | | 1.24 | % | | | 21.37 | % |
| $ | 13.50 | | | | 10.85 | % | | $ | 1,212.4 | | | | 1.13 | % | | | 0.90 | % | | | 1.11 | % | | | 0.92 | % | | | 21.00 | % |
| $ | 12.61 | | | | -2.58 | % | | $ | 877.6 | | | | 1.15 | % | | | 0.59 | % | | | 1.12 | % | | | 0.62 | % | | | 24.82 | % |
| $ | 13.58 | | | | 8.67 | % | | $ | 567.9 | | | | 1.15 | % | | | 0.67 | % | | | 1.18 | % | | | 0.64 | % | | | 24.30 | % |
| | | | | | | | | | | | | | | | | | | | | | | | | | | | | | |
| $ | 10.78 | | | | -7.83 | %(1) | | $ | 61.9 | | | | 1.00 | %(2) | | | 0.55 | %(2) | | | 1.11 | %(2) | | | 0.44 | %(2) | | | 11.16 | %(1) |
| $ | 12.15 | | | | -8.64 | % | | $ | 72.5 | | | | 1.00 | % | | | 1.35 | % | | | 1.05 | % | | | 1.30 | % | | | 21.97 | % |
| $ | 14.36 | | | | 11.67 | % | | $ | 76.1 | | | | 1.01 | %(8) | | | 1.33 | % | | | 1.05 | %(8) | | | 1.29 | % | | | 21.37 | % |
| $ | 13.50 | | | | 9.49 | %(7) | | $ | 16.5 | | | | 1.00 | %(2) | | | 1.03 | %(2) | | | 1.06 | %(2) | | | 0.97 | %(2) | | | 21.00 | %(1) |
The accompanying notes to financial statements are an integral part of these statements.
91
Brandes Investment Trust
FINANCIAL HIGHLIGHTS For a capital share outstanding for the period ended:
| | | | | | | | | | | | | | | | | | | | | | | | |
| | | Net asset
value,
beginning
of period | | | Net
investment
income(5) | | | Net realized and
unrealized
gain (loss) on
investments | | | Total from
investment
operations | | | Dividends
from net
investment
income | | | Dividends
from net
realized
gains | |
Brandes Small Cap Value Fund | | | | | |
Class A | | | | | | | | | | | | | | | | | | | | | | | | |
3/31/2019 (Unaudited) | | $ | 10.27 | | | | 0.03 | | | | (0.90 | ) | | | (0.87 | ) | | | (0.04 | ) | | | (0.69 | ) |
1/2/2018(3) – 9/30/2018 | | $ | 10.00 | | | | 0.02 | | | | 0.27 | | | | 0.29 | | | | (0.02 | ) | | | — | |
Class I | | | | | | | | | | | | | | | | | | | | | | | | |
3/31/2019 (Unaudited) | | $ | 10.27 | | | | 0.04 | | | | (0.89 | ) | | | (0.85 | ) | | | (0.05 | ) | | | (0.69 | ) |
1/2/2018(3) – 9/30/2018 | | $ | 10.00 | | | | 0.04 | | | | 0.27 | | | | 0.31 | | | | (0.04 | ) | | | — | |
Class R6 | | | | | | | | | | | | | | | | | | | | | | | | |
3/31/2019 (Unaudited) | | $ | 10.32 | | | | 0.05 | | | | (0.90 | ) | | | (0.85 | ) | | | (0.05 | ) | | | (0.69 | ) |
1/2/2018(3) – 9/30/2018 | | $ | 10.00 | | | | 0.05 | | | | 0.31 | | | | 0.36 | | | | (0.04 | ) | | | — | |
| |
Brandes Core Plus Fixed Income Fund | | | | | |
Class A | | | | | | | | | | | | | | | | | | | | | | | | |
3/31/2019 (Unaudited) | | $ | 8.85 | | | | 0.12 | | | | 0.15 | | | | 0.27 | | | | (0.12 | ) | | | — | |
9/30/2018 | | $ | 9.18 | | | | 0.23 | | | | (0.33 | ) | | | (0.10 | ) | | | (0.23 | ) | | | — | |
9/30/2017 | | $ | 9.39 | | | | 0.20 | | | | (0.18 | ) | | | 0.02 | | | | (0.21 | ) | | | (0.02 | ) |
9/30/2016 | | $ | 9.14 | | | | 0.22 | | | | 0.26 | | | | 0.48 | | | | (0.22 | ) | | | (0.01 | ) |
9/30/2015 | | $ | 9.22 | | | | 0.19 | | | | (0.02 | ) | | | 0.17 | | | | (0.20 | ) | | | (0.05 | ) |
9/30/2014 | | $ | 9.16 | | | | 0.25 | | | | 0.06 | | | | 0.31 | | | | (0.24 | ) | | | (0.01 | ) |
Class I | | | | | | | | | | | | | | | | | | | | | | | | |
3/31/2019 (Unaudited) | | $ | 8.92 | | | | 0.13 | | | | 0.16 | | | | 0.29 | | | | (0.13 | ) | | | — | |
9/30/2018 | | $ | 9.25 | | | | 0.25 | | | | (0.33 | ) | | | (0.08 | ) | | | (0.25 | ) | | | — | |
9/30/2017 | | $ | 9.44 | | | | 0.22 | | | | (0.16 | ) | | | 0.06 | | | | (0.23 | ) | | | (0.02 | ) |
9/30/2016 | | $ | 9.20 | | | | 0.24 | | | | 0.25 | | | | 0.49 | | | | (0.24 | ) | | | (0.01 | ) |
9/30/2015 | | $ | 9.28 | | | | 0.21 | | | | (0.02 | ) | | | 0.19 | | | | (0.22 | ) | | | (0.05 | ) |
9/30/2014 | | $ | 9.19 | | | | 0.27 | | | | 0.10 | | | | 0.37 | | | | (0.27 | ) | | | (0.01 | ) |
Class R6 | | | | | | | | | | | | | | | | | | | | | | | | |
3/31/2019 (Unaudited) | | $ | 8.93 | | | | 0.09 | | | | 0.23 | | | | 0.32 | | | | (0.16 | ) | | | — | |
10/10/2017(3) – 9/30/2018 | | $ | 9.25 | | | | 0.06 | | | | (0.06 | ) | | | — | | | | (0.32 | ) | | | — | |
| (3) | Commencement of operations. |
| (4) | After fees waived and expenses absorbed or recouped by the Advisor, where applicable. |
| (5) | Net investment income per share has been calculated based on average shares outstanding during the period. |
| (6) | The total return calculation does not reflect the sales loads that may be imposed on Class A shares (see Note 7 of the Notes to Financial Statements). |
| (7) | The total return figure is the since inception return for the class. |
| (8) | Includes expenses not covered by the Trust’s expense limitation agreement. See Note 3 for more information. |
| (9) | Amount is less than $50,000. |
The accompanying notes to financial statements are an integral part of these statements.
92
Brandes Investment Trust
FINANCIAL HIGHLIGHTS For a capital share outstanding for the period ended:
| | | | | | | | | | | | | | | | | | | | | | | | | | | | | | |
Net asset
value, end
of period | | | Total
return(6) | | | Net assets,
end of
period
(millions) | | | Ratio of
net expenses
to average
net assets(4) | | | Ratio of net
investment
income to
average
net assets(4) | | | Ratio of expenses (prior
to reimburse-
ments) to
average net assets | | | Ratio of net
investment
income (prior
to reimburse-
ments) to
average
net assets | | | Portfolio
turnover
rate | |
| | | | | | | | | | | | | | | | | | | | | | | | | | | | | | |
| | | | | | | | | | | | | | | | | | | | | | | | | | | | | | |
| $ | 8.67 | | | | -8.29 | %(1) | | $ | — | (9) | | | 1.15 | %(2) | | | 0.58 | %(2) | | | 3.21 | %(2) | | | (1.48 | )%(2) | | | 22.76 | %(1) |
| $ | 10.27 | | | | 2.92 | %(7) | | $ | 0.1 | | | | 1.15 | %(2) | | | 0.28 | %(2) | | | 3.21 | %(2) | | | (1.78 | )%(2) | | | 41.02 | %(1) |
| | | | | | | | | | | | | | | | | | | | | | | | | | | | | | |
| $ | 8.68 | | | | -8.13 | %(1) | | $ | 5.0 | | | | 0.90 | %(2) | | | 0.85 | %(2) | | | 3.06 | %(2) | | | (1.31 | )%(2) | | | 22.76 | %(1) |
| $ | 10.27 | | | | 3.09 | %(7) | | $ | 5.4 | | | | 0.90 | %(2) | | | 0.53 | %(2) | | | 3.67 | %(2) | | | (2.24 | )%(2) | | | 41.02 | %(1) |
| | | | | | | | | | | | | | | | | | | | | | | | | | | | | | |
| $ | 8.73 | | | | -8.07 | %(1) | | $ | 4.0 | | | | 0.72 | %(2) | | | 1.03 | %(2) | | | 3.01 | %(2) | | | (1.26 | )%(2) | | | 22.76 | %(1) |
| $ | 10.32 | | | | 3.63 | %(7) | | $ | 4.8 | | | | 0.72 | %(2) | | | 0.71 | %(2) | | | 2.99 | %(2) | | | (1.56 | )%(2) | | | 41.02 | %(1) |
| | | | | | | |
| | | | | | | | | | | | | | | | | | | | | | | | | | | | | | |
| | | | | | | | | | | | | | | | | | | | | | | | | | | | | | |
| $ | 9.00 | | | | 3.14 | %(1) | | $ | 2.0 | | | | 0.70 | %(2) | | | 2.82 | %(2) | | | 0.94 | %(2) | | | 2.58 | %(2) | | | 4.37 | %(1) |
| $ | 8.85 | | | | -1.08 | % | | $ | 1.8 | | | | 0.70 | % | | | 2.57 | % | | | 0.87 | % | | | 2.40 | % | | | 47.73 | % |
| $ | 9.18 | | | | 0.28 | % | | $ | 3.3 | | | | 0.71 | %(8) | | | 2.25 | % | | | 0.85 | %(8) | | | 2.11 | % | | | 35.10 | % |
| $ | 9.39 | | | | 5.32 | % | | $ | 2.0 | | | | 0.70 | % | | | 2.38 | % | | | 0.93 | % | | | 2.15 | % | | | 35.88 | % |
| $ | 9.14 | | | | 1.78 | % | | $ | 2.1 | | | | 0.70 | % | | | 2.07 | % | | | 1.06 | % | | | 1.71 | % | | | 11.24 | % |
| $ | 9.22 | | | | 3.52 | % | | $ | 2.1 | | | | 0.70 | % | | | 2.68 | % | | | 1.33 | % | | | 2.05 | % | | | 18.63 | % |
| | | | | | | | | | | | | | | | | | | | | | | | | | | | | | |
| $ | 9.08 | | | | 3.34 | %(1) | | $ | 79.5 | | | | 0.50 | %(2) | | | 3.01 | %(2) | | | 0.74 | %(2) | | | 2.77 | %(2) | | | 4.37 | %(1) |
| $ | 8.92 | | | | -0.85 | % | | $ | 89.7 | | | | 0.50 | % | | | 2.78 | % | | | 0.68 | % | | | 2.60 | % | | | 47.73 | % |
| $ | 9.25 | | | | 0.71 | % | | $ | 97.9 | | | | 0.51 | %(8) | | | 2.45 | % | | | 0.66 | %(8) | | | 2.30 | % | | | 35.10 | % |
| $ | 9.44 | | | | 5.43 | % | | $ | 97.2 | | | | 0.50 | % | | | 2.58 | % | | | 0.72 | % | | | 2.36 | % | | | 35.88 | % |
| $ | 9.20 | | | | 2.02 | % | | $ | 72.1 | | | | 0.50 | % | | | 2.26 | % | | | 0.86 | % | | | 1.90 | % | | | 11.24 | % |
| $ | 9.28 | | | | 4.10 | % | | $ | 43.3 | | | | 0.50 | % | | | 2.88 | % | | | 1.20 | % | | | 2.18 | % | | | 18.63 | % |
| | | | | | | | | | | | | | | | | | | | | | | | | | | | | | |
| $ | 9.09 | | | | 3.64 | %(1) | | $ | — | (9) | | | 0.35 | %(2) | | | 1.99 | %(2) | | | 0.35 | %(2) | | | 1.99 | %(2) | | | 4.37 | %(1) |
| $ | 8.93 | | | | 0.04 | %(7) | | $ | — | (9) | | | 0.35 | %(2) | | | 0.69 | %(2) | | | 0.35 | %(2) | | | 0.69 | %(2) | | | 47.73 | % |
The accompanying notes to financial statements are an integral part of these statements.
93
Brandes Investment Trust
NOTES TO FINANCIAL STATEMENTS
NOTE 1 – ORGANIZATION
The Brandes International Equity Fund (the “International Fund”), the Brandes Global Equity Fund (the “Global Fund”), the Brandes Global Equity Income Fund (the “Global Income Fund”), the Brandes Global Opportunities Value Fund (the “Global Opportunities Fund”), the Brandes Emerging Markets Value Fund (the “Emerging Markets Fund”), the Brandes International Small Cap Equity Fund (the “International Small Cap Fund”), the Brandes Small Cap Value Fund (the “Small Cap Value Fund”) and the Brandes Core Plus Fixed Income Fund (the “Core Plus Fund”) (each a “Fund” and collectively the “Funds”) are series of Brandes Investment Trust (the “Trust”). The Trust is registered under the Investment Company Act of 1940 (the “1940 Act”) as a diversified, open-end management investment company.
The International Fund, Global Fund, Global Income Fund, Global Opportunities Fund, Emerging Markets Fund, International Small Cap Fund, Small Cap Value Fund and Core Plus Fund began operations on January 2, 1997, October 6, 2008, December 31, 2014, December 31, 2014, January 31, 2011, February 1, 2012, January 2, 2018 and December 28, 2007, respectively. Prior to January 31, 2011 for the Emerging Markets Fund, February 1, 2012 for the International Small Cap and January 2, 2018 for the Small Cap Value Fund, these Funds’ portfolios were managed as private investment funds with investment objectives, investment policies and strategies that were, in all material respects, equivalent to those of the Emerging Markets Fund, International Small Cap Fund and Small Cap Value Fund, respectively.
The International Fund has four classes of shares: Class A, Class C, Class I and Class R6. The Global Fund, the Global Income Fund and Global Opportunities Fund have three classes of shares: Class A, Class C and Class I. The Emerging Markets Fund and International Small Cap Fund have four classes of shares: Class A, Class C, Class I and Class R6. The Small Cap Value Fund and Core Plus Fund have three classes of shares: Class A, Class I and Class R6.
The International Fund and Global Fund invest their assets primarily in equity securities of issuers with market capitalizations greater than $1 billion. The International, International Small Cap and Emerging Markets Funds invest their assets in securities of foreign companies, while the Global Fund, Global Income Fund and Global Opportunities Fund invest their assets in securities of foreign and domestic companies. The Small Cap Value Fund invests primarily in U.S. equity securities of issuers with market capitalizations less than $5 billion. The Core Plus Fund invests predominantly in debt securities issued by U.S. and foreign companies and debt obligations issued or guaranteed by the U.S. Government and foreign governments and their agencies and instrumentalities.
94
Brandes Investment Trust
NOTES TO FINANCIAL STATEMENTS — (continued)
NOTE 2 – SIGNIFICANT ACCOUNTING POLICIES
Each Fund is an investment company that applies the accounting and reporting guidance issued in Topic 946, “Financial Services-Investment Companies”, by the Financial Accounting Standards Board (“FASB”). The following is a summary of significant accounting policies consistently followed by the Funds. These policies are in conformity with generally accepted accounting principles (“GAAP”) in the United States of America.
| | A. | Repurchase Agreements. Each Fund may enter into repurchase agreements with government securities dealers recognized by the Federal Reserve Board, with member banks of the Federal Reserve System or with other brokers or dealers that meet the credit guidelines established by the Board of Trustees. Each Fund will always receive and maintain, as collateral, U.S. Government securities whose market value, including accrued interest (which is recorded in the Schedules of Investments), will be at least equal to 100% of the dollar amount invested by the Fund in each agreement, and the Fund will make payment for such securities only upon physical delivery or upon evidence of book entry transfer to the account of the Fund’s custodian. If the term of any repurchase transaction exceeds one business day, the value of the collateral is marked-to-market on a daily basis to ensure the adequacy of the collateral. Before causing a Fund to enter into a repurchase agreement with any other party, the investment advisor will determine that such party does not have any apparent risk of becoming involved in bankruptcy proceedings within the time frame contemplated by the repurchase agreement. If the seller defaults and the value of the collateral declines, or if bankruptcy proceedings are commenced with respect to the seller of the security, realization of the collateral by the Fund may be delayed or limited. At March 31, 2019, the Funds’ ongoing exposure to the economic return on repurchase agreements is shown on the Schedules of Investments. |
| | B. | Foreign Currency Translation and Transactions. Values of investments denominated in foreign currencies are converted into U.S. dollars using the spot market rates of exchange at the time of valuation. Purchases and sales of investments and dividend and interest income are translated into U.S. dollars using the spot market rates of exchange prevailing on the respective dates of such translations. The gain or loss resulting from changes in foreign exchange rates is included with net realized and unrealized gain or loss from investments, as appropriate. Foreign securities and currency transactions may involve certain considerations and risks not typically associated with those of domestic origin. |
Foreign securities are recorded in the financial statements after translation to U.S. dollars based on the applicable exchange rate at the end of the period. The Funds report certain foreign currency-related transactions as
95
Brandes Investment Trust
NOTES TO FINANCIAL STATEMENTS — (continued)
components of realized gains or losses for financial reporting purposes, whereas such components are treated as ordinary income for federal income tax purposes.
| | C. | Delayed Delivery Securities. The Funds may purchase securities on a when issued or delayed delivery basis. “When-issued” or delayed delivery refers to securities whose terms are available and for which a market exists, but that have not been issued. For a when-issued or delayed delivery transaction, no payment is made until delivery date, which is typically longer than the normal course of settlement. When a Fund enters into an agreement to purchase securities on a when-issued or delayed delivery basis, the Fund segregates cash or liquid securities, of any type or maturity, equal in value to the Fund’s commitment. Losses may arise if the market value of the underlying securities change, if the counterparty does not perform under the contract, or if the issuer does not issue the securities due to political, economic, or other factors. The Funds did not have any open commitments on delayed delivery securities as of March 31, 2019. |
| | D. | Participatory Notes. The International, Global, Global Income, Global Opportunities, Emerging Markets, International Small Cap and Small Cap Value Funds may invest in participatory notes. Participatory notes are derivative securities which are designed to provide synthetic exposure to one or more underlying securities, subject to the credit risk of the issuing financial institution. |
Investments in participatory notes involve risks normally associated with a direct investment in the underlying securities. In addition, participatory notes are subject to counterparty risk, which is the risk that the broker-dealer or bank that issues the notes will not fulfill its contractual obligation to complete the transaction with the Trust. Participatory notes constitute general unsecured, unsubordinated contractual obligations of the banks or broker-dealers that issue them and generally are issued as an actual note from the financial intermediary or an equity linked warrant (commonly known as a low exercise price option). The Trust is relying on the creditworthiness of such banks or broker-dealers and has no rights under a participatory note against the issuer of the securities underlying such participatory note. The investment advisor has established guidelines for monitoring participatory note exposure for the Funds. Prior to investment in a participatory note, the investment advisor will complete an analysis of the prospective counterparties and once purchased, will continue to monitor creditworthiness on a quarterly basis. The investment advisor requires a minimum credit rating for such counterparties (as determined by rating agencies such as Moody’s, Fitch and S&P) of A.
96
Brandes Investment Trust
NOTES TO FINANCIAL STATEMENTS — (continued)
The Funds record counterparty credit risk valuation adjustments, if material, on the participatory notes in order to appropriately reflect the credit quality of the counterparty.
The International, Global, Global Income, Global Opportunities, International Small Cap and Small Cap Value Funds did not invest in any participatory notes at March 31, 2019. The Emerging Markets Fund invested in one participatory note with HSBC Bank Plc in which HSBC Bank Plc is an investment vehicle used to gain exposure to the underlying security of China South Publishing & Media Group Co. Ltd. China South Publishing & Media Group Co. Ltd. was held from the beginning of the fiscal year through the end of the period. The average monthly market value of this security was $14,623,693 during the period. As a result of the investment in the participatory note, the Emerging Markets Fund did not recognize a realized gain (loss). The market value of China South Publishing & Media Group Co. Ltd. on March 31, 2019 was $15,221,587 and can be found in the Emerging Market Fund’s Schedule of Investments.
| | E. | Investment Transactions, Dividends and Distributions. Investment transactions are accounted for on the trade dates. Realized gains and losses are evaluated on the basis of identified costs. Dividend income and distributions to shareholders are recorded on the ex-dividend dates. Interest is recorded on an accrual basis. Withholding taxes on foreign dividends and capital gains, which are included as a component of net investment income and realized gain (loss) on investments, respectively, have been provided for in accordance with the Trust’s understanding of the applicable country’s tax rules and rates. Each Fund’s investment income, expenses, other than class specific expenses, and realized and unrealized gains and losses are allocated daily to each class of the Fund’s shares based upon the relative net asset values of outstanding shares of each class of shares at the beginning of the day (after adjusting for the current capital shares activity of the respective class). Expenses common to the Funds’ portfolios are allocated among the Funds based upon their relative net asset values or other appropriate allocation methods. The Funds amortize premiums and accrete discounts using the constant yield method. |
| | F. | Concentration of Risk. As of March 31, 2019, the International, Global, Global Income, Global Opportunities, Emerging Markets and International Small Cap Funds held significant portions of their assets in foreign securities. Certain price and foreign exchange fluctuations as well as economic and political situations in the foreign jurisdictions could have an impact on the International, Global, Global Income, Global Opportunities, Emerging Markets and International Small Cap Funds’ net assets. The investment advisor monitors these off-balance sheet risks. |
97
Brandes Investment Trust
NOTES TO FINANCIAL STATEMENTS — (continued)
| | G. | Use of Estimates. The preparation of financial statements in conformity with GAAP requires management to make estimates and assumptions that affect the reported amounts of assets and liabilities at the date of the financial statements and reported amounts of income and expenses during the reporting period. Actual results could differ from those estimates and assumptions. |
| | H. | Securities Lending. The Funds may lend their portfolio securities to banks, brokers and dealers. Lending Fund securities exposes the Fund to risks such as the following: (i) the borrower may fail to return the loaned securities, (ii) the borrower may not be able to provide additional collateral, or (iii) the Funds may experience delays in recovery of the loaned securities or loss of rights in the collateral if the borrower fails financially. |
To minimize these risks, the borrower must agree to maintain collateral with the Fund’s custodian, marked to market daily, in the form of U.S. Government obligations, in an amount at least equal to 102% (105% in the case of loans of foreign securities not denominated in U.S. dollars) of the market value of the loaned securities. As of March 31, 2019, the International Fund, Global Fund, Global Income Fund, Global Opportunities Fund, Emerging Markets Fund, Small Cap Value Fund and Core Plus Fund did not have any securities on loan. The International Small Cap Fund had a market value of a security loaned of $1,516,541 and received non-cash collateral for the loan of $1,563,750. Non-cash collateral received by the Fund may not be sold or re-pledged except to satisfy a borrower default. Therefore, non-cash collateral is not included on the Fund’s Schedules of Investments or Statements of Assets and Liabilities.
| | I. | Indemnification Obligations. Under the Trust’s organizational documents, its current and former officers and trustees are indemnified against certain liabilities arising out of the performance of their duties to the Trust. The Trust has indemnified its trustees against any expenses actually and reasonably incurred by the trustees in any proceeding arising out of or in connection with the trustees’ service to the Trust. In addition, in the normal course of business, the Trust enters into contracts that contain a variety of representations and warranties and provide general indemnifications. The Funds’ maximum exposure under these arrangements is unknown as this would involve future claims that may be made against the Funds that have not yet occurred or that would be covered by other parties. |
| | J. | Accounting for Uncertainty in Income Taxes. Each Fund has elected to be taxed as a “regulated investment company” and intends to distribute substantially all its taxable income to its shareholders and otherwise comply with the provisions of the Internal Revenue Code applicable to regulated investment companies. The Funds may be subject to a nondeductible excise |
98
Brandes Investment Trust
NOTES TO FINANCIAL STATEMENTS — (continued)
| | tax calculated as a percentage of certain undistributed amounts of net investment income and net capital gains. The Funds intend to distribute their net investment income and capital gains as necessary to avoid this excise tax. Therefore, no provision for federal income taxes or excise taxes has been made. |
The Trust analyzes all open tax years, as defined by the applicable statute of limitations, for all major jurisdictions. Open tax years for the Funds are those that are open for exam by taxing authorities (2015 through 2018). As of March 31, 2019 the Trust has no examinations in progress.
Management has analyzed the Trust’s tax positions, and has concluded that no liability should be recorded related to uncertain tax positions expected to be taken on the tax return for the fiscal year-ended September 30, 2018.
The Trust identifies its major tax jurisdictions as the U.S. Government and the State of California. The Funds are not aware of any tax positions for which it is reasonably possible that the total amounts of unrecognized tax benefits will significantly change in the next twelve months.
| | K. | Fair Value Measurements. The Trust has adopted GAAP accounting principles related to fair value accounting standards which establish a definition of fair value and set out a hierarchy for measuring fair value. These standards require additional disclosures about the various inputs and valuation techniques used to develop the measurements of fair value and a discussion of changes in valuation techniques and related inputs during the period. These inputs are summarized in the three broad levels listed below: |
Level 1 — Fair value measurement within Level 1 should be based on an unadjusted quoted price in an active market that the Funds have the ability to access for the asset or liability at the measurement date. Because a quoted price alone forms the basis for the measurement, the access requirement within Level 1 limits discretion in pricing the asset or liability, including in situations in which there are multiple markets for the asset or liability with different prices and no single market represents a principal market for the asset or liability. Importantly, the Financial Accounting Standards Board has indicated that when a quoted price in an active market for a security is available, that price should be used to measure fair value without regard to an entity’s intent to transact at that price.
Level 2 — Fair value measurement within Level 2 should be based on all inputs other than unadjusted quoted prices included within Level 1 that are observable for the asset or liability. Other significant observable market inputs include quoted prices for similar instruments in active markets, quoted adjusted prices in active markets, quoted prices for
99
Brandes Investment Trust
NOTES TO FINANCIAL STATEMENTS — (continued)
identical or similar instruments in markets that are not active, and model-derived valuations in which the majority of significant inputs and significant value drivers are observable in active markets.
Level 3 — Fair value measurement within Level 3 should be based on unobservable inputs in such cases where markets do not exist or are illiquid. Significant unobservable inputs include model derived valuations in which the majority of significant inputs or significant value drivers are unobservable. Unobservable inputs are those inputs that reflect the Fund’s own assumptions that market participants would use to price the asset or liability based on the best available information.
| | L. | Security Valuation. Common and preferred stocks, exchange-traded funds and financial derivative instruments, such as futures contracts and options contracts that are traded on a national securities or commodities exchange, are valued at the last reported sales price at the close of regular trading on each day the exchange is open for trading, in the case of common stocks and exchange-traded funds, or, in the case of futures contracts or options contracts, the settlement price determined by the relevant exchange. Securities listed on the NASDAQ National Market System for which market quotations are readily available are valued using the NASDAQ Official Closing Price. To the extent these securities are actively traded and valuation adjustments are not applied, they are categorized as Level 1 of the fair value hierarchy. |
Equity securities traded on an exchange for which there have been no sales on the valuation date are generally valued at the mean between last bid and ask price on such day and are categorized as Level 2 of the fair value hierarchy, or are fair valued by the Valuation Committee.
Investments in registered open-end management investment companies are valued based upon the Net Asset Values (“NAVs”) of such investments and are categorized as Level 1 of the fair value hierarchy.
Valuation adjustments may be applied to certain common and preferred stocks that are solely traded on a foreign exchange to account for the market movement between the close of the foreign market and the close of the New York Stock Exchange (“NYSE”). These securities are generally valued using pricing service providers that consider the correlation of the trading patterns of the foreign securities to the intraday trading in the U.S. markets for investments. Securities using these valuation adjustments are categorized as Level 2 of the fair value hierarchy. As of March 31, 2019, the International Fund, Global Fund, Global Income Fund, Global Opportunities Fund, Emerging Markets Fund and International Small Cap Fund had securities with market values of$616,170,423, $27,004,200, $749,526, $4,863,168, $673,688,789 and $325,804,004 that represent
100
Brandes Investment Trust
NOTES TO FINANCIAL STATEMENTS — (continued)
76.95%, 57.47%, 56.20%, 47.40%, 45.83% and 49.11% of each Fund’s net assets, respectively, that were fair valued using these valuation adjustments.
Fixed income securities (other than repurchase agreements and demand notes) including corporate, convertible and municipal bonds and notes, U.S. government agencies, U.S. Treasury obligations, sovereign issues, bank loans, convertible preferred securities, fixed income securities purchased on a delayed delivery basis and non-U.S. bonds are normally valued on the basis of quotes obtained from brokers and dealers or independent pricing services or sources. Independent pricing services typically use information provided by market makers or estimates of market values obtained from yield data relating to investments or securities with similar characteristics. The service providers’ internal models use inputs that are observable such as, among other things, issuer details, interest rates, yield curves, prepayment speeds, credit risks/spreads, default rates and quoted prices for similar assets. Securities that use similar valuation techniques and inputs as described above are categorized as Level 2 of the fair value hierarchy.
Rights that are traded on a national securities exchange are valued at the last reported sales price at the close of regular trading on each day the exchange is open. A right is a privilege offered by a corporation to its shareholders pro rata to subscribe to a certain security at a specified price, often for a short period. Rights may or may not be transferable.
The Funds may enter into mortgage dollar roll transactions in which the Funds sell a mortgage-backed security to a counterparty and simultaneously enter into an agreement with the same counterparty to buy back a similar security on a specific future date at a predetermined price. Risks may arise due to the delayed payment date and the potential inability of counterparties to complete the transaction. Mortgage dollar rolls are accounted for as purchase and sale transactions, which may increase a Fund’s portfolio turnover rate.
Mortgage and asset-backed securities are usually issued as separate tranches, or classes, of securities within each package of underlying securities. These securities are also normally valued by pricing service providers that use broker-dealer quotations or valuation estimates from their internal pricing models. The pricing models for these securities usually consider tranche level attributes, estimated cash flows and market-based yield spreads for each tranche, and current market data and incorporate packaged collateral performance, as available. Mortgage and asset-backed securities that use such valuation techniques and inputs are categorized as Level 2 of the fair value hierarchy.
101
Brandes Investment Trust
NOTES TO FINANCIAL STATEMENTS — (continued)
Repurchase agreements and demand notes, for which neither vendor pricing nor market maker prices are available, are valued at amortized cost on the day of valuation, unless Brandes Investment Partners, L.P. (the “Advisor”) determines that the use of amortized cost valuation on such day is not appropriate (in which case such instrument is fair valued in accordance with the fair value procedures of the Trust).
Certain securities may be fair valued in accordance with the fair valuation procedures approved by the Board of Trustees. The Valuation Committee is generally responsible for overseeing the day-to-day valuation processes and reports periodically to the Board. The Valuation Committee is authorized to make all necessary determinations of the fair value of portfolio securities and other assets for which market quotations are not readily available or if it is deemed that the prices obtained from brokers and dealers or independent pricing services are unreliable. The securities fair valued by the Valuation Committee are indicated in the Schedules of Investments and are categorized as Level 2 or Level 3 of the fair value hierarchy. Certain vendor priced securities may also be considered Level 3 if significant unobservable inputs are used by the vendors.
In using fair value pricing, each Fund attempts to establish the price that it might reasonably have expected to receive upon a sale of the security at 4:00 p.m. Eastern time. Valuing securities at fair value involves greater reliance on judgment than valuation of securities based on readily available market quotations. A Fund using fair value to price securities may value those securities higher or lower than another fund using market quotations or fair value to price the same securities. Further, there can be no assurance that the Fund could obtain the fair value assigned to a security if it were to sell the security at approximately the time at which the Fund determines its net asset value.
The following is a summary of the level inputs used, as of March 31, 2019, involving the Funds’ assets carried at fair value. The inputs used for valuing securities may not be an indication of the risk associated with investing in those securities.
102
Brandes Investment Trust
NOTES TO FINANCIAL STATEMENTS — (continued)
| | | | | | | | | | | | | | | | |
Description | | Level 1 | | | Level 2 | | | Level 3 | | | Total | |
Investments in Securities | | | | | | | | | | | | | | | | |
International Fund | | | | | | | | | | | | | | | | |
Common Stocks | | | | | | | | | | | | | | | | |
Communication Services | | $ | — | | | $ | 69,260,636 | | | $ | — | | | $ | 69,260,636 | |
Consumer Discretionary | | | — | | | | 100,008,453 | | | | — | | | | 100,008,453 | |
Consumer Staples | | | 19,696,592 | | | | 54,679,973 | | | | — | | | | 74,376,565 | |
Energy | | | — | | | | 48,723,522 | | | | — | | | | 48,723,522 | |
Financials | | | — | | | | 137,490,923 | | | | — | | | | 137,490,923 | |
Health Care | | | — | | | | 95,755,768 | | | | — | | | | 95,755,768 | |
Industrials | | | 14,227,065 | | | | 53,678,182 | | | | — | | | | 67,905,247 | |
Information Technology | | | 8,622,091 | | | | 23,255,876 | | | | — | | | | 31,877,967 | |
Materials | | | 12,159,644 | | | | 25,167,852 | | | | — | | | | 37,327,496 | |
Real Estate | | | 20,635,696 | | | | — | | | | — | | | | 20,635,696 | |
Utilities | | | — | | | | 18,197,683 | | | | — | | | | 18,197,683 | |
| | | | | | | | | | | | | | | | |
Total Common Stocks | | | 75,341,088 | | | | 626,218,868 | | | | — | | | | 701,559,956 | |
| | | | | | | | | | | | | | | | |
Preferred Stocks | | | | | | | | | | | | | | | | |
Communication Services | | | 7,310,585 | | | | — | | | | — | | | | 7,310,585 | |
Energy | | | 7,309,076 | | | | 11,921,417 | | | | — | | | | 19,230,493 | |
| | | | | | | | | | | | | | | | |
Total Preferred Stocks | | | 14,619,661 | | | | 11,921,417 | | | | — | | | | 26,541,078 | |
| | | | | | | | | | | | | | | | |
Repurchase Agreements | | | — | | | | 62,304,599 | | | | — | | | | 62,304,599 | |
| | | | | | | | | | | | | | | | |
Total Investments in Securities | | $ | 89,960,749 | | | $ | 700,444,884 | | | $ | — | | | $ | 790,405,633 | |
| | | | | | | | | | | | | | | | |
| | | | |
Global Fund | | | | | | | | | | | | | | | | |
Common Stocks | | | | | | | | | | | | | | | | |
Communication Services | | $ | — | | | $ | 1,879,843 | | | $ | — | | | $ | 1,879,843 | |
Consumer Discretionary | | | — | | | | 5,977,043 | | | | — | | | | 5,977,043 | |
Consumer Staples | | | 930,975 | | | | 3,700,249 | | | | — | | | | 4,631,224 | |
Energy | | | 353,809 | | | | 4,192,902 | | | | — | | | | 4,546,711 | |
Financials | | | 6,940,453 | | | | 3,708,682 | | | | — | | | | 10,649,135 | |
Health Care | | | 6,258,993 | | | | 3,427,044 | | | | — | | | | 9,686,037 | |
Industrials | | | 1,644,975 | | | | 1,125,532 | | | | — | | | | 2,770,507 | |
Information Technology | | | 917,755 | | | | 1,522,529 | | | | — | | | | 2,440,284 | |
Materials | | | — | | | | 557,043 | | | | — | | | | 557,043 | |
Real Estate | | | 937,247 | | | | — | | | | — | | | | 937,247 | |
Utilities | | | — | | | | 1,242,753 | | | | — | | | | 1,242,753 | |
| | | | | | | | | | | | | | | | |
Total Common Stocks | | | 17,984,207 | | | | 27,333,620 | | | | — | | | | 45,317,827 | |
| | | | | | | | | | | | | | | | |
Preferred Stocks | | | | | | | | | | | | | | | | |
Information Technology | | | — | | | | 138,680 | | | | — | | | | 138,680 | |
| | | | | | | | | | | | | | | | |
Total Preferred Stocks | | | — | | | | 138,680 | | | | — | | | | 138,680 | |
| | | | | | | | | | | | | | | | |
Repurchase Agreements | | | — | | | | 484,047 | | | | — | | | | 484,047 | |
| | | | | | | | | | | | | | | | |
Total Investments in Securities | | $ | 17,984,207 | | | $ | 27,956,347 | | | $ | — | | | $ | 45,940,554 | |
| | | | | | | | | | | | | | | | |
103
Brandes Investment Trust
NOTES TO FINANCIAL STATEMENTS — (continued)
| | | | | | | | | | | | | | | | |
Description | | Level 1 | | | Level 2 | | | Level 3 | | | Total | |
Global Equity Income | | | | | | | | | | | | | | | | |
Common Stocks | | | | | | | | | | | | | | | | |
Communication Services | | $ | 44,584 | | | $ | 57,457 | | | $ | — | | | $ | 102,041 | |
Consumer Discretionary | | | — | | | | 105,136 | | | | — | | | | 105,136 | |
Consumer Staples | | | 28,508 | | | | 133,818 | | | | — | | | | 162,326 | |
Energy | | | — | | | | 132,081 | | | | — | | | | 132,081 | |
Financials | | | 118,571 | | | | 87,421 | | | | — | | | | 205,992 | |
Health Care | | | 143,161 | | | | 98,376 | | | | — | | | | 241,537 | |
Industrials | | | 20,883 | | | | 41,442 | | | | — | | | | 62,325 | |
Information Technology | | | 15,214 | | | | 25,743 | | | | — | | | | 40,957 | |
Real Estate | | | 44,610 | | | | — | | | | — | | | | 44,610 | |
Utilities | | | 31,567 | | | | 44,485 | | | | — | | | | 76,052 | |
| | | | | | | | | | | | | | | | |
Total Common Stocks | | | 447,098 | | | | 725,959 | | | | — | | | | 1,173,057 | |
| | | | | | | | | | | | | | | | |
Preferred Stocks | | | | | | | | | | | | | | | | |
Financials | | | 98,901 | | | | — | | | | — | | | | 98,901 | |
Information Technology | | | — | | | | 23,567 | | | | — | | | | 23,567 | |
| | | | | | | | | | | | | | | | |
Total Preferred Stocks | | | 98,901 | | | | 23,567 | | | | — | | | | 122,468 | |
| | | | | | | | | | | | | | | | |
Total Investments in Securities | | $ | 545,999 | | | $ | 749,526 | | | $ | — | | | $ | 1,295,525 | |
| | | | | | | | | | | | | | | | |
| | | | |
Global Opportunities Value | | | | | | | | | | | | | | | | |
Common Stocks | | | | | | | | | | | | | | | | |
Communication Services | | $ | 208,953 | | | $ | 865,256 | | | $ | — | | | $ | 1,074,209 | |
Consumer Discretionary | | | 170,406 | | | | 1,189,743 | | | | — | | | | 1,360,149 | |
Consumer Staples | | | 663,301 | | | | 726,058 | | | | — | | | | 1,389,359 | |
Energy | | | 315,951 | | | | 244,480 | | | | — | | | | 560,431 | |
Financials | | | 732,393 | | | | 793,215 | | | | — | | | | 1,525,608 | |
Health Care | | | 372,515 | | | | 578,688 | | | | — | | | | 951,203 | |
Industrials | | | 873,497 | | | | 103,292 | | | | — | | | | 976,789 | |
Information Technology | | | 221,393 | | | | 250,604 | | | | — | | | | 471,997 | |
Materials | | | 107,713 | | | | — | | | | — | | | | 107,713 | |
Real Estate | | | 752,950 | | | | 93,977 | | | | — | | | | 846,927 | |
Utilities | | | — | | | | 177,151 | | | | — | | | | 177,151 | |
| | | | | | | | | | | | | | | | |
Total Common Stocks | | | 4,419,072 | | | | 5,022,464 | | | | — | | | | 9,441,536 | |
| | | | | | | | | | | | | | | | |
Preferred Stocks | | | | | | | | | | | | | | | | |
Consumer Discretionary | | | — | | | | 190,388 | | | | — | | | | 190,388 | |
Consumer Staples | | | 55,744 | | | | — | | | | — | | | | 55,744 | |
Energy | | | 91,266 | | | | 202,436 | | | | — | | | | 293,702 | |
Health Care | | | 93,578 | | | | — | | | | — | | | | 93,578 | |
| | | | | | | | | | | | | | | | |
Total Preferred Stocks | | | 240,588 | | | | 392,824 | | | | — | | | | 633,412 | |
| | | | | | | | | | | | | | | | |
Repurchase Agreements | | | — | | | | 214,905 | | | | — | | | | 214,905 | |
| | | | | | | | | | | | | | | | |
Total Investments in Securities | | $ | 4,659,660 | | | $ | 5,630,193 | | | $ | — | | | $ | 10,289,853 | |
| | | | | | | | | | | | | | | | |
104
Brandes Investment Trust
NOTES TO FINANCIAL STATEMENTS — (continued)
| | | | | | | | | | | | | | | | |
Description | | Level 1 | | | Level 2 | | | Level 3 | | | Total | |
Emerging Markets Fund | | | | | | | | | | | | | | | | |
Common Stocks | | | | | | | | | | | | | | | | |
Communication Services | | $ | 73,068,020 | | | $ | 123,203,053 | | | $ | — | | | $ | 196,271,073 | |
Consumer Discretionary | | | 68,879,482 | | | | 156,013,659 | | | | — | | | | 224,893,141 | |
Consumer Staples | | | 48,369,862 | | | | 39,369,386 | | | | — | | | | 87,739,248 | |
Energy | | | 51,612,023 | | | | 12,126,143 | | | | — | | | | 63,738,166 | |
Financials | | | 29,415,195 | | | | 224,030,920 | | | | — | | | | 253,446,115 | |
Health Care | | | 9,782,776 | | | | 28,340,175 | | | | — | | | | 38,122,951 | |
Industrials | | | 100,890,195 | | | | 21,595,350 | | | | — | | | | 122,485,545 | |
Information Technology | | | 38,907,772 | | | | 58,325,744 | | | | — | | | | 97,233,516 | |
Materials | | | 43,437,574 | | | | 29,001,069 | | | | — | | | | 72,438,643 | |
Real Estate | | | 100,521,748 | | | | 15,064,987 | | | | — | | | | 115,586,735 | |
Utilities | | | 18,099,377 | | | | 16,869,249 | | | | — | | | | 34,968,626 | |
| | | | | | | | | | | | | | | | |
Total Common Stocks | | | 582,984,024 | | | | 723,939,735 | | | | — | | | | 1,306,923,759 | |
| | | | | | | | | | | | | | | | |
Preferred Stocks | | | | | | | | | | | | | | | | |
Communication Services | | | 16,734,063 | | | | — | | | | — | | | | 16,734,063 | |
Consumer Discretionary | | | — | | | | 25,261,861 | | | | — | | | | 25,261,861 | |
Consumer Staples | | | 27,103,039 | | | | — | | | | — | | | | 27,103,039 | |
Energy | | | 24,816,649 | | | | 20,036,772 | | | | — | | | | 44,853,421 | |
Financials | | | 7,754,749 | | | | — | | | | — | | | | 7,754,749 | |
| | | | | | | | | | | | | | | | |
Total Preferred Stocks | | | 76,408,500 | | | | 45,298,633 | | | | — | | | | 121,707,133 | |
| | | | | | | | | | | | | | | | |
Participatory Note | | | | | | | | | | | | | | | | |
Communication Services | | | — | | | | 15,221,587 | | | | — | | | | 15,221,587 | |
| | | | | | | | | | | | | | | | |
Total Participatory Note | | | — | | | | 15,221,587 | | | | — | | | | 15,221,587 | |
| | | | | | | | | | | | | | | | |
Repurchase Agreements | | | — | | | | 28,736,612 | | | | — | | | | 28,736,612 | |
| | | | | | | | | | | | | | | | |
Total Investments in Securities | | $ | 659,392,524 | | | $ | 813,196,567 | | | $ | — | | | $ | 1,472,589,091 | |
| | | | | | | | | | | | | | | | |
| | | | |
International Small Cap Fund | | | | | | | | | | | | | | | | |
Common Stocks | | | | | | | | | | | | | | | | |
Communication Services | | $ | 15,762,489 | | | $ | 39,047,455 | | | $ | — | | | $ | 54,809,944 | |
Consumer Discretionary | | | 29,017,437 | | | | 39,758,973 | | | | — | | | | 68,776,410 | |
Consumer Staples | | | 63,405,411 | | | | 104,892,544 | | | | — | | | | 168,297,955 | |
Financials | | | — | | | | 59,477,617 | | | | — | | | | 59,477,617 | |
Health Care | | | 16,677,174 | | | | 17,743,633 | | | | — | | | | 34,420,807 | |
Industrials | | | 64,323,504 | | | | 37,442,706 | | | | — | | | | 101,766,210 | |
Information Technology | | | 30,392,478 | | | | 16,623,592 | | | | — | | | | 47,016,070 | |
Materials | | | — | | | | 3,909,946 | | | | — | | | | 3,909,946 | |
Real Estate | | | 38,868,281 | | | | 15,207,738 | | | | — | | | | 54,076,019 | |
Utilities | | | 6,292,384 | | | | 7,769,933 | | | | — | | | | 14,062,317 | |
| | | | | | | | | | | | | | | | |
Total Common Stocks | | | 264,739,158 | | | | 341,874,137 | | | | — | | | | 606,613,295 | |
| | | | | | | | | | | | | | | | |
Preferred Stocks | | | | | | | | | | | | | | | | |
Health Care | | | 10,666,685 | | | | — | | | | — | | | | 10,666,685 | |
| | | | | | | | | | | | | | | | |
Total Preferred Stocks | | | 10,666,685 | | | | — | | | | — | | | | 10,666,685 | |
| | | | | | | | | | | | | | | | |
Repurchase Agreements | | | — | | | | 39,555,382 | | | | — | | | | 39,555,382 | |
| | | | | | | | | | | | | | | | |
Total Investments in Securities | | $ | 275,405,843 | | | $ | 381,429,519 | | | $ | — | | | $ | 656,835,362 | |
| | | | | | | | | | | | | | | | |
105
Brandes Investment Trust
NOTES TO FINANCIAL STATEMENTS — (continued)
| | | | | | | | | | | | | | | | |
Description | | Level 1 | | | Level 2 | | | Level 3 | | | Total | |
Small Cap Value Fund | | | | | | | | | | | | | | | | |
Common Stocks | | | | | | | | | | | | | | | | |
Consumer Discretionary | | $ | 1,352,372 | | | $ | — | | | $ | — | | | $ | 1,352,372 | |
Consumer Staples | | | 760,281 | | | | — | | | | — | | | | 760,281 | |
Energy | | | 454,059 | | | | — | | | | — | | | | 454,059 | |
Financials | | | 724,478 | | | | — | | | | — | | | | 724,478 | |
Health Care | | | 1,077,057 | | | | — | | | | — | | | | 1,077,057 | |
Industrials | | | 1,119,979 | | | | — | | | | — | | | | 1,119,979 | |
Information Technology | | | 1,100,593 | | | | — | | | | — | | | | 1,100,593 | |
Real Estate | | | 392,804 | | | | — | | | | — | | | | 392,804 | |
Utilities | | | 67,348 | | | | — | | | | — | | | | 67,348 | |
| | | | | | | | | | | | | | | | |
Total Common Stocks | | | 7,048,971 | | | | — | | | | — | | | | 7,048,971 | |
| | | | | | | | | | | | | | | | |
Preferred Stocks | | | | | | | | | | | | | | | | |
Energy | | | 140,000 | | | | — | | | | — | | | | 140,000 | |
| | | | | | | | | | | | | | | | |
Total Preferred Stocks | | | 140,000 | | | | — | | | | — | | | | 140,000 | |
| | | | | | | | | | | | | | | | |
Corporate Bonds | | | | | | | | | | | | | | | | |
Consumer Discretionary | | | — | | | | 81,922 | | | | — | | | | 81,922 | |
Materials | | | — | | | | 151,792 | | | | — | | | | 151,792 | |
Utilities | | | — | | | | 233,282 | | | | — | | | | 233,282 | |
| | | | | | | | | | | | | | | | |
Total Corporate Bonds | | | — | | | | 466,996 | | | | — | | | | 466,996 | |
| | | | | | | | | | | | | | | | |
Repurchase Agreements | | | — | | | | 1,344,438 | | | | — | | | | 1,344,438 | |
| | | | | | | | | | | | | | | | |
Total Investments in Securities | | $ | 7,188,971 | | | $ | 1,811,434 | | | $ | — | | | $ | 9,000,405 | |
| | | | | | | | | | | | | | | | |
| | | | |
Core Plus Fund | | | | | | | | | | | | | | | | |
Common Stock | | $ | 2,191 | | | $ | — | | | $ | — | | | $ | 2,191 | |
Mortgage Backed Securities | | | — | | | | 6,806,456 | | | | — | | | | 6,806,456 | |
Government Securities | | | — | | | | 39,319,168 | | | | — | | | | 39,319,168 | |
Asset Backed Securities | | | — | | | | 1,845,570 | | | | — | | | | 1,845,570 | |
Corporate Bonds | | | — | | | | 31,206,405 | | | | — | | | | 31,206,405 | |
Repurchase Agreements | | | — | | | | 2,538,190 | | | | — | | | | 2,538,190 | |
| | | | | | | | | | | | | | | | |
Total Investments in Securities | | $ | 2,191 | | | $ | 81,715,789 | | | $ | — | | | $ | 81,717,980 | |
| | | | | | | | | | | | | | | | |
There were no Level 3 securities in the International, Global, Global Income, Global Opportunities, Emerging Markets, International Small Cap, Small Cap Value and Core Plus Funds at the beginning or during the periods presented.
NOTE 3 – INVESTMENT ADVISORY FEE AND OTHER TRANSACTIONS WITH AFFILIATES
| | A. | Advisor Fee. The Advisor provides the Funds with investment management services under an Investment Advisory Agreement. The Advisor furnishes all investment advice, office space and certain administrative services, and provides certain personnel, needed by the Funds. As compensation for its services, the Advisor is entitled to a monthly fee. The Advisor received a monthly fee at the annual rate of 0.80% of the first $2.5 billion of average daily net assets, 0.75% on average daily net assets from $2.5 billion to |
106
Brandes Investment Trust
NOTES TO FINANCIAL STATEMENTS — (continued)
| | $5.0 billion, and 0.70% of the average daily net assets greater than $5.0 billion, of the International Fund. The Advisor received a monthly fee at the annual rate of 0.95% of the first $2.5 billion of average daily net assets, 0.90% on average daily net assets from $2.5 billion to $5.0 billion, and 0.85% of the amount of average daily net assets greater than $5.0 billion, of the Emerging Markets Fund. The Advisor received a monthly fee at the annual rate of 0.95% of the first $1.0 billion of average daily net assets, and 0.90% of the average daily net assets greater than $1.0 billion, of the International Small Cap Fund. The Global Fund, Global Income Fund, Global Opportunities Fund, Small Cap Value Fund and Core Plus Fund incurred a monthly fee at the annual rate of 0.80%, 0.80%, 0.95%, 0.70% and 0.35% based upon their average daily net assets, respectively. For the six months ended March 31, 2019, the International Fund, the Global Fund, the Global Income Fund, the Global Opportunities Fund, the Emerging Markets Fund, the International Small Cap Fund, the Small Cap Value Fund and the Core Plus Fund incurred $2,928,827, $223,006, $5,229, $95,026, $6,764,107, $3,814,585, $32,244 and $148,616 in advisory fees, respectively. |
Certain officers and trustees of the Trust are also officers of the Advisor.
The Funds are responsible for their own operating expenses. The Advisor has contractually agreed to limit each Fund’s annual operating expenses, including repayment of previous waivers, to the following percentages of the Fund’s average daily net assets attributable to the specific classes through January 31, 2020 (the “Expense Cap Agreement”):
| | | | | | | | | | | | | | | | |
Fund | | Class A | | | Class C | | | Class I | | | Class R6 | |
International Fund | | | 1.20 | % | | | 1.95 | % | | | 1.00 | % | | | 0.82 | % |
Global Fund | | | 1.25 | % | | | 2.00 | % | | | 1.00 | % | | | 0.82 | %* |
Global Income Fund | | | 1.25 | % | | | 2.00 | % | | | 1.00 | % | | | 0.82 | %* |
Global Opportunities Fund | | | 1.40 | % | | | 2.15 | % | | | 1.15 | % | | | 0.97 | %* |
Emerging Markets Fund | | | 1.37 | % | | | 2.12 | % | | | 1.12 | % | | | 0.97 | % |
International Small Cap Fund | | | 1.40 | % | | | 2.15 | % | | | 1.15 | % | | | 1.00 | % |
Small Cap Value Fund | | | 1.15 | % | | | N/A | | | | 0.90 | % | | | 0.72 | % |
Core Plus Fund | | | 0.70 | % | | | N/A | | | | 0.50 | % | | | 0.35 | % |
| * | These classes are not active |
The Funds may incur additional expenses not covered under the Expense Cap Agreement. These expenses include acquired fund fees and expenses, taxes, interest, broker commissions, and proxy expenses or other extraordinary expenses.
Any reimbursements of fee waivers made by the Advisor to a Fund are subject to repayment by the Fund, to the extent that the Fund is able to make the repayment within the expense limit specified in its Expense Cap Agreement. Under the Expense Cap Agreement that was in place during the period covered by this report, any such repayment must be made
107
Brandes Investment Trust
NOTES TO FINANCIAL STATEMENTS — (continued)
before the end of the thirty-six months after the month in which the related reimbursement or waiver occurred. The Trust has agreed to repay the expense reimbursement to the Adviser. However, the repayment of previously waived expenses is limited to amounts that do not cause the aggregate operating expenses of the Fund to exceed the current expense cap or the expense cap in place at the time the waiver was generated. For the six months ended March 31, 2019, the Advisor waived expenses and/or reimbursed the Funds $12,041, $83,490, $81,880, $107,050, $175,367, $60,862, $102,161 and $100,703 for the International Fund, Global Fund, Global Income Fund, Global Opportunities Fund, Emerging Markets Fund, International Small Cap Fund, Small Cap Value Fund and Core Plus Fund, respectively. Potential recovery amounts expire through the following periods:
| | | | | | | | | | | | | | | | |
Fund | | Six Months
Ended
September 30,
2019 | | | Year Ended
September 30,
2020 | | | Year Ended
September 30,
2021 | | | Six Months
Ended
March 31,
2022 | |
International Fund | | $ | 7,467 | | | $ | 30,970 | | | $ | 22,758 | | | $ | 12,041 | |
Global Fund | | | 91,390 | | | | 157,094 | | | | 136,624 | | | | 83,490 | |
Global Income Fund | | | 74,756 | | | | 150,841 | | | | 159,007 | | | | 81,880 | |
Global Opportunities Fund | | | 94,653 | | | | 190,543 | | | | 178,887 | | | | 107,050 | |
Emerging Markets Fund | | | 157,620 | | | | 353,314 | | | | 295,177 | | | | 175,367 | |
International Small Cap Fund | | | 1,527 | | | | 24,530 | | | | 40,989 | | | | 60,862 | |
Small Cap Value Fund | | | N/A | | | | N/A | | | | 167,436 | | | | 102,161 | |
Core Plus Fund | | | 90,253 | | | | 145,644 | | | | 172,990 | | | | 100,703 | |
The Advisor did not recoup any fees previously waived or reimbursed for the International Fund, Global Fund, Global Income Fund, Global Opportunities Fund, International Small Cap Fund, Small Cap Value Fund and Core Plus Fund. For the six months ended March 31, 2019, the Advisor recouped fees previously waived or reimbursed in the following amounts:
| | | | |
Fund | | Class A | |
Emerging Markets Fund | | $ | 17,775 | |
| | B. | Administration Fee. U.S. Bancorp Fund Services, LLC, doing business as U.S. Bank Global Fund Services, (the “Administrator”) acts as administrator for the Funds. The Administrator prepares various federal and state regulatory filings; prepares reports and materials to be supplied to the Trustees; monitors the activities of the Funds’ custodian, transfer agent and accountant; coordinates the preparation and payment of Fund expenses; and reviews the Funds’ expense accruals. For these services, each Fund pays the administrator monthly a fee accrued daily and based on the Fund’s average daily net assets. The Funds may also reimburse the Administrator for out-of-pocket expenses incurred by the Administrator in the performance of its duties. The amounts paid directly to the Administrator by the Funds for administrative services are included in the Administration fees in the Statements of Operations. |
108
Brandes Investment Trust
NOTES TO FINANCIAL STATEMENTS — (continued)
| | C. | Distribution and Servicing Fees. ALPS Distributors, LLC (the “Distributor”), a registered broker-dealer, acts as the Funds’ principal underwriter in a continuous public offering of the Funds’ shares. A portion of the Funds’ distribution expenses is paid by the Advisor. |
The Funds have adopted a Distribution Plan (the “Plan”) pursuant to Rule 12b-1 under the Investment Company Act of 1940 for the Funds’ Class A and C shares. The Plan is designed to reimburse the Distributor or dealers for certain promotional and other sales related costs associated with sales of such Fund shares. Unreimbursed amounts may be carried forward and paid in a subsequent year, to the extent that total expenses under the Plan do not exceed 0.25% and 0.75% of the average daily net assets of each Fund’s Class A and C shares, respectively. During the six months ended March 31, 2019, the Funds paid to the Distributor and each dealer a monthly fee at the annual rate of 0.25% of the average daily net assets of Class A shares and 0.75% of the average daily net assets of Class C shares beneficially owned by the Distributor’s and each dealer’s existing brokerage clients. The Plan may be continued in effect from year to year if such continuance is approved annually by the Board of Trustees of the Trust, including the vote of a majority of the Independent Trustees. For the six months ended March 31, 2019, the following Funds incurred expenses pursuant to the Plan:
| | | | | | | | |
Fund | | Class A | | | Class C | |
International Fund | | $ | 43,511 | | | $ | 63,694 | |
Global Fund | | | 3,188 | | | | 5,469 | |
Global Income Fund | | | 38 | | | | 19 | |
Global Opportunities Fund | | | 1,130 | | | | 832 | |
Emerging Markets Fund | | | 314,884 | | | | 79,510 | |
International Small Cap Fund | | | 86,604 | | | | 42,309 | |
Small Cap Value Fund | | | 31 | | | | N/A | |
Core Plus Fund | | | 2,335 | | | | N/A | |
109
Brandes Investment Trust
NOTES TO FINANCIAL STATEMENTS — (continued)
The Funds have adopted a Shareholder Service Plan for Class C, and have authorized sub-transfer agency fee payments for Class I, to pay to securities broker-dealers, retirement plan sponsors and administrators, banks and their affiliates, and other institutions and service professionals, as shareholder servicing agents of the Funds, an annual fee for non-distribution sub-transfer agent and/or subaccounting services up to 0.25% and 0.05% of annual net assets attributable to Class C and Class I, respectively (the “Service Fees”). For the six months ended March 31, 2019, the Funds incurred the following Service Fees:
| | | | | | | | |
Fund | | Class C | | | Class I | |
International Fund | | $ | 21,231 | | | $ | 163,459 | |
Global Fund | | | 1,823 | | | | 12,936 | |
Global Income Fund | | | 6 | | | | 318 | |
Global Opportunities Fund | | | 277 | | | | 4,720 | |
Emerging Markets Fund | | | 26,503 | | | | 279,142 | |
International Small Cap Fund | | | 14,103 | | | | 164,458 | |
Small Cap Value Fund | | | N/A | | | | 1,249 | |
Core Plus Fund | | | N/A | | | | 20,764 | |
NOTE 4 – PURCHASES AND SALES OF SECURITIES
The cost of purchases and the proceeds from sales of securities, excluding short term investments, were as follows for the six months ended March 31, 2019:
| | | | | | | | | | | | | | | | |
| | | U.S. Government | | | Other | |
Fund | | Purchases | | | Sales | | | Purchases | | | Sales | |
International Fund | | $ | — | | | $ | — | | | $ | 149,907,773 | | | $ | 46,018,916 | |
Global Fund | | $ | — | | | $ | — | | | $ | 4,978,609 | | | $ | 20,201,935 | |
Global Income Fund | | $ | — | | | $ | — | | | $ | 82,726 | | | $ | 72,520 | |
Global Opportunities Fund | | $ | — | | | $ | — | | | $ | 1,507,370 | | | $ | 17,663,692 | |
Emerging Markets Fund | | $ | — | | | $ | — | | | $ | 200,278,628 | | | $ | 228,211,896 | |
International Small Cap Fund | | $ | — | | | $ | — | | | $ | 84,123,027 | | | $ | 403,990,401 | |
Small Cap Value Fund | | $ | — | | | $ | — | | | $ | 1,781,038 | | | $ | 1,792,709 | |
Core Plus Fund | | $ | 1,290,961 | | | $ | 9,432,615 | | | $ | 2,326,216 | | | $ | 7,481,997 | |
110
Brandes Investment Trust
NOTES TO FINANCIAL STATEMENTS — (continued)
NOTE 5 – CAPITAL STOCK TRANSACTIONS
Capital stock activity for each class of shares was as follows (shares and dollar amounts in thousands):
| | | | | | | | | | | | | | | | | | | | | | | | | | | | | | | | |
| | | International Fund | | | Global Fund | |
| | | Six Months
Ended
3/31/2019 | | | Year Ended
9/30/2018 | | | Six Months
Ended
3/31/2019 | | | Year Ended
9/30/2018 | |
| | | Shares | | | Amount | | | Shares | | | Amount | | | Shares | | | Amount | | | Shares | | | Amount | |
Shares Sold | | | | | | | | | | | | | | | | | | | | | | | | | | | | | | | | |
Class A | | | 975 | | | $ | 16,132 | | | | 702 | | | $ | 12,531 | | | | 3 | | | $ | 60 | | | | 19 | | | $ | 490 | |
Class C | | | 113 | | | | 1,836 | | | | 171 | | | | 3,063 | | | | 11 | | | | 257 | | | | 17 | | | | 410 | |
Class I | | | 13,859 | | | | 230,903 | | | | 13,918 | | | | 248,548 | | | | 211 | | | | 4,887 | | | | 178 | | | | 4,356 | |
Class R6 | | | 767 | | | | 12,963 | | | | 885 | | | | 16,042 | | | | N/A | | | | N/A | | | | N/A | | | | N/A | |
Issued on Reinvestment of Distributions | | | | | | | | | | | | | | | | | | | | | | | | | | | | | | | | |
Class A | | | 25 | | | | 409 | | | | 25 | | | | 447 | | | | 7 | | | | 148 | | | | 8 | | | | 192 | |
Class C | | | 12 | | | | 195 | | | | 14 | | | | 237 | | | | 4 | | | | 77 | | | | 2 | | | | 48 | |
Class I | | | 532 | | | | 8,607 | | | | 556 | | | | 9,884 | | | | 143 | | | | 3,080 | | | | 101 | | | | 2,470 | |
Class R6 | | | 25 | | | | 404 | | | | 25 | | | | 440 | | | | N/A | | | | N/A | | | | N/A | | | | N/A | |
Shares Redeemed | | | | | | | | | | | | | | | | | | | | | | | | | | | | | | | | |
Class A | | | (789 | ) | | | (13,213 | ) | | | (558 | ) | | | (10,034 | ) | | | (70 | ) | | | (1,565 | ) | | | (131 | ) | | | (3,312 | ) |
Class C | | | (125 | ) | | | (2,038 | ) | | | (174 | ) | | | (3,085 | ) | | | (18 | ) | | | (398 | ) | | | (22 | ) | | | (541 | ) |
Class I | | | (8,901 | ) | | | (144,990 | ) | | | (6,918 | ) | | | (125,341 | ) | | | (902 | ) | | | (19,990 | ) | | | (259 | ) | | | (6,438 | ) |
Class R6 | | | (145 | ) | | | (2,429 | ) | | | (1,720 | ) | | | (31,437 | ) | | | N/A | | | | N/A | | | | N/A | | | | N/A | |
| | | | | | | | | | | | | | | | | | | | | | | | | | | | | | | | |
Net Increase/(Decrease) Resulting from Fund Share Transactions | | | 6,348 | | | $ | 108,779 | | | | 6,926 | | | $ | 121,295 | | | | (611 | ) | | $ | (13,444 | ) | | | (87 | ) | | $ | (2,325 | ) |
| | | | | | | | | | | | | | | | | | | | | | | | | | | | | | | | |
| | | | | | | | | | | | | | | | | | | | | | | | | | | | | | | | |
| | | Global Income Fund | | | Global Opportunities Fund | |
| | | Six Months
Ended
3/31/2019 | | | Year Ended
9/30/2018 | | | Six Months
Ended
3/31/2019 | | | Year Ended
9/30/2018 | |
| | | Shares | | | Amount | | | Shares | | | Amount | | | Shares | | | Amount | | | Shares | | | Amount | |
Shares Sold | | | | | | | | | | | | | | | | | | | | | | | | | | | | | | | | |
Class A | | | — | | | $ | — | | | | 4 | | | $ | 43 | | | | 3 | | | $ | 33 | | | | 19 | | | $ | 231 | |
Class C | | | — | | | | — | | | | — | * | | | 5 | | | | — | * | | | 1 | | | | 16 | | | | 194 | |
Class I | | | 2 | | | | 23 | | | | 25 | | | | 292 | | | | 84 | | | | 790 | | | | 379 | | | | 4,394 | |
Issued on Reinvestment of Distributions | | | | | | | | | | | | | | | | | | | | | | | | | | | | | | | | |
Class A | | | — | * | | | — | * | | | — | * | | | — | * | | | 7 | | | | 60 | | | | 6 | | | | 69 | |
Class C | | | — | * | | | — | * | | | — | * | | | — | * | | | 1 | | | | 12 | | | | 1 | | | | 6 | |
Class I | | | 5 | | | | 56 | | | | 5 | | | | 63 | | | | 185 | | | | 1,720 | | | | 82 | | | | 936 | |
Shares Redeemed | | | | | | | | | | | | | | | | | | | | | | | | | | | | | | | | |
Class A | | | — | | | | — | | | | (1 | ) | | | (10 | ) | | | (83 | ) | | | (832 | ) | | | (121 | ) | | | (1,383 | ) |
Class C | | | — | | | | — | | | | — | | | | — | | | | (5 | ) | | | (49 | ) | | | (11 | ) | | | (127 | ) |
Class I | | | (4 | ) | | | (48 | ) | | | (1 | ) | | | (19 | ) | | | (1,851 | ) | | | (17,531 | ) | | | (334 | ) | | | (3,741 | ) |
| | | | | | | | | | | | | | | | | | | | | | | | | | | | | | | | |
Net Increase/(Decrease) Resulting from Fund Share Transactions | | | 3 | | | $ | 31 | | | | 32 | | | $ | 374 | | | | (1,659 | ) | | $ | (15,796 | ) | | | 37 | | | $ | 579 | |
| | | | | | | | | | | | | | | | | | | | | | | | | | | | | | | | |
| * | Value calculated is less than 500 shares/dollars. |
111
Brandes Investment Trust
NOTES TO FINANCIAL STATEMENTS — (continued)
| | | | | | | | | | | | | | | | | | | | | | | | | | | | | | | | |
| | | Emerging Markets Fund | | | International Small Cap Fund | |
| | | Six Months
Ended
3/31/2019 | | | Year Ended
9/30/2018 | | | Six Months
Ended
3/31/2019 | | | Year Ended
9/30/2018 | |
| | | Shares | | | Amount | | | Shares | | | Amount | | | Shares | | | Amount | | | Shares | | | Amount | |
Shares Sold | | | | | | | | | | | | | | | | | | | | | | | | | | | | | | | | |
Class A | | | 4,935 | | | $ | 43,424 | | | | 7,847 | | | $ | 73,159 | | | | 674 | | | $ | 7,500 | | | | 2,538 | | | $ | 33,671 | |
Class C | | | 165 | | | | 1,385 | | | | 455 | | | | 4,253 | | | | 23 | | | | 240 | | | | 127 | | | | 1,704 | |
Class I | | | 30,714 | | | | 259,879 | | | | 46,535 | | | | 439,948 | | | | 10,994 | | | | 120,461 | | | | 26,887 | | | | 356,547 | |
Class R6 | | | 638 | | | | 5,448 | | | | 1,602 | | | | 14,878 | | | | 143 | | | | 1,643 | | | | 689 | | | | 8,969 | |
Issued on Reinvestment of Distributions | | | | | | | | | | | | | | | | | | | | | | | | | | | | | | | | |
Class A | | | 78 | | | | 669 | | | | 417 | | | | 3,687 | | | | 227 | | | | 2,404 | | | | 782 | | | | 10,584 | |
Class C | | | 3 | | | | 21 | | | | 24 | | | | 216 | | | | 37 | | | | 377 | | | | 138 | | | | 1,836 | |
Class I | | | 494 | | | | 4,238 | | | | 2,416 | | | | 21,497 | | | | 1,834 | | | | 19,563 | | | | 7,773 | | | | 105,388 | |
Class R6 | | | 18 | | | | 155 | | | | 108 | | | | 993 | | | | 213 | | | | 2,273 | | | | 421 | | | | 5,700 | |
Shares Redeemed | | | | | | | | | | | | | | | | | | | | | | | | | | | | | | | | |
Class A | | | (5,463 | ) | | | (45,854 | ) | | | (11,397 | ) | | | (105,987 | ) | | | (1,830 | ) | | | (20,265 | ) | | | (9,006 | ) | | | (120,281 | ) |
Class C | | | (484 | ) | | | (4,018 | ) | | | (760 | ) | | | (7,003 | ) | | | (363 | ) | | | (3,944 | ) | | | (983 | ) | | | (12,440 | ) |
Class I | | | (34,984 | ) | | | (290,823 | ) | | | (50,197 | ) | | | (455,961 | ) | | | (42,955 | ) | | | (479,098 | ) | | | (62,848 | ) | | | (832,664 | ) |
Class R6 | | | (391 | ) | | | (3,292 | ) | | | (7,983 | ) | | | (72,039 | ) | | | (587 | ) | | | (6,733 | ) | | | (437 | ) | | | (5,831 | ) |
| | | | | | | | | | | | | | | | | | | | | | | | | | | | | | | | |
Net Decrease Resulting from Fund Share Transactions | | | (4,277 | ) | | $ | (28,768 | ) | | | (10,933 | ) | | $ | (82,359 | ) | | | (31,590 | ) | | $ | (355,579 | ) | | | (33,919 | ) | | $ | (446,817 | ) |
| | | | | | | | | | | | | | | | | | | | | | | | | | | | | | | | |
| | | | | | | | | | | | | | | | | | | | | | | | | | | | | | | | |
| | | Small Cap Value Fund | | | Core Plus Fund | |
| | | Six Months
Ended
3/31/2019 | | | Period Ended
9/30/2018 | | | Six Months
Ended
3/31/2019 | | | Year Ended
9/30/2018 | |
| | | Shares | | | Amount | | | Shares | | | Amount | | | Shares | | | Amount | | | Shares | | | Amount | |
Shares Sold | | | | | | | | | | | | | | | | | | | | | | | | | | | | | | | | |
Class A | | | — | | | $ | — | | | | 11 | | | $ | 112 | | | | 63 | | | $ | 557 | | | | 136 | | | $ | 1,215 | |
Class I | | | — | | | | — | | | | 527 | | | | 5,268 | | | | 692 | | | | 6,185 | | | | 3,622 | | | | 33,029 | |
Class R6 | | | — | | | | — | | | | 468 | | | | 4,566 | | | | — | | | | — | | | | — | * | | | — | * |
Issued on Reinvestment of Distributions | | | | | | | | | | | | | | | | | | | | | | | | | | | | | | | | |
Class A | | | — | * | | | 2 | | | | — | * | | | — | * | | | 3 | | | | 23 | | | | 7 | | | | 63 | |
Class I | | | 46 | | | | 393 | | | | 2 | | | | 20 | | | | 137 | | | | 1,227 | | | | 290 | | | | 2,617 | |
Class R6 | | | 39 | | | | 333 | | | | 2 | | | | 20 | | | | — | * | | | — | * | | | — | * | | | — | * |
Shares Redeemed | | | | | | | | | | | | | | | | | | | | | | | | | | | | | | | | |
Class A | | | (3 | ) | | | (32 | ) | | | (6 | ) | | | (66 | ) | | | (35 | ) | | | (314 | ) | | | (306 | ) | | | (2,754 | ) |
Class I | | | — | | | | — | | | | — | | | | — | | | | (2,132 | ) | | | (18,952 | ) | | | (4,431 | ) | | | (40,143 | ) |
Class R6 | | | (46 | ) | | | (400 | ) | | | — | | | | — | | | | — | | | | — | | | | — | | | | — | |
| | | | | | | | | | | | | | | | | | | | | | | | | | | | | | | | |
Net Increase/(Decrease) Resulting from Fund Share Transactions | | | 36 | | | $ | 296 | | | | 1,004 | | | $ | 9,920 | | | | (1,272 | ) | | $ | (11,274 | ) | | | (682 | ) | | $ | (5,973 | ) |
| | | | | | | | | | | | | | | | | | | | | | | | | | | | | | | | |
| * | Value calculated is less than 500 shares/dollars. |
112
Brandes Investment Trust
NOTES TO FINANCIAL STATEMENTS — (continued)
NOTE 6 – FEDERAL INCOME TAX MATTERS
GAAP requires that certain components of net assets be reclassified between financial and tax reporting. Temporary differences do not require reclassification. Temporary and permanent differences have no effect on net assets or net asset value per share. For the year ended September 30, 2018, the Funds made the following permanent book-to-tax reclassifications primarily related to the treatment of foreign currency transactions, passive foreign investment companies, paydowns and difference between book and tax accretion methods for market premium:
| | | | | | | | | | | | |
| | | Undistributed Net
Investment
Income/(Loss) | | | Accumulated
Net Realized
Gain/(Loss) | | | Paid-In Capital | |
International Fund | | $ | 2,424,398 | | | $ | 26,642,818 | | | $ | (29,067,216 | ) |
Global Fund | | | (10,426 | ) | | | 10,426 | | | | — | |
Global Income Fund | | | (260 | ) | | | 260 | | | | — | |
Global Opportunities Fund | | | 189,234 | | | | (189,234 | ) | | | — | |
Emerging Markets Fund | | | (5,085,855 | ) | | | 5,085,854 | | | | 1 | |
International Small Cap Fund | | | 51,885,578 | | | | (51,885,578 | ) | | | — | |
Small Cap Value Fund | | | 2,943 | | | | 373,882 | | | | (376,825 | ) |
Core Plus Fund | | | 17,036 | | | | (17,035 | ) | | | (1 | ) |
As of September 30, 2018, the components of distributable earnings on a tax basis were as follows:
| | | | | | | | | | | | | | | | |
| | | International
Fund | | | Global
Fund | | | Global
Income
Fund | | | Global
Opportunities
Fund | |
Cost of investments for tax purposes | | $ | 796,154,236 | | | $ | 60,379,864 | | | $ | 1,250,068 | | | $ | 31,119,325 | |
| | | | | | | | | | | | | | | | |
Gross tax unrealized appreciation | | | 38,075,486 | | | | 12,205,934 | | | | 154,916 | | | | 2,034,552 | |
Gross tax unrealized depreciation | | | (95,402,548 | ) | | | (4,928,418 | ) | | | (76,288 | ) | | | (3,206,905 | ) |
| | | | | | | | | | | | | | | | |
Net unrealized appreciation (depreciation) on investments and foreign currency | | | (57,327,062 | ) | | | 7,277,516 | | | | 78,628 | | | | (1,172,353 | ) |
Distributable ordinary income | | | 5,030,690 | | | | 27,782 | | | | 2,592 | | | | 362,904 | |
Distributable long-term capital gains | | | — | | | | 2,856,903 | | | | 40,691 | | | | 1,094,819 | |
| | | | | | | | | | | | | | | | |
Total distributable earnings | | | 5,030,690 | | | | 2,884,685 | | | | 43,283 | | | | 1,457,723 | |
| | | | | | | | | | | | | | | | |
Other accumulated gains/(losses) | | | (2,867,909 | ) | | | (13,019 | ) | | | (140 | ) | | | (1,853 | ) |
| | | | | | | | | | | | | | | | |
Total accumulated earnings | | $ | (55,164,281 | ) | | $ | 10,149,182 | | | $ | 121,771 | | | $ | 283,517 | |
| | | | | | | | | | | | | | | | |
113
Brandes Investment Trust
NOTES TO FINANCIAL STATEMENTS — (continued)
| | | | | | | | | | | | | | | | |
| | | Emerging
Markets
Fund | | | International
Small Cap
Fund | | | Small Cap
Value Fund | | | Core
Plus Fund | |
Cost of investments for tax purposes | | $ | 1,645,444,626 | | | $ | 1,255,647,935 | | | $ | 10,157,619 | | | $ | 93,929,200 | |
| | | | | | | | | | | | | | | | |
Gross tax unrealized appreciation | | | 95,526,559 | | | | 71,004,453 | | | | 785,536 | | | | 1,018,346 | |
Gross tax unrealized depreciation | | | (273,070,438 | ) | | | (204,366,680 | ) | | | (679,937 | ) | | | (2,910,853 | ) |
| | | | | | | | | | | | | | | | |
Net unrealized appreciation (depreciation) on investments and foreign currency | | | (177,543,879 | ) | | | (133,362,227 | ) | | | 105,599 | | | | (1,892,507 | ) |
Distributable ordinary income | | | — | | | | 14,780,535 | | | | 520,249 | | | | 19,107 | |
Distributable long-term capital gains | | | — | | | | 9,532,372 | | | | 165,379 | | | | — | |
| | | | | | | | | | | | | | | | |
Total distributable earnings | | | — | | | | 24,312,907 | | | | 685,628 | | | | 19,107 | |
| | | | | | | | | | | | | | | | |
Other accumulated gains/(losses) | | | (41,751,972 | ) | | | (80,926 | ) | | | (4,645 | ) | | | (883,142 | ) |
| | | | | | | | | | | | | | | | |
Total accumulated earnings | | $ | (219,295,851 | ) | | $ | (109,130,246 | ) | | $ | 786,582 | | | $ | (2,756,542 | ) |
| | | | | | | | | | | | | | | | |
The differences between book and tax basis distributable earnings are primarily related to foreign currency adjustments and the differences in classification of paydown gains and losses for tax purposes compared to book purposes. These differences are temporary.
The tax composition of dividends for the periods ended September 30, 2018 and September 30, 2017 for the Funds, were as follows:
| | | | | | | | | | | | | | | | |
| | | Ordinary Income | | | Long Term
Capital Gains | |
| | | 2018 | | | 2017 | | | 2018 | | | 2017 | |
International Fund | | $ | 11,817,058 | | | $ | 17,288,853 | | | $ | — | | | $ | — | |
Global Fund | | | 1,314,875 | | | | 1,158,288 | | | | 1,417,148 | | | | 144,842 | |
Global Income Fund | | | 36,763 | | | | 27,560 | | | | 28,247 | | | | 16,627 | |
Global Opportunities Fund | | | 910,584 | | | | 347,227 | | | | 132,721 | | | | — | |
Emerging Markets Fund | | | 29,717,180 | | | | 26,232,726 | | | | — | | | | — | |
International Small Cap Fund | | | 77,837,530 | | | | 55,283,372 | | | | 50,038,482 | | | | 16,143,560 | |
Small Cap Value Fund | | | 39,652 | | | | N/A | | | | — | | | | N/A | |
Core Plus Fund | | | 2,721,143 | | | | 2,708,539 | | | | — | | | | — | |
At September 30, 2018, the Funds had capital losses expiring and capital loss carryforwards utilized as indicated below:
| | | | | | | | |
| | | Indefinite | | | Utilized | |
International Fund | | $ | (2,825,666 | ) | | $ | (22,756,511 | ) |
Global Fund | | | — | | | | — | |
Global Income Fund | | | — | | | | — | |
Global Opportunities Fund | | | — | | | | — | |
Emerging Markets Fund | | | (41,227,548 | ) | | | (104,145,418 | ) |
International Small Cap Fund | | | — | | | | — | |
Small Cap Value Fund | | | — | | | | — | |
Core Plus Fund | | | (883,142 | ) | | | — | |
At September 30, 2018, the Emerging Markets Fund had ordinary loss deferral of $419,585. At September 30, 2018, the International Fund had $29,067,216 of capital loss carryforwards expire.
114
Brandes Investment Trust
NOTES TO FINANCIAL STATEMENTS — (continued)
NOTE 7 – OFFERING PRICE PER SHARE
The public offering price for Class A shares is the net asset value per share plus a sales charge, which varies in accordance with the amount of the purchase up to a maximum of 5.75% for the International, Global, Global Income, Global Opportunities, Emerging Markets, International Small Cap and Small Cap Value Funds, and 3.75% for the Core Plus Fund. A contingent deferred sales charge (“CDSC”) of 1.00% will be deducted with respect to Class A shares purchased without a sales load and redeemed within 12 months of purchase, unless waived, as discussed in the Prospectus. Any applicable CDSC will be 1.00% of the lesser of the original purchase price or the redemption value of the Class A shares redeemed. Class C shares include a 1.00% CDSC paid by redeeming shareholders within 12 months of purchase. As a result the redemption price may differ from the net asset value per share. The public offering prices for I shares are the respective net asset values. Sales charges are not an expense of the Funds and are not reflected in the financial statements of the Funds.
NOTE 8 – TRANSACTIONS WITH AFFILIATES
The following issuers were affiliated with the Emerging Markets Fund and International Small Cap Fund as defined in Section (2)(a)(3) of the 1940 Act, as these Funds held 5% or more of the outstanding voting securities of the following issuers during the six months from October 1, 2018 through March 31, 2019:
Emerging Markets Fund
| | | | | | | | | | | | | | | | | | | | | | | | | | | | | | | | |
| Issuer Name | | Share
Balance At
October 1,
2018 | | | Additions | | | Reductions | | | Share
Balance At
March 31,
2019 | | | Dividend
Income | | | Unrealized
Appreciation/
(Depreciation) | | | Realized
Gain/(Loss) | | | Value At
March 31,
2019 | |
Urbi Desarrollos Urbanos SA de CV | | | 10,242,449 | | | | — | | | | — | | | | 10,242,449 | | | $ | — | | | $ | (1,252,685 | ) | | $ | — | | | $ | 717,648 | |
| | | | | | | | | | | | | | | | | | | | | | | | | | | | | | | | |
| | | | | | | | | | | | | | | | | | $ | — | | | $ | (1,252,685 | ) | | $ | — | | | $ | 717,648 | |
| | | | | | | | | | | | | | | | | | | | | | | | | | | | | | | | |
International Small Cap Fund
| | | | | | | | | | | | | | | | | | | | | | | | | | | | | | | | |
| Issuer Name | | Share
Balance At
October 1,
2018 | | | Additions | | | Reductions | | | Share
Balance At
March 31,
2019 | | | Dividend
Income | | | Unrealized
Appreciation/
(Depreciation) | | | Realized
Gain/(Loss) | | | Value At
March 31,
2019 | |
Avadel Pharmaceuticals Plc(1) | | | 1,924,883 | | | | 138,526 | | | | (542,842 | ) | | | 1,520,567 | | | $ | — | | | $ | (2,172,223 | ) | | $ | (3,148,893 | ) | | $ | 2,189,617 | |
Countrywide Plc(1) | | | 114,155,464 | | | | — | | | | (36,959,960 | ) | | | 77,195,504 | | | | — | | | | 34,827,311 | | | | (40,044,757 | ) | | | 7,619,107 | |
Desarrolladora Homex SAB de CV | | | 279,501,983 | | | | — | | | | — | | | | 279,501,983 | | | | — | | | | (2,290,807 | ) | | | — | | | | 2,159,957 | |
Mills Estruturas e Servicos de Engenharia SA(1) | | | 8,911,000 | | | | — | | | | (5,744,900 | ) | | | 3,166,100 | | | | — | | | | 6,018,645 | | | | (1,133,241 | ) | | | 3,832,943 | |
Safilo Group SpA(1) | | | — | | | | 6,018,587 | | | | (79,681 | ) | | | 5,938,906 | | | | — | | | | (122,793 | ) | | | 748 | | | | 4,756,667 | |
Urbi Desarrollos Urbanos SA de CV | | | 12,867,533 | | | | — | | | | — | | | | 12,867,533 | | | | — | | | | (1,573,741 | ) | | | — | | | | 901,578 | |
| | | | | | | | | | | | | | | | | | | | | | | | | | | | | | | | |
| | | | | | | | | | | | | | | | | | $ | — | | | $ | 34,686,392 | | | $ | (44,326,143 | ) | | $ | 21,459,869 | |
| | | | | | | | | | | | | | | | | | | | | | | | | | | | | | | | |
| (1) | Issuer was not an affiliate as of March 31, 2019. |
115
Brandes Investment Trust
NOTES TO FINANCIAL STATEMENTS — (continued)
NOTE 9 – OWNERSHIP BY AFFILIATED PARTIES
As of March 31, 2019, the Advisor, Trustees or affiliates of the Advisor beneficially owned more than 5% of shares in each class of the Funds as follows:
| | | | | | |
| | | Global Fund | | Core Plus
Fund | | Core Plus
Fund |
| | | Class I | | Class I | | Class R6 |
Shares | | 173,904 | | 1,162,907 | | 12 |
% of Total Outstanding Shares | | 8.78% | | 13.28% | | 100% |
NOTE 10 –IN-KIND TRANSACTIONS
Affiliated Transactions
On January 2, 2018, the Advisor transferred all securities, through a reorganization, from an affiliated private investment fund to create the Small Cap Value Fund. The Fund received securities with a value of $4,432,969. Prior to January 2, 2018, the Advisor managed the affiliated private investment fund which had an investment objective and investment policies and strategies that were, in all material respects, equivalent to those of the Small Cap Value Fund. Through this transfer, the affiliated private investment fund was closed.
On March 15, 2018, a shareholder transferred securities from an affiliated separately managed account into the Small Cap Value Fund through anin-kind purchase. The Fund received securities with a value of $3,699,813.
The total value of these two transactions was $8,132,782, which is shown on the Statement of Changes in Net Assets. Of the $8,132,782 transferred, $8,051,136 were considered long-term purchases.
NOTE 11 – NEW ACCOUNTING PRONOUNCEMENTS
In August 2018, FASB issued ASU2018-13, Fair Value Measurement (Topic 820): Disclosure Framework – Changes to the Disclosure Requirements for Fair Value Measurement (“ASU2018-13”). The primary focus of ASU2018-13 is to improve the effectiveness of the disclosure requirements for fair value measurements. The changes affect all companies that are required to include fair value measurement disclosures. In general, the amendments in ASU2018-13 are effective for all entities for fiscal years and interim periods within those fiscal years, beginning after December 15, 2019. An entity is permitted to early adopt the removed or modified disclosures upon the issuance of ASU2018-13 and may delay adoption of the additional disclosures, which are required for public companies only, until their effective date. Management has chosen to adopt this disclosure in this report.
In August 2018, the Securities and Exchange Commission issued Final Rule ReleaseNo. 33-10532, Disclosure Update and Simplification, which in part amends certain disclosure requirements of RegulationS-X that have become redundant, duplicative, overlapping, outdated, or superseded, in light of other
116
Brandes Investment Trust
NOTES TO FINANCIAL STATEMENTS — (continued)
Commission disclosure requirements, U.S. Generally Accepted Accounting Principles, or changes in the information environment. The amendments are intended to facilitate the disclosure of information to investors and simplify compliance without significantly altering the total mix of information provided to investors. Management has chosen to adopt this disclosure in this report.
NOTE 12 – SUBSEQUENT EVENTS
In preparing these financial statements, the Trust has evaluated events and transactions for potential recognition or disclosure through the date the financial statements were available to be issued. The Board of Trustees, based on the recommendation of the Advisor, approved a plan of liquidation of the Global Opportunities Fund providing for liquidation of the Fund on or around June 28, 2019.
117
Brandes Investment Trust
ADDITIONAL INFORMATION — (Unaudited)
BOARD CONSIDERATION AND CONTINUATION OF INVESTMENT ADVISORY AGREEMENT
In November 2018, the Board of Trustees of the Trust, including the independent Trustees, unanimously approved renewal of the Investment Advisory Agreement (the “Agreement”) between the Trust and Brandes Investment Partners, L.P. (the “Advisor”) for an additionalone-year term with respect to the Brandes International Equity Fund, the Brandes Global Equity Fund, the Brandes Global Equity Income Fund, the Brandes Global Opportunities Value Fund, the Brandes Emerging Markets Value Fund, the Brandes International Small Cap Equity Fund, the Brandes Core Plus Fixed Income Fund and the Brandes Small Cap Value Fund. Each of these is referred to below as a “Fund” and they are collectively referred to as the “Funds.”
Information Reviewed
During the course of each year, Board members review a wide variety of materials relating to the nature, extent and quality of the services provided by the Advisor to the Funds, including reports on each Fund’s investment results, portfolio composition, portfolio trading practices, and other matters. In addition, in connection with its annual review of the Agreement with respect to the Funds, the Board requested and reviewed supplementary information that included materials regarding the Funds’ investment results, advisory fees and expense comparisons for peer groups and categories of similar funds identified by Morningstar Associates (“Morningstar”); financial and profitability information regarding the Advisor; the methods used by the Advisor to evaluate and compensate its professional investment personnel; descriptions of various functions performed by the Advisor on behalf of the Trust such as compliance monitoring and portfolio trading practices; and information about- the personnel providing investment management and administrative services to the Funds.
In connection with its reviews, the Board received assistance and advice regarding legal and industry standards from counsel to the Trust and the independent Trustees. The independent Trustees discussed the approval of the Agreement with respect to each Fund with representatives of the Advisor at two Board meetings and in private sessions with counsel at which no representatives of the Advisor were present. In deciding to recommend approval of the Agreement with respect to each Fund, the Board and the independent Trustees did not identify any single or particular piece of information that, in isolation, was the controlling factor, and each Trustee did not necessarily attribute the same weight to each factor. This summary describes the most important, but not all, of the factors considered by the Board and the independent Trustees.
118
Brandes Investment Trust
ADDITIONAL INFORMATION — (Unaudited) (continued)
Nature, Extent and Quality of Services
With respect to the nature, extent and quality of services provided by the Advisor to the Funds, the Trustees reviewed among other things the quality and depth of the Advisor’s investment management staff, its regulatory compliance resources and program, its business continuity and cyber-security programs, theday-to-day administrative services provided by the Advisor to the Funds, and the investment results of the Funds.
With respect to each Fund’s investment results, the Trustees reviewed detailed information regarding a peer group of similarly managed funds selected by Morningstar, all of the funds in the larger Morningstar category of funds managed with the same general style, and the Fund’s benchmark index. The Trustees also discussed with representatives of Morningstar the principles used in determining the Funds’ peer groups and categories, and differences in those groups from those presented by Morningstar in connection with the Trustees’ 2017 review of the Agreement. In addition, they reviewed the results of certain funds considered by the Advisor to be the most direct competitors to the Funds in the Funds’ marketing channels.
The independent Trustees noted that for theone-year, three-year, five-year andten-year periods ended September 30, 2018, the investment results of the I Class shares of all of the Funds were mixed versus the funds in their respective peer groups and categories, as well as versus their benchmarks. In addition, the Trustees noted the following:
| | • | | The International Equity Fund’s results were in the first quartile versus Morningstar Foreign Large Value peers for all periods; in the first quartile versus the category for theone-year and five-year periods, the second quartile for the three-year period and the third quartile for theten-year period; and ahead of its benchmark for theone-year and five-year periods and behind for the three-year andten-year periods. |
| | • | | The Global Equity Fund’s results were in the third quartile versus Morningstar World Large Stock peers for theone-year period and in the fourth quartile for the three-year and five-year periods; in the fourth quartile versus the category for all periods; and behind the benchmark for all periods. |
| | • | | The Global Equity Income Fund’s results were in the fourth quartile versus Morningstar World Large Stock peers for theone-year period and in the first quartile for the three-year period; in the fourth quartile versus the category for theone-year period and the third quartile for the three-year period; and behind the benchmark for all periods. |
| | • | | The Global Opportunities Value Fund’s results were in the fourth quartile versus Morningstar Foreign Large Value peers for theone-year period and |
119
Brandes Investment Trust
ADDITIONAL INFORMATION — (Unaudited) (continued)
| | in the third quartile for the three-year period; in the fourth quartile versus the category for theone-year period and the second quartile for the three-year period; and behind the benchmark for all periods. |
| | • | | The Emerging Markets Value Fund’s results were in the fourth quartile versus Morningstar Diversified Emerging Markets peers for theone-year and five-year periods and in the second quartile for the three-year period; in the fourth quartile versus the category for theone-year and five-year periods and the first quartile for the three-year period; and behind the benchmark for theone-year and five-year periods and ahead for the three-year period. |
| | • | | The International Small Cap Equity Fund’s results were in the fourth quartile versus Morningstar Foreign Small/Mid Value peers for theone-year, three-year and five-year periods; in the fourth quartile versus the category for all periods; and behind the benchmark for all periods. The independent Trustees noted the impact of the Fund’s investment results of its significant cash position, which related to the Advisor’s assessment of available investment opportunities meeting its value investment criteria. |
| | • | | The Core Plus Fixed Income Fund’s results were in the second quartile versus Morningstar Intermediate-Term Bond peers for theone-year period and in the third quartile for all other periods; in the second quartile versus the category for theone-year andten-year periods and in the third quartile for the three-year and five-year periods; and ahead of the benchmark for all periods. |
| | • | | The Small Cap Value Fund had less than a full year of investment results as a registered investment company. |
In evaluating the Funds’ performance, the independent Trustees generally considered long-term results to be more important than short-term results; noted the brief operating histories of the Global Equity Income Fund, the Global Opportunities Value Fund and the Small Cap Value Fund; noted the Advisor’s continued commitment to the Graham and Dodd value strategy of investment management and its lack of style drift compared to other value managers; considered that it is not unusual for the performance of funds managed with the long-term Graham and Dodd value strategy to fall below the performance of measurement indices for some periods; noted the Advisor’s observations regarding the unfavorable market for value investments in recent years; and further noted that the Funds investment approach is fully described in its prospectus and the Fund’s shareholders likely were willing to accept the long-term outlook associated with the Advisor’s approach.
Based on these discussions and reviews, the Trustees determined that under all the circumstances the investment results of the Funds were sufficient for renewal of the Agreement.
120
Brandes Investment Trust
ADDITIONAL INFORMATION — (Unaudited) (continued)
Advisory Fees, Total Expenses, Profitability and Ancillary Benefits
With respect to advisory fees and total expenses of the Funds, the independent Trustees noted that:
| | • | | The advisory fees for all of the Funds were at or near the median fees in their respective Morningstar peer groups. They also observed that the total fees and expenses actually paid by all of the Funds, after waivers by the Advisor of expenses above stated expense caps, were below or near the median fees and expenses paid by the funds in their respective Morningstar peer groups. The independent Trustees noted that the Advisor continues to waive any expenses over stated expense caps for the Funds. |
| | • | | Although the Advisor’s management fee is higher for the Funds than for its comparable institutional accounts, the independent Trustees noted information provided by the Advisor regarding the additional responsibilities and expenses that the Advisor incurs in sponsoring and operating the Funds. |
| | • | | The independent Trustees acknowledged the Advisor’s agreement to add a breakpoint to the advisory fee schedule for the International Small Cap Fund, which agreement had resulted from discussions with the Advisor last year. |
| | • | | The independent Trustees noted that the Advisor’s fees for the Funds other than the International Equity, International Small Cap and Emerging Markets Funds do not have breakpoints as those Funds’ assets increase. They noted that the Advisor believes that it is premature to discuss economies of scale when it is subsidizing the other Funds’ expenses, but had agreed to review the nature and extent of’ any economies of scale that it may realize as the Funds’ assets increase in the future and how such economies would be shared with the Funds’ shareholders. |
In addition, the independent Trustees reviewed an analysis of the profitability to the Advisor of its relationship with the Funds and information regarding the Advisor’s financial capability to continue to provide services to the Funds in the future. They also reviewed the methods used by the Advisor to evaluate and compensate its professional investment personnel. Finally, they considered ancillary benefits to the Advisor as a result of its relationships with the Funds. They noted that these were primarily related to the benefit of proprietary and third-party research provided by broker-dealers executing portfolio transactions on behalf of the Funds.
121
Brandes Investment Trust
ADDITIONAL INFORMATION — (Unaudited) (continued)
Conclusions
Based on their review, including consideration of each of the factors referred to above, the Board and the independent Trustees concluded that the Agreement is fair and reasonable to the Funds and their respective shareholders, that each of the factors discussed above supported renewal of the Agreement with respect to each of the Funds, and that renewal of the Agreement was in the best interests of each Fund and its shareholders.
PROXY VOTING PROCEDURES
The Advisor votes proxies relating to the Funds’ portfolio securities in accordance with procedures adopted by the Advisor. You may obtain a description of these procedures, free of charge, by calling toll-free 1-800-331-2979. This information is also available through the Securities and Exchange Commission’s website athttp://www.sec.gov.
Information regarding how the Trust voted proxies relating to portfolio securities during the most recent 12-month period ended June 30 is available without charge, upon request, by calling 1-800-331-2979. This information is also available through the Securities and Exchange Commission’s website athttp://www.sec.gov.
PORTFOLIO HOLDINGS DISCLOSURE
The Trust files the Funds’ complete schedules of portfolio holdings with the Securities and Exchange Commission for the first and third quarters of each fiscal year on Form N-Q or Part F of Form N-PORT (beginning with filings after March 31, 2019). The Trust’s Form N-Q or Part F of Form N-PORT filings are available on the Securities and Exchange Commission’s website at http://www.sec.gov. The Trust’s Form N-Q or Part F of Form N-PORT filings may be reviewed and copied at the Commission’s Public Reference Room in Washington, D.C., and information on the operation of the Public Reference Room may be obtained by calling 1-800-SEC-0330. Information regarding the Trust’s Form N-Q or Part F of Form N-PORT filings is also available, without charge, by callingtoll-free, 1-800-331-2979.
122
Brandes Investment Trust
TRUSTEES AND OFFICERS INFORMATION — (Unaudited)
The Board of Trustees is responsible for the overall management of the Trust’s business. The Board approves all significant agreements between the Trust and persons or companies furnishing services to the Trust, including the Trust’s agreements with the Advisor, Administrator, Custodian, Distributor and Transfer Agent. The Board of Trustees delegates the day-to-day operations of the Trust to its officers and service providers, subject to the Funds’ investment objectives and policies and to general supervision by the Board. The Trust’s Statement of Additional Information includes additional information about the Trustees and is available, without charge, bycalling 1-800-331-2979 or visiting www.brandes.com.
The Trustees and officers of the Trust, their business addresses and principal occupations during the past five years are:
| | | | | | | | | | |
Name, Address
and Age | | Position(s)
Held with
Trust | | Term of
Office
and
Length
of Time
Served(1) | | Principal
Occupation
During Past
5 Years | | Number
of Trust
Series
Overseen
by Trustee | | Other
Directorships/ Trusteeships
Held by
Trustee |
Independent Trustees(2) |
| | | | | |
Gregory Bishop, CFA 11988 El Camino Real, Suite 600 San Diego, CA 92130 (Born: 1961) | | Trustee | | Since January 2017 | | Retired. Previously Executive Vice President and Head of Retail Business, PIMCO Investments, from 1997 to 2014 | | 10 | | None |
| | | | | |
Jean E. Carter 11988 El Camino Real, Suite 600 San Diego, CA 92130 (Born: 1957) | | Trustee | | Since April 2008 | | Retired. | | 10 | | Bridge Builder Trust |
| | | | | |
Robert M. Fitzgerald, CPA (inactive) 11988 El Camino Real, Suite 600 San Diego, CA 92130 (Born: 1952) | | Trustee | | Since April 2008 | | Retired. | | 10 | | Hotchkis and Wiley Mutual Funds |
| | | | | |
Craig Wainscott, CFA 11988 El Camino Real, Suite 600 San Diego, CA 92130 (Born: 1961) | | Trustee and Chairman | | Since February 2012 | | Partner with The Paradigm Project and advisor to early-stage companies. | | 10 | | None |
123
Brandes Investment Trust
TRUSTEES AND OFFICERS INFORMATION — (Unaudited) (continued)
| | | | | | | | | | |
Name, Address
and Age | | Position(s)
Held with
Trust | | Term of
Office
and
Length
of Time
Served(1) | | Principal
Occupation
During Past
5 Years | | Number
of Trust
Series
Overseen
by Trustee | | Other
Directorships/ Trusteeships
Held by
Trustee |
“Interested” Trustees(3) | | | | | | | | |
| | | | | |
Oliver Murray 11988 El Camino Real, Suite 600 San Diego, CA 92130 (Born: 1962) | | Trustee | | Since February 2012 | | Chief Executive Officer, Brandes Investment Partners & Co.; Managing Director – PMCS of Brandes Investment Partners, L.P., the investment advisor to the Funds (the “Advisor”). | | 10 | | None |
| | | | | |
Jeff Busby, CFA 11988 El Camino Real, Suite 600 San Diego, CA 92130 (Born: 1961) | | Trustee and President | | Since July 2006 | | Executive Director of the Advisor. | | 10 | | None |
| | | | | |
Officers of the Trust | | | | | | | | | | |
| | | | | |
Thomas M. Quinlan 11988 El Camino Real, Suite 600 San Diego, CA 92130 (Born: 1970) | | Secretary | | Since June 2003 | | Associate General Counsel of the Advisor. | | N/A | | N/A |
| | | | | |
Gary Iwamura, CPA 11988 El Camino Real, Suite 600 San Diego, CA 92130 (Born: 1956) | | Treasurer | | Since September 1997 | | Finance Director of the Advisor. | | N/A | | N/A |
| | | | | |
Roberta Loubier 11988 El Camino Real, Suite 600 San Diego, CA 92130 (Born: 1971) | | Chief Compliance Officer | | Since September 2015 | | Global Head of Compliance, Brandes Investment Partners, L.P. | | N/A | | N/A |
| (1) | Trustees and officers of the Fund serve until their resignation, removal or retirement. |
| (2) | Not “interested persons” of the Trust as defined in the 1940 Act. |
| (3) | “Interested persons” of the Trust as defined in the 1940 Act by virtue of their positions with the Advisor. |
124
Brandes Investment Trust
PRIVACY NOTICE
Brandes Investment Trust and Brandes Investment Partners, L.P. may collectnon-public information about you from the following sources:
| • | | Information we receive about you on applications or other forms; |
| • | | Information you give us orally; and |
| • | | Information about your transactions with us. |
We do not disclose anynon-public personal information about any shareholder or former shareholder of the Funds without the shareholder’s authorization, except as required by law or in response to inquiries from governmental authorities. We restrict access to your personal and account information to those employees who need to know that information to provide products and services to you. We also may disclose that information to unaffiliated third parties (such as to brokers or custodians) only as permitted by law and only as needed for us to provide agreed services to you. We maintain physical, electronic and procedural safeguards to guard yournon-public personal information.
If you hold shares of the Funds through a financial intermediary, such as a broker-dealer, bank, or trust company, the privacy policy of your financial intermediary governs how your non-public personal information would be shared with nonaffiliated third parties.

ADVISOR Brandes Investment Partners, L.P. 11988 El Camino Real, Suite 600 San Diego, CA 92130 800.331.2979 DISTRIBUTOR ALPS Distributors, Inc. 1290 Broadway, #1100 Denver, CO 80203 TRANSFER AGENT U.S. Bancorp Fund Services, LLC 615 E. Michigan Street, 3rd Floor Milwaukee, WI 53202 INDEPENDENT REGISTERED PUBLIC ACCOUNTING FIRM PricewaterhouseCoopers LLP 601 South Figueroa Street Los Angeles, CA 90017 LEGAL COUNSEL Morgan, Lewis & Bockius LLP One Federal Street Boston, MA 02110 This report is intended for shareholders of the Brandes International Equity Fund, the Brandes Global Equity Fund, the Brandes Global Equity Income Fund, the Brandes Global Opportunities Value Fund, the Brandes Emerging Markets Value Fund, the Brandes International Small Cap Equity Fund, the Brandes Small Cap Value Fund and the Brandes Core Plus Fixed Income Fund and may not be used as sales literature unless preceded or accompanied by a current prospectus. Statements and other information herein are dated and are subject to change.
SEMI-ANNUAL SEPARATELY MANAGED ACCOUNT RESERVETR UST For the six months ended March 31, 2019 Beginning in January 2021, as permitted by regulations adopted by the U.S. Securities and Exchange Commission, paper copies of the Funds’ annual and semi-annual shareholder reports will no longer be sent by mail, unless you specifically request paper copies of the reports. Instead, the reports will be made available on the Funds’ website (http://www.brandesfunds.com/literature.html), and you will be notified by mail each time a report is posted and provided with a website link to access the report. If you already elected to receive shareholder reports electronically, you will not be affected by this change and you need not take any action. You may elect to receive shareholder reports and other communications from the Funds electronically anytime by contacting your financial intermediary (such as a broker-dealer or a bank) or, if you are a direct investor, by calling 1-800-395-3807, sending an e-mail request to info@brandesfunds.com, or by enrolling at http://www.brandesfunds.com/literature.html. You may elect to receive all future reports in paper free of charge. If you invest through a financial intermediary, you can contact your financial intermediary to request that you continue to receive paper copies of your shareholder reports. If you invest directly with the Funds, you can call 1-800-395-3807 or send an email request to info@brandesfunds.com to let the Funds know you wish to continue receiving paper copies of your shareholder reports. Your election to receive reports in paper will apply to all Funds held in your account with that intermediary if you invest through your financial intermediary or all Funds held with the fund complex if you invest directly with the Funds REPORT

Table of Contents
1
Brandes Separately Managed Account Reserve Trust
Dear Fellow Investor,
The net asset value of the Brandes Separately Managed Account Reserve Trust Fund gained 2.26% in the six months ending March 31, 2019. For the same period, the Bloomberg Barclays Aggregate Bond Index increased 4.63%.
Portfolio holdings in select corporate bonds detracted from performance.
Within corporate bonds holdings in Metals & Mining (Cloud Peak Energy), Telecommunications (Frontier Communications Corp.) and Banks & Thrifts (USB Capital IX) detracted from performance.
An underweight to U.S. agency mortgage-backed securities (MBS) was a positive performance factor, while duration positioning detracted from returns.
At the close of the period, the Fund continues to favor short maturity corporate bonds and those that we believe exhibit strong, tangible asset coverage. The Fund is underweight agency MBS. The duration is positioned toward the shorter end of our duration-controlled range. The Fund has a high allocation, relative to the benchmark, to U.S. Treasuries that we will look to redeploy thoughtfully and efficiently — if and when market uncertainty and volatility cause credit fundamentals to become mispriced from our estimates of intrinsic value.
In the45-plus years since Brandes Investment Partners was founded, our goal has remained the same: pursue above-market gains to help you move closer to your long-term investment objectives. We believe that our unwavering commitment to value investing will lead us to attractively priced, fundamentally sound companies worthy of inclusion in the fund.
Sincerely Yours,
The Brandes Fixed Income Investment Committee
Brandes Investment Trust
Because the values of the Fund’s investments will fluctuate with market conditions, so will the value of your investment in the Fund. You could lose money on your investment in the Fund, or the Fund could underperform other investments. The values of the Fund’s investments fluctuate in response to the activities of individual companies and general stock market and economic conditions. In addition, the performance of foreign securities depends on the political and economic environments and other overall economic conditions in the countries where the Fund invests. Emerging country markets involve greater risk and volatility than more developed markets. Some emerging markets countries may have fixed or managed currencies that are not free-floating against the U.S. dollar. Certain of these currencies have experienced, and may experience in the future, substantial fluctuations or a steady devaluation relative to the U.S. dollar. It is not possible to invest directly in an index.
2
Brandes Separately Managed Account Reserve Trust
As with most fixed income funds, the income on and value of your shares in the Fund will fluctuate along with interest rates. When interest rates rise, the market prices of the debt securities the Fund owns usually decline. When interest rates fall, the prices of these securities usually increase. Generally, the longer the Fund’s average portfolio maturity and the lower the average quality of its portfolio, the greater the price fluctuation. The price of any security owned by the Fund may also fall in response to events affecting the issuer of the security, such as its ability to continue to make principal and interest payments or its credit rating. Below investment grade debt securities are speculative and involve a greater risk of default and price change due to changes in the issuer’s creditworthiness. The market prices of these debt securities may fluctuate more than the market prices of investment grade debt securities and may decline significantly in periods of general economic difficulty.
Asset coverage: Assets available to cover debt obligations after all other liabilities have been satisfied.
Duration: The weighted maturity of a fixed-income investment’s cash flows, used in the estimation of the price sensitivity of fixed-income securities for a given change in interest rates.
Please refer to the Schedule of Investments in the report for complete holdings information. Fund holdings, geographic allocations and/or sector allocations are subject to change at any time and are not a recommendation to buy or sell any security.
The foregoing reflects the thoughts and opinions of Brandes Investment Partners® exclusively and is subject to change without notice.
Brandes Investment Partners® is a registered trademark of Brandes Investment Partners, L.P. in the United States and Canada.
Must be preceded or accompanied by a prospectus.
Index Guide
The Bloomberg Barclays U.S. Aggregate Bond Index is a broad-based benchmark that measures the investment grade, U.S. dollar-denominated, fixed-rate taxable bond market. This index is a total return index which reflects the price changes and interest of each bond in the index.
The Brandes Separately Managed Account Reserve Trust Fund is distributed by ALPS Distributors, Inc.
3
Brandes Separately Managed Account Reserve Trust
The following chart compares the value of a hypothetical $10,000 investment in the Separately Managed Account Reserve Trust from March 31, 2009 to March 31, 2019 with the value of such an investment in the Bloomberg Barclays U.S. Aggregate Bond Index and Bloomberg Barclays U.S. Intermediate Credit Bond Index for the same period.
Value of $10,000 Investment vs Bloomberg Barclays U.S. Aggregate Bond Index & Bloomberg Barclays U.S. Intermediate Credit Bond Index (Unaudited)
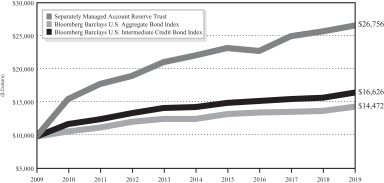
| | | | | | | | | | | | | | | | |
| | | Average Annual Total Return
Periods Ended March 31, 2019 | |
| | | One
Year | | | Five
Years | | | Ten
Years | | | Since
Inception(1) | |
Separately Managed Account | | | | | | | | | | | | | | | | |
Reserve Trust | | | 3.52 | % | | | 3.78 | % | | | 10.34 | % | | | 5.35 | % |
Bloomberg Barclays U.S. Aggregate Bond Index | | | 4.48 | % | | | 2.74 | % | | | 3.77 | % | | | 4.08 | % |
Bloomberg Barclays U.S. Intermediate Credit Bond Index | | | 5.00 | % | | | 2.85 | % | | | 5.22 | % | | | 4.42 | % |
| (1) | The inception date is October 3, 2005. |
Performance data quoted represents past performance; past performance does not guarantee future results. The investment return and principal value of an investment will fluctuate so that an investor’s shares, when redeemed, may be worth more or less than their original cost. Current performance of the Fund may be lower or higher than the performance quoted. Performance data current to the most recent month end may be obtained by calling 800-331-2979.
4
Brandes Separately Managed Account Reserve Trust
The returns shown do not reflect the deduction of taxes that a shareholder would pay on fund distributions or the redemption of fund shares. The Advisor has a fee waiver arrangement in place to limit the Fund’s annual operating expenses.
Asset Allocation as a Percentage of Total Investments as of
March 31, 2019 (Unaudited)
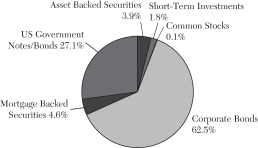
5
Brandes Separately Managed Account Reserve Trust
Expense Example (Unaudited)
As a shareholder of the Fund, you incur ongoing costs, including investment advisory and administrative fees and other Fund expenses. The example below is intended to help you understand your ongoing costs (in dollars) of investing in the Fund and to compare these costs with the ongoing costs of investing in other mutual funds. Note that for this Fund, which is used in wrap-fee programs, fees and expenses are paid at the wrap account level rather than the Fund level.
The example is based on an investment of $1,000 invested at the beginning of the period and held for the entire period from October 1, 2018 to March 31, 2019 (the “Period”).
Actual Expenses
This section provides information about actual account values and actual expenses. The “Ending Account Value” shown is derived from the Fund’s actual returns. You may use the information in this section, together with the amount you invested, to estimate the expenses that you paid over the period. Simply divide your account value by $1,000 (for example, an $8,600 account value divided by $1,000 = 8.6), then multiply the result by the number given for the Fund under the heading “Expenses Paid During Period” to estimate the expenses you paid on your account during this period.
| | | | | | | | | | | | | | | | |
Fund | | Beginning
Account
Value | | | Ending
Account
Value | | | Annual
Expense
Ratio | | | Expenses
Paid
During
the Period* | |
Separately Managed Account Reserve Trust** | | $ | 1,000.00 | | | $ | 1,022.60 | | | | 0.00% | | | $ | 0.00 | |
| * | The Fund’s expenses are equal to the Fund’s expense ratio for the period, multiplied by the average account value over the period, multiplied by 182/365 (to reflect the one half-year period). |
| ** | No expenses have been charged to the Brandes Separately Managed Account Reserve Trust (“SMART Fund”) over the period, as the SMART Fund participates in a wrap-fee program sponsored by investment advisors unaffiliated with the SMART Fund. See Note 3 to the Financial Statements. Fees and expenses are charged at the wrap account level. |
Hypothetical Example for Comparison Purposes
This section provides information about hypothetical account values and hypothetical expenses based on the Fund’s actual expense ratio and an assumed rate of return of 5% per year before expenses, which is not the Fund’s actual return. The hypothetical account values and expenses may not be used to estimate the actual ending account balance or expenses you paid for the period. You may use this information to compare the ongoing costs of investing in the Fund and other mutual funds. To do so, compare this 5% hypothetical example with the 5% hypothetical examples that appear in the shareholder reports of the other mutual funds.
6
Brandes Separately Managed Account Reserve Trust
Please note that the expenses shown in the table are meant to highlight your ongoing costs only and do not reflect any transaction costs, such as brokerage commissions on purchase and sales of Fund shares. Therefore, the last column of the table is useful in comparing ongoing costs only, and will not help you determine the relative total costs of owning different funds. In addition, if these transactional costs were included, your costs would have been higher.
| | | | | | | | | | | | | | | | |
Fund | | Beginning
Account
Value | | | Ending
Account
Value | | | Annual
Expense
Ratio | | | Expenses
Paid
During
the Period* | |
Separately Managed Account Reserve Trust** | | $ | 1,000.00 | | | $ | 1,024.93 | | | | 0.00% | | | $ | 0.00 | |
| * | The Fund’s expenses are equal to the Fund’s expense ratio for the period, multiplied by the average account value over the period, multiplied by 182/365 (to reflect the one half-year period). |
| ** | No expenses have been charged to the Brandes Separately Managed Account Reserve Trust (“SMART Fund”) over the period, as the SMART Fund participates in a wrap-fee program sponsored by investment advisors unaffiliated with the SMART Fund. See Note 3 to the Financial Statements. Fees and expenses are charged at the wrap account level. |
7
Brandes Separately Managed Account Reserve Trust
SCHEDULE OF INVESTMENTS — March 31, 2019 (Unaudited)
| | | | | | | | |
| | | Shares | | | Value | |
| COMMON STOCKS – 0.01% | | | | | | | | |
| | |
| Household Durables – 0.01% | | | | | | | | |
Urbi Desarrollos Urbanos SA de CV(a) | | | 176,124 | | | $ | 12,340 | |
| | | | | | | | |
TOTAL COMMON STOCKS
(Cost $1,887,387) | | | | | | $ | 12,340 | |
| | | | | | | | |
| | |
| | | Principal
Amount | | | Value | |
| FEDERAL AND FEDERALLY SPONSORED CREDITS – 4.62% | | | | | | | | |
| | |
| Federal Home Loan Mortgage Corporation – 1.19% | | | | | | | | |
Pool G1-8578, 3.000%, 12/1/2030 | | $ | 2,064,319 | | | $ | 2,084,665 | |
| | | | | | | | |
| | |
| Federal National Mortgage Association – 3.43% | | | | | | | | |
Pool CA1624, 3.000%, 4/1/2033 | | | 2,727,658 | | | | 2,755,769 | |
Pool AS6201, 3.500%, 11/1/2045 | | | 1,499,443 | | | | 1,525,324 | |
Pool AL9865, 3.000%, 2/1/2047 | | | 1,735,024 | | | | 1,729,737 | |
| | | | | | | | |
| | | | | | | 6,010,830 | |
| | | | | | | | |
TOTAL FEDERAL AND FEDERALLY SPONSORED CREDITS
(Cost $8,030,047) | | | | | | $ | 8,095,495 | |
| | | | | | | | |
| | |
| OTHER MORTGAGE RELATED SECURITIES – 0.00% | | | | | | | | |
| | |
| Collateralized Mortgage Obligations – 0.00% | | | | | | | | |
Wells Fargo Mortgage Backed Securities Trust
Series 2006-AR14, 4.669%, 10/25/2036(c) | | $ | 4,357 | | | $ | 4,224 | |
| | | | | | | | |
TOTAL OTHER MORTGAGE RELATED SECURITIES
(Cost $2,796) | | | | | | $ | 4,224 | |
| | | | | | | | |
| | |
| US GOVERNMENTS – 26.97% | | | | | | | | |
| | |
| Sovereign – 26.97% | | | | | | | | |
United States Treasury Bond
4.750%, 2/15/2037 | | $ | 27,035,000 | | | $ | 35,476,045 | |
United States Treasury Note
2.000%, 2/15/2023 | | | 1,000,000 | | | | 991,211 | |
2.250%, 2/15/2027 | | | 10,825,000 | | | | 10,741,698 | |
| | | | | | | | |
TOTAL US GOVERNMENTS
(Cost $46,210,508) | | | | | | $ | 47,208,954 | |
| | | | | | | | |
| | |
| ASSET BACKED SECURITIES – 3.84% | | | | | | | | |
| | |
| Student Loan – 3.84% | | | | | | | | |
SLM Private Credit Student Loan Trust 2004-B
Series 2004-B, 3.041% (3M LIBOR + 0.430%), 9/15/2033(d) | | $ | 1,500,000 | | | $ | 1,438,987 | |
SLM Private Credit Student Loan Trust 2005-A
Series 2005-A, 2.921% (3M LIBOR + 0.310%), 12/15/2038(d) | | | 1,865,000 | | | | 1,804,375 | |
SLM Private Credit Student Loan Trust 2006-A
Series 2006-A, 2.901% (3M LIBOR + 0.290%), 6/15/2039(d) | | | 3,576,317 | | | | 3,475,780 | |
| | | | | | | | |
TOTAL ASSET BACKED SECURITIES
(Cost $6,365,645) | | | | | | $ | 6,719,142 | |
| | | | | | | | |
The accompanying notes to financial statements are an integral part of this Schedule of Investments.
8
Brandes Separately Managed Account Reserve Trust
SCHEDULE OF INVESTMENTS — March 31, 2019 (Unaudited) (continued)
| | | | | | | | |
| | | Principal
Amount | | | Value | |
| CORPORATE BONDS – 62.22% | | | | | | | | |
| | |
| Automobiles – 3.99% | | | | | | | | |
Ford Motor Credit Co. LLC
8.125%, 1/15/2020 | | $ | 3,405,000 | | | $ | 3,529,022 | |
General Motors Financial Co., Inc.
2.650%, 4/13/2020 | | | 3,460,000 | | | | 3,446,121 | |
| | | | | | | | |
| | | | | | | 6,975,143 | |
| | | | | | | | |
| | |
| Banks – 11.11% | | | | | | | | |
Citibank, N.A.
2.100%, 6/12/2020 | | | 5,592,000 | | | | 5,551,818 | |
Goldman Sachs Group, Inc.
3.000%, 4/26/2022 | | | 3,405,000 | | | | 3,397,615 | |
JPMorgan Chase & Co.
6.221% (3M LIBOR + 3.470%), Perpetual(d) | | | 4,523,000 | | | | 4,545,615 | |
USB Capital IX
3.807% (3M LIBOR + 1.020%, minimum of 3.500%), Perpetual(d) | | | 3,250,000 | | | | 2,551,250 | |
Wells Fargo & Co.
6.381% (3M LIBOR + 3.770%), Perpetual(d) | | | 3,380,000 | | | | 3,401,125 | |
| | | | | | | | |
| | | | | | | 19,447,423 | |
| | | | | | | | |
| | |
| Commercial Services & Supplies – 4.90% | | | | | | | | |
ADT Corp.
3.500%, 7/15/2022 | | | 7,270,000 | | | | 7,006,462 | |
Iron Mountain, Inc.
4.875%, 9/15/2027(b) | | | 1,640,000 | | | | 1,574,400 | |
| | | | | | | | |
| | | | | | | 8,580,862 | |
| | | | | | | | |
| | |
| Consumer Products – 3.33% | | | | | | | | |
Avon International Operations, Inc.
7.875%, 8/15/2022(b) | | | 3,695,000 | | | | 3,828,944 | |
Wyndham Destinations, Inc.
3.900%, 3/1/2023 | | | 2,035,000 | | | | 1,994,300 | |
| | | | | | | | |
| | | | | | | 5,823,244 | |
| | | | | | | | |
| | |
| Food, Beverage & Tobacco – 3.19% | | | | | | | | |
Mead Johnson Nutrition Co.
4.900%, 11/1/2019 | | | 2,850,000 | | | | 2,883,552 | |
Pilgrim’s Pride Corp.
5.750%, 3/15/2025(b) | | | 2,665,000 | | | | 2,691,650 | |
| | | | | | | | |
| | | | | | | 5,575,202 | |
| | | | | | | | |
| | |
| Health Care Providers & Services – 3.13% | | | | | | | | |
Tenet Healthcare Corp.
6.000%, 10/1/2020 | | | 5,290,000 | | | | 5,481,763 | |
| | | | | | | | |
The accompanying notes to financial statements are an integral part of this Schedule of Investments.
9
Brandes Separately Managed Account Reserve Trust
SCHEDULE OF INVESTMENTS — March 31, 2019 (Unaudited) (continued)
| | | | | | | | |
| | | Principal
Amount | | | Value | |
| | |
| Homebuilders – 3.29% | | | | | | | | |
PulteGroup, Inc.
5.500%, 3/1/2026 | | $ | 3,920,000 | | | $ | 4,037,600 | |
Toll Brothers Finance Corp.
4.875%, 11/15/2025 | | | 1,710,000 | | | | 1,720,687 | |
| | | | | | | | |
| | | | | | | 5,758,287 | |
| | | | | | | | |
| | |
| Insurance – 2.43% | | | | | | | | |
American International Group, Inc.
6.400%, 12/15/2020 | | | 2,785,000 | | | | 2,945,123 | |
CNA Financial Corp.
5.875%, 8/15/2020 | | | 1,250,000 | | | | 1,299,841 | |
| | | | | | | | |
| | | | | | | 4,244,964 | |
| | | | | | | | |
| | |
| Media – 1.08% | | | | | | | | |
Netflix, Inc.
5.375%, 2/1/2021 | | | 1,815,000 | | | | 1,884,764 | |
| | | | | | | | |
| | |
| Metals & Mining – 0.21% | | | | | | | | |
Cloud Peak Energy Resources, LLC/Cloud Peak Energy Finance Corp.
12.000%, 11/1/2021(e) | | | 2,055,000 | | | | 369,900 | |
| | | | | | | | |
| | |
| Oil, Gas & Consumable Fuels – 12.52% | | | | | | | | |
BP Capital Markets Plc
3.506%, 3/17/2025 | | | 3,375,000 | | | | 3,440,624 | |
Chesapeake Energy Corp.
8.000%, 1/15/2025 | | | 5,105,000 | | | | 5,207,100 | |
Chevron Corp.
2.100%, 5/16/2021 | | | 3,460,000 | | | | 3,435,179 | |
Kinder Morgan, Inc.
4.300%, 6/1/2025 | | | 1,921,000 | | | | 2,003,577 | |
Occidental Petroleum Corp.
3.500%, 6/15/2025 | | | 1,705,000 | | | | 1,751,728 | |
Range Resources Corp.
5.000%, 3/15/2023 | | | 6,195,000 | | | | 6,071,100 | |
| | | | | | | | |
| | | | | | | 21,909,308 | |
| | | | | | | | |
| | |
| Retail – 2.44% | | | | | | | | |
JC Penney Corp, Inc.
5.875%, 7/1/2023(b) | | | 5,075,000 | | | | 4,275,687 | |
| | | | | | | | |
| | |
| Technology – 4.27% | | | | | | | | |
Microsoft Corp.
2.400%, 2/6/2022 | | | 3,460,000 | | | | 3,455,050 | |
VMware, Inc.
3.900%, 8/21/2027 | | | 4,176,000 | | | | 4,014,511 | |
| | | | | | | | |
| | | | | | | 7,469,561 | |
| | | | | | | | |
The accompanying notes to financial statements are an integral part of this Schedule of Investments.
10
Brandes Separately Managed Account Reserve Trust
SCHEDULE OF INVESTMENTS — March 31, 2019 (Unaudited) (continued)
| | | | | | | | |
| | | Principal
Amount | | | Value | |
| | |
| Telecommunications – 6.33% | | | | | | | | |
AT&T, Inc.
3.000%, 6/30/2022 | | $ | 5,235,000 | | | $ | 5,258,077 | |
Frontier Communications Corp.
6.250%, 9/15/2021 | | | 5,640,000 | | | | 4,371,000 | |
Telefonica Emisiones SA
5.462%, 2/16/2021 | | | 1,390,000 | | | | 1,452,552 | |
| | | | | | | | |
| | | | | | | 11,081,629 | |
| | | | | | | | |
TOTAL CORPORATE BONDS
(Cost $109,613,090) | | | | | | $ | 108,877,737 | |
| | | | | | | | |
| | |
| REPURCHASE AGREEMENTS – 1.84% | | | | | | | | |
State Street Bank and Trust Repurchase Agreement,
(Dated 03/29/19), due 04/01/19, 1.20% [Collateralized
by $2,980,000 US Treasury Notes TIPS, 0.125%, 01/15/22,
(Market Value $3,285,209)] (proceeds $3,216,163) | | $ | 3,215,842 | | | $ | 3,215,842 | |
| | | | | | | | |
TOTAL REPURCHASE AGREEMENTS
(Cost $3,215,842) | | | | | | $ | 3,215,842 | |
| | | | | | | | |
Total Investments (Cost $175,325,315) – 99.50% | | | | | | $ | 174,133,734 | |
Other Assets in Excess of Liabilities – 0.50% | | | | | | | 877,900 | |
| | | | | | | | |
TOTAL NET ASSETS – 100.00% | | | | | | $ | 175,011,634 | |
| | | | | | | | |
Percentages are stated as a percent of net assets.
TIPS Treasury Inflation-Protected Security
LIBOR London Inter-bank Offered Rate
| (a) | Non-income producing security. |
| (b) | Acquired in a transaction exempt from registration under Rule 144A or Section 4(a)(2) of the Securities Act of 1933. May be resold in the U.S. in transactions exempt from registration, normally to qualified institutional buyers. The total value of all such securities was $12,370,681, which represented 7.07% of the net assets of the Fund. |
| (c) | Variable rate security. The coupon is based on an underlying pool of loans. |
| (d) | Variable rate security. The coupon is based on a reference index and spread index. |
| (e) | Issuer is in default of interest payments. |
The industry classifications represented in the Schedule of Investments are comprised in accordance with Global Industry Classification Standards (GICS®), which was developed by and/or is the exclusive property of MSCI, Inc. and Standard & Poor Financial Services LLC or were otherwise determined by the Adviser to be appropriate. This information is unaudited.
The accompanying notes to financial statements are an integral part of this Schedule of Investments.
11
Brandes Separately Managed Account Reserve Trust
STATEMENT OF ASSETS AND LIABILITIES — March 31, 2019 (Unaudited)
| | | | |
ASSETS | | | | |
Investments in securities, at cost | | $ | 175,325,315 | |
| | | | |
Investment in securities, at value | | | 174,133,734 | |
Cash | | | 3,448,448 | |
Receivables: | | | | |
Fund shares sold | | | 11,869 | |
Interest | | | 1,361,897 | |
| | | | |
Total Assets | | | 178,955,948 | |
| | | | |
LIABILITIES | | | | |
Payables: | | | | |
Securities purchased | | | 3,298,746 | |
Fund shares redeemed | | | 569,672 | |
Dividends payable | | | 75,896 | |
| | | | |
Total Liabilities | | | 3,944,314 | |
| | | | |
NET ASSETS | | $ | 175,011,634 | |
| | | | |
COMPONENTS OF NET ASSETS | | | | |
Capital Stock | | $ | 185,599,504 | |
Total distributable earnings | | | (10,587,870 | ) |
| | | | |
Total Net Assets | | $ | 175,011,634 | |
| | | | |
Net asset value, offering price and redemption proceeds per share | | | | |
Net Assets | | $ | 175,011,634 | |
Shares outstanding (unlimited shares authorized without par value) | | | 20,239,556 | |
Offering and redemption price | | $ | 8.65 | |
| | | | |
The accompanying notes to financial statements are an integral part of this statement.
12
Brandes Separately Managed Account Reserve Trust
STATEMENT OF OPERATIONS — For the Six Months Ended March 31, 2019 (Unaudited)
| | | | |
INVESTMENT INCOME | | | | |
Income | | | | |
Interest income | | $ | 3,850,250 | |
| | | | |
Total Income | | | 3,850,250 | |
| | | | |
Expenses (Note 3) | | | | |
Total expenses | | | — | |
| | | | |
Total net expenses | | | — | |
| | | | |
Net investment income | | | 3,850,250 | |
| | | | |
REALIZED AND UNREALIZED GAIN (LOSS) ON INVESTMENTS: | | | | |
Net realized loss on investments | | | (500,787 | ) |
Net change in unrealized appreciation on investments | | | 338,164 | |
| | | | |
Net realized and unrealized loss on investments | | | (162,623 | ) |
| | | | |
Net Increase in net assets resulting from operations | | $ | 3,687,627 | |
| | | | |
The accompanying notes to financial statements are an integral part of this statement.
13
Brandes Separately Managed Account Reserve Trust
STATEMENT OF CHANGES IN NET ASSETS
| | | | | | | | |
| | | Six Months
Ended
March 31,
2019 | | | Year Ended
September 30,
2018(1) | |
| | | (Unaudited) | | | | |
INCREASE IN NET ASSETS FROM: | | | | | | | | |
OPERATIONS | | | | | | | | |
Net investment income | | $ | 3,850,250 | | | $ | 7,887,915 | |
Net realized gain (loss) on investments | | | (500,787 | ) | | | 1,068,915 | |
Net change in unrealized appreciation (depreciation) on investments | | | 338,164 | | | | (6,901,291 | ) |
| | | | | | | | |
Net increase in net assets resulting from operations | | | 3,687,627 | | | | 2,055,539 | |
| | | | | | | | |
DISTRIBUTIONS TO SHAREHOLDERS | | | | | | | | |
Distributions to Shareholders | | | (3,863,044 | ) | | | (7,860,061 | ) |
| | | | | | | | |
Decrease in net assets from distributions | | | (3,863,044 | ) | | | (7,860,061 | ) |
| | | | | | | | |
CAPITAL SHARE TRANSACTIONS | | | | | | | | |
Proceeds from shares sold | | | 21,601,969 | | | | 32,406,816 | |
Net asset value of shares issued on reinvestment of distributions | | | 3,657,654 | | | | 7,523,525 | |
Cost of shares redeemed | | | (26,707,897 | ) | | | (34,163,795 | ) |
| | | | | | | | |
Net increase (decrease) in net assets from capital share transactions | | | (1,448,274 | ) | | | 5,766,546 | |
| | | | | | | | |
Total decrease in net assets | | | (1,623,691 | ) | | | (37,976 | ) |
| | | | | | | | |
NET ASSETS | | | | | | | | |
Beginning of the Period | | | 176,635,325 | | | | 176,673,301 | |
| | | | | | | | |
End of the Period | | | 175,011,634 | | | | 176,635,325 | |
| | | | | | | | |
| (1) | Distributions to shareholders includes net investment income distributions of $7,860,061. End of period net assets includes accumulated undistributed net investment income of $50,508. |
The accompanying notes to financial statements are an integral part of this statement.
14
Brandes Separately Managed Account Reserve Trust
FINANCIAL HIGHLIGHTS
| | | | | | | | | | | | | | | | | | | | | | | | |
| | | Six Months
Ended
March 31,
2019 | | | Year Ended September 30, | |
| | | 2018 | | | 2017 | | | 2016 | | | 2015 | | | 2014 | |
| | | (Unaudited) | | | | | | | | | | | | | | | | |
Net asset value, beginning of period | | $ | 8.65 | | | $ | 8.94 | | | $ | 9.02 | | | $ | 8.69 | | | $ | 9.03 | | | $ | 8.89 | |
| | | | | | | | | | | | | | | | | | | | | | | | |
Total from investment operations: | | | | | | | | | | | | | | | | | | | | | | | | |
Net investment income(2) | | | 0.19 | | | | 0.39 | | | | 0.39 | | | | 0.44 | | | | 0.43 | | | | 0.46 | |
Net realized and unrealized gain/(loss) on investments | | | 0.00 | (5) | | | (0.29 | ) | | | (0.08 | ) | | | 0.33 | | | | (0.34 | ) | | | 0.16 | |
| | | | | | | | | | | | | | | | | | | | | | | | |
Total from investment operations | | | 0.19 | | | | 0.10 | | | | 0.31 | | | | 0.77 | | | | 0.09 | | | | 0.62 | |
| | | | | | | | | | | | | | | | | | | | | | | | |
Less dividends and distributions: | | | | | | | | | | | | | | | | | | | | | | | | |
Dividends from net investment income | | | (0.19 | ) | | | (0.39 | ) | | | (0.39 | ) | | | (0.44 | ) | | | (0.43 | ) | | | (0.48 | ) |
| | | | | | | | | | | | | | | | | | | | | | | | |
Total dividends and distributions | | | (0.19 | ) | | | (0.39 | ) | | | (0.39 | ) | | | (0.44 | ) | | | (0.43 | ) | | | (0.48 | ) |
| | | | | | | | | | | | | | | | | | | | | | | | |
Net asset value, end of period | | $ | 8.65 | | | $ | 8.65 | | | $ | 8.94 | | | $ | 9.02 | | | $ | 8.69 | | | $ | 9.03 | |
| | | | | | | | | | | | | | | | | | | | | | | | |
Total return | | | 2.26 | %(3) | | | 1.12 | % | | | 3.57 | % | | | 9.24 | % | | | 0.93 | % | | | 7.13 | % |
Net assets, end of period (millions) | | $ | 175.0 | | | $ | 176.6 | | | $ | 176.7 | | | $ | 163.9 | | | $ | 159.8 | | | $ | 138.3 | |
Ratio of expenses to average net assets(1) | | | 0.00 | %(4) | | | 0.00 | % | | | 0.00 | % | | | 0.00 | % | | | 0.00 | % | | | 0.00 | % |
Ratio of net investment income to average net assets(1) | | | 4.47 | %(4) | | | 4.43 | % | | | 4.39 | % | | | 5.12 | % | | | 4.77 | % | | | 5.12 | % |
Portfolio turnover rate | | | 17.55 | %(3) | | | 42.90 | % | | | 39.74 | % | | | 53.60 | % | | | 32.78 | % | | | 21.61 | % |
| (1) | Reflects the fact that no fees or expenses are incurred by the Fund. The Fund is an integral part of “wrap-fee” programs sponsored by investment advisers and/or broker-dealers unaffiliated with the Fund or the Advisor. Participants in these programs pay a “wrap” fee to the sponsor of the program. |
| (2) | Net investment income per share has been calculated based on average shares outstanding during the period. |
| (5) | Amount is less than $0.01 per share. |
The accompanying notes to financial statements are an integral part of this statement.
15
Brandes Separately Managed Account Reserve Trust
NOTES TO FINANCIAL STATEMENTS
NOTE 1 – ORGANIZATION
The Separately Managed Account Reserve Trust (the “Fund”) is a series of Brandes Investment Trust (the “Trust”). The Trust is registered under the Investment Company Act of 1940, as amended (the “1940 Act”), as a diversified, open-end management investment company. The Fund began operations on October 3, 2005. The Fund invests its assets primarily in debt securities and seeks to maximize total return.
NOTE 2 – SIGNIFICANT ACCOUNTING POLICIES
The Fund is an investment company that applies the accounting and reporting guidance issued in Topic 946, “Financial Services-Investment Companies”, by the Financial Accounting Standards Board (“FASB”). The following is a summary of significant accounting policies consistently followed by the Fund. These policies are in conformity with accounting principles (“GAAP”) generally accepted in the United States of America.
| | A. | Repurchase Agreements. The Fund may enter into repurchase agreements with government securities dealers recognized by the Federal Reserve Board, with member banks of the Federal Reserve System or with other brokers or dealers that meet the credit guidelines established by the Board of Trustees. The Fund will always receive and maintain, as collateral, securities whose market value, including accrued interest (which is recorded in the Schedule of Investments), will be at least equal to 100% of the dollar amount invested by the Fund in each agreement, and the Fund will make payment for such securities only upon physical delivery or upon evidence of book entry transfer to the account of the Fund’s custodian. If the term of any repurchase transaction exceeds one business day, the value of the Fund’s collateral is marked-to-market on a daily basis to ensure the adequacy of the collateral. Before causing the Fund to enter into a repurchase agreement with any other party, the investment advisor will determine that such party does not have any apparent risk of becoming involved in bankruptcy proceedings within the time frame contemplated by the repurchase agreement. If the seller defaults and the value of the collateral declines, or if bankruptcy proceedings are commenced with respect to the seller of the security, realization of the collateral by the Fund may be delayed or limited. At March 31, 2019, the Fund’s ongoing exposure to the economic return on repurchase agreements is shown on the Schedule of Investments. |
| | B. | Foreign Currency Translation and Transactions. Values of investments denominated in foreign currencies are converted into U.S. dollars using the spot market rates of exchange at the time of valuation. Purchases and sales of investments and dividend and interest income are translated into U.S. dollars using the spot market rates of exchange prevailing on the |
16
Brandes Separately Managed Account Reserve Trust
NOTES TO FINANCIAL STATEMENTS (continued)
| | respective dates of such translations. The gain or loss resulting from changes in foreign exchange rates is included with net realized and unrealized gain or loss from investments, as appropriate. Foreign securities and currency transactions may involve certain considerations and risks not typically associated with those of domestic origin. |
Foreign securities are recorded in the financial statements after translation to U.S. dollars based on the applicable exchange rate at the end of the period. The Fund reports certain foreign currency-related transactions as components of realized gains or losses for financial reporting purposes, whereas such components are treated as ordinary income for federal income tax purposes.
| | C. | Delayed Delivery Securities. The Fund may purchase securities on a when-issued or delayed delivery basis. “When-issued” or delayed delivery refers to securities whose terms are available and for which a market exists, but that have not been issued. For a when-issued or delayed delivery transaction, no payment is made until delivery date, which is typically longer than the normal course of settlement. When the Fund enters into an agreement to purchase securities on a when-issued or delayed delivery basis, the Fund segregates cash or liquid securities, of any type or maturity, equal in value to the Fund’s commitment. Losses may arise if the market values of the underlying securities change, if the counterparty does not perform under the contract, or if the issuer does not issue the securities due to political, economic or other factors. The Fund did not have any open commitments on delayed delivery securities as of March 31, 2019. |
| | D. | Security Transactions, Dividends and Distributions. Security transactions are accounted for on the trade dates. Realized gains and losses are evaluated on the basis of identified costs. Distributions from net investment income are declared daily and paid monthly. Distributions of net realized gains, if any, are declared at least annually. Dividend income and distributions to shareholders are recorded on the ex-dividend dates. Interest is recorded on an accrual basis. The Fund amortizes premiums and accretes discounts using the constant yield method. |
| | E. | Use of Estimates. The preparation of financial statements in conformity with accounting principles generally accepted in the United States of America requires management to make estimates and assumptions that affect the reported amounts of assets and liabilities at the date of the financial statements and reported amounts of income and expenses during the reporting period. Actual results could differ from those estimates. |
| | F. | Indemnification Obligations. Under the Trust’s organizational documents, its current and former officers and trustees are indemnified against certain liabilities arising out of the performance of their duties to the Trust. The |
17
Brandes Separately Managed Account Reserve Trust
NOTES TO FINANCIAL STATEMENTS (continued)
| | Trust has indemnified its trustees against any expenses actually and reasonably incurred by the trustees in any proceeding arising out of or in connection with the trustees’ service to the Trust. In addition, in the normal course of business, the Trust enters into contracts that contain a variety of representations and warranties and provide general indemnifications. The Fund’s maximum exposure under these arrangements is unknown as this would involve future claims that may be made against the Fund that have not yet occurred or that would be covered by other parties. |
| | G. | Accounting for Uncertainty in Income Taxes. The Fund has elected to be taxed as a “regulated investment company” and intends to distribute substantially all its taxable income to its shareholders and otherwise comply with the provisions of the Internal Revenue Code applicable to regulated investment companies. The Fund may be subject to a nondeductible excise tax calculated as a percentage of certain undistributed amounts of net investment income and net capital gains. The Fund intends to distribute its net investment income and capital gains as necessary to avoid this excise tax. Therefore, no provision for federal income taxes or excise taxes has been made. |
The Trust analyzes all open tax years, as defined by the applicable statute of limitations, for all major jurisdictions. Open tax years for the Fund are those that are open for exam by taxing authorities (2015 through 2018). As of March 31, 2019, the Trust has no examinations in progress.
Management has analyzed the Trust’s tax positions, and has concluded that no liability should be recorded related to uncertain tax positions expected to be taken on the tax return for the fiscal year-end September 30, 2018.
The Trust identifies its major tax jurisdictions as the U.S. Government and the State of California. The Trust is not aware of any tax positions for which it is reasonably possible that the total amounts of unrecognized tax benefits will significantly change in the next twelve months.
| | H. | Fair Value Measurements. The Trust has adopted GAAP accounting principles related to fair value accounting standards which establish a definition of fair value and set out a hierarchy for measuring fair value. These standards require additional disclosures about the various inputs and valuation techniques used to develop the measurements of fair value and a discussion of changes in valuation techniques and related inputs during the period. These inputs are summarized in the three broad levels listed below: |
Level 1 — Fair value measurement within Level 1 should be based on an unadjusted quoted price in an active market that the Fund has the ability to access for the asset or liability at the measurement date. Because a quoted price alone forms the basis for the measurement, the access
18
Brandes Separately Managed Account Reserve Trust
NOTES TO FINANCIAL STATEMENTS (continued)
requirement within Level 1 limits discretion in pricing the asset or liability, including in situations in which there are multiple markets for the asset or liability with different prices and no single market represents a principal market for the asset or liability. Importantly, the Financial Accounting Standards Board has indicated that when a quoted price in an active market for a security is available, that price should be used to measure fair value without regard to an entity’s intent to transact at that price.
Level 2 — Fair value measurement within Level 2 should be based on all inputs other than unadjusted quoted prices included within Level 1 that are observable for the asset or liability. Other significant observable market inputs include quoted prices for similar instruments in active markets, quoted adjusted prices in active markets, quoted prices for identical or similar instruments in markets that are not active, and model-derived valuations in which the majority of significant inputs and significant value drivers are observable in active markets.
Level 3 — Fair value measurement within Level 3 should be based on unobservable inputs in such cases where markets do not exist or are illiquid. Significant unobservable inputs include model derived valuations in which the majority of significant inputs or significant value drivers are unobservable. Unobservable inputs are those inputs that reflect the Fund’s own assumptions that market participants would use to price the asset or liability based on the best available information.
| | I. | Security Valuation. Bonds and other fixed-income securities (other than repurchase agreements and demand notes) are valued using the bid price on the day of the valuation provided by an independent pricing service. |
Securities traded on a national securities exchange are valued at the last reported sale price at the close of regular trading on each day the exchange is open for trading. Securities listed on the NASDAQ National Market System for which market quotations are readily available are valued using the NASDAQ Official Closing Price. Securities traded on an exchange for which there has been no sales on the valuation date are valued at the mean between last bid and ask price on such day. Securities for which quotations are not readily available are valued at their respective fair values as determined in good faith pursuant to procedures adopted by the Board of Trustees.
Repurchase agreements and demand notes, for which neither vendor pricing nor market maker prices are available, are valued at amortized cost on the day of valuation, unless Brandes Investment Partners, L.P. (the “Advisor”) determines that the use of amortized cost valuation on such day is not appropriate (in which case such instrument is fair valued in accordance with the fair value procedures of the Trust).
19
Brandes Separately Managed Account Reserve Trust
NOTES TO FINANCIAL STATEMENTS (continued)
The Trust has adopted valuation procedures that allow for fair value pricing for use in appropriate circumstances. For example, such circumstances may arise when trading in a security has been halted or suspended or a security has been delisted from a national exchange, a security has not been traded for an extended period of time, or a significant event with respect to a security occurs after the close of the market or exchange on which the security principally trades and before the time the Fund calculates its own share price. If no price, or in the Advisor’s determination no price representing fair value, is provided for a security held by the Fund by an independent pricing agent, then the security will be fair valued. Thinly traded securities and certain foreign securities may be impacted more by the use of fair valuations than other securities.
In using fair value pricing, the Fund attempts to establish the price that it might reasonably have expected to receive upon a sale of the security at 4:00 p.m. Eastern time. Valuing securities at fair value involves greater reliance on judgment than valuation of securities based on readily available market quotations. When using fair value to price securities, the Fund may value those securities higher or lower than another fund using market quotations or fair value to price the same securities. Further, there can be no assurance that the Fund could obtain the fair value assigned to a security if it were to sell the security at approximately the time at which the Fund determines its net asset value.
Foreign securities are recorded in the financial statements after translation to U.S. dollars based on the applicable exchange rate at the end of the period. The Fund reports certain foreign currency-related transactions as components of realized gains or losses for financial reporting purposes, whereas such components are treated as ordinary income for federal income tax purposes.
Fixed income securities including corporate, convertible and municipal bonds and notes, U.S. government agencies, U.S. Treasury obligations, sovereign issues, bank loans, convertible preferred securities and non-U.S. bonds are normally valued on the basis of quotes obtained from brokers and dealers or independent pricing services or sources. Independent pricing services typically use information provided by market makers or estimates of market values obtained from yield data relating to investments or securities with similar characteristics. The service providers’ internal models use inputs that are observable such as, among other things, issuer details, interest rates, yield curves, prepayment speeds, credit risks/spreads, default rates and quoted prices for similar assets. Securities that use similar valuation techniques and inputs as described above are categorized as Level 2 of the fair value hierarchy.
20
Brandes Separately Managed Account Reserve Trust
NOTES TO FINANCIAL STATEMENTS (continued)
Fixed income securities purchased on a delayed-delivery basis are typically marked to market daily until settlement at the forward settlement date.
The Fund may enter into mortgage dollar roll transactions in which the Fund sells a mortgage-backed security to a counterparty and simultaneously enters into an agreement with the same counterparty to buy back a similar security on a specific future date at a predetermined price. Risks may arise due to the delayed payment date and the potential inability of counterparties to complete the transaction. Mortgage dollar rolls are accounted for as purchase and sale transactions, which may increase the Fund’s portfolio turnover rate.
Mortgage and asset-backed securities are usually issued as separate tranches, or classes, of securities within each package of underlying securities. These securities are also normally valued by pricing service providers that use broker-dealer quotations or valuation estimates from their internal pricing models. The pricing models for these securities usually consider tranche level attributes, estimated cash flows and market-based yield spreads for each tranche, current market data and packaged collateral performance, as available. Mortgage and asset-backed securities that use such valuation techniques and inputs are categorized as Level 2 of the fair value hierarchy only if there are significant observable inputs used.
Common stocks, exchange-traded fund shares and financial derivative instruments, such as futures contracts or options contracts that are traded on a national securities or commodities exchange, are valued at the last reported sales price, in the case of common stocks and exchange-traded fund shares, or, in the case of futures contracts or options contracts, the settlement price determined by the relevant exchange. To the extent these securities are actively traded and valuation adjustments are not applied, they are categorized as Level 1 of the fair value hierarchy.
Valuation adjustments may be applied to certain securities that are solely traded on a foreign exchange to account for the market movement between the close of the foreign market and the close of the New York Stock Exchange (“NYSE”). These securities are generally valued using pricing service providers that consider the correlation of the trading patterns of the foreign security to the intraday trading in the U.S. markets for investments. Securities using these valuation adjustments are categorized as Level 2 of the fair value hierarchy. None of the Fund’s securities were fair valued utilizing this method as of March 31, 2019.
Investments in registered open-end management investment companies are valued based upon the Net Asset Values (“NAVs”) of such investments and are categorized as Level 1 of the fair value hierarchy. If, on a particular day, a share price of an investment company is not readily
21
Brandes Separately Managed Account Reserve Trust
NOTES TO FINANCIAL STATEMENTS (continued)
available, such securities are fair valued in accordance with the fair value procedures of the Trust.
Certain securities may be fair valued in accordance with the fair valuation procedures approved by the Board of Trustees. The Valuation Committee is generally responsible for overseeing the day to day valuation processes and reports periodically to the Board. The Valuation Committee is authorized to make all necessary determinations of the fair value of portfolio securities and other assets for which market quotations are not readily available or if it is deemed that the prices obtained from brokers and dealers or independent pricing services are unreliable.
The following is a summary of the inputs used, as of March 31, 2019, involving the Fund’s assets carried at fair value. The inputs of methodology used for valuing securities may not be an indication of the risk associated with investing in those securities.
| | | | | | | | | | | | | | | | |
Description | | Level 1 | | | Level 2 | | | Level 3 | | | Total | |
Separately Managed Account
Reserve Trust | | | | | | | | | | | | | | | | |
Common Stocks | | $ | 12,340 | | | $ | — | | | $ | — | | | $ | 12,340 | |
Mortgage Backed Securities | | | — | | | | 8,099,719 | | | | — | | | | 8,099,719 | |
Government Securities | | | — | | | | 47,208,954 | | | | — | | | | 47,208,954 | |
Asset Backed Securities | | | — | | | | 6,719,142 | | | | — | | | | 6,719,142 | |
Corporate Bonds | | | — | | | | 108,877,737 | | | | — | | | | 108,877,737 | |
Repurchase Agreements | | | — | | | | 3,215,842 | | | | — | | | | 3,215,842 | |
| | | | | | | | | | | | | | | | |
Total Investments in Securities | | $ | 12,340 | | | $ | 174,121,394 | | | $ | — | | | $ | 174,133,734 | |
| | | | | | | | | | | | | | | | |
There were no Level 3 securities in the Fund at the beginning or the end of the six months ended March 31, 2019.
NOTE 3 – INVESTMENT ADVISORY FEE AND OTHER TRANSACTIONS WITH AFFILIATES
| | A. | Advisor Fee. The Advisor provides the Fund with investment management services under an Investment Advisory Agreement. The Advisor receives no advisory fee or other fee from the Fund. The financial statements of the Fund reflect the fact that no fees or expenses are incurred by the Fund. It should be understood, however, that the Fund is an integral part of “wrap-fee” programs sponsored by investment advisors unaffiliated with the Fund and the Advisor. Typically, participants in these programs pay a “wrap-fee” to their investment advisors. Although the Fund does not compensate the Advisor directly for its service under the Investment Advisory Agreement, the Advisor benefits from its relationships with the sponsors of wrap-fee programs for which the Fund is an investment option. Certain officers and Trustees of the Trust are also officers of the Advisor. |
22
Brandes Separately Managed Account Reserve Trust
NOTES TO FINANCIAL STATEMENTS (continued)
| | B. | Administration Fee. U.S. Bancorp Fund Services, LLC, doing business as U.S. Bank Global Fund Services, (the “Administrator”) acts as administrator for the Fund. The Administrator prepares various federal and state regulatory filings; prepares reports and materials to be supplied to the Trustees; monitors the activities of the Fund’s custodian, transfer agent and accountant; coordinates the preparation and payment of Fund expenses; and prepares several Fund reports. The Advisor compensates the Administrator on behalf of the Fund for the services the Administrator performs for the Fund. |
| | C. | Distribution Fees. ALPS Distributors, Inc. (the “Distributor”), a registered broker-dealer, acts as the Fund’s principal underwriter in a continuous public offering of the Fund’s shares. All of the Fund’s distribution fees are paid by the Advisor. |
NOTE 4 – PURCHASES AND SALES OF SECURITIES
The cost of purchases and the proceeds from sales of securities of the Fund, excluding short-term investments, were as follows for the six months ended March 31, 2019:
| | | | | | | | | | | | | | |
| U.S. Government | | | Other | |
| Purchases | | | Sales | | | Purchases | | | Sales | |
| $ | 17,741,992 | | | $ | 11,678,086 | | | $ | 11,437,556 | | | $ | 23,759,487 | |
NOTE 5 – CAPITAL STOCK TRANSACTIONS
The Fund’s capital stock activity in shares and dollars during the six months ended March 31, 2019 and year ended September 30, 2018, was as follows (shares and dollar amounts in thousands):
| | | | | | | | | | | | | | | | |
| | | Six Months Ended
3/31/2019 | | | Year Ended
9/30/2018 | |
| | | Shares | | | Amount | | | Shares | | | Amount | |
Shares Sold | | | 2,535 | | | $ | 21,602 | | | | 3,693 | | | $ | 32,407 | |
Issued on Reinvestment of Distributions | | | 430 | | | | 3,658 | | | | 859 | | | | 7,524 | |
Shares Redeemed | | | (3,138 | ) | | | (26,708 | ) | | | (3,902 | ) | | | (34,164 | ) |
| | | | | | | | | | | | | | | | |
Net Increase/(Decrease) Resulting from Fund Share Transactions | | | (173 | ) | | $ | (1,448 | ) | | | 650 | | | $ | 5,767 | |
| | | | | | | | | | | | | | | | |
NOTE 6 – FEDERAL INCOME TAX MATTERS
GAAP requires that certain components of net assets be reclassified between financial and tax reporting. Temporary differences do not require reclassification. Temporary and permanent differences have no effect on net assets or net asset value per share. For the year ended September 30, 2018, the Fund made the following permanent book-to-tax reclassifications primarily related to the treatment
23
Brandes Separately Managed Account Reserve Trust
NOTES TO FINANCIAL STATEMENTS (continued)
of paydowns, the difference between book and tax accretion methods for market premium and the expiration of capital loss carryforwards:
| | | | | | | | | | |
Undistributed Net
Investment Income | | | Accumulated Net
Realized Gain | | | Paid-In Capital | |
| $ | 22,654 | | | $ | 6,062,094 | | | $ | (6,084,748 | ) |
As of September 30, 2018, the Fund’s components of distributable earnings on a tax basis were as follows:
| | | | |
Cost of investments for tax purposes | | $ | 182,729,582 | |
| | | | |
Gross tax unrealized appreciation | | | 4,113,287 | |
Gross tax unrealized depreciation | | | (5,666,441 | ) |
| | | | |
Net unrealized depreciation on investments | | | (1,553,154 | ) |
Distributable ordinary income | | | 50,508 | |
Distributable long-term capital gains | | | — | |
| | | | |
Total distributable earnings | | | 50,508 | |
| | | | |
Other accumulated losses | | | (8,909,807 | ) |
| | | | |
Total accumulated losses | | $ | (10,412,453 | ) |
| | | | |
The differences between book and tax basis distributable earnings are primarily related to the differences in classification of paydown gains and losses for tax purposes compared to book purposes. The difference between book and tax basis unrealized depreciation on investments is due primarily to timing differences resulting from wash sale transactions. These differences are temporary.
As of September 30, 2018, the Fund had a capital loss expiring on September 30, 2019 in the amount of $6,501,831. As of September 30, 2018, the Fund had a capital loss with an indefinite expiration in the amount of $2,407,976. At September 30, 2018, the Fund utilized $1,069,670 of capital loss carryforwards. At September 30, 2018, the Fund had $6,084,748 of capital loss carryforwards expire.
The tax compositions of dividends for the years ended September 30, 2018 and September 30, 2017 for the Fund were as follows:
| | | | | | | | | | | | | | | | | | | | |
| Ordinary Income | | | Long Term
Capital Gains | | | Return of
Capital | |
| 2018 | | 2017 | | | 2018 | | | 2017 | | | 2018 | | | 2017 | |
| $7,860,061 | | $ | 7,208,649 | | | $ | — | | | $ | — | | | $ | — | | | $ | 158,334 | |
NOTE 7 – NEW ACCOUNTING PRONOUNCEMENTS
In August 2018, FASB issued ASU 2018-13, Fair Value Measurement (Topic 820): Disclosure Framework — Changes to the Disclosure Requirements for Fair Value Measurement (“ASU 2018-13”). The primary focus of ASU 2018-13 is to improve the effectiveness of the disclosure requirements for fair value measurements. The changes affect all companies that are required to include fair value measurement disclosures. In general, the amendments in ASU 2018-13 are effective for all entities for fiscal years and interim periods within those fiscal years,
24
Brandes Separately Managed Account Reserve Trust
NOTES TO FINANCIAL STATEMENTS (continued)
beginning after December 15, 2019. An entity is permitted to early adopt the removed or modified disclosures upon the issuance of ASU 2018-13 and may delay adoption of the additional disclosures, which are required for public companies only, until their effective date. Management has chosen to adopt this disclosure in this report.
In August 2018, the Securities and Exchange Commission issued Final Rule Release No. 33-10532, Disclosure Update and Simplification, which in part amends certain disclosure requirements of Regulation S-X that have become redundant, duplicative, overlapping, outdated, or superseded, in light of other Commission disclosure requirements, U.S. Generally Accepted Accounting Principles, or changes in the information environment. The amendments are intended to facilitate the disclosure of information to investors and simplify compliance without significantly altering the total mix of information provided to investors. Management has chosen to adopt this disclosure in this report.
NOTE 8 – SUBSEQUENT EVENTS
In preparing these financial statements, the Trust has evaluated events and transactions for potential recognition or disclosure through the date the financial statements were available to be issued. The Trust has concluded that there are no subsequent events to note.
25
Brandes Separately Managed Account Reserve Trust
ADDITIONAL INFORMATION — (Unaudited)
BOARD CONSIDERATION AND CONTINUATION OF INVESTMENT ADVISORY AGREEMENT
In November 2018 the Board of Trustees of Brandes Investment Trust (the “Trust”), including the independent Trustees, unanimously approved renewal of the Investment Advisory Agreement (the “Agreement”) between the Trust and Brandes Investment Partners, L.P. (the “Advisor”) with respect to the SMART Fund (the “Fund”) for an additionalone-year term.
Information Reviewed
During the course of each year, Board members review a wide variety of materials relating to the nature, extent and quality of the services provided to the Fund by the Advisor, including reports on the Fund’s investment results, portfolio composition, portfolio trading practices, and other matters. In addition, in connection with its annual review of the Agreement with respect to the Fund, the Board requested and reviewed supplementary information that included materials regarding the Fund’s investment results, advisory fee and expense comparisons for peer groups and categories of similar funds identified by Morningstar Associates (“Morningstar”); financial and profitability information regarding the Advisor, the methods used by the Advisor to evaluate and compensate its professional investment personnel; descriptions of various functions performed by the Advisor on behalf of the Trust such as compliance monitoring and portfolio trading practices; and information about the personnel providing investment management and administrative services to the Fund.
In connection with its reviews, the Board received assistance and advice regarding legal and industry standards from counsel to the Trust and the independent Trustees. The independent Trustees discussed the approval of the Agreement with respect to the Fund with representatives of the Advisor at two Board meetings and in private sessions with counsel at which no representatives of the Advisor were present. In deciding to recommend approval of the Agreement with respect to the Fund, the Board and the independent Trustees did not identify any single or particular piece of information that, in isolation, was the controlling factor, and each Trustee did not necessarily attribute the same weight to each factor. This summary describes the most important, but not all, of the factors considered by the Board and the independent Trustees.
Nature, Extent and Quality of Services
With respect to the nature, extent and quality of services provided by the Advisor to the Fund, the Trustees reviewed among other things the quality and depth of the Advisor’s investment management staff, its regulatory compliance resources and program, its business continuity and cyber-security programs, theday-to-day administrative services provided by the Advisor to the Fund and the investment results of the Fund.
26
Brandes Separately Managed Account Reserve Trust
ADDITIONAL INFORMATION — (Unaudited) (continued)
With respect to the Fund’s investment results, the Trustees reviewed detailed information regarding a peer group of similarly managed funds selected by Morningstar, all of the funds in the larger Morningstar category of funds managed with the same general style, and the Fund’s benchmark index. The Trustees also discussed with representatives of Morningstar the principles used in determining the Fund’s peer groups and categories, and differences in those groups from those presented by Morningstar in connection with the Trustees’ 2017 review of the Agreement. In addition, they reviewed the results of certain funds considered by the Advisor to be the most direct competitors to the Fund in the Fund’s marketing channels.
The Trustees noted that the Fund’s investment results gross of fees (which are paid by the Advisor) were in the first quartile of the results of a peer group of funds identified by Morningstar for theone-year, three-year, five-year andten-year periods ended September 30, 2018; were in the same quartile of the larger group of funds in its Morningstar Intermediate-Term Bond Fund category for each of those periods; and were above the Fund’s benchmark index for all such periods. They concluded that the Fund’s performance was sufficient for renewal of the Agreement.
Advisory Fees, Total Expenses, Profitability and Ancillary Benefits
The Trustees noted that the Fund does not incur any advisory fees or other expenses, all of which are paid by the Advisor, and as a result the Advisor’s relationship with the Fund alone is not profitable. The Board also considered ancillary benefits to the Advisor as a result of its relationship with the Fund. They noted that these were primarily related to the Advisor’s receipt of wrap account fees from Fund shareholders through various broker-dealer sponsors that are not affiliated with either the Fund or the Advisor, and the benefit of proprietary and third-party research provided by broker-dealers executing portfolio transactions on behalf of the Fund.
Conclusions
Based on their review, including consideration of each of the factors referred to above, the Board and the independent Trustees concluded that the Agreement is fair and reasonable to the Fund and its shareholders, that each of the factors discussed above supported renewal of the Agreement with respect to the Fund, and that renewal of the Agreement was in the best interests of the Fund and its shareholders.
PROXY VOTING PROCEDURES
The Advisor votes proxies relating to the Fund’s portfolio securities in accordance with procedures adopted by the Advisor. You may obtain a description of these procedures, free of charge, by calling toll-free 1-800-331-2979. This
27
Brandes Separately Managed Account Reserve Trust
ADDITIONAL INFORMATION — (Unaudited) (continued)
information is also available through the Securities and Exchange Commission’s website athttp://www.sec.gov.
Information regarding how the Trust voted proxies relating to portfolio securities during the most recent 12-month period ended June 30 is available without charge, upon request, by calling 1-800-331-2979. This information is also available through the Securities and Exchange Commission’s website athttp://www.sec.gov.
PORTFOLIO HOLDINGS DISCLOSURE
The Trust files the Funds’ complete schedules of portfolio holdings with the Securities and Exchange Commission for the first and third quarters of each fiscal year on FormN-Q or Part F of FormN-PORT (beginning with filings after March 31, 2019). The Trust’s FormN-Q or Part F of FormN-PORT filings are available on the Securities and Exchange Commission’s website at http://www.sec.gov. The Trust’s FormN-Q or Part F of FormN-PORT filings may be reviewed and copied at the Commission’s Public Reference Room in Washington, D.C., and information on the operation of the Public Reference Room may be obtained by calling1-800-SEC-0330. Information regarding the Trust’s FormN-Q or Part F of FormN-PORT filings is also available, without charge, by calling toll-free,1-800-331-2979.
28
Brandes Separately Managed Account Reserve Trust
TRUSTEES AND OFFICERS INFORMATION — (Unaudited)
The Board of Trustees is responsible for the overall management of the Trust’s business. The Board approves all significant agreements between the Trust and persons or companies furnishing services to the Trust, including the Trust’s agreements with the Advisor, Administrator, Custodian, Distributor and Transfer Agent. The Board of Trustees delegates the day-to-day operations of the Trust to its officers and service providers, subject to the Fund investment objectives and policies and to general supervision by the Board. The Trust’s Statement of Additional Information includes additional information about the Trustees and is available, without charge, bycalling 1-800-331-2979 or visiting www.brandes.com.
The Trustees and officers of the Trust, their business addresses and principal occupations during the past five years are:
| | | | | | | | | | |
Name, Address and Age | | Position(s)
Held with
Trust | | Term of
Office
and
Length
of Time
Served(1) | | Principal
Occupation
During Past
5 Years | | Number
of Trust
Series
Overseen
by Trustee | | Other
Directorships/ Trusteeships
Held by
Trustee |
Independent Trustees(2) |
| | | | | |
Gregory Bishop, CFA 11988 El Camino Real, Suite 600 San Diego, CA 92130 (Born: 1961) | | Trustee | | Since January 2017 | | Retired. Previously Executive Vice President and Head of Retail Business, PIMCO Investments , from 1997 to 2014 | | 10 | | None |
| | | | | |
Jean E. Carter 11988 El Camino Real, Suite 600 San Diego, CA 92130 (Born: 1957) | | Trustee | | Since April 2008 | | Retired. | | 10 | | Bridge Builder Trust |
| | | | | |
Robert M. Fitzgerald, CPA (inactive) 11988 El Camino Real, Suite 600 San Diego, CA 92130 (Born: 1952) | | Trustee | | Since April 2008 | | Retired. | | 10 | | Hotchkis and Wiley Mutual Funds |
| | | | | |
Craig Wainscott, CFA 11988 El Camino Real, Suite 600 San Diego, CA 92130 (Born: 1961) | | Trustee and Chairman | | Since February 2012 | | Partner with The Paradigm Project and advisor to early-stage companies. | | 10 | | None |
29
Brandes Separately Managed Account Reserve Trust
TRUSTEES AND OFFICERS INFORMATION — (Unaudited) (continued)
| | | | | | | | | | |
Name, Address and Age | | Position(s)
Held with
Trust | | Term of
Office
and
Length
of Time
Served(1) | | Principal
Occupation
During Past
5 Years | | Number
of Trust
Series
Overseen
by Trustee | | Other
Directorships/ Trusteeships
Held by
Trustee |
“Interested” Trustees(3) | | | | | | | | |
| | | | | |
Oliver Murray 11988 El Camino Real, Suite 600 San Diego, CA 92130 (Born: 1962) | | Trustee | | Since February 2012 | | Chief Executive Officer, Brandes Investment Partners & Co.; Managing Director – PMCS of Brandes Investment Partners, L.P., the investment advisor to the Funds (the “Advisor”). | | 10 | | None |
| | | | | |
Jeff Busby, CFA 11988 El Camino Real, Suite 600 San Diego, CA 92130 (Born: 1961) | | Trustee and President | | Since July 2006 | | Executive Director of the Advisor. | | 10 | | None |
| | | | | |
Officers of the Trust | | | | | | | | | | |
| | | | | |
Thomas M. Quinlan 11988 El Camino Real, Suite 600 San Diego, CA 92130 (Born: 1970) | | Secretary | | Since June 2003 | | Associate General Counsel of the Advisor. | | N/A | | N/A |
| | | | | |
Gary Iwamura, CPA 11988 El Camino Real, Suite 600 San Diego, CA 92130 (Born: 1956) | | Treasurer | | Since September 1997 | | Finance Director of the Advisor. | | N/A | | N/A |
| | | | | |
Roberta Loubier 11988 El Camino Real, Suite 600 San Diego, CA 92130 (Born: 1971) | | Chief Compliance Officer | | Since September 2015 | | Global Head of Compliance, Brandes Investment Partners, L.P. | | N/A | | N/A |
| (1) | Trustees and officers of the Fund serve until their resignation, removal or retirement. |
| (2) | Not “interested persons” of the Trust as defined in the 1940 Act. |
| (3) | “Interested persons” of the Trust as defined in the 1940 Act by virtue of their positions with the Advisor. |
30
Brandes Separately Managed Account Reserve Trust
PRIVACY NOTICE
Brandes Investment Trust and Brandes Investment Partners, L.P. may collect non-public information about you from the following sources:
| • | | Information we receive about you on applications or other forms; |
| • | | Information you give us orally; and |
| • | | Information about your transactions with us. |
We do not disclose any non-public personal information about any shareholder or former shareholder of the Fund without the shareholder’s authorization, except as required by law or in response to inquiries from governmental authorities. We restrict access to your personal and account information to those employees who need to know that information to provide products and services to you. We also may disclose that information to unaffiliated third parties (such as to brokers or custodians) only as permitted by law and only as needed for us to provide agreed services to you. We maintain physical, electronic and procedural safeguards to guard your non-public personal information.
If you hold shares of the Fund through a financial intermediary, such as a broker-dealer, bank, or trust company, the privacy policy of your financial intermediary governs how your non-public personal information would be shared with nonaffiliated third parties.

ADVISOR Brandes Investment Partners, L.P. 11988 El Camino Real, Suite 600 San Diego, CA 92130 800.331.2979 DISTRIBUTOR ALPS Distributors, Inc. 1290 Broadway, #1100 Denver, CO 80203 TRANSFER AGENT U.S. Bancorp Fund Services, LLC 615 E. Michigan Street, 3rd Floor Milwaukee, WI 53202 INDEPENDENT REGISTERED PUBLIC ACCOUNTING FIRM PricewaterhouseCoopers LLP 601 South Figueroa Street Los Angeles, CA 90017 LEGAL COUNSEL Morgan, Lewis & Bockius LLP One Federal Street Boston, MA 02110 This report is intended for shareholders of the Brandes Value NextShares and may not be used as sales literature unless preceded or accompanied by a current prospectus. Statements and other information herein are dated and are subject to change.
SEMI-ANNUAL REPORT VALUE NEXTSHARESFor the six months ended March 31, 2019Beginning in January 2021, as permitted by regulations adopted by the U.S. Securitiesand Exchange Commission, paper copies of the Funds’ annual and semi-annualshareholder reports will no longer be sent by mail, unless you specifically request papercopies of the reports. Instead, the reports will be made available on the Funds’ website(http://www.brandesfunds.com/literature.html), and you will be notified by mail eachtime a report is posted and provided with a website link to access the report.If you already elected to receive shareholder reports electronically, you will not be affectedby this change and you need not take any action. You may elect to receive shareholderreports and other communications from the Funds electronically anytime by contactingyour financial intermediary (such as a broker-dealer or a bank) or, if you are a direct investor,by calling 1-800-395-3807, sending an e-mail request to info@brandesfunds.com, or byenrolling at http://www.brandesfunds.com/literature.html.You may elect to receive all future reports in paper free of charge. If you investthrough a financial intermediary, you can contact your financial intermediary torequest that you continue to receive paper copies of your shareholder reports. Ifyou invest directly with the Funds, you can call 1-800-395-3807 or send an email request to info@brandesfunds.com to let the Funds know you wish to continuereceiving paper copies of your shareholder reports. Your election to receive reportsin paper will apply to all Funds held in your account with that intermediary if youinvest through your financial intermediary or all Funds held with the fund complexif you invest directly with the Funds.BRANDES INVESTMENT TRUST

Table of Contents
1
Brandes Value NextShares
Dear Fellow Investor,
The net asset value of the Brandes Value NextShares declined 2.67% in the six months ending March 31, 2019. For the same period, the S&P 500 Index fell 1.72% while the Russell 1000 Value Index declined 1.19%.
Portfolio holdings in the Pharmaceuticals, Electrical Equipment, Instruments & Components and Media industries were contributors to performance, while holdings in Health Care Providers & Services, Banks and Machinery detracted from returns.
Three of the largest individual contributors to performance were Merck & Co., Inc. (Pharmaceuticals), Flex Ltd. (Electrical Equipment, Instruments & Components) and Comcast Corp. (Media). Briggs & Stratton Corp. (Machinery), Cigna Corp. (Health Care Providers & Services) and CVS Health Corp. (Health Care Providers & Services) were three of the largest detractors from performance.
At the close of the period, the Fund’s largest industry weights were in Banks and Health Care Providers & Services. Please note that while macro conditions are considered when we determine valuation estimates for individual companies, our country and industry weightings are aby-product ofbottom-up stock selection, not the result oftop-down observations.
In the45-plus years since Brandes Investment Partners was founded, our goal has remained the same: pursue above-market gains to help you move closer to your long-term investment objectives. We believe that our unwavering commitment to value investing will lead us to attractively priced, fundamentally sound companies worthy of inclusion in the Fund. Thank you for your business and continued trust.
Sincerely yours,
The Brandes GlobalLarge-Cap Investment Committee
Brandes Investment Trust
Because the values of the Fund’s investments will fluctuate with market conditions, so will the value of your investment in the Fund. You could lose money on your investment in the Fund, or the Fund could underperform other investments. The values of the Fund’s investments fluctuate in response to the activities of individual companies and general stock market and economic conditions. Investments in small and medium capitalization companies tend to have limited liquidity and greater price volatility than investments in larger capitalization companies. Value stocks typically are less volatile than growth stocks; however, issues of value stocks typically have a lower expected growth rate in earnings and sales than issues of growth stocks.
Please refer to the Schedule of Investments in the report for complete holdings information. Fund holdings, geographic allocations and/or sector allocations are
2
Brandes Value NextShares
subject to change at any time and are not considered a recommendation to buy or sell any security.
The foregoing reflects the thoughts and opinions of Brandes Investment Partners® exclusively and is subject to change without notice.
Brandes Investment Partners® is a registered trademark of Brandes Investment Partners, L.P. in the United States and Canada.
Must be preceded or accompanied by a prospectus.
Index Guide
The S&P 500 Index with gross dividends measures equity performance of 500 of the top companies in leading industries of the U.S. economy.
The Russell 1000 Value Index with gross dividends measures performance of the large cap value segment of the U.S. equity universe. Securities are categorized as growth or value based on their relativebook-to-price ratios, historical sales growth, and expected earnings growth.
One cannot invest directly in an index.
Brandes Value NextShares is distributed by ALPS Distributors, Inc.
3
Brandes Value NextShares
The following chart compares the value of a hypothetical $10,000 investment in the Brandes Value NextShares Fund from its inception (February 15, 2018) to March 31, 2019 with the value of such an investment in the Russell 1000 Value Index and S&P 500 Index for the same period.
Value of $10,000 Investment vs Russell 1000 Value & S&P 500 (Unaudited)

| | | | | | | | |
| | | Total Return*
Periods Ended March 31, 2019 | |
| | | One
Year | | | Since
Inception(1) | |
Brandes Value NextShares | | | 4.34 | % | | | 0.64 | % |
Russell 1000 Value Total Return Index | | | 5.67 | % | | | 3.17 | % |
S&P 500 Total Return Index | | | 9.50 | % | | | 6.58 | % |
| (1) | The inception date is February 15, 2018. |
| * | Returns do not reflect the effect of market-determined premiums or discounts. |
Performance data quoted represents past performance; past performance does not guarantee future results. The investment return and principal value of an investment will fluctuate so that an investor’s shares, when redeemed, may be worth more or less than their original cost. Current performance of the Fund may be lower or higher than the performance quoted. Performance data current to the most recent month end may be obtained by calling 800-331-2979.
The returns shown do not reflect the deduction of taxes that a shareholder would pay on fund distributions or the redemption of fund shares. The Advisor has a fee waiver arrangement in place to limit the Fund’s annual operating expenses.
4
Brandes Value NextShares
Sector Allocation as a Percentage of Total Investments as of
March 31, 2019 (Unaudited)
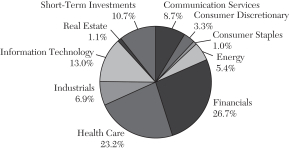
The sector classifications represented in the graph above are in accordance with Global Industry Classification Standards (GICS®), which was developed by and/or is the exclusive property of MSCI, Inc. and Standard & Poor Financial Services LLC.
5
Brandes Value NextShares
Expense Example (Unaudited)
As a shareholder of the Fund, you incur ongoing costs, including investment advisory and administrative fees and other Fund expenses. The example below is intended to help you understand your ongoing costs (in dollars) of investing in the Fund and to compare these costs with the ongoing costs of investing in other mutual funds.
The example is based on an investment of $1,000 invested at the beginning of the period and held for the entire period from October 1, 2018 to March 31, 2019 (the “Period”).
Actual Expenses
This section provides information about actual account values and actual expenses. The “Ending Account Value” shown is derived from the Fund’s actual returns. You may use the information in this section, together with the amount you invested, to estimate the expenses that you paid over the period. Simply divide your account value by $1,000 (for example, an $8,600 account value divided by $1,000 = 8.6), then multiply the result by the number given for the Fund under the heading “Expenses Paid During Period” to estimate the expenses you paid on your account during this period.
| | | | | | | | | | | | | | | | |
Fund | | Beginning
Account
Value | | | Ending
Account
Value | | | Annual
Expense
Ratio | | | Expenses
Paid
During
the Period* | |
Value NextShares | | $ | 1,000.00 | | | $ | 973.30 | | | | 0.40% | | | $ | 1.97 | |
| * | The Fund’s expenses are equal to the Fund’s expense ratio for the period, multiplied by the average account value over the period, multiplied by 182/365 (to reflect the one half-year period). |
Hypothetical Example for Comparison Purposes
This section provides information about hypothetical account values and hypothetical expenses based on the Fund’s actual expense ratio and an assumed rate of return of 5% per year before expenses, which is not the Fund’s actual return. The hypothetical account values and expenses may not be used to estimate the actual ending account balance or expenses you paid for the period. You may use this information to compare the ongoing costs of investing in the Fund and other mutual funds. To do so, compare this 5% hypothetical example with the 5% hypothetical examples that appear in the shareholder reports of the other mutual funds.
Please note that the expenses shown in the table are meant to highlight your ongoing costs only and do not reflect any transaction costs, such as brokerage commissions on purchase and sales of Fund shares. Therefore, the last column of the table is useful in comparing ongoing costs only, and will not help you determine the relative total costs of owning different funds. In addition, if these transactional costs were included, your costs would have been higher.
6
Brandes Value NextShares
| | | | | | | | | | | | | | | | |
Fund | | Beginning
Account
Value | | | Ending
Account
Value | | | Annual
Expense
Ratio | | | Expenses
Paid
During
the Period* | |
Brandes Value NextShares | | $ | 1,000.00 | | | $ | 1,022.94 | | | | 0.40% | | | $ | 2.02 | |
| * | The Fund’s expenses are equal to the Fund’s expense ratio for the period, multiplied by the average account value over the period, multiplied by 182/365 (to reflect the one half-year period). |
7
Brandes Value NextShares
SCHEDULE OF INVESTMENTS — March 31, 2019 (Unaudited)
| | | | | | | | |
| | | Shares | | | Value | |
| COMMON STOCKS – 87.30% | | | | | | | | |
| | |
| Air Freight & Logistics – 1.02% | | | | | | | | |
FedEx Corp. | | | 276 | | | $ | 50,069 | |
| | | | | | | | |
| | |
| Banks – 14.05% | | | | | | | | |
Bank of America Corp. | | | 5,057 | | | | 139,523 | |
BB&T Corp. | | | 2,051 | | | | 95,433 | |
Citigroup, Inc. | | | 2,332 | | | | 145,097 | |
Fifth Third Bancorp | | | 764 | | | | 19,268 | |
JPMorgan Chase & Co. | | | 724 | | | | 73,290 | |
PNC Financial Services Group, Inc. | | | 701 | | | | 85,985 | |
Wells Fargo & Co. | | | 2,793 | | | | 134,958 | |
| | | | | | | | |
| | | | | | | 693,554 | |
| | | | | | | | |
| | |
| Beverages – 0.95% | | | | | | | | |
PepsiCo, Inc. | | | 381 | | | | 46,692 | |
| | | | | | | | |
| | |
| Biotechnology – 2.45% | | | | | | | | |
Amgen, Inc. | | | 281 | | | | 53,384 | |
Gilead Sciences, Inc. | | | 1,042 | | | | 67,741 | |
| | | | | | | | |
| | | | | | | 121,125 | |
| | | | | | | | |
| | |
| Building Products – 1.02% | | | | | | | | |
Johnson Controls International Plc | | | 1,364 | | | | 50,386 | |
| | | | | | | | |
| | |
| Capital Markets – 4.26% | | | | | | | | |
Bank of New York Mellon Corp. | | | 2,292 | | | | 115,585 | |
State Street Corp. | | | 1,439 | | | | 94,701 | |
| | | | | | | | |
| | | | | | | 210,286 | |
| | | | | | | | |
| | |
| Communications Equipment – 0.57% | | | | | | | | |
Cisco Systems, Inc. | | | 522 | | | | 28,183 | |
| | | | | | | | |
| | |
| Diversified Financial Services – 1.27% | | | | | | | | |
Jefferies Financial Group, Inc. | | | 3,335 | | | | 62,665 | |
| | | | | | | | |
| | |
| Electrical Equipment – 1.89% | | | | | | | | |
Emerson Electric Co. | | | 1,362 | | | | 93,256 | |
| | | | | | | | |
| | |
| Electronic Equipment, Instruments & Components – 3.33% | | | | | | | | |
Avnet, Inc. | | | 2,393 | | | | 103,784 | |
Flex Ltd.(a) | | | 6,057 | | | | 60,570 | |
| | | | | | | | |
| | | | | | | 164,354 | |
| | | | | | | | |
| | |
| Energy Equipment & Services – 1.04% | | | | | | | | |
Halliburton Co. | | | 1,748 | | | | 51,216 | |
| | | | | | | | |
| | |
| Entertainment – 0.02% | | | | | | | | |
Walt Disney Co. | | | 8 | | | | 914 | |
| | | | | | | | |
| | |
| Health Care Providers & Services – 11.65% | | | | | | | | |
Cardinal Health, Inc. | | | 2,124 | | | | 102,270 | |
Cigna Corp. | | | 402 | | | | 64,650 | |
The accompanying notes to financial statements are an integral part of this Schedule of Investments.
8
Brandes Value NextShares
SCHEDULE OF INVESTMENTS — March 31, 2019 (Unaudited) (continued)
| | | | | | | | |
| | | Shares | | | Value | |
CVS Health Corp. | | | 1,302 | | | $ | 70,217 | |
HCA Healthcare, Inc. | | | 559 | | | | 72,882 | |
Laboratory Corp of America Holdings(a) | | | 868 | | | | 132,787 | |
McKesson Corp. | | | 1,129 | | | | 132,161 | |
| | | | | | | | |
| | | | | | | 574,967 | |
| | | | | | | | |
| | |
| Household Durables – 3.32% | | | | | | | | |
M.D.C. Holdings, Inc. | | | 2,735 | | | | 79,479 | |
Taylor Morrison Home Corp. – Class A(a) | | | 4,743 | | | | 84,188 | |
| | | | | | | | |
| | | | | | | 163,667 | |
| | | | | | | | |
| | |
| Insurance – 4.46% | | | | | | | | |
American International Group, Inc. | | | 2,286 | | | | 98,435 | |
Loews Corp. | | | 981 | | | | 47,020 | |
Old Republic International Corp. | | | 3,575 | | | | 74,789 | |
| | | | | | | | |
| | | | | | | 220,244 | |
| | | | | | | | |
| | |
| Interactive Media & Services – 2.40% | | | | | | | | |
Alphabet, Inc. – Class C(a) | | | 101 | | | | 118,504 | |
| | | | | | | | |
| | |
| IT Services – 4.46% | | | | | | | | |
Amdocs Ltd. | | | 1,795 | | | | 97,127 | |
Cognizant Technology Solutions Corp. | | | 1,697 | | | | 122,948 | |
| | | | | | | | |
| | | | | | | 220,075 | |
| | | | | | | | |
| | |
| Machinery – 1.38% | | | | | | | | |
Briggs & Stratton Corp. | | | 5,774 | | | | 68,307 | |
| | | | | | | | |
| | |
| Media – 6.40% | | | | | | | | |
Comcast Corp. – Class A | | | 3,253 | | | | 130,055 | |
Fox Corp. – Class A(a) | | | 204 | | | | 7,501 | |
Fox Corp. – Class B(a) | | | 1,178 | | | | 42,279 | |
Omnicom Group, Inc. | | | 1,865 | | | | 136,126 | |
| | | | | | | | |
| | | | | | | 315,961 | |
| | | | | | | | |
| | |
| Oil, Gas & Consumable Fuels – 4.44% | | | | | | | | |
Apache Corp. | | | 1,184 | | | | 41,038 | |
Chevron Corp. | | | 646 | | | | 79,574 | |
World Fuel Services Corp. | | | 3,415 | | | | 98,659 | |
| | | | | | | | |
| | | | | | | 219,271 | |
| | | | | | | | |
| | |
| Pharmaceuticals – 9.34% | | | | | | | | |
Johnson & Johnson | | | 582 | | | | 81,358 | |
Merck & Co., Inc. | | | 2,286 | | | | 190,126 | |
Pfizer, Inc. | | | 4,459 | | | | 189,374 | |
| | | | | | | | |
| | | | | | | 460,858 | |
| | | | | | | | |
| | |
| Real Estate Management & Development – 1.11% | | | | | | | | |
St. Joe Co.(a) | | | 3,325 | | | | 54,829 | |
| | | | | | | | |
The accompanying notes to financial statements are an integral part of this Schedule of Investments.
9
Brandes Value NextShares
SCHEDULE OF INVESTMENTS — March 31, 2019 (Unaudited) (continued)
| | | | | | | | |
| | | Shares | | | Value | |
| | |
| Road & Rail – 1.66% | | | | | | | | |
AMERCO | | | 220 | | | $ | 81,732 | |
| | | | | | | | |
| | |
| Semiconductors & Semiconductor Equipment – 1.20% | | | | | | | | |
Applied Materials, Inc. | | | 1,490 | | | | 59,093 | |
| | | | | | | | |
| | |
| Software – 3.61% | | | | | | | | |
Microsoft Corp. | | | 561 | | | | 66,164 | |
Oracle Corp. | | | 2,084 | | | | 111,932 | |
| | | | | | | | |
| | | | | | | 178,096 | |
| | | | | | | | |
TOTAL COMMON STOCKS
(Cost $4,416,805) | | | | | | $ | 4,308,304 | |
| | | | | | | | |
| | |
| PREFERRED STOCKS –2.90% | | | | | | | | |
| | |
| Banks – 1.47% | | | | | | | | |
U.S. Bancorp, 3.500% (3M LIBOR + 0.600%, minimum of 3.500%)(b) | | | 3,869 | | | $ | 72,737 | |
| | | | | | | | |
| | |
| Capital Markets – 1.43% | | | | | | | | |
Goldman Sachs Group, Inc., 4.000% (3M LIBOR + 0.670%, minimum of 4.000%)(b) | | | 2,567 | | | | 49,389 | |
Morgan Stanley, 4.000% (3M LIBOR + 0.700%, minimum of 4.000%)(b) | | | 1,104 | | | | 21,363 | |
| | | | | | | | |
| | | | | | | 70,752 | |
| | | | | | | | |
TOTAL PREFERRED STOCKS
(Cost $155,447) | | | | | | $ | 143,489 | |
| | | | | | | | |
| | |
| | | Principal
Amount | | | Value | |
| MONEY MARKET FUNDS – 10.77% | | | | | | | | |
First American Treasury Obligations Fund – Class X, 2.333%(c) | | $ | 165,796 | | | $ | 165,796 | |
First American Government Obligations Fund – Class X, 2.332%(c) | | | 365,524 | | | | 365,524 | |
| | | | | | | | |
TOTAL MONEY MARKET FUNDS
(Cost $531,320) | | | | | | $ | 531,320 | |
| | | | | | | | |
Total Investments (Cost $5,103,572) – 100.97% | | | | | | $ | 4,983,113 | |
Liabilities in Excess of Other Assets – (0.97)% | | | | | | | (48,021 | ) |
| | | | | | | | |
TOTAL NET ASSETS – 100.00% | | | | | | $ | 4,935,092 | |
| | | | | | | | |
Percentages are stated as a percent of net assets.
LIBOR London Inter-bank Offered Rate
| (a) | Non-income producing security. |
| (b) | Variable rate security. This coupon is based on a reference index and spread. |
| (c) | The rate shown is the annualized seven day yield as of March 31, 2019. |
The accompanying notes to financial statements are an integral part of this Schedule of Investments.
10
Brandes Value NextShares
SCHEDULE OF INVESTMENTS BY COUNTRY — March 31, 2019 (Unaudited)
| | | | |
COMMON STOCKS | | | | |
Ireland | | | 1.02 | % |
Singapore | | | 1.23 | % |
United Kingdom | | | 1.97 | % |
United States | | | 83.08 | % |
| | | | |
TOTAL COMMON STOCKS | | | 87.30 | % |
| | | | |
| |
PREFERRED STOCKS | | | | |
United States | | | 2.90 | % |
| | | | |
TOTAL PREFERRED STOCKS | | | 2.90 | % |
| | | | |
| |
MONEY MARKET FUNDS | | | 10.77 | % |
| | | | |
| |
TOTAL INVESTMENTS | | | 100.97 | % |
Liabilities in Excess of Other Assets | | | (0.97 | )% |
| | | | |
| |
TOTAL NET ASSETS | | | 100.00 | % |
| | | | |
The industry classifications represented in the Schedule of Investments are in accordance with Global Industry Classification Standards (GICS®), which was developed by and/or is the exclusive property of MSCI, Inc. and Standard & Poor Financial Services LLC. This information is unaudited.
The accompanying notes to financial statements are an integral part of this Schedule of Investments.
11
Brandes Value NextShares
STATEMENT OF ASSETS AND LIABILITIES — March 31, 2019 (Unaudited)
| | | | |
ASSETS | | | | |
Investments in securities, at cost | | $ | 5,103,572 | |
| | | | |
Investment in securities, at value | | $ | 4,983,113 | |
Cash | | | — | |
Receivables: | | | | |
Dividends and interest | | | 9,013 | |
Tax reclaims | | | 71 | |
Due from Advisor | | | 11,385 | |
Prepaid expenses and other assets | | | 7,136 | |
| | | | |
Total Assets | | | 5,010,718 | |
| | | | |
LIABILITIES | | | | |
Payables: | | | | |
Securities purchased | | | 32,799 | |
Trustee Fees | | | 1,059 | |
Due to Custodian | | | 747 | |
Accrued Expenses: | | | 41,021 | |
| | | | |
Total Liabilities | | | 75,626 | |
| | | | |
NET ASSETS | | $ | 4,935,092 | |
| | | | |
COMPONENTS OF NET ASSETS | | | | |
Capital Stock | | $ | 4,963,934 | |
Total distributable earnings | | | (28,842 | ) |
| | | | |
Total Net Assets | | $ | 4,935,092 | |
| | | | |
Net asset value per share | | | | |
Net Assets | | $ | 4,935,092 | |
Shares outstanding | | | 500,000 | |
Net asset value per share | | $ | 9.87 | |
| | | | |
The accompanying notes to financial statements are an integral part of this statement.
12
Brandes Value NextShares
STATEMENT OF OPERATIONS — For the Six Months Ended March 31, 2019 (Unaudited)
| | | | |
INVESTMENT INCOME | | | | |
Income | | | | |
Dividend income | | | 36,876 | |
Interest income | | | 4,276 | |
| | | | |
Total Income | | | 41,152 | |
| | | | |
Expenses | | | | |
Advisory fees (Note 3) | | | 5,083 | |
Custody fees | | | 2,282 | |
Administration, accounting and transfer agent fees (Note 3) | | | 45,782 | |
Legal fees | | | 92 | |
Printing fees | | | 8,662 | |
Miscellaneous | | | 486 | |
Trustee fees | | | 920 | |
Auditing fees | | | 14,752 | |
Organizational costs | | | 17,351 | |
| | | | |
Total expenses | | | 95,410 | |
Expenses waived | | | (88,633 | ) |
| | | | |
Total net expenses | | | 6,777 | |
| | | | |
Net investment income | | | 34,375 | |
| | | | |
REALIZED AND UNREALIZED GAIN (LOSS) ON INVESTMENTS: | | | | |
Net realized gain on investments | | | 93,060 | |
Net change in unrealized depreciation on investments | | | (144,024 | ) |
| | | | |
Net realized and unrealized loss on investments | | | (50,964 | ) |
| | | | |
Net loss in net assets resulting from operations | | | (16,589 | ) |
| | | | |
The accompanying notes to financial statements are an integral part of this statement.
13
Brandes Value NextShares
STATEMENT OF CHANGES IN NET ASSETS
| | | | | | | | |
| | | Six Months
Ended
March 31,
2019 | | | Period Ended
September 30,
2018(1)(2) | |
| | | (Unaudited) | | | | |
INCREASE (DECREASE) IN NET ASSETS FROM: | | | | | | | | |
OPERATIONS | | | | | | | | |
Net investment income | | $ | 34,375 | | | $ | 11,814 | |
Net realized gain on investments | | | 93,060 | | | | 5,827 | |
Net change in unrealized appreciation (depreciation) on investments | | | (144,024 | ) | | | 23,565 | |
| | | | | | | | |
Net increase (decrease) in net assets resulting from operations | | | (16,589 | ) | | | 41,206 | |
| | | | | | | | |
DISTRIBUTIONS TO SHAREHOLDERS | | | | | | | | |
Distributions to Shareholders | | | (42,827 | ) | | | (10,658 | ) |
| | | | | | | | |
Decrease in net assets from distributions | | | (42,827 | ) | | | (10,658 | ) |
| | | | | | | | |
CAPITAL SHARE TRANSACTIONS | | | | | | | | |
Proceeds from shares sold | | | 2,941,115 | | | | 2,022,845 | |
| | | | | | | | |
Net increase in net assets from capital share transactions | | | 2,941,115 | | | | 2,022,845 | |
| | | | | | | | |
Total increase in net assets | | | 2,881,699 | | | | 2,053,393 | |
| | | | | | | | |
NET ASSETS | | | | | | | | |
Beginning of the Period | | | 2,053,393 | | | | — | |
| | | | | | | | |
End of the Period | | | 4,935,092 | | | | 2,053,393 | |
| | | | | | | | |
| (1) | Commenced operations on February 15, 2018. |
| (2) | Distributions to shareholders includes net investment income distributions of $10,658. End of period net assets includes accumulated undistributed net investment income of $1,182. |
The accompanying notes to financial statements are an integral part of this statement.
14
Brandes Value NextShares
FINANCIAL HIGHLIGHTS
| | | | | | | | |
| | | Six Months
Ended
March 31,
2019 | | | Period Ended
September 30,
2018(1) | |
| | | (Unaudited) | | | | |
Net asset value, beginning of period | | $ | 10.27 | | | $ | 10.00 | |
| | | | | | | | |
Total from investment operations: | | | | | | | | |
Net investment income(2) | | | 0.10 | | | | 0.10 | |
Net realized and unrealized gain (loss) on investments | | | (0.38 | ) | | | 0.25 | |
| | | | | | | | |
Total from investment operations | | | (0.28 | ) | | | 0.35 | |
| | | | | | | | |
Less dividends and distributions: | | | | | | | | |
Dividends from net investment income | | | (0.08 | ) | | | (0.08 | ) |
Dividends from net realized gains | | | (0.04 | ) | | | — | |
| | | | | | | | |
Total dividends and distributions | | | (0.12 | ) | | | (0.08 | ) |
| | | | | | | | |
Net asset value, end of period | | $ | 9.87 | | | $ | 10.27 | |
| | | | | | | | |
Total return | | | -2.67 | % | | | 3.48 | %(3) |
Net assets, end of period (millions) | | $ | 4.9 | | | $ | 2.1 | |
Ratio of expenses to average net assets | | | 0.40 | %(5) | | | 0.40 | %(5) |
Ratio of expenses (prior to reimbursements) to average net assets | | | 5.63 | %(5) | | | 19.07 | %(5) |
Ratio of net investment income to average net assets | | | 2.03 | %(5) | | | 1.64 | %(5) |
Ratio of net investment income (prior to reimbursements) to average net assets | | | (3.20 | )%(5) | | | (17.03 | )%(5) |
Portfolio turnover rate | | | 5.33 | %(4) | | | 7.56 | %(4) |
| (1) | Commenced operations on February 15, 2018. |
| (2) | Net investment income per share has been calculated based on average shares outstanding during the period. |
| (3) | The total return figure is the since inception return for the Fund. |
The accompanying notes to financial statements are an integral part of this statement.
15
Brandes Value NextShares
NOTES TO FINANCIAL STATEMENTS — (Unaudited)
NOTE 1 – ORGANIZATION
Brandes Value NextShares (the “Fund”) is a series of Brandes Investment Trust (the “Trust”). The Trust is registered under the Investment Company Act of 1940, as amended (the “1940 Act”), as a diversified, open-end management investment company. The Fund is an exchange-traded product actively managed pursuant to an order issued by the Securities and Exchange Commission granting an exemption from certain provisions of the 1940 Act. Individual shares of the Fund may be purchased and sold only on a national securities exchange or alternative trading system through a broker-dealer that offers NextShares, and may not be directly purchased or redeemed from the Fund. Trading prices of shares of the Fund are directly linked to the Fund’s next-computed net asset values per share (“NAVs”) and vary from the NAV by a market-determined trading premium or discount, which may be zero. The Fund began operations on February 15, 2018.
NOTE 2 – SIGNIFICANT ACCOUNTING POLICIES
The Fund is an investment company that applies the accounting and reporting guidance issued in Topic 946, “Financial Services-Investment Companies”, by the Financial Accounting Standards Board (“FASB”). The following is a summary of significant accounting policies consistently followed by the Fund. These policies are in conformity with accounting principles (“GAAP”) generally accepted in the United States of America.
| | A. | Short-Term Investments. The Fund may invest from time to time in cash or short-term cash equivalent securities either as part of its overall investment strategy or for temporary defensive purposes in response to adverse market, economic, political or other conditions which in the discretion of Brandes Investment Partners L.P. (the “Advisor”) require investments inconsistent with the Fund’s principal investment strategies. The amount of such holdings will vary and will depend on the Advisor’s assessment of the quantity and quality of investment opportunities that exist at any given time, and may at times be relatively high. Short-term cash equivalent securities include U.S. government securities, certificates of deposit, bankers’ acceptances, repurchase agreements, demand notes and commercial paper. As a result of taking such temporary defensive positions, the Fund may not achieve its investment objectives. |
| | B. | Foreign Currency Translation and Transactions. Values of investments denominated in foreign currencies are converted into U.S. dollars using the spot market rates of exchange at the time of valuation. Purchases and sales of investments and dividend and interest income are translated into U.S. dollars using the spot market rates of exchange prevailing on the respective dates of such translations. The gain or loss resulting from changes in foreign exchange rates is included with net realized and unrealized gain or loss from |
16
Brandes Value NextShares
NOTES TO FINANCIAL STATEMENTS — (Unaudited) (continued)
| | investments, as appropriate. Foreign securities and currency transactions may involve certain considerations and risks not typically associated with those of domestic origin. |
Foreign securities are recorded in the financial statements after translation to U.S. dollars based on the applicable exchange rate at the end of the period. The Fund reports certain foreign currency-related transactions as components of realized gains or losses for financial reporting purposes, whereas such components are treated as ordinary income for federal income tax purposes.
| | C. | Delayed Delivery Securities. The Fund may purchase securities on a when- issued or delayed delivery basis. “When-issued” or delayed delivery refers to securities whose terms are available and for which a market exists, but that have not been issued. For a when-issued or delayed delivery transaction, no payment is made until delivery date, which is typically longer than the normal course of settlement. When the Fund enters into an agreement to purchase securities on a when-issued or delayed delivery basis, the Fund segregates cash or liquid securities, of any type or maturity, equal in value to the Fund’s commitment. Losses may arise if the market values of the underlying securities change, if the counterparty does not perform under the contract, or if the issuer does not issue the securities due to political, economic or other factors. The Fund did not have any open commitments on delayed delivery securities as of March 31, 2019. |
| | D. | Participatory Notes. The Fund may invest in participatory notes. Participatory notes are derivative securities which are designed to provide synthetic exposure to one or more underlying securities, subject to the credit risk of the issuing financial institution. |
Investments in participatory notes involve risks normally associated with a direct investment in the underlying securities. In addition, participatory notes are subject to counterparty risk, which is the risk that the broker-dealer or bank that issues the notes will not fulfill its contractual obligation to complete the transaction with the Trust. Participatory notes constitute general unsecured, unsubordinated contractual obligations of the banks or broker-dealers that issue them and generally are issued as an actual note from the financial intermediary or an equity linked warrant (commonly known as a low exercise price option). The Trust is relying on the creditworthiness of such banks or broker-dealers and has no rights under a participatory note against the issuer of the securities underlying such participatory note. The investment advisor has established guidelines for monitoring participatory note exposure for the Fund. Prior to investment in a participatory note, the investment advisor will complete an analysis of the prospective counterparties and once purchased, will continue to
17
Brandes Value NextShares
NOTES TO FINANCIAL STATEMENTS — (Unaudited) (continued)
monitor creditworthiness on a quarterly basis. The investment advisor requires a minimum credit rating for such counterparties (as determined by rating agencies such as Moody’s, Fitch and S&P) of A.
The Fund records counterparty credit risk valuation adjustments, if material, on the participatory notes in order to appropriately reflect the credit quality of the counterparty.
The Fund did not invest in any participatory notes at March 31, 2019.
| | E. | Investment Transactions, Dividends and Distributions. Investment transactions are accounted for on the trade dates. Realized gains and losses are evaluated on the basis of identified costs. Dividend income and distributions to shareholders are recorded on the ex-dividend dates. Interest is recorded on an accrual basis. Withholding taxes on foreign dividends and capital gains, which are included as a component of net investment income and realized gain (loss) on investments, respectively, have been provided for in accordance with the Trust’s understanding of the applicable country’s tax rules and rates. Expenses common to the Trust are allocated based upon the Fund’s relative net asset values or other appropriate allocation methods. The Fund amortizes premiums and accretes discounts using the constant yield method. |
| | F. | Use of Estimates. The preparation of financial statements in conformity with GAAP requires management to make estimates and assumptions that affect the reported amounts of assets and liabilities at the date of the financial statements and reported amounts of income and expenses during the reporting period. Actual results could differ from those estimates and assumptions. |
| | G. | Securities Lending. The Fund may lend its portfolio securities to banks, brokers and dealers. Lending Fund securities exposes the Fund to risks such as the following: (i) the borrower may fail to return the loaned securities, (ii) the borrower may not be able to provide additional collateral, or (iii) the Fund may experience delays in recovery of the loaned securities or loss of rights in the collateral if the borrower fails financially. |
To minimize these risks, the borrower must agree to maintain collateral with the Fund’s custodian, marked to market daily, in the form of U.S. Government obligations, in an amount at least equal to 102% (105% in the case of loans of foreign securities not denominated in U.S. dollars) of the market value of the loaned securities. As of March 31, 2019, the Fund did not have any securities on loan. Non-cash collateral received by the Fund may not be sold or re-pledged except to satisfy a borrower default. Therefore, non-cash collateral is not included on the Fund’s Schedule of Investments or Statement of Assets and Liabilities.
18
Brandes Value NextShares
NOTES TO FINANCIAL STATEMENTS — (Unaudited) (continued)
| | H. | Indemnification Obligations. Under the Trust’s organizational documents, its current and former officers and trustees are indemnified against certain liabilities arising out of the performance of their duties to the Trust. The Trust has indemnified its trustees against any expenses actually and reasonably incurred by the trustees in any proceeding arising out of or in connection with the trustees’ service to the Trust. In addition, in the normal course of business, the Trust enters into contracts that contain a variety of representations and warranties and provide general indemnifications. The Fund’s maximum exposure under these arrangements is unknown as this would involve future claims that may be made against the Fund that have not yet occurred or that would be covered by other parties. |
| | I. | Accounting for Uncertainty in Income Taxes. The Fund has elected to be taxed as a “regulated investment company” and intends to distribute substantially all its taxable income to its shareholders and otherwise comply with the provisions of the Internal Revenue Code applicable to regulated investment companies. The Fund may be subject to a nondeductible excise tax calculated as a percentage of certain undistributed amounts of net investment income and net capital gains. The Fund intends to distribute its net investment income and capital gains as necessary to avoid this excise tax. Therefore, no provision for federal income taxes or excise taxes has been made. |
The Trust analyzes all open tax years, as defined by the applicable statute of limitations, for all major jurisdictions. Open tax years for the Fund are those that are open for exam by taxing authorities (2015 through 2018). The Fund was in existence during the applicable tax year of 2018. As of March 31, 2019, the Trust has no examinations in progress.
Management has analyzed the Trust’s tax positions, and has concluded that no liability should be recorded related to uncertain tax positions expected to be taken on the tax return for the fiscal year-end September 30, 2018.
The Trust identifies its major tax jurisdictions as the U.S. Government and the State of California. The Fund is not aware of any tax positions for which it is reasonably possible that the total amounts of unrecognized tax benefits will significantly change in the next twelve months.
| | J. | Fair Value Measurements. The Trust has adopted GAAP accounting principles related to fair value accounting standards which establish a definition of fair value and set out a hierarchy for measuring fair value. These standards require additional disclosures about the various inputs and valuation techniques used to develop the measurements of fair value and a |
19
Brandes Value NextShares
NOTES TO FINANCIAL STATEMENTS — (Unaudited) (continued)
| | discussion of changes in valuation techniques and related inputs during the period. These inputs are summarized in the three broad levels listed below: |
Level 1 — Fair value measurement within Level 1 should be based on an unadjusted quoted price in an active market that the Fund has the ability to access for the asset or liability at the measurement date. Because a quoted price alone forms the basis for the measurement, the access requirement within Level 1 limits discretion in pricing the asset or liability, including in situations in which there are multiple markets for the asset or liability with different prices and no single market represents a principal market for the asset or liability. Importantly, the Financial Accounting Standards Board has indicated that when a quoted price in an active market for a security is available, that price should be used to measure fair value without regard to an entity’s intent to transact at that price.
Level 2 — Fair value measurement within Level 2 should be based on all inputs other than unadjusted quoted prices included within Level 1 that are observable for the asset or liability. Other significant observable market inputs include quoted prices for similar instruments in active markets, quoted adjusted prices in active markets, quoted prices for identical or similar instruments in markets that are not active, and model-derived valuations in which the majority of significant inputs and significant value drivers are observable in active markets.
Level 3 — Fair value measurement within Level 3 should be based on unobservable inputs in such cases where markets do not exist or are illiquid. Significant unobservable inputs include model derived valuations in which the majority of significant inputs or significant value drivers are unobservable. Unobservable inputs are those inputs that reflect the Fund’s own assumptions that market participants would use to price the asset or liability based on the best available information.
| | K. | Security Valuation. Common and preferred stocks, exchange-traded funds and financial derivative instruments, such as futures contracts and options contracts that are traded on a national securities or commodities exchange, are valued at the last reported sales price at the close of regular trading on each day the exchange is open for trading, in the case of common stocks and exchange-traded funds, or, in the case of futures contracts or options contracts, the settlement price determined by the relevant exchange. Securities listed on the NASDAQ National Market System for which market quotations are readily available are valued using the NASDAQ Official Closing Price. To the extent these securities are actively traded and valuation adjustments are not applied, they are categorized as Level 1 of the fair value hierarchy. |
Equity securities traded on an exchange for which there have been no sales on the valuation date are generally valued at the mean between last
20
Brandes Value NextShares
NOTES TO FINANCIAL STATEMENTS — (Unaudited) (continued)
bid and ask price on such day and are categorized as Level 2 of the fair value hierarchy, or are fair valued by the Valuation Committee.
Investments in registeredopen-end management investment companies will be valued based upon the NAVs of such investments and are categorized as Level 1 of the fair value hierarchy.
Valuation adjustments may be applied to certain common and preferred stocks that are solely traded on a foreign exchange to account for the market movement between the close of the foreign market and the close of the New York Stock Exchange (“NYSE”). These securities are generally valued using pricing service providers that consider the correlation of the trading patterns of the foreign securities to the intraday trading in the U.S. markets for investments. Securities using these valuation adjustments are categorized as Level 2 of the fair value hierarchy. None of the Fund’s securities were fair valued utilizing this method as of March 31, 2019.
Fixed income securities (other than repurchase agreements and demand notes) including corporate, convertible and municipal bonds and notes, U.S. government agencies, U.S. Treasury obligations, sovereign issues, bank loans, convertible preferred securities, fixed income securities purchased on a delayed delivery basis andnon-U.S. bonds are normally valued on the basis of quotes obtained from brokers and dealers or independent pricing services or sources. Independent pricing services typically use information provided by market makers or estimates of market values obtained from yield data relating to investments or securities with similar characteristics. The service providers’ internal models use inputs that are observable such as, among other things, issuer details, interest rates, yield curves, prepayment speeds, credit risks/ spreads, default rates and quoted prices for similar assets. Securities that use similar valuation techniques and inputs as described above are categorized as Level 2 of the fair value hierarchy.
Rights that are traded on a national securities exchange are valued at the last reported sales price at the close of regular trading on each day the exchange is open. A right is a privilege offered by a corporation to its shareholders pro rata to subscribe to a certain security at a specified price, often for a short period. Rights may or may not be transferable.
The Fund may enter into mortgage dollar roll transactions in which the Fund sells a mortgage-backed security to a counterparty and simultaneously enters into an agreement with the same counterparty to buy back a similar security on a specific future date at a predetermined price. Risks may arise due to the delayed payment date and the potential inability of counterparties to complete the transaction. Mortgage dollar rolls are accounted for as purchase and sale transactions, which may increase the Fund’s portfolio turnover rate.
21
Brandes Value NextShares
NOTES TO FINANCIAL STATEMENTS — (Unaudited) (continued)
Mortgage and asset-backed securities are usually issued as separate tranches, or classes, of securities within each package of underlying securities. These securities are also normally valued by pricing service providers that use broker-dealer quotations or valuation estimates from their internal pricing models. The pricing models for these securities usually consider tranche level attributes, estimated cash flows and market-based yield spreads for each tranche, and current market data and incorporate packaged collateral performance, as available. Mortgage and asset-backed securities that use such valuation techniques and inputs are categorized as Level 2 of the fair value hierarchy.
Repurchase agreements and demand notes, for which neither vendor pricing nor market maker prices are available, are valued at amortized cost on the day of valuation, unless the Advisor determines that the use of amortized cost valuation on such day is not appropriate (in which case such instrument is fair valued in accordance with the fair value procedures of the Trust).
Certain securities may be fair valued in accordance with the fair valuation procedures approved by the Board of Trustees. The Valuation Committee is generally responsible for overseeing theday-to-day valuation processes and reports periodically to the Board. The Valuation Committee is authorized to make all necessary determinations of the fair value of portfolio securities and other assets for which market quotations are not readily available or if it is deemed that the prices obtained from brokers and dealers or independent pricing services are unreliable. The securities fair valued by the Valuation Committee are indicated in the Schedule of Investments and are categorized as Level 2 or Level 3 of the fair value hierarchy. Certain vendor priced securities may also be considered Level 3 if significant unobservable inputs are used by the vendors.
In using fair value pricing, the Fund attempts to establish the price that it might reasonably have expected to receive upon a sale of the security at 4:00 p.m. Eastern time. Valuing securities at fair value involves greater reliance on judgment than valuation of securities based on readily available market quotations. A Fund using fair value to price securities may value those securities higher or lower than another fund using market quotations or fair value to price the same securities. Further, there can be no assurance that the Fund could obtain the fair value assigned to a security if it were to sell the security at approximately the time at which the Fund determines its net asset value.
22
Brandes Value NextShares
NOTES TO FINANCIAL STATEMENTS — (Unaudited) (continued)
The following is a summary of the inputs used, as of March 31, 2019, involving the Fund’s assets carried at fair value. The inputs of methodology used for valuing securities may not be an indication of the risk associated with investing in those securities.
| | | | | | | | | | | | | | | | |
Description | | Level 1 | | | Level 2 | | | Level 3 | | | Total | |
Brandes Value NextShares | | | | | | | | | | | | | | | | |
Common Stocks | | | | | | | | | | | | | | | | |
Communication Services | | $ | 435,379 | | | $ | — | | | $ | — | | | $ | 435,379 | |
Consumer Discretionary | | | 163,667 | | | | — | | | | — | | | | 163,667 | |
Consumer Staples | | | 46,692 | | | | — | | | | — | | | | 46,692 | |
Energy | | | 270,487 | | | | — | | | | — | | | | 270,487 | |
Financials | | | 1,186,748 | | | | — | | | | — | | | | 1,186,748 | |
Health Care | | | 1,156,950 | | | | — | | | | — | | | | 1,156,950 | |
Industrials | | | 343,750 | | | | — | | | | — | | | | 343,750 | |
Information Technology | | | 649,802 | | | | — | | | | — | | | | 649,802 | |
Real Estate | | | 54,829 | | | | — | | | | — | | | | 54,829 | |
| | | | | | | | | | | | | | | | |
Total Common Stocks | | | 4,308,304 | | | | — | | | | — | | | | 4,308,304 | |
| | | | | | | | | | | | | | | | |
Preferred Stocks | | | | | | | | | | | | | | | | |
Financials | | | 143,489 | | | | — | | | | — | | | | 143,489 | |
| | | | | | | | | | | | | | | | |
Total Preferred Stocks | | | 143,489 | | | | — | | | | — | | | | 143,489 | |
| | | | | | | | | | | | | | | | |
Money Market Funds | | | 531,320 | | | | — | | | | — | | | | 531,320 | |
| | | | | | | | | | | | | | | | |
Total Investments in Securities | | $ | 4,983,113 | | | $ | — | | | $ | — | | | $ | 4,983,113 | |
| | | | | | | | | | | | | | | | |
There were no Level 3 securities in the Fund at the beginning or the end of the six months ended March 31, 2019.
NOTE 3 – INVESTMENT ADVISORY FEE AND OTHER TRANSACTIONS WITH AFFILIATES
| | A. | Advisor Fee. The Advisor provides the Fund with investment management services under an Investment Advisory Agreement. The Advisor furnishes all investment advice, office space and certain administrative services, and provides certain personnel, needed by the Fund. As compensation for its services, the Advisor is entitled to a monthly fee. The Advisor received a monthly fee at the annual rate of 0.30% based upon the Fund’s average daily net assets. For the six months ended March 31, 2019, the Fund incurred $5,083 in advisory fees. |
Certain officers and trustees of the Trust are also officers of the Advisor.
The Fund is responsible for its own operating expenses. The Advisor has contractually agreed to limit the Fund’s annual operating expenses, including repayment of previous waivers, to 0.40% of the Fund’s average daily net assets through January 31, 2020 (the “Expense Cap Agreement”).
23
Brandes Value NextShares
NOTES TO FINANCIAL STATEMENTS — (Unaudited) (continued)
The Fund may incur additional expenses not covered under the Expense Cap Agreement. These expenses include acquired fund fees and expenses, taxes, interest, broker commissions, and proxy expenses or other extraordinary expenses.
Any reimbursements of fee waivers made by the Advisor to the Fund are subject to repayment by the Fund, to the extent that the Fund is able to make the repayment within the expense limit specified in its Expense Cap Agreement. Under the Expense Cap Agreement that was in place during the period covered by this report, any such repayment must be made before the end of the thirty-six months after the month in which the related reimbursement or waiver occurred. For the six months ended March 31, 2019, the Advisor waived expenses and/or reimbursed the Fund $88,633. Potential recovery amounts expire through the following periods:
| | |
Period Ended
September 30, 2021 | | Six Months Ended
March 31, 2022 |
| $134,544 | | $88,633 |
| | B. | Administration Fee. U.S. Bancorp Fund Services, LLC, doing business as U.S. Bank Global Fund Services, (the “Administrator”) acts as administrator for the Fund. The Administrator prepares various federal and state regulatory filings; prepares reports and materials to be supplied to the Trustees; monitors the activities of the Fund’s custodian, transfer agent and accountant; coordinates the preparation and payment of Fund expenses; and reviews the Fund’s expense accruals. For these services, the Fund pays the administrator monthly a fee accrued daily and based on the Fund’s average daily net assets. The Fund may also reimburse the Administrator for such out-of-pocket expenses as incurred by the Administrator in performance of its duties. The amounts paid directly to the Administrator by the Fund for administrative services are included in the Administration fees in the Statement of Operations. |
| | C. | Distribution Fee. ALPS Distributors, LLC (the “Distributor”), a registered broker-dealer, acts as the Fund’s principal underwriter in a continuous public offering of the Fund’s shares. All of the Fund’s distribution expenses are paid by the Advisor. |
The Fund has adopted a Distribution Plan (the “Plan”) pursuant to the Rule 12b-1 under the Investment Company Act of 1940. The Plan is designed to reimburse the Distributor or dealers for certain promotional and other sales related costs associated with sales of Fund shares. Unreimbursed amounts may be carried forward and paid in a subsequent year, to the extent that total expenses under the Plan does not exceed 0.25% of the average daily net assets of the Fund. As of March 31, 2019, the Plan had not been activated for the Fund.
24
Brandes Value NextShares
NOTES TO FINANCIAL STATEMENTS — (Unaudited) (continued)
NOTE 4 – PURCHASE AND SALES OF SECURITIES
The cost of purchases and the proceeds from sales of securities of the Fund, excluding short-term investments, were as follows for the six months ended March 31, 2019:
| | | | | | | | | | | | | | |
| U.S. Government | | | Other | |
| Purchases | | | Sales | | | Purchases | | | Sales | |
| $ | — | | | $ | — | | | $ | 2,923,057 | | | $ | 164,523 | |
NOTE 5 – CAPITAL STOCK TRANSACTIONS
The Fund issues and redeems shares only in blocks of 25,000 shares or multiples thereof (“Creation Units”). Creation Units may be purchased or redeemed only by or through broker-dealers or institutional investors that have entered into agreements with the Fund’s Distributor (“Authorized Participants”). The Fund issues and redeems Creation Units in return for the securities, instruments and/or cash (the “Basket”) that the Fund specifies each business day. The Fund imposes transaction fees on Creation Units issued and redeemed to offset the estimated cost to the Fund of processing the transaction and converting the Basket to or from the desired portfolio composition.
NOTE 6 – FEDERAL INCOME TAX MATTERS
GAAP requires that certain components of net assets be reclassified between financial and tax reporting. Temporary differences do not require reclassification. Temporary and permanent differences have no effect on net assets or net asset value per share. For the period ended September 30, 2018, the Fund made the following permanent book-to-tax reclassifications primarily related to the organizational costs that occured:
| | | | | | | | | | |
Undistributed Net
Investment Income | | | Net
Realized Gain | | | Paid-In Capital | |
| $ | 26 | | | $ | — | | | $ | (26 | ) |
As of September 30, 2018, the Fund’s components of distributable earnings on a tax basis were as follows:
| | | | |
Cost of investments for tax purposes | | $ | 2,036,608 | |
| | | | |
Gross tax unrealized appreciation | | | 90,285 | |
Gross tax unrealized depreciation | | | (66,720 | ) |
| | | | |
Net unrealized appreciation on investments | | | 23,565 | |
Distributable ordinary income | | | 7,009 | |
Distributable long-term capital gains | | | — | |
| | | | |
Total distributable earnings | | | 7,009 | |
| | | | |
Other accumulated gains | | | — | |
| | | | |
Total accumulated gains | | $ | 30,574 | |
| | | | |
25
Brandes Value NextShares
NOTES TO FINANCIAL STATEMENTS — (Unaudited) (continued)
The differences between book and tax basis distributable earnings are primarily related to the differences in classification of paydown gains and losses for tax purposes compared to book purposes. The difference between book and tax basis unrealized depreciation on investments is due primarily to timing differences resulting from wash sale transactions. These differences are temporary.
The tax compositions of dividends for the period ended September 30, 2018 for the Fund were as follows:
| | | | | | |
| Ordinary Income | | | Long Term
Capital Gains | |
| $ | 10,658 | | | $ | — | |
For the period ended September 30, 2018, the Fund did not have any capital loss carryforwards.
NOTE 7 – NEW ACCOUNTING PRONOUNCEMENTS
In August 2018, FASB issued ASU2018-13, Fair Value Measurement (Topic 820): Disclosure Framework – Changes to the Disclosure Requirements for Fair Value Measurement (“ASU2018-13”). The primary focus of ASU2018-13 is to improve the effectiveness of the disclosure requirements for fair value measurements. The changes affect all companies that are required to include fair value measurement disclosures. In general, the amendments in ASU2018-13 are effective for all entities for fiscal years and interim periods within those fiscal years, beginning after December 15, 2019. An entity is permitted to early adopt the removed or modified disclosures upon the issuance of ASU2018-13 and may delay adoption of the additional disclosures, which are required for public companies only, until their effective date. Management has chosen to adopt this disclosure in this report.
In August 2018, the Securities and Exchange Commission issued Final Rule ReleaseNo. 33-10532, Disclosure Update and Simplification, which in part amends certain disclosure requirements of RegulationS-X that have become redundant, duplicative, overlapping, outdated, or superseded, in light of other Commission disclosure requirements, U.S. Generally Accepted Accounting Principles, or changes in the information environment. The amendments are intended to facilitate the disclosure of information to investors and simplify compliance without significantly altering the total mix of information provided to investors. Management has chosen to adopt this disclosure in this report.
NOTE 8 – SUBSEQUENT EVENTS
In preparing these financial statements, the Trust has evaluated events and transactions for potential recognition or disclosure through the date the financial statements were available to be issued. The Trust has concluded that there are no subsequent events to note.
26
Brandes Value NextShares
ADDITIONAL INFORMATION — (Unaudited)
BOARD CONSIDERATION AND CONTINUATION OF INVESTMENT ADVISORY AGREEMENT
In November 2018 the Board of Trustees of Brandes Investment Trust (the “Trust”), including the independent Trustees, unanimously approved renewal of the Investment Advisory Agreement (the “Agreement”) between the Trust and Brandes Investment Partners, L.P. (the “Advisor”) with respect to Brandes Value NextShares (the “Fund”) for an additionalone-year term.
Information Reviewed
During the course of each year, Board members review a wide variety of materials relating to the nature, extent and quality of the services provided to the Fund by the Advisor, including reports on the Fund’s investment results, portfolio composition, portfolio trading practices, and other matters. In addition, in connection with its annual review of the Agreement with respect to the Fund, the Board requested and reviewed supplementary information that included materials regarding the Fund’s investment results and advisory fee and expense comparisons for peer groups and categories of similar funds identified by Morningstar Associates (“Morningstar”); financial and profitability information regarding the Advisor; the methods used by the Advisor to evaluate and compensate its professional investment personnel; descriptions of various functions performed by the Advisor on behalf of the Trust such as compliance monitoring and portfolio trading practices; and information about the personnel providing investment management and administrative services to the Fund.
In connection with its reviews, the Board received assistance and advice regarding legal and industry standards from counsel to the Trust and the independent Trustees. The independent Trustees discussed the approval of the Agreement with respect to the Fund with representatives of the Advisor at two Board meetings and in private sessions with counsel at which no representatives of the Advisor were present. In deciding to recommend approval of the Agreement with respect to the Fund, the Board and the independent Trustees did not identify any single or particular piece of information that, in isolation, was the controlling factor, and each Trustee did not necessarily attribute the same weight to each factor. This summary describes the most important, but not all, of the factors considered by the Board and the independent Trustees.
Nature, Extent and Quality of Services
With respect to the nature, extent and quality of services provided by the Advisor to the Fund, the Trustees reviewed among other things the quality and depth of the Advisor’s investment management staff, its regulatory compliance resources and program, its business continuity and cyber-security programs, the investment results of the Fund and theday-to-day administrative services provided by the Advisor to the Fund.
27
Brandes Value NextShares
ADDITIONAL INFORMATION — (Unaudited) (continued)
With respect to the Fund’s investment results, the Trustees reviewed detailed information regarding a peer group of similarly managed funds selected by Morningstar Associates, all of the funds in the larger Morningstar category of funds managed with the same general style, and the Fund’s benchmark index. The Trustees also discussed with representatives of Morningstar the principles used in determining the Funds’ peer groups and categories. In addition, they reviewed the results of certain Funds considered by the Advisor to be the most direct competitors to the Fund in the Fund’s marketing channels. They noted the brief operating history of the Fund (less than one year) and concluded that the Fund’s performance was sufficient for renewal of the Agreement.
Advisory Fees, Total Expenses, Profitability and Ancillary Benefits
With respect to the advisory fee and total expenses of the Fund, the independent Trustees noted that the Fund’s advisory fee was the same as the median fee of a peer group of similar funds identified by Morningstar and the net expense ratio of the Fund was near the Morningstar peer group median. They also noted that in the Fund’s brief period of operations, the Advisor was subsidizing the Fund’s expenses, the Fund was not profitable to the Advisor and any ancillary benefits to the Advisor were minimal.
Conclusion
Based on their review, including consideration of each of the factors referred to above, the Board and the independent Trustees concluded that the Agreement is fair and reasonable to the Fund and its shareholders, that each of the factors discussed above supported renewal of the Agreement with respect to the Fund, and that renewal of the Agreement was in the best interests of the Fund and its shareholders.
PROXY VOTING PROCEDURES
The Advisor votes proxies relating to the Fund’s portfolio securities in accordance with procedures adopted by the Advisor. You may obtain a description of these procedures, free of charge, by calling toll-free 1-800-331-2979. This information is also available through the Securities and Exchange Commission’s website athttp://www.sec.gov.
Information regarding how the Trust voted proxies relating to portfolio securities during the most recent 12-month period ended June 30 is available without charge, upon request, by calling 1-800-331-2979. This information is also available through the Securities and Exchange Commission’s website athttp://www.sec.gov.
28
Brandes Value NextShares
ADDITIONAL INFORMATION — (Unaudited) (continued)
PORTFOLIO HOLDINGS DISCLOSURE
The Trust files the Funds’ complete schedules of portfolio holdings with the Securities and Exchange Commission for the first and third quarters of each fiscal year on Form N-Q or Part F of Form N-PORT (beginning with filings after March 31, 2019). The Trust’s Form N-Q or Part F of Form N-PORT filings are available on the Securities and Exchange Commission’s website at http://www.sec.gov. The Trust’s Form N-Q or Part F of Form N-PORT filings may be reviewed and copied at the Commission’s Public Reference Room in Washington, D.C., and information on the operation of the Public Reference Room may be obtained by calling 1-800-SEC-0330. Information regarding the Trust’s Form N-Q or Part F of Form N-PORT filings is also available, without charge, by calling toll-free, 1-800-331-2979.
DISTRIBUTION OF DISCOUNTS AND PREMIUMS
A table showing the number of days the market price of the Fund’s shares was greater than the Fund’s net asset value, and the number of days it was less than the Fund’s net asset value (i.e., premium or discount) for the most recent calendar year may be found athttp://www.nextshares.com.
29
Brandes Value NextShares
TRUSTEES AND OFFICERS INFORMATION — (Unaudited)
The Board of Trustees is responsible for the overall management of the Trust’s business. The Board approves all significant agreements between the Trust and persons or companies furnishing services to the Trust, including the Trust’s agreements with the Advisor, Administrator, Custodian, Distributor and Transfer Agent. The Board of Trustees delegates the day-to-day operations of the Trust to its officers and service providers, subject to the Fund’s investment objectives and policies and to general supervision by the Board. The Trust’s Statement of Additional Information includes additional information about the Trustees and is available, without charge, bycalling 1-800-331-2979 or visiting www.brandes.com.
The Trustees and officers of the Trust, their business addresses and principal occupations during the past five years are:
| | | | | | | | | | |
Name, Address
and Age | | Position(s)
Held with
Trust | | Term of
Office
and
Length
of Time
Served(1) | | Principal
Occupation
During Past
5 Years | | Number
of Trust
Series
Overseen
by Trustee | | Other
Directorships/ Trusteeships
Held by
Trustee |
Independent Trustees(2) |
| | | | | |
Gregory Bishop, CFA 11988 El Camino Real, Suite 600 San Diego, CA 92130 (Born: 1961) | | Trustee | | Since January 2017 | | Retired. Previously Executive Vice President and Head of Retail Business, PIMCO Investments , from 1997 to 2014 | | 10 | | None |
| | | | | |
Jean E. Carter 11988 El Camino Real, Suite 600 San Diego, CA 92130 (Born: 1957) | | Trustee | | Since April 2008 | | Retired. | | 10 | | Bridge Builder Trust |
| | | | | |
Robert M. Fitzgerald, CPA (inactive) 11988 El Camino Real, Suite 600 San Diego, CA 92130 (Born: 1952) | | Trustee | | Since April 2008 | | Retired. | | 10 | | Hotchkis and Wiley Mutual Funds |
| | | | | |
Craig Wainscott, CFA 11988 El Camino Real, Suite 600 San Diego, CA 92130 (Born: 1961) | | Trustee and Chairman | | Since February 2012 | | Partner with The Paradigm Project and advisor to early-stage companies. | | 10 | | None |
30
Brandes Value NextShares
TRUSTEES AND OFFICERS INFORMATION — (Unaudited) (continued)
| | | | | | | | | | |
Name, Address
and Age | | Position(s)
Held with
Trust | | Term of
Office
and
Length
of Time
Served(1) | | Principal
Occupation
During Past
5 Years | | Number
of Trust
Series
Overseen
by Trustee | | Other
Directorships/ Trusteeships
Held by
Trustee |
“Interested” Trustees(3) | | | | | | | | |
| | | | | |
Oliver Murray 11988 El Camino Real, Suite 600 San Diego, CA 92130 (Born: 1962) | | Trustee | | Since February 2012 | | Chief Executive Officer, Brandes Investment Partners & Co.; Managing Director – PMCS of Brandes Investment Partners, L.P., the investment advisor to the Funds (the “Advisor”). | | 10 | | None |
| | | | | |
Jeff Busby, CFA 11988 El Camino Real, Suite 600 San Diego, CA 92130 (Born: 1961) | | Trustee and President | | Since July 2006 | | Executive Director of the Advisor. | | 10 | | None |
| | | | | |
Officers of the Trust | | | | | | | | | | |
| | | | | |
Thomas M. Quinlan 11988 El Camino Real, Suite 600 San Diego, CA 92130 (Born: 1970) | | Secretary | | Since June 2003 | | Associate General Counsel of the Advisor. | | N/A | | N/A |
| | | | | |
Gary Iwamura, CPA 11988 El Camino Real, Suite 600 San Diego, CA 92130 (Born: 1956) | | Treasurer | | Since September 1997 | | Finance Director of the Advisor. | | N/A | | N/A |
| | | | | |
Roberta Loubier 11988 El Camino Real, Suite 600 San Diego, CA 92130 (Born: 1971) | | Chief Compliance Officer | | Since September 2015 | | Global Head of Compliance, Brandes Investment Partners, L.P. | | N/A | | N/A |
| (1) | Trustees and officers of the Fund serve until their resignation, removal or retirement. |
| (2) | Not “interested persons” of the Trust as defined in the 1940 Act. |
| (3) | “Interested persons” of the Trust as defined in the 1940 Act by virtue of their positions with the Advisor. |
31
Brandes Value NextShares
PRIVACY NOTICE
Brandes Investment Trust and Brandes Investment Partners, L.P. may collectnon-public information about you from the following sources:
| • | | Information we receive about you on applications or other forms; |
| • | | Information you give us orally; and |
| • | | Information about your transactions with us. |
We do not disclose anynon-public personal information about any shareholder or former shareholder of the Fund without the shareholder’s authorization, except as required by law or in response to inquiries from governmental authorities. We restrict access to your personal and account information to those employees who need to know that information to provide products and services to you. We also may disclose that information to unaffiliated third parties (such as to brokers or custodians) only as permitted by law and only as needed for us to provide agreed services to you. We maintain physical, electronic and procedural safeguards to guard yournon-public personal information.
If you hold shares of the Fund through a financial intermediary, such as a broker-dealer, bank, or trust company, the privacy policy of your financial intermediary governs how your non-public personal information would be shared with nonaffiliated third parties.

ADVISOR Brandes Investment Partners, L.P. 11988 El Camino Real, Suite 600 San Diego, CA 92130 800.331.2979 DISTRIBUTOR ALPS Distributors, Inc. 1290 Broadway, #1100 Denver, CO 80203 TRANSFER AGENT U.S. Bancorp Fund Services, LLC 615 E. Michigan Street, 3rd Floor Milwaukee, WI 53202 INDEPENDENT REGISTERED PUBLIC ACCOUNTING FIRM PricewaterhouseCoopers LLP 601 South Figueroa Street Los Angeles, CA 90017 LEGAL COUNSEL Morgan, Lewis & Bockius LLP One Federal Street Boston, MA 02110 This report is intended for shareholders of the Brandes Value NextShares and may not be used as sales literature unless preceded or accompanied by a current prospectus. Statements and other information herein are dated and are subject to change.
Item 2. Code of Ethics.
Not applicable for semi-annual reports.
Item 3. Audit Committee Financial Expert.
Not applicable for semi-annual reports.
Item 4. Principal Accountant Fees and Services.
Not applicable for semi-annual reports.
Item 5. Audit Committee of Listed Registrants.
Not applicable to registrants who are not listed issuers (as defined in Rule10A-3 under the Securities Exchange Act of 1934).
Item 6. Investments.
| (a) | Schedule of Investments is included as part of the report to shareholders filed under Item 1 of this Form. |
Item 7. Disclosure of Proxy Voting Policies and Procedures forClosed-End Management Investment Companies.
Not applicable toopen-end investment companies.
Item 8. Portfolio Managers ofClosed-End Management Investment Companies.
Not applicable toopen-end investment companies.
Item 9. Purchases of Equity Securities byClosed-End Management Investment Company and Affiliated Purchasers.
Not applicable toopen-end investment companies.
Item 10. Submission of Matters to a Vote of Security Holders.
There have been no material changes to the procedures by which shareholders may recommend nominees to the registrant’s board of trustees.
Item 11. Controls and Procedures.
| (a) | The registrant’s President and Treasurer have reviewed the Registrant’s disclosure controls and procedures (as defined in Rule30a-3(c) under the Investment Company Act of 1940 (the “Act”)) as of a date within 90 days of the filing of this report, as required by Rule30a-3(b) under the Act and Rules13a-15(b) or15d-15(b) under the Securities Exchange Act of 1934. Based on their review, such officers have concluded that the disclosure controls and procedures are effective in ensuring that information required to be disclosed in this report is appropriately recorded, processed, summarized and reported and made known to them by others within the Registrant and by the Registrant’s service provider. |
| (b) | No changes in the registrant’s internal control over financial reporting (as defined in Rule30a-3(d) under the Act) occurred during the second fiscal quarter of the period covered by this report that materially affected, or are reasonably likely to materially affect, the registrant’s internal control over financial reporting. |
Item 12. Exhibits.
| (a) | (1)Any code of ethics or amendment thereto, that is the subject of the disclosure required by Item 2, to the extent that the registrant intends to satisfy Item 2 requirements through filing an exhibit.1) Incorporated by reference to the registrant’s FormN-CSR filed January 7, 2005. |
(2)A separate certification for each principal executive and principal financial officer pursuant to Section 302 of the Sarbanes-Oxley Act of 2002.Filed herewith.
(3)Any written solicitation to purchase securities under Rule 23c-1 under the Act sent or given during the period covered by the report by or on behalf of the registrant to 10 or more persons.Not applicable toopen-end investment companies.
| (b) | Certifications pursuant to Section 906 of the Sarbanes-Oxley Act of 2002. Furnished herewith. |
SIGNATURES
Pursuant to the requirements of the Securities Exchange Act of 1934 and the Investment Company Act of 1940, the registrant has duly caused this report to be signed on its behalf by the undersigned, thereunto duly authorized.
| | | | |
| | | (Registrant) Brandes Investment Trust |
| | |
| | By (Signature and Title)* | | /s/ Jeff Busby |
| | | | Jeff Busby, President and Principal Executive Officer |
| | |
| | Date 6/5/19 | | |
Pursuant to the requirements of the Securities Exchange Act of 1934 and the Investment Company Act of 1940, this report has been signed below by the following persons on behalf of the registrant and in the capacities and on the dates indicated.
| | | | |
| | | By (Signature and Title)* | | /s/ Jeff Busby |
| | | | Jeff Busby, President and Principal Executive Officer |
| | |
| | Date 6/5/19 | | |
| | | | |
| | | By (Signature and Title)* | | /s/ Gary Iwamura |
| | | | Gary Iwamura, Treasurer and Principal Financial Officer |
| | |
| | Date 6/5/19 | | |
| * | Print the name and title of each signing officer under his or her signature. |