UNITED STATES
SECURITIES AND EXCHANGE COMMISSION
Washington, D.C. 20549
FORM N-CSR
CERTIFIED SHAREHOLDER REPORT OF REGISTERED MANAGEMENT INVESTMENT COMPANIES
Investment Company Act File Number 811-08614
Brandes Investment Trust
(Exact name of registrant as specified in charter)
4275 Executive Square, 5th Floor
La Jolla, CA 92037
(Address of principal executive offices) (Zip code)
Lea Anne Copenhefer
Morgan, Lewis & Bockius LLP
One Federal Street
Boston, MA 02110-1726
(Name and address of agent for service)
(858) 755-0239
Registrant’s telephone number, including area code
Date of fiscal year end: September 30
Date of reporting period: March 31, 2024
Item 1. Reports to Stockholders.
(a) The following is a copy of the reports transmitted to shareholders pursuant to Rule 30e-1 under the Investment Company Act of 1940 (the “Act”) (17 CFR 270.30e-1):
1
SEMI-ANNUAL
REPORT
INTERNATIONAL EQUITY FUND
GLOBAL EQUITY FUND
EMERGING MARKETS VALUE FUND
INTERNATIONAL SMALL CAP EQUITY FUND
SMALL CAP VALUE FUND
CORE PLUS FIXED INCOME FUND
For the six months ended March 31, 2024

Table of Contents
1
Brandes International Equity Fund
Dear Fellow Investor,
The net asset value of the Brandes International Equity Fund (Class I Shares) advanced 16.46% in the six months ended March 31, 2024. During the same period, the MSCI EAFE Index gained 16.81%.
The primary drivers of performance were holdings in industrials and materials. Aerospace and defense companies Rolls-Royce and Embraer, as well as construction materials firm Heidelberg Materials, stood out as leading contributors.
Rolls-Royce and Embraer continued to benefit from the ongoing recovery in passenger air travel that has led to solid revenue growth, expanding profit margins, healthier cash-flow generation, and healed balance sheets. These positive fundamental developments helped confirm our long-term thesis around franchise quality, balance sheet durability, and end-market recovery potential for these holdings. Moreover, record backlogs highlighted—in our view—the appealing long-term secular growth outlook for global passenger air travel in an industry that has historically allowed incumbents to generate attractive returns on capital. Consequently, we revised our intrinsic value estimates for these companies upward, and believe they continue to offer an attractive risk/reward tradeoff at current valuation levels.
Select technology holdings also delivered solid performance. Notably, Taiwan Semiconductor Manufacturing Company (TSMC) appreciated as the proliferation of artificial intelligence (AI) applications fueled rising demand for semiconductor content. Besides TSMC, German software firm SAP also contributed positively to returns.
Health care holdings, such as Spain’s Grifols and pharmaceutical companies Sanofi, Takeda Pharmaceutical, and Astellas Pharma, were notable detractors in the period.
Biotechnology firm Grifols grappled with multiple declines in its share price following a short seller’s report that questioned the company’s debt and corporate governance practices. In our opinion, the risks highlighted in the report had been largely known, and we maintained our position in the company despite the volatility.
We continue to believe there is potentially meaningful upside in the stock. Grifols’ plasma business weathered considerable challenges amid the COVID-19 pandemic, including decreased blood donations and higher costs associated with compensating donors. Additionally, we appreciate Grifols’ competitive position in a consolidated industry with appealing potential growth.
Sanofi saw its share price decline after announcing a significant increase in research and development investment in its late-stage drug pipeline, which is expected to impact its near-term financial results. Taking a long-term view, however, we believe the share-price drop was overdone. The shares now trade at a low double-digit multiple of what we believe will likely be trough-level earnings, offering an appealing long-term risk/reward tradeoff, in our opinion.
Past performance is not a guarantee of future results.
Brandes International Equity Fund
Outside of health care, shares of Chinese internet retailer Alibaba fell after the company abandoned plans to spin off its cloud business. While Alibaba’s announcement was disappointing as it removed a potential catalyst for unlocking the significant value that we see in one of its businesses, we continue to believe the company is well positioned. Following the decline, Alibaba now trades at what we consider an attractive valuation of 8x forward earnings.
Select Portfolio Activity
There were several new purchases over the period, including U.K. health care equipment firm Smith & Nephew, consumer goods company Unilever, China-based battery maker Contemporary Amperex Technology Co. (CATL) and Mexico-based telecommunications services provider America Movil.
Smith & Nephew, a global leader in medical devices, specializes in orthopedics (including knee and hip replacements), sports medicine, ENT (ear, nose, and throat), and wound care. Over the past three years, the company’s shares have been under pressure as many elective but crucial medical procedures, such as knee and hip replacement surgeries, were delayed due to the COVID-19 pandemic. More recently, Smith & Nephew has also faced inflation challenges in its supply chain, which will likely impact its near-term margins. Nevertheless, we see the company as an appealing investment opportunity. We believe it is well positioned for a recovery in demand for elective procedures.
One of the world’s largest fast moving consumer goods companies, Unilever derives over half of its sales from emerging markets. Its shares recently slipped on concerns about slowing growth and margin pressures. Following several earnings downgrades, Unilever now trades at a discount to its European consumer staples peers. In our opinion, the share-price decline has offered an appealing opportunity to invest in a well-positioned company at a discounted valuation.
Contemporary Amperex Technology Co. (CATL) is the world’s largest producer of lithium-ion batteries for electric vehicles and energy storage systems, with an estimated global market share of approximately 35% in each segment. Known for its technological and cost leadership, CATL offers products for both premium and mass-market electric vehicles.
CATL stands out as a high-quality player in the global battery supply chain, excelling in technology, cost efficiency, cash-flow generation, and balance-sheet strength. At its current valuations, we believe the stock represents an attractive opportunity to invest in an industry leader amid a weak point in the industry cycle while keeping in mind the long-term trend of increasing levels of vehicle electrification.
Other major portfolio activity included the divestments of Taisho Pharmaceutical, insurers MS&AD Holdings (Japan) and Aegon (Netherlands), as well as Japan-based communication services company Softbank which we sold as they appreciated to our estimate of their intrinsic values.
3
Brandes International Equity Fund
Looking Forward
The portfolio has overweight positions in the United Kingdom, France, and emerging markets, and underweight positions in Australia and Japan. From a sector perspective, it holds key overweights to communication services, health care, and consumer staples, while maintaining meaningful underweights to industrials, technology, and financials.
At quarter end, value stocks continue to trade in the least expensive decile relative to growth (MSCI EAFE Value vs. MSCI EAFE Growth) since the inception of the style indices. This is evident across various valuation measures, including price/earnings, price/cash flow, and enterprise value/sales. Historically, such discount levels often signaled attractive subsequent returns for value stocks. This is encouraging for us as the Fund, guided by our value philosophy and process, has had the tendency to outperform the value index when it outperformed the benchmark.
Looking ahead, we remain optimistic about the prospects of our holdings. As of March 31, 2024, the Brandes International Equity Fund trades at more compelling valuation levels, in our opinion, while offering more attractive long-term growth characteristics relative to the benchmark and the MSCI EAFE Value Index.
For 50 years, Brandes Investment Partners has had the same goal: Seek better-than-market returns to help you pursue your long-term investment goals. We believe steadfast adherence to our value investing approach can help us achieve this aim because it compels us to invest in companies we view as strong yet appealingly priced. We thank you for your confidence and for investing with us.
Sincerely yours,
The Brandes International Large-Cap Investment Committee
Brandes Investment Trust
For term definitions, please refer to https://www.brandes.com/termdefinitions
Past Performance is not a guarantee of future results.
Diversification does not assure a profit or protect against a loss.
Because the values of the Fund’s investments will fluctuate with market conditions, so will the value of your investment in the Fund. You could lose money on your investment in the Fund, or the Fund could underperform other investments. The values of the Fund’s investments fluctuate in response to the activities of individual companies and general stock market and economic conditions. In addition, the performance of foreign securities depends on the political and economic environments and other overall economic conditions in the countries where the Fund invests. Emerging country markets involve greater risk and volatility than more developed markets. Some emerging markets countries may have fixed or managed currencies that are not free-floating against the U.S. dollar. Certain of these currencies have experienced, and
4
Brandes International Equity Fund
may experience in the future, substantial fluctuations or a steady devaluation relative to the U.S. dollar. Value stocks typically are less volatile than growth stocks; however, issues of value stocks typically have a lower expected growth rate in earnings and sales than issues of growth stocks.
Please refer to the Schedule of Investments in the report for complete holdings information. Fund holdings, geographic allocations and/or sector allocations are subject to change at any time and are not considered a recommendation to buy or sell any security.
The foregoing reflects the thoughts and opinions of Brandes Investment Partners® exclusively and is subject to change without notice.
Brandes Investment Partners® is a registered trademark of Brandes Investment Partners, L.P. in the United States and Canada.
Must be preceded or accompanied by a prospectus.
Index Guide
The MSCI EAFE Index with net dividends captures large and mid cap representation of developed market countries excluding the U.S. and Canada.
The MSCI EAFE Value Index with gross dividends captures large and mid cap securities across developed market countries, excluding the United States and Canada, exhibiting value style characteristics, defined using book value to price, 12-month forward earnings to price, and dividend yield.
The MSCI EAFE Growth Index with gross dividends captures large and mid cap securities across developed market countries, excluding the United States and Canada, exhibiting growth style characteristics, defined using long-term forward earnings per share (EPS) growth rate, short-term forward EPS growth rate, current internal growth rate, long-term historical EPS growth trend, and long-term historical sales per share growth trend.
MSCI has not approved, reviewed or produced this report, makes no express or implied warranties or representations and is not liable whatsoever for any data in the report. You may not redistribute the MSCI data or use it as a basis for other indices or investment products.
One cannot invest directly in an index.
The Brandes International Equity Fund is distributed by ALPS Distributors, Inc.
5
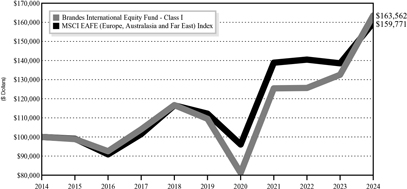
Brandes International Equity Fund
The following chart compares the value of a hypothetical $100,000 investment in the Brandes International Equity Fund – Class I from March 31, 2014 to March 31, 2024 with the value of such an investment in the MSCI EAFE (Europe, Australasia and Far East) Index for the same period.
Value of $100,000 Investment vs MSCI
EAFE (Europe, Australasia and Far East) Index (Unaudited)
| | | | | | | | | | | | | | | | | | | | |
| | | Average Annual Total Return | |
| | | Periods Ended March 31, 2024 | |
| | | One | | | Three | | | Five | | | Ten | | | Since | |
| | | Year | | | Years | | | Years | | | Years | | | Inception(1) | |
Brandes International Equity Fund | | | | | | | | | | | | | | | | | | | | |
Class A(2) | | | 23.09 | % | | | 8.96 | % | | | 8.06 | % | | | 4.80 | % | | | 7.46% | |
Class A (2) (with maximum sales charge) | | | 15.99 | % | | | 6.82 | % | | | 6.79 | % | | | 4.19 | % | | | 7.22% | |
Class C(3) | | | 22.10 | % | | | 8.23 | % | | | 7.31 | % | | | 4.20 | % | | | N/A | |
Class C (3) (with maximum sales charge) | | | 21.10 | % | | | 8.23 | % | | | 7.31 | % | | | 4.20 | % | | | N/A | |
Class I | | | 23.39 | % | | | 9.24 | % | | | 8.36 | % | | | 5.04 | % | | | 7.70% | |
Class R6(4) | | | 23.54 | % | | | 9.36 | % | | | 8.46 | % | | | 5.16 | % | | | 7.78% | |
MSCI EAFE (Europe, Australasia and Far East) Index | | | 15.32 | % | | | 4.78 | % | | | 7.33 | % | | | 4.80 | % | | | 5.08% | |
| (1) | The inception date is January 2, 1997. |
| (2) | Performance shown prior to January 31, 2011 for Class A shares reflects the performance of Class I shares adjusted to reflect Class A expenses. |
| (3) | Performance shown prior to January 31, 2013 for Class C shares reflects the performance of Class I shares adjusted to reflect Class C expenses. The Class C shares’ average annual total return for the 10-year period assumes that Class C shares automatically converted to Class A shares 8 years after the start of the |
6
Brandes International Equity Fund
| | period. The Class C shares’ average annual total return for the since inception period cannot be calculated as the Class A shares did not yet exist 8 years after the Fund’s inception date. |
| (4) | Performance shown prior to February 1, 2016 for Class R6 shares reflects the performance of Class I shares adjusted to reflect Class R6 expenses. |
Performance data quoted represents past performance; past performance does not indicate future results. The investment return and principal value of an investment will fluctuate so that an investor’s shares, when redeemed, may be worth more or less than their original cost. Current performance of the Fund may be lower or higher than the performance quoted. Performance data current to the most recent month end may be obtained by calling 800-331-2979.
The returns shown do not reflect the deduction of taxes that a shareholder would pay on Fund distributions or the redemption of Fund shares. Brandes Investment Partners, L.P., the Advisor, has a fee waiver arrangement in place to limit the Fund’s annual operating expenses.
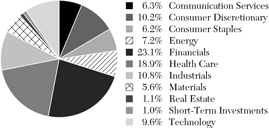
Sector Allocation as a Percentage of Total Investments as of
March 31, 2024 (Unaudited)
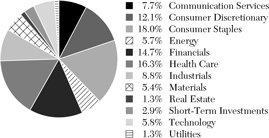
The sector classifications represented in the graph above are in accordance with Global Industry Classification Standard (GICS®), which was developed by and/or is the exclusive property of MSCI, Inc. and Standard & Poor’s Financial Services LLC.
7
Brandes Global Equity Fund
Dear Fellow Investor,
The net asset value of the Brandes Global Equity Fund (Class I Shares) increased 22.28% in the six months ended March 31, 2024. During the same period, the MSCI World Index rose 21.31%.
From an industry perspective, Fund holdings in the Aerospace & Defense and Banking industries were meaningful contributors to performance.
Both Rolls-Royce and Embraer continued to benefit from recoveries in their commercial aerospace end-markets, resulting in improved cash-flow generation and stronger balance sheets. This positive development has mitigated the downside risks associated with the investments, while amplifying their upside potential. Consequently, we revised our intrinsic value estimates for these companies upward and believe they continue to offer attractive margins of safety at current valuation levels. The margin of safety for any security is the discount of market price to our estimate of intrinsic value.
U.S. money center banks Citigroup and Wells Fargo sustained their recent positive momentum continuing to contribute to the Fund’s outperformance.
And our technology holdings, particularly semiconductor-related firms such as Taiwan Semiconductor and U.S.-based Micron Technology, also delivered solid performance. This was fueled by the improving semiconductor market and rising demand for semiconductor content, driven at least partially by the proliferation of artificial intelligence (AI) applications. German software company SAP also experienced a rise in its share price.
Performance detractors during the period included holdings in the Biotechnology and Pharmaceuticals industires.
Biotechnology firm Grifols grappled with multiple declines in its share price following a short seller’s report that questioned the company’s accounting and corporate governance practices. In our opinion, the risks highlighted in the report had been largely known, and we maintained our modest-sized position in the company despite the volatility—albeit now at a lower weighting due to the share-price decline. While we have long been concerned with the company’s balance sheet, there is a potential near-term catalyst for its improvement as Grifols is expected to complete the sale of its ownership stake in Shanghai RAAS in the first half of this year and use the proceeds to pay down a significant portion of its debt.
We continue to believe there is potentially meaningful upside in the stock. Grifols’ plasma business weathered considerable challenges amid the COVID-19 pandemic, including decreased blood donations and higher costs associated with compensating donors. The company had also made substantial investments to expand capacity for future growth, which further weighed on its profitability. While the recovery has been slower than anticipated, assuming the Shanghai RAAS transaction concludes as expected, Grifols appears attractively valued to us, trading at a single-digit multiple of
Past performance is not a guarantee of future results.
8
Brandes Global Equity Fund
pre-COVID earnings. Additionally, we appreciate Grifols’ competitive position in a consolidated industry with appealing long-term potential growth.
Pfizer’s stock price dropped as the market continued to express concern over the decrease in its COVID-related revenue and near-term growth prospects. Nevertheless, we believe the company represents an appealing long-term risk/reward tradeoff given its broad product portfolio and significant investments in research and development (R&D). We took advantage of the share-price reduction to increase our allocation.
Sanofi saw its share price decline after announcing a significant R&D investment increase in its late-stage drug pipeline, which we expect to affect its near-term financial results. However, taking a long-term view, we believe that the discount has been overly punitive. Sanofi’s shares now trade at a low double-digit multiple of what appears to us as trough-level earnings, thus offering an attractive opportunity over a longer time horizon.
From a country perspective, Fund holdings in the United States, the United Kingdom and Brazil contributed to performance, while results were hampered by holdings in China, Spain and Thailand.
Select Portfolio Activity
The investment committee initiated new positions in Switzerland-based luxury goods business Compagnie Financiere Richemont and Canadian aerospace and defense company CAE, while divesting our holdings in semiconductor equipment firm Applied Materials and multinational financial institution JPMorgan Chase.
CAE supplies simulation equipment and integrated pilot training services to both civil aviation and military customers. Competing in a market dominated by two key players (the other being Flight Safety), CAE boasts the world’s largest installed base of full-flight simulators. Over the past 20 years, CAE has diversified into the less cyclical pilot training business, offering training services through a global network of over 250 civil aviation and military training locations across 40 countries. The company derives 40% of its revenues from simulation products and 60% from training and services.
Our coverage of CAE began in 2011, and since then, our assessment of the company’s core franchise quality remains unchanged. It is notable that during the COVID-19 pandemic, CAE took significant steps to strengthen its competitive position and improve industry structure. Firstly, the company leveraged its financial strength to complete a series of opportunistic acquisitions, purchasing nine companies at what we deemed attractive prices. This has helped CAE consolidate end-markets and expand its capabilities. Secondly, it restructured its cost base, closing nine plants and removing $70 million in annualized costs that resulted in a 1.5% margin benefit on sales. Lastly, CAE expanded its relationship with mainline airlines, which chose to outsource an increasing share of their internal training needs. To satisfy this new demand, CAE embarked on a heavy capital expenditure cycle over the course of the pandemic that we believe will benefit shareholders in the years ahead.
9
Brandes Global Equity Fund
The opportunity to initiate a position in CAE came as investors have been concerned about recent margin weakness within the company’s defense segment. However, we view these challenges as temporary. Inflation and supply chain pressures have started to ease, Many of CAE’s under-earning, fixed-price contracts are set to expire by 2025. We expect that CAE is positioned to improve its profitability as legacy fixed priced contracts roll over and as new high-margin defense contracts begin to ramp up. The company has given guidance for mid-double-digit margins on new contracts versus mid-single digit on legacy fixed-price contracts that were impacted by pandemic-related cost pressures.
CAE’s investment case is supported by its dominant position within flight simulation and pilot training services that offer moat-like characteristics, strong free cash flow and high tangible returns on capital with favorable medium-term growth characteristics. The company also has access to attractive financing in the form of perpetual, zero-cost loans from the Canadian government for research and development initiatives.
We initially bought Applied Materials, the world’s largest supplier of wafer fabrication equipment for semiconductor production, when its shares declined in 2022 due to concerns about industry-wide semiconductor capital expenditures (capex). Although near-term earnings expectations were undermined by the cyclical downturn, we believed Applied Materials was well-positioned to capitalize on increased silicon intensity over the medium-term. Driven by rising need for DRAM and NAND memory, as well as the expanding use case for semiconductors across a variety of end-markets, we foresaw a potential uptick in demand for production equipment from companies like Applied Materials. Looking beyond short-term fluctuations, we anticipated that greater long-term semiconductor capex spending would be necessary to drive bit growth if the underlying requirement for memory chips and other semiconductors remained robust. With Applied Materials’ stock price dipping below its historical trading multiples, we saw an attractive long-term risk/reward tradeoff.
The market has increasingly favored semiconductor-related companies because of rising demand driven primarily by AI. We opted to sell our position in Applied Materials after the shares rose over the past 18 months and they reached our estimate of their intrinsic value.
Looking Forward
At the end of March, the Brandes Global Equity Fund continues to hold its key positions in the economically sensitive financials sector and the more defensive health care sector. Our largest sector underweight remains to technology, which rose above a 20% allocation in the MSCI World Index due to its price appreciation this past year. Our allocation is under half the benchmark weighting.
Geographically, we continue to hold overweight positions in the United Kingdom, France, and emerging markets, while maintaining underweights to the United States and Japan.
10
Brandes Global Equity Fund
Within the benchmark, a wide dispersion of sector performance has continued, with companies in the technology and communication services sectors materially outperforming the broad index. Meanwhile, more defensive groupings—such as consumer staples, utilities, and health care—have underperformed. We have begun to notice more attractively valued companies in these sectors and have modestly increased our allocation over the past year.
We believe that the current fundamentals of the Fund’s holdings bode well for the long term. As of March 31, 2024, the Brandes Global Equity Fund trades at more compelling valuation levels than the benchmark, in our opinion, and the Fund’s holdings in aggregate have stronger balance sheets than the companies that comprise the MSCI World and MSCI World Value indices, as highlighted by leverage metrics such as net debt to EBITDA (earnings before interest, taxes, depreciation and amortization).
With the valuation gap between value and growth stocks widening in the past year, we are increasingly optimistic about the return potential for value stocks. Following the performance of the growth index, fueled largely by a few U.S. tech-related companies, value stocks are trading at the largest discount relative to growth stocks (MSCI World Value vs. MSCI World Growth) since the inception of the style indices. This valuation disparity is evident across various metrics, such as price/earnings, price/cash flow and enterprise value/sales. Historically, such valuation differentials have often signaled attractive future returns for value stocks over longer term horizons.
Notably, the Fund, guided by our value philosophy and process, has tended to outperform the benchmark when value stocks have outperformed the MSCI World Index. We believe the Fund is an excellent complement and diversifier to passive and growth-oriented strategies. Going forward, we remain optimistic about the long-term prospects of the Fund’s holdings.
Brandes Investment Partners has had the same goal since we started 50 years ago: Realize above-market gains to help you pursue your long-term investment objectives. We aim to do so by staying true to our value approach, which seeks fundamentally sound but potentially undervalued companies for your portfolio. Thank you for investing with us.
Sincerely yours,
The Brandes Global Large-Cap Investment Committee
Brandes Investment Trust
For term definitions, please refer to https://www.brandes.com/termdefinitions
Past Performance is not a guarantee of future results.
Diversification does not assure a profit or protect against a loss.
11
Brandes Global Equity Fund
Because the values of the Fund’s investments will fluctuate with market conditions, so will the value of your investment in the Fund. You could lose money on your investment in the Fund, or the Fund could underperform other investments. The values of the Fund’s investments fluctuate in response to the activities of individual companies and general stock market and economic conditions. In addition, the performance of foreign securities depends on the political and economic environments and other overall economic conditions in the countries where the Fund invests. Emerging country markets involve greater risk and volatility than more developed markets. Some emerging markets countries may have fixed or managed currencies that are not free-floating against the U.S. dollar. Certain of these currencies have experienced, and may experience in the future, substantial fluctuations or a steady devaluation relative to the U.S. dollar. Value stocks typically are less volatile than growth stocks; however, issues of value stocks typically have a lower expected growth rate in earnings and sales than issues of growth stocks.
Please refer to the Schedule of Investments in the report for complete holdings information. Fund holdings, geographic allocations and/or sector allocations are subject to change at any time and are not considered a recommendation to buy or sell any security.
The foregoing reflects the thoughts and opinions of Brandes Investment Partners® exclusively and is subject to change without notice.
Brandes Investment Partners® is a registered trademark of Brandes Investment Partners, L.P. in the United States and Canada.
Must be preceded or accompanied by a prospectus.
Index Guide
The MSCI World Index with net dividends captures large and mid cap representation of developed markets.
The MSCI World Value Index with net dividends captures large and mid cap securities across developed market countries exhibiting value style characteristics, defined using book value to price, 12-month forward earnings to price, and dividend yield.
The MSCI World Growth Index with gross dividends captures large and mid cap securities across developed market countries exhibiting growth style characteristics, defined using long-term forward earnings per share (EPS) growth rate, short-term forward EPS growth rate, current internal growth rate, long-term historical EPS growth trend, and long-term historical sales per share growth trend.
MSCI has not approved, reviewed or produced this report, makes no express or implied warranties or representations and is not liable whatsoever for any data in the report. You may not redistribute the MSCI data or use it as a basis for other indices or investment products.
One cannot invest directly in an index.
12
Brandes Global Equity Fund
The Brandes Global Equity Fund is distributed by ALPS Distributors, Inc.
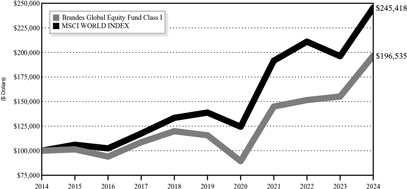
The following chart compares the value of a hypothetical $100,000 investment in the Brandes Global Equity Fund – Class I from March 31, 2014 to March 31, 2024 with the value of such an investment in the MSCI World Index for the same period.
Value of $100,000 Investment vs MSCI
World Index (Unaudited)
| | | | | | | | | | | | | | | | | | | | |
| | | Average Annual Total Return | |
| | | Periods Ended March 31, 2024 | |
| | | One | | | Three | | | Five | | | Ten | | | Since | |
| | | Year | | | Years | | | Years | | | Years | | | Inception(1) | |
Brandes Global Equity Fund | | | | | | | | | | | | | | | | | | | | |
Class A(2) | | | 26.38 | % | | | 10.41 | % | | | 10.91 | % | | | 6.72 | % | | | 7.77% | |
Class A (2) (with maximum sales charge) | | | 19.10 | % | | | 8.25 | % | | | 9.61 | % | | | 6.09 | % | | | 7.36% | |
Class C(3) | | | 25.44 | % | | | 9.60 | % | | | 10.08 | % | | | 6.08 | % | | | 7.34% | |
Class C (3) (with maximum sales charge) | | | 24.44 | % | | | 9.60 | % | | | 10.08 | % | | | 6.08 | % | | | 7.34% | |
Class I | | | 26.69 | % | | | 10.69 | % | | | 11.18 | % | | | 6.99 | % | | | 8.02% | |
MSCI World Index | | | 25.11 | % | | | 8.60 | % | | | 12.07 | % | | | 9.39 | % | | | 9.90% | |
| (1) | The inception date is October 6, 2008. |
| (2) | Performance shown prior to January 31, 2011 for Class A shares reflects the performance of Class I shares adjusted to reflect Class A expenses. |
| (3) | Performance shown prior to January 31, 2013 for Class C shares reflects the performance of Class I shares adjusted to reflect Class C expenses. The Class C shares’ average annual total return for the 10-year and since inception periods assumes that Class C shares automatically converted to Class A shares 8 years after the start of the period. |
13
Brandes Global Equity Fund
Performance data quoted represents past performance; past performance does not indicate future results. The investment return and principal value of an investment will fluctuate so that an investor’s shares, when redeemed, may be worth more or less than their original cost. Current performance of the Fund may be lower or higher than the performance quoted. Performance data current to the most recent month end may be obtained by calling 800-331-2979.
The returns shown do not reflect the deduction of taxes that a shareholder would pay on fund distributions or the redemption of fund shares. Brandes Investment Partners, L.P., the Advisor, has a fee waiver arrangement in place to limit the Fund’s annual operating expenses.
Sector Allocation as a Percentage of Total Investments as of
March 31, 2024 (Unaudited)
The sector classifications represented in the graph above are in accordance with Global Industry Classification Standard (GICS®), which was developed by and/or is the exclusive property of MSCI, Inc. and Standard & Poor’s Financial Services LLC.
14
Brandes Emerging Markets Value Fund
Dear Fellow Investor,
The net asset value of the Brandes Emerging Markets Value Fund (Class I Shares) increased 11.35% in the six months ended March 31, 2024. During the same period, the MSCI Emerging Markets Index gained 10.42%.
Notable performers included holdings in Taiwan, South Korea, and Brazil. Specifically, semiconductor firms Taiwan Semiconductor Manufacturing Company (TSMC) and SK Hynix aided returns, as did regional jet manufacturer Embraer.
Embraer continued to benefit from a recovery in its commercial aerospace end-market, resulting in improved cash-flow generation and a stronger balance sheet. Meanwhile, TSMC and SK Hynix appreciated as the proliferation of artificial intelligence (AI) applications fueled rising demand for semiconductor chips and servers.
Several holdings in China detracted from performance, notably TravelSky Technology, Chinasoft International, LONGi Green Energy Technology, and Alibaba.
TravelSky issued a profit warning in January, attributing it to cost inflation mainly driven by increased expenditures in salary compensation, technical support and maintenance, research and development, and system security. Chinasoft declined on weaker-than-anticipated revenue and earnings from the second half of 2023. Meanwhile, LONGi continued to grapple with an industry oversupply issue that has pressured pricing within its wafer segment. We believe LONGi will likely be able to maintain healthy profitability throughout the downcycle, in contrast to its less profitable, second-tier peers.
In addition to these company-specific challenges, many of our Chinese holdings faced subdued investor sentiment stemming from the country’s weaker-than-expected post-COVID economic rebound and consumption, and the persistent downturn in its property sector. While we did not add any new China-based companies to the portfolio during the quarter, we selectively increased our existing positions amid the share-price weakness.
Select Portfolio Activity
During the period, the emerging markets investment committee initiated positions in China-based battery producer Contemporary Amperex Technology Co. and Mexico-based telecom America Movil.
Contemporary Amperex Technology Co. (CATL) is the world’s largest producer of lithium-ion batteries for electric vehicles and energy storage systems, with an estimated global market share of approximately 35% in each segment. Known for its technological and cost leadership, CATL offers products for both premium and mass-market electric vehicles.
CATL stands out as a high-quality player in the global battery supply chain, excelling in technology, cost efficiency, cash-flow generation, and balance-sheet strength. At its
Past performance is not a guarantee of future results.
15
Brandes Emerging Markets Value Fund
current valuations, we believe the stock represents an attractive opportunity to invest in an industry leader amid a weak point in the industry cycle while keeping in mind the long-term trend of increasing levels of vehicle electrification. Boasting market leadership in Latin America, America Movil (AMX) is one of the world’s largest network operators in terms of subscribers. The company’s operations span 22 countries, with a primary focus in Latin America and a presence in Austria and Eastern Europe. Recently, several factors have pressured AMX’s share price. These included a year-over-year contraction in reported service revenue driven by a strong Mexican peso, some negative views on lower-than-expected returns to shareholders, and uncertainty around potential regulatory changes in Mexico, as well as fiscal loosening in the country as the 2024 presidential election approaches.
AMX’s share-price weakness provided a good opportunity to invest in what we consider a fundamentally sound company. AMX has a long history of prudent capital allocation, with a focus on long-term returns on capital and free-cash-flow generation.
Other major portfolio activity included the divestment of Indonesian telecom XL Axiata and electric utility Enel Chile, which we sold as they appreciated to our estimate of their intrinsic values.
Looking Forward
Our portfolio positioning is a result of our bottom-up approach focused on uncovering value potential across all emerging markets. As such, our overweights tend to reflect areas where we have found many compelling opportunities, while our underweights represent those where we have not observed as much value. We believe maintaining the discipline to avoid overpriced businesses and those that are statistically cheap for a reason is just as important as the diligence to identify potentially undervalued companies through rigorous fundamental analysis.
At the end of March, the Fund’s largest country weights were in China and Brazil, and the Fund’s largest industry weights were in Banks and Semiconductors & Semiconductor Equipment.
We continue to hold underweights to companies in India and Taiwan, while maintaining an overweight to Latin America through our diversified positions in telecommunications, utilities, energy, and real estate. In our view, these holdings, including our recent purchase America Movil, have the potential to gain from deflationary input costs and the increasing trend of nearshoring in Mexico and nearby regions.
While value leadership (MSCI EM Value vs. MSCI EM) provided a tailwind for the Fund over the last six months, it was our stock selection across sectors and countries that primarily drove our outperformance. Going forward, we remain optimistic about the portfolio’s holdings composition and the risk/reward tradeoff it offers.
16
Brandes Emerging Markets Value Fund
For 50 years, Brandes Investment Partners has had the same goal: Seek better-than-market returns to help you pursue your long-term investment goals. We believe steadfast adherence to our value investing approach can help us achieve this aim because it compels us to invest in companies we view as strong yet appealingly priced. We thank you for your confidence and for investing with us.
Sincerely yours,
The Brandes Emerging Markets Investment Committee
Brandes Investment Trust
For term definitions, please refer to https://www.brandes.com/termdefinitions
Past Performance is not a guarantee of future results.
Diversification does not assure a profit or protect against a loss.
Because the values of the Fund’s investments will fluctuate with market conditions, so will the value of your investment in the Fund. You could lose money on your investment in the Fund, or the Fund could underperform other investments. The values of the Fund’s investments fluctuate in response to the activities of individual companies and general stock market and economic conditions. In addition, the performance of foreign securities depends on the political and economic environments and other overall economic conditions in the countries where the Fund invests. Emerging country markets involve greater risk and volatility than more developed markets. Some emerging markets countries may have fixed or managed currencies that are not free-floating against the U.S. dollar. Certain of these currencies have experienced, and may experience in the future, substantial fluctuations or a steady devaluation relative to the U.S. dollar. Investments in small and medium capitalization companies tend to have limited liquidity and greater price volatility than investments in larger capitalization companies. Value stocks typically are less volatile than growth stocks; however, issues of value stocks typically have a lower expected growth rate in earnings and sales than issues of growth stocks.
Please refer to the Schedule of Investments in the report for complete holdings information. Fund holdings, geographic allocations and/or sector allocations are subject to change at any time and are not considered a recommendation to buy or sell any security.
The foregoing reflects the thoughts and opinions of Brandes Investment Partners® exclusively and is subject to change without notice.
Brandes Investment Partners® is a registered trademark of Brandes Investment Partners, L.P. in the United States and Canada.
Must be preceded or accompanied by a prospectus.
Index Guide
17
Brandes Emerging Markets Value Fund
The MSCI Emerging Markets Index with net dividends captures large and mid cap representation of emerging market countries.
The MSCI Emerging Markets Value Index with net dividends captures large and mid cap securities across emerging markets countries, exhibiting value style characteristics, defined using book value to price, 12-month forward earnings to price, and dividend yield.
MSCI has not approved, reviewed or produced this report, makes no express or implied warranties or representations and is not liable whatsoever for any data in the report. You may not redistribute the MSCI data or use it as a basis for other indices or investment products.
One cannot invest directly in an index.
The Brandes Emerging Markets Value Fund is distributed by ALPS Distributors, Inc.
18
Brandes Emerging Markets Value Fund
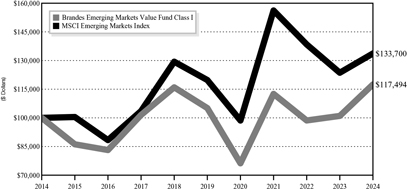
The following chart compares the value of a hypothetical $100,000 investment in the Brandes Emerging Markets Value Fund – Class I from March 31, 2014 to March 31, 2024 with the value of such an investment in the MSCI Emerging Markets Index for the same period.
Value of $100,000 Investment vs MSCI
Emerging Markets Index (Unaudited)
| | | | | | | | | | | | | | | | | | | | |
| | | Average Annual Total Return | |
| | | Periods Ended March 31, 2024(1) | |
| | | One | | | Three | | | Five | | | Ten | | | Since | |
| | | Year | | | Years | | | Years | | | Years | | | Inception(2) | |
Brandes Emerging Markets Value Fund | | | | | | | | | | | | | | | | | | | | |
Class A | | | 16.02 | % | | | 1.23 | % | | | 2.04 | % | | | 1.37 | % | | | 6.09% | |
Class A (with maximum sales charge) | | | 9.35 | % | | | -0.75 | % | | | 0.84 | % | | | 0.77 | % | | | 5.87% | |
Class C(3) | | | 15.17 | % | | | 0.63 | % | | | 1.37 | % | | | 0.81 | % | | | N/A | |
Class C (3) (with maximum sales charge) | | | 14.17 | % | | | 0.63 | % | | | 1.37 | % | | | 0.81 | % | | | N/A | |
Class I | | | 16.31 | % | | | 1.45 | % | | | 2.25 | % | | | 1.63 | % | | | 6.33% | |
Class R6(4) | | | 16.37 | % | | | 1.54 | % | | | 2.39 | % | | | 1.74 | % | | | 6.41% | |
MSCI Emerging Markets Index | | | 8.15 | % | | | -5.05 | % | | | 2.22 | % | | | 2.95 | % | | | N/A | |
| (1) | Prior to January 31, 2011, the Advisor managed a private investment fund with an investment objective, investment policies and strategies that were, in all material respects, equivalent to those of the Brandes Emerging Markets Value Fund. The performance information shown for the Class I shares for periods before January 31, 2011 is that of the private investment fund and reflects the net expenses of the private investment fund. The performance of the private investment fund prior to January 31, 2011 is based on a calculation method that is different from the standardized calculation method prescribed by the SEC. The performance information shown for the Class A shares has been adjusted to reflect the differences in |
19
Brandes Emerging Markets Value Fund
| | the net expense ratios between the Class I and A shares. The private investment fund was not registered under the Investment Company Act of 1940 (“1940 Act”) and was not subject to certain investment limitations, diversification requirements, and other restrictions imposed by the 1940 Act and the Internal Revenue Code of 1986, which, if applicable, may have adversely affected its performance. |
| (2) | The inception date is August 20, 1996. |
| (3) | Performance shown prior to January 31, 2013 for Class C shares reflects the performance of Class I shares adjusted to reflect Class C expenses. The Class C shares’ average annual total return for the 10-year period assumes that Class C shares automatically converted to Class A shares 8 years after the start of the period. The Class C shares’ average annual total return for the since inception period cannot be calculated as the Class A shares did not yet exist 8 years after the Fund’s inception date. |
| (4) | Performance shown prior to July 11, 2016 for Class R6 shares reflects the performance of Class I shares adjusted to reflect Class R6 expenses. |
Performance data quoted represents past performance; past performance does not indicate future results. The investment return and principal value of an investment will fluctuate so that an investor’s shares, when redeemed, may be worth more or less than their original cost. Current performance of the Fund may be lower or higher than the performance quoted. Performance data current to the most recent month end may be obtained by calling 800-331-2979.
The returns shown do not reflect the deduction of taxes that a shareholder would pay on fund distributions or the redemption of fund shares. Brandes Investment Partners, L.P., the Advisor, has a fee waiver arrangement in place to limit the Fund’s annual operating expenses.
Sector Allocation as a Percentage of Total Investments as of
March 31, 2024 (Unaudited)
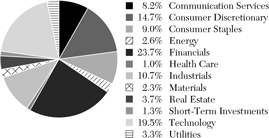
The sector classifications represented in the graph above are in accordance with Global Industry Classification Standard (GICS®), which was developed by and/or is the exclusive property of MSCI, Inc. and Standard & Poor’s Financial Services LLC.
20
Brandes International Small Cap Equity Fund
Dear Fellow Investor,
The net asset value of the Brandes International Small Cap Equity Fund (Class I Shares) advanced 23.23% in the six months ended March 31, 2024. During the same period, the MSCI ACWI ex USA Small Cap Index rose 12.44%.
Top contributors included holdings in the aerospace and defense industry, led by Rolls-Royce, Embraer, and Montana Aerospace. All three companies continued to see a resurgence in the markets in which they operate.
Our aerospace and defense holdings continued to benefit from the ongoing recovery in passenger air travel that has led to solid revenue growth, expanding profit margins, healthier cash-flow generation, and healed balance sheets. These positive fundamental developments helped confirm our long-term thesis around franchise quality, balance sheet durability, and end-market recovery potential for these holdings. Moreover, record backlogs highlighted—in our view—the appealing long-term secular growth outlook for global passenger air travel in an industry that has historically allowed incumbents to generate attractive returns on capital. Consequently, we revised our intrinsic value estimates for several of our aerospace and defense holdings upward, and believe they continue to offer an attractive risk/reward tradeoff at current valuation levels.
Notable detractors include several health care holdings such as Spain’s Grifols and France-based active pharmaceutical ingredient company Euroapi.
Biotechnology firm Grifols grappled with multiple declines in its share price following a short seller’s report that questioned the company’s debt and corporate governance practices. In our opinion, the risks highlighted in the report had been largely known, and we maintained our position in the company despite the volatility—albeit now at a lower weighting due to the share-price decline. While we have long been concerned with the company’s elevated financial leverage, we recognize that Grifols has several options at its disposal that can help derisk, including the partial sale of its stake in Shanghai RAAS that is scheduled to close in the first half of this year.
Furthermore, we appreciate Grifols’ competitive position in a consolidated industry with high barriers to entry and long-term secular growth, as well as its business model that should allow it to generate steady free cash flow if the industry returns to equilibrium. Trading at a single-digit multiple of pre-COVID earnings, Grifols appears attractively valued to us.
Euroapi issued another profit warning in October, revising down its EBITDA (earnings before interest, taxes, depreciation, and amortization) and sales growth guidance for the 2023 fiscal year, while also suspending its medium-term targets to 2026. Euroapi was carved out of global pharmaceutical firm Sanofi in May 2022, and it was expected that the company could face initial operational challenges as a standalone entity.
Past performance is not a guarantee of future results.
21
Brandes International Small Cap Equity Fund
Despite these short-term issues, we maintain a positive long-term outlook for Euroapi and have taken advantage of the share-price decline to add to our position.
Select Portfolio Activity
The small-cap investment committee initiated positions in Canada-based CAE and Switzerland’s Montana Aerospace.
CAE supplies simulation equipment and integrated pilot training services to both civil aviation and military customers. Competing in a market dominated by two key players (the other being Flight Safety), CAE boasts the world’s largest installed base of full-flight simulators. Over the past 20 years, CAE has diversified into the less cyclical pilot training business, offering training services through a global network of over 250 civil aviation and military training locations across 40 countries. The company derives 40% of its revenues from simulation products and 60% from training and services. It is notable that during the COVID-19 pandemic, CAE took significant steps to strengthen its competitive position and improve industry structure.
The opportunity to initiate a position in CAE came as investors have been concerned about recent margin weakness within the defense segment. However, we view these challenges as temporary. At its current valuation levels, CAE represents an appealing risk/reward tradeoff, in our opinion.
Montana Aerospace (AERO) is a vertically integrated manufacturer of metallic systems and components (aluminum, titanium) for the commercial aerospace, electric vehicle, and renewable energy end-markets. AERO, which went public in 2021 following its spin-off from parent company Montana Tech Components (MTC), has a relatively short operating history as a publicly traded company. However, its legacy assets date back to the 1990s when the business served as a U.S.-based casting company for Boeing.
AERO boasts a vertically integrated industrial base, expanding manufacturing scale, and low-cost industrial footprint that is intelligently located near customers. These capabilities position AERO as a cost-effective, one-stop-shop solution for aircraft OEMs (original equipment manufacturers) and Tier 1 suppliers (i.e., those that work the most closely with OEMs) looking to rationalize their highly complex and inefficient supply chains. To provide perspective, a typical commercial aircraft is made up of five million parts, and if one part is missing, the OEM can’t finish assembling the plane.
As air traffic has resumed, aircraft production has been ramping up, capital expenditures have been declining, and new factories have become operational. We believe it is an opportune time to invest in a company with an attractive long-term risk/reward tradeoff.
Other major portfolio activity included the full sale of a number of Japanese holdings including Fuji Media, medical device company Fukuda Denshi and Taisho Pharmaceutical.
22
Brandes International Small Cap Equity Fund
Taisho Pharmaceutical appreciated following a management buyout announcement. The offer reflected a 50% premium to Taisho’s six-month average trading price, and we divested our position as the share price surpassed the management buyout offer price.
Looking Forward
Allocations from a country and sector standpoint were largely unchanged during this period. The Fund maintains large allocations to industrials, consumer staples, and healthcare, while holding underweights in technology, materials, and consumer discretionary.
Geographically, the Fund continues to have significant exposure to companies in Japan (although underweight relative to the benchmark), the U.K., Ireland, and Hong Kong. It remains underweight Australia and Sweden relative to the benchmark. We believe the differences between the Fund’s portfolio and the MSCI ACWI ex USA Small Cap Index make it an appealing complement to index-tracking or passively managed strategies.
While value leadership (MSCI ACWI ex USA Small Cap Value vs. MSCI ACWI ex USA Small Cap) did provide a slight tailwind for the Fund over the last six months, it was our stock selection across sectors and countries that primarily drove outperformance. Going forward, we remain optimistic about the portfolio’s holdings composition and the risk/reward tradeoff it offers.
Brandes Investment Partners has had the same goal since we started 50 years ago: Realize above-market gains to help you pursue your long-term investment objectives. We aim to do so by staying true to our value approach, which seeks fundamentally sound but potentially undervalued companies for the Fund. Thank you for investing with us.
Sincerely yours,
The Brandes Small-Cap Investment Committee
Brandes Investment Trust
For term definitions, please refer to https://www.brandes.com/termdefinitions
Past Performance is not a guarantee of future results.
Diversification does not assure a profit or protect against a loss.
Because the values of the Fund’s investments will fluctuate with market conditions, so will the value of your investment in the Fund. You could lose money on your investment in the Fund, or the Fund could underperform other investments. The values of the Fund’s investments fluctuate in response to the activities of individual companies and general stock market and economic conditions. In addition, the performance of foreign securities depends on the political and economic environments and other overall economic conditions in the countries where the Fund invests. Emerging country markets involve greater risk and volatility than more developed markets. Some
23
Brandes International Small Cap Equity Fund
emerging markets countries may have fixed or managed currencies that are not free-floating against the U.S. dollar. Certain of these currencies have experienced, and may experience in the future, substantial fluctuations or a steady devaluation relative to the U.S. dollar. Investments in small and medium capitalization companies tend to have limited liquidity and greater price volatility than investments in larger capitalization companies. Value stocks typically are less volatile than growth stocks; however, issues of value stocks typically have a lower expected growth rate in earnings and sales than issues of growth stocks.
Please refer to the Schedule of Investments in the report for complete holdings information. Fund holdings, geographic allocations and/or sector allocations are subject to change at any time and are not considered a recommendation to buy or sell any security.
The foregoing reflects the thoughts and opinions of Brandes Investment Partners® exclusively and is subject to change without notice.
Brandes Investment Partners® is a registered trademark of Brandes Investment Partners, L.P. in the United States and Canada.
Must be preceded or accompanied by a prospectus.
Index Guide
The MSCI ACWI ex USA Small Cap Index with net dividends captures small-cap representation across developed and emerging markets excluding the United States.
The MSCI ACWI ex USA Small Cap Value Index captures small-cap securities across developed and emerging markets excluding the United States, exhibiting overall value style characteristics, defined using book value to price, 12-month forward earnings to price, and dividend yield.
MSCI has not approved, reviewed or produced this report, makes no express or implied warranties or representations and is not liable whatsoever for any data in the report. You may not redistribute the MSCI data or use it as a basis for other indices or investment products.
One cannot invest directly in an index.
The Brandes International Equity Small Cap Equity Fund is distributed by ALPS Distributors, Inc.
24
Brandes International Small Cap Equity Fund
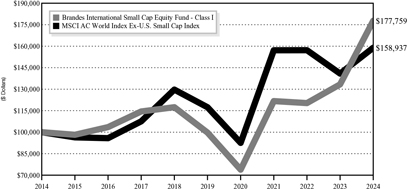
The following chart compares the value of a hypothetical $100,000 investment in the Brandes International Small Cap Fund – Class I from March 31, 2014 to March 31, 2024 with the value of such an investment in the MSCI AC World Index Ex-U.S. Small Cap Index for the same period.
Value of $100,000 Investment vs MSCI AC World Index
Ex-U.S. Small Cap Index (Unaudited)
| | | | | | | | | | | | | | | | | | | | |
| | | Average Annual Total Return | |
| | | Periods Ended March 31, 2024(1) | |
| | | One | | | Three | | | Five | | | Ten | | | Since | |
| | | Year | | | Years | | | Years | | | Years | | | Inception(2) | |
Brandes International Small Cap Equity Fund | | | | | | | | | | | | | | | | | | | | |
Class A | | | 33.07 | % | | | 13.22 | % | | | 12.02 | % | | | 5.70 | % | | | 9.08% | |
Class A (with maximum sales charge) | | | 25.42 | % | | | 11.01 | % | | | 10.70 | % | | | 5.08 | % | | | 8.85% | |
Class C(3) | | | 32.09 | % | | | 12.61 | % | | | 11.33 | % | | | 5.13 | % | | | N/A | |
Class C (3) (with maximum sales charge) | | | 31.09 | % | | | 12.61 | % | | | 11.33 | % | | | 5.13 | % | | | N/A | |
Class I | | | 33.28 | % | | | 13.46 | % | | | 12.25 | % | | | 5.92 | % | | | 9.34% | |
Class R6(4) | | | 33.47 | % | | | 13.61 | % | | | 12.39 | % | | | 6.03 | % | | | 9.41% | |
MSCI AC World Index | | | | | | | | | | | | | | | | | | | | |
Ex-U.S. Small Cap Index | | | 12.80 | % | | | 0.38 | % | | | 6.24 | % | | | 4.74 | % | | | 5.94% | |
| (1) | Prior to February 1, 2012, the Advisor managed a private investment fund with an investment objective, investment policies and strategies that were, in all material respects, equivalent to those of the Brandes International Small Cap Fund. The performance information shown for the Class I shares for periods before February 1, 2012 is that of the private investment fund and reflects the net expenses of the private investment fund. The performance of the private investment fund prior to February 1, 2012 is based on a calculation method that is different from the standardized calculation method prescribed by the SEC. |
25
Brandes International Small Cap Equity Fund
| | The performance information shown for the Class A shares has been adjusted to reflect the differences in the net expense ratios between the Class I and A shares. The private investment fund was not registered under the Investment Company Act of 1940 (“1940 Act”) and was not subject to certain investment limitations, diversification requirements, and other restrictions imposed by the 1940 Act and the Internal Revenue Code of 1986, which, if applicable, may have adversely affected its performance. |
| (2) | The inception date is August 19, 1996. |
| (3) | Performance shown prior to January 31, 2013 for Class C shares reflects the performance of Class I shares adjusted to reflect Class C expenses. The Class C shares’ average annual total return for the 10-year period assumes that Class C shares automatically converted to Class A shares 8 years after the start of the period. The Class C shares’ average annual total return for the since inception period cannot be calculated as the Class A shares did not yet exist 8 years after the Fund’s inception date. |
| (4) | Performance shown prior to June 27, 2016 for Class R6 shares reflects the performance of Class I shares adjusted to reflect Class R6 expenses. |
Performance data quoted represents past performance; past performance does not indicate future results. The investment return and principal value of an investment will fluctuate so that an investor’s shares, when redeemed, may be worth more or less than their original cost. Current performance of the Fund may be lower or higher than the performance quoted. Performance data current to the most recent month end may be obtained by calling 800-331-2979.
The returns shown do not reflect the deduction of taxes that a shareholder would pay on fund distributions or the redemption of fund shares. Brandes Investment Partners, L.P., the Advisor, has a fee waiver arrangement in place to limit the Fund’s annual operating expenses.
Sector Allocation as a Percentage of Total Investments as of
March 31, 2024 (Unaudited)
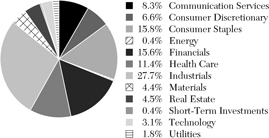
The sector classifications represented in the graph above are in accordance with Global Industry Classification Standard (GICS®), which was developed by and/or is the exclusive property of MSCI, Inc. and Standard & Poor’s Financial Services LLC.
26
Brandes Small Cap Value Fund
Dear Fellow Investor,
The net asset value of the Brandes Small Cap Value Fund (Class I Shares) rose 21.23% in the six months ended March 31, 2024. During the same period, the Russell 2000 Index increased 19.94%.
From an industry perspective, the Fund’s aerospace and defense holdings such as Moog and Embraer continued to benefit from the ongoing recovery in passenger air travel that has led to solid revenue growth, expanding profit margins, healthier cash-flow generation, and healed balance sheets. These positive fundamental developments helped confirm our long-term thesis around franchise quality, balance sheet durability, and end-market recovery potential for these holdings. Moreover, record backlogs highlighted—in our view—the appealing long-term secular growth outlook for global passenger air travel in an industry that has historically allowed incumbents to generate attractive returns on capital. Consequently, we revised our intrinsic value estimates for several of the Fund’s aerospace and defense holdings upward, and believe they continue to offer an attractive risk/reward tradeoff at current valuation levels.
Other standout performers included Machinery businesses Graham Corporation and L.B. Foster Company, as well as Pharmaceuticals such as Elanco Animal Health, Prestige Consumer Healthcare, and Avadel Pharmaceuticals.
While the Fund’s Pharmaceutical industry holdings contributed in aggregate, Eagle Pharmaceuticals and Pediatrix Medical Group declined.
Eagle Pharmaceuticals declined after the company’s founding chief executive abruptly resigned and Nasdaq issued a non-compliance notice related to its late quarterly earnings filing. The company had previously noted a delay in releasing its third-quarter results due to potential adjustments for reporting Pemfexy (a cancer treatment) sales.
Other detractors were energy company Dril-Quip and outdoor sports company American Outdoor Brands
Select Portfolio Activity
The small-cap investment committee initiated positions in gas utility companies Spire and Northwest Natural Holding, as well as aerospace and defense business Spirit AeroSystems.
Spire Inc., formerly The Laclede Group, was formed in 2000 as the holding company for the Laclede Gas Company based in Missouri. Laclede Gas was founded in 1857 and was listed in 1889. Between 2013 and 2016, the company spent $2.6 billion acquiring three regulated natural gas utilities in Alabama, Missouri, and Mississippi. The company has three reportable business segments: gas utility, gas marketing and midstream. The gas utility segment includes the regulated operations of Spire Missouri, Spire Alabama, Spire Gulf and Spire Mississippi, which serve 1.7 million customers.
Past performance is not a guarantee of future results.
27
Brandes Small Cap Value Fund
Other gas-related businesses include unregulated natural gas marketing services and highly contracted midstream activities (pipelines and storage).
Spire earns an above-average (tangible) return on equity and has an earnings per share (EPS) growth profile similar to its peers. The company targets around 6% EPS growth over the medium term underpinned by a robust 10-year capex plan that implies 7%-8% annual rate base growth with good visibility on timely cost recovery. The shares trade at a discount of approximately 10% relative to their peers. This discount may reflect lingering negative perceptions of the regulatory climate in Missouri (68% of rate base) following a cost recovery dispute (since resolved). Other considerations include execution and capital allocation issues outside the regulated utilities and uncertainty about the timing (but not the outcome) for the recovery of its deferred gas purchases. These are based on a volumetric formula and thus tied to customer demand in winter. We believe Spire’s utilities have an average or above-average regulatory profile: Alabama and Mississippi are two of the most investor-friendly states in the country, and recent developments in Missouri have significantly improved its regulatory environment. With respect to capital allocation, 97% of Spire’s 10-year capex plan is allocated to the regulated utilities, providing good visibility of its earnings growth and returns.
Northwest Natural Holding Company (NW Holdings) is headquartered in Portland, OR. Its primary business is the distribution of natural gas to 800,000 customers in the state, including the Portland metropolitan area, as well as in southwest Washington. The company also engages in other business activities, including a gas storage facility, water utilities and in unregulated, renewable natural gas.
NW Holdings targets about 5% EPS growth for the 2022-27 period and is dependent on continuous rate case filings to sustain a return on equity of around 8%. Like Spire, it trades at a discount relative to its peers. Some of the discount seems justified, given the company’s below-average return on equity and low EPS growth potential, but we believe current levels are not too significant. As for shareholder returns, NW Holdings has grown its dividends for 68 years, making it one of only three companies listed on the NYSE with this legacy.
Looking Forward
At the end of March, the Fund maintains its largest weights in industrials, health care and information technology (although an underweight relative to the benchmark). The Fund’s most notable underweights are in consumer discretionary, financials, and real estate.
Compared with the Russell 2000 Value Index, we have significantly less exposure to financials and real estate. In our opinion, the differences between the Brandes Small Cap Value Fund and the broader U.S. small-cap market continue to make it an attractive complement to other small-cap offerings. The Fund exhibits lower valuations than the Russell 2000 Index, while offering exposure to companies with what we
28
Brandes Small Cap Value Fund
consider are strong balance sheets, compelling growth prospects, and a history of durable free cash flow generation. We are optimistic about the potential of value stocks in general and believe the Brandes Small Cap Value Fund remains well positioned from a long-term risk/reward perspective.
After a half-century of professional investing, Brandes Investment Partners remains fixed on its original goal. We pursue above-market returns to help you fulfill your long-term investment objectives. Our approach remains deeply rooted in the value philosophy and seeks to identify worthy but potentially underpriced companies. Thank you for your confidence in our approach.
Sincerely yours,
The Brandes Small-Cap Investment Committee
Brandes Investment Trust
For term definitions, please refer to https://www.brandes.com/termdefinitions.
Past Performance is not a guarantee of future results.
Diversification does not assure a profit or protect against a loss.
Because the values of the Fund’s investments will fluctuate with market conditions, so will the value of your investment in the Fund. You could lose money on your investment in the Fund, or the Fund could underperform other investments. The values of the Fund’s investments fluctuate in response to the activities of individual companies and general stock market and economic conditions. Investments in small and medium capitalization companies tend to have limited liquidity and greater price volatility than investments in larger capitalization companies. Value stocks typically are less volatile than growth stocks; however, issues of value stocks typically have a lower expected growth rate in earnings and sales than issues of growth stocks.
Please refer to the Schedule of Investments in the report for complete holdings information. Fund holdings, geographic allocations and/or sector allocations are subject to change at any time and are not considered a recommendation to buy or sell any security.
The foregoing reflects the thoughts and opinions of Brandes Investment Partners® exclusively and is subject to change without notice.
Brandes Investment Partners® is a registered trademark of Brandes Investment Partners, L.P. in the United States and Canada.
Must be preceded or accompanied by a prospectus.
Index Guide
The Russell 2000 Index with gross dividends measures the performance of the small cap segment of the U.S. equity universe.
29
Brandes Small Cap Value Fund
The Russell 2000 Value Index with gross dividends measures performance of the small cap value segment of the U.S. equity universe. Securities are categorized as growth or value based on their relative book-to-price ratios, historical sales growth, and expected earnings growth.
One cannot invest directly in an index.
The Brandes Small Cap Value Fund is distributed by ALPS Distributors, Inc.
30
Brandes Small Cap Value Fund
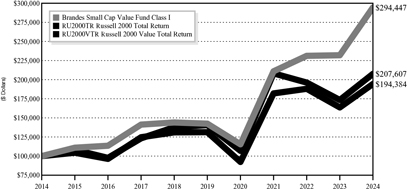
The following chart compares the value of a hypothetical $100,000 investment in the Brandes Small Cap Value Fund – Class I from March 31, 2014 to March 31, 2024 with the value of such an investment in the Russell 2000 Total Return Index and Russell 2000 Value Total Return Index for the same period.
Value of $100,000 Investment vs Russell 2000 Total
Return Index & Russell 2000 Value Total
Return Index (Unaudited)
| | | | | | | | | | | | | | | | | | | | |
| | | Average Annual Total Return | |
| | | Periods Ended March 31, 2024(2) | |
| | | One | | | Three | | | Five | | | Ten | | | Since | |
| | | Year | | | Years | | | Years | | | Years | | | Inception(1) | |
Brandes Small Cap Value Fund | | | | | | | | | | | | | | | | | | | | |
Class A | | | 26.63 | % | | | 11.47 | % | | | 15.31 | % | | | 11.11 | % | | | 8.07% | |
Class A (with maximum sales charge) | | | 19.32 | % | | | 9.28 | % | | | 13.95 | % | | | 10.45 | % | | | 7.83% | |
Class I | | | 26.93 | % | | | 11.75 | % | | | 15.64 | % | | | 11.40 | % | | | 8.35% | |
Class R6(3) | | | 27.14 | % | | | 12.06 | % | | | 14.25 | % | | | 10.80 | % | | | 8.12% | |
Russell 2000 Total Return Index | | | 19.71 | % | | | -0.10 | % | | | 8.10 | % | | | 7.58 | % | | | 7.41% | |
Russell 2000 Value Total Return Index | | | 18.75 | % | | | 2.22 | % | | | 8.17 | % | | | 6.87 | % | | | 7.99% | |
| (1) | The inception date is September 30, 1997. |
| (2) | Prior to January 2, 2018, the Advisor managed a private investment fund with an investment objective, investment policies and strategies that were, in all material respects, equivalent to those of the Brandes Small Cap Value Fund. The performance information shown for the Class I shares for periods before January 2, 2018 is that of the private investment fund and reflects the net expenses of the private investment fund. The performance of the private investment fund prior to January 2, 2018 is based on a calculation method that is different from the standardized calculation method prescribed by the SEC. |
31
Brandes Small Cap Value Fund
| | The performance information shown for the Class A shares has been adjusted to reflect the differences in the net expense ratios between the Class I and A shares. |
| (3) | Performance shown prior to January 2, 2018 for Class R6 shares reflects the performance of Class I shares. The private investment fund was not registered under the Investment Company Act of 1940 (“1940 Act”) and was not subject to certain investment limitations, diversification requirements, and other restrictions imposed by the 1940 Act and the Internal Revenue Code of 1986, which, if applicable, may have adversely affected its performance. |
Performance data quoted represents past performance; past performance does not indicate future results. The investment return and principal value of an investment will fluctuate so that an investor’s shares, when redeemed, may be worth more or less than their original cost. Current performance of the Fund may be lower or higher than the performance quoted. Performance data current to the most recent month end may be obtained by calling 800-331-2979.
The returns shown do not reflect the deduction of taxes that a shareholder would pay on Fund distributions or the redemption of Fund shares. Brandes Investment Partners, L.P., the Advisor, has a fee waiver arrangement in place to limit the Fund’s annual operating expenses.
Sector Allocation as a Percentage of Total Investments as of
March 31, 2024 (Unaudited)
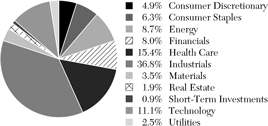
The sector classifications represented in the graph above are in accordance with Global Industry Classification Standard (GICS®), which was developed by and/or is the exclusive property of MSCI, Inc. and Standard & Poor’s Financial Services LLC.
32
Brandes Core Plus Fixed Income Fund
Dear Fellow Investor,
In the six months ended March 31, 2024, the Brandes Core Plus Fixed Income Fund (Class I Shares) increased 6.77%, while its benchmark, the Bloomberg Barclays U.S. Aggregate Bond Index, increased 5.99%.
Bond prices rallied in the fourth quarter of 2023 as the Fed (Federal Reserve) appeared to indicate that not only are further fed funds rate increases off the table, but the next move is likely a cut in rates. Taxable fixed income (as measured by the Bloomberg U.S. Aggregate Bond Index) delivered positive returns not only for the quarter but also the year.
In the credit markets, both investment grade and high yield bonds (as measured by Bloomberg’s U.S. Credit and U.S. Corporate High Yield Bond Indices respectively) posted strong absolute returns as well as positive returns relative to U.S. Treasury securities. Even after a sharp move downward during the quarter, yields on corporate bonds remain near the highest we have seen in close to 15 years, which has led to considerable market optimism about the opportunities in the asset class.
By the standards of the past few years, the start of 2024 was relatively benign – no global pandemic (2020 & 2021), no beginning of a significant rate hike cycle (2022), and no banking chaos (2023). During the first quarter, equity markets moved higher, credit spreads moved tighter, and interest rates moved upwards as the continued resilience in the U.S. economy forced investors to rethink the timing and number of rate cuts for the coming year.
The first three months of 2024 have seen an acceleration in upside surprises in economic data as demonstrated by the US Citigroup Economic Surprise Index, which has ultimately led the market to price in rate cuts starting later in the year and fewer overall – leading to a rise in U.S Treasury rates during the quarter.
We believe that the primary reason that the Fed and investors are eager to see rate cuts as soon as possible is that it seems they assume that the current fed funds rate is indeed restrictive. We would question this. The Bloomberg U.S. Financial Conditions Index shows that financial conditions are easier now than when the Fed began its rate hikes. If so, why do many investors still think the current fed funds rate is restrictive and thus keep planning for imminent rate cuts? In an ideal world, there should be little distinction between what a central bank like the Fed should do and what it will do. The Fed seems intent on easing policy despite stubborn inflation data and a clear easing of financial conditions over the past several months. Let’s hope market pressure for lower rates does not push the Fed into policy errors like those made in the 1970s.
Select Portfolio Activity
Fund activity was modest during the six months ending March 31, 2024.
In mid-October 2023 we added approximately 3% in agency mortgage-backed securities (“MBS”) to the Fund but remain underweight the sector relative to the
Past performance is not a guarantee of future results.
33
Brandes Core Plus Fixed Income Fund
benchmark. We also added to an existing holding in Methanex Corp. (5.25% coupon, maturing 12/15/29, rated Ba1/BB). Methanex is the world’s largest producer of methanol. Methanol is a liquid chemical produced from natural gas that is primarily used as a feedstock in the production of other chemicals. It is generally categorized as “clean” energy - relatively speaking. It is used as an additive in gasoline that raises octane and reduces emissions.
In early 2024, the Fund added a new position in first lien bonds from Univision Communications (8.00% coupon, maturing 8/15/28, rated B1/B+).
Univision Communications is a leading Hispanic media company in the U.S. and Mexico. It operates 36 cable networks and 59 owned or operated television stations. In January 2022, Univision merged with Televisa – its primary content provider – to form a new company TelevisaUnivision. Given the growth of Spanish speaking population in the U.S. along with Univision’s position as the leader in distribution assets and (with the recent merger) content, we view this as among the healthiest categories in broadcasting.
During the quarter we sold our position in MicroStrategy as it reached our estimate of fair value. We also experienced a full call in our holding of Tenet Healthcare.
Outlook
There are two important themes that we have highlighted over the past six months that still guide how we position and manage the Fund in today’s market.
The first theme is our view that while fixed income yields are at attractive levels, valuations are stretched. Yields offered by corporate bonds are near the highest we have seen in nearly 15 years, which has led to considerable optimism about the asset class. As we have explained previously, a closer look indicates that the rise in yield on corporate bonds is largely attributable to the increase in Treasury yields rather than a cheapening of overall credit spreads. The corporate market appears to be priced for perfection with credit spreads at or near their tightest levels in several decades. Accordingly, we believe caution is warranted when allocating to the sector.
The second theme is that after nearly seventeen years of unconventional and near-zero rate monetary policy, there exists a paucity of experience and perspective among investors leading to a distorted view of what a normal interest rate environment is. Many investment professionals who are less than fifteen years into their careers don’t seem to realize that in the fifteen-year period leading up to the Global Financial Crisis, the average rate on the 10-year U.S. Treasury was 5.5%, in contrast with their own apparent perception of normal being near zero rates. The market does not seem to give much weight to the notion that the current fed funds rate is not restrictive. That is a risk to monitor as we move forward.
We share some of the optimism as overall yields in the corporate bond market are the highest they have been since 2009. Our main caution, however, is that we believe it is
34
Brandes Core Plus Fixed Income Fund
important to remain disciplined in what one buys. Higher yields are welcome for long-term savers and investors, but a potential burden for companies as they are staring at refinancing upcoming maturities at much higher costs. The takeaway in our view is that deep, measured, fundamental research is essential as we move forward in an environment where idiosyncratic risks appear to be on the rise. We believe it’s critical to be patient when adding positions: not just know what you own but why you own it.
For a considerable period now, we have attempted to tilt the Fund into what we believe is a defensive posture to mitigate some of the potential detrimental impact of rising interest rates and widening yield spreads. We believe that this remains a risk. Accordingly, the Fund continues to favor shorter-maturity corporate bonds and those that we believe exhibit strong, tangible asset coverage. We are managing duration approximately 10% shorter than the Fund’s benchmark. We have a meaningful allocation to U.S. Treasuries and if market uncertainty and volatility continue to cause credit fundamentals to become mispriced relative to our estimates of intrinsic value, then we will look to redeploy some of those Treasury holdings thoughtfully and effectively to take advantage of opportunities. We remain underweight agency mortgage-backed securities.
As we move forward, we believe prudence dictates that we continue our search for value in a measured and deliberate manner while continuing to tilt the Fund to what we believe is a relatively defensive posture.
We remain optimistic about the prospects for the Brandes Core Plus Fixed Income Fund.
Sincerely yours,
The Brandes Fixed Income Investment Committee
Brandes Investment Trust
For term definitions, please refer to https://www.brandes.com/termdefinitions
First lien bonds are senior to all other bonds of an issuer so that first lien bond holders are paid back before all other debt holders. A lien is the legal right of a creditor to seize property from a borrower that has failed to repay the creditor.
Past Performance is not a guarantee of future results.
Diversification does not assure a profit or protect against a loss in a declining market.
Because the values of the fund’s investments will fluctuate with market conditions, so will the value of your investment in the fund. You could lose money on your investment in the fund, or the fund could underperform other investments. The values of the fund’s investments fluctuate in response to the activities of individual companies and general bond market and economic conditions. Investments in small and medium capitalization companies tend to have limited liquidity and greater price volatility than large capitalization companies.
35
Brandes Core Plus Fixed Income Fund
As with most fixed income funds, the income on and value of your shares in the fund will fluctuate along with interest rates. When interest rates rise, the market prices of the debt securities the fund owns usually decline. When interest rates fall, the prices of these securities usually increase. Generally, the longer the fund’s average portfolio maturity and the lower the average quality of its portfolio, the greater the price fluctuation. The price of any security owned by the fund may also fall in response to events affecting the issuer of the security, such as its ability to continue to make principal and interest payments or its credit rating. Below investment grade debt securities are speculative and involve a greater risk of default and price change due to changes in the issuer’s creditworthiness than higher grade debt. The market prices of these debt securities may fluctuate more than the market prices of investment grade debt securities and may decline significantly in periods of general economic difficulty.
Bond credit ratings are grades given to bonds that indicate their credit quality as determined by a private independent rating service. The firm evaluates a bond issuer’s financial strength, or its ability to pay a bond’s principal and interest in a timely fashion. Credit ratings are measured on a scale that generally ranges from AAA (highest) to D (lowest). All Fund securities except for those labeled “Not Rated” and “Other” have been rated by Moody’s, S&P or Fitch, which are each a Nationally Recognized Statistical Rating Organization. All Index securities except for those labeled “Not Rated” have been rated by Moody’s or S&P. Credit ratings are subject to change.
Index securities except for those labeled “Not Rated” have been rated by Moody’s or S&P. Credit ratings are subject to change.
Please refer to the Schedule of Investments in the report for complete holdings information. Fund holdings, geographic allocations and/or sector allocations are subject to change at any time and are not considered a recommendation to buy or sell any security.
The foregoing reflects the thoughts and opinions of Brandes Investment Partners® exclusively and is subject to change without notice.
Brandes Investment Partners® is a registered trademark of Brandes Investment Partners, L.P. in the United States and Canada.
Must be preceded or accompanied by a prospectus.
Index Guide
The Bloomberg Barclays U.S. Aggregate Bond Index is a broad-based benchmark that measures the investment grade, U.S. dollar-denominated, fixed-rate taxable bond market. This index is a total return index which reflects the price changes and interest of each bond in the index.
The Bloomberg U.S. Corporate High Yield Bond Index is an unmanaged index consisting of U.S. dollar-denominated, non-investment-grade, fixed-rate, taxable
36
Brandes Core Plus Fixed Income Fund
corporate bonds. The index is a total return index which reflects the price changes and interest of each bond in the index.
The Bloomberg U.S. Credit Index measures the U.S. dollar-denominated, fixed-rate taxable corporate and government related bond markets. The index is a total return index which reflects the price changes and interest of each bond in the index.
The Bloomberg U.S. Financial Conditions Index tracks the overall level of financial stress in the U.S. money, bond, and equity markets to help assess the availability and cost of credit.
The US Citigroup Economic Surprise Index represents the difference between official economic results and forecasts.
One cannot invest directly in an index.
The Brandes Core Plus Fixed Income Fund is distributed by ALPS Distributors, Inc.
37
Brandes Core Plus Fixed Income Fund
The following chart compares the value of a hypothetical $100,000 investment in the Brandes Core Plus Fixed Income Fund – Class I from March 31, 2014 to March 31, 2024 with the value of such an investment in the Bloomberg U.S. Aggregate Bond Index for the same period.
Value of $100,000 Investment vs Bloomberg
U.S. Aggregate Bond Index (Unaudited)
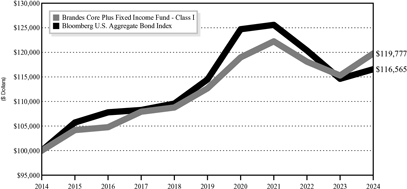
| | | | | | | | | | | | | | | | | | | | |
| | | Average Annual Total Return | |
| | | Periods Ended March 31, 2024 | |
| | | One | | | Three | | | Five | | | Ten | | | Since | |
| | | Year | | | Years | | | Years | | | Years | | | Inception(1) | |
Brandes Core Plus Fixed Income Fund | | | | | | | | | | | | | | | | | | | | |
Class A(2) | | | 3.81 | % | | | -0.87 | % | | | 1.04 | % | | | 1.58 | % | | | 2.65% | |
Class A (2) (with maximum sales charge) | | | -0.05 | % | | | -2.12 | % | | | 0.27 | % | | | 1.19 | % | | | 2.41% | |
Class I | | | 3.90 | % | | | -0.68 | % | | | 1.23 | % | | | 1.82 | % | | | 2.93% | |
Class R6(2) | | | 3.95 | % | | | -0.03 | % | | | 1.98 | % | | | 2.34 | % | | | 3.28% | |
Bloomberg Barclays U.S. Aggregate Bond Index | | | 1.70 | % | | | -2.46 | % | | | 0.36 | % | | | 1.54 | % | | | 2.76% | |
| (1) | The inception date is December 28, 2007. |
| (2) | Performance shown prior to January 31, 2013 for Class A shares reflects the performance of Class I shares adjusted to reflect Class A expenses. Performance shown prior to October 10, 2017 for Class R6 shares reflects the performance of Class I shares adjusted to reflect Class R6 expenses. |
Performance data quoted represents past performance; past performance does not indicate future results. The investment return and principal value of an investment will fluctuate so that an investor’s shares, when redeemed, may be worth more or less than their original cost. Current performance of the Fund may be lower or higher than the
38
Brandes Core Plus Fixed Income Fund
performance quoted. Performance data current to the most recent month end may be obtained by calling 800-331-2979.
The returns shown do not reflect the deduction of taxes that a shareholder would pay on fund distributions or the redemption of Fund shares. Brandes Investment Partners, L.P., the Advisor, has a fee waiver arrangement in place to limit the Fund’s annual operating expenses.
Asset Allocation as a Percentage of Total Investments as of
March 31, 2024 (Unaudited)
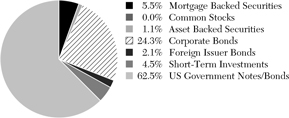
39
Brandes Investment Trust
Expense Example (Unaudited)
As a shareholder of a Fund, you incur ongoing costs, including investment advisory and administrative fees and other fund expenses. The examples below are intended to help you understand your ongoing costs (in dollars) of investing in the Funds and to compare these costs with ongoing costs of investing in other mutual funds.
The examples are based on an investment of $1,000 invested at the beginning of the period and held for the entire period from October 01, 2023 to March 31, 2024 (the “Period”).
Actual Expenses
This section provides information about actual account values and actual expenses. The “Ending Account Value” shown is derived from each Fund’s actual return. You may use the information in this section, together with the amount you invested, to estimate the expenses that you paid over the Period. Simply divide your account value by $1,000 (for example, an $8,600 account value divided by $1,000 = 8.6), then multiply the result by the number given for the Fund under the heading “Expenses Paid During Period” to estimate the expenses you paid on your account during this Period.
| | | | | | | | |
| | | Class A |
| | | | | | | | | Expenses |
| | | Beginning | | Ending | | Annualized | | Paid |
| | | Account | | Account | | Expense | | During |
Fund | | Value | | Value | | Ratio | | the Period |
International Equity Fund | | $1,000.00 | | $1,162.70 | | 1.12% | | $6.06R |
Global Equity Fund | | $1,000.00 | | $1,221.30 | | 1.25% | | $6.94R |
Emerging Markets Value Fund | | $1,000.00 | | $1,112.50 | | 1.34% | | $7.08R |
International Small Cap Fund | | $1,000.00 | | $1,230.70 | | 1.34% | | $7.47R |
Small Cap Value Fund | | $1,000.00 | | $1,210.80 | | 1.15% | | $6.36R |
Core Plus Fixed Income Fund | | $1,000.00 | | $1,068.40 | | 0.50% | | $2.59R |
| |
| | | Class C |
| | | | | | | | | Expenses |
| | | Beginning | | Ending | | Annualized | | Paid |
| | | Account | | Account | | Expense | | During |
Fund | | Value | | Value | | Ratio | | the Period |
International Equity Fund | | $1,000.00 | | $1,158.30 | | 1.88% | | $10.14R |
Global Equity Fund | | $1,000.00 | | $1,216.50 | | 2.00% | | $11.08R |
Emerging Markets Value Fund | | $1,000.00 | | $1,108.80 | | 2.09% | | $11.02R |
International Small Cap Fund | | $1,000.00 | | $1,226.20 | | 2.09% | | $11.63R |
40
Brandes Investment Trust
| | | | | | | | |
| | | Class I |
| | | | | | | | | Expenses |
| | | Beginning | | Ending | | Annualized | | Paid |
| | | Account | | Account | | Expense | | During |
Fund | | Value | | Value | | Ratio | | the Period |
International Equity Fund | | $1,000.00 | | $1,164.60 | | 0.85% | | $4.60R |
Global Equity Fund | | $1,000.00 | | $1,222.80 | | 1.00% | | $5.56R |
Emerging Markets Value Fund | | $1,000.00 | | $1,113.50 | | 1.12% | | $5.92R |
International Small Cap Fund | | $1,000.00 | | $1,232.30 | | 1.15% | | $6.42R |
Small Cap Value Fund | | $1,000.00 | | $1,212.30 | | 0.90% | | $4.98R |
Core Plus Fixed Income Fund | | $1,000.00 | | $1,067.70 | | 0.30% | | $1.55R |
| |
| | | Class R6 |
| | | | | | | | | Expenses |
| | | Beginning | | Ending | | Annualized | | Paid |
| | | Account | | Account | | Expense | | During |
Fund | | Value | | Value | | Ratio | | the Period |
International Equity Fund | | $1,000.00 | | $1,165.50 | | 0.75% | | $4.06R |
Emerging Markets Value Fund | | $1,000.00 | | $1,114.00 | | 0.97% | | $5.13R |
International Small Cap Fund | | $1,000.00 | | $1,232.40 | | 1.00% | | $5.58R |
Small Cap Value Fund | | $1,000.00 | | $1,212.60 | | 0.72% | | $3.98R |
Core Plus Fixed Income Fund | | $1,000.00 | | $1,067.90 | | 0.30% | | $1.55R |
| R | The Fund’s expenses are equal to the Fund’s expense ratio for the period, multiplied by the average account value over the period, multiplied by 183/366 (to reflect the one half-year period). |
Hypothetical Example for Comparison Purposes
This section provides information about hypothetical account values and hypothetical expenses based on the Funds’ actual expense ratios and an assumed rate of return of 5% per year before expenses, which are not the Funds’ actual returns. The hypothetical account values and expenses may not be used to estimate the actual ending account balance or expenses you paid for the period. You may use this information to compare the ongoing costs of investing in the Funds and other mutual funds. To do so, compare this 5% hypothetical example with the 5% hypothetical examples that appear in the shareholder reports of the other mutual funds.
Please note that the expenses shown in the table are meant to highlight your ongoing costs only and do not reflect any transaction costs, such as brokerage commissions on purchase and sales of Fund shares. Therefore, the last column of the table is useful in comparing ongoing costs only, and will not help you determine the relative total costs of owning different funds. In addition, if these transactional costs were included, your costs would have been higher.
41
Brandes Investment Trust
| | | | | | | | |
| | | Class A |
| | | | | | | | | Expenses |
| | | Beginning | | Ending | | Annualized | | Paid |
| | | Account | | Account | | Expense | | During |
Fund | | Value | | Value | | Ratio | | the Period |
International Equity Fund | | $1,000.00 | | $1,019.40 | | 1.12% | | $5.65R |
Global Equity Fund | | $1,000.00 | | $1,018.75 | | 1.25% | | $6.31R |
Emerging Markets Value Fund | | $1,000.00 | | $1,018.30 | | 1.34% | | $6.76R |
International Small Cap Fund | | $1,000.00 | | $1,018.30 | | 1.34% | | $6.76R |
Small Cap Value Fund | | $1,000.00 | | $1,019.25 | | 1.15% | | $5.81R |
Core Plus Fixed Income Fund | | $1,000.00 | | $1,022.50 | | 0.50% | | $2.53R |
| |
| | | Class C |
| | | | | | | | | Expenses |
| | | Beginning | | Ending | | Annualized | | Paid |
| | | Account | | Account | | Expense | | During |
Fund | | Value | | Value | | Ratio | | the Period |
International Equity Fund | | $1,000.00 | | $1,015.60 | | 1.88% | | $ 9.47R |
Global Equity Fund | | $1,000.00 | | $1,015.00 | | 2.00% | | $10.08R |
Emerging Markets Value Fund | | $1,000.00 | | $1,014.55 | | 2.09% | | $10.53R |
International Small Cap Fund | | $1,000.00 | | $1,014.55 | | 2.09% | | $10.53R |
| | | | | | | | |
| | | Class I |
| | | | | | | | | Expenses |
| | | Beginning | | Ending | | Annualized | | Paid |
| | | Account | | Account | | Expense | | During |
Fund | | Value | | Value | | Ratio | | the Period |
International Equity Fund | | $1,000.00 | | $1,020.75 | | 0.85% | | $4.29R |
Global Equity Fund | | $1,000.00 | | $1,020.00 | | 1.00% | | $5.05R |
Emerging Markets Value Fund | | $1,000.00 | | $1,019.40 | | 1.12% | | $5.65R |
International Small Cap Fund | | $1,000.00 | | $1,019.25 | | 1.15% | | $5.81R |
Small Cap Value Fund | | $1,000.00 | | $1,020.50 | | 0.90% | | $4.55R |
Core Plus Fixed Income Fund | | $1,000.00 | | $1,023.50 | | 0.30% | | $1.52R |
| |
| | | Class R6 |
| | | | | | | | | Expenses |
| | | Beginning | | Ending | | Annualized | | Paid |
| | | Account | | Account | | Expense | | During |
Fund | | Value | | Value | | Ratio | | the Period |
International Equity Fund | | $1,000.00 | | $1,021.25 | | 0.75% | | $3.79R |
Emerging Markets Value Fund | | $1,000.00 | | $1,020.15 | | 0.97% | | $4.90R |
International Small Cap Fund | | $1,000.00 | | $1,020.00 | | 1.00% | | $5.05R |
Small Cap Value Fund | | $1,000.00 | | $1,021.40 | | 0.72% | | $3.64R |
Core Plus Fixed Income Fund | | $1,000.00 | | $1,023.50 | | 0.30% | | $1.52R |
| R | The Fund’s expenses are equal to the Fund’s expense ratio for the period, multiplied by the average account value over the period, multiplied by 183/366 (to reflect the one half-year period). |
42
Brandes International Equity Fund
SCHEDULE OF INVESTMENTS — March 31, 2024 (Unaudited)
| | | | | | |
| Shares | | | | Value | |
| |
COMMON STOCKS – 93.94% | | | | |
Austria – 1.83% | |
| 332,751 | | Erste Group Bank AG | | $ | 14,829,954 | |
| | | | | | |
|
Belgium – 1.07% | |
| 142,276 | | Anheuser-Busch InBev SA/NV | | | 8,660,911 | |
| | | | | | |
|
Brazil – 4.98% | |
| 4,751,300 | | Ambev SA(a) | | | 11,832,304 | |
| 854,398 | | Embraer SA Sponsored – ADR(a) | | | 22,761,163 | |
| 566,700 | | Telefonica Brasil SA | | | 5,717,394 | |
| | | | | | |
| | |
| | | | | 40,310,861 | |
| | | | | | |
|
China – 3.35% | |
| 2,240,000 | | Alibaba Group Holding Ltd. | | | 20,255,949 | |
| 259,998 | | Contemporary Amperex Technology Co. Ltd. – Class A | | | 6,807,928 | |
| | | | | | |
| | |
| | | | | 27,063,877 | |
| | | | | | |
|
France – 16.23% | |
| 219,246 | | BNP Paribas SA | | | 15,609,197 | |
| 930,557 | | Carrefour SA(b) | | | 15,963,082 | |
| 112,447 | | Danone SA | | | 7,269,119 | |
| 607,589 | | Engie SA | | | 10,181,584 | |
| 31,055 | | Kering SA | | | 12,300,372 | |
| 1,176,299 | | Orange SA | | | 13,833,296 | |
| 112,557 | | Publicis Groupe SA | | | 12,271,023 | |
| 105,304 | | Renault SA | | | 5,313,653 | |
| 210,155 | | Sanofi SA | | | 20,444,825 | |
| 104,961 | | Societe BIC SA | | | 7,500,117 | |
| 154,074 | | TotalEnergies SE | | | 10,598,657 | |
| | | | | | |
| | | | | 131,284,925 | |
| | | | | | |
|
Germany – 8.28% | |
| 445,924 | | Fresenius & Co. KGaA | | | 12,025,151 | |
| 182,599 | | Heidelberg Materials AG | | | 20,100,748 | |
| 228,417 | | Henkel AG & Co. KGaA | | | 16,458,236 | |
| 94,208 | | SAP SE | | | 18,344,088 | |
| | | | | | |
| | |
| | | | | 66,928,223 | |
| | | | | | |
|
Hong Kong – 0.74% | |
| 11,842,000 | | First Pacific Co. Ltd. | | | 5,966,215 | |
| | | | | | |
|
Ireland – 1.20% | |
| 35,339 | | Willis Towers Watson Plc | | | 9,718,225 | |
| | | | | | |
|
Italy – 5.43% | |
| 317,275 | | Buzzi SpA | | | 12,460,326 | |
| | | | | | |
| Shares | | | | Value | |
| | |
| 633,272 | | Eni SpA | | $ | 10,027,251 | |
| 4,928,692 | | Intesa Sanpaolo SpA | | | 17,893,801 | |
| 14,351,304 | | Telecom Italia SpA(a) | | | 3,530,102 | |
| | | | | | |
| | |
| | | | | 43,911,480 | |
| | | | | | |
|
Japan – 10.30% | |
| 1,270,700 | | Astellas Pharma, Inc. | | | 13,795,716 | |
| 778,300 | | Honda Motor Co. Ltd. | | | 9,722,323 | |
| 182,900 | | Makita Corp. | | | 5,159,090 | |
| 1,073,000 | | Mitsubishi UFJ Financial Group, Inc. | | | 11,036,207 | |
| 1,454,200 | | Nissan Motor Co. Ltd.(b) | | | 5,843,505 | |
| 622,500 | | Sumitomo Mitsui Trust Holdings, Inc. | | | 13,603,052 | |
| 873,083 | | Takeda Pharmaceutical Co. Ltd. | | | 24,131,188 | |
| | | | | | |
| | |
| | | | | 83,291,081 | |
| | | | | | |
|
Mexico – 4.05% | |
| 13,099,897 | | America Movil SAB de CV - Class B | | | 12,230,713 | |
| 1,145,464 | | Cemex SAB de CV Sponsored – ADR(a) | | | 10,320,630 | |
| 6,132,436 | | Fibra Uno Administracion SA de CV | | | 10,200,267 | |
| | | | | | |
| | |
| | | | | 32,751,610 | |
| | | | | | |
|
Netherlands – 4.22% | |
| 248,853 | | Heineken Holding NV | | | 20,083,425 | |
| 700,262 | | Koninklijke Philips NV(a) | | | 14,015,013 | |
| | | | | | |
| | |
| | | | | 34,098,438 | |
| | | | | | |
|
Russia – 0.00% | |
| 1,013,133 | | Mobile TeleSystems PJSC(c) | | | — | |
| | | | | | |
|
South Korea – 4.71% | |
| 170,450 | | Hana Financial Group, Inc. | | | 7,305,452 | |
| 46,655 | | Hyundai Mobis Co. Ltd. | | | 8,837,159 | |
| 140,392 | | KT&G Corp. | | | 9,750,531 | |
| 199,334 | | Samsung Electronics Co. Ltd. | | | 12,200,647 | |
| | | | | | |
| | |
| | | | | 38,093,789 | |
| | | | | | |
The accompanying notes to financial statements are an integral part of this Schedule of Investments.
43
Brandes International Equity Fund
SCHEDULE OF INVESTMENTS — March 31, 2024 (Unaudited) (continued)
| | | | | | |
| Shares | | | | Value | |
|
Switzerland – 6.64% | |
| 84,938 | | Cie Financiere Richemont SA – Class A Registered | | $ | 12,930,996 | |
| 96,188 | | Novartis AG Registered | | | 9,316,620 | |
| 7,948 | | Swatch Group AG Bearer | | | 1,854,127 | |
| 235,668 | | Swatch Group AG Registered | | | 10,686,110 | |
| 614,461 | | UBS Group AG Registered | | | 18,919,827 | |
| | | | | | |
| | |
| | | | | 53,707,680 | |
| | | | | | |
| |
Taiwan – 2.01% | | | | |
| 668,000 | | Taiwan Semiconductor Manufacturing Co. Ltd. | | | 16,259,847 | |
| | | | | | |
| |
United Kingdom – 18.90% | | | | |
| 3,984,558 | | Barclays Plc | | | 9,234,805 | |
| 812,790 | | GSK Plc | | | 17,450,926 | |
| 363,785 | | Imperial Brands Plc | | | 8,132,272 | |
| 3,693,647 | | J Sainsbury Plc | | | 12,611,735 | |
| 3,336,043 | | Kingfisher Plc | | | 10,499,454 | |
| 1,631,459 | | Marks & Spencer Group Plc | | | 5,463,546 | |
| | | | | | |
| Shares | | | | Value | |
| | |
| 5,356,667 | | Rolls-Royce Holdings Plc(a) | | $ | 28,820,832 | |
| 321,318 | | Shell Plc | | | 10,661,172 | |
| 921,026 | | Smith & Nephew Plc | | | 11,530,315 | |
| 3,728,875 | | Tesco Plc | | | 13,966,403 | |
| 186,427 | | Unilever Plc | | | 9,361,855 | |
| 1,597,028 | | WPP Plc | | | 15,135,258 | |
| | | | | | |
| | |
| | | | | 152,868,573 | |
| | | | | | |
| |
TOTAL COMMON STOCKS
(Cost $661,294,291) | | $ | 759,745,689 | |
| | | | | | |
PREFERRED STOCKS – 3.02% | | | | |
| |
Brazil – 1.87% | | | | |
| 2,032,000 | | Petroleo Brasileiro SA, 5.883%(d) | | $ | 15,136,484 | |
| | | | | | |
| |
Russia – 0.00% | | | | |
| 21,512,699 | | Surgutneftegas PJSC, 1.194%(c),(d) | | | — | |
| | | | | | |
| |
Spain – 1.15% | | | | |
| 1,403,153 | | Grifols SA – Class B(a) | | | 9,254,503 | |
| | | | | | |
| |
TOTAL PREFERRED STOCKS
(Cost $37,613,287) | | $ | 24,390,987 | |
| | | | | | |
| | | | | | | | |
| | | Shares | | | Value | |
| | |
SHORT-TERM INVESTMENTS – 2.88% | | | | | | | | |
| | |
Money Market Funds — 2.88% | | | | | | | | |
| Northern Institutional Funds - Treasury Portfolio (Premier), 5.15%(e) | | | 23,304,164 | | | $ | 23,304,164 | |
| | | | | | | | |
| | |
TOTAL SHORT-TERM INVESTMENTS
(Cost $23,304,164) | | | | | | $ | 23,304,164 | |
| | | | | | | | |
| | |
Total Investments
(Cost $722,211,742) – 99.84% | | | | | | $ | 807,440,840 | |
Other Assets in Excess of Liabilities – 0.16% | | | | | | | 1,282,344 | |
| | | | | | | | |
| | |
TOTAL NET ASSETS – 100.00% | | | | | | $ | 808,723,184 | |
| | | | | | | | |
Percentages are stated as a percent of net assets.
ADR American Depositary Receipt
| (a) | Non-income producing security. |
| (b) | All or a portion of this security is on loan. See Note 2 in the Notes to Financial Statements. |
| (d) | Current yield is disclosed. Dividends are calculated based on a percentage of the issuer’s net income. |
| (e) | The rate shown is the annualized seven day yield as of March 31, 2024. |
The accompanying notes to financial statements are an integral part of this Schedule of Investments.
44
Brandes International Equity Fund
SCHEDULE OF INVESTMENTS BY INDUSTRY — March 31, 2024
| | | | |
COMMON STOCKS | | | | |
Aerospace & Defense | | | 6.37 | % |
Automobile Components | | | 1.09 | % |
Automobiles | | | 2.57 | % |
Banks | | | 11.06 | % |
Beverages | | | 5.02 | % |
Broadline Retail | | | 2.51 | % |
Capital Markets | | | 2.34 | % |
Commercial Services & Supplies | | | 0.93 | % |
Construction Materials | | | 5.31 | % |
Consumer Staples Distribution & Retail | | | 5.93 | % |
Diversified REITs | | | 1.26 | % |
Diversified Telecommunication Services | | | 2.86 | % |
Electrical Equipment | | | 0.84 | % |
Food Products | | | 1.64 | % |
Health Care Equipment & Supplies. | | | 3.16 | % |
Health Care Providers & Services | | | 1.49 | % |
Household Products | | | 2.03 | % |
Insurance | | | 1.20 | % |
Machinery | | | 0.64 | % |
Media | | | 3.39 | % |
Multi-Utilities | | | 1.26 | % |
Oil, Gas & Consumable Fuels | | | 3.87 | % |
Personal Care Products | | | 1.16 | % |
Pharmaceuticals | | | 10.53 | % |
Semiconductors & Semiconductor Equipment | | | 2.01 | % |
Software | | | 2.27 | % |
Specialty Retail | | | 1.30 | % |
Technology Hardware, Storage & Peripherals | | | 1.51 | % |
Textiles, Apparel & Luxury Goods | | | 4.67 | % |
Tobacco | | | 2.21 | % |
| |
Wireless Telecommunication Services. | | | 1.51 | % |
| | | | |
| |
TOTAL COMMON STOCKS | | | 93.94 | % |
| | | | |
| |
PREFERRED STOCKS | | | | |
Biotechnology | | | 1.15 | % |
| |
Oil, Gas & Consumable Fuels | | | 1.87 | % |
| | | | |
| |
TOTAL PREFERRED STOCKS | | | 3.02 | % |
| | | | |
| |
SHORT-TERM INVESTMENTS | | | 2.88 | % |
| | | | |
| |
TOTAL INVESTMENTS | | | 99.84 | % |
| |
Other Assets in Excess of Liabilities | | | 0.16 | % |
| | | | |
| |
TOTAL NET ASSETS | | | 100.00 | % |
| | | | |
The accompanying notes to financial statements are an integral part of this Schedule of Investments.
45
Brandes International Equity Fund
SCHEDULE OF INVESTMENTS BY INDUSTRY — March 31, 2024 (continued)
The industry classifications represented in the Schedule of Investments are in accordance with Global Industry Classification Standards (GICS®), which was developed by and/or is the exclusive property of MSCI, Inc. and Standard & Poor’s Financial Services LLC or were otherwise determined by the Advisor to be appropriate. This information is unaudited.
The accompanying notes to financial statements are an integral part of this Schedule of Investments.
46
Brandes Global Equity Fund
SCHEDULE OF INVESTMENTS — March 31, 2024 (Unaudited)
| | | | | | |
| Shares | | | | Value | |
|
COMMON STOCKS – 97.35% | |
|
Austria – 2.40% | |
| | |
| 26,936 | | Erste Group Bank AG | | $ | 1,200,476 | |
| | | | | | |
|
Brazil – 4.21% | |
| 305,700 | | Ambev SA(a) | | | 761,294 | |
| 144,220 | | Embraer SA(a) | | | 957,843 | |
| | |
| 14,490 | | Embraer SA Sponsored – ADR(a) | | | 386,014 | |
| | | | | | |
| | |
| | | | | 2,105,151 | |
| | | | | | |
|
Canada – 1.04% | |
| 25,237 | | CAE, Inc.(a) | | | 520,892 | |
| | | | | | |
|
China – 3.10% | |
| 77,600 | | Alibaba Group Holding Ltd. | | | 701,724 | |
| 91,398 | | Gree Electric Appliances, Inc. of Zhuhai – Class A | | | 494,727 | |
| | |
| 529,000 | | Topsports International Holdings Ltd. | | | 354,796 | |
| | | | | | |
| | |
| | | | | 1,551,247 | |
| | | | | | |
|
France – 8.88% | |
| 27,911 | | Carrefour SA(b) | | | 478,794 | |
| 1,739 | | Kering SA | | | 688,789 | |
| 9,256 | | Publicis Groupe SA | | | 1,009,094 | |
| 12,153 | | Sanofi SA | | | 1,182,299 | |
| 15,711 | | TotalEnergies SE | | | 1,080,750 | |
| | | | | | |
| | |
| | | | | 4,439,726 | |
| | | | | | |
|
Germany – 4.02% | |
| 10,785 | | Heidelberg Materials AG | | | 1,187,227 | |
| 4,221 | | SAP SE | | | 821,909 | |
| | | | | | |
| | |
| | | | | 2,009,136 | |
| | | | | | |
|
Ireland – 1.48% | |
| 8,586 | | CRH Plc | | | 741,058 | |
| | | | | | |
|
Malaysia – 1.01% | |
| 509,900 | | Genting Berhad | | | 506,345 | |
| | | | | | |
|
Mexico – 1.05% | |
| 314,401 | | Fibra Uno Administracion SA de CV | | | 522,953 | |
| | | | | | |
|
Netherlands – 1.24% | |
| 6,450 | | Heineken NV | | | 621,830 | |
| | | | | | |
|
Singapore – 1.26% | |
| 23,600 | | DBS Group Holdings Ltd. | | | 629,832 | |
| | | | | | |
|
South Korea – 3.89% | |
| 1,761 | | Hyundai Mobis Co. Ltd. | | | 333,560 | |
| | | | | | |
| Shares | | | | Value | |
| | |
| 2,384 | | Hyundai Motor Co. | | $ | 412,607 | |
| 3,729 | | KT&G Corp. | | | 258,987 | |
| 15,353 | | Samsung Electronics Co. Ltd. | | | 939,712 | |
| | | | | | |
| | |
| | | | | 1,944,866 | |
| | | | | | |
|
Switzerland – 3.73% | |
| 3,435 | | Cie Financiere Richemont SA – Class A Registered | | | 522,946 | |
| 43,642 | | UBS Group AG Registered | | | 1,343,778 | |
| | | | | | |
| | |
| | | | | 1,866,724 | |
| | | | | | |
|
Taiwan – 1.61% | |
| 33,000 | | Taiwan Semiconductor Manufacturing Co. Ltd. | | | 803,256 | |
| | | | | | |
|
Thailand – 0.73% | |
| 106,600 | | Kasikornbank PCL – Class F | | | 362,272 | |
| | | | | | |
|
United Kingdom – 15.14% | |
| 120,862 | | BP Plc | | | 758,219 | |
| 58,280 | | GSK Plc | | | 1,251,295 | |
| 42,039 | | Imperial Brands Plc | | | 939,765 | |
| 128,757 | | Kingfisher Plc | | | 405,234 | |
| 130,788 | | NatWest Group Plc | | | 438,054 | |
| 289,636 | | Rolls-Royce Holdings Plc(a) | | | 1,558,348 | |
| 16,798 | | Shell Plc – ADR | | | 1,126,138 | |
| 43,307 | | Smith & Nephew Plc | | | 542,160 | |
| 58,067 | | WPP Plc | | | 550,309 | |
| | | | | | |
| | |
| | | | | 7,569,522 | |
| | | | | | |
|
United States – 42.56% | |
| 3,806 | | Alphabet, Inc. - Class A(a) | | | 574,440 | |
| 8,983 | | Amdocs Ltd. | | | 811,794 | |
| 9,741 | | American International Group, Inc. | | | 761,454 | |
| 28,333 | | Bank of America Corp. | | | 1,074,387 | |
| 10,069 | | Bank of New York Mellon Corp. | | | 580,176 | |
| 6,384 | | Cardinal Health, Inc. | | | 714,370 | |
| 2,421 | | Cigna Corp. | | | 879,282 | |
| 15,981 | | Citigroup, Inc. | | | 1,010,638 | |
| 6,255 | | Cognizant Technology Solutions Corp. – Class A | | | 458,429 | |
| 22,358 | | Comcast Corp. – Class A | | | 969,219 | |
| 14,527 | | Corteva, Inc. | | | 837,772 | |
| 8,640 | | CVS Health Corp. | | | 689,126 | |
The accompanying notes to financial statements are an integral part of this Schedule of Investments.
47
Brandes Global Equity Fund
SCHEDULE OF INVESTMENTS — March 31, 2024 (Unaudited) (continued)
| | | | | | |
| Shares | | | | Value | |
| | |
| 4,083 | | Emerson Electric Co. | | $ | 463,094 | |
| 2,837 | | FedEx Corp. | | | 821,992 | |
| 6,035 | | Fiserv, Inc.(a) | | | 964,514 | |
| 9,631 | | Fortrea Holdings, Inc.(a) | | | 386,588 | |
| 14,465 | | Halliburton Co. | | | 570,210 | |
| 1,667 | | HCA Healthcare, Inc. | | | 555,995 | |
| 1,926 | | Laboratory Corp. of America Holdings | | | 420,754 | |
| 1,576 | | McKesson Corp. | | | 846,076 | |
| 6,310 | | Merck & Co., Inc. | | | 832,605 | |
| 7,465 | | Micron Technology, Inc. | | | 880,049 | |
| 4,789 | | Mohawk Industries, Inc.(a) | | | 626,832 | |
| 11,505 | | OneMain Holdings, Inc. | | | 587,791 | |
| 29,367 | | Pfizer, Inc. | | | 814,934 | |
| 4,441 | | PNC Financial Services Group, Inc. | | | 717,666 | |
| 4,426 | | State Street Corp. | | | 342,218 | |
| | | | | | |
| Shares | | | | Value | |
| | |
| 6,541 | | Textron, Inc. | | $ | 627,478 | |
| 25,214 | | Wells Fargo & Co. | | | 1,461,403 | |
| | | | | | |
| | |
| | | | | 21,281,286 | |
| | | | | | |
TOTAL COMMON STOCKS
(Cost $34,125,364) | | $ | 48,676,572 | |
| | | | | | |
PREFERRED STOCKS – 0.65% | | | | |
South Korea – 0.06% | | | | |
| 597 | | Samsung Electronics Co. Ltd., 2.125%(c) | | $ | 30,155 | |
| | | | | | |
Spain – 0.59% | | | | |
| | |
| 44,265 | | Grifols SA – Class B – ADR(a) | | | 295,690 | |
| | | | | | |
TOTAL PREFERRED STOCKS
(Cost $657,161) | | $ | 325,845 | |
| | | | | | |
| | | | | | | | |
| | | Shares | | | Value | |
| | |
SHORT-TERM INVESTMENTS – 1.04% | | | | | | | | |
Money Market Funds — 1.04% | | | | | | | | |
Northern Institutional Funds - Treasury Portfolio (Premier), 5.15%(d) | | | 518,180 | | | $ | 518,180 | |
| | | | | | | | |
TOTAL SHORT-TERM INVESTMENTS
(Cost $518,180) | | | | | | $ | 518,180 | |
| | | | | | | | |
Total Investments
(Cost $35,300,705) – 99.04% | | | | | | $ | 49,520,597 | |
Other Assets in Excess of Liabilities – 0.96% | | | | | | | 478,603 | |
| | | | | | | | |
| | |
TOTAL NET ASSETS – 100.00% | | | | | | $ | 49,999,200 | |
| | | | | | | | |
Percentages are stated as a percent of net assets.
ADR American Depositary Receipt
| (a) | Non-income producing security. |
| (b) | All or a portion of this security is on loan. See Note 2 in the Notes to Financial Statements. |
| (c) | Current yield is disclosed. Dividends are calculated based on a percentage of the issuer’s net income. |
| (d) | The rate shown is the annualized seven day yield as of March 31, 2024. |
The accompanying notes to financial statements are an integral part of this Schedule of Investments.
48
Brandes Global Equity Fund
SCHEDULE OF INVESTMENTS BY INDUSTRY — March 31, 2024
| | | | |
COMMON STOCKS | | | | |
| |
Aerospace & Defense | | | 8.10 | % |
Air Freight & Logistics | | | 1.64 | % |
Automobile Components | | | 0.67 | % |
Automobiles | | | 0.82 | % |
Banks | | | 13.80 | % |
Beverages | | | 2.76 | % |
Broadline Retail | | | 1.40 | % |
Capital Markets | | | 4.53 | % |
Chemicals | | | 1.68 | % |
Construction Materials | | | 3.86 | % |
Consumer Finance | | | 1.18 | % |
Consumer Staples Distribution & Retail | | | 0.96 | % |
Diversified REITs | | | 1.05 | % |
Electrical Equipment | | | 0.93 | % |
Energy Equipment & Services | | | 1.14 | % |
Financial Services | | | 1.93 | % |
Health Care Equipment & Supplies. | | | 1.08 | % |
Health Care Providers & Services | | | 8.21 | % |
Hotels, Restaurants & Leisure | | | 1.01 | % |
Household Durables | | | 2.24 | % |
Insurance | | | 1.52 | % |
Interactive Media & Services | | | 1.15 | % |
IT Services | | | 2.54 | % |
Life Sciences Tools & Services | | | 0.77 | % |
Media | | | 5.06 | % |
Oil, Gas & Consumable Fuels | | | 5.93 | % |
Pharmaceuticals | | | 8.16 | % |
Semiconductors & Semiconductor Equipment | | | 3.37 | % |
Software | | | 1.64 | % |
Specialty Retail | | | 1.52 | % |
Technology Hardware, Storage & Peripherals | | | 1.88 | % |
Textiles, Apparel & Luxury Goods | | | 2.42 | % |
Tobacco | | | 2.40 | % |
| | | | |
| |
TOTAL COMMON STOCKS | | | 97.35 | % |
| | | | |
| |
PREFERRED STOCKS | | | | |
Biotechnology | | | 0.59 | % |
| |
Technology Hardware, Storage & Peripherals | | | 0.06 | % |
| | | | |
| |
TOTAL PREFERRED STOCKS | | | 0.65 | % |
| | | | |
| |
SHORT-TERM INVESTMENTS | | | 1.04 | % |
| | | | |
| |
TOTAL INVESTMENTS | | | 99.04 | % |
Other Assets in Excess of Liabilities | | | 0.96 | % |
| | | | |
| |
TOTAL NET ASSETS | | | 100.00 | % |
| | | | |
The accompanying notes to financial statements are an integral part of this Schedule of Investments.
49
Brandes Global Equity Fund
SCHEDULE OF INVESTMENTS BY INDUSTRY — March 31, 2024 (continued)
The industry classifications represented in the Schedule of Investments are in accordance with Global Industry Classification Standards (GICS®), which was developed by and/or is the exclusive property of MSCI, Inc. and Standard & Poor’s Financial Services LLC or were otherwise determined by the Advisor to be appropriate. This information is unaudited.
The accompanying notes to financial statements are an integral part of this Schedule of Investments.
50
Brandes Emerging Markets Value Fund
SCHEDULE OF INVESTMENTS — March 31, 2024 (Unaudited)
| | | | | | | | |
| Shares | | | | | Value | |
| COMMON STOCKS – 95.86% | | | | |
| |
| | Austria – 2.78% | | | | |
| | 435,761 | | | Erste Group Bank AG | | $ | 19,420,875 | |
| | | | | | | | |
| |
| | Brazil – 12.55% | | | | |
| | 1,178,134 | | | Embraer SA Sponsored – ADR(a) | | | 31,385,490 | |
| | 961,966 | | | Engie Brasil Energia SA | | | 7,721,966 | |
| | 2,492,133 | | | Neoenergia SA | | | 10,111,837 | |
| | 4,540,700 | | | Sendas Distribuidora SA | | | 13,317,721 | |
| | 714,800 | | | Suzano SA(a) | | | 9,118,496 | |
| | 304,200 | | | Telefonica Brasil SA | | | 3,069,051 | |
| | 3,647,300 | | | TIM SA | | | 12,944,519 | |
| | | | | | | | |
| | |
| | | | | | | 87,669,080 | |
| | | | | | | | |
| |
| | Chile – 0.96% | | | | |
| | 2,007,084 | | | Empresa Nacional de Telecomunicaciones SA | | | 6,680,038 | |
| | | | | | | | |
| |
| | China – 23.59% | | | | |
| | 2,638,200 | | | Alibaba Group Holding Ltd. | | | 23,856,805 | |
| | 11,225,395 | | | China Education Group Holdings Ltd. | | | 6,015,718 | |
| | 14,096,000 | | | Chinasoft International Ltd.(a) | | | 8,511,731 | |
| | 634,990 | | | Contemporary Amperex Technology Co. Ltd. – Class A | | | 16,626,922 | |
| | 2,688,000 | | | Galaxy Entertainment Group Ltd. | | | 13,512,765 | |
| | 2,060,676 | | | Gree Electric Appliances, Inc. of Zhuhai – Class A | | | 11,154,204 | |
| | 4,340,234 | | | LONGi Green Energy Technology Co. Ltd. – Class A | | | 11,654,450 | |
| | 1,644,146 | | | Midea Group Co. Ltd. – Class A | | | 14,539,066 | |
| | 2,480,900 | | | Ping An Insurance Group Co. of China Ltd. – Class H | | | 10,533,110 | |
| | 4,967,400 | | | Shanghai Pharmaceuticals Holding Co. Ltd. – Class H | | | 7,177,619 | |
| | | | | | | | |
| Shares | | | | | Value | |
| 15,624,000 | | | Topsports International Holdings Ltd. | | $ | 10,478,885 | |
| | 9,030,000 | | | TravelSky Technology Ltd. – Class H | | | 10,953,226 | |
| | 7,093,800 | | | Wynn Macau Ltd.(a) | | | 6,340,103 | |
| | 643,290 | | | ZTO Express Cayman, Inc. Sponsored – ADR | | | 13,470,493 | |
| | | | | | | | |
| | |
| | | | | | | 164,825,097 | |
| | | | | | | | |
| |
| | Hong Kong – 1.96% | | | | |
| | 1,266,400 | | | AIA Group Ltd. | | | 8,518,533 | |
| | 1,882,200 | | | Luk Fook Holdings International Ltd. | | | 5,159,710 | |
| | | | | | | | |
| | |
| | | | | | | 13,678,243 | |
| | | | | | | | |
| |
| | India – 6.84% | | | | |
| | 1,070,964 | | | HDFC Bank Ltd. | | | 18,675,066 | |
| | 3,702,622 | | | Indus Towers Ltd.(a) | | | 12,950,966 | |
| | 607,271 | | | IndusInd Bank Ltd. | | | 11,353,254 | |
| | 1,185,615 | | | NTPC Ltd. | | | 4,791,402 | |
| | | | | | | | |
| | |
| | | | | | | 47,770,688 | |
| | | | | | | | |
| |
| | Indonesia – 3.39% | | | | |
| | 32,973,711 | | | Bank Rakyat Indonesia Persero Tbk PT | | | 12,608,322 | |
| | 2,510,812 | | | Gudang Garam Tbk PT | | | 3,151,382 | |
| | 19,624,300 | | | Indofood Sukses Makmur Tbk PT | | | 7,890,565 | |
| | | | | | | | |
| | |
| | | | | | | 23,650,269 | |
| | | | | | | | |
| |
| | Luxembourg – 1.44% | | | | |
| | 493,362 | | | Millicom International Cellular SA - SDR(a) | | | 10,060,199 | |
| | | | | | | | |
| |
| | Mexico – 6.93% | | | | |
| | 7,554,340 | | | America Movil SAB de CV - Class B | | | 7,053,106 | |
| | 817,842 | | | Cemex SAB de CV Sponsored – ADR(a) | | | 7,368,756 | |
| | 8,842,522 | | | Fibra Uno Administracion SA de CV | | | 14,708,036 | |
| | 3,498,307 | | | Kimberly-Clark de Mexico SAB de CV - Class A | | | 8,143,322 | |
The accompanying notes to financial statements are an integral part of this Schedule of Investments.
51
Brandes Emerging Markets Value Fund
SCHEDULE OF INVESTMENTS — March 31, 2024 (Unaudited) (continued)
| | | | | | | | |
| Shares | | | | | Value | |
| | |
| | 4,008,404 | | | PLA Administradora Industrial S de RL de CV | | $ | 10,945,385 | |
| | 512,122 | | | Urbi Desarrollos Urbanos SAB de CV(a) | | | 212,556 | |
| | | | | | | | |
| | |
| | | | | | | 48,431,161 | |
| | | | | | | | |
| |
| | Panama – 3.76% | | | | |
| | 443,894 | | | Banco Latinoamericano de Comercio Exterior SA – Class E | | | 13,148,140 | |
| | 126,136 | | | Copa Holdings SA – Class A | | | 13,138,326 | |
| | | | | | | | |
| | |
| | | | | | | 26,286,466 | |
| | | | | | | | |
| |
| | Philippines – 1.96% | | | | |
| | 6,519,109 | | | Bank of the Philippine Islands | | | 13,695,753 | |
| | | | | | | | |
| |
| | Russia – 0.00% | | | | |
| | 236,429 | | | LUKOIL PJSC(b) | | | — | |
| | 4,858,073 | | | Mobile TeleSystems PJSC(b) | | | — | |
| | 7,919,891 | | | Sberbank of Russia PJSC(b) | | | — | |
| | 31,423,480 | | | Sistema AFK PAO(b) | | | — | |
| | | | | | | | |
| | |
| | | | | | | — | |
| | | | | | | | |
| |
| | Singapore – 2.96% | | | | |
| | 270,000 | | | DBS Group Holdings Ltd. | | | 7,205,711 | |
| | 5,299,293 | | | Wilmar International Ltd. | | | 13,460,866 | |
| | | | | | | | |
| | |
| | | | | | | 20,666,577 | |
| | | | | | | | |
| |
| | South Africa – 1.18% | | | | |
| | 1,050,058 | | | Absa Group Ltd. | | | 8,212,518 | |
| | | | | | | | |
| |
| | South Korea – 11.25% | | | | |
| | 7,069 | | | Hana Financial Group, Inc. | | | 302,976 | |
| | | | | | | | |
| Shares | | | | | Value | |
| | |
| | 135,564 | | | KT&G Corp. | | $ | 9,415,215 | |
| | 25,652 | | | LG H&H Co. Ltd. | | | 7,240,676 | |
| | 589,393 | | | Samsung Electronics Co. Ltd. | | | 36,075,011 | |
| | 310,888 | | | Shinhan Financial Group Co. Ltd. | | | 10,622,728 | |
| | 109,977 | | | SK Hynix, Inc. | | | 14,949,520 | |
| | | | | | | | |
| | |
| | | | | | | 78,606,126 | |
| | | | | | | | |
| |
| | Taiwan – 10.56% | | | | |
| | 1,823,620 | | | Chailease Holding Co. Ltd. | | | 9,800,886 | |
| | 2,135,900 | | | Taiwan Semiconductor Manufacturing Co. Ltd. | | | 51,990,129 | |
| | 169,000 | | | Wiwynn Corp. | | | 11,987,126 | |
| | | | | | | | |
| | |
| | | | | | | 73,778,141 | |
| | | | | | | | |
| |
| | Thailand – 2.23% | | | | |
| | 33,092,081 | | | 3BB Internet Infrastructure Fund | | | 5,214,922 | |
| | 3,040,100 | | | Kasikornbank PCL – Class F | | | 10,331,549 | |
| | | | | | | | |
| | |
| | | | | | | 15,546,471 | |
| | | | | | | | |
| |
| | United Kingdom – 1.52% | | | | |
| | 1,361,608 | | | HSBC Holdings Plc | | | 10,643,453 | |
| | | | | | | | |
| |
| TOTAL COMMON STOCKS
(Cost $724,903,128) | | $ | 669,621,155 | |
| | | | | | | | |
| |
| | PREFERRED STOCKS – 2.59% | | | | |
| |
| | Brazil – 2.59% | | | | |
| | 2,434,000 | | | Petroleo Brasileiro SA, 5.883%(c) | | $ | 18,131,004 | |
| | | | | | | | |
| |
| TOTAL PREFERRED STOCKS
(Cost $8,137,859) | | $ | 18,131,004 | |
| | | | | | | | |
The accompanying notes to financial statements are an integral part of this Schedule of Investments.
52
Brandes Emerging Markets Value Fund
SCHEDULE OF INVESTMENTS — March 31, 2024 (Unaudited) (continued)
| | | | | | | | |
| | | Shares | | | Value | |
| | |
SHORT-TERM INVESTMENTS – 1.31% | | | | | | | | |
| | |
Money Market Funds — 1.31% | | | | | | | | |
Northern Institutional Funds - Treasury Portfolio (Premier), 5.15%(d) | | | 9,146,737 | | | $ | 9,146,737 | |
| | | | | | | | |
| | |
TOTAL SHORT-TERM INVESTMENTS
(Cost $9,146,737) | | | | | | $ | 9,146,737 | |
| | | | | | | | |
| | |
Total Investments
(Cost $742,187,724) – 99.76% | | | | | | $ | 696,898,896 | |
Other Assets in Excess of Liabilities – 0.24% | | | | | | | 1,649,555 | |
| | | | | | | | |
| | |
TOTAL NET ASSETS – 100.00% | | | | | | $ | 698,548,451 | |
| | | | | | | | |
Percentages are stated as a percent of net assets.
ADR American Depositary Receipt
| (a) | Non-income producing security. |
| (c) | Current yield is disclosed. Dividends are calculated based on a percentage of the issuer’s net income. |
| (d) | The rate shown is the annualized seven day yield as of March 31, 2024. |
The accompanying notes to financial statements are an integral part of this Schedule of Investments.
53
Brandes Emerging Markets Value Fund
SCHEDULE OF INVESTMENTS BY INDUSTRY — March 31, 2024
| | | | |
COMMON STOCKS | | | | |
Aerospace & Defense | | | 4.49 | % |
Air Freight & Logistics | | | 1.93 | % |
Banks | | | 17.62 | % |
Broadline Retail | | | 3.41 | % |
Construction Materials | | | 1.05 | % |
Consumer Staples Distribution & Retail | | | 1.91 | % |
Diversified Consumer Services | | | 0.86 | % |
Diversified REITs | | | 2.10 | % |
Diversified Telecommunication Services | | | 3.04 | % |
Electric Utilities | | | 1.45 | % |
Electrical Equipment | | | 2.38 | % |
Financial Services | | | 3.28 | % |
Food Products | | | 3.06 | % |
Health Care Providers & Services | | | 1.03 | % |
Hotels, Restaurants & Leisure | | | 4.41 | % |
Household Durables | | | 3.70 | % |
Household Products | | | 1.17 | % |
Independent Power and Renewable Electricity Producers | | | 1.80 | % |
Industrial Real Estate Investment Trusts | | | 1.57 | % |
Insurance | | | 2.73 | % |
IT Services | | | 1.22 | % |
Oil, Gas & Consumable Fuels | | | 0.00 | % |
Paper & Forest Products | | | 1.30 | % |
Passenger Airlines | | | 1.88 | % |
Personal Care Products | | | 1.04 | % |
Semiconductors & Semiconductor Equipment | | | 11.25 | % |
Specialty Retail | | | 2.24 | % |
Technology Hardware, Storage & Peripherals | | | 6.88 | % |
Tobacco | | | 1.80 | % |
Wireless Telecommunication Services | | | 5.26 | % |
| | | | |
| |
TOTAL COMMON STOCKS | | | 95.86 | % |
| | | | |
| |
PREFERRED STOCKS | | | | |
Oil, Gas & Consumable Fuels | | | 2.59 | % |
| | | | |
| |
TOTAL PREFERRED STOCKS | | | 2.59 | % |
| | | | |
| |
SHORT-TERM INVESTMENTS | | | 1.31 | % |
| | | | |
| |
TOTAL INVESTMENTS | | | 99.76 | % |
Other Assets in Excess of Liabilities | | | 0.24 | % |
| | | | |
| |
TOTAL NET ASSETS | | | 100.00 | % |
| | | | |
The industry classifications represented in the Schedule of Investments are in accordance with Global Industry Classification Standards (GICS®), which was developed by and/or is the exclusive property of MSCI, Inc. and Standard & Poor’s Financial Services LLC or were otherwise determined by the Advisor to be appropriate. This information is unaudited.
The accompanying notes to financial statements are an integral part of this Schedule of Investments.
54
Brandes International Small Cap Equity Fund
SCHEDULE OF INVESTMENTS — March 31, 2024 (Unaudited)
| | | | | | | | |
| Shares | | | | | Value | |
| |
| | COMMON STOCKS – 95.25% | | | | |
| |
| | Austria – 1.78% | | | | |
| | 455,936 | | | Addiko Bank AG(a) | | $ | 8,829,364 | |
| | | | | | | | |
| |
| | Belgium – 1.06% | | | | |
| | 620,764 | | | Ontex Group NV(a) | | | 5,248,306 | |
| | | | | | | | |
| |
| | Brazil – 6.22% | | | | |
| | 4,166,440 | | | Embraer SA(a) | | | 27,671,595 | |
| | 788,200 | | | Neoenergia SA | | | 3,198,124 | |
| | | | | | | | |
| | |
| | | | | | | 30,869,719 | |
| | | | | | | | |
| |
| | Canada – 6.51% | | | | |
| | 492,772 | | | CAE, Inc.(a) | | | 10,170,814 | |
| | 396,764 | | | Corby Spirit and Wine Ltd. | | | 3,775,636 | |
| | 885,059 | | | Dorel Industries, Inc. – Class B(a) | | | 4,521,508 | |
| | 614,546 | | | Heroux-Devtek, Inc.(a) | | | 8,252,624 | |
| | 32,998 | | | Lassonde Industries, Inc. – Class A | | | 3,623,921 | |
| | 174,044 | | | Pason Systems, Inc. | | | 2,009,559 | |
| | | | | | | | |
| | |
| | | | | | | 32,354,062 | |
| | | | | | | | |
| |
| | Chile – 1.06% | | | | |
| | 87,777,008 | | | Enel Chile SA | | | 5,276,816 | |
| | | | | | | | |
| |
| | China – 1.06% | | | | |
| | 12,059,900 | | | Boyaa Interactive International Ltd.(a) | | | 3,528,494 | |
| | 202,087 | | | China Yuchai International Ltd. | | | 1,723,802 | |
| | | | | | | | |
| | |
| | | | | | | 5,252,296 | |
| | | | | | | | |
| |
| | France – 4.90% | | | | |
| | 548,991 | | | Elior Group SA(a),(b) | | | 1,467,681 | |
| | 782,763 | | | Euroapi SA(a) | | | 2,360,207 | |
| | 285,921 | | | LISI SA | | | 7,295,786 | |
| | 21,230 | | | LISI SA Registered (2025) | | | 541,679 | |
| | 71,431 | | | LISI SA Registered (2026) | | | 1,822,548 | |
| | 44,149 | | | Societe BIC SA | | | 3,154,721 | |
| | 195,281 | | | Vicat SACA | | | 7,703,019 | |
| | | | | | | | |
| | |
| | | | | | | 24,345,641 | |
| | | | | | | | |
| |
| | Germany – 0.77% | | | | |
| | 78,598 | | | Draegerwerk AG & Co. KGaA | | | 3,844,915 | |
| | | | | | | | |
| | | | | | | | |
| Shares | | | | | Value | |
| |
| | Greece – 1.00% | | | | |
| | 391,627 | | | Sarantis SA | | $ | 4,960,230 | |
| | | | | | | | |
| |
| | Hong Kong – 9.82% | | | | |
| | 2,059,500 | | | Dickson Concepts International Ltd. | | | 1,294,605 | |
| | 64,290,000 | | | Emperor Watch & Jewellery Ltd. | | | 1,462,088 | |
| | 22,815,000 | | | First Pacific Co. Ltd. | | | 11,494,613 | |
| | 19,439,020 | | | PAX Global Technology Ltd. | | | 15,323,915 | |
| | 26,266,000 | | | Pico Far East Holdings Ltd. | | | 5,573,252 | |
| | 9,681,500 | | | Yue Yuen Industrial Holdings Ltd. | | | 13,606,810 | |
| | | | | | | | |
| | |
| | | | | | | 48,755,283 | |
| | | | | | | | |
| |
| | Hungary – 1.90% | | | | |
| | 3,844,280 | | | Magyar Telekom Telecommunications Plc | | | 9,445,937 | |
| | | | | | | | |
| |
| | Ireland – 8.82% | | | | |
| | 2,619,097 | | | AIB Group Plc | | | 13,295,688 | |
| | 250,771 | | | Avadel Pharmaceuticals Plc Sponsored – ADR(a) | | | 4,235,522 | |
| | 7,004,737 | | | C&C Group Plc | | | 14,481,606 | |
| | 7,831,897 | | | Greencore Group Plc(a) | | | 11,792,840 | |
| | | | | | | | |
| | |
| | | | | | | 43,805,656 | |
| | | | | | | | |
| |
| | Italy – 1.52% | | | | |
| | 192,059 | | | Buzzi SpA | | | 7,542,724 | |
| | | | | | | | |
| |
| | Japan – 11.74% | | | | |
| | 739,200 | | | Futaba Corp. | | | 2,509,901 | |
| | 612,200 | | | H.U. Group Holdings, Inc.(c) | | | 9,879,803 | |
| | 975,700 | | | Hachijuni Bank Ltd. | | | 6,703,184 | |
| | 1,253,700 | | | Hyakugo Bank Ltd. | | | 5,374,893 | |
| | 214,500 | | | Kaken Pharmaceutical Co. Ltd. | | | 4,901,278 | |
| | 320,000 | | | Kissei Pharmaceutical Co. Ltd. | | | 7,472,586 | |
| | 595,400 | | | Koatsu Gas Kogyo Co. Ltd. | | | 3,508,368 | |
| | 844,944 | | | Komori Corp. | | | 6,876,543 | |
| | 336,500 | | | Medipal Holdings Corp. | | | 5,157,088 | |
The accompanying notes to financial statements are an integral part of this Schedule of Investments.
55
Brandes International Small Cap Equity Fund
SCHEDULE OF INVESTMENTS — March 31, 2024 (Unaudited) (continued)
| | | | | | | | |
| Shares | | | | | Value | |
| | |
| | 404,600 | | | Nihon Parkerizing Co. Ltd. | | $ | 3,292,821 | |
| | 131,400 | | | Oita Bank Ltd. | | | 2,621,403 | |
| | | | | | | | |
| | |
| | | | | | | 58,297,868 | |
| | | | | | | | |
| |
| | Luxembourg – 2.50% | | | | |
| | 613,349 | | | Millicom International Cellular SA(a) | | | 12,408,050 | |
| | | | | | | | |
| |
| | Mexico – 2.40% | | | | |
| | 32,000,124 | | | Consorcio ARA SAB de CV | | | 6,140,359 | |
| | 279,501,983 | | | Desarrolladora Homex SAB de CV(a),(d) | | | 184,939 | |
| | 3,175,233 | | | Fibra Uno Administracion SA de CV | | | 5,281,462 | |
| | 806,929 | | | Urbi Desarrollos Urbanos SAB de CV(a),(d) | | | 334,916 | |
| | | | | | | | |
| | |
| | | | | | | 11,941,676 | |
| | | | | | | | |
| |
| | Panama – 2.22% | | | | |
| | 372,068 | | | Banco Latinoamericano de Comercio Exterior SA – Class E | | | 11,020,654 | |
| | | | | | | | |
| |
| | Slovenia – 2.07% | | | | |
| | 406,612 | | | Nova Ljubljanska Banka – GDR(b) | | | 9,519,212 | |
| | 32,369 | | | Nova Ljubljanska Banka – GDR | | | 757,792 | |
| | | | | | | | |
| | |
| | | | | | | 10,277,004 | |
| | | | | | | | |
| |
| | South Korea – 3.50% | | | | |
| | 127,665 | | | Binggrae Co. Ltd. | | | 5,177,722 | |
| | 287,392 | | | Kangwon Land, Inc. | | | 3,477,523 | |
| | 195,405 | | | S-1 Corp. | | | 8,723,373 | |
| | | | | | | | |
| | |
| | | | | | | 17,378,618 | |
| | | | | | | | |
| |
| | Spain – 4.41% | | | | |
| | 1,313,919 | | | Lar Espana Real Estate Socimi SA | | | 10,234,506 | |
| | 11,696,213 | | | Linea Directa Aseguradora SA Cia de Seguros y Reaseguros | | | 11,672,075 | |
| | | | | | | | |
| | |
| | | | | | | 21,906,581 | |
| | | | | | | | |
| | | | | | | | |
| Shares | | | | | Value | |
| |
| | Switzerland – 3.82% | | | | |
| | 527,352 | | | Montana Aerospace AG(a),(b) | | $ | 9,882,185 | |
| | 54,921 | | | Sulzer AG Registered | | | 6,683,898 | |
| | 20,507 | | | Valiant Holding AG Registered | | | 2,405,767 | |
| | | | | | | | |
| | |
| | | | | | | 18,971,850 | |
| | | | | | | | |
| |
| | United Kingdom – 16.17% | | | | |
| | 1,621,633 | | | Balfour Beatty Plc | | | 7,822,656 | |
| | 11,214,106 | | | ITV Plc | | | 10,459,721 | |
| | 3,814,218 | | | J Sainsbury Plc | | | 13,023,418 | |
| | 1,964,399 | | | LSL Property Services Plc | | | 6,595,114 | |
| | 1,364,072 | | | Marks & Spencer Group Plc | | | 4,568,101 | |
| | 4,469,364 | | | Mitie Group Plc | | | 5,923,059 | |
| | 3,078,604 | | | Rolls-Royce Holdings Plc(a) | | | 16,564,018 | |
| | 869,983 | | | St James’s Place Plc | | | 5,103,906 | |
| | 1,352,768 | | | Yellow Cake Plc(a),(b) | | | 10,275,137 | |
| | | | | | | | |
| | |
| | | | | | | 80,335,130 | |
| | | | | | | | |
| TOTAL COMMON STOCKS
(Cost $394,895,917) | | $ | 473,068,380 | |
| | | | | | | | |
| | PREFERRED STOCKS – 3.64% | | | | |
| |
| | Germany – 1.70% | | | | |
| | 153,473 | | | Draegerwerk AG & Co. KGaA, 3.579%(e) | | $ | 8,438,727 | |
| | | | | | | | |
| |
| | Spain – 1.94% | | | | |
| | 1,441,607 | | | Grifols SA – Class B – ADR(a) | | | 9,629,935 | |
| | | | | | | | |
| TOTAL PREFERRED STOCKS
(Cost $18,611,308) | | $ | 18,068,662 | |
| | | | | | | | |
The accompanying notes to financial statements are an integral part of this Schedule of Investments.
56
Brandes International Small Cap Equity Fund
SCHEDULE OF INVESTMENTS — March 31, 2024 (Unaudited) (continued)
| | | | | | | | |
| | | Shares | | | Value | |
| | |
SHORT-TERM INVESTMENTS – 0.44% | | | | | | | | |
Money Market Funds — 0.44% | | | | | | | | |
Northern Institutional Funds - Treasury Portfolio (Premier), 5.15%(f) | | | 2,200,752 | | | $ | 2,200,752 | |
| | | | | | | | |
| | |
TOTAL SHORT-TERM INVESTMENTS
(Cost $2,200,752) | | | | | | $ | 2,200,752 | |
| | | | | | | | |
| | |
Total Investments
(Cost $415,707,977) – 99.33% | | | | | | $ | 493,337,794 | |
Other Assets in Excess of Liabilities – 0.67% | | | | | | | 3,329,417 | |
| | | | | | | | |
| | |
TOTAL NET ASSETS – 100.00% | | | | | | $ | 496,667,211 | |
| | | | | | | | |
Percentages are stated as a percent of net assets.
ADR American Depositary Receipt
GDR Global Depositary Receipt
| (a) | Non-income producing security. |
| (b) | Acquired in a transaction exempt from registration under Rule 144A or Section 4(a)(2) of the Securities Act of 1933. May be resold in the U.S. in transactions exempt from registration, normally to qualified institutional buyers. The total value of all such securities was $31,144,215 which represented 6.27% of the net assets of the Fund. |
| (c) | All or a portion of this security is on loan. See Note 2 in the Notes to Financial Statements. |
| (d) | Affiliated issuer. See Note 3 in the Notes to Financial Statements. |
| (e) | Current yield is disclosed. Dividends are calculated based on a percentage of the issuer’s net income. |
| (f) | The rate shown is the annualized seven day yield as of March 31, 2024. |
The accompanying notes to financial statements are an integral part of this Schedule of Investments.
57
Brandes International Small Cap Equity Fund
SCHEDULE OF INVESTMENTS BY INDUSTRY — March 31, 2024
| | | | |
COMMON STOCKS | | | | |
Aerospace & Defense | | | 16.55 | % |
Banks | | | 9.97 | % |
Beverages | | | 3.68 | % |
Capital Markets | | | 1.03 | % |
Chemicals | | | 1.37 | % |
Commercial Services & Supplies | | | 3.58 | % |
Construction & Engineering | | | 1.57 | % |
Construction Materials | | | 3.07 | % |
Consumer Staples Distribution & Retail | | | 3.54 | % |
Diversified REITs | | | 1.06 | % |
Diversified Telecommunication Services | | | 1.90 | % |
Electric Utilities | | | 1.71 | % |
Electrical Equipment | | | 0.51 | % |
Electronic Equipment, Instruments & Components | | | 3.09 | % |
Energy Equipment & Services | | | 0.40 | % |
Entertainment | | | 0.71 | % |
Financial Services | | | 2.22 | % |
Food Products | | | 6.45 | % |
Health Care Equipment & Supplies | | | 0.77 | % |
Health Care Providers & Services | | | 3.03 | % |
Hotels, Restaurants & Leisure | | | 1.00 | % |
Household Durables | | | 2.25 | % |
Insurance | | | 2.35 | % |
Machinery | | | 3.08 | % |
Media | | | 3.23 | % |
Personal Care Products | | | 2.06 | % |
Pharmaceuticals | | | 3.81 | % |
Real Estate Management & Development | | | 1.33 | % |
Retail REITs | | | 2.06 | % |
Specialty Retail | | | 0.56 | % |
Textiles, Apparel & Luxury Goods | | | 2.74 | % |
Trading Companies & Distributors | | | 2.07 | % |
Wireless Telecommunication Services | | | 2.50 | % |
| | | | |
| |
TOTAL COMMON STOCKS | | | 95.25 | % |
| | | | |
| |
PREFERRED STOCKS | | | | |
Biotechnology | | | 1.94 | % |
Health Care Equipment & Supplies | | | 1.70 | % |
| | | | |
| |
TOTAL PREFERRED STOCKS | | | 3.64 | % |
| | | | |
| |
SHORT-TERM INVESTMENTS | | | 0.44 | % |
| | | | |
| |
TOTAL INVESTMENTS | | | 99.33 | % |
Other Assets in Excess of Liabilities | | | 0.67 | % |
| | | | |
| |
TOTAL NET ASSETS | | | 100.00 | % |
| | | | |
The accompanying notes to financial statements are an integral part of this Schedule of Investments.
58
Brandes International Small Cap Equity Fund
SCHEDULE OF INVESTMENTS BY INDUSTRY — March 31, 2024 (continued)
The industry classifications represented in the Schedule of Investments are in accordance with Global Industry Classification Standards (GICS®), which was developed by and/or is the exclusive property of MSCI, Inc. and Standard & Poor’s Financial Services LLC or were otherwise determined by the Advisor to be appropriate. This information is unaudited.
The accompanying notes to financial statements are an integral part of this Schedule of Investments.
59
Brandes Small Cap Value Fund
SCHEDULE OF INVESTMENTS — March 31, 2024 (Unaudited)
| | | | | | |
| Shares | | | | Value | |
| |
COMMON STOCKS – 97.82% | | | | |
| |
Aerospace & Defense – 17.53% | | | | |
| 55,153 | | Embraer SA Sponsored – ADR(a) | | $ | 1,469,276 | |
| 8,227 | | Moog, Inc. – Class A | | | 1,313,441 | |
| 8,187 | | National Presto Industries, Inc. | | | 686,071 | |
| 97,205 | | Park Aerospace Corp. | | | 1,616,519 | |
| 19,920 | | Spirit AeroSystems Holdings Inc. – Class A(a) | | | 718,514 | |
| | | | | | |
| | |
| | | | | 5,803,821 | |
| | | | | | |
| |
Banks – 2.46% | | | | |
| 24,761 | | Eagle Bancorp Montana, Inc. | | | 317,931 | |
| 14,825 | | National Bankshares, Inc. | | | 495,303 | |
| | | | | | |
| | |
| | | | | 813,234 | |
| | | | | | |
| |
Biotechnology – 0.69% | | | | |
| 11,508 | | PDL BioPharma, Inc.(a),(b) | | | 1,871 | |
| 989 | | United Therapeutics Corp.(a) | | | 227,193 | |
| | | | | | |
| | |
| | | | | 229,064 | |
| | | | | | |
| |
Chemicals – 1.83% | | | | |
| 8,108 | | Scotts Miracle-Gro Co. | | | 604,776 | |
| | | | | | |
|
Commercial Services & Supplies – 3.73% | |
| 75,333 | | Healthcare Services Group, Inc.(a) | | | 940,156 | |
| 1,696 | | UniFirst Corp. | | | 294,137 | |
| | | | | | |
| | |
| | | | | 1,234,293 | |
| | | | | | |
| |
Communications Equipment – 5.71% | | | | |
| 93,918 | | NETGEAR, Inc.(a) | | | 1,481,087 | |
| 127,531 | | Ribbon Communications, Inc.(a) | | | 408,099 | |
| | | | | | |
| | |
| | | | | 1,889,186 | |
| | | | | | |
| |
Construction & Engineering – 1.86% | | | | |
| 75,105 | | Orion Group Holdings, Inc.(a) | | | 615,861 | |
| | | | | | |
| |
Construction Materials – 1.71% | | | | |
| 28,814 | | Buzzi SpA – ADR | | | 566,365 | |
| | | | | | |
|
Consumer Staples Distribution & Retail – 2.48% | |
| 10,685 | | Ingles Markets, Inc. – Class A | | | 819,326 | |
| | | | | | |
| | | | | | |
| Shares | | | | Value | |
| |
Electronic Equipment, Instruments & Components – 3.75% | | | | |
| 98,184 | | Arlo Technologies, Inc.(a) | | $ | 1,242,028 | |
| | | | | | |
|
Energy Equipment & Services – 3.90% | |
| 57,231 | | Dril-Quip, Inc.(a) | | | 1,289,414 | |
| | | | | | |
|
Gas Utilities – 1.51% | |
| 4,479 | | Northwest Natural Holding Co. | | | 166,708 | |
| 5,413 | | Spire, Inc. | | | 332,196 | |
| | | | | | |
| | |
| | | | | 498,904 | |
| | | | | | |
|
Health Care Equipment & Supplies – 3.56% | |
| 50,007 | | LENSAR, Inc.(a) | | | 177,525 | |
| 14,088 | | Utah Medical Products, Inc. | | | 1,001,797 | |
| | | | | | |
| | |
| | | | | 1,179,322 | |
| | | | | | |
|
Health Care Providers & Services – 1.98% | |
| 51,984 | | Pediatrix Medical Group, Inc.(a) | | | 521,399 | |
| 6,069 | | Premier, Inc. – Class A | | | 134,125 | |
| | | | | | |
| | |
| | | | | 655,524 | |
| | | | | | |
| |
Household Durables – 0.98% | | | | |
| 63,637 | | Dorel Industries, Inc. – Class B(a) | | | 325,103 | |
| | | | | | |
| |
Insurance – 4.12% | | | | |
| 72,018 | | Crawford & Co. – Class A | | | 679,130 | |
| 13,268 | | Mercury General Corp. | | | 684,629 | |
| | | | | | |
| | |
| | | | | 1,363,759 | |
| | | | | | |
| |
Leisure Products – 1.69% | | | | |
| 63,647 | | American Outdoor Brands, Inc.(a) | | | 560,094 | |
| | | | | | |
| |
Machinery – 13.67% | | | | |
| 10,621 | | Flowserve Corp. | | | 485,167 | |
| 63,912 | | Graham Corp.(a) | | | 1,743,519 | |
| 28,123 | | Hurco Companies, Inc. | | | 566,960 | |
| 40,717 | | Kennametal, Inc. | | | 1,015,482 | |
| 26,184 | | L.B. Foster Co. – Class A(a) | | | 715,085 | |
| | | | | | |
| | |
| | | | | 4,526,213 | |
| | | | | | |
| |
Multi-Utilities – 1.01% | | | | |
| 9,504 | | Avista Corp. | | | 332,830 | |
| | | | | | |
|
Office Real Estate Investment Trusts – 1.95% | |
| 34,150 | | Equity Commonwealth(a) | | | 644,752 | |
| | | | | | |
The accompanying notes to financial statements are an integral part of this Schedule of Investments.
60
Brandes Small Cap Value Fund
SCHEDULE OF INVESTMENTS — March 31, 2024 (Unaudited) (continued)
| | | | | | |
| Shares | | | | Value | |
| |
Oil, Gas & Consumable Fuels – 4.79% | | | | |
| 7,575 | | Chesapeake Energy Corp. | | $ | 672,887 | |
| 34,523 | | World Kinect Corp. | | | 913,134 | |
| | | | | | |
| | |
| | | | | 1,586,021 | |
| | | | | | |
| |
Personal Care Products – 3.82% | | | | |
| 32,752 | | Edgewell Personal Care Co. | | | 1,265,537 | |
| | | | | | |
| |
Pharmaceuticals – 9.16% | | | | |
| 22,431 | | Avadel Pharmaceuticals Plc Sponsored – ADR(a) | | | 378,860 | |
| 59,784 | | Elanco Animal Health, Inc.(a) | | | 973,283 | |
| 59,858 | | Phibro Animal Health Corp. – Class A | | | 773,964 | |
| 12,509 | | Prestige Consumer Healthcare, Inc.(a) | | | 907,653 | |
| | | | | | |
| | |
| | | | | 3,033,760 | |
| | | | | | |
| | | | | | |
| Shares | | | | Value | |
| |
Software – 1.70% | | | | |
| 44,690 | | SolarWinds Corp.(a) | | $ | 563,988 | |
| | | | | | |
| |
Textiles, Apparel & Luxury Goods – 2.23% | | | | |
| 127,466 | | Hanesbrands, Inc.(a) | | | 739,303 | |
| | | | | | |
| |
TOTAL COMMON STOCKS | | | | |
(Cost $27,131,262) | | $ | 32,382,478 | |
| | | | | | |
| |
INVESTMENT COMPANIES – 1.41% | | | | |
| |
Trading Companies & Distributors – 1.41% | | | | |
| 22,601 | | Sprott Physical Uranium Trust | | $ | 468,021 | |
| | | | | | |
| |
TOTAL INVESTMENT COMPANIES | | | | |
| |
| (Cost $350,490) | | $ | 468,021 | |
| | | | | | |
| | | | | | | | |
| | | Shares | | | Value | |
| | |
SHORT-TERM INVESTMENTS – 0.94% | | | | | | | | |
| Northern Institutional Funds - Treasury Portfolio (Premier), 5.15%, (c) | | | 309,539 | | | $ | 309,539 | |
| | | | | | | | |
TOTAL SHORT-TERM INVESTMENTS | | | | | | | | |
| (Cost $309,539) | | | | | | $ | 309,539 | |
| | | | | | | | |
Total Investments (Cost $27,791,291) – 100.17% | | | | | | $ | 33,160,038 | |
Liabilities in Excess of Other Assets – (0.17)% | | | | | | | (55,278 | ) |
| | | | | | | | |
| | |
TOTAL NET ASSETS – 100.00% | | | | | | $ | 33,104,760 | |
| | | | | | | | |
Percentages are stated as a percent of net assets.
ADR American Depositary Receipt
| (a) | Non-income producing security. |
| (c) | The rate shown is the annualized seven day yield as of March 31, 2024. |
The industry classifications represented in the Schedule of Investments are in accordance with Global Industry Classification Standards (GICS®), which was developed by and/or is the exclusive property of MSCI, Inc. and Standard & Poor’s Financial Services LLC or were otherwise determined by the Advisor to be appropriate. This information is unaudited.
The accompanying notes to financial statements are an integral part of this Schedule of Investments.
61
Brandes Small Cap Value Fund
SCHEDULE OF INVESTMENTS BY COUNTRY — March 31, 2024
| | | | |
COMMON STOCKS | | | | |
Brazil | | | 4.44 | % |
Canada | | | 0.98 | % |
Ireland | | | 1.14 | % |
Italy | | | 1.71 | % |
United States | | | 89.55 | % |
| | | | |
| |
TOTAL COMMON STOCKS | | | 97.82 | % |
| | | | |
| |
INVESTMENT COMPANIES | | | | |
Canada | | | 1.41 | % |
| | | | |
| |
TOTAL INVESTMENT COMPANIES | | | 1.41 | % |
| | | | |
| |
SHORT-TERM INVESTMENTS | | | 0.94 | % |
| | | | |
| |
TOTAL INVESTMENTS | | | 100.17 | % |
Liabilities in Excess of Other Assets | | | (0.17 | )% |
| | | | |
| |
TOTAL NET ASSETS | | | 100.00 | % |
| | | | |
The accompanying notes to financial statements are an integral part of this Schedule of Investments.
62
Brandes Core Plus Fixed Income Fund
SCHEDULE OF INVESTMENTS — March 31, 2024 (Unaudited)
| | | | | | | | |
| | | Shares | | | Value | |
COMMON STOCKS – 0.00% | | | | | | | | |
Home Construction – 0.00% | | | | | | | | |
Urbi Desarrollos Urbanos SAB de CV (a) | | | 1,564 | | | $ | 649 | |
| | | | | | | | |
| | |
TOTAL COMMON STOCKS
(Cost $292,050) | | | | | | $ | 649 | |
| | | | | | | | |
| | |
| | | Principal
Amount | | | Value | |
| | |
FEDERAL AND FEDERALLY SPONSORED CREDITS – 5.41% | | | | | | | | |
Federal Home Loan Mortgage Corporation – 2.85% | | | | | | | | |
Pool A9-3505 4.500%, 8/1/2040 | | $ | 41,403 | | | $ | 40,692 | |
Pool G0-6018 6.500%, 4/1/2039 | | | 10,970 | | | | 11,373 | |
Pool G1-8578 3.000%, 12/1/2030 | | | 421,861 | | | | 401,726 | |
Pool SD-2873 3.000%, 1/1/2052 | | | 2,203,878 | | | | 1,921,051 | |
Pool SD-8001 3.500%, 7/1/2049 | | | 200,245 | | | | 181,812 | |
Pool SD-8003 4.000%, 7/1/2049 | | | 197,233 | | | | 184,716 | |
| | | | | | | | |
| | |
| | | | | | | 2,741,370 | |
| | | | | | | | |
| | |
Federal National Mortgage Association – 2.56% | | | | | | | | |
Pool 934124 5.500%, 7/1/2038 | | | 34,751 | | | | 35,498 | |
Pool AL9865 3.000%, 2/1/2047 | | | 647,551 | | | | 570,144 | |
Pool AS6201 3.500%, 11/1/2045 | | | 157,970 | | | | 144,450 | |
Pool BJ2553 3.500%, 12/1/2047 | | | 205,200 | | | | 187,316 | |
Pool BN6683 3.500%, 6/1/2049 | | | 345,123 | | | | 313,961 | |
Pool CA0483 3.500%, 10/1/2047 | | | 657,888 | | | | 601,241 | |
Pool CA1624 3.000%, 4/1/2033 | | | 395,966 | | | | 372,555 | |
Pool MA0918 4.000%, 12/1/2041 | | | 93,233 | | | | 88,425 | |
Pool MA3687 4.000%, 6/1/2049 | | | 156,252 | | | | 146,357 | |
Pool MA3695 3.000%, 7/1/2034 | | | 5,152 | | | | 4,828 | |
| | | | | | | | |
| | |
| | | | | | | 2,464,775 | |
| | | | | | | | |
| | |
TOTAL FEDERAL AND FEDERALLY SPONSORED CREDITS
(Cost $5,265,650) | | | | | | $ | 5,206,145 | |
| | | | | | | | |
| | |
OTHER MORTGAGE RELATED SECURITIES – 0.00% | | | | | | | | |
Collateralized Mortgage Obligations – 0.00% | | | | | | | | |
Wells Fargo Mortgage Backed Securities Trust Series 2006-AR14 5.884%, 10/25/2036(b) | | $ | 264 | | | $ | 230 | |
| | | | | | | | |
| | |
TOTAL OTHER MORTGAGE RELATED SECURITIES
(Cost $261) | | | | | | $ | 230 | |
| | | | | | | | |
| | |
US GOVERNMENTS – 61.96% | | | | | | | | |
Sovereign Government – 61.96% | | | | | | | | |
United States Treasury Bond | | | | | | | | |
4.750%, 2/15/2037 | | $ | 7,250,497 | | | $ | 7,721,213 | |
3.500%, 2/15/2039 | | | 3,082,289 | | | | 2,835,826 | |
The accompanying notes to financial statements are an integral part of this Schedule of Investments.
63
Brandes Core Plus Fixed Income Fund
SCHEDULE OF INVESTMENTS — March 31, 2024 (Unaudited) (continued)
| | | | | | | | |
| | | Principal
Amount | | | Value | |
| | |
3.750%, 11/15/2043 | | $ | 7,736,874 | | | $ | 7,009,124 | |
3.000%, 5/15/2047 | | | 4,979,223 | | | | 3,918,026 | |
| | | | | | | | |
| | |
| | | | | | | 21,484,189 | |
| | | | | | | | |
| | |
United States Treasury Note | | | | | | | | |
2.375%, 8/15/2024 | | | 3,260,000 | | | | 3,224,185 | |
2.250%, 2/15/2027 | | | 8,107,255 | | | | 7,634,754 | |
2.375%, 5/15/2029 | | | 17,501,090 | | | | 16,020,334 | |
1.625%, 5/15/2031 | | | 13,276,124 | | | | 11,197,581 | |
| | | | | | | | |
| | |
| | | | | | | 38,076,854 | |
| | | | | | | | |
TOTAL US GOVERNMENTS
(Cost $62,820,220) | | | | | | $ | 59,561,043 | |
| | | | | | | | |
| | |
CORPORATE BONDS – 24.13% | | | | | | | | |
Asset Management – 0.98% | | | | | | | | |
Charles Schwab Corp.
5.375% (U.S. Treasury Yield Curve Rate CMT 5Y + 4.971%), 6/1/2025(c) | | $ | 950,225 | | | $ | 943,458 | |
| | | | | | | | |
| | |
Automotive – 1.23% | | | | | | | | |
Ford Motor Credit Co. LLC | | | | | | | | |
3.375%, 11/13/2025 | | | 423,842 | | | | 407,843 | |
2.700%, 8/10/2026 | | | 828,842 | | | | 772,878 | |
| | | | | | | | |
| | |
| | | | | | | 1,180,721 | |
| | | | | | | | |
| | |
Banking – 5.01% | | | | | | | | |
Bank of America Corp.
4.450%, 3/3/2026 | | | 1,512,221 | | | | 1,489,959 | |
Citigroup, Inc.
4.400%, 6/10/2025 | | | 1,333,222 | | | | 1,314,959 | |
Fifth Third Bancorp
8.250%, 3/1/2038 | | | 230,381 | | | | 276,487 | |
USB Capital IX
6.596% (CME Term SOFR 3M + 1.282%, minimum of 6.596%), Perpetual, 5/2/2024(c) | | | 2,129,060 | | | | 1,732,776 | |
| | | | | | | | |
| | |
| | | | | | | 4,814,181 | |
| | | | | | | | |
| | |
Cable & Satellite – 0.35% | | | | | | | | |
Charter Communications Operating LLC
4.908%, 7/23/2025 | | | 339,305 | | | | 335,223 | |
| | | | | | | | |
| | |
Commercial Support Services – 1.94% | | | | | | | | |
Prime Security Services Borrower LLC | | | | | | | | |
5.750%, 4/15/2026(d) | | | 844,223 | | | | 841,666 | |
6.250%, 1/15/2028(d) | | | 1,038,685 | | | | 1,018,225 | |
| | | | | | | | |
| | |
| | | | | | | 1,859,891 | |
| | | | | | | | |
| | |
Containers & Packaging – 0.48% | | | | | | | | |
Sealed Air Corp.
4.000%, 12/1/2027(d) | | | 494,612 | | | | 463,477 | |
| | | | | | | | |
The accompanying notes to financial statements are an integral part of this Schedule of Investments.
64
Brandes Core Plus Fixed Income Fund
SCHEDULE OF INVESTMENTS — March 31, 2024 (Unaudited) (continued)
| | | | | | | | |
| | | Principal
Amount | | | Value | |
| | |
Electric Utilities – 1.43% | | | | | | | | |
American Transmission Systems, Inc.
2.650%, 1/15/2032(d) | | $ | 677,534 | | | $ | 561,444 | |
Commonwealth Edison Co.
5.900%, 3/15/2036 | | | 237,766 | | | | 252,350 | |
FirstEnergy Corp.
7.375%, 11/15/2031 | | | 474,612 | | | | 558,491 | |
| | | | | | | | |
| | |
| | | | | | | 1,372,285 | |
| | | | | | | | |
| | |
Entertainment Content – 0.37% | | | | | | | | |
Univision Communications, Inc.
8.000%, 8/15/2028(d) | | | 350,000 | | | | 356,572 | |
| | | | | | | | |
| | |
Food – 0.78% | | | | | | | | |
Pilgrim’s Pride Corp.
4.250%, 4/15/2031 | | | 836,533 | | | | 752,729 | |
| | | | | | | | |
| | |
Home Construction – 2.00% | | | | | | | | |
PulteGroup, Inc.
5.500%, 3/1/2026 | | | 1,127,684 | | | | 1,128,409 | |
Toll Brothers Finance Corp.
4.875%, 11/15/2025 | | | 807,766 | | | | 798,662 | |
| | | | | | | | |
| | |
| | | | | | | 1,927,071 | |
| | | | | | | | |
| | |
Household Products – 0.95% | | | | | | | | |
Coty, Inc.
5.000%, 4/15/2026(d) | | | 926,594 | | | | 913,151 | |
| | | | | | | | |
| | |
Institutional Financial Services – 0.74% | | | | | | | | |
Goldman Sachs Group, Inc.
3.800% (U.S. Treasury Yield Curve Rate CMT 5Y + 2.969%), 5/10/2026(c) | | | 758,842 | | | | 707,889 | |
| | | | | | | | |
| | |
Internet Media & Services – 2.50% | | | | | | | | |
Expedia Group, Inc. | | | | | | | | |
3.800%, 2/15/2028 | | | 150,307 | | | | 143,056 | |
3.250%, 2/15/2030 | | | 371,151 | | | | 334,149 | |
Meta Platforms, Inc.
4.950%, 5/15/2033 | | | 745,456 | | | | 755,116 | |
Netflix, Inc.
4.375%, 11/15/2026 | | | 1,186,608 | | | | 1,169,003 | |
| | | | | | | | |
| | |
| | | | | | | 2,401,324 | |
| | | | | | | | |
| | |
Leisure Facilities & Services – 0.95% | | | | | | | | |
Travel + Leisure
Co. 6.625%, 7/31/2026(d) | | | 906,839 | | | | 913,220 | |
| | | | | | | | |
| | |
Oil & Gas Producers – 1.52% | | | | | | | | |
Hess Midstream Operations LP
4.250%, 2/15/2030(d) | | | 416,689 | | | | 382,842 | |
Range Resources Corp.
4.875%, 5/15/2025 | | | 1,089,223 | | | | 1,081,042 | |
| | | | | | | | |
| | |
| | | | | | | 1,463,884 | |
| | | | | | | | |
The accompanying notes to financial statements are an integral part of this Schedule of Investments.
65
Brandes Core Plus Fixed Income Fund
SCHEDULE OF INVESTMENTS — March 31, 2024 (Unaudited) (continued)
| | | | | | | | |
| | | Principal
Amount | | | Value | |
| | |
REIT – 0.75% | | | | | | | | |
| | |
Iron Mountain, Inc. | | | | | | | | |
4.875%, 9/15/2027(d) | | $ | 702,228 | | | $ | 678,675 | |
4.875%, 9/15/2027 | | | 38,767 | | | | 37,467 | |
| | | | | | | | |
| | | | | | | 716,142 | |
| | | | | | | | |
| | |
Software – 1.39% | | | | | | | | |
VMware LLC | | | | | | | | |
4.500%, 5/15/2025 | | | 237,153 | | | | 234,846 | |
3.900%, 8/21/2027 | | | 1,153,760 | | | | 1,105,519 | |
| | | | | | | | |
| | | | | | | 1,340,365 | |
| | | | | | | | |
| | |
Telecommunications – 0.76% | | | | | | | | |
Sprint Spectrum Co. LLC
5.152%, 3/20/2028(d) | | | 391,074 | | | | 390,276 | |
T-Mobile USA, Inc.
4.750%, 2/1/2028 | | | 346,151 | | | | 341,654 | |
| | | | | | | | |
| | | | | | | 731,930 | |
| | | | | | | | |
TOTAL CORPORATE BONDS
(Cost $23,611,864) | | | | | | $ | 23,193,513 | |
| | | | | | | | |
| | |
| FOREIGN ISSUER BONDS – 2.07% | | | | | | | | |
| | |
Chemicals – 0.73% | | | | | | | | |
Methanex Corp. | | | | | | | | |
5.125%, 10/15/2027 | | $ | 283,229 | | | $ | 274,056 | |
5.250%, 12/15/2029 | | | 441,689 | | | | 422,836 | |
| | | | | | | | |
| | | | | | | 696,892 | |
| | | | | | | | |
| | |
Oil, Gas Services & Equipment – 0.36% | | | | | | | | |
Transocean, Inc.
8.750%, 2/15/2030(d) | | | 335,213 | | | | 349,437 | |
| | | | | | | | |
| | |
Telecommunications – 0.98% | | | | | | | | |
SoftBank Group Corp.
4.750%, 9/19/2024 | | | 200,000 | | | | 198,104 | |
Telecom Italia Capital SA
6.375%, 11/15/2033 | | | 787,302 | | | | 743,807 | |
| | | | | | | | |
| | | | | | | 941,911 | |
| | | | | | | | |
TOTAL FOREIGN ISSUER BONDS
(Cost $2,110,090) | | | | | | $ | 1,988,240 | |
| | | | | | | | |
| | |
| ASSET BACKED SECURITIES – 1.09% | | | | | | | | |
| | |
| Specialty Finance – 1.09% | | | | | | | | |
SLM Private Credit Student Loan Trust Series 2004-B, 6.021%, (CME Term SOFR 3M + 0.692%), 9/15/2033(c) | | $ | 318,055 | | | $ | 313,558 | |
SLM Private Credit Student Loan Trust Series 2005-A, 5.901%, (CME Term SOFR 3M + 0.572%), 12/15/2038(c) | | | 247,036 | | | | 242,930 | |
The accompanying notes to financial statements are an integral part of this Schedule of Investments.
66
Brandes Core Plus Fixed Income Fund
SCHEDULE OF INVESTMENTS — March 31, 2024 (Unaudited) (continued)
| | | | | | | | |
| | | Principal
Amount | | | Value | |
SLM Private Credit Student Loan Trust Series 2006-A, 5.881%, (CME Term SOFR 3M + 0.552%), 6/15/2039(c) | | $ | 359,399 | | | $ | 348,379 | |
SLM Private Credit Student Loan Trust Series 2007-A, 5.831%, (CME Term SOFR 3M + 0.502%), 12/16/2041(c) | | | 145,002 | | | | 142,775 | |
| | | | | | | | |
| | |
TOTAL ASSET BACKED SECURITIES
(Cost $1,008,723) | | | | | | $ | 1,047,642 | |
| | | | | | | | |
| | |
| | | Shares | | | Value | |
| | |
SHORT-TERM INVESTMENTS – 4.42% | | | | | | | | |
| | |
Money Market Funds – 4.42% | | | | | | | | |
Northern Institutional Funds - Treasury Portfolio (Premier), 5.15%(e) | | | 4,250,592 | | | $ | 4,250,592 | |
| | | | | | | | |
| | |
TOTAL SHORT-TERM INVESTMENTS
(Cost $4,250,592) | | | | | | $ | 4,250,592 | |
| | | | | | | | |
| | |
Total Investments (Cost $99,359,450) – 99.08% | | | | | | $ | 95,248,054 | |
Other Assets in Excess of Liabilities – 0.92% | | | | | | | 879,845 | |
| | | | | | | | |
| | |
Total Net Assets – 100.00% | | | | | | $ | 96,127,899 | |
| | | | | | | | |
Percentages are stated as a percent of net assets.
SOFR Secured Overnight Financing Rate
LP Limited Partnership
REIT Real Estate Investment Trust
| (a) | Non-income producing security. |
| (b) | Variable rate security. The coupon is based on an underlying pool of loans. |
| (c) | Variable rate security. The coupon is based on a reference index and spread index. |
| (d) | Acquired in a transaction exempt from registration under Rule 144A or Section 4(a)(2) of the Securities Act of 1933. May be resold in the U.S. in transactions exempt from registration, normally to qualified institutional buyers. The total value of all such securities was $6,868,985 which represented 7.15% of the net assets of the Fund. |
| (e) | The rate shown is the annualized seven day yield as of March 31, 2024. |
The industry classifications represented in the Schedule of Investments are in accordance with Bloomberg Industry Classification Standards (BICS) or were otherwise determined by the Advisor to be appropriate. This information is unaudited.
The accompanying notes to financial statements are an integral part of this Schedule of Investments.
67
Brandes Investment Trust
STATEMENTS OF ASSETS AND LIABILITIES — March 31, 2024 (Unaudited)
| | | | | | | | |
| | | Brandes
International
Equity Fund | | | Brandes
Global
Equity Fund | |
| | |
ASSETS | | | | | | | | |
Investment in securities, at value(1), (2) | | | | | | | | |
Unaffiliated issuers | | $ | 807,440,840 | | | $ | 49,520,597 | |
Affiliated issuers | | | — | | | | — | |
Foreign Currency(1) | | | 203,853 | | | | 36,179 | |
Cash | | | 71,265 | | | | 42,295 | |
Receivables: | | | | | | | | |
Securities sold | | | — | | | | — | |
Fund shares sold | | | 420,448 | | | | 355,000 | |
Dividends and interest | | | 3,043,541 | | | | 124,034 | |
Tax reclaims | | | 1,916,585 | | | | 55,432 | |
Securities lending | | | 477 | | | | — | |
Prepaid expenses and other assets | | | 124,798 | | | | 41,071 | |
| | | | | | | | |
| | |
Total Assets | | | 813,221,807 | | | | 50,174,608 | |
| | | | | | | | |
| | |
LIABILITIES | | | | | | | | |
Payables: | | | | | | | | |
Securities purchased | | | 3,057,241 | | | | — | |
Fund shares redeemed | | | 647,189 | | | | 87,625 | |
12b-1 Fee | | | 13,375 | | | | 611 | |
Trustee Fees | | | 25,674 | | | | 1,581 | |
Custodian Fee | | | 18,891 | | | | 2,057 | |
Foreign capital gains taxes | | | — | | | | — | |
Dividends payable | | | — | | | | 1,200 | |
Accrued expenses | | | 233,069 | | | | 49,581 | |
Due to Advisor | | | 503,184 | | | | 32,753 | |
| | | | | | | | |
| | |
Total Liabilities | | | 4,498,623 | | | | 175,408 | |
| | | | | | | | |
| | |
NET ASSETS | | $ | 808,723,184 | | | $ | 49,999,200 | |
| | | | | | | | |
| | |
COMPONENTS OF NET ASSETS | | | | | | | | |
Paid in Capital | | $ | 801,979,228 | | | $ | 34,302,980 | |
Total distributable earnings (loss) | | | 6,743,956 | | | | 15,696,220 | |
| | | | | | | | |
Total Net Assets | | $ | 808,723,184 | | | $ | 49,999,200 | |
| | | | | | | | |
| | |
Net asset value, offering price and redemption proceeds per share | | | | | | | | |
Class A Shares | | | | | | | | |
Net Assets | | $ | 41,974,435 | | | $ | 1,635,133 | |
Shares outstanding (unlimited shares authorized without par value) | | | 1,998,706 | | | | 53,738 | |
Offering and redemption price | | $ | 21.00 | | | $ | 30.43 | |
| | | | | | | | |
Maximum offering price per share* | | $ | 22.28 | | | $ | 32.29 | |
| | | | | | | | |
| | |
Class C Shares | | | | | | | | |
Net Assets | | $ | 7,266,432 | | | $ | 840,295 | |
Shares outstanding (unlimited shares authorized without par value) | | | 353,738 | | | | 27,999 | |
Offering and redemption price | | $ | 20.54 | | | $ | 30.01 | |
| | | | | | | | |
| | |
Class I Shares | | | | | | | | |
Net Assets | | $ | 691,981,595 | | | $ | 47,523,772 | |
Shares outstanding (unlimited shares authorized without par value) | | | 32,607,321 | | | | 1,540,890 | |
Offering and redemption price | | $ | 21.22 | | | $ | 30.84 | |
| | | | | | | | |
| | |
Class R6 Shares | | | | | | | | |
Net Assets | | $ | 67,500,722 | | | $ | N/A | |
Shares outstanding (unlimited shares authorized without par value) | | | 3,152,964 | | | | N/A | |
Offering and redemption price | | $ | 21.41 | | | $ | N/A | |
| | | | | | | | |
(1) Cost of: | | | | | | | | |
Investments in securities | | | | | | | | |
Unaffiliated issuers | | $ | 722,211,742 | | | $ | 35,300,705 | |
Affiliated issuers | | | — | | | | — | |
Foreign currency | | | 203,854 | | | | 36,179 | |
(2) Market value of securities loaned of: | | $ | 4,328,287 | | | $ | 1,509 | |
| * | Includes a sales load of 5.75% for the International, Global, Emerging Markets, International Small Cap, and Small Cap Value Funds and 3.75% for the Core Plus Fund. (see Note 7 of the Notes to Financial Statements) |
The accompanying notes to financial statements are an integral part of this statement.
68
Brandes Investment Trust
STATEMENTS OF ASSETS AND LIABILITIES — March 31, 2024 (Unaudited) (continued)
| | | | | | | | | | | | | | |
Brandes Emerging Markets Value Fund | | | Brandes
International
Small Cap
Equity Fund | | | Brandes
Small Cap
Value Fund | | Brandes
Core Plus
Fixed
Income
Fund | |
| | | |
| | | | | | | | | | | | | | |
| | | | | | | | | | | | | | |
| $ | 696,898,896 | | | $ | 492,817,939 | | | $ | 33,160,038 | | | $ | 95,248,054 | |
| | — | | | | 519,855 | | | | — | | | | — | |
| | 627,222 | | | | 46,842 | | | | — | | | | — | |
| | 87,932 | | | | 4,135,017 | | | | 177,985 | | | | 52,635 | |
| | | | | | | | | | | | | | |
| | 1,069,187 | | | | 2,043,801 | | | | 514,434 | | | | — | |
| | 1,340,148 | | | | 670,073 | | | | 85,169 | | | | 82,193 | |
| | 1,959,769 | | | | 2,474,048 | | | | 21,888 | | | | 842,207 | |
| | 232,538 | | | | 182,447 | | | | — | | | | — | |
| | — | | | | 413 | | | | — | | | | — | |
| | 62,528 | | | | 76,625 | | | | 41,898 | | | | 60,845 | |
| | | | | | | | | | | | | | |
| | | |
| | 702,278,220 | | | | 502,967,060 | | | | 34,001,412 | | | | 96,285,934 | |
| | | | | | | | | | | | | | |
| | | |
| | | | | | | | | | | | | | |
| | | | | | | | | | | | | | |
| | 654,531 | | | | 459,695 | | | | 826,333 | | | | 19,898 | |
| | 380,522 | | | | 5,195,162 | | | | 6,798 | | | | 47,065 | |
| | 35,199 | | | | 15,068 | | | | 1,295 | | | | 261 | |
| | 25,135 | | | | 14,441 | | | | 431 | | | | 2,959 | |
| | 32,860 | | | | 13,129 | | | | 1,269 | | | | 749 | |
| | 1,762,841 | | | | — | | | | — | | | | — | |
| | — | | | | 661 | | | | 16 | | | | — | |
| | 287,948 | | | | 218,453 | | | | 42,086 | | | | 59,028 | |
| | 550,733 | | | | 383,240 | | | | 18,424 | | | | 28,075 | |
| | | | | | | | | | | | | | |
| | | |
| | 3,729,769 | | | | 6,299,849 | | | | 896,652 | | | | 158,035 | |
| | | | | | | | | | | | | | |
| | | |
| $ | 698,548,451 | | | $ | 496,667,211 | | | $ | 33,104,760 | | | $ | 96,127,899 | |
| | | | | | | | | | | | | | |
| | | |
| | | | | | | | | | | | | | |
| $ | 1,045,578,432 | | | $ | 562,002,198 | | | $ | 28,465,157 | | | $ | 102,655,882 | |
| | (347,029,981 | ) | | | (65,334,987 | ) | | | 4,639,603 | | | | (6,527,983 | ) |
| | | | | | | | | | | | | | |
| $ | 698,548,451 | | | $ | 496,667,211 | | | $ | 33,104,760 | | | $ | 96,127,899 | |
| | | | | | | | | | | | | | |
| | | |
| | | | | | | | | | | | | | |
| | | | | | | | | | | | | | |
| $ | 154,441,429 | | | $ | 62,715,683 | | | $ | 6,634,884 | | | $ | 1,232,953 | |
| | 17,993,646 | | | | 3,728,255 | | | | 429,658 | | | | 148,820 | |
| $ | 8.58 | | | $ | 16.82 | | | $ | 15.44 | | | $ | 8.28 | |
| | | | | | | | | | | | | | |
| $ | 9.10 | | | $ | 17.85 | | | $ | 16.38 | | | $ | 8.60 | |
| | | | | | | | | | | | | | |
| | | |
| | | | | | | | | | | | | | |
| $ | 4,493,103 | | | $ | 3,757,773 | | | $ | N/A | | | $ | N/A | |
| | 529,016 | | | | 233,325 | | | | N/A | | | | N/A | |
| $ | 8.49 | | | $ | 16.11 | | | $ | N/A | | | $ | N/A | |
| | | | | | | | | | | | | | |
| | | |
| | | | | | | | | | | | | | |
| $ | 531,145,629 | | | $ | 429,534,563 | | | $ | 26,441,002 | | | $ | 85,312,113 | |
| | 61,424,403 | | | | 25,359,669 | | | | 1,687,434 | | | | 10,199,500 | |
| $ | 8.65 | | | $ | 16.94 | | | $ | 15.67 | | | $ | 8.36 | |
| | | | | | | | | | | | | | |
| | | |
| | | | | | | | | | | | | | |
| $ | 8,468,290 | | | $ | 659,192 | | | $ | 28,874 | | | $ | 9,582,833 | |
| | 971,074 | | | | 38,682 | | | | 1,965 | | | | 1,146,084 | |
| $ | 8.72 | | | $ | 17.04 | | | $ | 14.69 | | | $ | 8.36 | |
| | | | | | | | | | | | | | |
| | | | | | | | | | | | | | |
| | | | | | | | | | | | | | |
| $ | 742,187,724 | | | $ | 384,825,103 | | | $ | 27,791,291 | | | $ | 99,359,450 | |
| | — | | | | 30,882,874 | | | | — | | | | — | |
| | 630,534 | | | | 46,587 | | | | — | | | | — | |
| $ | — | | | $ | 7,263,845 | | | $ | — | | | $ | — | |
The accompanying notes to financial statements are an integral part of this statement.
69
Brandes Investment Trust
STATEMENTS OF OPERATIONS — For the Six Months Ended March 31, 2024 (Unaudited)
| | | | | | | | |
| | |
Brandes
International
Equity Fund | | | Brandes
Global
Equity Fund | |
| | |
INVESTMENT INCOME | | | | | | | | |
Income | | | | | | | | |
Dividend income | | | | | | | | |
Unaffiliated issuers | | | $ 9,039,489 | | | | $ 605,718 | |
Less: Foreign taxes withheld | | | (554,540 | ) | | | (28,159 | ) |
Interest income | | | 2,730 | | | | — | |
Income from securities lending | | | 6,407 | | | | — | |
| | | | | | | | |
| | |
Total Income | | | 8,494,086 | | | | 577,559 | |
| | | | | | | | |
| | |
Expenses | | | | | | | | |
Advisory fees (Note 3) | | | 2,736,519 | | | | 178,786 | |
Custody fees | | | 41,154 | | | | 2,113 | |
Administration fees (Note 3) | | | 83,087 | | | | 9,788 | |
Insurance expense | | | 13,411 | | | | 950 | |
Legal fees | | | 39,475 | | | | 2,433 | |
Printing fees | | | 19,109 | | | | 1,742 | |
Miscellaneous | | | 50,486 | | | | 7,170 | |
Registration expense | | | 43,717 | | | | 21,373 | |
Trustees fees | | | 52,111 | | | | 3,212 | |
Transfer agent fees | | | 78,082 | | | | 4,783 | |
12b-1 Fees – Class A | | | 55,845 | | | | 1,667 | |
12b-1 Fees – Class C | | | 27,584 | | | | 1,434 | |
Shareholder Service Fees – Class C | | | 9,195 | | | | 478 | |
Sub-Transfer Agency Fees – Class I | | | 154,511 | | | | 10,745 | |
Unutilized Sub-Transfer Agency Fees – Class I (Note 3) | | | — | | | | (16,547 | ) |
Auditing fees | | | 27,393 | | | | 24,232 | |
Expenses recouped | | | — | | | | — | |
| | | | | | | | |
Total expenses | | | 3,431,679 | | | | 254,359 | |
Expenses waived by Advisor | | | (260,576 | ) | | | (27,292 | ) |
Expenses waived by Service Provider | | | — | | | | — | |
| | | | | | | | |
Total net expenses | | | 3,171,103 | | | | 227,067 | |
| | | | | | | | |
Net investment income | | | 5,322,983 | | | | 350,492 | |
| | | | | | | | |
| | |
REALIZED AND UNREALIZED GAIN (LOSS) ON INVESTMENTS | | | | | | | | |
Net realized gain (loss) on: | | | | | | | | |
Unaffiliated investments | | | 19,880,912 | | | | 1,687,836 | |
Foreign currency transactions | | | (23,897 | ) | | | (4,044 | ) |
| | | | | | | | |
Net realized gain (loss) | | | 19,857,015 | | | | 1,683,792 | |
| | | | | | | | |
Net change in unrealized appreciation (depreciation) on: | | | | | | | | |
Unaffiliated investments (net of increase in estimated foreign capital gains taxes of $351,686 for the Emerging Markets Fund) | | | 87,347,086 | | | | 7,092,595 | |
Affiliated investments | | | — | | | | — | |
Foreign currency transactions | | | 111,272 | | | | 1,300 | |
| | | | | | | | |
Net change in unrealized appreciation (depreciation) | | | 87,458,358 | | | | 7,093,895 | |
| | | | | | | | |
Net realized and unrealized gain (loss) on investments and foreign currency transactions | | | 107,315,373 | | | | 8,777,687 | |
| | | | | | | | |
Net increase (decrease) in net assets resulting from operations | | | $112,638,356 | | | | $9,128,179 | |
| | | | | | | | |
The accompanying notes to financial statements are an integral part of this statement.
70
Brandes Investment Trust
STATEMENTS OF OPERATIONS — For the Six Months Ended March 31, 2024 (Unaudited) (continued)
| | | | | | | | | | | | | | |
Brandes
Emerging
Markets
Value Fund | | | Brandes
International
Small Cap
Equity Fund | | | Brandes
Small Cap
Value Fund | | | Brandes
Core Plus
Fixed
Income
Fund | |
| | | |
| | | | | | | | | | | | | | |
| | | |
| | | | | | | | | | | | | | |
| | | | | | | | | | | | | | |
| | $ 8,539,072 | | | | $ 4,571,643 | | | | $ 153,599 | | | | $ 90,979 | |
| | (1,163,734 | ) | | | (431,299 | ) | | | — | | | | (2 | ) |
| | — | | | | 505 | | | | — | | | | 1,559,253 | |
| | — | | | | 413 | | | | — | | | | — | |
| | | | | | | | | | | | | | |
| | 7,375,338 | | | | 4,141,262 | | | | 153,599 | | | | 1,650,230 | |
| | | | | | | | | | | | | | |
| | | |
| | | | | | | | | | | | | | |
| | 3,235,710 | | | | 1,923,747 | | | | 67,565 | | | | 138,371 | |
| | 64,523 | | | | 29,265 | | | | 3,841 | | | | 1,549 | |
| | 77,894 | | | | 48,340 | | | | 7,071 | | | | 13,466 | |
| | 14,141 | | | | 6,898 | | | | 186 | | | | 1,428 | |
| | 38,509 | | | | 21,288 | | | | 696 | | | | 4,274 | |
| | 32,471 | | | | 7,834 | | | | 3,036 | | | | 2,912 | |
| | 55,514 | | | | 29,571 | | | | 2,799 | | | | 6,786 | |
| | 37,780 | | | | 32,575 | | | | 24,251 | | | | 25,440 | |
| | 50,796 | | | | 28,170 | | | | 913 | | | | 5,659 | |
| | 72,889 | | | | 43,335 | | | | 2,066 | | | | 8,461 | |
| | 181,260 | | | | 68,041 | | | | 5,273 | | | | 1,616 | |
| | 16,673 | | | | 12,608 | | | | — | | | | — | |
| | 5,558 | | | | 4,203 | | | | — | | | | — | |
| | 130,821 | | | | 86,656 | | | | 3,763 | | | | 18,120 | |
| | — | | | | — | | | | — | | | | (56,136 | ) |
| | 27,315 | | | | 26,533 | | | | 22,738 | | | | 24,140 | |
| | — | | | | 28,844 | | | | 23 | | | | — | |
| | | | | | | | | | | | | | |
| | 4,041,854 | | | | 2,397,908 | | | | 144,221 | | | | 196,086 | |
| | (54,506 | ) | | | (1,004 | ) | | | (51,670 | ) | | | (56,208 | ) |
| | — | | | | — | | | | — | | | | (19,768 | ) |
| | | | | | | | | | | | | | |
| | 3,987,348 | | | | 2,396,904 | | | | 92,551 | | | | 120,110 | |
| | | | | | | | | | | | | | |
| | 3,387,990 | | | | 1,744,358 | | | | 61,048 | | | | 1,530,120 | |
| | | | | | | | | | | | | | |
| | | |
| | | | | | | | | | | | | | |
| | | | | | | | | | | | | | |
| | (17,202,073 | ) | | | 14,594,685 | | | | 27,344 | | | | 141,027 | |
| | (38,853 | ) | | | (55,529 | ) | | | 304 | | | | — | |
| | | | | | | | | | | | | | |
| | (17,240,926 | ) | | | 14,539,156 | | | | 27,648 | | | | 141,027 | |
| | | | | | | | | | | | | | |
| | | | | | | | | | | | | | |
| | 87,362,330 | | | | 71,816,890 | | | | 4,596,183 | | | | 3,207,090 | |
| | — | | | | 7,915 | | | | — | | | | — | |
| | (20,506 | ) | | | 46,986 | | | | (11 | ) | | | — | |
| | | | | | | | | | | | | | |
| | 87,341,824 | | | | 71,871,791 | | | | 4,596,172 | | | | 3,207,090 | |
| | | | | | | | | | | | | | |
| | 70,100,898 | | | | 86,410,947 | | | | 4,623,820 | | | | 3,348,117 | |
| | | | | | | | | | | | | | |
| | $ 73,488,888 | | | | $88,155,305 | | | | $4,684,868 | | | | $4,878,237 | |
| | | | | | | | | | | | | | |
The accompanying notes to financial statements are an integral part of this statement.
71
Brandes Investment Trust
STATEMENT OF CHANGES IN NET ASSETS
| | | | | | | | | | | | | | | | |
| | | Brandes International Equity
Fund | | Brandes Global
Equity Fund |
| | | Six Months Ended
March 31,
2024
(Unaudited) | | Year Ended
September 30,
2023 | | Six Months Ended
March 31,
2024
(Unaudited) | | Year Ended
September 30,
2023 |
| | | | |
INCREASE (DECREASE) IN NET ASSETS FROM: | | | | | | | | | | | | | | | | |
| | | | |
OPERATIONS | | | | | | | | | | | | | | | | |
Net investment income | | | $ 5,322,983 | | | | $ 17,377,303 | | | | $ 350,492 | | | | $ 876,502 | |
Net realized gain (loss) on: | | | | | | | | | | | | | | | | |
Investments | | | 19,880,912 | | | | (19,081,764 | ) | | | 1,687,836 | | | | 1,182,465 | |
Foreign currency transactions | | | (23,897 | ) | | | 90,783 | | | | (4,044 | ) | | | 4,807 | |
Net unrealized appreciation (depreciation) on: | | | | | | | | | | | | | | | | |
Investments | | | 87,347,086 | | | | 196,610,998 | | | | 7,092,595 | | | | 8,635,965 | |
Foreign currency transactions | | | 111,272 | | | | 93,879 | | | | 1,300 | | | | 5,116 | |
| | | | | | | | | | | | | | | | |
| | | | |
Net increase (decrease) in net assets resulting from operations | | | 112,638,356 | | | | 195,091,199 | | | | 9,128,179 | | | | 10,704,855 | |
| | | | | | | | | | | | | | | | |
| | | | |
DISTRIBUTIONS TO SHAREHOLDERS | | | | | | | | | | | | | | | | |
Distributions to shareholders | | | | | | | | | | | | | | | | |
Class A | | | (260,323 | ) | | | (982,193 | ) | | | (43,828 | ) | | | (28,987 | ) |
Class C | | | (28,633 | ) | | | (124,383 | ) | | | (12,031 | ) | | | (14,198 | ) |
Class I | | | (3,749,967 | ) | | | (13,201,875 | ) | | | (1,519,120 | ) | | | (1,303,715 | ) |
Class R6 | | | (361,072 | ) | | | (1,245,833 | ) | | | N/A | | | | N/A | |
| | | | | | | | | | | | | | | | |
| | | | |
Decrease in net assets from distributions | | | (4,399,995 | ) | | | (15,554,284 | ) | | | (1,574,979 | ) | | | (1,346,900 | ) |
| | | | | | | | | | | | | | | | |
| | | | |
CAPITAL SHARE TRANSACTIONS | | | | | | | | | | | | | | | | |
Proceeds from shares sold | | | 119,197,421 | | | | 181,227,234 | | | | 2,063,889 | | | | 2,921,723 | |
Net asset value of shares issued on reinvestment of distributions | | | 4,195,179 | | | | 15,210,215 | | | | 1,562,974 | | | | 1,337,641 | |
Cost of shares redeemed | | | (81,250,900 | ) | | | (178,850,167 | ) | | | (3,271,975 | ) | | | (8,015,333 | ) |
| | | | | | | | | | | | | | | | |
| | | | |
Net increase (decrease) in net assets from capital share transactions | | | 42,141,700 | | | | 17,587,282 | | | | 354,888 | | | | (3,755,969 | ) |
| | | | | | | | | | | | | | | | |
Total increase (decrease) in net assets | | | 150,380,061 | | | | 197,124,197 | | | | 7,908,088 | | | | 5,601,986 | |
| | | | | | | | | | | | | | | | |
| | | | |
NET ASSETS | | | | | | | | | | | | | | | | |
Beginning of the Period | | | 658,343,123 | | | | 461,218,926 | | | | 42,091,112 | | | | 36,489,126 | |
| | | | | | | | | | | | | | | | |
End of the Period | | | $808,723,184 | | | | $ 658,343,123 | | | | $49,999,200 | | | | $42,091,112 | |
| | | | | | | | | | | | | | | | |
The accompanying notes to financial statements are an integral part of this statement.
72
Brandes Investment Trust
STATEMENT OF CHANGES IN NET ASSETS (continued)
| | | | | | | | | | | | | | | | |
| | | Brandes Emerging Markets
Value Fund | | Brandes International Small
Cap Equity Fund |
| | | Six Months Ended
March 31,
2024
(Unaudited) | | Year Ended
September 30,
2023 | | Six Months Ended
March 31,
2024
(Unaudited) | | Year Ended
September 30,
2023 |
| | | | |
INCREASE (DECREASE) IN NET ASSETS FROM: | | | | | | | | | | | | | | | | |
| | | | |
OPERATIONS | | | | | | | | | | | | | | | | |
Net investment income | | | $ 3,387,990 | | | | $ 15,944,242 | | | | $ 1,744,358 | | | | $ 6,448,797 | |
Net realized gain (loss) on: | | | | | | | | | | | | | | | | |
Investments | | | (17,202,073 | ) | | | (9,407,945 | ) | | | 14,594,685 | | | | 2,626,764 | |
Foreign currency transactions | | | (38,853 | ) | | | (131,926 | ) | | | (55,529 | ) | | | (177,732 | ) |
Net unrealized appreciation (depreciation) on: | | | | | | | | | | | | | | | | |
Investments | | | 87,362,330 | | | | 179,020,784 | | | | 71,824,805 | | | | 100,701,377 | |
Foreign currency transactions | | | (20,506 | ) | | | (12,191 | ) | | | 46,986 | | | | 9,030 | |
| | | | | | | | | | | | | | | | |
| | | | |
Net increase (decrease) in net assets resulting from operations | | | 73,488,888 | | | | 185,412,964 | | | | 88,155,305 | | | | 109,608,236 | |
| | | | | | | | | | | | | | | | |
| | | | |
DISTRIBUTIONS TO SHAREHOLDERS | | | | | | | | | | | | | | | | |
Distributions to shareholders | | | | | | | | | | | | | | | | |
Class A | | | (1,267,930 | ) | | | (2,095,363 | ) | | | (866,551 | ) | | | (739,891 | ) |
Class C | | | (30,716 | ) | | | (28,354 | ) | | | (60,649 | ) | | | (29,797 | ) |
Class I | | | (4,958,055 | ) | | | (8,705,978 | ) | | | (5,808,931 | ) | | | (4,690,866 | ) |
Class R6 | | | (78,485 | ) | | | (147,308 | ) | | | (9,232 | ) | | | (9,174 | ) |
| | | | | | | | | | | | | | | | |
| | | | |
Decrease in net assets from distributions | | | (6,335,186 | ) | | | (10,977,003 | ) | | | (6,745,363 | ) | | | (5,469,728 | ) |
| | | | | | | | | | | | | | | | |
| | | | |
CAPITAL SHARE TRANSACTIONS | | | | | | | | | | | | | | | | |
Proceeds from shares sold | | | 50,490,645 | | | | 145,204,047 | | | | 124,672,426 | | | | 68,732,747 | |
Net asset value of shares issued on reinvestment of distributions | | | 5,236,652 | | | | 9,170,438 | | | | 6,645,662 | | | | 5,427,552 | |
Cost of shares redeemed | | | (99,825,990 | ) | | | (273,965,187 | ) | | | (41,407,271 | ) | | | (90,520,043 | ) |
| | | | | | | | | | | | | | | | |
| | | | |
Net increase (decrease) in net assets from capital share transactions | | | (44,098,693 | ) | | | (119,590,702 | ) | | | 89,910,817 | | | | (16,359,744 | ) |
| | | | | | | | | | | | | | | | |
Total increase (decrease) in net assets | | | 23,055,009 | | | | 54,845,259 | | | | 171,320,759 | | | | 87,778,764 | |
| | | | | | | | | | | | | | | | |
| | | | |
NET ASSETS | | | | | | | | | | | | | | | | |
Beginning of the Period | | | 675,493,442 | | | | 620,648,183 | | | | 325,346,452 | | | | 237,567,688 | |
| | | | | | | | | | | | | | | | |
End of the Period | | | $698,548,451 | | | | $ 675,493,442 | | | | $496,667,211 | | | | $325,346,452 | |
| | | | | | | | | | | | | | | | |
The accompanying notes to financial statements are an integral part of this statement.
73
Brandes Investment Trust
STATEMENT OF CHANGES IN NET ASSETS (continued)
| | | | | | | | | | | | | | | | |
| | | Brandes Small Cap Value Fund | | Brandes Core Plus Fixed
Income Fund |
| | | Six Months Ended
March 31,
2024
(Unaudited) | | Year Ended
September 30,
2023 | | Six Months Ended
March 31,
2024
(Unaudited) | | Year Ended
September 30,
2023 |
| | | | |
INCREASE (DECREASE) IN NET ASSETS FROM: | | | | | | | | | | | | | | | | |
| | | | |
OPERATIONS | | | | | | | | | | | | | | | | |
Net investment income | | | $ 61,048 | | | | $ 90,457 | | | | $ 1,530,120 | | | | $ 2,202,801 | |
Net realized gain (loss) on: | | | | | | | | | | | | | | | | |
Investments | | | 27,344 | | | | 217,142 | | | | 141,027 | | | | (338,518 | ) |
Foreign currency transactions | | | 304 | | | | 107 | | | | — | | | | — | |
Net unrealized appreciation (depreciation) on: | | | | | | | | | | | | | | | | |
Investments | | | 4,596,183 | | | | 1,114,457 | | | | 3,207,090 | | | | (539,401 | ) |
Foreign currency transactions | | | (11 | ) | | | 11 | | | | — | | | | — | |
| | | | | | | | | | | | | | | | |
| | | | |
Net increase (decrease) in net assets resulting from operations | | | 4,684,868 | | | | 1,422,174 | | | | 4,878,237 | | | | 1,324,882 | |
| | | | | | | | | | | | | | | | |
| | | | |
DISTRIBUTIONS TO SHAREHOLDERS | | | | | | | | | | | | | | | | |
Distributions to shareholders | | | | | | | | | | | | | | | | |
Class A | | | (119,791 | ) | | | (23,984 | ) | | | (23,369 | ) | | | (27,393 | ) |
Class C | | | N/A | | | | N/A | | | | N/A | | | | N/A | |
Class I | | | (273,068 | ) | | | (107,346 | ) | | | (1,386,195 | ) | | | (2,163,987 | ) |
Class R6 | | | (136 | ) | | | (2,384 | ) | | | (102,561 | ) | | | (5,116 | ) |
| | | | | | | | | | | | | | | | |
| | | | |
Decrease in net assets from distributions | | | (392,995 | ) | | | (133,714 | ) | | | (1,512,125 | ) | | | (2,196,496 | ) |
| | | | | | | | | | | | | | | | |
| | | | |
CAPITAL SHARE TRANSACTIONS | | | | | | | | | | | | | | | | |
Proceeds from shares sold | | | 20,639,013 | | | | 8,429,869 | | | | 30,098,113 | | | | 25,725,843 | |
Net asset value of shares issued on reinvestment of distributions | | | 392,122 | | | | 132,847 | | | | 1,497,285 | | | | 2,168,094 | |
Cost of shares redeemed | | | (4,088,231 | ) | | | (1,861,305 | ) | | | (5,576,082 | ) | | | (21,001,036 | ) |
| | | | | | | | | | | | | | | | |
| | | | |
Net increase (decrease) in net assets from capital share transactions | | | 16,942,904 | | | | 6,701,411 | | | | 26,019,316 | | | | 6,892,901 | |
| | | | | | | | | | | | | | | | |
Total increase (decrease) in net assets | | | 21,234,777 | | | | 7,989,871 | | | | 29,385,428 | | | | 6,021,287 | |
| | | | | | | | | | | | | | | | |
| | | | |
NET ASSETS | | | | | | | | | | | | | | | | |
Beginning of the Period | | | 11,869,983 | | | | 3,880,112 | | | | 66,742,471 | | | | 60,721,184 | |
| | | | | | | | | | | | | | | | |
End of the Period | | | $33,104,760 | | | | $11,869,983 | | | | $96,127,899 | | | | $ 66,742,471 | |
| | | | | | | | | | | | | | | | |
The accompanying notes to financial statements are an integral part of this statement.
74
(This Page Intentionally Left Blank)
75
Brandes Investment Trust
FINANCIAL HIGHLIGHTS For a capital share outstanding for the period ended:
| | | | | | | | | | | | | | | | | | | | | | | | | | | | | | |
| | | Net asset
value,
beginning
of period | | Net
investment
income(1) | |
Net
realized and
unrealized
gain (loss) on
investments | | Total from
investment
operations | | Dividends
from net
investment
income | | Net asset
value, end
of period |
| | | | |
Brandes International Equity Fund | | | | | | | | | | | | | | | | | | | | | |
Class A | | | | | | | | | | | | | | | | | | | | | | | | | | | | | | |
3/31/2024(Unaudited) | | | $ | 18.15 | | | | | 0.11 | | | | | 2.85 | | | | | 2.96 | | | | | (0.11 | ) | | | $ | 21.00 | |
9/30/2023 | | | $ | 12.97 | | | | | 0.46 | | | | | 5.14 | | | | | 5.60 | | | | | (0.42 | ) | | | $ | 18.15 | |
9/30/2022 | | | $ | 18.12 | | | | | 0.60 | | | | | (5.02 | ) | | | | (4.42 | ) | | | | (0.73 | ) | | | $ | 12.97 | |
9/30/2021 | | | $ | 13.51 | | | | | 0.53 | | | | | 4.54 | | | | | 5.07 | | | | | (0.46 | ) | | | $ | 18.12 | |
9/30/2020 | | | $ | 16.02 | | | | | 0.26 | | | | | (2.40 | ) | | | | (2.14 | ) | | | | (0.37 | ) | | | $ | 13.51 | |
9/30/2019 | | | $ | 17.71 | | | | | 0.53 | | | | | (1.59 | ) | | | | (1.06 | ) | | | | (0.63 | ) | | | $ | 16.02 | |
Class C | | | | | | | | | | | | | | | | | | | | | | | | | | | | | | |
3/31/2024(Unaudited) | | | $ | 17.79 | | | | | 0.04 | | | | | 2.78 | | | | | 2.82 | | | | | (0.07 | ) | | | $ | 20.54 | |
9/30/2023 | | | $ | 12.72 | | | | | 0.30 | | | | | 5.07 | | | | | 5.37 | | | | | (0.30 | ) | | | $ | 17.79 | |
9/30/2022 | | | $ | 17.78 | | | | | 0.43 | | | | | (4.89 | ) | | | | (4.46 | ) | | | | (0.60 | ) | | | $ | 12.72 | |
9/30/2021 | | | $ | 13.27 | | | | | 0.43 | | | | | 4.47 | | | | | 4.90 | | | | | (0.39 | ) | | | $ | 17.78 | |
9/30/2020 | | | $ | 15.76 | | | | | 0.13 | | | | | (2.33 | ) | | | | (2.20 | ) | | | | (0.29 | ) | | | $ | 13.27 | |
9/30/2019 | | | $ | 17.47 | | | | | 0.40 | | | | | (1.58 | ) | | | | (1.18 | ) | | | | (0.53 | ) | | | $ | 15.76 | |
Class I | | | | | | | | | | | | | | | | | | | | | | | | | | | | | | |
3/31/2024(Unaudited) | | | $ | 18.32 | | | | | 0.15 | | | | | 2.87 | | | | | 3.02 | | | | | (0.12 | ) | | | $ | 21.22 | |
9/30/2023 | | | $ | 13.08 | | | | | 0.51 | | | | | 5.19 | | | | | 5.70 | | | | | (0.46 | ) | | | $ | 18.32 | |
9/30/2022 | | | $ | 18.21 | | | | | 0.62 | | | | | (5.03 | ) | | | | (4.41 | ) | | | | (0.72 | ) | | | $ | 13.08 | |
9/30/2021 | | | $ | 13.57 | | | | | 0.57 | | | | | 4.57 | | | | | 5.14 | | | | | (0.50 | ) | | | $ | 18.21 | |
9/30/2020 | | | $ | 16.07 | | | | | 0.27 | | | | | (2.37 | ) | | | | (2.10 | ) | | | | (0.40 | ) | | | $ | 13.57 | |
9/30/2019 | | | $ | 17.76 | | | | | 0.56 | | | | | (1.60 | ) | | | | (1.04 | ) | | | | (0.65 | ) | | | $ | 16.07 | |
Class R6 | | | | | | | | | | | | | | | | | | | | | | | | | | | | | | |
3/31/2024(Unaudited) | | | $ | 18.47 | | | | | 0.16 | | | | | 2.90 | | | | | 3.06 | | | | | (0.12 | ) | | | $ | 21.41 | |
9/30/2023 | | | $ | 13.18 | | | | | 0.52 | | | | | 5.23 | | | | | 5.75 | | | | | (0.46 | ) | | | $ | 18.47 | |
9/30/2022 | | | $ | 18.32 | | | | | 0.63 | | | | | (5.06 | ) | | | | (4.43 | ) | | | | (0.71 | ) | | | $ | 13.18 | |
9/30/2021 | | | $ | 13.64 | | | | | 0.57 | | | | | 4.62 | | | | | 5.19 | | | | | (0.51 | ) | | | $ | 18.32 | |
9/30/2020 | | | $ | 16.15 | | | | | 0.36 | | | | | (2.47 | ) | | | | (2.11 | ) | | | | (0.40 | ) | | | $ | 13.64 | |
9/30/2019 | | | $ | 17.83 | | | | | 0.59 | | | | | (1.61 | ) | | | | (1.02 | ) | | | | (0.66 | ) | | | $ | 16.15 | |
| (1) | Net investment income per share has been calculated based on average shares outstanding during the period. |
| (2) | The total return calculation does not reflect the sales loads that may be imposed on Class A or C shares (see Note 7 of the Notes to Financial Statements). |
| (3) | After fees waived and expenses absorbed or recouped by the Advisor, where applicable. |
| (6) | As of June 30, 2019, the expense cap for the class changed from 1.00% to 0.85%. |
| (7) | As of June 30, 2019, the expense cap for the class changed from 0.82% to 0.75%. |
The accompanying notes to financial statements are an integral part of this statement.
76
Brandes Investment Trust
FINANCIAL HIGHLIGHTS For a capital share outstanding for the period ended:
| | | | | | | | | | | | | | | | | | | | | | | | | | | | | | | | | |
Total
return(2) | | Net assets,
end of
period
(millions) | | Ratio of
net expenses
to average
net assets(3) | | Ratio of net
investment
income to
average net assets(3) | | Ratio of
expenses (prior
to reimburse-
ments) to
average net assets | | Ratio of net
investment
income (prior
to reimburse-
ments) to
average net assets | | Portfolio
turnover
rate |
| | | | | | |
| | | | | | | | | | | | | | | | | | | | | | | | | | | | | | | | | | |
| | | | | | | | | | | | | | | | | | | | | | | | | | | | | | | | | | |
| | | 16.27% | (4) | | | $ | 42.0 | | | | | 1.12 | %(5) | | | | 1.17 | %(5) | | | | 1.12 | %(5) | | | | 1.17 | %(5) | | | | 11.93 | %(4) |
| | | 43.29% | | | | $ | 43.9 | | | | | 1.13 | % | | | | 2.69 | % | | | | 1.13 | % | | | | 2.69 | % | | | | 21.81 | % |
| | | (25.05)% | | | | $ | 27.9 | | | | | 1.12 | % | | | | 3.57 | % | | | | 1.13 | % | | | | 3.56 | % | | | | 28.67 | % |
| | | 37.55% | | | | $ | 38.2 | | | | | 1.10 | % | | | | 3.03 | % | | | | 1.11 | % | | | | 3.02 | % | | | | 30.41 | % |
| | | (13.42)% | | | | $ | 22.1 | | | | | 1.13 | % | | | | 1.80 | % | | | | 1.14 | % | | | | 1.79 | % | | | | 23.20 | % |
| | | (5.98)% | | | | $ | 32.0 | | | | | 1.16 | % | | | | 3.21 | % | | | | 1.16 | % | | | | 3.21 | % | | | | 14.43 | % |
| | | | | | | | | | | | | | | | | | | | | | | | | | | | | | | | | | |
| | | 15.83% | (4) | | | $ | 7.3 | | | | | 1.88 | %(5) | | | | 0.41 | %(5) | | | | 1.88 | %(5) | | | | 0.41 | %(5) | | | | 11.93 | %(4) |
| | | 42.25% | | | | $ | 7.3 | | | | | 1.89 | % | | | | 1.81 | % | | | | 1.89 | % | | | | 1.81 | % | | | | 21.81 | % |
| | | (25.64)% | | | | $ | 5.9 | | | | | 1.87 | % | | | | 2.58 | % | | | | 1.88 | % | | | | 2.57 | % | | | | 28.67 | % |
| | | 36.90% | | | | $ | 8.8 | | | | | 1.54 | % | | | | 2.51 | % | | | | 1.56 | % | | | | 2.49 | % | | | | 30.41 | % |
| | | (14.06)% | | | | $ | 7.6 | | | | | 1.88 | % | | | | 1.01 | % | | | | 1.89 | % | | | | 1.00 | % | | | | 23.20 | % |
| | | (6.73)% | | | | $ | 13.1 | | | | | 1.91 | % | | | | 2.46 | % | | | | 1.91 | % | | | | 2.46 | % | | | | 14.43 | % |
| | | | | | | | | | | | | | | | | | | | | | | | | | | | | | | | | | |
| | | 16.46% | (4) | | | $ | 692.0 | | | | | 0.85 | %(5) | | | | 1.48 | %(5) | | | | 0.92 | %(5) | | | | 1.41 | %(5) | | | | 11.93 | %(4) |
| | | 43.66% | | | | $ | 553.0 | | | | | 0.85 | % | | | | 2.94 | % | | | | 0.93 | % | | | | 2.86 | % | | | | 21.81 | % |
| | | (24.83)% | | | | $ | 387.4 | | | | | 0.85 | % | | | | 3.66 | % | | | | 0.93 | % | | | | 3.58 | % | | | | 28.67 | % |
| | | 37.87% | | | | $ | 552.2 | | | | | 0.85 | % | | | | 3.25 | % | | | | 0.91 | % | | | | 3.19 | % | | | | 30.41 | % |
| | | (13.13)% | | | | $ | 401.7 | | | | | 0.85 | % | | | | 2.03 | % | | | | 0.94 | % | | | | 1.94 | % | | | | 23.20 | % |
| | | (5.82)% | | | | $ | 622.4 | | | | | 0.94 | %(6) | | | | 3.43 | % | | | | 0.96 | %(6) | | | | 3.41 | % | | | | 14.43 | % |
| | | | | | | | | | | | | | | | | | | | | | | | | | | | | | | | | | |
| | | 16.55% | (4) | | | $ | 67.5 | | | | | 0.75 | %(5) | | | | 1.59 | %(5) | | | | 0.87 | %(5) | | | | 1.47 | %(5) | | | | 11.93 | %(4) |
| | | 43.76% | | | | $ | 54.1 | | | | | 0.75 | % | | | | 2.99 | % | | | | 0.88 | % | | | | 2.86 | % | | | | 21.81 | % |
| | | (24.76)% | | | | $ | 40.1 | | | | | 0.75 | % | | | | 3.69 | % | | | | 0.88 | % | | | | 3.56 | % | | | | 28.67 | % |
| | | 38.03% | | | | $ | 58.8 | | | | | 0.75 | % | | | | 3.28 | % | | | | 0.86 | % | | | | 3.17 | % | | | | 30.41 | % |
| | | (13.08)% | | | | $ | 47.8 | | | | | 0.75 | % | | | | 2.35 | % | | | | 0.89 | % | | | | 2.21 | % | | | | 23.20 | % |
| | | (5.69)% | | | | $ | 35.9 | | | | | 0.80 | %(7) | | | | 3.57 | % | | | | 0.91 | %(7) | | | | 3.46 | % | | | | 14.43 | % |
The accompanying notes to financial statements are an integral part of this statement.
77
Brandes Investment Trust
FINANCIAL HIGHLIGHTS For a capital share outstanding for the period ended:
| | | | | | | | | | | | | | | | | | | | | | | | | | | | | | |
| | | Net asset
value,
beginning
of period | | Net
investment
income(1) | |
Net
realized and
unrealized
gain (loss) on
investments | | Total from
investment
operations | | Dividends
from net
investment
income | | Dividends
from net
realized
gains |
| | | | |
Brandes Global Equity Fund | | | | | | | | | | | | | | | | | | | | | |
Class A | | | | | | | | | | | | | | | | | | | | | | | | | | | | | | |
3/31/2024(Unaudited) | | | $ | 25.80 | | | | | 0.18 | | | | | 5.42 | | | | | 5.60 | | | | | (0.20 | ) | | | | (0.77 | ) |
9/30/2023 | | | $ | 20.42 | | | | | 0.48 | | | | | 5.67 | | | | | 6.15 | | | | | (0.44 | ) | | | | (0.33 | ) |
9/30/2022 | | | $ | 26.53 | | | | | 0.49 | | | | | (5.09 | ) | | | | (4.60 | ) | | | | (0.61 | ) | | | | (0.90 | ) |
9/30/2021 | | | $ | 19.30 | | | | | 0.55 | | | | | 7.54 | | | | | 8.09 | | | | | (0.56 | ) | | | | (0.30 | ) |
9/30/2020 | | | $ | 21.75 | | | | | 0.28 | | | | | (2.33 | ) | | | | (2.05 | ) | | | | (0.40 | ) | | | | — | |
9/30/2019 | | | $ | 24.61 | | | | | 0.47 | | | | | (1.80 | ) | | | | (1.33 | ) | | | | (0.48 | ) | | | | (1.05 | ) |
Class C | | | | | | | | | | | | | | | | | | | | | | | | | | | | | | |
3/31/2024(Unaudited) | | | $ | 25.48 | | | | | 0.08 | | | | | 5.33 | | | | | 5.41 | | | | | (0.11 | ) | | | | (0.77 | ) |
9/30/2023 | | | $ | 20.17 | | | | | 0.28 | | | | | 5.61 | | | | | 5.89 | | | | | (0.25 | ) | | | | (0.33 | ) |
9/30/2022 | | | $ | 26.25 | | | | | 0.29 | | | | | (5.01 | ) | | | | (4.72 | ) | | | | (0.46 | ) | | | | (0.90 | ) |
9/30/2021 | | | $ | 19.16 | | | | | 0.37 | | | | | 7.47 | | | | | 7.84 | | | | | (0.45 | ) | | | | (0.30 | ) |
9/30/2020 | | | $ | 21.60 | | | | | 0.17 | | | | | (2.35 | ) | | | | (2.18 | ) | | | | (0.26 | ) | | | | — | |
9/30/2019 | | | $ | 24.45 | | | | | 0.30 | | | | | (1.78 | ) | | | | (1.48 | ) | | | | (0.32 | ) | | | | (1.05 | ) |
Class I | | | | | | | | | | | | | | | | | | | | | | | | | | | | | | |
3/31/2024(Unaudited) | | | $ | 26.13 | | | | | 0.22 | | | | | 5.48 | | | | | 5.70 | | | | | (0.22 | ) | | | | (0.77 | ) |
9/30/2023 | | | $ | 20.66 | | | | | 0.54 | | | | | 5.75 | | | | | 6.29 | | | | | (0.49 | ) | | | | (0.33 | ) |
9/30/2022 | | | $ | 26.78 | | | | | 0.55 | | | | | (5.14 | ) | | | | (4.59 | ) | | | | (0.63 | ) | | | | (0.90 | ) |
9/30/2021 | | | $ | 19.46 | | | | | 0.64 | | | | | 7.59 | | | | | 8.23 | | | | | (0.61 | ) | | | | (0.30 | ) |
9/30/2020 | | | $ | 21.91 | | | | | 0.38 | | | | | (2.39 | ) | | | | (2.01 | ) | | | | (0.44 | ) | | | | — | |
9/30/2019 | | | $ | 24.77 | | | | | 0.53 | | | | | (1.81 | ) | | | | (1.28 | ) | | | | (0.53 | ) | | | | (1.05 | ) |
| (1) | Net investment income per share has been calculated based on average shares outstanding during the period. |
| (2) | The total return calculation does not reflect the sales loads that may be imposed on Class A shares (see Note 7 of the Notes to Financial Statements). |
| (3) | After fees waived and expenses absorbed or recouped by the Advisor, where applicable. |
The accompanying notes to financial statements are an integral part of this statement.
78
Brandes Investment Trust
FINANCIAL HIGHLIGHTS For a capital share outstanding for the period ended:
| | | | | | | | | | | | | | | | | | | | | | | | | | | | | | | | | | | | | | |
Net asset
value, end
of period | | Total
return(2) | | Net assets,
end of
period
(millions) | | Ratio of
net expenses
to average
net assets(3)
| | Ratio of net
investment
income to
average net assets(3) | | Ratio of
expenses (prior
to reimburse-
ments) to
average
net assets | | Ratio of net
investment
income (prior
to reimburse-
ments) to
average
net assets | | Portfolio
turnover
rate |
| | | | | | | | | | | | | | | | | | | | | | | | | | | | | | | | | | | | | | | |
| | | | | | | | | | | | | | | | | | | | | | | | | | | | | | | | | | | | | | | |
| | | $30.43 | | | | | 22.13 | %(4) | | | $ | 1.6 | | | | | 1.25 | %(5) | | | | 1.34 | %(5) | | | | 1.40 | %(5) | | | | 1.19 | %(5) | | | | 9.03 | %(4) |
| | | $25.80 | | | | | 30.29 | % | | | $ | 1.1 | | | | | 1.25 | % | | | | 1.88 | % | | | | 1.43 | % | | | | 1.70 | % | | | | 17.28 | % |
| | | $20.42 | | | | | (18.30 | )% | | | $ | 0.8 | | | | | 1.25 | % | | | | 1.95 | % | | | | 1.42 | % | | | | 1.78 | % | | | | 14.57 | % |
| | | $26.53 | | | | | 42.30 | % | | | $ | 0.8 | | | | | 1.25 | % | | | | 2.21 | % | | | | 1.41 | % | | | | 2.05 | % | | | | 20.46 | % |
| | | $19.30 | | | | | (9.41 | )% | | | $ | 0.9 | | | | | 1.25 | % | | | | 1.56 | % | | | | 1.58 | % | | | | 1.23 | % | | | | 17.16 | % |
| | | $21.75 | | | | | (5.22 | )% | | | $ | 1.5 | | | | | 1.25 | % | | | | 2.11 | % | | | | 1.56 | % | | | | 1.81 | % | | | | 12.11 | % |
| | | | | | | | | | | | | | | | | | | | | | | | | | | | | | | | | | | | | | | |
| | | $30.01 | | | | | 21.65 | %(4) | | | $ | 0.8 | | | | | 2.00 | %(5) | | | | 0.60 | %(5) | | | | 2.15 | %(5) | | | | 0.45 | %(5) | | | | 9.03 | %(4) |
| | | $25.48 | | | | | 29.35 | % | | | $ | 0.3 | | | | | 2.00 | % | | | | 1.14 | % | | | | 2.18 | % | | | | 0.96 | % | | | | 17.28 | % |
| | | $20.17 | | | | | (18.91 | )% | | | $ | 0.6 | | | | | 2.00 | % | | | | 1.17 | % | | | | 2.17 | % | | | | 1.00 | % | | | | 14.57 | % |
| | | $26.25 | | | | | 41.21 | % | | | $ | 0.9 | | | | | 2.00 | % | | | | 1.50 | % | | | | 1.78 | % | | | | 1.72 | % | | | | 20.46 | % |
| | | $19.16 | | | | | (10.08 | )% | | | $ | 0.7 | | | | | 2.00 | % | | | | 0.84 | % | | | | 2.32 | % | | | | 0.52 | % | | | | 17.16 | % |
| | | $21.60 | | | | | (5.91 | )% | | | $ | 1.2 | | | | | 2.00 | % | | | | 1.37 | % | | | | 2.32 | % | | | | 1.05 | % | | | | 12.11 | % |
| | | | | | | | | | | | | | | | | | | | | | | | | | | | | | | | | | | | | | | |
| | | $30.84 | | | | | 22.28 | %(4) | | | $ | 47.5 | | | | | 1.00 | %(5) | | | | 1.59 | %(5) | | | | 1.12 | %(5) | | | | 1.47 | %(5) | | | | 9.03 | %(4) |
| | | $26.13 | | | | | 30.60 | % | | | $ | 40.6 | | | | | 1.00 | % | | | | 2.11 | % | | | | 1.21 | % | | | | 1.90 | % | | | | 17.28 | % |
| | | $20.66 | | | | | (18.08 | )% | | | $ | 35.2 | | | | | 1.00 | % | | | | 2.18 | % | | | | 1.22 | % | | | | 1.96 | % | | | | 14.57 | % |
| | | $26.78 | | | | | 42.67 | % | | | $ | 45.5 | | | | | 1.00 | % | | | | 2.52 | % | | | | 1.20 | % | | | | 2.32 | % | | | | 20.46 | % |
| | | $19.46 | | | | | (9.18 | )% | | | $ | 28.6 | | | | | 1.00 | % | | | | 1.83 | % | | | | 1.36 | % | | | | 1.47 | % | | | | 17.16 | % |
| | | $21.91 | | | | | (4.98 | )% | | | $ | 33.4 | | | | | 1.00 | % | | | | 2.37 | % | | | | 1.36 | % | | | | 2.00 | % | | | | 12.11 | % |
The accompanying notes to financial statements are an integral part of this statement.
79
Brandes Investment Trust
FINANCIAL HIGHLIGHTS For a capital share outstanding for the period ended:
| | | | | | | | | | | | | | | | | | | | | | | | | | | | | | |
| | | Net asset
value,
beginning
of period | | Net
investment
income(1) | |
Net
realized and
unrealized
gain (loss) on
investments | | Total from
investment
operations | | Dividends
from net
investment
income | | Return of capital |
| | | | | | |
Brandes Emerging Markets Value Fund | | | | | | | | | | | | | | | | | | | | | | | | | | | | | | |
Class A | | | | | | | | | | | | | | | | | | | | | | | | | | | | | | |
3/31/2024 (Unaudited) | | | $ | 7.76 | | | | | 0.03 | | | | | 0.86 | | | | | 0.89 | | | | | (0.07 | ) | | | | — | |
9/30/2023 | | | $ | 5.92 | | | | | 0.16 | | | | | 1.79 | | | | | 1.95 | | | | | (0.11 | ) | | | | — | |
9/30/2022 | | | $ | 8.66 | | | | | 0.28 | | | | | (2.75 | ) | | | | (2.47 | ) | | | | (0.27 | ) | | | | — | (6) |
9/30/2021 | | | $ | 7.04 | | | | | 0.18 | | | | | 1.54 | | | | | 1.72 | | | | | (0.10 | ) | | | | — | |
9/30/2020 | | | $ | 8.57 | | | | | 0.13 | | | | | (1.49 | ) | | | | (1.36 | ) | | | | (0.17 | ) | | | | — | |
9/30/2019 | | | $ | 8.46 | | | | | 0.19 | | | | | 0.07 | | | | | 0.26 | | | | | (0.15 | ) | | | | — | |
Class C | | | | | | | | | | | | | | | | | | | | | | | | | | | | | | |
3/31/2024 (Unaudited) | | | $ | 7.69 | | | | | — | (6) | | | | 0.85 | | | | | 0.85 | | | | | (0.05 | ) | | | | — | |
9/30/2023 | | | $ | 5.86 | | | | | 0.09 | | | | | 1.79 | | | | | 1.88 | | | | | (0.05 | ) | | | | — | |
9/30/2022 | | | $ | 8.59 | | | | | 0.22 | | | | | (2.72 | ) | | | | (2.50 | ) | | | | (0.23 | ) | | | | — | (6) |
9/30/2021 | | | $ | 7.01 | | | | | 0.14 | | | | | 1.55 | | | | | 1.69 | | | | | (0.11 | ) | | | | — | |
9/30/2020 | | | $ | 8.53 | | | | | 0.07 | | | | | (1.48 | ) | | | | (1.41 | ) | | | | (0.11 | ) | | | | — | |
9/30/2019 | | | $ | 8.44 | | | | | 0.13 | | | | | 0.06 | | | | | 0.19 | | | | | (0.10 | ) | | | | — | |
Class I | | | | | | | | | | | | | | | | | | | | | | | | | | | | | | |
3/31/2024 (Unaudited) | | | $ | 7.81 | | | | | 0.04 | | | | | 0.87 | | | | | 0.91 | | | | | (0.07 | ) | | | | — | |
9/30/2023 | | | $ | 5.96 | | | | | 0.18 | | | | | 1.80 | | | | | 1.98 | | | | | (0.13 | ) | | | | — | |
9/30/2022 | | | $ | 8.71 | | | | | 0.24 | | | | | (2.70 | ) | | | | (2.46 | ) | | | | (0.28 | ) | | | | (0.01 | ) |
9/30/2021 | | | $ | 7.07 | | | | | 0.20 | | | | | 1.55 | | | | | 1.75 | | | | | (0.11 | ) | | | | — | |
9/30/2020 | | | $ | 8.62 | | | | | 0.14 | | | | | (1.50 | ) | | | | (1.36 | ) | | | | (0.19 | ) | | | | — | |
9/30/2019 | | | $ | 8.50 | | | | | 0.21 | | | | | 0.08 | | | | | 0.29 | | | | | (0.17 | ) | | | | — | |
Class R6 | | | | | | | | | | | | | | | | | | | | | | | | | | | | | | |
3/31/2024 (Unaudited) | | | $ | 7.87 | | | | | 0.05 | | | | | 0.88 | | | | | 0.93 | | | | | (0.08 | ) | | | | — | |
9/30/2023 | | | $ | 6.00 | | | | | 0.15 | | | | | 1.85 | | | | | 2.00 | | | | | (0.13 | ) | | | | — | |
9/30/2022 | | | $ | 8.76 | | | | | 0.28 | | | | | (2.75 | ) | | | | (2.47 | ) | | | | (0.28 | ) | | | | (0.01 | ) |
9/30/2021 | | | $ | 7.11 | | | | | 0.20 | | | | | 1.56 | | | | | 1.76 | | | | | (0.11 | ) | | | | — | |
9/30/2020 | | | $ | 8.65 | | | | | 0.16 | | | | | (1.51 | ) | | | | (1.35 | ) | | | | (0.19 | ) | | | | — | |
9/30/2019 | | | $ | 8.53 | | | | | 0.23 | | | | | 0.07 | | | | | 0.30 | | | | | (0.18 | ) | | | | — | |
| (1) | Net investment income per share has been calculated based on average shares outstanding during the period. |
| (2) | The total return calculation does not reflect the sales loads that may be imposed on Class A or C shares (see Note 7 of the Notes to Financial Statements). |
| (3) | After fees waived and expenses absorbed or recouped by the Advisor, where applicable. |
| (6) | Amount is less than $0.01 per share. |
The accompanying notes to financial statements are an integral part of this statement.
80
Brandes Investment Trust
FINANCIAL HIGHLIGHTS For a capital share outstanding for the period ended:
| | | | | | | | | | | | | | | | | | | | | | | | | | | | | | | | | | | | | | |
Net asset
value, end
of period | | Total
return(2) | | Net assets,
end of
period
(millions) | | Ratio of
net expenses
to average
net assets(3)
| | Ratio of net
investment
income to
average net assets(3) | | Ratio of
expenses (prior
to reimburse-
ments) to
average
net assets | | Ratio of net
investment
income (prior
to reimburse-
ments) to
average
net assets | | Portfolio
turnover
rate |
| | | | | | | | | | | | | | | | | | | | | | | | | | | | | | | | | | | | | | | |
| | | | | | | | | | | | | | | | | | | | | | | | | | | | | | | | | | | | | | | |
| | $ | 8.58 | | | | | 11.25 | %(4) | | | $ | 154.4 | | | | | 1.34 | %(5) | | | | 0.83 | %(5) | | | | 1.34 | %(5) | | | | 0.83 | %(5) | | | | 8.93 | %(4) |
| | $ | 7.76 | | | | | 33.00 | % | | | $ | 141.6 | | | | | 1.35 | % | | | | 2.16 | % | | | | 1.35 | % | | | | 2.16 | % | | | | 19.23 | % |
| | $ | 5.92 | | | | | (28.99 | )% | | | $ | 137.5 | | | | | 1.33 | % | | | | 2.90 | % | | | | 1.33 | % | | | | 2.90 | % | | | | 23.04 | % |
| | $ | 8.66 | | | | | 24.41 | % | | | $ | 216.2 | | | | | 1.30 | % | | | | 2.02 | % | | | | 1.31 | % | | | | 2.01 | % | | | | 34.97 | % |
| | $ | 7.04 | | | | | (16.10 | )% | | | $ | 174.2 | | | | | 1.33 | % | | | | 1.75 | % | | | | 1.34 | % | | | | 1.74 | % | | | | 34.39 | % |
| | $ | 8.57 | | | | | 3.10 | % | | | $ | 235.9 | | | | | 1.35 | % | | | | 2.23 | % | | | | 1.35 | % | | | | 2.23 | % | | | | 22.09 | % |
| | | | | | | | | | | | | | | | | | | | | | | | | | | | | | | | | | | | | | | |
| | $ | 8.49 | | | | | 10.88 | %(4) | | | $ | 4.5 | | | | | 2.09 | %(5) | | | | 0.07 | %(5) | | | | 2.09 | %(5) | | | | 0.07 | %(5) | | | | 8.93 | %(4) |
| | $ | 7.69 | | | | | 32.05 | % | | | $ | 4.4 | | | | | 2.10 | % | | | | 1.29 | % | | | | 2.10 | % | | | | 1.29 | % | | | | 19.23 | % |
| | $ | 5.86 | | | | | (29.54 | )% | | | $ | 5.1 | | | | | 2.08 | % | | | | 2.14 | % | | | | 2.08 | % | | | | 2.14 | % | | | | 23.04 | % |
| | $ | 8.59 | | | | | 24.01 | % | | | $ | 10.3 | | | | | 1.59 | % | | | | 1.66 | % | | | | 1.60 | % | | | | 1.65 | % | | | | 34.97 | % |
| | $ | 7.01 | | | | | (16.63 | )% | | | $ | 11.1 | | | | | 2.08 | % | | | | 0.90 | % | | | | 2.09 | % | | | | 0.89 | % | | | | 34.39 | % |
| | $ | 8.53 | | | | | 2.27 | % | | | $ | 18.0 | | | | | 2.10 | % | | | | 1.48 | % | | | | 2.10 | % | | | | 1.48 | % | | | | 22.09 | % |
| | | | | | | | | | | | | | | | | | | | | | | | | | | | | | | | | | | | | | | |
| | $ | 8.65 | | | | | 11.35 | %(4) | | | $ | 531.1 | | | | | 1.12 | %(5) | | | | 1.05 | %(5) | | | | 1.14 | %(5) | | | | 1.03 | %(5) | | | | 8.93 | %(4) |
| | $ | 7.81 | | | | | 33.37 | % | | | $ | 520.8 | | | | | 1.12 | % | | | | 2.40 | % | | | | 1.14 | % | | | | 2.38 | % | | | | 19.23 | % |
| | $ | 5.96 | | | | | (28.79 | )% | | | $ | 457.0 | | | | | 1.12 | % | | | | 3.10 | % | | | | 1.14 | % | | | | 3.08 | % | | | | 23.04 | % |
| | $ | 8.71 | | | | | 24.71 | % | | | $ | 1,003.8 | | | | | 1.12 | % | | | | 2.24 | % | | | | 1.11 | % | | | | 2.25 | % | | | | 34.97 | % |
| | $ | 7.07 | | | | | (15.96 | )% | | | $ | 834.8 | | | | | 1.12 | % | | | | 1.88 | % | | | | 1.14 | % | | | | 1.86 | % | | | | 34.39 | % |
| | $ | 8.62 | | | | | 3.41 | % | | | $ | 1,117.7 | | | | | 1.12 | % | | | | 2.46 | % | | | | 1.15 | % | | | | 2.43 | % | | | | 22.09 | % |
| | | | | | | | | | | | | | | | | | | | | | | | | | | | | | | | | | | | | | | |
| | $ | 8.72 | | | | | 11.40 | %(4) | | | $ | 8.5 | | | | | 0.97 | %(5) | | | | 1.16 | %(5) | | | | 1.09 | %(5) | | | | 1.04 | %(5) | | | | 8.93 | %(4) |
| | $ | 7.87 | | | | | 33.54 | % | | | $ | 8.7 | | | | | 0.97 | % | | | | 2.05 | % | | | | 1.10 | % | | | | 1.92 | % | | | | 19.23 | % |
| | $ | 6.00 | | | | | (28.75 | )% | | | $ | 21.0 | | | | | 0.97 | % | | | | 2.95 | % | | | | 1.08 | % | | | | 2.84 | % | | | | 23.04 | % |
| | $ | 8.76 | | | | | 24.74 | % | | | $ | 68.1 | | | | | 0.97 | % | | | | 2.32 | % | | | | 1.06 | % | | | | 2.23 | % | | | | 34.97 | % |
| | $ | 7.11 | | | | | (15.74 | )% | | | $ | 39.1 | | | | | 0.97 | % | | | | 2.07 | % | | | | 1.09 | % | | | | 1.95 | % | | | | 34.39 | % |
| | $ | 8.65 | | | | | 3.45 | % | | | $ | 47.6 | | | | | 0.97 | % | | | | 2.61 | % | | | | 1.10 | % | | | | 2.48 | % | | | | 22.09 | % |
The accompanying notes to financial statements are an integral part of this statement.
81
Brandes Investment Trust
FINANCIAL HIGHLIGHTS For a capital share outstanding for the period ended:
| | | | | | | | | | | | | | | | | | | | | | | | | | | | | | |
| | | Net asset
value,
beginning
of period | | Net
investment
income (loss)(1) | |
Net
realized and
unrealized
gain (loss) on
investments | | Total from
investment
operations | | Dividends
from net
investment
income | | Dividends
from net
realized
gains |
| | | | |
Brandes International Small Cap Equity Fund | | | | | | | | | | | | | | | | | | | | | |
Class A | | | | | | | | | | | | | | | | | | | | | | | | | | | | | | |
3/31/2024(Unaudited) | | | $ | 13.89 | | | | | 0.05 | | | | | 3.13 | | | | | 3.18 | | | | | (0.25 | ) | | | | — | |
9/30/2023 | | | $ | 9.45 | | | | | 0.25 | | | | | 4.41 | | | | | 4.66 | | | | | (0.22 | ) | | | | — | |
9/30/2022 | | | $ | 14.01 | | | | | 0.45 | | | | | (4.27 | ) | | | | (3.82 | ) | | | | (0.74 | ) | | | | — | |
9/30/2021 | | | $ | 9.33 | | | | | 0.14 | | | | | 4.69 | | | | | 4.83 | | | | | (0.15 | ) | | | | — | |
9/30/2020 | | | $ | 10.22 | | | | | 0.07 | | | | | (0.88 | ) | | | | (0.81 | ) | | | | (0.08 | ) | | | | — | |
9/30/2019 | | | $ | 12.10 | | | | | 0.15 | | | | | (1.60 | ) | | | | (1.45 | ) | | | | (0.30 | ) | | | | (0.13 | ) |
Class C | | | | | | | | | | | | | | | | | | | | | | | | | | | | | | |
3/31/2024(Unaudited) | | | $ | 13.36 | | | | | (0.01 | ) | | | | 3.01 | | | | | 3.00 | | | | | (0.25 | ) | | | | — | |
9/30/2023 | | | $ | 9.09 | | | | | 0.13 | | | | | 4.27 | | | | | 4.40 | | | | | (0.13 | ) | | | | — | |
9/30/2022 | | | $ | 13.49 | | | | | 0.33 | | | | | (4.08 | ) | | | | (3.75 | ) | | | | (0.65 | ) | | | | — | |
9/30/2021 | | | $ | 9.03 | | | | | 0.10 | | | | | 4.54 | | | | | 4.64 | | | | | (0.18 | ) | | | | — | |
9/30/2020 | | | $ | 9.94 | | | | | (0.01 | ) | | | | (0.85 | ) | | | | (0.86 | ) | | | | (0.05 | ) | | | | — | |
9/30/2019 | | | $ | 11.81 | | | | | 0.06 | | | | | (1.55 | ) | | | | (1.49 | ) | | | | (0.25 | ) | | | | (0.13 | ) |
Class I | | | | | | | | | | | | | | | | | | | | | | | | | | | | | | |
3/31/2024(Unaudited) | | | $ | 13.97 | | | | | 0.07 | | | | | 3.15 | | | | | 3.22 | | | | | (0.25 | ) | | | | — | |
9/30/2023 | | | $ | 9.50 | | | | | 0.28 | | | | | 4.43 | | | | | 4.71 | | | | | (0.24 | ) | | | | — | |
9/30/2022 | | | $ | 14.09 | | | | | 0.47 | | | | | (4.29 | ) | | | | (3.82 | ) | | | | (0.77 | ) | | | | — | |
9/30/2021 | | | $ | 9.37 | | | | | 0.15 | | | | | 4.73 | | | | | 4.88 | | | | | (0.16 | ) | | | | — | |
9/30/2020 | | | $ | 10.25 | | | | | 0.09 | | | | | (0.88 | ) | | | | (0.79 | ) | | | | (0.09 | ) | | | | — | |
9/30/2019 | | | $ | 12.14 | | | | | 0.17 | | | | | (1.61 | ) | | | | (1.44 | ) | | | | (0.32 | ) | | | | (0.13 | ) |
Class R6 | | | | | | | | | | | | | | | | | | | | | | | | | | | | | | |
3/31/2024(Unaudited) | | | $ | 14.05 | | | | | 0.07 | | | | | 3.17 | | | | | 3.24 | | | | | (0.25 | ) | | | | — | |
9/30/2023 | | | $ | 9.54 | | | | | 0.32 | | | | | 4.44 | | | | | 4.76 | | | | | (0.25 | ) | | | | — | |
9/30/2022 | | | $ | 14.14 | | | | | 0.59 | | | | | (4.40 | ) | | | | (3.81 | ) | | | | (0.79 | ) | | | | — | |
9/30/2021 | | | $ | 9.39 | | | | | 0.17 | | | | | 4.74 | | | | | 4.91 | | | | | (0.16 | ) | | | | — | |
9/30/2020 | | | $ | 10.27 | | | | | 0.07 | | | | | (0.86 | ) | | | | (0.79 | ) | | | | (0.09 | ) | | | | — | |
9/30/2019 | | | $ | 12.15 | | | | | 0.18 | | | | | (1.61 | ) | | | | (1.43 | ) | | | | (0.32 | ) | | | | (0.13 | ) |
| (1) | Net investment income per share has been calculated based on average shares outstanding during the period. |
| (2) | The total return calculation does not reflect the sales loads that may be imposed on Class A or C shares (see Note 7 of the Notes to Financial Statements). |
| (3) | After fees waived and expenses absorbed or recouped by the Advisor, where applicable. |
The accompanying notes to financial statements are an integral part of this statement.
82
Brandes Investment Trust
FINANCIAL HIGHLIGHTS For a capital share outstanding for the period ended:
| | | | | | | | | | | | | | | | | | | | | | | | | | | | | | | | | | | | | | |
Net asset
value, end
of period | | Total
return(2) | | Net assets,
end of
period
(millions) | | Ratio of
net expenses
to average
net assets(3)
| | Ratio of net
investment
income to
average net assets(3) | | Ratio of
expenses (prior
to reimburse-
ments) to
average
net assets | | Ratio of net
investment
income (prior
to reimburse-
ments) to
average
net assets | | Portfolio
turnover
rate |
| | | | | | | | | | | | | | | | | | | | | | | | | | | | | | | | | | | | | | | |
| | | | | | | | | | | | | | | | | | | | | | | | | | | | | | | | | | | | | | | |
| | $ | 16.82 | | | | | 23.07 | %(4) | | | $ | 62.7 | | | | | 1.34 | %(5) | | | | 0.66 | %(5) | | | | 1.34 | %(5) | | | | 0.66 | %(5) | | | | 13.87 | %(4) |
| | $ | 13.89 | | | | | 49.42 | % | | | $ | 48.9 | | | | | 1.36 | % | | | | 1.99 | % | | | | 1.36 | % | | | | 1.99 | % | | | | 32.77 | % |
| | $ | 9.45 | | | | | (28.26 | )% | | | $ | 37.8 | | | | | 1.36 | % | | | | 3.73 | % | | | | 1.36 | % | | | | 3.73 | % | | | | 38.17 | % |
| | $ | 14.01 | | | | | 51.91 | % | | | $ | 68.0 | | | | | 1.32 | % | | | | 1.10 | % | | | | 1.33 | % | | | | 1.09 | % | | | | 26.16 | % |
| | $ | 9.33 | | | | | (7.95 | )% | | | $ | 35.8 | | | | | 1.35 | % | | | | 0.77 | % | | | | 1.36 | % | | | | 0.76 | % | | | | 39.28 | % |
| | $ | 10.22 | | | | | (12.04 | )% | | | $ | 43.5 | | | | | 1.35 | % | | | | 1.34 | % | | | | 1.35 | % | | | | 1.34 | % | | | | 22.52 | % |
| | | | | | | | | | | | | | | | | | | | | | | | | | | | | | | | | | | | | | | |
| | $ | 16.11 | | | | | 22.62 | %(4) | | | $ | 3.8 | | | | | 2.09 | %(5) | | | | (0.11 | )%(5) | | | | 2.09 | %(5) | | | | (0.11 | )%(5) | | | | 13.87 | %(4) |
| | $ | 13.36 | | | | | 48.26 | % | | | $ | 3.0 | | | | | 2.11 | % | | | | 1.05 | % | | | | 2.11 | % | | | | 1.05 | % | | | | 32.77 | % |
| | $ | 9.09 | | | | | (28.71 | )% | | | $ | 3.2 | | | | | 2.11 | % | | | | 2.88 | % | | | | 2.11 | % | | | | 2.88 | % | | | | 38.17 | % |
| | $ | 13.49 | | | | | 51.52 | % | | | $ | 5.3 | | | | | 1.49 | % | | | | 0.86 | % | | | | 1.50 | % | | | | 0.85 | % | | | | 26.16 | % |
| | $ | 9.03 | | | | | (8.64 | )% | | | $ | 4.5 | | | | | 2.11 | % | | | | (0.06 | )% | | | | 2.12 | % | | | | (0.07 | )% | | | | 39.28 | % |
| | $ | 9.94 | | | | | (12.69 | )% | | | $ | 6.9 | | | | | 2.10 | % | | | | 0.59 | % | | | | 2.10 | % | | | | 0.59 | % | | | | 22.52 | % |
| | | | | | | | | | | | | | | | | | | | | | | | | | | | | | | | | | | | | | | |
| | $ | 16.94 | | | | | 23.23 | %(4) | | | $ | 429.5 | | | | | 1.15 | %(5) | | | | 0.90 | %(5) | | | | 1.15 | %(5) | | | | 0.90 | %(5) | | | | 13.87 | %(4) |
| | $ | 13.97 | | | | | 49.62 | % | | | $ | 272.9 | | | | | 1.15 | % | | | | 2.24 | % | | | | 1.16 | % | | | | 2.23 | % | | | | 32.77 | % |
| | $ | 9.50 | | | | | (28.04 | )% | | | $ | 196.2 | | | | | 1.15 | % | | | | 3.85 | % | | | | 1.16 | % | | | | 3.84 | % | | | | 38.17 | % |
| | $ | 14.09 | | | | | 52.15 | % | | | $ | 318.0 | | | | | 1.12 | % | | | | 1.23 | % | | | | 1.13 | % | | | | 1.22 | % | | | | 26.16 | % |
| | $ | 9.37 | | | | | (7.69 | )% | | | $ | 260.8 | | | | | 1.15 | % | | | | 0.93 | % | | | | 1.16 | % | | | | 0.92 | % | | | | 39.28 | % |
| | $ | 10.25 | | | | | (11.93 | )% | | | $ | 414.8 | | | | | 1.15 | % | | | | 1.54 | % | | | | 1.15 | % | | | | 1.54 | % | | | | 22.52 | % |
| | | | | | | | | | | | | | | | | | | | | | | | | | | | | | | | | | | | | | | |
| | $ | 17.04 | | | | | 23.24 | %(4) | | | $ | 0.7 | | | | | 1.00 | %(5) | | | | 0.97 | %(5) | | | | 1.09 | %(5) | | | | 0.88 | %(5) | | | | 13.87 | %(4) |
| | $ | 14.05 | | | | | 50.05 | % | | | $ | 0.5 | | | | | 1.00 | % | | | | 2.51 | % | | | | 1.11 | % | | | | 2.40 | % | | | | 32.77 | % |
| | $ | 9.54 | | | | | (28.00 | )% | | | $ | 0.3 | | | | | 1.00 | % | | | | 4.53 | % | | | | 1.10 | % | | | | 4.43 | % | | | | 38.17 | % |
| | $ | 14.14 | | | | | 52.39 | % | | | $ | 13.5 | | | | | 1.00 | % | | | | 1.37 | % | | | | 1.08 | % | | | | 1.29 | % | | | | 26.16 | % |
| | $ | 9.39 | | | | | (7.72 | )% | | | $ | 10.5 | | | | | 1.00 | % | | | | 0.83 | % | | | | 1.12 | % | | | | 0.71 | % | | | | 39.28 | % |
| | $ | 10.27 | | | | | (11.80 | )% | | | $ | 20.4 | | | | | 1.00 | % | | | | 1.69 | % | | | | 1.10 | % | | | | 1.59 | % | | | | 22.52 | % |
The accompanying notes to financial statements are an integral part of this statement.
83
Brandes Investment Trust
FINANCIAL HIGHLIGHTS For a capital share outstanding for the period ended:
| | | | | | | | | | | | | | | | | | | | | | | | | | | | | | |
| | | | | | |
Net | | | | | | |
| | | Net asset | | | | realized and | | | | Dividends | | Dividends |
| | | value, | | Net | | unrealized | | Total from | | from net | | from net |
| | | beginning | | investment | | gain (loss) on | | investment | | investment | | realized |
| | | of period | | income(1) | | investments | | operations | | income | | gains |
| | | | | | |
Brandes Small Cap Value Fund | | | | | | | | | | | | | | | | | | | | | | | | | | | | | | |
Class A | | | | | | | | | | | | | | | | | | | | | | | | | | | | | | |
3/31/2024 (Unaudited) | | | $ | 13.12 | | | | | 0.03 | | | | | 2.67 | | | | | 2.70 | | | | | (0.11 | ) | | | | (0.27 | ) |
9/30/2023 | | | $ | 10.40 | | | | | 0.12 | | | | | 2.88 | | | | | 3.00 | | | | | (0.27 | ) | | | | (0.01 | ) |
9/30/2022 | | | $ | 13.22 | | | | | 0.20 | | | | | (2.30 | ) | | | | (2.10 | ) | | | | (0.21 | ) | | | | (0.51 | ) |
9/30/2021 | | | $ | 8.52 | | | | | 0.02 | | | | | 4.51 | | | | | 4.53 | | | | | 0.17 | | | | | — | |
9/30/2020 | | | $ | 8.58 | | | | | 0.15 | | | | | (0.16 | ) | | | | (0.01 | ) | | | | (0.05 | ) | | | | — | |
9/30/2019 | | | $ | 10.27 | | | | | 0.05 | | | | | (0.95 | ) | | | | (0.90 | ) | | | | (0.10 | ) | | | | (0.69 | ) |
Class I | | | | | | | | | | | | | | | | | | | | | | | | | | | | | | |
3/31/2024 (Unaudited) | | | $ | 13.30 | | | | | 0.05 | | | | | 2.71 | | | | | 2.76 | | | | | (0.12 | ) | | | | (0.27 | ) |
9/30/2023 | | | $ | 10.52 | | | | | 0.17 | | | | | 2.89 | | | | | 3.06 | | | | | (0.27 | ) | | | | (0.01 | ) |
9/30/2022 | | | $ | 13.34 | | | | | 0.19 | | | | | (2.28 | ) | | | | (2.09 | ) | | | | (0.22 | ) | | | | (0.51 | ) |
9/30/2021 | | | $ | 8.58 | | | | | 0.09 | | | | | 4.50 | | | | | 4.59 | | | | | 0.17 | | | | | — | |
9/30/2020 | | | $ | 8.62 | | | | | 0.14 | | | | | (0.13 | ) | | | | 0.01 | | | | | (0.05 | ) | | | | — | |
9/30/2019 | | | $ | 10.27 | | | | | 0.07 | | | | | (0.92 | ) | | | | (0.85 | ) | | | | (0.11 | ) | | | | (0.69 | ) |
Class R6 | | | | | | | | | | | | | | | | | | | | | | | | | | | | | | |
3/31/2024 (Unaudited) | | | $ | 12.49 | | | | | 0.01 | | | | | 2.58 | | | | | 2.59 | | | | | (0.12 | ) | | | | (0.27 | ) |
9/30/2023 | | | $ | 9.88 | | | | | 0.19 | | | | | 2.70 | | | | | 2.89 | | | | | (0.27 | ) | | | | (0.01 | ) |
9/30/2022 | | | $ | 12.53 | | | | | 0.20 | | | | | (2.13 | ) | | | | (1.93 | ) | | | | (0.21 | ) | | | | (0.51 | ) |
9/30/2021 | | | $ | 8.00 | | | | | 0.18 | | | | | 4.18 | | | | | 4.36 | | | | | 0.17 | | | | | — | |
9/30/2020 | | | $ | 7.97 | | | | | 0.26 | | | | | (0.18 | ) | | | | 0.08 | | | | | (0.05 | ) | | | | — | |
9/30/2019 | | | $ | 10.32 | | | | | 0.09 | | | | | (1.63 | ) | | | | (1.54 | ) | | | | (0.12 | ) | | | | (0.69 | ) |
| (1) | Net investment income per share has been calculated based on average shares outstanding during the period. |
| (2) | The total return calculation does not reflect the sales loads that may be imposed on Class A shares (see Note 7 of the Notes to Financial Statements). |
| (3) | After fees waived and expenses absorbed or recouped by the Advisor, where applicable. |
| (6) | Amount is less than $50,000. |
The accompanying notes to financial statements are an integral part of this statement.
84
Brandes Investment Trust
FINANCIAL HIGHLIGHTS For a capital share outstanding for the period ended:
| | | | | | | | | | | | | | | | | | | | | | | | | | | | | | | | | | | | | | |
Net asset value, end of period | | Total
return(2) | | Net assets,
end of
period
(millions) | | Ratio of
net expenses
to average
net assets(3) | | Ratio of net
investment
income to
average
net assets(3) | | Ratio of
expenses (prior
to reimburse-
ments) to
average
net assets | | Ratio of net
investment
income (prior
to reimburse-
ments) to
average net
assets | | Portfolio
turnover
rate |
| | | | | | | | | | | | | | | | | | | | | | | | | | | | | | | | | | | | | | | |
| | | | | | | | | | | | | | | | | | | | | | | | | | | | | | | | | | | | | | | |
| | $ | 15.44 | | | | | 21.08 | %(4) | | | $ | 6.6 | | | | | 1.15 | %(5) | | | | 0.41 | %(5) | | | | 1.65 | %(5) | | | | (0.09 | )%(5) | | | | 16.05 | %(4) |
| | $ | 13.12 | | | | | 29.02 | % | | | $ | 2.3 | | | | | 1.15 | % | | | | 0.96 | % | | | | 2.70 | % | | | | (0.59 | )% | | | | 30.99 | % |
| | $ | 10.40 | | | | | (16.84 | )% | | | $ | 0.7 | | | | | 1.15 | % | | | | 1.64 | % | | | | 4.66 | % | | | | (1.87 | )% | | | | 160.46 | % |
| | $ | 13.22 | | | | | 57.55 | % | | | $ | 0.5 | | | | | 1.15 | % | | | | 0.19 | % | | | | 5.78 | % | | | | (4.44 | )% | | | | 90.71 | % |
| | $ | 8.52 | | | | | (0.02 | )% | | | $ | — | (6) | | | | 1.15 | % | | | | 1.06 | % | | | | 27.37 | % | | | | (25.16 | )% | | | | 80.65 | % |
| | $ | 8.58 | | | | | (8.53 | )% | | | $ | — | (6) | | | | 1.15 | % | | | | 0.55 | % | | | | 7.18 | % | | | | (5.48 | )% | | | | 54.30 | % |
| | | | | | | | | | | | | | | | | | | | | | | | | | | | | | | | | | | | | | | |
| | $ | 15.67 | | | | | 21.23 | %(4) | | | $ | 26.4 | | | | | 0.90 | %(5) | | | | 0.69 | %(5) | | | | 1.44 | %(5) | | | | 0.15 | %(5) | | | | 16.05 | %(4) |
| | $ | 13.30 | | | | | 29.33 | % | | | $ | 9.4 | | | | | 0.90 | % | | | | 1.36 | % | | | | 2.50 | % | | | | (0.24 | )% | | | | 30.99 | % |
| | $ | 10.52 | | | | | (16.66 | )% | | | $ | 3.1 | | | | | 0.90 | % | | | | 1.50 | % | | | | 4.25 | % | | | | (1.85 | )% | | | | 160.46 | % |
| | $ | 13.34 | | | | | 58.09 | % | | | $ | 1.6 | | | | | 0.90 | % | | | | 0.70 | % | | | | 6.66 | % | | | | (5.06 | )% | | | | 90.71 | % |
| | $ | 8.58 | | | | | 0.10 | % | | | $ | 0.5 | | | | | 0.90 | % | | | | 1.65 | % | | | | 30.12 | % | | | | (27.57 | )% | | | | 80.65 | % |
| | $ | 8.62 | | | | | (8.13 | )% | | | $ | 0.5 | | | | | 0.90 | % | | | | 0.81 | % | | | | 4.18 | % | | | | (2.47 | )% | | | | 54.30 | % |
| | | | | | | | | | | | | | | | | | | | | | | | | | | | | | | | | | | | | | | |
| | $ | 14.69 | | | | | 21.26 | %(4) | | | $ | — | (6) | | | | 0.72 | %(5) | | | | 0.19 | %(5) | | | | 1.55 | %(5) | | | | (0.64 | )%(5) | | | | 16.05 | %(4) |
| | $ | 12.49 | | | | | 29.66 | % | | | $ | 0.1 | | | | | 0.72 | % | | | | 1.63 | % | | | | 2.45 | % | | | | (0.10 | )% | | | | 30.99 | % |
| | $ | 9.88 | | | | | (16.50 | )% | | | $ | 0.1 | | | | | 0.72 | % | | | | 1.86 | % | | | | 3.58 | % | | | | (1.00 | )% | | | | 160.46 | % |
| | $ | 12.53 | | | | | 59.25 | % | | | $ | — | (6) | | | | 0.72 | % | | | | 0.86 | % | | | | 6.62 | % | | | | (5.04 | )% | | | | 90.71 | % |
| | $ | 8.00 | | | | | 1.11 | % | | | $ | — | (6) | | | | 0.72 | % | | | | 0.87 | % | | | | 29.17 | % | | | | (27.58 | )% | | | | 80.65 | % |
| | $ | 7.97 | | | | | (15.36 | )% | | | $ | — | (6) | | | | 0.72 | % | | | | 0.98 | % | | | | 3.16 | % | | | | (1.46 | )% | | | | 54.30 | % |
The accompanying notes to financial statements are an integral part of this statement.
85
Brandes Investment Trust
FINANCIAL HIGHLIGHTS For a capital share outstanding for the period ended:
| | | | | | | | | | | | | | | | | | | | | | | | | | | | | | | | | | | |
| | | | | | | Net | | | | | | | | |
| | | | | | | realized | | | | | | | | |
| | | | | | | and | | | | | | | | |
| | | Net asset | | | | unrealized | | | | Dividends | | | | |
| | | value, | | Net | | gain | | Total from | | from net | | Net asset | | |
| | | beginning | | investment | | (loss) on | | investment | | investment | | value, end | | Total |
| | | of period | | income(1) | | investments | | operations | | income | | of period | | return(2) |
| | | | | | | |
Brandes Core Plus Fixed Income Fund | | | | | | | | | | | | | | | | | | | | | | | | | | | | | | | | | | | |
Class A | | | | | | | | | | | | | | | | | | | | | | | | | | | | | | | | | | | |
3/31/2024 (Unaudited) | | | $ | 7.90 | | | | | 0.15 | | | | | 0.38 | | | | | 0.53 | | | | | (0.15 | ) | | | $ | 8.28 | | | | | 6.84 | %(4) |
9/30/2023 | | | $ | 7.98 | | | | | 0.27 | | | | | (0.08 | ) | | | | 0.19 | | | | | (0.27 | ) | | | $ | 7.90 | | | | | 2.33 | % |
9/30/2022 | | | $ | 9.35 | | | | | 0.20 | | | | | (1.36 | ) | | | | (1.16 | ) | | | | (0.21 | ) | | | $ | 7.98 | | | | | (12.55 | )% |
9/30/2021 | | | $ | 9.52 | | | | | 0.18 | | | | | (0.12 | ) | | | | 0.06 | | | | | (0.23 | ) | | | $ | 9.35 | | | | | 0.67 | % |
9/30/2020 | | | $ | 9.18 | | | | | 0.19 | | | | | 0.34 | | | | | 0.53 | | | | | (0.19 | ) | | | $ | 9.52 | | | | | 5.89 | % |
9/30/2019 | | | $ | 8.85 | | | | | 0.24 | | | | | 0.33 | | | | | 0.57 | | | | | (0.24 | ) | | | $ | 9.18 | | | | | 6.56 | % |
Class I | | | | | | | | | | | | | | | | | | | | | | | | | | | | | | | | | | | |
3/31/2024 (Unaudited) | | | $ | 7.98 | | | | | 0.16 | | | | | 0.38 | | | | | 0.54 | | | | | (0.16 | ) | | | $ | 8.36 | | | | | 6.77 | %(4) |
9/30/2023 | | | $ | 8.06 | | | | | 0.29 | | | | | (0.08 | ) | | | | 0.21 | | | | | (0.29 | ) | | | $ | 7.98 | | | | | 2.55 | % |
9/30/2022 | | | $ | 9.43 | | | | | 0.23 | | | | | (1.37 | ) | | | | (1.14 | ) | | | | (0.23 | ) | | | $ | 8.06 | | | | | (12.25 | )% |
9/30/2021 | | | $ | 9.60 | | | | | 0.21 | | | | | (0.13 | ) | | | | 0.08 | | | | | (0.25 | ) | | | $ | 9.43 | | | | | 0.89 | % |
9/30/2020 | | | $ | 9.26 | | | | | 0.22 | | | | | 0.33 | | | | | 0.55 | | | | | (0.21 | ) | | | $ | 9.60 | | | | | 6.07 | % |
9/30/2019 | | | $ | 8.92 | | | | | 0.26 | | | | | 0.34 | | | | | 0.60 | | | | | (0.26 | ) | | | $ | 9.26 | | | | | 6.85 | % |
Class R6 | | | | | | | | | | | | | | | | | | | | | | | | | | | | | | | | | | | |
3/31/2024 (Unaudited) | | | $ | 7.98 | | | | | 0.16 | | | | | 0.38 | | | | | 0.54 | | | | | (0.16 | ) | | | $ | 8.36 | | | | | 6.79 | %(4) |
9/30/2023 | | | $ | 8.06 | | | | | 0.29 | | | | | (0.06 | ) | | | | 0.23 | | | | | (0.31 | ) | | | $ | 7.98 | | | | | 2.79 | % |
9/30/2022 | | | $ | 9.43 | | | | | 0.33 | | | | | (1.37 | ) | | | | (1.04 | ) | | | | (0.33 | ) | | | $ | 8.06 | | | | | (11.26 | )% |
9/30/2021 | | | $ | 9.60 | | | | | 0.34 | | | | | (0.13 | ) | | | | 0.21 | | | | | (0.38 | ) | | | $ | 9.43 | | | | | 2.23 | % |
9/30/2020 | | | $ | 9.26 | | | | | 0.29 | | | | | 0.34 | | | | | 0.63 | | | | | (0.29 | ) | | | $ | 9.60 | | | | | 6.89 | % |
9/30/2019 | | | $ | 8.93 | | | | | 0.09 | | | | | 0.56 | | | | | 0.65 | | | | | (0.32 | ) | | | $ | 9.26 | | | | | 7.40 | % |
| (1) | Net investment income per share has been calculated based on average shares outstanding during the period. |
| (2) | The total return calculation does not reflect the sales loads that may be imposed on Class A shares (see Note 7 of the Notes to Financial Statements). |
| (3) | After fees waived and expenses absorbed or recouped by the Advisor, where applicable. |
| (6) | As of August 13, 2020, the expense cap for the class changed from 0.70% to 0.50%. |
| (7) | As of August 13, 2020, the expense cap for the class changed from 0.50% to 0.30%. |
| (8) | Amount is less than $50,000. |
| (9) | As of August 13, 2020, the expense cap for the class changed from 0.35% to 0.30%. |
The accompanying notes to financial statements are an integral part of this statement.
86
Brandes Investment Trust
FINANCIAL HIGHLIGHTS For a capital share outstanding for the period ended:
| | | | | | | | | | | | | | | | | | | | | | | | | | | | |
Net assets, end
of period
(millions) | | Ratio of
net expenses
to average
net assets(3) | | Ratio of net
investment
income to
average
net assets(3) | | Ratio of
expenses (prior
to reimburse-
ments) to
average
net assets | | Ratio of net
investment
income (prior
to reimburse-
ments) to
average
net assets | | Portfolio
turnover
rate |
| | | | | |
| | | | | | | | | | | | | | | | | | | | | | | | | | | | | |
| | | | | | | | | | | | | | | | | | | | | | | | | | | | | |
| | $ | 1.2 | | | | | 0.50 | %(5) | | | | 3.67 | %(5) | | | | 0.84 | %(5) | | | | 3.33 | %(5) | | | | 7.44 | %(4) |
| | $ | 1.3 | | | | | 0.50 | % | | | | 3.34 | % | | | | 0.88 | % | | | | 2.96 | % | | | | 15.72 | % |
| | $ | 0.8 | | | | | 0.50 | % | | | | 2.30 | % | | | | 0.86 | % | | | | 1.94 | % | | | | 25.44 | % |
| | $ | 1.0 | | | | | 0.50 | % | | | | 1.95 | % | | | | 0.83 | % | | | | 1.62 | % | | | | 27.13 | % |
| | $ | 1.2 | | | | | 0.68 | %(6) | | | | 2.30 | % | | | | 0.86 | % | | | | 2.12 | % | | | | 20.59 | % |
| | $ | 3.2 | | | | | 0.70 | % | | | | 2.72 | % | | | | 0.93 | % | | | | 2.49 | % | | | | 18.54 | % |
| | | | | | | | | | | | | | | | | | | | | | | | | | | | | |
| | $ | 85.3 | | | | | 0.30 | %(5) | | | | 3.87 | %(5) | | | | 0.48 | %(5) | | | | 3.69 | %(5) | | | | 7.44 | %(4) |
| | $ | 65.4 | | | | | 0.30 | % | | | | 3.53 | % | | | | 0.66 | % | | | | 3.17 | % | | | | 15.72 | % |
| | $ | 60.0 | | | | | 0.30 | % | | | | 2.59 | % | | | | 0.66 | % | | | | 2.23 | % | | | | 25.44 | % |
| | $ | 78.1 | | | | | 0.30 | % | | | | 2.23 | % | | | | 0.63 | % | | | | 1.90 | % | | | | 27.13 | % |
| | $ | 85.6 | | | | | 0.48 | %(7) | | | | 2.41 | % | | | | 0.65 | % | | | | 2.24 | % | | | | 20.59 | % |
| | $ | 83.4 | | | | | 0.50 | % | | | | 2.91 | % | | | | 0.73 | % | | | | 2.68 | % | | | | 18.54 | % |
| | | | | | | | | | | | | | | | | | | | | | | | | | | | | |
| | $ | 9.6 | | | | | 0.30 | %(5) | | | | 3.88 | %(5) | | | | 0.58 | %(5) | | | | 3.60 | %(5) | | | | 7.44 | %(4) |
| | $ | — | (8) | | | | 0.30 | % | | | | 3.55 | % | | | | 0.64 | % | | | | 3.21 | % | | | | 15.72 | % |
| | $ | — | (8) | | | | 0.30 | % | | | | 3.73 | % | | | | 0.30 | % | | | | 3.73 | % | | | | 25.44 | % |
| | $ | — | (8) | | | | 0.30 | % | | | | 3.54 | % | | | | 0.30 | % | | | | 3.54 | % | | | | 27.13 | % |
| | $ | — | (8) | | | | 0.30 | %(9) | | | | 3.19 | % | | | | 0.30 | % | | | | 3.19 | % | | | | 20.59 | % |
| | $ | — | (8) | | | | 0.35 | % | | | | 0.97 | % | | | | 0.35 | % | | | | 0.97 | % | | | | 18.54 | % |
The accompanying notes to financial statements are an integral part of this statement.
87
Brandes Investment Trust
NOTES TO FINANCIAL STATEMENTS
NOTE 1 – ORGANIZATION
The Brandes International Equity Fund (the “International Fund”), the Brandes Global Equity Fund (the “Global Fund”), the Brandes Emerging Markets Value Fund (the “Emerging Markets Fund”), the Brandes International Small Cap Equity Fund (the “International Small Cap Fund”), the Brandes Small Cap Value Fund (the “Small Cap Value Fund”), and the Brandes Core Plus Fixed Income Fund (the “Core Plus Fund”) (each a “Fund” and collectively the “Funds”) are series of Brandes Investment Trust (the “Trust”). The Trust is registered under the Investment Company Act of 1940, as amended (the “1940 Act”), as a diversified, open-end management investment company.
The International Fund, Global Fund, Emerging Markets Fund, International Small Cap Fund, Small Cap Value Fund and Core Plus Fund began operations on January 2, 1997, October 6, 2008, January 31, 2011, February 1, 2012, January 2, 2018 and December 28, 2007, respectively. Prior to January 31, 2011 for the Emerging Markets Fund, February 1, 2012 for the International Small Cap and January 2, 2018 for the Small Cap Value Fund, these Funds’ portfolios were managed as private investment funds with investment objectives, investment policies and strategies that were, in all material respects, equivalent to those of the Emerging Markets Fund, International Small Cap Fund and Small Cap Value Fund, respectively.
The International Fund, Emerging Markets Fund and International Small Cap Fund have four classes of shares: Class A, Class C, Class I and Class R6. The Global Fund has three classes of shares: Class A, Class C and Class I. The Small Cap Value Fund and Core Plus Fund have three classes of shares: Class A, Class I and Class R6.
The International Fund and Global Fund invest their assets primarily in equity securities of issuers with market capitalizations greater than $5 billion. The International, International Small Cap and Emerging Markets Funds invest their assets in securities of foreign companies, while the Global Fund invests its assets in securities of foreign and domestic companies. The Small Cap Value Fund invests primarily in U.S. equity securities of issuers with market capitalizations $5 billion or less. The Core Plus Fund invests predominantly in debt securities issued by U.S. and foreign companies and debt obligations issued or guaranteed by the U.S. Government and foreign governments and their agencies and instrumentalities.
NOTE 2 – SIGNIFICANT ACCOUNTING POLICIES
Each Fund is an investment company that applies the accounting and reporting guidance issued in Topic 946, “Financial Services-Investment Companies”, by the Financial Accounting Standards Board (“FASB”). The following is a summary of
88
Brandes Investment Trust
NOTES TO FINANCIAL STATEMENTS — (continued)
significant accounting policies consistently followed by the Funds. These policies are in conformity with generally accepted accounting principles (“GAAP”) in the United States of America.
| | A. | Repurchase Agreements. Each Fund may enter into repurchase agreements with government securities dealers recognized by the Federal Reserve Board, with member banks of the Federal Reserve System or with other brokers or dealers that meet the credit guidelines established by the Board of Trustees. Each Fund will always receive and maintain, as collateral, U.S. Government securities whose market value, including accrued interest (which is recorded in the Schedules of Investments), will be at least equal to 100% of the dollar amount invested by the Fund in each agreement, and the Fund will make payment for such securities only upon physical delivery or upon evidence of book entry transfer to the account of the Fund’s custodian. If the term of any repurchase transaction exceeds one business day, the value of the collateral is marked-to-market on a daily basis to ensure the adequacy of the collateral. Before causing a Fund to enter into a repurchase agreement with any other party, the investment advisor will determine that such party does not have any apparent risk of becoming involved in bankruptcy proceedings within the time frame contemplated by the repurchase agreement. If the seller defaults and the value of the collateral declines, or if bankruptcy proceedings are commenced with respect to the seller of the security, realization of the collateral by the Fund may be delayed or limited. At March 31, 2024, the Funds did not invest in repurchase agreements. |
| | B. | Foreign Currency Translation and Transactions. Values of investments denominated in foreign currencies are converted into U.S. dollars using the spot market rates of exchange at the time of valuation. Purchases and sales of investments and dividend and interest income are translated into U.S. dollars using the spot market rates of exchange prevailing on the respective dates of such translations. The gain or loss resulting from changes in foreign exchange rates is included with net realized and unrealized gain or loss from investments, as appropriate. Foreign securities and currency transactions may involve certain considerations and risks not typically associated with those of domestic origin. |
Foreign securities are recorded in the financial statements after translation to U.S. dollars based on the applicable exchange rate at the end of the period. The Funds report certain foreign currency-related transactions as components of realized gains or losses for financial reporting purposes, whereas such components are treated as ordinary income for federal income tax purposes.
| | C. | Delayed Delivery Securities. The Funds may purchase securities on a when issued or delayed delivery basis. “When-issued” or delayed delivery refers to |
89
Brandes Investment Trust
NOTES TO FINANCIAL STATEMENTS — (continued)
| | securities whose terms are available and for which a market exists, but that have not been issued. For a when-issued or delayed delivery transaction, no payment is made until delivery date, which is typically longer than the normal course of settlement. When a Fund enters into an agreement to purchase securities on a when-issued or delayed delivery basis, the Fund segregates cash or liquid securities, of any type or maturity, equal in value to the Fund’s commitment. Losses may arise if the market value of the underlying securities changes, if the counterparty does not perform under the contract, or if the issuer does not issue the securities due to political, economic, or other factors. The Funds did not have any open commitments on delayed delivery securities as of March 31, 2024. |
| | D. | Zero Coupon Bonds. The Funds may invest without limit in so-called zero coupon bonds. Zero coupon bonds are issued at a significant discount from their principal amount in lieu of paying interest periodically. Because zero coupon bonds do not pay current interest in cash, their value is subject to greater fluctuation in response to changes in market interest rates than bonds that pay interest currently. Zero coupon bonds allow an issuer to avoid the need to generate cash to meet current interest payments. Accordingly, such bonds may involve greater credit risks than bonds paying interest currently in cash. A Fund is required to accrue interest income on such investments and to distribute such amounts at least annually to shareholders even though the investments do not make any current interest payments. The daily market quotations of the original bonds may include the accrued interest (referred to as a dirty price) and require a pro rata adjustment, if any, from the unrealized appreciation (depreciation) on investments to interest receivable on the Statements of Assets and Liabilities. |
| | E. | Participatory Notes. The International, Global, Emerging Markets, International Small Cap and Small Cap Value Funds may invest in participatory notes. Participatory notes are derivative securities which are designed to provide synthetic exposure to one or more underlying securities, subject to the credit risk of the issuing financial institution. |
Investments in participatory notes involve risks normally associated with a direct investment in the underlying securities. In addition, participatory notes are subject to counterparty risk, which is the risk that the broker-dealer or bank that issues the notes will not fulfill its contractual obligation to complete the transaction with the Trust. Participatory notes constitute general unsecured, unsubordinated contractual obligations of the banks or broker-dealers that issue them and generally are issued as an actual note from the financial intermediary or an equity linked warrant (commonly known as a low exercise price option). The Trust is relying on the creditworthiness of such banks or broker-dealers and has no rights under a participatory note against
90
Brandes Investment Trust
NOTES TO FINANCIAL STATEMENTS — (continued)
the issuer of the securities underlying such participatory note. The investment advisor has established guidelines for monitoring participatory note exposure for the Funds. Prior to investment in a participatory note, the investment advisor will complete an analysis of the prospective counterparties and once purchased, will continue to monitor creditworthiness on a quarterly basis. The investment advisor requires a minimum credit rating for such counterparties (as determined by rating agencies such as Moody’s, Fitch and S&P) of A.
The Funds record counterparty credit risk valuation adjustments, if material, on the participatory notes in order to appropriately reflect the credit quality of the counterparty.
The International, Global, Emerging Markets, International Small Cap and Small Cap Value Funds did not invest in any participatory notes at March 31, 2024.
| | F. | Investment Transactions, Dividends and Distributions. Investment transactions are accounted for on the trade dates. Realized gains and losses are evaluated on the basis of identified cost. Dividend income and distributions to shareholders are recorded on the ex-dividend dates. Interest is recorded on an accrual basis. Other non-cash dividends are recognized as investment income at the fair value of the investment received. Withholding taxes on foreign dividends and capital gains, which are included as a component of net investment income and realized gain (loss) on investments, respectively, have been provided for in accordance with the Trust’s understanding of the applicable country’s tax rules and rates. Each Fund’s investment income, expenses, other than class specific expenses, and realized and unrealized gains and losses are allocated daily to each class of the Fund’s shares based upon the relative net asset values of outstanding shares of each class of shares at the beginning of the day (after adjusting for the current capital shares activity of the respective class). Expenses common to the Funds’ portfolios are allocated among the Funds based upon their relative net asset values or other appropriate allocation methods. The Funds amortize premiums and accrete discounts using the constant yield method. |
| | G. | Concentration of Risk. As of March 31, 2024, the International, Global, Emerging Markets and International Small Cap Funds held significant portions of their assets in foreign securities. Certain price and foreign exchange fluctuations as well as economic and political situations in the foreign jurisdictions could have an impact on the International, Global, Emerging Markets and International Small Cap Funds’ net assets. The investment advisor monitors these off-balance sheet risks. |
| | H. | Use of Estimates. The preparation of financial statements in conformity with GAAP requires management to make estimates and assumptions that affect |
91
Brandes Investment Trust
NOTES TO FINANCIAL STATEMENTS — (continued)
| | the reported amounts of assets and liabilities at the date of the financial statements and reported amounts of income and expenses during the reporting period. Actual results could differ from those estimates and assumptions. |
| | I. | Securities Lending. The Funds may lend their portfolio securities to banks, brokers and dealers. Lending Fund securities exposes the Fund to risks such as the following: (i) the borrower may fail to return the loaned securities, (ii) the borrower may not be able to provide additional collateral, or (iii) the Funds may experience delays in recovery of the loaned securities or loss of rights in the collateral if the borrower fails financially. |
To minimize these risks, the borrower must agree to maintain collateral with the Fund’s custodian, marked to market daily, in the form of U.S. Government obligations, in an amount at least equal to 102% (105% in the case of loans of foreign securities not denominated in U.S. dollars) of the market value of the loaned securities. As of March 31, 2024, the Emerging Markets Fund, Small Cap Value Fund and Core Plus Fund did not have any securities on loan. The International Fund, Global Fund and International Small Cap Fund had securities on loan as of March 31, 2024. The market values of securities loaned are $4,328,287, $1,509 and $7,263,845 and received non-cash collateral for the loans in the amounts of $4,584,539, $1,617 and $7,659,316. Non-cash collateral received by a Fund may not be sold or re-pledged except to satisfy a borrower default. Therefore, non-cash collateral is not included on the Funds’ Schedules of Investments or Statements of Assets and Liabilities.
| | J. | Indemnification Obligations. Under the Trust’s organizational documents, its current and former officers and trustees are indemnified against certain liabilities arising out of the performance of their duties to the Trust. The Trust has indemnified its trustees against any expenses actually and reasonably incurred by the trustees in any proceeding arising out of or in connection with the trustees’ service to the Trust. In addition, in the normal course of business, the Trust enters into contracts that contain a variety of representations and warranties and provide general indemnifications. The Funds’ maximum exposure under these arrangements is unknown as this would involve future claims that may be made against the Funds that have not yet occurred or that would be covered by other parties. |
| | K. | Accounting for Uncertainty in Income Taxes. Each Fund has elected to be taxed as a “regulated investment company” and intends to distribute substantially all its taxable income to its shareholders and otherwise comply with the provisions of the Internal Revenue Code applicable to regulated investment companies. The Funds may be subject to a nondeductible excise tax calculated as a percentage of certain undistributed amounts of net |
92
Brandes Investment Trust
NOTES TO FINANCIAL STATEMENTS — (continued)
| | investment income and net capital gains. The Funds intend to distribute their net investment income and capital gains as necessary to avoid this excise tax. Therefore, no provision for federal income taxes or excise taxes has been made. |
The Trust analyzes all open tax years, as defined by the applicable statute of limitations, for all major jurisdictions. Open tax years for the Funds are those that are open for exam by taxing authorities (2020 through 2023). As of March 31, 2024 the Trust has no examinations in progress.
Management has analyzed the Trust’s tax positions, and has concluded that no liability should be recorded related to uncertain tax positions expected to be taken on the tax return for the fiscal year ended September 30, 2023.
The Trust identifies its major tax jurisdictions as the U.S. Government and the State of California. The Funds are not aware of any tax positions for which it is reasonably possible that the total amounts of unrecognized tax benefits will significantly change in the next twelve months.
| | L. | Fair Value Measurements. The Trust has adopted GAAP accounting principles related to fair value accounting standards which establish a definition of fair value and set out a hierarchy for measuring fair value. These standards require additional disclosures about the various inputs and valuation techniques used to develop the measurements of fair value and a discussion of changes in valuation techniques and related inputs during the period. These inputs are summarized in the three broad levels listed below: |
Level 1—Fair value measurement within Level 1 should be based on an unadjusted quoted price in an active market that the Funds have the ability to access for the asset or liability at the measurement date. Because a quoted price alone forms the basis for the measurement, the access requirement within Level 1 limits discretion in pricing the asset or liability, including in situations in which there are multiple markets for the asset or liability with different prices and no single market represents a principal market for the asset or liability. Importantly, the FASB has indicated that when a quoted price in an active market for a security is available, that price should be used to measure fair value without regard to an entity’s intent to transact at that price.
Level 2—Fair value measurement within Level 2 should be based on all inputs other than unadjusted quoted prices included within Level 1 that are observable for the asset or liability. Other significant observable market inputs include quoted prices for similar instruments in active markets, quoted adjusted prices in active markets, quoted prices for identical or similar
93
Brandes Investment Trust
NOTES TO FINANCIAL STATEMENTS — (continued)
instruments in markets that are not active, and model derived valuations in which the majority of significant inputs and significant value drivers are observable in active markets.
Level 3—Fair value measurement within Level 3 should be based on unobservable inputs in such cases where markets do not exist or are illiquid. Significant unobservable inputs include model derived valuations in which the majority of significant inputs or significant value drivers are unobservable. Unobservable inputs are those inputs that reflect the Fund’s own assumptions that market participants would use to price the asset or liability based on the best available information.
| | M. | Security Valuation. Common and preferred stocks, exchange-traded funds and financial derivative instruments, such as futures contracts and options contracts that are traded on a national securities or commodities exchange, are valued at the last reported sales price at the close of regular trading on each day the exchange is open for trading, in the case of common stocks and exchange-traded funds, or, in the case of futures contracts or options contracts, the settlement price determined by the relevant exchange. Securities listed on the NASDAQ National Market System for which market quotations are readily available are valued using the NASDAQ Official Closing Price. To the extent these securities are actively traded and valuation adjustments are not applied, they are categorized as Level 1 of the fair value hierarchy. |
Equity securities traded on an exchange for which there have been no sales on the valuation date are generally valued at the mean between last bid and ask price on such day and are categorized as Level 2 of the fair value hierarchy, or are fair valued by the Advisor.
Investments in registered open-end management investment companies are valued based upon the Net Asset Values (“NAVs”) of such investments and are categorized as Level 1 of the fair value hierarchy.
Valuation adjustments may be applied to certain common and preferred stocks that are solely traded on a foreign exchange to account for the market movement between the close of the foreign market and the close of the New York Stock Exchange (“NYSE”). These securities are generally valued using pricing service providers that consider the correlation of the trading patterns of the foreign securities to the intraday trading in the U.S. markets for investments. Securities using these valuation adjustments are categorized as Level 2 of the fair value hierarchy. As of March 31, 2024, the International Fund, Global Fund, Emerging Markets Fund and International Small Cap Fund had securities with market values of $308,184,501,
94
Brandes Investment Trust
NOTES TO FINANCIAL STATEMENTS — (continued)
$10,347,714, $180,727,394 and $113,187,258 that represent 38.11%, 20.70%, 25.87% and 22.79% of each Fund’s net assets, respectively, that were fair valued using these valuation adjustments.
Fixed income securities (other than repurchase agreements and demand notes) including corporate, convertible and municipal bonds and notes, U.S. government agencies, U.S. Treasury obligations, sovereign issues, bank loans, convertible preferred securities, fixed income securities purchased on a delayed delivery basis and non-U.S. bonds are normally valued on the basis of quotes obtained from brokers and dealers or independent pricing services or sources. Independent pricing services typically use information provided by market makers or estimates of market values obtained from yield data relating to investments or securities with similar characteristics. The service providers’ internal models use inputs that are observable such as, among other things, issuer details, interest rates, yield curves, prepayment speeds, credit risks/ spreads, default rates and quoted prices for similar assets. Securities that use similar valuation techniques and inputs as described above are categorized as Level 2 of the fair value hierarchy.
Rights that are traded on a national securities exchange are valued at the last reported sales price at the close of regular trading on each day the exchange is open. A right is a privilege offered by a corporation to its shareholders pro rata to subscribe to a certain security at a specified price, often for a short period. Rights may or may not be transferable. Rights that use such valuation techniques and inputs are categorized as Level 2 of the fair value hierarchy.
Mortgage and asset-backed securities are usually issued as separate tranches, or classes, of securities within each package of underlying securities. These securities are also normally valued by pricing service providers that use broker-dealer quotations or valuation estimates from their internal pricing models. The pricing models for these securities usually consider tranche level attributes, estimated cash flows and market based yield spreads for each tranche, and current market data and incorporate packaged collateral performance, as available. Mortgage and asset-backed securities that use such valuation techniques and inputs are categorized as Level 2 of the fair value hierarchy.
Repurchase agreements and demand notes, for which neither vendor pricing nor market maker prices are available, are valued at amortized cost on the day of valuation, unless Brandes Investment Partners, L.P. (the “Advisor”) determines that the use of amortized cost valuation on such day is not appropriate (in which case such instrument is fair valued in accordance with the fair value procedures of the Trust). Repurchase agreements and demand notes that use such valuation techniques and inputs are categorized as Level 2 of the fair value hierarchy.
95
Brandes Investment Trust
NOTES TO FINANCIAL STATEMENTS — (continued)
The Board of Trustees has designated the Advisor as the valuation designee pursuant to Rule 2a-5 under the 1940 Act to perform fair value determinations relating to any or all Fund investments. Certain securities may be fair valued in accordance with the fair valuation procedures approved by the Board of Trustees. The Advisor is generally responsible for overseeing the day-to-day valuation processes and the Board of Trustees oversees the Advisor in its role as valuation designee in accordance with the requirements of Rule 2a-5 under the 1940 Act. The Advisor is authorized to make all necessary determinations of the fair value of portfolio securities and other assets for which market quotations are not readily available or if it is deemed that the prices obtained from brokers and dealers or independent pricing services are unreliable. The securities fair valued by the Advisor are indicated in the Schedules of Investments and are categorized as Level 2 or Level 3 of the fair value hierarchy. Certain vendor priced securities may also be considered Level 3 if significant unobservable inputs are used by the vendors.
In using fair value pricing, each Fund attempts to establish the price that it might reasonably have expected to receive upon a sale of the security at 4:00 p.m. Eastern time. Valuing securities at fair value involves greater reliance on judgment than valuation of securities based on readily available market quotations. A Fund using fair value to price securities may value those securities higher or lower than another fund using market quotations or fair value to price the same securities. Further, there can be no assurance that the Fund could obtain the fair value assigned to a security if it were to sell the security at approximately the time at which the Fund determines its net asset value.
96
Brandes Investment Trust
NOTES TO FINANCIAL STATEMENTS — (continued)
The following is a summary of the level inputs used, as of March 31, 2024, involving the Funds’ assets carried at fair value. The inputs used for valuing securities may not be an indication of the risk associated with investing in those securities.
| | | | | | | | | | | | | | | | |
Description | | Level 1 | | | Level 2 | | | Level 3 | | | Total | |
| | | | |
Investments in Securities | | | | | | | | | | | | | | | | |
International Fund | | | | | | | | | | | | | | | | |
Common Stocks | | | | | | | | | | | | | | | | |
Communication Services | | $ | 21,518,519 | | | $ | 41,199,267 | | | $ | — | | | $ | 62,717,786 | |
Consumer Discretionary | | | 68,089,386 | | | | 30,154,262 | | | | — | | | | 98,243,648 | |
Consumer Staples | | | 77,738,337 | | | | 67,781,297 | | | | — | | | | 145,519,634 | |
Energy | | | — | | | | 31,287,080 | | | | — | | | | 31,287,080 | |
Financials | | | 94,085,761 | | | | 24,064,759 | | | | — | | | | 118,150,520 | |
Health Care | | | 78,709,463 | | | | 44,000,291 | | | | — | | | | 122,709,754 | |
Industrials | | | 63,549,013 | | | | 7,500,117 | | | | — | | | | 71,049,130 | |
Materials | | | 10,320,630 | | | | 32,561,074 | | | | — | | | | 42,881,704 | |
Real Estate | | | — | | | | 10,200,267 | | | | — | | | | 10,200,267 | |
Technology | | | 46,804,582 | | | | — | | | | — | | | | 46,804,582 | |
Utilities | | | — | | | | 10,181,584 | | | | — | | | | 10,181,584 | |
| | | | | | | | | | | | | | | | |
| | | | |
Total Common Stocks | | | 460,815,691 | | | | 298,929,998 | | | | — | | | | 759,745,689 | |
| | | | | | | | | | | | | | | | |
| | | | |
Preferred Stocks | | | | | | | | | | | | | | | | |
Energy | | | 15,136,484 | | | | — | | | | — | | | | 15,136,484 | |
Health Care | | | — | | | | 9,254,503 | | | | — | | | | 9,254,503 | |
| | | | | | | | | | | | | | | | |
| | | | |
Total Preferred Stocks | | | 15,136,484 | | | | 9,254,503 | | | | — | | | | 24,390,987 | |
| | | | | | | | | | | | | | | | |
| | | | |
Short-Term Investments | | | 23,304,164 | | | | — | | | | — | | | | 23,304,164 | |
| | | | | | | | | | | | | | | | |
| | | | |
Total Investments in Securities | | $ | 499,256,339 | | | $ | 308,184,501 | | | $ | — | | | $ | 807,440,840 | |
| | | | | | | | | | | | | | | | |
| | | | |
Global Fund | | | | | | | | | | | | | | | | |
Common Stocks | | | | | | | | | | | | | | | | |
Communication Services | | $ | 2,552,753 | | | $ | 550,309 | | | $ | — | | | $ | 3,103,062 | |
Consumer Discretionary | | | 4,003,975 | | | | 1,043,585 | | | | — | | | | 5,047,560 | |
Consumer Staples | | | 1,960,046 | | | | 1,100,624 | | | | — | | | | 3,060,670 | |
Energy | | | 1,696,348 | | | | 1,838,969 | | | | — | | | | 3,535,317 | |
Financials | | | 9,473,857 | | | | 2,000,802 | | | | — | | | | 11,474,659 | |
Health Care | | | 7,391,025 | | | | 1,724,459 | | | | — | | | | 9,115,484 | |
Industrials | | | 5,335,661 | | | | — | | | | — | | | | 5,335,661 | |
Materials | | | 837,772 | | | | 1,928,285 | | | | — | | | | 2,766,057 | |
Real Estate | | | — | | | | 522,953 | | | | — | | | | 522,953 | |
Technology | | | 4,715,149 | | | | — | | | | — | | | | 4,715,149 | |
| | | | | | | | | | | | | | | | |
| | | | |
Total Common Stocks | | | 37,966,586 | | | | 10,709,986 | | | | — | | | | 48,676,572 | |
| | | | | | | | | | | | | | | | |
| | | | |
Preferred Stocks | | | | | | | | | | | | | | | | |
Health Care | | | 295,690 | | | | — | | | | — | | | | 295,690 | |
Technology | | | 30,155 | | | | — | | | | — | | | | 30,155 | |
| | | | | | | | | | | | | | | | |
| | | | |
Total Preferred Stocks | | | 325,845 | | | | — | | | | — | | | | 325,845 | |
| | | | | | | | | | | | | | | | |
| | | | |
Short-Term Investments | | | 518,180 | | | | — | | | | — | | | | 518,180 | |
| | | | | | | | | | | | | | | | |
| | | | |
Total Investments in Securities | | $ | 38,810,611 | | | $ | 10,709,986 | | | $ | — | | | $ | 49,520,597 | |
| | | | | | | | | | | | | | | | |
97
Brandes Investment Trust
NOTES TO FINANCIAL STATEMENTS — (continued)
| | | | | | | | | | | | | | | | |
Description | | Level 1 | | | Level 2 | | | Level 3 | | | Total | |
| | | | |
Emerging Markets Fund | | | | | | | | | | | | | | | | |
Common Stocks | | | | | | | | | | | | | | | | |
Communication Services | | $ | 22,693,608 | | | $ | 35,279,193 | | | $ | — | | | $ | 57,972,801 | |
Consumer Discretionary | | | 60,503,301 | | | | 41,719,737 | | | | — | | | | 102,223,038 | |
Consumer Staples | | | 41,015,559 | | | | 21,604,188 | | | | — | | | | 62,619,747 | |
Energy | | | — | | | | — | | | | — | | | | — | |
Financials | | | 113,323,743 | | | | 51,749,131 | | | | — | | | | 165,072,874 | |
Health Care | | | — | | | | 7,177,619 | | | | — | | | | 7,177,619 | |
Industrials | | | 74,621,231 | | | | — | | | | — | | | | 74,621,231 | |
Materials | | | 16,487,252 | | | | — | | | | — | | | | 16,487,252 | |
Real Estate | | | — | | | | 25,653,421 | | | | — | | | | 25,653,421 | |
Technology | | | 126,656,236 | | | | 8,511,731 | | | | — | | | | 135,167,967 | |
Utilities | | | 17,833,803 | | | | 4,791,402 | | | | — | | | | 22,625,205 | |
| | | | | | | | | | | | | | | | |
| | | | |
Total Common Stocks | | | 473,134,733 | | | | 196,486,422 | | | | — | | | | 669,621,155 | |
| | | | | | | | | | | | | | | | |
| | | | |
Preferred Stocks | | | | | | | | | | | | | | | | |
Energy | | | 18,131,004 | | | | — | | | | — | | | | 18,131,004 | |
Short-Term Investments | | | 9,146,737 | | | | — | | | | — | | | | 9,146,737 | |
| | | | | | | | | | | | | | | | |
| | | | |
Total Investments in Securities | | $ | 500,412,474 | | | $ | 196,486,422 | | | $ | — | | | $ | 696,898,896 | |
| | | | | | | | | | | | | | | | |
| | | | |
International Small Cap Fund | | | | | | | | | | | | | | | | |
Common Stocks | | | | | | | | | | | | | | | | |
Communication Services | | $ | 26,396,265 | | | $ | 15,019,189 | | | $ | — | | | $ | 41,415,454 | |
Consumer Discretionary | | | 17,081,022 | | | | 15,409,407 | | | | — | | | | 32,490,429 | |
Consumer Staples | | | 68,329,986 | | | | 9,816,407 | | | | — | | | | 78,146,393 | |
Energy | | | 2,009,559 | | | | — | | | | — | | | | 2,009,559 | |
Financials | | | 49,385,132 | | | | 27,918,806 | | | | — | | | | 77,303,938 | |
Health Care | | | 31,646,277 | | | | 6,205,122 | | | | — | | | | 37,851,399 | |
Industrials | | | 108,484,797 | | | | 27,409,542 | | | | — | | | | 135,894,339 | |
Materials | | | 14,504,208 | | | | 7,542,724 | | | | — | | | | 22,046,932 | |
Real Estate | | | 16,829,620 | | | | 5,281,462 | | | | — | | | | 22,111,082 | |
Technology | | | 15,323,915 | | | | — | | | | — | | | | 15,323,915 | |
Utilities | | | 8,474,940 | | | | — | | | | — | | | | 8,474,940 | |
| | | | | | | | | | | | | | | | |
| | | | |
Total Common Stocks | | | 358,465,721 | | | | 114,602,659 | | | | — | | | | 473,068,380 | |
| | | | | | | | | | | | | | | | |
| | | | |
Preferred Stocks | | | | | | | | | | | | | | | | |
Health Care | | | 9,629,935 | | | | 8,438,727 | | | | — | | | | 18,068,662 | |
Short-Term Investments | | | 2,200,752 | | | | — | | | | — | | | | 2,200,752 | |
| | | | | | | | | | | | | | | | |
| | | | |
Total Investments in Securities | | $ | 370,296,408 | | | $ | 123,041,386 | | | $ | — | | | $ | 493,337,794 | |
| | | | | | | | | | | | | | | | |
98
Brandes Investment Trust
NOTES TO FINANCIAL STATEMENTS — (continued)
| | | | | | | | | | | | | | | | |
Description | | Level 1 | | | Level 2 | | | Level 3 | | | Total | |
| | | | |
Small Cap Value Fund | | | | | | | | | | | | | | | | |
Common Stocks | | | | | | | | | | | | | | | | |
Consumer Discretionary | | $ | 1,624,500 | | | $ | — | | | $ | — | | | $ | 1,624,500 | |
Consumer Staples | | | 2,084,863 | | | | — | | | | — | | | | 2,084,863 | |
Energy | | | 2,875,435 | | | | — | | | | — | | | | 2,875,435 | |
Financials | | | 2,176,993 | | | | — | | | | — | | | | 2,176,993 | |
Health Care | | | 5,095,799 | | | | — | | | | 1,871 | | | | 5,097,670 | |
Industrials | | | 12,180,188 | | | | — | | | | — | | | | 12,180,188 | |
Materials | | | 604,776 | | | | 566,365 | | | | — | | | | 1,171,141 | |
Real Estate | | | 644,752 | | | | — | | | | — | | | | 644,752 | |
Technology | | | 3,695,202 | | | | — | | | | — | | | | 3,695,202 | |
Utilities | | | 831,734 | | | | — | | | | — | | | | 831,734 | |
| | | | | | | | | | | | | | | | |
| | | | |
Total Common Stocks | | | 31,814,242 | | | | 566,365 | | | | 1,871 | | | | 32,382,478 | |
| | | | | | | | | | | | | | | | |
| | | | |
Investment Companies | | | | | | | | | | | | | | | | |
Financials | | | 468,021 | | | | — | | | | — | | | | 468,021 | |
Short-Term Investments | | | 309,539 | | | | — | | | | — | | | | 309,539 | |
| | | | | | | | | | | | | | | | |
| | | | |
Total Investments in Securities | | $ | 32,591,802 | | | $ | 566,365 | | | $ | 1,871 | | | $ | 33,160,038 | |
| | | | | | | | | | | | | | | | |
| | | | |
Core Plus Fund | | | | | | | | | | | | | | | | |
Common Stocks | | | | | | | | | | | | | | | | |
Consumer Discretionary | | $ | — | | | $ | 649 | | | $ | — | | | $ | 649 | |
| | | | |
Asset Backed Securities | | | — | | | | 1,047,642 | | | | — | | | | 1,047,642 | |
| | | | |
Corporate Bonds | | | — | | | | 23,193,513 | | | | — | | | | 23,193,513 | |
| | | | |
Foreign Issuer Bonds | | | | | | | | | | | | | | | | |
Energy | | | — | | | | 349,437 | | | | — | | | | 349,437 | |
Materials | | | — | | | | 696,892 | | | | — | | | | 696,892 | |
Telecommunications | | | — | | | | 941,911 | | | | — | | | | 941,911 | |
| | | | | | | | | | | | | | | | |
| | | | |
Total Foreign Issuer Bonds | | | — | | | | 1,988,240 | | | | — | | | | 1,988,240 | |
| | | | | | | | | | | | | | | | |
| | | | |
Mortgage Backed Securities | | | — | | | | 5,206,375 | | | | — | | | | 5,206,375 | |
| | | | |
Government Securities | | | — | | | | 59,561,043 | | | | — | | | | 59,561,043 | |
| | | | |
Short-Term Investments | | | 4,250,592 | | | | — | | | | — | | | | 4,250,592 | |
| | | | | | | | | | | | | | | | |
| | | | |
Total Investments in Securities | | $ | 4,250,592 | | | $ | 90,997,462 | | | $ | — | | | $ | 95,248,054 | |
| | | | | | | | | | | | | | | | |
There were no Level 3 securities in the Global, International Small Cap and Core Plus Funds at the beginning or during the period presented.
The following is a reconciliation of investments in which significant unobservable inputs (Level 3) were used in determining fair value in the International Fund:
| | | | | | | | | | | | | | | | | | | | | | | | | | | | | | | | |
| | | Balance
As Of
September 30,
2023 | | | Realized
Gains
(Losses) | | | Change in
Unrealized
Appreciation
(Depreciation) | | | Purchases | | | Sales | | | Transfers
into
Level 3 | | | Transfers
out of
Level 3 | | | Balance
As Of
March 31,
2024 | |
| | | | | | | | |
Preferred stocks | | | | | | | | | | | | | | | | | | | | | | | | | | | | | | | | |
| | | | | | | | |
Russia | | | $— | | | | $— | | | | $— | | | | $— | | | | $— | | | | $— | | | | $— | | | | $— | |
| | | | | | | | |
Common Stocks | | | | | | | | | | | | | | | | | | | | | | | | | | | | | | | | |
| | | | | | | | |
Russia | | | — | | | | — | | | | — | | | | — | | | | — | | | | — | | | | — | | | | — | |
| | | | | | | | |
| | | | | | | | | | | | | | | | | | | | | | | | | | | | | | | | |
| | | | | | | | |
Total | | | $— | | | | $— | | | | $— | | | | $— | | | | $— | | | | $— | | | | $— | | | | $— | |
| | | | | | | | | | | | | | | | | | | | | | | | | | | | | | | | |
99
Brandes Investment Trust
NOTES TO FINANCIAL STATEMENTS — (continued)
The International Fund held two level 3 securities with a fair value of $0 as of March 31, 2024 that were valued using prices provided by the Fund’s investment advisor.
| | | | | | | | | | | | | | | | |
| | | Fair Value
at March 31, 2024 | | | Valuation
Techniques | | | Unobservable
Inputs | | | Range
(Weighted Average) |
| | | | |
Preferred stocks | | | | | | | | | | | | | | | | |
| | | | |
Russia | | | $— | | |
| Market
Approach |
| |
| Market
Discount Rate |
| | | 100 | % |
| | | | |
Common Stocks | | | | | | | | | | | | | | | | |
| | | | |
Russia | | | — | | |
| Market
Approach |
| |
| Market
Discount Rate |
| | | 100 | % |
The significant unobservable inputs that can be used in the fair value measurement are: Market Discount Rate. Significant decreases in Market Discount Rate would have resulted in a significantly higher fair value measurement.
The following is a reconciliation of investments in which significant unobservable inputs (Level 3) were used in determining fair value in the Emerging Markets Fund:
| | | | | | | | | | | | | | | | | | | | | | | | | | | | | | | | |
| | | Balance
As Of
September 30,
2023 | | | Realized
Gains
(Losses) | | | Change in
Unrealized
Appreciation
(Depreciation) | | | Purchases | | | Sales | | | Transfers
into
Level 3 | | | Transfers
out of
Level 3 | | | Balance
As Of
March 31,
2024 | |
| | | | | | | | |
Common Stocks | | | | | | | | | | | | | | | | | | | | | | | | | | | | | | | | |
| | | | | | | | |
Russia | | | $— | | | | $— | | | | $— | | | | $— | | | | $— | | | | $— | | | | $— | | | | $— | |
| | | | | | | | |
| | | | | | | | | | | | | | | | | | | | | | | | | | | | | | | | |
| | | | | | | | |
Total | | | $— | | | | $— | | | | $— | | | | $— | | | | $— | | | | $— | | | | $— | | | | $— | |
| | | | | | | | | | | | | | | | | | | | | | | | | | | | | | | | |
The Emerging Markets Fund held four level 3 securities with a fair value of $0 as of March 31, 2024 that were valued using prices provided by the Fund’s investment advisor.
| | | | | | | | | | | | | | | | |
| | | Fair Value
at March 31, 2024 | | | Valuation
Techniques | | | Unobservable
Inputs | | | Range
(Weighted Average) |
| | | | |
Common Stocks | | | | | | | | | | | | | | | | |
| | | | |
Russia | | | $— | | |
| Market
Approach |
| |
| Market
Discount Rate |
| | | 100 | % |
The significant unobservable inputs that can be used in the fair value measurement are: Market Discount Rate. Significant decreases in Market Discount Rate would have resulted in a significantly higher fair value measurement.
The following is a reconciliation of investments in which significant unobservable inputs (Level 3) were used in determining fair value in the Small Cap Value Fund:
| | | | | | | | | | | | | | | | | | | | | | | | | | | | | | | | |
| | | Balance
As Of
September 30,
2023 | | Realized
Gains
(Losses) | | Change in
Unrealized
Appreciation
(Depreciation) | | Purchases | | Sales | | Transfers
into
Level 3 | | Transfers
out of
Level 3 | | Balance
As Of
March 31,
2024 |
| | | | | | | | |
Common Stocks | | | | | | | | | | | | | | | | | | | | | | | | | | | | | | | | |
| | | | | | | | |
United States | | | $1,871 | | | | $— | | | | $— | | | | $— | | | | $— | | | | $— | | | | $— | | | $ | 1,871 | |
| | | | | | | | | | | | | | | | | | | | | | | | | | | | | | | | |
| | | | | | | | |
Total | | | $1,871 | | | | $— | | | | $— | | | | $— | | | | $— | | | | $— | | | | $— | | | $ | 1,871 | |
| | | | | | | | | | | | | | | | | | | | | | | | | | | | | | | | |
100
Brandes Investment Trust
NOTES TO FINANCIAL STATEMENTS — (continued)
The Small Cap Value Fund held one level 3 security with a fair value of $1,871 as of March 31, 2024. The valuation technique used for this security was the last observable price and the unobservable input used was management’s estimate of net liquidation value.
NOTE 3 – INVESTMENT ADVISORY FEE AND OTHER TRANSACTIONS WITH AFFILIATES
| | A. | Advisor Fee. The Advisor provides the Funds with investment management services under an Investment Advisory Agreement. The Advisor furnishes all investment advice, office space and certain administrative services, and provides certain personnel, needed by the Funds. As compensation for its services, the Advisor is entitled to a monthly fee. The Advisor received a monthly fee at the annual rate of 0.75% of the first $2.5 billion of average daily net assets, 0.70% on average daily net assets from $2.5 billion to $5.0 billion, and 0.67% of the average daily net assets greater than $5.0 billion, of the International Fund. The Advisor received a monthly fee at the annual rate of 0.95% of the first $2.5 billion of average daily net assets, 0.90% on average daily net assets from $2.5 billion to $5.0 billion, and 0.85% of the amount of average daily net assets greater than $5.0 billion, of the Emerging Markets Fund. The Advisor received a monthly fee at the annual rate of 0.95% of the first $1.0 billion of average daily net assets, and 0.90% of the average daily net assets greater than $1.0 billion, of the International Small Cap Fund. The Global Fund, Small Cap Value Fund and Core Plus Fund incurred a monthly fee at the annual rate of 0.80%, 0.70% and 0.35% based upon their average daily net assets, respectively. The Advisor has contractually agreed to limit the Management Fee of each share class of the Core Plus Fund to 0.30% pursuant to an Investment Advisory Fee Waiver Agreement in effect until January 31, 2025. For the six months ended March 31, 2024, the Core Plus fund had $19,768 in advisory fees waived. These waived fees are not eligible for recoupment. For the six months ended March 31, 2024, the International Fund, the Global Fund, the Emerging Markets Fund, the International Small Cap Fund, the Small Cap Value Fund, and the Core Plus Fund incurred $2,736,519, $178,786, $3,235,710, $1,923,747, $67,565 and $138,371 in advisory fees, respectively. |
Certain officers and trustees of the Trust are also officers of the Advisor and receive no compensation directly from the Funds for serving in their role.
The Funds are responsible for their own operating expenses. The Advisor contractually agreed to limit each Fund’s annual operating expenses, including repayment of previous waivers, to the following percentages of the Fund’s average daily net assets attributable to the specific classes through January 31, 2025 (the “Expense Cap Agreement”):
101
Brandes Investment Trust
NOTES TO FINANCIAL STATEMENTS — (continued)
| | | | | | | | | | | | | | | | | | | | |
Fund | | Class A | | Class C | | Class I | | Class R6 |
| | | | |
International Fund | | | | 1.20 | % | | | | 1.95 | % | | | | 0.85 | % | | | | 0.75 | % |
Global Fund | | | | 1.25 | % | | | | 2.00 | % | | | | 1.00 | % | | | | 0.82 | %* |
Emerging Markets Fund | | | | 1.37 | % | | | | 2.12 | % | | | | 1.12 | % | | | | 0.97 | % |
International Small Cap Fund | | | | 1.40 | % | | | | 2.15 | % | | | | 1.15 | % | | | | 1.00 | % |
Small Cap Value Fund | | | | 1.15 | % | | | | N/A | | | | | 0.90 | % | | | | 0.72 | % |
Core Plus Fund | | | | 0.50 | % | | | | N/A | | | | | 0.30 | % | | | | 0.30 | % |
* This class is not active.
The Funds may incur additional expenses not covered under the Expense Cap Agreement. These expenses include acquired fund fees and expenses, taxes, interest, broker commissions, and proxy expenses or other extraordinary expenses.
Any reimbursements of fee waivers made by the Advisor to a Fund are subject to repayment by the Fund, to the extent that the Fund is able to make the repayment within the expense limit specified in its Expense Cap Agreement. Under the Expense Cap Agreement that was in place during the period covered by this report, any such repayment must be made before the end of the thirty-six months after the month in which the related reimbursement or waiver occurred. The Trust has agreed to repay the expense reimbursement to the Advisor. However, the repayment of previously waived expenses is limited to amounts that do not cause the aggregate operating expenses of the Fund to exceed the current expense cap or the expense cap in place at the time the waiver was generated. For the six months ended March 31, 2024, the Advisor waived expenses and/or reimbursed the Funds $260,576, $27,292, $54,506, $1,004, $51,670, and $56,208 for the International Fund, Global Fund, Emerging Markets Fund, International Small Cap Fund, Small Cap Value Fund, and Core Plus Fund, respectively. Repayment rights expire as follows:
| | | | | | | | | | | | | | | | | | | | |
Fund | | Six Months
Ended
September 30,
2024 | | Year Ended
September 30,
2025 | | Year Ended
September 30,
2026 | | Six Months
Ended
March 31,
2027 |
| | | | |
International Fund | | | | $145,655 | | | | | $440,163 | | | | | $471,697 | | | | | $260,576 | |
Global Fund | | | | 34,962 | | | | | 96,460 | | | | | 89,159 | | | | | 27,292 | |
Emerging Markets Fund | | | | 26,629 | | | | | 141,383 | | | | | 138,307 | | | | | 54,506 | |
International Small Cap Fund | | | | 4,269 | | | | | 7,484 | | | | | 2,978 | | | | | 1,004 | |
Small Cap Value Fund | | | | 52,338 | | | | | 132,822 | | | | | 111,993 | | | | | 51,646 | |
Core Plus Fund | | | | 106,926 | | | | | 211,363 | | | | | 192,628 | | | | | 56,208 | |
The Advisor did not recoup any fees previously waived or reimbursed for the International Fund, Global Fund, Emerging Markets and Core Plus Fund. For the period ended March 31, 2024, the Advisor recouped fees previously waived or reimbursed in the following amounts:
102
Brandes Investment Trust
NOTES TO FINANCIAL STATEMENTS — (continued)
| | | | | | | | |
Fund | | Class I | | | Class R6 | |
| | |
International Small Cap Fund. | | | $28,844 | | | | $— | |
Small Cap Value Fund | | | — | | | | 23 | |
| | B. | Administration Fee. The Northern Trust Company (the “Administrator”) acts as administrator for the Funds. The Administrator prepares various federal and state regulatory filings; prepares reports and materials to be supplied to the Trustees; monitors the activities of the Funds’ custodian, transfer agent and accountant; coordinates the preparation and payment of Fund expenses; and reviews the Funds’ expense accruals. For these services, each Fund pays the administrator monthly a fee accrued daily and based on the Fund’s average daily net assets. The Funds may also reimburse the Administrator for out-of-pocket expenses incurred by the Administrator in the performance of its duties. The amounts paid directly to the Administrator by the Funds for administrative services are included in the Administration fees in the Statements of Operations. |
| | C. | Distribution and Servicing Fees. ALPS Distributors, Inc. (the “Distributor”), a registered broker-dealer, acts as the Funds’ principal underwriter in a continuous public offering of the Funds’ shares. A portion of the Funds’ distribution expenses is paid by the Advisor. |
The Funds have adopted a Distribution Plan (the “Plan”) pursuant to Rule 12b-1 under the 1940 Act for the Funds’ Class A and C shares. The Plan is designed to reimburse the Distributor or dealers for certain promotional and other sales related costs associated with sales of such Fund shares. Unreimbursed amounts may be carried forward and paid in a subsequent year, to the extent that total expenses under the Plan do not exceed 0.25% and 0.75% of the average daily net assets of each Fund’s Class A and C shares, respectively. During the six months ended March 31, 2024, the Funds paid to the Distributor and each dealer a monthly fee at the annual rate of 0.25% of the average daily net assets of Class A shares and 0.75% of the average daily net assets of Class C shares beneficially owned by the Distributor’s and each dealer’s existing brokerage clients. The Plan may be continued in effect from year to year if such continuance is approved annually by the Board of Trustees of the Trust, including the vote of a majority of the Independent Trustees. For the six months ended March 31, 2024, the following Funds incurred expenses pursuant to the Plan:
103
Brandes Investment Trust
NOTES TO FINANCIAL STATEMENTS — (continued)
| | | | | | | | |
Fund | | Class A | | | Class C | |
| | |
International Fund | | $ | 55,845 | | | $ | 27,584 | |
Global Fund | | | 1,667 | | | | 1,434 | |
Emerging Markets Fund | | | 181,260 | | | | 16,673 | |
International Small Cap Fund | | | 68,041 | | | | 12,608 | |
Small Cap Value Fund | | | 5,273 | | | | N/A | |
Core Plus Fund | | | 1,616 | | | | N/A | |
The Funds have adopted a Shareholder Service Plan for Class C, and have authorized sub-transfer agency fee payments for Class I, to pay to securities broker-dealers, retirement plan sponsors and administrators, banks and their affiliates, and other institutions and service professionals, as shareholder servicing agents of the Funds, an annual fee for non-distribution sub-transfer agent and/or subaccounting services up to 0.25% and 0.05% of annual net assets attributable to Class C and Class I, respectively (the “Service Fees”). For the six months ended March 31, 2024, the Funds incurred the following Service Fees:
| | | | | | | | |
Fund | | Class C | | | Class I | |
| | |
International Fund | | | $9,195 | | | | $154,511 | |
Global Fund | | | 478 | | | | (5,802 | ) |
Emerging Markets Fund | | | 5,558 | | | | 130,821 | |
International Small Cap Fund | | | 4,203 | | | | 86,656 | |
Small Cap Value Fund | | | N/A | | | | 3,763 | |
Core Plus Fund | | | N/A | | | | (38,016 | ) |
Included in the Global Fund and Core Plus Fund is a credit for accumulated unutilized class I sub-transfer agency fees in the amount of $16,547 and $56,136 respectively.
NOTE 4 – PURCHASES AND SALES OF SECURITIES
The cost of purchases and the proceeds from sales of securities, excluding short term investments, were as follows for the six months ended March 31, 2024:
| | | | | | | | | | | | | | | | |
| | | U.S. Government | | | Other | |
Fund | | Purchases | | | Sales | | | Purchases | | | Sales | |
| | | | |
International Fund | | $ | — | | | $ | — | | | $ | 124,667,987 | | | $ | 84,683,948 | |
Global Fund | | $ | — | | | $ | — | | | $ | 3,985,791 | | | $ | 5,011,793 | |
Emerging Markets Fund | | $ | — | | | $ | — | | | $ | 60,917,540 | | | $ | 111,744,464 | |
International Small Cap Fund | | $ | — | | | $ | — | | | $ | 127,100,942 | | | $ | 55,341,172 | |
Small Cap Value Fund | | $ | — | | | $ | — | | | $ | 19,693,936 | | | $ | 3,137,098 | |
Core Plus Fund. | | $ | 23,678,042 | | | $ | 1,981,322 | | | $ | 4,716,656 | | | $ | 3,670,471 | |
104
Brandes Investment Trust
NOTES TO FINANCIAL STATEMENTS — (continued)
NOTE 5 – CAPITAL STOCK TRANSACTIONS
Capital stock activity for each class of shares was as follows (shares and dollar amounts in thousands):
| | | | | | | | | | | | | | | | | | | | | | | | | | | | | | | | |
| | | International Fund | | | Global Fund |
| | | Six Months | | | | | | | | | Six Months | | | | | | |
| | | Ended | | | Year Ended | | | Ended | | Year Ended | |
| | | 3/31/2024 | | | 9/30/2023 | | | 3/31/2024 | | 9/30/2023 | |
| | | Shares | | | Amount | | | Shares | | | Amount | | | Shares | | Amount | | | Shares | | | Amount | |
Shares Sold | | | | | | | | | | | | | | | | | | | | | | | | | | | | | | | | |
Class A | | | 212 | | | $ | 4,129 | | | | 973 | | | $ | 17,054 | | | | 10 | | | $ | 281 | | | | 22 | | | $ | 557 | |
Class C | | | 36 | | | | 710 | | | | 71 | | | | 1,202 | | | | 15 | | | | 452 | | | | 4 | | | | 123 | |
Class I | | | 5,300 | | | | 103,015 | | | | 8,395 | | | | 146,372 | | | | 47 | | | | 1,331 | | | | 86 | | | | 2,242 | |
Class R6 | | | 573 | | | | 11,343 | | | | 935 | | | | 16,599 | | | | N/A | | | | N/A | | | | N/A | | | | N/A | |
Issued on Reinvestment of Distributions | | | | | | | | | | | | | | | | | | | | | | | | | | | | | | | | |
Class A | | | 13 | | | | 255 | | | | 55 | | | | 980 | | | | 2 | | | | 43 | | | | 1 | | | | 29 | |
Class C | | | 1 | | | | 29 | | | | 7 | | | | 124 | | | | — | * | | | 12 | | | | 1 | | | | 14 | |
Class I | | | 178 | | | | 3,594 | | | | 723 | | | | 12,897 | | | | 55 | | | | 1,508 | | | | 51 | | | | 1,295 | |
Class R6 | | | 16 | | | | 318 | | | | 68 | | | | 1,210 | | | | N/A | | | | N/A | | | | N/A | | | | N/A | |
Shares Redeemed | | | | | | | | | | | | | | | | | | | | | | | | | | | | | | | | |
Class A | | | (646) | | | | (12,754 | ) | | | (758) | | | | (13,034 | ) | | | (2) | | | | (44) | | | | (17) | | | | (426) | |
Class C | | | (95) | | | | (1,839 | ) | | | (130) | | | | (2,175 | ) | | | (1) | | | | (30) | | | | (20) | | | | (511) | |
Class I | | | (3,057) | | | | (59,522 | ) | | | (8,548) | | | | (143,936 | ) | | | (116) | | | | (3,198) | | | | (284) | | | | (7,078) | |
Class R6 | | | (364) | | | | (7,136 | ) | | | (1,116) | | | | (19,705 | ) | | | N/A | | | | N/A | | | | N/A | | | | N/A | |
| | | | | | | | | | | | | | | | | | | | | | | | | | | | | | | | |
Net Increase/(Decrease) Resulting from Fund Share Transactions | | | 2,167 | | | $ | 42,142 | | | | 675 | | | $ | 17,588 | | | | 10 | | | $ | 355 | | | | (156) | | | $ | (3,755) | |
| | | | | | | | | | | | | | | | | | | | | | | | | | | | | | | | |
| * | Value calculated is less than 500 shares/dollars. |
105
Brandes Investment Trust
NOTES TO FINANCIAL STATEMENTS — (continued)
| | | | | | | | | | | | | | | | | | | | | | | | | | | | | | | | |
| | |
| | | Emerging Markets Fund | | | International Small Cap Fund |
| | | Six Months | | | | | | | | | Six Months | | | | | | |
| | | Ended | | | Year Ended | | | Ended | | Year Ended | |
| | | 3/31/2024 | | | 9/30/2023 | | | 3/31/2024 | | 9/30/2023 | |
| | | Shares | | | Amount | | | Shares | | | Amount | | | Shares | | Amount | | | Shares | | | Amount | |
Shares Sold | | | | | | | | | | | | | | | | | | | | | | | | | | | | | | | | |
Class A | | | 522 | | | $ | 4,200 | | | | 1,336 | | | $ | 9,619 | | | | 845 | | | $ | 12,767 | | | | 1,081 | | | $ | 14,379 | |
Class C | | | 71 | | | | 566 | | | | 71 | | | | 494 | | | | 52 | | | | 736 | | | | 20 | | | | 258 | |
Class I | | | 5,555 | | | | 45,088 | | | | 17,714 | | | | 130,544 | | | | 7,396 | | | | 111,072 | | | | 4,073 | | | | 53,890 | |
Class R6 | | | 76 | | | | 637 | | | | 688 | | | | 4,548 | | | | 7 | | | | 97 | | | | 17 | | | | 207 | |
Issued on Reinvestment of Distributions | | | | | | | | | | | | | | | | | | | | | | | | | | | | | | | | |
Class A | | | 38 | | | | 317 | | | | 72 | | | | 560 | | | | 52 | | | | 811 | | | | 54 | | | | 707 | |
Class C | | | 4 | | | | 31 | | | | 4 | | | | 28 | | | | 3 | | | | 54 | | | | 2 | | | | 27 | |
Class I | | | 585 | | | | 4,884 | | | | 1,087 | | | | 8,575 | | | | 371 | | | | 5,774 | | | | 355 | | | | 4,687 | |
Class R6 | | | 1 | | | | 4 | | | | 1 | | | | 7 | | | | — | | | | 7 | | | | — | * | | | 6 | |
Shares Redeemed | | | | | | | | | | | | | | | | | | | | | | | | | | | | | | | | |
Class A | | | (813 | ) | | | (6,429 | ) | | | (6,395 | ) | | | (41,430 | ) | | | (690) | | | | (10,486 | ) | | | (1,616) | | | | (20,479 | ) |
Class C | | | (122 | ) | | | (977 | ) | | | (369 | ) | | | (2,623 | ) | | | (49) | | | | (687 | ) | | | (144) | | | | (1,691 | ) |
Class I | | | (11,353 | ) | | | (90,745 | ) | | | (28,880 | ) | | | (206,361 | ) | | | (1,939) | | | | (30,155 | ) | | | (5,544) | | | | (68,173 | ) |
Class R6 | | | (207 | ) | | | (1,675 | ) | | | (3,093 | ) | | | (23,552 | ) | | | (5) | | | | (79 | ) | | | (14) | | | | (178 | ) |
| | | | | | | | | | | | | | | | | | | | | | | | | | | | | | | | |
Net Increase/(Decrease) Resulting from Fund Share Transactions | | | (5,643 | ) | | $ | (44,099 | ) | | | (17,764 | ) | | $ | (119,591 | ) | | | 6,043 | | | $ | 89,911 | | | | (1,716) | | | $ | (16,360 | ) |
| | | | | | | | | | | | | | | | | | | | | | | | | | | | | | | | |
| * | Value calculated is less than 500 shares/dollars. |
| | | | | | | | | | | | | | | | | | | | | | | | | | | | | | | | |
| | | Small Cap Value Fund | | Core Plus Fund |
| | | Six Months
Ended
3/31/2024 | | Year Ended
9/30/2023 | | Six Months
Ended
3/31/2024 | | Year Ended
9/30/2023 |
| | | Shares | | Amount | | Shares | | Amount | | Shares | | Amount | | Shares | | Amount |
Shares Sold | | | | | | | | | | | | | | | | | | | | | | | | | | | | | | | | |
Class A | | | 285 | | | $ | 3,850 | | | | 136 | | | $ | 1,732 | | | | 8 | | | $ | 66 | | | | 91 | | | $ | 735 | |
Class C. | | | N/A | | | | N/A | | | | N/A | | | | N/A | | | | N/A | | | | N/A | | | | N/A | | | | N/A | |
Class I | | | 1,213 | | | | 16,766 | | | | 519 | | | | 6,692 | | | | 2,483 | | | | 20,529 | | | | 2,922 | | | | 24,000 | |
Class R6 | | | 2 | | | | 23 | | | | 1 | | | | 6 | | | | 1,134 | | | | 9,503 | | | | 120 | | | | 991 | |
Issued on Reinvestment of Distributions | | | | | | | | | | | | | | | | | | | | | | | | | | | | | | | | |
Class A | | | 9 | | | | 119 | | | | 2 | | | | 23 | | | | 3 | | | | 23 | | | | 3 | | | | 27 | |
Class C. | | | N/A | | | | N/A | | | | N/A | | | | N/A | | | | N/A | | | | N/A | | | | N/A | | | | N/A | |
Class I | | | 20 | | | | 273 | | | | 9 | | | | 107 | | | | 166 | | | | 1,371 | | | | 260 | | | | 2,136 | |
Class R6 | | | — | * | | | — | * | | | — | * | | | 2 | | | | 12 | | | | 103 | | | | 1 | | | | 5 | |
Shares Redeemed | | | | | | | | | | | | | | | | | | | | | | | | | | | | | | | | |
Class A | | | (43) | | | | (576) | | | | (31) | | | | (383) | | | | (33) | | | | (273) | | | | (19) | | | | (156) | |
Class C. | | | N/A | | | | N/A | | | | N/A | | | | N/A | | | | N/A | | | | N/A | | | | N/A | | | | N/A | |
Class I | | | (253) | | | | (3,404) | | | | (111) | | | | (1,477) | | | | (647) | | | | (5,303) | | | | (2,423) | | | | (19,837) | |
Class R6 | | | (9) | | | | (108) | | | | (—) | * | | | (1) | | | | N/A | | | | N/A | | | | (121) | | | | (1,008) | |
| | | | | | | | | | | | | | | | | | | | | | | | | | | | | | | | |
Net Increase/(Decrease) Resulting from Fund Share Transactions | | | 1,224 | | | $ | 16,943 | | | | 525 | | | $ | 6,701 | | | | 3,126 | | | $ | 26,019 | | | | 834 | | | $ | 6,893 | |
| | | | | | | | | | | | | | | | | | | | | | | | | | | | | | | | |
| * | Value calculated is less than 500 shares/dollars. |
106
Brandes Investment Trust
NOTES TO FINANCIAL STATEMENTS — (continued)
NOTE 6 – FEDERAL INCOME TAX MATTERS
The Funds may be subject to taxes imposed by countries in which they invest. Such taxes are generally based on income and/or capital gains earned. Taxes are accrued based on net investment income, net realized gains and net unrealized appreciation as such income and/or gains are recorded. Taxes accrued on unrealized gains are reflected as a liability on the Statements of Assets and Liabilities under the caption “Foreign capital gains taxes”. When assets subject to capital gains tax are sold, accrued taxes are relieved, and the actual amount of the taxes paid is reflected on the Statements of Operations as a reduction in “Net realized gain (loss) on Investments”.
GAAP requires that certain components of net assets be reclassified between financial and tax reporting. Temporary differences do not require reclassification. Temporary and permanent differences have no effect on net assets or net asset value per share. For the year ended September 30, 2023, the Funds made the following permanent book-to-tax reclassifications primarily related to the treatment of foreign currency transactions, passive foreign investment companies, and paydowns:
| | | | | | | | | | | | | | | |
| | | Undistributed Net Investment Income/(Loss) | | Accumulated Net Realized Gain/(Loss) | | Paid-In Capital |
International Fund | | | | $ 95,880 | | | | | $ (95,880 | ) | | $— | |
Global Fund | | | | 4,779 | | | | | (4,779 | ) | | — | |
Emerging Markets Fund. | | | | 756,841 | | | | | (756,841 | ) | | — | |
International Small Cap Fund | | | | 2,377,525 | | | | | (2,377,525 | ) | | — | |
Small Cap Value Fund | | | | 107 | | | | | (107 | ) | | — | |
Core Plus Fund | | | | 2,936 | | | | | (2,936 | ) | | — | |
As of September 30, 2023, the components of distributable earnings on a tax basis were as follows:
| | | | | | | | |
| | | International
Fund | | | Global
Fund | |
| | |
Cost of investments for tax purposes | | $ | 656,751,358 | | | $ | 35,200,752 | |
| | | | | | | | |
| | |
Gross tax unrealized appreciation | | | 83,379,969 | | | | 10,016,173 | |
Gross tax unrealized depreciation | | | (87,637,153 | ) | | | (3,095,616 | ) |
| | | | | | | | |
Net unrealized appreciation (depreciation) on investments and foreign currency | | | (4,257,184 | ) | | | 6,920,557 | |
Distributable ordinary income | | | 1,502,585 | | | | 20,815 | |
Distributable long-term capital gains | | | — | | | | 1,201,648 | |
| | | | | | | | |
| | |
Total distributable earnings | | | 1,502,585 | | | | 1,222,463 | |
| | | | | | | | |
| | |
Other accumulated gains/(losses) | | | (98,739,806 | ) | | | — | |
| | | | | | | | |
| | |
Total accumulated earnings | | $ | (101,494,405 | ) | | $ | 8,143,020 | |
| | | | | | | | |
107
Brandes Investment Trust
NOTES TO FINANCIAL STATEMENTS — (continued)
| | | | | | | | | | | | | | | | |
| | | Emerging
Markets
Fund | | | International
Small Cap
Fund | | | Small Cap
Value Fund | | | Core
Plus Fund | |
| | | | |
Cost of investments for tax purposes | | $ | 822,629,697 | | | $ | 343,997,313 | | | $ | 12,531,926 | | | $ | 73,702,123 | |
| | | | | | | | | | | | | | | | |
Gross tax unrealized appreciation | | | 90,485,225 | | | | 56,993,841 | | | | 777,075 | | | | 116,908 | |
Gross tax unrealized depreciation | | | (235,583,422 | ) | | | (67,320,260 | ) | | | (715,621 | ) | | | (7,599,835 | ) |
| | | | | | | | | | | | | | | | |
Net unrealized appreciation (depreciation) on investments and foreign currency | | | (145,098,197 | ) | | | (10,326,419 | ) | | | 61,454 | | | | (7,482,927 | ) |
Distributable ordinary income | | | 4,965,148 | | | | 6,745,326 | | | | 83,810 | | | | 33,422 | |
Distributable long-term capital gains | | | — | | | | — | | | | 205,481 | | | | — | |
| | | | | | | | | | | | | | | | |
Total distributable earnings | | | 4,965,148 | | | | 6,745,326 | | | | 289,291 | | | | 33,422 | |
| | | | | | | | | | | | | | | | |
| | | | |
Other accumulated gains/(losses) | | | (274,050,634 | ) | | | (143,163,836 | ) | | | (3,015 | ) | | | (2,444,590 | ) |
| | | | | | | | | | | | | | | | |
Total accumulated earnings | | $ | (414,183,683 | ) | | $ | (146,744,929 | ) | | $ | 347,730 | | | $ | (9,894,095 | ) |
| | | | | | | | | | | | | | | | |
The differences between book and tax basis distributable earnings are primarily related to passive foreign investment companies and wash sales. These differences are temporary.
The tax composition of dividends for the years ended September 30, 2023 and September 30, 2022 for the Funds, were as follows:
| | | | | | | | | | | | | | | | | | | | | | | | |
| | | Ordinary Income | | | Long Term
Capital Gains | | | Return of Capital | |
| | | 2023 | | | 2022 | | | 2023 | | | 2022 | | | 2023 | | | 2022 | |
| | | | | | |
International Fund | | $ | 15,554,284 | | | $ | 26,061,162 | | | $ | — | | | $ | — | | | | $— | | | $ | — | |
Global Fund | | | 776,169 | | | | 1,162,638 | | | | 570,731 | | | | 1,557,411 | | | | — | | | | — | |
Emerging Markets Fund | | | 10,977,003 | | | | 35,549,724 | | | | — | | | | — | | | | — | | | | 619,180 | |
International Small Cap Fund | | | 5,469,728 | | | | 20,716,055 | | | | — | | | | — | | | | — | | | | — | |
Small Cap Value Fund | | | 133,714 | | | | 148,814 | | | | — | | | | 20,801 | | | | — | | | | — | |
Core Plus Fund | | | 2,196,496 | | | | 1,785,392 | | | | — | | | | — | | | | — | | | | — | |
At September 30, 2023 the Funds had capital loss carryforwards and capital loss carryforwards utilized as indicated below:
| | | | | | | | |
| | | Indefinite | | | Utilized | |
| | |
International Fund | | $ | (98,739,806 | ) | | | $— | |
Global Fund | | | — | | | | — | |
Emerging Markets Fund | | | (274,015,145 | ) | | | — | |
International Small Cap Fund | | | (143,150,333 | ) | | | — | |
Small Cap Value Fund | | | — | | | | — | |
Core Plus Fund | | | (2,444,590 | ) | | | — | |
108
Brandes Investment Trust
NOTES TO FINANCIAL STATEMENTS — (continued)
NOTE 7 – OFFERING PRICE PER SHARE
The public offering price for Class A shares is the net asset value per share plus a sales charge, which varies in accordance with the amount of the purchase up to a maximum of 5.75% for the International, Global, Emerging Markets, International Small Cap and Small Cap Value, and 3.75% for the Core Plus Fund. A contingent deferred sales charge (“CDSC”) of 1.00% will be deducted with respect to Class A shares purchased without a sales load and redeemed within 12 months of purchase, unless waived, as discussed in the Prospectus. Any applicable CDSC will be 1.00% of the lesser of the original purchase price or the redemption value of the Class A shares redeemed. Class C shares include a 1.00% CDSC paid by redeeming shareholders within 12 months of purchase. As a result the redemption price may differ from the net asset value per share. The public offering prices for I shares are the respective net asset values. Sales charges are not an expense of the Funds and are not reflected in the financial statements of the Funds.
NOTE 8 – TRANSACTIONS WITH AFFILIATES
The following issuers were affiliated with the International Small Cap Fund as defined in Section (2)(a)(3) of the 1940 Act, as these Funds held 5% or more of the outstanding voting securities of the following issuers during the six months from October 1, 2023 through March 31, 2024:
International Small Cap Fund
| | | | | | | | | | | | | | |
Issuer Name | | Value At
September 30,
2023 | | Purchases | | Sales Proceeds | | Realized
Gain/(Loss) | | Unrealized
Appreciation/
(Depreciation) | | Value At
March 31,
2024 | | Dividend
Income |
| | | | | | | |
Desarrolladora Homex SAB de CV | | $192,456 | | $— | | $— | | $— | | $(7,517) | | $184,939 | | $— |
Urbi Desarrollos Urbanos SAB de CV | | 319,484 | | — | | — | | — | | 15,432 | | 334,916 | | — |
| | | | | | | | | | | | | | |
| | | | | | | |
| | $511,940 | | $— | | $— | | $— | | $7,915 | | $519,855 | | $— |
| | | | | | | | | | | | | | |
NOTE 9 – OWNERSHIP BY AFFILIATED PARTIES
As of March 31, 2024, the Advisor, Trustees or affiliates of the Advisor beneficially owned more than 5% of shares in each class of the Funds as follows:
| | |
| | | Global
Fund |
| | | Class I |
| |
Shares | | 362,259 |
% of Total Outstanding Shares | | 23.53% |
| | |
| | | Core
Plus Fund |
| | | Class I |
| |
Shares | | 2,302,406 |
% of Total Outstanding Shares | | 22.65% |
109
Brandes Investment Trust
NOTES TO FINANCIAL STATEMENTS — (continued)
NOTE 10 – RISK FACTORS
Significant market disruptions, such as those caused by pandemics (e.g. Covid-19 pandemic), war (e.g. Russia’s invasion of Ukraine or war in the Middle East), natural disasters, acts of terrorism, or other events, may adversely impact global economic and market activity, and contribute to significant volatility in financial markets. Any such disruptions could have an adverse impact on the prices and liquidity of the Funds’ investments.
NOTE 11 – SUBSEQUENT EVENTS
In preparing these financial statements, the Trust has evaluated events and transactions for potential recognition or disclosure through the date the financial statements were available to be issued. The Trust has concluded that there are no subsequent events to note, other than the item noted below:
The Board of Trustees of the Trust has approved an Agreement and Plan of Reorganization, with respect to each of the Funds (the “Reorganization Agreement”), with Datum One Series Trust to reorganize each of the Funds with and into a corresponding Acquiring Fund. Each of the Acquiring Funds is a new series of Datum One Series Trust created specifically for the purpose of acquiring the assets and liabilities of the corresponding Funds. The Reorganization Agreement requires approval by shareholders of each of the Funds. Notice has been given that a joint special meeting of shareholders of each of the Funds is scheduled to be held at 10:00 AM Pacific Time on June 13, 2024, at the offices of the Advisor to approve the Reorganization Agreement. If the Funds reorganizations are approved, they are expected to close in July 2024, or such other date as the parties may agree. The Acquiring Funds will not commence operations until the closing date.
110
Brandes Investment Trust
ADDITIONAL INFORMATION — (Unaudited)
BOARD CONSIDERATIONS AND CONTINUATION OF INVESTMENT ADVISORY AGREEMENT
In November 2023, the Board of Trustees of Brandes Investment Trust (the “Trust”), including the independent Trustees, unanimously approved renewal of the Investment Advisory Agreement (the “Agreement”) between the Trust and Brandes Investment Partners, L.P. (the “Advisor”) for an additional one-year term with respect to the following series of the Trust (each, a “Fund”): Brandes International Equity Fund, Brandes Global Equity Fund, Brandes Emerging Markets Value Fund, Brandes International Small Cap Equity Fund, Brandes Small Cap Value Fund and Brandes Core Plus Fixed Income Fund.
Information Reviewed
During the course of each year, the Board receives and reviews a wide variety of materials relating to the nature, quality and extent of the services provided by the Advisor to the Funds, including reports on each Fund’s investment results, portfolio composition, portfolio trading practices, and other matters. In addition, in connection with the Board’s annual review of the Agreement, the Trustees requested and reviewed supplementary information from the Advisor that included materials and analysis about the Funds’ investment results and advisory fees; information about the services provided by the Advisor to the Funds, such as compliance monitoring and portfolio trading practices, and the risks assumed by the Advisor in connection with those services; information about the services provided and the fees charged by the Advisor to its institutional and other clients employing similar strategies, including comparisons of those services and fees to the services and fees for the Funds; financial and profitability information regarding the Advisor and its relationship with the Funds; and information about the Advisor’s investment and other personnel providing services to the Funds, as well as the Advisor’s practices to evaluate and compensate its investment personnel. The Trustees also obtained and reviewed information from FUSE Research Network LLC, an independent third-party data provider, comparing the Funds’ investment results and fees and expenses to those of peer groups and categories of funds identified by FUSE as similar to the Funds.
In connection with the Board’s reviews, the Trustees received assistance and advice regarding legal and industry standards from counsel to the Trust and the independent Trustees. The Board discussed the approval of the Agreement with respect to each Fund with representatives of the Advisor at two Board meetings, and the independent Trustees discussed the Agreement in multiple private sessions with counsel at which no representatives of the Advisor were present. In deciding to approve the Agreement with respect to each Fund, the Board and the independent Trustees did not identify any single or particular piece of information that, in isolation, was the controlling factor, and each Trustee may have attributed different weight to each factor considered. The Board considered each Fund separately and made a separate decision
111
Brandes Investment Trust
ADDITIONAL INFORMATION — (Unaudited) (continued)
about approval of the Agreement as to each Fund. This summary describes the most important, but not all, of the factors considered by the Board and the independent Trustees.
Nature, Quality and Extent of Services
The Trustees considered the overall nature, quality and extent of services provided by the Advisor to the Funds. They considered, among other things, the quality and depth of the Advisor’s investment, compliance and other personnel, the Advisor’s regulatory compliance resources and program, the Advisor’s business continuity and cybersecurity programs, and the day-to-day administrative services provided to the Funds.
With respect to the Funds’ investment results, the Trustees reviewed and considered detailed information provided by FUSE, which utilized Morningstar data, comparing each Fund’s investment results to those of a peer group of similarly managed funds selected by FUSE, a larger group of funds selected by FUSE in the same investment classification as the subject fund, and the Fund’s benchmark index. The Trustees also met with representatives of FUSE and discussed with them the methodology used by FUSE in determining the Funds’ peer groups and universes. The FUSE report included confirmation that FUSE had selected peer group and universe funds for comparison to the Funds independently of the Advisor. The Trustees noted that while the FUSE information covered both peer group and universe funds, the Trustees focused more on the peer group information because the peer group funds were more directly comparable to the Funds.
The Trustees considered that for the one-, three-, five- and ten-year periods ended September 30, 2023, as applicable, and since inception, the investment results of the Class I shares of the Funds were mixed compared to the funds in their respective peer groups, as well as compared to their respective benchmarks. The Trustees noted that the investment performance of the other share classes would differ, and generally be lower, as a result of the higher expenses paid by those share classes. The meeting materials indicated as follows with respect to the annualized returns of each Fund compared to the median of its peer group and its benchmark:
● International Equity: above median for the one-, three-, five- and ten-year periods and since inception; and outperformed the benchmark for the one-, three-, five- and ten-year periods and since inception;
● Global Equity: above median for the one-, three- and five-year periods, at median for the ten-year period, and below median since inception; and outperformed the benchmark for the one- and three-year periods;
● Emerging Markets Value: above median for the one- and three-year periods, and below median for the five- and ten-year periods and since inception; and outperformed the benchmark for the one-, three- and five-year periods and since inception;
112
Brandes Investment Trust
ADDITIONAL INFORMATION — (Unaudited) (continued)
● International Small Cap Equity: above median for the one-, three- and five-year periods, and at median for the ten-year period and since inception, and outperformed the benchmark for the one-, three-, five- and ten-year periods and since inception;
● Small Cap Value: above median for the one- and five-year periods and since inception, and below median for the three-year period; and outperformed the benchmark for the one-, three- and five-year periods and since inception; and
● Core Plus Fixed Income: above median for the one- and three-year periods, and below median for the five- and ten-year periods and since inception; and outperformed the benchmark for the one-, three-, five- and ten-year periods.
The Trustees considered, among other things, that the Global Equity and Small Cap Value Funds have very small assets; and that one or more Funds from time to time may hold, or may have held, significant cash positions, and that these positions may impact investment performance.
In evaluating the Funds’ performance, the Trustees generally considered long-term performance to be more important than short-term performance but noted that short-term performance may be helpful in showing an improving trend. The Trustees noted the Advisor’s continued commitment to the Graham and Dodd value style of investment management and its lack of style drift compared to other value managers; considered that it is not unusual for the performance of funds managed with such a long-term strategy to fall below performance measurement indices for some periods; noted the Advisor’s observations regarding the market environment in recent years, including extended periods where the value style has been out of favor in the market, recent periods where the value style has outperformed in both U.S. and non-U.S. markets, and the outperformance of the value style over the past year in both developed non-U.S. markets and emerging markets; and noted that the Advisor’s strategies generally have performed well when value is performing well in the market. They also noted that the Funds’ investment approach is fully described in the prospectus, enabling the Funds’ shareholders to decide if they are willing to accept the long-term outlook associated with the Advisor’s investment approach.
Based on these reviews, the Trustees determined that under all of the circumstances the nature and quality of the services provided by the Advisor were sufficient for renewal of the Funds’ investment advisory agreement.
Advisory Fees, Total Expenses, Profitability and Ancillary Benefits
With respect to advisory fees, the Trustees considered the following:
● The Funds’ contractual advisory fees are at or below the median advisory fees of the funds in their respective FUSE peer groups with the exception of the Global Equity Fund (where the advisory fee is five basis points above the median).
● The advisory fees charged by the Advisor to comparable institutional and other accounts. The Trustees considered that these fees generally are lower than the fees
113
Brandes Investment Trust
ADDITIONAL INFORMATION — (Unaudited) (continued)
charged the Funds, and noted the information provided by the Advisor regarding the additional risks, responsibilities and expenses that the Advisor incurs in sponsoring and operating the Funds.
With respect to the total expenses of the Funds, the Trustees considered the following:
● Total expenses represent the amount actually paid by Fund shareholders.
● All of the Funds are subject to expense caps.
● The Funds’ actual total expenses are at or below the median total expenses of the funds in their respective FUSE peer groups with the exception of the Emerging Markets, International Small Cap Equity and Global Equity Funds (where the actual total expenses are one, five and seven basis points above the median, respectively).
The Trustees determined that the Funds’ advisory fees and total expense levels were fair and reasonable.
The Trustees considered that in the past the Advisor had agreed to add breakpoints to the fee schedules for Funds where appropriate. They considered that although the fee schedules for a number of the other Funds did not yet have breakpoints, it was premature to discuss economies of scale for those Funds when the Advisor is still subsidizing the Funds’ expenses, and that the matter could be discussed in the future as the Funds’ assets increase. The Trustees concluded that there was a reasonable sharing of any efficiencies or economies of scale at this time.
The Trustees reviewed and considered information about the Advisor’s financial capability to continue to provide services to the Funds, as well as an analysis of the profitability to the Advisor of its relationship with the Funds. The Trustees considered information regarding the ancillary benefits to the Advisor from its relationship with the Funds, which primarily related to the benefits of proprietary and third-party research provided by broker-dealers executing portfolio transactions on behalf of the Funds. The Trustees concluded that the Advisor’s profitability from its relationship with the Funds is not excessive and that any ancillary benefits received are reasonable under the circumstances.
Conclusions
Based on their review, including consideration of the factors identified above, the Board and the independent Trustees concluded in the exercise of their reasonable business judgment that the advisory fees contemplated by the Agreement are fair and reasonable to each Fund and its shareholders, and that renewal of the Agreement is in the best interests of each Fund and its shareholders.
PROXY VOTING PROCEDURES
The Advisor votes proxies relating to the Funds’ portfolio securities in accordance with procedures adopted by the Advisor. You may obtain a description of these
114
Brandes Investment Trust
ADDITIONAL INFORMATION — (Unaudited) (continued)
procedures, free of charge, by calling toll-free 1-800-331-2979. This information is also available through the Commission’s website at http://www.sec.gov.
Information regarding how the Trust voted proxies relating to portfolio securities during the most recent 12-month period ended June 30 is available without charge, upon request, by calling 1-800-331-2979. This information is also available through the Commission’s website at http://www.sec.gov.
PORTFOLIO HOLDINGS DISCLOSURE
The Trust files the Funds’ complete schedules of portfolio holdings with the Commission for the first and third quarters of each fiscal year on Form N-PORT. The Trust’s Form N-PORT filings are available on the Commission’s website at http://www.sec.gov. Information regarding the Trust’s Form N-PORT filings is also available, without charge, by calling toll-free, 1-800-331-2979.
115
Brandes Investment Trust
TRUSTEES AND OFFICERS INFORMATION — (Unaudited)
The Board is responsible for the overall management of the Trust’s business. The Board approves all significant agreements between the Trust and persons or companies furnishing services to it, including the agreements with the Advisor, Administrator, the Trust’s Custodian, Distributor and Transfer Agent. The Board delegates the day-to-day operations of the Trust to its officers, subject to each Fund’s investment objective and policies and to general supervision by the Board. The Trust’s Statement of Additional Information includes additional information about the Trustees and is available, without charge, by calling 1-800-331-2979 or visiting www.brandes.com.
The Trustees and officers of the Trust, their business addresses and principal occupations during the past five years are:
| | | | | | | | | | | | | | | | |
| | | | | | Term of | | | | | | | | |
| | | | | | Office | | | | Number | | | Other | |
| | | | | | and | | Principal | | of Trust | | | Directorships/ | |
| | | Position(s) | | | Length | | Occupation | | Series | | | Trusteeships | |
| Name, Address | | Held with | | | of Time | | During Past | | Overseen | | | Held by | |
and Year of Birth | | Trust | | | Served(1) | | 5 Years | | by Trustee | | | Trustee | |
| | | | | |
Independent Trustees(2) | | | | | | | | | | | | | | | | |
| | | | | |
Gregory Bishop, CFA 4275 Executive Square, 5th Floor La Jolla, CA 92037 (1961) | | | Trustee | | | Since January 2017 | | Retired. Previously Executive Vice President and Head of Retail Business, PIMCO Investments, from 1997 to 2014 | | | 7 | | | | None | |
| | | | | |
Robert M. Fitzgerald 4275 Executive Square, 5th Floor La Jolla, CA 92037 (1952) | | | Trustee | | | Since April 2008 | | Retired from 2002- 2005 and since 2007; Chief Financial Officer of National Retirement Partners from 2005 to 2007. | | | 7 | | |
| Hotchkis
and Wiley
Funds
(10 portfolios). |
|
| | | | | |
Craig Wainscott, CFA 4275 Executive Square, 5th Floor La Jolla, CA 92037 (1961) | |
| Trustee and
(beginning
January 2018)
Chairman
of the Board |
| | Since February 2012 | | Retired from Russell Investments, Managing Director, US Mutual Funds; Currently Partner with The Paradigm Project and advisor to early-stage companies. | | | 7 | | | | None | |
116
Brandes Investment Trust
TRUSTEES AND OFFICERS INFORMATION — (Unaudited) (continued)
| | | | | | | | | | |
| | | | | Term of | | | | | | |
| | | | | Office | | | | Number | | Other |
| | | | | and | | Principal | | of Trust | | Directorships/ |
| | | Position(s) | | Length | | Occupation | | Series | | Trusteeships |
| Name, Address | | Held with | | of Time | | During Past | | Overseen | | Held by |
and Year of Birth | | Trust | | Served(1) | | 5 Years | | by Trustee | | Trustee |
| | | | | |
| “Interested” Trustees(3) | | | | | | | | | | |
| | | | | |
Jeff Busby, CFA 4275 Executive Square, 5th Floor La Jolla, CA 92037 (1961) | | Trustee and
President | | Since July 2006 Since February 2012 | | Retired. Formerly, Executive Director of the Advisor from January 2004 through December 2023. | | 7 | | None |
| | | | | |
Oliver Murray 4275 Executive Square, 5th Floor La Jolla, CA 92037 (1961) | | Trustee | | Since February 2012 | | CEO, Brandes Investment Partners & Co. since 2002; Managing Director - PCPM of the Advisor since 2011. | | 7 | | None |
| | | | | |
| Officers of the Trust | | | | | | | | | | |
| | | | | |
Thomas M. Quinlan 4275 Executive Square, 5th Floor La Jolla, CA 92037 (1970) | | Secretary | | Since June 2003 | | Associate General Counsel of the Advisor since January 2006. | | N/A | | N/A |
| | | | | |
Gary Iwamura, CPA 4275 Executive Square, 5th Floor La Jolla, CA 92037 (1956) | | Treasurer | | Since September 1997 | | Retired. Consultant to Advisor January 2022 to present. Finance Director of the Advisor January 1997 through December 2021. | | N/A | | N/A |
| | | | | |
Roberta Loubier 4275 Executive Square, 5th Floor La Jolla, CA 92037 (1971) | | Chief Compliance
Officer and
Anti-Money
Laundering
Officer | | Since September 2015 | | Global Head of Compliance of the Advisor. | | N/A | | N/A |
| (1) | Trustees and officers of the Fund serve until their resignation, removal or retirement. |
| (2) | Not “interested persons” of the Trust as defined in the 1940 Act. |
| (3) | “Interested persons” of the Trust as defined in the 1940 Act. Jeff Busby is an interested person of the Trust because he is the President of the Trust and was the Executive Director of the Advisor from January 2004 until December 2023. Oliver Murray is an interested person of the Trust, because he is the Managing Director of the Advisor. |
117
Brandes Investment Trust
PRIVACY NOTICE
Brandes Investment Trust and Brandes Investment Partners, L.P. may collect non-public information about you from the following sources:
| ● | | Information we receive about you on applications or other forms; |
| ● | | Information you give us orally; and |
| ● | | Information about your transactions with us. |
We do not disclose any non-public personal information about any shareholder or former shareholder of the Fund without the shareholder’s authorization, except as required by law or in response to inquiries from governmental authorities. We restrict access to your personal and account information to those employees who need to know that information to provide products and services to you. We also may disclose that information to unaffiliated third parties (such as to brokers or custodians) only as permitted by law and only as needed for us to provide agreed services to you. We maintain physical, electronic and procedural safeguards to guard your non-public personal information.
If you hold shares of the Fund through a financial intermediary, such as a broker-dealer, bank, or trust company, the privacy policy of your financial intermediary governs how your non-public personal information would be shared with nonaffiliated third parties.
118

ADVISOR Brandes Investment Partners, L.P. 4275 Executive Square, 5th Floor La Jolla, CA 92037 800.331.2979 DISTRIBUTOR ALPS Distributors, Inc. 1290 Broadway, #1100 Denver, CO 80203 TRANSFER AGENT The Northern Trust Company 333 South Wabash Avenue, W-38 Chicago, IL 60604 INDEPENDENT REGISTERED PUBLIC ACCOUNTING FIRM PricewaterhouseCoopers LLP 601 South Figueroa Street Los Angeles, CA 90017 LEGAL COUNSEL Morgan, Lewis & Bockius LLP One Federal Street Boston, MA 02110 This report is intended for shareholders of the Brandes International Equity Fund, the Brandes Global Equity Fund, the Brandes Emerging Markets Value Fund, the Brandes International Small Cap Equity Fund, the Brandes Small Cap Value Fund, and the Brandes Core Plus Fixed Income Fund and may not be used as sales literature unless preceded or accompanied by a current prospectus. Statements and other information herein are dated and are subject to change. BIT 03/31
SEMI-ANNUAL
REPORT
SEPARATELY MANAGED ACCOUNT
RESERVE TRUST
For the six months ended March 31, 2024
1
Brandes Separately Managed Account Reserve Trust
Dear Fellow Investor,
In the six months ended March 31, 2024, the Brandes Separately Managed Account Reserve Trust increased 9.08%, while its benchmark, the Bloomberg Barclays U.S. Aggregate Bond Index, increased 5.99%.
Bond prices rallied in the fourth quarter of 2023 as the Fed (Federal Reserve) appeared to indicate that not only are further fed funds rate increases off the table, but the next move is likely a cut in rates. Taxable fixed income (as measured by the Bloomberg U.S. Aggregate Bond Index) delivered positive returns not only for the quarter but also the year.
In the credit markets, both investment grade and high yield bonds (as measured by Bloomberg’s U.S. Credit and U.S. Corporate High Yield Bond Indices respectively) posted strong absolute returns as well as positive returns relative to U.S. Treasury securities. Even after a sharp move downward during the quarter, yields on corporate bonds remain near the highest we have seen in close to 15 years, which has led to considerable market optimism about the opportunities in the asset class.
By the standards of the past few years, the start of 2024 was relatively benign – no global pandemic (2020 & 2021), no beginning of a significant rate hike cycle (2022), and no banking chaos (2023). During the first quarter, equity markets moved higher, credit spreads moved tighter, and interest rates moved upwards as the continued resilience in the U.S. economy forced investors to rethink the timing and number of rate cuts for the coming year.
The first three months of 2024 have seen an acceleration in upside surprises in economic data as demonstrated by the US Citigroup Economic Surprise Index, which has ultimately led the market to price in rate cuts starting later in the year and fewer overall – leading to a rise in U.S Treasury rates during the quarter.
We believe that the primary reason that the Fed and investors are eager to see rate cuts as soon as possible is that it seems they assume that the current fed funds rate is indeed restrictive. We would question this. The Bloomberg U.S. Financial Conditions Index shows that financial conditions are easier now than when the Fed began its rate hikes. If so, why do many investors still think the current fed funds rate is restrictive and thus keep planning for imminent rate cuts? In an ideal world, there should be little distinction between what a central bank like the Fed should do and what it will do. The Fed seems intent on easing policy despite stubborn inflation data and a clear easing of financial conditions over the past several months. Let’s hope market pressure for lower rates does not push the Fed into policy errors like those made in the 1970s.
Select Portfolio Activity
Fund activity was modest during the six months ending March 31, 2024.
In mid-October 2023 we added approximately 3% in agency mortgage-backed securities (“MBS”) to the Fund but remain underweight the sector relative to the
Past performance is not a guarantee of future results.
Brandes Separately Managed Account Reserve Trust
benchmark. We also added to an existing holding in Methanex Corp. (5.25% coupon, maturing 12/15/29, rated Ba1/BB). Methanex is the world’s largest producer of methanol. Methanol is a liquid chemical produced from natural gas that is primarily used as a feedstock in the production of other chemicals. It is generally categorized as “clean” energy -relatively speaking. It is used as an additive in gasoline that raises octane and reduces emissions.
In early 2024, the Fund added a new position in first lien bonds from Univision Communications (8.00% coupon, maturing 8/15/28, rated B1/B+).
Univision Communications is a leading Hispanic media company in the U.S. and Mexico. It operates 36 cable networks and 59 owned or operated television stations. In January 2022, Univision merged with Televisa – its primary content provider – to form a new company TelevisaUnivision. Given the growth of Spanish speaking population in the U.S. along with Univision’s position as the leader in distribution assets and (with the recent merger) content, we view this as among the healthiest categories in broadcasting.
During the quarter we sold our position in MicroStrategy as it reached our estimate of fair value. We also experienced a full call in our holding of Tenet Healthcare.
Outlook
There are two important themes that we have highlighted over the past six months that still guide how we position and manage the Fund in today’s market.
The first theme is our view that while fixed income yields are at attractive levels, valuations are stretched. Yields offered by corporate bonds are near the highest we have seen in nearly 15 years, which has led to considerable optimism about the asset class. As we have explained previously, a closer look indicates that the rise in yield on corporate bonds is largely attributable to the increase in Treasury yields rather than a cheapening of overall credit spreads. The corporate market appears to be priced for perfection with credit spreads at or near their tightest levels in several decades. Accordingly, we believe caution is warranted when allocating to the sector.
The second theme is that after nearly seventeen years of unconventional and near-zero rate monetary policy, there exists a paucity of experience and perspective among investors leading to a distorted view of what a normal interest rate environment is. Many investment professionals who are less than fifteen years into their careers don’t seem to realize that in the fifteen-year period leading up to the Global Financial Crisis, the average rate on the 10-year U.S. Treasury was 5.5%, in contrast with their own apparent perception of normal being near zero rates. The market does not seem to give much weight to the notion that the current fed funds rate is not restrictive. That is a risk to monitor as we move forward.
We share some of the optimism as overall yields in the corporate bond market are the highest they have been since 2009. Our main caution, however, is that we believe it is
3
Brandes Separately Managed Account Reserve Trust
important to remain disciplined in what one buys. Higher yields are welcome for long-term savers and investors, but a potential burden for companies as they are staring at refinancing upcoming maturities at much higher costs. The takeaway in our view is that deep, measured, fundamental research is essential as we move forward in an environment where idiosyncratic risks appear to be on the rise. We believe it’s critical to be patient when adding positions: not just know what you own but why you own it.
For a considerable period now, we have attempted to tilt the Fund into what we believe is a defensive posture to mitigate some of the potential detrimental impact of rising interest rates and widening yield spreads. We believe that this remains a risk. Accordingly, the Fund continues to favor shorter-maturity corporate bonds and those that we believe exhibit strong, tangible asset coverage. We are managing duration approximately 10% shorter than the Fund’s benchmark. We have a meaningful allocation to U.S. Treasuries and if market uncertainty and volatility continue to cause credit fundamentals to become mispriced relative to our estimates of intrinsic value, then we will look to redeploy some of those Treasury holdings thoughtfully and effectively to take advantage of opportunities. We remain underweight agency mortgage-backed securities.
As we move forward, we believe prudence dictates that we continue our search for value in a measured and deliberate manner while continuing to tilt the Fund to what we believe is a relatively defensive posture.
We remain optimistic about the prospects for the Brandes Separately Managed Account Reserve Trust Fund.
Sincerely yours,
The Brandes Fixed Income Investment Committee
Brandes Investment Trust
For term definitions, please refer to https://www.brandes.com/termdefinitions
First lien bonds are senior to all other bonds of an issuer so that first lien bond holders are paid back before all other debt holders. A lien is the legal right of a creditor to seize property from a borrower that has failed to repay the creditor.
Past Performance is not a guarantee of future results.
Diversification does not assure a profit or protect against a loss in a declining market.
Because the values of the fund’s investments will fluctuate with market conditions, so will the value of your investment in the fund. You could lose money on your investment in the fund, or the fund could underperform other investments. The values of the fund’s investments fluctuate in response to the activities of individual companies and general bond market and economic conditions. Investments in small and medium capitalization companies tend to have limited liquidity and greater price volatility than large capitalization companies.
4
Brandes Separately Managed Account Reserve Trust
As with most fixed income funds, the income on and value of your shares in the fund will fluctuate along with interest rates. When interest rates rise, the market prices of the debt securities the fund owns usually decline. When interest rates fall, the prices of these securities usually increase. Generally, the longer the fund’s average portfolio maturity and the lower the average quality of its portfolio, the greater the price fluctuation. The price of any security owned by the fund may also fall in response to events affecting the issuer of the security, such as its ability to continue to make principal and interest payments or its credit rating. Below investment grade debt securities are speculative and involve a greater risk of default and price change due to changes in the issuer’s creditworthiness than higher grade debt. The market prices of these debt securities may fluctuate more than the market prices of investment grade debt securities and may decline significantly in periods of general economic difficulty.
Bond credit ratings are grades given to bonds that indicate their credit quality as determined by a private independent rating service. The firm evaluates a bond issuer’s financial strength, or its ability to pay a bond’s principal and interest in a timely fashion. Credit ratings are measured on a scale that generally ranges from AAA (highest) to D (lowest). All Fund securities except for those labeled “Not Rated” and “Other” have been rated by Moody’s, S&P or Fitch, which are each a Nationally Recognized Statistical Rating Organization. All Index securities except for those labeled “Not Rated” have been rated by Moody’s or S&P. Credit ratings are subject to change.
Index securities except for those labeled “Not Rated” have been rated by Moody’s or S&P. Credit ratings are subject to change.
Please refer to the Schedule of Investments in the report for complete holdings information. Fund holdings, geographic allocations and/or sector allocations are subject to change at any time and are not considered a recommendation to buy or sell any security.
The foregoing reflects the thoughts and opinions of Brandes Investment Partners® exclusively and is subject to change without notice.
Brandes Investment Partners® is a registered trademark of Brandes Investment Partners, L.P. in the United States and Canada.
Must be preceded or accompanied by a prospectus.
Index Guide
The Bloomberg Barclays U.S. Aggregate Bond Index is a broad-based benchmark that measures the investment grade, U.S. dollar-denominated, fixed-rate taxable bond market. This index is a total return index which reflects the price changes and interest of each bond in the index.
The Bloomberg U.S. Corporate High Yield Bond Index is an unmanaged index consisting of U.S. dollar-denominated, non-investment-grade, fixed-rate, taxable
5
Brandes Separately Managed Account Reserve Trust
corporate bonds. The index is a total return index which reflects the price changes and interest of each bond in the index.
The Bloomberg U.S. Credit Index measures the U.S. dollar-denominated, fixed-rate taxable corporate and government related bond markets. The index is a total return index which reflects the price changes and interest of each bond in the index.
The Bloomberg U.S. Financial Conditions Index tracks the overall level of financial stress in the U.S. money, bond, and equity markets to help assess the availability and cost of credit.
One cannot invest directly in an index.
The Brandes Separately Managed Account Reserve Trust Fund is distributed by ALPS Distributors, Inc.
6
Brandes Separately Managed Account Reserve Trust
The following chart compares the value of a hypothetical $10,000 investment in the Separately Managed Account Reserve Trust from March 31, 2014 to March 31, 2024 with the value of such an investment in the Bloomberg U.S. Aggregate Bond Index and Bloomberg U.S. Intermediate Credit Bond Index for the same period.
Value of $10,000 Investment vs Bloomberg U.S. Aggregate Bond
Index & Bloomberg U.S. Intermediate Credit Bond Index (Unaudited)
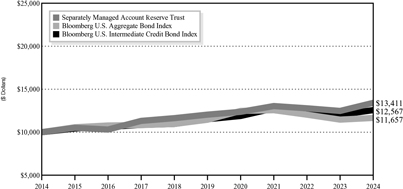
| | | | | | | | | | | | | | | | |
| | | Average Annual Total Return | |
| | | Periods Ended March 31, 2024 | |
| | | One
Year | | | Five
Years | | | Ten
Years | | | Since
Inception(1) | |
Brandes Separately Managed Account Reserve Trust | | | 7.53 | % | | | 2.18 | % | | | 2.98 | % | | | 4.48% | |
Bloomberg Barclays U.S. Aggregate Bond Index | | | 1.70 | % | | | 0.36 | % | | | 1.54 | % | | | 3.06% | |
Bloomberg Barclays U.S. Intermediate Credit Bond Index | | | 4.56 | % | | | 1.77 | % | | | 2.31 | % | | | 3.70% | |
| (1) | The inception date is October 3, 2005. |
Performance data quoted represents past performance; past performance does not guarantee future results. The investment return and principal value of an investment will fluctuate so that an investor’s shares, when redeemed, may be worth more or less than their original cost. Current performance of the Fund may be lower or higher than the performance quoted. Performance data current to the most recent month end may be obtained by calling 800-331-2979.
7
Brandes Separately Managed Account Reserve Trust
The returns shown do not reflect the deduction of taxes that a shareholder would pay on fund distributions or the redemption of fund shares.
Asset Allocation as a Percentage of Total Investments as of
March 31, 2024 (Unaudited)
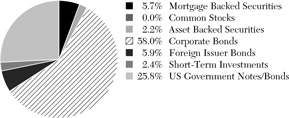
8
Brandes Separately Managed Account Reserve Trust
Expense Example (Unaudited)
As a shareholder of the Fund, you incur ongoing costs, including investment advisory and administrative fees and other Fund expenses. The example below is intended to help you understand your ongoing costs (in dollars) of investing in the Fund and to compare these costs with the ongoing costs of investing in other mutual funds. Note that for this Fund, which is used in wrap-fee programs, fees and expenses are paid at the wrap account level rather than the Fund level.
The example is based on an investment of $1,000 invested at the beginning of the period and held for the entire period from October 01, 2023 to March 31, 2024 (the “Period”).
Actual Expenses
This section provides information about actual account values and actual expenses. The “Ending Account Value” shown is derived from the Fund’s actual returns. You may use the information in this section, together with the amount you invested, to estimate the expenses that you paid over the Period. Simply divide your account value by $1,000 (for example, an $8,600 account value divided by $1,000 = 8.6), then multiply the result by the number given for the Fund under the heading “Expenses Paid During Period” to estimate the expenses you paid on your account during this Period.
| | | | | | | | |
Fund | | Beginning
Account
Value | | Ending
Account
Value | | Annualized
Expense
Ratio | | Expenses
Paid
During
the Period* |
| | | | | | | | | |
Seperately Managed Account Reserve Trust** | | $1,000.00 | | $1,090.80 | | 0.00% | | $0.00 |
| * | The Fund’s expenses are equal to the Fund’s expense ratio for the period, multiplied by the average account value over the period, multiplied by 183/366 (to reflect the one half-year period). |
| ** | No expenses have been charged to the Brandes Separately Managed Account Reserve Trust (“SMART Fund”) over the period, as the SMART Fund participates in a wrap-fee program sponsored by investment advisors unaffiliated with the SMART Fund. See Note 3 to the Financial Statements. Fees and expenses are charged at the wrap account level. |
Hypothetical Example for Comparison Purposes
This section provides information about hypothetical account values and hypothetical expenses based on the Fund’s actual expense ratio and an assumed rate of return of 5% per year before expenses, which is not the Fund’s actual return. The hypothetical account values and expenses may not be used to estimate the actual ending account balance or expenses you paid for the period. You may use this information to compare the ongoing costs of investing in the Fund and other mutual funds. To do so, compare this 5% hypothetical example with the 5% hypothetical examples that appear in the shareholder reports of the other mutual funds.
9
Brandes Separately Managed Account Reserve Trust
Please note that the expenses shown in the table are meant to highlight your ongoing costs only and do not reflect any transaction costs, such as brokerage commissions on purchase and sales of Fund shares. Therefore, the last column of the table is useful in comparing ongoing costs only, and will not help you determine the relative total costs of owning different funds. In addition, if these transactional costs were included, your costs would have been higher.
| | | | | | | | |
| | | | | | | | | Expenses |
| | | Beginning | | Ending | | Annualized | | Paid |
| | | Account | | Account | | Expense | | During |
| Fund | | Value | | Value | | Ratio | | the Period* |
Seperately Managed Account Reserve Trust** | | $1,000.00 | | $1,025.00 | | 0.00% | | $0.00 |
| * | The Fund’s expenses are equal to the Fund’s expense ratio for the period, multiplied by the average account value over the period, multiplied by 183/366 (to reflect the one half-year period). |
| ** | No expenses have been charged to the Brandes Separately Managed Account Reserve Trust (“SMART Fund”) over the period, as the SMART Fund participates in a wrap-fee program sponsored by investment advisors unaffiliated with the SMART Fund. See Note 3 to the Financial Statements. Fees and expenses are charged at the wrap account level. |
10
Brandes Separately Managed Account Reserve Trust
SCHEDULE OF INVESTMENTS — March 31, 2024 (Unaudited)
| | | | | | | | |
| | | Shares | | | Value | |
COMMON STOCKS – 0.00% | | | | | | | | |
Home Construction – 0.00% | | | | | | | | |
Urbi Desarrollos Urbanos SAB de CV (a) | | | 8,806 | | | $ | 3,655 | |
| | | | | | | | |
| | |
TOTAL COMMON STOCKS
(Cost $1,887,388) | | | | | | $ | 3,655 | |
| | | | | | | | |
| | |
| | | Principal Amount | | | Value | |
FEDERAL AND FEDERALLY SPONSORED CREDITS – 5.68% | | | | | | | | |
Federal Home Loan Mortgage Corporation – 2.22% | | | | | | | | |
Pool G1-8578 3.000%, 12/1/2030 | | $ | 521,515 | | | $ | 496,624 | |
Pool SD-2873 3.000%, 1/1/2052 | | | 2,375,774 | | | | 2,070,887 | |
Pool SD-8001 3.500%, 7/1/2049 | | | 650,115 | | | | 590,269 | |
Pool SD-8003 4.000%, 7/1/2049 | | | 328,170 | | | | 307,343 | |
| | | | | | | | |
| | |
| | | | | | | 3,465,123 | |
| | | | | | | | |
| | |
Federal National Mortgage Association – 3.46% | | | | | | | | |
Pool AL9865 3.000%, 2/1/2047 | | | 544,080 | | | | 479,041 | |
Pool AS6201 3.500%, 11/1/2045 | | | 224,171 | | | | 204,986 | |
Pool BN6683 3.500%, 6/1/2049 | | | 544,377 | | | | 495,223 | |
Pool CA0483 3.500%, 10/1/2047 | | | 3,130,363 | | | | 2,860,826 | |
Pool CA1624 3.000%, 4/1/2033 | | | 809,924 | | | | 762,038 | |
Pool MA3687 4.000%, 6/1/2049 | | | 635,952 | | | | 595,681 | |
| | | | | | | | |
| | |
| | | | | | | 5,397,795 | |
| | | | | | | | |
| | |
TOTAL FEDERAL AND FEDERALLY SPONSORED CREDITS
(Cost $8,901,248) | | | | | | $ | 8,862,918 | |
| | | | | | | | |
| | |
OTHER MORTGAGE RELATED SECURITIES – 0.00% | | | | | | | | |
Collateralized Mortgage Obligations – 0.00% | | | | | | | | |
Wells Fargo Mortgage Backed Securities Trust Series 2006-AR14 5.884%, 10/25/2036(b) | | $ | 912 | | | $ | 795 | |
| | | | | | | | |
TOTAL OTHER MORTGAGE RELATED SECURITIES
(Cost $911) | | | | | | $ | 795 | |
| | | | | | | | |
| | |
US GOVERNMENTS – 25.51% | | | | | | | | |
Sovereign Government – 25.51% | | | | | | | | |
United States Treasury Bond | | | | | | | | |
4.750%, 2/15/2037 | | $ | 4,250,000 | | | $ | 4,525,918 | |
3.500%, 2/15/2039 | | | 10,500,000 | | | | 9,660,410 | |
3.750%, 11/15/2043 | | | 9,000,000 | | | | 8,153,438 | |
3.000%, 5/15/2047 | | | 15,750,000 | | | | 12,393,281 | |
| | | | | | | | |
| | |
| | | | | | | 34,733,047 | |
| | | | | | | | |
United States Treasury Note
1.625%, 5/15/2031 | | | 6,000,000 | | | | 5,060,625 | |
| | | | | | | | |
TOTAL US GOVERNMENTS
(Cost $43,185,586) | | | | | | $ | 39,793,672 | |
| | | | | | | | |
The accompanying notes to financial statements are an integral part of this Schedule of Investments.
11
Brandes Separately Managed Account Reserve Trust
SCHEDULE OF INVESTMENTS — March 31, 2024 (Unaudited) (continued)
| | | | | | | | |
| | | Principal Amount | | | Value | |
CORPORATE BONDS – 57.44% | | | | | | | | |
Asset Management – 2.59% | | | | | | | | |
Charles Schwab Corp.
5.375% (U.S. Treasury Yield Curve Rate CMT 5Y + 4.971%), 6/1/2025(c) | | $ | 4,070,000 | | | $ | 4,041,015 | |
| | | | | | | | |
| | |
Automotive – 2.70% | | | | | | | | |
Ford Motor Credit Co. LLC | | | | | | | | |
3.375%, 11/13/2025 | | | 1,625,000 | | | | 1,563,660 | |
2.700%, 8/10/2026 | | | 2,845,000 | | | | 2,652,903 | |
| | | | | | | | |
| | |
| | | | | | | 4,216,563 | |
| | | | | | | | |
Banking – 11.72% | | | | | | | | |
Bank of America Corp.
4.450%, 3/3/2026 | | | 6,120,000 | | | | 6,029,907 | |
Citigroup, Inc.
4.400%, 6/10/2025 | | | 5,385,000 | | | | 5,311,234 | |
USB Capital IX
6.596% (CME Term SOFR 3M + 1.282%, minimum of 6.596%), Perpetual, 5/2/2024(c) | | | 8,525,000 | | | | 6,938,233 | |
| | | | | | | | |
| | |
| | | | | | | 18,279,374 | |
| | | | | | | | |
Cable & Satellite – 0.84% | | | | | | | | |
Charter Communications Operating LLC
4.908%, 7/23/2025 | | | 1,325,000 | | | | 1,309,059 | |
| | | | | | | | |
| | |
Commercial Support Services – 5.40% | | | | | | | | |
Prime Security Services Borrower LLC
| | | | | | | | |
5.750%, 4/15/2026(d) | | | 4,870,000 | | | | 4,855,250 | |
6.250%, 1/15/2028(d) | | | 3,635,000 | | | | 3,563,397 | |
| | | | | | | | |
| | |
| | | | | | | 8,418,647 | |
| | | | | | | | |
Containers & Packaging – 1.20% | | | | | | | | |
Sealed Air Corp.
4.000%, 12/1/2027(d) | | | 1,990,000 | | | | 1,864,735 | |
| | | | | | | | |
| | |
Electric Utilities – 3.50% | | | | | | | | |
American Transmission Systems, Inc.
2.650%, 1/15/2032(d) | | | 2,930,000 | | | | 2,427,970 | |
FirstEnergy Corp.
7.375%, 11/15/2031 | | | 2,580,000 | | | | 3,035,966 | |
| | | | | | | | |
| | |
| | | | | | | 5,463,936 | |
| | | | | | | | |
Entertainment Content – 0.96% | | | | | | | | |
Univision Communications, Inc.
8.000%, 8/15/2028(d) | | | 1,475,000 | | | | 1,502,695 | |
| | | | | | | | |
| | |
Food – 2.22% | | | | | | | | |
Pilgrim’s Pride Corp.
4.250%, 4/15/2031 | | | 3,845,000 | | | | 3,459,805 | |
| | | | | | | | |
The accompanying notes to financial statements are an integral part of this Schedule of Investments.
12
Brandes Separately Managed Account Reserve Trust
SCHEDULE OF INVESTMENTS — March 31, 2024 (Unaudited) (continued)
| | | | | | | | |
| | | Principal Amount | | | Value | |
Home Construction – 3.60% | | | | | | | | |
PulteGroup, Inc.
5.500%, 3/1/2026 | | $ | 3,920,000 | | | $ | 3,922,520 | |
Toll Brothers Finance Corp.
4.875%, 11/15/2025 | | | 1,710,000 | | | | 1,690,728 | |
| | | | | | | | |
| | |
| | | | | | | 5,613,248 | |
| | | | | | | | |
Household Products – 2.23% | | | | | | | | |
Coty, Inc.
5.000%, 4/15/2026(d) | | | 3,534,000 | | | | 3,482,730 | |
| | | | | | | | |
| | |
Institutional Financial Services – 1.73% | | | | | | | | |
Goldman Sachs Group, Inc.
3.800% (U.S. Treasury Yield Curve Rate CMT 5Y + 2.969%), 5/10/2026(c) | | | 2,900,000 | | | | 2,705,277 | |
| | | | | | | | |
| | |
Internet Media & Services – 4.55% | | | | | | | | |
Expedia Group, Inc. | | | | | | | | |
3.800%, 2/15/2028 | | | 810,000 | | | | 770,924 | |
3.250%, 2/15/2030 | | | 1,732,000 | | | | 1,559,330 | |
Netflix, Inc.
4.375%, 11/15/2026 | | | 4,840,000 | | | | 4,768,191 | |
| | | | | | | | |
| | | | | | | 7,098,445 | |
| | | | | | | | |
| | |
Leisure Facilities & Services – 3.02% | | | | | | | | |
Travel + Leisure Co.
6.625%, 7/31/2026(d) | | | 4,675,000 | | | | 4,707,893 | |
| | | | | | | | |
| | |
Oil & Gas Producers – 4.28% | | | | | | | | |
Hess Midstream Operations LP
4.250%, 2/15/2030(d) | | | 1,940,000 | | | | 1,782,415 | |
Range Resources Corp.
4.875%, 5/15/2025 | | | 4,925,000 | | | | 4,888,010 | |
| | | | | | | | |
| | |
| | | | | | | 6,670,425 | |
| | | | | | | | |
| | |
REIT – 1.81% | | | | | | | | |
Iron Mountain, Inc.
4.875%, 9/15/2027(d) | | | 2,925,000 | | | | 2,826,896 | |
| | | | | | | | |
| | |
Software – 3.16% | | | | | | | | |
VMware LLC | | | | | | | | |
4.500%, 5/15/2025 | | | 930,000 | | | | 920,953 | |
3.900%, 8/21/2027 | | | 4,176,000 | | | | 4,001,394 | |
| | | | | | | | |
| | | | | | | 4,922,347 | |
| | | | | | | | |
The accompanying notes to financial statements are an integral part of this Schedule of Investments.
13
Brandes Separately Managed Account Reserve Trust
SCHEDULE OF INVESTMENTS — March 31, 2024 (Unaudited) (continued)
| | | | | | | | |
| | | Principal Amount | | | Value | |
Telecommunications – 1.93% | | | | | | | | |
Sprint Spectrum Co. LLC
5.152%, 3/20/2028(d) | | $ | 1,590,400 | | | $ | 1,587,157 | |
T-Mobile USA, Inc.
4.750%, 2/1/2028 | | | 1,435,000 | | | | 1,416,356 | |
| | | | | | | | |
| | |
| | | | | | | 3,003,513 | |
| | | | | | | | |
TOTAL CORPORATE BONDS
(Cost $91,995,455) | | | | | | $ | 89,586,603 | |
| | | | | | | | |
| | |
FOREIGN ISSUER BONDS – 5.80% | | | | | | | | |
Chemicals – 2.00% | | | | | | | | |
Methanex Corp. | | | | | | | | |
5.125%, 10/15/2027 | | $ | 1,249,000 | | | $ | 1,208,547 | |
5.250%, 12/15/2029 | | | 2,005,000 | | | | 1,919,420 | |
| | | | | | | | |
| | |
| | | | | | | 3,127,967 | |
| | | | | | | | |
Oil, Gas Services & Equipment – 0.98% | | | | | | | | |
Transocean, Inc.
8.750%, 2/15/2030(d) | | | 1,462,500 | | | | 1,524,555 | |
| | | | | | | | |
| | |
Telecommunications – 2.82% | | | | | | | | |
SoftBank Group Corp.
4.750%, 9/19/2024 | | | 980,000 | | | | 970,709 | |
Telecom Italia Capital SA
6.375%, 11/15/2033 | | | 3,626,000 | | | | 3,425,681 | |
| | | | | | | | |
| | |
| | | | | | | 4,396,390 | |
| | | | | | | | |
TOTAL FOREIGN ISSUER BONDS
(Cost $9,666,949) | | | | | | $ | 9,048,912 | |
| | | | | | | | |
| | |
ASSET BACKED SECURITIES – 2.17% | | | | | | | | |
Specialty Finance – 2.17% | | | | | | | | |
SLM Private Credit Student Loan Trust Series 2004-B, 6.021%, (CME Term SOFR 3M + 0.692%), 9/15/2033(c) | | $ | 1,210,411 | | | $ | 1,193,298 | |
SLM Private Credit Student Loan Trust Series 2005-A, 5.901%, (CME Term SOFR 3M + 0.572%), 12/15/2038(c) | | | 838,394 | | | | 824,458 | |
SLM Private Credit Student Loan Trust Series 2006-A, 5.881%, (CME Term SOFR 3M + 0.552%), 6/15/2039(c) | | | 1,412,935 | | | | 1,369,612 | |
| | | | | | | | |
TOTAL ASSET BACKED SECURITIES
(Cost $3,259,525) | | | | | | $ | 3,387,368 | |
| | | | | | | | |
The accompanying notes to financial statements are an integral part of this Schedule of Investments.
14
Brandes Separately Managed Account Reserve Trust
SCHEDULE OF INVESTMENTS — March 31, 2024 (Unaudited) (continued)
| | | | | | | | |
| | | Shares | | | Value | |
SHORT-TERM INVESTMENTS – 2.42% | | | | | | | | |
Money Market Funds – 2.42% | | | | | | | | |
Northern Institutional Funds -Treasury Portfolio (Premier), 5.15%(e) | | | 3,763,665 | | | $ | 3,763,665 | |
| | | | | | | | |
| | |
TOTAL SHORT-TERM INVESTMENTS
(Cost $3,763,665) | | | | | | $ | 3,763,665 | |
| | | | | | | | |
| | |
Total Investments (Cost $162,660,727) – 99.02% | | | | | | $ | 154,447,588 | |
Other Assets in Excess of Liabilities – 0.98% | | | | | | | 1,530,202 | |
| | | | | | | | |
| | |
Total Net Assets – 100.00% | | | | | | $ | 155,977,790 | |
| | | | | | | | |
Percentages are stated as a percent of net assets.
SOFR Secured Overnight Financing Rate
LP Limited Partnership
REIT Real Estate Investment Trust
| (a) | Non-income producing security. |
| (b) | Variable rate security. The coupon is based on an underlying pool of loans. |
| (c) | Variable rate security. The coupon is based on a reference index and spread index. |
| (d) | Acquired in a transaction exempt from registration under Rule 144A or Section 4(a)(2) of the Securities Act of 1933. May be resold in the U.S. in transactions exempt from registration, normally to qualified institutional buyers. The total value of all such securities was $30,125,692 which represented 19.30% of the net assets of the Fund. |
| (e) | The rate shown is the annualized seven day yield as of March 31, 2024. |
The industry classifications represented in the Schedule of Investments are in accordance with Bloomberg Industry Classification Standards (BICS) or were otherwise determined by the Advisor to be appropriate. This information is unaudited.
The accompanying notes to financial statements are an integral part of this Schedule of Investments.
15
Brandes Separately Managed Account Reserve Trust
STATEMENT OF ASSETS AND LIABILITIES — March 31, 2024 (Unaudited)
| | | | |
ASSETS | | | | |
Investment in securities, at cost | | $ | 162,660,727 | |
| | | | |
| |
Investment in securities, at value | | $ | 154,447,588 | |
Cash | | | 31,366 | |
Receivables: | | | | |
Fund shares sold | | | 615,880 | |
Interest | | | 1,660,645 | |
| | | | |
| |
Total Assets | | | 156,755,479 | |
| | | | |
LIABILITIES | | | | |
Payables: | | | | |
Fund shares redeemed | | | 419,430 | |
Dividends payable | | | 358,259 | |
| | | | |
| |
Total Liabilities | | | 777,689 | |
| | | | |
| |
NET ASSETS | | $ | 155,977,790 | |
| | | | |
| |
COMPONENTS OF NET ASSETS | | | | |
Paid-in Capital | | $ | 175,587,320 | |
Total distributable earnings (loss) | | | (19,609,530 | ) |
| | | | |
| |
Total Net Assets | | $ | 155,977,790 | |
| | | | |
Net asset value, offering price and redemption proceeds per share | | | | |
Net Assets | | $ | 155,977,790 | |
Shares outstanding (unlimited shares authorized without par value) | | | 19,737,766 | |
Offering and redemption price | | $ | 7.90 | |
| | | | |
The accompanying notes to financial statements are an integral part of this statement.
16
Brandes Separately Managed Account Reserve Trust
STATEMENT OF OPERATIONS — For the Six Months Ended March 31, 2024 (Unaudited)
| | | | |
INVESTMENT INCOME | | | | |
Income | | | | |
Dividend income | | $ | 91,842 | |
Less: Foreign taxes withheld | | | (11 | ) |
Interest income | | | 3,738,041 | |
| | | | |
| |
Total Income | | | 3,829,872 | |
| | | | |
Expenses (Note 3) | | | | |
Total expenses | | | — | |
| | | | |
| |
Total net expenses | | | — | |
| | | | |
| |
Net investment income | | | 3,829,872 | |
| | | | |
| |
REALIZED AND UNREALIZED GAIN (LOSS) ON INVESTMENTS: | | | | |
Net realized gain (loss) on investments | | | (152,472 | ) |
Net change in unrealized appreciation (depreciation) on investments | | | 9,959,291 | |
| | | | |
| |
Net realized and unrealized gain on investments | | | 9,806,819 | |
| | | | |
| |
Net increase in net assets resulting from operations | | $ | 13,636,691 | |
| | | | |
The accompanying notes to financial statements are an integral part of this statement.
17
Brandes Separately Managed Account Reserve Trust
STATEMENT OF CHANGES IN NET ASSETS
| | | | | | | | |
| | | Six Months | | | |
| | | Ended | | | Year Ended |
| | | March 31, | | | September 30, |
| | | 2024 | | | 2023 |
INCREASE IN NET ASSETS FROM: | | | | | | | | |
OPERATIONS | | | | | | | | |
Net investment income | | $ | 3,829,872 | | | $ | 7,229,895 | |
Net realized gain (loss) on investments | | | (152,472 | ) | | | (2,208,647 | ) |
Net change in unrealized appreciation (depreciation) on investments | | | 9,959,291 | | | | 3,015,650 | |
| | | | | | | | |
| | |
Net increase (decrease) in net assets resulting from operations | | | 13,636,691 | | | | 8,036,898 | |
| | | | | | | | |
DISTRIBUTIONS TO SHAREHOLDERS | | | | | | | | |
Distributions to Shareholders | | | (3,799,111 | ) | | | (7,215,374 | ) |
| | | | | | | | |
| | |
Decrease in net assets from distributions | | | (3,799,111 | ) | | | (7,215,374 | ) |
| | | | | | | | |
| | |
CAPITAL SHARE TRANSACTIONS | | | | | | | | |
Proceeds from shares sold | | | 13,369,940 | | | | 24,768,280 | |
Net asset value of shares issued on reinvestment of distributions | | | 3,676,350 | | | | 6,802,184 | |
| | |
Cost of shares redeemed | | | (21,828,189 | ) | | | (31,266,107 | ) |
| | | | | | | | |
Net increase (decrease) in net assets from capital share transactions | | | (4,781,899 | ) | | | 304,357 | |
| | | | | | | | |
| | |
Total increase in net assets | | | 5,055,681 | | | | 1,125,881 | |
| | | | | | | | |
| | |
NET ASSETS | | | | | | | | |
Beginning of the Period | | | 150,922,109 | | | | 149,796,228 | |
| | | | | | | | |
| | |
End of the Period | | $ | 155,977,790 | | | $ | 150,922,109 | |
| | | | | | | | |
The accompanying notes to financial statements are an integral part of this statement.
18
Brandes Separately Managed Account Reserve Trust
FINANCIAL HIGHLIGHTS
| | | | | | | | | | | | | | | | | | | | | | | | |
| | | Six Months | | | | | | | | | | | | | | | | |
| | | Ended | | | Year Ended | |
| | | March 31, | | | September 30, | |
| | | 2024 | | | 2023 | | | 2022 | | | 2021 | | | 2020 | | | 2019 | |
| | | | | | |
Net asset value, beginning of period | | $ | 7.42 | | | $ | 7.38 | | | $ | 8.83 | | | $ | 8.94 | | | $ | 8.73 | | | $ | 8.65 | |
| | | | | | | | | | | | | | | | | | | | | | | | |
| | | | | | |
Total from investment operations: | | | | | | | | | | | | | | | | | | | | | | | | |
Net investment income(1) | | | 0.19 | | | | 0.36 | | | | 0.30 | | | | 0.27 | | | | 0.31 | | | | 0.36 | |
Net realized and unrealized gain/(loss) on investments | | | 0.48 | | | | 0.04 | | | | (1.45 | ) | | | (0.07 | ) | | | 0.21 | | | | 0.08 | |
| | | | | | | | | | | | | | | | | | | | | | | | |
| | | | | | |
Total from investment operations | | | 0.67 | | | | 0.40 | | | | (1.15 | ) | | | 0.20 | | | | 0.52 | | | | 0.44 | |
| | | | | | | | | | | | | | | | | | | | | | | | |
Less dividends and distributions: | | | | | | | | | | | | | | | | | | | | | | | | |
Dividends from net investment income | | | (0.19) | | | | (0.36 | ) | | | (0.30 | ) | | | (0.31 | ) | | | (0.31 | ) | | | (0.36 | ) |
| | | | | | | | | | | | | | | | | | | | | | | | |
| | | | | | |
Total dividends and distributions | | | (0.19) | | | | (0.36 | ) | | | (0.30 | ) | | | (0.31 | ) | | | (0.31 | ) | | | (0.36 | ) |
| | | | | | | | | | | | | | | | | | | | | | | | |
| | | | | | |
Net asset value, end of period | | $ | 7.90 | | | $ | 7.42 | | | $ | 7.38 | | | $ | 8.83 | | | $ | 8.94 | | | $ | 8.73 | |
| | | | | | | | | | | | | | | | | | | | | | | | |
Total return | | | 9.08%( | 2) | | | 5.39 | % | | | (13.30 | %) | | | 2.33 | % | | | 6.05 | % | | | 5.29 | % |
Net assets, end of period (millions) | | $ | 156.0 | | | $ | 150.9 | | | $ | 149.8 | | | $ | 186.5 | | | $ | 181.2 | | | $ | 177.0 | |
Ratio of expenses to average net assets(3) | | | 0.00%( | 4) | | | 0.00 | % | | | 0.00 | % | | | 0.00 | % | | | 0.00 | % | | | 0.00 | % |
Ratio of net investment income to average net assets(3) | | | 4.92%( | 4) | | | 4.74 | % | | | 3.63 | % | | | 3.04 | % | | | 3.52 | % | | | 4.27 | % |
Portfolio turnover rate | | | 12.97%( | 2) | | | 23.24 | % | | | 28.94 | % | | | 36.89 | % | | | 32.24 | % | | | 35.99 | % |
| (1) | Net investment income per share has been calculated based on average shares outstanding during the period. |
| (3) | Reflects the fact that no fees or expenses are incurred by the Fund. The Fund is an integral part of “wrap-fee” programs sponsored by investment advisors and/or broker-dealers unaffiliated with the Fund or the Advisor. Participants in these programs pay a “wrap” fee to the sponsor of the program. |
The accompanying notes to financial statements are an integral part of this statement.
19
Brandes Separately Managed Account Reserve Trust
NOTES TO FINANCIAL STATEMENTS
NOTE 1 – ORGANIZATION
The Brandes Separately Managed Account Reserve Trust (the “Fund”) is a series of Brandes Investment Trust (the “Trust”). The Trust is registered under the Investment Company Act of 1940, as amended (the “1940 Act”), as a diversified, open-end management investment company. The Fund began operations on October 3, 2005. The Fund invests its assets primarily in debt securities and seeks to maximize total return.
NOTE 2 – SIGNIFICANT ACCOUNTING POLICIES
The Fund is an investment company that applies the accounting and reporting guidance issued in Topic 946, “Financial Services-Investment Companies”, by the Financial Accounting Standards Board (“FASB”). The following is a summary of significant accounting policies consistently followed by the Fund. These policies are in conformity with generally accepted accounting principles (“GAAP”) in the United States of America.
| | A. | Repurchase Agreements. The Fund may enter into repurchase agreements with government securities dealers recognized by the Federal Reserve Board, with member banks of the Federal Reserve System or with other brokers or dealers that meet the credit guidelines established by the Board of Trustees. Each Fund will always receive and maintain, as collateral, U.S. Government securities whose market value, including accrued interest (which is recorded in the Schedules of Investments), will be at least equal to 100% of the dollar amount invested by the Fund in each agreement, and the Fund will make payment for such securities only upon physical delivery or upon evidence of book entry transfer to the account of the Fund’s custodian. If the term of any repurchase transaction exceeds one business day, the value of the collateral is marked-to-market on a daily basis to ensure the adequacy of the collateral. Before causing the Fund to enter into a repurchase agreement with any other party, the investment advisor will determine that such party does not have any apparent risk of becoming involved in bankruptcy proceedings within the time frame contemplated by the repurchase agreement. If the seller defaults and the value of the collateral declines, or if bankruptcy proceedings are commenced with respect to the seller of the security, realization of the collateral by the Fund may be delayed or limited. At March 31, 2024, the Fund did not invest in repurchase agreements. |
| | B. | Foreign Currency Translation and Transactions. Values of investments denominated in foreign currencies are converted into U.S. dollars using the spot market rates of exchange at the time of valuation. Purchases and sales of investments and dividend and interest income are translated into U.S. dollars using the spot market rates of exchange prevailing on the respective dates of such translations. The gain or loss resulting from changes in foreign exchange |
Brandes Separately Managed Account Reserve Trust
NOTES TO FINANCIAL STATEMENTS — (continued)
| | rates is included with net realized and unrealized gain or loss from investments, as appropriate. Foreign securities and currency transactions may involve certain considerations and risks not typically associated with those of domestic origin. |
Foreign securities are recorded in the financial statements after translation to U.S. dollars based on the applicable exchange rate at the end of the period. The Fund reports certain foreign currency-related transactions as components of realized gains or losses for financial reporting purposes, whereas such components are treated as ordinary income for federal income tax purposes.
| | C. | Delayed Delivery Securities. The Fund may purchase securities on a when issued or delayed delivery basis. “When-issued” or delayed delivery refers to securities whose terms are available and for which a market exists, but that have not been issued. For a when-issued or delayed delivery transaction, no payment is made until delivery date, which is typically longer than the normal course of settlement. When the Fund enters into an agreement to purchase securities on a when-issued or delayed delivery basis, the Fund segregates cash or liquid securities, of any type or maturity, equal in value to the Fund’s commitment. Losses may arise if the market value of the underlying securities change, if the counterparty does not perform under the contract, or if the issuer does not issue the securities due to political, economic, or other factors. The Fund did not have any open commitments on delayed delivery securities as of March 31, 2024. |
| | D. | Security Transactions, Dividends and Distributions. Security transactions are accounted for on the trade dates. Realized gains and losses are evaluated on the basis of identified cost. Distributions from net investment income are declared daily and paid monthly. Distributions of net realized gains, if any, are declared at least annually. Dividend income and distributions to shareholders are recorded on the ex-dividend dates. Interest is recorded on an accrual basis. The Fund amortizes premiums and accretes discounts using the constant yield method. |
| | E. | Use of Estimates. The preparation of financial statements in conformity with GAAP requires management to make estimates and assumptions that affect the reported amounts of assets and liabilities at the date of the financial statements and reported amounts of income and expenses during the reporting period. Actual results could differ from those estimates and assumptions. |
| | F. | Indemnification Obligations. Under the Trust’s organizational documents, its current and former officers and trustees are indemnified against certain liabilities arising out of the performance of their duties to the Trust. The Trust |
21
Brandes Separately Managed Account Reserve Trust
NOTES TO FINANCIAL STATEMENTS — (continued)
| | has indemnified its trustees against any expenses actually and reasonably incurred by the trustees in any proceeding arising out of or in connection with the trustees’ service to the Trust. In addition, in the normal course of business, the Trust enters into contracts that contain a variety of representations and warranties and provide general indemnifications. The Fund’s maximum exposure under these arrangements is unknown as this would involve future claims that may be made against the Fund that have not yet occurred or that would be covered by other parties. |
| | G. | Accounting for Uncertainty in Income Taxes. The Fund has elected to be taxed as a “regulated investment company” and intends to distribute substantially all its taxable income to its shareholders and otherwise comply with the provisions of the Internal Revenue Code applicable to regulated investment companies. The Fund may be subject to a nondeductible excise tax calculated as a percentage of certain undistributed amounts of net investment income and net capital gains. The Fund intends to distribute its net investment income and capital gains as necessary to avoid this excise tax. Therefore, no provision for federal income taxes or excise taxes has been made. |
The Trust analyzes all open tax years, as defined by the applicable statute of limitations, for all major jurisdictions. Open tax years for the Fund are those that are open for exam by taxing authorities (2020 through 2023). As of March 31, 2024 the Trust has no examinations in progress.
Management has analyzed the Trust’s tax positions, and has concluded that no liability should be recorded related to uncertain tax positions expected to be taken on the tax return for the fiscal year ended September 30, 2023.
The Trust identifies its major tax jurisdictions as the U.S. Government and the State of California. The Fund is not aware of any tax positions for which it is reasonably possible that the total amounts of unrecognized tax benefits will significantly change in the next twelve months.
| | H. | Fair Value Measurements. The Trust has adopted GAAP accounting principles related to fair value accounting standards which establish a definition of fair value and set out a hierarchy for measuring fair value. These standards require additional disclosures about the various inputs and valuation techniques used to develop the measurements of fair value and a discussion of changes in valuation techniques and related inputs during the period. These inputs are summarized in the three broad levels listed below: |
Level 1—Fair value measurement within Level 1 should be based on an unadjusted quoted price in an active market that the Fund has the ability to access for the asset or liability at the measurement date. Because a quoted price alone forms the basis for the measurement, the access requirement
Brandes Separately Managed Account Reserve Trust
NOTES TO FINANCIAL STATEMENTS — (continued)
within Level 1 limits discretion in pricing the asset or liability, including in situations in which there are multiple markets for the asset or liability with different prices and no single market represents a principal market for the asset or liability. Importantly, the FASB has indicated that when a quoted price in an active market for a security is available, that price should be used to measure fair value without regard to an entity’s intent to transact at that price.
Level 2—Fair value measurement within Level 2 should be based on all inputs other than unadjusted quoted prices included within Level 1 that are observable for the asset or liability. Other significant observable market inputs include quoted prices for similar instruments in active markets, quoted adjusted prices in active markets, quoted prices for identical or similar instruments in markets that are not active, and model derived valuations in which the majority of significant inputs and significant value drivers are observable in active markets.
Level 3—Fair value measurement within Level 3 should be based on unobservable inputs in such cases where markets do not exist or are illiquid. Significant unobservable inputs include model derived valuations in which the majority of significant inputs or significant value drivers are unobservable. Unobservable inputs are those inputs that reflect the Fund’s own assumptions that market participants would use to price the asset or liability based on the best available information.
| | I. | Security Valuation. Fixed income securities including corporate, convertible and municipal bonds and notes, U.S. government agencies, U.S. Treasury obligations, sovereign issues, bank loans, convertible preferred securities and non-U.S. bonds are normally valued on the basis of quotes obtained from brokers and dealers or independent pricing services or sources. Independent pricing services typically use information provided by market makers or estimates of market values obtained from yield data relating to investments or securities with similar characteristics. The service providers’ internal models use inputs that are observable such as, among other things, issuer details, interest rates, yield curves, prepayment speeds, credit risks/ spreads, default rates and quoted prices for similar assets. Securities that use similar valuation techniques and inputs as described above are categorized as Level 2 of the fair value hierarchy. |
Fixed income securities purchased on a delayed-delivery basis are typically marked to market daily until settlement at the forward settlement date.
Repurchase agreements and demand notes, for which neither vendor pricing nor market maker prices are available, are valued at amortized cost on the day of valuation, unless Brandes Investment Partners, L.P. (the “Advisor”)
23
Brandes Separately Managed Account Reserve Trust
NOTES TO FINANCIAL STATEMENTS — (continued)
determines that the use of amortized cost valuation on such day is not appropriate (in which case such instrument is fair valued in accordance with the fair value procedures of the Trust).
Mortgage and asset-backed securities are usually issued as separate tranches, or classes, of securities within each package of underlying securities. These securities are also normally valued by pricing service providers that use broker-dealer quotations or valuation estimates from their internal pricing models. The pricing models for these securities usually consider tranche level attributes, estimated cash flows and market based yield spreads for each tranche, current market data and packaged collateral performance, as available. Mortgage and asset-backed securities that use such valuation techniques and inputs are categorized as Level 2 of the fair value hierarchy only if there are significant observable inputs used.
Common stocks, exchange-traded fund shares and financial derivative instruments, such as futures contracts or options contracts that are traded on a national securities or commodities exchange, are valued at the last reported sales price, in the case of common stocks and exchange-traded fund shares, or, in the case of futures contracts or options contracts, the settlement price determined by the relevant exchange. Securities listed on the NASDAQ National Market System for which market quotations are readily available are valued using the NASDAQ Official Closing Price. To the extent these securities are actively traded and valuation adjustments are not applied, they are categorized as Level 1 of the fair value hierarchy.
Valuation adjustments may be applied to certain securities that are solely traded on a foreign exchange to account for the market movement between the close of the foreign market and the close of the New York Stock Exchange (“NYSE”). These securities are generally valued using pricing service providers that consider the correlation of the trading patterns of the foreign security to the intraday trading in the U.S. markets for investments. Securities using these valuation adjustments are categorized as Level 2 of the fair value hierarchy. None of the Fund’s securities were fair valued utilizing this method as of March 31, 2024.
Investments in registered open-end management investment companies are valued based upon the Net Asset Values (“NAVs”) of such investments and are categorized as Level 1 of the fair value hierarchy. If, on a particular day, a share price of an investment company is not readily available, such securities are fair valued in accordance with the fair value procedures of the Trust.
The Board of Trustees has designated the Advisor as the valuation designee pursuant to Rule 2a-5 under the 1940 Act to perform fair value determinations relating to any or all Fund investments. Certain securities may
Brandes Separately Managed Account Reserve Trust
NOTES TO FINANCIAL STATEMENTS — (continued)
be fair valued in accordance with the fair valuation procedures approved by the Board of Trustees. The Advisor is generally responsible for overseeing the day-to-day valuation processes and the Board of Trustees oversees the Advisor in its role as valuation designee in accordance with the requirements of Rule 2a-5 under the 1940 Act. The Advisor is authorized to make all necessary determinations of the fair value of portfolio securities and other assets for which market quotations are not readily available or if it is deemed that the prices obtained from brokers and dealers or independent pricing services are unreliable. The securities fair valued by the Advisor are indicated in the Schedules of Investments and are categorized as Level 2 or Level 3 of the fair value hierarchy. Certain vendor priced securities may also be considered Level 3 if significant unobservable inputs are used by the vendors.
In using fair value pricing, the Fund attempts to establish the price that it might reasonably have expected to receive upon a sale of the security at 4:00 p.m. Eastern time. Valuing securities at fair value involves greater reliance on judgment than valuation of securities based on readily available market quotations. When using fair value to price securities, the Fund may value those securities higher or lower than another fund using market quotations or fair value to price the same securities. Further, there can be no assurance that the Fund could obtain the fair value assigned to a security if it were to sell the security at approximately the time at which the Fund determines its net asset value.
The following is a summary of the level inputs used, as of March 31, 2024, involving the Fund’s assets carried at fair value. The inputs used for valuing securities may not be an indication of the risk associated with investing in those securities.
| | | | | | | | | | | | | | | | |
Description | | Level 1 | | | Level 2 | | | Level 3 | | | Total | |
Seperately Managed Account Reserve Trust | | | | | | | | | | | | | | | | |
Common Stocks | | $ | — | | | $ | 3,655 | | | | $— | | | $ | 3,655 | |
Asset Backed Securities | | | — | | | | 3,387,368 | | | | — | | | | 3,387,368 | |
Corporate Bonds | | | — | | | | 89,586,603 | | | | — | | | | 89,586,603 | |
Government Securities | | | — | | | | 8,862,918 | | | | — | | | | 8,862,918 | |
Foreign Issuer Bonds | | | — | | | | 9,048,912 | | | | — | | | | 9,048,912 | |
US Governments | | | — | | | | 39,793,672 | | | | — | | | | 39,793,672 | |
Mortgage Backed Securities | | | — | | | | 795 | | | | — | | | | 795 | |
Short-Term Investments | | | 3,763,665 | | | | — | | | | — | | | | 3,763,665 | |
| | | | | | | | | | | | | | | | |
Total Investments in Securities | | $ | 3,763,665 | | | $ | 150,683,923 | | | | $— | | | $ | 154,447,588 | |
| | | | | | | | | | | | | | | | |
There were no Level 3 securities in the Fund at the beginning or the end of the period ended March 31, 2024.
25
Brandes Separately Managed Account Reserve Trust
NOTES TO FINANCIAL STATEMENTS — (continued)
NOTE 3 – INVESTMENT ADVISORY FEE AND OTHER TRANSACTIONS WITH AFFILIATES
| | A. | Advisor Fee. The Advisor provides the Fund with investment management services under an Investment Advisory Agreement. The Advisor receives no advisory fee or other fee from the Fund. The financial statements of the Fund reflect the fact that no fees or expenses are incurred by the Fund. It should be understood, however, that the Fund is an integral part of “wrap-fee” programs sponsored by investment advisors unaffiliated with the Fund and the Advisor. Typically, participants in these programs pay a “wrap-fee” to their investment advisors. Although the Fund does not compensate the Advisor directly for its service under the Investment Advisory Agreement, the Advisor benefits from its relationships with the sponsors of wrap-fee programs for which the Fund is an investment option. Certain officers and Trustees of the Trust are also officers of the Advisor. |
| | B. | Administration Fee. The Northern Trust Company (the “Administrator”) acts as the administrator for the Fund. The Administrator prepares various federal and state regulatory filings; prepares reports and materials to be supplied to the Trustees; monitors the activities of the Fund’s custodian, transfer agent and accountant; coordinates the preparation and payment of Fund expenses; and prepares several Fund reports. The Advisor compensates the Administrator on behalf of the Fund for the services the Administrator performs for the Fund. |
| | C. | Distribution Fees. ALPS Distributors, Inc. (the “Distributor”), a registered broker-dealer, acts as the Fund’s principal underwriter in a continuous public offering of the Fund’s shares. All of the Fund’s distribution fees are paid by the Advisor. |
NOTE 4 – PURCHASES AND SALES OF SECURITIES
The cost of purchases and the proceeds from sales of securities of the Fund, excluding short-term investments, were as follows for the period ended March 31, 2024:
| | | | | | |
| U.S. Government | | Other |
| Purchases | | Sales | | Purchases | | Sales |
| $12,733,242 | | $6,740,908 | | $6,889,677 | | $16,429,215 |
Brandes Separately Managed Account Reserve Trust
NOTES TO FINANCIAL STATEMENTS — (continued)
NOTE 5 – CAPITAL STOCK TRANSACTIONS
The Fund’s capital stock activity in shares and dollars during the six month period ended March 31, 2024 and the year ended September 30, 2023, was as follows (shares and dollar amounts in thousands):
| | | | | | | | | | | | | | | | |
| | | Six Months
Ended
3/31/2024 | | | Year Ended
9/30/2023 | |
| | | Shares | | | Amount | | | Shares | | | Amount | |
Shares Sold | | | 1,747 | | | $ | 13,370 | | | | 3,259 | | | $ | 24,768 | |
Issued on Reinvestment of Distributions | | | 476 | | | | 3,676 | | | | 896 | | | | 6,802 | |
Shares Redeemed | | | (2,831 | ) | | | (21,828 | ) | | | (4,115 | ) | | | (31,266 | ) |
| | | | | | | | | | | | | | | | |
| | | | |
Net Increase/(Decrease) Resulting from Fund Share Transactions | | | (608 | ) | | $ | (4,782 | ) | | | 40 | | | $ | 304 | |
| | | | | | | | | | | | | | | | |
NOTE 6 – FEDERAL INCOME TAX MATTERS
GAAP requires that certain components of net assets be reclassified between financial and tax reporting. Temporary differences do not require reclassification. Temporary and permanent differences have no effect on net assets or net asset value per share. For the year ended September 30, 2023, the Fund made the following permanent book-to-tax reclassifications primarily related to the treatment of paydowns:
| | | | |
Undistributed Net
Investment Income | | Accumulated Net
Realized Loss | | Paid-In Capital |
| $8,761 | | $(8,761) | | $— |
As of September 30, 2023, the Fund’s components of distributable earnings on a tax basis were as follows:
| | | | |
Cost of investments for tax purposes | | $ | 167,823,473 | |
| | | | |
Gross tax unrealized appreciation | | | 146,521 | |
Gross tax unrealized depreciation | | | (18,318,951 | ) |
| | | | |
Net unrealized appreciation (depreciation) | | | (18,172,430 | ) |
Distributable ordinary income | | | 75,626 | |
Distributable long-term capital gains | | | — | |
| | | | |
| |
Total distributable earnings | | | 75,626 | |
| | | | |
| |
Other accumulated losses | | | (11,350,306 | ) |
| | | | |
| |
Total accumulated losses | | $ | (29,447,110 | ) |
| | | | |
As of September 30, 2023, the Fund had a capital loss carryforward with an indefinite expiration in the amount of $11,350,306. During the tax year ended September 30, 2023, the Fund utilized $0 in capital loss carryforwards.
27
Brandes Separately Managed Account Reserve Trust
NOTES TO FINANCIAL STATEMENTS — (continued)
The tax compositions of dividends for the years ended September 30, 2023 and September 30, 2022 for the Fund were as follows:
| | | | | | |
| Ordinary Income | | Long Term
Capital Gains |
| 2023 | | 2022 | | 2023 | | 2022 |
| $7,215,374 | | $6,148,231 | | $— | | $— |
NOTE 7 – RISK FACTORS
Significant market disruptions, such as those caused by pandemics (e.g. Covid-19 pandemic), war (e.g. Russia’s invasion of Ukraine or war in the Middle East), natural disasters, acts of terrorism, or other events, may adversely impact global economic and market activity, and contribute to significant volatility in financial markets. Any such disruptions could have an adverse impact on the prices and liquidity of the Funds’ investments.
NOTE 8 – SUBSEQUENT EVENTS
In preparing these financial statements, the Trust has evaluated events and transactions for potential recognition or disclosure through the date the financial statements were available to be issued. The Trust has concluded that there are no subsequent events to note, other than the item noted below:
The Board of Trustees of the Trust has approved an Agreement and Plan of Reorganization, with respect to the Fund (the “Reorganization Agreement”), with Datum One Series Trust to reorganize the Fund with and into a corresponding Acquiring Fund. The Acquiring Fund is a new series of Datum One Series Trust created specifically for the purpose of acquiring the assets and liabilities of the corresponding Fund. The Reorganization Agreement requires approval by shareholders of the Fund. Notice has been given that a joint special meeting of shareholders of the Fund is scheduled to be held at 10:00 AM Pacific Time on June 13, 2024, at the offices of the Advisor to approve the Reorganization Agreement. If the Fund reorganization is approved, it is expected to close in July 2024, or such other date as the parties may agree. The Acquiring Fund will not commence operations until the closing date.
Brandes Separately Managed Account Reserve Trust
ADDITIONAL INFORMATION — (Unaudited)
BOARD CONSIDERATIONS AND CONTINUATION OF INVESTMENT ADVISORY AGREEMENT
In November 2023, the Board of Trustees (the “Board”) of Brandes Investment Trust (the “Trust”), including the trustees who are not “interested persons” of the Trust (the “Independent Trustees”) as defined in the Investment Company Act of 1940, as amended, unanimously approved the renewal of the Investment Advisory Agreement (the “Agreement”) between the Trust and Brandes Investment Partners, L.P. (the “Advisor”) for an additional one-year term with respect to the Brandes Separately Managed Account Reserve Trust (the “Fund”).
Information Reviewed
During the course of each year, the Board receives and reviews a wide variety of materials relating to the nature, quality and extent of the services provided by the Advisor to the Fund, including reports on the Fund’s investment results, portfolio composition, portfolio trading practices, and other matters. In addition, in connection with the Board’s annual review of the Agreement, the Trustees requested and reviewed supplementary information from the Advisor that included materials and analysis about the Fund’s investment results and advisory fees; information about the services provided by the Advisor to the Fund, such as compliance monitoring and portfolio trading practices, and the risks assumed by the Advisor in connection with those services; information about the services provided and the fees charged by the Advisor to its institutional and other clients employing similar strategies, including comparisons of those services and fees to the services and fees for the Fund; financial and profitability information regarding the Advisor and its relationship with the Fund; and information about the Advisor’s investment and other personnel providing services to the Fund, as well as the Advisor’s practices to evaluate and compensate its investment personnel. The Trustees also obtained and reviewed information from FUSE Research Network LLC (“FUSE”), an independent third-party data provider, comparing the Fund’s investment results and fees and expenses to those of a peer group and category of funds identified by FUSE as similar to the Fund.
In connection with the Board’s reviews, the Trustees received assistance and advice regarding legal and industry standards from counsel to the Trust and the independent Trustees. The Board discussed the approval of the Agreement with respect to the Fund with representatives of the Advisor at two Board meetings, and the independent Trustees discussed the Agreement in multiple private sessions with counsel at which no representatives of the Advisor were present. In deciding to approve the Agreement with respect to the Fund, the Board and the independent Trustees did not identify any single or particular piece of information that, in isolation, was the controlling factor, and each Trustee may have attributed different weight to each factor considered. This summary describes the most important, but not all, of the factors considered by the Board and the independent Trustees.
29
Brandes Separately Managed Account Reserve Trust
ADDITIONAL INFORMATION — (Unaudited) (continued)
Nature, Quality and Extent of Services
The Trustees considered the overall nature, quality and extent of services provided by the Advisor to the Fund. They considered, among other things, the quality and depth of the Advisor’s investment, compliance and other personnel, the Advisor’s regulatory compliance resources and program, the Advisor’s business continuity and cybersecurity programs, and the day-to-day administrative services provided to the Fund.
With respect to the Fund’s investment results, the Trustees reviewed and considered detailed information provided by FUSE, which utilized Morningstar data, comparing the Fund’s investment results to those of a peer group of similarly managed funds selected by FUSE, a larger group of funds selected by FUSE in the same investment classification as the subject fund, and the Fund’s benchmark index. The Trustees also met with representatives of FUSE and discussed with them the methodology used by FUSE in determining the Fund’s peer group and universe. The FUSE report included confirmation that FUSE had selected peer group and universe funds for comparison to the Fund independently of the Advisor. The Trustees noted that while the FUSE information covered both the peer group and universe funds, the Trustees focused more on the peer group information because the peer group funds were more directly comparable to the Fund.
The Trustees considered that for the one-, three-, five- and ten-year periods ended September 30, 2023, the investment results of the Fund were ahead of benchmark. The Trustees also considered that the investment results of the Fund were above median of the peers in the Fund’s FUSE peer group for the one-, three-, five- and ten-year periods, and at the median for the period since inception.
In evaluating the Fund’s performance, the Trustees generally considered long-term performance to be more important than short-term performance but noted that short-term performance may be helpful in showing an improving trend. The Trustees noted the Advisor’s continued commitment to the Graham and Dodd value style of investment management and its lack of style drift compared to other value managers; considered that it is not unusual for the performance of funds managed with such a long-term strategy to fall below performance measurement indices for some periods; noted the Advisor’s observations regarding the market environment in recent years, including extended periods where the value style has been out of favor in the market, recent periods where the value style has outperformed in both U.S. and non-U.S. markets, and the outperformance of the value style over the past year in both developed non-U.S. markets and emerging markets; and noted that the Advisor’s strategies generally have performed well when value is performing well in the market. They also noted that the Fund’s investment approach is fully described in the prospectus, enabling Fund shareholders to decide if they are willing to accept the long-term outlook associated with the Advisor’s investment approach.
Brandes Separately Managed Account Reserve Trust
ADDITIONAL INFORMATION — (Unaudited) (continued)
Based on these reviews, the Trustees determined that under all of the circumstances the nature and quality of the services provided by the Advisor were sufficient for renewal of the Fund’s Agreement.
Advisory Fees, Total Expenses, Profitability and Ancillary Benefits
With respect to advisory fees, the Trustees considered that investors in the Fund must be clients of wrap account programs sponsored by broker-dealers which have agreements with the Advisor or certain other persons or entities. They considered that the Fund does not pay advisory fees or other expenses, all of which are borne by the Advisor, but that investors pay management fees and other expenses at the wrap account level, and that the Advisor receives compensation from the wrap program sponsors and others. The Trustees determined that the Fund’s advisory fees and total expense levels were fair and reasonable in light of the structure of the product. The Trustees also concluded that there was a reasonable sharing of any efficiencies or economies of scale at this time in light of the structure of the product.
The Trustees reviewed and considered information about the Advisor’s financial capability to continue to provide services to the Fund, as well as an analysis of the profitability to the Advisor of its relationship with the Fund. The Trustees considered information regarding the ancillary benefits to the Advisor from its relationship with the Fund, which primarily related to compensation from wrap program sponsors that offer the Fund. The Trustees concluded that the Advisor’s profitability from its relationship with the Fund is not excessive and that any ancillary benefits received are reasonable under the circumstances.
Conclusions
Based on their review, including consideration of the factors identified above, the Board and the independent Trustees concluded in the exercise of their reasonable business judgment that the Agreement is fair and reasonable to the Fund and its shareholders, and that renewal of the Agreement is in the best interests of the Fund and its shareholders.
PROXY VOTING PROCEDURES
The Advisor votes proxies relating to the Fund’s portfolio securities in accordance with procedures adopted by the Advisor. You may obtain a description of these procedures, free of charge, by calling toll-free 1-800-331-2979. This information is also available through the Commission’s website at http://www.sec.gov.
Information regarding how the Trust voted proxies relating to portfolio securities during the most recent 12-month period ended June 30 is available without charge, upon request, by calling 1-800-331-2979. This information is also available through the Commission’s website at http://www.sec.gov.
31
Brandes Separately Managed Account Reserve Trust
ADDITIONAL INFORMATION — (Unaudited) (continued)
PORTFOLIO HOLDINGS DISCLOSURE
The Trust files the Fund’s complete schedule of portfolio holdings with the Commission for the first and third quarters of each fiscal year on Form N-PORT. The Trust’s Form N-PORT filings are available on the Commission’s website at http://www.sec.gov. Information regarding the Trust’s Form N-PORT filings is also available, without charge, by calling toll-free, 1-800-331-2979.
Brandes Separately Managed Account Reserve Trust
TRUSTEES AND OFFICERS INFORMATION — (Unaudited)
The Board is responsible for the overall management of the Trust’s business. The Board approves all significant agreements between the Trust and persons or companies furnishing services to it, including the agreements with the Advisor, Administrator, the Trust’s Custodian, Distributor and Transfer Agent. The Board delegates the day-to-day operations of the Trust to its officers, subject to the Fund’s investment objective and policies and to general supervision by the Board. The Trust’s Statement of Additional Information includes additional information about the Trustees and is available, without charge, by calling 1-800-331-2979 or visiting www.brandes.com.
The Trustees and officers of the Trust, their business addresses and principal occupations during the past five years are:
| | | | | | | | | | |
Name, Address and Year of Birth | | Position(s)
Held with
Trust | | Term of
Office and Length
of Time
Served(1) | | Principal Occupation During Past 5 Years | | Number
of Trust
Series
Overseen
by Trustee | | Other
Directorships/
Trusteeships
Held by
Trustee |
| | | | | | | | | | | |
| Independent Trustees(2) | | | | | | |
| | | | | |
Gregory Bishop, CFA 4275 Executive Square, 5th Floor La Jolla, CA 92037 (1961) | | Trustee | | Since January 2017 | | Retired. Previously Executive Vice President and Head of Retail Business, PIMCO Investments, from 1997 to 2014 | | 7 | | None |
| | | | | |
Robert M. Fitzgerald 4275 Executive Square, 5th Floor La Jolla, CA 92037 (1952) | | Trustee | | Since April 2008 | | Retired from 2002- 2005 and since 2007; Chief Financial Officer of National Retirement Partners from 2005 to 2007. | | 7 | | Hotchkis
and Wiley
Funds (10
portfolios). |
| | | | | |
Craig Wainscott, CFA 4275 Executive Square, 5th Floor La Jolla, CA 92037 (1961) | | Trustee and
(beginning
January 2018)
Chairman
of the Board | | Since February 2012 | | Retired from Russell Investments, Managing Director, US Mutual Funds; Currently Partner with The Paradigm Project and advisor to early-stage companies. | | 7 | | None |
33
Brandes Separately Managed Account Reserve Trust
TRUSTEES AND OFFICERS INFORMATION — (Unaudited) (continued)
| | | | | | | | | | | | | | | | |
Name, Address and Year of Birth | | Position(s)
Held with
Trust | | | Term of
Office and Length
of Time
Served(1) | | Principal Occupation During Past 5 Years | | Number
of Trust
Series
Overseen
by Trustee | | | Other
Directorships/
Trusteeships
Held by
Trustee | |
| | | | | | | | | | | | | | |
“Interested” Trustees(3) | | | | | | | | | | |
| | | | | |
Jeff Busby, CFA 4275 Executive Square, 5th Floor La Jolla, CA 92037 (1961) | |
| Trustee and
President |
| | Since July 2006 Since February 2012 | | Retired. Formerly, Executive Director of the Advisor from January 2004 through December 2023. | | | 7 | | | | None | |
| | | | | |
Oliver Murray 4275 Executive Square, 5th Floor La Jolla, CA 92037 (1961) | | | Trustee | | | Since February 2012 | | CEO, Brandes Investment Partners & Co. since 2002; Managing Director - PCPM of the Advisor since 2011. | | | 7 | | | | None | |
| | | | | |
Officers of the Trust | | | | | | | | | | | | | | | | |
| | | | | |
Thomas M. Quinlan 4275 Executive Square, 5th Floor La Jolla, CA 92037 (1970) | | | Secretary | | | Since June 2003 | | Associate General Counsel of the Advisor since January 2006. | | | N/A | | | | N/A | |
| | | | | |
Gary Iwamura, CPA 4275 Executive Square, 5th Floor La Jolla, CA 92037 (1956) | | | Treasurer | | | Since September 1997 | | Retired. Consultant to Advisor January 2022 to present. Finance Director of the Advisor January 1997 through December 2021. | | | N/A | | | | N/A | |
| | | | | |
Roberta Loubier 4275 Executive Square, 5th Floor La Jolla, CA 92037 (1971) | |
| Chief
Compliance
Officer and
Anti-Money
Laundering
Officer |
| | Since September 2015 | | Global Head of Compliance of the Advisor. | | | N/A | | | | N/A | |
| (1) | Trustees and officers of the Fund serve until their resignation, removal or retirement. |
| (2) | Not “interested persons” of the Trust as defined in the 1940 Act. |
| (3) | “Interested persons” of the Trust as defined in the 1940 Act. Jeff Busby is an interested person of the Trust because he is the President of the Trust and was the Executive Director of the Advisor from January 2004 until December 2023. Oliver Murray is an interested person of the Trust, because he is the Managing Director of the Advisor. |
Brandes Separately Managed Account Reserve Trust
PRIVACY NOTICE
Brandes Investment Trust and Brandes Investment Partners, L.P. may collect non-public information about you from the following sources:
| ● | Information we receive about you on applications or other forms; |
| ● | Information you give us orally; and |
| ● | Information about your transactions with us. |
We do not disclose any non-public personal information about any shareholder or former shareholder of the Fund without the shareholder’s authorization, except as required by law or in response to inquiries from governmental authorities. We restrict access to your personal and account information to those employees who need to know that information to provide products and services to you. We also may disclose that information to unaffiliated third parties (such as to brokers or custodians) only as permitted by law and only as needed for us to provide agreed services to you. We maintain physical, electronic and procedural safeguards to guard your non-public personal information.
If you hold shares of the Fund through a financial intermediary, such as a broker-dealer, bank, or trust company, the privacy policy of your financial intermediary governs how your non-public personal information would be shared with nonaffiliated third parties.
35

ADVISOR Brandes Investment Partners, L.P. 4275 Executive Square, 5th Floor La Jolla, CA 92037 800.331.2979 DISTRIBUTOR ALPS Distributors, Inc. 1290 Broadway, #1100 Denver, CO 80203 TRANSFER AGENT The Northern Trust Company 333 South Wabash Avenue, W-38 Chicago, IL 60604 INDEPENDENT REGISTERED PUBLIC ACCOUNTING FIRM PricewaterhouseCoopers LLP 601 South Figueroa Street Los Angeles, CA 90017 LEGAL COUNSEL Morgan, Lewis & Bockius LLP One Federal Street Boston, MA 02110 This report is intended for shareholders of the Brandes Separately Managed Account Reserve Trust and may not be used as sales literature unless preceded or accompanied by a current prospectus. Statements and other information herein are dated and are subject to change. BITS 03/31
(b) Not applicable.
1
Item 2. Code of Ethics.
Not applicable for semi-annual reports.
Item 3. Audit Committee Financial Expert.
Not applicable for semi-annual reports.
Item 4. Principal Accountant Fees and Services.
Not applicable for semi-annual reports.
Item 5. Audit Committee of Listed Registrants.
Not applicable to registrants who are not listed issuers (as defined in Rule 10A-3 under the Securities Exchange Act of 1934).
Item 6. Investments.
| (a) | Schedule I – Investments in securities of unaffiliated issuers is included as part of the reports to shareholders filed under Item 1 of this Form. |
Item 7. Disclosure of Proxy Voting Policies and Procedures for Closed-End Management Investment Companies.
Not applicable to open-end investment companies.
Item 8. Portfolio Managers of Closed-End Management Investment Companies.
Not applicable to open-end investment companies.
Item 9. Purchases of Equity Securities by Closed-End Management Investment Company and Affiliated Purchasers.
Not applicable to open-end investment companies.
1
Item 10. Submission of Matters to a Vote of Security Holders.
There have been no material changes to the procedures by which shareholders may recommend nominees to the registrant’s Board of Trustees.
Item 11. Controls and Procedures.
| (a) | The registrant’s President and Treasurer have reviewed the Registrant’s disclosure controls and procedures (as defined in Rule 30a-3(c) of the Investment Company Act of 1940 (“the Act”)) as of a date within 90 days of the filing date of this report, as required by 30a-3(b) under the Act and Rules 13a-15(b) or 15d-15(b) under the Securities Exchange Act of 1934. Based on their review, such officers have concluded that the disclosure controls and procedures are effective in ensuring that information required to be disclosed in this report is appropriately recorded, processed, summarized and reported and made known to them by others within the Registrant and by the Registrant’s service provider. |
| (b) | No changes in the registrant’s internal control over financial reporting (as defined in Rule 30a-3(d) under the Act) occurred during the period covered by this report that materially affected or are reasonably likely to materially affect, the registrant’s internal control over financial reporting. |
Item 12. Disclosure of Securities Lending Activities for Closed-End Management Investment Companies.
Not applicable to open-end investment companies.
Item 13. Exhibits.
(a)(1) Not applicable for semi-annual reports.
(a)(2) Filed herewith.
(a)(3) Not applicable to open-end investment companies.
(a)(4) There has been no change to the registrant’s independent public accountant.
(b) Certifications pursuant to Section 906 of the Sarbanes-Oxley Act of 2002. Filed herewith.
2
SIGNATURES
Pursuant to the requirements of the Securities Exchange Act of 1934 and the Investment Company Act of 1940, the registrant has duly caused this report to be signed on its behalf by the undersigned, thereunto duly authorized.
Brandes Investment Trust
| | |
| By: | | /s/ Jeff Busby |
| | Jeff Busby |
| | President and Principal Executive Officer |
Date: June 3, 2024
Pursuant to the requirements of the Securities Exchange Act of 1934 and the Investment Company Act of 1940, this report has been signed below by the following persons on behalf of the registrant and in the capacities and on the dates indicated.
| | |
| By: | | /s/ Jeff Busby |
| | Jeff Busby |
| | President and Principal Executive Officer |
Date: June 3, 2024
| | |
| By: | | /s/Gary Iwamura |
| | Gary Iwamura |
| | Treasurer and Principal Financial Officer |
Date: June 3, 2024
3