UNITED STATES
SECURITIES AND EXCHANGE COMMISSION
Washington, D.C. 20549
FORM N-CSR
CERTIFIED SHAREHOLDER REPORT OF REGISTERED
MANAGEMENT INVESTMENT COMPANIES
Investment Company Act file number 811-7205
Variable Insurance Products Fund III
(Exact name of registrant as specified in charter)
82 Devonshire St., Boston, Massachusetts 02109
(Address of principal executive offices) (Zip code)
Eric D. Roiter, Secretary
82 Devonshire St.
Boston, Massachusetts 02109
(Name and address of agent for service)
Registrant's telephone number, including area code: 617-563-7000
Date of fiscal year end: | December 31 |
| |
Date of reporting period: | December 31, 2005 |
Item 1. Reports to Stockholders
Fidelity® Variable Insurance Products:
Aggressive Growth Portfolio
|

Annual Report
December 31, 2005
|

| Contents | | | | |
| |
| Performance | | 3 | | How the fund has done over time. |
| Management’s Discussion | | 4 | | The manager’s review of fund performance, strategy and |
| | | | | outlook. |
| Shareholder Expense Example | | 5 | | An example of shareholder expenses. |
| Investment Changes | | 6 | | A summary of major shifts in the fund’s investments over the |
| | | | | past six months. |
| Investments | | 7 | | A complete list of the fund’s investments with their |
| | | | | market values. |
| Financial Statements | | 11 | | Statements of assets and liabilities, operations, and |
| | | | | changes in net assets, as well as financial highlights. |
| Notes | | 15 | | Notes to the financial statements. |
| Report of Independent Registered Public | | 19 | | |
| Accounting Firm | | | | |
| Trustees and Officers | | 20 | | |
| Distributions | | 25 | | |
| Board Approval of Investment Advisory | | 26 | | |
| Contracts and Management Fees | | | | |
| | To view a fund’s proxy voting guidelines and proxy voting record for the 12 month period ended June 30, visit www.fidelity.com/proxyvotingresults or visit the
Securities and Exchange Commission’s (SEC) web site at www.sec.gov. You may also call 1-877-208-0098 to request a free copy of the proxy voting guidelines.
Fidelity Variable Insurance Products are separate account options which are purchased through a variable insurance contract.
Standard & Poor’s, S&P and S&P 500 are registered service marks of The McGraw Hill Companies, Inc. and have been licensed for use by
Fidelity Distributors Corporation.
Other third party marks appearing herein are the property of their respective owners.
All other marks appearing herein are registered or unregistered trademarks or service marks of FMR Corp. or an affiliated company.
|
| | This report and the financial statements contained herein are submitted for the general information of the shareholders of the fund. This report is not authorized for
distribution to prospective investors in the fund unless preceded or accompanied by an effective prospectus.
A fund files its complete schedule of portfolio holdings with the SEC for the first and third quarters of each fiscal year on Form N Q. Forms N Q are available on the
SEC’s web site at http://www.sec.gov. A fund’s Forms N Q may be reviewed and copied at the SEC’s Public Reference Room in Washington, DC. Information regard
ing the operation of the SEC’s Public Reference Room may be obtained by calling 1-800-SEC-0330. For a complete list of a fund’s portfolio holdings, view the most
recent quarterly holdings report, semiannual report, or annual report on Fidelity’s web site at http://www.advisor.fidelity.com.
NOT FDIC INSURED · MAY LOSE VALUE · NO BANK GUARANTEE
Neither the fund nor Fidelity Distributors Corporation is a bank.
|
VIP Aggressive Growth Portfolio 2
| | VIP Aggressive Growth Portfolio
Performance: The Bottom Line
|
Average annual total return reflects the change in the value of an investment, assuming reinvestment of the class’ dividend income and capital gains (the profits earned upon the sale of securities that have grown in value) and assuming a constant rate of performance each year. During periods of reimbursement by Fidelity, a fund’s total return will be greater than it would be had the reimbursement not occurred. Performance numbers are net of all underlying fund operating expenses, but do not include any insurance charges imposed by your insurance company’s separate account. If performance information included the effect of these additional charges, the total returns would have been lower. How a fund did yesterday is no guarantee of how it will do tomorrow.
| Average Annual Total Returns | | | | | | |
| Periods ended December 31, 2005 | | Past 1 | | Past 5 | | Life of |
| | | year | | years | | fundA |
| VIP Aggressive Growth — Initial Class | | 8.11% | | 1.22% | | 1.17% |
| VIP Aggressive Growth — Service ClassC | | 7.98% | | 1.19% | | 1.15% |
| VIP Aggressive Growth — Service Class 2D | | 7.74% | | 1.51% | | 1.47% |
| VIP Aggressive Growth — Investor ClassB | | 7.88% | | 1.26% | | 1.21% |
A From December 27, 2000.
B The initial offering of Investor Class shares took place on July 21, 2005. Returns prior to July 21, 2005 are those of Initial Class. If Investor Class’s transfer agent fee had
been reflected, returns prior to July 21, 2005 would have been lower.
C Performance for Service Class shares reflects an asset based service fee (12b 1 fee).
D Performance for Service Class 2 shares reflects an asset based service fee (12b 1 fee).
|
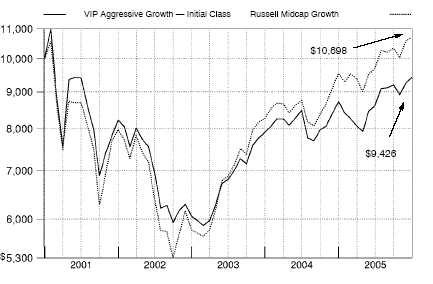
$10,000 Over Life of Fund
Let’s say hypothetically that $10,000 was invested in VIP Aggressive Growth Portfolio Initial Class on December 27, 2000, when the fund started. The chart shows how the value of your investment would have changed, and also shows how the Russell Midcap® Growth Index performed over the same period.
3 Annual Report
VIP Aggressive Growth Portfolio
Management’s Discussion of Fund Performance
|
Comments from Steven Calhoun, Portfolio Manager of VIP Aggressive Growth Portfolio
U.S. equity benchmarks generally had positive results for the 12 months ending December 31, 2005, the third consecutive year that stocks finished in the black. Energy and utilities were the two best performing sectors, contributing greatly to the 4.91% gain of the Standard & Poor’s 500SM Index. Elsewhere, the NASDAQ Composite® Index returned 2.13%, while the Dow Jones Industrial AverageSM rose 1.72% . The U.S. economy did not decelerate as much as many had predicted, despite eight short term interest rate hikes, record high energy prices and the devastation caused by Hurricane Katrina. Meanwhile, corporate America notched its 14th consecutive quarter of double digit earnings gains through the third quarter of the year, an unprecedented streak in market history. From a style perspective, large cap stocks ended the six year reign of small caps by a narrow margin, but mid caps finished well ahead of both categories. The gap between growth and value stocks also was relatively narrow, with value gaining a slight edge.
During the past year, the fund trailed the 12.10% return of the Russell Midcap® Growth Index and the 10.22% gain of the LipperSM Variable Annuity Mid Cap Funds Average. (For specific portfolio performance results, please refer to the performance section of this report.) Most of the underperfor mance occurred during the first half of the period, when two biotechnology stocks Biogen Idec and Ireland based Elan suffered steep declines. Questions about the safety of the companies’ jointly developed multiple sclerosis drug, Tysabri, and their subsequent decision to take it off the market early in 2005 triggered the drops in both stocks. I sold Elan and Biogen Idec shortly after taking over the fund. Chinese online gaming stock Shanda Interactive Entertainment was one of my picks that didn’t work out. While I was surprised by the severity of the market’s reaction to a lull in the company’s product cycles, I was skeptical about some recent changes in Shanda’s business model and sold the stock by period end. On the other hand, energy provided a boost because of the fund’s overweighted exposure versus the index and due to solid stock picking in the group. Among individual holdings, biotechnology bellwether Genentech was by far the fund’s top contributor in both absolute terms and compared with the index. Positive test results for a number of the company’s drugs fueled a strong advance in its stock, and I liquidated the position to lock in profits. Internet search engine Google also bolstered our results, its stock price lifted by several upward revisions in earnings growth and the company’s increasing share of the rapidly growing paid search market.
The views expressed in this statement reflect those of the portfolio manager only through the end of the period of the report as stated on the cover and do not necessarily represent the views of Fidelity or any other person in the Fidelity organization. Any such views are subject to change at any time based upon market or other conditions and Fidelity disclaims any responsibility to update such views. These views may not be relied on as invest ment advice and, because investment decisions for a Fidelity fund are based on numerous factors, may not be relied on as an indication of trading intent on behalf of any Fidelity fund.
VIP Aggressive Growth Portfolio 4
VIP Aggressive Growth Portfolio
Shareholder Expense Example
|
As a shareholder of the Fund, you incur two types of costs: (1) transaction costs, and (2) ongoing costs, including management fees, distribution and/or service (12b 1) fees and other Fund expenses. This Example is intended to help you understand your ongoing costs (in dollars) of investing in the Fund and to compare these costs with the ongoing costs of investing in other mutual funds.
The actual expense Example is based on an investment of $1,000 invested at the beginning of the period and held for the entire period (July 1, 2005 to December 31, 2005) for Initial Class, Service Class and Service Class 2 and for the entire period (July 21, 2005 to December 31, 2005) for Investor Class. The hypothetical expense Example is based on an investment of $1,000 invested for the one half year period (July 1, 2005 to December 31, 2005).
Actual Expenses
The first line of the table below for each class of the Fund provides information about actual account values and actual expenses. You may use the information in this line, together with the amount you invested, to estimate the expenses that you paid over the period. Simply divide your account value by $1,000.00 (for example, an $8,600 account value divided by $1,000.00 = 8.6), then multiply the result by the number in the first line for a class of the Fund under the heading entitled “Expenses Paid During Period” to estimate the expenses you paid on your account during this period. The estimate of expenses does not include any fees or other expenses of any variable annuity or variable life insurance product. If they were, the estimate of expenses you paid during the period would be higher, and your ending account value would be lower.
Hypothetical Example for Comparison Purposes
The second line of the table below for each class of the Fund provides information about hypothetical account values and hypothetical expenses based on a Class’ actual expense ratio and an assumed rate of return of 5% per year before expenses, which is not the Class’ actual return. The hypothetical account values and expenses may not be used to estimate the actual ending account balance or expenses you paid for the period. You may use this information to compare the ongoing costs of investing in the Fund and other funds. To do so, compare this 5% hypothetical example with the 5% hypothetical examples that appear in the shareholder reports of the other funds. The estimate of expenses does not include any fees or other expenses of any variable annuity or variable life insurance product. If they were, the estimate of expenses you paid during the period would be higher, and your ending account value would be lower.
Please note that the expenses shown in the table are meant to highlight your ongoing costs only and do not reflect any transaction costs. Therefore, the second line of the table is useful in comparing ongoing costs only, and will not help you determine the relative total costs of owning different funds.
| | | | | Ending | | | | |
| | | Beginning | | Account Value | | | | Expenses Paid |
| | | Account Value | | December 31, 2005 | | | | During Period |
| Initial Class | | | | | | | | |
| Actual | | $ 1,000.00 | | $ 1,094.90 | | | | $ 4.75B |
| HypotheticalA | | $ 1,000.00 | | $ 1,020.67 | | | | $ 4.58C |
| Service Class | | | | | | | | |
| Actual | | $ 1,000.00 | | $ 1,094.80 | | | | $ 5.28B |
| HypotheticalA | | $ 1,000.00 | | $ 1,020.16 | | | | $ 5.09C |
| Service Class 2 | | | | | | | | |
| Actual | | $ 1,000.00 | | $ 1,092.60 | | | | $ 6.07B |
| HypotheticalA | | $ 1,000.00 | | $ 1,019.41 | | | | $ 5.85C |
| Investor Class | | | | | | | | |
| Actual | | $ 1,000.00 | | $ 1,049.90 | | | | $ 4.84B |
| HypotheticalA | | $ 1,000.00 | | $ 1,019.91 | | | | $ 5.35C |
A 5% return per year before expenses
B Actual expenses are equal to each Class’ annualized expense ratio (shown in the table below); multiplied by the average account value
over the period, multiplied by 184/365 (to reflect the one half year period) for Initial Class, Service Class and Service Class 2 and multiplied
by 164/365 (to reflect the period July 21, 2005 to December 31, 2005) for Investor Class.
C Hypothetical expenses are equal to each Class’ annualized expense ratio (shown in the table below); multiplied by the average account
value over the period, multiplied by 184/365 (to reflect the one-half year period).
|
| | | Annualized |
| | | Expense Ratio |
| Initial Class | | 90% |
| Service Class | | 1.00% |
| Service Class 2 | | 1.15% |
| Investor Class | | 1.05% |
55 Annual Report
| VIP Aggressive Growth Portfolio | | |
| Investment Changes | | |
| |
| |
| Top Ten Stocks as of December 31, 2005 |
| | | % of fund’s | | % of fund’s net assets |
| | | net assets | | 6 months ago |
| St. Jude Medical, Inc. | | 4.0 | | 1.1 |
| Potash Corp. of Saskatchewan | | 3.0 | | 0.7 |
| KB Home | | 2.7 | | 0.0 |
| INAMED Corp. | | 2.7 | | 0.0 |
| Monsanto Co. | | 2.3 | | 2.8 |
| Abercrombie & Fitch Co. | | | | |
| Class A | | 2.2 | | 1.0 |
| Agrium, Inc. | | 2.2 | | 1.0 |
| Ameritrade Holding Corp. | | 2.1 | | 0.0 |
| Humana, Inc. | | 2.1 | | 1.0 |
| ASML Holding NV (NY Shares) | | 2.1 | | 0.0 |
| | | 25.4 | | |
Top Five Market Sectors as of December 31, 2005 |
| | | % of fund’s | | % of fund’s net assets |
| | | net assets | | 6 months ago |
| Health Care | | 31.7 | | 33.9 |
| Information Technology | | 19.2 | | 23.5 |
| Consumer Discretionary | | 15.5 | | 9.6 |
| Energy | | 9.6 | | 10.3 |
| Materials | | 7.5 | | 6.6 |
VIP Aggressive Growth Portfolio 6
| VIP Aggressive Growth Portfolio | | | | | | | | |
| Investments December 31, 2005 | | | | |
| Showing Percentage of Net Assets | | | | | | | | |
| |
| Common Stocks 97.3% | | | | | | | | |
| | | | | | | | | Shares | | Value (Note 1) |
| |
| CONSUMER DISCRETIONARY 15.5% | | | | | | | | |
| Hotels, Restaurants & Leisure 3.1% | | | | | | | | |
| Kerzner International Ltd. (a) | | | | | | | | 2,450 | | $ 168,438 |
| Penn National Gaming, Inc. (a) | | | | | | | | 6,764 | | 222,874 |
| Station Casinos, Inc. | | | | | | | | 3,000 | | 203,400 |
| | | | | | | | | | | 594,712 |
| Household Durables 4.6% | | | | | | | | | | |
| D.R. Horton, Inc. | | | | | | | | 9,900 | | 353,727 |
| KB Home | | | | | | | | 7,100 | | 515,886 |
| | | | | | | | | | | 869,613 |
| Media 1.1% | | | | | | | | | | |
| Getty Images, Inc. (a) | | | | | | | | 2,270 | | 202,643 |
| Specialty Retail 6.7% | | | | | | | | | | |
| Abercrombie & Fitch Co. Class A | | | | | | 6,500 | | 423,670 |
| Best Buy Co., Inc. | | | | | | | | 6,550 | | 284,794 |
| Tiffany & Co., Inc. | | | | | | | | 4,800 | | 183,792 |
| Urban Outfitters, Inc. (a) | | | | | | | | 14,600 | | 369,526 |
| | | | | | | | | | | 1,261,782 |
| |
| TOTAL CONSUMER DISCRETIONARY | | | | | | | | 2,928,750 |
| |
| CONSUMER STAPLES 1.5% | | | | | | | | | | |
| Food & Staples Retailing – 1.5% | | | | | | | | |
| Whole Foods Market, Inc. | | | | | | | | 3,700 | | 286,343 |
| |
| ENERGY 9.6% | | | | | | | | | | |
| Energy Equipment & Services – 2.9% | | | | | | | | |
| Baker Hughes, Inc. | | | | | | | | 3,100 | | 188,418 |
| Halliburton Co. | | | | | | | | 2,900 | | 179,684 |
| Weatherford International Ltd. (a) | | | | | | 5,160 | | 186,792 |
| | | | | | | | | | | 554,894 |
| Oil, Gas & Consumable Fuels 6.7% | | | | | | | | |
| Arch Coal, Inc. | | | | | | | | 2,600 | | 206,700 |
| Chesapeake Energy Corp. | | | | | | | | 6,400 | | 203,072 |
| EOG Resources, Inc. | | | | | | | | 3,720 | | 272,936 |
| Peabody Energy Corp. | | | | | | | | 2,400 | | 197,808 |
| Range Resources Corp. | | | | | | | | 7,350 | | 193,599 |
| Ultra Petroleum Corp. (a) | | | | | | | | 3,300 | | 184,140 |
| | | | | | | | | | | 1,258,255 |
| |
| TOTAL ENERGY | | | | | | | | | | 1,813,149 |
| |
| FINANCIALS – 5.4% | | | | | | | | | | |
| Capital Markets 4.4% | | | | | | | | | | |
| Ameritrade Holding Corp. | | | | | | | | 16,561 | | 397,464 |
| Daiwa Securities Group, Inc. | | | | | | | | 18,000 | | 204,114 |
| Indiabulls Financial Services Ltd. | | | | | | 4,590 | | 19,397 |
| Indiabulls Financial Services Ltd. GDR (c) | | | | | | 4,803 | | 20,268 |
| Nikko Cordial Corp. | | | | | | | | 12,000 | | 190,119 |
| | | | | | | | | | | 831,362 |
See accompanying notes which are an integral part of the financial statements.
|
7
| VIP Aggressive Growth Portfolio | | | | |
| Investments - continued | | | | |
| |
| |
| |
| | | Shares | | Value (Note 1) |
| Diversified Financial Services – 1.0% | | | | |
| IntercontinentalExchange, Inc. | | 5,100 | | $ 185,385 |
| |
| TOTAL FINANCIALS | | | | 1,016,747 |
| |
| HEALTH CARE 31.7% | | | | |
| Biotechnology – 5.6% | | | | |
| Alnylam Pharmaceuticals, Inc. (a) | | 7,587 | | 101,362 |
| Celgene Corp. (a) | | 5,340 | | 346,032 |
| Martek Biosciences (a) | | 9,100 | | 223,951 |
| MedImmune, Inc. (a) | | 5,500 | | 192,610 |
| Protein Design Labs, Inc. (a) | | 6,900 | | 196,098 |
| | | | | 1,060,053 |
| Health Care Equipment & Supplies 17.6% | | | | |
| Alcon, Inc. | | 1,400 | | 181,440 |
| American Medical Systems Holdings, Inc. (a) | | 20,700 | | 369,081 |
| China Medical Technologies, Inc. sponsored ADR | | 1,600 | | 50,960 |
| Cyberonics, Inc. (a) | | 10,200 | | 329,460 |
| INAMED Corp. (a) | | 5,744 | | 503,634 |
| Integra LifeSciences Holdings Corp. (a) | | 5,600 | | 198,576 |
| Kyphon, Inc. (a) | | 4,400 | | 179,652 |
| Mentor Corp. | | 5,600 | | 258,048 |
| NeuroMetrix, Inc. (a) | | 2,810 | | 76,657 |
| NuVasive, Inc. (a) | | 8,800 | | 159,280 |
| St. Jude Medical, Inc. (a) | | 14,900 | | 747,980 |
| Ventana Medical Systems, Inc. (a) | | 6,700 | | 283,745 |
| | | | | 3,338,513 |
| Health Care Providers & Services 4.2% | | | | |
| Covance, Inc. (a) | | 4,100 | | 199,055 |
| Humana, Inc. (a) | | 7,250 | | 393,893 |
| Sierra Health Services, Inc. (a) | | 2,400 | | 191,904 |
| | | | | 784,852 |
| Pharmaceuticals 4.3% | | | | |
| Allergan, Inc. | | 3,550 | | 383,258 |
| Medicis Pharmaceutical Corp. Class A | | 8,100 | | 259,605 |
| Sepracor, Inc. (a) | | 3,400 | | 175,440 |
| | | | | 818,303 |
| |
| TOTAL HEALTH CARE | | | | 6,001,721 |
| |
| INDUSTRIALS – 6.9% | | | | |
| Air Freight & Logistics – 2.6% | | | | |
| Expeditors International of Washington, Inc. | | 4,300 | | 290,293 |
| UTI Worldwide, Inc. | | 2,147 | | 199,327 |
| | | | | 489,620 |
| Commercial Services & Supplies 1.0% | | | | |
| Stericycle, Inc. (a) | | 3,200 | | 188,416 |
| Construction & Engineering – 1.1% | | | | |
| Quanta Services, Inc. (a) | | 15,600 | | 205,452 |
See accompanying notes which are an integral part of the financial statements.
| | |
| VIP Aggressive Growth Portfolio | | 8 |
| Common Stocks continued | | | | | | |
| | | Shares | | Value (Note 1) |
| |
| INDUSTRIALS – continued | | | | | | |
| Electrical Equipment 1.0% | | | | | | |
| AMETEK, Inc. | | 4,600 | | $ | | 195,684 |
| Machinery – 1.2% | | | | | | |
| Deere & Co. | | 3,200 | | | | 217,952 |
| |
| TOTAL INDUSTRIALS | | | | | | 1,297,124 |
| |
| INFORMATION TECHNOLOGY 19.2% | | | | | | |
| Communications Equipment – 4.4% | | | | | | |
| ADC Telecommunications, Inc. (a) | | 15,800 | | | | 352,972 |
| Comverse Technology, Inc. (a) | | 10,765 | | | | 286,241 |
| Ixia (a) | | 13,300 | | | | 196,574 |
| | | | | | | 835,787 |
| Computers & Peripherals 1.5% | | | | | | |
| Sun Microsystems, Inc. (a) | | 68,200 | | | | 285,758 |
| Internet Software & Services 3.1% | | | | | | |
| Google, Inc. Class A (sub. vtg.) (a) | | 910 | | | | 377,523 |
| VeriSign, Inc. (a) | | 9,100 | | | | 199,472 |
| | | | | | | 576,995 |
| Semiconductors & Semiconductor Equipment – 5.8% | | | | | | |
| ARM Holdings PLC sponsored ADR | | 35,500 | | | | 220,455 |
| ASML Holding NV (NY Shares) (a) | | 19,500 | | | | 391,560 |
| Microchip Technology, Inc. | | 5,787 | | | | 186,052 |
| National Semiconductor Corp. | | 7,100 | | | | 184,458 |
| PMC Sierra, Inc. (a) | | 14,716 | | | | 113,460 |
| | | | | | | 1,095,985 |
| Software 4.4% | | | | | | |
| Activision, Inc. (a) | | 16,346 | | | | 224,594 |
| Citrix Systems, Inc. (a) | | 6,850 | | | | 197,143 |
| Cognos, Inc. (a) | | 5,700 | | | | 198,817 |
| Hyperion Solutions Corp. (a) | | 5,880 | | | | 210,622 |
| | | | | | | 831,176 |
| |
| TOTAL INFORMATION TECHNOLOGY | | | | | | 3,625,701 |
| |
| |
| | | Shares | | Value (Note 1) |
| |
| MATERIALS 7.5% | | | | | | |
| Chemicals 7.5% | | | | | | |
| Agrium, Inc. | | 18,700 | | $ | | 412,106 |
| Monsanto Co. | | 5,640 | | | | 437,269 |
| Potash Corp. of Saskatchewan | | 7,200 | | | | 576,595 |
| | | | | | | 1,425,970 |
| |
| TOTAL COMMON STOCKS | | | | | | |
| (Cost $16,894,051) | | | | 18,395,505 |
See accompanying notes which are an integral part of the financial statements.
|
9
| VIP Aggressive Growth Portfolio | | | | |
| Investments - continued | | | | | | |
| |
| | | | Shares | | Value (Note 1) |
| | | | | | |
| | | | | | |
| Money Market Funds 2.7% | | | | | | |
| Fidelity Cash Central Fund, 4.28% (b) | | | | | | |
| (Cost $515,593) | | | | 515,593 | | 515,593 |
| |
| TOTAL INVESTMENT PORTFOLIO 100.0% | | | | |
| (Cost $17,409,644) | | | | | | 18,911,098 |
| |
| NET OTHER ASSETS 0.0% | | | | | | 8,139 |
| NET ASSETS 100% | | | | | | $ 18,919,237 |
Legend
(a) Non-income producing
(b) Affiliated fund that is available only to investment companies and other accounts managed by Fidelity Investments. The rate quoted is the annualized seven-day
yield of the fund at period end. A complete unaudited listing of the fund’s holdings as of its most recent quarter end is available upon request.
(c) Security exempt from registration under Rule 144A of the Securities Act of 1933. These securities may be resold in transactions exempt from registration,
normally to qualified institutional buyers. At the period end, the value of these securities amounted to $20,268 or 0.1% of net assets.
|
Affiliated Central Funds
Information regarding income received by the fund from the affiliated Central funds during the period is as follows:
| Fund | | Income received |
| Fidelity Cash Central Fund | | $ | | 15,584 |
Other Information
Distribution of investments by country of issue, as a percentage of total net assets, is as follows:
| United States of America | | 83.9% |
| Canada | | 7.3% |
| Japan | | 2.1% |
| Netherlands | | 2.1% |
| United Kingdom | | 1.1% |
| British Virgin Islands | | 1.1% |
| Switzerland | | 1.0% |
| Others (individually less than 1%) | | 1.4% |
| | | 100.0% |
See accompanying notes which are an integral part of the financial statements.
VIP Aggressive Growth Portfolio 10
| VIP Aggressive Growth Portfolio | | | | | | |
| |
| Financial Statements | | | | | | |
| |
| |
| Statement of Assets and Liabilities | | | | | | |
| | | December 31, 2005 |
| |
| Assets | | | | | | |
| Investment in securities, at value — See accompanying schedule: | | | | | | |
| Unaffiliated issuers (cost $16,894,051) | | $ 18,395,505 | | | | |
| Affiliated Central Funds (cost $515,593) | | 515,593 | | | | |
| Total Investments (cost $17,409,644) | | | | $ | | 18,911,098 |
| Cash | | | | | | 15,988 |
| Receivable for investments sold | | | | | | 17,517 |
| Receivable for fund shares sold | | | | | | 32,541 |
| Dividends receivable | | | | | | 4,802 |
| Interest receivable | | | | | | 1,622 |
| Prepaid expenses | | | | | | 70 |
| Receivable from investment adviser for expense reductions | | | | | | 938 |
| Other receivables | | | | | | 3,067 |
| Total assets | | | | | | 18,987,643 |
| |
| Liabilities | | | | | | |
| Payable for investments purchased | | $ 10,680 | | | | |
| Payable for fund shares redeemed | | 8,984 | | | | |
| Accrued management fee | | 9,554 | | | | |
| Distribution fees payable | | 2,238 | | | | |
| Other affiliated payables | | 1,815 | | | | |
| Other payables and accrued expenses | | 35,135 | | | | |
| Total liabilities | | | | | | 68,406 |
| |
| Net Assets | | | | $ | | 18,919,237 |
| Net Assets consist of: | | | | | | |
| Paid in capital | | | | $ | | 17,454,001 |
| Undistributed net investment income | | | | | | 14,866 |
| Accumulated undistributed net realized gain (loss) on investments and foreign currency transactions | | | | | | (50,787) |
| Net unrealized appreciation (depreciation) on investments and assets and liabilities in foreign currencies | | | | | | 1,501,157 |
| Net Assets | | | | $ | | 18,919,237 |
| |
| Statement of Assets and Liabilities continued | | | | | | |
| | | December 31, 2005 |
| |
| Initial Class: | | | | | | |
| Net Asset Value, offering price and redemption price per share ($6,167,545 ÷ 674,299 shares) | | | | $ | | 9.15 |
| Service Class: | | | | | | |
| Net Asset Value, offering price and redemption price per share ($1,134,944 ÷ 123,940 shares) | | | | $ | | 9.16 |
| Service Class 2: | | | | | | |
| Net Asset Value, offering price and redemption price per share ($10,221,864 ÷ 1,134,046 shares) | | | | $ | | 9.01 |
| Investor Class: | | | | | | |
| Net Asset Value, offering price and redemption price per share ($1,394,884 ÷ 152,699 shares) | | | | $ | | 9.13 |
See accompanying notes which are an integral part of the financial statements.
|
11 Annual Report
| VIP Aggressive Growth Portfolio | | | | | | | | | | |
| Financial Statements - continued | | | | | | | | | | |
| |
| |
| Statement of Operations | | | | | | | | | | |
| | | | | | | Year ended December 31, 2005 |
| |
| Investment Income | | | | | | | | | | |
| Dividends | | | | | | | | $ | | 58,577 |
| Special dividends | | | | | | | | | | 10,050 |
| Interest | | | | | | | | | | 229 |
| Income from affiliated Central Funds | | | | | | | | | | 15,584 |
| Total income | | | | | | | | | | 84,440 |
| |
| Expenses | | | | | | | | | | |
| Management fee | | | | $ | | 85,719 | | | | |
| Transfer agent fees | | | | | | 13,979 | | | | |
| Distribution fees | | | | | | 24,730 | | | | |
| Accounting fees and expenses | | | | | | 5,693 | | | | |
| Independent trustees’ compensation | | | | | | 58 | | | | |
| Custodian fees and expenses | | | | | | 27,462 | | | | |
| Audit | | | | | | 42,410 | | | | |
| Legal | | | | | | 90 | | | | |
| Miscellaneous | | | | | | 9,547 | | | | |
| Total expenses before reductions | | | | | | 209,688 | | | | |
| Expense reductions | | | | | | (70,080) | | | | 139,608 |
| |
| Net investment income (loss) | | | | | | | | | | (55,168) |
| Realized and Unrealized Gain (Loss) | | | | | | | | | | |
| Net realized gain (loss) on: | | | | | | | | | | |
| Investment securities: | | | | | | | | | | |
| Unaffiliated issuers | | | | | | 1,621,006 | | | | |
| Foreign currency transactions | | | | | | 542 | | | | |
| Total net realized gain (loss) | | | | | | | | | | 1,621,548 |
| Change in net unrealized appreciation (depreciation) on: | | | | | | | | | | |
| Investment securities (net of increase in deferred foreign taxes of $300) | | | | | | (357,437) | | | | |
| Assets and liabilities in foreign currencies | | | | | | 3 | | | | |
| Total change in net unrealized appreciation (depreciation) | | | | | | | | | | (357,434) |
| Net gain (loss) | | | | | | | | | | 1,264,114 |
| Net increase (decrease) in net assets resulting from operations | | | | | | | | $ | | 1,208,946 |
| |
| Statement of Changes in Net Assets | | | | | | | | | | |
| | | | | | | Year ended | | | | Year ended |
| | | | | | | December 31, | | | | December 31, |
| | | | | | | 2005 | | | | 2004 |
| Increase (Decrease) in Net Assets | | | | | | | | | | |
| Operations | | | | | | | | | | |
| Net investment income (loss) | | | | $ | | (55,168) | | $ | | (73,241) |
| Net realized gain (loss) | | | | | | 1,621,548 | | | | 588,268 |
| Change in net unrealized appreciation (depreciation) | | | | | | (357,434) | | | | 478,044 |
| Net increase (decrease) in net assets resulting from operations | | | | | | 1,208,946 | | | | 993,071 |
| Distributions to shareholders from net realized gain | | | | | | (540,605) | | | | — |
| Share transactions - net increase (decrease) | | | | | | 7,047,654 | | | | 1,403,379 |
| Total increase (decrease) in net assets | | | | | | 7,715,995 | | | | 2,396,450 |
| |
| Net Assets | | | | | | | | | | |
| Beginning of period | | | | | | 11,203,242 | | | | 8,806,792 |
| End of period (including undistributed net investment income of $14,866 and undistributed net investment income of | | | | | | | | |
| $13,755, respectively) | | | | $ | | 18,919,237 | | $ | | 11,203,242 |
| |
| |
| |
| |
| See accompanying notes which are an integral part of the financial statements. | | | | | | | | | | |
| |
| VIP Aggressive Growth Portfolio | | 12 | | | | | | | | |
| Financial Highlights Initial Class | | | | | | | | | | |
| |
| Years ended December 31, | | 2005 | | 2004 | | 2003 | | 2002 | | 2001 |
| Selected Per Share Data | | | | | | | | | | |
| Net asset value, beginning of period | | $ 8.71 | | $ 7.90 | | $ 6.05 | | $ 8.22 | | $ 10.02 |
| Income from Investment Operations | | | | | | | | | | |
| Net investment income (loss)C | | (.02)D | | (.04) | | (.04) | | (.06) | | .03F |
| Net realized and unrealized gain (loss) | | 73 | | .85 | | 1.89 | | (2.11) | | (1.82)F |
| Total from investment operations | | 71 | | .81 | | 1.85 | | (2.17) | | (1.79) |
| Distributions from net investment income | | — | | — | | — | | — | | (.01) |
| Distributions from net realized gain | | (.27) | | — | | — | | — | | — |
| Net asset value, end of period | | $ 9.15 | | $ 8.71 | | $ 7.90 | | $ 6.05 | | $ 8.22 |
| Total ReturnA,B | | 8.11% | | 10.25% | | 30.58% | | (26.40)% | | (17.89)% |
| Ratios to Average Net AssetsE | | | | | | | | | | |
| Expenses before reductions | | 1.28% | | 1.64% | | 2.87% | | 2.51% | | 3.00% |
| Expenses net of fee waivers, if any | | 90% | | 1.00% | | 1.26% | | 1.50% | | 1.50% |
| Expenses net of all reductions | | 82% | | .96% | | 1.20% | | 1.35% | | 1.45% |
| Net investment income (loss) | | (.21)%D | | (.53)% | | (.62)% | | (.85)% | | .34%F |
| Supplemental Data | | | | | | | | | | |
| Net assets, end of period (000 omitted) | | $ 6,168 | | $ 1,031 | | $ 907 | | $ 689 | | $ 864 |
| Portfolio turnover rate | | 242% | | 91% | | 150% | | 460% | | 526% |
A Total returns do not reflect charges attributable to your insurance company’s separate account. Inclusion of these charges would reduce the total returns shown.
B Total returns would have been lower had certain expenses not been reduced during the periods shown.
C Calculated based on average shares outstanding during the period.
D Investment income per share reflects a special dividend which amounted to $.01 per share. Excluding the special dividend, the ratio of net investment income (loss) to average net assets would have been (.28)%.
E Expense ratios reflect operating expenses of the class. Expenses before reductions do not reflect amounts reimbursed by the investment adviser or reductions from brokerage service arrangements or other expense offset arrangements and do not
represent the amount paid by the class during periods when reimbursements or reductions occur. Expenses net of fee waivers reflect expenses after reimbursement by the investment adviser but prior to reductions from brokerage service arrange
ments or other expense offset arrangements. Expenses net of all reductions represent the net expenses paid by the class.
F Effective January 1, 2001, the fund adopted the provisions of the AICPA Audit and Accounting Guide for Investment Companies and began amortizing premium and discount on all debt securities. Per share data and ratios for periods prior to adop
tion have not been restated to reflect this change.
|
| Financial Highlights Service Class | | | | | | | | | | |
| |
| Years ended December 31, | | 2005 | | 2004 | | 2003 | | 2002 | | 2001 |
| Selected Per Share Data | | | | | | | | | | |
| Net asset value, beginning of period | | $ 8.73 | | $ 7.92 | | $ 6.07 | | $ 8.25 | | $ 10.02 |
| Income from Investment Operations | | | | | | | | | | |
| Net investment income (loss)C | | (.03)D | | (.05) | | (.05) | | (.07) | | .02F |
| Net realized and unrealized gain (loss) | | 73 | | .86 | | 1.90 | | (2.11) | | (1.78)F |
| Total from investment operations | | 70 | | .81 | | 1.85 | | (2.18) | | (1.76) |
| Distributions from net investment income | | — | | — | | — | | — | | (.01) |
| Distributions from net realized gain | | (.27) | | — | | — | | — | | — |
| Net asset value, end of period | | $ 9.16 | | $ 8.73 | | $ 7.92 | | $ 6.07 | | $ 8.25 |
| Total ReturnA,B | | 7.98% | | 10.23% | | 30.48% | | (26.42)% | | (17.59)% |
| Ratios to Average Net AssetsE | | | | | | | | | | |
| Expenses before reductions | | 1.44% | | 1.74% | | 2.94% | | 2.56% | | 3.09% |
| Expenses net of fee waivers, if any | | 1.01% | | 1.10% | | 1.36% | | 1.60% | | 1.60% |
| Expenses net of all reductions | | 93% | | 1.07% | | 1.30% | | 1.45% | | 1.55% |
| Net investment income (loss) | | (.32)%D | | (.63)% | | (.72)% | | (.96)% | | .24%F |
| Supplemental Data | | | | | | | | | | |
| Net assets, end of period (000 omitted) | | $ 1,135 | | $ 1,059 | | $ 1,026 | | $ 779 | | $ 1,152 |
| Portfolio turnover rate | | 242% | | 91% | | 150% | | 460% | | 526% |
A Total returns do not reflect charges attributable to your insurance company’s separate account. Inclusion of these charges would reduce the total returns shown.
B Total returns would have been lower had certain expenses not been reduced during the periods shown.
C Calculated based on average shares outstanding during the period.
D Investment income per share reflects a special dividend which amounted to $.01 per share. Excluding the special dividend, the ratio of net investment income (loss) to average net assets would have been (.39)%.
E Expense ratios reflect operating expenses of the class. Expenses before reductions do not reflect amounts reimbursed by the investment adviser or reductions from brokerage service arrangements or other expense offset arrangements and do not
represent the amount paid by the class during periods when reimbursements or reductions occur. Expenses net of fee waivers reflect expenses after reimbursement by the investment adviser but prior to reductions from brokerage service arrange
ments or other expense offset arrangements. Expenses net of all reductions represent the net expenses paid by the class.
F Effective January 1, 2001, the fund adopted the provisions of the AICPA Audit and Accounting Guide for Investment Companies and began amortizing premium and discount on all debt securities. Per share data and ratios for periods prior to adop
tion have not been restated to reflect this change.
|
See accompanying notes which are an integral part of the financial statements.
|
13 Annual Report
| Financial Highlights Service Class 2 | | | | | | | | | | |
| |
| Years ended December 31, | | 2005 | | 2004 | | 2003 | | 2002 | | 2001 |
| Selected Per Share Data | | | | | | | | | | |
| Net asset value, beginning of period | | $ 8.61 | | $ 7.83 | | $ 6.01 | | $ 8.20 | | $ 10.02 |
| Income from Investment Operations | | | | | | | | | | |
| Net investment income (loss)C | | (.04)D | | (.06) | | (.06) | | (.08) | | .01F |
| Net realized and unrealized gain (loss) | | 71 | | .84 | | 1.88 | | (2.11) | | (1.82)F |
| Total from investment operations | | 67 | | .78 | | 1.82 | | (2.19) | | (1.81) |
| Distributions from net investment income | | — | | — | | — | | — | | (.01) |
| Distributions from net realized gain | | (.27) | | — | | — | | — | | — |
| Net asset value, end of period | | $ 9.01 | | $ 8.61 | | $ 7.83 | | $ 6.01 | | $ 8.20 |
| Total ReturnA,B | | 7.74% | | 9.96% | | 30.28% | | (26.71)% | | (18.08)% |
| Ratios to Average Net AssetsE | | | | | | | | | | |
| Expenses before reductions | | 1.60% | | 1.92% | | 3.14% | | 2.74% | | 3.23% |
| Expenses net of fee waivers, if any | | 1.16% | | 1.25% | | 1.51% | | 1.75% | | 1.75% |
| Expenses net of all reductions | | 1.08% | | 1.21% | | 1.45% | | 1.60% | | 1.70% |
| Net investment income (loss) | | (.47)%D | | (.78)% | | (.87)% | | (1.11)% | | .09%F |
| Supplemental Data | | | | | | | | | | |
| Net assets, end of period (000 omitted) | | $ 10,222 | | $ 9,113 | | $ 6,873 | | $ 3,930 | | $ 4,500 |
| Portfolio turnover rate | | 242% | | 91% | | 150% | | 460% | | 526% |
A Total returns do not reflect charges attributable to your insurance company’s separate account. Inclusion of these charges would reduce the total returns shown.
B Total returns would have been lower had certain expenses not been reduced during the periods shown.
C Calculated based on average shares outstanding during the period.
D Investment income per share reflects a special dividend which amounted to $.01 per share. Excluding the special dividend, the ratio of net investment income (loss) to average net assets would have been (.54)%.
E Expense ratios reflect operating expenses of the class. Expenses before reductions do not reflect amounts reimbursed by the investment adviser or reductions from brokerage service arrangements or other expense offset arrangements and do not
represent the amount paid by the class during periods when reimbursements or reductions occur. Expenses net of fee waivers reflect expenses after reimbursement by the investment adviser but prior to reductions from brokerage service arrange
ments or other expense offset arrangements. Expenses net of all reductions represent the net expenses paid by the class.
F Effective January 1, 2001, the fund adopted the provisions of the AICPA Audit and Accounting Guide for Investment Companies and began amortizing premium and discount on all debt securities. Per share data and ratios for periods prior to adop
tion have not been restated to reflect this change.
|
| Financial Highlights Investor Class | | |
| |
| Year ended December 31, | | 2005G |
| Selected Per Share Data | | |
| Net asset value, beginning of period | | $ 8.95 |
| Income from Investment Operations | | |
| Net investment income (loss)E | | (.01)F |
| Net realized and unrealized gain (loss) | | 46 |
| Total from investment operations | | 45 |
| Distributions from net realized gain | | (.27) |
| Net asset value, end of period | | $ 9.13 |
| Total ReturnB,C,D | | 4.99% |
| Ratios to Average Net AssetsH | | |
| Expenses before reductions | | 1.25%A |
| Expenses net of fee waivers, if any | | 1.05%A |
| Expenses net of all reductions | | 97%A |
| Net investment income (loss) | | (.36)%A,F |
| Supplemental Data | | |
| Net assets, end of period (000 omitted) | | $ 1,395 |
| Portfolio turnover rate | | 242% |
A Annualized
B Total returns for periods of less than one year are not annualized.
C Total returns do not reflect charges attributable to your insurance company’s separate account. Inclusion of these charges would reduce the total returns shown.
D Total returns would have been lower had certain expenses not been reduced during the periods shown.
E Calculated based on average shares outstanding during the period.
F Investment income per share reflects a special dividend which amounted to $.01 per share. Excluding the special dividend, the ratio of net investment income (loss) to average net assets would have been (.43)%.
G For the period July 21, 2005 (commencement of sale of shares) to December 31, 2005.
H Expense ratios reflect operating expenses of the class. Expenses before reductions do not reflect amounts reimbursed by the investment adviser or reductions from brokerage service arrangements or other expense offset arrangements and do not
represent the amount paid by the class during periods when reimbursements or reductions occur. Expense ratios before reductions for start up periods may not be representative of longer term operating periods. Expenses net of fee waivers reflect
expenses after reimbursement by the investment adviser but prior to reductions from brokerage service arrangements or other expense offset arrangements. Expenses net of all reductions represent the net expenses paid by the class.
|
See accompanying notes which are an integral part of the financial statements.
| | |
| VIP Aggressive Growth Portfolio | | 14 |
Notes to Financial Statements
For the period ended December 31, 2005
|
1. Significant Accounting Policies.
|
VIP Aggressive Growth Portfolio (the fund) is a fund of Variable Insurance Products Fund III (the trust) (referred to in this report as VIP Aggressive Growth Portfolio) and is authorized to issue an unlimited number of shares. The trust is registered under the Investment Company Act of 1940, as amended (the 1940 Act), as an open end management investment company organized as a Massachusetts business trust. Shares of the fund may only be purchased by insurance companies for the purpose of funding variable annuity or variable life insurance contracts. The fund offers the following classes of shares: Initial Class shares, Service Class shares, Service Class 2 shares and Investor Class shares. The fund commenced sale of Investor Class shares on July 21, 2005. All classes have equal rights and voting privileges, except for matters affecting a single class. Investment income, realized and unrealized capital gains and losses, the common expenses of the fund, and certain fund level expense reductions, if any, are allocated on a pro rata basis to each class based on the relative net assets of each class to the total net assets of the fund. Each class differs with respect to transfer agent and distribution and service plan fees incurred. Certain expense reductions also differ by class.
The fund may invest in affiliated money market central funds (Money Market Central Funds), which are open end investment companies available to investment companies and other accounts managed by Fidelity Management & Research Company (FMR) and its affiliates. The financial statements have been prepared in conformity with accounting principles generally accepted in the United States of America, which require management to make certain estimates and assumptions at the date of the financial statements. The following summarizes the significant accounting policies of the fund:
Security Valuation. Investments are valued and net asset value (NAV) per share is calculated (NAV calculation) as of the close of business of the New York Stock Exchange (NYSE), normally 4:00 p.m. Eastern time. Wherever possible, the fund uses independent pricing services approved by the Board of Trustees to value its investments.
Equity securities, including restricted securities, for which market quotations are readily available, are valued at the last reported sale price or official closing price as reported by an independent pricing service on the primary market or exchange on which they are traded. In the event there were no sales during the day or closing prices are not available, securities are valued at the last quoted bid price. Investments in open end mutual funds, are valued at their closing net asset value each business day. Short term securities with remaining maturities of sixty days or less for which quotations are not readily available are valued at amortized cost, which approximates value.
When current market prices or quotations are not readily available or do not accurately reflect fair value, valuations may be determined in accordance with procedures adopted by the Board of Trustees. For example, when developments occur between the close of a market and the close of the NYSE that may materially affect the value of some or all of the securities, or when trading in a security is halted, those securities may be fair valued. Factors used in the determination of fair value may include monitoring news to identify significant market or security specific events such as changes in the value of U.S. securities markets, reviewing developments in foreign markets and evaluating the performance of ADRs, futures contracts and exchange-traded funds. Because the fund’s utilization of fair value pricing depends on market activity, the frequency with which fair value pricing is used can not be predicted and may be utilized to a significant extent. The value of securities used for NAV calculation under fair value pricing may differ from published prices for the same securities.
Foreign Currency. The fund uses foreign currency contracts to facilitate transactions in foreign denominated securities. Losses from these transac tions may arise from changes in the value of the foreign currency or if the counterparties do not perform under the contracts’ terms.
Foreign denominated assets, including investment securities, and liabilities are translated into U.S. dollars at the exchange rate at period end. Pur chases and sales of investment securities, income and dividends received and expenses denominated in foreign currencies are translated into U.S. dollars at the exchange rate in effect on the transaction date.
The effects of exchange rate fluctuations on investments are included with the net realized and unrealized gain (loss) on investment securities. Other foreign currency transactions resulting in realized and unrealized gain (loss) are disclosed separately.
Investment Transactions and Income. Security transactions are accounted for as of trade date. Gains and losses on securities sold are determined on the basis of identified cost and may include proceeds received from litigation. Dividend income is recorded on the ex dividend date, except for certain dividends from foreign securities where the ex dividend date may have passed, which are recorded as soon as the fund is informed of the ex dividend date. Non cash dividends included in dividend income, if any, are recorded at the fair market value of the securities received. Distributions received on securities that represent a return of capital or capital gain are recorded as a reduction of cost of investments and/or as a realized gain. The fund estimates the components of distributions received that may be considered return of capital distributions or capital gain distributions. Large, non recurring dividends recognized by the fund are presented separately on the Statement of Operations as “Special Dividends” and the impact of these dividends is presented in the Financial Highlights. Interest income is accrued as earned. Interest income includes coupon interest and amortization of premium and accretion of discount on debt securities. Investment income is recorded net of foreign taxes withheld where recovery of such taxes is uncertain.
15 Annual Report
| Notes to Financial Statements continued |
1. Significant Accounting Policies continued |
Expenses. Most expenses of the trust can be directly attributed to a fund. Expenses which cannot be directly attributed are apportioned among each fund in the trust.
Income Tax Information and Distributions to Shareholders. Each year, the fund intends to qualify as a regulated investment company by distrib uting all of its taxable income and realized gains under Subchapter M of the Internal Revenue Code. As a result, no provision for income taxes is required in the accompanying financial statements. Foreign taxes are provided for based on the fund’s understanding of the tax rules and rates that exist in the foreign markets in which it invests.
Distributions are recorded on the ex dividend date. Income dividends and capital gain distributions are declared separately for each class. Income and capital gain distributions are determined in accordance with income tax regulations, which may differ from generally accepted accounting principles.
Capital accounts within the financial statements are adjusted for permanent book tax differences. These adjustments have no impact on net assets or the results of operations. Temporary book tax differences will reverse in a subsequent period.
Book tax differences are primarily due to foreign currency transactions, deferred trustees compensation, net operating losses, capital loss carryfor wards and losses deferred due to wash sales.
The tax basis components of distributable earnings and the federal tax cost as of period end were as follows:
| | | | | | |
| Unrealized appreciation | | | $ | 2,074,782 | | | | |
| Unrealized depreciation | | | | (660,636) | | | | |
| Net unrealized appreciation (depreciation) | | | | 1,414,146 | | | | |
| Undistributed long term capital gain | | | | 51,088 | | | | |
| Cost for federal income tax purposes | | | $ | 17,496,952 | | | | |
| The tax character of distributions paid was as follows: | | | | | | | | |
| | | | | December 31, 2005 | | | | December 31, 2004 |
| Long term Capital Gains | | | $ | 540,605 | | | $ | — |
2. Operating Policies. | | | | | | | | |
Repurchase Agreements. FMR has received an Exemptive Order from the Securities and Exchange Commission (the SEC) which permits the fund and other affiliated entities of FMR to transfer uninvested cash balances into joint trading accounts which are then invested in repurchase agreements. The fund may also invest directly with institutions in repurchase agreements. Repurchase agreements are collateralized by government or non government securities. Collateral is held in segregated accounts with custodian banks and may be obtained in the event of a default of the counter-party. The fund monitors, on a daily basis, the value of the collateral to ensure it is at least equal to the principal amount of the repurchase agreement (including accrued interest). In the event of a default by the counterparty, realization of the collateral proceeds could be delayed, during which time the value of the collateral may decline.
Restricted Securities. The fund may invest in securities that are subject to legal or contractual restrictions on resale. These securities generally may be resold in transactions exempt from registration or to the public if the securities are registered. Disposal of these securities may involve time consuming negotiations and expense, and prompt sale at an acceptable price may be difficult. Information regarding restricted securities is included at the end of the fund’s Schedule of Investments.
3. Purchases and Sales of Investments.
Purchases and sales of securities, other than short term securities and U.S. government securities, aggregated $39,242,681 and $32,478,944, respectively.
4. Fees and Other Transactions with Affiliates.
Management Fee. FMR and its affiliates provide the fund with investment management related services for which the fund pays a monthly manage ment fee. The management fee is the sum of an individual fund fee rate that is based on an annual rate of .35% of the fund’s average net assets and a group fee rate that averaged .27% during the period. The group fee rate is based upon the average net assets of all the mutual funds advised by FMR. The group fee rate decreases as assets under management increase and increases as assets under management decrease. For the period, the total annual management fee rate was .62% of the fund’s average net assets.
VIP Aggressive Growth Portfolio
|
4. Fees and Other Transactions with Affiliates continued
Distribution and Service Plan. In accordance with Rule 12b 1 of the 1940 Act, the fund has adopted separate 12b 1 Plans for each Service Class of shares. Each Service Class pays Fidelity Distributors Corporation (FDC), an affiliate of FMR, a service fee. For the period, the service fee is based on an annual rate of .10% of Service Class’ average net assets and .25% of Service Class 2’s average net assets.
For the period, each class paid FDC the following amounts, all of which were re allowed to insurance companies for the distribution of shares and providing shareholder support services:
| Service Class | | | $ | 1,085 |
| Service Class 2 | | | | 23,645 |
| | | | $ | 24,730 |
Transfer Agent Fees. Fidelity Investments Institutional Operations Company, Inc. (FIIOC), an affiliate of FMR, is the fund’s transfer, dividend disbursing, and shareholder servicing agent. FIIOC receives an asset based fee with respect to each class. FIIOC pays a portion of the expenses related to the typesetting, printing and mailing of shareholder reports, except proxy statements. Each class with the exception of Investor Class pays a transfer agent fee, excluding out of pocket expenses, equal to an annual rate of ..07% of their month end net assets. Investor Class pays an asset based transfer agent fee of .18% of its month end net assets. The total transfer agent fees paid by each class to FIIOC, including out of pocket expenses, were as follows:
| Initial Class | | | $ | 2,988 |
| Service Class | | | | 875 |
| Service Class 2 | | | | 9,526 |
| Investor Class | | | | 590 |
| | | | $ | 13,979 |
Accounting Fees. Fidelity Service Company, Inc. (FSC), an affiliate of FMR, maintains the fund’s accounting records. The fee is based on the level of average net assets for the month.
Affiliated Central Funds. The fund may invest in Money Market Central Funds which seek preservation of capital and current income and are managed by Fidelity Investments Money Management, Inc. (FIMM), an affiliate of FMR. The Money Market Central Funds do not pay a management fee.
5. Committed Line of Credit.
|
The fund participates with other funds managed by FMR in a $4.2 billion credit facility (the “line of credit”) to be utilized for temporary or emergency purposes to fund shareholder redemptions or for other short term liquidity purposes. The fund has agreed to pay commitment fees on its pro rata portion of the line of credit. During the period, there were no borrowings on this line of credit.
FMR voluntarily agreed to reimburse each class to the extent annual operating expenses exceeded certain levels of average net assets as noted in the table below. Some expenses, for example interest expense, are excluded from this reimbursement.
The following classes were in reimbursement during the period:
| | | | | | |
| | | Expense | | | | Reimbursement |
| | | Limitations | | | | from adviser |
| |
| Initial Class | | 1.00% - .90%* | | | $ | 11,897 |
| Service Class | | 1.10% - 1.00%* | | | | 4,612 |
| Service Class 2 | | 1.25% - 1.15%* | | | | 41,889 |
| Investor Class | | 1.05% | | | | 381 |
| | | | | | $ | 58,779 |
| * Expense limitation in effect at period end. | | | | | | |
Many of the brokers with whom FMR places trades on behalf of the fund provided services to the fund in addition to trade execution. These services included payments of certain expenses on behalf of the fund totaling $11,301 for the period.
17 Annual Report
| Notes to Financial Statements continued |
7. Other. | | |
The fund’s organizational documents provide former and current trustees and officers with a limited indemnification against liabilities arising in connection with the performance of their duties to the fund. In the normal course of business, the fund may also enter into contracts that provide general indemnifications. The fund’s maximum exposure under these arrangements is unknown as this would be dependent on future claims that may be made against the fund. The risk of material loss from such claims is considered remote.
At the end of the period, FMR or its affiliates were the owners of record of 63% of the total outstanding shares of the fund and two otherwise unaffiliated shareholders were the owners of record of 35% of the total outstanding shares of the fund.
| 8. Distributions to Shareholders. | | | | | | | | | | |
| |
| Distributions to shareholders of each class were as follows: | | | | | | | | | | |
| |
| | | | | | | Years ended December 31, |
| | | | | | | 2005A | | | | 2004 |
| From net realized gain | | | | | | | | | | |
| Initial Class | | | | | $ | 171,838 | | | $ | — |
| Service Class | | | | | | 32,519 | | | | — |
| Service Class 2 | | | | | | 297,197 | | | | — |
| Investor Class | | | | | | 39,051 | | | | — |
| Total | | | | | $ | 540,605 | | | $ | — |
| |
| A Distributions for Investor Class are for the period July 21, 2005 (commencement of sale of shares) to December 31, 2005. | | | | | | | | | | |
| |
| 9. Share Transactions. | | | | | | | | | | |
| |
| Transactions for each class of shares were as follows: | | | | | | | | | | |
| |
| | | Shares | | Dollars |
| | | Years ended December 31, | | Years ended December 31, |
| | | 2005A | | 2004 | | 2005A | | | | 2004 |
| Initial Class | | | | | | | | | | |
| Shares sold | | 1,063,075 | | 20,196 | | $ 9,578,096 | | | $ | 163,969 |
| Reinvestment of distributions | | 18,537 | | — | | 171,838 | | | | — |
| Shares redeemed | | (525,656) | | (16,791) | | (4,765,585) | | | | (137,010) |
| Net increase (decrease) | | 555,956 | | 3,405 | | $ 4,984,349 | | | $ | 26,959 |
| Service Class | | | | | | | | | | |
| Shares sold | | 14,466 | | 5,688 | | $ 124,895 | | | $ | 46,408 |
| Reinvestment of distributions | | 3,504 | | — | | 32,519 | | | | — |
| Shares redeemed | | (15,326) | | (13,886) | | (141,133) | | | | (112,605) |
| Net increase (decrease) | | 2,644 | | (8,198) | | $ 16,281 | | | $ | (66,197) |
| Service Class 2 | | | | | | | | | | |
| Shares sold | | 237,617 | | 349,350 | | $ 2,014,380 | | | $ | 2,799,000 |
| Reinvestment of distributions | | 32,552 | | — | | 297,197 | | | | — |
| Shares redeemed | | (194,170) | | (169,649) | | (1,674,066) | | | | (1,356,383) |
| Net increase (decrease) | | 75,999 | | 179,701 | | $ 637,511 | | | $ | 1,442,617 |
| Investor Class | | | | | | | | | | |
| Shares sold | | 153,237 | | — | | $ 1,415,178 | | | $ | — |
| Reinvestment of distributions | | 4,222 | | — | | 39,051 | | | | — |
| Shares redeemed | | (4,760) | | — | | (44,716) | | | | — |
| Net increase (decrease) | | 152,699 | | — | | $ 1,409,513 | | | $ | — |
| |
| A Share transactions for Investor Class are for the period July 21, 2005 (commencement of sale of shares) to December 31, 2005. | | | | | | | | |
VIP Aggressive Growth Portfolio
|
Report of Independent Registered Public Accounting Firm
To the Trustees of Variable Insurance Products Fund III and Shareholders of VIP Aggressive Growth Portfolio:
We have audited the accompanying statement of assets and liabilities of VIP Aggressive Growth Portfolio (the Fund), a fund of Variable Insurance Products Fund III, including the schedule of investments as of December 31, 2005, and the related statement of operations for the year then ended, the statement of changes in net assets for each of the two years in the period then ended, and the financial highlights for each of the five years in the period then ended. These financial statements and financial highlights are the responsibility of the Fund’s management. Our responsibility is to express an opinion on these financial statements and financial highlights based on our audits.
We conducted our audits in accordance with standards of the Public Company Accounting Oversight Board (United States). Those standards require that we plan and perform the audit to obtain reasonable assurance about whether the financial statements and financial highlights are free of material misstatement. The Fund is not required to have, nor were we engaged to perform, an audit of its internal control over financial reporting. Our audits included consideration of internal control over financial reporting as a basis for designing audit procedures that are appropriate in the circumstances, but not for the purpose of expressing an opinion on the effectiveness of the Fund’s internal control over financial reporting. Accordingly, we express no such opinion. An audit also includes examining, on a test basis, evidence supporting the amounts and disclosures in the financial statements, assessing the accounting principles used and significant estimates made by management, as well as evaluating the overall financial statement presentation. Our procedures included confirmation of securities owned as of December 31, 2005, by correspondence with the custodians and brokers; where replies were not received from brokers, we performed other auditing procedures. We believe that our audits provide a reasonable basis for our opinion.
In our opinion, the financial statements and financial highlights referred to above present fairly, in all material respects, the financial position of VIP Aggressive Growth Portfolio as of December 31, 2005, the results of its operations for the year then ended, the changes in its net assets for each of the two years in the period then ended, and its financial highlights for each of the five years in the period then ended, in conformity with accounting principles generally accepted in the United States of America.
/s/ Deloitte & Touche LLP
DELOITTE & TOUCHE LLP
Boston, Massachusetts
February 14, 2006
|
19 Annual Report
The Trustees, Member of the Advisory Board, and executive officers of the trust and funds, as applicable, are listed below. The Board of Trustees governs the fund and is responsible for protecting the interests of shareholders. The Trustees are experienced executives who meet periodically throughout the year to oversee the fund’s activities, review contractual arrangements with companies that provide services to the fund, and review the fund’s performance. Except for William O. McCoy and Albert R. Gamper, Jr., each of the Trustees oversees 326 funds advised by FMR or an affiliate. Mr. McCoy oversees 328 funds advised by FMR or an affiliate. Mr. Gamper oversees 235 funds advised by FMR or an affiliate.
The Trustees hold office without limit in time except that (a) any Trustee may resign; (b) any Trustee may be removed by written instrument, signed by at least two thirds of the number of Trustees prior to such removal; (c) any Trustee who requests to be retired or who has become inca pacitated by illness or injury may be retired by written instrument signed by a majority of the other Trustees; and (d) any Trustee may be removed at any special meeting of shareholders by a two thirds vote of the outstanding voting securities of the trust. Each Trustee who is not an interested person (as defined in the 1940 Act) (Independent Trustee), shall retire not later than the last day of the calendar year in which his or her 72nd birthday occurs. The Independent Trustees may waive this mandatory retirement age policy with respect to individual Trustees. The executive officers and Advisory Board Member hold office without limit in time, except that any officer and Advisory Board Member may resign or may be removed by a vote of a majority of the Trustees at any regular meeting or any special meeting of the Trustees. Except as indicated, each individual has held the office shown or other offices in the same company for the past five years.
The fund’s Statement of Additional Information (SAI) includes more information about the Trustees. To request a free copy, call Fidelity at 1-800-208-0098.
Correspondence intended for each Trustee who is an interested person may be sent to Fidelity Investments, 82 Devonshire Street, Boston, Massachusetts 02109.
| | Name, Age; Principal Occupation
Edward C. Johnson 3d (75)
|
Year of Election or Appointment: 1994
Mr. Johnson is Chairman of the Board of Trustees. Mr. Johnson serves as Chief Executive Officer, Chairman, and a Director of FMR Corp.; a Director and Chairman of the Board and of the Executive Committee of FMR; Chairman and a Director of Fidelity Man agement & Research (Far East) Inc.; Chairman and a Director of Fidelity Investments Money Management, Inc.; and Chairman (2001 present) and a Director (2000 present) of FMR Co., Inc.
Year of Election or Appointment: 2005
Mr. Jonas is Senior Vice President of VIP Aggressive Growth (2005 present). He also serves as Senior Vice President of other Fidelity funds (2005 present). Mr. Jonas is Executive Director of FMR (2005 present). Previously, Mr. Jonas served as President of Fidelity Enterprise Operations and Risk Services (2004 2005), Chief Administrative Officer (2002 2004), and Chief Financial Officer of FMR Co. (1998 2000). Mr. Jonas has been with Fidelity Investments since 1987 and has held various financial and management positions including Chief Financial Officer of FMR. In addition, he serves on the Boards of Boston Ballet (2003 present) and Simmons College (2003 present).
Year of Election or Appointment: 2003
Mr. Reynolds is a Director (2003 present) and Chief Operating Officer (2002 present) of FMR Corp. He also serves on the Board at Fidelity Investments Canada, Ltd. (2000 present). Previously, Mr. Reynolds served as President of Fidelity Investments Institutional Retirement Group (1996 2000).
* Trustees have been determined to be “Interested Trustees” by virtue of, among other things, their affiliation with the trust or various entities under common control with FMR.
VIP Aggressive Growth Portfolio
|
Correspondence intended for each Independent Trustee (that is, the Trustees other than the Interested Trustees) may be sent to Fidelity Investments, P.O. Box 55235, Boston, Massachusetts 02205-5235.
| | Name, Age; Principal Occupation
Dennis J. Dirks (57)
|
Year of Election or Appointment: 2005
Prior to his retirement in May 2003, Mr. Dirks was Chief Operating Officer and a member of the Board of The Depository Trust & Clearing Corporation (DTCC) (1999 2003). He also served as President, Chief Operating Officer, and Board member of The Depository Trust Company (DTC) (1999 2003) and President and Board member of the National Securities Clearing Corporation (NSCC) (1999 2003). In addition, Mr. Dirks served as Chief Executive Officer and Board member of the Government Securities Clearing Corporation (2001 2003) and Chief Executive Officer and Board member of the Mortgage Backed Securities Clearing Corporation (2001 2003). Mr. Dirks also serves as a Trustee of Manhattan College (2005 present).
| | Albert R. Gamper, Jr. (63)
|
Year of Election or Appointment: 2006
Mr. Gamper also serves as a Trustee (2006 present) or Member of the Advisory Board (2005 present) of other investment companies advised by FMR. Prior to his retirement in December 2004, Mr. Gamper served as Chairman of the Board of CIT Group Inc. (commercial finance). During his tenure with CIT Group Inc. Mr. Gamper served in numerous senior management positions, includ ing Chairman (1987 1989; 1999 2001; 2002 2004), Chief Executive Officer (1987 2004), and President (1989 2002). He currently serves as a member of the Board of Directors of Public Service Enterprise Group (utilities, 2001 present), Chairman of the Board of Governors, Rutgers University (2004 present), and Chairman of the Board of Saint Barnabas Health Care System.
Year of Election or Appointment: 1997
Dr. Gates is Chairman of the Independent Trustees (2006 present). Dr. Gates is President of Texas A&M University (2002 present). He was Director of the Central Intelligence Agency (CIA) from 1991 to 1993. From 1989 to 1991, Dr. Gates served as Assistant to the President of the United States and Deputy National Security Advisor. Dr. Gates is a Director of NACCO Industries, Inc. (mining and manufacturing), Parker Drilling Co., Inc. (drilling and rental tools for the energy industry, 2001 present), and Brinker International (restaurant management, 2003 present). Previously, Dr. Gates served as a Director of LucasVarity PLC (automotive components and diesel engines), a Director of TRW Inc. (automotive, space, defense, and information technology), and Dean of the George Bush School of Government and Public Service at Texas A&M University (1999 2001). Dr. Gates also is a Trustee of the Forum for International Policy.
Year of Election or Appointment: 2004
Dr. Heilmeier is Chairman Emeritus of Telcordia Technologies (communication software and systems), where prior to his retirement, he served as company Chairman and Chief Executive Officer. He currently serves on the Boards of Directors of The Mitre Corpo ration (systems engineering and information technology support for the government), and HRL Laboratories (private research and development, 2004 present). He is Chairman of the General Motors Science & Technology Advisory Board and a Life Fellow of the Institute of Electrical and Electronics Engineers (IEEE) (2000 present). Dr. Heilmeier is a member of the Defense Science Board and the National Security Agency Advisory Board. He is also a member of the National Academy of Engineering, the American Academy of Arts and Sciences, and the Board of Overseers of the School of Engineering and Applied Science of the University of Pennsylvania. Previously, Dr. Heilmeier served as a Director of TRW Inc. (automotive, space, defense, and information technology, 1992 2002), Compaq (1994 2002), Automatic Data Processing, Inc. (ADP) (technology based business outsourcing, 1995 2002), INET Technologies Inc. (telecommunications network surveillance, 2001 2004), and Teletech Holdings (customer management services). He is the recipient of the 2005 Kyoto Prize in Advanced Technology for his invention of the liquid display.
Year of Election or Appointment: 2001
Prior to Ms. Knowles’ retirement in June 2000, she served as Executive Vice President and Chief Financial Officer of Atlantic Richfield Company (ARCO) (diversified energy, 1996 2000). From 1993 to 1996, she was a Senior Vice President of ARCO and President of ARCO Transportation Company. She served as a Director of ARCO from 1996 to 1998. She currently serves as a Director of Phelps Dodge Corporation (copper mining and manufacturing) and McKesson Corporation (healthcare service, 2002 present). Ms. Knowles is a Trustee of the Brookings Institution and the Catalina Island Conservancy and also serves as a member of the Advisory Board for the School of Engineering of the University of Southern California.
21 Annual Report
Trustees and Officers - continued
|
| | Name, Age; Principal Occupation
Ned C. Lautenbach (61)
|
Year of Election or Appointment: 2000
Mr. Lautenbach has been a partner of Clayton, Dubilier & Rice, Inc. (private equity investment firm) since September 1998. Previously, Mr. Lautenbach was with the International Business Machines Corporation (IBM) from 1968 until his retirement in 1998. Mr. Lautenbach serves as a Director of Italtel Holding S.p.A. (telecommunications (Milan, Italy), 2004 present) and Eaton Corpora tion (diversified industrial) as well as the Philharmonic Center for the Arts in Naples, Florida. He also is a member of the Board of Trustees of Fairfield University (2005 present), as well as a member of the Council on Foreign Relations.
Year of Election or Appointment: 1997
Prior to his retirement in December 1994, Mr. McCoy was Vice Chairman of the Board of BellSouth Corporation (telecommunica tions) and President of BellSouth Enterprises. He is currently a Director of Liberty Corporation (holding company), Duke Realty Cor poration (real estate), and Progress Energy, Inc. (electric utility). He is also a partner of Franklin Street Partners (private investment management firm) and a member of the Research Triangle Foundation Board. In addition, Mr. McCoy served as the Interim Chancellor (1999 2000) and a member of the Board of Visitors for the University of North Carolina at Chapel Hill and currently serves on the Board of Directors of the University of North Carolina Health Care System and the Board of Visitors of the Kenan Flagler Business School (University of North Carolina at Chapel Hill). He also served as Vice President of Finance for the University of North Carolina (16 school system).
Year of Election or Appointment: 2005
Ms. Small is a member (2000 present) and Chairperson (2002 present) of the Investment Committee, and a member (2002 present) of the Board of Trustees of Smith College. Previously, she served as Chief Investment Officer (1999 2000), Director of Global Equity Investments (1996 1999), and a member of the Board of Directors of Scudder, Stevens & Clark (1990 1997) and Scudder Kemper Investments (1997 1998). In addition, Ms. Small served as Co Chair (2000 2003) of the Annual Fund for the Fletcher School of Law and Diplomacy.
| | William S. Stavropoulos (66)
|
Year of Election or Appointment: 2002
Mr. Stavropoulos is Chairman of the Board (2000 present) and a Member of the Board of Directors of The Dow Chemical Company. Since joining The Dow Chemical Company in 1967, Mr. Stavropoulos served in numerous senior management positions, including President (1993 2000; 2002 2003), CEO (1995 2000; 2002 2004), and Chairman of the Executive Committee (2000 2004). Currently, he is a Director of NCR Corporation (data warehousing and technology solutions), BellSouth Corporation (telecommu nications), Chemical Financial Corporation, Maersk Inc. (industrial conglomerate, 2002 present), and Metalmark Capital (private equity investment firm, 2005 present). He also serves as a member of the Board of Trustees of the American Enterprise Institute for Public Policy Research. In addition, Mr. Stavropoulos is a member of The Business Council, J.P. Morgan International Council and the University of Notre Dame Advisory Council for the College of Science.
Year of Election or Appointment: 2005
Prior to his retirement in 2001, Mr. Wolfe was Chairman and Chief Executive Officer of Hershey Foods Corporation (1993 2001). He currently serves as a member of the boards of Adelphia Communications Corporation (2003 present), Bausch & Lomb, Inc., and Revlon Inc. (2004 present).
VIP Aggressive Growth Portfolio
|
Advisory Board Member and Executive Officers:
Correspondence intended for each executive officer and Mr. Lynch may be sent to Fidelity Investments, 82 Devonshire Street, Boston, Massachusetts 02109.
| | Name, Age; Principal Occupation
Peter S. Lynch (61)
|
Year of Election or Appointment: 2003
Member of the Advisory Board of Fidelity Variable Insuance Products Fund III. Vice Chairman and a Director of FMR, and Vice Chairman (2001 present) and a Director (2000 present) of FMR Co., Inc. Previously, Mr. Lynch served as a Trustee of the Fidelity funds (1990 2003). In addition, he serves as a Trustee of Boston College, Massachusetts Eye & Ear Infirmary, Historic Deerfield, John F. Kennedy Library, and the Museum of Fine Arts of Boston.
Year of Election or Appointment: 2005
Vice President of VIP Aggressive Growth. Mr. Churchill also serves as Vice President of certain Equity Funds (2005 present) and certain High Income Funds (2005 present). Previously, he served as Head of Fidelity’s Fixed Income Division (2000 2005), Vice President of Fidelity’s Money Market Funds (2000 2005), Vice President of Fidelity’s Bond Funds, and Senior Vice President of FIMM (2000) and FMR. Mr. Churchill joined Fidelity in 1993 as Vice President and Group Leader of Taxable Fixed Income Investments.
Year of Election or Appointment: 1998
Secretary of VIP Aggressive Growth. He also serves as Secretary of other Fidelity funds; Vice President, General Counsel, and Secretary of FMR Co., Inc. (2001 present) and FMR; Assistant Secretary of Fidelity Management & Research (U.K.) Inc. (2001 present), Fidelity Management & Research (Far East) Inc. (2001 present), and Fidelity Investments Money Management, Inc. (2001 present). Mr. Roiter is an Adjunct Member, Faculty of Law, at Boston College Law School (2003 present). Previously, Mr. Roiter served as Vice President and Secretary of Fidelity Distributors Corporation (FDC) (1998 2005).
Year of Election or Appointment: 2005
Vice President of VIP Aggressive Growth. Mr. Calhoun serves as Vice President of other funds advised by FMR. Prior to assuming his current responsibilities, Mr. Calhoun worked as a research analyst and manager. Mr. Calhoun also serves as Vice President of FMR (2005) and FMR Co., Inc. (2005).
Year of Election or Appointment: 2003
Assistant Secretary of VIP Aggressive Growth. Mr. Fross also serves as Assistant Secretary of other Fidelity funds (2003 present), Vice President and Secretary of FDC (2005 present), and is an employee of FMR.
Year of Election or Appointment: 2004
President, Treasurer, and Anti Money Laundering (AML) officer of VIP Aggressive Growth. Ms. Reynolds also serves as President, Treasurer, and AML officer of other Fidelity funds (2004) and is a Vice President (2003) and an employee (2002) of FMR. Before joining Fidelity Investments, Ms. Reynolds worked at PricewaterhouseCoopers LLP (PwC) (1980 2002), where she was most recently an audit partner with PwC’s investment management practice.
Year of Election or Appointment: 2006
Chief Financial Officer of VIP Aggressive Growth. Mr. Murphy also serves as Chief Financial Officer of other Fidelity funds (2005 present). He also serves as Senior Vice President of Fidelity Pricing and Cash Management Services Group (FPCMS).
| | Kenneth A. Rathgeber (58)
|
Year of Election or Appointment: 2004
Chief Compliance Officer of VIP Aggressive Growth. Mr. Rathgeber also serves as Chief Compliance Officer of other Fidelity funds (2004) and Executive Vice President of Risk Oversight for Fidelity Investments (2002). Previously, he served as Executive Vice President and Chief Operating Officer for Fidelity Investments Institutional Services Company, Inc. (1998 2002).
Year of Election or Appointment: 2003
Deputy Treasurer of VIP Aggressive Growth. Mr. Hebble also serves as Deputy Treasurer of other Fidelity funds (2003), and is an employee of FMR. Before joining Fidelity Investments, Mr. Hebble worked at Deutsche Asset Management where he served as Director of Fund Accounting (2002 2003) and Assistant Treasurer of the Scudder Funds (1998 2003).
23 Annual Report
Trustees and Officers - continued
|
| | Name, Age; Principal Occupation
Bryan A. Mehrmann (44)
|
Year of Election or Appointment: 2005
Deputy Treasurer of VIP Aggressive Growth. Mr. Mehrmann also serves as Deputy Treasurer of other Fidelity funds (2005 present) and is an employee of FMR. Previously, Mr. Mehrmann served as Vice President of Fidelity Investments Institutional Services Group (FIIS)/Fidelity Investments Institutional Operations Corporation, Inc. (FIIOC) Client Services (1998 2004).
| | Kimberley H. Monasterio (42)
|
Year of Election or Appointment: 2004
Deputy Treasurer of VIP Aggressive Growth. Ms. Monasterio also serves as Deputy Treasurer of other Fidelity funds (2004) and is an employee of FMR (2004). Before joining Fidelity Investments, Ms. Monasterio served as Treasurer (2000 2004) and Chief Financial Officer (2002 2004) of the Franklin Templeton Funds and Senior Vice President of Franklin Templeton Services, LLC (2000 2004).
Year of Election or Appointment: 2005
Deputy Treasurer of VIP Aggressive Growth. Mr. Robins also serves as Deputy Treasurer of other Fidelity funds (2005 present) and is an employee of FMR (2004 present). Before joining Fidelity Investments, Mr. Robins worked at KPMG LLP, where he was a partner in KPMG’s department of professional practice (2002 2004) and a Senior Manager (1999 2000). In addition, Mr. Robins served as Assistant Chief Accountant, United States Securities and Exchange Commission (2000 2002).
Year of Election or Appointment: 2005
Assistant Treasurer of VIP Aggressive Growth. Mr. Byrnes also serves as Assistant Treasurer of other Fidelity funds (2005 present) and is an employee of FMR (2005 present). Previously, Mr. Byrnes served as Vice President of FPCMS (2003 2005). Before joining Fidelity Investments, Mr. Byrnes worked at Deutsche Asset Management where he served as Vice President of the Investment Operations Group (2000 2003).
Year of Election or Appointment: 1986
Assistant Treasurer of VIP Aggressive Growth. Mr. Costello also serves as Assistant Treasurer of other Fidelity funds and is an employee of FMR.
Year of Election or Appointment: 2004
Assistant Treasurer of VIP Aggressive Growth. Mr. Lydecker also serves as Assistant Treasurer of other Fidelity funds (2004) and is an employee of FMR.
Year of Election or Appointment: 2002
Assistant Treasurer of VIP Aggresive Growth. Mr. Osterheld also serves as Assistant Treasurer of other Fidelity funds (2002) and is an employee of FMR.
Year of Election or Appointment: 2005
Assistant Treasurer of VIP Aggressive Growth. Mr. Ryan also serves as Assistant Treasurer of other Fidelity funds (2005 present) and is an employee of FMR (2005 present). Previously, Mr. Ryan served as Vice President of Fund Reporting in FPCMS (1999 2005).
Year of Election or Appointment: 2005
Assistant Treasurer of VIP Aggressive Growth. Mr. Schiavone also serves as Assistant Treasurer of other Fidelity funds
(2005 present) and is an employee of FMR (2005 present). Before joining Fidelity Investments, Mr. Schiavone worked at Deutsche Asset Management, where he most recently served as Assistant Treasurer (2003 2005) of the Scudder Funds and Vice President and Head of Fund Reporting (1996 2003).
VIP Aggressive Growth Portfolio
|
The Board of Trustees of VIP Aggressive Growth Portfolio voted to pay to shareholders of record at the opening of business on record date, the following distributions per share derived from capital gains realized from sales of portfolio securities, and dividends derived from net invest ment income:
| | | Pay Date | | Record Date | | Capital Gains |
| Initial Class | | 2/10/06 | | 2/10/06 | | $0.03 |
| Service Class | | 2/10/06 | | 2/10/06 | | $0.03 |
| Service Class 2 | | 2/10/06 | | 2/10/06 | | $0.03 |
| Investor Class | | 2/10/06 | | 2/10/06 | | $0.03 |
The fund hereby designates as a capital gain dividend with respect to the taxable year ended December 31, 2005, $591,693, or, if subsequently determined to be different, the net capital gain of such year.
The fund will notify shareholders in January 2006 of amounts for use in preparing 2005 income tax returns.
25 Annual Report
Board Approval of Investment Advisory Contracts and Management Fees
VIP Aggressive Growth Portfolio
|
Each year, typically in July, the Board of Trustees, including the independent Trustees (together, the Board), votes on the renewal of the management contract and sub advisory agreements (together, the Advisory Contracts) for the fund. The Board, assisted by the advice of fund counsel and indepen dent Trustees’ counsel, requests and considers a broad range of information throughout the year.
The Board meets regularly each month except August and takes into account throughout the year matters bearing on Advisory Contracts. The Board, acting directly and through its separate committees, considers at each of its meetings factors that are relevant to the annual renewal of the fund’s Advisory Contracts, including the services and support provided to the fund and its shareholders by Fidelity. At the time of the renewal, the Board had 11 standing committees, each composed of independent Trustees with varying backgrounds, to which the Board has assigned specific subject matter responsibilities in order to enhance effective decision making by the Board. Each committee has adopted a written charter outlining the structure and purposes of the committee. One such committee, the Equity Contract Committee, meets periodically during the first six months of each year and as necessary to consider matters specifically related to the annual renewal of Advisory Contracts. The committee requests and receives information on, and makes recommendations to the independent Trustees concerning, the approval and annual review of the Advisory Contracts.
At its July 2005 meeting, the Board of Trustees, including the independent Trustees, unanimously determined to renew the Advisory Contracts for the fund. In reaching its determination, the Board considered all factors it believed relevant, including (1) the nature, extent, and quality of the services to be provided to the fund and its shareholders by Fidelity (including the investment performance of the fund); (2) the competitiveness of the manage ment fee and total expenses of the fund; (3) the total costs of the services to be provided by and the profits to be realized by the investment adviser and its affiliates from the relationship with the fund; (4) the extent to which economies of scale would be realized as the fund grows; and (5) whether fee levels reflect these economies of scale, if any, for the benefit of fund shareholders.
In determining whether to renew the Advisory Contracts for the fund, the Board ultimately reached a determination, with the assistance of fund counsel and independent Trustees’ counsel, that the renewal of the Advisory Contracts and the compensation to be received by Fidelity under the management contract is consistent with Fidelity’s fiduciary duty under applicable law. In addition to evaluating the specific factors noted above, the Board, in reaching its determination, is aware that shareholders in the fund have a broad range of investment choices available to them, including a wide choice among mutual funds offered by competitors to Fidelity, and that the fund’s shareholders, with the opportunity to review and weigh the disclosure provided by the fund in its prospectus and other public disclosures, have chosen to invest in this fund, managed by Fidelity.
Nature, Extent, and Quality of Services Provided by Fidelity. The Board considered staffing within the investment adviser, FMR, and the sub advisers (together, the Investment Advisers), including the background of the fund’s portfolio manager and the fund’s investment objective and discipline. The independent Trustees also had discussions with senior management of Fidelity’s investment operations and investment groups. The Board considered the structure of the portfolio manager compensation program and whether this structure provides appropriate incentives.
Fidelity Resources Dedicated to Investment Management and Support Services. The Board reviewed the size, education, and experience of the Invest ment Advisers’ investment staff, their use of technology, and the Investment Advisers’ approach to recruiting, training, and retaining portfolio managers and other research, advisory, and management personnel. The Board considered Fidelity’s extensive global research capabilities that enable the Investment Advisers to aggregate data from various sources in an effort to produce positive investment results. The Board noted that Fidelity’s analysts have access to a variety of technological tools that enable them to perform both fundamental and quantitative analysis and to specialize in various disciplines. The Board also considered that Fidelity’s portfolio managers and analysts have access to daily portfolio attribution that allows for monitor ing of a fund’s portfolio, as well as an electronic communication system that provides immediate real time access to research concerning issuers and credit enhancers.
Shareholder and Administrative Services. The Board considered the nature, extent, quality, and cost of administrative, distribution, and shareholder services performed by the Investment Advisers and their affiliates under the Advisory Contracts and under separate agreements covering transfer agency, pricing and bookkeeping, and securities lending services for the fund. The Board also considered the nature and extent of the Investment Advisers’ supervision of third party service providers, principally custodians and subcustodians. The Board reviewed the allocation of fund brokerage, including allocations to brokers affiliated with the Investment Advisers, the use of brokerage commissions to pay fund expenses, and the use of “soft” commission dollars to pay for research services. The Board also considered that Fidelity voluntarily decided in 2004 to stop using “soft” commission dollars to pay for market data and, instead, to pay for that data out of its own resources. The Board also considered the resources devoted to, and the record of compliance with, the fund’s compliance policies and procedures.
The Board noted that the growth of fund assets across the complex allows Fidelity to reinvest in the development of services designed to enhance the value or convenience of the Fidelity funds as investment vehicles. These services include 24 hour access to account information and market informa tion through phone representatives and over the Internet, and investor education materials and asset allocation tools.
Investment in a Large Fund Family. The Board considered the benefits to shareholders of investing in a Fidelity fund, including the benefits of investing in a fund that is part of a large family of funds offering a variety of investment disciplines and providing for a large variety of mutual fund investor services. The Board noted that, since the last Advisory Contract renewals in July 2004, Fidelity has taken a number of actions that benefited particular
VIP Aggressive Growth Portfolio
|
funds, including (i) voluntarily deciding in 2004 to stop using “soft” commission dollars to pay for market data and, instead, to pay for that data out of its own resources, (ii) contractually agreeing to impose management fee reductions and expense limitations on its five Spartan stock index funds and its stock index fund available through variable insurance products, (iii) contractually agreeing to eliminate the management fees on the Fidelity Freedom Funds and the Fidelity Advisor Freedom Funds, (iv) contractually agreeing to reduce the management fees on most of its investment grade taxable bond funds, and (v) contractually agreeing to impose expense limitations on its retail and Spartan investment grade taxable bond funds.
Investment Performance and Compliance. The Board considered whether the fund has operated within its investment objective, as well as its record of compliance with its investment restrictions. It also reviewed the fund’s absolute investment performance for each class, as well as the fund’s relative investment performance for each class measured against (i) a broad based securities market index, and (ii) a peer group of mutual funds deemed appropriate by the Board over multiple periods. Because the fund had been in existence less than five calendar years, the following charts considered by the Board show, over the one and three year periods ended December 31, 2004, the returns of Service Class 2 and Initial Class of the fund, the returns of a broad based securities market index (“benchmark”), and a range of returns of a peer group of mutual funds identified by Lipper Inc. as having an investment objective similar to that of the fund. The returns of Service Class 2 and Initial Class represent the performance of classes with the highest and lowest 12b 1 fees, respectively (not necessarily with the highest and lowest total expenses). The box within each chart shows the 25th percentile return (bottom of box) and the 75th percentile return (top of box) of the Lipper peer group. Returns shown above the box are in the first quartile and returns shown below the box are in the fourth quartile. The percentage beaten numbers noted below each chart correspond to the percen tile box and represent the percentage of funds in the Lipper peer group whose performance was equal to or lower than that of the class indicated.
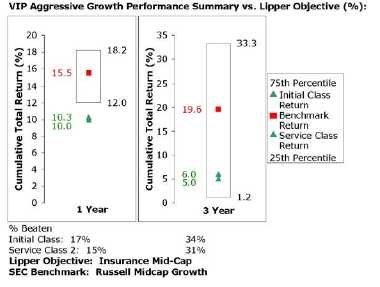
The Board reviewed the fund’s relative investment performance against its Lipper peer group and stated that the performance of Initial Class of the fund was in the fourth quartile for the one year period and the third quartile for the three year period. The Board also stated that the relative investment performance of the fund was lower than its benchmark over time. The Board considered that the variations in performance among the fund’s classes reflect the variations in class expenses, which result in lower performance for higher expense classes. The Board discussed with FMR actions to be taken by FMR to improve the fund’s disappointing performance.
The Board has had thorough discussions with FMR throughout the year about the Board’s and FMR’s concerns about equity research, equity fund performance, and compliance with internal policies governing gifts and entertainment. FMR has taken steps that it believes will refocus and strengthen equity research and equity portfolio management and compliance. The Board noted with favor FMR’s recent reorganization of its senior management team and FMR’s plans to dedicate additional resources to investment research, and participated in the process that led to those changes.
Based on its review, and giving particular weight to the nature and quality of the resources dedicated by the Investment Advisers to maintain and improve relative performance, the Board concluded that the nature, extent, and quality of the services provided by Fidelity will benefit the fund’s shareholders, particularly in light of the Board’s view that the fund’s shareholders benefit from investing in a fund that is part of a large family of funds offering a variety of investment disciplines and services.
Competitiveness of Management Fee and Total Fund Expenses. The Board considered the fund’s management fee and total expenses compared to “mapped groups” of competitive funds and classes. Fidelity creates “mapped groups” by combining similar Lipper investment objective categories that have comparable management fee characteristics. Combining Lipper investment objective categories aids the Board’s management fee and total expense comparisons by broadening the competitive group used for comparison and by reducing the number of universes to which various Fidelity funds are compared.
27 Annual Report
Board Approval of Investment Advisory Contracts and Management Fees - continued
The Board considered two proprietary management fee comparisons for the 12 month periods shown in the chart below. The group of Lipper funds used by the Board for management fee comparisons is referred to below as the “Total Mapped Group” and, for the reasons explained above, is broader than the Lipper peer group used by the Board for performance comparisons. The Total Mapped Group comparison focuses on a fund’s standing relative to the total universe of comparable funds available to investors, in terms of gross management fees before expense reimbursements or caps. “TMG %” represents the percentage of funds in the Total Mapped Group that had management fees that were lower than the fund’s. For example, a TMG % of 15% means that 85% of the funds in the Total Mapped Group had higher management fees than the fund. The “Asset Size Peer Group” (ASPG) comparison focuses on a fund’s standing relative to non Fidelity funds similar in size to the fund within the Total Mapped Group. The ASPG represents at least 15% of the funds in the Total Mapped Group with comparable asset size and management fee characteristics, subject to a minimum of 50 funds (or all funds in the Total Mapped Group if fewer than 50). Additional information, such as the ASPG quartile (“quadrant”) in which the fund’s management fee ranked, is also included in the chart and considered by the Board.
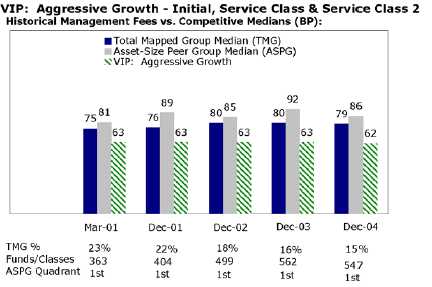
The Board noted that the fund’s management fee ranked below the median of its Total Mapped Group and below the median of its ASPG for 2004.
Based on its review, the Board concluded that the fund’s management fee was fair and reasonable in light of the services that the fund receives and the other factors considered.
In its review of each class’s total expenses, the Board considered the fund’s management fee as well as other fund or class expenses, as applicable, such as transfer agent fees, pricing and bookkeeping fees, fund paid 12b 1 fees, and custodial, legal, and audit fees. The Board also noted the effects of any waivers and reimbursements on fees and expenses. As part of its review, the Board also considered current and historical total expenses of each class of the fund compared to competitive fund median expenses. Each class of the fund is compared to those funds and classes in the Total Mapped Group (used by the Board for management fee comparisons) that have a similar sales load structure.
The Board noted that each class’s total expenses ranked above its competitive median for 2004. The Board considered that the classes were above median because of high expenses in basis points due to the fund’s small size. The Board noted that the fund offers multiple classes, each of which has a different 12b 1 fee structure, and that the multiple structures are intended to offer a range of pricing options for the intermediary market. The Board also noted that the total expenses of the classes vary primarily by the level of their 12b 1 fees.
Furthermore, the Board considered that on December 16, 2004, it had approved changes (effective January 1, 2005) in the transfer agent and service agreements for the fund that established maximum transfer agent fees and eliminated the minimum pricing and bookkeeping fee to prevent small funds or funds with small average account sizes from having relatively high fees in basis points (the “small fund fee reductions”). The Board considered that, if the small fund fee reductions had been in effect in 2004, the total expenses of Initial Class would have ranked below the median.
In its review of total expenses, the Board also considered Fidelity fee structures and other information on clients that FMR and its affiliates service in other competitive markets, such as other mutual funds advised or subadvised by FMR or its affiliates, pension plan clients, and other institutional clients.
Based on its review, the Board concluded that the total expenses for each class of the fund were reasonable, although in all cases above the median of the universe presented for comparison, in light of the services that the fund and its shareholders receive and the other factors considered.
VIP Aggressive Growth Portfolio
|
Costs of the Services and Profitability. The Board considered the revenues earned and the expenses incurred by Fidelity in conducting the busi ness of developing, marketing, distributing, managing, administering and servicing the fund and its shareholders. The Board also considered the level of Fidelity’s profits in respect of all the Fidelity funds.
On an annual basis, FMR presents to the Board Fidelity’s profitability for the fund. Fidelity calculates the profitability for each fund, as well as aggregate profitability for groups of Fidelity funds and all Fidelity funds, using a series of detailed revenue and cost allocation methodologies which originate with the audited books and records of Fidelity. The Audit Committee of the Board reviews any significant changes from the prior year’s methodologies.
PricewaterhouseCoopers LLP (PwC), independent registered accounting firm and auditor to Fidelity and certain Fidelity funds, has been engaged annually by the Board as part of the Board’s assessment of the results of Fidelity’s profitability analysis. PwC’s engagement includes the review and assessment of Fidelity’s methodologies used in determining the revenues and expenses attributable to Fidelity’s mutual fund business, and completion of agreed upon procedures surrounding the mathematical accuracy of fund profitability and its conformity to allocation methodologies. After consider ing PwC’s reports issued under the engagement and information provided by Fidelity, the Board believes that while other allocation methods may also be reasonable, Fidelity’s profitability methodologies are reasonable in all material respects.
The Board has also reviewed Fidelity’s non fund businesses and any fall out benefits related to the mutual fund business as well as cases where Fidelity’s affiliates may benefit from or be related to the fund’s business. In addition, a special committee of the Board reviewed services provided to Fidelity by its affiliates and determined that the fees that Fidelity paid for such services were reasonable.
The Board considered the costs of the services provided by and the profits realized by Fidelity in connection with the operation of the fund and deter mined that the amount of profit is a fair entrepreneurial profit for the management of the fund.
Economies of Scale. The Board considered whether there have been economies of scale in respect of the management of the Fidelity funds, whether the Fidelity funds (including the fund) have appropriately benefited from any such economies of scale, and whether there is potential for realization of any further economies of scale. The Board considered the extent to which the fund will benefit from economies of scale through increased services to the fund, through waivers or reimbursements, or through fee or expense reductions.
The Board recognized that the fund’s management contract incorporates a “group fee” structure, which provides for lower fee rates as total fund assets under FMR’s management increase, and for higher fee rates as total fund assets under FMR’s management decrease. The Board considered that the group fee is designed to deliver the benefits of economies of scale to fund shareholders when total fund assets increase, even if assets of any particular fund are unchanged or have declined, because some portion of Fidelity’s costs are attributable to services provided to all Fidelity funds, and all funds benefit if those costs can be allocated among more assets. The Board concluded that, given the group fee structure, fund shareholders will achieve a certain level of economies of scale as assets under FMR’s management increase at the fund complex level, regardless of whether Fidelity achieves any such economies of scale.
The Board further concluded that any potential economies of scale are being shared between fund shareholders and Fidelity in an appropriate manner.
Additional Information Requested by the Board. In order to develop fully the factual basis for consideration of the Advisory Contracts, the Board requested additional information regarding (i) equity fund transfer agency fees; (ii) Fidelity’s fund profitability methodology and the impact of various changes in the methodology over time; (iii) benefits to shareholders from economies of scale; (iv) composition and characteristics of various fund and industry data used in comparisons; and (v) compensation of portfolio managers and research analysts.
Based on its evaluation of all of the conclusions noted above, and after considering all material factors, the Board ultimately concluded that the exist ing advisory fee structures are fair and reasonable, and that the fund’s existing Advisory Contracts should be renewed.
29 Annual Report
Investment Adviser
Fidelity Management & Research Company
Boston, MA
Investment Sub Advisers
FMR Co., Inc.
Fidelity Management & Research (U.K.) Inc.
Fidelity Management & Research (Far East) Inc.
Fidelity Investments Japan Limited
Fidelity International Investment Advisors
Fidelity International Investment Advisors (U.K.) Limited
General Distributor
Fidelity Distributors Corporation
Boston, MA
Transfer and Service Agents
Fidelity Investments Institutional Operations Company, Inc.
Boston, MA
Fidelity Service Company, Inc.
Boston, MA
Custodian
JPMorgan Chase Bank
New York, NY
|
VIPAG ANN 0206
1.751800.105
|
Fidelity® Variable Insurance Products:
Balanced Portfolio
|

Annual Report
December 31, 2005
|

| Contents | | | | |
| |
| Performance | | 3 | | How the fund has done over time. |
| Management’s Discussion | | 4 | | The manager’s review of fund performance, strategy and |
| | | | | outlook. |
| Shareholder Expense Example | | 5 | | An example of shareholder expenses. |
| Investment Changes | | 6 | | A summary of major shifts in the fund’s investments over the |
| | | | | past six months. |
| Investments | | 7 | | A complete list of the fund’s investments with their |
| | | | | market values. |
| Financial Statements | | 42 | | Statements of assets and liabilities, operations, and |
| | | | | changes in net assets, as well as financial highlights. |
| Notes | | 46 | | Notes to the financial statements. |
| Report of Independent Registered Public | | 52 | | |
| Accounting Firm | | | | |
| Trustees and Officers | | 53 | | |
| Distributions | | 59 | | |
| Board Approval of Investment Advisory | | 60 | | |
| Contracts and Management Fees | | | | |
| | To view a fund’s proxy voting guidelines and proxy voting record for the 12 month period ended June 30, visit www.fidelity.com/proxyvotingresults or visit the
Securities and Exchange Commission’s (SEC) web site at www.sec.gov. You may also call 1-877-208-0098 to request a free copy of the proxy voting guidelines.
Fidelity Variable Insurance Products are separate account options which are purchased through a variable insurance contract.
Standard & Poor’s, S&P and S&P 500 are registered service marks of The McGraw Hill Companies, Inc. and have been licensed for use by
Fidelity Distributors Corporation.
Other third party marks appearing herein are the property of their respective owners.
All other marks appearing herein are registered or unregistered trademarks or service marks of FMR Corp. or an affiliated company.
|
| | This report and the financial statements contained herein are submitted for the general information of the shareholders of the fund. This report is not authorized for
distribution to prospective investors in the fund unless preceded or accompanied by an effective prospectus.
A fund files its complete schedule of portfolio holdings with the SEC for the first and third quarters of each fiscal year on Form N Q. Forms N Q are available on the SEC’s
web site at http://www.sec.gov. A fund’s Forms N Q may be reviewed and copied at the SEC’s Public Reference Room in Washington, DC. Information regarding the
operation of the SEC’s Public Reference Room may be obtained by calling 1-800-SEC-0330. For a complete list of a fund’s portfolio holdings, view the most recent quar
terly holdings report, semiannual report, or annual report on Fidelity’s web site at http://www.advisor.fidelity.com.
NOT FDIC INSURED · MAY LOSE VALUE · NO BANK GUARANTEE
Neither the fund nor Fidelity Distributors Corporation is a bank.
|
VIP Balanced Portfolio 2
| | VIP Balanced Portfolio
Performance: The Bottom Line
|
Average annual total return reflects the change in the value of an investment, assuming reinvestment of the class’ dividend income and capital gains (the profits earned upon the sale of securities that have grown in value) and assuming a constant rate of performance each year. During periods of reimbursement by Fidelity, a fund’s total return will be greater than it would be had the reimbursement not occurred. Performance numbers are net of all underlying fund operating expenses, but do not include any insurance charges imposed by your insurance company’s separate account. If performance information included the effect of these additional charges, the total returns would have been lower. How a fund did yesterday is no guarantee of how it will do tomorrow.
| Average Annual Total Returns | | | | | | |
| Periods ended December 31, 2005 | | Past 1 | | Past 5 | | Past 10 |
| | | year | | years | | years |
| VIP Balanced - Initial Class | | 5.77% | | 3.36% | | 6.44% |
| VIP Balanced - Service ClassA | | 5.61% | | 3.25% | | 6.33% |
| VIP Balanced - Service Class 2B | | 5.53% | | 3.09% | | 6.23% |
| VIP Balanced - Investor ClassC | | 5.69% | | 3.35% | | 6.43% |
A The initial offering of Service Class shares took place on November 3, 1997. Performance for Service Class shares reflects an asset based service fee (12b 1 fee), and returns prior to
November 3, 1997 are those of Initial Class and do not include the effects of Service Class’ 12b 1 fee. Had Service Class shares’ 12b 1 fee been reflected, returns prior to November 3, 1997
would have been lower.
B The initial offering of Service Class 2 shares took place on January 12, 2000. Performance for Service Class 2 shares reflects an asset based service fee (12b 1 fee). Returns
from November 3, 1997 through January 12, 2000 are those of Service Class which reflects a different 12b 1 fee. Service Class 2 returns prior to November 3, 1997 are those of
Initial Class, and do not include the effects of a 12b 1 fee. Had Service Class 2’s 12b 1 fee been reflected, returns prior to January 12, 2000 would have been lower.
C The initial offering of Investor Class shares took place on July 21, 2005. Returns prior to July 21, 2005 are those of Initial Class. If Investor Class’s transfer agent fee had
been reflected, returns prior to July 21, 2005 would have been lower.
|
$10,000 Over 10 Years
Let’s say hypothetically that $10,000 was invested in VIP Balanced Portfolio Initial Class on December 31, 1995. The chart shows how the value of your investment would have changed, and also shows how the Standard & Poor’s 500SM Index performed over the same period.
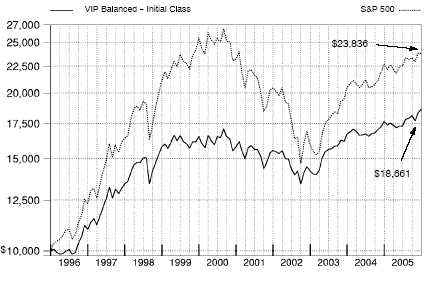
3 Annual Report
VIP Balanced Portfolio
Management’s Discussion of Fund Performance
|
Comments from Lawrence Rakers and Ford O’Neil, Co Portfolio Managers of VIP Balanced Portfolio
U.S. equities outperformed investment grade and high yield debt during the 12 month period ending December 31, 2005, a positive year for all three asset classes. Energy and utilities were the two best performing equity market sectors, and significant contributors to the 4.91% gain of the Standard & Poor’s 500SM Index. Elsewhere, the NASDAQ Composite® Index returned 2.13%, while the Dow Jones Industrial AverageSM rose 1.72% . The investment grade bond market also ended 2005 in the black, marking six consecutive years of gains for the debt category. However, the 2.43% advance of the Lehman Brothers® Aggregate Bond Index was its lowest return in that streak, which reflects the trying investment conditions bonds encountered in the form of higher interest rates and rising inflation. Amid the uncertainty, Treasuries outperformed corporate, agency and mortgage backed debt. High yield also struggled, rising only 2.74% according to the Merrill Lynch® U.S. High Yield Master II Index. Intermittent weakness in the automotive and air transportation industries tempered high yield debt performance.
During the past year, the fund outperformed both the 4.00% return of the Fidelity Balanced 60/40 Composite Index and the 4.78% gain of the LipperSM Variable Annuity Balanced Funds Average. (For specific portfolio performance results, please refer to the performance section of this report.) While poor performance in the equity subportfolio during the period’s first half hampered overall results, both the equity and fixed income subportfolios comfort ably outperformed their respective benchmarks in the final six months, enabling the fund to finish ahead of its benchmarks. Stock picking in energy, industrials and health care added the most value versus the Fidelity Composite index. Diversified energy services provider Halliburton was by far the best overall contributor, aided by rising demand in its energy services division. News of strong same store sales boosted the stock price of clothing retailer Kohl’s, and I sold the position to lock in profits. Conversely, the fund was hurt by its position in satellite TV provider EchoStar Communications the equity subportfolio’s largest detractor as concerns about increasing competition hurt the stock. Also holding back performance was cardboard container maker Smurfit Stone Container, which suffered from weaker than expected demand for containerboard. In the fixed income subportfolio, an out of index exposure to high yield securities was helpful, as they outperformed investment grade bonds. In the investment grade category, our holdings in floating rate securities and securitized products aided performance, along with an overweighting in securities with longer maturities.
The views expressed in this statement reflect those of the portfolio managers only through the end of the period of the report as stated on the cover and do not necessarily represent the views of Fidelity or any other person in the Fidelity organization. Any such views are subject to change at any time based upon market or other conditions and Fidelity disclaims any responsibility to update such views. These views may not be relied on as invest ment advice and, because investment decisions for a Fidelity fund are based on numerous factors, may not be relied on as an indication of trading intent on behalf of any Fidelity fund.
VIP Balanced Portfolio 4
VIP Balanced Portfolio
Shareholder Expense Example
|
As a shareholder of the Fund, you incur two types of costs: (1) transaction costs, and (2) ongoing costs, including management fees, distribution and/or service (12b 1) fees and other Fund expenses. This Example is intended to help you understand your ongoing costs (in dollars) of investing in the Fund and to compare these costs with the ongoing costs of investing in other mutual funds.
The actual expense Example is based on an investment of $1,000 invested at the beginning of the period and held for the entire period (July 1, 2005 to December 31, 2005) for Initial Class, Service Class and Service Class 2 and for the entire period (July 21, 2005 to December 31, 2005) for Investor Class. The hypothetical expense Example is based on an investment of $1,000 invested for the one half year period (July 1, 2005 to December 31, 2005).
Actual Expenses
The first line of the table below for each class of the Fund provides information about actual account values and actual expenses. You may use the information in this line, together with the amount you invested, to estimate the expenses that you paid over the period. Simply divide your account value by $1,000.00 (for example, an $8,600 account value divided by $1,000.00 = 8.6), then multiply the result by the number in the first line for a class of the Fund under the heading entitled “Expenses Paid During Period” to estimate the expenses you paid on your account during this period. The estimate of expenses does not include any fees or other expenses of any variable annuity or variable life insurance product. If they were, the estimate of expenses you paid during the period would be higher, and your ending account value would be lower. In addition, the fund, as a shareholder in the underlying affiliated central funds, will indirectly bear its pro rata share of the fees and expenses incurred by the underlying affiliated central funds. These fees and expenses are not included in the fund’s annualized expense ratio used to calculate the expense estimate in the table below.
Hypothetical Example for Comparison Purposes
The second line of the table below for each class of the Fund provides information about hypothetical account values and hypothetical expenses based on a Class’ actual expense ratio and an assumed rate of return of 5% per year before expenses, which is not the Class’ actual return. The hypothetical account values and expenses may not be used to estimate the actual ending account balance or expenses you paid for the period. You may use this information to compare the ongoing costs of investing in the Fund and other funds. To do so, compare this 5% hypothetical example with the 5% hypothetical examples that appear in the shareholder reports of the other funds. The estimate of expenses does not include any fees or other expenses of any variable annuity or variable life insurance product. If they were, the estimate of expenses you paid during the period would be higher, and your ending account value would be lower. In addition, the fund, as a shareholder in the underlying affiliated central funds, will indirectly bear its pro rata share of the fees and expenses incurred by the underlying affiliated central funds. These fees and expenses are not included in the fund’s annualized expense ratio used to calculate the expense estimate in the table below.
Please note that the expenses shown in the table are meant to highlight your ongoing costs only and do not reflect any transaction costs. Therefore, the second line of the table is useful in comparing ongoing costs only, and will not help you determine the relative total costs of owning different funds.
| | | | | Ending | | | | |
| | | Beginning | | Account Value | | | | Expenses Paid |
| | | Account Value | | December 31, 2005 | | | | During Period |
| Initial Class | | | | | | | | |
| Actual | | $ 1,000.00 | | $ 1,078.80 | | | | $ 3.04B |
| HypotheticalA | | $ 1,000.00 | | $ 1,022.28 | | | | $ 2.96C |
| Service Class | | | | | | | | |
| Actual | | $ 1,000.00 | | $ 1,078.50 | | | | $ 3.61B |
| HypotheticalA | | $ 1,000.00 | | $ 1,021.73 | | | | $ 3.52C |
| Service Class 2 | | | | | | | | |
| Actual | | $ 1,000.00 | | $ 1,077.40 | | | | $ 4.40B |
| HypotheticalA | | $ 1,000.00 | | $ 1,020.97 | | | | $ 4.28C |
| Investor Class | | | | | | | | |
| Actual | | $ 1,000.00 | | $ 1,058.00 | | | | $ 3.51B |
| HypotheticalA | | $ 1,000.00 | | $ 1,021.37 | | | | $ 3.87C |
A 5% return per year before expenses
B Actual expenses are equal to each Class’ annualized expense ratio (shown in the table below); multiplied by the average account value over the period, multiplied by 184/365 (to reflect the one half year period) for Initial Class, Service Class and Service Class 2 and multiplied by 164/365 (to reflect the period July 21, 2005 to December 31, 2005) for Investor Class.
C Hypothetical expenses are equal to each Class’ annualized expense ratio (shown in the table below); multiplied by the average account value over the period, multiplied by 184/365 (to reflect the one-half year period).
| | | Annualized |
| | | Expense Ratio |
| Initial Class | | 58% |
| Service Class | | 69% |
| Service Class 2 | | 84% |
| Investor Class | | 76% |
55 Annual Report
| VIP Balanced Portfolio | | | | |
| Investment Changes | | |
| |
| |
| Top Five Stocks as of December 31, 2005 |
| | | % of fund’s | | % of fund’s net assets |
| | | net assets | | 6 months ago |
| General Electric Co. | | 1.6 | | 2.0 |
| Halliburton Co. | | 1.2 | | 2.3 |
| American International Group, Inc. | | 1.2 | | 1.2 |
| Pride International, Inc. | | 1.2 | | 1.0 |
| National Oilwell Varco, Inc. | | 1.1 | | 0.0 |
| | | 6.3 | | |
Top Five Bond Issuers as of December 31, 2005 |
| (with maturities greater than one year) | | % of fund’s | | % of fund’s net assets |
| | | net assets | | 6 months ago |
| Fannie Mae | | 10.2 | | 11.1 |
| U.S. Treasury Obligations | | 5.0 | | 5.6 |
| Freddie Mac | | 1.4 | | 1.4 |
| CS First Boston Mortgage Securities | | | | |
| Corp. | | 0.3 | | 0.4 |
| Goldman Sachs Group, Inc. | | 0.2 | | 0.3 |
| | | 17.1 | | |
Top Five Market Sectors as of December 31, 2005 |
| | | % of fund’s | | % of fund’s net assets |
| | | net assets | | 6 months ago |
| Financials | | 15.5 | | 13.8 |
| Information Technology | | 11.1 | | 9.2 |
| Energy | | 9.7 | | 8.2 |
| Industrials | | 8.6 | | 8.6 |
| Health Care | | 7.6 | | 7.9 |

A Short Term Investments and Net Other Assets are not included in the pie chart. Percentages are adjusted for the effect of futures contracts and swaps, if applicable.
The information in the above tables is based on the combined investments of the fund and its pro rata share of the investments of Fidelity’s fixed income central funds. For an unaudited list of holdings for each fixed income central fund, visit advisor.fidelity.com.
VIP Balanced Portfolio 6
| VIP Balanced Portfolio | | | | | | | | |
| Investments December 31, | | 2005 | | | | | | |
Showing Percentage of Net Assets | | | | | | | | |
Common Stocks 67.9% | | | | | | | | |
| | | | | Shares | | | | Value |
| | | | | | | | | (Note 1) |
| CONSUMER DISCRETIONARY 6.3% | | | | | | | | |
| Auto Components – 0.2% | | | | | | | | |
| American Axle & Manufacturing Holdings, Inc. | | | | 19,800 | | $ | | 362,934 |
| LKQ Corp. (a) | | | | 5,100 | | | | 176,562 |
| | | | | | | | | 539,496 |
| Diversified Consumer Services 0.1% | | | | | | | | |
| Carriage Services, Inc. Class A (a) | | | | 12,700 | | | | 63,500 |
| Service Corp. International (SCI) | | | | 16,400 | | | | 134,152 |
| | | | | | | | | 197,652 |
| Hotels, Restaurants & Leisure 1.3% | | | | | | | | |
| Applebee’s International, Inc. | | | | 7,000 | | | | 158,130 |
| Boyd Gaming Corp. | | | | 4,600 | | | | 219,236 |
| Brinker International, Inc. | | | | 6,600 | | | | 255,156 |
| Carnival Corp. unit | | | | 4,500 | | | | 240,615 |
| Gaylord Entertainment Co. (a) | | | | 5,600 | | | | 244,104 |
| Kerzner International Ltd. (a) | | | | 8,900 | | | | 611,875 |
| McDonald’s Corp. | | | | 26,400 | | | | 890,208 |
| Outback Steakhouse, Inc. | | | | 10,200 | | | | 424,422 |
| Royal Caribbean Cruises Ltd. | | | | 12,000 | | | | 540,720 |
| Ruby Tuesday, Inc. | | | | 900 | | | | 23,301 |
| Six Flags, Inc. (a) | | | | 10,600 | | | | 81,726 |
| Starwood Hotels & Resorts Worldwide, Inc. unit | | | | 4,400 | | | | 280,984 |
| Station Casinos, Inc. | | | | 2,900 | | | | 196,620 |
| WMS Industries, Inc. (a) | | | | 10,000 | | | | 250,900 |
| | | | | | | | | 4,417,997 |
| Household Durables 1.0% | | | | | | | | |
| Cyrela Brazil Realty SA | | | | 8,000 | | | | 108,455 |
| D.R. Horton, Inc. | | | | 15,000 | | | | 535,950 |
| Directed Electronics, Inc. | | | | 1,900 | | | | 27,265 |
| Interface, Inc. Class A (a) | | | | 30,212 | | | | 248,343 |
| KB Home | | | | 19,700 | | | | 1,431,402 |
| Pulte Homes, Inc. | | | | 1,000 | | | | 39,360 |
| Ryland Group, Inc. | | | | 6,800 | | | | 490,484 |
| Sharp Corp. | | | | 8,000 | | | | 121,725 |
| Standard Pacific Corp. | | | | 8,800 | | | | 323,840 |
| Techtronic Industries Co. Ltd. | | | | 142,000 | | | | 337,892 |
| | | | | | | | | 3,664,716 |
| Internet & Catalog Retail 0.1% | | | | | | | | |
| eBay, Inc. (a) | | | | 11,200 | | | | 484,400 |
| Leisure Equipment & Products 0.1% | | | | | | | | |
| Brunswick Corp. | | | | 7,300 | | | | 296,818 |
| Media 2.2% | | | | | | | | |
| CCE Spinco, Inc. (a) | | | | 7,800 | | | | 102,180 |
| Citadel Broadcasting Corp. | | | | 24,700 | | | | 331,968 |
| Clear Channel Communications, Inc. | | | | 10,800 | | | | 339,660 |
| E.W. Scripps Co. Class A | | | | 6,600 | | | | 316,932 |
| EchoStar Communications Corp. Class A | | | | 20,036 | | | | 544,378 |
| Gannett Co., Inc. | | | | 700 | | | | 42,399 |
| Lagardere S.C.A. (Reg.) | | | | 3,300 | | | | 253,936 |
| Lamar Advertising Co. Class A (a) | | | | 19,200 | | | | 885,888 |
| |
| |
See accompanying notes which are an integral part of the financial statements.
| | | | | | |
| | | | | 7 | | Annual Report |
7
| VIP Balanced Portfolio | | | | |
| Investments - continued | | | | |
| |
| |
| |
| | | Shares | | Value |
| | | | | (Note 1) |
| Liberty Global, Inc.: | | | | |
| Class A | | 13,000 | | $ 292,500 |
| Class C (a) | | 11,100 | | 235,320 |
| Liberty Media Corp. Class A (a) | | 47,300 | | 372,251 |
| McGraw Hill Companies, Inc. | | 5,200 | | 268,476 |
| News Corp. Class A | | 44,700 | | 695,085 |
| NTL, Inc. (a) | | 13,600 | | 925,888 |
| Omnicom Group, Inc. | | 3,800 | | 323,494 |
| Radio One, Inc. Class D (non vtg.) (a) | | 11,000 | | 113,850 |
| Salem Communications Corp. Class A (a) | | 6,300 | | 110,187 |
| SES Global unit | | 4,228 | | 72,577 |
| The DIRECTV Group, Inc. (a) | | 16,300 | | 230,156 |
| TVN SA | | 24,756 | | 594,418 |
| Walt Disney Co. | | 27,000 | | 647,190 |
| | | | | 7,698,733 |
| Multiline Retail – 0.4% | | | | |
| Dollar Tree Stores, Inc. (a) | | 4,600 | | 110,124 |
| Family Dollar Stores, Inc. | | 3,600 | | 89,244 |
| Federated Department Stores, Inc. | | 5,300 | | 351,549 |
| Fred’s, Inc. Class A | | 20,600 | | 335,162 |
| JCPenney Co., Inc. | | 7,000 | | 389,200 |
| Target Corp. | | 4,100 | | 225,377 |
| | | | | 1,500,656 |
| Specialty Retail 0.9% | | | | |
| Aeropostale, Inc. (a) | | 12,100 | | 318,230 |
| Best Buy Co., Inc. | | 5,750 | | 250,010 |
| Big 5 Sporting Goods Corp. | | 9,500 | | 207,955 |
| Circuit City Stores, Inc. | | 3,800 | | 85,842 |
| Edgars Consolidated Stores Ltd. | | 10,300 | | 57,234 |
| Foot Locker, Inc. | | 13,400 | | 316,106 |
| Home Depot, Inc. | | 16,200 | | 655,776 |
| Linens ’N Things, Inc. (a) | | 5,600 | | 148,960 |
| OfficeMax, Inc. | | 4,700 | | 119,192 |
| Pacific Sunwear of California, Inc. (a) | | 15,300 | | 381,276 |
| Ross Stores, Inc. | | 6,700 | | 193,630 |
| Staples, Inc. | | 13,700 | | 311,127 |
| TJX Companies, Inc. | | 10,500 | | 243,915 |
| | | | | 3,289,253 |
| |
| TOTAL CONSUMER DISCRETIONARY | | | | 22,089,721 |
| |
| CONSUMER STAPLES 3.5% | | | | |
| Beverages 0.2% | | | | |
| The Coca Cola Co. | | 14,400 | | 580,464 |
| Food & Staples Retailing – 0.8% | | | | |
| CVS Corp. | | 23,700 | | 626,154 |
| Safeway, Inc. | | 20,100 | | 475,566 |
| Wal Mart de Mexico SA de CV Series V | | 12,800 | | 71,040 |
| Wal Mart Stores, Inc. | | 32,800 | | 1,535,040 |
| | | | | 2,707,800 |
| Food Products – 0.7% | | | | |
| Archer Daniels Midland Co. | | 4,300 | | 106,038 |
See accompanying notes which are an integral part of the financial statements.
| | |
| VIP Balanced Portfolio | | 8 |
| Common Stocks continued | | | | | | |
| | | Shares | | | | Value |
| | | | | | | (Note 1) |
| CONSUMER STAPLES – continued | | | | | | |
| Food Products – continued | | | | | | |
| Bunge Ltd. | | 4,800 | | $ | | 271,728 |
| Corn Products International, Inc. | | 20,500 | | | | 489,745 |
| General Mills, Inc. | | 6,600 | | | | 325,512 |
| Global Bio Chem Technology | | | | | | |
| Group Co. Ltd. | | 280,000 | | | | 122,781 |
| Groupe Danone | | 2,000 | | | | 208,950 |
| Kellogg Co. | | 5,500 | | | | 237,710 |
| Nestle SA (Reg.) | | 854 | | | | 255,420 |
| The J.M. Smucker Co. | | 7,000 | | | | 308,000 |
| TreeHouse Foods, Inc. (a) | | 5,040 | | | | 94,349 |
| Tyson Foods, Inc. Class A | | 10,500 | | | | 179,550 |
| | | | | | | 2,599,783 |
| Household Products – 0.5% | | | | | | |
| Colgate Palmolive Co. | | 14,900 | | | | 817,265 |
| Procter & Gamble Co. | | 15,340 | | | | 887,879 |
| | | | | | | 1,705,144 |
| Personal Products 0.2% | | | | | | |
| Alberto Culver Co. | | 4,400 | | | | 201,300 |
| Avon Products, Inc. | | 12,700 | | | | 362,585 |
| Playtex Products, Inc. (a) | | 1,400 | | | | 19,138 |
| | | | | | | 583,023 |
| Tobacco – 1.1% | | | | | | |
| Altria Group, Inc. | | 51,850 | | | | 3,874,232 |
| |
| TOTAL CONSUMER STAPLES | | | | | | 12,050,446 |
| |
| ENERGY 8.7% | | | | | | |
| Energy Equipment & Services – 5.7% | | | | | | |
| Basic Energy Services, Inc. | | 2,500 | | | | 49,875 |
| BJ Services Co. | | 47,400 | | | | 1,738,158 |
| Grant Prideco, Inc. (a) | | 68,000 | | | | 3,000,160 |
| Grey Wolf, Inc. (a) | | 52,800 | | | | 408,144 |
| Halliburton Co. | | 69,000 | | | | 4,275,240 |
| Nabors Industries Ltd. (a) | | 6,000 | | | | 454,500 |
| National Oilwell Varco, Inc. (a) | | 63,100 | | | | 3,956,370 |
| Pride International, Inc. (a) | | 132,800 | | | | 4,083,600 |
| Smith International, Inc. | | 1,200 | | | | 44,532 |
| Union Drilling, Inc. | | 12,400 | | | | 180,172 |
| Weatherford International Ltd. (a) | | 44,400 | | | | 1,607,280 |
| | | | | | | 19,798,031 |
| Oil, Gas & Consumable Fuels 3.0% | | | | | | |
| Arch Coal, Inc. | | 1,900 | | | | 151,050 |
| Cabot Oil & Gas Corp. | | 6,500 | | | | 293,150 |
| Canadian Natural Resources Ltd. | | 5,300 | | | | 262,732 |
| Chesapeake Energy Corp. | | 23,600 | | | | 748,828 |
| CNX Gas Corp. (a)(f) | | 2,600 | | | | 54,600 |
| CONSOL Energy, Inc. | | 2,100 | | | | 136,878 |
| Double Hull Tankers, Inc. | | 9,600 | | | | 126,432 |
| El Paso Corp. | | 16,100 | | | | 195,776 |
| |
See accompanying notes which are an integral part of the financial statements.
| | | | | | |
| | | 9 | | Annual Report |
9
| VIP Balanced Portfolio | | | | |
| Investments - continued | | | | |
| |
| |
| |
| | | Shares | | Value |
| | | | | (Note 1) |
| EnCana Corp. | | 13,300 | | $ 601,306 |
| Energy Partners Ltd. (a) | | 3,300 | | 71,907 |
| Goodrich Petroleum Corp. (a) | | 3,800 | | 95,570 |
| Holly Corp. | | 10,200 | | 600,474 |
| Houston Exploration Co. (a) | | 4,700 | | 248,160 |
| International Coal Group, Inc. (a) | | 18,400 | | 174,800 |
| KCS Energy, Inc. (a) | | 1,900 | | 46,018 |
| Maritrans, Inc. | | 3,800 | | 98,876�� |
| Massey Energy Co. | | 2,300 | | 87,101 |
| McMoRan Exploration Co. (a)(e) | | 9,700 | | 191,769 |
| OMI Corp. | | 9,600 | | 174,240 |
| Overseas Shipholding Group, Inc. | | 1,400 | | 70,546 |
| Penn Virginia Corp. | | 6,700 | | 384,580 |
| Petroleum Development Corp. (a) | | 4,400 | | 146,696 |
| Plains Exploration & Production Co. (a) | | 6,800 | | 270,164 |
| Quicksilver Resources, Inc. (a) | | 13,900 | | 583,939 |
| Range Resources Corp. | | 22,950 | | 604,503 |
| Southwestern Energy Co. (a) | | 10,400 | | 373,776 |
| Ultra Petroleum Corp. (a) | | 5,100 | | 284,580 |
| Valero Energy Corp. | | 67,000 | | 3,457,200 |
| | | | | 10,535,651 |
| |
| TOTAL ENERGY | | | | 30,333,682 |
| |
| FINANCIALS 12.9% | | | | |
| Capital Markets 1.9% | | | | |
| Affiliated Managers Group, Inc. (a) | | 1,000 | | 80,250 |
| Ameriprise Financial, Inc. | | 2,780 | | 113,980 |
| Ameritrade Holding Corp. | | 12,600 | | 302,400 |
| E*TRADE Financial Corp. (a) | | 43,300 | | 903,238 |
| Goldman Sachs Group, Inc. | | 7,300 | | 932,283 |
| Investors Financial Services Corp. | | 1,500 | | 55,245 |
| Janus Capital Group, Inc. | | 11,400 | | 212,382 |
| Lazard Ltd.: | | | | |
| unit | | 4,400 | | 129,844 |
| Class A | | 8,500 | | 271,150 |
| Lehman Brothers Holdings, Inc. | | 7,400 | | 948,458 |
| Merrill Lynch & Co., Inc. | | 21,100 | | 1,429,103 |
| Morgan Stanley | | 6,000 | | 340,440 |
| Nuveen Investments, Inc. Class A | | 5,600 | | 238,672 |
| Piper Jaffray Companies (a) | | 8,900 | | 359,560 |
| State Street Corp. | | 6,400 | | 354,816 |
| | | | | 6,671,821 |
| Commercial Banks – 2.6% | | | | |
| Banco Nossa Caixa SA | | 5,100 | | 76,447 |
| Bank of America Corp. | | 85,400 | | 3,941,210 |
| China Construction Bank Corp. | | | | |
| (H Shares) | | 990,000 | | 344,741 |
| ICICI Bank Ltd. sponsored ADR | | 5,300 | | 152,640 |
| Mitsubishi UFJ Financial Group, Inc. | | 18 | | 246,420 |
| SVB Financial Group (a) | | 7,200 | | 337,248 |
| UCBH Holdings, Inc. | | 31,900 | | 570,372 |
| Unicredito Italiano Spa | | 37,700 | | 259,619 |
See accompanying notes which are an integral part of the financial statements.
| | |
| VIP Balanced Portfolio | | 10 |
| Common Stocks continued | | | | | | | | |
| | | | | Shares | | | | Value |
| | | | | | | | | (Note 1) |
| FINANCIALS – continued | | | | | | | | |
| Commercial Banks – continued | | | | | | | | |
| UnionBanCal Corp. | | | | 3,800 | | $ | | 261,136 |
| Wachovia Corp. | | | | 36,900 | | | | 1,950,534 |
| Wells Fargo & Co. | | | | 5,600 | | | | 351,848 |
| Wilshire Bancorp, Inc. | | | | 16,700 | | | | 287,073 |
| Wintrust Financial Corp. | | | | 5,000 | | | | 274,500 |
| | | | | | | | | 9,053,788 |
| Consumer Finance – 0.5% | | | | | | | | |
| American Express Co. | | | | 9,400 | | | | 483,724 |
| Capital One Financial Corp. (e) | | | | 5,000 | | | | 432,000 |
| MBNA Corp. | | | | 6,600 | | | | 179,190 |
| SLM Corp. | | | | 11,200 | | | | 617,008 |
| | | | | | | | | 1,711,922 |
| Diversified Financial Services – 1.8% | | | | | | | | |
| Citigroup, Inc. | | | | 81,000 | | | | 3,930,930 |
| JPMorgan Chase & Co. | | | | 58,200 | | | | 2,309,958 |
| | | | | | | | | 6,240,888 |
| Insurance – 3.6% | | | | | | | | |
| ACE Ltd. | | | | 23,100 | | | | 1,234,464 |
| AFLAC, Inc. | | | | 8,600 | | | | 399,212 |
| AMBAC Financial Group, Inc. | | | | 5,600 | | | | 431,536 |
| American International Group, Inc. | | | | 61,350 | | | | 4,185,911 |
| Aspen Insurance Holdings Ltd. | | | | 15,100 | | | | 357,417 |
| Axis Capital Holdings Ltd. | | | | 3,300 | | | | 103,224 |
| Endurance Specialty Holdings Ltd. | | | | 5,600 | | | | 200,760 |
| Hartford Financial Services Group, Inc. | | | | 10,200 | | | | 876,078 |
| Hilb Rogal & Hobbs Co. | | | | 4,400 | | | | 169,444 |
| IPC Holdings Ltd. | | | | 4,500 | | | | 123,210 |
| MBIA, Inc. | | | | 9,100 | | | | 547,456 |
| Montpelier Re Holdings Ltd. | | | | 11,700 | | | | 221,130 |
| Navigators Group, Inc. (a) | | | | 1,100 | | | | 47,971 |
| PartnerRe Ltd. | | | | 7,800 | | | | 512,226 |
| Platinum Underwriters Holdings Ltd. | | | | 8,200 | | | | 254,774 |
| PXRE Group Ltd. | | | | 22,400 | | | | 290,304 |
| Scottish Re Group Ltd. | | | | 38,600 | | | | 947,630 |
| Specialty Underwriters’ Alliance, Inc. (a) | | | | 13,100 | | | | 80,696 |
| T&D Holdings, Inc. | | | | 1,700 | | | | 112,752 |
| The St. Paul Travelers Companies, Inc. | | | | 13,549 | | | | 605,234 |
| Universal American Financial Corp. (a) | | | | 7,100 | | | | 107,068 |
| USI Holdings Corp. (a) | | | | 17,900 | | | | 246,483 |
| XL Capital Ltd. Class A | | | | 7,600 | | | | 512,088 |
| | | | | | | | | 12,567,068 |
| Real Estate 0.8% | | | | | | | | |
| Apartment Investment & Management Co. Class A | | | | 5,400 | | | | 204,498 |
| CBL & Associates Properties, Inc. | | | | 2,900 | | | | 114,579 |
| Developers Diversified Realty Corp. | | | | 200 | | | | 9,404 |
| Digital Realty Trust, Inc. | | | | 3,800 | | | | 85,994 |
| Duke Realty Corp. | | | | 2,300 | | | | 76,820 |
| Education Realty Trust, Inc. (m) | | | | 4,406 | | | | 51,114 |
| Equity Lifestyle Properties, Inc. | | | | 900 | | | | 40,050 |
| |
See accompanying notes which are an integral part of the financial statements.
| | | | | | | | |
| | | 11 | | | | Annual Report |
11
| VIP Balanced Portfolio | | | | |
| Investments - continued | | | | |
| |
| |
| |
| | | Shares | | Value |
| | | | | (Note 1) |
| Equity Office Properties Trust | | 5,700 | | $ 172,881 |
| Equity Residential (SBI) | | 3,400 | | 133,008 |
| General Growth Properties, Inc. | | 7,200 | | 338,328 |
| Highwoods Properties, Inc. (SBI) | | 2,300 | | 65,435 |
| Mitsui Fudosan Co. Ltd. | | 13,000 | | 264,069 |
| Pennsylvania (REIT) (SBI) | | 2,800 | | 104,608 |
| Reckson Associates Realty Corp. | | 4,600 | | 165,508 |
| Trizec Properties, Inc. | | 10,000 | | 229,200 |
| United Dominion Realty Trust, Inc. (SBI) | | 25,700 | | 602,408 |
| Vornado Realty Trust | | 2,900 | | 242,063 |
| | | | | 2,899,967 |
| Thrifts & Mortgage Finance – 1.7% | | | | |
| Countrywide Financial Corp. | | 11,100 | | 379,509 |
| Doral Financial Corp. | | 24,800 | | 262,880 |
| Fannie Mae | | 21,300 | | 1,039,653 |
| Fidelity Bankshares, Inc. | | 2,200 | | 71,940 |
| First Niagara Financial Group, Inc. | | 3,900 | | 56,433 |
| Freddie Mac | | 26,600 | | 1,738,310 |
| Golden West Financial Corp., Delaware | | 2,500 | | 165,000 |
| Hudson City Bancorp, Inc. | | 20,900 | | 253,308 |
| KNBT Bancorp, Inc. | | 4,000 | | 65,160 |
| MGIC Investment Corp. | | 2,000 | | 131,640 |
| NetBank, Inc. | | 30,300 | | 217,554 |
| New York Community Bancorp, Inc. | | 1,100 | | 18,172 |
| NewAlliance Bancshares, Inc. | | 15,500 | | 225,370 |
| R&G Financial Corp. Class B | | 29,900 | | 394,680 |
| Sovereign Bancorp, Inc. | | 27,800 | | 601,036 |
| W Holding Co., Inc. | | 34,700 | | 285,581 |
| | | | | 5,906,226 |
| |
| TOTAL FINANCIALS | | | | 45,051,680 |
| |
| HEALTH CARE 7.5% | | | | |
| Biotechnology – 0.8% | | | | |
| Biogen Idec, Inc. (a) | | 7,000 | | 317,310 |
| Cephalon, Inc. (a) | | 11,400 | | 738,036 |
| Charles River Laboratories International, Inc. (a) | | 9,600 | | 406,752 |
| Genentech, Inc. (a) | | 3,500 | | 323,750 |
| InterMune, Inc. (a)(e) | | 5,300 | | 89,040 |
| Invitrogen Corp. (a) | | 4,200 | | 279,888 |
| MedImmune, Inc. (a) | | 4,000 | | 140,080 |
| OSI Pharmaceuticals, Inc. (a) | | 12,500 | | 350,500 |
| Serologicals Corp. (a) | | 12,000 | | 236,880 |
| | | | | 2,882,236 |
| Health Care Equipment & Supplies 2.1% | | | | |
| Bausch & Lomb, Inc. | | 3,600 | | 244,440 |
| Baxter International, Inc. | | 28,600 | | 1,076,790 |
| Becton, Dickinson & Co. | | 7,100 | | 426,568 |
| C.R. Bard, Inc. | | 8,800 | | 580,096 |
| CONMED Corp. (a) | | 6,400 | | 151,424 |
| Cooper Companies, Inc. | | 11,400 | | 584,820 |
| Cytyc Corp. (a) | | 5,100 | | 143,973 |
See accompanying notes which are an integral part of the financial statements.
| | |
| VIP Balanced Portfolio | | 12 |
| Common Stocks continued | | | | |
| | | Shares | | Value |
| | | | | (Note 1) |
| HEALTH CARE continued | | | | |
| Health Care Equipment & Supplies – continued | | | | |
| Dade Behring Holdings, Inc. | | 23,814 | | $ 973,754 |
| Fisher & Paykel Healthcare Corp. | | 19,793 | | 51,363 |
| Fisher Scientific International, Inc. (a) | | 5,100 | | 315,486 |
| Guidant Corp. | | 3,000 | | 194,250 |
| INAMED Corp. (a) | | 1,100 | | 96,448 |
| Inverness Medical Innovations, Inc. (a) | | 4,700 | | 111,437 |
| Inverness Medical Innovations, Inc. (a)(m) | | 900 | | 21,339 |
| Kinetic Concepts, Inc. (a) | | 4,600 | | 182,896 |
| Medtronic, Inc. | | 4,200 | | 241,794 |
| St. Jude Medical, Inc. (a) | | 2,000 | | 100,400 |
| Synthes, Inc. | | 2,810 | | 315,644 |
| Thermo Electron Corp. (a) | | 15,000 | | 451,950 |
| Varian, Inc. (a) | | 8,400 | | 334,236 |
| Waters Corp. (a) | | 17,500 | | 661,500 |
| | | | | 7,260,608 |
| Health Care Providers & Services 2.7% | | | | |
| Aetna, Inc. | | 4,600 | | 433,826 |
| American Retirement Corp. (a) | | 4,900 | | 123,137 |
| Cardinal Health, Inc. | | 17,700 | | 1,216,875 |
| Caremark Rx, Inc. (a) | | 6,200 | | 321,098 |
| Emdeon Corp. (a) | | 37,600 | | 318,096 |
| Health Net, Inc. (a) | | 15,000 | | 773,250 |
| Humana, Inc. (a) | | 8,900 | | 483,537 |
| IMS Health, Inc. | | 2,400 | | 59,808 |
| Medco Health Solutions, Inc. (a) | | 7,400 | | 412,920 |
| Omnicare, Inc. | | 4,100 | | 234,602 |
| Psychiatric Solutions, Inc. (a) | | 2,300 | | 135,102 |
| Quest Diagnostics, Inc. | | 2,600 | | 133,848 |
| Sierra Health Services, Inc. (a) | | 2,200 | | 175,912 |
| Sunrise Senior Living, Inc. (a) | | 12,700 | | 428,117 |
| UnitedHealth Group, Inc. | | 54,600 | | 3,392,844 |
| WebMD Health Corp. Class A | | 600 | | 17,430 |
| WellPoint, Inc. (a) | | 9,300 | | 742,047 |
| | | | | 9,402,449 |
| Pharmaceuticals 1.9% | | | | |
| Atherogenics, Inc. (a) | | 16,100 | | 322,161 |
| Barr Pharmaceuticals, Inc. (a) | | 8,100 | | 504,549 |
| Cipla Ltd. | | 11,414 | | 113,645 |
| Johnson & Johnson | | 29,800 | | 1,790,980 |
| Novartis AG sponsored ADR | | 17,600 | | 923,648 |
| Pfizer, Inc. | | 25,000 | | 583,000 |
| Schering Plough Corp. | | 13,200 | | 275,220 |
| Teva Pharmaceutical Industries Ltd. sponsored ADR | | 20,900 | | 898,909 |
| Wyeth | | 25,900 | | 1,193,213 |
| | | | | 6,605,325 |
| |
| TOTAL HEALTH CARE | | | | 26,150,618 |
See accompanying notes which are an integral part of the financial statements.
|
13 Annual Report
13
| VIP Balanced Portfolio | | | | |
| Investments - continued | | | | |
| |
| |
| |
| | | Shares | | Value |
| | | | | (Note 1) |
| INDUSTRIALS – 8.2% | | | | |
| Aerospace & Defense – 1.2% | | | | |
| EADS NV | | 11,600 | | $ 438,072 |
| Goodrich Corp. | | 1,000 | | 41,100 |
| Hexcel Corp. (a) | | 14,700 | | 265,335 |
| Honeywell International, Inc. | | 23,800 | | 886,550 |
| Lockheed Martin Corp. | | 5,100 | | 324,513 |
| Meggitt PLC | | 32,778 | | 204,273 |
| Precision Castparts Corp. | | 11,850 | | 613,949 |
| Raytheon Co. | | 7,800 | | 313,170 |
| Rockwell Collins, Inc. | | 6,400 | | 297,408 |
| United Technologies Corp. | | 13,700 | | 765,967 |
| | | | | 4,150,337 |
| Air Freight & Logistics – 0.3% | | | | |
| EGL, Inc. (a) | | 11,200 | | 420,784 |
| FedEx Corp. | | 2,500 | | 258,475 |
| Forward Air Corp. | | 500 | | 18,325 |
| UTI Worldwide, Inc. | | 3,000 | | 278,520 |
| | | | | 976,104 |
| Airlines – 0.6% | | | | |
| ACE Aviation Holdings, Inc. Class A (a) | | 10,600 | | 346,480 |
| AirTran Holdings, Inc. (a) | | 72,500 | | 1,162,175 |
| Frontier Airlines, Inc. (a)(e) | | 73,500 | | 679,140 |
| | | | | 2,187,795 |
| Building Products – 0.2% | | | | |
| American Standard Companies, Inc. | | 3,900 | | 155,805 |
| Masco Corp. | | 15,100 | | 455,869 |
| | | | | 611,674 |
| Commercial Services & Supplies 0.4% | | | | |
| Banta Corp. | | 1,300 | | 64,740 |
| Cendant Corp. | | 30,200 | | 520,950 |
| Cintas Corp. | | 2,600 | | 107,068 |
| Corrections Corp. of America (a) | | 2,800 | | 125,916 |
| HNI Corp. | | 1,100 | | 60,423 |
| Kforce, Inc. (a) | | 10,100 | | 112,716 |
| PICO Holdings, Inc. (a) | | 1,000 | | 32,260 |
| The Brink’s Co. | | 6,200 | | 297,042 |
| | | | | 1,321,115 |
| Construction & Engineering – 1.4% | | | | |
| Chicago Bridge & Iron Co. NV | | | | |
| (NY Shares) | | 11,200 | | 282,352 |
| Fluor Corp. | | 25,200 | | 1,946,952 |
| Foster Wheeler Ltd. (a) | | 10,100 | | 371,478 |
| Granite Construction, Inc. | | 5,900 | | 211,869 |
| Infrasource Services, Inc. (a) | | 8,100 | | 105,948 |
| McDermott International, Inc. (a) | | 4,700 | | 209,667 |
| Perini Corp. (a) | | 19,400 | | 468,510 |
| Punj Lloyd Ltd. | | 574 | | 8,930 |
| Shaw Group, Inc. (a) | | 24,100 | | 701,069 |
See accompanying notes which are an integral part of the financial statements.
| | |
| VIP Balanced Portfolio | | 14 |
| Common Stocks continued | | | | | | | | |
| | | | | Shares | | | | Value |
| | | | | | | | | (Note 1) |
| INDUSTRIALS – continued | | | | | | | | |
| Construction & Engineering – continued | | | | | | | | |
| URS Corp. (a) | | | | 14,600 | | $ | | 549,106 |
| Washington Group International, Inc. | | | | 1,700 | | | | 90,049 |
| | | | | | | | | 4,945,930 |
| Electrical Equipment 0.1% | | | | | | | | |
| Cooper Industries Ltd. Class A | | | | 1,900 | | | | 138,700 |
| Rockwell Automation, Inc. | | | | 600 | | | | 35,496 |
| | | | | | | | | 174,196 |
| Industrial Conglomerates 2.3% | | | | | | | | |
| 3M Co. | | | | 7,300 | | | | 565,750 |
| Carlisle Companies, Inc. | | | | 900 | | | | 62,235 |
| General Electric Co. | | | | 162,200 | | | | 5,685,110 |
| Smiths Group PLC | | | | 21,169 | | | | 381,199 |
| Tyco International Ltd. | | | | 51,000 | | | | 1,471,860 |
| | | | | | | | | 8,166,154 |
| Machinery – 0.6% | | | | | | | | |
| Atlas Copco AB (B Shares) | | | | 14,400 | | | | 287,293 |
| Briggs & Stratton Corp. | | | | 8,400 | | | | 325,836 |
| Danaher Corp. | | | | 5,100 | | | | 284,478 |
| Deere & Co. | | | | 5,700 | | | | 388,227 |
| SPX Corp. | | | | 9,300 | | | | 425,661 |
| Timken Co. | | | | 9,800 | | | | 313,796 |
| Watts Water Technologies, Inc. Class A | | | | 2,700 | | | | 81,783 |
| | | | | | | | | 2,107,074 |
| Marine – 0.1% | | | | | | | | |
| Alexander & Baldwin, Inc. | | | | 8,500 | | | | 461,040 |
| Road & Rail 0.6% | | | | | | | | |
| Burlington Northern Santa Fe Corp. | | | | 9,600 | | | | 679,872 |
| Laidlaw International, Inc. | | | | 29,200 | | | | 678,316 |
| Norfolk Southern Corp. | | | | 18,200 | | | | 815,906 |
| | | | | | | | | 2,174,094 |
| Trading Companies & Distributors – 0.4% | | | | | | | | |
| UAP Holding Corp. | | | | 12,400 | | | | 253,208 |
| United Rentals, Inc. (a) | | | | 2,700 | | | | 63,153 |
| WESCO International, Inc. (a) | | | | 27,800 | | | | 1,187,894 |
| | | | | | | | | 1,504,255 |
| |
| TOTAL INDUSTRIALS | | | | | | | | 28,779,768 |
| |
| INFORMATION TECHNOLOGY 10.8% | | | | | | | | |
| Communications Equipment – 0.8% | | | | | | | | |
| Andrew Corp. (a) | | | | 14,000 | | | | 150,220 |
| Avaya, Inc. (a) | | | | 15,900 | | | | 169,653 |
| Avocent Corp. (a) | | | | 7,000 | | | | 190,330 |
| Dycom Industries, Inc. (a) | | | | 32,500 | | | | 715,000 |
| Harris Corp. | | | | 8,200 | | | | 352,682 |
| Juniper Networks, Inc. (a) | | | | 7,200 | | | | 160,560 |
| MasTec, Inc. (a) | | | | 19,800 | | | | 207,306 |
| |
| |
| |
See accompanying notes which are an integral part of the financial statements.
| | | | | | | | |
| | | 15 | | | | Annual Report |
15
| VIP Balanced Portfolio | | | | |
| Investments - continued | | | | |
| |
| |
| |
| | | Shares | | Value |
| | | | | (Note 1) |
| Motorola, Inc. | | 27,500 | | $ 621,225 |
| QUALCOMM, Inc. | | 8,400 | | 361,872 |
| | | | | 2,928,848 |
| Computers & Peripherals 1.3% | | | | |
| Dell, Inc. (a) | | 7,400 | | 221,926 |
| EMC Corp. (a) | | 23,000 | | 313,260 |
| Hewlett Packard Co. | | 13,900 | | 397,957 |
| Maxtor Corp. (a) | | 143,900 | | 998,666 |
| McDATA Corp. Class A (a) | | 28,100 | | 106,780 |
| NCR Corp. (a) | | 8,900 | | 302,066 |
| Seagate Technology | | 53,000 | | 1,059,470 |
| Sun Microsystems, Inc. (a) | | 72,200 | | 302,518 |
| UNOVA, Inc. (a) | | 1,900 | | 64,220 |
| Western Digital Corp. (a) | | 33,200 | | 617,852 |
| | | | | 4,384,715 |
| Electronic Equipment & Instruments – 2.2% | | | | |
| Agilent Technologies, Inc. (a) | | 26,300 | | 875,527 |
| Avnet, Inc. (a) | | 14,600 | | 349,524 |
| Bell Microproducts, Inc. (a) | | 19,500 | | 149,175 |
| Benchmark Electronics, Inc. (a) | | 8,600 | | 289,218 |
| Celestica, Inc. (sub. vtg.) (a) | | 52,600 | | 558,328 |
| Flextronics International Ltd. (a) | | 133,700 | | 1,395,828 |
| Hon Hai Precision Industry Co. Ltd. (Foxconn) unit | | 46,037 | | 529,428 |
| Ibiden Co. Ltd. | | 1,900 | | 101,845 |
| Ingram Micro, Inc. Class A (a) | | 28,800 | | 573,984 |
| KEMET Corp. (a) | | 10,300 | | 72,821 |
| Littelfuse, Inc. (a) | | 4,300 | | 117,175 |
| Mettler Toledo International, Inc. (a) | | 5,300 | | 292,560 |
| Molex, Inc. | | 8,600 | | 223,170 |
| Sanmina SCI Corp. (a) | | 2,800 | | 11,928 |
| Solectron Corp. (a) | | 248,900 | | 910,974 |
| Symbol Technologies, Inc. | | 64,600 | | 828,172 |
| Tektronix, Inc. | | 10,300 | | 290,563 |
| Vishay Intertechnology, Inc. (a) | | 18,700 | | 257,312 |
| | | | | 7,827,532 |
| Internet Software & Services 0.6% | | | | |
| Google, Inc. Class A (sub. vtg.) (a) | | 2,950 | | 1,223,837 |
| Openwave Systems, Inc. (a) | | 6,600 | | 115,302 |
| Yahoo!, Inc. (a) | | 15,900 | | 622,962 |
| | | | | 1,962,101 |
| IT Services 0.4% | | | | |
| Alliance Data Systems Corp. (a) | | 6,600 | | 234,960 |
| Ceridian Corp. (a) | | 22,500 | | 559,125 |
| First Data Corp. | | 12,700 | | 546,227 |
| Wright Express Corp. | | 5,900 | | 129,800 |
| | | | | 1,470,112 |
| Office Electronics – 0.2% | | | | |
| Xerox Corp. (a) | | 49,400 | | 723,710 |
| Semiconductors & Semiconductor Equipment – 4.0% | | | | |
| Advanced Energy Industries, Inc. (a) | | 9,900 | | 117,117 |
| Agere Systems, Inc. (a) | | 81,000 | | 1,044,900 |
See accompanying notes which are an integral part of the financial statements.
| | |
| VIP Balanced Portfolio | | 16 |
| Common Stocks continued | | | | |
| | | Shares | | Value |
| | | | | (Note 1) |
| INFORMATION TECHNOLOGY – continued | | | | |
| Semiconductors & Semiconductor Equipment – continued | | | | |
| AMIS Holdings, Inc. (a) | | 4,200 | | $ 44,730 |
| Amkor Technology, Inc. (a) | | 48,600 | | 272,160 |
| Analog Devices, Inc. | | 3,600 | | 129,132 |
| Applied Micro Circuits Corp. (a) | | 7,500 | | 19,275 |
| Asat Holdings Ltd. sponsored ADR (a) | | 33,200 | | 25,564 |
| ASM International NV (Nasdaq) (a) | | 9,800 | | 164,836 |
| ASML Holding NV (NY Shares) (a) | | 30,500 | | 612,440 |
| ATI Technologies, Inc. (a) | | 14,500 | | 246,957 |
| ATMI, Inc. (a) | | 39,300 | | 1,099,221 |
| Axcelis Technologies, Inc. (a) | | 73,800 | | 352,026 |
| Cascade Microtech, Inc. | | 6,500 | | 81,900 |
| Credence Systems Corp. (a) | | 34,300 | | 238,728 |
| Cymer, Inc. (a) | | 12,700 | | 450,977 |
| Cypress Semiconductor Corp. (a) | | 9,900 | | 141,075 |
| DSP Group, Inc. (a) | | 9,400 | | 235,564 |
| Fairchild Semiconductor International, Inc. (a) | | 47,100 | | 796,461 |
| FormFactor, Inc. (a) | | 11,800 | | 288,274 |
| Freescale Semiconductor, Inc.: | | | | |
| Class A (a) | | 42,200 | | 1,063,018 |
| Class B (a) | | 90,000 | | 2,265,300 |
| Integrated Device Technology, Inc. (a) | | 7,300 | | 96,214 |
| Intel Corp. | | 4,300 | | 107,328 |
| Intersil Corp. Class A | | 13,200 | | 328,416 |
| Linear Technology Corp. | | 3,600 | | 129,852 |
| LTX Corp. (a) | | 72,400 | | 325,800 |
| Maxim Integrated Products, Inc. | | 1,400 | | 50,736 |
| Microchip Technology, Inc. | | 5,900 | | 189,685 |
| National Semiconductor Corp. | | 46,000 | | 1,195,080 |
| ON Semiconductor Corp. (a) | | 24,900 | | 137,697 |
| Samsung Electronics Co. Ltd. | | 1,260 | | 824,159 |
| Silicon Laboratories, Inc. (a) | | 11,300 | | 414,258 |
| Teradyne, Inc. (a) | | 20,700 | | 301,599 |
| | | | | 13,790,479 |
| Software 1.3% | | | | |
| Activision, Inc. (a) | | 12,433 | | 170,829 |
| BEA Systems, Inc. (a) | | 60,100 | | 564,940 |
| Citrix Systems, Inc. (a) | | 5,800 | | 166,924 |
| Cognos, Inc. (a) | | 12,300 | | 429,027 |
| FileNET Corp. (a) | | 6,000 | | 155,100 |
| Hyperion Solutions Corp. (a) | | 8,100 | | 290,142 |
| JDA Software Group, Inc. (a) | | 7,200 | | 122,472 |
| Macrovision Corp. (a) | | 16,506 | | 276,145 |
| McAfee, Inc. (a) | | 1,900 | | 51,547 |
| Microsoft Corp. | | 70,800 | | 1,851,420 |
| Nintendo Co. Ltd. | | 700 | | 84,602 |
| Oracle Corp. (a) | | 7,500 | | 91,575 |
| Symantec Corp. (a) | | 12,905 | | 225,838 |
See accompanying notes which are an integral part of the financial statements.
|
17 Annual Report
17
| VIP Balanced Portfolio | | | | |
| Investments - continued | | | | |
| |
| |
| |
| | | Shares | | Value |
| | | | | (Note 1) |
| Take Two Interactive Software, Inc. (a) | | 10,200 | | $ 180,540 |
| TIBCO Software, Inc. (a) | | 1,500 | | 11,205 |
| | | | | 4,672,306 |
| |
| TOTAL INFORMATION TECHNOLOGY | | | | 37,759,803 |
| |
| MATERIALS 4.6% | | | | |
| Chemicals 1.8% | | | | |
| Air Products & Chemicals, Inc. | | 5,600 | | 331,464 |
| Airgas, Inc. | | 16,100 | | 529,690 |
| Albemarle Corp. | | 12,100 | | 464,035 |
| Ashland, Inc. | | 16,500 | | 955,350 |
| Celanese Corp. Class A | | 24,500 | | 468,440 |
| Chemtura Corp. | | 64,900 | | 824,230 |
| Cytec Industries, Inc. | | 1,300 | | 61,919 |
| Georgia Gulf Corp. | | 9,200 | | 279,864 |
| Lyondell Chemical Co. | | 10,600 | | 252,492 |
| Monsanto Co. | | 9,700 | | 752,041 |
| Mosaic Co. (a) | | 48,300 | | 706,629 |
| NOVA Chemicals Corp. | | 1,800 | | 60,090 |
| Praxair, Inc. | | 7,000 | | 370,720 |
| Rhodia SA (a) | | 167,059 | | 357,969 |
| | | | | 6,414,933 |
| Construction Materials – 0.4% | | | | |
| Florida Rock Industries, Inc. | | 1,550 | | 76,043 |
| Martin Marietta Materials, Inc. | | 6,000 | | 460,320 |
| Rinker Group Ltd. | | 29,000 | | 349,940 |
| Texas Industries, Inc. | | 7,000 | | 348,880 |
| Vulcan Materials Co. | | 2,900 | | 196,475 |
| | | | | 1,431,658 |
| Containers & Packaging – 0.8% | | | | |
| Ball Corp. | | 1,900 | | 75,468 |
| Crown Holdings, Inc. (a) | | 7,200 | | 140,616 |
| Owens Illinois, Inc. (a) | | 46,100 | | 969,944 |
| Packaging Corp. of America | | 15,500 | | 355,725 |
| Pactiv Corp. (a) | | 36,600 | | 805,200 |
| Smurfit Stone Container Corp. (a) | | 27,102 | | 384,035 |
| | | | | 2,730,988 |
| Metals & Mining – 1.5% | | | | |
| Agnico Eagle Mines Ltd. | | 16,700 | | 330,682 |
| Alcoa, Inc. | | 43,600 | | 1,289,252 |
| Boliden AB (a) | | 3,000 | | 24,545 |
| Chaparral Steel Co. (a) | | 4,300 | | 130,075 |
| Companhia Vale do Rio Doce sponsored ADR | | 4,100 | | 168,674 |
| Compass Minerals International, Inc. | | 8,300 | | 203,682 |
| Falconbridge Ltd. | | 21,220 | | 629,728 |
| Goldcorp, Inc. | | 31,000 | | 690,637 |
| Ivanhoe Mines Ltd. (a) | | 7,100 | | 50,996 |
| Meridian Gold, Inc. (a) | | 38,100 | | 835,051 |
| Newmont Mining Corp. | | 1,000 | | 53,400 |
| RTI International Metals, Inc. (a) | | 4,800 | | 182,160 |
See accompanying notes which are an integral part of the financial statements.
| | |
| VIP Balanced Portfolio | | 18 |
| Common Stocks continued | | | | | | | | |
| | | | | Shares | | | | Value |
| | | | | | | | | (Note 1) |
| MATERIALS – continued | | | | | | | | |
| Metals & Mining – continued | | | | | | | | |
| Stillwater Mining Co. (a) | | | | 27,400 | | $ | | 317,018 |
| Teck Cominco Ltd. Class B (sub. vtg.) | | | | 7,900 | | | | 421,655 |
| | | | | | | | | 5,327,555 |
| Paper & Forest Products 0.1% | | | | | | | | |
| Votorantim Celulose e Papel SA sponsored ADR (non vtg.) | | | | 15,700 | | | | 192,953 |
| |
| TOTAL MATERIALS | | | | | | | | 16,098,087 |
| |
| TELECOMMUNICATION SERVICES 3.2% | | | | | | | | |
| Diversified Telecommunication Services – 1.8% | | | | | | | | |
| AT&T, Inc. | | | | 106,270 | | | | 2,602,552 |
| BellSouth Corp. | | | | 9,700 | | | | 262,870 |
| Covad Communications Group, Inc. (a) | | | | 314,200 | | | | 307,916 |
| Telewest Global, Inc. (a) | | | | 11,000 | | | | 262,020 |
| Verizon Communications, Inc. | | | | 87,300 | | | | 2,629,476 |
| | | | | | | | | 6,064,834 |
| Wireless Telecommunication Services – 1.4% | | | | | | | | |
| American Tower Corp. Class A (a) | | | | 80,970 | | | | 2,194,287 |
| Bharti Televentures Ltd. (a) | | | | 5,183 | | | | 40,587 |
| Crown Castle International Corp. (a) | | | | 22,900 | | | | 616,239 |
| DigitalGlobe, Inc. (f) | | | | 163 | | | | 408 |
| Nextel Partners, Inc. Class A (a) | | | | 22,000 | | | | 614,680 |
| NII Holdings, Inc. (a) | | | | 10,900 | | | | 476,112 |
| Sprint Nextel Corp. | | | | 42,262 | | | | 987,240 |
| Wireless Facilities, Inc. (a) | | | | 7,000 | | | | 35,700 |
| | | | | | | | | 4,965,253 |
| |
| TOTAL TELECOMMUNICATION SERVICES | | | | | | | | 11,030,087 |
| |
| UTILITIES 2.2% | | | | | | | | |
| Electric Utilities – 0.5% | | | | | | | | |
| E.ON AG | | | | 2,400 | | | | 248,544 |
| Edison International | | | | 2,800 | | | | 122,108 |
| Entergy Corp. | | | | 4,200 | | | | 288,330 |
| Exelon Corp. | | | | 15,800 | | | | 839,612 |
| ITC Holdings Corp. | | | | 2,600 | | | | 73,034 |
| Northeast Utilities | | | | 3,300 | | | | 64,977 |
| PPL Corp. | | | | 9,100 | | | | 267,540 |
| | | | | | | | | 1,904,145 |
| Independent Power Producers & Energy Traders 1.2% | | | | | | | | |
| AES Corp. (a) | | | | 108,000 | | | | 1,709,640 |
| Dynegy, Inc. Class A (a) | | | | 500 | | | | 2,420 |
| NRG Energy, Inc. (a) | | | | 7,900 | | | | 372,248 |
| TXU Corp. | | | | 39,600 | | | | 1,987,524 |
| | | | | | | | | 4,071,832 |
| Multi-Utilities – 0.5% | | | | | | | | |
| CMS Energy Corp. (a) | | | | 32,900 | | | | 477,379 |
| Dominion Resources, Inc. | | | | 7,500 | | | | 579,000 |
| |
| |
See accompanying notes which are an integral part of the financial statements.
| | | | | | | | |
| | | 19 | | | | Annual Report |
19
| VIP Balanced Portfolio | | | | | | | | |
| Investments - continued | | | | | | |
| |
| |
| |
| | | | | Shares | | | | Value |
| | | | | | | | | (Note 1) |
| MDU Resources Group, Inc. | | | | 500 | | $ | | 16,370 |
| PG&E Corp. | | | | 12,100 | | | | 449,152 |
| Public Service Enterprise Group, Inc. | | 4,400 | | | | 285,868 |
| | | | | | | | | 1,807,769 |
| |
| TOTAL UTILITIES | | | | | | | | 7,783,746 |
| |
| TOTAL COMMON STOCKS | | | | | | | | |
| (Cost $212,360,226) | | | | | | 237,127,638 |
| |
| Convertible Preferred Stocks 0.1% | | | | | | |
| |
| FINANCIALS – 0.1% | | | | | | | | |
| Insurance – 0.1% | | | | | | | | |
| Platinum Underwriters Holdings Ltd. Series A, 6.00% | | 1,800 | | | | 55,836 |
| XL Capital Ltd. 6.50% | | | | 9,100 | | | | 202,566 |
| | | | | | | | | 258,402 |
| |
| UTILITIES 0.0% | | | | | | | | |
| Electric Utilities – 0.0% | | | | | | | | |
| Entergy Corp. 7.25% | | | | 3,200 | | | | 159,200 |
| TOTAL CONVERTIBLE PREFERRED STOCKS | | | | | | |
| (Cost $423,662) | | | | | | | | 417,602 |
| |
| Corporate Bonds 7.2% | | | | | | | | |
| | | | | Principal | | | | |
| | | | | Amount | | | | |
| Convertible Bonds 0.2% | | | | | | | | |
| |
| ENERGY 0.1% | | | | | | | | |
| Oil, Gas & Consumable Fuels 0.1% | | | | | | |
| McMoRan Exploration Co. 6% 7/2/08 | | $ 180,000 | | | | 255,168 |
| HEALTH CARE 0.0% | | | | | | | | |
| Health Care Providers & Services 0.0% | | | | | | |
| Omnicare, Inc. 3.25% 12/15/35 | | | | 110,000 | | | | 109,175 |
| TELECOMMUNICATION SERVICES 0.1% | | | | | | |
| Wireless Telecommunication Services – 0.1% | | | | | | |
| Nextel Communications, Inc. 5.25% 1/15/10 | | 150,000 | | | | 150,375 |
| |
| TOTAL CONVERTIBLE BONDS | | | | | | | | 514,718 |
| Nonconvertible Bonds – 7.0% | | | | | | | | |
| |
| CONSUMER DISCRETIONARY 0.8% | | | | | | |
| Auto Components – 0.0% | | | | | | | | |
| Delco Remy International, Inc. 9.375% 4/15/12 | | 55,000 | | | | 15,950 |
| Automobiles – 0.1% | | | | | | | | |
| Ford Motor Co.: | | | | | | | | |
| 6.625% 10/1/28 | | | | 40,000 | | | | 25,800 |
See accompanying notes which are an integral part of the financial statements.
| | |
| VIP Balanced Portfolio | | 20 |
| Corporate Bonds continued | | | | |
| | | Principal | | Value |
| | | Amount | | (Note 1) |
| Nonconvertible Bonds – continued | | | | |
| |
| CONSUMER DISCRETIONARY – continued | | | | |
| Automobiles – continued | | | | |
| Ford Motor Co.: – continued | | | | |
| 7.45% 7/16/31 | | $ 145,000 | | $ 98,600 |
| General Motors Corp. 8.375% 7/15/33 | | 515,000 | | 339,900 |
| | | | | 464,300 |
| Diversified Consumer Services 0.0% | | | | |
| Carriage Services, Inc. 7.875% 1/15/15 | | 50,000 | | 50,875 |
| Hotels, Restaurants & Leisure 0.1% | | | | |
| Carrols Corp. 9% 1/15/13 | | 100,000 | | 97,250 |
| Mandalay Resort Group 6.5% 7/31/09 | | 95,000 | | 96,069 |
| MGM MIRAGE 5.875% 2/27/14 | | 90,000 | | 85,950 |
| Six Flags, Inc.: | | | | |
| 9.625% 6/1/14 | | 15,000 | | 14,550 |
| 9.75% 4/15/13 | | 20,000 | | 19,600 |
| | | | | 313,419 |
| Media 0.5% | | | | |
| AOL Time Warner, Inc.: | | | | |
| 6.875% 5/1/12 | | 30,000 | | 31,934 |
| 7.625% 4/15/31 | | 100,000 | | 111,365 |
| Cablevision Systems Corp. 8.7163% 4/1/09 (j) | | 90,000 | | 90,450 |
| Charter Communications Operating LLC/Charter Communications Operating Capital Corp. 8% 4/30/12 (f) | | 80,000 | | 79,800 |
| Cox Communications, Inc. 7.125% 10/1/12 | | 100,000 | | 107,148 |
| CSC Holdings, Inc. 7.625% 4/1/11 | | 40,000 | | 39,800 |
| Dex Media West LLC/Dex Media West Finance Co. 9.875% 8/15/13 | | 39,000 | | 43,241 |
| Houghton Mifflin Co. 9.875% 2/1/13 | | 170,000 | | 179,563 |
| Liberty Media Corp.: | | | | |
| 5.7% 5/15/13 | | 150,000 | | 139,875 |
| 8.25% 2/1/30 | | 185,000 | | 181,273 |
| News America Holdings, Inc. 7.75% 12/1/45 | | 85,000 | | 97,447 |
| News America, Inc. 6.2% 12/15/34 | | 165,000 | | 163,895 |
| Time Warner Entertainment Co. LP 8.375% 7/15/33 | | 250,000 | | 295,315 |
| Time Warner, Inc. 6.625% 5/15/29 | | 105,000 | | 104,852 |
| | | | | 1,665,958 |
| Multiline Retail – 0.1% | | | | |
| The May Department Stores Co. 6.7% 7/15/34 | | 190,000 | | 202,368 |
| |
| | | Principal | | Value |
| | | Amount | | (Note 1) |
| Specialty Retail 0.0% | | | | |
| Asbury Automotive Group, Inc. 8% 3/15/14 | | $ 80,000 | | $ 76,400 |
| Sonic Automotive, Inc. 8.625% 8/15/13 | | 110,000 | | 106,425 |
| | | | | 182,825 |
| Textiles, Apparel & Luxury Goods 0.0% | | | | |
| Levi Strauss & Co. 8.8044% 4/1/12 (j) | | 30,000 | | 30,150 |
| |
| TOTAL CONSUMER DISCRETIONARY | | | | 2,925,845 |
See accompanying notes which are an integral part of the financial statements.
|
21 Annual Report
21
| VIP Balanced Portfolio | | | | |
| Investments - continued | | | | |
| |
| |
| | Principal | | Value |
| | Amount | | (Note 1) |
| | | | |
| CONSUMER STAPLES 0.1% | | | | |
| Beverages 0.0% | | | | |
| FBG Finance Ltd. 5.125% 6/15/15 (f) | | 125,000 | | 121,614 |
| Food Products – 0.1% | | | | |
| H.J. Heinz Co. 6.428% 12/1/08 (f)(j) | | 135,000 | | 138,681 |
| Tobacco – 0.0% | | | | |
| Altria Group, Inc. 7% 11/4/13 | | 55,000 | | 60,183 |
| |
| TOTAL CONSUMER STAPLES | | | | 320,478 |
| |
| ENERGY 0.9% | | | | |
| Energy Equipment & Services – 0.2% | | | | |
| Hornbeck Offshore Services, Inc. 6.125% 12/1/14 | | 40,000 | | 39,050 |
| Petronas Capital Ltd. 7% 5/22/12 (f) | | 395,000 | | 434,823 |
| Seabulk International, Inc. 9.5% 8/15/13 | | 80,000 | | 89,800 |
| | | | | 563,673 |
| Oil, Gas & Consumable Fuels 0.7% | | | | |
| Amerada Hess Corp. 6.65% 8/15/11 | | 40,000 | | 42,982 |
| Chesapeake Energy Corp. 7.5% 6/15/14 | | 40,000 | | 42,200 |
| Duke Capital LLC: | | | | |
| 4.37% 3/1/09 | | 400,000 | | 390,424 |
| 6.75% 2/15/32 | | 210,000 | | 228,533 |
| El Paso Corp.: | | | | |
| 6.5% 5/15/06 (f) | | 10,000 | | 10,074 |
| 7.625% 9/1/08 (f) | | 10,000 | | 10,118 |
| 7.75% 6/15/10 (f) | | 35,000 | | 35,823 |
| 7.875% 6/15/12 | | 85,000 | | 87,125 |
| Empresa Nacional de Petroleo 6.75% 11/15/12 (f) | | 120,000 | | 129,204 |
| EnCana Holdings Finance Corp. 5.8% 5/1/14 | | 80,000 | | 83,389 |
| Enterprise Products Operating LP 5.75% 3/1/35 | | 125,000 | | 114,931 |
| Kinder Morgan Energy Partners LP: | | | | |
| 5.125% 11/15/14 | | 35,000 | | 34,231 |
| 5.8% 3/15/35 | | 100,000 | | 95,661 |
See accompanying notes which are an integral part of the financial statements.
| | |
| VIP Balanced Portfolio | | 22 |
| Corporate Bonds continued | | | | | | | | | | |
| | | | | | | Principal | | | | Value |
| | | | | | | Amount | | | | (Note 1) |
| Nonconvertible Bonds – continued | | | | | | | | | | |
| |
| ENERGY – continued | | | | | | | | | | |
| Oil, Gas & Consumable Fuels – continued | | | | | | | | | | |
| Massey Energy Co. 6.875% 12/15/13 (f) | | | | | $ | 40,000 | | $ | | 40,350 |
| Nexen, Inc. 5.875% 3/10/35 | | | | | | 190,000 | | | | 186,831 |
| Pemex Project Funding Master Trust: | | | | | | | | | | |
| 5.75% 12/15/15 (f) | | | | | | 100,000 | | | | 99,500 |
| 6.125% 8/15/08 | | | | | | 400,000 | | | | 408,000 |
| 6.625% 6/15/35 (f) | | | | | | 235,000 | | | | 235,588 |
| 7.875% 2/1/09 (j) | | | | | | 180,000 | | | | 192,510 |
| Plains Exploration & Production Co. 7.125% 6/15/14 | | | | | | 25,000 | | | | 25,875 |
| | | | | | | | | | | 2,493,349 |
| |
| TOTAL ENERGY | | | | | | | | | | 3,057,022 |
| |
| FINANCIALS – 2.4% | | | | | | | | | | |
| Capital Markets 0.5% | | | | | | | | | | |
| Goldman Sachs Group, Inc.: | | | | | | | | | | |
| 5.25% 10/15/13 | | | | | | 500,000 | | | | 499,880 |
| 6.6% 1/15/12 | | | | | | 410,000 | | | | 440,417 |
| Lazard Group LLC 7.125% 5/15/15 | | | | | | 195,000 | | | | 204,768 |
| Merrill Lynch & Co., Inc. 4.25% 2/8/10 | | | | | | 480,000 | | | | 466,908 |
| Morgan Stanley 6.6% 4/1/12 | | | | | | 160,000 | | | | 171,979 |
| | | | | | | | | | | 1,783,952 |
| Commercial Banks – 0.2% | | | | | | | | | | |
| Bank of America Corp. 7.4% 1/15/11 | | | | | | 155,000 | | | | 170,736 |
| Korea Development Bank 3.875% 3/2/09 | | | | | | 250,000 | | | | 241,885 |
| Wachovia Bank NA 4.875% 2/1/15 | | | | | | 90,000 | | | | 87,770 |
| Wachovia Corp. 4.875% 2/15/14 | | | | | | 25,000 | | | | 24,467 |
| | | | | | | | | | | 524,858 |
| Consumer Finance – 0.4% | | | | | | | | | | |
| Capital One Bank 6.5% 6/13/13 | | | | | | 250,000 | | | | 265,610 |
| Ford Motor Credit Co.: | | | | | | | | | | |
| 7.375% 2/1/11 | | | | | | 100,000 | | | | 87,652 |
| 7.875% 6/15/10 | | | | | | 200,000 | | | | 179,978 |
| General Motors Acceptance Corp.: | | | | | | | | | | |
| 6.75% 12/1/14 | | | | | | 40,000 | | | | 36,000 |
| 6.875% 9/15/11 | | | | | | 35,000 | | | | 31,938 |
| 6.875% 8/28/12 | | | | | | 15,000 | | | | 13,520 |
| 8% 11/1/31 | | | | | | 15,000 | | | | 14,550 |
| Household Finance Corp. 4.125% 11/16/09 | | | | | | 300,000 | | | | 289,647 |
| Household International, Inc. 5.836% 2/15/08 | | | | | | 150,000 | | | | 152,485 |
| |
| | | | | | | Principal | | | | Value |
| | | | | | | Amount | | | | (Note 1) |
| MBNA America Bank NA 7.125% 11/15/12 | | | | | $ | 325,000 | | $ | | 363,318 |
| MBNA Corp. 7.5% 3/15/12 | | | | | | 75,000 | | | | 84,475 |
| | | | | | | | | | | 1,519,173 |
| Diversified Financial Services – 0.2% | | | | | | | | | | |
| Alliance Capital Management LP 5.625% 8/15/06 | | | | | | 150,000 | | | | 150,621 |
| |
See accompanying notes which are an integral part of the financial statements.
| | | | | | | | | | |
| | | 23 | | | | | | Annual Report |
23
| VIP Balanced Portfolio | | | | |
| Investments - continued | | | | |
| |
| | Principal | | Value |
| | Amount | | (Note 1) |
| | | | |
| JPMorgan Chase Capital XVII 5.85% 8/1/35 | | 565,000 | | 559,013 |
| Prime Property Funding, Inc. 5.125% 6/1/15 (f) | | 160,000 | | 154,720 |
| | | | | 864,354 |
| Insurance – 0.1% | | | | |
| Axis Capital Holdings Ltd. 5.75% 12/1/14 | | 250,000 | | 250,054 |
| Marsh & McLennan Companies, Inc. 5.75% 9/15/15 | | 110,000 | | 110,884 |
| Principal Life Global Funding I 6.25% 2/15/12 (f) | | 85,000 | | 90,289 |
| | | | | 451,227 |
| Real Estate 0.8% | | | | |
| Archstone Smith Operating Trust 5.25% 5/1/15 | | 210,000 | | 207,095 |
| Arden Realty LP 5.25% 3/1/15 | | 525,000 | | 530,476 |
| BRE Properties, Inc. 5.95% 3/15/07 | | 250,000 | | 252,137 |
| CarrAmerica Realty Corp.: | | | | |
| 5.125% 9/1/11 | | 300,000 | | 294,047 |
| 5.5% 12/15/10 | | 120,000 | | 119,817 |
| Colonial Properties Trust 5.5% 10/1/15 | | 260,000 | | 253,427 |
| Developers Diversified Realty Corp.: | | | | |
| 5% 5/3/10 | | 115,000 | | 113,306 |
| 5.25% 4/15/11 | | 65,000 | | 64,345 |
| EOP Operating LP: | | | | |
| 4.65% 10/1/10 | | 200,000 | | 193,782 |
| 7% 7/15/11 | | 200,000 | | 214,069 |
| Simon Property Group LP: | | | | |
| 5.1% 6/15/15 | | 145,000 | | 140,237 |
| 5.625% 8/15/14 | | 200,000 | | 201,360 |
| Ventas Realty LP/Ventas Capital Corp. 6.5% 6/1/16 (f) | | 30,000 | | 30,225 |
| | | | | 2,614,323 |
| Thrifts & Mortgage Finance – 0.2% | | | | |
| Countrywide Home Loans, Inc. 4% 3/22/11 | | 145,000 | | 136,436 |
| Independence Community Bank Corp. 3.75% 4/1/14 (j) | | 165,000 | | 158,051 |
See accompanying notes which are an integral part of the financial statements.
| | |
| VIP Balanced Portfolio | | 24 |
| Corporate Bonds continued | | | | | | | | | | |
| | | | | | | Principal | | | | Value |
| | | | | | | Amount | | | | (Note 1) |
| Nonconvertible Bonds – continued | | | | | | | | | | |
| |
| FINANCIALS – continued | | | | | | | | | | |
| Thrifts & Mortgage Finance – continued | | | | | | | | | | |
| Residential Capital Corp. 6.375% 6/30/10 | | | | | $ | 185,000 | | $ | | 187,981 |
| Washington Mutual, Inc. 4.625% 4/1/14 | | | | | | 200,000 | | | | 188,072 |
| | | | | | | | | | | 670,540 |
| |
| TOTAL FINANCIALS | | | | | | | | | | 8,428,427 |
| |
| HEALTH CARE 0.1% | | | | | | | | | | |
| Health Care Providers & Services 0.1% | | | | | | | | | | |
| DaVita, Inc. 7.25% 3/15/15 | | | | | | 165,000 | | | | 167,063 |
| HCA, Inc. 6.375% 1/15/15 | | | | | | 70,000 | | | | 70,694 |
| Psychiatric Solutions, Inc. 7.75% 7/15/15 | | | | | | 30,000 | | | | 30,900 |
| Skilled Healthcare Group, Inc. 11% 1/15/14 (f) | | | | | | 20,000 | | | | 20,200 |
| | | | | | | | | | | 288,857 |
| |
| INDUSTRIALS – 0.4% | | | | | | | | | | |
| Aerospace & Defense – 0.1% | | | | | | | | | | |
| BAE Systems Holdings, Inc. 4.75% 8/15/10 (f) | | | | | | 145,000 | | | | 142,403 |
| Bombardier, Inc. 6.3% 5/1/14 (f) | | | | | | 200,000 | | | | 175,000 |
| | | | | | | | | | | 317,403 |
| Airlines – 0.2% | | | | | | | | | | |
| American Airlines, Inc. pass thru trust certificates: | | | | | | | | | | |
| 6.855% 10/15/10 | | | | | | 14,951 | | | | 15,211 |
| 6.978% 10/1/12 | | | | | | 37,551 | | | | 38,713 |
| 7.024% 4/15/11 | | | | | | 100,000 | | | | 102,529 |
| 7.377% 5/23/19 | | | | | | 68,586 | | | | 56,241 |
| 7.379% 11/23/17 | | | | | | 41,055 | | | | 33,665 |
| 7.858% 4/1/13 | | | | | | 155,000 | | | | 163,426 |
| Continental Airlines, Inc. pass thru trust certificates 6.795% 2/2/20 | | | | | | 209,287 | | | | 188,359 |
| Delta Air Lines, Inc. pass thru trust certificates 7.57% 11/18/10 | | | | | | 80,000 | | | | 78,824 |
| Northwest Airlines, Inc. 7.875% 3/15/08 (d) | | | | | | 255,000 | | | | 94,350 |
| | | | | | | | | | | 771,318 |
| Commercial Services & Supplies 0.0% | | | | | | | | | | |
| Allied Waste North America, Inc. 8.5% 12/1/08 | | | | | | 60,000 | | | | 63,000 |
| IKON Office Solutions, Inc. 7.75% 9/15/15 (f) | | | | | | 10,000 | | | | 9,775 |
| | | | | | | | | | | 72,775 |
| |
| |
| | | | | | | Principal | | | | Value |
| | | | | | | Amount | | | | (Note 1) |
| Industrial Conglomerates 0.1% | | | | | | | | | | |
| Hutchison Whampoa International 03/13 Ltd. 6.5% 2/13/13 (f) | | | | | $ | 55,000 | | $ | | 58,241 |
| Hutchison Whampoa International 03/33 Ltd. 7.45% 11/24/33 (f) | | | | | | 120,000 | | | | 138,605 |
| | | | | | | | | | | 196,846 |
| Machinery – 0.0% | | | | | | | | | | |
| Invensys PLC 9.875% 3/15/11 (f) | | | | | | 80,000 | | | | 79,200 |
| Marine – 0.0% | | | | | | | | | | |
| American Commercial Lines LLC/ACL Finance Corp. 9.5% 2/15/15 | | | | | | 68,000 | | | | 73,100 |
| |
| |
See accompanying notes which are an integral part of the financial statements.
| | | | | | | | | | |
| | | 25 | | | | | | Annual Report |
25
| VIP Balanced Portfolio | | | | |
| Investments - continued | | | | |
| |
| | Principal | | Value |
| | Amount | | (Note 1) |
| Road & Rail 0.0% | | | | |
| Hertz Corp.: | | | | |
| 8.875% 1/1/14 (f) | | 30,000 | | 30,413 |
| 10.5% 1/1/16 (f) | | 20,000 | | 20,425 |
| | | | | 50,838 |
| |
| TOTAL INDUSTRIALS | | | | 1,561,480 |
| |
| INFORMATION TECHNOLOGY 0.3% | | | | |
| Communications Equipment – 0.0% | | | | |
| L 3 Communications Corp. 6.125% 1/15/14 | | 95,000 | | 94,288 |
| IT Services 0.0% | | | | |
| SunGard Data Systems, Inc.: | | | | |
| 8.5248% 8/15/13 (f)(j) | | 30,000 | | 30,938 |
| 9.125% 8/15/13 (f) | | 50,000 | | 51,688 |
| | | | | 82,626 |
| Office Electronics – 0.1% | | | | |
| Xerox Capital Trust I 8% 2/1/27 | | 170,000 | | 174,675 |
| Xerox Corp. 7.125% 6/15/10 | | 35,000 | | 36,313 |
| | | | | 210,988 |
| Semiconductors & Semiconductor Equipment – 0.2% | | | | |
| Amkor Technology, Inc. 9.25% 2/15/08 | | 20,000 | | 19,450 |
| Chartered Semiconductor Manufacturing Ltd.: | | | | |
| 5.75% 8/3/10 | | 195,000 | | 194,316 |
| 6.375% 8/3/15 | | 145,000 | | 144,161 |
| Freescale Semiconductor, Inc.: | | | | |
| 6.9% 7/15/09 (j) | | 70,000 | | 71,575 |
| 7.125% 7/15/14 | | 80,000 | | 84,600 |
| | | | | 514,102 |
| |
| TOTAL INFORMATION TECHNOLOGY | | | | 902,004 |
| |
| MATERIALS 0.2% | | | | |
| Chemicals 0.1% | | | | |
| BCP Crystal U.S. Holdings Corp. 9.625% 6/15/14 | | 62,000 | | 69,285 |
See accompanying notes which are an integral part of the financial statements.
| | |
| VIP Balanced Portfolio | | 26 |
| Corporate Bonds continued | | | | | | | | | | |
| | | | | | | Principal | | | | Value |
| | | | | | | Amount | | | | (Note 1) |
| Nonconvertible Bonds – continued | | | | | | | | | | |
| |
| MATERIALS – continued | | | | | | | | | | |
| Chemicals – continued | | | | | | | | | | |
| Huntsman International LLC 9.875% 3/1/09 | | | | | $ | 60,000 | | $ | | 63,225 |
| Lyondell Chemical Co. | | | | | | | | | | |
| 9.5% 12/15/08 | | | | | | 94,000 | | | | 98,583 |
| | | | | | | | | | | 231,093 |
| Construction Materials – 0.0% | | | | | | | | | | |
| RMCC Acquisition Co. 9.5% | | | | | | | | | | |
| 11/1/12 (f) | | | | | | 90,000 | | | | 90,450 |
| Containers & Packaging – 0.0% | | | | | | | | | | |
| Owens-Brockway Glass Container, Inc.: | | | | | | | | | | |
| 7.75% 5/15/11 | | | | | | 50,000 | | | | 52,125 |
| 8.75% 11/15/12 | | | | | | 25,000 | | | | 26,875 |
| | | | | | | | | | | 79,000 |
| Metals & Mining – 0.0% | | | | | | | | | | |
| Newmont Mining Corp. 5.875% | | | | | | | | | | |
| 4/1/35 | | | | | | 130,000 | | | | 128,287 |
| Paper & Forest Products 0.1% | | | | | | | | | | |
| Georgia Pacific Corp.: | | | | | | | | | | |
| 7.5% 5/15/06 | | | | | | 120,000 | | | | 120,600 |
| 8.125% 5/15/11 | | | | | | 120,000 | | | | 120,000 |
| International Paper Co. 4.25% | | | | | | | | | | |
| 1/15/09 | | | | | | 70,000 | | | | 67,937 |
| | | | | | | | | | | 308,537 |
| |
| TOTAL MATERIALS | | | | | | | | | | 837,367 |
| |
| TELECOMMUNICATION SERVICES 0.9% | | | | | | | | | | |
| Diversified Telecommunication Services – 0.7% | | | | | | | | | | |
| AT&T Broadband Corp. 8.375% 3/15/13 | | | | | | 100,000 | | | | 115,748 |
| BellSouth Capital Funding Corp. 7.875% 2/15/30 | | | | | | 115,000 | | | | 138,830 |
| BellSouth Corp. 5.2% 9/15/14 | | | | | | 55,000 | | | | 54,707 |
| British Telecommunications PLC 8.875% 12/15/30 | | | | | | 200,000 | | | | 267,588 |
| Koninklijke KPN NV yankee 8% | | | | | | | | | | |
| 10/1/10 | | | | | | 200,000 | | | | 219,650 |
| Qwest Capital Funding, Inc. 7% | | | | | | | | | | |
| 8/3/09 | | | | | | 60,000 | | | | 60,225 |
| Qwest Corp.: | | | | | | | | | | |
| 7.7413% 6/15/13 (f)(j) | | | | | | 140,000 | | | | 149,800 |
| 8.875% 3/15/12 | | | | | | 85,000 | | | | 95,838 |
| SBC Communications, Inc.: | | | | | | | | | | |
| 6.15% 9/15/34 | | | | | | 150,000 | | | | 150,669 |
| 6.45% 6/15/34 | | | | | | 55,000 | | | | 57,232 |
| Sprint Capital Corp.: | | | | | | | | | | |
| 6.875% 11/15/28 | | | | | | 145,000 | | | | 158,440 |
| 8.375% 3/15/12 | | | | | | 135,000 | | | | 156,460 |
| |
| | | | | | | Principal | | | | Value |
| | | | | | | Amount | | | | (Note 1) |
| Telecom Italia Capital: | | | | | | | | | | |
| 4.95% 9/30/14 | | | | | $ | 95,000 | | $ | | 90,733 |
See accompanying notes which are an integral part of the financial statements.
| | | | | | | | | | |
| | | 27 | | | | | | Annual Report |
27
| VIP Balanced Portfolio | | | | |
| Investments - continued | | | | |
| |
| | Principal | | Value |
| | Amount | | (Note 1) |
| | | | |
| 5.25% 11/15/13 | | 250,000 | | 245,319 |
| Verizon Global Funding Corp.: | | | | |
| 5.85% 9/15/35 | | 230,000 | | 221,645 |
| 7.75% 12/1/30 | | 200,000 | | 237,731 |
| Verizon New York, Inc. 6.875% 4/1/12 | | 45,000 | | 46,909 |
| | | | | 2,467,524 |
| Wireless Telecommunication Services – 0.2% | | | | |
| America Movil SA de CV 4.125% 3/1/09 | | 100,000 | | 97,200 |
| AT&T Wireless Services, Inc. 7.875% 3/1/11 | | 55,000 | | 61,713 |
| Intelsat Ltd.: | | | | |
| 6.5% 11/1/13 | | 25,000 | | 18,594 |
| 8.695% 1/15/12 (f)(j) | | 70,000 | | 71,225 |
| Nextel Communications, Inc. 7.375% 8/1/15 | | 160,000 | | 169,531 |
| Rogers Communications, Inc.: | | | | |
| 6.375% 3/1/14 | | 115,000 | | 115,144 |
| 7.6163% 12/15/10 (j) | | 50,000 | | 51,625 |
| | | | | 585,032 |
| |
| TOTAL TELECOMMUNICATION SERVICES | | | | 3,052,556 |
| |
| UTILITIES 0.9% | | | | |
| Electric Utilities – 0.4% | | | | |
| Cleveland Electric Illuminating Co. 5.65% 12/15/13 | | 145,000 | | 147,818 |
| Exelon Corp.: | | | | |
| 4.9% 6/15/15 | | 190,000 | | 181,333 |
| 5.625% 6/15/35 | | 25,000 | | 23,560 |
| 6.75% 5/1/11 | | 110,000 | | 117,108 |
| FirstEnergy Corp. 6.45% 11/15/11 | | 90,000 | | 95,400 |
| Niagara Mohawk Power Corp. 8.875% 5/15/07 | | 75,000 | | 78,952 |
| Progress Energy, Inc. 7.1% 3/1/11 | | 270,000 | | 291,308 |
| TXU Energy Co. LLC 7% 3/15/13 | | 375,000 | | 399,624 |
| | | | | 1,335,103 |
| Gas Utilities 0.1% | | | | |
| Sonat, Inc.: | | | | |
| 6.625% 2/1/08 | | 65,000 | | 64,431 |
| 6.75% 10/1/07 | | 70,000 | | 69,913 |
| Texas Eastern Transmission Corp. 7.3% 12/1/10 | | 185,000 | | 201,536 |
| | | | | 335,880 |
| Independent Power Producers & Energy Traders 0.2% | | | | |
| AES Corp.: | | | | |
| 8.75% 5/15/13 (f) | | 170,000 | | 185,088 |
| 9.5% 6/1/09 | | 59,000 | | 63,499 |
See accompanying notes which are an integral part of the financial statements.
| | |
| VIP Balanced Portfolio | | 28 |
| Corporate Bonds continued | | | | |
| | | Principal | | Value |
| | | Amount | | (Note 1) |
| Nonconvertible Bonds – continued | | | | |
| |
| UTILITIES – continued | | | | |
| Independent Power Producers & Energy Traders continued | | | | |
| Constellation Energy Group, Inc. 7% 4/1/12 | | $ 345,000 | | $ 376,424 |
| Mirant North America LLC / Mirant North America Finance Corp. 7.375% 12/31/13 (f) | | 20,000 | | 20,150 |
| | | | | 645,161 |
| Multi-Utilities – 0.2% | | | | |
| CMS Energy Corp.: | | | | |
| 8.5% 4/15/11 | | 85,000 | | 92,650 |
| 8.9% 7/15/08 | | 125,000 | | 133,750 |
| Dominion Resources, Inc.: | | | | |
| 4.75% 12/15/10 | | 155,000 | | 151,481 |
| 5.95% 6/15/35 | | 115,000 | | 112,250 |
| 6.25% 6/30/12 | | 370,000 | | 387,097 |
| | | | | 877,228 |
| |
| TOTAL UTILITIES | | | | 3,193,372 |
| |
| TOTAL NONCONVERTIBLE BONDS | | | | 24,567,408 |
| |
| TOTAL CORPORATE BONDS | | | | |
| (Cost $25,121,550) | | | | 25,082,126 |
| |
| U.S. Government and Government | | | | |
| Agency Obligations 6.9% | | | | |
| |
| U.S. Government Agency Obligations – 1.9% | | | | |
| Fannie Mae: | | | | |
| 2.5% 6/15/06 | | 410,000 | | 406,185 |
| 3.25% 1/15/08 | | 318,000 | | 308,919 |
| 3.25% 8/15/08 | | 400,000 | | 385,647 |
| 3.25% 2/15/09 | | 1,216,000 | | 1,164,699 |
| 3.375% 12/15/08 | | 140,000 | | 134,934 |
| 4.625% 5/1/13 | | 1,250,000 | | 1,213,991 |
| 5.5% 3/15/11 | | 210,000 | | 217,066 |
| 6.25% 2/1/11 | | 280,000 | | 295,711 |
| Freddie Mac: | | | | |
| 4% 6/12/13 | | 1,575,000 | | 1,488,989 |
| 6.625% 9/15/09 | | 475,000 | | 504,660 |
| 6.75% 3/15/31 | | 404,000 | | 506,397 |
| |
| TOTAL U.S. GOVERNMENT AGENCY OBLIGATIONS | | | | 6,627,198 |
| U.S. Treasury Inflation Protected Obligations – 1.8% | | | | |
| U.S. Treasury Inflation Indexed Bonds 2.375% 1/15/25 | | 1,056,710 | | 1,112,210 |
See accompanying notes which are an integral part of the financial statements.
|
29 Annual Report
29
| VIP Balanced Portfolio | | | | | | |
| Investments - continued | | | | | | |
| |
| |
| |
| | | | | Principal | | Value |
| | | | | Amount | | (Note 1) |
| U.S. Treasury Inflation Indexed Notes: | | | | | | |
| 0.875% 4/15/10 | | | | $ 1,051,420 | | $ 999,850 |
| 2% 1/15/14 | | | | 4,042,500 | | 4,020,113 |
| |
| TOTAL U.S. TREASURY INFLATION PROTECTED OBLIGATIONS | | | | 6,132,173 |
| U.S. Treasury Obligations – 3.2% | | | | | | |
| U.S. Treasury Bonds 6.25% 5/15/30 | | | | 1,040,000 | | 1,291,631 |
| U.S. Treasury Notes: | | | | | | |
| 4.375% 12/15/10 | | | | 170,000 | | 170,133 |
| 4.75% 5/15/14 | | | | 4,955,000 | | 5,075,585 |
| 6.5% 2/15/10 | | | | 4,320,000 | | 4,660,032 |
| |
| TOTAL U.S. TREASURY OBLIGATIONS | | | | | | 11,197,381 |
| |
| TOTAL U.S. GOVERNMENT AND GOVERNMENT AGENCY OBLIGATIONS | | | | |
| (Cost $24,331,213) | | | | | | 23,956,752 |
| |
| U.S. Government Agency Mortgage | | | | |
| Securities 9.1% | | | | | | |
| |
| Fannie Mae – 8.6% | | | | | | |
| 3.477% 4/1/34 (j) | | | | 37,614 | | 37,380 |
| 3.726% 1/1/35 (j) | | | | 24,621 | | 24,265 |
| 3.752% 10/1/33 (j) | | | | 17,589 | | 17,182 |
| 3.76% 12/1/34 (j) | | | | 18,896 | | 18,634 |
| 3.793% 6/1/34 (j) | | | | 83,791 | | 80,757 |
| 3.82% 6/1/33 (j) | | | | 13,757 | | 13,515 |
| 3.83% 1/1/35 (j) | | | | 19,131 | | 18,891 |
| 3.847% 1/1/35 (j) | | | | 41,070 | | 40,543 |
| 3.869% 1/1/35 (j) | | | | 20,901 | | 20,858 |
| 3.889% 12/1/34 (j) | | | | 20,109 | | 20,086 |
| 3.906% 10/1/34 (j) | | | | 17,816 | | 17,617 |
| 3.952% 5/1/34 (j) | | | | 10,777 | | 10,939 |
| 3.964% 1/1/35 (j) | | | | 18,864 | | 18,696 |
| 3.983% 12/1/34 (j) | | | | 96,260 | | 95,935 |
| 3.984% 12/1/34 (j) | | | | 20,268 | | 20,148 |
| 3.991% 12/1/34 (j) | | | | 19,352 | | 19,236 |
| 3.993% 1/1/35 (j) | | | | 18,777 | | 18,642 |
| 4.002% 2/1/35 (j) | | | | 20,345 | | 20,160 |
| 4.023% 12/1/34 (j) | | | | 18,407 | | 18,266 |
| 4.029% 2/1/35 (j) | | | | 19,807 | | 19,608 |
| 4.034% 10/1/18 (j) | | | | 13,025 | | 12,783 |
| 4.037% 1/1/35 (j) | | | | 20,509 | | 20,378 |
| 4.057% 1/1/35 (j) | | | | 19,132 | | 18,911 |
| 4.064% 4/1/33 (j) | | | | 8,463 | | 8,403 |
| 4.066% 12/1/34 (j) | | | | 20,482 | | 20,375 |
| 4.079% 1/1/35 (j) | | | | 36,100 | | 35,831 |
| 4.095% 2/1/35 (j) | | | | 19,626 | | 19,489 |
| 4.099% 2/1/35 (j) | | | | 19,401 | | 19,229 |
| 4.101% 2/1/35 (j) | | | | 19,752 | | 19,579 |
See accompanying notes which are an integral part of the financial statements.
| | |
| VIP Balanced Portfolio | | 30 |
| U.S. Government Agency Mortgage | | | | | | | | | | |
| Securities continued | | | | | | | | | | | | |
| | | | | | | | | Principal | | | | Value |
| | | | | | | | | Amount | | | | (Note 1) |
| Fannie Mae – continued | | | | | | | | | | | | |
| 4.105% 2/1/35 (j) | | | | | | | $ | 57,210 | | | $ | 56,768 |
| 4.111% 1/1/35 (j) | | | | | | | | 29,037 | | | | 28,746 |
| 4.12% 11/1/34 (j) | | | | | | | | 17,331 | | | | 17,191 |
| 4.122% 1/1/35 (j) | | | | | | | | 52,640 | | | | 52,164 |
| 4.123% 1/1/35 (j) | | | | | | | | 37,076 | | | | 36,962 |
| 4.126% 2/1/35 (j) | | | | | | | | 38,858 | | | | 38,753 |
| 4.144% 1/1/35 (j) | | | | | | | | 42,263 | | | | 42,303 |
| 4.161% 2/1/35 (j) | | | | | | | | 20,018 | | | | 19,836 |
| 4.176% 11/1/34 (j) | | | | | | | | 14,998 | | | | 14,886 |
| 4.176% 1/1/35 (j) | | | | | | | | 53,149 | | | | 52,742 |
| 4.176% 1/1/35 (j) | | | | | | | | 19,117 | | | | 18,959 |
| 4.185% 1/1/35 (j) | | | | | | | | 43,187 | | | | 42,375 |
| 4.205% 3/1/34 (j) | | | | | | | | 16,647 | | | | 16,407 |
| 4.214% 10/1/34 (j) | | | | | | | | 37,419 | | | | 37,407 |
| 4.25% 2/1/35 (j) | | | | | | | | 22,292 | | | | 21,829 |
| 4.278% 2/1/35 (j) | | | | | | | | 17,995 | | | | 17,819 |
| 4.288% 8/1/33 (j) | | | | | | | | 31,715 | | | | 31,352 |
| 4.291% 1/1/35 (j) | | | | | | | | 20,544 | | | | 20,299 |
| 4.298% 7/1/34 (j) | | | | | | | | 14,903 | | | | 14,955 |
| 4.299% 3/1/35 (j) | | | | | | | | 21,153 | | | | 20,990 |
| 4.308% 5/1/35 (j) | | | | | | | | 24,672 | | | | 24,390 |
| 4.313% 3/1/33 (j) | | | | | | | | 14,621 | | | | 14,348 |
| 4.327% 12/1/34 (j) | | | | | | | | 21,297 | | | | 21,264 |
| 4.332% 1/1/35 (j) | | | | | | | | 18,837 | | | | 18,574 |
| 4.348% 1/1/35 (j) | | | | | | | | 22,457 | | | | 22,064 |
| 4.367% 2/1/34 (j) | | | | | | | | 39,118 | | | | 38,533 |
| 4.394% 2/1/35 (j) | | | | | | | | 21,360 | | | | 20,977 |
| 4.409% 5/1/35 (j) | | | | | | | | 44,308 | | | | 43,819 |
| 4.442% 10/1/34 (j) | | | | | | | | 86,022 | | | | 86,055 |
| 4.445% 3/1/35 (j) | | | | | | | | 22,670 | | | | 22,311 |
| 4.447% 4/1/34 (j) | | | | | | | | 26,537 | | | | 26,413 |
| 4.467% 8/1/34 (j) | | | | | | | | 56,461 | | | | 55,812 |
| 4.48% 1/1/35 (j) | | | | | | | | 17,462 | | | | 17,383 |
| 4.497% 3/1/35 (j) | | | | | | | | 45,725 | | | | 44,984 |
| 4.5% 10/1/18 to 10/1/33 | | | | | | | | 4,690,247 | | | | 4,467,806 |
| 4.5% 1/1/21 (g) | | | | | | | | 2,050,000 | | | | 1,994,266 |
| 4.52% 8/1/34 (j) | | | | | | | | 94,001 | | | | 94,590 |
| 4.522% 3/1/35 (j) | | | | | | | | 45,928 | | | | 45,269 |
| 4.545% 2/1/35 (j) | | | | | | | | 117,135 | | | | 116,546 |
| 4.545% 7/1/35 (j) | | | | | | | | 44,678 | | | | 44,348 |
| 4.55% 2/1/35 (j) | | | | | | | | 18,378 | | | | 18,222 |
| 4.56% 2/1/35 (j) | | | | | | | | 16,198 | | | | 16,114 |
| 4.584% 2/1/35 (j) | | | | | | | | 161,970 | | | | 160,065 |
| 4.607% 2/1/35 (j) | | | | | | | | 51,561 | | | | 51,003 |
| 4.642% 11/1/34 (j) | | | | | | | | 54,441 | | | | 54,062 |
| 4.674% 11/1/34 (j) | | | | | | | | 61,455 | | | | 60,999 |
| 4.695% 3/1/35 (j) | | | | | | | | 142,953 | | | | 142,437 |
| 4.722% 3/1/35 (j) | | | | | | | | 20,959 | | | | 20,779 |
| 4.729% 7/1/34 (j) | | | | | | | | 50,623 | | | | 50,263 |
| 4.803% 12/1/34 (j) | | | | | | | | 39,859 | | | | 39,750 |
| |
| |
See accompanying notes which are an integral part of the financial statements.
| | | | | | | | | | |
| | | | | 31 | | | | | | Annual Report |
31
| VIP Balanced Portfolio | | | | | | |
| Investments - continued | | | | | | |
| |
| |
| |
| | | Principal | | | | Value |
| | | Amount | | | | (Note 1) |
| 4.816% 12/1/32 (j) | | $ 19,108 | | $ | | 19,102 |
| 4.838% 12/1/34 (j) | | 19,283 | | | | 19,233 |
| 5% 11/1/17 to 8/1/35 | | 7,682,322 | | | | 7,521,552 |
| 5.111% 5/1/35 (j) | | 107,168 | | | | 107,752 |
| 5.199% 6/1/35 (j) | | 88,625 | | | | 89,004 |
| 5.5% 2/1/11 to 6/1/29 | | 1,250,972 | | | | 1,256,533 |
| 5.5% 1/1/36 (g) | | 7,934,740 | | | | 7,857,854 |
| 6% 7/1/13 to 3/1/33 | | 1,864,593 | | | | 1,896,003 |
| 6% 1/1/36 (g) | | 299,817 | | | | 302,628 |
| 6.5% 6/1/15 to 7/1/32 | | 1,184,699 | | | | 1,219,323 |
| 7% 12/1/24 to 2/1/28 | | 94,129 | | | | 98,472 |
| 7.5% 10/1/26 to 8/1/28 | | 349,249 | | | | 366,601 |
| |
| TOTAL FANNIE MAE | | | | 29,916,582 |
| Freddie Mac 0.3% | | | | | | |
| 4.056% 12/1/34 (j) | | 18,017 | | | | 17,821 |
| 4.103% 12/1/34 (j) | | 18,515 | | | | 18,260 |
| 4.188% 1/1/35 (j) | | 79,492 | | | | 78,450 |
| 4.269% 3/1/35 (j) | | 20,079 | | | | 19,918 |
| 4.3% 5/1/35 (j) | | 41,947 | | | | 41,591 |
| 4.307% 12/1/34 (j) | | 42,309 | | | | 41,549 |
| 4.364% 3/1/35 (j) | | 46,027 | | | | 45,135 |
| 4.375% 2/1/35 (j) | | 55,492 | | | | 55,169 |
| 4.39% 2/1/35 (j) | | 43,301 | | | | 42,895 |
| 4.445% 3/1/35 (j) | | 23,794 | | | | 23,350 |
| 4.447% 2/1/34 (j) | | 28,467 | | | | 28,119 |
| 4.489% 3/1/35 (j) | | 22,602 | | | | 22,211 |
| 4.49% 3/1/35 (j) | | 151,663 | | | | 149,613 |
| 4.5% 5/1/19 | | 49,787 | | | | 48,522 |
| 4.552% 2/1/35 (j) | | 43,367 | | | | 42,800 |
| 5.017% 4/1/35 (j) | | 140,671 | | | | 140,478 |
| 5.285% 8/1/33 (j) | | 16,721 | | | | 16,923 |
| 6% 5/1/33 | | 219,314 | | | | 222,163 |
| 7.5% 1/1/27 | | 23,847 | | | | 25,095 |
| |
| TOTAL FREDDIE MAC | | | | | | 1,080,062 |
| Government National Mortgage Association – 0.2% | | | | | | |
| 6.5% 10/15/27 to 9/15/32 | | 349,475 | | | | 365,650 |
| 7% 1/15/28 to 7/15/32 | | 266,913 | | | | 280,268 |
| 7.5% 6/15/27 to 3/15/28 | | 109,525 | | | | 115,350 |
| |
| TOTAL GOVERNMENT NATIONAL MORTGAGE ASSOCIATION | | | | | | 761,268 |
| |
| TOTAL U.S. GOVERNMENT AGENCY - MORTGAGE SECURITIES | | | | | | |
| (Cost $32,133,938) | | | | 31,757,912 |
See accompanying notes which are an integral part of the financial statements.
| | |
| VIP Balanced Portfolio | | 32 |
| Asset Backed Securities 0.9% | | | | | | |
| | | | | Principal | | | | Value |
| | | | | Amount | | | | (Note 1) |
| ACE Securities Corp.: | | | | | | | | |
| Series 2004 HE1: | | | | | | | | |
| Class M1, 4.8788% 2/25/34 (j) | | $ 50,000 | | $ | | 50,105 |
| Class M2, 5.4788% 2/25/34 (j) | | 50,000 | | | | 50,332 |
| Series 2005 SD1 Class A1, 4.7788% 11/25/50 (j) | | 37,364 | | | | 37,409 |
| Aesop Funding II LLC Series 2005 1A Class A1, 3.95% 4/20/08 (f) | | 200,000 | | | | 195,714 |
| American Express Credit Account Master Trust Series 2001 6 Class B, 4.7194% 12/15/08 (j) | | 200,000 | | | | 200,084 |
| Ameriquest Mortgage Securities, Inc. Series 2004 R2: | | | | | | |
| Class M1, 4.8088% 4/25/34 (j) | | 25,000 | | | | 25,000 |
| Class M2, 4.8588% 4/25/34 (j) | | 25,000 | | | | 25,000 |
| Amortizing Residential Collateral Trust Series 2002 BC1 Class M2, 5.4788% 1/25/32 (j) | | 11,940 | | | | 11,988 |
| Argent Securities, Inc. | | | | | | | | |
| Series 2004 W5 Class M1, 4.9788% 4/25/34 (j) | | 75,000 | | | | 75,090 |
| Capital One Multi Asset Execution Trust: | | | | | | |
| Series 2003 B4 Class B4, 5.1694% 7/15/11 (j) | | 105,000 | | | | 106,501 |
| Series 2004 6 Class B, 4.15% 7/16/12 | | 125,000 | | | | 121,574 |
| Cendant Timeshare Receivables Funding LLC Series 2005 1A Class A1, 4.67% 5/20/17 (f) | | 80,080 | | | | 79,255 |
| Citibank Credit Card Issuance Trust | | | | | | |
| Series 2002 C1 Class C1, 5.2806% 2/9/09 (j) | | 250,000 | | | | 252,059 |
| Countrywide Home Loans, Inc.: | | | | | | | | |
| Series 2004 2 Class M1, 4.8788% 5/25/34 (j) | | 140,000 | | | | 140,257 |
| Series 2004 3 Class M1, 4.8788% 6/25/34 (j) | | 25,000 | | | | 25,050 |
| Series 2004 4: | | | | | | | | |
| Class A, 4.7488% 8/25/34 (j) | | 32,475 | | | | 32,506 |
| Class M1, 4.8588% 7/25/34 (j) | | 75,000 | | | | 75,236 |
| Class M2, 4.9088% 6/25/34 (j) | | 80,000 | | | | 80,100 |
| Series 2005 1: | | | | | | | | |
| Class MV1, 4.7788% 7/25/35 (j) | | 60,000 | | | | 59,999 |
| Class MV2, 4.8188% 7/25/35 (j) | | 70,000 | | | | 69,977 |
| Crown Castle Towers LLC/Crown Atlantic Holdings Sub LLC/Crown Communication, Inc. Series 2005 1A: | | | | | | |
| Class B, 4.878% 6/15/35 (f) | | | | 97,000 | | | | 94,466 |
| Class C, 5.074% 6/15/35 (f) | | | | 88,000 | | | | 85,908 |
| |
| | | | | Principal | | | | Value |
| | | | | Amount | | | | (Note 1) |
| Discover Card Master Trust I Series 2003 4 Class B1, 4.6994% 5/16/11 (j) | | $ 155,000 | | $ | | 155,889 |
| Fremont Home Loan Trust: | | | | | | | | |
| Series 2004 A: | | | | | | | | |
| Class M1, 4.9288% 1/25/34 (j) | | 75,000 | | | | 75,232 |
| Class M2, 5.5288% 1/25/34 (j) | | 100,000 | | | | 101,207 |
| Series 2005 A: | | | | | | | | |
| Class M1, 4.8088% 1/25/35 (j) | | 25,000 | | | | 25,084 |
| Class M2, 4.8388% 1/25/35 (j) | | 50,000 | | | | 50,049 |
| Class M3, 4.8688% 1/25/35 (j) | | 25,000 | | | | 25,062 |
| Class M4, 5.0588% 1/25/35 (j) | | 25,000 | | | | 25,166 |
| HSBC Home Equity Loan Trust | | | | | | | | |
| Series 2005 2: | | | | | | | | |
| Class M1, 4.83% 1/20/35 (j) | | | | 42,752 | | | | 42,756 |
| Class M2, 4.86% 1/20/35 (j) | | | | 31,093 | | | | 31,102 |
| Meritage Mortgage Loan Trust | | | | | | | | |
| Series 2004 1: | | | | | | | | |
| Class M1, 4.8788% 7/25/34 (j) | | 50,000 | | | | 50,000 |
| Class M3, 5.3288% 7/25/34 (j) | | 25,000 | | | | 25,000 |
| |
See accompanying notes which are an integral part of the financial statements.
| | | | | | |
| | | 33 | | | | Annual Report |
33
| VIP Balanced Portfolio | | | | |
| Investments - continued | | | | |
| |
| | Principal | | Value |
| | Amount | | (Note 1) |
| | | | |
| Morgan Stanley ABS Capital I, Inc. | | | | |
| Series 2003 NC5 Class M2, 6.3788% 4/25/33 (j) | | 50,000 | | 50,377 |
| Morgan Stanley Dean Witter Capital I Trust Series 2003 NC1 Class M1, 5.4288% 11/25/32 (j) | | 42,118 | | 42,353 |
| National Collegiate Student Loan Trust Series 2005 GT1 Class AIO, 6.75% 12/25/09 (l) | | 100,000 | | 23,852 |
| Park Place Securities, Inc. Series 2005 WCH1 Class M2, 4.8988% 1/25/35 (j) | | 75,000 | | 75,081 |
| Structured Asset Securities Corp. | | | | |
| Series 2004 GEL1 Class A, 4.7388% 2/25/34 (j) | | 15,702 | | 15,702 |
| Volkswagen Auto Lease Trust | | | | |
| Series 2005 A Class A4, 3.94% 10/20/10 | | 305,000 | | 300,304 |
| TOTAL ASSET BACKED SECURITIES | | | | |
| (Cost $3,021,154) | | | | 3,007,826 |
| |
| Collateralized Mortgage Obligations 1.1% | | | | |
| |
| Private Sponsor 0.7% | | | | |
| Adjustable Rate Mortgage Trust floater: | | | | |
| Series 2005 1 Class 5A2, 4.7088% 5/25/35 (j) | | 87,426 | | 87,129 |
See accompanying notes which are an integral part of the financial statements.
| | |
| VIP Balanced Portfolio | | 34 |
| Collateralized Mortgage Obligations continued | | | | | | |
| | | | | Principal | | | | Value |
| | | | | Amount | | | | (Note 1) |
| Private Sponsor – continued | | | | | | | | |
| Adjustable Rate Mortgage Trust floater: – continued | | | | | | |
| Series 2005 2 Class 6A2, 4.6588% 6/25/35 (j) | | $ 41,669 | | $ | | 41,681 |
| Series 2005 3 Class 8A2, 4.6188% 7/25/35 (j) | | 204,394 | | | | 204,189 |
| Bear Stearns Alt A Trust floater Series 2005 1 Class A1, 4.6588% 1/25/35 (j) | | 139,714 | | | | 139,714 |
| CS First Boston Mortgage Securities Corp. floater Series 2004 AR3 Class 6A2, 4.7488% 4/25/34 (j) | | 28,923 | | | | 28,959 |
| Impac CMB Trust floater Series 2005 1: | | | | | | | | |
| Class M1, 4.8388% 4/25/35 (j) | | | | 57,245 | | | | 57,220 |
| Class M2, 4.8788% 4/25/35 (j) | | | | 87,776 | | | | 87,745 |
| Lehman Structured Securities Corp. floater Series 2005 1 Class A2, 4.59% 9/26/45 (f)(j) | | 168,884 | | | | 168,884 |
| Master Alternative Loan Trust Series 2004 3 Class 3A1, 6% 4/25/34 | | 16,927 | | | | 16,900 |
| Merrill Lynch Mortgage Investors, Inc. floater Series 2005 B Class A2, 4.79% 7/25/30 (j) | | 155,871 | | | | 155,769 |
| Opteum Mortgage Acceptance Corp. floater Series 2005 3 Class APT, 4.6688% 7/25/35 (j) | | 99,999 | | | | 100,057 |
| Residential Asset Mortgage Products, Inc. sequential pay Series 2004 SL2 | | | | | | |
| Class A1, 6.5% 10/25/16 | | | | 22,626 | | | | 23,029 |
| Sequoia Mortgage Trust floater: | | | | | | | | |
| Series 2005 1 Class A2, 4.1% 2/20/35 (j) | | 103,663 | | | | 103,269 |
| Series 2005 2 Class A2, 4.29% 3/20/35 (j) | | 124,512 | | | | 124,512 |
| Thornburg Mortgage Securities Trust floater Series 2005 3 Class A4, 4.6488% 10/25/35 (j) | | 183,293 | | | | 183,293 |
| WAMU Mortgage pass thru certificates floater Series 2005 AR13 Class A1C1, 4.3838% 10/25/45 (j) | | 189,577 | | | | 189,577 |
| Wells Fargo Mortgage Backed Securities Trust: | | | | | | |
| Series 2005 AR10 Class 2A2, 4.1101% 6/25/35 (j) | | 235,747 | | | | 231,429 |
| Series 2005 AR12 Class 2A6, 4.3214% 7/25/35 (j) | | 248,534 | | | | 243,230 |
| Series 2005 AR4 Class 2A2, 4.5345% 4/25/35 (j) | | 201,372 | | | | 197,373 |
| Series 2005 AR9 Class 2A1, 4.3624% 5/25/35 (j) | | 107,606 | | | | 106,202 |
| |
| TOTAL PRIVATE SPONSOR | | | | | | | | 2,490,161 |
| |
| |
| | | | | Principal | | | | Value |
| | | | | Amount | | | | (Note 1) |
| U.S. Government Agency – 0.4% | | | | | | | | |
| Fannie Mae guaranteed REMIC pass thru certificates planned amortization class Series 2004 81: | | | | | | |
| Class KC, 4.5% 4/25/17 | | | | $ 380,000 | | $ | | 371,725 |
| Class KD, 4.5% 7/25/18 | | | | 170,000 | | | | 163,753 |
| Freddie Mac Multi class participation certificates guaranteed planned amortization class: | | | | | | |
| Series 2677 Class LD, 4.5% 3/15/17 | | | | 560,000 | | | | 544,235 |
| Series 2885 Class PC, 4.5% 3/15/18 | | | | 165,000 | | | | 161,450 |
| |
| TOTAL U.S. GOVERNMENT AGENCY | | | | | | | | 1,241,163 |
| |
| TOTAL COLLATERALIZED MORTGAGE OBLIGATIONS | | | | | | |
| (Cost $3,782,190) | | | | | | 3,731,324 |
| |
| Commercial Mortgage Securities 1.1% | | | | | | |
| |
| Bayview Commercial Asset Trust floater: | | | | | | | | |
| Series 2004 1 Class A, 4.7388% 4/25/34 (f)(j) | | 76,286 | | | | 76,322 |
| Series 2004 3 Class A1, 4.7488% 1/25/35 (f)(j) | | 135,869 | | | | 136,017 |
| COMM: | | | | | | | | |
| floater Series 2002 FL7 Class D, 4.9394% 11/15/14 (f)(j) | | 10,286 | | | | 10,317 |
| Series 2004 LBN2 Class X2, 1.1989% 3/10/39 (f)(j)(l) | | 298,978 | | | | 10,119 |
| |
| |
See accompanying notes which are an integral part of the financial statements.
| | | | | | |
| | | 35 | | | | Annual Report |
35
| VIP Balanced Portfolio | | | | |
| Investments - continued | | | | |
| |
| | Principal | | Value |
| | Amount | | (Note 1) |
| | | | |
| CS First Boston Mortgage Securities Corp.: | | | | |
| sequential pay: | | | | |
| Series 1999 C1 Class A2, 7.29% 9/15/41 | | 250,000 | | 266,001 |
| Series 2000 C1 Class A2, 7.545% 4/15/62 | | 500,000 | | 541,988 |
| Series 2004 C1 Class A3, 4.321% 1/15/37 | | 95,000 | | 91,583 |
| Series 1997 C2 Class D, 7.27% 1/17/35 | | 150,000 | | 158,082 |
| Series 2004 C1 Class ASP, 1.1065% 1/15/37 (f)(j)(l) | | 1,463,157 | | 47,497 |
| DLJ Commercial Mortgage Corp. sequential pay Series 2000 CF1 | | | | |
| Class A1B, 7.62% 6/10/33 | | 500,000 | | 545,727 |
| Fannie Mae sequential pay Series 1999 10 Class MZ, 6.5% 9/17/38 | | 223,174 | | 230,293 |
See accompanying notes which are an integral part of the financial statements.
| | |
| VIP Balanced Portfolio | | 36 |
| Commercial Mortgage Securities continued | | | | |
| | | Principal | | Value |
| | | Amount | | (Note 1) |
| GS Mortgage Securities Corp. II: | | | | |
| sequential pay: | | | | |
| Series 2001 LIBA Class A2, 6.615% 2/14/16 (f) | | $ 130,000 | | $ 139,056 |
| Series 2003 C1 Class A2A, 3.59% 1/10/40 | | 125,000 | | 122,000 |
| Series 1998 GLII Class E, 7.1906% 4/13/31 (j) | | 120,000 | | 124,363 |
| J.P. Morgan Commercial Mortgage Finance Corp. sequential pay Series 2000 C9 Class A2, 7.77% 10/15/32 | | 225,000 | | 244,172 |
| Leafs CMBS I Ltd./Leafs CMBS I Corp. Series 2002 1A: | | | | |
| Class B, 4.13% 11/20/37 (f) | | 110,000 | | 102,444 |
| Class C, 4.13% 11/20/37 (f) | | 110,000 | | 99,229 |
| Merrill Lynch Mortgage Trust sequential pay Series 2004 KEY2 Class A2, 4.166% 8/12/39 | | 215,000 | | 207,692 |
| Morgan Stanley Capital I, Inc.: | | | | |
| sequential pay Series 2004 HQ3 | | | | |
| Class A2, 4.05% 1/13/41 | | 105,000 | | 101,198 |
| Series 2005 IQ9 Class X2, 1.203% 7/15/56 (f)(j)(l) | | 1,285,000 | | 59,311 |
| Thirteen Affiliates of General Growth Properties, Inc. sequential pay Series 1 Class A2, 6.602% 11/15/07 (f) | | 500,000 | | 513,919 |
| Wachovia Bank Commercial Mortgage Trust sequential pay Series 2003 C6 Class A2, 4.498% 8/15/35 | | 165,000 | | 162,030 |
| TOTAL COMMERCIAL MORTGAGE SECURITIES | | | | |
| (Cost $3,931,300) | | | | 3,989,360 |
| |
| Foreign Government and Government Agency Obligations 0.2% | | | | |
| |
| Israeli State 4.625% 6/15/13 | | 30,000 | | 28,931 |
| United Mexican States: | | | | |
| 5.875% 1/15/14 | | 30,000 | | 31,050 |
| 6.375% 1/16/13 | | 300,000 | | 318,750 |
| 6.75% 9/27/34 | | 270,000 | | 295,313 |
| 7.5% 4/8/33 | | 175,000 | | 207,200 |
| TOTAL FOREIGN GOVERNMENT AND GOVERNMENT AGENCY OBLIGATIONS | | | | |
| (Cost $807,867) | | | | 881,244 |
| |
| Fixed Income Funds 4.1% | | | | |
| | | Shares | | |
| Fidelity Ultra Short Central Fund (k) | | | | |
| (Cost $14,499,872) | | 145,742 | | 14,495,499 |
| |
| Money Market Funds 4.2% | | | | |
| | | Shares | | Value |
| | | | | (Note 1) |
| Fidelity Cash Central Fund, 4.28% (b) | | 13,810,568 | | $ 13,810,568 |
| Fidelity Securities Lending Cash Central Fund, 4.35% (b)(c) | | 970,845 | | 970,845 |
| TOTAL MONEY MARKET FUNDS | | | | |
| (Cost $14,781,413) | | | | 14,781,413 |
| |
| TOTAL INVESTMENT PORTFOLIO 102.8% | | | | |
| (Cost $335,194,385) | | | | 359,228,696 |
| |
| NET OTHER ASSETS (2.8)% | | | | (9,856,053) |
| NET ASSETS 100% | | $ 349,372,643) |
See accompanying notes which are an integral part of the financial statements.
|
37 Annual Report
37
| VIP Balanced Portfolio | | | | | | | | |
| Investments - continued | | | | | | | | |
| |
| |
| Swap Agreements | | | | | | | | |
| | | Expiration | | Notional | | | | Value |
| | | Date | | Amount | | | | |
| |
| Credit Default Swaps | | | | | | | | |
| Receive quarterly a fixed rate of .4% multiplied by the notional amount and pay to Merrill Lynch, Inc., | | | | | | | | |
| upon each default event of one of the issues of Dow Jones CDX N.A. Investment Grade 4, par value of | | | | | | | | |
| the proportional notional amount (i) | | June 2010 | | $ 500,000 | | $ | | (1,985) |
| Receive quarterly a fixed rate of .4% multiplied by the notional amount and pay to Morgan Stanley, Inc., | | | | | | | | |
| upon each default event of one of the issues of Dow Jones CDX N.A. Investment Grade 4, par value of | | | | | | | | |
| the proportional notional amount (i) | | June 2010 | | 1,000,000 | | | | (3,970) |
See accompanying notes which are an integral part of the financial statements.
| | |
| VIP Balanced Portfolio | | 38 |
| Swap Agreements continued | | | | | | | | |
| |
| | | Expiration | | Notional | | | | Value |
| | | Date | | Amount | | | | |
| |
| Credit Default Swaps continued | | | | | | | | |
| Receive quarterly a fixed rate of .5% multiplied by the notional amount and pay to Merrill Lynch, Inc., | | | | | | | | |
| upon each default event of one of the issues of Dow Jones CDX N.A. Investment Grade 3, par value of | | | | | | | | |
| the proportional notional amount (h) | | March 2010 | | $ 248,000 | | $ | | 789 |
| Receive quarterly a fixed rate of .65% multiplied by the notional amount and pay to Merrill Lynch, Inc., | | | | | | | | |
| upon each default event of one of the issues of Dow Jones CDX N.A. Investment Grade 4, par value of | | | | | | | | |
| the proportional notional amount (i) | | June 2015 | | 500,000 | | | | (2,180) |
| Receive quarterly a fixed rate of .7% multiplied by the notional amount and pay to Deutsche Bank, upon | | | | | | | | |
| each default event of one of the issues of Dow Jones CDX N.A. Investment Grade 3, par value of the | | | | | | | | |
| proportional notional amount (h) | | March 2015 | | 248,000 | | | | 761 |
| Receive quarterly notional amount multiplied by .41% and pay Goldman Sachs upon default event of | | | | | | | | |
| Sempra Energy, par value of the notional amount of Sempra Energy 7.95% 3/1/10 | | Sept. 2010 | | 100,000 | | | | 35 |
| Receive quarterly notional amount multiplied by .42% and pay Morgan Stanley, Inc. upon default event of | | | | | | | | |
| Sempra Energy, par value of the notional amount of Sempra Energy 6% 2/1/13 | | Sept. 2010 | | 150,000 | | | | 116 |
| |
| |
| | | Expiration | | Notional | | | | Value |
| | | Date | | Amount | | | | |
| |
| Receive monthly notional amount multiplied by 1.6% and pay Morgan Stanley, Inc. upon default event of Park | | | | | | | | |
| Place Securities, Inc., par value of the notional amount of Park Place Securities, Inc. Series 2005 WHQ2 | | | | | | | | |
| Class M7, 5.4413% 5/25/35 | | June 2035 | | $ 30,000 | | $ | | 134 |
| Receive monthly notional amount multiplied by 2.79% and pay Merrill Lynch, Inc. upon default event of | | | | | | | | |
| New Century Home Equity Loan Trust, par value of the notional amount of New Century Home Equity | | | | | | | | |
| Loan Trust Series 2004 4 Class M9, 7.0788% 2/25/35 | | March 2035 | | 70,000 | | | | (157) |
| Receive monthly notional amount multiplied by 3.3% and pay to Morgan Stanley, Inc. upon each default | | | | | | | | |
| event of Ameriquest Mortgage Securities, Inc., par value of the notional amount of Ameriquest | | | | | | | | |
| Mortgage Securities, Inc. Series 2004 R11, Class M9, 7.6913% 11/25/34 | | Dec. 2034 | | 30,000 | | | | 192 |
| |
| TOTAL CREDIT DEFAULT SWAPS | | | | 2,876,000 | | | | (6,265) |
See accompanying notes which are an integral part of the financial statements.
|
39 Annual Report
39
| VIP Balanced Portfolio | | | | | | | | |
| Investments - continued | | | | | | | | |
| |
| |
| Swap Agreements continued | | | | | | | | |
| | | Expiration | | Notional | | | | Value |
| | | Date | | Amount | | | | |
| |
| Interest Rate Swaps | | | | | | | | |
| Receive quarterly a fixed rate equal to 4.3875% and pay quarterly a floating rate based on 3 month | | | | | | | | |
| LIBOR with Credit Suisse First Boston | | March 2010 | | $ 250,000 | | $ | | (4,128) |
| Receive semi annually a fixed rate equal to 4.492% and pay quarterly a floating rate based on 3 month | | | | | | | | |
| LIBOR with Lehman Brothers, Inc. | | Sept. 2010 | | 1,000,000 | | | | (4,700) |
| Receive quarterly a fixed rate equal to 4.774% and pay quarterly a floating rate based on 3 month | | | | | | | | |
| LIBOR with Credit Suisse First Boston | | March 2015 | | 250,000 | | | | (2,188) |
| Receive semi annually a fixed rate equal to 4.8575% and pay quarterly a floating rate based on 3 month | | | | | | | | |
| LIBOR with Lehman Brothers, Inc. | | Dec. 2008 | | 6,000,000 | | | | 3,900 |
| TOTAL INTEREST RATE SWAPS | | | | 7,500,000 | | | | (7,116) |
| Total Return Swaps | | | | | | | | |
| Receive monthly a return equal to Lehman Brothers CMBS U.S. Aggregate Index and pay monthly a | | | | | | | | |
| floating rate based on 1 month LIBOR minus 15 basis points with Citibank | | April 2006 | | 1,430,000 | | | | 6,962 |
| Receive monthly a return equal to Lehman Brothers CMBS U.S. Aggregate Index and pay monthly a | | | | | | | | |
| floating rate based on 1 month LIBOR minus 20 basis points with Lehman Brothers, Inc. | | March 2006 | | 3,070,000 | | | | 16,004 |
| |
| |
| | | Expiration | | Notional | | | | Value |
| | | Date | | Amount | | | | |
| Receive monthly a return equal to Lehman Brothers Commercial Mortgage Backed Securities AAA Daily | | | | | | | | |
| Index and pay monthly a floating rate based on 1 month LIBOR minus 10 basis points with Citibank | | March 2006 | | $ 490,000 | | $ | | 2,410 |
| Receive quarterly a return equal to Banc of America Securities LLC AAA 10Yr Commercial Mortgage | | | | | | | | |
| Backed Securities Daily Index and pay quarterly a floating rate based on 3 month LIBOR minus 30 basis | | | | | | | | |
| points with Bank of America | | May 2006 | | 500,000 | | | | 4,755 |
| TOTAL TOTAL RETURN SWAPS | | | | 5,490,000 | | | | 30,131 |
| |
| | | | | $ 15,866,000 | | $ | | 16,750 |
Legend
(a) Non income producing
(b) Affiliated fund that is available only to investment companies and other accounts managed by Fidelity Investments. The rate quoted is the annualized seven day
yield of the fund at period end. A complete unaudited listing of the fund’s holdings as of its most recent quarter end is available upon request.
(c) Investment made with cash collateral received from securities on loan.
(d) Non income producing Issuer is in default.
(e) Security or a portion of the security is on loan at period end.
(f) Security exempt from registration under Rule 144A of the Securities Act of 1933. These securities may be resold in transactions exempt from registration, normally
to qualified institutional buyers. At the period end, the value of these securities amounted to $4,757,876 or 1.4% of net assets.
(g) Security or a portion of the security purchased on a delayed delivery or when issued basis.
(h) Dow Jones CDX N.A. Investment Grade 3 is a tradable index of credit default swaps on investment grade debt of U.S. companies.
(i) Dow Jones CDX N.A. Investment Grade 4 is a tradable index of credit default swaps on investment grade debt of U.S. companies.
(j) The coupon rate shown on floating or adjustable rate securities represents the rate at period end.
(k) Affiliated fund that is available only to investment companies and other accounts managed by Fidelity Investments. A complete unaudited list of holdings for each
fixed income central fund, as of the investing fund’s report date, is available upon request or at advisor.fidelity.com. The reports are located just after the fund’s
financial statements and quarterly reports but are not part of the financial statements or quarterly reports. In addition, the fixed income central fund’s financial
statements, which are not covered by the investing fund’s Report of Independent Registered Public Accounting Firm, are available on the EDGAR Database on the
SEC’s web site, www.sec.gov, or upon request.
(l) Security represents right to receive monthly interest payments on an underlying pool of mortgages. Principal shown is the par amount of the mortgage pool.
|
See accompanying notes which are an integral part of the financial statements.
VIP Balanced Portfolio 40
| | (m) Restricted securities Investment in securities not registered under the Securities Act of 1933 (excluding 144A issues). At the end of the period, the value of
restricted securities (excluding 144A issues) amounted to $72,453 or 0.0% of net assets.
|
Additional information on each holding is as follows:
| Security | | | | Acquisition Date | | Acquisition Cost |
| Education Realty Trust, Inc. | | | | 9/29/05 | | $ 70,496 |
| Inverness Medical Innovations, Inc. | | | | 12/14/05 | | $ 20,772 |
Affiliated Central Funds
Information regarding income received by the fund from the affiliated Central funds during the period is as follows:
| Fund | | Income received |
| Fidelity Cash Central Fund | | $ 762,489 |
| Fidelity Securities Lending Cash Central Fund | | 7,896 |
| Fidelity Ultra Short Central Fund | | 253,752 |
| Total | | $ 1,024,137 |
Additional information regarding the fund’s purchases and sales, including the ownership percentage, of the following fixed income Central Fund during the period is as follows:
| | | Value, beginning | | | | Purchases | | | | Sales Proceeds | | | | Value, | | % ownership, |
| Fund | | of period | | | | | | | | | | | | end of period | | end of period |
| |
| Fidelity Ultra Short Central Fund | | $ | | — | | $ | | 14,499,872 | | $ | | — | | $ | | 14,495,499 | | 0.2% |
Other Information
The composition of credit quality ratings as a percentage of net assets is as follows (ratings are unaudited):
| U.S.Government and U.S.Government Agency Obligations | | 17.0% |
| AAA,AA,A | | 5.7% |
| BBB | | 4.8% |
| BB | | 1.1% |
| B | | 0.4% |
| CCC,CC,C | | 0.1% |
| Not Rated | | 0.2% |
| Equities | | 68.0% |
| Short-Term Investments and Net Other Assets | | 2.7% |
| | | 100.0% |
We have used ratings from Moody’s® Investors Services, Inc. Where Moody’s ratings are not available, we have used S&P® ratings.
See accompanying notes which are an integral part of the financial statements.
41 Annual Report
| VIP Balanced Portfolio | | | | |
| |
| Financial Statements | | | | |
| |
| |
| Statement of Assets and Liabilities | | | | |
| | | December 31, 2005 |
| |
| Assets | | | | |
| Investment in securities, at value (including securities loaned of $948,486) — See | | | | |
| accompanying schedule: | | | | |
| Unaffiliated issuers (cost $305,913,100) | | $ 329,951,784 | | |
| Affiliated Central Funds (cost $29,281,285) | | 29,276,912 | | |
| Total Investments (cost $335,194,385) | | | $ | 359,228,696 |
| Cash | | | | 24,004 |
| Foreign currency held at value (cost $15,755) | | | | 15,723 |
| Receivable for investments sold | | | | 413,418 |
| Receivable for swap agreements | | | | 58 |
| Receivable for fund shares sold | | | | 284,766 |
| Dividends receivable | | | | 249,763 |
| Interest receivable | | | | 928,149 |
| Swap agreements, at value | | | | 16,750 |
| Prepaid expenses | | | | 1,631 |
| Other receivables | | | | 63,682 |
| Total assets | | | | 361,226,640 |
| |
| Liabilities | | | | |
| Payable for investments purchased | | | | |
| Regular delivery | | $ 422,146 | | |
| Delayed delivery | | 10,097,824 | | |
| Payable for fund shares redeemed | | 133,669 | | |
| Accrued management fee | | 121,543 | | |
| Distribution fees payable | | 10,041 | | |
| Other affiliated payables | | 32,663 | | |
| Other payables and accrued expenses | | 65,266 | | |
| Collateral on securities loaned, | | | | |
| at value | | 970,845 | | |
| Total liabilities | | | | 11,853,997 |
| |
| Net Assets | | | $ | 349,372,643 |
| Net Assets consist of: | | | | |
| Paid in capital | | | $ | 306,499,337 |
| Undistributed net investment income | | | | 7,582,792 |
| Accumulated undistributed net realized gain (loss) on investments and foreign currency transactions | | | | 11,220,784 |
| Net unrealized appreciation (depreciation) on investments and assets and liabilities in foreign currencies | | | | 24,069,730 |
| Net Assets | | | $ | 349,372,643 |
| |
| Statement of Assets and Liabilities continued | | | | |
| | | December 31, 2005 |
| |
| Initial Class: | | | | |
| Net Asset Value, offering price | | | | |
| and redemption price | | | | |
| per share ($276,342,815 ÷ 18,699,525 shares) | | $ | | 14.78 |
| Service Class: | | | | |
| Net Asset Value, offering price | | | | |
| and redemption price | | | | |
| per share ($18,180,924 ÷ 1,236,502 shares) | | $ | | 14.70 |
| Service Class 2: | | | | |
| Net Asset Value, offering price | | | | |
| and redemption price | | | | |
| per share ($40,715,962 ÷ 2,784,328 shares) | | $ | | 14.62 |
| Investor Class: | | | | |
| Net Asset Value, offering price | | | | |
| and redemption price | | | | |
| per share ($14,132,942 ÷ 957,114 shares) | | $ | | 14.77 |
See accompanying notes which are an integral part of the financial statements.
| | |
| VIP Balanced Portfolio | | 42 |
| Statement of Operations | | | | | | | | |
| | | | | Year ended December 31, 2005 |
| |
| Investment Income | | | | | | | | |
| Dividends | | | | | | | $ | 3,161,844 |
| Interest | | | | | | | | 5,067,606 |
| Income from affiliated Central Funds | | | | | | | | 1,024,137 |
| Total income | | | | | | | | 9,253,587 |
| |
| Expenses | | | | | | | | |
| Management fee | | | $ | 1,414,139 | | | | |
| Transfer agent fees | | | | 237,061 | | | | |
| Distribution fees | | | | 114,818 | | | | |
| Accounting and security lending fees | | | | 138,748 | | | | |
| Independent trustees’ compensation | | | | 1,503 | | | | |
| Custodian fees and expenses | | | | 69,718 | | | | |
| Registration fees | | | | 10 | | | | |
| Audit | | | | 49,628 | | | | |
| Legal | | | | 1,478 | | | | |
| Miscellaneous | | | | 26,099 | | | | |
| Total expenses before reductions | | | | 2,053,202 | | | | |
| Expense reductions | | | | (112,588) | | | | 1,940,614 |
| |
| Net investment income (loss) | | | | | | | | 7,312,973 |
| Realized and Unrealized Gain (Loss) | | | | | | | | |
| Net realized gain (loss) on: | | | | | | | | |
| Investment securities: | | | | | | | | |
| Unaffiliated issuers | | | | 23,595,902 | | | | |
| Foreign currency transactions | | | | (4,529) | | | | |
| Swap agreements | | | | (108,634) | | | | |
| Total net realized gain (loss) | | | | | | | | 23,482,739 |
| Change in net unrealized appreciation (depreciation) on: | | | | | | | | |
| Investment securities (net of increase in deferred foreign taxes of $2,603) | | | | (12,137,531) | | | | |
| Assets and liabilities in foreign currencies | | | | (77) | | | | |
| Swap agreements | | | | 10,189 | | | | |
| Total change in net unrealized appreciation (depreciation) | | | | | | | | (12,127,419) |
| Net gain (loss) | | | | | | | | 11,355,320 |
| Net increase (decrease) in net assets resulting from operations | | | | | | | $ | 18,668,293 |
| |
| Statement of Changes in Net Assets | | | | | | | | |
| | | | | Year ended | | | | Year ended |
| | | | | December 31, | | | | December 31, |
| | | | | 2005 | | | | 2004 |
| Increase (Decrease) in Net Assets | | | | | | | | |
| Operations | | | | | | | | |
| Net investment income (loss) | | | | $ 7,312,973 | | | $ | 8,902,920 |
| Net realized gain (loss) | | | | 23,482,739 | | | | 8,580,364 |
| Change in net unrealized appreciation (depreciation) | | | | (12,127,419) | | | | 573,968 |
| Net increase (decrease) in net assets resulting from operations | | | | 18,668,293 | | | | 18,057,252 |
| Distributions to shareholders from net investment income | | | | (8,716,691) | | | | (6,988,389) |
| Distributions to shareholders from net realized gain | | | | (241,563) | | | | — |
| Total distributions | | | | (8,958,254) | | | | (6,988,389) |
| Share transactions - net increase (decrease) | | | | (9,761,182) | | | | (8,689,636) |
| Total increase (decrease) in net assets | | | | (51,143) | | | | 2,379,227 |
| |
| Net Assets | | | | | | | | |
| Beginning of period | | | | 349,423,786 | | | | 347,044,559 |
| End of period (including undistributed net investment income of $7,582,792 and undistributed net investment income of | | | | | | |
| $9,092,580, respectively) | | | | $ 349,372,643 | | | $ | 349,423,786 |
| |
| |
| |
| See accompanying notes which are an integral part of the financial statements. | | | | | | | | |
| |
| | | 43 | | | | Annual Report |
| Financial Highlights Initial Class | | | | | | | | | | |
| Years ended December 31, | | 2005 | | 2004 | | 2003 | | 2002 | | 2001 |
| Selected Per Share Data | | | | | | | | | | |
| Net asset value, beginning of period | | $ 14.35 | | $ 13.88 | | $ 12.16 | | $ 13.72 | | $ 14.45 |
| Income from Investment Operations | | | | | | | | | | |
| Net investment income (loss)C | | 31 | | .36E | | .30 | | .36 | | .42 |
| Net realized and unrealized gain (loss) | | 50 | | .39 | | 1.78 | | (1.53) | | (.63) |
| Total from investment operations | | 81 | | .75 | | 2.08 | | (1.17) | | (.21) |
| Distributions from net investment income | | (.37) | | (.28) | | (.36) | | (.39) | | (.52) |
| Distributions from net realized gain | | (.01) | | — | | — | | — | | — |
| Total distributions | | (.38) | | (.28) | | (.36) | | (.39) | | (.52) |
| Net asset value, end of period | | $ 14.78 | | $ 14.35 | | $ 13.88 | | $ 12.16 | | $ 13.72 |
| Total ReturnA,B | | 5.77% | | 5.47% | | 17.72% | | (8.72)% | | (1.58)% |
| Ratios to Average Net AssetsD,F | | | | | | | | | | |
| Expenses before reductions | | 58% | | .56% | | .59% | | .57% | | .57% |
| Expenses net of fee waivers, if any | | 58% | | .56% | | .59% | | .57% | | .57% |
| Expenses net of all reductions | | 54% | | .56% | | .58% | | .55% | | .55% |
| Net investment income (loss) | | 2.22% | | 2.60% | | 2.32% | | 2.84% | | 3.11% |
| Supplemental Data | | | | | | | | | | |
| Net assets, end of period (000 omitted) | | $ 276,343 | | $ 291,176 | | $ 295,656 | | $ 235,064 | | $ 264,608 |
| Portfolio turnover rate | | 140% | | 74% | | 102% | | 134% | | 126% |
A Total returns do not reflect charges attributable to your insurance company’s separate account. Inclusion of these charges would reduce the total returns shown.
B Total returns would have been lower had certain expenses not been reduced during the periods shown.
C Calculated based on average shares outstanding during the period.
D Amounts do not include the activity of the affiliated central funds.
E Investment income per share reflects a special dividend which amounted to $.03 per share.
F Expense ratios reflect operating expenses of the class. Expenses before reductions do not reflect amounts reimbursed by the investment adviser or reductions from brokerage service arrangements or other expense offset arrangements and do not
represent the amount paid by the class during periods when reimbursements or reductions occur. Expenses net of fee waivers reflect expenses after reimbursement by the investment adviser but prior to reductions from brokerage service arrange
ments or other expense offset arrangements. Expenses net of all reductions represent the net expenses paid by the class.
|
| Financial Highlights Service Class | | | | | | | | | | |
| Years ended December 31, | | 2005 | | 2004 | | 2003 | | 2002 | | 2001 |
| Selected Per Share Data | | | | | | | | | | |
| Net asset value, beginning of period | | $ 14.28 | | $ 13.81 | | $ 12.11 | | $ 13.66 | | $ 14.39 |
| Income from Investment Operations | | | | | | | | | | |
| Net investment income (loss)C | | 30 | | .34E | | .28 | | .34 | | .41 |
| Net realized and unrealized gain (loss) | | 48 | | .40 | | 1.77 | | (1.51) | | (.64) |
| Total from investment operations | | 78 | | .74 | | 2.05 | | (1.17) | | (.23) |
| Distributions from net investment income | | (.35) | | (.27) | | (.35) | | (.38) | | (.50) |
| Distributions from net realized gain | | (.01) | | — | | — | | — | | — |
| Total distributions | | (.36) | | (.27) | | (.35) | | (.38) | | (.50) |
| Net asset value, end of period | | $ 14.70 | | $ 14.28 | | $ 13.81 | | $ 12.11 | | $ 13.66 |
| Total ReturnA,B | | 5.61% | | 5.42% | | 17.53% | | (8.75)% | | (1.72)% |
| Ratios to Average Net AssetsD,F | | | | | | | | | | |
| Expenses before reductions | | 68% | | .67% | | .69% | | .67% | | .67% |
| Expenses net of fee waivers, if any | | 68% | | .67% | | .69% | | .67% | | .67% |
| Expenses net of all reductions | | 65% | | .67% | | .68% | | .65% | | .65% |
| Net investment income (loss) | | 2.12% | | 2.50% | | 2.22% | | 2.74% | | 3.01% |
| Supplemental Data | | | | | | | | | | |
| Net assets, end of period (000 omitted) | | $ 18,181 | | $ 21,228 | | $ 21,903 | | $ 20,019 | | $ 25,455 |
| Portfolio turnover rate | | 140% | | 74% | | 102% | | 134% | | 126% |
A Total returns do not reflect charges attributable to your insurance company’s separate account. Inclusion of these charges would reduce the total returns shown.
B Total returns would have been lower had certain expenses not been reduced during the periods shown.
C Calculated based on average shares outstanding during the period.
D Amounts do not include the activity of the affiliated central funds.
E Investment income per share reflects a special dividend which amounted to $.03 per share.
F Expense ratios reflect operating expenses of the class. Expenses before reductions do not reflect amounts reimbursed by the investment adviser or reductions from brokerage service arrangements or other expense offset arrangements and do not
represent the amount paid by the class during periods when reimbursements or reductions occur. Expenses net of fee waivers reflect expenses after reimbursement by the investment adviser but prior to reductions from brokerage service arrange
ments or other expense offset arrangements. Expenses net of all reductions represent the net expenses paid by the class.
|
See accompanying notes which are an integral part of the financial statements.
| | |
| VIP Balanced Portfolio | | 44 |
| Financial Highlights Service Class 2 | | | | | | | | | | |
| Years ended December 31, | | 2005 | | 2004 | | 2003 | | 2002 | | 2001 |
| Selected Per Share Data | | | | | | | | | | |
| Net asset value, beginning of period | | $ 14.20 | | $ 13.75 | | $ 12.05 | | $ 13.61 | | $ 14.37 |
| Income from Investment Operations | | | | | | | | | | |
| Net investment income (loss)C | | 27 | | .32E | | .26 | | .32 | | .38 |
| Net realized and unrealized gain (loss) | | 50 | | .38 | | 1.77 | | (1.51) | | (.63) |
| Total from investment operations | | 77 | | .70 | | 2.03 | | (1.19) | | (.25) |
| Distributions from net investment income | | (.34) | | (.25) | | (.33) | | (.37) | | (.51) |
| Distributions from net realized gain | | (.01) | | — | | — | | — | | — |
| Total distributions | | (.35) | | (.25) | | (.33) | | (.37) | | (.51) |
| Net asset value, end of period | | $ 14.62 | | $ 14.20 | | $ 13.75 | | $ 12.05 | | $ 13.61 |
| Total ReturnA,B | | 5.53% | | 5.15% | | 17.41% | | (8.93)% | | (1.87)% |
| Ratios to Average Net AssetsD,F | | | | | | | | | | |
| Expenses before reductions | | 83% | | .82% | | .84% | | .83% | | .83% |
| Expenses net of fee waivers, if any | | 83% | | .82% | | .84% | | .83% | | .83% |
| Expenses net of all reductions | | 80% | | .82% | | .84% | | .81% | | .81% |
| Net investment income (loss) | | 1.95% | | 2.35% | | 2.06% | | 2.58% | | 2.85% |
| Supplemental Data | | | | | | | | | | |
| Net assets, end of period (000 omitted) | | $ 40,716 | | $ 37,020 | | $ 29,485 | | $ 18,577 | | $ 16,798 |
| Portfolio turnover rate | | 140% | | 74% | | 102% | | 134% | | 126% |
A Total returns do not reflect charges attributable to your insurance company’s separate account. Inclusion of these charges would reduce the total returns shown.
B Total returns would have been lower had certain expenses not been reduced during the periods shown.
C Calculated based on average shares outstanding during the period.
D Amounts do not include the activity of the affiliated central funds.
E Investment income per share reflects a special dividend which amounted to $.03 per share.
F Expense ratios reflect operating expenses of the class. Expenses before reductions do not reflect amounts reimbursed by the investment adviser or reductions from brokerage service arrangements or other expense offset arrangements and do not
represent the amount paid by the class during periods when reimbursements or reductions occur. Expenses net of fee waivers reflect expenses after reimbursement by the investment adviser but prior to reductions from brokerage service arrange
ments or other expense offset arrangements. Expenses net of all reductions represent the net expenses paid by the class.
|
| Financial Highlights Investor Class | | |
| |
| Year ended December 31, | | 2005G |
| Selected Per Share Data | | |
| Net asset value, beginning of period | | $ 13.96 |
| Income from Investment Operations | | |
| Net investment income (loss)E | | 11 |
| Net realized and unrealized gain (loss) | | 70 |
| Total from investment operations | | 81 |
| Net asset value, end of period | | $ 14.77 |
| Total ReturnB,C,D | | 5.80% |
| Ratios to Average Net AssetsF,H | | |
| Expenses before reductions | | 76%A |
| Expenses net of fee waivers, if any | | 76%A |
| Expenses net of all reductions | | 73%A |
| Net investment income (loss) | | 1.73%A |
| Supplemental Data | | |
| Net assets, end of period (000 omitted) | | $ 14,133 |
| Portfolio turnover rate | | 140% |
A Annualized
B Total returns for periods of less than one year are not annualized.
C Total returns do not reflect charges attributable to your insurance company’s separate account. Inclusion of these charges would reduce the total returns shown.
D Total returns would have been lower had certain expenses not been reduced during the periods shown.
E Calculated based on average shares outstanding during the period.
F Amounts do not include the activity of the affiliated central funds.
G For the period July 21, 2005 (commencement of sale of shares) to December 31, 2005.
H Expense ratios reflect operating expenses of the class. Expenses before reductions do not reflect amounts reimbursed by the investment adviser or reductions from brokerage service arrangements or other expense offset arrangements and do not
represent the amount paid by the class during periods when reimbursements or reductions occur. Expense ratios before reductions for start up periods may not be representative of longer term operating periods. Expenses net of fee waivers reflect
expenses after reimbursement by the investment adviser but prior to reductions from brokerage service arrangements or other expense offset arrangements. Expenses net of all reductions represent the net expenses paid by the class.
|
See accompanying notes which are an integral part of the financial statements.
|
45 Annual Report
Notes to Financial Statements
For the period ended December 31, 2005
|
1. Significant Accounting Policies.
|
VIP Balanced Portfolio (the fund) is a fund of Variable Insurance Products Fund III (the trust) (referred to in this report as VIP Balanced Portfolio) and is authorized to issue an unlimited number of shares. The trust is registered under the Investment Company Act of 1940, as amended (the 1940 Act), as an open end management investment company organized as a Massachusetts business trust. Shares of the fund may only be purchased by insurance companies for the purpose of funding variable annuity or variable life insurance contracts. The fund offers the following classes of shares: Initial Class shares, Service Class shares, Service Class 2 shares and Investor Class shares. The fund commenced sale of Investor Class shares on July 21, 2005. All classes have equal rights and voting privileges, except for matters affecting a single class. Investment income, realized and unreal ized capital gains and losses, the common expenses of the fund, and certain fund level expense reductions, if any, are allocated on a pro rata basis to each class based on the relative net assets of each class to the total net assets of the fund. Each class differs with respect to transfer agent and distribution and service plan fees incurred. Certain expense reductions also differ by class.
The fund may invest in affiliated money market central funds (Money Market Central Funds), and fixed income Central Investment Portfolios (CIPs), collectively referred to as Central Funds, which are open end investment companies available to investment companies and other accounts managed by Fidelity Management & Research Company (FMR) and its affiliates. The financial statements have been prepared in conformity with accounting principles generally accepted in the United States of America, which require management to make certain estimates and assumptions at the date of the financial statements. The following summarizes the significant accounting policies of the fund, which are also consistently followed by the Central Funds:
Security Valuation. Investments are valued and net asset value (NAV) per share is calculated (NAV calculation) as of the close of business of the New York Stock Exchange (NYSE), normally 4:00 p.m. Eastern time. Wherever possible, the fund uses independent pricing services approved by the Board of Trustees to value its investments.
Equity securities, including restricted securities, for which market quotations are readily available, are valued at the last reported sale price or official closing price as reported by an independent pricing service on the primary market or exchange on which they are traded. In the event there were no sales during the day or closing prices are not available, securities are valued at the last quoted bid price. Debt securities, including restricted securities, for which quotations are readily available, are valued by independent pricing services or by dealers who make markets in such securities. Pricing services consider yield or price of bonds of comparable quality, coupon, maturity and type as well as dealer supplied prices. Investments in open end mutual funds, including Central Funds, are valued at their closing net asset value each business day. Short term securities with remaining maturities of sixty days or less for which quotations are not readily available are valued at amortized cost, which approximates value.
When current market prices or quotations are not readily available or do not accurately reflect fair value, valuations may be determined in accor dance with procedures adopted by the Board of Trustees. For example, when developments occur between the close of a market and the close of the NYSE that may materially affect the value of some or all of the securities, or when trading in a security is halted, those securities may be fair valued. Factors used in the determination of fair value may include monitoring news to identify significant market or security specific events such as changes in the value of U.S. securities markets, reviewing developments in foreign markets and evaluating the performance of ADRs, futures contracts and exchange traded funds. Because the fund’s utilization of fair value pricing depends on market activity, the frequency with which fair value pricing is used can not be predicted and may be utilized to a significant extent. The value of securities used for NAV calculation under fair value pricing may differ from published prices for the same securities.
Foreign Currency. The fund uses foreign currency contracts to facilitate transactions in foreign denominated securities. Losses from these transactions may arise from changes in the value of the foreign currency or if the counterparties do not perform under the contracts’ terms.
Foreign denominated assets, including investment securities, and liabilities are translated into U.S. dollars at the exchange rate at period end. Purchases and sales of investment securities, income and dividends received and expenses denominated in foreign currencies are translated into U.S. dollars at the exchange rate in effect on the transaction date.
The effects of exchange rate fluctuations on investments are included with the net realized and unrealized gain (loss) on investment securities. Other foreign currency transactions resulting in realized and unrealized gain (loss) are disclosed separately.
Investment Transactions and Income. Security transactions, including the fund’s investment activity in the Central Funds, are accounted for as of trade date. Gains and losses on securities sold are determined on the basis of identified cost and may include proceeds received from litigation. Dividend income is recorded on the ex dividend date, except for certain dividends from foreign securities where the ex dividend date may have passed, which are recorded as soon as the fund is informed of the ex dividend date. Non cash dividends included in dividend income, if any, are recorded at the fair market value of the securities received. Distributions received on securities that represent a return of capital or capital gain are recorded as a reduction of cost of investments and/or as a realized gain. The fund estimates the components of distributions received that may be considered return of capital distributions or capital gain distributions. Interest income and distributions from the Central Funds, are accrued as earned. Interest income includes coupon interest and amortization of premium and accretion of discount on debt securities. Investment income is recorded net of foreign taxes withheld where recovery of such taxes is uncertain. Debt obligations may be placed on non accrual status and related
1. Significant Accounting Policies continued
Investment Transactions and Income continued
interest income may be reduced by ceasing current accruals and writing off interest receivables when the collection of all or a portion of interest has become doubtful based on consistently applied procedures. A debt obligation is removed from non accrual status when the issuer resumes interest payments or when collectibility of interest is reasonably assured.
Expenses. Most expenses of the trust can be directly attributed to a fund. Expenses which cannot be directly attributed are apportioned among each fund in the trust.
Income Tax Information and Distributions to Shareholders. Each year, the fund intends to qualify as a regulated investment company by distributing all of its taxable income and realized gains under Subchapter M of the Internal Revenue Code. As a result, no provision for income taxes is required in the accompanying financial statements. Foreign taxes are provided for based on the fund’s understanding of the tax rules and rates that exist in the foreign markets in which it invests.
Distributions are recorded on the ex dividend date. Income dividends and capital gain distributions are declared separately for each class. Income and capital gain distributions are determined in accordance with income tax regulations, which may differ from generally accepted accounting principles.
Capital accounts within the financial statements are adjusted for permanent book tax differences. These adjustments have no impact on net assets or the results of operations. Temporary book tax differences will reverse in a subsequent period.
Book tax differences are primarily due to swap agreements, foreign currency transactions, market discount, financing transactions and losses deferred due to wash sales.
| The tax basis components of distributable earnings and the federal tax cost as of period end were as follows: | | | | |
| |
| Unrealized appreciation | | | $ | 31,475,639 | | |
| Unrealized depreciation | | | | (7,543,512) | | |
| Net unrealized appreciation (depreciation) | | | | 23,932,127 | | |
| Undistributed ordinary income | | | | 7,197,610 | | |
| Undistributed long term capital gain | | | | 11,747,332 | | |
| |
| Cost for federal income tax purposes | | | $ | 335,296,569 | | |
| |
| The tax character of distributions paid was as follows: | | | | | | |
| |
| | | | | December 31, 2005 | | December 31, 2004 |
| Ordinary Income | | | $ | 8,958,254 | | $ | | 6,988,389 |
| |
| 2. Operating Policies. | | | | | | |
Repurchase Agreements. FMR has received an Exemptive Order from the Securities and Exchange Commission (the SEC) which permits the fund and other affiliated entities of FMR to transfer uninvested cash balances into joint trading accounts which are then invested in repurchase agreements. The fund may also invest directly with institutions in repurchase agreements. Repurchase agreements are collateralized by government or non government securities. Collateral is held in segregated accounts with custodian banks and may be obtained in the event of a default of the counterparty. The fund monitors, on a daily basis, the value of the collateral to ensure it is at least equal to the principal amount of the repurchase agreement (including accrued interest). In the event of a default by the counterparty, realization of the collateral proceeds could be delayed, during which time the value of the collateral may decline.
Delayed Delivery Transactions and When Issued Securities. The fund may purchase or sell securities on a delayed delivery or when issued basis. Payment and delivery may take place after the customary settlement period for that security. The price of the underlying securities and the date when the securities will be delivered and paid for are fixed at the time the transaction is negotiated. During the time a delayed delivery sell is outstanding, the contract is marked to market daily and equivalent deliverable securities are held for the transaction. The value of the securities purchased on a delayed delivery or when issued basis are identified as such in the fund’s Schedule of Investments. The fund may receive compensa tion for interest forgone in the purchase of a delayed delivery or when issued security. With respect to purchase commitments, the fund identifies securities as segregated in its records with a value at least equal to the amount of the commitment. Losses may arise due to changes in the value of the underlying securities or if the counterparty does not perform under the contract’s terms, or if the issuer does not issue the securities due to political, economic, or other factors.
47 Annual Report
| Notes to Financial Statements continued |
2. Operating Policies continued |
Restricted Securities. The fund may invest in securities that are subject to legal or contractual restrictions on resale. These securities generally may be resold in transactions exempt from registration or to the public if the securities are registered. Disposal of these securities may involve time consuming negotiations and expense, and prompt sale at an acceptable price may be difficult. Information regarding restricted securities is included at the end of the fund’s Schedule of Investments.
Swap Agreements. The fund may invest in swaps for the purpose of managing its exposure to interest rate, credit or market risk.
Interest rate swaps are agreements to exchange cash flows periodically based on a notional principal amount, for example, the exchange of fixed rate interest payments for floating rate interest payments. Periodic payments received or made by the fund are recorded in the accompanying Statement of Operations as realized gains or losses, respectively. The primary risk associated with interest rate swaps is that unfavorable changes in the fluctuation of interest rates could adversely impact a fund.
Total return swaps are agreements to exchange the return generated by one instrument or index for the return generated by another instrument, for example, the agreement to pay interest in exchange for a market linked return based on a notional amount. To the extent the total return of the index exceeds the offsetting interest obligation, a fund will receive a payment from the counterparty. To the extent it is less, a fund will make a payment to the counterparty. Periodic payments received or made by the fund are recorded in the accompanying Statement of Operations as realized gains or losses, respectively.
Credit default swaps involve the exchange of a fixed rate premium for protection against the loss in value of an underlying debt instrument in the event of a defined credit event (such as payment default or bankruptcy). Under the terms of the swap, one party acts as a “guarantor” receiving a periodic payment that is a fixed percentage applied to a notional principal amount. In return the party agrees to purchase the notional amount of the underlying instrument, at par, if a credit event occurs during the term of the swap. The fund may enter into credit default swaps in which either it or its counterparty act as guarantors. By acting as the guarantor of a swap, a fund assumes the market and credit risk of the underlying instrument including liquidity and loss of value. Periodic payments and premiums received or made by the fund are recorded in the accompanying Statement of Operations as realized gains or losses, respectively.
Swaps are marked to market daily based on dealer supplied valuations and changes in value are recorded as unrealized appreciation (depreci ation). Gains or losses are realized upon early termination of the swap agreement. Collateral, in the form of cash or securities, may be required to be held in segregated accounts with a fund’s custodian in compliance with swap contracts. Risks may exceed amounts recognized on the Statement of Assets and Liabilities. These risks include changes in the returns of the underlying instruments, failure of the counterparties to perform under the contracts’ terms and the possible lack of liquidity with respect to the swap agreements. Details of swap agreements open at period end are included in the fund’s Schedule of Investments under the caption “Swap Agreements.”
Mortgage Dollar Rolls. To earn additional income, the fund may employ trading strategies which involve the sale and simultaneous agreement to repurchase similar securities (“mortgage dollar rolls”) or the purchase and simultaneous agreement to sell similar securities (“reverse mortgage dollar rolls”). The securities traded are mortgage securities and bear the same interest rate but may be collateralized by different pools of mort gages. During the period between the sale and repurchase in a mortgage dollar roll transaction, a fund will not be entitled to receive interest and principal payments on the securities sold but will invest the proceeds of the sale in other securities which may enhance the yield and total return. In addition, the difference between the sale price and the future purchase price is recorded as an adjustment to investment income. During the period between the purchase and subsequent sale in a reverse mortgage dollar roll transaction a fund is entitled to interest and principal payments on the securities purchased. The price differential between the purchase and sale is recorded as an adjustment to investment income. Losses may arise due to changes in the value of the securities or if the counterparty does not perform under the terms of the agreement. If the counterparty files for bankruptcy or becomes insolvent, a fund’s right to repurchase or sell securities may be limited.
3. Purchases and Sales of Investments.
Purchases and sales of securities, other than short term securities and U.S. government securities, aggregated $325,865,211 and $296,604,561, respectively.
4. Fees and Other Transactions with Affiliates.
Management Fee. FMR and its affiliates provide the fund with investment management related services for which the fund pays a monthly management fee. The management fee is the sum of an individual fund fee rate that is based on an annual rate of .15% of the fund’s average net assets and a group fee rate that averaged .27% during the period. The group fee rate is based upon the average net assets of all the mutual funds advised by FMR. The group fee rate decreases as assets under management increase and increases as assets under management decrease. For the period, the total annual management fee rate was .42% of the fund’s average net assets.
4. Fees and Other Transactions with Affiliates continued
Distribution and Service Plan. In accordance with Rule 12b 1 of the 1940 Act, the fund has adopted separate 12b 1 Plans for each Service Class of shares. Each Service Class pays Fidelity Distributors Corporation (FDC), an affiliate of FMR, a service fee. For the period, the service fee is based on an annual rate of .10% of Service Class’ average net assets and .25% of Service Class 2’s average net assets.
For the period, each class paid FDC the following amounts, all of which were re allowed to insurance companies for the distribution of shares and providing shareholder support services:
| Service Class | | | $ | 19,214 |
| Service Class 2 | | | | 95,604 |
| | | | $ | 114,818 |
Transfer Agent Fees. Fidelity Investments Institutional Operations Company, Inc. (FIIOC), an affiliate of FMR, is the fund’s transfer, dividend disbursing, and shareholder servicing agent. FIIOC receives an asset based fee with respect to each class. FIIOC pays a portion of the expenses related to the typesetting, printing and mailing of shareholder reports, except proxy statements. Each class with the exception of Investor Class pays a transfer agent fee, excluding out of pocket expenses, equal to an annual rate of ..07% of their month end net assets. Investor Class pays an asset based transfer agent fee of .18% of its month end net assets. The total transfer agent fees paid by each class to FIIOC, including out of pocket ex penses, were as follows:
| Initial Class | | | $ | 189,375 |
| Service Class | | | | 14,435 |
| Service Class 2 | | | | 28,595 |
| Investor Class | | | | 4,656 |
| | | | $ | 237,061 |
Accounting and Security Lending Fees. Fidelity Service Company, Inc. (FSC), an affiliate of FMR, maintains the fund’s accounting records. The accounting fee is based on the level of average net assets for the month. Under a separate contract, FSC administers the security lending program. The security lending fee is based on the number and duration of lending transactions.
Affiliated Central Funds. The fund may invest in Money Market Central Funds which seek preservation of capital and current income and are managed by Fidelity Investments Money Management, Inc. (FIMM), an affiliate of FMR.
The fund may also invest in CIPs managed by FIMM. The Ultra Short Central Fund seeks to obtain a high level of current income consistent with preservation of capital by investing in U.S. dollar denominated money market and investment grade debt securities.
The fund’s Schedule of Investments lists each applicable CIP as an investment of the fund but does not include the underlying holdings of each CIP. Based on their investment objectives, each CIP may invest or participate in various investment vehicles or strategies that are similar to those of the investing fund. In addition, each CIP may also participate in derivatives. These strategies are consistent with the investment objectives of the fund and may involve certain economic risks, including the risk that a counterparty to one or more of these transactions may be unable or unwilling to comply with the terms of the governing agreement. This may result in a decline in value of each CIP and the fund.
A complete unaudited list of holdings for each CIP, as of the funds’ report date, is available upon request or at advisor.fidelity.com. The reports are located just after the fund’s financial statements and quarterly reports but are not part of the financial statements or quarterly reports. In addition, the CIP’s financial statements, which are not covered by this fund’s Report of Independent Registered Public Accounting Firm, are available on the EDGAR Database on the SEC’s web site, www.sec.gov, or upon request.
The Central Funds do not pay a management fee.
|
Brokerage Commissions. The fund placed a portion of its portfolio transactions with brokerage firms which are affiliates of the investment adviser. The commissions paid to these affiliated firms were $8,950 for the period.
5. Committed Line of Credit.
|
The fund participates with other funds managed by FMR in a $4.2 billion credit facility (the “line of credit”) to be utilized for temporary or emer gency purposes to fund shareholder redemptions or for other short term liquidity purposes. The fund has agreed to pay commitment fees on its pro rata portion of the line of credit. During the period, there were no borrowings on this line of credit.
49 Annual Report
| Notes to Financial Statements continued |
6. Security Lending. | | |
The fund lends portfolio securities from time to time in order to earn additional income. On the settlement date of the loan, the fund receives collateral (in the form of U.S. Treasury obligations, letters of credit and/or cash) against the loaned securities and maintains collateral in an amount not less than 100% of the market value of the loaned securities during the period of the loan. The market value of the loaned securities is deter mined at the close of business of the fund and any additional required collateral is delivered to the fund on the next business day. If the borrower defaults on its obligation to return the securities loaned because of insolvency or other reasons, a fund could experience delays and costs in recovering the securities loaned or in gaining access to the collateral. Any cash collateral received is invested in the Fidelity Securities Lending Cash Central Fund. The value of loaned securities and cash collateral at period end are disclosed on the fund’s Statement of Assets and Liabilities. Security lending income represents the income earned on investing cash collateral, less fees and expenses associated with the loan, plus any premium payments that may be received on the loan of certain types of securities. Net income from lending portfolio securities during the period amounted to $7,896.
Many of the brokers with whom FMR places trades on behalf of the fund provided services to the fund in addition to trade execution. These services included payments of certain expenses on behalf of the fund totaling $111,757 for the period. In addition, through arrangements with the fund’s custodian, credits realized as a result of uninvested cash balances were used to reduce the fund’s expenses. During the period, these credits reduced the fund’s custody expenses by $831.
The fund’s organizational documents provide former and current trustees and officers with a limited indemnification against liabilities arising in connection with the performance of their duties to the fund. In the normal course of business, the fund may also enter into contracts that provide general indemnifications. The fund’s maximum exposure under these arrangements is unknown as this would be dependent on future claims that may be made against the fund. The risk of material loss from such claims is considered remote.
At the end of the period, FMR or its affiliates were the owners of record of 65% of the total outstanding shares of the fund and one otherwise unaffili ated shareholder was the owner of record of 19% of the total outstanding shares of the fund.
| 9. Distributions to Shareholders. | | | | | | |
| |
| Distributions to shareholders of each class were as follows: | | | | | | |
| |
| | | Years ended December 31, |
| | | 2005 | | | | 2004 |
| From net investment income | | | | | | |
| Initial Class | | $ 7,331,284 | | | $ | 6,005,122 |
| Service Class | | 507,567 | | | | 429,413 |
| Service Class 2 | | 877,840 | | | | 553,854 |
| Total | | $ 8,716,691 | | | $ | 6,988,389 |
| From net realized gain | | | | | | |
| Initial Class | | $ 200,857 | | | $ | — |
| Service Class | | 14,502 | | | | — |
| Service Class 2 | | 26,204 | | | | — |
| Total | | $ 241,563 | | | $ | — |
| 10. Share Transactions. | | | | | | | | | | | | |
| |
| Transactions for each class of shares were as follows: | | | | | | | | | | | | |
| |
| | | Shares | | | | Dollars |
| | | Years ended December 31, | | | | Years ended December 31, |
| | | 2005A | | 2004 | | | | 2005A | | | | 2004 |
| Initial Class | | | | | | | | | | | | |
| Shares sold | | 1,236,357 | | 2,035,766 | | | $ | 17,375,383 | | | $ | 28,145,848 |
| Reinvestment of distributions | | 539,938 | | 432,646 | | | | 7,532,140 | | | | 6,005,122 |
| Shares redeemed | | (3,374,047) | | (3,476,835) | | | | (47,380,600) | | | | (47,800,698) |
| Net increase (decrease) | | (1,597,752) | | (1,008,423) | | | $ | (22,473,077) | | | $ | (13,649,728) |
| Service Class | | | | | | | | | | | | |
| Shares sold | | 21,835 | | 95,487 | | | $ | 304,769 | | | $ | 1,311,596 |
| Reinvestment of distributions | | 37,586 | | 31,049 | | | | 522,069 | | | | 429,413 |
| Shares redeemed | | (309,945) | | (224,978) | | | | (4,318,560) | | | | (3,078,714) |
| Net increase (decrease) | | (250,524) | | (98,442) | | | $ | (3,491,722) | | | $ | (1,337,705) |
| Service Class 2 | | | | | | | | | | | | |
| Shares sold | | 692,036 | | 798,702 | | | $ | 9,651,143 | | | $ | 10,871,355 |
| Reinvestment of distributions | | 65,368 | | 40,193 | | | | 904,044 | | | | 553,854 |
| Shares redeemed | | (579,257) | | (377,301) | | | | (8,109,967) | | | | (5,127,412) |
| Net increase (decrease) | | 178,147 | | 461,594 | | | $ | 2,445,220 | | | $ | 6,297,797 |
| Investor Class | | | | | | | | | | | | |
| Shares sold | | 966,823 | | — | | | $ | 13,896,815 | | | $ | — |
| Shares redeemed | | (9,709) | | — | | | | (138,418) | | | | — |
| Net increase (decrease) | | 957,114 | | — | | | $ | 13,758,397 | | | $ | — |
A Share transactions for Investor Class are for the period July 21, 2005 (commencement of sale of shares) to December 31, 2005 | | | | | | | | | | |
51 Annual Report
Report of Independent Registered Public Accounting Firm
To the Trustees of Variable Insurance Products Fund III and Shareholders of VIP Balanced Portfolio:
We have audited the accompanying statement of assets and liabilities of VIP Balanced Portfolio (the Fund), a fund of Variable Insurance Products Fund III, including the schedule of investments as of December 31, 2005, and the related statement of operations for the year then ended, the state ment of changes in net assets for each of the two years in the period then ended, and the financial highlights for each of the five years in the period then ended. These financial statements and financial highlights are the responsibility of the Fund’s management. Our responsibility is to express an opinion on these financial statements and financial highlights based on our audits.
We conducted our audits in accordance with standards of the Public Company Accounting Oversight Board (United States). Those standards require that we plan and perform the audit to obtain reasonable assurance about whether the financial statements and financial highlights are free of material misstatement. The Fund is not required to have, nor were we engaged to perform, an audit of its internal control over financial reporting. Our audits included consideration of internal control over financial reporting as a basis for designing audit procedures that are appropriate in the circumstances, but not for the purpose of expressing an opinion on the effectiveness of the Fund’s internal control over financial reporting. Accordingly, we express no such opinion. An audit also includes examining, on a test basis, evidence supporting the amounts and disclosures in the financial statements, assessing the accounting principles used and significant estimates made by management, as well as evaluating the overall financial statement presentation. Our procedures included confirmation of securities owned as of December 31, 2005, by correspondence with the custodians and brokers; where replies were not received from brokers, we performed other auditing procedures. We believe that our audits provide a reasonable basis for our opinion.
In our opinion, the financial statements and financial highlights referred to above present fairly, in all material respects, the financial position of VIP Balanced Portfolio as of December 31, 2005, the results of its operations for the year then ended, the changes in its net assets for each of the two years in the period then ended, and its financial highlights for each of the five years in the period then ended, in conformity with accounting principles generally accepted in the United States of America.
/s/ Deloitte & Touche LLP
DELOITTE & TOUCHE LLP
Boston, Massachusetts
February 15, 2006
|
The Trustees, Member of the Advisory Board, and executive officers of the trust and fund, as applicable, are listed below. The Board of Trustees governs the fund and is responsible for protecting the interests of shareholders. The Trustees are experienced executives who meet periodically throughout the year to oversee the fund’s activities, review contractual arrangements with companies that provide services to the fund, and review the fund’s performance. Except for William O. McCoy and Albert R. Gamper, Jr., each of the Trustees oversees 326 funds advised by FMR or an affiliate. Mr. McCoy oversees 328 funds advised by FMR or an affiliate. Mr. Gamper oversees 235 funds advised by FMR or an affiliate.
The Trustees hold office without limit in time except that (a) any Trustee may resign; (b) any Trustee may be removed by written instrument, signed by at least two thirds of the number of Trustees prior to such removal; (c) any Trustee who requests to be retired or who has become inca pacitated by illness or injury may be retired by written instrument signed by a majority of the other Trustees; and (d) any Trustee may be removed at any special meeting of shareholders by a two thirds vote of the outstanding voting securities of the trust. Each Trustee who is not an interested person (as defined in the 1940 Act) (Independent Trustee), shall retire not later than the last day of the calendar year in which his or her 72nd birthday occurs. The Independent Trustees may waive this mandatory retirement age policy with respect to individual Trustees. The executive officers and Advisory Board Member hold office without limit in time, except that any officer and Advisory Board Member may resign or may be removed by a vote of a majority of the Trustees at any regular meeting or any special meeting of the Trustees. Except as indicated, each individual has held the office shown or other offices in the same company for the past five years.
The fund’s Statement of Additional Information (SAI) includes more information about the Trustees. To request a free copy, call Fidelity at 1-877-208-0098.
Interested Trustees*:
Correspondence intended for each Trustee who is an interested person may be sent to Fidelity Investments, 82 Devonshire Street, Boston, Massachusetts 02109.
| | Name, Age; Principal Occupation
Edward C. Johnson 3d (75)
|
Year of Election or Appointment: 1994
Mr. Johnson is Chairman of the Board of Trustees. Mr. Johnson serves as Chief Executive Officer, Chairman, and a Director of FMR Corp.; a Director and Chairman of the Board and of the Executive Committee of FMR; Chairman and a Director of Fidelity Man agement & Research (Far East) Inc.; Chairman and a Director of Fidelity Investments Money Management, Inc.; and Chairman (2001 present) and a Director (2000 present) of FMR Co., Inc.
Year of Election or Appointment: 2005
Mr. Jonas is Senior Vice President of VIP Balanced (2005 present). He also serves as Senior Vice President of other Fidelity funds (2005 present). Mr. Jonas is Executive Director of FMR (2005 present). Previously, Mr. Jonas served as President of Fidelity Enter prise Operations and Risk Services (2004 2005), Chief Administrative Officer (2002 2004), and Chief Financial Officer of FMR Co. (1998 2000). Mr. Jonas has been with Fidelity Investments since 1987 and has held various financial and management positions including Chief Financial Officer of FMR. In addition, he serves on the Boards of Boston Ballet (2003 present) and Simmons College (2003 present).
Year of Election or Appointment: 2003
Mr. Reynolds is a Director (2003 present) and Chief Operating Officer (2002 present) of FMR Corp. He also serves on the Board at Fidelity Investments Canada, Ltd. (2000 present). Previously, Mr. Reynolds served as President of Fidelity Investments Institutional Retirement Group (1996 2000).
* Trustees have been determined to be “Interested Trustees” by virtue of, among other things, their affiliation with the trust or various entities under common control with FMR.
53 Annual Report
Trustees and Officers - continued
Independent Trustees:
|
Correspondence intended for each Independent Trustee (that is, the Trustees other than the Interested Trustees) may be sent to Fidelity Investments, P.O. Box 55235, Boston, Massachusetts 02205-5235.
| | Name, Age; Principal Occupation
Dennis J. Dirks (57)
|
Year of Election or Appointment: 2005
Prior to his retirement in May 2003, Mr. Dirks was Chief Operating Officer and a member of the Board of The Depository Trust & Clearing Corporation (DTCC) (1999 2003). He also served as President, Chief Operating Officer, and Board member of The Depository Trust Company (DTC) (1999 2003) and President and Board member of the National Securities Clearing Corporation (NSCC) (1999 2003). In addition, Mr. Dirks served as Chief Executive Officer and Board member of the Government Securities Clearing Corporation (2001 2003) and Chief Executive Officer and Board member of the Mortgage Backed Securities Clearing Corporation (2001 2003). Mr. Dirks also serves as a Trustee of Manhattan College (2005 present).
| | Albert R. Gamper, Jr. (63)
|
Year of Election or Appointment: 2006
Mr. Gamper also serves as a Trustee (2006 present) or Member of the Advisory Board (2005 present) of other investment compa nies advised by FMR. Prior to his retirement in December 2004, Mr. Gamper served as Chairman of the Board of CIT Group Inc. (commercial finance). During his tenure with CIT Group Inc. Mr. Gamper served in numerous senior management positions, includ ing Chairman (1987 1989; 1999 2001; 2002 2004), Chief Executive Officer (1987 2004), and President (1989 2002). He currently serves as a member of the Board of Directors of Public Service Enterprise Group (utilities, 2001 present), Chairman of the Board of Governors, Rutgers University (2004 present), and Chairman of the Board of Saint Barnabas Health Care System.
Year of Election or Appointment: 1997
Dr. Gates is Chairman of the Independent Trustees (2006 present). Dr. Gates is President of Texas A&M University (2002 present). He was Director of the Central Intelligence Agency (CIA) from 1991 to 1993. From 1989 to 1991, Dr. Gates served as Assistant to the President of the United States and Deputy National Security Advisor. Dr. Gates is a Director of NACCO Industries, Inc. (mining and manufacturing), Parker Drilling Co., Inc. (drilling and rental tools for the energy industry, 2001 present), and Brinker International (restaurant management, 2003 present). Previously, Dr. Gates served as a Director of LucasVarity PLC (automotive components and diesel engines), a Director of TRW Inc. (automotive, space, defense, and information technology), and Dean of the George Bush School of Government and Public Service at Texas A&M University (1999 2001). Dr. Gates also is a Trustee of the Forum for International Policy.
Year of Election or Appointment: 2004
Dr. Heilmeier is Chairman Emeritus of Telcordia Technologies (communication software and systems), where prior to his retirement, he served as company Chairman and Chief Executive Officer. He currently serves on the Boards of Directors of The Mitre Corpo ration (systems engineering and information technology support for the government), and HRL Laboratories (private research and development, 2004 present). He is Chairman of the General Motors Science & Technology Advisory Board and a Life Fellow of the Institute of Electrical and Electronics Engineers (IEEE) (2000 present). Dr. Heilmeier is a member of the Defense Science Board and the National Security Agency Advisory Board. He is also a member of the National Academy of Engineering, the American Academy of Arts and Sciences, and the Board of Overseers of the School of Engineering and Applied Science of the University of Pennsylvania. Previously, Dr. Heilmeier served as a Director of TRW Inc. (automotive, space, defense, and information technology, 1992 2002), Compaq (1994 2002), Automatic Data Processing, Inc. (ADP) (technology based business outsourcing, 1995 2002), INET Technologies Inc. (telecommunications network surveillance, 2001 2004), and Teletech Holdings (customer management services). He is the recipient of the 2005 Kyoto Prize in Advanced Technology for his invention of the liquid display.
Year of Election or Appointment: 2001
Prior to Ms. Knowles’ retirement in June 2000, she served as Executive Vice President and Chief Financial Officer of Atlantic Richfield Company (ARCO) (diversified energy, 1996 2000). From 1993 to 1996, she was a Senior Vice President of ARCO and President of ARCO Transportation Company. She served as a Director of ARCO from 1996 to 1998. She currently serves as a Director of Phelps Dodge Corporation (copper mining and manufacturing) and McKesson Corporation (healthcare service, 2002 present). Ms. Knowles is a Trustee of the Brookings Institution and the Catalina Island Conservancy and also serves as a member of the Advisory Board for the School of Engineering of the University of Southern California.
Name, Age; Principal Occupation
Ned C. Lautenbach (61)
|
Year of Election or Appointment: 2000
Mr. Lautenbach has been a partner of Clayton, Dubilier & Rice, Inc. (private equity investment firm) since September 1998. Pre viously, Mr. Lautenbach was with the International Business Machines Corporation (IBM) from 1968 until his retirement in 1998. Mr. Lautenbach serves as a Director of Italtel Holding S.p.A. (telecommunications (Milan, Italy), 2004 present) and Eaton Corpora tion (diversified industrial) as well as the Philharmonic Center for the Arts in Naples, Florida. He also is a member of the Board of Trustees of Fairfield University (2005 present), as well as a member of the Council on Foreign Relations.
Year of Election or Appointment: 1997
Prior to his retirement in December 1994, Mr. McCoy was Vice Chairman of the Board of BellSouth Corporation (telecommu nications) and President of BellSouth Enterprises. He is currently a Director of Liberty Corporation (holding company), Duke Realty Corporation (real estate), and Progress Energy, Inc. (electric utility). He is also a partner of Franklin Street Partners (private invest ment management firm) and a member of the Research Triangle Foundation Board. In addition, Mr. McCoy served as the Interim Chancellor (1999 2000) and a member of the Board of Visitors for the University of North Carolina at Chapel Hill and currently serves on the Board of Directors of the University of North Carolina Health Care System and the Board of Visitors of the Kenan Flagler Business School (University of North Carolina at Chapel Hill). He also served as Vice President of Finance for the University of North Carolina (16 school system).
Year of Election or Appointment: 2005
Ms. Small is a member (2000 present) and Chairperson (2002 present) of the Investment Committee, and a member (2002 present) of the Board of Trustees of Smith College. Previously, she served as Chief Investment Officer (1999 2000), Director of Global Equity Investments (1996 1999), and a member of the Board of Directors of Scudder, Stevens & Clark (1990 1997) and Scudder Kemper Investments (1997 1998). In addition, Ms. Small served as Co Chair (2000 2003) of the Annual Fund for the Fletcher School of Law and Diplomacy.
William S. Stavropoulos (66)
|
Year of Election or Appointment: 2002
Mr. Stavropoulos is Chairman of the Board (2000 present) and a Member of the Board of Directors of The Dow Chemical Company. Since joining The Dow Chemical Company in 1967, Mr. Stavropoulos served in numerous senior management positions, including President (1993 2000; 2002 2003), CEO (1995 2000; 2002 2004), and Chairman of the Executive Committee (2000 2004). Currently, he is a Director of NCR Corporation (data warehousing and technology solutions), BellSouth Corporation (telecommu nications), Chemical Financial Corporation, Maersk Inc. (industrial conglomerate, 2002 present), and Metalmark Capital (private equity investment firm, 2005 present). He also serves as a member of the Board of Trustees of the American Enterprise Institute for Public Policy Research. In addition, Mr. Stavropoulos is a member of The Business Council, J.P. Morgan International Council and the University of Notre Dame Advisory Council for the College of Science.
Year of Election or Appointment: 2005
Prior to his retirement in 2001, Mr. Wolfe was Chairman and Chief Executive Officer of Hershey Foods Corporation (1993 2001). He currently serves as a member of the boards of Adelphia Communications Corporation (2003 present), Bausch & Lomb, Inc., and Revlon Inc. (2004 present).
55 Annual Report
Trustees and Officers - continued
|
Advisory Board Member and Executive Officers:
Correspondence intended for each executive officer and Mr. Lynch may be sent to Fidelity Investments, 82 Devonshire Street, Boston, Massachusetts 02109.
| | Name, Age; Principal Occupation
Peter S. Lynch (61)
|
Year of Election or Appointment: 2003
Member of the Advisory Board of Variable Insurance Products Fund III. Vice Chairman and a Director of FMR, and Vice Chairman (2001 present) and a Director (2000 present) of FMR Co., Inc. Previously, Mr. Lynch served as a Trustee of the Fidelity funds (1990 2003). In addition, he serves as a Trustee of Boston College, Massachusetts Eye & Ear Infirmary, Historic Deerfield, John F. Kennedy Library, and the Museum of Fine Arts of Boston.
Year of Election or Appointment: 2005
Vice President of VIP Balanced. Mr. Churchill also serves as Vice President of certain Equity Funds (2005 present) and certain High Income Funds (2005 present). Previously, he served as Head of Fidelity’s Fixed Income Division (2000 2005), Vice President of Fidelity’s Money Market Funds (2000 2005), Vice President of Fidelity’s Bond Funds, and Senior Vice President of FIMM (2000) and FMR. Mr. Churchill joined Fidelity in 1993 as Vice President and Group Leader of Taxable Fixed Income Investments.
Year of Election or Appointment: 2005
Vice President of VIP Balanced. Mr. Donovan also serves as Vice President of Fidelity’s High Income Funds (2005 present), Fidelity’s Fixed Income Funds (2005 present), certain Asset Allocation Funds (2005 present), and certain Balanced Funds (2005 present). Mr. Donovan also serves as Executive Vice President of FMR (2005 present) and FMRC (2005 present). Previously, Mr. Donovan served as Vice President and Director of Fidelity’s International Equity Trading group (1998 2005).
Year of Election or Appointment: 2005
Vice President of VIP Balanced. Mr. Murphy also serves as Vice President of Fidelity’s Money Market Funds (2002 present), certain Asset Allocation Funds (2003 present), Fidelity’s Investment Grade Bond Funds (2005 present), and Fidelity’s Balanced Funds (2005 present). He serves as Senior Vice President (2000 present) and Head (2004 present) of the Fidelity Investments Fixed Income Division. Mr. Murphy is also a Senior Vice President of FIMM (2003 present) and a Vice President of FMR (2000 present). Previously, Mr. Murphy served as Money Market Group Leader (2002 2004), Bond Group Leader (2000 2002), and Vice Presi dent of Fidelity’s Taxable Bond Funds (2000 2002) and Fidelity’s Municipal Bond Funds (2001 2002). Mr. Murphy joined Fidelity Investments in 1989 as a portfolio manager in the Bond Group.
Year of Election or Appointment: 2001
Vice President of VIP Balanced. Mr. O’Neil also serves as Vice President of other funds advised by FMR. Prior to assuming his current responsibilities, Mr. O’Neil worked as a research analyst and portfolio manager.
Year of Election or Appointment: 2005
Vice President of VIP Balanced. Mr. Rakers also serves as Vice President of other funds advised by FMR. Prior to assuming his current responsibilities, Mr. Rakers has worked as a research analyst and manager.
Year of Election or Appointment: 2005
Vice President of VIP Balanced. Mr. Silvia also serves as Vice President of Fidelity’s Bond Funds (2005 present), certain Balanced Funds (2005 present), certain Asset Allocation Funds (2005 present), and Senior Vice President and Bond Group Leader of the Fidelity Investments Fixed Income Division (2005 present). Previously, Mr. Silvia served as Director of Fidelity’s Taxable Bond port folio managers (2002 2004) and a portfolio manager in the Bond Group (1997 2004).
Year of Election or Appointment: 1998
Secretary of VIP Balanced. He also serves as Secretary of other Fidelity funds; Vice President, General Counsel, and Secretary of FMR Co., Inc. (2001 present) and FMR; Assistant Secretary of Fidelity Management & Research (U.K.) Inc. (2001 present), Fidelity Management & Research (Far East) Inc. (2001 present), and Fidelity Investments Money Management, Inc. (2001 present). Mr. Roiter is an Adjunct Member, Faculty of Law, at Boston College Law School (2003 present). Previously, Mr. Roiter served as Vice President and Secretary of FDC (1998 2005).
Name, Age; Principal Occupation
|
Year of Election or Appointment: 2003
Assistant Secretary of VIP Balanced. Mr. Fross also serves as Assistant Secretary of other Fidelity funds (2003 present), Vice President and Secretary of FDC (2005 present), and is an employee of FMR.
Year of Election or Appointment: 2004
President, Treasurer, and Anti Money Laundering (AML) officer of VIP Balanced. Ms. Reynolds also serves as President, Treasurer, and AML officer of other Fidelity funds (2004) and is a Vice President (2003) and an employee (2002) of FMR. Before joining Fidelity Investments, Ms. Reynolds worked at PricewaterhouseCoopers LLP (PwC) (1980 2002), where she was most recently an audit partner with PwC’s investment management practice.
Year of Election or Appointment: 2005
Chief Financial Officer of VIP Balanced. Mr.Murphy also serves as Chief Financial Officer of other Fidelity funds (2005 present). He also serves as Senior Vice President of Fidelity Pricing and Cash Management Services Group (FPCMS).
Kenneth A. Rathgeber (58)
|
Year of Election or Appointment: 2004
Chief Compliance Officer of VIP Balanced. Mr. Rathgeber also serves as Chief Compliance Officer of other Fidelity funds (2004) and Executive Vice President of Risk Oversight for Fidelity Investments (2002). Previously, he served as Executive Vice President and Chief Operating Officer for Fidelity Investments Institutional Services Company, Inc. (1998 2002).
Year of Election or Appointment: 2003
Deputy Treasurer of VIP Balanced. Mr. Hebble also serves as Deputy Treasurer of other Fidelity funds (2003), and is an employee of FMR. Before joining Fidelity Investments, Mr. Hebble worked at Deutsche Asset Management where he served as Director of Fund Accounting (2002 2003) and Assistant Treasurer of the Scudder Funds (1998 2003).
Year of Election or Appointment: 2005
Deputy Treasurer of VIP Balanced. Mr. Mehrmann also serves as Deputy Treasurer of other Fidelity funds (2005 present) and is an employee of FMR. Previously, Mr. Mehrmann served as Vice President of Fidelity Investments Institutional Services Group (FIIS)/Fidelity Investments Institutional Operations Corporation, Inc. (FIIOC) Client Services (1998 2004).
Kimberley H. Monasterio (42)
|
Year of Election or Appointment: 2004
Deputy Treasurer of VIP Balanced. Ms. Monasterio also serves as Deputy Treasurer of other Fidelity funds (2004) and is an employee of FMR (2004). Before joining Fidelity Investments, Ms. Monasterio served as Treasurer (2000 2004) and Chief Financial Officer (2002 2004) of the Franklin Templeton Funds and Senior Vice President of Franklin Templeton Services, LLC (2000 2004).
Year of Election or Appointment: 2005
Deputy Treasurer of VIP Balanced. Mr. Robins also serves as Deputy Treasurer of other Fidelity funds (2005 present) and is an employee of FMR (2004 present). Before joining Fidelity Investments, Mr. Robins worked at KPMG LLP, where he was a partner in KPMG’s department of professional practice (2002 2004) and a Senior Manager (1999 2000). In addition, Mr. Robins served as Assistant Chief Accountant, United States Securities and Exchange Commission (2000 2002).
Year of Election or Appointment: 2005
Assistant Treasurer of VIP Balanced. Mr. Byrnes also serves as Assistant Treasurer of other Fidelity funds (2005 present) and is an employee of FMR (2005 present). Previously, Mr. Byrnes served as Vice President of FPCMS (2003 2005). Before joining Fidelity Investments, Mr. Byrnes worked at Deutsche Asset Management where he served as Vice President of the Investment Operations Group (2000 2003).
Year of Election or Appointment: 1995
Assistant Treasurer of VIP Balanced. Mr. Costello also serves as Assistant Treasurer of other Fidelity funds and is an employee of FMR.
57 Annual Report
Trustees and Officers - continued
|
| | Name, Age; Principal Occupation
Peter L. Lydecker (51)
|
Year of Election or Appointment: 2004
Assistant Treasurer of VIP Balanced. Mr. Lydecker also serves as Assistant Treasurer of other Fidelity funds (2004) and is an employee of FMR.
Year of Election or Appointment: 2002
Assistant Treasurer of VIP Balanced. Mr. Osterheld also serves as Assistant Treasurer of other Fidelity funds (2002) and is an employee of FMR.
Year of Election or Appointment: 2005
Assistant Treasurer of VIP Balanced. Mr. Ryan also serves as Assistant Treasurer of other Fidelity funds (2005 present) and is an employee of FMR (2005 present). Previously, Mr. Ryan served as Vice President of Fund Reporting in FPCMS (1999 2005).
Year of Election or Appointment: 2005
Assistant Treasurer of VIP Balanced. Mr. Schiavone also serves as Assistant Treasurer of other Fidelity funds (2005 present) and is an employee of FMR (2005 present). Before joining Fidelity Investments, Mr. Schiavone worked at Deutsche Asset Management, where he most recently served as Assistant Treasurer (2003 2005) of the Scudder Funds and Vice President and Head of Fund Reporting (1996 2003).
The Board of Trustees of VIP III Balanced Portfolio voted to pay to shareholders of record at the opening of business on record date, the following distributions per share derived from capital gains realized from sales of portfolio securities, and dividends derived from net investment income:
| | | Pay Date | | Record Date | | Dividends | | Capital Gains |
| Initial Class | | 2/10/06 | | 2/10/06 | | $.306 | | $.50 |
| Service Class | | 2/10/06 | | 2/10/06 | | $.289 | | $.50 |
| Service Class 2 | | 2/10/06 | | 2/10/06 | | $.272 | | $.50 |
| Investor Class | | 2/10/06 | | 2/10/06 | | $.313 | | $.50 |
The fund hereby designates as a capital gain dividend with respect to the taxable year ended December 31, 2005, $11,747,332, or, if subse quently determined to be different, the net capital gain of such year.
A total of 6.7% of the dividends distributed during the fiscal year was derived from interest on U.S. Government securities which is generally exempt from state income tax.
Initial Class designates 44%; Service Class designates 46%; and Service Class 2 designates 48% of the dividends distributed in February 2005 during the fiscal year as qualifying for the dividends received deduction for corporate shareholders.
The fund will notify shareholders in January 2006 of amounts for use in preparing 2005 income tax returns.
59 Annual Report
Board Approval of Investment Advisory Contracts and Management Fees
Each year, typically in July, the Board of Trustees, including the independent Trustees (together, the Board), votes on the renewal of the management contract and sub advisory agreements (together, the Advisory Contracts) for the fund. The Board, assisted by the advice of fund counsel and indepen dent Trustees’ counsel, requests and considers a broad range of information throughout the year.
The Board meets regularly each month except August and takes into account throughout the year matters bearing on Advisory Contracts. The Board, acting directly and through its separate committees, considers at each of its meetings factors that are relevant to the annual renewal of the fund’s Advisory Contracts, including the services and support provided to the fund and its shareholders by Fidelity. At the time of the renewal, the Board had 11 standing committees, each composed of independent Trustees with varying backgrounds, to which the Board has assigned specific subject matter responsibilities in order to enhance effective decision making by the Board. Each committee has adopted a written charter outlining the structure and purposes of the committee. One such committee, the Equity Contract Committee, meets periodically during the first six months of each year and as necessary to consider matters specifically related to the annual renewal of Advisory Contracts. The committee requests and receives information on, and makes recommendations to the independent Trustees concerning, the approval and annual review of the Advisory Contracts.
At its July 2005 meeting, the Board of Trustees, including the independent Trustees, unanimously determined to renew the Advisory Contracts for the fund. In reaching its determination, the Board considered all factors it believed relevant, including (1) the nature, extent, and quality of the services to be provided to the fund and its shareholders by Fidelity (including the investment performance of the fund); (2) the competitiveness of the manage ment fee and total expenses of the fund; (3) the total costs of the services to be provided by and the profits to be realized by the investment adviser and its affiliates from the relationship with the fund; (4) the extent to which economies of scale would be realized as the fund grows; and (5) whether fee levels reflect these economies of scale, if any, for the benefit of fund shareholders.
In determining whether to renew the Advisory Contracts for the fund, the Board ultimately reached a determination, with the assistance of fund counsel and independent Trustees’ counsel, that the renewal of the Advisory Contracts and the compensation to be received by Fidelity under the management contract is consistent with Fidelity’s fiduciary duty under applicable law. In addition to evaluating the specific factors noted above, the Board, in reaching its determination, is aware that shareholders in the fund have a broad range of investment choices available to them, including a wide choice among mutual funds offered by competitors to Fidelity, and that the fund’s shareholders, with the opportunity to review and weigh the disclosure provided by the fund in its prospectus and other public disclosures, have chosen to invest in this fund, managed by Fidelity.
Nature, Extent, and Quality of Services Provided by Fidelity. The Board considered staffing within the investment adviser, FMR, and the sub advisers (together, the Investment Advisers), including the backgrounds of the fund’s portfolio managers and the fund’s investment objective and discipline. The independent Trustees also had discussions with senior management of Fidelity’s investment operations and investment groups. The Board considered the structure of the portfolio manager compensation program and whether this structure provides appropriate incentives.
Fidelity Resources Dedicated to Investment Management and Support Services. The Board reviewed the size, education, and experience of the Invest ment Advisers’ investment staff, their use of technology, and the Investment Advisers’ approach to recruiting, training, and retaining portfolio managers and other research, advisory, and management personnel. The Board considered Fidelity’s extensive global research capabilities that enable the Investment Advisers to aggregate data from various sources in an effort to produce positive investment results. The Board noted that Fidelity’s analysts have access to a variety of technological tools that enable them to perform both fundamental and quantitative analysis and to specialize in various disciplines. The Board also considered that Fidelity’s portfolio managers and analysts have access to daily portfolio attribution that allows for monitor ing of a fund’s portfolio, as well as an electronic communication system that provides immediate real time access to research concerning issuers and credit enhancers.
Shareholder and Administrative Services. The Board considered the nature, extent, quality, and cost of administrative, distribution, and shareholder services performed by the Investment Advisers and their affiliates under the Advisory Contracts and under separate agreements covering transfer agency, pricing and bookkeeping, and securities lending services for the fund. The Board also considered the nature and extent of the Investment Advisers’ supervision of third party service providers, principally custodians and subcustodians. The Board reviewed the allocation of fund brokerage, including allocations to brokers affiliated with the Investment Advisers, the use of brokerage commissions to pay fund expenses, and the use of “soft” commission dollars to pay for research services. The Board also considered that Fidelity voluntarily decided in 2004 to stop using “soft” commission dollars to pay for market data and, instead, to pay for that data out of its own resources. The Board also considered the resources devoted to, and the record of compliance with, the fund’s compliance policies and procedures.
The Board noted that the growth of fund assets across the complex allows Fidelity to reinvest in the development of services designed to enhance the value or convenience of the Fidelity funds as investment vehicles. These services include 24 hour access to account information and market informa tion through phone representatives and over the Internet, and investor education materials and asset allocation tools.
Investment in a Large Fund Family. The Board considered the benefits to shareholders of investing in a Fidelity fund, including the benefits of investing in a fund that is part of a large family of funds offering a variety of investment disciplines and providing for a large variety of mutual fund investor services. The Board noted that, since the last Advisory Contract renewals in July 2004, Fidelity has taken a number of actions that benefited particular
funds, including (i) voluntarily deciding in 2004 to stop using “soft” commission dollars to pay for market data and, instead, to pay for that data out of its own resources, (ii) contractually agreeing to impose management fee reductions and expense limitations on its five Spartan stock index funds and its stock index fund available through variable insurance products, (iii) contractually agreeing to eliminate the management fees on the Fidelity Freedom Funds and the Fidelity Advisor Freedom Funds, (iv) contractually agreeing to reduce the management fees on most of its investment grade taxable bond funds, and (v) contractually agreeing to impose expense limitations on its retail and Spartan investment grade taxable bond funds.
Investment Performance and Compliance. The Board considered whether the fund has operated within its investment objective, as well as its record of compliance with its investment restrictions. It also reviewed the fund’s absolute investment performance for each class, as well as the fund’s relative investment performance for each class measured against (i) a proprietary custom index, and (ii) a peer group of mutual funds deemed appropriate by the Board over multiple periods. The following charts considered by the Board show, over the one , three , and five year periods ended December 31, 2004, the returns of Service Class and Initial Class of the fund, the returns of a proprietary custom index (“benchmark”), and a range of returns of a peer group of mutual funds identified by Lipper Inc. as having an investment objective similar to that of the fund. The returns of Service Class and Initial Class represent the performance of classes with high and low 12b 1 fees, respectively (not necessarily with the highest and lowest total expenses). (Unlike Service Class, Service Class 2, which has a higher 12b 1 fee than Service Class, did not have five years of performance as of Decem ber 31, 2004.) The box within each chart shows the 25th percentile return (bottom of box) and the 75th percentile return (top of box) of the Lipper peer group. Returns shown above the box are in the first quartile and returns shown below the box are in the fourth quartile. The percentage beaten numbers noted below each chart correspond to the percentile box and represent the percentage of funds in the Lipper peer group whose performance was equal to or lower than that of the class indicated. The fund’s proprietary custom index is an index developed by FMR that represents the fund’s general investment categories in both equity and bond securities.
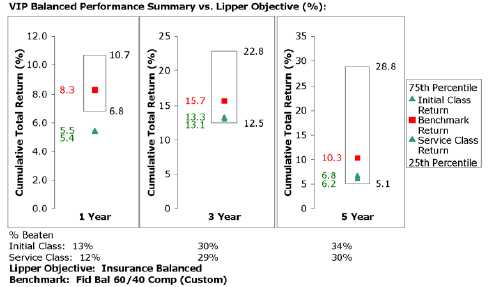
The Board reviewed the fund’s relative investment performance against its Lipper peer group and stated that the performance of Initial Class of the fund was in the fourth quartile for the one year period and the third quartile for the three and five year periods. The Board also stated that the relative investment performance of the fund was lower than its benchmark over time. The Board considered that the variations in performance among the fund’s classes reflect the variations in class expenses, which result in lower performance for higher expense classes. The Board discussed with FMR actions to be taken by FMR to improve the fund’s disappointing performance.
The Board has had thorough discussions with FMR throughout the year about the Board’s and FMR’s concerns about equity research, equity fund performance, and compliance with internal policies governing gifts and entertainment. FMR has taken steps that it believes will refocus and strengthen equity research and equity portfolio management and compliance. The Board noted with favor FMR’s recent reorganization of its senior management team and FMR’s plans to dedicate additional resources to investment research, and participated in the process that led to those changes.
Based on its review, and giving particular weight to the nature and quality of the resources dedicated by the Investment Advisers to maintain and improve relative performance, the Board concluded that the nature, extent, and quality of the services provided by Fidelity will benefit the fund’s shareholders, particularly in light of the Board’s view that the fund’s shareholders benefit from investing in a fund that is part of a large family of funds offering a variety of investment disciplines and services.
Competitiveness of Management Fee and Total Fund Expenses. The Board considered the fund’s management fee and total expenses compared to “mapped groups” of competitive funds and classes. Fidelity creates “mapped groups” by combining similar Lipper investment objective categories that have comparable management fee characteristics. Combining Lipper investment objective categories aids the Board’s management fee
61 Annual Report
Board Approval of Investment Advisory Contracts and Management Fees - continued
and total expense comparisons by broadening the competitive group used for comparison and by reducing the number of universes to which various Fidelity funds are compared.
The Board considered two proprietary management fee comparisons for the 12 month periods shown in the chart below. The group of Lipper funds used by the Board for management fee comparisons is referred to below as the “Total Mapped Group” and, for the reasons explained above, is broader than the Lipper peer group used by the Board for performance comparisons. The Total Mapped Group comparison focuses on a fund’s standing relative to the total universe of comparable funds available to investors, in terms of gross management fees before expense reimbursements or caps. “TMG %” represents the percentage of funds in the Total Mapped Group that had management fees that were lower than the fund’s. For example, a TMG % of 13% means that 87% of the funds in the Total Mapped Group had higher management fees than the fund. The “Asset Size Peer Group” (ASPG) comparison focuses on a fund’s standing relative to non Fidelity funds similar in size to the fund within the Total Mapped Group. The ASPG represents at least 15% of the funds in the Total Mapped Group with comparable asset size and management fee characteristics, subject to a minimum of 50 funds (or all funds in the Total Mapped Group if fewer than 50). Additional information, such as the ASPG quartile (“quadrant”) in which the fund’s management fee ranked, is also included in the chart and considered by the Board.
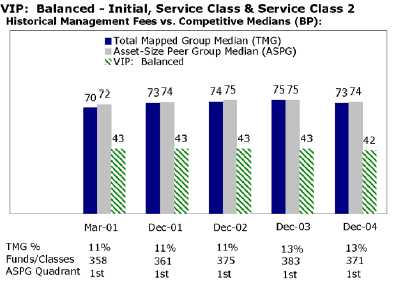
The Board noted that the fund’s management fee ranked below the median of its Total Mapped Group and below the median of its ASPG for 2004.
Based on its review, the Board concluded that the fund’s management fee was fair and reasonable in light of the services that the fund receives and the other factors considered.
In its review of each class’s total expenses, the Board considered the fund’s management fee as well as other fund or class expenses, as applicable, such as transfer agent fees, pricing and bookkeeping fees, fund paid 12b 1 fees, and custodial, legal, and audit fees. The Board also noted the effects of any waivers and reimbursements on fees and expenses. As part of its review, the Board also considered current and historical total expenses of each class of the fund compared to competitive fund median expenses. Each class of the fund is compared to those funds and classes in the Total Mapped Group (used by the Board for management fee comparisons) that have a similar sales load structure.
The Board noted that each class’s total expenses ranked below its competitive median for 2004.
In its review of total expenses, the Board also considered Fidelity fee structures and other information on clients that FMR and its affiliates service in other competitive markets, such as other mutual funds advised or subadvised by FMR or its affiliates, pension plan clients, and other institutional clients.
Based on its review, the Board concluded that the total expenses for each class of the fund were reasonable in light of the services that the fund and its shareholders receive and the other factors considered.
Costs of the Services and Profitability. The Board considered the revenues earned and the expenses incurred by Fidelity in conducting the busi ness of developing, marketing, distributing, managing, administering and servicing the fund and its shareholders. The Board also considered the level of Fidelity’s profits in respect of all the Fidelity funds.
On an annual basis, FMR presents to the Board Fidelity’s profitability for the fund. Fidelity calculates the profitability for each fund, as well as aggregate profitability for groups of Fidelity funds and all Fidelity funds, using a series of detailed revenue and cost allocation methodologies which originate with the audited books and records of Fidelity. The Audit Committee of the Board reviews any significant changes from the prior year’s methodologies.
PricewaterhouseCoopers LLP (PwC), independent registered accounting firm and auditor to Fidelity and certain Fidelity funds, has been engaged annually by the Board as part of the Board’s assessment of the results of Fidelity’s profitability analysis. PwC’s engagement includes the review and assessment of Fidelity’s methodologies used in determining the revenues and expenses attributable to Fidelity’s mutual fund business, and completion of agreed upon procedures surrounding the mathematical accuracy of fund profitability and its conformity to allocation methodologies. After consider ing PwC’s reports issued under the engagement and information provided by Fidelity, the Board believes that while other allocation methods may also be reasonable, Fidelity’s profitability methodologies are reasonable in all material respects.
The Board has also reviewed Fidelity’s non fund businesses and any fall out benefits related to the mutual fund business as well as cases where Fidelity’s affiliates may benefit from or be related to the fund’s business. In addition, a special committee of the Board reviewed services provided to Fidelity by its affiliates and determined that the fees that Fidelity paid for such services were reasonable.
The Board considered the costs of the services provided by and the profits realized by Fidelity in connection with the operation of the fund and deter mined that the amount of profit is a fair entrepreneurial profit for the management of the fund.
Economies of Scale. The Board considered whether there have been economies of scale in respect of the management of the Fidelity funds, whether the Fidelity funds (including the fund) have appropriately benefited from any such economies of scale, and whether there is potential for realization of any further economies of scale. The Board considered the extent to which the fund will benefit from economies of scale through increased services to the fund, through waivers or reimbursements, or through fee or expense reductions.
The Board recognized that the fund’s management contract incorporates a “group fee” structure, which provides for lower fee rates as total fund assets under FMR’s management increase, and for higher fee rates as total fund assets under FMR’s management decrease. The Board considered that the group fee is designed to deliver the benefits of economies of scale to fund shareholders when total fund assets increase, even if assets of any particular fund are unchanged or have declined, because some portion of Fidelity’s costs are attributable to services provided to all Fidelity funds, and all funds benefit if those costs can be allocated among more assets. The Board concluded that, given the group fee structure, fund shareholders will achieve a certain level of economies of scale as assets under FMR’s management increase at the fund complex level, regardless of whether Fidelity achieves any such economies of scale.
The Board further concluded that any potential economies of scale are being shared between fund shareholders and Fidelity in an appropriate manner.
Additional Information Requested by the Board. In order to develop fully the factual basis for consideration of the Advisory Contracts, the Board requested additional information regarding (i) equity fund transfer agency fees; (ii) Fidelity’s fund profitability methodology and the impact of various changes in the methodology over time; (iii) benefits to shareholders from economies of scale; (iv) composition and characteristics of various fund and industry data used in comparisons; and (v) compensation of portfolio managers and research analysts.
Based on its evaluation of all of the conclusions noted above, and after considering all material factors, the Board ultimately concluded that the exist ing advisory fee structures are fair and reasonable, and that the fund’s existing Advisory Contracts should be renewed.
63 Annual Report
Investment Adviser
Fidelity Management & Research Company
Boston, MA
Investment Sub Advisers
FMR Co., Inc.
Fidelity Investments Money Management, Inc.
Fidelity Management & Research (U.K.) Inc.
Fidelity Management & Research (Far East) Inc.
Fidelity Investments Japan Limited
Fidelity International Investment Advisors
Fidelity International Investment Advisors (U.K.) Limited
General Distributor
Fidelity Distributors Corporation
Boston, MA
Transfer and Service Agents
Fidelity Investments Institutional Operations Co., Inc.
Boston, MA
Fidelity Service Company, Inc.
Boston, MA
Custodian
JPMorgan Chase Bank
New York, NY
|
VIPBAL ANN 0206
1.540208.108
|
Fidelity® Variable Insurance Products:
Dynamic Capital Appreciation Portfolio
|

Annual Report
December 31, 2005
|

| Contents | | | | |
| |
| Performance | | 3 | | How the fund has done over time. |
| Management’s Discussion | | 4 | | The manager’s review of fund performance, strategy and |
| | | | | outlook. |
| Shareholder Expense Example | | 5 | | An example of shareholder expenses. |
| Investment Changes | | 6 | | A summary of major shifts in the fund’s investments over the |
| | | | | past six months. |
| Investments | | 7 | | A complete list of the fund’s investments with their |
| | | | | market values. |
| Financial Statements | | 13 | | Statements of assets and liabilities, operations, and |
| | | | | changes in net assets, as well as financial highlights. |
| Notes | | 17 | | Notes to the financial statements. |
| Report of Independent Registered Public | | 21 | | |
| Accounting Firm | | | | |
| Trustees and Officers | | 22 | | |
| Board Approval of Investment Advisory | | 27 | | |
| Contracts and Management Fees | | | | |
| | To view a fund’s proxy voting guidelines and proxy voting record for the 12 month period ended June 30, visit www.fidelity.com/proxyvotingresults or visit the
Securities and Exchange Commission’s (SEC) web site at www.sec.gov. You may also call 1-877-208-0098 to request a free copy of the proxy voting guidelines.
Fidelity Variable Insurance Products are separate account options which are purchased through a variable insurance contract.
Standard & Poor’s, S&P and S&P 500 are registered service marks of The McGraw Hill Companies, Inc. and have been licensed for use by
Fidelity Distributors Corporation.
Other third party marks appearing herein are the property of their respective owners.
All other marks appearing herein are registered or unregistered trademarks or service marks of FMR Corp. or an affiliated company.
|
| | This report and the financial statements contained herein are submitted for the general information of the shareholders of the fund. This report is not authorized for
distribution to prospective investors in the fund unless preceded or accompanied by an effective prospectus.
A fund files its complete schedule of portfolio holdings with the SEC for the first and third quarters of each fiscal year on Form N Q. Forms N Q are available on the SEC’s
web site at http://www.sec.gov. A fund’s Forms N Q may be reviewed and copied at the SEC’s Public Reference Room in Washington, DC. Information regarding the
operation of the SEC’s Public Reference Room may be obtained by calling 1-800-SEC-0330. For a complete list of a fund’s portfolio holdings, view the most recent
quarterly holdings report, semiannual report, or annual report on Fidelity’s web site at http://www.advisor.fidelity.com.
NOT FDIC INSURED · MAY LOSE VALUE · NO BANK GUARANTEE
Neither the fund nor Fidelity Distributors Corporation is a bank.
|
VIP Dynamic Capital Appreciation Portfolio 2
| | VIP Dynamic Capital Appreciation Portfolio
Performance: The Bottom Line
|
Average annual total return reflects the change in the value of an investment, assuming reinvestment of the class’ dividend income and capital gains (the profits earned upon the sale of securities that have grown in value) and assuming a constant rate of performance each year. During periods of reimbursement by Fidelity, a fund’s total return will be greater than it would be had the reimbursement not occurred. Performance numbers are net of all underlying fund operating expenses, but do not include any insurance charges imposed by your insurance company’s separate account. If performance information included the effect of these additional charges, the total returns would have been lower. How a fund did yesterday is no guarantee of how it will do tomorrow.
| Average Annual Total Returns | | | | | | |
| Periods ended December 31, 2005 | | Past 1 | | Past 5 | | Life of |
| | | year | | years | | fund |
| VIP Dynamic Capital Appreciation — Initial ClassA | | 21.14% | | 0.50% | | 2.53% |
| VIP Dynamic Capital Appreciation — Service ClassB | | 20.98% | | 0.36% | | 2.66% |
| VIP Dynamic Capital Appreciation — Service Class 2C | | 20.68% | | 0.20% | | 2.81% |
| VIP Dynamic Capital Appreciation — Investor ClassD | | 21.14% | | 0.50% | | 2.53% |
A From September 25, 2000.
B The initial offering of Service Class shares took place on September 25, 2000. Performance for Service Class shares reflects an asset based service fee (12b 1 fee).
C The initial offering of Service Class 2 shares took place on September 25, 2000. Performance for Service Class 2 shares reflects an asset based service fee (12b 1 fee).
D The initial offering of Investor Class shares took place on July 21, 2005. Returns prior to July 21, 2005 are those of Initial Class. If Investor Class’s transfer agent fee had
been reflected, returns prior to July 21, 2005 would have been lower.
|
$10,000 Over Life of Fund
Let’s say hypothetically that $10,000 was invested in VIP Dynamic Capital Appreciation Portfolio Initial Class on September 25, 2000, when the fund started. The chart shows how the value of your investment would have changed, and also shows how the Standard & Poor’s 500SM Index performed over the same period.

3 Annual Report
VIP Dynamic Capital Appreciation Portfolio
Management’s Discussion of Fund Performance
|
Comments from Fergus Shiel, who became Portfolio Manager of VIP Dynamic Capital Appreciation Portfolio on September 30, 2005
U.S. equity benchmarks generally had positive results for the 12 months ending December 31, 2005, the third consecutive year that stocks finished in the black. Energy and utilities were the two best performing sectors, contributing greatly to the 4.91% gain of the Standard & Poor’s 500SM Index. Elsewhere, the NASDAQ Composite® Index returned 2.13%, while the Dow Jones Industrial AverageSM rose 1.72% . The U.S. economy did not decelerate as much as many had predicted, despite eight short term interest rate hikes, record high energy prices and the devastation caused by Hurricane Katrina. Meanwhile, corporate America notched its 14th consecutive quarter of double digit earnings gains through the third quarter of the year, an unprecedented streak in market history. From a style perspective, large cap stocks ended the six year reign of small caps by a narrow margin, but mid caps finished well ahead of both categories. The gap between growth and value stocks also was relatively narrow, with value gaining a slight edge.
During the past year, the fund more than quadrupled the return of the S&P 500® and also significantly outperformed the 7.10% mark of the LipperSM Variable Annuity Capital Appreciation Funds Average. (For specific portfolio performance results, please refer to the performance section of this report.)
After taking the helm in September, I made the fund less concentrated due to my concern about the market’s higher valuations and my desire to spread risk among a larger number of holdings. The fund’s sector positioning also changed fairly significantly as a result of where I saw the most attractive investments. Our top contributor and largest holding for most of the period was Internet search engine provider Google, whose stock bene fited from gains in the company’s share of the paid search market. In large part due to Google, information technology was one of the fund’s top contributing sectors relative to the index. However, the top contributing sector was energy, which added value because of both the fund’s sizable overweighting and adept stock picking. Also helpful were our results in health care, telecommunication services and consumer discretionary. In the latter sector, women’s clothing retailer Chico’s FAS was a significant contributor, aided by robust increases in same store sales. Another holding adding value was HMO UnitedHealth Group, which continued to enjoy solid earnings growth from a combination of rising premiums and effective cost cutting. Property and casualty insurer American International Group (AIG) was the largest detractor, as the stock suffered from negative publicity surrounding accounting issues and the forced departure of the company’s CEO. Also holding back performance was Canada based Research In Motion. Legal disputes about patents for the company’s BlackBerry handheld personal messaging device sidetracked the stock. I sold both AIG and Research In Motion by period end.
The views expressed in this statement reflect those of the portfolio manager only through the end of the period of the report as stated on the cover and do not necessarily represent the views of Fidelity or any other person in the Fidelity organization. Any such views are subject to change at any time based upon market or other conditions and Fidelity disclaims any responsibility to update such views. These views may not be relied on as invest ment advice and, because investment decisions for a Fidelity fund are based on numerous factors, may not be relied on as an indication of trading intent on behalf of any Fidelity fund.
VIP Dynamic Capital Appreciation Portfolio 4
VIP Dynamic Capital Appreciation Portfolio
Shareholder Expense Example
|
As a shareholder of the Fund, you incur two types of costs: (1) transaction costs, and (2) ongoing costs, including management fees, distribution and/or service (12b 1) fees and other Fund expenses. This Example is intended to help you understand your ongoing costs (in dollars) of investing in the Fund and to compare these costs with the ongoing costs of investing in other mutual funds.
The actual expense Example is based on an investment of $1,000 invested at the beginning of the period and held for the entire period (July 1, 2005 to December 31, 2005) for Initial Class, Service Class and Service Class 2 and for the entire period (July 21, 2005 to December 31, 2005) for Investor Class. The hypothetical expense Example is based on an investment of $1,000 invested for the one half year period (July 1, 2005 to December 31, 2005).
Actual Expenses
The first line of the table below for each class of the Fund provides information about actual account values and actual expenses. You may use the information in this line, together with the amount you invested, to estimate the expenses that you paid over the period. Simply divide your account value by $1,000.00 (for example, an $8,600 account value divided by $1,000.00 = 8.6), then multiply the result by the number in the first line for a class of the Fund under the heading entitled “Expenses Paid During Period” to estimate the expenses you paid on your account during this period. The estimate of expenses does not include any fees or other expenses of any variable annuity or variable life insurance product. If they were, the estimate of expenses you paid during the period would be higher, and your ending account value would be lower.
Hypothetical Example for Comparison Purposes
The second line of the table below for each class of the Fund provides information about hypothetical account values and hypothetical expenses based on a Class’ actual expense ratio and an assumed rate of return of 5% per year before expenses, which is not the Class’ actual return. The hypothetical account values and expenses may not be used to estimate the actual ending account balance or expenses you paid for the period. You may use this information to compare the ongoing costs of investing in the Fund and other funds. To do so, compare this 5% hypothetical example with the 5% hypothetical examples that appear in the shareholder reports of the other funds. The estimate of expenses does not include any fees or other expenses of any variable annuity or variable life insurance product. If they were, the estimate of expenses you paid during the period would be higher, and your ending account value would be lower.
Please note that the expenses shown in the table are meant to highlight your ongoing costs only and do not reflect any transaction costs. Therefore, the second line of the table is useful in comparing ongoing costs only, and will not help you determine the relative total costs of owning different funds.
| | | | | Ending | | | | |
| | | Beginning | | Account Value | | | | Expenses Paid |
| | | Account Value | | December 31, 2005 | | | | During Period |
| Initial Class | | | | | | | | |
| Actual | | $ 1,000.00 | | $ 1,159.80 | | | | $ 4.63B |
| HypotheticalA | | $ 1,000.00 | | $ 1,020.92 | | | | $ 4.33C |
| Service Class | | | | | | | | |
| Actual | | $ 1,000.00 | | $ 1,158.00 | | | | $ 5.17B |
| HypotheticalA | | $ 1,000.00 | | $ 1,020.42 | | | | $ 4.84C |
| Service Class 2 | | | | | | | | |
| Actual | | $ 1,000.00 | | $ 1,156.30 | | | | $ 5.98B |
| HypotheticalA | | $ 1,000.00 | | $ 1,019.66 | | | | $ 5.60C |
| Investor Class | | | | | | | | |
| Actual | | $ 1,000.00 | | $ 1,103.90 | | | | $ 4.73B |
| HypotheticalA | | $ 1,000.00 | | $ 1,020.16 | | | | $ 5.09C |
A 5% return per year before expenses
B Actual expenses are equal to each Class’ annualized expense ratio (shown in the table below); multiplied by the average account value
over the period, multiplied by 184/365 (to reflect the one half year period) for Initial Class, Service Class and Service Class 2 and multiplied
by 164/365 (to reflect the period July 21, 2005 to December 31, 2005) for Investor Class.
C Hypothetical expenses are equal to each Class’ annualized expense ratio (shown in the table below); multiplied by the average account
value over the period, multiplied by 184/365 (to reflect the one-half year period).
|
| | | Annualized |
| | | Expense Ratio |
| Initial Class | | 85% |
| Service Class | | 95% |
| Service Class 2 | | 1.10% |
| Investor Class | | 1.00% |
55 Annual Report
| VIP Dynamic Capital Appreciation Portfolio |
| Investment Changes | | |
| |
| |
| Top Ten Stocks as of December 31, 2005 |
| | | % of fund’s | | % of fund’s net assets |
| | | net assets | | 6 months ago |
| Google, Inc. Class A (sub. vtg.) | | 5.1 | | 9.9 |
| Motorola, Inc. | | 3.0 | | 0.0 |
| Walt Disney Co. | | 3.0 | | 0.0 |
| eBay, Inc. | | 2.7 | | 7.4 |
| Wal Mart Stores, Inc. | | 2.2 | | 0.0 |
| QUALCOMM, Inc. | | 2.1 | | 0.9 |
| UnitedHealth Group, Inc. | | 2.1 | | 4.7 |
| Yahoo!, Inc. | | 2.0 | | 7.1 |
| Qwest Communications | | | | |
| International, Inc. | | 1.9 | | 0.0 |
| Abercrombie & Fitch Co. Class A | | 1.7 | | 0.0 |
| | | 25.8 | | |
Top Five Market Sectors as of December 31, 2005 |
| | | % of fund’s | | % of fund’s net assets |
| | | net assets | | 6 months ago |
| Consumer Discretionary | | 23.5 | | 25.4 |
| Information Technology | | 22.8 | | 36.8 |
| Energy | | 9.8 | | 18.6 |
| Health Care | | 9.7 | | 6.5 |
| Industrials | | 8.6 | | 2.1 |
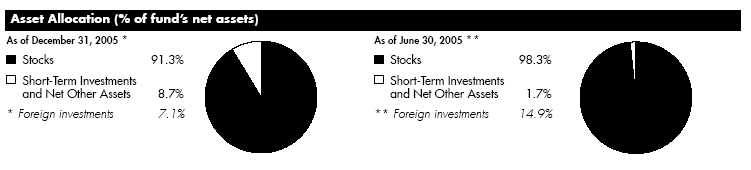
VIP Dynamic Capital Appreciation Portfolio 6
| VIP Dynamic Capital Appreciation Portfolio | | | | | | |
| Investments December 31, 2005 | | | | |
| Showing Percentage of Net Assets | | | | | | |
| |
| Common Stocks 91.3% | | | | | | |
| | | | | | | Shares | | Value (Note 1) |
| |
| CONSUMER DISCRETIONARY 23.5% | | | | | | |
| Auto Components – 0.6% | | | | | | | | |
| Goodyear Tire & Rubber Co. (a) | | | | | | 10,700 | | $ 185,966 |
| Johnson Controls, Inc. | | | | | | 4,800 | | 349,968 |
| | | | | | | | | 535,934 |
| Diversified Consumer Services 0.3% | | | | | | |
| ITT Educational Services, Inc. (a) | | | | | | 3,500 | | 206,885 |
| Hotels, Restaurants & Leisure 1.8% | | | | | | |
| Ambassadors Group, Inc. | | | | | | 8,900 | | 203,721 |
| Las Vegas Sands Corp. | | | | | | 1,600 | | 63,152 |
| Royal Caribbean Cruises Ltd. | | | | | | 1,600 | | 72,096 |
| Six Flags, Inc. (a) | | | | | | 40,400 | | 311,484 |
| Starbucks Corp. (a) | | | | | | 11,200 | | 336,112 |
| Wynn Resorts Ltd. (a)(d) | | | | | | 9,500 | | 521,075 |
| | | | | | | | | 1,507,640 |
| Household Durables 1.6% | | | | | | | | |
| D.R. Horton, Inc. | | | | | | 10,000 | | 357,300 |
| KB Home | | | | | | 7,300 | | 530,418 |
| Koninklijke Philips Electronics NV (NY Shares) | | | | 13,400 | | 416,740 |
| | | | | | | | | 1,304,458 |
| Internet & Catalog Retail 3.6% | | | | | | |
| Blue Nile, Inc. (a) | | | | | | 13,500 | | 544,185 |
| eBay, Inc. (a) | | | | | | 51,400 | | 2,223,050 |
| NutriSystem, Inc. (a) | | | | | | 7,222 | | 260,136 |
| | | | | | | | | 3,027,371 |
| Leisure Equipment & Products 0.2% | | | | | | |
| Mattel, Inc. | | | | | | 12,000 | | 189,840 |
| Media 5.9% | | | | | | | | |
| Discovery Holding Co. Class A (a) | | | | 23,326 | | 353,389 |
| Getty Images, Inc. (a) | | | | | | 3,000 | | 267,810 |
| Grupo Televisa SA de CV (CPO) sponsored ADR | | | | 6,000 | | 483,000 |
| Knight Ridder, Inc. | | | | | | 4,600 | | 291,180 |
| Lamar Advertising Co. Class A (a) | | | | 9,300 | | 429,102 |
| Meredith Corp. | | | | | | 2,000 | | 104,680 |
| The New York Times Co. Class A | | | | 13,400 | | 354,430 |
| Tribune Co. | | | | | | 5,900 | | 178,534 |
| Walt Disney Co. | | | | | | 103,800 | | 2,488,086 |
| | | | | | | | | 4,950,211 |
| Multiline Retail – 0.4% | | | | | | | | |
| Family Dollar Stores, Inc. | | | | | | 14,400 | | 356,976 |
| Specialty Retail 9.1% | | | | | | | | |
| Abercrombie & Fitch Co. Class A | | | | 22,300 | | 1,453,514 |
| AC Moore Arts & Crafts, Inc. (a) | | | | | | 34,600 | | 503,430 |
| American Eagle Outfitters, Inc. | | | | | | 47,700 | | 1,096,146 |
| Best Buy Co., Inc. | | | | | | 25,100 | | 1,091,348 |
| Charlotte Russe Holding, Inc. (a) | | | | | | 12,341 | | 257,063 |
| Chico’s FAS, Inc. (a) | | | | | | 29,800 | | 1,309,114 |
| Cost Plus, Inc. (a) | | | | | | 7,700 | | 132,055 |
See accompanying notes which are an integral part of the financial statements.
|
7
| VIP Dynamic Capital Appreciation Portfolio | | | | |
| Investments - continued | | | | |
| |
| |
| |
| | | | | Shares | | Value (Note 1) |
| Eddie Bauer Holdings, Inc. (a) | | | | 8,500 | | $ 127,500 |
| Gymboree Corp. (a) | | | | 24,800 | | 580,320 |
| Maidenform Brands, Inc. | | | | 17,200 | | 217,752 |
| Urban Outfitters, Inc. (a) | | | | 23,200 | | 587,192 |
| Wet Seal, Inc. Class A (a) | | | | 53,700 | | 238,428 |
| | | | | | | 7,593,862 |
| |
| TOTAL CONSUMER DISCRETIONARY | | | | 19,673,177 |
| |
| CONSUMER STAPLES 3.5% | | | | | | |
| Beverages 0.2% | | | | | | |
| Hansen Natural Corp. (a) | | | | 2,004 | | 157,935 |
| Food & Staples Retailing – 2.2% | | | | |
| Wal Mart Stores, Inc. | | | | 38,500 | | 1,801,800 |
| Food Products – 0.4% | | | | | | |
| Archer Daniels Midland Co. | | | | 14,900 | | 367,434 |
| Tobacco – 0.7% | | | | | | |
| Reynolds American, Inc. | | | | 3,000 | | 285,990 |
| UST, Inc. | | | | 6,700 | | 273,561 |
| | | | | | | 559,551 |
| |
| TOTAL CONSUMER STAPLES | | | | | | 2,886,720 |
| |
| ENERGY 9.8% | | | | | | |
| Energy Equipment & Services – 6.0% | | | | |
| Baker Hughes, Inc. | | | | 3,200 | | 194,496 |
| BJ Services Co. | | | | 19,400 | | 711,398 |
| Grant Prideco, Inc. (a) | | | | 25,180 | | 1,110,942 |
| National Oilwell Varco, Inc. (a) | | | | 14,388 | | 902,128 |
| Pride International, Inc. (a) | | | | 21,890 | | 673,118 |
| Schlumberger Ltd. (NY Shares) | | | | 14,600 | | 1,418,390 |
| | | | | | | 5,010,472 |
| Oil, Gas & Consumable Fuels 3.8% | | | | |
| Amerada Hess Corp. | | | | 5,300 | | 672,146 |
| Arch Coal, Inc. | | | | 7,600 | | 604,200 |
| Cameco Corp. | | | | 11,000 | | 698,198 |
| Peabody Energy Corp. | | | | 6,200 | | 511,004 |
| Valero Energy Corp. | | | | 14,200 | | 732,720 |
| | | | | | | 3,218,268 |
| |
| TOTAL ENERGY | | | | | | 8,228,740 |
| |
| FINANCIALS – 5.1% | | | | | | |
| Capital Markets 4.1% | | | | | | |
| Ameritrade Holding Corp. | | | | 20,830 | | 499,920 |
| Charles Schwab Corp. | | | | 20,000 | | 293,400 |
| E*TRADE Financial Corp. (a) | | | | 31,100 | | 648,746 |
| Janus Capital Group, Inc. | | | | 13,250 | | 246,848 |
| Lehman Brothers Holdings, Inc. | | | | 2,500 | | 320,425 |
| Merrill Lynch & Co., Inc. | | | | 8,000 | | 541,840 |
| Morgan Stanley | | | | 15,500 | | 879,470 |
| | | | | | | 3,430,649 |
See accompanying notes which are an integral part of the financial statements.
| | |
| VIP Dynamic Capital Appreciation Portfolio | | 8 |
| Common Stocks continued | | | | | | |
| | | | | Shares | | Value (Note 1) |
| |
| FINANCIALS – continued | | | | | | | | |
| Commercial Banks – 0.3% | | | | | | | | |
| Bank of America Corp. | | | | 6,400 | | $ | | 295,360 |
| Consumer Finance – 0.3% | | | | | | | | |
| First Cash Financial Services, Inc. (a) | | | | 8,100 | | | | 236,196 |
| Insurance – 0.4% | | | | | | | | |
| Covanta Holding Corp. (a) | | | | 3,100 | | | | 46,686 |
| Marsh & McLennan Companies, Inc. | | | | 9,100 | | | | 289,016 |
| | | | | | | | | 335,702 |
| |
| TOTAL FINANCIALS | | | | | | | | 4,297,907 |
| |
| HEALTH CARE 9.7% | | | | | | | | |
| Biotechnology – 1.3% | | | | | | | | |
| Amgen, Inc. (a) | | | | 900 | | | | 70,974 |
| Biogen Idec, Inc. (a) | | | | 21,000 | | | | 951,930 |
| Origin Agritech Ltd. (a) | | | | 1,700 | | | | 21,760 |
| | | | | | | | | 1,044,664 |
| Health Care Equipment & Supplies 1.2% | | | | | | |
| Aspect Medical Systems, Inc. (a) | | | | 4,900 | | | | 168,315 |
| Cytyc Corp. (a) | | | | 11,000 | | | | 310,530 |
| St. Jude Medical, Inc. (a) | | | | 5,100 | | | | 256,020 |
| Thermo Electron Corp. (a) | | | | 10,200 | | | | 307,326 |
| | | | | | | | | 1,042,191 |
| Health Care Providers & Services 5.1% | | | | | | |
| American Retirement Corp. (a) | | | | 8,100 | | | | 203,553 |
| Brookdale Senior Living, Inc. | | | | 6,100 | | | | 181,841 |
| Caremark Rx, Inc. (a) | | | | 6,900 | | | | 357,351 |
| Express Scripts, Inc. (a) | | | | 7,200 | | | | 603,360 |
| IMS Health, Inc. | | | | 10,500 | | | | 261,660 |
| Medco Health Solutions, Inc. (a) | | | | 10,100 | | | | 563,580 |
| UnitedHealth Group, Inc. | | | | 28,528 | | | | 1,772,730 |
| VCA Antech, Inc. (a) | | | | 11,600 | | | | 327,120 |
| | | | | | | | | 4,271,195 |
| Pharmaceuticals 2.1% | | | | | | | | |
| Adams Respiratory Therapeutics, Inc. | | | | 5,100 | | | | 207,366 |
| Allergan, Inc. | | | | 5,300 | | | | 572,188 |
| Elan Corp. PLC sponsored ADR (a) | | | | 46,500 | | | | 647,745 |
| Eli Lilly & Co. | | | | 2,100 | | | | 118,839 |
| Schering Plough Corp. | | | | 11,600 | | | | 241,860 |
| | | | | | | | | 1,787,998 |
| |
| TOTAL HEALTH CARE | | | | | | | | 8,146,048 |
| |
| INDUSTRIALS – 8.6% | | | | | | | | |
| Air Freight & Logistics – 1.1% | | | | | | | | |
| United Parcel Service, Inc. Class B | | | | 11,800 | | | | 886,770 |
| Airlines – 1.4% | | | | | | | | |
| AMR Corp. (a) | | | | 13,100 | | | | 291,213 |
| Continental Airlines, Inc. Class B (a) | | | | 12,200 | | | | 259,860 |
| |
| |
See accompanying notes which are an integral part of the financial statements.
| | | | | | |
| | | | | 9 | | Annual Report |
| VIP Dynamic Capital Appreciation Portfolio | | | | |
| Investments - continued | | | | |
| |
| |
| |
| | | Shares | | Value (Note 1) |
| Ryanair Holdings PLC sponsored ADR (a) | | 6,300 | | $ 352,737 |
| US Airways Group, Inc. (a) | | 8,000 | | 297,120 |
| | | | | 1,200,930 |
| Construction & Engineering – 1.1% | | | | |
| Empresas ICA Sociedad Controladora SA de CV sponsored ADR (a) | | 2,041 | | 59,699 |
| Granite Construction, Inc. | | 6,507 | | 233,666 |
| McDermott International, Inc. (a) | | 9,600 | | 428,256 |
| Quanta Services, Inc. (a) | | 18,900 | | 248,913 |
| | | | | 970,534 |
| Electrical Equipment 1.5% | | | | |
| ABB Ltd. sponsored ADR (a) | | 54,300 | | 527,796 |
| Rockwell Automation, Inc. | | 12,500 | | 739,500 |
| | | | | 1,267,296 |
| Machinery – 1.6% | | | | |
| Caterpillar, Inc. | | 6,000 | | 346,620 |
| Deere & Co. | | 9,300 | | 633,423 |
| Pentair, Inc. | | 10,700 | | 369,364 |
| | | | | 1,349,407 |
| Road & Rail 1.3% | | | | |
| Burlington Northern Santa Fe Corp. | | 5,500 | | 389,510 |
| Norfolk Southern Corp. | | 15,500 | | 694,865 |
| | | | | 1,084,375 |
| Trading Companies & Distributors – 0.6% | | | | |
| Interline Brands, Inc. | | 2,400 | | 54,600 |
| WESCO International, Inc. (a) | | 9,900 | | 423,027 |
| | | | | 477,627 |
| |
| TOTAL INDUSTRIALS | | | | 7,236,939 |
| |
| INFORMATION TECHNOLOGY 22.8% | | | | |
| Communications Equipment – 7.2% | | | | |
| Alcatel SA sponsored ADR (a) | | 17,800 | | 220,720 |
| CIENA Corp. (a) | | 34,900 | | 103,653 |
| CommScope, Inc. (a) | | 8,900 | | 179,157 |
| Finisar Corp. (a) | | 31,338 | | 65,183 |
| JDS Uniphase Corp. (a) | | 41,900 | | 98,884 |
| Juniper Networks, Inc. (a) | | 40,200 | | 896,460 |
| Motorola, Inc. | | 111,400 | | 2,516,526 |
| Oplink Communications, Inc. (a) | | 5,100 | | 73,950 |
| QUALCOMM, Inc. | | 41,400 | | 1,783,512 |
| Sycamore Networks, Inc. (a) | | 30,100 | | 130,032 |
| | | | | 6,068,077 |
| Computers & Peripherals 2.2% | | | | |
| Apple Computer, Inc. (a) | | 20,200 | | 1,452,178 |
| Dot Hill Systems Corp. (a) | | 13,500 | | 93,555 |
| Network Appliance, Inc. (a) | | 10,500 | | 283,500 |
| | | | | 1,829,233 |
| Electronic Equipment & Instruments – 0.1% | | | | |
| Aeroflex, Inc. (a) | | 4,900 | | 52,675 |
See accompanying notes which are an integral part of the financial statements.
| | |
| VIP Dynamic Capital Appreciation Portfolio | | 10 |
| Common Stocks continued | | | | |
| | | Shares | | Value (Note 1) |
| |
| INFORMATION TECHNOLOGY – continued | | | | |
| Internet Software & Services 7.4% | | | | |
| Akamai Technologies, Inc. (a) | | 7,000 | | $ 139,510 |
| DealerTrack Holdings, Inc. | | 2,000 | | 41,960 |
| Google, Inc. Class A (sub. vtg.) (a) | | 10,400 | | 4,314,544 |
| iPass, Inc. (a) | | 9,884 | | 64,839 |
| Yahoo!, Inc. (a) | | 42,200 | | 1,653,396 |
| | | | | 6,214,249 |
| IT Services 1.6% | | | | |
| Electronic Data Systems Corp. | | 28,600 | | 687,544 |
| First Data Corp. | | 15,900 | | 683,859 |
| | | | | 1,371,403 |
| Semiconductors & Semiconductor Equipment – 3.5% | | | | |
| Advanced Micro Devices, Inc. (a) | | 32,100 | | 982,260 |
| ATI Technologies, Inc. (a) | | 17,100 | | 291,239 |
| Broadcom Corp. Class A (a) | | 17,300 | | 815,695 |
| Ikanos Communications, Inc. | | 21,200 | | 312,488 |
| Integrated Device Technology, Inc. (a) | | 12,300 | | 162,114 |
| Silicon Laboratories, Inc. (a) | | 1,700 | | 62,322 |
| Texas Instruments, Inc. | | 9,100 | | 291,837 |
| | | | | 2,917,955 |
| Software 0.8% | | | | |
| Symantec Corp. (a) | | 39,100 | | 684,250 |
| |
| TOTAL INFORMATION TECHNOLOGY | | | | 19,137,842 |
| |
| MATERIALS 2.6% | | | | |
| Chemicals 2.0% | | | | |
| Airgas, Inc. | | 12,800 | | 421,120 |
| Monsanto Co. | | 10,200 | | 790,806 |
| Syngenta AG sponsored ADR | | 18,100 | | 450,871 |
| | | | | 1,662,797 |
| Metals & Mining – 0.6% | | | | |
| Allegheny Technologies, Inc. | | 15,100 | | 544,808 |
| |
| TOTAL MATERIALS | | | | 2,207,605 |
| |
| TELECOMMUNICATION SERVICES 5.7% | | | | |
| Diversified Telecommunication Services – 1.9% | | | | |
| Qwest Communications International, Inc. (a) | | 289,500 | | 1,635,675 |
| |
| |
| | | Shares | | Value (Note 1) |
| Wireless Telecommunication Services – 3.8% | | | | |
| American Tower Corp. Class A (a) | | 47,500 | | $ 1,287,250 |
| Centennial Communications Corp. | | | | |
| Class A (a) | | 2,100 | | 32,592 |
See accompanying notes which are an integral part of the financial statements.
|
11 Annual Report
11
| VIP Dynamic Capital Appreciation Portfolio | | | | |
| Investments - continued | | | | |
| |
| | Shares | | Value (Note 1) |
| | | | |
| | | | |
| Dobson Communications Corp. | | | | |
| Class A (a) | | 142,400 | | 1,068,000 |
| Sprint Nextel Corp. | | 32,658 | | 762,891 |
| | | | | 3,150,733 |
| TOTAL TELECOMMUNICATION SERVICES | | | | 4,786,408 |
| TOTAL COMMON STOCKS | | | | |
| (Cost $66,682,274) | | | | 76,601,386 |
| Money Market Funds 9.1% | | | | |
| Fidelity Cash Central Fund, 4.28% (b) | | 7,154,007 | | 7,154,007 |
| Fidelity Securities Lending Cash Central Fund, 4.35% (b)(c) | | 528,750 | | 528,750 |
| TOTAL MONEY MARKET FUNDS | | | | |
| (Cost $7,682,757) | | | | 7,682,757 |
| |
| TOTAL INVESTMENT PORTFOLIO 100.4% | | | | |
| (Cost $74,365,031) | | | | 84,284,143 |
| |
| NET OTHER ASSETS (0.4)% | | | | (346,906) |
| NET ASSETS 100% | | | | $ 83,937,237 |
Legend
(a) Non-income producing
(b) Affiliated fund that is available only to investment companies and other accounts managed by Fidelity Investments. The rate quoted is the annualized seven-day
yield of the fund at period end. A complete unaudited listing of the fund’s holdings as of its most recent quarter end is available upon request.
(c) Investment made with cash collateral received from securities on loan.
(d) Security or a portion of the security is on loan at period end.
|
Affiliated Central Funds
Information regarding income received by the fund from the affiliated Central funds during the period is as follows:
| Fund | | Income received |
| Fidelity Cash Central Fund | | $ | | 76,437 |
| Fidelity Securities Lending Cash Central Fund | | | | 2,424 |
| Total | | $ | | 78,861 |
Income Tax Information
At December 31, 2005, the fund had a capital loss carryforward of approximately $945,036 all of which will expire on December 31, 2012.
See accompanying notes which are an integral part of the financial statements.
VIP Dynamic Capital Appreciation Portfolio 12
| VIP Dynamic Capital Appreciation Portfolio | | | | | | |
| |
| Financial Statements | | | | | | |
| |
| |
| Statement of Assets and Liabilities | | | | | | |
| | | December 31, 2005 |
| |
| Assets | | | | | | |
| Investment in securities, at value (including securities loaned of $515,590) — See accompanying schedule: | | | | | | |
| Unaffiliated issuers (cost $66,682,274) | | $ 76,601,386 | | | | |
| Affiliated Central Funds (cost $7,682,757) | | 7,682,757 | | | | |
| Total Investments (cost $74,365,031) | | | | $ | | 84,284,143 |
| Receivable for investments sold | | | | | | 255,862 |
| Receivable for fund shares sold | | | | | | 228,231 |
| Dividends receivable | | | | | | 69,352 |
| Interest receivable | | | | | | 19,295 |
| Prepaid expenses | | | | | | 180 |
| Receivable from investment adviser for expense reductions | | | | | | 295 |
| Other receivables | | | | | | 20,979 |
| Total assets | | | | | | 84,878,337 |
| |
| Liabilities | | | | | | |
| Payable for investments purchased | | $ 240,948 | | | | |
| Payable for fund shares redeemed | | 79,959 | | | | |
| Accrued management fee | | 38,103 | | | | |
| Distribution fees payable | | 3,823 | | | | |
| Other affiliated payables | | 8,053 | | | | |
| Other payables and accrued expenses | | 41,464 | | | | |
| Collateral on securities loaned, at value | | 528,750 | | | | |
| Total liabilities | | | | | | 941,100 |
| |
| Net Assets | | | | $ | | 83,937,237 |
| Net Assets consist of: | | | | | | |
| Paid in capital | | | | $ | | 74,978,066 |
| Undistributed net investment income | | | | | | 42,097 |
| Accumulated undistributed net realized gain (loss) on investments and foreign currency transactions | | | | | | (1,002,043) |
| Net unrealized appreciation (depreciation) on investments and assets and liabilities in foreign currencies | | | | | | 9,919,117 |
| Net Assets | | | | $ | | 83,937,237 |
| |
| Statement of Assets and Liabilities continued | | | | | | |
| | | December 31, 2005 |
| |
| Initial Class: | | | | | | |
| Net Asset Value, offering price and redemption price per share ($57,609,244 ÷ 6,616,267 shares) | | | | $ | | 8.71 |
| Service Class: | | | | | | |
| Net Asset Value, offering price and redemption price per share ($878,817 ÷ 101,564 shares) | | | | $ | | 8.65 |
| Service Class 2: | | | | | | |
| Net Asset Value, offering price and redemption price per share ($18,208,406 ÷ 2,121,615 shares) | | | | $ | | 8.58 |
| Investor Class: | | | | | | |
| Net Asset Value, offering price and redemption price per share ($7,240,770 ÷ 831,550 shares) | | | | $ | | 8.71 |
See accompanying notes which are an integral part of the financial statements.
|
13 Annual Report
| VIP Dynamic Capital Appreciation Portfolio | | | | | | | | |
| Financial Statements - continued | | | | | | | | |
| |
| |
| Statement of Operations | | | | | | | | |
| | | | | Year ended December 31, 2005 |
| |
| Investment Income | | | | | | | | |
| Dividends | | | | | | $ | | 263,525 |
| Special dividends | | | | | | | | 57,744 |
| Interest | | | | | | | | 268 |
| Income from affiliated Central Funds | | | | | | | | 78,861 |
| Total income | | | | | | | | 400,398 |
| |
| Expenses | | | | | | | | |
| Management fee | | $ | | 232,802 | | | | |
| Transfer agent fees | | | | 34,903 | | | | |
| Distribution fees | | | | 33,626 | | | | |
| Accounting and security lending fees | | | | 17,455 | | | | |
| Independent trustees’ compensation | | | | 164 | | | | |
| Custodian fees and expenses | | | | 25,075 | | | | |
| Audit | | | | 38,195 | | | | |
| Legal | | | | 174 | | | | |
| Miscellaneous | | | | 19,370 | | | | |
| Total expenses before reductions | | | | 401,764 | | | | |
| Expense reductions | | | | (52,254) | | | | 349,510 |
| |
| Net investment income (loss) | | | | | | | | 50,888 |
| Realized and Unrealized Gain (Loss) | | | | | | | | |
| Net realized gain (loss) on: | | | | | | | | |
| Investment securities: | | | | | | | | |
| Unaffiliated issuers | | | | 2,869,348 | | | | |
| Foreign currency transactions | | | | (5,671) | | | | |
| Total net realized gain (loss) | | | | | | | | 2,863,677 |
| Change in net unrealized appreciation (depreciation) on: | | | | | | | | |
| Investment securities | | | | 5,413,520 | | | | |
| Assets and liabilities in foreign currencies | | | | (1,041) | | | | |
| Total change in net unrealized appreciation (depreciation) | | | | | | | | 5,412,479 |
| Net gain (loss) | | | | | | | | 8,276,156 |
| Net increase (decrease) in net assets resulting from operations | | | | | | $ | | 8,327,044 |
| |
| Statement of Changes in Net Assets | | | | | | | | |
| | | | | Year ended | | | | Year ended |
| | | | | December 31, | | | | December 31, |
| | | | | 2005 | | | | 2004 |
| Increase (Decrease) in Net Assets | | | | | | | | |
| Operations | | | | | | | | |
| Net investment income (loss) | | $ | | 50,888 | | $ | | (192,725) |
| Net realized gain (loss) | | | | 2,863,677 | | | | (2,440,393) |
| Change in net unrealized appreciation (depreciation) | | | | 5,412,479 | | | | 2,036,456 |
| Net increase (decrease) in net assets resulting from operations | | | | 8,327,044 | | | | (596,662) |
| Share transactions - net increase (decrease) | | | | 42,552,762 | | | | 5,346,069 |
| Total increase (decrease) in net assets | | | | 50,879,806 | | | | 4,749,407 |
| |
| Net Assets | | | | | | | | |
| Beginning of period | | | | 33,057,431 | | | | 28,308,024 |
| End of period (including undistributed net investment income of $42,097 and accumulated net investment loss of | | | | | | | | |
| $17,559, respectively) | | $ | | 83,937,237 | | $ | | 33,057,431 |
See accompanying notes which are an integral part of the financial statements.
| | |
| VIP Dynamic Capital Appreciation Portfolio | | 14 |
| Financial Highlights Initial Class | | | | | | | | | | |
| |
| Years ended December 31, | | 2005 | | 2004 | | 2003 | | 2002 | | 2001 |
| Selected Per Share Data | | | | | | | | | | |
| Net asset value, beginning of period | | $ 7.19 | | $ 7.09 | | $ 5.65 | | $ 6.10 | | $ 8.52 |
| Income from Investment Operations | | | | | | | | | | |
| Net investment income (loss)C | | 02D | | (.03)E | | (.02) | | .02 | | H |
| Net realized and unrealized gain (loss) | | 1.50 | | .13F | | 1.46 | | (.46) | | (2.41) |
| Total from investment operations | | 1.52 | | .10 | | 1.44 | | (.44) | | (2.41) |
| Distributions from net investment income | | — | | — | | — | | (.01) | | (.01) |
| Net asset value, end of period | | $ 8.71 | | $ 7.19 | | $ 7.09 | | $ 5.65 | | $ 6.10 |
| Total ReturnA,B | | 21.14% | | 1.41% | | 25.49% | | (7.21)% | | (28.32)% |
| Ratios to Average Net AssetsG | | | | | | | | | | |
| Expenses before reductions | | 88% | | .98% | | 1.83% | | 2.64% | | 3.59% |
| Expenses net of fee waivers, if any | | 85% | | .98% | | 1.06% | | 1.50% | | 1.50% |
| Expenses net of all reductions | | 76% | | .91% | | .96% | | 1.38% | | 1.43% |
| Net investment income (loss) | | 21%D | | (.48)%E | | (.30)% | | .32% | | .02% |
| Supplemental Data | | | | | | | | | | |
| Net assets, end of period (000 omitted) | | $ 57,609 | | $ 19,486 | | $ 16,684 | | $ 719 | | $ 390 |
| Portfolio turnover rate | | 201% | | 226% | | 307% | | 349% | | 432% |
A Total returns do not reflect charges attributable to your insurance company’s separate account. Inclusion of these charges would reduce the total returns shown.
B Total returns would have been lower had certain expenses not been reduced during the periods shown.
C Calculated based on average shares outstanding during the period.
D Investment income per share reflects an in kind dividend received in a corporate reorganization which amounted to $0.01 per share. Excluding this dividend, the ratio of net investment income to average net assets would have been .07%.
E Investment income per share reflects an in kind dividend received in a corporate reorganization which amounted to $0.00 per share. Excluding this dividend, the ratio of net investment income (loss) to average net assets would have been (.52)%.
F The amount shown for a share outstanding does not correspond with the aggregate net gain (loss) on investments for the period due to the timing of sales and repurchases of shares in relation to fluctuating market values of the investments of the
fund.
G Expense ratios reflect operating expenses of the class. Expenses before reductions do not reflect amounts reimbursed by the investment adviser or reductions from brokerage service arrangements or other expense offset arrangements and do not
represent the amount paid by the class during periods when reimbursements or reductions occur. Expenses net of fee waivers reflect expenses after reimbursement by the investment adviser but prior to reductions from brokerage service arrange
ments or other expense offset arrangements. Expenses net of all reductions represent the net expenses paid by the class.
H Amount represents less than $.01 per share.
|
| Financial Highlights Service Class | | | | | | | | | | |
| |
| Years ended December 31, | | 2005 | | 2004 | | 2003 | | 2002 | | 2001 |
| Selected Per Share Data | | | | | | | | | | |
| Net asset value, beginning of period | | $ 7.15 | | $ 7.06 | | $ 5.64 | | $ 6.09 | | $ 8.52 |
| Income from Investment Operations | | | | | | | | | | |
| Net investment income (loss)C | | 01D | | (.04)E | | (.04) | | .01 | | (.01) |
| Net realized and unrealized gain (loss) | | 1.49 | | .13F | | 1.46 | | (.45) | | (2.41) |
| Total from investment operations | | 1.50 | | .09 | | 1.42 | | (.44) | | (2.42) |
| Distributions from net investment income | | — | | — | | — | | (.01) | | (.01) |
| Net asset value, end of period | | $ 8.65 | | $ 7.15 | | $ 7.06 | | $ 5.64 | | $ 6.09 |
| Total ReturnA,B | | 20.98% | | 1.27% | | 25.18% | | (7.22)% | | (28.44)% |
| Ratios to Average Net AssetsG | | | | | | | | | | |
| Expenses before reductions | | 99% | | 1.07% | | 1.92% | | 2.61% | | 3.63% |
| Expenses net of fee waivers, if any | | 96% | | 1.07% | | 1.38% | | 1.60% | | 1.60% |
| Expenses net of all reductions | | 88% | | 1.00% | | 1.29% | | 1.48% | | 1.53% |
| Net investment income (loss) | | 11%D | | (.57)%E | | (.63)% | | .22% | | (.08)% |
| Supplemental Data | | | | | | | | | | |
| Net assets, end of period (000 omitted) | | $ 879 | | $ 644 | | $ 852 | | $ 773 | | $ 915 |
| Portfolio turnover rate | | 201% | | 226% | | 307% | | 349% | | 432% |
A Total returns do not reflect charges attributable to your insurance company’s separate account. Inclusion of these charges would reduce the total returns shown.
B Total returns would have been lower had certain expenses not been reduced during the periods shown.
C Calculated based on average shares outstanding during the period.
D Investment income per share reflects an in kind dividend received in a corporate reorganization which amounted to $0.01 per share. Excluding this dividend, the ratio of net investment income (loss) to average net assets would have been (.03)%.
E Investment income per share reflects an in kind dividend received in a corporate reorganization which amounted to $0.00 per share. Excluding this dividend, the ratio of net investment income (loss) to average net assets would have been (.61)%.
F The amount shown for a share outstanding does not correspond with the aggregate net gain (loss) on investments for the period due to the timing of sales and repurchases of shares in relation to fluctuating market values of the investments of the
fund.
G Expense ratios reflect operating expenses of the class. Expenses before reductions do not reflect amounts reimbursed by the investment adviser or reductions from brokerage service arrangements or other expense offset arrangements and do not
represent the amount paid by the class during periods when reimbursements or reductions occur. Expenses net of fee waivers reflect expenses after reimbursement by the investment adviser but prior to reductions from brokerage service arrange
ments or other expense offset arrangements. Expenses net of all reductions represent the net expenses paid by the class.
|
See accompanying notes which are an integral part of the financial statements.
|
15 Annual Report
| Financial Highlights Service Class 2 | | | | | | | | | | |
| |
| Years ended December 31, | | 2005 | | 2004 | | 2003 | | 2002 | | 2001 |
| Selected Per Share Data | | | | | | | | | | |
| Net asset value, beginning of period | | $ 7.11 | | $ 7.02 | | $ 5.62 | | $ 6.09 | | $ 8.52 |
| Income from Investment Operations | | | | | | | | | | |
| Net investment income (loss)C | | —D,H | | (.05)E | | (.05) | | —H | | (.01) |
| Net realized and unrealized gain (loss) | | 1.47 | | .14F | | 1.45 | | (.46) | | (2.41) |
| Total from investment operations | | 1.47 | | .09 | | 1.40 | | (.46) | | (2.42) |
| Distributions from net investment income | | — | | — | | — | | (.01) | | (.01) |
| Net asset value, end of period | | $ 8.58 | | $ 7.11 | | $ 7.02 | | $ 5.62 | | $ 6.09 |
| Total ReturnA,B | | 20.68% | | 1.28% | | 24.91% | | (7.55)% | | (28.44)% |
| Ratios to Average Net AssetsG | | | | | | | | | | |
| Expenses before reductions | | 1.18% | | 1.26% | | 2.10% | | 2.79% | | 3.77% |
| Expenses net of fee waivers, if any | | 1.11% | | 1.25% | | 1.51% | | 1.75% | | 1.75% |
| Expenses net of all reductions | | 1.03% | | 1.17% | | 1.41% | | 1.63% | | 1.68% |
| Net investment income (loss) | | (.04)%D | | (.74)%E | | (.75)% | | .07% | | (.23)% |
| Supplemental Data | | | | | | | | | | |
| Net assets, end of period (000 omitted) | | $ 18,208 | | $ 12,928 | | $ 10,772 | | $ 6,209 | | $ 3,972 |
| Portfolio turnover rate | | 201% | | 226% | | 307% | | 349% | | 432% |
A Total returns do not reflect charges attributable to your insurance company’s separate account. Inclusion of these charges would reduce the total returns shown.
B Total returns would have been lower had certain expenses not been reduced during the periods shown.
C Calculated based on average shares outstanding during the period.
D Investment income per share reflects an in kind dividend received in a corporate reorganization which amounted to $0.01 per share. Excluding this dividend, the ratio of net investment income (loss) to average net assets would have been (.19)%.
E Investment income per share reflects an in kind dividend received in a corporate reorganization which amounted to $0.00 per share. Excluding this dividend, the ratio of net investment income (loss) to average net assets would have been (.78)%.
F The amount shown for a share outstanding does not correspond with the aggregate net gain (loss) on investments for the period due to the timing of sales and repurchases of shares in relation to fluctuating market values of the investments of the
fund.
G Expense ratios reflect operating expenses of the class. Expenses before reductions do not reflect amounts reimbursed by the investment adviser or reductions from brokerage service arrangements or other expense offset arrangements and do not
represent the amount paid by the class during periods when reimbursements or reductions occur. Expenses net of fee waivers reflect expenses after reimbursement by the investment adviser but prior to reductions from brokerage service arrange
ments or other expense offset arrangements. Expenses net of all reductions represent the net expenses paid by the class.
H Amount represents less than $.01 per share.
|
| Financial Highlights Investor Class | | |
| |
| Year ended December 31, | | 2005F |
| Selected Per Share Data | | |
| Net asset value, beginning of period | | $ 7.89 |
| Income from Investment Operations | | |
| Net investment income (loss)E | | —H |
| Net realized and unrealized gain (loss) | | 82 |
| Total from investment operations | | 82 |
| Net asset value, end of period | | $ 8.71 |
| Total ReturnB,C,D | | 10.39% |
| Ratios to Average Net AssetsG | | |
| Expenses before reductions | | 1.04%A |
| Expenses net of fee waivers, if any | | 1.00%A |
| Expenses net of all reductions | | 92%A |
| Net investment income (loss) | | 02%A |
| Supplemental Data | | |
| Net assets, end of period (000 omitted) | | $ 7,241 |
| Portfolio turnover rate | | 201% |
A Annualized
B Total returns for periods of less than one year are not annualized.
C Total returns do not reflect charges attributable to your insurance company’s separate account. Inclusion of these charges would reduce the total returns shown.
D Total returns would have been lower had certain expenses not been reduced during the periods shown.
E Calculated based on average shares outstanding during the period.
F For the period July 21, 2005 (commencement of sale of shares) to December 31, 2005.
G Expense ratios reflect operating expenses of the class. Expenses before reductions do not reflect amounts reimbursed by the investment adviser or reductions from brokerage service arrangements or other expense offset arrangements and do not
represent the amount paid by the class during periods when reimbursements or reductions occur. Expense ratios before reductions for start up periods may not be representative of longer term operating periods. Expenses net of fee waivers reflect
expenses after reimbursement by the investment adviser but prior to reductions from brokerage service arrangements or other expense offset arrangements. Expenses net of all reductions represent the net expenses paid by the class.
H Amount represents less than $.01 per share.
|
See accompanying notes which are an integral part of the financial statements.
| | |
| VIP Dynamic Capital Appreciation Portfolio | | 16 |
Notes to Financial Statements
For the period ended December 31, 2005
|
1. Significant Accounting Policies.
|
VIP Dynamic Capital Appreciation Portfolio (the fund) is a fund of Variable Insurance Products Fund III (the trust) (referred to in this report as VIP Dynamic Capital Appreciation Portfolio) and is authorized to issue an unlimited number of shares. The trust is registered under the Investment Company Act of 1940, as amended (the 1940 Act), as an open end management investment company organized as a Massachusetts business trust. Shares of the fund may only be purchased by insurance companies for the purpose of funding variable annuity or variable life insurance contracts. The fund offers the following classes of shares: Initial Class shares, Service Class shares, Service Class 2 shares and Investor Class shares. The fund commenced sale of Investor Class shares on July 21, 2005. All classes have equal rights and voting privileges, except for matters affecting a single class. Investment income, realized and unrealized capital gains and losses, the common expenses of the fund, and certain fund level expense reductions, if any, are allocated on a pro rata basis to each class based on the relative net assets of each class to the total net assets of the fund. Each class differs with respect to transfer agent and distribution and service plan fees incurred. Certain expense reductions also differ by class.
The fund may invest in affiliated money market central funds (Money Market Central Funds) which are open end investment companies available to investment companies and other accounts managed by Fidelity Management & Research Company (FMR) and its affiliates. The financial statements have been prepared in conformity with accounting principles generally accepted in the United States of America, which require management to make certain estimates and assumptions at the date of the financial statements. The following summarizes the significant accounting policies of the fund:
Security Valuation. Investments are valued and net asset value (NAV) per share is calculated (NAV calculation) as of the close of business of the New York Stock Exchange (NYSE), normally 4:00 p.m. Eastern time. Wherever possible, the fund uses independent pricing services approved by the Board of Trustees to value its investments.
Equity securities, including restricted securities, for which market quotations are readily available, are valued at the last reported sale price or official closing price as reported by an independent pricing service on the primary market or exchange on which they are traded. In the event there were no sales during the day or closing prices are not available, securities are valued at the last quoted bid price. Investments in open end mutual funds, are valued at their closing net asset value each business day. Short term securities with remaining maturities of sixty days or less for which quotations are not readily available are valued at amortized cost, which approximates value.
When current market prices or quotations are not readily available or do not accurately reflect fair value, valuations may be determined in accordance with procedures adopted by the Board of Trustees. For example, when developments occur between the close of a market and the close of the NYSE that may materially affect the value of some or all of the securities, or when trading in a security is halted, those securities may be fair valued. Factors used in the determination of fair value may include monitoring news to identify significant market or security specific events such as changes in the value of U.S. securities markets, reviewing developments in foreign markets and evaluating the performance of ADRs, futures contracts and exchange-traded funds. Because the fund’s utilization of fair value pricing depends on market activity, the frequency with which fair value pricing is used can not be predicted and may be utilized to a significant extent. The value of securities used for NAV calculation under fair value pricing may differ from published prices for the same securities.
Foreign Currency. The fund uses foreign currency contracts to facilitate transactions in foreign denominated securities. Losses from these transac tions may arise from changes in the value of the foreign currency or if the counterparties do not perform under the contracts’ terms.
Foreign denominated assets, including investment securities, and liabilities are translated into U.S. dollars at the exchange rate at period end. Pur chases and sales of investment securities, income and dividends received and expenses denominated in foreign currencies are translated into U.S. dollars at the exchange rate in effect on the transaction date.
The effects of exchange rate fluctuations on investments are included with the net realized and unrealized gain (loss) on investment securities. Other foreign currency transactions resulting in realized and unrealized gain (loss) are disclosed separately.
Investment Transactions and Income. Security transactions are accounted for as of trade date. Gains and losses on securities sold are determined on the basis of identified cost. Dividend income is recorded on the ex dividend date, except for certain dividends from foreign securities where the ex dividend date may have passed, which are recorded as soon as the fund is informed of the ex dividend date. Non cash dividends included in dividend income, if any, are recorded at the fair market value of the securities received. Distributions received on securities that represent a return of capital or capital gain are recorded as a reduction of cost of investments and/or as a realized gain. The fund estimates the components of distributions received that may be considered return of capital distributions or capital gain distributions. Large, non recurring dividends recognized by the fund are presented separately on the Statement of Operations as “Special Dividends” and the impact of these dividends is presented in the Financial Highlights. Interest income is accrued as earned. Interest income includes coupon interest and amortization of premium and accretion of discount on debt securities. Investment income is recorded net of foreign taxes withheld where recovery of such taxes is uncertain.
Expenses. Most expenses of the trust can be directly attributed to a fund. Expenses which cannot be directly attributed are apportioned among each fund in the trust.
17 Annual Report
| Notes to Financial Statements continued |
1. Significant Accounting Policies continued |
Income Tax Information and Distributions to Shareholders. Each year, the fund intends to qualify as a regulated investment company by distributing all of its taxable income and realized gains under Subchapter M of the Internal Revenue Code. As a result, no provision for income taxes is required in the accompanying financial statements. Foreign taxes are provided for based on the fund’s understanding of the tax rules and rates that exist in the foreign markets in which it invests.
Distributions are recorded on the ex dividend date. Income dividends and capital gain distributions are declared separately for each class. Income and capital gain distributions are determined in accordance with income tax regulations, which may differ from generally accepted accounting principles.
Capital accounts within the financial statements are adjusted for permanent book tax differences. These adjustments have no impact on net assets or the results of operations. Temporary book tax differences will reverse in a subsequent period.
Book tax differences are primarily due to foreign currency transactions, passive foreign investment companies (PFIC), capital loss carryforwards, losses deferred due to wash sales and excise tax regulations.
| The tax basis components of distributable earnings and the federal tax cost as of period end were as follows: | | |
| |
| Unrealized appreciation | | | $ | 11,056,468 |
| Unrealized depreciation | | | | (1,199,519) |
| Net unrealized appreciation (depreciation) | | | | 9,856,949 |
| Undistributed ordinary income | | | | 47,258 |
| Capital loss carryforward | | | | (945,036) |
| Cost for federal income tax purposes | | | | 74,427,194 |
| |
| 2. Operating Policies. | | | | |
Repurchase Agreements. FMR has received an Exemptive Order from the Securities and Exchange Commission (the SEC) which permits the fund and other affiliated entities of FMR to transfer uninvested cash balances into joint trading accounts which are then invested in repurchase agree ments. The fund may also invest directly with institutions in repurchase agreements. Repurchase agreements are collateralized by government or non government securities. Collateral is held in segregated accounts with custodian banks and may be obtained in the event of a default of the counterparty. The fund monitors, on a daily basis, the value of the collateral to ensure it is at least equal to the principal amount of the repurchase agreement (including accrued interest). In the event of a default by the counterparty, realization of the collateral proceeds could be delayed, during which time the value of the collateral may decline.
3. Purchases and Sales of Investments.
Purchases and sales of securities, other than short term securities and U.S. government securities, aggregated $117,663,097 and $81,324,856, respectively.
4. Fees and Other Transactions with Affiliates.
Management Fee. FMR and its affiliates provide the fund with investment management related services for which the fund pays a monthly manage ment fee. The management fee is the sum of an individual fund fee rate that is based on an annual rate of .30% of the fund’s average net assets and a group fee rate that averaged .27% during the period. The group fee rate is based upon the average net assets of all the mutual funds advised by FMR. The group fee rate decreases as assets under management increase and increases as assets under management decrease. For the period, the total annual management fee rate was .57% of the fund’s average net assets.
Distribution and Service Plan. In accordance with Rule 12b 1 of the 1940 Act, the fund has adopted separate 12b 1 Plans for each Service Class of shares. Each Service Class pays Fidelity Distributors Corporation (FDC), an affiliate of FMR, a service fee. For the period, the service fee is based on an annual rate of .10% of Service Class’ average net assets and .25% of Service Class 2’s average net assets.
For the period, each class paid FDC the following amounts, all of which were re allowed to insurance companies for the distribution of shares and providing shareholder support services:
| Service Class | | | $ | 710 |
| Service Class 2 | | | | 32,916 |
| | | | $ | 33,626 |
VIP Dynamic Capital Appreciation Portfolio
4. Fees and Other Transactions with Affiliates continued
Transfer Agent Fees. Fidelity Investments Institutional Operations Company, Inc. (FIIOC), an affiliate of FMR, is the fund’s transfer, dividend disbursing, and shareholder servicing agent. FIIOC receives an asset based fee with respect to each class. FIIOC pays a portion of the expenses related to the typesetting, printing and mailing of shareholder reports, except proxy statements. Each class with the exception of Investor Class pays a transfer agent fee, excluding out of pocket expenses, equal to an annual rate of ..07% of their month end net assets. Investor Class pays an asset based transfer agent fee of .18% of its month end net assets. The total transfer agent fees paid by each class to FIIOC, including out of pocket expenses, were as follows:
| Initial Class | | | $ | 18,228 |
| Service Class | | | | 493 |
| Service Class 2 | | | | 13,723 |
| Investor Class | | | | 2,459 |
| | | | $ | 34,903 |
Accounting and Security Lending Fees. Fidelity Service Company, Inc. (FSC), an affiliate of FMR, maintains the fund’s accounting records. The accounting fee is based on the level of average net assets for the month. Under a separate contract, FSC administers the security lending program. The security lending fee is based on the number and duration of lending transactions.
Affiliated Central Funds. The fund may invest in Money Market Central Funds which seek preservation of capital and current income and are managed by Fidelity Investments Money Management, Inc. (FIMM), an affiliate of FMR. The Money Market Central Funds do not pay a management fee.
Brokerage Commissions. The fund placed a portion of its portfolio transactions with brokerage firms which are affiliates of the investment adviser. The commissions paid to these affiliated firms were $7,845 for the period.
5. Committed Line of Credit.
|
The fund participates with other funds managed by FMR in a $4.2 billion credit facility (the “line of credit”) to be utilized for temporary or emergency purposes to fund shareholder redemptions or for other short term liquidity purposes. The fund has agreed to pay commitment fees on its pro rata portion of the line of credit. During the period, there were no borrowings on this line of credit.
The fund lends portfolio securities from time to time in order to earn additional income. On the settlement date of the loan, the fund receives collateral (in the form of U.S. Treasury obligations, letters of credit and/or cash) against the loaned securities and maintains collateral in an amount not less than 100% of the market value of the loaned securities during the period of the loan. The market value of the loaned securities is determined at the close of business of the fund and any additional required collateral is delivered to the fund on the next business day. If the borrower defaults on its obligation to return the securities loaned because of insolvency or other reasons, a fund could experience delays and costs in recovering the securities loaned or in gaining access to the collateral. Any cash collateral received is invested in the Fidelity Securities Lending Cash Central Fund. The value of loaned securities and cash collateral at period end are disclosed on the fund’s Statement of Assets and Liabilities. Security lending income represents the income earned on investing cash collateral, less fees and expenses associated with the loan, plus any premium payments that may be received on the loan of certain types of securities. Net income from lending portfolio securities during the period amounted to $2,424.
FMR voluntarily agreed to reimburse each class to the extent annual operating expenses exceeded certain levels of average net assets as noted in the table below. Some expenses, for example interest expense, are excluded from this reimbursement.
The following classes were in reimbursement during the period:
| | | | | | |
| | | Expense | | | | Reimbursement |
| | | Limitations | | | | from adviser |
| |
| Initial Class | | 1.00% - .85%* | | | $ | 7,830 |
| Service Class | | 1.10% - .95%* | | | | 251 |
| Service Class 2 | | 1.25% - 1.10%* | | | | 9,168 |
| Investor Class | | 1.00% | | | | 354 |
| | | | | | $ | 17,603 |
| * Expense limitation in effect at period end. | | | | | | |
19 Annual Report
Notes to Financial Statements continued
7. Expense Reductions - continued
Many of the brokers with whom FMR places trades on behalf of the fund provided services to the fund in addition to trade execution. These services included payments of certain expenses on behalf of the fund totaling $31,923 for the period. In addition, through arrangements with the each class’ transfer agent, credits realized as a result of uninvested cash balances were used to reduce the fund’s expenses. During the period, credits reduced each class’ transfer agent expense as noted in the table below.
| | | Transfer Agent |
| | | expense reduction |
| Initial Class | | $ | | 2,728 |
| |
| 8. Other. | | |
The fund’s organizational documents provide former and current trustees and officers with a limited indemnification against liabilities arising in connection with the performance of their duties to the fund. In the normal course of business, the fund may also enter into contracts that provide general indemnifications. The fund’s maximum exposure under these arrangements is unknown as this would be dependent on future claims that may be made against the fund. The risk of material loss from such claims is considered remote.
At the end of the period, FMR or its affiliates were the owners of record of 77% of the total outstanding shares of the fund.
| 9. Share Transactions. | | | | | | | | | | |
| |
| Transactions for each class of shares were as follows: | | | | | | | | | | |
| |
| | | Shares | | Dollars |
| | | Years ended December 31 | | Years ended December 31 |
| | | 2005A | | 2004 | | 2005A | | | | 2004 |
| Initial Class | | | | | | | | | | |
| Shares sold | | 5,315,043 | | 2,414,426 | | $ 43,123,464 | | $ | | 17,426,612 |
| Shares redeemed | | (1,408,625) | | (2,058,955) | | (10,370,197) | | (13,839,795) |
| Net increase (decrease) | | 3,906,418 | | 355,471 | | $ 32,753,267 | | $ | | 3,586,817 |
| Service Class | | | | | | | | | | |
| Shares sold | | 28,508 | | 8,530 | | $ 222,823 | | $ | | 58,255 |
| Shares redeemed | | (16,924) | | (39,255) | | (129,062) | | | | (268,348) |
| Net increase (decrease) | | 11,584 | | (30,725) | | $ 93,761 | | $ | | (210,093) |
| Service Class 2 | | | | | | | | | | |
| Shares sold | | 836,551 | | 663,391 | | $ 6,641,312 | | $ | | 4,511,425 |
| Shares redeemed | | (533,808) | | (378,225) | | (3,950,252) | | | | (2,542,080) |
| Net increase (decrease) | | 302,743 | | 285,166 | | $ 2,691,060 | | $ | | 1,969,345 |
| Investor Class | | | | | | | | | | |
| Shares sold | | 836,455 | | — | | $ 7,057,993 | | $ | | — |
| Shares redeemed | | (4,905) | | — | | (43,319) | | | | — |
| Net increase (decrease) | | 831,550 | | — | | $ 7,014,674 | | $ | | — |
A Share transactions for Investor Class are for the period July 21, 2005 (commencement of sale of shares) to December 31, 2005. | | | | | | | | | | |
VIP Dynamic Capital Appreciation Portfolio
Report of Independent Registered Public Accounting Firm
To the Trustees of Variable Insurance Products Fund III and Shareholders of VIP Dynamic Capital Appreciation Portfolio:
We have audited the accompanying statement of assets and liabilities of VIP Dynamic Capital Appreciation Portfolio (the Fund), a fund of Variable Insurance Products Fund III, including the schedule of investments as of December 31, 2005, and the related statement of operations for the year then ended, the statement of changes in net assets for each of the two years in the period then ended, and the financial highlights for each of the five years in the period then ended. These financial statements and financial highlights are the responsibility of the Fund’s management. Our responsibility is to express an opinion on these financial statements and financial highlights based on our audits.
We conducted our audits in accordance with standards of the Public Company Accounting Oversight Board (United States). Those standards require that we plan and perform the audit to obtain reasonable assurance about whether the financial statements and financial highlights are free of material misstatement. The Fund is not required to have, nor were we engaged to perform, an audit of its internal control over financial reporting. Our audits included consideration of internal control over financial reporting as a basis for designing audit procedures that are appropriate in the circumstances, but not for the purpose of expressing an opinion on the effectiveness of the Fund’s internal control over financial reporting. Accordingly, we express no such opinion. An audit also includes examining, on a test basis, evidence supporting the amounts and disclosures in the financial statements, assessing the accounting principles used and significant estimates made by management, as well as evaluating the overall financial statement presentation. Our procedures included confirmation of securities owned as of December 31, 2005, by correspondence with the custodians and brokers; where replies were not received from brokers, we performed other auditing procedures. We believe that our audits provide a reasonable basis for our opinion.
In our opinion, the financial statements and financial highlights referred to above present fairly, in all material respects, the financial position of VIP Dynamic Capital Appreciation Portfolio as of December 31, 2005, the results of its operations for the year then ended, the changes in its net assets for each of the two years in the period then ended, and its financial highlights for each of the five years in the period then ended, in conformity with accounting principles generally accepted in the United States of America.
/s/ Deloitte & Touche LLP
DELOITTE & TOUCHE LLP
Boston, Massachusetts
February 17, 2006
|
21 Annual Report
The Trustees, Member of the Advisory Board, and executive officers of the trust and fund, as applicable, are listed below. The Board of Trustees governs the fund and is responsible for protecting the interests of shareholders. The Trustees are experienced executives who meet periodically throughout the year to oversee the fund’s activities, review contractual arrangements with companies that provide services to the fund, and review the fund’s performance. Except for William O. McCoy and Albert R. Gamper, Jr., each of the Trustees oversees 326 funds advised by FMR or an affiliate. Mr. McCoy oversees 328 funds advised by FMR or an affiliate. Mr. Gamper oversees 235 funds advised by FMR or an affiliate.
The Trustees hold office without limit in time except that (a) any Trustee may resign; (b) any Trustee may be removed by written instrument, signed by at least two thirds of the number of Trustees prior to such removal; (c) any Trustee who requests to be retired or who has become inca pacitated by illness or injury may be retired by written instrument signed by a majority of the other Trustees; and (d) any Trustee may be removed at any special meeting of shareholders by a two thirds vote of the outstanding voting securities of the trust. Each Trustee who is not an interested person (as defined in the 1940 Act) (Independent Trustee), shall retire not later than the last day of the calendar year in which his or her 72nd birthday occurs. The Independent Trustees may waive this mandatory retirement age policy with respect to individual Trustees. The executive officers and Advisory Board Member hold office without limit in time, except that any officer and Advisory Board Member may resign or may be removed by a vote of a majority of the Trustees at any regular meeting or any special meeting of the Trustees. Except as indicated, each individual has held the office shown or other offices in the same company for the past five years.
The fund’s Statement of Additional Information (SAI) includes more information about the Trustees. To request a free copy, call Fidelity at 1-877-208-0098.
Correspondence intended for each Trustee who is an interested person may be sent to Fidelity Investments, 82 Devonshire Street, Boston, Massachusetts 02109.
| | Name, Age; Principal Occupation
Edward C. Johnson 3d (75)
|
Year of Election or Appointment: 1994
Mr. Johnson is Chairman of the Board of Trustees. Mr. Johnson serves as Chief Executive Officer, Chairman, and a Director of FMR Corp.; a Director and Chairman of the Board and of the Executive Committee of FMR; Chairman and a Director of Fidelity Man agement & Research (Far East) Inc.; Chairman and a Director of Fidelity Investments Money Management, Inc.; and Chairman (2001 present) and a Director (2000 present) of FMR Co., Inc.
Year of Election or Appointment: 2005
Mr. Jonas is Senior Vice President of VIP Dynamic Capital Appreciation (2005 present). He also serves as Senior Vice President of other Fidelity funds (2005 present). Mr. Jonas is Executive Director of FMR (2005 present). Previously, Mr. Jonas served as President of Fidelity Enterprise Operations and Risk Services (2004 2005), Chief Administrative Officer (2002 2004), and Chief Financial Officer of FMR Co. (1998 2000). Mr. Jonas has been with Fidelity Investments since 1987 and has held various financial and management positions including Chief Financial Officer of FMR. In addition, he serves on the Boards of Boston Ballet (2003 present) and Simmons College (2003 present).
Year of Election or Appointment: 2003
Mr. Reynolds is a Director (2003 present) and Chief Operating Officer (2002 present) of FMR Corp. He also serves on the Board at Fidelity Investments Canada, Ltd. (2000 present). Previously, Mr. Reynolds served as President of Fidelity Investments Institutional Retirement Group (1996 2000).
* Trustees have been determined to be “Interested Trustees” by virtue of, among other things, their affiliation with the trust or various entities under common control with FMR.
VIP Dynamic Capital Appreciation Portfolio
Correspondence intended for each Independent Trustee (that is, the Trustees other than the Interested Trustees) may be sent to Fidelity Investments, P.O. Box 55235, Boston, Massachusetts 02205-5235.
| | Name, Age; Principal Occupation
Dennis J. Dirks (57)
|
Year of Election or Appointment: 2005
Prior to his retirement in May 2003, Mr. Dirks was Chief Operating Officer and a member of the Board of The Depository Trust & Clearing Corporation (DTCC) (1999 2003). He also served as President, Chief Operating Officer, and Board member of The Depository Trust Company (DTC) (1999 2003) and President and Board member of the National Securities Clearing Corporation (NSCC) (1999 2003). In addition, Mr. Dirks served as Chief Executive Officer and Board member of the Government Securities Clearing Corporation (2001 2003) and Chief Executive Officer and Board member of the Mortgage Backed Securities Clearing Corporation (2001 2003). Mr. Dirks also serves as a Trustee of Manhattan College (2005 present).
| | Albert R. Gamper, Jr. (63)
|
Year of Election or Appointment: 2006
Mr. Gamper also serves as a Trustee (2006 present) or Member of the Advisory Board (2005 present) of other investment companies advised by FMR. Prior to his retirement in December 2004, Mr. Gamper served as Chairman of the Board of CIT Group Inc. (commercial finance). During his tenure with CIT Group Inc. Mr. Gamper served in numerous senior management positions, includ ing Chairman (1987 1989; 1999 2001; 2002 2004), Chief Executive Officer (1987 2004), and President (1989 2002). He currently serves as a member of the Board of Directors of Public Service Enterprise Group (utilities, 2001 present), Chairman of the Board of Governors, Rutgers University (2004 present), and Chairman of the Board of Saint Barnabas Health Care System.
Year of Election or Appointment: 1997
Dr. Gates is Chairman of the Independent Trustees (2006 present). Dr. Gates is President of Texas A&M University (2002 present). He was Director of the Central Intelligence Agency (CIA) from 1991 to 1993. From 1989 to 1991, Dr. Gates served as Assistant to the President of the United States and Deputy National Security Advisor. Dr. Gates is a Director of NACCO Industries, Inc. (mining and manufacturing), Parker Drilling Co., Inc. (drilling and rental tools for the energy industry, 2001 present), and Brinker International (restaurant management, 2003 present). Previously, Dr. Gates served as a Director of LucasVarity PLC (automotive components and diesel engines), a Director of TRW Inc. (automotive, space, defense, and information technology), and Dean of the George Bush School of Government and Public Service at Texas A&M University (1999 2001). Dr. Gates also is a Trustee of the Forum for International Policy.
Year of Election or Appointment: 2004
Dr. Heilmeier is Chairman Emeritus of Telcordia Technologies (communication software and systems), where prior to his retirement, he served as company Chairman and Chief Executive Officer. He currently serves on the Boards of Directors of The Mitre Corpo ration (systems engineering and information technology support for the government), and HRL Laboratories (private research and development, 2004 present). He is Chairman of the General Motors Science & Technology Advisory Board and a Life Fellow of the Institute of Electrical and Electronics Engineers (IEEE) (2000 present). Dr. Heilmeier is a member of the Defense Science Board and the National Security Agency Advisory Board. He is also a member of the National Academy of Engineering, the American Academy of Arts and Sciences, and the Board of Overseers of the School of Engineering and Applied Science of the University of Pennsylvania. Previously, Dr. Heilmeier served as a Director of TRW Inc. (automotive, space, defense, and information technology, 1992 2002), Compaq (1994 2002), Automatic Data Processing, Inc. (ADP) (technology based business outsourcing, 1995 2002), INET Technologies Inc. (telecommunications network surveillance, 2001 2004), and Teletech Holdings (customer management services). He is the recipient of the 2005 Kyoto Prize in Advanced Technology for his invention of the liquid display.
Year of Election or Appointment: 2001
Prior to Ms. Knowles’ retirement in June 2000, she served as Executive Vice President and Chief Financial Officer of Atlantic Richfield Company (ARCO) (diversified energy, 1996 2000). From 1993 to 1996, she was a Senior Vice President of ARCO and President of ARCO Transportation Company. She served as a Director of ARCO from 1996 to 1998. She currently serves as a Director of Phelps Dodge Corporation (copper mining and manufacturing) and McKesson Corporation (healthcare service, 2002 present). Ms. Knowles is a Trustee of the Brookings Institution and the Catalina Island Conservancy and also serves as a member of the Advisory Board for the School of Engineering of the University of Southern California.
23 Annual Report
Trustees and Officers - continued
|
| | Name, Age; Principal Occupation
Ned C. Lautenbach (61)
|
Year of Election or Appointment: 2000
Mr. Lautenbach has been a partner of Clayton, Dubilier & Rice, Inc. (private equity investment firm) since September 1998. Previously, Mr. Lautenbach was with the International Business Machines Corporation (IBM) from 1968 until his retirement in 1998. Mr. Lautenbach serves as a Director of Italtel Holding S.p.A. (telecommunications (Milan, Italy), 2004 present) and Eaton Corpora tion (diversified industrial) as well as the Philharmonic Center for the Arts in Naples, Florida. He also is a member of the Board of Trustees of Fairfield University (2005 present), as well as a member of the Council on Foreign Relations.
Year of Election or Appointment: 1997
Prior to his retirement in December 1994, Mr. McCoy was Vice Chairman of the Board of BellSouth Corporation (telecommunications) and President of BellSouth Enterprises. He is currently a Director of Liberty Corporation (holding company), Duke Realty Corpora tion (real estate), and Progress Energy, Inc. (electric utility). He is also a partner of Franklin Street Partners (private investment management firm) and a member of the Research Triangle Foundation Board. In addition, Mr. McCoy served as the Interim Chan cellor (1999 2000) and a member of the Board of Visitors for the University of North Carolina at Chapel Hill and currently serves on the Board of Directors of the University of North Carolina Health Care System and the Board of Visitors of the Kenan Flagler Business School (University of North Carolina at Chapel Hill). He also served as Vice President of Finance for the University of North Carolina (16 school system).
Year of Election or Appointment: 2005
Ms. Small is a member (2000 present) and Chairperson (2002 present) of the Investment Committee, and a member (2002 present) of the Board of Trustees of Smith College. Previously, she served as Chief Investment Officer (1999 2000), Director of Global Equity Investments (1996 1999), and a member of the Board of Directors of Scudder, Stevens & Clark (1990 1997) and Scudder Kemper Investments (1997 1998). In addition, Ms. Small served as Co Chair (2000 2003) of the Annual Fund for the Fletcher School of Law and Diplomacy.
| | William S. Stavropoulos (66)
|
Year of Election or Appointment: 2002
Mr. Stavropoulos is Chairman of the Board (2000 present) and a Member of the Board of Directors of The Dow Chemical Company. Since joining The Dow Chemical Company in 1967, Mr. Stavropoulos served in numerous senior management positions, including President (1993 2000; 2002 2003), CEO (1995 2000; 2002 2004), and Chairman of the Executive Committee (2000 2004). Currently, he is a Director of NCR Corporation (data warehousing and technology solutions), BellSouth Corporation (telecommu nications), Chemical Financial Corporation, Maersk Inc. (industrial conglomerate, 2002 present), and Metalmark Capital (private equity investment firm, 2005 present). He also serves as a member of the Board of Trustees of the American Enterprise Institute for Public Policy Research. In addition, Mr. Stavropoulos is a member of The Business Council, J.P. Morgan International Council and the University of Notre Dame Advisory Council for the College of Science.
Year of Election or Appointment: 2005
Prior to his retirement in 2001, Mr. Wolfe was Chairman and Chief Executive Officer of Hershey Foods Corporation (1993 2001). He currently serves as a member of the boards of Adelphia Communications Corporation (2003 present), Bausch & Lomb, Inc., and Revlon Inc. (2004 present).
VIP Dynamic Capital Appreciation Portfolio
Advisory Board Member and Executive Officers:
Correspondence intended for each executive officer and Mr. Lynch may be sent to Fidelity Investments, 82 Devonshire Street, Boston, Massachusetts 02109.
| | Name, Age; Principal Occupation
Peter S. Lynch (61)
|
Year of Election or Appointment: 2003
Member of the Advisory Board of Variable Insurance Products III. Vice Chairman and a Director of FMR, and Vice Chairman (2001 present) and a Director (2000 present) of FMR Co., Inc. Previously, Mr. Lynch served as a Trustee of the Fidelity funds (1990 2003). In addition, he serves as a Trustee of Boston College, Massachusetts Eye & Ear Infirmary, Historic Deerfield, John F. Kennedy Library, and the Museum of Fine Arts of Boston.
Year of Election or Appointment: 2005
Vice President of VIP Dynamic Capital Appreciation. Mr. Churchill also serves as Vice President of certain Equity Funds
(2005 present) and certain High Income Funds (2005 present). Previously, he served as Head of Fidelity’s Fixed Income Division (2000 2005), Vice President of Fidelity’s Money Market Funds (2000 2005), Vice President of Fidelity’s Bond Funds, and Senior Vice President of FIMM (2000) and FMR. Mr. Churchill joined Fidelity in 1993 as Vice President and Group Leader of Taxable Fixed Income Investments.
Year of Election or Appointment: 1998
Secretary of VIP Dynamic Capital Appreciation. He also serves as Secretary of other Fidelity funds; Vice President, General Counsel, and Secretary of FMR Co., Inc. (2001 present) and FMR; Assistant Secretary of Fidelity Management & Research (U.K.) Inc. (2001 present), Fidelity Management & Research (Far East) Inc. (2001 present), and Fidelity Investments Money Management, Inc. (2001 present). Mr. Roiter is an Adjunct Member, Faculty of Law, at Boston College Law School (2003 present). Previously, Mr. Roiter served as Vice President and Secretary of FDC (1998 2005).
Year of Election or Appointment: 2003
Assistant Secretary of VIP Dynamic Capital Appreciation. Mr. Fross also serves as Assistant Secretary of other Fidelity funds (2003 present), Vice President and Secretary of FDC (2005 present), and is an employee of FMR.
Year of Election or Appointment: 2004
President, Treasurer, and Anti Money Laundering (AML) officer of VIP Dynamic Capital Appreciation. Ms. Reynolds also serves as President, Treasurer, and AML officer of other Fidelity funds (2004) and is a Vice President (2003) and an employee (2002) of FMR. Before joining Fidelity Investments, Ms. Reynolds worked at PricewaterhouseCoopers LLP (PwC) (1980 2002), where she was most recently an audit partner with PwC’s investment management practice.
Year of Election or Appointment: 2005
Chief Financial Officer of VIP Dynamic Capital Appreciation. Mr.Murphy also serves as Chief Financial Officer of otherFidelity funds (2005 present). He also serves as Senior Vice President of Fidelity Pricing and Cash Management Services Group (FPCMS).
| | Kenneth A. Rathgeber (58)
|
Year of Election or Appointment: 2004
Chief Compliance Officer of VIP Dynamic Capital Appreciation. Mr. Rathgeber also serves as Chief Compliance Officer of other Fidelity funds (2004) and Executive Vice President of Risk Oversight for Fidelity Investments (2002). Previously, he served as Executive Vice President and Chief Operating Officer for Fidelity Investments Institutional Services Company, Inc. (1998 2002).
Year of Election or Appointment: 2003
Deputy Treasurer of VIP Dynamic Capital Appreciation. Mr. Hebble also serves as Deputy Treasurer of other Fidelity funds (2003), and is an employee of FMR. Before joining Fidelity Investments, Mr. Hebble worked at Deutsche Asset Management where he served as Director of Fund Accounting (2002 2003) and Assistant Treasurer of the Scudder Funds (1998 2003).
25 Annual Report
Trustees and Officers - continued
|
| | Name, Age; Principal Occupation
Bryan A. Mehrmann (44)
|
Year of Election or Appointment: 2005
Deputy Treasurer of VIP Dynamic Capital Appreciation. Mr. Mehrmann also serves as Deputy Treasurer of other Fidelity funds (2005 present) and is an employee of FMR. Previously, Mr. Mehrmann served as Vice President of Fidelity Investments Institutional Services Group (FIIS)/Fidelity Investments Institutional Operations Corporation, Inc. (FIIOC) Client Services (1998 2004).
| | Kimberley H. Monasterio (42)
|
Year of Election or Appointment: 2004
Deputy Treasurer of VIP Dynamic Capital Appreciation. Ms. Monasterio also serves as Deputy Treasurer of other Fidelity funds (2004) and is an employee of FMR (2004). Before joining Fidelity Investments, Ms. Monasterio served as Treasurer (2000 2004) and Chief Financial Officer (2002 2004) of the Franklin Templeton Funds and Senior Vice President of Franklin Templeton Services, LLC (2000 2004).
Year of Election or Appointment: 2005
Deputy Treasurer of VIP Dynamic Capital Appreciation. Mr. Robins also serves as Deputy Treasurer of other Fidelity funds (2005 present) and is an employee of FMR (2004 present). Before joining Fidelity Investments, Mr. Robins worked at KPMG LLP, where he was a partner in KPMG’s department of professional practice (2002 2004) and a Senior Manager (1999 2000). In addition, Mr. Robins served as Assistant Chief Accountant, United States Securities and Exchange Commission (2000 2002).
Year of Election or Appointment: 2005
Assistant Treasurer of VIP Dynamic Capital Appreciation. Mr. Byrnes also serves as Assistant Treasurer of other Fidelity funds (2005 present) and is an employee of FMR (2005 present). Previously, Mr. Byrnes served as Vice President of FPCMS (2003 2005). Before joining Fidelity Investments, Mr. Byrnes worked at Deutsche Asset Management where he served as Vice President of the Investment Operations Group (2000 2003).
Year of Election or Appointment: 1995
Assistant Treasurer of VIP Dynamic Capital Appreciation. Mr. Costello also serves as Assistant Treasurer of other Fidelity funds and is an employee of FMR.
Year of Election or Appointment: 2004
Assistant Treasurer of VIP Dynamic Capital Appreciation. Mr. Lydecker also serves as Assistant Treasurer of other Fidelity funds (2004) and is an employee of FMR.
Year of Election or Appointment: 2002
Assistant Treasurer of VIP Dynamic Capital Appreciation. Mr. Osterheld also serves as Assistant Treasurer of other Fidelity funds (2002) and is an employee of FMR.
Year of Election or Appointment: 2005
Assistant Treasurer of VIP Dynamic Capital Appreciation. Mr. Ryan also serves as Assistant Treasurer of other Fidelity funds (2005 present) and is an employee of FMR (2005 present). Previously, Mr. Ryan served as Vice President of Fund Reporting in FPCMS (1999 2005).
Year of Election or Appointment: 2005
Assistant Treasurer of VIP Dynamic Capital Appreciation. Mr. Schiavone also serves as Assistant Treasurer of other Fidelity funds (2005 present) and is an employee of FMR (2005 present). Before joining Fidelity Investments, Mr. Schiavone worked at Deutsche Asset Management, where he most recently served as Assistant Treasurer (2003 2005) of the Scudder Funds and Vice President and Head of Fund Reporting (1996 2003).
VIP Dynamic Capital Appreciation Portfolio
Board Approval of Investment Advisory Contracts and Management Fees
VIP Dynamic Capital Appreciation Portfolio
|
Each year, typically in July, the Board of Trustees, including the independent Trustees (together, the Board), votes on the renewal of the management contract and sub advisory agreements (together, the Advisory Contracts) for the fund. The Board, assisted by the advice of fund counsel and indepen dent Trustees’ counsel, requests and considers a broad range of information throughout the year.
The Board meets regularly each month except August and takes into account throughout the year matters bearing on Advisory Contracts. The Board, acting directly and through its separate committees, considers at each of its meetings factors that are relevant to the annual renewal of the fund’s Advisory Contracts, including the services and support provided to the fund and its shareholders by Fidelity. At the time of the renewal, the Board had 11 standing committees, each composed of independent Trustees with varying backgrounds, to which the Board has assigned specific subject matter responsibilities in order to enhance effective decision making by the Board. Each committee has adopted a written charter outlining the structure and purposes of the committee. One such committee, the Equity Contract Committee, meets periodically during the first six months of each year and as necessary to consider matters specifically related to the annual renewal of Advisory Contracts. The committee requests and receives information on, and makes recommendations to the independent Trustees concerning, the approval and annual review of the Advisory Contracts.
At its July 2005 meeting, the Board of Trustees, including the independent Trustees, unanimously determined to renew the Advisory Contracts for the fund. In reaching its determination, the Board considered all factors it believed relevant, including (1) the nature, extent, and quality of the services to be provided to the fund and its shareholders by Fidelity (including the investment performance of the fund); (2) the competitiveness of the manage ment fee and total expenses of the fund; (3) the total costs of the services to be provided by and the profits to be realized by the investment adviser and its affiliates from the relationship with the fund; (4) the extent to which economies of scale would be realized as the fund grows; and (5) whether fee levels reflect these economies of scale, if any, for the benefit of fund shareholders.
In determining whether to renew the Advisory Contracts for the fund, the Board ultimately reached a determination, with the assistance of fund counsel and independent Trustees’ counsel, that the renewal of the Advisory Contracts and the compensation to be received by Fidelity under the management contract is consistent with Fidelity’s fiduciary duty under applicable law. In addition to evaluating the specific factors noted above, the Board, in reaching its determination, is aware that shareholders in the fund have a broad range of investment choices available to them, including a wide choice among mutual funds offered by competitors to Fidelity, and that the fund’s shareholders, with the opportunity to review and weigh the disclosure provided by the fund in its prospectus and other public disclosures, have chosen to invest in this fund, managed by Fidelity.
Nature, Extent, and Quality of Services Provided by Fidelity. The Board considered staffing within the investment adviser, FMR, and the sub advisers (together, the Investment Advisers), including the background of the fund’s portfolio manager and the fund’s investment objective and discipline. The independent Trustees also had discussions with senior management of Fidelity’s investment operations and investment groups. The Board considered the structure of the portfolio manager compensation program and whether this structure provides appropriate incentives.
Fidelity Resources Dedicated to Investment Management and Support Services. The Board reviewed the size, education, and experience of the Invest ment Advisers’ investment staff, their use of technology, and the Investment Advisers’ approach to recruiting, training, and retaining portfolio managers and other research, advisory, and management personnel. The Board considered Fidelity’s extensive global research capabilities that enable the Investment Advisers to aggregate data from various sources in an effort to produce positive investment results. The Board noted that Fidelity’s analysts have access to a variety of technological tools that enable them to perform both fundamental and quantitative analysis and to specialize in various disciplines. The Board also considered that Fidelity’s portfolio managers and analysts have access to daily portfolio attribution that allows for monitor ing of a fund’s portfolio, as well as an electronic communication system that provides immediate real time access to research concerning issuers and credit enhancers.
Shareholder and Administrative Services. The Board considered the nature, extent, quality, and cost of administrative, distribution, and shareholder services performed by the Investment Advisers and their affiliates under the Advisory Contracts and under separate agreements covering transfer agency, pricing and bookkeeping, and securities lending services for the fund. The Board also considered the nature and extent of the Investment Advisers’ supervision of third party service providers, principally custodians and subcustodians. The Board reviewed the allocation of fund brokerage, including allocations to brokers affiliated with the Investment Advisers, the use of brokerage commissions to pay fund expenses, and the use of “soft” commission dollars to pay for research services. The Board also considered that Fidelity voluntarily decided in 2004 to stop using “soft” commission dollars to pay for market data and, instead, to pay for that data out of its own resources. The Board also considered the resources devoted to, and the record of compliance with, the fund’s compliance policies and procedures.
The Board noted that the growth of fund assets across the complex allows Fidelity to reinvest in the development of services designed to enhance the value or convenience of the Fidelity funds as investment vehicles. These services include 24 hour access to account information and market informa tion through phone representatives and over the Internet, and investor education materials and asset allocation tools.
Investment in a Large Fund Family. The Board considered the benefits to shareholders of investing in a Fidelity fund, including the benefits of investing in a fund that is part of a large family of funds offering a variety of investment disciplines and providing for a large variety of mutual fund investor services. The Board noted that, since the last Advisory Contract renewals in July 2004, Fidelity has taken a number of actions that benefited particular
27 Annual Report
Board Approval of Investment Advisory Contracts and Management Fees - continued
funds, including (i) voluntarily deciding in 2004 to stop using “soft” commission dollars to pay for market data and, instead, to pay for that data out of its own resources, (ii) contractually agreeing to impose management fee reductions and expense limitations on its five Spartan stock index funds and its stock index fund available through variable insurance products, (iii) contractually agreeing to eliminate the management fees on the Fidelity Freedom Funds and the Fidelity Advisor Freedom Funds, (iv) contractually agreeing to reduce the management fees on most of its investment grade taxable bond funds, and (v) contractually agreeing to impose expense limitations on its retail and Spartan investment grade taxable bond funds.
Investment Performance and Compliance. The Board considered whether the fund has operated within its investment objective, as well as its record of compliance with its investment restrictions. It also reviewed the fund’s absolute investment performance for each class, as well as the fund’s relative investment performance for each class measured against (i) a broad based securities market index, and (ii) a peer group of mutual funds deemed appropriate by the Board over multiple periods. Because the fund had been in existence less than five calendar years, the following charts considered by the Board show, over the one and three year periods ended December 31, 2004, the returns of Service Class 2 and Initial Class of the fund, the returns of a broad based securities market index (“benchmark”), and a range of returns of a peer group of mutual funds identified by Lipper Inc. as having an investment objective similar to that of the fund. The returns of Service Class 2 and Initial Class represent the performance of classes with the highest and lowest 12b 1 fees, respectively (not necessarily with the highest and lowest total expenses). The box within each chart shows the 25th percentile return (bottom of box) and the 75th percentile return (top of box) of the Lipper peer group. Returns shown above the box are in the first quartile and returns shown below the box are in the fourth quartile. The percentage beaten numbers noted below each chart correspond to the percen tile box and represent the percentage of funds in the Lipper peer group whose performance was equal to or lower than that of the class indicated.
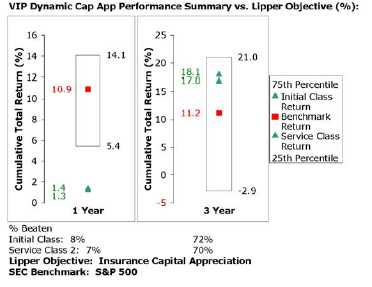
The Board reviewed the fund’s relative investment performance against its Lipper peer group and stated that the performance of Initial Class of the fund was in the fourth quartile for the one year period and the second quartile for the three year period. The Board also stated that the relative investment performance of Initial Class of the fund has compared favorably to its benchmark over time, although the fund’s one year cumulative total return was lower than its benchmark. The Board considered that the variations in performance among the fund’s classes reflect the variations in class expenses, which result in lower performance for higher expense classes.
The Board has had thorough discussions with FMR throughout the year about the Board’s and FMR’s concerns about equity research, equity fund performance, and compliance with internal policies governing gifts and entertainment. FMR has taken steps that it believes will refocus and strengthen equity research and equity portfolio management and compliance. The Board noted with favor FMR’s recent reorganization of its senior management team and FMR’s plans to dedicate additional resources to investment research, and participated in the process that led to those changes.
Based on its review, and giving particular weight to the nature and quality of the resources dedicated by the Investment Advisers to maintain and improve relative performance, the Board concluded that the nature, extent, and quality of the services provided by Fidelity will benefit the fund’s shareholders, particularly in light of the Board’s view that the fund’s shareholders benefit from investing in a fund that is part of a large family of funds offering a variety of investment disciplines and services.
Competitiveness of Management Fee and Total Fund Expenses. The Board considered the fund’s management fee and total expenses compared to “mapped groups” of competitive funds and classes. Fidelity creates “mapped groups” by combining similar Lipper investment objective categories that have comparable management fee characteristics. Combining Lipper investment objective categories aids the Board’s management fee and total expense comparisons by broadening the competitive group used for comparison and by reducing the number of universes to which various Fidelity funds are compared.
VIP Dynamic Capital Appreciation Portfolio
The Board considered two proprietary management fee comparisons for the 12 month periods shown in the chart below. The group of Lipper funds used by the Board for management fee comparisons is referred to below as the “Total Mapped Group” and, for the reasons explained above, is broader than the Lipper peer group used by the Board for performance comparisons. The Total Mapped Group comparison focuses on a fund’s standing relative to the total universe of comparable funds available to investors, in terms of gross management fees before expense reimbursements or caps. “TMG %” represents the percentage of funds in the Total Mapped Group that had management fees that were lower than the fund’s. For example, a TMG % of 12% means that 88% of the funds in the Total Mapped Group had higher management fees than the fund. The “Asset Size Peer Group” (ASPG) comparison focuses on a fund’s standing relative to non Fidelity funds similar in size to the fund within the Total Mapped Group. The ASPG represents at least 15% of the funds in the Total Mapped Group with comparable asset size and management fee characteristics, subject to a minimum of 50 funds (or all funds in the Total Mapped Group if fewer than 50). Additional information, such as the ASPG quartile (“quadrant”) in which the fund’s management fee ranked, is also included in the chart and considered by the Board.
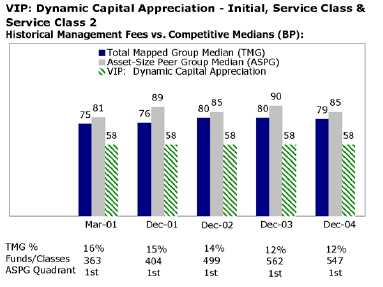
The Board noted that the fund’s management fee ranked below the median of its Total Mapped Group and below the median of its ASPG for 2004.
Based on its review, the Board concluded that the fund’s management fee was fair and reasonable in light of the services that the fund receives and the other factors considered.
In its review of each class’s total expenses, the Board considered the fund’s management fee as well as other fund or class expenses, as applicable, such as transfer agent fees, pricing and bookkeeping fees, fund paid 12b 1 fees, and custodial, legal, and audit fees. The Board also noted the effects of any waivers and reimbursements on fees and expenses. As part of its review, the Board also considered current and historical total expenses of each class of the fund compared to competitive fund median expenses. Each class of the fund is compared to those funds and classes in the Total Mapped Group (used by the Board for management fee comparisons) that have a similar sales load structure.
The Board noted that the total expenses of Initial Class ranked below its competitive median for 2004, and the total expenses of each of Service Class and Service Class 2 ranked above its competitive median for 2004. The Board noted that the fund offers multiple classes, each of which has a different 12b 1 fee structure, and that the multiple structures are intended to offer a range of pricing options for the intermediary market. The Board also noted that the total expenses of the classes vary primarily by the level of their 12b 1 fees.
Furthermore, the Board considered that on December 16, 2004, it had approved changes (effective January 1, 2005) in the transfer agent and service agreements for the fund that established maximum transfer agent fees and eliminated the minimum pricing and bookkeeping fee to prevent small funds or funds with small average account sizes from having relatively high fees in basis points (the “small fund fee reductions”). The Board considered that, if the small fund fee reductions had been in effect in 2004, the total expenses of Service Class would have ranked below the median.
In its review of total expenses, the Board also considered Fidelity fee structures and other information on clients that FMR and its affiliates service in other competitive markets, such as other mutual funds advised or subadvised by FMR or its affiliates, pension plan clients, and other institutional clients.
Based on its review, the Board concluded that the total expenses for each class of the fund were reasonable, although in some cases above the median of the universe presented for comparison, in light of the services that the fund and its shareholders receive and the other factors considered.
29 Annual Report
Board Approval of Investment Advisory Contracts and Management Fees - continued
Costs of the Services and Profitability. The Board considered the revenues earned and the expenses incurred by Fidelity in conducting the busi ness of developing, marketing, distributing, managing, administering and servicing the fund and its shareholders. The Board also considered the level of Fidelity’s profits in respect of all the Fidelity funds.
On an annual basis, FMR presents to the Board Fidelity’s profitability for the fund. Fidelity calculates the profitability for each fund, as well as aggregate profitability for groups of Fidelity funds and all Fidelity funds, using a series of detailed revenue and cost allocation methodologies which originate with the audited books and records of Fidelity. The Audit Committee of the Board reviews any significant changes from the prior year’s methodologies.
PricewaterhouseCoopers LLP (PwC), independent registered accounting firm and auditor to Fidelity and certain Fidelity funds, has been engaged annually by the Board as part of the Board’s assessment of the results of Fidelity’s profitability analysis. PwC’s engagement includes the review and assessment of Fidelity’s methodologies used in determining the revenues and expenses attributable to Fidelity’s mutual fund business, and completion of agreed upon procedures surrounding the mathematical accuracy of fund profitability and its conformity to allocation methodologies. After consider ing PwC’s reports issued under the engagement and information provided by Fidelity, the Board believes that while other allocation methods may also be reasonable, Fidelity’s profitability methodologies are reasonable in all material respects.
The Board has also reviewed Fidelity’s non fund businesses and any fall out benefits related to the mutual fund business as well as cases where Fidelity’s affiliates may benefit from or be related to the fund’s business. In addition, a special committee of the Board reviewed services provided to Fidelity by its affiliates and determined that the fees that Fidelity paid for such services were reasonable.
The Board considered the costs of the services provided by and the profits realized by Fidelity in connection with the operation of the fund and deter mined that the amount of profit is a fair entrepreneurial profit for the management of the fund.
Economies of Scale. The Board considered whether there have been economies of scale in respect of the management of the Fidelity funds, whether the Fidelity funds (including the fund) have appropriately benefited from any such economies of scale, and whether there is potential for realization of any further economies of scale. The Board considered the extent to which the fund will benefit from economies of scale through increased services to the fund, through waivers or reimbursements, or through fee or expense reductions.
The Board recognized that the fund’s management contract incorporates a “group fee” structure, which provides for lower fee rates as total fund assets under FMR’s management increase, and for higher fee rates as total fund assets under FMR’s management decrease. The Board considered that the group fee is designed to deliver the benefits of economies of scale to fund shareholders when total fund assets increase, even if assets of any particular fund are unchanged or have declined, because some portion of Fidelity’s costs are attributable to services provided to all Fidelity funds, and all funds benefit if those costs can be allocated among more assets. The Board concluded that, given the group fee structure, fund shareholders will achieve a certain level of economies of scale as assets under FMR’s management increase at the fund complex level, regardless of whether Fidelity achieves any such economies of scale.
The Board further concluded that any potential economies of scale are being shared between fund shareholders and Fidelity in an appropriate manner.
Additional Information Requested by the Board. In order to develop fully the factual basis for consideration of the Advisory Contracts, the Board requested additional information regarding (i) equity fund transfer agency fees; (ii) Fidelity’s fund profitability methodology and the impact of various changes in the methodology over time; (iii) benefits to shareholders from economies of scale; (iv) composition and characteristics of various fund and industry data used in comparisons; and (v) compensation of portfolio managers and research analysts.
Based on its evaluation of all of the conclusions noted above, and after considering all material factors, the Board ultimately concluded that the exist ing advisory fee structures are fair and reasonable, and that the fund’s existing Advisory Contracts should be renewed.
VIP Dynamic Capital Appreciation Portfolio
Investment Adviser
Fidelity Management & Research Company
Boston, MA
Investment Sub Advisers
FMR Co., Inc.
Fidelity Management & Research (U.K.) Inc.
Fidelity Management & Research (Far East) Inc.
Fidelity Investments Japan Limited
Fidelity International Investment Advisors
Fidelity International Investment Advisors (U.K.) Limited
General Distributor
Fidelity Distributors Corporation
Boston, MA
Transfer Agent
Fidelity Investments Institutional Operations Company, Inc.
Boston, MA
Service Agent
Fidelity Service Company, Inc.
Boston, MA
Custodian
State Street Bank and Trust Company
Quincy, MA
|
| | VIPDCA ANN 0206
1.751799.105
|
Fidelity® Variable Insurance Products:
Growth & Income Portfolio
|

Annual Report
December 31, 2005
|

| Contents | | | | |
| |
| Performance | | 3 | | How the fund has done over time. |
| Management’s Discussion | | 4 | | The manager’s review of fund performance, strategy and |
| | | | | outlook. |
| Shareholder Expense Example | | 5 | | An example of shareholder expenses. |
| Investment Changes | | 6 | | A summary of major shifts in the fund’s investments over the |
| | | | | past six months. |
| Investments | | 7 | | A complete list of the fund’s investments with their |
| | | | | market values. |
| Financial Statements | | 15 | | Statements of assets and liabilities, operations, and |
| | | | | changes in net assets, as well as financial highlights. |
| Notes | | 19 | | Notes to the financial statements. |
| Report of Independent Registered | | 23 | | |
| Public Accounting Firm | | | | |
| Trustees and Officers | | 24 | | |
| Distributions | | 29 | | |
| Board Approval of Investment Advisory | | 30 | | |
| Contracts and Management Fees | | | | |
| | To view a fund’s proxy voting guidelines and proxy voting record for the 12 month period ended June 30, visit www.fidelity.com/proxyvotingresults or visit the
Securities and Exchange Commission’s (SEC) web site at www.sec.gov. You may also call 1-877-208-0098 to request a free copy of the proxy voting guidelines.
Fidelity Variable Insurance Products are separate account options which are purchased through a variable insurance contract.
Standard & Poor’s, S&P and S&P 500 are registered service marks of The McGraw Hill Companies, Inc. and have been licensed for use by
Fidelity Distributors Corporation.
Other third party marks appearing herein are the property of their respective owners.
All other marks appearing herein are registered or unregistered trademarks or service marks of FMR Corp. or an affiliated company.
|
| | This report and the financial statements contained herein are submitted for the general information of the shareholders of the fund. This report is not authorized for
distribution to prospective investors in the fund unless preceded or accompanied by an effective prospectus.
A fund files its complete schedule of portfolio holdings with the SEC for the first and third quarters of each fiscal year on Form N Q. Forms N Q are available on the
SEC’s web site at http://www.sec.gov. A fund’s Forms N Q may be reviewed and copied at the SEC’s Public Reference Room in Washington, DC. Information regard
ing the operation of the SEC’s Public Reference Room may be obtained by calling 1-800-SEC-0330. For a complete list of a fund’s portfolio holdings, view the most
recent quarterly holdings report, semiannual report, or annual report on Fidelity’s web site at http://www.advisor.fidelity.com.
NOT FDIC INSURED · MAY LOSE VALUE · NO BANK GUARANTEE
Neither the fund nor Fidelity Distributors Corporation is a bank.
|
VIP Growth & Income Portfolio 2
VIP Growth & Income Portfolio
Performance: The Bottom Line
|
Average annual total return reflects the change in the value of an investment, assuming reinvestment of the class’ dividend income and capital gains (the profits earned upon the sale of securities that have grown in value) and assuming a constant rate of performance each year. During periods of reimbursement by Fidelity, a fund’s total return will be greater than it would be had the reimbursement not occurred. Performance numbers are net of all underlying fund operating expenses, but do not include any insurance charges imposed by your insurance company’s separate account. If performance information included the effect of these additional charges, the total returns would have been lower. How a fund did yesterday is no guarantee of how it will do tomorrow.
| Average Annual Total Returns | | | | | | |
| Periods ended December 31, 2005 | | Past 1 | | Past 5 | | Life of |
| | | | | year | | years | | fundA |
| VIP Growth & Income - Initial Class | | 7.63% | | 1.41% | | 7.28% |
| VIP Growth & Income - Service ClassB | | 7.53% | | 1.31% | | 7.17% |
| VIP Growth & Income - Service Class 2C | | 7.40% | | 1.15% | | 7.06% |
| VIP Growth & Income - Investor ClassD | | 7.56% | | 1.40% | | 7.40% |
| | A From December 31, 1996.
B The initial offering of Service Class shares took place on November 3, 1997. Performance for Service Class shares reflects an asset based distribution fee (12b 1 fee), and
returns prior to November 3, 1997 are those of Initial Class and do not include the effects of Service Class’ 12b 1 fee. Had Service Class shares’ 12b 1 fee been reflected, returns
prior to November 3, 1997 would have been lower.
C The initial offering of Service Class 2 shares took place on January 12, 2000. Performance for Service Class 2 shares reflects an asset based distribution fee (12b 1 fee).
Returns from November 3, 1997 to January 12, 2000 are those of Service Class which reflect a different 12b 1 fee. Service Class 2 returns prior to November 3, 1997 are those
of the Initial Class and do not include the effects of a 12b 1 fee. Had Service Class 2’s 12b 1 fee been reflected, returns prior to January 12, 2000 would have been lower.
D The initial offering of Investor Class shares took place on July 21, 2005. Returns prior to July 21, 2005 are those of Initial Class. If Investor Class’s transfer agent fee had
been reflected, returns prior to July 21, 2005 would have been lower.
|
$10,000 Life of Fund
Let’s say hypothetically that $10,000 was invested in VIP Growth & Income Portfolio Initial Class on December 31, 1996, when the fund started. The chart shows how the value of your investment would have changed, and also shows how the Standard & Poor’s 500SM Index performed over the same period.
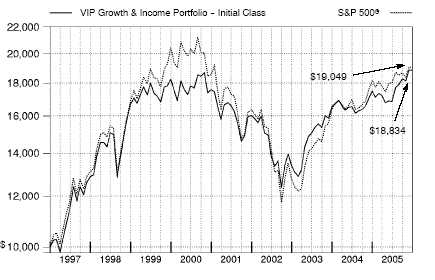
3 Annual Report
VIP Growth & Income Portfolio
Management’s Discussion of Fund Performance
|
Comments from James Catudal, who became Portfolio Manager of VIP Growth & Income Portfolio on October 31, 2005
U.S. equity benchmarks generally had positive results for the 12 months ending December 31, 2005, the third consecutive year that stocks finished in the black. Energy and utilities were the two best performing sectors, contributing greatly to the 4.91% gain of the Standard & Poor’s 500SM Index. Elsewhere, the NASDAQ Composite® Index returned 2.13%, while the Dow Jones Industrial AverageSM rose 1.72% . The U.S. economy did not decelerate as much as many had predicted, despite eight short term interest rate hikes, record high energy prices and the devastation caused by Hurricane Katrina. Meanwhile, corporate America notched its 14th consecutive quarter of double digit earnings gains through the third quarter of the year, an unprecedented streak in market history. From a style perspective, large cap stocks ended the six year reign of small caps by a narrow margin, but mid caps finished well ahead of both categories. The gap between growth and value stocks also was relatively narrow, with value gaining a slight edge.
For the 12 months that ended December 31, 2005, VIP Growth & Income Portfolio outperformed the S&P 500® as well as the 5.60% return of LipperSM Variable Annuity Growth & Income Funds Average. (For specific portfolio performance results, please refer to the performance section of this report.)
Stock selection, especially in the second half of the year, drove fund performance relative to the index. The single biggest contributor was Internet search firm Google, which continued to surpass earnings expectations. Several energy holdings performed especially well, including independent refiner Valero Energy, oil field services company Halliburton and Ultra Petroleum, an exploration and production company. The fund sold the position in Ultra Petroleum before period end. Other standouts were Swiss health care company Alcon, which specializes in eye care products, and financial services company Goldman Sachs. Holding back results were investments in two media names that declined in value despite posting good earnings results: EchoStar Communications, a satellite television provider, and Omnicom, a global advertising, marketing and public relations firm. The fund eliminated the investments in both companies as well as in telecommunication services provider Verizon, which also had disappointing results. The fund reduced its position in another poor performer during the first half of the period, Smurfit Stone Container, a producer of cardboard containers. I’d like to point out that I’ve made some major changes to the portfolio during the past two months in search of attractive investments.
The views expressed in this statement reflect those of the portfolio manager only through the end of the period of the report as stated on the cover and do not necessarily represent the views of Fidelity or any other person in the Fidelity organization. Any such views are subject to change at any time based upon market or other conditions and Fidelity disclaims any responsibility to update such views. These views may not be relied on as invest ment advice and, because investment decisions for a Fidelity fund are based on numerous factors, may not be relied on as an indication of trading intent on behalf of any Fidelity fund.
VIP Growth & Income Portfolio 4
VIP Growth & Income Portfolio
Shareholder Expense Example
|
As a shareholder of the Fund, you incur two types of costs: (1) transaction costs, and (2) ongoing costs, including management fees, distribution and/or service (12b 1) fees and other Fund expenses. This Example is intended to help you understand your ongoing costs (in dollars) of investing in the Fund and to compare these costs with the ongoing costs of investing in other mutual funds.
The actual expense Example is based on an investment of $1,000 invested at the beginning of the period and held for the entire period (July 1, 2005 to December 31, 2005) for Initial Class, Service Class and Service Class 2 and for the entire period (July 21, 2005 to December 31, 2005) for the Investor Class. The hypothetical expense Example is based on an investment of $1,000 invested for the one half year period (July 1, 2005 to December 31, 2005).
Actual Expenses
The first line of the table below for each class of the Fund provides information about actual account values and actual expenses. You may use the information in this line, together with the amount you invested, to estimate the expenses that you paid over the period. Simply divide your account value by $1,000.00 (for example, an $8,600 account value divided by $1,000.00 = 8.6), then multiply the result by the number in the first line for a class of the Fund under the heading entitled “Expenses Paid During Period” to estimate the expenses you paid on your account during this period. The estimate of expenses does not include any fees or other expenses of any variable annuity or variable life insurance product. If they were, the estimate of expenses you paid during the period would be higher, and your ending account value would be lower.
Hypothetical Example for Comparison Purposes
The second line of the table below for each class of the Fund provides information about hypothetical account values and hypothetical expenses based on a Class’ actual expense ratio and an assumed rate of return of 5% per year before expenses, which is not the Class’ actual return. The hypothetical account values and expenses may not be used to estimate the actual ending account balance or expenses you paid for the period. You may use this information to compare the ongoing costs of investing in the Fund and other funds. To do so, compare this 5% hypothetical example with the 5% hypothetical examples that appear in the shareholder reports of the other funds. The estimate of expenses does not include any fees or other expenses of any variable annuity or variable life insurance product. If they were, the estimate of expenses you paid during the period would be higher, and your ending account value would be lower.
Please note that the expenses shown in the table are meant to highlight your ongoing costs only and do not reflect any transaction costs. Therefore, the second line of the table is useful in comparing ongoing costs only, and will not help you determine the relative total costs of owning different funds.
| | | | | Ending | | | | |
| | | Beginning | | Account Value | | | | Expenses Paid |
| | | Account Value | | December 31, 2005 | | | | During Period |
| Initial Class | | | | | | | | | | |
| Actual | | $ 1,000.00 | | | | $ 1,118.30 | | | | $ 3.15B |
| HypotheticalA | | $ 1,000.00 | | | | $ 1,022.23 | | | | $ 3.01C |
| Service Class | | | | | | | | | | |
| Actual | | $ 1,000.00 | | | | $ 1,118.20 | | | | $ 3.68B |
| HypotheticalA | | $ 1,000.00 | | | | $ 1,021.73 | | | | $ 3.52C |
| Service Class 2 | | | | | | | | | | |
| Actual | | $ 1,000.00 | | | | $ 1,116.80 | | | | $ 4.48B |
| HypotheticalA | | $ 1,000.00 | | | | $ 1,020.97 | | | | $ 4.28C |
| Investor Class | | | | | | | | | | |
| Actual | | $ 1,000.00 | | | | $ 1,080.60 | | | | $ 3.65B |
| HypotheticalA | | $ 1,000.00 | | | | $ 1,021.27 | | | | $ 3.97C |
| | A 5% return per year before expenses
B Actual expenses are equal to each Class’ annualized expense ratio (shown in the table below); multiplied by the average account value over
the period, multiplied by 184/365 (to reflect the one half year period) for Initial Class, Service Class and Service Class 2 and multiplied by
164/365 (to reflect the period July 21, 2005 to December 31, 2005) for the Investor Class.
C Hypothetical expenses are equal to each Class’ annualized expense ratio (shown in the table below); multiplied by the average account
value over the period, multiplied by 184/365 (to reflect the one-half year period).
|
| | | Annualized |
| | | Expense Ratio |
| Initial Class | | 59% |
| Service Class | | 69% |
| Service Class 2 | | 84% |
| Investor Class | | 78% |
55 Annual Report
VIP Growth & Income Portfolio
Investment Changes
|
| Top Ten Stocks as of December 31, 2005 |
| | | % of fund’s | | % of fund’s net assets |
| | | net assets | | 6 months ago |
| Microsoft Corp. | | 4.4 | | 3.0 |
| General Electric Co. | | 4.1 | | 0.0 |
| American International Group, | | | | |
| Inc. | | 3.2 | | 3.2 |
| Johnson & Johnson | | 2.2 | | 0.0 |
| Exxon Mobil Corp. | | 2.2 | | 4.2 |
| UnitedHealth Group, Inc. | | 2.0 | | 1.0 |
| Bank of America Corp. | | 1.9 | | 0.0 |
| Wachovia Corp. | | 1.5 | | 0.0 |
| Schlumberger Ltd. (NY Shares) | | 1.4 | | 1.0 |
| Altria Group, Inc. | | 1.4 | | 1.7 |
| | | 24.3 | | |
| Top Five Market Sectors as of December 31, 2005 |
| | | % of fund’s | | % of fund’s net assets |
| | | net assets | | 6 months ago |
| Financials | | 19.3 | | 17.8 |
| Information Technology | | 18.4 | | 17.4 |
| Health Care | | 15.8 | | 7.7 |
| Industrials | | 13.5 | | 7.0 |
| Consumer Discretionary | | 9.0 | | 14.6 |
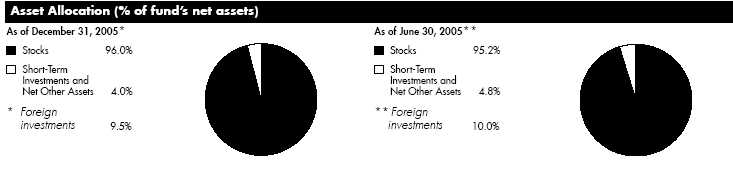
VIP Growth & Income Portfolio 6
| VIP Growth & Income Portfolio | | | | | | | | |
| Investments December 31, 2005 | | | | |
| Showing Percentage of Net Assets | | | | | | | | |
| |
| Common Stocks 96.0% | | | | | | | | |
| | | | | | | | | Shares | | Value (Note 1) |
| |
| CONSUMER DISCRETIONARY 9.0% | | | | | | | | |
| Hotels, Restaurants & Leisure 1.4% | | | | | | | | |
| Ctrip.com International Ltd. sponsored ADR | | | | | | 20,000 | | $ 1,155,000 |
| Kerzner International Ltd. (a) | | | | | | | | 40,000 | | 2,750,000 |
| Marriott International, Inc. Class A | | | | | | 55,000 | | 3,683,350 |
| Sonic Corp. (a) | | | | | | | | 160,000 | | 4,720,000 |
| Starbucks Corp. (a) | | | | | | | | 172,200 | | 5,167,722 |
| Wendy’s International, Inc. | | | | | | | | 64,700 | | 3,575,322 |
| Wynn Resorts Ltd. (a)(d) | | | | | | | | 35,400 | | 1,941,690 |
| | | | | | | | | | | 22,993,084 |
| Household Durables 0.7% | | | | | | | | | | |
| Sharp Corp. | | | | | | | | 690,000 | | 10,498,792 |
| Internet & Catalog Retail 0.7% | | | | | | | | |
| eBay, Inc. (a) | | | | | | | | 222,500 | | 9,623,125 |
| Expedia, Inc. (a) | | | | | | | | 57,200 | | 1,370,512 |
| | | | | | | | | | | 10,993,637 |
| Media 2.4% | | | | | | | | | | |
| CCE Spinco, Inc. (a) | | | | | | | | 10,625 | | 139,188 |
| Clear Channel Communications, Inc. | | | | | | 85,000 | | 2,673,250 |
| E.W. Scripps Co. Class A | | | | | | | | 175,000 | | 8,403,500 |
| Lamar Advertising Co. Class A (a) | | | | | | 74,200 | | 3,423,588 |
| News Corp. Class A | | | | | | | | 150,000 | | 2,332,500 |
| Time Warner, Inc. | | | | | | | | 440,700 | | 7,685,808 |
| Univision Communications, Inc. Class A (a) | | | | | | 188,900 | | 5,551,771 |
| Walt Disney Co. | | | | | | | | 205,000 | | 4,913,850 |
| XM Satellite Radio Holdings, Inc. Class A (a) | | | | | | 90,700 | | 2,474,296 |
| | | | | | | | | | | 37,597,751 |
| Multiline Retail – 0.9% | | | | | | | | | | |
| Dollar General Corp. | | | | | | | | 137,500 | | 2,622,125 |
| JCPenney Co., Inc. | | | | | | | | 80,000 | | 4,448,000 |
| Target Corp. | | | | | | | | 141,600 | | 7,783,752 |
| | | | | | | | | | | 14,853,877 |
| Specialty Retail 2.9% | | | | | | | | | | |
| Bed Bath & Beyond, Inc. (a) | | | | | | | | 126,600 | | 4,576,590 |
| Best Buy Co., Inc. | | | | | | | | 182,300 | | 7,926,404 |
| Chico’s FAS, Inc. (a) | | | | | | | | 10,000 | | 439,300 |
| Home Depot, Inc. | | | | | | | | 265,000 | | 10,727,200 |
| Lowe’s Companies, Inc. | | | | | | | | 79,500 | | 5,299,470 |
| PETsMART, Inc. | | | | | | | | 160,000 | | 4,105,600 |
| Staples, Inc. | | | | | | | | 386,000 | | 8,766,060 |
| Tiffany & Co., Inc. | | | | | | | | 125,000 | | 4,786,250 |
| | | | | | | | | | | 46,626,874 |
| |
| TOTAL CONSUMER DISCRETIONARY | | | | | | | | 143,564,015 |
| |
| CONSUMER STAPLES 5.5% | | | | | | | | | | |
| Beverages 0.8% | | | | | | | | | | |
| PepsiCo, Inc. | | | | | | | | 210,000 | | 12,406,800 |
See accompanying notes which are an integral part of the financial statements.
|
7
| VIP Growth & Income Portfolio | | | | |
| Investments - continued | | | | |
| |
| |
| |
| | | Shares | | Value (Note 1) |
| Food & Staples Retailing – 0.8% | | | | |
| CVS Corp. | | 258,300 | | $ 6,824,286 |
| Safeway, Inc. | | 80,000 | | 1,892,800 |
| Wal Mart Stores, Inc. | | 90,200 | | 4,221,360 |
| | | | | 12,938,446 |
| Food Products – 1.1% | | | | |
| Bunge Ltd. | | 82,600 | | 4,675,986 |
| Corn Products International, Inc. | | 26,500 | | 633,085 |
| Nestle SA sponsored ADR | | 158,900 | | 11,877,775 |
| | | | | 17,186,846 |
| Household Products – 1.4% | | | | |
| Colgate Palmolive Co. | | 340,000 | | 18,649,000 |
| Procter & Gamble Co. | | 64,100 | | 3,710,108 |
| | | | | 22,359,108 |
| Tobacco – 1.4% | | | | |
| Altria Group, Inc. | | 303,960 | | 22,711,891 |
| |
| TOTAL CONSUMER STAPLES | | | | 87,603,091 |
| |
| ENERGY 8.8% | | | | |
| Energy Equipment & Services – 5.1% | | | | |
| Cooper Cameron Corp. (a) | | 420,000 | | 17,388,000 |
| Diamond Offshore Drilling, Inc. | | 300 | | 20,868 |
| ENSCO International, Inc. | | 245,000 | | 10,865,750 |
| Halliburton Co. | | 297,400 | | 18,426,904 |
| Nabors Industries Ltd. (a) | | 77,600 | | 5,878,200 |
| Schlumberger Ltd. (NY Shares) | | 234,700 | | 22,801,105 |
| Smith International, Inc. | | 11,900 | | 441,609 |
| Weatherford International Ltd. (a) | | 150,000 | | 5,430,000 |
| | | | | 81,252,436 |
| Oil, Gas & Consumable Fuels 3.7% | | | | |
| ConocoPhillips | | 135,700 | | 7,895,026 |
| Exxon Mobil Corp. | | 607,000 | | 34,095,190 |
| Peabody Energy Corp. | | 61,600 | | 5,077,072 |
| Valero Energy Corp. | | 225,400 | | 11,630,640 |
| | | | | 58,697,928 |
| |
| TOTAL ENERGY | | | | 139,950,364 |
| |
| FINANCIALS 19.3% | | | | |
| Capital Markets 3.3% | | | | |
| Ameriprise Financial, Inc. | | 136,000 | | 5,576,000 |
| Ameritrade Holding Corp. | | 125,000 | | 3,000,000 |
| Charles Schwab Corp. | | 139,300 | | 2,043,531 |
| Franklin Resources, Inc. | | 31,600 | | 2,970,716 |
| Goldman Sachs Group, Inc. | | 65,300 | | 8,339,463 |
| Investors Financial Services Corp. | | 111,300 | | 4,099,179 |
| Merrill Lynch & Co., Inc. | | 187,200 | | 12,679,056 |
| Nomura Holdings, Inc. sponsored ADR | | 228,000 | | 4,382,160 |
| State Street Corp. | | 185,800 | | 10,300,752 |
| | | | | 53,390,857 |
See accompanying notes which are an integral part of the financial statements.
| | |
| VIP Growth & Income Portfolio | | 8 |
| Common Stocks continued | | | | |
| | | Shares | | Value (Note 1) |
| |
| FINANCIALS – continued | | | | |
| Commercial Banks – 5.2% | | | | |
| Bank of America Corp. | | 664,800 | | $ 30,680,520 |
| Mitsui Trust Holdings, Inc. | | 125,000 | | 1,501,209 |
| Mizuho Financial Group, Inc. | | 85 | | 674,781 |
| Nishi Nippon City Bank Ltd. | | 300,000 | | 1,791,273 |
| Standard Chartered PLC (United Kingdom) | | 239,600 | | 5,341,660 |
| Sumitomo Mitsui Financial Group, Inc. | | 250 | | 2,650,439 |
| Wachovia Corp. | | 449,700 | | 23,771,142 |
| Wells Fargo & Co. | | 263,400 | | 16,549,422 |
| | | | | 82,960,446 |
| Consumer Finance – 0.7% | | | | |
| American Express Co. | | 118,600 | | 6,103,156 |
| Capital One Financial Corp. (d) | | 66,300 | | 5,728,320 |
| | | | | 11,831,476 |
| Diversified Financial Services – 0.7% | | | | |
| Citigroup, Inc. | | 194,400 | | 9,434,232 |
| NETeller PLC (a) | | 112,600 | | 1,424,772 |
| | | | | 10,859,004 |
| Insurance – 7.3% | | | | |
| AFLAC, Inc. | | 55,000 | | 2,553,100 |
| American International Group, Inc. | | 748,505 | | 51,070,496 |
| Endurance Specialty Holdings Ltd. | | 64,600 | | 2,315,910 |
| Everest Re Group Ltd. | | 55,000 | | 5,519,250 |
| Fidelity National Financial, Inc. | | 190,000 | | 6,990,100 |
| Fidelity National Title Group, Inc. Class A | | 70,000 | | 1,704,500 |
| Hartford Financial Services Group, Inc. | | 169,100 | | 14,523,999 |
| National Financial Partners Corp. | | 92,000 | | 4,834,600 |
| PartnerRe Ltd. | | 26,400 | | 1,733,688 |
| Prudential Financial, Inc. | | 106,700 | | 7,809,373 |
| PXRE Group Ltd. | | 205,700 | | 2,665,872 |
| W.R. Berkley Corp. | | 89,400 | | 4,257,228 |
| XL Capital Ltd. Class A | | 145,700 | | 9,817,266 |
| | | | | 115,795,382 |
| Real Estate 0.4% | | | | |
| Equity Residential (SBI) | | 120,000 | | 4,694,400 |
| Vornado Realty Trust | | 15,900 | | 1,327,173 |
| | | | | 6,021,573 |
| Thrifts & Mortgage Finance – 1.7% | | | | |
| Freddie Mac | | 104,200 | | 6,809,470 |
| Golden West Financial Corp., Delaware | | 152,600 | | 10,071,600 |
| Hudson City Bancorp, Inc. | | 410,000 | | 4,969,200 |
| Washington Mutual, Inc. | | 118,300 | | 5,146,050 |
| | | | | 26,996,320 |
| |
| TOTAL FINANCIALS | | | | 307,855,058 |
| |
| HEALTH CARE 15.8% | | | | |
| Biotechnology – 3.5% | | | | |
| Affymetrix, Inc. (a) | | 230,900 | | 11,025,475 |
| |
| |
See accompanying notes which are an integral part of the financial statements.
| | | | |
| | | 9 | | Annual Report |
9
| VIP Growth & Income Portfolio | | | | |
| Investments - continued | | | | |
| |
| |
| |
| | | | | Shares | | Value (Note 1) |
| Amgen, Inc. (a) | | | | 222,300 | | $ 17,530,578 |
| Biogen Idec, Inc. (a) | | | | 78,000 | | 3,535,740 |
| Cephalon, Inc. (a) | | | | 58,000 | | 3,754,920 |
| Genentech, Inc. (a) | | | | 500 | | 46,250 |
| ImClone Systems, Inc. (a) | | | | 24,300 | | 832,032 |
| Invitrogen Corp. (a) | | | | 135,300 | | 9,016,392 |
| MedImmune, Inc. (a) | | | | 60,000 | | 2,101,200 |
| Protein Design Labs, Inc. (a) | | | | 234,800 | | 6,673,016 |
| Serono SA sponsored ADR (d) | | | | 61,000 | | 1,211,460 |
| | | | | | | 55,727,063 |
| Health Care Equipment & Supplies 2.2% | | | | |
| Alcon, Inc. | | | | 38,000 | | 4,924,800 |
| Baxter International, Inc. | | | | 201,100 | | 7,571,415 |
| Becton, Dickinson & Co. | | | | 135,000 | | 8,110,800 |
| Cooper Companies, Inc. | | | | 80,100 | | 4,109,130 |
| DJ Orthopedics, Inc. (a) | | | | 35,400 | | 976,332 |
| Medtronic, Inc. | | | | 79,200 | | 4,559,544 |
| Millipore Corp. (a) | | | | 1,000 | | 66,040 |
| St. Jude Medical, Inc. (a) | | | | 49,500 | | 2,484,900 |
| Zimmer Holdings, Inc. (a) | | | | 28,500 | | 1,922,040 |
| | | | | | | 34,725,001 |
| Health Care Providers & Services 3.7% | | | | |
| Aetna, Inc. | | | | 64,800 | | 6,111,288 |
| American Healthways, Inc. (a) | | | | 30,000 | | 1,357,500 |
| American Retirement Corp. (a) | | | | 36,700 | | 922,271 |
| Brookdale Senior Living, Inc. | | | | 18,200 | | 542,542 |
| Cardinal Health, Inc. | | | | 76,300 | | 5,245,625 |
| Emdeon Corp. (a) | | | | 131,000 | | 1,108,260 |
| Henry Schein, Inc. (a) | | | | 209,200 | | 9,129,488 |
| IMS Health, Inc. | | | | 99,100 | | 2,469,572 |
| UnitedHealth Group, Inc. | | | | 524,200 | | 32,573,788 |
| | | | | | | 59,460,334 |
| Pharmaceuticals 6.4% | | | | | | |
| Johnson & Johnson | | | | 589,100 | | 35,404,910 |
| Novartis AG sponsored ADR | | | | 143,800 | | 7,546,624 |
| Pfizer, Inc. | | | | 821,600 | | 19,159,712 |
| Roche Holding AG (participation certificate) | | 83,509 | | 12,539,061 |
| Schering Plough Corp. | | | | 190,800 | | 3,978,180 |
| Sepracor, Inc. (a) | | | | 40,000 | | 2,064,000 |
| Teva Pharmaceutical Industries Ltd. sponsored ADR | | 107,800 | | 4,636,478 |
| Wyeth | | | | 375,000 | | 17,276,250 |
| | | | | | | 102,605,215 |
| |
| TOTAL HEALTH CARE | | | | | | 252,517,613 |
| |
| INDUSTRIALS – 13.5% | | | | | | |
| Aerospace & Defense – 3.6% | | | | | | |
| Aviall, Inc. (a) | | | | 242,800 | | 6,992,640 |
| EDO Corp. | | | | 129,300 | | 3,498,858 |
| Goodrich Corp. | | | | 50,000 | | 2,055,000 |
| Honeywell International, Inc. | | | | 459,800 | | 17,127,550 |
See accompanying notes which are an integral part of the financial statements.
| | |
| VIP Growth & Income Portfolio | | 10 |
| Common Stocks continued | | | | | | |
| | | | | | | Shares | | Value (Note 1) |
| |
| INDUSTRIALS – continued | | | | | | | | |
| Aerospace & Defense – continued | | | | | | |
| The Boeing Co. | | | | | | 75,000 | | $ 5,268,000 |
| United Technologies Corp. | | | | | | 404,300 | | 22,604,413 |
| | | | | | | | | 57,546,461 |
| Air Freight & Logistics – 1.1% | | | | | | | | |
| Expeditors International of Washington, Inc. | | | | 48,294 | | 3,260,328 |
| FedEx Corp. | | | | | | 130,200 | | 13,461,378 |
| | | | | | | | | 16,721,706 |
| Airlines – 0.3% | | | | | | | | |
| Southwest Airlines Co. | | | | | | 310,000 | | 5,093,300 |
| Commercial Services & Supplies 0.3% | | | | | | |
| Aramark Corp. Class B | | | | | | 90,000 | | 2,500,200 |
| Robert Half International, Inc. | | | | | | 40,100 | | 1,519,389 |
| | | | | | | | | 4,019,589 |
| Construction & Engineering – 0.7% | | | | | | |
| McDermott International, Inc. (a) | | | | | | 261,800 | | 11,678,898 |
| Electrical Equipment 0.0% | | | | | | | | |
| Evergreen Solar, Inc. (a) | | | | | | 50,000 | | 532,500 |
| Industrial Conglomerates 5.3% | | | | | | | | |
| 3M Co. | | | | | | 197,600 | | 15,314,000 |
| General Electric Co. | | | | | | 1,852,300 | | 64,923,115 |
| Tyco International Ltd. | | | | | | 145,000 | | 4,184,700 |
| | | | | | | | | 84,421,815 |
| Machinery – 1.0% | | | | | | | | |
| Danaher Corp. | | | | | | 112,700 | | 6,286,406 |
| Deere & Co. | | | | | | 81,900 | | 5,578,209 |
| Pentair, Inc. | | | | | | 110,000 | | 3,797,200 |
| | | | | | | | | 15,661,815 |
| Road & Rail 1.2% | | | | | | | | |
| Laidlaw International, Inc. | | | | | | 165,800 | | 3,851,534 |
| Landstar System, Inc. | | | | | | 46,246 | | 1,930,308 |
| Norfolk Southern Corp. | | | | | | 310,000 | | 13,897,300 |
| | | | | | | | | 19,679,142 |
| |
| TOTAL INDUSTRIALS | | | | | | | | 215,355,226 |
| |
| INFORMATION TECHNOLOGY 18.4% | | | | | | |
| Communications Equipment – 3.6% | | | | | | |
| Alcatel SA sponsored ADR (a) | | | | | | 228,200 | | 2,829,680 |
| Cisco Systems, Inc. (a) | | | | | | 649,300 | | 11,116,016 |
| Comverse Technology, Inc. (a) | | | | | | 77,065 | | 2,049,158 |
| Corning, Inc. (a) | | | | | | 685,600 | | 13,478,896 |
| Juniper Networks, Inc. (a) | | | | | | 219,600 | | 4,897,080 |
| Motorola, Inc. | | | | | | 353,700 | | 7,990,083 |
| QUALCOMM, Inc. | | | | | | 260,000 | | 11,200,800 |
| Research In Motion Ltd. (a) | | | | | | 53,100 | | 3,505,591 |
| | | | | | | | | 57,067,304 |
| Computers & Peripherals 2.7% | | | | | | | | |
| Apple Computer, Inc. (a) | | | | | | 163,800 | | 11,775,582 |
| |
See accompanying notes which are an integral part of the financial statements.
| | | | | | |
| | | | | 11 | | | | Annual Report |
11
| VIP Growth & Income Portfolio | | | | |
| Investments - continued | | | | |
| |
| |
| |
| | | Shares | | Value (Note 1) |
| Dell, Inc. (a) | | 409,500 | | $ 12,280,905 |
| EMC Corp. (a) | | 926,400 | | 12,617,568 |
| Hewlett Packard Co. | | 6,900 | | 197,547 |
| NEC Corp. sponsored ADR | | 76,200 | | 471,678 |
| Seagate Technology | | 114,500 | | 2,288,855 |
| Sun Microsystems, Inc. (a) | | 648,000 | | 2,715,120 |
| | | | | 42,347,255 |
| Electronic Equipment & Instruments – 0.5% | | | | |
| Agilent Technologies, Inc. (a) | | 199,014 | | 6,625,176 |
| Symbol Technologies, Inc. | | 145,200 | | 1,861,464 |
| | | | | 8,486,640 |
| Internet Software & Services 1.5% | | | | |
| Akamai Technologies, Inc. (a) | | 17,600 | | 350,768 |
| China Finance Online Co. Ltd. ADR (a) | | 56,800 | | 372,608 |
| Google, Inc. Class A (sub. vtg.) (a) | | 33,000 | | 13,690,380 |
| Yahoo! Japan Corp | | 1,137 | | 1,726,161 |
| Yahoo!, Inc. (a) | | 219,900 | | 8,615,682 |
| | | | | 24,755,599 |
| IT Services 1.0% | | | | |
| First Data Corp. | | 171,400 | | 7,371,914 |
| Paychex, Inc. | | 207,200 | | 7,898,464 |
| | | | | 15,270,378 |
| Semiconductors & Semiconductor Equipment – 4.0% | | | | |
| Altera Corp. (a) | | 192,600 | | 3,568,878 |
| Analog Devices, Inc. | | 170,000 | | 6,097,900 |
| ASML Holding NV (NY Shares) (a) | | 300,000 | | 6,024,000 |
| Entegris, Inc. (a) | | 98,800 | | 930,696 |
| Freescale Semiconductor, Inc. Class A (a) | | 302,800 | | 7,627,532 |
| Intel Corp. | | 905,800 | | 22,608,768 |
| Lam Research Corp. (a) | | 115,000 | | 4,103,200 |
| Microchip Technology, Inc. | | 105,400 | | 3,388,610 |
| National Semiconductor Corp. | | 253,000 | | 6,572,940 |
| Taiwan Semiconductor Manufacturing Co. Ltd. sponsored ADR | | 83,600 | | 828,476 |
| Teradyne, Inc. (a) | | 140,000 | | 2,039,800 |
| | | | | 63,790,800 |
| Software 5.1% | | | | |
| BEA Systems, Inc. (a) | | 260,000 | | 2,444,000 |
| Cognos, Inc. (a) | | 79,000 | | 2,755,537 |
| FileNET Corp. (a) | | 1,100 | | 28,435 |
| Microsoft Corp. | | 2,697,200 | | 70,531,779 |
| Oracle Corp. (a) | | 230,000 | | 2,808,300 |
| Symantec Corp. (a) | | 198,200 | | 3,468,500 |
| | | | | 82,036,551 |
| |
| TOTAL INFORMATION TECHNOLOGY | | | | 293,754,527 |
| |
| MATERIALS 3.2% | | | | |
| Chemicals 1.9% | | | | |
| Ashland, Inc. | | 180,000 | | 10,422,000 |
See accompanying notes which are an integral part of the financial statements.
| | |
| VIP Growth & Income Portfolio | | 12 |
| Common Stocks continued | | | | | | |
| | | | | Shares | | Value (Note 1) |
| |
| MATERIALS – continued | | | | | | |
| Chemicals – continued | | | | | | |
| Monsanto Co. | | | | 96,010 | | $ 7,443,655 |
| Praxair, Inc. | | | | 238,800 | | 12,646,848 |
| | | | | | | 30,512,503 |
| Containers & Packaging – 0.2% | | | | | | |
| Smurfit Stone Container Corp. (a) | | | | 230,000 | | 3,259,100 |
| Metals & Mining – 1.1% | | | | | | |
| Alcoa, Inc. | | | | 160,000 | | 4,731,200 |
| Newmont Mining Corp. | | | | 246,200 | | 13,147,080 |
| | | | | | | 17,878,280 |
| |
| TOTAL MATERIALS | | | | | | 51,649,883 |
| |
| TELECOMMUNICATION SERVICES 1.5% | | | | | | |
| Diversified Telecommunication Services – 0.6% | | | | | | |
| AT&T, Inc. | | | | 302,600 | | 7,410,674 |
| Qwest Communications International, Inc. (a) | | | | 580,000 | | 3,277,000 |
| | | | | | | 10,687,674 |
| Wireless Telecommunication Services – 0.9% | | | | | | |
| Nextel Partners, Inc. Class A (a) | | | | 235,000 | | 6,565,900 |
| Sprint Nextel Corp. | | | | 321,466 | | 7,509,446 |
| | | | | | | 14,075,346 |
| |
| TOTAL TELECOMMUNICATION SERVICES | | | | | | 24,763,020 |
| |
| UTILITIES 1.0% | | | | | | |
| Independent Power Producers & Energy Traders 0.6% | | | | | | |
| TXU Corp. | | | | 185,700 | | 9,320,283 |
| |
| | | | | Shares | | Value (Note 1) |
| Multi-Utilities – 0.4% | | | | | | |
| Public Service Enterprise Group, Inc. | | | | 105,900 | | $ 6,880,323 |
| TOTAL UTILITIES | | | | | | 16,200,606 |
| |
| TOTAL COMMON STOCKS | | | | | | |
| (Cost $1,435,009,084) | | | | 1,533,213,403 |
| |
| Money Market Funds 4.2% | | | | | | |
| |
| Fidelity Cash Central Fund, 4.28% (b) | | | | 62,804,740 | | 62,804,740 |
| Fidelity Securities Lending Cash Central Fund, 4.35% (b)(c) | | | | 4,647,650 | | 4,647,650 |
| TOTAL MONEY MARKET FUNDS | | | | | | |
| (Cost $67,452,390) | | | | | | 67,452,390 |
| |
| TOTAL INVESTMENT PORTFOLIO 100.2% | | | | | | |
| (Cost $1,502,461,474) | | | | 1,600,665,793 |
| |
| NET OTHER ASSETS (0.2)% | | | | | | (3,685,849) |
| NET ASSETS 100% | | | | $ 1,596,979,944 |
| |
See accompanying notes which are an integral part of the financial statements.
| | | | | | |
| | | 13 | | | | Annual Report |
| | VIP Growth & Income Portfolio
Investments - continued
|
| | Legend
(a) Non-income producing
(b) Affiliated fund that is available only to investment companies and other accounts managed by Fidelity Investments. The rate quoted is the annualized seven-day
yield of the fund at period end. A complete unaudited listing of the fund’s holdings as of its most recent quarter end is available upon request.
(c) Investment made with cash collateral received from securities on loan.
(d) Security or a portion of the security is on loan at period end.
|
Affiliated Central Funds
Information regarding income received by the fund from the affiliated Central funds during the period is as follows:
| Fund | | Income received |
| Fidelity Cash Central Fund | | $ 2,972,486 |
| Fidelity Securities Lending Cash Central Fund | | 18,128 |
| Total | | $ 2,990,614 |
See accompanying notes which are an integral part of the financial statements.
VIP Growth & Income Portfolio 14
| VIP Growth & Income Portfolio | | | | |
| |
| Financial Statements | | | | |
| |
| |
| Statement of Assets and Liabilities | | | | |
| | | December 31, 2005 |
| |
| Assets | | | | |
| Investment in securities, at value (including securities loaned of $4,533,286) — See accompanying schedule: | | | | |
| Unaffiliated issuers (cost $1,435,009,084) | | $1,533,213,403 | | |
| Affiliated Central Funds (cost $67,452,390) | | 67,452,390 | | |
| Total Investments (cost $1,502,461,474) | | $1,600,665,793 |
| Cash | | | | 88,393 |
| Receivable for fund shares sold | | | | 434,737 |
| Dividends receivable | | | | 1,469,324 |
| Interest receivable | | | | 222,714 |
| Prepaid expenses | | | | 7,556 |
| Other receivables�� | | | | 281,277 |
| Total assets | | | | 1,603,169,794 |
| |
| Liabilities | | | | |
| Payable for fund shares redeemed | | $ 548,513 | | |
| Accrued management fee | | 634,137 | | |
| Distribution fees payable | | 158,079 | | |
| Other affiliated payables | | 133,578 | | |
| Other payables and accrued expenses | | 67,893 | | |
| Collateral on securities loaned, at value | | 4,647,650 | | |
| Total liabilities | | | | 6,189,850 |
| |
| Net Assets | | $ 1,596,979,944 |
| Net Assets consist of: | | | | |
| Paid in capital | | $1,448,917,539 |
| Undistributed net investment income | | | | 13,071,943 |
| Accumulated undistributed net realized gain (loss) on investments and foreign currency transactions | | | | 36,786,143 |
| Net unrealized appreciation (depreciation) on investments | | | | 98,204,319 |
| Net Assets | | $ 1,596,979,944 |
| |
| Statement of Assets and Liabilities continued | | | | |
| | | December 31, 2005 |
| |
| Initial Class: | | | | |
| Net Asset Value, offering price and redemption price per share ($606,101,885 ÷ 41,081,215 shares) | | | $ | 14.75 |
| Service Class: | | | | |
| Net Asset Value, offering price and redemption price per share ($384,526,645 ÷ 26,236,435 shares) | | | $ | 14.66 |
| Service Class 2: | | | | |
| Net Asset Value, offering price and redemption price per share ($596,787,338 ÷ 41,077,054 shares) | | | $ | 14.53 |
| Investor Class: | | | | |
| Net Asset Value, offering price and redemption price per share ($9,564,076 ÷ 648,822 shares) | | | $ | 14.74 |
See accompanying notes which are an integral part of the financial statements.
|
15 Annual Report
| VIP Growth & Income Portfolio | | | | | | | | |
| Financial Statements - continued | | | | | | | | |
| |
| |
| Statement of Operations | | | | | | | | |
| | | | | Year ended December 31, 2005 |
| |
| Investment Income | | | | | | | | |
| Dividends | | | | | | $ | | 20,302,284 |
| Interest | | | | | | | | 154,557 |
| Income from affiliated Central Funds (including $18,128 from security lending) | | | | | | | | 2,990,614 |
| Total income | | | | | | | | 23,447,455 |
| |
| Expenses | | | | | | | | |
| Management fee | | $ | | 7,365,883 | | | | |
| Transfer agent fees | | | | 1,057,472 | | | | |
| Distribution fees | | | | 1,746,694 | | | | |
| Accounting and security lending fees | | | | 518,731 | | | | |
| Independent trustees’ compensation | | | | 6,997 | | | | |
| Custodian fees and expenses | | | | 45,672 | | | | |
| Audit | | | | 51,284 | | | | |
| Legal | | | | 5,128 | | | | |
| Interest | | | | 9,146 | | | | |
| Miscellaneous | | | | 191,042 | | | | |
| Total expenses before reductions | | | | 10,998,049 | | | | |
| Expense reductions | | | | (873,199) | | | | 10,124,850 |
| |
| Net investment income (loss) | | | | | | | | 13,322,605 |
| Realized and Unrealized Gain (Loss) | | | | | | | | |
| Net realized gain (loss) on: | | | | | | | | |
| Investment securities: | | | | | | | | |
| Unaffiliated issuers | | | | 199,907,620 | | | | |
| Foreign currency transactions | | | | (21,184) | | | | |
| Total net realized gain (loss) | | | | | | | | 199,886,436 |
| Change in net unrealized appreciation (depreciation) on investment securities | | | | | | | | (101,373,471) |
| Net gain (loss) | | | | | | | | 98,512,965 |
| Net increase (decrease) in net assets resulting from operations | | | | | | $ | | 111,835,570 |
| |
| Statement of Changes in Net Assets | | | | | | | | |
| | | | | Year ended | | | | Year ended |
| | | | | December 31, | | | | December 31, |
| | | | | 2005 | | | | 2004 |
| Increase (Decrease) in Net Assets | | | | | | | | |
| Operations | | | | | | | | |
| Net investment income (loss) | | $ | | 13,322,605 | | $ | | 22,894,276 |
| Net realized gain (loss) | | | | 199,886,436 | | | | 6,132,638 |
| Change in net unrealized appreciation (depreciation) | | | | (101,373,471) | | | | 59,376,943 |
| Net increase (decrease) in net assets resulting from operations | | | | 111,835,570 | | | | 88,403,857 |
| Distributions to shareholders from net investment income | | | | (22,706,700) | | | | (12,447,351) |
| Share transactions - net increase (decrease) | | | | (123,504,452) | | | | 70,330,734 |
| Total increase (decrease) in net assets | | | | (34,375,582) | | | | 146,287,240 |
| |
| Net Assets | | | | | | | | |
| Beginning of period | | | | 1,631,355,526 | | | | 1,485,068,286 |
| End of period (including undistributed net investment income of $13,071,943 and undistributed net investment income | | | | | | | | |
| of $22,467,135, respectively) | | $ | | 1,596,979,944 | | $ | | 1,631,355,526 |
See accompanying notes which are an integral part of the financial statements.
| | |
| VIP Growth & Income Portfolio | | 16 |
| Financial Highlights Initial Class | | | | | | | | | | |
| Years ended December 31, | | 2005 | | 2004 | | 2003 | | 2002 | | 2001 |
| Selected Per Share Data | | | | | | | | | | |
| Net asset value, beginning of period | | $ 13.91 | | $ 13.26 | | $ 10.86 | | $ 13.19 | | $ 15.26 |
| Income from Investment Operations | | | | | | | | | | |
| Net investment income (loss)C | | 13 | | .21D | | .12 | | .15 | | .18 |
| Net realized and unrealized gain (loss) | | 92 | | .56 | | 2.42 | | (2.32) | | (1.45) |
| Total from investment operations | | 1.05 | | .77 | | 2.54 | | (2.17) | | (1.27) |
| Distributions from net investment income | | (.21) | | (.12) | | (.14) | | (.16) | | (.19) |
| Distributions from net realized gain | | — | | — | | — | | — | | (.61) |
| Total distributions | | (.21) | | (.12) | | (.14) | | (.16) | | (.80) |
| Net asset value, end of period | | $ 14.75 | | $ 13.91 | | $ 13.26 | | $ 10.86 | | $ 13.19 |
| Total ReturnA,B | | 7.63% | | 5.80% | | 23.77% | | (16.61)% | | (8.75)% |
| Ratios to Average Net AssetsE | | | | | | | | | | |
| Expenses before reductions | | 59% | | .60% | | .59% | | .59% | | .58% |
| Expenses net of fee waivers, if any | | 59% | | .60% | | .59% | | .59% | | .58% |
| Expenses net of all reductions | | 54% | | .60% | | .59% | | .58% | | .56% |
| Net investment income (loss) | | 97% | | 1.58% | | 1.02% | | 1.30% | | 1.34% |
| Supplemental Data | | | | | | | | | | |
| Net assets, end of period (000 omitted) | | $ 606,102 | | $ 704,460 | | $ 785,494 | | $ 638,124 | | $ 893,359 |
| Portfolio turnover rate | | 206% | | 23% | | 25% | | 43% | | 58% |
A Total returns do not reflect charges attributable to your insurance company’s separate account. Inclusion of these charges would reduce the total returns shown.
B Total returns would have been lower had certain expenses not been reduced during the periods shown.
C Calculated based on average shares outstanding during the period.
D Investment income per share reflects a special dividend which amounted to $.05 per share.
E Expense ratios reflect operating expenses of the class. Expenses before reductions do not reflect amounts reimbursed by the investment adviser or reductions from brokerage service arrangements or other expense offset arrangements and do
not represent the amount paid by the class during periods when reimbursements or reductions occur. Expenses net of fee waivers reflect expenses after reimbursement by the investment adviser but prior to reductions from brokerage service
arrangements or other expense offset arrangements. Expenses net of all reductions represent the net expenses paid by the class.
|
| Financial Highlights Service Class | | | | | | | | | | |
| Years ended December 31, | | 2005 | | 2004 | | 2003 | | 2002 | | 2001 |
| Selected Per Share Data | | | | | | | | | | |
| Net asset value, beginning of period | | $ 13.83 | | $ 13.18 | | $ 10.80 | | $ 13.12 | | $ 15.19 |
| Income from Investment Operations | | | | | | | | | | |
| Net investment income (loss)C | | 12 | | .19D | | .11 | | .14 | | .16 |
| Net realized and unrealized gain (loss) | | 91 | | .57 | | 2.40 | | (2.31) | | (1.44) |
| Total from investment operations | | 1.03 | | .76 | | 2.51 | | (2.17) | | (1.28) |
| Distributions from net investment income | | (.20) | | (.11) | | (.13) | | (.15) | | (.18) |
| Distributions from net realized gain | | — | | — | | — | | — | | (.61) |
| Total distributions | | (.20) | | (.11) | | (.13) | | (.15) | | (.79) |
| Net asset value, end of period | | $ 14.66 | | $ 13.83 | | $ 13.18 | | $ 10.80 | | $ 13.12 |
| Total ReturnA,B | | 7.53% | | 5.75% | | 23.60% | | (16.69)% | | (8.85)% |
| Ratios to Average Net AssetsE | | | | | | | | | | |
| Expenses before reductions | | 69% | | .70% | | .69% | | .69% | | .68% |
| Expenses net of fee waivers, if any | | 69% | | .70% | | .69% | | .69% | | .68% |
| Expenses net of all reductions | | 64% | | .70% | | .69% | | .68% | | .66% |
| Net investment income (loss) | | 87% | | 1.48% | | .92% | | 1.20% | | 1.24% |
| Supplemental Data | | | | | | | | | | |
| Net assets, end of period (000 omitted) | | $ 384,527 | | $ 401,392 | | $ 357,585 | | $ 250,160 | | $ 281,194 |
| Portfolio turnover rate | | 206% | | 23% | | 25% | | 43% | | 58% |
A Total returns do not reflect charges attributable to your insurance company’s separate account. Inclusion of these charges would reduce the total returns shown.
B Total returns would have been lower had certain expenses not been reduced during the periods shown.
C Calculated based on average shares outstanding during the period.
D Investment income per share reflects a special dividend which amounted to $.05 per share.
E Expense ratios reflect operating expenses of the class. Expenses before reductions do not reflect amounts reimbursed by the investment adviser or reductions from brokerage service arrangements or other expense offset arrangements and do
not represent the amount paid by the class during periods when reimbursements or reductions occur. Expenses net of fee waivers reflect expenses after reimbursement by the investment adviser but prior to reductions from brokerage service
arrangements or other expense offset arrangements. Expenses net of all reductions represent the net expenses paid by the class.
|
See accompanying notes which are an integral part of the financial statements.
|
17 Annual Report
| Financial Highlights Service Class 2 | | | | | | | | | | |
| Years ended December 31, | | 2005 | | 2004 | | 2003 | | 2002 | | 2001 |
| Selected Per Share Data | | | | | | | | | | |
| Net asset value, beginning of period | | $ 13.71 | | $ 13.09 | | $ 10.73 | | $ 13.07 | | $ 15.17 |
| Income from Investment Operations | | | | | | | | | | |
| Net investment income (loss)C | | 10 | | .17D | | .09 | | .12 | | .14 |
| Net realized and unrealized gain (loss) | | 90 | | .55 | | 2.39 | | (2.30) | | (1.44) |
| Total from investment operations | | 1.00 | | .72 | | 2.48 | | (2.18) | | (1.30) |
| Distributions from net investment income | | (.18) | | (.10) | | (.12) | | (.16) | | (.19) |
| Distributions from net realized gain | | — | | — | | — | | — | | (.61) |
| Total distributions | | (.18) | | (.10) | | (.12) | | (.16) | | (.80) |
| Net asset value, end of period | | $ 14.53 | | $ 13.71 | | $ 13.09 | | $ 10.73 | | $ 13.07 |
| Total ReturnA,B | | 7.40% | | 5.52% | | 23.44% | | (16.84)% | | (9.01)% |
| Ratios to Average Net AssetsE | | | | | | | | | | |
| Expenses before reductions | | 84% | | .85% | | .85% | | .85% | | .84% |
| Expenses net of fee waivers, if any | | 84% | | .85% | | .85% | | .85% | | .84% |
| Expenses net of all reductions | | 79% | | .85% | | .84% | | .84% | | .82% |
| Net investment income (loss) | | 70% | | 1.33% | | .76% | | 1.05% | | 1.08% |
| Supplemental Data | | | | | | | | | | |
| Net assets, end of period (000 omitted) | | $ 596,787 | | $ 525,504 | | $ 341,989 | | $ 140,890 | | $ 76,237 |
| Portfolio turnover rate | | 206% | | 23% | | 25% | | 43% | | 58% |
A Total returns do not reflect charges attributable to your insurance company’s separate account. Inclusion of these charges would reduce the total returns shown.
B Total returns would have been lower had certain expenses not been reduced during the periods shown.
C Calculated based on average shares outstanding during the period.
D Investment income per share reflects a special dividend which amounted to $.05 per share.
E Expense ratios reflect operating expenses of the class. Expenses before reductions do not reflect amounts reimbursed by the investment adviser or reductions from brokerage service arrangements or other expense offset arrangements and do
not represent the amount paid by the class during periods when reimbursements or reductions occur. Expenses net of fee waivers reflect expenses after reimbursement by the investment adviser but prior to reductions from brokerage service
arrangements or other expense offset arrangements. Expenses net of all reductions represent the net expenses paid by the class.
|
| Financial Highlights Investor Class | | |
| Year ended December 31, | | 2005F |
| Selected Per Share Data | | |
| Net asset value, beginning of period | | $ 13.64 |
| Income from Investment Operations | | |
| Net investment income (loss)E | | 03 |
| Net realized and unrealized gain (loss) | | 1.07 |
| Total from investment operations | | 1.10 |
| Net asset value, end of period | | $ 14.74 |
| Total ReturnB,C,D | | 8.06% |
| Ratios to Average Net AssetsG | | |
| Expenses before reductions | | 78%A |
| Expenses net of fee waivers, if any | | 78%A |
| Expenses net of all reductions | | 72%A |
| Net investment income (loss) | | 49%A |
| Supplemental Data | | |
| Net assets, end of period (000 omitted) | | $ 9,564 |
| Portfolio turnover rate | | 206% |
A Annualized
B Total returns for periods of less than one year are not annualized.
C Total returns do not reflect charges attributable to your insurance company’s separate account. Inclusion of these charges would reduce the total returns shown.
D Total returns would have been lower had certain expenses not been reduced during the periods shown.
E Calculated based on average shares outstanding during the period.
F For the period July 21, 2005 (commencement of sale of shares) to December 31, 2005.
G Expense ratios reflect operating expenses of the class. Expenses before reductions do not reflect amounts reimbursed by the investment adviser or reductions from brokerage service arrangements or other expense offset arrangements and do
not represent the amount paid by the class during periods when reimbursements or reductions occur. Expense ratios before reductions for start up periods may not be representative of longer term operating periods. Expenses net of fee waivers
reflect expenses after reimbursement by the investment adviser but prior to reductions from brokerage service arrangements or other expense offset arrangements. Expenses net of all reductions represent the net expenses paid by the class.
|
See accompanying notes which are an integral part of the financial statements.
| | |
| VIP Growth & Income Portfolio | | 18 |
Notes to Financial Statements
For the period ended December 31, 2005
|
1. Significant Accounting Policies.
|
VIP Growth & Income Portfolio (the fund) is a fund of Variable Insurance Products Fund III, (the trust) (referred to in this report as VIP Growth & Income Portfolio) and is authorized to issue an unlimited number of shares. The trust is registered under the Investment Company Act of 1940, as amended (the 1940 Act), as an open end management investment company organized as a Massachusetts business trust. Shares of the fund may only be purchased by insurance companies for the purpose of funding variable annuity or variable life insurance contracts. The fund offers the following classes of shares: Initial Class shares, Service Class shares, Service Class 2 shares and Investor Class shares. The fund commenced sale of Investor Class shares on July 21, 2005. All classes have equal rights and voting privileges, except for matters affecting a single class. Investment income, realized and unrealized capital gains and losses, the common expenses of the fund, and certain fund level expense reductions, if any, are allocated on a pro rata basis to each class based on the relative net assets of each class to the total net assets of the fund. Each class differs with respect to transfer agent and distribution and service plan fees incurred. Certain expense reductions also differ by class.
The fund may invest in affiliated money market central funds (Money Market Central Funds), which are open end investment companies available to investment companies and other accounts managed by Fidelity Management & Research Company (FMR) and its affiliates. The financial statements have been prepared in conformity with accounting principles generally accepted in the United States of America, which require management to make certain estimates and assumptions at the date of the financial statements. The following summarizes the significant accounting policies of the fund:
Security Valuation. Investments are valued and net asset value (NAV) per share is calculated (NAV calculation) as of the close of business of the New York Stock Exchange (NYSE), normally 4:00 p.m. Eastern time. Wherever possible, the fund uses independent pricing services approved by the Board of Trustees to value its investments.
Equity securities, including restricted securities, for which market quotations are readily available, are valued at the last reported sale price or official closing price as reported by an independent pricing service on the primary market or exchange on which they are traded. In the event there were no sales during the day or closing prices are not available, securities are valued at the last quoted bid price. Investments in open end mutual funds, are valued at their closing net asset value each business day. Short term securities with remaining maturities of sixty days or less for which quotations are not readily available are valued at amortized cost, which approximates value.
When current market prices or quotations are not readily available or do not accurately reflect fair value, valuations may be determined in accordance with procedures adopted by the Board of Trustees. For example, when developments occur between the close of a market and the close of the NYSE that may materially affect the value of some or all of the securities, or when trading in a security is halted, those securities may be fair valued. Factors used in the determination of fair value may include monitoring news to identify significant market or security specific events such as changes in the value of U.S. securities markets, reviewing developments in foreign markets and evaluating the performance of ADRs, futures contracts and exchange-traded funds. Because the fund’s utilization of fair value pricing depends on market activity, the frequency with which fair value pricing is used can not be predicted and may be utilized to a significant extent. The value of securities used for NAV calculation under fair value pricing may differ from published prices for the same securities.
Foreign Currency. The fund uses foreign currency contracts to facilitate transactions in foreign denominated securities. Losses from these transac tions may arise from changes in the value of the foreign currency or if the counterparties do not perform under the contracts’ terms.
Foreign denominated assets, including investment securities, and liabilities are translated into U.S. dollars at the exchange rate at period end. Pur chases and sales of investment securities, income and dividends received and expenses denominated in foreign currencies are translated into U.S. dollars at the exchange rate in effect on the transaction date.
The effects of exchange rate fluctuations on investments are included with the net realized and unrealized gain (loss) on investment securities. Other foreign currency transactions resulting in realized and unrealized gain (loss) are disclosed separately.
Investment Transactions and Income. Security transactions are accounted for as of trade date. Gains and losses on securities sold are determined on the basis of identified cost and may include proceeds received from litigation. Dividend income is recorded on the ex dividend date, except for certain dividends from foreign securities where the ex dividend date may have passed, which are recorded as soon as the fund is informed of the ex dividend date. Non cash dividends included in dividend income, if any, are recorded at the fair market value of the securities received. Distributions received on securities that represent a return of capital or capital gain are recorded as a reduction of cost of investments and/or as a realized gain. The fund estimates the components of distributions received that may be considered return of capital distributions or capital gain distributions. Interest income is accrued as earned. Interest income includes coupon interest and amortization of premium and accretion of discount on debt securities. Investment income is recorded net of foreign taxes withheld where recovery of such taxes is uncertain.
Expenses. Most expenses of the trust can be directly attributed to a fund. Expenses which cannot be directly attributed are apportioned among each fund in the trust.
19 Annual Report
| Notes to Financial Statements continued |
1. Significant Accounting Policies continued |
Income Tax Information and Distributions to Shareholders. Each year, the fund intends to qualify as a regulated investment company by distrib uting all of its taxable income and realized gains under Subchapter M of the Internal Revenue Code. As a result, no provision for income taxes is required in the accompanying financial statements. Foreign taxes are provided for based on the fund’s understanding of the tax rules and rates that exist in the foreign markets in which it invests.
Distributions are recorded on the ex dividend date. Income dividends and capital gain distributions are declared separately for each class. Income and capital gain distributions are determined in accordance with income tax regulations, which may differ from generally accepted accounting principles.
Capital accounts within the financial statements are adjusted for permanent book tax differences. These adjustments have no impact on net assets or the results of operations. Temporary book tax differences will reverse in a subsequent period.
Book tax differences are primarily due to foreign currency transactions, market discount, and losses deferred due to wash sales.
| | |
The tax basis components of distributable earnings and the federal tax cost as of period end were as follows:
| | | | |
| Unrealized appreciation | | | $ | 113,614,524 | | |
| Unrealized depreciation | | | | (19,165,326) | | |
| Net unrealized appreciation (depreciation) | | | | 94,449,198 | | |
| Undistributed ordinary income | | | | 13,029,206 | | |
| Undistributed long term capital gain | | | | 40,583,998 | | |
| Cost for federal income tax purposes | | | $ | 1,506,216,595 | | |
| |
The tax character of distributions paid was as follows:
| | | | | | |
| | | | | December 31, 2005 | | December 31, 2004 |
| Ordinary Income | | | | $ 22,706,700 | | $ 12,447,351 |
| |
| 2. Operating Policies. | | | | | | |
Repurchase Agreements. FMR has received an Exemptive Order from the Securities and Exchange Commission (the SEC) which permits the fund and other affiliated entities of FMR to transfer uninvested cash balances into joint trading accounts which are then invested in repurchase agreements. The fund may also invest directly with institutions in repurchase agreements. Repurchase agreements are collateralized by government or non government securities. Collateral is held in segregated accounts with custodian banks and may be obtained in the event of a default of the counterparty. The fund monitors, on a daily basis, the value of the collateral to ensure it is at least equal to the principal amount of the repurchase agreement (in cluding accrued interest). In the event of a default by the counterparty, realization of the collateral proceeds could be delayed, during which time the value of the collateral may decline.
3. Purchases and Sales of Investments.
Purchases and sales of securities, other than short term securities and U.S. government securities, aggregated $3,020,508,357 and $3,061,997,245, respectively.
4. Fees and Other Transactions with Affiliates.
Management Fee. FMR and its affiliates provide the fund with investment management related services for which the fund pays a monthly manage ment fee. The management fee is the sum of an individual fund fee rate that is based on an annual rate of .20% of the fund’s average net assets and a group fee rate that averaged .27% during the period. The group fee rate is based upon the average net assets of all the mutual funds advised by FMR. The group fee rate decreases as assets under management increase and increases as assets under management decrease. For the period, the total annual management fee rate was .47% of the fund’s average net assets.
Distribution and Service Plan. In accordance with Rule 12b 1 of the 1940 Act, the fund has adopted separate 12b 1 Plans for each Service Class of shares. Each Service Class pays Fidelity Distributors Corporation (FDC), an affiliate of FMR, a service fee. For the period, the service fee is based on an annual rate of .10% of Service Class’ average net assets and .25% of Service Class 2’s average net assets.
VIP Growth & Income Portfolio
|
| 4. Fees and Other Transactions with Affiliates continued |
Distribution and Service Plan continued | | |
For the period, each class paid FDC the following amounts, all of which were re allowed to insurance companies for the distribution of shares and providing shareholder support services:
| Service Class | | | $ | 382,538 |
| Service Class 2 | | | | 1,364,156 |
| | | | $ | 1,746,694 |
Transfer Agent Fees. Fidelity Investments Institutional Operations Company, Inc. (FIIOC), an affiliate of FMR, is the fund’s transfer, dividend disbursing, and shareholder servicing agent. FIIOC receives an asset based fee with respect to each class. FIIOC pays a portion of the expenses related to the typesetting, printing and mailing of shareholder reports, except proxy statements. Each class with the exception of Investor Class pays a transfer agent fee, excluding out of pocket expenses, equal to an annual rate of ..07% of their month end net assets. Investor Class pays an asset based transfer agent fee of .18% of its month end net assets. The total transfer agent fees paid by each class to FIIOC, including out of pocket expenses, were as follows:
| Initial Class | | | $ | 427,648 |
| Service Class | | | | 255,582 |
| Service Class 2 | | | | 370,341 |
| Investor Class | | | | 3,901 |
| | | | $ | 1,057,472 |
Accounting and Security Lending Fees. Fidelity Service Company, Inc. (FSC), an affiliate of FMR, maintains the fund’s accounting records. The accounting fee is based on the level of average net assets for the month. Under a separate contract, FSC administers the security lending program. The security lending fee is based on the number and duration of lending transactions.
Affiliated Central Funds. The fund may invest in Money Market Central Funds which seek preservation of capital and current income and are managed by Fidelity Investments Money Management, Inc. (FIMM), an affiliate of FMR.
The Money Market Central Funds do not pay a management fee.
|
Brokerage Commissions. The fund placed a portion of its portfolio transactions with brokerage firms which are affiliates of the investment adviser. The commissions paid to these affiliated firms were $43,302 for the period.
Interfund Lending Program. Pursuant to an Exemptive Order issued by the SEC, the fund, along with other registered investment companies having management contracts with FMR, may participate in an interfund lending program. This program provides an alternative credit facility allowing the funds to borrow from, or lend money to, other participating affiliated funds. At period end, there were no interfund loans outstanding. The fund’s activity in this program during the period for which loans were outstanding was as follows:
| | | Average Daily | | Weighted Average | | | | Interest |
| Borrower or Lender | | Loan Balance | | Interest Rate | | | | Expense |
| Borrower | | $ | | 17,164,500 | | 3.20% | | | $ | 9,146 |
| |
| 5. Committed Line of Credit. | | | | | | | | |
The fund participates with other funds managed by FMR in a $4.2 billion credit facility (the “line of credit”) to be utilized for temporary or emergency purposes to fund shareholder redemptions or for other short term liquidity purposes. The fund has agreed to pay commitment fees on its pro rata portion of the line of credit. During the period, there were no borrowings on this line of credit.
The fund lends portfolio securities from time to time in order to earn additional income. On the settlement date of the loan, the fund receives collateral (in the form of U.S. Treasury obligations, letters of credit and/or cash) against the loaned securities and maintains collateral in an amount not less than 100% of the market value of the loaned securities during the period of the loan. The market value of the loaned securities is determined at the close of business of the fund and any additional required collateral is delivered to the fund on the next business day. If the borrower defaults on its obligation to return the securities loaned because of insolvency or other reasons, a fund could experience delays and costs in recovering the securities loaned or in gaining access to the collateral. Any cash collateral received is invested in the Fidelity Securities Lending Cash Central Fund. The value of loaned securities and cash collateral at period end are disclosed on the fund’s Statement of Assets and Liabilities. Security lending income represents the income earned on investing cash collateral, less fees and expenses associated with the loan, plus any premium payments that may be received on the loan of certain types of securities.
21 Annual Report
| Notes to Financial Statements continued |
7. Expense Reductions. | | |
Many of the brokers with whom FMR places trades on behalf of the fund provided services to the fund in addition to trade execution. These services included payments of certain expenses on behalf of the fund totaling $871,655 for the period. In addition, through arrangements with the fund’s custodian, credits realized as a result of uninvested cash balances were used to reduce the fund’s expenses. During the period, these credits reduced the fund’s custody expenses by $1,544.
The fund’s organizational documents provide former and current trustees and officers with a limited indemnification against liabilities arising in connection with the performance of their duties to the fund. In the normal course of business, the fund may also enter into contracts that provide general indemnifications. The fund’s maximum exposure under these arrangements is unknown as this would be dependent on future claims that may be made against the fund. The risk of material loss from such claims is considered remote.
At the end of the period, FMR or its affiliates were the owners of record of 18% of the total outstanding shares of the fund and one otherwise unaffiliated shareholder was the owner of record of 51% of the total outstanding shares of the fund.
| 9. Distributions to Shareholders. | | | | | | | | | | | | |
| |
Distributions to shareholders of each class were as follows:
| | | | | | | | | | | | |
| Years ended December 31, | | | | | | 2005 | | | | 2004 |
| From net investment income | | | | | | | | | | | | |
| Initial Class | | | | | $ | 10,102,093 | | | $ | 6,722,963 |
| Service Class | | | | | | 5,620,334 | | | | 2,898,471 |
| Service Class 2 | | | | | | 6,984,273 | | | | 2,825,917 |
| Total | | | | | $ | 22,706,700 | | | $ | 12,447,351 |
| |
| |
| 10. Share Transactions. | | | | | | | | | | | | |
| |
Transactions for each class of shares were as follows:
| | | | | | | | | | | | |
| | | Shares | | | | Dollars |
| Years ended December 31, | | 2005 | | 2004 | | | | 2005 | | | | 2004 |
| Initial Class | | | | | | | | | | | | |
| Shares sold | | 2,834,273 | | 2,753,905 | | $ | | 39,200,777 | | $ | | 36,538,808 |
| Reinvestment of distributions | | 741,166 | | 498,736 | | | | 10,102,093 | | | | 6,722,963 |
| Shares redeemed | | (13,127,442) | | (11,869,073) | | | | (181,187,562) | | (156,807,050) |
| Net increase (decrease) | | (9,552,003) | | (8,616,432) | | $ | | (131,884,692) | | $ | | (113,545,279) |
| Service Class | | | | | | | | | | | | |
| Shares sold | | 434,637 | | 2,759,500 | | $ | | 5,919,559 | | $ | | 36,240,477 |
| Reinvestment of distributions | | 414,785 | | 216,142 | | | | 5,620,334 | | | | 2,898,471 |
| Shares redeemed | | (3,644,857) | | (1,077,681) | | | | (50,018,197) | | | | (14,210,796) |
| Net increase (decrease) | | (2,795,435) | | 1,897,961 | | $ | | (38,478,304) | | $ | | 24,928,152 |
| Service Class 2 | | | | | | | | | | | | |
| Shares sold | | 4,647,860 | | 13,125,821 | | $ | | 63,603,372 | | $ | | 171,074,614 |
| Reinvestment of distributions | | 519,277 | | 212,315 | | | | 6,984,273 | | | | 2,825,917 |
| Shares redeemed | | (2,412,711) | | (1,149,269) | | | | (33,058,649) | | | | (14,952,670) |
| Net increase (decrease) | | 2,754,426 | | 12,188,867 | | $ | | 37,528,996 | | $ | | 158,947,861 |
| Investor ClassA | | | | | | | | | | | | |
| Shares sold | | 662,399 | | — | | $ | | 9,527,602 | | $ | | — |
| Shares redeemed | | (13,577) | | — | | | | (198,054) | | | | — |
| Net increase (decrease) | | 648,822 | | — | | $ | | 9,329,548 | | $ | | — |
A Share transactions for Investor Class are for the period July 21, 2005 (commencement of sale of shares) to December 31, 2005. | | | | | | | | | | | | |
VIP Growth & Income Portfolio
|
Report of Independent Registered Public Accounting Firm
To the Trustees of Variable Insurance Products Fund III and Shareholders of VIP Growth & Income Portfolio:
We have audited the accompanying statement of assets and liabilities of VIP Growth & Income Portfolio (the Fund), a fund of Variable Insurance Products Fund III, including the schedule of investments as of December 31, 2005, and the related statement of operations for the year then ended, the statement of changes in net assets for each of the two years in the period then ended, and the financial highlights for each of the five years in the period then ended. These financial statements and financial highlights are the responsibility of the Fund’s management. Our responsibility is to express an opinion on these financial statements and financial highlights based on our audits.
We conducted our audits in accordance with standards of the Public Company Accounting Oversight Board (United States). Those standards require that we plan and perform the audit to obtain reasonable assurance about whether the financial statements and financial highlights are free of material misstatement. The Fund is not required to have, nor were we engaged to perform, an audit of its internal control over financial reporting. Our audits included consideration of internal control over financial reporting as a basis for designing audit procedures that are appropriate in the circumstances, but not for the purpose of expressing an opinion on the effectiveness of the Fund’s internal control over financial reporting. Accordingly, we express no such opinion. An audit also includes examining, on a test basis, evidence supporting the amounts and disclosures in the financial statements, assessing the accounting principles used and significant estimates made by management, as well as evaluating the overall financial statement presentation. Our procedures included confirmation of securities owned as of December 31, 2005, by correspondence with the custodians and brokers. We believe that our audits provide a reasonable basis for our opinion.
In our opinion, the financial statements and financial highlights referred to above present fairly, in all material respects, the financial position of VIP Growth & Income Portfolio as of December 31, 2005, the results of its operations for the year then ended, the changes in its net assets for each of the two years in the period then ended, and its financial highlights for each of the five years in the period then ended, in conformity with accounting principles generally accepted in the United States of America.
/s/ Deloitte & Touche LLP
DELOITTE & TOUCHE LLP
Boston, Massachusetts
February 14, 2006
|
23 Annual Report
The Trustees, Member of the Advisory Board, and executive officers of the trust and fund, as applicable, are listed below. The Board of Trustees governs the fund and is responsible for protecting the interests of shareholders. The Trustees are experienced executives who meet periodically throughout the year to oversee the fund’s activities, review contractual arrangements with companies that provide services to the fund, and review the fund’s performance. Except for William O. McCoy and Albert R. Gamper, Jr., each of the Trustees oversees 326 funds advised by FMR or an affiliate. Mr. McCoy oversees 328 funds advised by FMR or an affiliate. Mr. Gamper oversees 235 funds advised by FMR or an affiliate.
The Trustees hold office without limit in time except that (a) any Trustee may resign; (b) any Trustee may be removed by written instrument, signed by at least two thirds of the number of Trustees prior to such removal; (c) any Trustee who requests to be retired or who has become incapac itated by illness or injury may be retired by written instrument signed by a majority of the other Trustees; and (d) any Trustee may be removed at any special meeting of shareholders by a two thirds vote of the outstanding voting securities of the trust. Each Trustee who is not an interested person (as defined in the 1940 Act) (Independent Trustee), shall retire not later than the last day of the calendar year in which his or her 72nd birthday occurs. The Independent Trustees may waive this mandatory retirement age policy with respect to individual Trustees. The executive officers and Advisory Board Member hold office without limit in time, except that any officer and Advisory Board Member may resign or may be removed by a vote of a majority of the Trustees at any regular meeting or any special meeting of the Trustees. Except as indicated, each individual has held the office shown or other offices in the same company for the past five years.
The fund’s Statement of Additional Information (SAI) includes more information about the Trustees. To request a free copy, call Fidelity at 1-877-208-0098.
Interested Trustees*:
Correspondence intended for each Trustee who is an interested person may be sent to Fidelity Investments, 82 Devonshire Street, Boston, Massa chusetts 02109.
| | Name, Age; Principal Occupation
Edward C. Johnson 3d (75)
|
Year of Election or Appointment: 1994
Mr. Johnson is Chairman of the Board of Trustees. Mr. Johnson serves as Chief Executive Officer, Chairman, and a Director of FMR Corp.; a Director and Chairman of the Board and of the Executive Committee of FMR; Chairman and a Director of Fidelity Man agement & Research (Far East) Inc.; Chairman and a Director of Fidelity Investments Money Management, Inc.; and Chairman (2001 present) and a Director (2000 present) of FMR Co., Inc.
Year of Election or Appointment: 2005
Mr. Jonas is Senior Vice President of VIP Growth & Income (2005 present). He also serves as Senior Vice President of other Fidelity funds (2005 present). Mr. Jonas is Executive Director of FMR (2005 present). Previously, Mr. Jonas served as President of Fidelity Enterprise Operations and Risk Services (2004 2005), Chief Administrative Officer (2002 2004), and Chief Financial Officer of FMR Co. (1998 2000). Mr. Jonas has been with Fidelity Investments since 1987 and has held various financial and management positions including Chief Financial Officer of FMR. In addition, he serves on the Boards of Boston Ballet (2003 present) and Simmons College (2003 present).
Year of Election or Appointment: 2003
Mr. Reynolds is a Director (2003 present) and Chief Operating Officer (2002 present) of FMR Corp. He also serves on the Board at Fidelity Investments Canada, Ltd. (2000 present). Previously, Mr. Reynolds served as President of Fidelity Investments Institutional Retirement Group (1996 2000).
* Trustees have been determined to be “Interested Trustees” by virtue of, among other things, their affiliation with the trust or various entities under common control with FMR.
VIP Growth & Income Portfolio
|
Correspondence intended for each Independent Trustee (that is, the Trustees other than the Interested Trustees) may be sent to Fidelity Investments, P.O. Box 55235, Boston, Massachusetts 02205-5235.
| | Name, Age; Principal Occupation
Dennis J. Dirks (57)
|
Year of Election or Appointment: 2005
Prior to his retirement in May 2003, Mr. Dirks was Chief Operating Officer and a member of the Board of The Depository Trust & Clearing Corporation (DTCC) (1999 2003). He also served as President, Chief Operating Officer, and Board member of The De pository Trust Company (DTC) (1999 2003) and President and Board member of the National Securities Clearing Corporation (NSCC) (1999 2003). In addition, Mr. Dirks served as Chief Executive Officer and Board member of the Government Securities Clearing Corporation (2001 2003) and Chief Executive Officer and Board member of the Mortgage Backed Securities Clearing Corporation (2001 2003). Mr. Dirks also serves as a Trustee of Manhattan College (2005 present).
| | Albert R. Gamper, Jr. (63)
|
Year of Election or Appointment: 2006
Mr. Gamper also serves as a Trustee (2006 present) or Member of the Advisory Board (2005 present) of other investment compa nies advised by FMR. Prior to his retirement in December 2004, Mr. Gamper served as Chairman of the Board of CIT Group Inc. (commercial finance). During his tenure with CIT Group Inc. Mr. Gamper served in numerous senior management positions, includ ing Chairman (1987 1989; 1999 2001; 2002 2004), Chief Executive Officer (1987 2004), and President (1989 2002). He cur rently serves as a member of the Board of Directors of Public Service Enterprise Group (utilities, 2001 present), Chairman of the Board of Governors, Rutgers University (2004 present), and Chairman of the Board of Saint Barnabas Health Care System.
Year of Election or Appointment: 1997
Dr. Gates is Chairman of the Independent Trustees (2006 present). Dr. Gates is President of Texas A&M University (2002 present). He was Director of the Central Intelligence Agency (CIA) from 1991 to 1993. From 1989 to 1991, Dr. Gates served as Assistant to the President of the United States and Deputy National Security Advisor. Dr. Gates is a Director of NACCO Industries, Inc. (mining and manufacturing), Parker Drilling Co., Inc. (drilling and rental tools for the energy industry, 2001 present), and Brinker International (restaurant management, 2003 present). Previously, Dr. Gates served as a Director of LucasVarity PLC (automotive components and diesel engines), a Director of TRW Inc. (automotive, space, defense, and information technology), and Dean of the George Bush School of Government and Public Service at Texas A&M University (1999 2001). Dr. Gates also is a Trustee of the Forum for International Policy.
Year of Election or Appointment: 2004
Dr. Heilmeier is Chairman Emeritus of Telcordia Technologies (communication software and systems), where prior to his retirement, he served as company Chairman and Chief Executive Officer. He currently serves on the Boards of Directors of The Mitre Corpo ration (systems engineering and information technology support for the government), and HRL Laboratories (private research and development, 2004 present). He is Chairman of the General Motors Science & Technology Advisory Board and a Life Fellow of the Institute of Electrical and Electronics Engineers (IEEE) (2000 present). Dr. Heilmeier is a member of the Defense Science Board and the National Security Agency Advisory Board. He is also a member of the National Academy of Engineering, the American Academy of Arts and Sciences, and the Board of Overseers of the School of Engineering and Applied Science of the University of Pennsylvania. Previously, Dr. Heilmeier served as a Director of TRW Inc. (automotive, space, defense, and information technology, 1992 2002), Compaq (1994 2002), Automatic Data Processing, Inc. (ADP) (technology based business outsourcing, 1995 2002), INET Technologies Inc. (telecommunications network surveillance, 2001 2004), and Teletech Holdings (customer management ser vices). He is the recipient of the 2005 Kyoto Prize in Advanced Technology for his invention of the liquid display.
Year of Election or Appointment: 2001
Prior to Ms. Knowles’ retirement in June 2000, she served as Executive Vice President and Chief Financial Officer of Atlantic Rich field Company (ARCO) (diversified energy, 1996 2000). From 1993 to 1996, she was a Senior Vice President of ARCO and President of ARCO Transportation Company. She served as a Director of ARCO from 1996 to 1998. She currently serves as a Director of Phelps Dodge Corporation (copper mining and manufacturing) and McKesson Corporation (healthcare service, 2002 present). Ms. Knowles is a Trustee of the Brookings Institution and the Catalina Island Conservancy and also serves as a member of the Advisory Board for the School of Engineering of the University of Southern California.
25 Annual Report
Trustees and Officers - continued
|
| | Name, Age; Principal Occupation
Ned C. Lautenbach (61)
|
Year of Election or Appointment: 2000
Mr. Lautenbach has been a partner of Clayton, Dubilier & Rice, Inc. (private equity investment firm) since September 1998. Pre viously, Mr. Lautenbach was with the International Business Machines Corporation (IBM) from 1968 until his retirement in 1998. Mr. Lautenbach serves as a Director of Italtel Holding S.p.A. (telecommunications (Milan, Italy), 2004 present) and Eaton Corpora tion (diversified industrial) as well as the Philharmonic Center for the Arts in Naples, Florida. He also is a member of the Board of Trustees of Fairfield University (2005 present), as well as a member of the Council on Foreign Relations.
Year of Election or Appointment: 1997
Prior to his retirement in December 1994, Mr. McCoy was Vice Chairman of the Board of BellSouth Corporation (telecommunica tions) and President of BellSouth Enterprises. He is currently a Director of Liberty Corporation (holding company), Duke Realty Cor poration (real estate), and Progress Energy, Inc. (electric utility). He is also a partner of Franklin Street Partners (private investment management firm) and a member of the Research Triangle Foundation Board. In addition, Mr. McCoy served as the Interim Chan cellor (1999 2000) and a member of the Board of Visitors for the University of North Carolina at Chapel Hill and currently serves on the Board of Directors of the University of North Carolina Health Care System and the Board of Visitors of the Kenan Flagler Business School (University of North Carolina at Chapel Hill). He also served as Vice President of Finance for the University of North Carolina (16 school system).
Year of Election or Appointment: 2005
Ms. Small is a member (2000 present) and Chairperson (2002 present) of the Investment Committee, and a member (2002 present) of the Board of Trustees of Smith College. Previously, she served as Chief Investment Officer (1999 2000), Director of Global Equity Investments (1996 1999), and a member of the Board of Directors of Scudder, Stevens & Clark (1990 1997) and Scudder Kemper Investments (1997 1998). In addition, Ms. Small served as Co Chair (2000 2003) of the Annual Fund for the Fletcher School of Law and Diplomacy.
| | William S. Stavropoulos (66)
|
Year of Election or Appointment: 2002
Mr. Stavropoulos is Chairman of the Board (2000 present) and a Member of the Board of Directors of The Dow Chemical Company. Since joining The Dow Chemical Company in 1967, Mr. Stavropoulos served in numerous senior management posi tions, including President (1993 2000; 2002 2003), CEO (1995 2000; 2002 2004), and Chairman of the Executive Committee (2000 2004). Currently, he is a Director of NCR Corporation (data warehousing and technology solutions), BellSouth Corporation (telecommunications), Chemical Financial Corporation, Maersk Inc. (industrial conglomerate, 2002 present), and Metalmark Capi tal (private equity investment firm, 2005 present). He also serves as a member of the Board of Trustees of the American Enterprise Institute for Public Policy Research. In addition, Mr. Stavropoulos is a member of The Business Council, J.P. Morgan International Council and the University of Notre Dame Advisory Council for the College of Science.
Year of Election or Appointment: 2005
Prior to his retirement in 2001, Mr. Wolfe was Chairman and Chief Executive Officer of Hershey Foods Corporation (1993 2001). He currently serves as a member of the boards of Adelphia Communications Corporation (2003 present), Bausch & Lomb, Inc., and Revlon Inc. (2004 present).
Advisory Board Member and Executive Officers:
Correspondence intended for each executive officer and Mr. Lynch may be sent to Fidelity Investments, 82 Devonshire Street, Boston, Massachu setts 02109.
| | Name, Age; Principal Occupation
Peter S. Lynch (61)
|
Year of Election or Appointment: 2003
Member of the Advisory Board of Variable Insurance Products Fund III. Vice Chairman and a Director of FMR, and Vice Chairman (2001 present) and a Director (2000 present) of FMR Co., Inc. Previously, Mr. Lynch served as a Trustee of the Fidelity funds (1990 2003). In addition, he serves as a Trustee of Boston College, Massachusetts Eye & Ear Infirmary, Historic Deerfield, John F. Kennedy Library, and the Museum of Fine Arts of Boston.
VIP Growth & Income Portfolio
|
Name, Age; Principal Occupation
Dwight D. Churchill (52)
|
Year of Election or Appointment: 2005
Vice President of VIP Growth & Income. Mr. Churchill also serves as Vice President of certain Equity Funds (2005 present) and certain High Income Funds (2005 present). Previously, he served as Head of Fidelity’s Fixed Income Division (2000 2005), Vice President of Fidelity’s Money Market Funds (2000 2005), Vice President of Fidelity’s Bond Funds, and Senior Vice President of FIMM (2000) and FMR. Mr. Churchill joined Fidelity in 1993 as Vice President and Group Leader of Taxable Fixed Income Investments.
Year of Election or Appointment: 2005
Vice President of VIP Growth & Income. Mr. Catudal also serves as Vice President of other funds advised by FMR. Prior to assuming his current responsibilities, Mr. Catudal worked as a research analyst and manager. Mr. Catudal also serves as a Vice President of FMR (2002) and FMR Co., Inc. (2002).
Year of Election or Appointment: 1998
Secretary of VIP Growth & Income. He also serves as Secretary of other Fidelity funds; Vice President, General Counsel, and Secretary of FMR Co., Inc. (2001 present) and FMR; Assistant Secretary of Fidelity Management & Research (U.K.) Inc. (2001 present), Fidelity Management & Research (Far East) Inc. (2001 present), and Fidelity Investments Money Management, Inc. (2001 present). Mr. Roiter is an Adjunct Member, Faculty of Law, at Boston College Law School (2003 present). Previously, Mr. Roiter served as Vice President and Secretary of Fidelity Distributors Corporation (FDC) (1998 2005).
Year of Election or Appointment: 2003
Assistant Secretary of VIP Growth & Income. Mr. Fross also serves as Assistant Secretary of other Fidelity funds (2003 present), Vice President and Secretary of FDC (2005 present), and is an employee of FMR.
Year of Election or Appointment: 2004
President, Treasurer, and Anti Money Laundering (AML) officer of VIP Growth & Income. Ms. Reynolds also serves as President, Treasurer, and AML officer of other Fidelity funds (2004) and is a Vice President (2003) and an employee (2002) of FMR. Before joining Fidelity Investments, Ms. Reynolds worked at PricewaterhouseCoopers LLP (PwC) (1980 2002), where she was most recently an audit partner with PwC’s investment management practice.
Year of Election or Appointment: 2005
Chief Financial Officer of VIP Growth & Income. Mr. Murphy also serves as Chief Financial Officer of other Fidelity funds (2005 present). He also serves as Senior Vice President of Fidelity Pricing and Cash Management Services Group (FPCMS).
Kenneth A. Rathgeber (58)
|
Year of Election or Appointment: 2004
Chief Compliance Officer of VIP Growth & Income. Mr. Rathgeber also serves as Chief Compliance Officer of other Fidelity funds (2004) and Executive Vice President of Risk Oversight for Fidelity Investments (2002). Previously, he served as Executive Vice Presi dent and Chief Operating Officer for Fidelity Investments Institutional Services Company, Inc. (1998 2002).
Year of Election or Appointment: 2003
Deputy Treasurer of VIP Growth & Income. Mr. Hebble also serves as Deputy Treasurer of other Fidelity funds (2003), and is an employee of FMR. Before joining Fidelity Investments, Mr. Hebble worked at Deutsche Asset Management where he served as Di rector of Fund Accounting (2002 2003) and Assistant Treasurer of the Scudder Funds (1998 2003).
27 Annual Report
Trustees and Officers - continued
|
| | Name, Age; Principal Occupation
Bryan A. Mehrmann (44)
|
Year of Election or Appointment: 2005
Deputy Treasurer of VIP Growth & Income. Mr. Mehrmann also serves as Deputy Treasurer of other Fidelity funds (2005 present) and is an employee of FMR. Previously, Mr. Mehrmann served as Vice President of Fidelity Investments Institutional Services Group (FIIS)/Fidelity Investments Institutional Operations Corporation, Inc. (FIIOC) Client Services (1998 2004).
| | Kimberley H. Monasterio (42)
|
Year of Election or Appointment: 2004
Deputy Treasurer of VIP Growth & Income. Ms. Monasterio also serves as Deputy Treasurer of other Fidelity funds (2004) and is an employee of FMR (2004). Before joining Fidelity Investments, Ms. Monasterio served as Treasurer (2000 2004) and Chief Financial Officer (2002 2004) of the Franklin Templeton Funds and Senior Vice President of Franklin Templeton Services, LLC (2000 2004).
Year of Election or Appointment: 2005
Deputy Treasurer of VIP Growth & Income. Mr. Robins also serves as Deputy Treasurer of other Fidelity funds (2005 present) and is an employee of FMR (2004 present). Before joining Fidelity Investments, Mr. Robins worked at KPMG LLP, where he was a partner in KPMG’s department of professional practice (2002 2004) and a Senior Manager (1999 2000). In addition, Mr. Robins served as Assistant Chief Accountant, United States Securities and Exchange Commission (2000 2002).
Year of Election or Appointment: 2005
Assistant Treasurer of VIP Growth & Income. Mr. Byrnes also serves as Assistant Treasurer of other Fidelity funds (2005 present) and is an employee of FMR (2005 present). Previously, Mr. Byrnes served as Vice President of FPCMS (2003 2005). Before joining Fidelity Investments, Mr. Byrnes worked at Deutsche Asset Management where he served as Vice President of the Investment Op erations Group (2000 2003).
Year of Election or Appointment: 1996
Assistant Treasurer of VIP Growth & Income. Mr. Costello also serves as Assistant Treasurer of other Fidelity funds and is an em ployee of FMR.
Year of Election or Appointment: 2004
Assistant Treasurer of VIP Growth & Income. Mr. Lydecker also serves as Assistant Treasurer of other Fidelity funds (2004) and is an employee of FMR.
Year of Election or Appointment: 2002
Assistant Treasurer of VIP Growth & Income. Mr. Osterheld also serves as Assistant Treasurer of other Fidelity funds (2002) and is an employee of FMR.
Year of Election or Appointment: 2005
Assistant Treasurer of VIP Growth & Income. Mr. Ryan also serves as Assistant Treasurer of other Fidelity funds (2005 present) and is an employee of FMR (2005 present). Previously, Mr. Ryan served as Vice President of Fund Reporting in FPCMS (1999 2005).
Year of Election or Appointment: 2005
Assistant Treasurer of VIP Growth & Income. Mr. Schiavone also serves as Assistant Treasurer of other Fidelity funds (2005 present) and is an employee of FMR (2005 present). Before joining Fidelity Investments, Mr. Schiavone worked at Deutsche Asset Manage ment, where he most recently served as Assistant Treasurer (2003 2005) of the Scudder Funds and Vice President and Head of Fund Reporting (1996 2003).
VIP Growth & Income Portfolio
|
The Board of Trustees of VIP Growth & Income Portfolio voted to pay to shareholders of record at the opening of business on record date, the following distributions per share derived from capital gains realized from sales of portfolio securities, and dividends derived from net invest ment income:
| | | Pay Date | | Record Date | | Dividends | | Capital Gains |
| Initial Class | | 2/10/06 | | 2/10/06 | | $.136 | | $.380 |
| Service Class | | 2/10/06 | | 2/10/06 | | $.122 | | $.380 |
| Service Class 2 | | 2/10/06 | | 2/10/06 | | $.105 | | $.380 |
| Investor Class | | 2/10/06 | | 2/10/06 | | $.142 | | $.380 |
A percentage of the dividends distributed during the fiscal year for the following classes qualifies for the dividends received deduction for corporate shareholders:
| Initial Class | | 100% |
| Service Class | | 100% |
| Service Class 2 | | 100% |
The fund hereby designates as a capital gain dividend with respect to the taxable year ended December 31, 2005, $40,583,998, or, if subse quently determined to be different, the net capital gain of such year.
The fund will notify shareholders in January 2006 of amounts for use in preparing 2005 income tax returns.
29 Annual Report
Board Approval of Investment Advisory Contracts and Management Fees
VIP Growth & Income Portfolio
|
Each year, typically in July, the Board of Trustees, including the independent Trustees (together, the Board), votes on the renewal of the management contract and sub advisory agreements (together, the Advisory Contracts) for the fund. The Board, assisted by the advice of fund counsel and indepen dent Trustees’ counsel, requests and considers a broad range of information throughout the year.
The Board meets regularly each month except August and takes into account throughout the year matters bearing on Advisory Contracts. The Board, acting directly and through its separate committees, considers at each of its meetings factors that are relevant to the annual renewal of the fund’s Advisory Contracts, including the services and support provided to the fund and its shareholders by Fidelity. At the time of the renewal, the Board had 11 standing committees, each composed of independent Trustees with varying backgrounds, to which the Board has assigned specific subject matter responsibilities in order to enhance effective decision making by the Board. Each committee has adopted a written charter outlining the structure and purposes of the committee. One such committee, the Equity Contract Committee, meets periodically during the first six months of each year and as necessary to consider matters specifically related to the annual renewal of Advisory Contracts. The committee requests and receives information on, and makes recommendations to the independent Trustees concerning, the approval and annual review of the Advisory Contracts.
At its July 2005 meeting, the Board of Trustees, including the independent Trustees, unanimously determined to renew the Advisory Contracts for the fund. In reaching its determination, the Board considered all factors it believed relevant, including (1) the nature, extent, and quality of the services to be provided to the fund and its shareholders by Fidelity (including the investment performance of the fund); (2) the competitiveness of the manage ment fee and total expenses of the fund; (3) the total costs of the services to be provided by and the profits to be realized by the investment adviser and its affiliates from the relationship with the fund; (4) the extent to which economies of scale would be realized as the fund grows; and (5) whether fee levels reflect these economies of scale, if any, for the benefit of fund shareholders.
In determining whether to renew the Advisory Contracts for the fund, the Board ultimately reached a determination, with the assistance of fund counsel and independent Trustees’ counsel, that the renewal of the Advisory Contracts and the compensation to be received by Fidelity under the management contract is consistent with Fidelity’s fiduciary duty under applicable law. In addition to evaluating the specific factors noted above, the Board, in reaching its determination, is aware that shareholders in the fund have a broad range of investment choices available to them, including a wide choice among mutual funds offered by competitors to Fidelity, and that the fund’s shareholders, with the opportunity to review and weigh the disclosure provided by the fund in its prospectus and other public disclosures, have chosen to invest in this fund, managed by Fidelity.
Nature, Extent, and Quality of Services Provided by Fidelity. The Board considered staffing within the investment adviser, FMR, and the sub advisers (together, the Investment Advisers), including the background of the fund’s portfolio manager and the fund’s investment objective and discipline. The independent Trustees also had discussions with senior management of Fidelity’s investment operations and investment groups. The Board considered the structure of the portfolio manager compensation program and whether this structure provides appropriate incentives.
Fidelity Resources Dedicated to Investment Management and Support Services. The Board reviewed the size, education, and experience of the Invest ment Advisers’ investment staff, their use of technology, and the Investment Advisers’ approach to recruiting, training, and retaining portfolio managers and other research, advisory, and management personnel. The Board considered Fidelity’s extensive global research capabilities that enable the Investment Advisers to aggregate data from various sources in an effort to produce positive investment results. The Board noted that Fidelity’s analysts have access to a variety of technological tools that enable them to perform both fundamental and quantitative analysis and to specialize in various disciplines. The Board also considered that Fidelity’s portfolio managers and analysts have access to daily portfolio attribution that allows for monitor ing of a fund’s portfolio, as well as an electronic communication system that provides immediate real time access to research concerning issuers and credit enhancers.
Shareholder and Administrative Services. The Board considered the nature, extent, quality, and cost of administrative, distribution, and shareholder services performed by the Investment Advisers and their affiliates under the Advisory Contracts and under separate agreements covering transfer agency, pricing and bookkeeping, and securities lending services for the fund. The Board also considered the nature and extent of the Investment Advisers’ supervision of third party service providers, principally custodians and subcustodians. The Board reviewed the allocation of fund brokerage, including allocations to brokers affiliated with the Investment Advisers, the use of brokerage commissions to pay fund expenses, and the use of “soft” commission dollars to pay for research services. The Board also considered that Fidelity voluntarily decided in 2004 to stop using “soft” commission dollars to pay for market data and, instead, to pay for that data out of its own resources. The Board also considered the resources devoted to, and the record of compliance with, the fund’s compliance policies and procedures.
The Board noted that the growth of fund assets across the complex allows Fidelity to reinvest in the development of services designed to enhance the value or convenience of the Fidelity funds as investment vehicles. These services include 24 hour access to account information and market informa tion through phone representatives and over the Internet, and investor education materials and asset allocation tools.
Investment in a Large Fund Family. The Board considered the benefits to shareholders of investing in a Fidelity fund, including the benefits of investing in a fund that is part of a large family of funds offering a variety of investment disciplines and providing for a large variety of mutual fund investor services. The Board noted that, since the last Advisory Contract renewals in July 2004, Fidelity has taken a number of actions that benefited particular
VIP Growth & Income Portfolio
|
funds, including (i) voluntarily deciding in 2004 to stop using “soft” commission dollars to pay for market data and, instead, to pay for that data out of its own resources, (ii) contractually agreeing to impose management fee reductions and expense limitations on its five Spartan stock index funds and its stock index fund available through variable insurance products, (iii) contractually agreeing to eliminate the management fees on the Fidelity Freedom Funds and the Fidelity Advisor Freedom Funds, (iv) contractually agreeing to reduce the management fees on most of its investment grade taxable bond funds, and (v) contractually agreeing to impose expense limitations on its retail and Spartan investment grade taxable bond funds.
Investment Performance and Compliance. The Board considered whether the fund has operated within its investment objective, as well as its record of compliance with its investment restrictions. It also reviewed the fund’s absolute investment performance for each class, as well as the fund’s relative investment performance for each class measured against (i) a broad based securities market index, and (ii) a peer group of mutual funds deemed appropriate by the Board over multiple periods. The following charts considered by the Board show, over the one , three , and five year periods ended December 31, 2004, the returns of Service Class and Initial Class of the fund, the returns of a broad based securities market index (“benchmark”), and a range of returns of a peer group of mutual funds identified by Lipper Inc. as having an investment objective similar to that of the fund. The returns of Service Class and Initial Class represent the performance of classes with high and low 12b 1 fees, respectively (not necessarily with the highest and lowest total expenses). (Unlike Service Class, Service Class 2, which has a higher 12b 1 fee than Service Class, did not have five years of performance as of December 31, 2004.) The box within each chart shows the 25th percentile return (bottom of box) and the 75th percentile return (top of box) of the Lipper peer group. Returns shown above the box are in the first quartile and returns shown below the box are in the fourth quartile. The percentage beaten numbers noted below each chart correspond to the percentile box and represent the percentage of funds in the Lipper peer group whose performance was equal to or lower than that of the class indicated.

The Board reviewed the fund’s relative investment performance against its Lipper peer group and stated that the performance of Initial Class of the fund was in the fourth quartile for the one year period and the third quartile for the three and five year periods. The Board also stated that the relative investment performance of the fund was lower than its benchmark for certain periods, although the five year cumulative total return of the fund was higher than its benchmark. The Board considered that the variations in performance among the fund’s classes reflect the variations in class expenses, which result in lower performance for higher expense classes. The Board discussed with FMR actions to be taken by FMR to improve the fund’s disap pointing performance.
The Board has had thorough discussions with FMR throughout the year about the Board’s and FMR’s concerns about equity research, equity fund performance, and compliance with internal policies governing gifts and entertainment. FMR has taken steps that it believes will refocus and strengthen equity research and equity portfolio management and compliance. The Board noted with favor FMR’s recent reorganization of its senior management team and FMR’s plans to dedicate additional resources to investment research, and participated in the process that led to those changes.
Based on its review, and giving particular weight to the nature and quality of the resources dedicated by the Investment Advisers to maintain and improve relative performance, the Board concluded that the nature, extent, and quality of the services provided by Fidelity will benefit the fund’s shareholders, particularly in light of the Board’s view that the fund’s shareholders benefit from investing in a fund that is part of a large family of funds offering a variety of investment disciplines and services.
Competitiveness of Management Fee and Total Fund Expenses. The Board considered the fund’s management fee and total expenses compared to “mapped groups” of competitive funds and classes. Fidelity creates “mapped groups” by combining similar Lipper investment objective categories that have comparable management fee characteristics. Combining Lipper investment objective categories aids the Board’s management fee
31 Annual Report
Board Approval of Investment Advisory Contracts and Management Fees - continued
and total expense comparisons by broadening the competitive group used for comparison and by reducing the number of universes to which various Fidelity funds are compared.
The Board considered two proprietary management fee comparisons for the 12 month periods shown in the chart below. The group of Lipper funds used by the Board for management fee comparisons is referred to below as the “Total Mapped Group” and, for the reasons explained above, is broader than the Lipper peer group used by the Board for performance comparisons. The Total Mapped Group comparison focuses on a fund’s standing relative to the total universe of comparable funds available to investors, in terms of gross management fees before expense reimbursements or caps. “TMG %” represents the percentage of funds in the Total Mapped Group that had management fees that were lower than the fund’s. For example, a TMG % of 16% means that 84% of the funds in the Total Mapped Group had higher management fees than the fund. The “Asset Size Peer Group” (ASPG) comparison focuses on a fund’s standing relative to non Fidelity funds similar in size to the fund within the Total Mapped Group. The ASPG represents at least 15% of the funds in the Total Mapped Group with comparable asset size and management fee characteristics, subject to a minimum of 50 funds (or all funds in the Total Mapped Group if fewer than 50). Additional information, such as the ASPG quartile (“quadrant”) in which the fund’s management fee ranked, is also included in the chart and considered by the Board.

The Board noted that the fund’s management fee ranked below the median of its Total Mapped Group and below the median of its ASPG for 2004.
Based on its review, the Board concluded that the fund’s management fee was fair and reasonable in light of the services that the fund receives and the other factors considered.
In its review of each class’s total expenses, the Board considered the fund’s management fee as well as other fund or class expenses, as applicable, such as transfer agent fees, pricing and bookkeeping fees, fund paid 12b 1 fees, and custodial, legal, and audit fees. The Board also noted the effects of any waivers and reimbursements on fees and expenses. As part of its review, the Board also considered current and historical total expenses of each class of the fund compared to competitive fund median expenses. Each class of the fund is compared to those funds and classes in the Total Mapped Group (used by the Board for management fee comparisons) that have a similar sales load structure.
The Board noted that each class’s total expenses ranked below its competitive median for 2004.
In its review of total expenses, the Board also considered Fidelity fee structures and other information on clients that FMR and its affiliates service in other competitive markets, such as other mutual funds advised or subadvised by FMR or its affiliates, pension plan clients, and other institutional clients.
Based on its review, the Board concluded that the total expenses for each class of the fund were reasonable in light of the services that the fund and its shareholders receive and the other factors considered.
Costs of the Services and Profitability. The Board considered the revenues earned and the expenses incurred by Fidelity in conducting the busi ness of developing, marketing, distributing, managing, administering and servicing the fund and its shareholders. The Board also considered the level of Fidelity’s profits in respect of all the Fidelity funds.
On an annual basis, FMR presents to the Board Fidelity’s profitability for the fund. Fidelity calculates the profitability for each fund, as well as aggregate profitability for groups of Fidelity funds and all Fidelity funds, using a series of detailed revenue and cost allocation methodologies which originate with the audited books and records of Fidelity. The Audit Committee of the Board reviews any significant changes from the prior year’s methodologies.
VIP Growth & Income Portfolio
|
PricewaterhouseCoopers LLP (PwC), independent registered accounting firm and auditor to Fidelity and certain Fidelity funds, has been engaged annually by the Board as part of the Board’s assessment of the results of Fidelity’s profitability analysis. PwC’s engagement includes the review and assessment of Fidelity’s methodologies used in determining the revenues and expenses attributable to Fidelity’s mutual fund business, and completion of agreed upon procedures surrounding the mathematical accuracy of fund profitability and its conformity to allocation methodologies. After consider ing PwC’s reports issued under the engagement and information provided by Fidelity, the Board believes that while other allocation methods may also be reasonable, Fidelity’s profitability methodologies are reasonable in all material respects.
The Board has also reviewed Fidelity’s non fund businesses and any fall out benefits related to the mutual fund business as well as cases where Fidelity’s affiliates may benefit from or be related to the fund’s business. In addition, a special committee of the Board reviewed services provided to Fidelity by its affiliates and determined that the fees that Fidelity paid for such services were reasonable.
The Board considered the costs of the services provided by and the profits realized by Fidelity in connection with the operation of the fund and deter mined that the amount of profit is a fair entrepreneurial profit for the management of the fund.
Economies of Scale. The Board considered whether there have been economies of scale in respect of the management of the Fidelity funds, whether the Fidelity funds (including the fund) have appropriately benefited from any such economies of scale, and whether there is potential for realization of any further economies of scale. The Board considered the extent to which the fund will benefit from economies of scale through increased services to the fund, through waivers or reimbursements, or through fee or expense reductions.
The Board recognized that the fund’s management contract incorporates a “group fee” structure, which provides for lower fee rates as total fund assets under FMR’s management increase, and for higher fee rates as total fund assets under FMR’s management decrease. The Board considered that the group fee is designed to deliver the benefits of economies of scale to fund shareholders when total fund assets increase, even if assets of any particular fund are unchanged or have declined, because some portion of Fidelity’s costs are attributable to services provided to all Fidelity funds, and all funds benefit if those costs can be allocated among more assets. The Board concluded that, given the group fee structure, fund shareholders will achieve a certain level of economies of scale as assets under FMR’s management increase at the fund complex level, regardless of whether Fidelity achieves any such economies of scale.
The Board further concluded that any potential economies of scale are being shared between fund shareholders and Fidelity in an appropriate manner.
Additional Information Requested by the Board. In order to develop fully the factual basis for consideration of the Advisory Contracts, the Board requested additional information regarding (i) equity fund transfer agency fees; (ii) Fidelity’s fund profitability methodology and the impact of various changes in the methodology over time; (iii) benefits to shareholders from economies of scale; (iv) composition and characteristics of various fund and industry data used in comparisons; and (v) compensation of portfolio managers and research analysts.
Based on its evaluation of all of the conclusions noted above, and after considering all material factors, the Board ultimately concluded that the exist ing advisory fee structures are fair and reasonable, and that the fund’s existing Advisory Contracts should be renewed.
33 Annual Report
VIP Growth & Income Portfolio
|
35 Annual Report
Investment Adviser
Fidelity Management & Research Company
Boston, MA
Investment Sub Advisers
FMR Co., Inc.
Fidelity Management & Research (U.K.) Inc.
Fidelity Management & Research (Far East) Inc.
Fidelity Investments Japan Limited
Fidelity International Investment Advisors
Fidelity International Investment Advisors (U.K.) Limited
General Distributor
Fidelity Distributors Corporation
Boston, MA
Transfer and Service Agents
Fidelity Investments Institutional Operations Company, Inc.
Boston, MA
Fidelity Service Company, Inc.
Boston, MA
Custodian
JPMorgan Chase Bank
New York, NY
|
VIPGI ANN 0206
1.540026.108
|
Fidelity® Variable Insurance Products:
Growth Opportunities Portfolio
|

| | Annual Report
December 31, 2005
|

| Contents | | | | |
| |
| Performance | | 3 | | How the fund has done over time. |
| Management’s Discussion | | 4 | | The manager’s review of fund performance, strategy |
| | | | | and outlook. |
| Shareholder Expense Example | | 5 | | An example of shareholder expenses. |
| Investment Changes | | 6 | | A summary of major shifts in the fund’s investments |
| | | | | over the past six months. |
| Investments | | 7 | | A complete list of the fund’s investments with their |
| | | | | market values. |
| Financial Statements | | 14 | | Statements of assets and liabilities, operations, and |
| | | | | changes in net assets, as well as financial highlights. |
| Notes | | 18 | | Notes to the financial statements. |
| Report of Independent Registered Public | | 22 | | |
| Accounting Firm | | | | |
| Trustees and Officers | | 23 | | |
| Distributions | | 29 | | |
| Board Approval of Investment Advisory | | 30 | | |
| Contracts and Management Fees | | | | |
| | To view a fund’s proxy voting guidelines and proxy voting record for the 12 month period ended June 30, visit www.fidelity.com/proxyvotingresults or visit the
Securities and Exchange Commission’s (SEC) web site at www.sec.gov. You may also call 1-877-208-0098 to request a free copy of the proxy voting guidelines.
Fidelity Variable Insurance Products are separate account options which are purchased through a variable insurance contract.
Standard & Poor’s, S&P and S&P 500 are registered service marks of The McGraw Hill Companies, Inc. and have been licensed for use by
Fidelity Distributors Corporation.
Other third party marks appearing herein are the property of their respective owners.
All other marks appearing herein are registered or unregistered trademarks or service marks of FMR Corp. or an affiliated company.
|
| | This report and the financial statements contained herein are submitted for the general information of the shareholders of the fund. This report is not authorized for
distribution to prospective investors in the fund unless preceded or accompanied by an effective prospectus.
A fund files its complete schedule of portfolio holdings with the SEC for the first and third quarters of each fiscal year on Form N Q. Forms N Q are available on
the SEC’s web site at http://www.sec.gov. A fund’s Forms N Q may be reviewed and copied at the SEC’s Public Reference Room in Washington, DC. Information
regarding the operation of the SEC’s Public Reference Room may be obtained by calling 1-800-SEC-0330. For a complete list of a fund’s portfolio holdings, view the
most recent quarterly holdings report, semiannual report, or annual report on Fidelity’s web site at http://www.advisor.fidelity.com.
NOT FDIC INSURED · MAY LOSE VALUE · NO BANK GUARANTEE
Neither the fund nor Fidelity Distributors Corporation is a bank.
|
VIP Growth Opportunities Portfolio 2
VIP Growth Opportunities Portfolio
Performance: The Bottom Line
|
Average annual total return reflects the change in the value of an investment, assuming reinvestment of the class’ dividend income and capital gains (the profits earned upon the sale of securities that have grown in value) and assuming a constant rate of performance each year. During periods of reimbursement by Fidelity, a fund’s total return will be greater than it would be had the reimbursement not occurred. Performance numbers are net of all underlying fund operating expenses, but do not include any insurance charges imposed by your insurance company’s separate account. If performance information included the effect of these additional charges, the total returns would have been lower. How a fund did yesterday is no guarantee of how it will do tomorrow.
| Average Annual Total Returns | | | | | | |
| Periods ended December 31, 2005 | | Past 1 | | Past 5 | | Past 10 |
| | | year | | years | | years |
| VIP Growth Opportunities - Initial Class | | 8.89% | | 0.28% | | 5.32% |
| VIP Growth Opportunities - Service ClassA | | 8.86% | | 0.18% | | 5.24% |
| VIP Growth Opportunities - Service Class 2B | | 8.68% | | 0.02% | | 5.14% |
| VIP Growth Opportunities - Investor ClassC | | 8.83% | | 0.26% | | 5.31% |
A The initial offering of Service Class shares took place November 3, 1997. Performance for Service Class shares reflects an asset based service fee (12b 1 fee), and returns
prior to November 3, 1997 are those of Initial Class and do not include the effects of Service Class 12b 1 fee. Had Service Class shares’ 12b 1 fee been reflected, returns prior to
November 3, 1997 would have been lower.
B The initial offering of Service Class 2 shares took place January 12, 2000. Performance for Service Class 2 shares reflects an asset based service fee (12b 1 fee). Returns
from November 3, 1997 to January 12, 2000 are those of Service Class which reflect a different 12b 1 fee. Service Class 2 returns prior to November 3, 1997 are those of Initial
Class and do not include the effects of a 12b 1 fee. Had Service Class 2 shares’ 12b 1 fee been reflected, returns prior to January 12, 2000 would have been lower.
C The initial offering of Investor Class took place on July 21, 2005. Returns prior to July 21, 2005 are those of Initial Class. If Investor Class’s transfer agent fee had been
reflected, returns prior to July 21, 2005 would have been lower.
|
$10,000 Over 10 Years
Let’s say hypothetically that $10,000 was invested in VIP Growth Opportunities Portfolio Initial Class on December 31, 1995. The chart shows how the value of your investment would have changed, and also shows how the S&P 500® Index performed over the same period.

3 Annual Report
VIP Growth Opportunities Portfolio
Management’s Discussion of Fund Performance
|
Comments from John Porter, who became Portfolio Manager of VIP Growth Opportunities Portfolio on September 19, 2005
U.S. equity benchmarks generally had positive results for the 12 months ending December 31, 2005, the third consecutive year that stocks finished in the black. Energy and utilities were the two best performing sectors, contributing greatly to the 4.91% gain of the Standard & Poor’s 500SM Index. Elsewhere, the NASDAQ Composite® Index returned 2.13%, while the Dow Jones Industrial AverageSM rose 1.72% . The U.S. economy did not decelerate as much as many had predicted, despite eight short term interest rate hikes, record high energy prices and the devastation caused by Hurricane Katrina. Meanwhile, corporate America notched its 14th consecutive quarter of double digit earnings gains through the third quarter of the year, an unprecedented streak in market history. From a style perspective, large cap stocks ended the six year reign of small caps by a narrow margin, but mid caps finished well ahead of both categories. The gap between growth and value stocks also was relatively narrow, with value gaining a slight edge.
During the past year, the fund beat both the LipperSM Variable Annuity Growth Funds Average, which gained 7.67%, and the S&P 500®. (For specific portfolio performance results, please refer to the performance section of this report.) Strong stock selection drove the fund’s significant outperformance relative to the index, led by technology stocks Google and Yahoo!, two large holdings that benefited from strong growth in Internet advertising. In consumer discretionary an area I added to considerably, along with technology retailer eBay contributed to returns when its core online auction business regained momentum. Sizable positions in energy services companies Halliburton and Schlumberger performed well in the high oil price environment, while some good picks in health care and consumer staples including insurer UnitedHealth Group and consumer products giant Gillette, which was acquired by Procter & Gamble also contributed. Procter & Gamble is no longer held in the fund. On the other hand, several technology hardware and equipment stocks detracted from relative performance, including Network Appliance and Juniper Networks. Canada based Research In Motion, the manufacturer of the BlackBerry wireless communications device, also was weak due to concerns that alleged patent violations might cause the product’s withdrawal from the U.S. market. Symantec, the desktop security software giant, stumbled in response to a merger announce ment with VERITAS that was poorly received by the market. Elsewhere, weak results in the industrials and consumer durables/apparel, as well as an underweighting in surging utilities stocks, also worked against the fund.
The views expressed in this statement reflect those of the portfolio manager only through the end of the period of the report as stated on the cover and do not necessarily represent the views of Fidelity or any other person in the Fidelity organization. Any such views are subject to change at any time based upon market or other conditions and Fidelity disclaims any responsibility to update such views. These views may not be relied on as invest ment advice and, because investment decisions for a Fidelity fund are based on numerous factors, may not be relied on as an indication of trading intent on behalf of any Fidelity fund.
VIP Growth Opportunities Portfolio 4
| | VIP Growth Opportunities Portfolio
Shareholder Expense Example
|
As a shareholder of the Fund, you incur two types of costs: (1) transaction costs, and (2) ongoing costs, including management fees, distribution and/or service (12b 1) fees and other Fund expenses. This Example is intended to help you understand your ongoing costs (in dollars) of investing in the Fund and to compare these costs with the ongoing costs of investing in other mutual funds.
The actual expense Example is based on an investment of $1,000 invested at the beginning of the period and held for the entire period (July 1, 2005 to December 31, 2005) for Initial Class, Service Class and Service Class 2 and for the entire period (July 21, 2005 to December 31, 2005) for Investor Class. The hypothetical expense Example is based on an investment of $1,000 invested for the one half year period (July 1, 2005 to December 31, 2005).
Actual Expenses
The first line of the table below for each class of the Fund provides information about actual account values and actual expenses. You may use the information in this line, together with the amount you invested, to estimate the expenses that you paid over the period. Simply divide your account value by $1,000.00 (for example, an $8,600 account value divided by $1,000.00 = 8.6), then multiply the result by the number in the first line for a class of the Fund under the heading entitled “Expenses Paid During Period” to estimate the expenses you paid on your account during this period. The estimate of expenses does not include any fees or other expenses of any variable annuity or variable life insurance product. If they were, the estimate of expenses you paid during the period would be higher, and your ending account value would be lower.
Hypothetical Example for Comparison Purposes
The second line of the table below for each class of the Fund provides information about hypothetical account values and hypothetical expenses based on a Class’ actual expense ratio and an assumed rate of return of 5% per year before expenses, which is not the Class’ actual return. The hypothetical account values and expenses may not be used to estimate the actual ending account balance or expenses you paid for the period. You may use this information to compare the ongoing costs of investing in the Fund and other funds. To do so, compare this 5% hypothetical example with the 5% hypothetical examples that appear in the shareholder reports of the other funds. The estimate of expenses does not include any fees or other expenses of any variable annuity or variable life insurance product. If they were, the estimate of expenses you paid during the period would be higher, and your ending account value would be lower.
Please note that the expenses shown in the table are meant to highlight your ongoing costs only and do not reflect any transaction costs. Therefore, the second line of the table is useful in comparing ongoing costs only, and will not help you determine the relative total costs of owning different funds.
| | | | | Ending | | | | |
| | | Beginning | | Account Value | | | | Expenses Paid |
| | | Account Value | | December 31, 2005 | | | | During Period |
| Initial Class | | | | | | | | |
| Actual | | $ 1,000.00 | | $ 1,098.90 | | | | $ 3.65B |
| HypotheticalA | | $ 1,000.00 | | $ 1,021.73 | | | | $ 3.52C |
| Service Class | | | | | | | | |
| Actual | | $ 1,000.00 | | $ 1,098.90 | | | | $ 4.18B |
| HypotheticalA | | $ 1,000.00 | | $ 1,021.22 | | | | $ 4.02C |
| Service Class 2 | | | | | | | | |
| Actual | | $ 1,000.00 | | $ 1,098.20 | | | | $ 5.08B |
| HypotheticalA | | $ 1,000.00 | | $ 1,020.37 | | | | $ 4.89C |
| Investor Class | | | | | | | | |
| Actual | | $ 1,000.00 | | $ 1,069.80 | | | | $ 4.05B |
| HypotheticalA | | $ 1,000.00 | | $ 1,020.82 | | | | $ 4.43C |
A 5% return per year before expenses
B Actual expenses are equal to each Class’ annualized expense ratio (shown in the table below); multiplied by the average account value over
the period, multiplied by 184/365 (to reflect the one half year period) for Initial Class, Service Class and Service Class 2 and multiplied by
164/365 (to reflect the period July 21, 2005 to December 31, 2005) for Investor Class.
C Hypothetical expenses are equal to each Class’ annualized expense ratio (shown in the table below); multiplied by the average account
value over the period, multiplied by 184/365 (to reflect the one-half year period).
|
| | | Annualized |
| | | Expense Ratio |
| Initial Class | | 69% |
| Service Class | | 79% |
| Service Class 2 | | 96% |
| Investor Class | | 87% |
55 Annual Report
| VIP Growth Opportunities Portfolio | | |
| Investment Changes | | |
| |
| |
| Top Ten Stocks as of December 31, 2005 |
| | | % of fund’s | | % of fund’s net assets |
| | | net assets | | 6 months ago |
| Google, Inc. Class A (sub. vtg.) | | 8.4 | | 1.1 |
| eBay, Inc. | | 5.8 | | 0.0 |
| Yahoo!, Inc. | | 5.4 | | 1.2 |
| UnitedHealth Group, Inc. | | 4.8 | | 1.3 |
| Sprint Nextel Corp. | | 3.7 | | 0.0 |
| Halliburton Co. | | 2.7 | | 1.4 |
| General Electric Co. | | 2.6 | | 4.7 |
| KB Home | | 2.5 | | 0.0 |
| D.R. Horton, Inc. | | 2.0 | | 0.0 |
| Research In Motion Ltd. | | 1.5 | | 0.0 |
| | | 39.4 | | |
Top Five Market Sectors as of December 31, 2005 |
| | | % of fund’s | | % of fund’s net assets |
| | | net assets | | 6 months ago |
| Information Technology | | 30.0 | | 20.1 |
| Consumer Discretionary | | 26.0 | | 15.9 |
| Health Care | | 12.7 | | 12.5 |
| Energy | | 10.1 | | 7.9 |
| Financials | | 8.8 | | 14.1 |
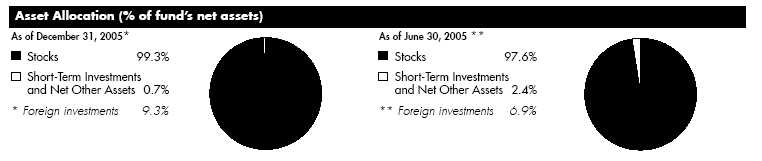
VIP Growth Opportunities Portfolio 6
| VIP Growth Opportunities Portfolio | | | | | | |
| Investments December 31, 2005 | | | | |
| Showing Percentage of Net Assets | | | | | | |
| |
| Common Stocks 99.3% | | | | | | |
| | | | | | | Shares | | Value (Note 1) |
| |
| CONSUMER DISCRETIONARY 26.0% | | | | | | |
| Diversified Consumer Services 0.1% | | | | | | |
| Apollo Group, Inc. Class A (a) | | | | | | 7,000 | | $ 423,220 |
| Hotels, Restaurants & Leisure 2.6% | | | | | | |
| Carnival Corp. unit | | | | | | 24,800 | | 1,326,056 |
| Harrah’s Entertainment, Inc. | | | | | | 10,600 | | 755,674 |
| Hilton Hotels Corp. | | | | | | 23,770 | | 573,095 |
| Las Vegas Sands Corp. | | | | | | 176,900 | | 6,982,243 |
| Sportingbet PLC | | | | | | 209,200 | | 1,237,109 |
| Starbucks Corp. (a) | | | | | | 21,400 | | 642,214 |
| Starwood Hotels & Resorts Worldwide, Inc. unit | | | | 28,800 | | 1,839,168 |
| Wynn Resorts Ltd. (a) | | | | | | 67,800 | | 3,718,830 |
| | | | | | | | | 17,074,389 |
| Household Durables 7.3% | | | | | | | | |
| D.R. Horton, Inc. | | | | | | 380,533 | | 13,596,444 |
| Garmin Ltd. (d) | | | | | | 25,200 | | 1,672,020 |
| Harman International Industries, Inc. | | | | 27,700 | | 2,710,445 |
| KB Home | | | | | | 230,000 | | 16,711,800 |
| Lennar Corp. Class A | | | | | | 14,300 | | 872,586 |
| Pulte Homes, Inc. | | | | | | 145,100 | | 5,711,136 |
| Ryland Group, Inc. | | | | | | 24,900 | | 1,796,037 |
| Toll Brothers, Inc. (a) | | | | | | 160,900 | | 5,573,576 |
| | | | | | | | | 48,644,044 |
| Internet & Catalog Retail 5.8% | | | | | | |
| eBay, Inc. (a)(d) | | | | | | 895,000 | | 38,708,750 |
| Overstock.com, Inc. (a) | | | | | | 7,200 | | 202,680 |
| Submarino SA | | | | | | 2,900 | | 51,705 |
| | | | | | | | | 38,963,135 |
| Media 5.2% | | | | | | | | |
| Central European Media Enterprises Ltd. Class A (a) | | | | 3,500 | | 202,650 |
| Getty Images, Inc. (a) | | | | | | 500 | | 44,635 |
| Lamar Advertising Co. Class A (a) | | | | 7,100 | | 327,594 |
| McGraw Hill Companies, Inc. | | | | | | 40,366 | | 2,084,097 |
| Omnicom Group, Inc. | | | | | | 74,600 | | 6,350,698 |
| Time Warner, Inc. | | | | | | 432,000 | | 7,534,080 |
| Univision Communications, Inc. | | | | | | | | |
| Class A (a) | | | | | | 276,800 | | 8,135,152 |
| Walt Disney Co. | | | | | | 277,000 | | 6,639,690 |
| XM Satellite Radio Holdings, Inc. | | | | | | |
| Class A (a) | | | | | | 127,400 | | 3,475,472 |
| | | | | | | | | 34,794,068 |
| Multiline Retail – 0.7% | | | | | | | | |
| Federated Department Stores, Inc. | | | | 10,900 | | 722,997 |
| Nordstrom, Inc. | | | | | | 28,100 | | 1,050,940 |
| Sears Holdings Corp. (a) | | | | | | 15,400 | | 1,779,162 |
| Target Corp. | | | | | | 22,300 | | 1,225,831 |
| | | | | | | | | 4,778,930 |
| |
| |
| | | | | | | Shares | | Value (Note 1) |
| Specialty Retail 4.2% | | | | | | | | |
| Bed Bath & Beyond, Inc. (a) | | | | | | 10,800 | | $ 390,420 |
See accompanying notes which are an integral part of the financial statements.
| | | | |
| | | | | | | 7 | | Annual Report |
7
| VIP Growth Opportunities Portfolio | | | | |
| Investments - continued | | | | |
| |
| |
| | Shares | | Value (Note 1) |
| | | | |
| | | | |
| Best Buy Co., Inc. | | 171,000 | | 7,435,080 |
| Chico’s FAS, Inc. (a) | | 88,800 | | 3,900,984 |
| Circuit City Stores, Inc. | | 251,300 | | 5,676,867 |
| Dick’s Sporting Goods, Inc. (a)(d) | | 10,700 | | 355,668 |
| Gamestop Corp. Class B (a) | | 21,600 | | 624,240 |
| Home Depot, Inc. | | 22,700 | | 918,896 |
| Lowe’s Companies, Inc. | | 12,100 | | 806,586 |
| Staples, Inc. | | 166,195 | | 3,774,288 |
| Urban Outfitters, Inc. (a) | | 125,000 | | 3,163,750 |
| Zumiez, Inc. | | 15,123 | | 653,616 |
| | | | | 27,700,395 |
| Textiles, Apparel & Luxury Goods 0.1% | | | | |
| Coach, Inc. (a) | | 28,000 | | 933,520 |
| Under Armour, Inc. Class A | | 600 | | 22,986 |
| | | | | 956,506 |
| |
| TOTAL CONSUMER DISCRETIONARY | | | | 173,334,687 |
| |
| CONSUMER STAPLES 2.0% | | | | |
| Food & Staples Retailing – 0.5% | | | | |
| CVS Corp. | | 69,500 | | 1,836,190 |
| Wal Mart Stores, Inc. | | 19,210 | | 899,028 |
| Walgreen Co. | | 14,000 | | 619,640 |
| | | | | 3,354,858 |
| Food Products – 0.2% | | | | |
| Nestle SA sponsored ADR | | 13,900 | | 1,039,025 |
| Tobacco – 1.3% | | | | |
| Altria Group, Inc. | | 118,720 | | 8,870,758 |
| |
| TOTAL CONSUMER STAPLES | | | | 13,264,641 |
| |
| ENERGY 10.1% | | | | |
| Energy Equipment & Services – 6.8% | | | | |
| Baker Hughes, Inc. | | 107,600 | | 6,539,928 |
| BJ Services Co. | | 128,500 | | 4,712,095 |
| GlobalSantaFe Corp. | | 14,000 | | 674,100 |
| Grant Prideco, Inc. (a) | | 14,200 | | 626,504 |
| Halliburton Co. | | 296,700 | | 18,383,532 |
| National Oilwell Varco, Inc. (a) | | 28,900 | | 1,812,030 |
| Schlumberger Ltd. (NY Shares) | | 103,800 | | 10,084,170 |
| Transocean, Inc. (a) | | 39,000 | | 2,717,910 |
| | | | | 45,550,269 |
| Oil, Gas & Consumable Fuels 3.3% | | | | |
| Amerada Hess Corp. | | 2,800 | | 355,096 |
| Anadarko Petroleum Corp | | 7,000 | | 663,250 |
| Apache Corp. | | 13,900 | | 952,428 |
| BP PLC sponsored ADR | | 17,690 | | 1,136,052 |
| Burlington Resources, Inc. | | 11,500 | | 991,300 |
| ConocoPhillips | | 21,600 | | 1,256,688 |
| EnCana Corp. | | 21,500 | | 972,036 |
| Exxon Mobil Corp. | | 140,000 | | 7,863,800 |
See accompanying notes which are an integral part of the financial statements.
| | |
| VIP Growth Opportunities Portfolio | | 8 |
| Common Stocks continued | | | | |
| | | Shares | | Value (Note 1) |
| |
| ENERGY – continued | | | | |
| Oil, Gas & Consumable Fuels – continued | | | | |
| Plains Exploration & Production Co. (a) | | 27,800 | | $ 1,104,494 |
| Total SA sponsored ADR | | 7,000 | | 884,800 |
| Valero Energy Corp. | | 107,800 | | 5,562,480 |
| | | | | 21,742,424 |
| |
| TOTAL ENERGY | | | | 67,292,693 |
| |
| FINANCIALS – 8.8% | | | | |
| Capital Markets 3.0% | | | | |
| Ameritrade Holding Corp. | | 164,210 | | 3,941,040 |
| Calamos Asset Management, Inc. | | | | |
| Class A | | 14,000 | | 440,300 |
| Charles Schwab Corp. | | 34,900 | | 511,983 |
| E*TRADE Financial Corp. (a) | | 97,600 | | 2,035,936 |
| Federated Investors, Inc. Class B (non vtg.) | | 13,900 | | 514,856 |
| Goldman Sachs Group, Inc. | | 16,100 | | 2,056,131 |
| Lazard Ltd. Class A | | 49,200 | | 1,569,480 |
| Legg Mason, Inc. | | 3,600 | | 430,884 |
| Merrill Lynch & Co., Inc. | | 103,200 | | 6,989,736 |
| optionsXpress Holdings, Inc. | | 14,400 | | 353,520 |
| UBS AG (NY Shares) | | 12,600 | | 1,198,890 |
| | | | | 20,042,756 |
| Commercial Banks – 1.0% | | | | |
| Bank of America Corp. | | 65,200 | | 3,008,980 |
| Standard Chartered PLC (United Kingdom) | | 34,900 | | 778,063 |
| Wachovia Corp. | | 26,800 | | 1,416,648 |
| Wells Fargo & Co. | | 27,300 | | 1,715,259 |
| | | | | 6,918,950 |
| Consumer Finance – 0.4% | | | | |
| American Express Co. | | 58,500 | | 3,010,410 |
| Diversified Financial Services – 0.7% | | | | |
| IntercontinentalExchange, Inc. | | 33,350 | | 1,212,273 |
| JPMorgan Chase & Co. | | 27,900 | | 1,107,351 |
| NETeller PLC (a) | | 179,848 | | 2,275,687 |
| | | | | 4,595,311 |
| Insurance – 3.3% | | | | |
| ACE Ltd. | | 86,930 | | 4,645,539 |
| AFLAC, Inc. | | 64,800 | | 3,008,016 |
| American International Group, Inc. | | 108,662 | | 7,414,008 |
| Aspen Insurance Holdings Ltd. | | 50,800 | | 1,202,436 |
| Axis Capital Holdings Ltd. | | 22,300 | | 697,544 |
| Genworth Financial, Inc. Class A (non vtg.) | | 115,200 | | 3,983,616 |
| Montpelier Re Holdings Ltd. | | 49,100 | | 927,990 |
| | | | | 21,879,149 |
| Thrifts & Mortgage Finance – 0.4% | | | | |
| Countrywide Financial Corp. | | 35,600 | | 1,217,164 |
See accompanying notes which are an integral part of the financial statements.
|
9
| VIP Growth Opportunities Portfolio | | | | |
| Investments - continued | | | | |
| |
| |
| |
| | | | | Shares | | Value (Note 1) |
| Fannie Mae | | | | 4,900 | | $ 239,169 |
| Golden West Financial Corp., Delaware | | 13,900 | | 917,400 |
| | | | | | | 2,373,733 |
| |
| TOTAL FINANCIALS | | | | | | 58,820,309 |
| |
| HEALTH CARE 12.7% | | | | | | |
| Biotechnology – 1.5% | | | | | | |
| Amgen, Inc. (a) | | | | 34,200 | | 2,697,012 |
| Genentech, Inc. (a) | | | | 34,500 | | 3,191,250 |
| Gilead Sciences, Inc. (a) | | | | 42,600 | | 2,242,038 |
| ImClone Systems, Inc. (a) | | | | 14,379 | | 492,337 |
| MedImmune, Inc. (a) | | | | 28,500 | | 998,070 |
| | | | | | | 9,620,707 |
| Health Care Equipment & Supplies 2.2% | | | | |
| Alcon, Inc. | | | | 15,900 | | 2,060,640 |
| Becton, Dickinson & Co. | | | | 81,000 | | 4,866,480 |
| C.R. Bard, Inc. | | | | 100,800 | | 6,644,736 |
| Foxhollow Technologies, Inc. (a) | | | | 100 | | 2,979 |
| Kinetic Concepts, Inc. (a) | | | | 32,400 | | 1,288,224 |
| | | | | | | 14,863,059 |
| Health Care Providers & Services 5.4% | | | | |
| Aetna, Inc. | | | | 7,000 | | 660,170 |
| UnitedHealth Group, Inc. | | | | 510,800 | | 31,741,112 |
| WebMD Health Corp. Class A | | | | 4,400 | | 127,820 |
| WellPoint, Inc. (a) | | | | 41,100 | | 3,279,369 |
| | | | | | | 35,808,471 |
| Pharmaceuticals 3.6% | | | | | | |
| Allergan, Inc. | | | | 28,600 | | 3,087,656 |
| Johnson & Johnson | | | | 65,900 | | 3,960,590 |
| Novartis AG sponsored ADR | | | | 32,600 | | 1,710,848 |
| Pfizer, Inc. | | | | 298,693 | | 6,965,521 |
| Roche Holding AG (participation certificate) | | 14,405 | | 2,162,943 |
| Sepracor, Inc. (a) | | | | 36,000 | | 1,857,600 |
| Wyeth | | | | 94,700 | | 4,362,829 |
| | | | | | | 24,107,987 |
| |
| TOTAL HEALTH CARE | | | | | | 84,400,224 |
| |
| INDUSTRIALS – 4.6% | | | | | | |
| Aerospace & Defense – 0.2% | | | | | | |
| Honeywell International, Inc. | | | | 41,600 | | 1,549,600 |
| Air Freight & Logistics – 0.3% | | | | | | |
| FedEx Corp. | | | | 18,700 | | 1,933,393 |
| Commercial Services & Supplies 0.3% | | | | |
| Robert Half International, Inc. | | | | 45,760 | | 1,733,846 |
| Construction & Engineering – 0.7% | | | | |
| Fluor Corp. | | | | 59,500 | | 4,596,970 |
See accompanying notes which are an integral part of the financial statements.
| | |
| VIP Growth Opportunities Portfolio | | 10 |
| Common Stocks continued | | | | | | |
| | | | | Shares | | Value (Note 1) |
| |
| INDUSTRIALS – continued | | | | | | |
| Electrical Equipment 0.3% | | | | | | |
| ABB Ltd. sponsored ADR (a) | | | | 144,000 | | $ 1,399,680 |
| Rockwell Automation, Inc. | | | | 7,100 | | 420,036 |
| | | | | | | 1,819,716 |
| Industrial Conglomerates 2.6% | | | | | | |
| General Electric Co. | | | | 501,350 | | 17,572,318 |
| Road & Rail 0.2% | | | | | | |
| Burlington Northern Santa Fe Corp. | | | | 10,700 | | 757,774 |
| Laidlaw International, Inc. | | | | 34,800 | | 808,404 |
| | | | | | | 1,566,178 |
| |
| TOTAL INDUSTRIALS | | | | | | 30,772,021 |
| |
| INFORMATION TECHNOLOGY 30.0% | | | | | | |
| Communications Equipment – 5.4% | | | | | | |
| F5 Networks, Inc. (a) | | | | 29,700 | | 1,698,543 |
| Juniper Networks, Inc. (a) | | | | 327,650 | | 7,306,595 |
| Motorola, Inc. | | | | 148,600 | | 3,356,874 |
| Nokia Corp. sponsored ADR | | | | 235,400 | | 4,307,820 |
| QUALCOMM, Inc. | | | | 212,800 | | 9,167,424 |
| Research In Motion Ltd. (a) | | | | 156,800 | | 10,351,727 |
| | | | | | | 36,188,983 |
| Computers & Peripherals 2.6% | | | | | | |
| Apple Computer, Inc. (a) | | | | 104,500 | | 7,512,505 |
| Dell, Inc. (a) | | | | 24,800 | | 743,752 |
| EMC Corp. (a) | | | | 271,700 | | 3,700,554 |
| Network Appliance, Inc. (a) | | | | 205,700 | | 5,553,900 |
| | | | | | | 17,510,711 |
| Electronic Equipment & Instruments – 0.1% | | | | | | |
| Cogent, Inc. (a) | | | | 28,800 | | 653,184 |
| Sunpower Corp. Class A | | | | 500 | | 16,995 |
| | | | | | | 670,179 |
| Internet Software & Services 14.7% | | | | | | |
| Google, Inc. Class A (sub. vtg.) (a) | | | | 133,800 | | 55,508,266 |
| NetEase.com, Inc. sponsored ADR (a)(d) | | | | 14,200 | | 797,472 |
| Yahoo! Japan Corp | | | | 3,595 | | 5,457,827 |
| Yahoo!, Inc. (a) | | | | 920,800 | | 36,076,944 |
| | | | | | | 97,840,509 |
| IT Services 1.3% | | | | | | |
| First Data Corp. | | | | 205,100 | | 8,821,351 |
| Semiconductors & Semiconductor Equipment – 3.1% | | | | | | |
| Altera Corp. (a) | | | | 69,700 | | 1,291,541 |
| Analog Devices, Inc. | | | | 103,000 | | 3,694,610 |
| Freescale Semiconductor, Inc. Class B (a) | | | | 96,286 | | 2,423,519 |
| Intel Corp. | | | | 128,810 | | 3,215,098 |
| Linear Technology Corp. | | | | 27,900 | | 1,006,353 |
| Marvell Technology Group Ltd. (a) | | | | 49,900 | | 2,798,891 |
| National Semiconductor Corp. | | | | 138,500 | | 3,598,230 |
| |
| |
| |
See accompanying notes which are an integral part of the financial statements.
| | | | | | |
| | | 11 | | | | Annual Report |
| VIP Growth Opportunities Portfolio | | | | |
| Investments - continued | | | | |
| |
| |
| |
| | | Shares | | Value (Note 1) |
| NVIDIA Corp. (a) | | 14,000 | | $ 511,840 |
| Texas Instruments, Inc. | | 59,100 | | 1,895,337 |
| | | | | 20,435,419 |
| Software 2.8% | | | | |
| Activision, Inc. (a) | | 405,466 | | 5,571,103 |
| Autodesk, Inc. (a) | | 42,800 | | 1,838,260 |
| Microsoft Corp. | | 113,400 | | 2,965,410 |
| Symantec Corp. (a) | | 455,778 | | 7,976,115 |
| | | | | 18,350,888 |
| |
| TOTAL INFORMATION TECHNOLOGY | | | | 199,818,040 |
| |
| MATERIALS 1.1% | | | | |
| Chemicals 1.1% | | | | |
| Monsanto Co. | | 15,200 | | 1,178,456 |
| Praxair, Inc. | | 120,400 | | 6,376,384 |
| | | | | 7,554,840 |
| |
| TELECOMMUNICATION SERVICES 3.8% | | | | |
| Wireless Telecommunication Services – 3.8% | | | | |
| American Tower Corp. Class A (a) | | 14,400 | | 390,240 |
| Crown Castle International Corp. (a) | | 10,800 | | 290,628 |
| SBA Communications Corp. Class A (a) | | 14,400 | | 257,760 |
| Sprint Nextel Corp. | | 1,045,500 | | 24,422,880 |
| | | | | 25,361,508 |
| |
| UTILITIES 0.2% | | | | |
| Electric Utilities – 0.2% | | | | |
| Exelon Corp. | | 21,600 | | 1,147,824 |
| TOTAL COMMON STOCKS | | | | |
| (Cost $530,373,135) | | | | 661,766,787 |
| |
| Money Market Funds 5.1% | | | | |
| |
| Fidelity Cash Central Fund, 4.28% (b) | | 1,999,525 | | 1,999,525 |
| Fidelity Securities Lending Cash Central Fund, 4.35% (b)(c) | | 31,810,925 | | 31,810,925 |
| TOTAL MONEY MARKET FUNDS | | | | |
| (Cost $33,810,450) | | | | 33,810,450 |
| |
| TOTAL INVESTMENT PORTFOLIO 104.4% | | | | |
| (Cost $564,183,585) | | | | 695,577,237 |
| |
| NET OTHER ASSETS (4.4)% | | | | (29,376,864) |
| NET ASSETS 100% | | | | $ 666,200,373 |
See accompanying notes which are an integral part of the financial statements.
| | |
| VIP Growth Opportunities Portfolio | | 12 |
Legend
(a) Non-income producing
(b) Affiliated fund that is available only to investment companies and other accounts managed by Fidelity Investments. The rate quoted is the annualized seven-day
yield of the fund at period end. A complete unaudited listing of the fund’s holdings as of its most recent quarter end is available upon request.
(c) Investment made with cash collateral received from securities on loan.
(d) Security or a portion of the security is on loan at period end.
|
Affiliated Central Funds
Information regarding income received by the fund from the affiliated Central funds during the period is as follows:
| Fund | | Income received |
| Fidelity Cash Central Fund | | $ 453,920 |
| Fidelity Securities Lending Cash Central Fund | | 628,062 |
| Total | | $ 1,081,982 |
Income Tax Information
At December 31, 2005, the fund had a capital loss carryforward of approximately $190,130,062 of which $74,515,185 and $115,614,877 will expire on December 31, 2009 and 2010, respectively.
See accompanying notes which are an integral part of the financial statements.
13 Annual Report
| VIP Growth Opportunities Portfolio | | | | | | |
| |
| Financial Statements | | | | | | |
| |
| |
| Statement of Assets and Liabilities | | | | | | |
| | | December 31, 2005 |
| |
| Assets | | | | | | |
| Investment in securities, at value (including securities loaned of $30,759,741) — See accompanying schedule: | | | | | | |
| Unaffiliated issuers (cost $530,373,135) | | $ 661,766,787 | | | | |
| Affiliated Central Funds (cost $33,810,450) | | 33,810,450 | | | | |
| Total Investments (cost $564,183,585) | | | | $ | | 695,577,237 |
| Receivable for investments sold | | | | | | 5,628,507 |
| Receivable for fund shares sold | | | | | | 178,830 |
| Dividends receivable | | | | | | 519,089 |
| Interest receivable | | | | | | 10,985 |
| Prepaid expenses | | | | | | 3,304 |
| Other receivables | | | | | | 123,007 |
| Total assets | | | | | | 702,040,959 |
| |
| Liabilities | | | | | | |
| Payable for investments purchased | | $ 2,245,216 | | | | |
| Payable for fund shares redeemed | | 1,321,444 | | | | |
| Accrued management fee | | 323,772 | | | | |
| Distribution fees payable | | 29,848 | | | | |
| Other affiliated payables | | 59,392 | | | | |
| Other payables and accrued expenses | | 49,989 | | | | |
| Collateral on securities loaned, at value | | 31,810,925 | | | | |
| Total liabilities | | | | | | 35,840,586 |
| |
| Net Assets | | | | $ | | 666,200,373 |
| Net Assets consist of: | | | | | | |
| Paid in capital | | | | $ | | 721,658,994 |
| Undistributed net investment income | | | | | | 3,933,365 |
| Accumulated undistributed net realized gain (loss) on investments and foreign currency transactions | | | | | | (190,785,581) |
| Net unrealized appreciation (depreciation) on investments and assets and liabilities in foreign currencies | | | | | | 131,393,595 |
| Net Assets | | | | $ | | 666,200,373 |
| |
| Statement of Assets and Liabilities continued | | | | | | |
| | | December 31, 2005 |
| |
| Initial Class: | | | | | | |
| Net Asset Value, offering price | | | | | | |
| and redemption price | | | | | | |
| per share ($400,643,585 ÷ 23,102,952 shares) | | | | $ | | 17.34 |
| Service Class: | | | | | | |
| Net Asset Value, offering price | | | | | | |
| and redemption price | | | | | | |
| per share ($200,797,838 ÷ 11,589,782 shares) | | | | $ | | 17.33 |
| Service Class 2: | | | | | | |
| Net Asset Value, offering price | | | | | | |
| and redemption price | | | | | | |
| per share ($60,405,723 ÷ 3,506,828 shares) | | | | $ | | 17.23 |
| Investor Class: | | | | | | |
| Net Asset Value, offering price | | | | | | |
| and redemption price | | | | | | |
| per share ($4,353,227 ÷ 251,224 shares) | | | | $ | | 17.33 |
See accompanying notes which are an integral part of the financial statements.
| | |
| VIP Growth Opportunities Portfolio | | 14 |
| Statement of Operations | | | | | | | | |
| | | | | Year ended December 31, 2005 |
| |
| Investment Income | | | | | | | | |
| Dividends | | | | | | $ | | 7,672,433 |
| Interest | | | | | | | | 477 |
| Income from affiliated Central Funds (including $628,062 from security lending) | | | | | | | | 1,081,982 |
| Total income | | | | | | | | 8,754,892 |
| |
| Expenses | | | | | | | | |
| Management fee | | | $ | 3,860,769 | | | | |
| Transfer agent fees | | | | 471,061 | | | | |
| Distribution fees | | | | 339,034 | | | | |
| Accounting and security lending fees | | | | 259,528 | | | | |
| Independent trustees’ compensation | | | | 3,043 | | | | |
| Custodian fees and expenses | | | | 31,916 | | | | |
| Audit | | | | 46,589 | | | | |
| Legal | | | | 3,635 | | | | |
| Miscellaneous | | | | 52,393 | | | | |
| Total expenses before reductions | | | | 5,067,968 | | | | |
| Expense reductions | | | | (313,468) | | | | 4,754,500 |
| |
| Net investment income (loss) | | | | | | | | 4,000,392 |
| Realized and Unrealized Gain (Loss) | | | | | | | | |
| Net realized gain (loss) on: | | | | | | | | |
| Investment securities: | | | | | | | | |
| Unaffiliated issuers | | | | 76,610,223 | | | | |
| Foreign currency transactions | | | | 8,727 | | | | |
| Total net realized gain (loss) | | | | | | | | 76,618,950 |
| Change in net unrealized appreciation (depreciation) on: | | | | | | | | |
| Investment securities | | | | (25,503,259) | | | | |
| Assets and liabilities in foreign currencies | | | | (57) | | | | |
| Total change in net unrealized appreciation (depreciation) | | | | | | | | (25,503,316) |
| Net gain (loss) | | | | | | | | 51,115,634 |
| Net increase (decrease) in net assets resulting from operations | | | | | | $ | | 55,116,026 |
| |
| Statement of Changes in Net Assets | | | | | | | | |
| | | | | Year ended | | | | Year ended |
| | | | | December 31, | | | | December 31, |
| | | | | 2005 | | | | 2004 |
| Increase (Decrease) in Net Assets | | | | | | | | |
| Operations | | | | | | | | |
| Net investment income (loss) | | | $ | 4,000,392 | | $ | | 6,314,997 |
| Net realized gain (loss) | | | | 76,618,950 | | | | 14,949,483 |
| Change in net unrealized appreciation (depreciation) | | | | (25,503,316) | | | | 26,748,507 |
| Net increase (decrease) in net assets resulting from operations | | | | 55,116,026 | | | | 48,012,987 |
| Distributions to shareholders from net investment income | | | | (6,184,820) | | | | (3,865,122) |
| Share transactions - net increase (decrease) | | | | (116,534,058) | | | | (85,843,295) |
| Total increase (decrease) in net assets | | | | (67,602,852) | | | | (41,695,430) |
| |
| Net Assets | | | | | | | | |
| Beginning of period | | | | 733,803,225 | | | | 775,498,655 |
| End of period (including undistributed net investment income of $3,933,365 and undistributed net investment income of | | | | | | |
| $6,108,550, respectively) | | | $ | 666,200,373 | | $ | | 733,803,225 |
| |
| |
| |
| |
| See accompanying notes which are an integral part of the financial statements. | | | | | | | | |
| |
| 15 | | | | | | Annual Report |
| Financial Highlights Initial Class | | | | | | | | | | |
| Years ended December 31, | | 2005 | | 2004 | | 2003 | | 2002 | | 2001 |
| Selected Per Share Data | | | | | | | | | | |
| Net asset value, beginning of period | | $ 16.07 | | $ 15.07 | | $ 11.71 | | $ 15.13 | | $ 17.74 |
| Income from Investment Operations | | | | | | | | | | |
| Net investment income (loss)C | | 10 | | .14D | | .08 | | .09 | | .12 |
| Net realized and unrealized gain (loss) | | 1.32 | | .94 | | 3.38 | | (3.37) | | (2.67) |
| Total from investment operations | | 1.42 | | 1.08 | | 3.46 | | (3.28) | | (2.55) |
| Distributions from net investment income | | (.15) | | (.08) | | (.10) | | (.14) | | (.06) |
| Net asset value, end of period | | $ 17.34 | | $ 16.07 | | $ 15.07 | | $ 11.71 | | $ 15.13 |
| Total ReturnA,B | | 8.89% | | 7.19% | | 29.87% | | (21.84)% | | (14.42)% |
| Ratios to Average Net AssetsE | | | | | | | | | | |
| Expenses before reductions | | 70% | | .72% | | .72% | | .70% | | .69% |
| Expenses net of fee waivers, if any | | 70% | | .72% | | .72% | | .70% | | .69% |
| Expenses net of all reductions | | 65% | | .70% | | .70% | | .66% | | .67% |
| Net investment income (loss) | | 65% | | .91% | | .64% | | .68% | | .79% |
| Supplemental Data | | | | | | | | | | |
| Net assets, end of period (000 omitted) | | $ 400,644 | | $ 459,975 | | $ 490,710 | | $ 403,476 | | $ 652,493 |
| Portfolio turnover rate | | 123% | | 65% | | 62% | | 60% | | 89% |
A Total returns do not reflect charges attributable to your insurance company’s separate account. Inclusion of these charges would reduce the total returns shown.
B Total returns would have been lower had certain expenses not been reduced during the periods shown.
C Calculated based on average shares outstanding during the period.
D Investment income per share reflects a special dividend which amounted to $.04 per share.
E Expense ratios reflect operating expenses of the class. Expenses before reductions do not reflect amounts reimbursed by the investment adviser or reductions from brokerage service arrangements or other expense offset arrangements and do not
represent the amount paid by the class during periods when reimbursements or reductions occur. Expenses net of fee waivers reflect expenses after reimbursement by the investment adviser but prior to reductions from brokerage service arrange
ments or other expense offset arrangements. Expenses net of all reductions represent the net expenses paid by the class.
|
| Financial Highlights Service Class | | | | | | | | | | |
| Years ended December 31, | | 2005 | | 2004 | | 2003 | | 2002 | | 2001 |
| Selected Per Share Data | | | | | | | | | | |
| Net asset value, beginning of period | | $ 16.05 | | $ 15.06 | | $ 11.70 | | $ 15.11 | | $ 17.71 |
| Income from Investment Operations | | | | | | | | | | |
| Net investment income (loss)C | | 09 | | .12D | | .07 | | .08 | | .11 |
| Net realized and unrealized gain (loss) | | 1.32 | | .94 | | 3.37 | | (3.37) | | (2.67) |
| Total from investment operations | | 1.41 | | 1.06 | | 3.44 | | (3.29) | | (2.56) |
| Distributions from net investment income | | (.13) | | (.07) | | (.08) | | (.12) | | (.04) |
| Net asset value, end of period | | $ 17.33 | | $ 16.05 | | $ 15.06 | | $ 11.70 | | $ 15.11 |
| Total ReturnA,B | | 8.86% | | 7.06% | | 29.66% | | (21.92)% | | (14.49)% |
| Ratios to Average Net AssetsE | | | | | | | | | | |
| Expenses before reductions | | 80% | | .82% | | .82% | | .80% | | .79% |
| Expenses net of fee waivers, if any | | 80% | | .82% | | .82% | | .80% | | .79% |
| Expenses net of all reductions | | 75% | | .80% | | .80% | | .77% | | .77% |
| Net investment income (loss) | | 54% | | .81% | | .54% | | .58% | | .69% |
| Supplemental Data | | | | | | | | | | |
| Net assets, end of period (000 omitted) | | $ 200,798 | | $ 212,890 | | $ 224,660 | | $ 188,318 | | $ 278,446 |
| Portfolio turnover rate | | 123% | | 65% | | 62% | | 60% | | 89% |
A Total returns do not reflect charges attributable to your insurance company’s separate account. Inclusion of these charges would reduce the total returns shown.
B Total returns would have been lower had certain expenses not been reduced during the periods shown.
C Calculated based on average shares outstanding during the period.
D Investment income per share reflects a special dividend which amounted to $.04 per share.
E Expense ratios reflect operating expenses of the class. Expenses before reductions do not reflect amounts reimbursed by the investment adviser or reductions from brokerage service arrangements or other expense offset arrangements and do not
represent the amount paid by the class during periods when reimbursements or reductions occur. Expenses net of fee waivers reflect expenses after reimbursement by the investment adviser but prior to reductions from brokerage service arrange
ments or other expense offset arrangements. Expenses net of all reductions represent the net expenses paid by the class.
|
See accompanying notes which are an integral part of the financial statements.
| | |
| VIP Growth Opportunities Portfolio | | 16 |
| Financial Highlights Service Class 2 | | | | | | | | | | |
| Years ended December 31, | | 2005 | | 2004 | | 2003 | | 2002 | | 2001 |
| Selected Per Share Data | | | | | | | | | | |
| Net asset value, beginning of period | | $ 15.96 | | $ 14.98 | | $ 11.64 | | $ 15.04 | | $ 17.68 |
| Income from Investment Operations | | | | | | | | | | |
| Net investment income (loss)C | | 06 | | .10D | | .05 | | .05 | | .08 |
| Net realized and unrealized gain (loss) | | 1.32 | | .93 | | 3.35 | | (3.34) | | (2.66) |
| Total from investment operations | | 1.38 | | 1.03 | | 3.40 | | (3.29) | | (2.58) |
| Distributions from net investment income | | (.11) | | (.05) | | (.06) | | (.11) | | (.06) |
| Net asset value, end of period | | $ 17.23 | | $ 15.96 | | $ 14.98 | | $ 11.64 | | $ 15.04 |
| Total ReturnA,B | | 8.68% | | 6.89% | | 29.40% | | (22.01)% | | (14.64)% |
| Ratios to Average Net AssetsE | | | | | | | | | | |
| Expenses before reductions | | 96% | | .98% | | .99% | | .97% | | .95% |
| Expenses net of fee waivers, if any | | 96% | | .98% | | .99% | | .97% | | .95% |
| Expenses net of all reductions | | 92% | | .96% | | .96% | | .94% | | .93% |
| Net investment income (loss) | | 38% | | .65% | | .37% | | .41% | | .53% |
| Supplemental Data | | | | | | | | | | |
| Net assets, end of period (000 omitted) | | $ 60,406 | | $ 60,938 | | $ 60,129 | | $ 41,486 | | $ 44,643 |
| Portfolio turnover rate | | 123% | | 65% | | 62% | | 60% | | 89% |
A Total returns do not reflect charges attributable to your insurance company’s separate account. Inclusion of these charges would reduce the total returns shown.
B Total returns would have been lower had certain expenses not been reduced during the periods shown.
C Calculated based on average shares outstanding during the period.
D Investment income per share reflects a special dividend which amounted to $.04 per share.
E Expense ratios reflect operating expenses of the class. Expenses before reductions do not reflect amounts reimbursed by the investment adviser or reductions from brokerage service arrangements or other expense offset arrangements and do not
represent the amount paid by the class during periods when reimbursements or reductions occur. Expenses net of fee waivers reflect expenses after reimbursement by the investment adviser but prior to reductions from brokerage service arrange
ments or other expense offset arrangements. Expenses net of all reductions represent the net expenses paid by the class.
|
| Financial Highlights Investor Class | | |
| |
| Year ended December 31, | | 2005F |
| Selected Per Share Data | | |
| Net asset value, beginning of period | | $ 16.20 |
| Income from Investment Operations | | |
| Net investment income (loss)E | | 02 |
| Net realized and unrealized gain (loss) | | 1.11 |
| Total from investment operations | | 1.13 |
| Net asset value, end of period | | $ 17.33 |
| Total ReturnB,C,D | | 6.98% |
| Ratios to Average Net AssetsG | | |
| Expenses before reductions | | 87%A |
| Expenses net of fee waivers, if any | | 87%A |
| Expenses net of all reductions | | 83%A |
| Net investment income (loss) | | 33%A |
| Supplemental Data | | |
| Net assets, end of period (000 omitted) | | $ 4,353 |
| Portfolio turnover rate | | 123% |
A Annualized
B Total returns for periods of less than one year are not annualized.
C Total returns do not reflect charges attributable to your insurance company’s separate account. Inclusion of these charges would reduce the total returns shown.
D Total returns would have been lower had certain expenses not been reduced during the periods shown.
E Calculated based on average shares outstanding during the period.
F For the period July 21, 2005 (commencement of sale of shares) to December 31, 2005.
G Expense ratios reflect operating expenses of the class. Expenses before reductions do not reflect amounts reimbursed by the investment adviser or reductions from brokerage service arrangements or other expense offset arrangements and do not
represent the amount paid by the class during periods when reimbursements or reductions occur. Expense ratios before reductions for start up periods may not be representative of longer term operating periods. Expenses net of fee waivers reflect
expenses after reimbursement by the investment adviser but prior to reductions from brokerage service arrangements or other expense offset arrangements. Expenses net of all reductions represent the net expenses paid by the class.
|
See accompanying notes which are an integral part of the financial statements.
|
17 Annual Report
Notes to Financial Statements
For the period ended December 31, 2005
|
1. Significant Accounting Policies.
|
VIP Growth Opportunities Portfolio (the fund) is a fund of Variable Insurance Products Fund III, (the trust) (referred to in this report as VIP Growth Opportunities Portfolio) and is authorized to issue an unlimited number of shares. The trust is registered under the Investment Company Act of 1940, as amended (the 1940 Act), as an open end management investment company organized as a Massachusetts business trust. Shares of the fund may only be purchased by insurance companies for the purpose of funding variable annuity or variable life insurance contracts. The fund offers the following classes of shares: Initial Class shares, Service Class shares, Service Class 2 shares, and Investor Class shares. The fund commenced sale of Investor Class shares on July 21, 2005. All classes have equal rights and voting privileges, except for matters affecting a single class. Investment income, realized and unrealized capital gains and losses, the common expenses of the fund, and certain fund level expense reductions, if any, are allocated on a pro rata basis to each class based on the relative net assets of each class to the total net assets of the fund. Each class differs with respect to transfer agent and distribution and service plan fees incurred. Certain expense reductions also differ by class.
The fund may invest in affiliated money market central funds (Money Market Central Funds) which are open end investment companies available to investment companies and other accounts managed by Fidelity Management & Research Company (FMR) and its affiliates. The financial statements have been prepared in conformity with accounting principles generally accepted in the United States of America, which require management to make certain estimates and assumptions at the date of the financial statements. The following summarizes the significant accounting policies of the fund:
Security Valuation. Investments are valued and net asset value (NAV) per share is calculated (NAV calculation) as of the close of business of the New York Stock Exchange (NYSE), normally 4:00 p.m. Eastern time. Wherever possible, the fund uses independent pricing services approved by the Board of Trustees to value its investments.
Equity securities, including restricted securities, for which market quotations are readily available, are valued at the last reported sale price or official closing price as reported by an independent pricing service on the primary market or exchange on which they are traded. In the event there were no sales during the day or closing prices are not available, securities are valued at the last quoted bid price. Investments in open end mutual funds, are valued at their closing net asset value each business day. Short term securities with remaining maturities of sixty days or less for which quotations are not readily available are valued at amortized cost, which approximates value.
When current market prices or quotations are not readily available or do not accurately reflect fair value, valuations may be determined in accordance with procedures adopted by the Board of Trustees. For example, when developments occur between the close of a market and the close of the NYSE that may materially affect the value of some or all of the securities, or when trading in a security is halted, those securities may be fair valued. Factors used in the determination of fair value may include monitoring news to identify significant market or security specific events such as changes in the value of U.S. securities markets, reviewing developments in foreign markets and evaluating the performance of ADRs, futures contracts and exchange-traded funds. Because the fund’s utilization of fair value pricing depends on market activity, the frequency with which fair value pricing is used can not be predicted and may be utilized to a significant extent. The value of securities used for NAV calculation under fair value pricing may differ from published prices for the same securities.
Foreign Currency. The fund uses foreign currency contracts to facilitate transactions in foreign denominated securities. Losses from these trans actions may arise from changes in the value of the foreign currency or if the counterparties do not perform under the contracts’ terms.
Foreign denominated assets, including investment securities, and liabilities are translated into U.S. dollars at the exchange rate at period end. Purchases and sales of investment securities, income and dividends received and expenses denominated in foreign currencies are translated into U.S. dollars at the exchange rate in effect on the transaction date.
The effects of exchange rate fluctuations on investments are included with the net realized and unrealized gain (loss) on investment securities. Other foreign currency transactions resulting in realized and unrealized gain (loss) are disclosed separately.
Investment Transactions and Income. Security transactions are accounted for as of trade date. Gains and losses on securities sold are determined on the basis of identified cost and may include proceeds received from litigation. Dividend income is recorded on the ex dividend date, except for certain dividends from foreign securities where the ex dividend date may have passed, which are recorded as soon as the fund is informed of the ex dividend date. Non cash dividends included in dividend income, if any, are recorded at the fair market value of the securities received. Distributions received on securities that represent a return of capital or capital gain are recorded as a reduction of cost of investments and/or as a realized gain. The fund estimates the components of distributions received that may be considered return of capital distributions or capital gain distributions. Interest income is accrued as earned. Interest income includes coupon interest and amortization of premium and accretion of discount on debt securities. Investment income is recorded net of foreign taxes withheld where recovery of such taxes is uncertain.
VIP Growth Opportunities Portfolio
|
1. Significant Accounting Policies continued
|
Expenses. Most expenses of the trust can be directly attributed to a fund. Expenses which cannot be directly attributed are apportioned among each fund in the trust.
Income Tax Information and Distributions to Shareholders. Each year, the fund intends to qualify as a regulated investment company by dis tributing all of its taxable income and realized gains under Subchapter M of the Internal Revenue Code. As a result, no provision for income taxes is required in the accompanying financial statements. Foreign taxes are provided for based on the fund’s understanding of the tax rules and rates that exist in the foreign markets in which it invests.
Distributions are recorded on the ex dividend date. Income dividends and capital gain distributions are declared separately for each class. Income and capital gain distributions are determined in accordance with income tax regulations, which may differ from generally accepted accounting principles.
Capital accounts within the financial statements are adjusted for permanent book tax differences. These adjustments have no impact on net assets or the results of operations. Temporary book tax differences will reverse in a subsequent period.
Book tax differences are primarily due to foreign currency transactions, deferred trustee compensation, capital loss carryforwards and losses deferred due to wash sales.
| The tax basis components of distributable earnings and the federal tax cost as of period end were as follows: | | | | |
| |
| Unrealized appreciation | | | $ | 139,486,144 | | |
| Unrealized depreciation | | | | (8,756,797) | | |
| Net unrealized appreciation (depreciation) | | | | 130,729,347 | | |
| Undistributed ordinary income | | | | 3,942,443 | | |
| Capital loss carryforward | | | | (190,130,062) | | |
| |
| Cost for federal income tax purposes | | | $ | 564,847,890 | | |
| |
| The tax character of distributions paid was as follows: | | | | | | |
| |
| | | | | December 31, 2005 | | December 31, 2004 |
| Ordinary Income | | | $ | 6,184,820 | | $ | | 3,865,122 |
| |
| 2. Operating Policies. | | | | | | |
Repurchase Agreements. FMR has received an Exemptive Order from the Securities and Exchange Commission (the SEC) which permits the fund and other affiliated entities of FMR to transfer uninvested cash balances into joint trading accounts which are then invested in repurchase agreements. The fund may also invest directly with institutions in repurchase agreements. Repurchase agreements are collateralized by government or non government securities. Collateral is held in segregated accounts with custodian banks and may be obtained in the event of a default of the counterparty. The fund monitors, on a daily basis, the value of the collateral to ensure it is at least equal to the principal amount of the repurchase agreement (including accrued interest). In the event of a default by the counterparty, realization of the collateral proceeds could be delayed, during which time the value of the collateral may decline.
3. Purchases and Sales of Investments.
Purchases and sales of securities, other than short term securities and U.S. government securities, aggregated $810,143,696 and $896,677,386, respectively.
4. Fees and Other Transactions with Affiliates.
Management Fee. FMR and its affiliates provide the fund with investment management related services for which the fund pays a monthly manage ment fee. The management fee is the sum of an individual fund fee rate that is based on an annual rate of .30% of the fund’s average net assets and a group fee rate that averaged .27% during the period. The group fee rate is based upon the average net assets of all the mutual funds advised by FMR. The group fee rate decreases as assets under management increase and increases as assets under management decrease. For the period, the total annual management fee rate was .57% of the fund’s average net assets.
Distribution and Service Plan. In accordance with Rule 12b 1 of the 1940 Act, the fund has adopted separate 12b 1 Plans for each Service Class of shares. Each Service Class pays Fidelity Distributors Corporation (FDC), an affiliate of FMR, a service fee. For the period, the service fee is based on an annual rate of .10% of Service Class’ average net assets and .25% of Service Class 2’s average net assets.
19 Annual Report
| Notes to Financial Statements continued | | |
| |
| 4. Fees and Other Transactions with Affiliates continued |
Distribution and Service Plan continued | | |
For the period, each class paid FDC the following amounts, all of which were re allowed to insurance companies for the distribution of shares and providing shareholder support services:
| Service Class | | | $ | 196,341 |
| Service Class 2 | | | | 142,693 |
| | | | $ | 339,034 |
Transfer Agent Fees. Fidelity Investments Institutional Operations Company, Inc. (FIIOC), an affiliate of FMR, is the fund’s transfer, dividend disbursing, and shareholder servicing agent. FIIOC receives an asset based fee with respect to each class. FIIOC pays a portion of the expenses related to the typesetting, printing and mailing of shareholder reports, except proxy statements. Each class with the exception of Investor Class pays a transfer agent fee, excluding out of pocket expenses, equal to an annual rate of ..07% of their month end net assets. Investor Class pays an asset based transfer agent fee of .18% of its month end net assets. The total transfer agent fees paid by each class to FIIOC, including out of pocket expenses, were as follows:
| Initial Class | | | $ | 286,871 |
| Service Class | | | | 135,181 |
| Service Class 2 | | | | 47,132 |
| Investor Class | | | | 1,877 |
| | | | $ | 471,061 |
Accounting and Security Lending Fees. Fidelity Service Company, Inc. (FSC), an affiliate of FMR, maintains the fund’s accounting records. The accounting fee is based on the level of average net assets for the month. Under a separate contract, FSC administers the security lending program. The security lending fee is based on the number and duration of lending transactions.
Affiliated Central Funds. The fund may invest in Money Market Central Funds which seek preservation of capital and current income and are managed by Fidelity Investments Money Management, Inc. (FIMM), an affiliate of FMR.
The Money Market Central Funds do not pay a management fee.
|
Brokerage Commissions. The fund placed a portion of its portfolio transactions with brokerage firms which are affiliates of the investment adviser. The commissions paid to these affiliated firms were $24,428 for the period.
5. Committed Line of Credit.
|
The fund participates with other funds managed by FMR in a $4.2 billion credit facility (the “line of credit”) to be utilized for temporary or emergency purposes to fund shareholder redemptions or for other short term liquidity purposes. The fund has agreed to pay commitment fees on its pro rata portion of the line of credit. During the period, there were no borrowings on this line of credit.
The fund lends portfolio securities from time to time in order to earn additional income. On the settlement date of the loan, the fund receives collateral (in the form of U.S. Treasury obligations, letters of credit and/or cash) against the loaned securities and maintains collateral in an amount not less than 100% of the market value of the loaned securities during the period of the loan. The market value of the loaned securities is determined at the close of business of the fund and any additional required collateral is delivered to the fund on the next business day. If the borrower defaults on its obligation to return the securities loaned because of insolvency or other reasons, a fund could experience delays and costs in recovering the securities loaned or in gaining access to the collateral. Any cash collateral received is invested in the Fidelity Securities Lending Cash Central Fund. The value of loaned securities and cash collateral at period end are disclosed on the fund’s Statement of Assets and Liabilities. Security lending income represents the income earned on investing cash collateral, less fees and expenses associated with the loan, plus any premium payments that may be received on the loan of certain types of securities.
Many of the brokers with whom FMR places trades on behalf of the fund provided services to the fund in addition to trade execution. These services included payments of certain expenses on behalf of the fund totaling $313,468 for the period.
VIP Growth Opportunities Portfolio
|
The fund’s organizational documents provide former and current trustees and officers with a limited indemnification against liabilities arising in connection with the performance of their duties to the fund. In the normal course of business, the fund may also enter into contracts that provide general indemnifications. The fund’s maximum exposure under these arrangements is unknown as this would be dependent on future claims that may be made against the fund. The risk of material loss from such claims is considered remote.
At the end of the period, FMR or its affiliates were the owners of record of 21% of the total outstanding shares of the fund and one of otherwise unaffili ated shareholder was the owner of record of 42% of the total outstanding shares of the fund.
| 9. Distributions to Shareholders. | | | | | | | | | | | | |
| |
| Distributions to shareholders of each class were as follows: | | | | | | | | | | | | |
| |
| | | | | | | | | Years ended December 31, |
| | | | | | | | | 2005 | | | | 2004 |
| From net investment income | | | | | | | | | | | | |
| Initial Class | | | | | | | $ | 4,113,187 | | | $ | 2,623,558 |
| Service Class | | | | | | | | 1,676,409 | | | | 1,042,625 |
| Service Class 2 | | | | | | | | 395,224 | | | | 198,939 |
| Total | | | | | | | $ | 6,184,820 | | | $ | 3,865,122 |
| |
| 10. Share Transactions. | | | | | | | | | | | | |
| |
| Transactions for each class of shares were as follows: | | | | | | | | | | | | |
| |
| | | Shares | | | | Dollars |
| | | Years ended December 31, | | | | Years ended December 31, |
| | | 2005A | | 2004 | | | | 2005A | | | | 2004 |
| Initial Class | | | | | | | | | | | | |
| Shares sold | | 2,043,068 | | 2,729,868 | | | $ | 32,630,211 | | | $ | 41,720,058 |
| Reinvestment of distributions | | 259,671 | | 170,805 | | | | 4,113,187 | | | | 2,623,558 |
| Shares redeemed | | (7,829,217) | | (6,832,162) | | | | (126,275,246) | | | | (102,539,187) |
| Net increase (decrease) | | (5,526,478) | | (3,931,489) | | | $ | (89,531,848) | | | $ | (58,195,571) |
| Service Class | | | | | | | | | | | | |
| Shares sold | | 1,133,176 | | 870,070 | | | $ | 18,609,478 | | | $ | 13,156,606 |
| Reinvestment of distributions | | 105,834 | | 67,879 | | | | 1,676,409 | | | | 1,042,625 |
| Shares redeemed | | (2,911,194) | | (2,590,797) | | | | (46,797,036) | | | | (38,992,902) |
| Net increase (decrease) | | (1,672,184) | | (1,652,848) | | | $ | (26,511,149) | | | $ | (24,793,671) |
| Service Class 2 | | | | | | | | | | | | |
| Shares sold | | 586,782 | | 885,612 | | | $ | 9,623,165 | | | $ | 13,251,573 |
| Reinvestment of distributions | | 25,062 | | 13,011 | | | | 395,224 | | | | 198,939 |
| Shares redeemed | | (922,792) | | (1,093,977) | | | | (14,688,498) | | | | (16,304,565) |
| Net increase (decrease) | | (310,948) | | (195,354) | | | $ | (4,670,109) | | | $ | (2,854,053) |
| Investor Class | | | | | | | | | | | | |
| Shares sold | | 260,971 | | — | | | $ | 4,346,383 | | | $ | — |
| Shares redeemed | | (9,747) | | — | | | | (167,335) | | | | — |
| Net increase (decrease) | | 251,224 | | — | | | $ | 4,179,048 | | | $ | — |
| |
| A Share transactions for Investor Class are for the period July 21, 2005 (commencement of sale of shares) to December 31, 2005. | | | | | | | | | | | | |
21 Annual Report
Report of Independent Registered Public Accounting Firm
To the Trustees of Variable Insurance Products Fund III and Shareholders of VIP Growth Opportunities Portfolio:
We have audited the accompanying statement of assets and liabilities of VIP Growth Opportunities Portfolio (the Fund), a fund of Variable Insurance Products Fund III, including the schedule of investments as of December 31, 2005, and the related statement of operations for the year then ended, the statement of changes in net assets for each of the two years in the period then ended, and the financial highlights for each of the five years in the period then ended. These financial statements and financial highlights are the responsibility of the Fund’s management. Our responsibility is to express an opinion on these financial statements and financial highlights based on our audits.
We conducted our audits in accordance with standards of the Public Company Accounting Oversight Board (United States). Those standards require that we plan and perform the audit to obtain reasonable assurance about whether the financial statements and financial highlights are free of material misstatement. The Fund is not required to have, nor were we engaged to perform, an audit of its internal control over financial reporting. Our audits included consideration of internal control over financial reporting as a basis for designing audit procedures that are appropriate in the circumstances, but not for the purpose of expressing an opinion on the effectiveness of the Fund’s internal control over financial reporting. Accordingly, we express no such opinion. An audit also includes examining, on a test basis, evidence supporting the amounts and disclosures in the financial statements, assessing the accounting principles used and significant estimates made by management, as well as evaluating the overall financial statement presentation. Our procedures included confirmation of securities owned as of December 31, 2005, by correspondence with the custodians and brokers; where replies were not received from brokers, we performed other auditing procedures. We believe that our audits provide a reasonable basis for our opinion.
In our opinion, the financial statements and financial highlights referred to above present fairly, in all material respects, the financial position of VIP Growth Opportunities Portfolio as of December 31, 2005, the results of its operations for the year then ended, the changes in its net assets for each of the two years in the period then ended, and its financial highlights for each of the five years in the period then ended, in conformity with accounting principles generally accepted in the United States of America.
/s/ Deloitte & Touche LLP
DELOITTE & TOUCHE LLP
Boston, Massachusetts
February 14, 2006
|
VIP Growth Opportunities Portfolio
|
The Trustees Member of the Advisory Board, and executive officers of the trust and fund, as applicable, are listed below. The Board of Trustees governs the fund and is responsible for protecting the interests of shareholders. The Trustees are experienced executives who meet periodically throughout the year to oversee the fund’s activities, review contractual arrangements with companies that provide services to the fund, and review the fund’s performance. Except for William O. McCoy and Albert R. Gamper, Jr., each of the Trustees oversees 326 funds advised by FMR or an affiliate. Mr. McCoy oversees 328 funds advised by FMR or an affiliate. Mr. Gamper oversees 235 funds advised by FMR or an affiliate.
The Trustees hold office without limit in time except that (a) any Trustee may resign; (b) any Trustee may be removed by written instrument, signed by at least two thirds of the number of Trustees prior to such removal; (c) any Trustee who requests to be retired or who has become inca pacitated by illness or injury may be retired by written instrument signed by a majority of the other Trustees; and (d) any Trustee may be removed at any special meeting of shareholders by a two thirds vote of the outstanding voting securities of the trust. Each Trustee who is not an interested person (as defined in the 1940 Act) (Independent Trustee), shall retire not later than the last day of the calendar year in which his or her 72nd birthday occurs. The Independent Trustees may waive this mandatory retirement age policy with respect to individual Trustees. The executive officers and Advisory Board Member hold office without limit in time, except that any officer and Advisory Board Member may resign or may be removed by a vote of a majority of the Trustees at any regular meeting or any special meeting of the Trustees. Except as indicated, each individual has held the office shown or other offices in the same company for the past five years.
The fund’s Statement of Additional Information (SAI) includes more information about the Trustees. To request a free copy, call Fidelity at 1-877-208-0098.
Correspondence intended for each Trustee who is an interested person may be sent to Fidelity Investments, 82 Devonshire Street, Boston, Massachusetts 02109.
| | Name, Age; Principal Occupation
Edward C. Johnson 3d (75)
|
Year of Election or Appointment: 1994
Mr. Johnson is Chairman of the Board of Trustees. Mr. Johnson serves as Chief Executive Officer, Chairman, and a Director of FMR Corp.; a Director and Chairman of the Board and of the Executive Committee of FMR; Chairman and a Director of Fidelity Man agement & Research (Far East) Inc.; Chairman and a Director of Fidelity Investments Money Management, Inc.; and Chairman (2001 present) and a Director (2000 present) of FMR Co., Inc.
Year of Election or Appointment: 2005
Mr. Jonas is Senior Vice President of VIP Growth Opportunities (2005 present). He also serves as Senior Vice President of other Fidelity funds (2005 present). Mr. Jonas is Executive Director of FMR (2005 present). Previously, Mr. Jonas served as President of Fidelity Enterprise Operations and Risk Services (2004 2005), Chief Administrative Officer (2002 2004), and Chief Financial Officer of FMR Co. (1998 2000). Mr. Jonas has been with Fidelity Investments since 1987 and has held various financial and management positions including Chief Financial Officer of FMR. In addition, he serves on the Boards of Boston Ballet (2003 present) and Simmons College (2003 present).
Year of Election or Appointment: 2003
Mr. Reynolds is a Director (2003 present) and Chief Operating Officer (2002 present) of FMR Corp. He also serves on the Board at Fidelity Investments Canada, Ltd. (2000 present). Previously, Mr. Reynolds served as President of Fidelity Investments Institutional Retirement Group (1996 2000).
* Trustees have been determined to be “Interested Trustees” by virtue of, among other things, their affiliation with the trust or various entities under common control with FMR.
23 Annual Report
Trustees and Officers - continued
Independent Trustees:
|
Correspondence intended for each Independent Trustee (that is, the Trustees other than the Interested Trustees) may be sent to Fidelity Investments, P.O. Box 55235, Boston, Massachusetts 02205-5235.
| | Name, Age; Principal Occupation
Dennis J. Dirks (57)
|
Year of Election or Appointment: 2005
Prior to his retirement in May 2003, Mr. Dirks was Chief Operating Officer and a member of the Board of The Depository Trust & Clearing Corporation (DTCC) (1999 2003). He also served as President, Chief Operating Officer, and Board member of The Depository Trust Company (DTC) (1999 2003) and President and Board member of the National Securities Clearing Corporation (NSCC) (1999 2003). In addition, Mr. Dirks served as Chief Executive Officer and Board member of the Government Securities Clearing Corporation (2001 2003) and Chief Executive Officer and Board member of the Mortgage Backed Securities Clearing Corporation (2001 2003). Mr. Dirks also serves as a Trustee of Manhattan College (2005 present).
| | Albert R. Gamper, Jr. (63)
|
Year of Election or Appointment: 2006
Mr. Gamper also serves as a Trustee (2006 present) or Member of the Advisory Board (2005 present) of other investment companies advised by FMR. Prior to his retirement in December 2004, Mr. Gamper served as Chairman of the Board of CIT Group Inc. (commercial finance). During his tenure with CIT Group Inc. Mr. Gamper served in numerous senior management positions, includ ing Chairman (1987 1989; 1999 2001; 2002 2004), Chief Executive Officer (1987 2004), and President (1989 2002). He currently serves as a member of the Board of Directors of Public Service Enterprise Group (utilities, 2001 present), Chairman of the Board of Governors, Rutgers University (2004 present), and Chairman of the Board of Saint Barnabas Health Care System.
Year of Election or Appointment: 1997
Dr. Gates is Chairman of the Independent Trustees (2006 present). Dr. Gates is President of Texas A&M University (2002 present). He was Director of the Central Intelligence Agency (CIA) from 1991 to 1993. From 1989 to 1991, Dr. Gates served as Assistant to the President of the United States and Deputy National Security Advisor. Dr. Gates is a Director of NACCO Industries, Inc. (mining and manufacturing), Parker Drilling Co., Inc. (drilling and rental tools for the energy industry, 2001 present), and Brinker International (restaurant management, 2003 present). Previously, Dr. Gates served as a Director of LucasVarity PLC (automotive components and diesel engines), a Director of TRW Inc. (automotive, space, defense, and information technology), and Dean of the George Bush School of Government and Public Service at Texas A&M University (1999 2001). Dr. Gates also is a Trustee of the Forum for International Policy.
Year of Election or Appointment: 2004
Dr. Heilmeier is Chairman Emeritus of Telcordia Technologies (communication software and systems), where prior to his retirement, he served as company Chairman and Chief Executive Officer. He currently serves on the Boards of Directors of The Mitre Corpo ration (systems engineering and information technology support for the government), and HRL Laboratories (private research and development, 2004 present). He is Chairman of the General Motors Science & Technology Advisory Board and a Life Fellow of the Institute of Electrical and Electronics Engineers (IEEE) (2000 present). Dr. Heilmeier is a member of the Defense Science Board and the National Security Agency Advisory Board. He is also a member of the National Academy of Engineering, the American Academy of Arts and Sciences, and the Board of Overseers of the School of Engineering and Applied Science of the University of Pennsylvania. Previously, Dr. Heilmeier served as a Director of TRW Inc. (automotive, space, defense, and information technology, 1992 2002), Compaq (1994 2002), Automatic Data Processing, Inc. (ADP) (technology based business outsourcing, 1995 2002), INET Technologies Inc. (telecommunications network surveillance, 2001 2004), and Teletech Holdings (customer management ser vices). He is the recipient of the 2005 Kyoto Prize in Advanced Technology for his invention of the liquid display.
Year of Election or Appointment: 2001
Prior to Ms. Knowles’ retirement in June 2000, she served as Executive Vice President and Chief Financial Officer of Atlantic Richfield Company (ARCO) (diversified energy, 1996 2000). From 1993 to 1996, she was a Senior Vice President of ARCO and President of ARCO Transportation Company. She served as a Director of ARCO from 1996 to 1998. She currently serves as a Director of Phelps Dodge Corporation (copper mining and manufacturing) and McKesson Corporation (healthcare service, 2002 present). Ms. Knowles is a Trustee of the Brookings Institution and the Catalina Island Conservancy and also serves as a member of the Advisory Board for the School of Engineering of the University of Southern California.
VIP Growth Opportunities Portfolio
|
Name, Age; Principal Occupation
Ned C. Lautenbach (61)
|
Year of Election or Appointment: 2000
Mr. Lautenbach has been a partner of Clayton, Dubilier & Rice, Inc. (private equity investment firm) since September 1998. Previously, Mr. Lautenbach was with the International Business Machines Corporation (IBM) from 1968 until his retirement in 1998. Mr. Lautenbach serves as a Director of Italtel Holding S.p.A. (telecommunications (Milan, Italy), 2004 present) and Eaton Corpora tion (diversified industrial) as well as the Philharmonic Center for the Arts in Naples, Florida. He also is a member of the Board of Trustees of Fairfield University (2005 present), as well as a member of the Council on Foreign Relations.
Year of Election or Appointment: 1997
Prior to his retirement in December 1994, Mr. McCoy was Vice Chairman of the Board of BellSouth Corporation (telecommunications) and President of BellSouth Enterprises. He is currently a Director of Liberty Corporation (holding company), Duke Realty Corpora tion (real estate), and Progress Energy, Inc. (electric utility). He is also a partner of Franklin Street Partners (private investment management firm) and a member of the Research Triangle Foundation Board. In addition, Mr. McCoy served as the Interim Chan cellor (1999 2000) and a member of the Board of Visitors for the University of North Carolina at Chapel Hill and currently serves on the Board of Directors of the University of North Carolina Health Care System and the Board of Visitors of the Kenan Flagler Business School (University of North Carolina at Chapel Hill). He also served as Vice President of Finance for the University of North Carolina (16 school system).
Year of Election or Appointment: 2005
Ms. Small is a member (2000 present) and Chairperson (2002 present) of the Investment Committee, and a member (2002 present) of the Board of Trustees of Smith College. Previously, she served as Chief Investment Officer (1999 2000), Director of Global Equity Investments (1996 1999), and a member of the Board of Directors of Scudder, Stevens & Clark (1990 1997) and Scudder Kemper Investments (1997 1998). In addition, Ms. Small served as Co Chair (2000 2003) of the Annual Fund for the Fletcher School of Law and Diplomacy.
William S. Stavropoulos (66)
|
Year of Election or Appointment: 2001
Mr. Stavropoulos is Chairman of the Board (2000 present) and a Member of the Board of Directors of The Dow Chemical Company. Since joining The Dow Chemical Company in 1967, Mr. Stavropoulos served in numerous senior management positions, including President (1993 2000; 2002 2003), CEO (1995 2000; 2002 2004), and Chairman of the Executive Committee (2000 2004). Currently, he is a Director of NCR Corporation (data warehousing and technology solutions), BellSouth Corporation (telecommu nications), Chemical Financial Corporation, Maersk Inc. (industrial conglomerate, 2002 present), and Metalmark Capital (private equity investment firm, 2005 present). He also serves as a member of the Board of Trustees of the American Enterprise Institute for Public Policy Research. In addition, Mr. Stavropoulos is a member of The Business Council, J.P. Morgan International Council and the University of Notre Dame Advisory Council for the College of Science.
Year of Election or Appointment: 2005
Prior to his retirement in 2001, Mr. Wolfe was Chairman and Chief Executive Officer of Hershey Foods Corporation (1993 2001). He currently serves as a member of the boards of Adelphia Communications Corporation (2003 present), Bausch & Lomb, Inc., and Revlon Inc. (2004 present).
25 Annual Report
Trustees and Officers - continued
|
Advisory Board Member and Executive Officers:
Correspondence intended for each executive officer and Mr. Lynch may be sent to Fidelity Investments, 82 Devonshire Street, Boston, Massachusetts 02109.
| | Name, Age; Principal Occupation
Peter S. Lynch (61)
|
Year of Election or Appointment: 2003
Member of the Advisory Board of Variable Insurance Products Fund III. Vice Chairman and a Director of FMR, and Vice Chairman (2001 present) and a Director (2000 present) of FMR Co., Inc. Previously, Mr. Lynch served as a Trustee of the Fidelity funds (1990 2003). In addition, he serves as a Trustee of Boston College, Massachusetts Eye & Ear Infirmary, Historic Deerfield, John F. Kennedy Library, and the Museum of Fine Arts of Boston.
Year of Election or Appointment: 2005
Vice President of VIP Growth Opportunities. Mr. Churchill also serves as Vice President of certain Equity Funds (2005 present) and certain High Income Funds (2005 present). Previously, he served as Head of Fidelity’s Fixed Income Division (2000 2005), Vice President of Fidelity’s Money Market Funds (2000 2005), Vice President of Fidelity’s Bond Funds, and Senior Vice President of FIMM (2000) and FMR. Mr. Churchill joined Fidelity in 1993 as Vice President and Group Leader of Taxable Fixed Income Investments.
Year of Election or Appointment: 2005
Vice President of VIP Growth Opportunities. Mr. Porter also serves as Vice President of another fund advised by FMR. Prior to assuming his current responsibilities, Mr. Porter worked as a research analyst and portfolio manager. Mr. Porter also serves as Vice President of FMR (2004) and FMR Co., Inc. (2004).
Year of Election or Appointment: 1998
Secretary of VIP Growth Opportunities. He also serves as Secretary of other Fidelity funds; Vice President, General Counsel, and Secretary of FMR Co., Inc. (2001 present) and FMR; Assistant Secretary of Fidelity Management & Research (U.K.) Inc.
(2001 present), Fidelity Management & Research (Far East) Inc. (2001 present), and Fidelity Investments Money Management, Inc. (2001 present). Mr. Roiter is an Adjunct Member, Faculty of Law, at Boston College Law School (2003 present). Previously, Mr. Roiter served as Vice President and Secretary of Fidelity Distributors Corporation (FDC) (1998 2005).
Year of Election or Appointment: 2003
Assistant Secretary of VIP Growth Opportunities. Mr. Fross also serves as Assistant Secretary of other Fidelity funds (2003 present), Vice President and Secretary of FDC (2005 present), and is an employee of FMR.
Year of Election or Appointment: 2004
President, Treasurer, and Anti Money Laundering (AML) officer of VIP Growth Opportunities. Ms. Reynolds also serves as President, Treasurer, and AML officer of other Fidelity funds (2004) and is a Vice President (2003) and an employee (2002) of FMR. Before joining Fidelity Investments, Ms. Reynolds worked at PricewaterhouseCoopers LLP (PwC) (1980 2002), where she was most recently an audit partner with PwC’s investment management practice.
Year of Election or Appointment: 2005
Chief Financial Officer of VIP Growth Opportunities. Mr. Murphy also serves as Chief Financial Officer of other Fidelity funds (2005 present). He also serves as Senior Vice President of Fidelity Pricing and Cash Management Services Group (FPCMS).
VIP Growth Opportunities Portfolio
|
Name, Age; Principal Occupation
Kenneth A. Rathgeber (58)
|
Year of Election or Appointment: 2004
Chief Compliance Officer of VIP Growth Opportunities. Mr. Rathgeber also serves as Chief Compliance Officer of other Fidelity funds (2004) and Executive Vice President of Risk Oversight for Fidelity Investments (2002). Previously, he served as Executive Vice President and Chief Operating Officer for Fidelity Investments Institutional Services Company, Inc. (1998 2002).
Year of Election or Appointment: 2003
Deputy Treasurer of VIP Growth Opportunities. Mr. Hebble also serves as Deputy Treasurer of other Fidelity funds (2003), and is an employee of FMR. Before joining Fidelity Investments, Mr. Hebble worked at Deutsche Asset Management where he served as Director of Fund Accounting (2002 2003) and Assistant Treasurer of the Scudder Funds (1998 2003).
Year of Election or Appointment: 2005
Deputy Treasurer of VIP Growth Opportunities. Mr. Mehrmann also serves as Deputy Treasurer of other Fidelity funds (2005 present) and is an employee of FMR. Previously, Mr. Mehrmann served as Vice President of Fidelity Investments Institutional Services Group (FIIS)/Fidelity Investments Institutional Operations Corporation, Inc. (FIIOC) Client Services (1998 2004).
Kimberley H. Monasterio (42)
|
Year of Election or Appointment: 2004
Deputy Treasurer of VIP Growth Opportunities. Ms. Monasterio also serves as Deputy Treasurer of other Fidelity funds (2004) and is an employee of FMR (2004). Before joining Fidelity Investments, Ms. Monasterio served as Treasurer (2000 2004) and Chief Financial Officer (2002 2004) of the Franklin Templeton Funds and Senior Vice President of Franklin Templeton Services, LLC (2000 2004).
Year of Election or Appointment: 2005
Deputy Treasurer of VIP Growth Opportunities. Mr. Robins also serves as Deputy Treasurer of other Fidelity funds (2005 present) and is an employee of FMR (2004 present). Before joining Fidelity Investments, Mr. Robins worked at KPMG LLP, where he was a partner in KPMG’s department of professional practice (2002 2004) and a Senior Manager (1999 2000). In addition, Mr. Robins served as Assistant Chief Accountant, United States Securities and Exchange Commission (2000 2002).
Year of Election or Appointment: 2005
Assistant Treasurer of VIP Growth Opportunities. Mr. Byrnes also serves as Assistant Treasurer of other Fidelity funds (2005 present) and is an employee of FMR (2005 present). Previously, Mr. Byrnes served as Vice President of FPCMS (2003 2005). Before joining Fidelity Investments, Mr. Byrnes worked at Deutsche Asset Management where he served as Vice President of the Investment Operations Group (2000 2003).
Year of Election or Appointment: 1995
Assistant Treasurer of VIP Growth Opportunities. Mr. Costello also serves as Assistant Treasurer of other Fidelity funds and is an employee of FMR.
Year of Election or Appointment: 2004
Assistant Treasurer of VIP Growth Opportunities. Mr. Lydecker also serves as Assistant Treasurer of other Fidelity funds (2004) and is an employee of FMR.
Year of Election or Appointment: 2002
Assistant Treasurer of VIP Growth Opportunities. Mr. Osterheld also serves as Assistant Treasurer of other Fidelity funds (2002) and is an employee of FMR.
Year of Election or Appointment: 2005
Assistant Treasurer of VIP Growth Opportunities. Mr. Ryan also serves as Assistant Treasurer of other Fidelity funds (2005 present) and is an employee of FMR (2005 present). Previously, Mr. Ryan served as Vice President of Fund Reporting in FPCMS
(1999 2005).
27 Annual Report
Trustees and Officers - continued
|
| | Name, Age; Principal Occupation
Salvatore Schiavone (40)
|
Year of Election or Appointment: 2005
Assistant Treasurer of VIP Growth Opportunities. Mr. Schiavone also serves as Assistant Treasurer of other Fidelity funds (2005 present) and is an employee of FMR (2005 present). Before joining Fidelity Investments, Mr. Schiavone worked at Deutsche Asset Management, where he most recently served as Assistant Treasurer (2003 2005) of the Scudder Funds and Vice President and Head of Fund Reporting (1996 2003).
VIP Growth Opportunities Portfolio
|
Initial Class, Service Class, and Service Class 2 designates 100% of the dividends distributed during the fiscal year as qualifying for the dividends received deduction for corporate shareholders.
The fund will notify shareholders in January 2006 of amounts for use in preparing 2005 income tax returns.
29 Annual Report
Board Approval of Investment Advisory Contracts and Management Fees
VIP Growth Opportunities Portfolio
|
Each year, typically in July, the Board of Trustees, including the independent Trustees (together, the Board), votes on the renewal of the management contract and sub advisory agreements (together, the Advisory Contracts) for the fund. The Board, assisted by the advice of fund counsel and indepen dent Trustees’ counsel, requests and considers a broad range of information throughout the year.
The Board meets regularly each month except August and takes into account throughout the year matters bearing on Advisory Contracts. The Board, acting directly and through its separate committees, considers at each of its meetings factors that are relevant to the annual renewal of the fund’s Advisory Contracts, including the services and support provided to the fund and its shareholders by Fidelity. At the time of the renewal, the Board had 11 standing committees, each composed of independent Trustees with varying backgrounds, to which the Board has assigned specific subject matter responsibilities in order to enhance effective decision making by the Board. Each committee has adopted a written charter outlining the structure and purposes of the committee. One such committee, the Equity Contract Committee, meets periodically during the first six months of each year and as necessary to consider matters specifically related to the annual renewal of Advisory Contracts. The committee requests and receives information on, and makes recommendations to the independent Trustees concerning, the approval and annual review of the Advisory Contracts.
At its July 2005 meeting, the Board of Trustees, including the independent Trustees, unanimously determined to renew the Advisory Contracts for the fund. In reaching its determination, the Board considered all factors it believed relevant, including (1) the nature, extent, and quality of the services to be provided to the fund and its shareholders by Fidelity (including the investment performance of the fund); (2) the competitiveness of the manage ment fee and total expenses of the fund; (3) the total costs of the services to be provided by and the profits to be realized by the investment adviser and its affiliates from the relationship with the fund; (4) the extent to which economies of scale would be realized as the fund grows; and (5) whether fee levels reflect these economies of scale, if any, for the benefit of fund shareholders.
In determining whether to renew the Advisory Contracts for the fund, the Board ultimately reached a determination, with the assistance of fund counsel and independent Trustees’ counsel, that the renewal of the Advisory Contracts and the compensation to be received by Fidelity under the management contract is consistent with Fidelity’s fiduciary duty under applicable law. In addition to evaluating the specific factors noted above, the Board, in reaching its determination, is aware that shareholders in the fund have a broad range of investment choices available to them, including a wide choice among mutual funds offered by competitors to Fidelity, and that the fund’s shareholders, with the opportunity to review and weigh the disclosure provided by the fund in its prospectus and other public disclosures, have chosen to invest in this fund, managed by Fidelity.
Nature, Extent, and Quality of Services Provided by Fidelity. The Board considered staffing within the investment adviser, FMR, and the sub advisers (together, the Investment Advisers), including the background of the fund’s portfolio manager and the fund’s investment objective and discipline. The independent Trustees also had discussions with senior management of Fidelity’s investment operations and investment groups. The Board considered the structure of the portfolio manager compensation program and whether this structure provides appropriate incentives.
Fidelity Resources Dedicated to Investment Management and Support Services. The Board reviewed the size, education, and experience of the Invest ment Advisers’ investment staff, their use of technology, and the Investment Advisers’ approach to recruiting, training, and retaining portfolio managers and other research, advisory, and management personnel. The Board considered Fidelity’s extensive global research capabilities that enable the Investment Advisers to aggregate data from various sources in an effort to produce positive investment results. The Board noted that Fidelity’s analysts have access to a variety of technological tools that enable them to perform both fundamental and quantitative analysis and to specialize in various disciplines. The Board also considered that Fidelity’s portfolio managers and analysts have access to daily portfolio attribution that allows for monitor ing of a fund’s portfolio, as well as an electronic communication system that provides immediate real time access to research concerning issuers and credit enhancers.
Shareholder and Administrative Services. The Board considered the nature, extent, quality, and cost of administrative, distribution, and shareholder services performed by the Investment Advisers and their affiliates under the Advisory Contracts and under separate agreements covering transfer agency, pricing and bookkeeping, and securities lending services for the fund. The Board also considered the nature and extent of the Investment Advisers’ supervision of third party service providers, principally custodians and subcustodians. The Board reviewed the allocation of fund brokerage, including allocations to brokers affiliated with the Investment Advisers, the use of brokerage commissions to pay fund expenses, and the use of “soft” commission dollars to pay for research services. The Board also considered that Fidelity voluntarily decided in 2004 to stop using “soft” commission dollars to pay for market data and, instead, to pay for that data out of its own resources. The Board also considered the resources devoted to, and the record of compliance with, the fund’s compliance policies and procedures.
The Board noted that the growth of fund assets across the complex allows Fidelity to reinvest in the development of services designed to enhance the value or convenience of the Fidelity funds as investment vehicles. These services include 24 hour access to account information and market informa tion through phone representatives and over the Internet, and investor education materials and asset allocation tools.
Investment in a Large Fund Family. The Board considered the benefits to shareholders of investing in a Fidelity fund, including the benefits of investing in a fund that is part of a large family of funds offering a variety of investment disciplines and providing for a large variety of mutual fund investor services. The Board noted that, since the last Advisory Contract renewals in July 2004, Fidelity has taken a number of actions that benefited particular
VIP Growth Opportunities Portfolio
|
funds, including (i) voluntarily deciding in 2004 to stop using “soft” commission dollars to pay for market data and, instead, to pay for that data out of its own resources, (ii) contractually agreeing to impose management fee reductions and expense limitations on its five Spartan stock index funds and its stock index fund available through variable insurance products, (iii) contractually agreeing to eliminate the management fees on the Fidelity Freedom Funds and the Fidelity Advisor Freedom Funds, (iv) contractually agreeing to reduce the management fees on most of its investment grade taxable bond funds, and (v) contractually agreeing to impose expense limitations on its retail and Spartan investment grade taxable bond funds.
Investment Performance and Compliance. The Board considered whether the fund has operated within its investment objective, as well as its record of compliance with its investment restrictions. It also reviewed the fund’s absolute investment performance for each class, as well as the fund’s relative investment performance for each class measured against (i) a broad based securities market index, and (ii) a peer group of mutual funds deemed appropriate by the Board over multiple periods. The following charts considered by the Board show, over the one , three , and five year periods ended December 31, 2004, the returns of Service Class and Initial Class of the fund, the returns of a broad based securities market index (“benchmark”), and a range of returns of a peer group of mutual funds identified by Lipper Inc. as having an investment objective similar to that of the fund. The returns of Service Class and Initial Class represent the performance of classes with high and low 12b 1 fees, respectively (not necessarily with the highest and lowest total expenses). (Unlike Service Class, Service Class 2, which has a higher 12b 1 fee than Service Class, did not have five years of performance as of December 31, 2004.) The box within each chart shows the 25th percentile return (bottom of box) and the 75th percentile return (top of box) of the Lipper peer group. Returns shown above the box are in the first quartile and returns shown below the box are in the fourth quartile. The percentage beaten numbers noted below each chart correspond to the percentile box and represent the percentage of funds in the Lipper peer group whose performance was equal to or lower than that of the class indicated.
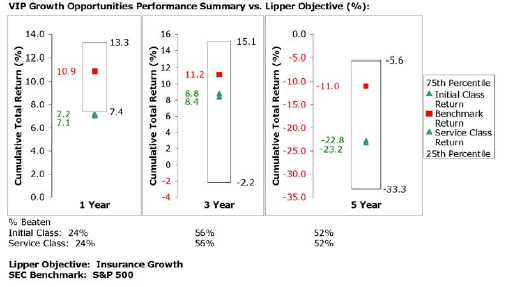
The Board reviewed the fund’s relative investment performance against its Lipper peer group and stated that the performance of Initial Class of the fund was in the fourth quartile for the one year period and the second quartile for the three and five year periods. The Board also stated that the relative investment performance of the fund was lower than its benchmark over time. The Board considered that the variations in performance among the fund’s classes reflect the variations in class expenses, which result in lower performance for higher expense classes.
The Board has had thorough discussions with FMR throughout the year about the Board’s and FMR’s concerns about equity research, equity fund performance, and compliance with internal policies governing gifts and entertainment. FMR has taken steps that it believes will refocus and strengthen equity research and equity portfolio management and compliance. The Board noted with favor FMR’s recent reorganization of its senior management team and FMR’s plans to dedicate additional resources to investment research, and participated in the process that led to those changes.
Based on its review, and giving particular weight to the nature and quality of the resources dedicated by the Investment Advisers to maintain and improve relative performance, the Board concluded that the nature, extent, and quality of the services provided by Fidelity will benefit the fund’s shareholders, particularly in light of the Board’s view that the fund’s shareholders benefit from investing in a fund that is part of a large family of funds offering a variety of investment disciplines and services.
Competitiveness of Management Fee and Total Fund Expenses. The Board considered the fund’s management fee and total expenses compared to “mapped groups” of competitive funds and classes. Fidelity creates “mapped groups” by combining similar Lipper investment objective categories that have comparable management fee characteristics. Combining Lipper investment objective categories aids the Board’s management fee and total expense comparisons by broadening the competitive group used for comparison and by reducing the number of universes to which various Fidelity funds are compared.
31 Annual Report
Board Approval of Investment Advisory Contracts and Management Fees - continued
The Board considered two proprietary management fee comparisons for the 12 month periods shown in the chart below. The group of Lipper funds used by the Board for management fee comparisons is referred to below as the “Total Mapped Group” and, for the reasons explained above, is broader than the Lipper peer group used by the Board for performance comparisons. The Total Mapped Group comparison focuses on a fund’s standing relative to the total universe of comparable funds available to investors, in terms of gross management fees before expense reimbursements or caps. “TMG %” represents the percentage of funds in the Total Mapped Group that had management fees that were lower than the fund’s. For example, a TMG % of 12% means that 88% of the funds in the Total Mapped Group had higher management fees than the fund. The “Asset Size Peer Group” (ASPG) comparison focuses on a fund’s standing relative to non Fidelity funds similar in size to the fund within the Total Mapped Group. The ASPG represents at least 15% of the funds in the Total Mapped Group with comparable asset size and management fee characteristics, subject to a minimum of 50 funds (or all funds in the Total Mapped Group if fewer than 50). Additional information, such as the ASPG quartile (“quadrant”) in which the fund’s management fee ranked, is also included in the chart and considered by the Board.

The Board noted that the fund’s management fee ranked below the median of its Total Mapped Group and below the median of its ASPG for 2004.
Based on its review, the Board concluded that the fund’s management fee was fair and reasonable in light of the services that the fund receives and the other factors considered.
In its review of each class’s total expenses, the Board considered the fund’s management fee as well as other fund or class expenses, as applicable, such as transfer agent fees, pricing and bookkeeping fees, fund paid 12b 1 fees, and custodial, legal, and audit fees. The Board also noted the effects of any waivers and reimbursements on fees and expenses. As part of its review, the Board also considered current and historical total expenses of each class of the fund compared to competitive fund median expenses. Each class of the fund is compared to those funds and classes in the Total Mapped Group (used by the Board for management fee comparisons) that have a similar sales load structure.
The Board noted that each class’s total expenses ranked below its competitive median for 2004.
In its review of total expenses, the Board also considered Fidelity fee structures and other information on clients that FMR and its affiliates service in other competitive markets, such as other mutual funds advised or subadvised by FMR or its affiliates, pension plan clients, and other institutional clients.
Based on its review, the Board concluded that the total expenses for each class of the fund were reasonable in light of the services that the fund and its shareholders receive and the other factors considered.
Costs of the Services and Profitability. The Board considered the revenues earned and the expenses incurred by Fidelity in conducting the busi ness of developing, marketing, distributing, managing, administering and servicing the fund and its shareholders. The Board also considered the level of Fidelity’s profits in respect of all the Fidelity funds.
On an annual basis, FMR presents to the Board Fidelity’s profitability for the fund. Fidelity calculates the profitability for each fund, as well as aggregate profitability for groups of Fidelity funds and all Fidelity funds, using a series of detailed revenue and cost allocation methodologies which originate with the audited books and records of Fidelity. The Audit Committee of the Board reviews any significant changes from the prior year’s methodologies.
PricewaterhouseCoopers LLP (PwC), independent registered accounting firm and auditor to Fidelity and certain Fidelity funds, has been engaged annually by the Board as part of the Board’s assessment of the results of Fidelity’s profitability analysis. PwC’s engagement includes the review and
VIP Growth Opportunities Portfolio
|
assessment of Fidelity’s methodologies used in determining the revenues and expenses attributable to Fidelity’s mutual fund business, and completion of agreed upon procedures surrounding the mathematical accuracy of fund profitability and its conformity to allocation methodologies. After consider ing PwC’s reports issued under the engagement and information provided by Fidelity, the Board believes that while other allocation methods may also be reasonable, Fidelity’s profitability methodologies are reasonable in all material respects.
The Board has also reviewed Fidelity’s non fund businesses and any fall out benefits related to the mutual fund business as well as cases where Fidelity’s affiliates may benefit from or be related to the fund’s business. In addition, a special committee of the Board reviewed services provided to Fidelity by its affiliates and determined that the fees that Fidelity paid for such services were reasonable.
The Board considered the costs of the services provided by and the profits realized by Fidelity in connection with the operation of the fund and deter mined that the amount of profit is a fair entrepreneurial profit for the management of the fund.
Economies of Scale. The Board considered whether there have been economies of scale in respect of the management of the Fidelity funds, whether the Fidelity funds (including the fund) have appropriately benefited from any such economies of scale, and whether there is potential for realization of any further economies of scale. The Board considered the extent to which the fund will benefit from economies of scale through increased services to the fund, through waivers or reimbursements, or through fee or expense reductions.
The Board recognized that the fund’s management contract incorporates a “group fee” structure, which provides for lower fee rates as total fund assets under FMR’s management increase, and for higher fee rates as total fund assets under FMR’s management decrease. The Board considered that the group fee is designed to deliver the benefits of economies of scale to fund shareholders when total fund assets increase, even if assets of any particular fund are unchanged or have declined, because some portion of Fidelity’s costs are attributable to services provided to all Fidelity funds, and all funds benefit if those costs can be allocated among more assets. The Board concluded that, given the group fee structure, fund shareholders will achieve a certain level of economies of scale as assets under FMR’s management increase at the fund complex level, regardless of whether Fidelity achieves any such economies of scale.
The Board further concluded that any potential economies of scale are being shared between fund shareholders and Fidelity in an appropriate manner.
Additional Information Requested by the Board. In order to develop fully the factual basis for consideration of the Advisory Contracts, the Board requested additional information regarding (i) equity fund transfer agency fees; (ii) Fidelity’s fund profitability methodology and the impact of various changes in the methodology over time; (iii) benefits to shareholders from economies of scale; (iv) composition and characteristics of various fund and industry data used in comparisons; and (v) compensation of portfolio managers and research analysts.
Based on its evaluation of all of the conclusions noted above, and after considering all material factors, the Board ultimately concluded that the exist ing advisory fee structures are fair and reasonable, and that the fund’s existing Advisory Contracts should be renewed.
33 Annual Report
Investment Adviser
Fidelity Management & Research Company
Boston, MA
Investment Sub Advisers
FMR Co., Inc.
Fidelity Management & Research (U.K.) Inc.
Fidelity Management & Research (Far East) Inc.
Fidelity Investments Japan Limited
Fidelity International Investment Advisors
Fidelity International Investment Advisors (U.K.) Limited
General Distributor
Fidelity Distributors Corporation
Boston, MA
Transfer and Service Agents
Fidelity Investments Institutional Operations Company, Inc.
Boston, MA
Fidelity Service Company, Inc.
Boston, MA
Custodian
Mellon Bank, N.A.
Pittsburgh, PA
|
VIPGRO ANN 0206
1.540209.108
|
Fidelity® Variable Insurance Products:
Mid Cap Portfolio
|

Annual Report
December 31, 2005
|

| Contents | | | | |
| |
| Performance | | 3 | | How the fund has done over time. |
| Management’s Discussion | | 4 | | The manager’s review of fund performance, strategy and |
| | | | | outlook. |
| Shareholder Expense Example | | 5 | | An example of shareholder expenses. |
| Investment Changes | | 6 | | A summary of major shifts in the fund’s investments over the |
| | | | | past six months. |
| Investments | | 7 | | A complete list of the fund’s investments with their |
| | | | | market values. |
| Financial Statements | | 32 | | Statements of assets and liabilities, operations, and |
| | | | | changes in net assets, as well as financial highlights. |
| Notes | | 37 | | Notes to the financial statements. |
| Report of Independent Registered | | 41 | | |
| Public Accounting Firm | | | | |
| Trustees and Officers | | 42 | | |
| Distributions | | 47 | | |
| Board Approval of Investment Advisory | | 48 | | |
| Contracts and Management Fees | | | | |
| | To view a fund’s proxy voting guidelines and proxy voting record for the 12 month period ended June 30, visit www.fidelity.com/proxyvotingresults or visit the
Securities and Exchange Commission’s (SEC) web site at www.sec.gov. You may also call 1-877-208-0098 to request a free copy of the proxy voting guidelines.
Fidelity Variable Insurance Products are separate account options which are purchased through a variable insurance contract.
Standard & Poor’s, S&P and S&P 500 are registered service marks of The McGraw Hill Companies, Inc. and have been licensed for use by
Fidelity Distributors Corporation.
Other third party marks appearing herein are the property of their respective owners.
All other marks appearing herein are registered or unregistered trademarks or service marks of FMR Corp. or an affiliated company.
|
| | This report and the financial statements contained herein are submitted for the general information of the shareholders of the fund. This report is not authorized for
distribution to prospective investors in the fund unless preceded or accompanied by an effective prospectus.
A fund files its complete schedule of portfolio holdings with the SEC for the first and third quarters of each fiscal year on Form N Q. Forms N Q are available on the
SEC’s web site at http://www.sec.gov. A fund’s Forms N Q may be reviewed and copied at the SEC’s Public Reference Room in Washington, DC. Information regard
ing the operation of the SEC’s Public Reference Room may be obtained by calling 1-800-SEC-0330. For a complete list of a fund’s portfolio holdings, view the most
recent quarterly holdings report, semiannual report, or annual report on Fidelity’s web site at http://www.advisor.fidelity.com.
NOT FDIC INSURED · MAY LOSE VALUE · NO BANK GUARANTEE
Neither the fund nor Fidelity Distributors Corporation is a bank.
|
VIP Mid Cap Portfolio 2
VIP Mid Cap Portfolio
Performance: The Bottom Line
|
Average annual total return reflects the change in the value of an investment, assuming reinvestment of the class’ dividend income and capital gains (the profits earned upon the sale of securities that have grown in value) and assuming a constant rate of performance each year. During periods of reimbursement by Fidelity, a fund’s total return will be greater than it would be had the reimbursement not occurred. Perfor mance numbers are net of all underlying fund operating expenses, but do not include any insurance charges imposed by your insurance company’s separate account. If performance information included the effect of these additional charges, the total returns would have been lower. How a fund did yesterday is no guarantee of how it will do tomorrow.
| Average Annual Total Returns | | | | | | |
| Periods ended December 31, 2005 | | Past 1 | | Past 5 | | Life of |
| | | year | | years | | fundA |
| VIP Mid Cap — Initial Class | | 18.30% | | 12.32% | | 20.39% |
| VIP Mid Cap — Service ClassB | | 18.20% | | 12.21% | | 20.26% |
| VIP Mid Cap — Service Class 2C | | 18.02% | | 12.04% | | 20.11% |
| VIP Mid Cap — Investor ClassD | | 18.20% | | 12.30% | | 20.37% |
| | A From December 28, 1998.
B Performance for Service Class shares reflects an asset based distribution fee (12b 1).
C The initial offering of Service Class 2 shares took place January 12, 2000. Performance for Service Class 2 shares reflects an asset based distribution fee (12b 1 fee).
Returns from December 28, 1998 to January 12, 2000 are those of Service Class which reflect a different 12b 1 fee. Had Service Class 2’s 12b 1 fee been reflected, returns prior
to January 12, 2000 would have been lower.
D The initial offering of Investor Class shares took place on July 21, 2005. Returns prior to July 21, 2005 are those of Initial Class. If Investor Class’s transfer agent fee had
been reflected, returns prior to July 21, 2005 would have been lower.
|
$10,000 Over Life of Fund
Let’s say hypothetically that $10,000 was invested in VIP Mid Cap Portfolio Initial Class on December 28, 1998, when the fund started. The chart shows how the value of your investment would have changed, and also shows how the S&P® MidCap 400 Index performed the same period.
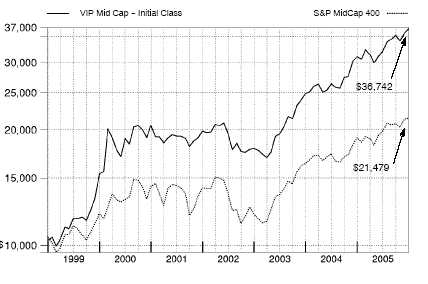
3 Annual Report
VIP Mid Cap Portfolio
Management’s Discussion of Fund Performance
|
Comments from Thomas Allen, Portfolio Manager of VIP Mid Cap Portfolio
U.S. equity benchmarks generally had positive results for the 12 months ending December 31, 2005, the third consecutive year that stocks finished in the black. Energy and utilities were the two best performing sectors, contributing greatly to the 4.91% gain of the Standard & Poor’s 500SM Index. Elsewhere, the NASDAQ Composite® Index returned 2.13%, while the Dow Jones Industrial AverageSM rose 1.72% . The U.S. economy did not decelerate as much as many had predicted, despite eight short term interest rate hikes, record high energy prices and the devastation caused by Hurricane Katrina. Meanwhile, corporate America notched its 14th consecutive quarter of double digit earnings gains through the third quarter of the year, an unprecedented streak in market history. From a style perspective, large cap stocks ended the six year reign of small caps by a narrow margin, but mid caps finished well ahead of both categories. The gap between growth and value stocks also was relatively narrow, with value gaining a slight edge.
During the past year, the fund significantly outperformed the 12.56% return of the Standard & Poor’s® MidCap 400 Index and the 10.22% gain of the LipperSM Variable Annuity Mid Cap Funds Average. (For specific portfolio performance results, please refer to the performance section of this report.)
Most of the outperformance relative to the index came from a significant overweighting in energy, along with effective stock picking in the sector. Also aiding the fund’s performance was timely stock selection in financials and materials. On the other hand, my choices in consumer staples and technology dampened results. Valero Energy was the fund’s top contributor both in absolute terms and compared with the index. The crude oil refiner benefited from strong demand and limited industrywide capacity. Southwestern Energy, an exploration and production company, was aided by some natural gas discoveries that significantly boosted its reserves. Within technology, Apple Computer was a standout, spurred by robust sales of the iPod, the company’s personal digital media player. Conversely, Symbol Technologies, a maker of bar code scanners, was the fund’s largest detractor both in absolute terms and versus the index. Lackluster sales growth derailed the stock. Household and personal products marketer Avon Products also had a negative impact on the fund’s results, primarily because of its disappointing sales growth in the United States and abroad. In absolute terms, currency fluctuations —particularly the depreciation of the Japanese yen versus the U.S. dollar acted as a mild head wind given the fund’s significant foreign exposure.
The views expressed in this statement reflect those of the portfolio manager only through the end of the period of the report as stated on the cover and do not necessarily represent the views of Fidelity or any other person in the Fidelity organization. Any such views are subject to change at any time based upon market or other conditions and Fidelity disclaims any responsibility to update such views. These views may not be relied on as invest ment advice and, because investment decisions for a Fidelity fund are based on numerous factors, may not be relied on as an indication of trading intent on behalf of any Fidelity fund.
VIP Mid Cap Portfolio 4
| | VIP Mid Cap Portfolio
Shareholder Expense Example
|
As a shareholder of the Fund, you incur two types of costs: (1) transaction costs, and (2) ongoing costs, including management fees, distribution and/or service (12b 1) fees and other Fund expenses. This Example is intended to help you understand your ongoing costs (in dollars) of investing in the Fund and to compare these costs with the ongoing costs of investing in other mutual funds.
The actual expense Example is based on an investment of $1,000 invested at the beginning of the period and held for the entire period (July 1, 2005 to December 31, 2005) for the Initial Class, Service Class and Service Class 2 and for the entire period (July 21, 2005 to December 31, 2005) for the Investor Class. The hypothetical expense Example is based on an investment of $1,000 invested for the one half year period (July 1, 2005 to Decem ber 31, 2005).
Actual Expenses
The first line of the table below for each class of the Fund provides information about actual account values and actual expenses. You may use the information in this line, together with the amount you invested, to estimate the expenses that you paid over the period. Simply divide your account value by $1,000.00 (for example, an $8,600 account value divided by $1,000.00 = 8.6), then multiply the result by the number in the first line for a class of the Fund under the heading entitled “Expenses Paid During Period” to estimate the expenses you paid on your account during this period. The estimate of expenses does not include any fees or other expenses of any variable annuity or variable life insurance product. If they were, the estimate of expenses you paid during the period would be higher, and your ending account value would be lower.
Hypothetical Example for Comparison Purposes
The second line of the table below for each class of the Fund provides information about hypothetical account values and hypothetical expenses based on a Class’ actual expense ratio and an assumed rate of return of 5% per year before expenses, which is not the Class’ actual return. The hypothetical account values and expenses may not be used to estimate the actual ending account balance or expenses you paid for the period. You may use this information to compare the ongoing costs of investing in the Fund and other funds. To do so, compare this 5% hypothetical example with the 5% hypothetical examples that appear in the shareholder reports of the other funds. The estimate of expenses does not include any fees or other expenses of any variable annuity or variable life insurance product. If they were, the estimate of expenses you paid during the period would be higher, and your ending account value would be lower.
Please note that the expenses shown in the table are meant to highlight your ongoing costs only and do not reflect any transaction costs. Therefore, the second line of the table is useful in comparing ongoing costs only, and will not help you determine the relative total costs of owning different funds.
| | | | | Ending | | | | |
| | | Beginning | | Account Value | | | | Expenses Paid |
| | | Account Value | | December 31, 2005 | | | | During Period |
| Initial Class | | | | | | | | | | |
| Actual | | $ 1,000.00 | | | | $ 1,148.10 | | | | $ 3.74B |
| HypotheticalA | | $ 1,000.00 | | | | $ 1,021.73 | | | | $ 3.52C |
| Service Class | | | | | | | | | | |
| Actual | | $ 1,000.00 | | | | $ 1,147.80 | | | | $ 4.28B |
| HypotheticalA | | $ 1,000.00 | | | | $ 1,021.22 | | | | $ 4.02C |
| Service Class 2 | | | | | | | | | | |
| Actual | | $ 1,000.00 | | | | $ 1,146.90 | | | | $ 5.09B |
| HypotheticalA | | $ 1,000.00 | | | | $ 1,020.47 | | | | $ 4.79C |
| Investor Class | | | | | | | | | | |
| Actual | | $ 1,000.00 | | | | $ 1,102.80 | | | | $ 4.06B |
| HypotheticalA | | $ 1,000.00 | | | | $ 1,020.87 | | | | $ 4.38C |
A 5% return per year before expenses
B Actual expenses are equal to each Class’ annualized expense ratio (shown in the table below); multiplied by the average account value over
the period, multiplied by 184/365 (to reflect the one half year period) for the Initial Class, Service Class and Service Class 2 and multiplied by
164/365 (to reflect the period July 21, 2005 to December 31, 2005) for the Investor Class.
C Hypothetical expenses are equal to each Class’ annualized expense ratio (shown in the table below); multiplied by the average account
value over the period, multiplied by 184/365 (to reflect the one-half year period).
|
| | | Annualized |
| | | Expense Ratio |
| Initial Class | | 69% |
| Service Class | | 79% |
| Service Class 2 | | 94% |
| Investor Class | | 86% |
55 Annual Report
| VIP Mid Cap Portfolio | | | | |
| Investment Changes | | |
| |
| |
| Top Ten Stocks as of December 31, 2005 |
| | | % of fund’s | | % of fund’s net assets |
| | | net assets | | 6 months ago |
| Newmont Mining Corp. | | 1.6 | | 1.6 |
| Rockwell Automation, Inc. | | 1.4 | | 0.9 |
| Assurant, Inc. | | 1.4 | | 1.7 |
| Nabors Industries Ltd. | | 1.3 | | 0.6 |
| Thermo Electron Corp. | | 1.3 | | 0.2 |
| CONSOL Energy, Inc. | | 1.3 | | 1.1 |
| Humana, Inc. | | 1.2 | | 0.3 |
| Freeport McMoRan Copper & | | | | |
| Gold, Inc. Class B | | 1.2 | | 1.1 |
| QIAGEN NV | | 1.2 | | 1.3 |
| Covance, Inc. | | 1.1 | | 0.9 |
| | | 13.0 | | |
| |
| Top Five Market Sectors as of December 31, 2005 |
| | | % of fund’s | | % of fund’s net assets |
| | | net assets | | 6 months ago |
| Health Care | | 17.2 | | 17.3 |
| Energy | | 16.5 | | 15.5 |
| Industrials | | 13.9 | | 10.6 |
| Information Technology | | 10.7 | | 14.0 |
| Consumer Discretionary | | 10.6 | | 13.2 |
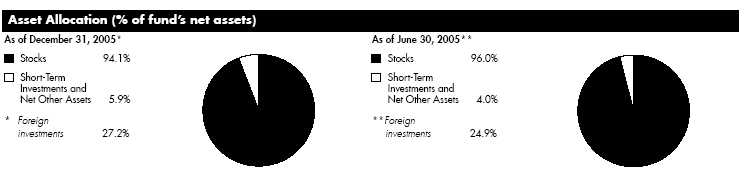
VIP Mid Cap Portfolio 6
| VIP Mid Cap Portfolio | | | | | | |
| Investments December 31, 2005 | | | | |
| Showing Percentage of Net Assets | | | | | | |
| |
| Common Stocks 94.1% | | | | | | |
| | | | | | | Shares | | Value (Note 1) |
| |
| CONSUMER DISCRETIONARY 10.6% | | | | | | |
| Auto Components – 0.9% | | | | | | |
| BorgWarner, Inc. | | | | | | 290,200 | | $ 17,594,826 |
| China Yuchai International Ltd. | | | | 100 | | 783 |
| Continental AG | | | | | | 100 | | 8,877 |
| ElringKlinger AG | | | | | | 200 | | 7,236 |
| Gentex Corp. | | | | | | 672,400 | | 13,111,800 |
| IMPCO Technologies, Inc. (e) | | | | 1,806,793 | | 9,268,848 |
| Jinheng Automotive Safety Technology Holdings Ltd. | | | | 2,000 | | 217 |
| LKQ Corp. (a) | | | | | | 356,481 | | 12,341,372 |
| New Focus Auto Tech Holdings Ltd. | | | | 5,804,000 | | 845,862 |
| Quantum Fuel Systems Technologies Worldwide, Inc. (a) | | | | 46 | | 123 |
| | | | | | | | | 53,179,944 |
| Automobiles – 0.6% | | | | | | | | |
| Bajaj Auto Ltd. | | | | | | 270,533 | | 12,031,639 |
| Denway Motors Ltd. | | | | | | 4,000 | | 1,328 |
| Geely Automobile Holdings Ltd. | | | | 59,050,200 | | 2,475,133 |
| Harley Davidson, Inc. | | | | | | 65,100 | | 3,351,999 |
| Hero Honda Motors Ltd. | | | | 94 | | 1,795 |
| Hyundai Motor Co. | | | | | | 83,220 | | 8,037,030 |
| Hyundai Motor Co. GDR (f) | | | | 100 | | 4,861 |
| Mahindra & Mahindra Ltd. | | | | 169,496 | | 1,927,195 |
| Maruti Udyog Ltd. | | | | | | 481,168 | | 6,799,125 |
| Renault SA | | | | | | 100 | | 8,157 |
| Thor Industries, Inc. | | | | | | 200 | | 8,014 |
| | | | | | | | | 34,646,276 |
| Distributors 0.0% | | | | | | | | |
| China Resources Enterprise Ltd. | | | | 2,000 | | 3,573 |
| Educational Development Corp. | | | | 100 | | 810 |
| Li & Fung Ltd. | | | | | | 2,000 | | 3,856 |
| | | | | | | | | 8,239 |
| Diversified Consumer Services 0.2% | | | | | | |
| Alderwoods Group, Inc. (a) | | | | 100 | | 1,587 |
| Apollo Group, Inc. Class A (a) | | | | 311 | | 18,803 |
| Benesse Corp. | | | | | | 100 | | 3,503 |
| Bright Horizons Family Solutions, Inc. (a) | | | | 105,214 | | 3,898,179 |
| Concorde Career Colleges, Inc. (a) | | | | 100 | | 1,480 |
| Educate, Inc. (a) | | | | | | 100 | | 1,180 |
| Education Management Corp. (a) | | | | 58,800 | | 1,970,388 |
| ITT Educational Services, Inc. (a) | | | | 100 | | 5,911 |
| Matthews International Corp. Class A | | | | 100 | | 3,641 |
| Princeton Review, Inc. (a) | | | | 29 | | 149 |
| Service Corp. International (SCI) | | | | 358,000 | | 2,928,440 |
| | | | | | | | | 8,833,261 |
| Hotels, Restaurants & Leisure 0.9% | | | | | | |
| Accor SA | | | | | | 100 | | 5,500 |
| Ambassadors Group, Inc. | | | | 200 | | 4,578 |
| BJ’s Restaurants, Inc. (a) | | | | 100 | | 2,286 |
| Indian Hotels Co. Ltd. | | | | | | 100 | | 2,203 |
| Krispy Kreme Doughnuts, Inc. (a) | | | | 100 | | 574 |
| |
| |
See accompanying notes which are an integral part of the financial statements.
| | | | |
| | | | | | | 7 | | Annual Report |
7
| VIP Mid Cap Portfolio | | | | |
| Investments - continued | | | | |
| |
| |
| |
| | | Shares | | Value (Note 1) |
| Kuoni Reisen Holding AG Class B (Reg.) | | 100 | | $ 41,400 |
| Life Time Fitness, Inc. (a) | | 100 | | 3,809 |
| Minor International PCL (For. Reg.) | | 100 | | 16 |
| Outback Steakhouse, Inc. | | 100 | | 4,161 |
| P.F. Chang’s China Bistro, Inc. (a) | | 100 | | 4,963 |
| Red Robin Gourmet Burgers, Inc. (a) | | 100 | | 5,096 |
| Royal Caribbean Cruises Ltd. | | 366,700 | | 16,523,502 |
| Ruby Tuesday, Inc. | | 100 | | 2,589 |
| Shangri La Asia Ltd. | | 2,000 | | 3,340 |
| Sonic Corp. (a) | | 363,283 | | 10,716,849 |
| St. Marc Co. Ltd. | | 353,700 | | 24,628,957 |
| TAJ GVK Hotels & Resorts Ltd. | | 717,595 | | 2,868,307 |
| | | | | 54,818,130 |
| Household Durables 0.9% | | | | |
| Alba PLC | | 26 | | 180 |
| Chitaly Holdings Ltd. | | 894,000 | | 429,494 |
| Garmin Ltd. | | 51 | | 3,384 |
| George Wimpey PLC | | 100 | | 826 |
| Goldcrest Co. Ltd. (d) | | 188,100 | | 17,022,409 |
| Harman International Industries, Inc. | | 100 | | 9,785 |
| Joint Corp. | | 200 | | 6,921 |
| LG Electronics, Inc. | | 123,160 | | 10,916,317 |
| Makita Corp. sponsored ADR | | 100 | | 2,418 |
| Nihon Eslead Corp. | | 262,700 | | 7,553,141 |
| Rational AG | | 39,471 | | 5,246,124 |
| Sekisui House Ltd. (d) | | 661,000 | | 8,319,614 |
| Skyworth Digital Holdings Ltd. | | 2,052 | | 307 |
| Steinhoff International Holdings Ltd. | | 100 | | 296 |
| Toll Brothers, Inc. (a) | | 100 | | 3,464 |
| William Lyon Homes, Inc. (a) | | 100 | | 10,090 |
| | | | | 49,524,770 |
| Internet & Catalog Retail 0.1% | | | | |
| 1 800 FLOWERS.com, Inc. Class A (a) | | 100 | | 642 |
| Alloy, Inc. (a)(d) | | 49,600 | | 143,344 |
| ASKUL Corp. | | 103,800 | | 3,222,154 |
| ASKUL Corp. New | | 103,800 | | 3,222,154 |
| Audible, Inc. (a) | | 100 | | 1,284 |
| Coldwater Creek, Inc. (a) | | 100 | | 3,053 |
| dELiA*s, Inc. (a) | | 24,800 | | 205,840 |
| dELiA*s, Inc. rights 1/27/06 (a) | | 2,865 | | 2,865 |
| GSI Commerce, Inc. (a) | | 100 | | 1,509 |
| | | | | 6,802,845 |
| Leisure Equipment & Products 0.3% | | | | |
| Giant Manufacturing Co. Ltd. | | 512,000 | | 990,419 |
| Jumbo SA | | 681,816 | | 7,409,801 |
| Li Ning Co. Ltd. | | 2,000 | | 1,419 |
| MarineMax, Inc. (a) | | 100 | | 3,157 |
| Mega Bloks, Inc. (a) | | 100 | | 2,376 |
| Nautilus, Inc. | | 100 | | 1,866 |
| Nidec Copal Corp. | | 100 | | 1,357 |
| Oakley, Inc. (d) | | 105,300 | | 1,546,857 |
| Polaris Industries, Inc. | | 100 | | 5,020 |
See accompanying notes which are an integral part of the financial statements.
| | |
| VIP Mid Cap Portfolio | | 8 |
| Common Stocks continued | | | | |
| | | Shares | | Value (Note 1) |
| |
| CONSUMER DISCRETIONARY – continued | | | | |
| Leisure Equipment & Products – continued | | | | |
| SHIMANO, Inc. | | 100 | | $ 2,629 |
| Trigano SA (d) | | 210,800 | | 9,388,281 |
| | | | | 19,353,182 |
| Media 2.2% | | | | |
| Astral Media, Inc. Class A (non vtg.) | | 365,800 | | 9,640,972 |
| Astro All Asia Networks PLC | | 100 | | 139 |
| Austar United Communications Ltd. (a) | | 100 | | 87 |
| Balaji Telefilms Ltd. (a) | | 100 | | 321 |
| Central European Media Enterprises Ltd. Class A (a) | | 100 | | 5,790 |
| Chum Ltd. Class B (non vtg.) | | 200 | | 4,817 |
| Clear Media Ltd. (a) | | 243,000 | | 197,443 |
| E.W. Scripps Co. Class A | | 592,000 | | 28,427,840 |
| Focus Media Holding Ltd. ADR | | 100 | | 3,377 |
| Getty Images, Inc. (a) | | 5,900 | | 526,693 |
| Grupo Televisa SA de CV (CPO) sponsored ADR | | 100 | | 8,050 |
| Harris Interactive, Inc. (a) | | 1,749,767 | | 7,541,496 |
| Insignia Systems, Inc. (a) | | 100 | | 72 |
| JC Decaux SA (a) | | 100 | | 2,332 |
| Modern Times Group AB (MTG) (B Shares) (a) | | 100 | | 4,173 |
| News Corp. Class A | | 204 | | 3,172 |
| Omnicom Group, Inc. | | 714,800 | | 60,850,924 |
| Salem Communications Corp. Class A (a) | | 187,132 | | 3,272,939 |
| Scholastic Corp. (a) | | 100 | | 2,851 |
| Sogecable SA (a) | | 100 | | 4,009 |
| Trader Classified Media NV: | | | | |
| (A Shares) | | 100 | | 1,532 |
| Class A (NY Shares) | | 76,800 | | 1,178,880 |
| Univision Communications, Inc. | | | | |
| Class A (a) | | 570,100 | | 16,755,239 |
| Zee Telefilms Ltd. | | 88 | | 307 |
| | | | | 128,433,455 |
| Multiline Retail – 0.4% | | | | |
| Dollar General Corp. | | 100 | | 1,907 |
| Don Quijote Co. Ltd. | | 100 | | 8,363 |
| Hudson’s Bay Co. | | 200 | | 2,550 |
| JCPenney Co., Inc. | | 100 | | 5,560 |
| Kohl’s Corp. (a) | | 100 | | 4,860 |
| Lifestyle International Holdings Ltd. | | 1,980,500 | | 2,758,623 |
| Lojas Renner SA | | 252,200 | | 8,089,210 |
| Pantaloon Retail India Ltd. | | 70,800 | | 2,669,693 |
| Pantaloon Retail India Ltd. rights 2/22/06 | | 14,160 | | 376,588 |
| Parkson Retail Group Ltd. | | 500 | | 903 |
| PT Mitra Adiperkasa Tbk | | 2,633,000 | | 235,710 |
| Ryohin Keikaku Co. Ltd. | | 92,300 | | 8,055,359 |
| | | | | 22,209,326 |
| Specialty Retail 3.6% | | | | |
| Abercrombie & Fitch Co. Class A | | 70,800 | | 4,614,744 |
See accompanying notes which are an integral part of the financial statements.
|
9
| VIP Mid Cap Portfolio | | | | |
| Investments - continued | | | | |
| |
| |
| |
| | | Shares | | Value (Note 1) |
| A.C. Moore Arts & Crafts, Inc. (a) | | 205,094 | | $ 2,984,118 |
| Advance Auto Parts, Inc. (a) | | 126,300 | | 5,488,998 |
| Best Buy Co., Inc. | | 216,200 | | 9,400,376 |
| Blacks Leisure Group PLC | | 100 | | 853 |
| Build A Bear Workshop, Inc. (a)(d) | | 823,000 | | 24,393,720 |
| CarMax, Inc. (a) | | 486,300 | | 13,460,784 |
| Charming Shoppes, Inc. (a) | | 100 | | 1,320 |
| Chico’s FAS, Inc. (a) | | 200 | | 8,786 |
| Chow Sang Sang Holdings International Ltd. | | 2,000 | | 761 |
| Circuit City Stores, Inc. | | 1,237,300 | | 27,950,607 |
| Cost Plus, Inc. (a) | | 842,500 | | 14,448,875 |
| DSG International PLC | | 5,601,500 | | 15,790,842 |
| DSG International PLC sponsored ADR | | 100 | | 865 |
| DSW, Inc. Class A | | 100 | | 2,622 |
| Edgars Consolidated Stores Ltd. | | 2,039,700 | | 11,333,995 |
| Ellerine Holdings Ltd. | | 100 | | 980 |
| Esprit Holdings Ltd. | | 500 | | 3,553 |
| Fantastic Holdings Ltd. | | 110 | | 238 |
| Gamestop Corp. Class B (a) | | 564,100 | | 16,302,490 |
| GOME Electrical Appliances Holdings Ltd. | | 100 | | 68 |
| Guess?, Inc. (a) | | 89,200 | | 3,175,520 |
| JB Hi Fi Ltd. | | 100 | | 296 |
| JD Group Ltd. | | 100 | | 1,211 |
| KOMERI Co. Ltd. (d) | | 687,500 | | 29,562,997 |
| Lithia Motors, Inc. Class A (sub. vtg.) | | 100 | | 3,144 |
| Michaels Stores, Inc. | | 200 | | 7,074 |
| Nitori Co. Ltd. | | 232,300 | | 21,672,534 |
| O’Reilly Automotive, Inc. (a) | | 200 | | 6,402 |
| Pacific Sunwear of California, Inc. (a) | | 372,400 | | 9,280,208 |
| RONA, Inc. (a) | | 100 | | 1,845 |
| Ross Stores, Inc. | | 100 | | 2,890 |
| Sa Sa International Holdings Ltd. | | 2,000 | | 696 |
| Select Comfort Corp. (a) | | 100 | | 2,735 |
| Shimamura Co. Ltd. | | 100 | | 13,842 |
| Shopper’s Stop Ltd. | | 100 | | 969 |
| Tiffany & Co., Inc. | | 57,100 | | 2,186,359 |
| Truworths International Ltd. | | 100 | | 379 |
| United Auto Group, Inc. | | 100 | | 3,820 |
| Williams Sonoma, Inc. (a) | | 100 | | 4,315 |
| Yamada Denki Co. Ltd. | | 100 | | 12,519 |
| | | | | 212,129,350 |
| Textiles, Apparel & Luxury Goods 0.5% | | | | |
| Billabong International Ltd. | | 100 | | 1,065 |
| Cherokee, Inc. | | 100 | | 3,439 |
| Columbia Sportswear Co. (a)(d) | | 73,290 | | 3,498,132 |
| Compagnie Financiere Richemont unit | | 100 | | 4,353 |
| Folli Follie SA | | 80 | | 2,131 |
| Gildan Activewear, Inc. Class A (a) | | 200 | | 8,602 |
| K Swiss, Inc. Class A | | 200 | | 6,488 |
| Luxottica Group Spa sponsored ADR | | 100 | | 2,531 |
| NIKE, Inc. Class B | | 100 | | 8,679 |
| Polo Ralph Lauren Corp. Class A | | 100 | | 5,614 |
See accompanying notes which are an integral part of the financial statements.
| | |
| VIP Mid Cap Portfolio | | 10 |
| Common Stocks continued | | | | |
| | | Shares | | Value (Note 1) |
| |
| CONSUMER DISCRETIONARY – continued | | | | |
| Textiles, Apparel & Luxury Goods – continued | | | | |
| Ports Design Ltd. | | 2,687,500 | | $ 3,119,499 |
| Quiksilver, Inc. (a) | | 257,168 | | 3,559,205 |
| Ted Baker PLC | | 1,176,408 | | 10,440,139 |
| The Swatch Group AG (Bearer) | | 100 | | 14,840 |
| Tod’s Spa | | 53,800 | | 3,631,031 |
| Wacoal Holdings Corp. sponsored ADR | | 59,600 | | 4,035,516 |
| Weyco Group, Inc. | | 200 | | 3,820 |
| Wolverine World Wide, Inc. | | 150 | | 3,369 |
| | | | | 28,348,453 |
| |
| TOTAL CONSUMER DISCRETIONARY | | | | 618,287,231 |
| |
| CONSUMER STAPLES 5.0% | | | | |
| Beverages 0.1% | | | | |
| Boston Beer Co., Inc. Class A (a) | | 100 | | 2,500 |
| Brick Brewing Co. Ltd. (a) | | 100 | | 191 |
| C&C Group PLC | | 43,900 | | 280,643 |
| Companhia de Bebidas das Americas (AmBev): | | | | |
| (PN) sponsored ADR | | 100 | | 3,805 |
| sponsored ADR | | 20 | | 654 |
| Constellation Brands, Inc. Class A (sub. vtg.) (a) | | 100 | | 2,623 |
| Fomento Economico Mexicano SA de CV sponsored ADR | | 37,700 | | 2,733,627 |
| Grupo Modelo SA de CV Series C | | 241,800 | | 875,551 |
| Hansen Natural Corp. (a) | | 41,500 | | 3,270,615 |
| Jones Soda Co. (a) | | 198,359 | | 1,071,139 |
| MGP Ingredients, Inc. | | 200 | | 2,360 |
| Pernod Ricard SA | | 100 | | 17,450 |
| Tsingtao Brewery Co. Ltd. (H Shares) | | 3,000 | | 3,173 |
| Yantai Changyu Pioneer Wine Co. | | | | |
| (B Shares) | | 100 | | 171 |
| | | | | 8,264,502 |
| Food & Staples Retailing – 0.9% | | | | |
| Alimentation Couche Tard, Inc. Class B (sub. vtg.) | | 100 | | 2,013 |
| Central European Distribution Corp. (a) | | 150 | | 6,021 |
| Daikokutenbussan Co. Ltd. | | 37,200 | | 2,012,943 |
| Heng Tai Consumables Group Ltd. | | 15,898,000 | | 2,275,932 |
| Lianhua Supermarket Holdings Co. | | | | |
| (H Shares) (a) | | 1,000 | | 935 |
| Massmart Holdings Ltd. | | 1,111,569 | | 9,073,495 |
| Metro AG | | 84,100 | | 4,062,121 |
| Plant Co. Ltd. | | 127,000 | | 1,109,453 |
| Pyaterochka Holding NV GDR (a) | | 100 | | 1,445 |
| Shinsegae Co. Ltd. | | 3,490 | | 1,534,561 |
| Sugi Pharmacy Co. Ltd. (d) | | 502,600 | | 23,999,306 |
| Tesco PLC | | 101 | | 576 |
| Valor Co. Ltd. | | 47,500 | | 1,845,130 |
See accompanying notes which are an integral part of the financial statements.
|
11 Annual Report
11
| VIP Mid Cap Portfolio | | | | |
| Investments - continued | | | | |
| |
| |
| |
| | | Shares | | Value (Note 1) |
| Wal Mart de Mexico SA de CV sponsored ADR | | 101 | | $ 5,641 |
| Whole Foods Market, Inc. | | 57,200 | | 4,426,708 |
| | | | | 50,356,280 |
| Food Products – 2.8% | | | | |
| Archer Daniels Midland Co. | | 267,600 | | 6,599,016 |
| Barry Callebaut AG | | 85 | | 27,719 |
| Britannia Industries Ltd. | | 60,541 | | 1,830,223 |
| Chaoda Modern Agriculture (Holdings) Ltd. | | 1,151,700 | | 479,030 |
| China Mengniu Dairy Co. Ltd. | | 3,305,000 | | 2,813,256 |
| COFCO International Ltd. | | 2,000 | | 890 |
| Green Mountain Coffee Roasters, Inc. (a) | | 81,568 | | 3,311,661 |
| Groupe Danone | | 378,800 | | 39,575,040 |
| Groupe Danone sponsored ADR | | 427,300 | | 8,990,392 |
| Heritage Foods (INDIA) Ltd. | | 100 | | 357 |
| Hershey Co. | | 755,800 | | 41,757,950 |
| Hokuto Corp. | | 100 | | 1,587 |
| Hormel Foods Corp. | | 100 | | 3,268 |
| IAWS Group PLC (Ireland) | | 25,450 | | 366,067 |
| Lindt & Spruengli AG | | 1,200 | | 20,045,662 |
| Lindt & Spruengli AG (participation certificate) | | 2,767 | | 4,710,639 |
| McCormick & Co., Inc. (non vtg.) | | 270,700 | | 8,370,044 |
| Peet’s Coffee & Tea, Inc. (a) | | 100 | | 3,035 |
| Poore Brothers, Inc. (a) | | 27 | | 76 |
| PT Indofood Sukses Makmur Tbk | | 58,698,500 | | 5,433,919 |
| Rocky Mountain Chocolate Factory, Inc. | | 100 | | 1,628 |
| Tingyi (Cayman Island) Holding Corp. | | 1,238,000 | | 610,725 |
| Want Want Holdings Ltd. | | 1,645,000 | | 1,636,775 |
| Wimm Bill Dann Foods OJSC sponsored ADR (a) | | 76,800 | | 1,845,504 |
| Wm. Wrigley Jr. Co. | | 240,500 | | 15,990,845 |
| | | | | 164,405,308 |
| Household Products – 0.0% | | | | |
| Hindustan Lever Ltd. | | 104,300 | | 457,117 |
| Kao Corp. | | 1,000 | | 26,801 |
| Reckitt Benckiser PLC | | 300 | | 9,916 |
| | | | | 493,834 |
| Personal Products 1.2% | | | | |
| AmorePacific Corp. | | 100 | | 31,365 |
| Avon Products, Inc. | | 524,279 | | 14,968,165 |
| Body Shop International PLC | | 100 | | 453 |
| Concern Kalina OJSC: | | | | |
| GDR (a)(f) | | 43,243 | | 1,712,183 |
| sponsored ADR | | 43,600 | | 1,726,318 |
| Dabur India Ltd. | | 865,295 | | 4,055,800 |
| Elizabeth Arden, Inc. (a) | | 100 | | 2,006 |
| Godrej Consumer Products Ltd. | | 216,376 | | 2,532,361 |
| Hengan International Group Co. Ltd. | | 33,796,200 | | 38,356,975 |
| Kose Corp. | | 100 | | 4,003 |
| Marico Ltd. | | 100 | | 818 |
See accompanying notes which are an integral part of the financial statements.
| | |
| VIP Mid Cap Portfolio | | 12 |
| Common Stocks continued | | | | | | | | |
| | | | | Shares | | Value (Note 1) |
| |
| CONSUMER STAPLES – continued | | | | | | | | |
| Personal Products – continued | | | | | | | | |
| Natura Cosmeticos SA | | | | 100 | | $ | | 4,426 |
| Shiseido Co. Ltd. sponsored ADR | | | | 321,700 | | | | 5,967,535 |
| | | | | | | | | 69,362,408 |
| Tobacco – 0.0% | | | | | | | | |
| ITC Ltd. | | | | 1,500 | | | | 4,737 |
| |
| TOTAL CONSUMER STAPLES | | | | | | 292,887,069 |
| |
| ENERGY 16.5% | | | | | | | | |
| Energy Equipment & Services 12.0% | | | | | | | | |
| BJ Services Co. | | | | 96,620 | | | | 3,543,055 |
| Cal Dive International, Inc. (a) | | | | 1,041,000 | | | | 37,361,490 |
| Carbo Ceramics, Inc. | | | | 150 | | | | 8,478 |
| Compagnie Generale de Geophysique SA (a) | | | | 100 | | | | 8,849 |
| Cooper Cameron Corp. (a) | | | | 788,400 | | | | 32,639,760 |
| Core Laboratories NV (a) | | | | 934,100 | | | | 34,897,976 |
| Dril Quip, Inc. (a) | | | | 67,800 | | | | 3,200,160 |
| FMC Technologies, Inc. (a) | | | | 580,900 | | | | 24,932,228 |
| Global Industries Ltd. (a) | | | | 922,189 | | | | 10,466,845 |
| GlobalSantaFe Corp. | | | | 728,150 | | | | 35,060,423 |
| Grant Prideco, Inc. (a) | | | | 78,700 | | | | 3,472,244 |
| Gulf Island Fabrication, Inc. | | | | 416,600 | | | | 10,127,546 |
| Helmerich & Payne, Inc. | | | | 226,000 | | | | 13,991,660 |
| Hydril Co. (a) | | | | 100 | | | | 6,260 |
| Input/Output, Inc. (a)(d) | | | | 763,000 | | | | 5,363,890 |
| Nabors Industries Ltd. (a) | | | | 1,020,600 | | | | 77,310,450 |
| National Oilwell Varco, Inc. (a) | | | | 768,362 | | | | 48,176,297 |
| Newpark Resources, Inc. (a) | | | | 818,500 | | | | 6,245,155 |
| Noble Corp. | | | | 827,500 | | | | 58,371,850 |
| NS Group, Inc. (a) | | | | 100 | | | | 4,181 |
| Oceaneering International, Inc. (a) | | | | 388,286 | | | | 19,328,877 |
| Parker Drilling Co. (a)(e) | | | | 5,481,500 | | | | 59,364,645 |
| Pason Systems, Inc. | | | | 1,512,600 | | | | 37,601,944 |
| Patterson UTI Energy, Inc. | | | | 298,700 | | | | 9,842,165 |
| Pioneer Drilling Co. (a) | | | | 198,444 | | | | 3,558,101 |
| Precision Drilling Trust | | | | 442,800 | | | | 14,618,437 |
| Pride International, Inc. (a) | | | | 716,700 | | | | 22,038,525 |
| Rowan Companies, Inc. | | | | 757,300 | | | | 26,990,172 |
| SEACOR Holdings, Inc. (a) | | | | 100 | | | | 6,810 |
| Smith International, Inc. | | | | 598,580 | | | | 22,213,304 |
| Superior Energy Services, Inc. (a) | | | | 634,600 | | | | 13,358,330 |
| Transocean, Inc. (a) | | | | 504,000 | | | | 35,123,760 |
| Unit Corp. (a) | | | | 100 | | | | 5,503 |
| Veritas DGC, Inc. (a) | | | | 100 | | | | 3,549 |
| W H Energy Services, Inc. (a) | | | | 551,900 | | | | 18,256,852 |
| Weatherford International Ltd. (a) | | | | 464,400 | | | | 16,811,280 |
| | | | | | | 704,311,051 |
| Oil, Gas & Consumable Fuels 4.5% | | | | | | | | |
| Amerada Hess Corp. | | | | 52,300 | | | | 6,632,686 |
| Arch Coal, Inc. | | | | 189,100 | | | | 15,033,450 |
| |
See accompanying notes which are an integral part of the financial statements.
| | | | | | | | |
| | | 13 | | | | Annual Report |
13
| VIP Mid Cap Portfolio | | | | |
| Investments - continued | | | | |
| |
| |
| |
| | | Shares | | Value (Note 1) |
| Cameco Corp. | | 61,700 | | $ 3,916,256 |
| Canadian Natural Resources Ltd. | | 378,200 | | 18,748,154 |
| Chesapeake Energy Corp. | | 205,700 | | 6,526,861 |
| China Petroleum & Chemical Corp. sponsored ADR | | 100 | | 4,960 |
| CONSOL Energy, Inc. | | 1,150,900 | | 75,015,662 |
| Forest Oil Corp. (a) | | 499,300 | | 22,753,101 |
| Golar LNG Ltd. (Nasdaq) (a) | | 21,393 | | 283,457 |
| Goodrich Petroleum Corp. (a) | | 295,300 | | 7,426,795 |
| International Coal Group, Inc. (a) | | 604,800 | | 5,745,600 |
| JKX Oil & Gas | | 91 | | 388 |
| Newfield Exploration Co. (a) | | 286,400 | | 14,340,048 |
| Niko Resources Ltd. | | 100 | | 4,750 |
| Oil Search Ltd. | | 1,048,800 | | 2,838,891 |
| OMV AG | | 100 | | 5,860 |
| OPTI Canada, Inc. (a) | | 100 | | 3,283 |
| Peabody Energy Corp. | | 167,700 | | 13,821,834 |
| PetroChina Co. Ltd. sponsored ADR | | 100 | | 8,196 |
| Petroleo Brasileiro SA Petrobras: | | | | |
| (PN) sponsored ADR (non vtg.) | | 100 | | 6,437 |
| sponsored ADR | | 100 | | 7,127 |
| Ship Finance International Ltd. | | | | |
| (NY Shares) | | 446,700 | | 7,549,230 |
| Southwestern Energy Co. (a) | | 408,800 | | 14,692,272 |
| Surgutneftegaz JSC sponsored ADR | | 100 | | 5,347 |
| Talisman Energy, Inc. | | 100 | | 5,299 |
| Tesoro Corp. | | 170,100 | | 10,469,655 |
| TransCanada Corp. (d) | | 646,300 | | 20,374,947 |
| TransMontaigne, Inc. (a) | | 500 | | 3,300 |
| Valero Energy Corp. | | 250,722 | | 12,937,255 |
| Whiting Petroleum Corp. (a) | | 1,600 | | 64,000 |
| World Fuel Services Corp. | | 46,600 | | 1,571,352 |
| XTO Energy, Inc. | | 166 | | 7,294 |
| | | | | 260,803,747 |
| |
| TOTAL ENERGY | | | | 965,114,798 |
| |
| FINANCIALS – 9.1% | | | | |
| Capital Markets 0.3% | | | | |
| Ameriprise Financial, Inc. | | 20 | | 820 |
| Ameritrade Holding Corp. | | 100 | | 2,400 |
| BlackRock, Inc. Class A | | 100 | | 10,848 |
| Deutsche Bank AG (NY Shares) | | 100 | | 9,687 |
| Eaton Vance Corp. (non vtg.) | | 200 | | 5,472 |
| Indiabulls Financial Services Ltd. | | 300 | | 1,268 |
| International Assets Holding Corp. (a) | | 100 | | 910 |
| Korea Investment Holdings Co. Ltd. | | 383,270 | | 16,357,928 |
| Legg Mason, Inc. | | 100 | | 11,969 |
| Matsui Securities Co. Ltd. | | 100 | | 1,388 |
| Nuveen Investments, Inc. Class A | | 100 | | 4,262 |
| optionsXpress Holdings, Inc. | | 100 | | 2,455 |
| T. Rowe Price Group, Inc. | | 200 | | 14,406 |
| TradeStation Group, Inc. (a) | | 10,100 | | 125,038 |
| | | | | 16,548,851 |
See accompanying notes which are an integral part of the financial statements.
| | |
| VIP Mid Cap Portfolio | | 14 |
| Common Stocks continued | | | | |
| | | Shares | | Value (Note 1) |
| |
| FINANCIALS – continued | | | | |
| Commercial Banks – 2.8% | | | | |
| Allahabad Bank | | 71,000 | | $ 131,207 |
| Banco Itau Holding Financeira SA: | | | | |
| (PN) | | 9,000 | | 214,810 |
| sponsored ADR (non vtg.) | | 235,500 | | 5,656,710 |
| Banco Pastor SA (Reg.) | | 478,600 | | 22,963,917 |
| Bank of Baroda | | 1,460,904 | | 7,831,640 |
| Bank of Fukuoka Ltd. | | 3,538,600 | | 30,282,410 |
| Bank of India | | 2,962,900 | | 8,356,307 |
| Boston Private Financial Holdings, Inc. | | 386,867 | | 11,768,494 |
| Canara Bank | | 660,149 | | 3,539,526 |
| Capitalia Spa | | 79 | | 457 |
| Cathay General Bancorp | | 20 | | 719 |
| Center Financial Corp., California | | 103,900 | | 2,614,124 |
| Colonial Bancgroup, Inc. | | 234,100 | | 5,576,262 |
| Commerce Bancorp, Inc., New Jersey | | 200 | | 6,882 |
| Corp. Bank | | 479,299 | | 3,867,840 |
| CVB Financial Corp. | | 137 | | 2,782 |
| DnB NOR ASA | | 100 | | 1,067 |
| Erste Bank der Oesterreichischen Sparkassen AG | | 100 | | 5,570 |
| Fulton Financial Corp. | | 13 | | 229 |
| HDFC Bank Ltd. sponsored ADR | | 84,900 | | 4,321,410 |
| Hiroshima Bank Ltd. | | 1,563,900 | | 10,107,221 |
| Hokuhoku Financial Group, Inc. | | 100 | | 467 |
| ICICI Bank Ltd. sponsored ADR | | 62,100 | | 1,788,480 |
| Industrial & Commercial Bank of China (Asia) Ltd. | | 1,000 | | 1,225 |
| Juroku Bank Ltd. | | 1,155,400 | | 8,711,680 |
| Lakeland Financial Corp. | | 100 | | 4,038 |
| M&T Bank Corp. | | 100 | | 10,905 |
| Oriental Bank of Commerce | | 89,627 | | 559,653 |
| OTP Bank Rt. | | 100 | | 3,265 |
| PrivateBancorp, Inc. | | 66,700 | | 2,372,519 |
| PT Bank Central Asia Tbk | | 500 | | 173 |
| Punjab National Bank | | 99,500 | | 1,092,919 |
| Sberbank RF GDR (a) | | 200 | | 26,213 |
| State Bancorp, Inc., New York | | 6 | | 100 |
| State Bank of India | | 689,845 | | 15,134,735 |
| Sumitomo Trust & Banking Co. Ltd. | | 811,000 | | 8,288,495 |
| TCF Financial Corp. | | 200 | | 5,428 |
| Texas Regional Bancshares, Inc. Class A | | 150 | | 4,245 |
| The Keiyo Bank Ltd. | | 806,400 | | 5,751,940 |
| UCBH Holdings, Inc. | | 100 | | 1,788 |
| Uti Bank Ltd. | | 673,100 | | 4,292,611 |
| Westcorp | | 100 | | 6,661 |
| Wintrust Financial Corp. | | 100 | | 5,490 |
| | | | | 165,312,614 |
| Consumer Finance – 0.0% | | | | |
| Advanta Corp. Class B | | 100 | | 3,244 |
See accompanying notes which are an integral part of the financial statements.
|
15 Annual Report
15
| VIP Mid Cap Portfolio | | | | |
| Investments - continued | | | | |
| |
| |
| |
| | | Shares | | Value (Note 1) |
| American Express Co. | | 100 | | $ 5,146 |
| First Cash Financial Services, Inc. (a) | | 150 | | 4,374 |
| | | | | 12,764 |
| Diversified Financial Services – 0.8% | | | | |
| Alliance Capital Management Holding LP | | 236,400 | | 13,354,236 |
| Infrastructure Development Finance Co. Ltd. | | 100 | | 163 |
| IntercontinentalExchange, Inc. | | 176,100 | | 6,401,235 |
| Kotak Mahindra Bank Ltd. | | 1,473,664 | | 7,316,734 |
| Moody’s Corp. | | 156,853 | | 9,633,911 |
| Power Financial Corp. | | 100 | | 2,873 |
| Principal Financial Group, Inc. | | 100 | | 4,743 |
| TSX Group, Inc. | | 203,300 | | 8,189,359 |
| | | | | 44,903,254 |
| Insurance – 3.4% | | | | |
| ACE Ltd. | | 100 | | 5,344 |
| Admiral Group PLC | | 367,500 | | 2,878,647 |
| AFLAC, Inc. | | 783,600 | | 36,374,712 |
| American International Group, Inc. | | 254,700 | | 17,378,181 |
| Assurant, Inc. | | 1,841,000 | | 80,065,090 |
| Baloise Holdings AG (Reg.) | | 100 | | 5,841 |
| Brown & Brown, Inc. | | 209,800 | | 6,407,292 |
| Erie Indemnity Co. Class A | | 100 | | 5,320 |
| Everest Re Group Ltd. | | 156,000 | | 15,654,600 |
| Genworth Financial, Inc. Class A (non vtg.) | | 100 | | 3,458 |
| Hilb Rogal & Hobbs Co. | | 200 | | 7,702 |
| Mercury General Corp. | | 100 | | 5,822 |
| Ohio Casualty Corp. | | 122,800 | | 3,477,696 |
| Ping An Insurance (Group) Co. of China, Ltd. (H Shares) | | 5,779,500 | | 10,659,090 |
| Progressive Corp. | | 90,200 | | 10,533,556 |
| Reinsurance Group of America, Inc. | | 100 | | 4,776 |
| UNIPOL Assicurazioni Spa | | 100 | | 281 |
| Universal American Financial Corp. (a) | | 577,116 | | 8,702,909 |
| UnumProvident Corp. | | 100 | | 2,275 |
| USI Holdings Corp. (a) | | 168,300 | | 2,317,491 |
| W.R. Berkley Corp. | | 113,513 | | 5,405,465 |
| Zenith National Insurance Corp. | | 450 | | 20,754 |
| | | | | 199,916,302 |
| Real Estate 1.6% | | | | |
| Aeon Mall Co. Ltd. | | 335,000 | | 16,337,306 |
| British Land Co. PLC | | 100 | | 1,835 |
| Corporate Office Properties Trust (SBI) | | 100 | | 3,554 |
| Diamond City Co. Ltd. | | 417,400 | | 17,063,467 |
| Digital Realty Trust, Inc. | | 900,800 | | 20,385,104 |
| Equity Office Properties Trust | | 210,400 | | 6,381,432 |
| Equity Residential (SBI) | | 558,700 | | 21,856,344 |
| General Growth Properties, Inc. | | 172,400 | | 8,101,076 |
| Land Securities Group PLC | | 100 | | 2,863 |
| Mitsui Fudosan Co. Ltd. | | 31,000 | | 629,702 |
| Plum Creek Timber Co., Inc. | | 100 | | 3,605 |
| Shun Tak Holdings Ltd. | | 530,200 | | 488,922 |
See accompanying notes which are an integral part of the financial statements.
| | |
| VIP Mid Cap Portfolio | | 16 |
| Common Stocks continued | | | | | | | | |
| | | | | Shares | | Value (Note 1) |
| |
| FINANCIALS – continued | | | | | | | | |
| Real Estate continued | | | | | | | | |
| W.P. Carey & Co. LLC | | | | 8,000 | | $ | | 202,880 |
| Weingarten Realty Investors (SBI) | | | | 161,300 | | | | 6,098,753 |
| | | | | | | | | 97,556,843 |
| Thrifts & Mortgage Finance – 0.2% | | | | | | | | |
| Doral Financial Corp. | | | | 100 | | | | 1,060 |
| Housing Development Finance Corp. Ltd. | | | | 163,904 | | | | 4,396,758 |
| MGIC Investment Corp. | | | | 100 | | | | 6,582 |
| NetBank, Inc. | | | | 943,664 | | | | 6,775,508 |
| Radian Group, Inc. | | | | 100 | | | | 5,859 |
| | | | | | | | | 11,185,767 |
| |
| TOTAL FINANCIALS | | | | | | 535,436,395 |
| |
| HEALTH CARE 17.2% | | | | | | | | |
| Biotechnology – 2.4% | | | | | | | | |
| Albany Molecular Research, Inc. (a) | | | | 620,902 | | | | 7,543,959 |
| Alexion Pharmaceuticals, Inc. (a) | | | | 100 | | | | 2,025 |
| Alnylam Pharmaceuticals, Inc. (a) | | | | 100 | | | | 1,336 |
| Applera Corp. – Celera Genomics Group (a) | | | | 100 | | | | 1,096 |
| Bachem Holding AG (B Shares) | | | | 100 | | | | 5,746 |
| BioCryst Pharmaceuticals, Inc. (a) | | | | 100 | | | | 1,675 |
| Celgene Corp. (a) | | | | 200 | | | | 12,960 |
| Ciphergen Biosystems, Inc. (a) | | | | 100 | | | | 118 |
| CSL Ltd. | | | | 83 | | | | 2,588 |
| CuraGen Corp. (a) | | | | 100 | | | | 308 |
| CytRx Corp. (a) | | | | 100 | | | | 103 |
| deCODE genetics, Inc. (a) | | | | 100 | | | | 826 |
| Dendreon Corp. (a) | | | | 100 | | | | 542 |
| Digene Corp. (a) | | | | 100 | | | | 2,917 |
| Genentech, Inc. (a) | | | | 25,500 | | | | 2,358,750 |
| Harvard Bioscience, Inc. (a)(e) | | | | 2,496,047 | | | | 11,107,409 |
| Illumina, Inc. (a) | | | | 100 | | | | 1,410 |
| ImmunoGen, Inc. (a) | | | | 139,700 | | | | 716,661 |
| Invitrogen Corp. (a) | | | | 273,630 | | | | 18,234,703 |
| Lexicon Genetics, Inc. (a) | | | | 100 | | | | 365 |
| Luminex Corp. (a) | | | | 100 | | | | 1,162 |
| Martek Biosciences (a) | | | | 98 | | | | 2,412 |
| MedImmune, Inc. (a) | | | | 100 | | | | 3,502 |
| Myriad Genetics, Inc. (a) | | | | 87,000 | | | | 1,809,600 |
| Nektar Therapeutics (a) | | | | 100 | | | | 1,646 |
| Orchid Cellmark, Inc. (a) | | | | 100 | | | | 760 |
| Orthologic Corp. (a) | | | | 100,600 | | | | 492,940 |
| OSI Pharmaceuticals, Inc. (a) | | | | 135,700 | | | | 3,805,028 |
| Pro Pharmaceuticals, Inc. (a) | | | | 100 | | | | 305 |
| QIAGEN NV (a) | | | | 5,693,500 | | | | 66,898,625 |
| Renovis, Inc. (a) | | | | 100 | | | | 1,530 |
| Sangamo Biosciences, Inc. (a) | | | | 100 | | | | 403 |
| Seattle Genetics, Inc. (a) | | | | 3,600 | | | | 16,992 |
| Serologicals Corp. (a) | | | | 100 | | | | 1,974 |
| Sirna Therapeutics, Inc. (a) | | | | 100 | | | | 303 |
| |
See accompanying notes which are an integral part of the financial statements.
| | | | | | | | |
| | | 17 | | | | Annual Report |
| VIP Mid Cap Portfolio | | | | | | |
| Investments - continued | | | | | | |
| |
| |
| |
| | | | | Shares | | Value (Note 1) |
| Stratagene Corp. (e) | | | | 1,441,447 | | $ 14,472,128 |
| Tanox, Inc. (a) | | | | 100 | | 1,637 |
| Telik, Inc. (a) | | | | 100 | | 1,699 |
| ViroPharma, Inc. (a) | | | | 569,600 | | 10,566,080 |
| | | | | | | 138,074,223 |
| Health Care Equipment & Supplies 4.2% | | | | |
| ArthroCare Corp. (a) | | | | 95,000 | | 4,003,300 |
| Beckman Coulter, Inc. | | | | 316,900 | | 18,031,610 |
| Bio Rad Laboratories, Inc. Class A (a) | | | | 100 | | 6,544 |
| BioLase Technology, Inc. (a) | | | | 100 | | 799 |
| bioMerieux SA | | | | 100 | | 5,276 |
| Biophan Technologies, Inc. (a) | | | | 100 | | 152 |
| Bruker BioSciences Corp. (a) | | | | 24,463 | | 118,890 |
| Clarient, Inc. (a) | | | | 100 | | 130 |
| Cyberonics, Inc. (a) | | | | 200 | | 6,460 |
| Cytyc Corp. (a) | | | | 100 | | 2,823 |
| DENTSPLY International, Inc. | | | | 172,400 | | 9,256,156 |
| Dionex Corp. (a) | | | | 100 | | 4,908 |
| Edwards Lifesciences Corp. (a) | | | | 100 | | 4,161 |
| Endocare, Inc. (a) | | | | 144,600 | | 396,204 |
| Epix Pharmaceuticals, Inc. (a) | | | | 178,600 | | 721,544 |
| Fisher Scientific International, Inc. (a) | | | | 100 | | 6,186 |
| Gen Probe, Inc. (a) | | | | 100 | | 4,879 |
| Greatbatch, Inc. (a) | | | | 800 | | 20,808 |
| Haemonetics Corp. (a) | | | | 996,325 | | 48,680,440 |
| Hospira, Inc. (a) | | | | 100 | | 4,278 |
| IDEXX Laboratories, Inc. (a) | | | | 42,500 | | 3,059,150 |
| INAMED Corp. (a) | | | | 70,450 | | 6,177,056 |
| IntraLase Corp. (a) | | | | 100 | | 1,783 |
| Intuitive Surgical, Inc. (a) | | | | 100 | | 11,727 |
| Kinetic Concepts, Inc. (a) | | | | 200 | | 7,952 |
| Millipore Corp. (a) | | | | 744,700 | | 49,179,988 |
| Neogen Corp. (a) | | | | 109,363 | | 2,297,722 |
| Osteotech, Inc. (a) | | | | 100 | | 497 |
| PolyMedica Corp. | | | | 82 | | 2,745 |
| Possis Medical, Inc. (a) | | | | 100 | | 995 |
| SonoSite, Inc. (a) | | | | 100 | | 3,501 |
| Stereotaxis, Inc. (a) | | | | 100 | | 861 |
| Strategic Diagnostics, Inc. (a)(e) | | | | 1,481,500 | | 5,392,660 |
| Synthes, Inc. | | | | 81 | | 9,099 |
| Thermo Electron Corp. (a) | | | | 2,554,200 | | 76,958,046 |
| Thoratec Corp. (a) | | | | 100 | | 2,069 |
| Varian Medical Systems, Inc. (a) | | | | 100 | | 5,034 |
| Ventana Medical Systems, Inc. (a) | | | | 115,600 | | 4,895,660 |
| Waters Corp. (a) | | | | 392,420 | | 14,833,476 |
| Young Innovations, Inc. | | | | 100 | | 3,408 |
| Zimmer Holdings, Inc. (a) | | | | 100 | | 6,744 |
| Zoll Medical Corp. (a) | | | | 100 | | 2,519 |
| | | | | | | 244,128,240 |
| Health Care Providers & Services 8.4% | | | | |
| Aetna, Inc. | | | | 428,100 | | 40,374,111 |
| American Dental Partners, Inc. (a) | | | | 50 | | 904 |
| American Retirement Corp. (a) | | | | 511,100 | | 12,843,943 |
See accompanying notes which are an integral part of the financial statements.
| | |
| VIP Mid Cap Portfolio | | 18 |
| Common Stocks continued | | | | | | | | |
| | | | | Shares | | Value (Note 1) |
| |
| HEALTH CARE continued | | | | | | | | |
| Health Care Providers & Services continued | | | | | | | | |
| Apollo Hospitals Enterprise Ltd. | | | | 57,000 | | $ | | 631,567 |
| Apollo Hospitals Enterprise Ltd. GDR (a)(f) | | | | 126,100 | | | | 1,395,188 |
| Bio Imaging Technologies, Inc. (a) | | | | 100 | | | | 320 |
| Caremark Rx, Inc. (a) | | | | 1,103,106 | | | | 57,129,860 |
| Cerner Corp. (a) | | | | 54,917 | | | | 4,992,504 |
| Community Health Systems, Inc. (a) | | | | 557,100 | | | | 21,359,214 |
| Covance, Inc. (a) | | | | 1,343,100 | | | | 65,207,505 |
| Coventry Health Care, Inc. (a) | | | | 75 | | | | 4,272 |
| Diagnosticos da America SA (a) | | | | 141,400 | | | | 2,660,736 |
| Dynacq Healthcare, Inc. (a)(d) | | | | 100 | | | | 243 |
| Eclipsys Corp. (a)(e) | | | | 2,486,200 | | | | 47,063,766 |
| Emageon, Inc. | | | | 489,800 | | | | 7,787,820 |
| Evotec OAI AG (a) | | | | 100 | | | | 296 |
| Gambro AB (A Shares) | | | | 100 | | | | 1,092 |
| Health Grades, Inc. (a) | | | | 328,311 | | | | 2,058,510 |
| Health Net, Inc. (a) | | | | 100 | | | | 5,155 |
| Humana, Inc. (a) | | | | 1,284,200 | | | | 69,770,586 |
| ICON PLC sponsored ADR (a) | | | | 199,126 | | | | 8,192,044 |
| IMS Health, Inc. | | | | 2,247,400 | | | | 56,005,208 |
| iSoft Group PLC | | | | 35 | | | | 235 |
| Merge Technologies, Inc. (a) | | | | 41,800 | | | | 1,046,672 |
| National Research Corp. | | | | 100 | | | | 1,730 |
| NDCHealth Corp. (a) | | | | 100 | | | | 1,923 |
| Omnicare, Inc. | | | | 472,650 | | | | 27,045,033 |
| Per Se Technologies, Inc. (a) | | | | 100 | | | | 2,336 |
| Pharmaceutical Product Development, Inc. | | | | 2,300 | | | | 142,485 |
| Quest Diagnostics, Inc. | | | | 100 | | | | 5,148 |
| Ramsay Health Care Ltd. | | | | 100 | | | | 697 |
| Renal Care Group, Inc. (a) | | | | 50 | | | | 2,366 |
| ResCare, Inc. (a)(e) | | | | 1,627,003 | | | | 28,261,042 |
| Sunrise Senior Living, Inc. (a)(d) | | | | 766,600 | | | | 25,842,086 |
| TriZetto Group, Inc. (a) | | | | 546,900 | | | | 9,291,831 |
| VCA Antech, Inc. (a) | | | | 170,800 | | | | 4,816,560 |
| WellPoint, Inc. (a) | | | | 400 | | | | 31,916 |
| | | | | | | 493,976,904 |
| Pharmaceuticals 2.2% | | | | | | | | |
| Able Laboratories, Inc. (a) | | | | 100 | | | | 15 |
| Allergan, Inc. | | | | 164,400 | | | | 17,748,624 |
| American Pharmaceutical Partners, Inc. (a) | | | | 50 | | | | 1,940 |
| Aventis Pharma Ltd. | | | | 100 | | | | 3,695 |
| Bentley Pharmaceuticals, Inc. (a) | | | | 256,000 | | | | 4,200,960 |
| Boiron SA | | | | 55 | | | | 1,413 |
| Caraco Pharmaceutical Laboratories Ltd. (a) | | | | 100 | | | | 898 |
| Cipla Ltd. | | | | 50,500 | | | | 502,811 |
| Connetics Corp. (a) | | | | 100 | | | | 1,445 |
| Dr. Reddy’s Laboratories Ltd. sponsored ADR | | | | 85,100 | | | | 1,838,160 |
| |
| |
| | | | | Shares | | Value (Note 1) |
| Eisai Co. Ltd. sponsored ADR | | | | 100 | | $ | | 4,250 |
| GlaxoSmithkline Pharmaceuticals Ltd. | | | | 100 | | | | 2,493 |
See accompanying notes which are an integral part of the financial statements.
| | | | | | | | |
| | | 19 | | | | Annual Report |
19
| VIP Mid Cap Portfolio | | | | |
| Investments - continued | | | | |
| |
| |
| | Shares | | Value (Note 1) |
| | | | |
| | | | |
| Kos Pharmaceuticals, Inc. (a) | | 640,193 | | 33,117,184 |
| Medicis Pharmaceutical Corp. Class A | | 180,000 | | 5,769,000 |
| Merck KGaA | | 375,821 | | 31,121,853 |
| New River Pharmaceuticals, Inc. (a) | | 100 | | 5,188 |
| Pfizer Ltd. | | 100 | | 2,259 |
| Ranbaxy Laboratories Ltd. sponsored GDR | | 527,746 | | 4,216,691 |
| Roche Holding AG: | | | | |
| (participation certificate) | | 154,849 | | 23,250,919 |
| sponsored ADR | | 62,700 | | 4,708,770 |
| Schering Plough Corp. | | 100 | | 2,085 |
| Sepracor, Inc. (a) | | 100 | | 5,160 |
| SuperGen, Inc. (a) | | 100 | | 505 |
| Valeant Pharmaceuticals International | | 211,500 | | 3,823,920 |
| | | | | 130,330,238 |
| |
| TOTAL HEALTH CARE | | | | 1,006,509,605 |
| |
| INDUSTRIALS – 13.9% | | | | |
| Aerospace & Defense – 1.0% | | | | |
| CAE, Inc. | | 1,045,200 | | 7,659,975 |
| Ceradyne, Inc. (a)(d) | | 349,734 | | 15,318,349 |
| EDO Corp. | | 100 | | 2,706 |
| Embraer – Empresa Brasileira de Aeronautica SA sponsored ADR | | 100 | | 3,910 |
| Esterline Technologies Corp. (a) | | 708,691 | | 26,356,218 |
| General Dynamics Corp. | | 100 | | 11,405 |
| L 3 Communications Holdings, Inc. | | 88,300 | | 6,565,105 |
| Precision Castparts Corp. | | 200 | | 10,362 |
| Rockwell Collins, Inc. | | 100 | | 4,647 |
| | | | | 55,932,677 |
| Air Freight & Logistics – 0.2% | | | | |
| Business Post Group PLC | | 200 | | 1,153 |
| Expeditors International of Washington, Inc. | | 100 | | 6,751 |
| Forward Air Corp. | | 150 | | 5,498 |
| Hub Group, Inc. Class A (a) | | 341,067 | | 12,056,718 |
| UTI Worldwide, Inc. | | 100 | | 9,284 |
| | | | | 12,079,404 |
| Airlines – 0.2% | | | | |
| ACE Aviation Holdings, Inc. Class A (a) | | 312,800 | | 10,224,420 |
| Air China Ltd. (H Shares) (a) | | 2,000 | | 638 |
| easyJet PLC (a) | | 100 | | 651 |
| Ryanair Holdings PLC sponsored ADR (a) | | 64,000 | | 3,583,360 |
| Southwest Airlines Co. | | 100 | | 1,643 |
| | | | | 13,810,712 |
| Building Products – 0.2% | | | | |
| American Woodmark Corp. | | 200 | | 4,958 |
| Simpson Manufacturing Co. Ltd. | | 228,200 | | 8,295,070 |
| Trex Co., Inc. (a) | | 100 | | 2,805 |
See accompanying notes which are an integral part of the financial statements.
| | |
| VIP Mid Cap Portfolio | | 20 |
| Common Stocks continued | | | | | | | | |
| | | | | Shares | | Value (Note 1) |
| |
| INDUSTRIALS – continued | | | | | | | | |
| Building Products – continued | | | | | | | | |
| USG Corp. (a) | | | | 100 | | $ | | 6,500 |
| Wienerberger Baustoffindust AG | | | | 100 | | | | 4,001 |
| | | | | | | | | 8,313,334 |
| Commercial Services & Supplies 3.0% | | | | | | | | |
| Advisory Board Co. (a) | | | | 100 | | | | 4,767 |
| Bennett Environmental, Inc. (a) | | | | 167,100 | | | | 518,886 |
| CDI Corp. | | | | 621,600 | | | | 17,031,840 |
| ChoicePoint, Inc. (a) | | | | 1,134,700 | | | | 50,505,497 |
| Cintas Corp. | | | | 917,325 | | | | 37,775,444 |
| Corporate Executive Board Co. | | | | 100 | | | | 8,970 |
| CoStar Group, Inc. (a) | | | | 100 | | | | 4,317 |
| Dun & Bradstreet Corp. (a) | | | | 100 | | | | 6,696 |
| Fullcast Co. Ltd. (d) | | | | 5,746 | | | | 19,103,788 |
| GFK AG | | | | 20 | | | | 670 |
| Intertek Group PLC | | | | 436,200 | | | | 5,234,053 |
| Monster Worldwide, Inc. (a) | | | | 317,300 | | | | 12,952,186 |
| PICO Holdings, Inc. (a) | | | | 100 | | | | 3,226 |
| Pike Electric Corp. | | | | 100 | | | | 1,622 |
| Randstad Holdings NV | | | | 86,700 | | | | 3,765,854 |
| Ritchie Brothers Auctioneers, Inc. | | | | 33,100 | | | | 1,398,475 |
| Robert Half International, Inc. | | | | 100 | | | | 3,789 |
| Rollins, Inc. | | | | 100 | | | | 1,971 |
| Societe Generale de Surveillance Holding SA (SGS) (Reg.) | | | | 14,791 | | | | 12,472,167 |
| Stericycle, Inc. (a) | | | | 222,100 | | | | 13,077,248 |
| Tele Atlas NV (a) | | | | 65,600 | | | | 1,755,905 |
| | | | | | | 175,627,371 |
| Construction & Engineering – 1.8% | | | | | | | | |
| Arcadis NV | | | | 9,700 | | | | 307,754 |
| Arcadis NV (NY Shares) | | | | 200 | | | | 6,320 |
| Chicago Bridge & Iron Co. NV | | | | | | | | |
| (NY Shares) | | | | 605,600 | | | | 15,267,176 |
| Daelim Industrial Co. | | | | 58,000 | | | | 4,144,914 |
| EMCOR Group, Inc. (a) | | | | 100 | | | | 6,753 |
| Fluor Corp. | | | | 136,100 | | | | 10,515,086 |
| Infrasource Services, Inc. (a) | | | | 100 | | | | 1,308 |
| Insituform Technologies, Inc. Class A (a) | | | | 100 | | | | 1,937 |
| Jacobs Engineering Group, Inc. (a) | | | | 430,900 | | | | 29,245,183 |
| Larsen & Toubro Ltd. | | | | 100 | | | | 4,101 |
| LG Engineering & Construction Co. Ltd. | | | | 100 | | | | 5,261 |
| Orascom Construction Industries SAE GDR | | | | 100 | | | | 7,500 |
| PTC India Ltd. | | | | 100 | | | | 132 |
| Quanta Services, Inc. (a) | | | | 100 | | | | 1,317 |
| Shaw Group, Inc. (a) | | | | 1,283,700 | | | | 37,342,833 |
| SNC Lavalin Group, Inc. | | | | 100 | | | | 6,563 |
| United Group Ltd. | | | | 1,285,700 | | | | 10,883,665 |
| | | | | | | 107,747,803 |
| Electrical Equipment 1.8% | | | | | | | | |
| AstroPower, Inc. (a) | | | | 100 | | | | 0 |
| |
| |
| |
See accompanying notes which are an integral part of the financial statements.
| | | | | | | | |
| | | 21 | | | | Annual Report |
21
| VIP Mid Cap Portfolio | | | | |
| Investments - continued | | | | |
| |
| |
| |
| | | Shares | | Value (Note 1) |
| Bharat Heavy Electricals Ltd. | | 100 | | $ 3,114 |
| C&D Technologies, Inc. | | 490,700 | | 3,739,134 |
| Crompton Greaves Ltd. | | 144,396 | | 2,441,045 |
| Fujikura Ltd. | | 1,000 | | 8,108 |
| II VI, Inc. (a) | | 200 | | 3,574 |
| Johnson Electric Holdings Ltd. sponsored ADR | | 100 | | 940 |
| Rockwell Automation, Inc. | | 1,401,100 | | 82,889,076 |
| Roper Industries, Inc. | | 281,300 | | 11,114,163 |
| Shanghai Electric (Group) Corp. | | | | |
| (H Shares) | | 2,000 | | 684 |
| SolarWorld AG | | 27,100 | | 3,625,304 |
| | | | | 103,825,142 |
| Industrial Conglomerates 0.8% | | | | |
| Aditya Birla Nuvo Ltd. | | 100 | | 1,478 |
| Fu Sheng Industrial Co. Ltd. | | 2,295,000 | | 2,922,365 |
| Hutchison Whampoa Ltd. ADR | | 100 | | 4,740 |
| Max India Ltd. (a) | | 395,174 | | 5,273,964 |
| Shanghai Industrial Holdings Ltd. Class H | | 1,000 | | 2,083 |
| Smiths Group PLC | | 100 | | 1,801 |
| Teleflex, Inc. | | 582,400 | | 37,844,352 |
| | | | | 46,050,783 |
| Machinery – 4.4% | | | | |
| AGCO Corp. (a) | | 3,632,500 | | 60,190,525 |
| Badger Meter, Inc. | | 258,700 | | 10,151,388 |
| Bucher Holding AG | | 500 | | 39,878 |
| Danaher Corp. | | 100 | | 5,578 |
| Deutz AG (a) | | 100 | | 490 |
| Dover Corp. | | 260,700 | | 10,555,743 |
| Eicher Motors Ltd. | | 342,065 | | 1,744,345 |
| Flowserve Corp. (a) | | 458,000 | | 18,118,480 |
| Graco, Inc. | | 326,300 | | 11,903,424 |
| Harsco Corp. | | 954,799 | | 64,458,480 |
| Heidelberger Druckmaschinen AG | | 178,400 | | 6,825,947 |
| Hexagon AB (B Shares) | | 100 | | 2,983 |
| Jain Irrigation Systems Ltd. (a) | | 100 | | 466 |
| Koyo Seiko Co. Ltd. | | 1,000 | | 18,617 |
| Krones AG | | 2,900 | | 292,197 |
| MAN AG | | 100 | | 5,337 |
| Manitowoc Co., Inc. | | 100 | | 5,022 |
| Middleby Corp. (a) | | 100 | | 8,650 |
| PACCAR, Inc. | | 150 | | 10,385 |
| Pall Corp. | | 100 | | 2,686 |
| Pentair, Inc. | | 654,500 | | 22,593,340 |
| Railpower Technologies Corp. (a) | | 100 | | 556 |
| Tata Motors Ltd. | | 452,400 | | 6,569,578 |
| Tata Motors Ltd. sponsored ADR (d) | | 17,100 | | 245,727 |
| Terex Corp. (a) | | 495,200 | | 29,414,880 |
| Timken Co. | | 148,800 | | 4,764,576 |
| Toshiba Machine Co. Ltd. | | 1,000 | | 9,898 |
| Valmont Industries, Inc. | | 100 | | 3,346 |
See accompanying notes which are an integral part of the financial statements.
| | |
| VIP Mid Cap Portfolio | | 22 |
| Common Stocks continued | | | | | | |
| | | | | Shares | | Value (Note 1) |
| |
| INDUSTRIALS – continued | | | | | | |
| Machinery – continued | | | | | | |
| Wabtec Corp. | | | | 246,700 | | $ 6,636,230 |
| Zenon Environmental, Inc. (a) | | | | 336,100 | | 4,862,760 |
| | | | | | | 259,441,512 |
| Marine – 0.1% | | | | | | |
| Alexander & Baldwin, Inc. | | | | 100,745 | | 5,464,409 |
| Hanjin Shipping Co. Ltd. | | | | 80 | | 1,826 |
| Odfjell ASA: | | | | | | |
| (A Shares) | | | | 41,500 | | 842,908 |
| (B Shares) | | | | 400 | | 6,938 |
| | | | | | | 6,316,081 |
| Road & Rail 0.0% | | | | | | |
| Burlington Northern Santa Fe Corp. | | | | 100 | | 7,082 |
| CNF, Inc. | | | | 100 | | 5,589 |
| Guangshen Railway Co. Ltd. sponsored ADR | | | | 100 | | 1,552 |
| Heartland Express, Inc. | | | | 150 | | 3,044 |
| Knight Transportation, Inc. | | | | 225 | | 4,664 |
| Old Dominion Freight Lines, Inc. (a) | | | | 225 | | 6,071 |
| | | | | | | 28,002 |
| Trading Companies & Distributors – 0.4% | | | | | | |
| Bunzl PLC | | | | 78 | | 857 |
| Fastenal Co. | | | | 233,200 | | 9,139,108 |
| GATX Corp. | | | | 100 | | 3,608 |
| MSC Industrial Direct Co., Inc. Class A | | | | 288,300 | | 11,595,426 |
| NuCo2, Inc. (a) | | | | 64,000 | | 1,784,320 |
| Richelieu Hardware Ltd | | | | 100 | | 2,039 |
| STB Leasing Co. Ltd. | | | | 100 | | 2,036 |
| United Rentals, Inc. (a) | | | | 100 | | 2,339 |
| W.W. Grainger, Inc. | | | | 27,600 | | 1,962,360 |
| WESCO International, Inc. (a) | | | | 100 | | 4,273 |
| | | | | | | 24,496,366 |
| Transportation Infrastructure – 0.0% | | | | | | |
| Anhui Expressway Co. Ltd. (H Shares) | | | | 2,000 | | 967 |
| Macquarie Infrastructure Group unit | | | | 100 | | 261 |
| Sea Containers Ltd. Class B (a) | | | | 7,900 | | 96,933 |
| | | | | | | 98,161 |
| |
| TOTAL INDUSTRIALS | | | | | | 813,767,348 |
| |
| INFORMATION TECHNOLOGY 10.7% | | | | | | |
| Communications Equipment – 0.5% | | | | | | |
| Arris Group, Inc. (a) | | | | 100 | | 947 |
| AudioCodes Ltd. (a) | | | | 100 | | 1,110 |
| Avaya, Inc. (a) | | | | 100 | | 1,067 |
| Black Box Corp. | | | | 100 | | 4,738 |
| Comtech Telecommunications Corp. (a) | | | | 150 | | 4,581 |
| EFJ, Inc. (a) | | | | 100 | | 1,015 |
| Foxconn International Holdings Ltd. | | | | 1,000 | | 1,631 |
| Harris Corp. | | | | 100 | | 4,301 |
| Ixia (a) | | | | 869,100 | | 12,845,298 |
| |
See accompanying notes which are an integral part of the financial statements.
| | | | | | |
| | | 23 | | | | Annual Report |
23
| VIP Mid Cap Portfolio | | | | |
| Investments - continued | | | | |
| |
| |
| |
| | | Shares | | Value (Note 1) |
| Juniper Networks, Inc. (a) | | 200 | | $ 4,460 |
| NETGEAR, Inc. (a) | | 724,500 | | 13,946,625 |
| Option NV (a) | | 90 | | 6,686 |
| Plantronics, Inc. | | 100 | | 2,830 |
| Polycom, Inc. (a) | | 200 | | 3,060 |
| Powerwave Technologies, Inc. (a) | | 100 | | 1,257 |
| Redback Networks, Inc. (a) | | 100 | | 1,406 |
| Research In Motion Ltd. (a) | | 100 | | 6,602 |
| TANDBERG ASA | | 26,600 | | 162,871 |
| | | | | 27,000,485 |
| Computers & Peripherals 1.7% | | | | |
| Apple Computer, Inc. (a) | | 806,100 | | 57,950,529 |
| Compal Electronics, Inc. | | 1,113 | | 1,004 |
| Creative Technology Ltd. (Nasdaq) | | 100 | | 842 |
| Foxconn Technology Co. Ltd. | | 1,100 | | 5,479 |
| Gemplus International SA sponsored ADR (a) | | 100 | | 530 |
| Komag, Inc. (a) | | 209,875 | | 7,274,268 |
| Logitech International SA (Reg.) (a) | | 55,000 | | 2,584,665 |
| M Systems Flash Disk Pioneers Ltd. (a) | | 900 | | 29,808 |
| Moser Baer India Ltd. | | 200 | | 876 |
| NCR Corp. (a) | | 100 | | 3,394 |
| NEC Corp. sponsored ADR | | 1,672,800 | | 10,354,632 |
| Oberthur Card Systems (d) | | 683,600 | | 5,932,021 |
| Psion PLC | | 33 | | 94 |
| SanDisk Corp. (a) | | 221,842 | | 13,936,114 |
| Synaptics, Inc. (a) | | 100 | | 2,472 |
| | | | | 98,076,728 |
| Electronic Equipment & Instruments – 3.7% | | | | |
| Agilent Technologies, Inc. (a) | | 6 | | 200 |
| Amphenol Corp. Class A | | 100 | | 4,426 |
| Applied Films Corp. (a) | | 100 | | 2,077 |
| Brightpoint, Inc. (a) | | 225 | | 6,225 |
| CDW Corp. | | 1,112,791 | | 64,063,378 |
| CellStar Corp. (a) | | 100 | | 190 |
| Cogent, Inc. (a) | | 200 | | 4,536 |
| Excel Technology, Inc. (a) | | 100 | | 2,378 |
| FLIR Systems, Inc. (a) | | 409,600 | | 9,146,368 |
| Hon Hai Precision Industry Co. Ltd. (Foxconn) | | 10,565,597 | | 57,935,127 |
| I. D. Systems Inc. (a) | | 100 | | 2,385 |
| Iteris, Inc. (a) | | 100 | | 240 |
| Itron, Inc. (a) | | 100 | | 4,004 |
| KEMET Corp. (a) | | 1,177,700 | | 8,326,339 |
| Keyence Corp. | | 14,300 | | 4,069,081 |
| Mercury Computer Systems, Inc. (a) | | 1,500 | | 30,945 |
| Metrologic Instruments, Inc. (a) | | 200 | | 3,852 |
| Mettler Toledo International, Inc. (a) | | 487,100 | | 26,887,920 |
| Molex, Inc. | | 100 | | 2,595 |
| MTS Systems Corp. | | 100 | | 3,464 |
| National Instruments Corp. | | 2,800 | | 89,740 |
| Robotic Vision Systems, Inc. (a) | | 100 | | 0 |
| ScanSource, Inc. (a) | | 100 | | 5,468 |
See accompanying notes which are an integral part of the financial statements.
| | |
| VIP Mid Cap Portfolio | | 24 |
| Common Stocks continued | | | | | | | | |
| | | | | Shares | | Value (Note 1) |
| |
| INFORMATION TECHNOLOGY – continued | | | | | | | | |
| Electronic Equipment & Instruments – continued | | | | | | | | |
| Sunpower Corp. Class A | | | | 4,400 | | $ | | 149,556 |
| Symbol Technologies, Inc. | | | | 189 | | | | 2,423 |
| Universal Display Corp. (a) | | | | 100 | | | | 1,051 |
| Vishay Intertechnology, Inc. (a) | | | | 3,482,500 | | | | 47,919,200 |
| Xyratex Ltd. (a) | | | | 18,700 | | | | 330,616 |
| Yageo Corp. sponsored GDR (a) | | | | 100 | | | | 218 |
| | | | | | | 218,994,002 |
| Internet Software & Services 1.6% | | | | | | | | |
| Akamai Technologies, Inc. (a) | | | | 100 | | | | 1,993 |
| Answers Corp. (a) | | | | 100 | | | | 1,147 |
| aQuantive, Inc. (a) | | | | 157,611 | | | | 3,978,102 |
| Baidu.com, Inc. sponsored ADR | | | | 100 | | | | 6,292 |
| Bankrate, Inc. (a) | | | | 100 | | | | 2,952 |
| eCollege.com (a) | | | | 649,100 | | | | 11,703,273 |
| Entrust, Inc. (a) | | | | 100 | | | | 484 |
| Iliad Group SA | | | | 100 | | | | 6,192 |
| iMergent, Inc. (a) | | | | 100 | | | | 660 |
| InfoSpace, Inc. (a) | | | | 100 | | | | 2,582 |
| LookSmart Ltd. (a) | | | | 20 | | | | 75 |
| MIVA, Inc. (a) | | | | 100 | | | | 495 |
| Neoforma, Inc. (a) | | | | 100 | | | | 990 |
| NHN Corp. (a) | | | | 100 | | | | 26,799 |
| Online Resources Corp. (a) | | | | 100 | | | | 1,105 |
| Open Text Corp. (a) | | | | 100 | | | | 1,415 |
| RealNetworks, Inc. (a) | | | | 4,022,404 | | | | 31,213,855 |
| Sify Ltd. sponsored ADR (a) | | | | 100 | | | | 1,076 |
| Sina Corp. (a) | | | | 100 | | | | 2,416 |
| SonicWALL, Inc. (a) | | | | 100 | | | | 792 |
| Tencent Holdings Ltd. | | | | 1,000 | | | | 1,070 |
| ValueClick, Inc. (a) | | | | 1,170,495 | | | | 21,197,664 |
| VeriSign, Inc. (a) | | | | 968,664 | | | | 21,233,115 |
| WebSideStory, Inc. (a) | | | | 100 | | | | 1,813 |
| Yahoo! Japan Corp | | | | 3,300 | | | | 5,009,966 |
| | | | | | | | | 94,396,323 |
| IT Services 0.5% | | | | | | | | |
| Affiliated Computer Services, Inc. | | | | | | | | |
| Class A (a) | | | | 16 | | | | 947 |
| CheckFree Corp. (a) | | | | 100 | | | | 4,590 |
| Computershare Ltd. | | | | 100 | | | | 498 |
| DST Systems, Inc. (a) | | | | 600 | | | | 35,946 |
| Global Payments, Inc. | | | | 200 | | | | 9,322 |
| Hewitt Associates, Inc. Class A (a) | | | | 100 | | | | 2,801 |
| Infosys Technologies Ltd. | | | | 15,605 | | | | 1,039,356 |
| Infosys Technologies Ltd. sponsored ADR | | | | 200 | | | | 16,172 |
| infoUSA, Inc. | | | | 100 | | | | 1,093 |
| Lionbridge Technologies, Inc. (a) | | | | 1,323,300 | | | | 9,289,566 |
| ManTech International Corp. Class A (a) | | | | 188,332 | | | | 5,246,930 |
| Maximus, Inc. | | | | 328,200 | | | | 12,041,658 |
| Obic Co. Ltd. | | | | 100 | | | | 22,035 |
| RightNow Technologies, Inc. (a) | | | | 100 | | | | 1,846 |
| |
See accompanying notes which are an integral part of the financial statements.
| | | | | | | | |
| | | 25 | | | | Annual Report |
25
| VIP Mid Cap Portfolio | | | | |
| Investments - continued | | | | |
| |
| |
| |
| | | Shares | | Value (Note 1) |
| Satyam Computer Services Ltd. | | 100 | | $ 1,640 |
| StarTek, Inc. | | 100 | | 1,800 |
| Syntel, Inc. | | 100 | | 2,083 |
| TALX Corp. | | 150 | | 6,857 |
| TietoEnator Oyj | | 100 | | 3,652 |
| Tyler Technologies, Inc. (a) | | 100 | | 878 |
| | | | | 27,729,670 |
| Office Electronics – 0.0% | | | | |
| Zebra Technologies Corp. Class A (a) | | 75 | | 3,214 |
| Semiconductors & Semiconductor Equipment – 0.8% | | | | |
| Agere Systems, Inc. (a) | | 10 | | 129 |
| Analog Devices, Inc. | | 100 | | 3,587 |
| ARM Holdings PLC sponsored ADR | | 100 | | 621 |
| ASM Pacific Technology Ltd. | | 500 | | 2,821 |
| ASML Holding NV (NY Shares) (a) | | 100 | | 2,008 |
| ATI Technologies, Inc. (a) | | 100 | | 1,703 |
| Axcelis Technologies, Inc. (a) | | 100 | | 477 |
| Credence Systems Corp. (a) | | 772,500 | | 5,376,600 |
| Freescale Semiconductor, Inc. Class A (a) | | 100 | | 2,519 |
| Integrated Device Technology, Inc. (a) | | 1,020,000 | | 13,443,600 |
| International Rectifier Corp. (a) | | 100 | | 3,190 |
| KLA Tencor Corp. | | 100 | | 4,933 |
| Marvell Technology Group Ltd. (a) | | 200 | | 11,218 |
| Mattson Technology, Inc. (a) | | 482,810 | | 4,857,069 |
| Microchip Technology, Inc. | | 100 | | 3,215 |
| National Semiconductor Corp. | | 200 | | 5,196 |
| NVIDIA Corp. (a) | | 248,900 | | 9,099,784 |
| PortalPlayer, Inc. (a) | | 100 | | 2,832 |
| Rambus, Inc. (a) | | 100 | | 1,619 |
| Saifun Semiconductors Ltd. | | 6,300 | | 198,261 |
| Silicon Image, Inc. (a) | | 100 | | 905 |
| Veeco Instruments, Inc. (a) | | 397,500 | | 6,888,675 |
| Zoran Corp. (a) | | 625,137 | | 10,133,471 |
| | | | | 50,044,433 |
| Software 1.9% | | | | |
| Activision, Inc. (a) | | 518,772 | | 7,127,927 |
| Adobe Systems, Inc. | | 138 | | 5,100 |
| Advent Software, Inc. (a) | | 143,911 | | 4,160,467 |
| Altiris, Inc. (a) | | 100 | | 1,689 |
| Autonomy Corp. PLC (a) | | 200 | | 1,347 |
| Blackboard, Inc. (a) | | 100 | | 2,898 |
| Bottomline Technologies, Inc. (a) | | 11 | | 121 |
| Cadence Design Systems, Inc. (a) | | 100 | | 1,692 |
| CCC Information Services Group, Inc. (a) | | 100 | | 2,622 |
| Cognos, Inc. (a) | | 984,600 | | 34,343,065 |
| Concur Technologies, Inc. (a) | | 100 | | 1,289 |
| FactSet Research Systems, Inc. | | 150 | | 6,174 |
| FileNET Corp. (a) | | 100 | | 2,585 |
| Hitachi Software Engineerng Co. Ltd. | | 100 | | 2,095 |
| Hyperion Solutions Corp. (a) | | 396,591 | | 14,205,890 |
| Informatica Corp. (a) | | 100 | | 1,200 |
| Intuit, Inc. (a) | | 100 | | 5,330 |
| KOEI Co. Ltd. (d) | | 429,020 | | 11,898,524 |
See accompanying notes which are an integral part of the financial statements.
| | |
| VIP Mid Cap Portfolio | | 26 |
| Common Stocks continued | | | | | | | | |
| | | | | Shares | | Value (Note 1) |
| |
| INFORMATION TECHNOLOGY – continued | | | | | | | | |
| Software – continued | | | | | | | | |
| Kronos, Inc. (a) | | | | 100 | | $ | | 4,186 |
| Manhattan Associates, Inc. (a) | | | | 100 | | | | 2,048 |
| Midway Games, Inc. (a) | | | | 100 | | | | 1,897 |
| Napster, Inc. (a) | | | | 100 | | | | 352 |
| NAVTEQ Corp. (a) | | | | 100 | | | | 4,387 |
| NDS Group PLC sponsored ADR (a) | | | | 100 | | | | 4,115 |
| Net 1 UEPS Technologies, Inc. (a) | | | | 17,100 | | | | 493,335 |
| Nuance Communications, Inc. (a) | | | | 299,200 | | | | 2,282,896 |
| Open Solutions, Inc. (a)(e) | | | | 1,102,309 | | | | 25,264,922 |
| Plato Learning, Inc. (a) | | | | 82,400 | | | | 654,256 |
| Quality Systems, Inc. | | | | 100 | | | | 7,676 |
| Renaissance Learning, Inc. | | | | 71 | | | | 1,343 |
| RSA Security, Inc. (a) | | | | 251 | | | | 2,819 |
| Salesforce.com, Inc. (a) | | | | 36,100 | | | | 1,157,005 |
| Scientific Learning Corp. (a) | | | | 100 | | | | 565 |
| Subex Systems Ltd. | | | | 100 | | | | 1,702 |
| Symantec Corp. (a) | | | | 100 | | | | 1,750 |
| Tata Elxsi Ltd. | | | | 100 | | | | 455 |
| Temenos Group AG (a) | | | | 100 | | | | 974 |
| THQ, Inc. (a) | | | | 487,650 | | | | 11,630,453 |
| Ultimate Software Group, Inc. (a) | | | | 100 | | | | 1,907 |
| | | | | | | 113,289,058 |
| |
| TOTAL INFORMATION TECHNOLOGY | | | | | | 629,533,913 |
| |
| MATERIALS 8.9% | | | | | | | | |
| Chemicals 3.2% | | | | | | | | |
| Air Products & Chemicals, Inc. | | | | 100 | | | | 5,919 |
| Airgas, Inc. | | | | 1,898,800 | | | | 62,470,520 |
| Albemarle Corp. | | | | 100 | | | | 3,835 |
| American Vanguard Corp. | | | | 200 | | | | 4,700 |
| Asian Paints India Ltd. | | | | 880,007 | | | | 11,319,126 |
| Balchem Corp. | | | | 150 | | | | 4,472 |
| Ecolab, Inc. (d) | | | | 1,361,700 | | | | 49,388,859 |
| Filtrona PLC | | | | 50 | | | | 245 |
| Jubilant Organosys Ltd. | | | | 100 | | | | 2,389 |
| Kuraray Co. Ltd. | | | | 223,000 | | | | 2,311,234 |
| Lonza Group AG | | | | 10 | | | | 612 |
| Monsanto Co. | | | | 272,800 | | | | 21,150,184 |
| Mosaic Co. (a) | | | | 100 | | | | 1,463 |
| Nitto Denko Corp. | | | | 113,500 | | | | 8,846,657 |
| Praxair, Inc. | | | | 222,700 | | | | 11,794,192 |
| Quaker Chemical Corp. | | | | 100 | | | | 1,923 |
| Recticel SA | | | | 100 | | | | 888 |
| Sasa Dupont Sabanci Polyester Sanayi AS | | | | 1 | | | | 1 |
| Sinopec Shanghai Petrochemical Co. Ltd.: | | | | | | | | |
| (H Shares) | | | | 2,000 | | | | 767 |
| sponsored ADR | | | | 200 | | | | 7,574 |
| Syngenta AG sponsored ADR | | | | 100 | | | | 2,491 |
| |
| |
| |
See accompanying notes which are an integral part of the financial statements.
| | | | | | | | |
| | | 27 | | | | Annual Report |
27
| VIP Mid Cap Portfolio | | | | |
| Investments - continued | | | | |
| |
| |
| |
| | | Shares | | Value (Note 1) |
| Tokuyama Corp. | | 1,493,000 | | $ 19,184,048 |
| United Phosphorous Ltd. | | 455 | | 2,425 |
| | | | | 186,504,524 |
| Construction Materials – 0.1% | | | | |
| Cemex SA de CV sponsored ADR | | 108 | | 6,408 |
| Florida Rock Industries, Inc. | | 149,175 | | 7,318,526 |
| Headwaters, Inc. (a) | | 100 | | 3,544 |
| | | | | 7,328,478 |
| Containers & Packaging – 0.0% | | | | |
| Essel Propack Ltd. | | 270,100 | | 2,150,835 |
| Sealed Air Corp. (a) | | 100 | | 5,617 |
| Silgan Holdings, Inc. | | 68 | | 2,456 |
| | | | | 2,158,908 |
| Metals & Mining – 5.2% | | | | |
| Agnico Eagle Mines Ltd. | | 1,143,930 | | 22,651,300 |
| Agnico Eagle Mines Ltd. (a) | | 23,350 | | 102,974 |
| Aleris International, Inc. (a) | | 100 | | 3,224 |
| Barrick Gold Corp. | | 100 | | 2,788 |
| BHP Billiton Ltd. sponsored ADR | | 100 | | 3,342 |
| BlueScope Steel Ltd. | | 100 | | 511 |
| Boliden AB (a) | | 556,000 | | 4,549,059 |
| Compania de Minas Buenaventura SA sponsored ADR | | 452,000 | | 12,791,600 |
| Dofasco, Inc. | | 100 | | 5,589 |
| Falconbridge Ltd. | | 277 | | 8,220 |
| FNX Mining Co., Inc. (a) | | 100 | | 1,169 |
| Fording Canadian Coal Trust (d) | | 116,700 | | 4,037,395 |
| Freeport McMoRan Copper & Gold, Inc. Class B (d) | | 1,285,900 | | 69,181,420 |
| Glamis Gold Ltd. (a) | | 100 | | 2,750 |
| Goldcorp, Inc. | | 146,800 | | 3,270,500 |
| Golden Star Resources Ltd. (a) | | 250,000 | | 664,488 |
| Grupo Mexico SA de CV Series B | | 100 | | 233 |
| Harmony Gold Mining Co. Ltd. (a) | | 1,096,300 | | 14,306,716 |
| High River Gold Mines Ltd. (a) | | 1,989,600 | | 2,532,887 |
| Inco Ltd. | | 100 | | 4,344 |
| Inmet Mining Corp. | | 100 | | 2,538 |
| Ivanhoe Mines Ltd. (a) | | 100 | | 718 |
| Kinross Gold Corp. (a) | | 6,605,666 | | 61,025,206 |
| Mechel Steel Group OAO sponsored ADR | | 100 | | 2,417 |
| Meridian Gold, Inc. (a) | | 100 | | 2,192 |
| Mittal Steel Co. NV Class A (NY Shares) | | 3,044 | | 80,135 |
| Newmont Mining Corp. | | 1,782,180 | | 95,168,404 |
| Northern Orion Resources, Inc. (a) | | 100 | | 326 |
| Nucor Corp. | | 100 | | 6,672 |
| Phelps Dodge Corp. | | 100 | | 14,387 |
| POSCO sponsored ADR | | 100 | | 4,951 |
| Sumitomo Metal Mining Co. Ltd. | | 2,000 | | 24,749 |
| Teck Cominco Ltd. Class B (sub. vtg.) | | 279,600 | | 14,923,384 |
| Xstrata PLC | | 100 | | 2,341 |
| | | | | 305,378,929 |
See accompanying notes which are an integral part of the financial statements.
| | |
| VIP Mid Cap Portfolio | | 28 |
| Common Stocks continued | | | | | | | | |
| | | | | | | Shares | | Value (Note 1) |
| |
| MATERIALS – continued | | | | | | | | | | |
| Paper & Forest Products 0.4% | | | | | | | | |
| Cathay Forest Products Corp. (a) | | | | 40,100 | | $ | | 26,905 |
| International Forest Products Ltd. (Interfor) Class A (sub. vtg.) (a) | | | | 9,100 | | | | 56,359 |
| Lee & Man Paper Manufacturing Ltd. | | | | 10,218,000 | | | | 11,333,346 |
| MAXXAM, Inc. (a) | | | | | | 100 | | | | 3,505 |
| Pope Resources, Inc. LP | | | | | | 100 | | | | 3,102 |
| Sino Forest Corp. (a) | | | | | | 2,546,500 | | | | 10,820,791 |
| Votorantim Celulose e Papel SA sponsored ADR (non vtg.) | | | | 250 | | | | 3,073 |
| | | | | | | | | | | 22,247,081 |
| |
| TOTAL MATERIALS | | | | | | | | 523,617,920 |
| |
| TELECOMMUNICATION SERVICES 1.2% | | | | | | | | |
| Diversified Telecommunication Services – 0.0% | | | | | | | | |
| Cable & Wireless PLC sponsored ADR | | | | 100 | | | | 616 |
| Covad Communications Group, Inc. (a) | | | | 61 | | | | 60 |
| Golden Telecom, Inc. | | | | | | 100 | | | | 2,596 |
| Philippine Long Distance Telephone Co. | | | | 100 | | | | 3,460 |
| Pipex Communications PLC (a) | | | | 100 | | | | 21 |
| PT Indosat Tbk sponsored ADR | | | | 100 | | | | 2,909 |
| PT Telkomunikasi Indonesia Tbk sponsored ADR | | | | 100 | | | | 2,386 |
| | | | | | | | | | | 12,048 |
| Wireless Telecommunication Services – 1.2% | | | | | | | | |
| America Movil SA de CV Series L sponsored ADR | | | | 389,700 | | | | 11,402,622 |
| Bharti Televentures Ltd. (a) | | | | 1,055,400 | | | | 8,264,700 |
| MTN Group Ltd. | | | | | | 100 | | | | 982 |
| Nextel Partners, Inc. Class A (a) | | | | 100 | | | | 2,794 |
| NII Holdings, Inc. (a) | | | | | | 1,009,816 | | | | 44,108,763 |
| Telemig Celular Participacoes SA sponsored ADR | | | | 100 | | | | 3,941 |
| USA Mobility, Inc. | | | | | | 286,340 | | | | 7,937,345 |
| | | | | | | | | | | 71,721,147 |
| |
| TOTAL TELECOMMUNICATION SERVICES | | | | | | | | 71,733,195 |
| |
| UTILITIES 1.0% | | | | | | | | | | |
| Electric Utilities – 0.0% | | | | | | | | | | |
| FPL Group, Inc. | | | | | | 200 | | | | 8,312 |
| Korea Electric Power Corp. sponsored ADR | | | | 100 | | | | 1,949 |
| PPL Corp. | | | | | | 200 | | | | 5,880 |
| | | | | | | | | | | 16,141 |
| Gas Utilities 0.3% | | | | | | | | | | |
| PT Perusahaan Gas Negara Tbk Series B | | | | 500 | | | | 351 |
| SEMCO Energy, Inc. (a) | | | | | | 1,613,700 | | | | 9,068,994 |
| Xinao Gas Holdings Ltd. | | | | | | 11,158,000 | | | | 8,850,245 |
| | | | | | | | | | | 17,919,590 |
| |
| |
| | | | | | | Shares | | Value (Note 1) |
| Independent Power Producers & Energy Traders 0.6% | | | | | | | | |
| AES Corp. (a) | | | | | | 2,066,600 | | $ 32,714,278 |
| |
| |
See accompanying notes which are an integral part of the financial statements.
| | | | | | | | |
| | | | | 29 | | | | Annual Report |
29
| VIP Mid Cap Portfolio | | | | | | |
| Investments - continued | | | | |
| |
| | | | Shares | | Value (Note 1) |
| | | | | | |
| | | | | | |
| Multi-Utilities – 0.1% | | | | | | |
| Public Service Enterprise Group, Inc. | | 105,000 | | 6,821,850 |
| TOTAL UTILITIES | | | | | | 57,471,859 |
| TOTAL COMMON STOCKS | | | | | | |
| (Cost $4,282,979,998) | | | | 5,514,359,333 |
| Nonconvertible Preferred Stocks 0.0% | | | | |
| |
| CONSUMER DISCRETIONARY 0.0% | | | | |
| Household Durables 0.0% | | | | | | |
| Fedders Corp. Series A, 8.60% | | | | | | |
| (Cost $119) | | | | 5 | | 45 |
| Money Market Funds 8.3% | | | | |
| Fidelity Cash Central Fund, 4.28% (b) | | 372,876,046 | | 372,876,046 |
| Fidelity Securities Lending Cash Central Fund, 4.35% (b)(c) | | 114,642,969 | | 114,642,969 |
| TOTAL MONEY MARKET FUNDS | | | | |
| (Cost $487,519,015) | | | | | | 487,519,015 |
| TOTAL INVESTMENT PORTFOLIO 102.4% | | | | |
| (Cost $4,770,499,132) | | | | 6,001,878,393 |
| |
| NET OTHER ASSETS (2.4)% | | (141,304,340) |
| NET ASSETS 100% | | | | $ 5,860,574,053 |
Legend
(a) Non-income producing
(b) Affiliated fund that is available only to investment companies and other accounts managed by Fidelity Investments. The rate quoted is the annualized seven-day
yield of the fund at period end. A complete unaudited listing of the fund’s holdings as of its most recent quarter end is available upon request.
(c) Investment made with cash collateral received from securities on loan.
(d) Security or a portion of the security is on loan at period end.
(e) Affiliated company
(f) Security exempt from registration under Rule 144A of the Securities Act of 1933. These securities may be resold in transactions exempt from registration,
normally to qualified institutional buyers. At the period end, the value of these securities amounted to $3,112,232 or 0.1% of net assets.
|
Affiliated Central Funds
Information regarding income received by the fund from the affiliated Central funds during the period is as follows:
| Fund | | Income received |
| Fidelity Cash Central Fund | | $ 10,697,508 |
| Fidelity Securities Lending Cash Central Fund | | 1,173,532 |
| Total | | $ 11,871,040 |
Other Affiliated Issuers
An affiliated company is a company in which the fund has ownership of at least 5% of the voting securities. Transactions during the period with companies which are or were affiliates are as follows:
| | | Value, beginning | | | | | | | | Value, end of |
| Affiliate | | of period | | Purchases | | Sales Proceeds | | Dividend Income | | period |
| Eclipsys Corp. | | $ | | 2,043 | | $ | | 44,996,485 | | $ | | 4,829,543 | | $ | | — | | $ | | 47,063,766 |
| Harvard Bioscience, Inc. | | | | 13,996,708 | | — | | 1,599,168 | | — | | 11,107,409 |
| IMPCO Technologies, Inc. | | | | 11,373,320 | | 7,701,234 | | 5,209,047 | | — | | 9,268,848 |
| LKQ Corp. | | | | 6,328,814 | | 27,305,192 | | 30,196,332 | | — | | — |
| Open Solutions, Inc. | | | | 11,349,946 | | 14,785,536 | | — | | — | | 25,264,922 |
See accompanying notes which are an integral part of the financial statements.
VIP Mid Cap Portfolio 30
| Parker Drilling Co. | | 7,847,424 | | 25,100,378 | | | | — | | | | — | | 59,364,645 |
| ResCare, Inc. | | 18,093,582 | | 11,382,634 | | | | 3,120,143 | | | | — | | 28,261,042 |
| SEMCO Energy, Inc. | | — | | 9,501,356 | | | | — | | | | — | | — |
| Stratagene Corp. | | 6,584,400 | | 6,768,249 | | | | 1,381,366 | | | | 360,362 | | 14,472,128 |
| Strategic Diagnostics, Inc. | | 2,773,050 | | 2,383,669 | | | | — | | | | — | | 5,392,660 |
| Total | | $ | | 78,349,287 | | $ | | 149,924,733 | | $ | | 46,335,599 | | $ | | 360,362 | | $ | | 200,195,420 |
| |
| Other Information | | | | | | | | | | | | | | |
| Distribution of investments by country of issue, as a percentage of total net assets, is as follows: | | | | | | | | | | |
| |
| United States of America | | | | | | | | | | | | | | 72.8% |
| Japan | | | | | | | | | | | | | | 5.8% |
| Canada | | | | | | | | | | | | | | 5.1% |
| India | | | | | | | | | | | | | | 2.2% |
| Netherlands | | | | | | | | | | | | | | 2.1% |
| Cayman Islands | | | | | | | | | | | | | | 2.0% |
| Switzerland | | | | | | | | | | | | | | 1.2% |
| France | | | | | | | | | | | | | | 1.2% |
| Taiwan | | | | | | | | | | | | | | 1.1% |
| Others (individually less than 1%) | | | | | | | | | | | | | | 6.5% |
| | | | | | | | | | | | | | | 100.0% |
See accompanying notes which are an integral part of the financial statements.
|
31 Annual Report
31
| VIP Mid Cap Portfolio | | | | | | | | |
| |
| Financial Statements | | | | | | | | |
| |
| |
| Statement of Assets and Liabilities | | | | | | | | |
| | | | | December 31, 2005 |
| |
| Assets | | | | | | | | |
| Investment in securities, at value (including securities loaned of $109,479,789) — See accompanying schedule: | | | | | | |
| Unaffiliated issuers (cost $4,135,029,460) | | | | $5,314,163,958 | | | | |
| Affiliated Central Funds (cost $487,519,015) | | | | 487,519,015 | | | | |
| Other affiliated issuers (cost $147,950,657) | | | | 200,195,420 | | | | |
| Total Investments (cost $4,770,499,132) | | | | | | $6,001,878,393 |
| Foreign currency held at value (cost $3,939,086) | | | | | | | | 3,939,073 |
| Receivable for investments sold | | | | | | | | 3,023,285 |
| Receivable for fund shares sold | | | | | | | | 4,185,895 |
| Dividends receivable | | | | | | | | 3,319,781 |
| Interest receivable | | | | | | | | 1,278,741 |
| Prepaid expenses | | | | | | | | 23,423 |
| Other affiliated receivables | | | | | | | | 1,311 |
| Other receivables | | | | | | | | 1,051,712 |
| Total assets | | | | | | 6,018,701,614 |
| |
| Liabilities | | | | | | | | |
| Payable to custodian bank | | | | $ 1,817 | | | | |
| Payable for investments purchased | | | | 33,815,197 | | | | |
| Payable for fund shares redeemed | | | | 2,826,714 | | | | |
| Accrued management fee | | | | 2,756,501 | | | | |
| Distribution fees payable | | | | 811,709 | | | | |
| Other affiliated payables | | | | 426,970 | | | | |
| Other payables and accrued expenses | | | | 2,845,684 | | | | |
| Collateral on securities loaned, at value | | | | 114,642,969 | | | | |
| Total liabilities | | | | | | | | 158,127,561 |
| |
| Net Assets | | | | | | $ 5,860,574,053 |
| Net Assets consist of: | | | | | | | | |
| Paid in capital | | | | | | $3,882,983,567 |
| Undistributed net investment income | | | | | | | | 15,998,697 |
| Accumulated undistributed net realized gain (loss) on investments and foreign currency transactions | | | | | | 732,865,298 |
| Net unrealized appreciation (depreciation) on investments and assets and liabilities in foreign currencies | | | | 1,228,726,491 |
| Net Assets | | | | | | $ 5,860,574,053 |
| |
| Statement of Assets and Liabilities continued | | | | | | | | |
| | | | | December 31, 2005 |
| |
| Initial Class: | | | | | | | | |
| Net Asset Value, offering price and redemption price per share ($1,276,301,578 ÷ 36,352,772 shares) | | | | $ | | 35.11 |
| Service Class: | | | | | | | | |
| Net Asset Value, offering price and redemption price per share ($990,560,917 ÷ 28,343,115 shares) | | | | $ | | 34.95 |
| Service Class 2: | | | | | | | | |
| Net Asset Value, offering price and redemption price per share ($3,542,951,507 ÷ 102,202,703 shares) | | | | $ | | 34.67 |
| Investor Class: | | | | | | | | |
| Net Asset Value, offering price and redemption price per share ($50,760,051 ÷ 1,446,900 shares) | | | | $ | | 35.08 |
| |
| |
| |
| |
| See accompanying notes which are an integral part of the financial statements. | | | | | | | | |
| |
| VIP Mid Cap Portfolio | | 32 | | | | | | |
| Statement of Operations | | | | | | | | |
| | | | | Year ended December 31, 2005 |
| |
| Investment Income | | | | | | | | |
| Dividends (including $360,362 received from other affiliated issuers) | | | | | | $ | | 35,322,015 |
| Special dividends | | | | | | | | 6,755,487 |
| Interest | | | | | | | | 44,739 |
| Income from affiliated Central Funds (including $1,173,532 from security lending) | | | | | | | | 11,871,040 |
| Total income | | | | | | | | 53,993,281 |
| |
| Expenses | | | | | | | | |
| Management fee | | $ | | 27,032,934 | | | | |
| Transfer agent fees | | | | 3,217,491 | | | | |
| Distribution fees | | | | 7,754,097 | | | | |
| Accounting and security lending fees | | | | 1,151,450 | | | | |
| Independent trustees’ compensation | | | | 20,396 | | | | |
| Custodian fees and expenses | | | | 862,268 | | | | |
| Registration fees | | | | 8,689 | | | | |
| Audit | | | | 77,475 | | | | |
| Legal | | | | 17,668 | | | | |
| Miscellaneous | | | | 505,110 | | | | |
| Total expenses before reductions | | | | 40,647,578 | | | | |
| Expense reductions | | | | (2,742,506) | | | | 37,905,072 |
| |
| Net investment income (loss) | | | | | | | | 16,088,209 |
| Realized and Unrealized Gain (Loss) | | | | | | | | |
| Net realized gain (loss) on: | | | | | | | | |
| Investment securities: | | | | | | | | |
| Unaffiliated issuers (net of foreign taxes of $175,374) | | | | 737,345,770 | | | | |
| Other affiliated issuers | | | | 1,991,693 | | | | |
| Foreign currency transactions | | | | (204,299) | | | | |
| Total net realized gain (loss) | | | | | | | | 739,133,164 |
| Change in net unrealized appreciation (depreciation) on: | | | | | | | | |
| Investment securities (net of increase in deferred foreign taxes of $1,404,806) | | | | 80,110,633 | | | | |
| Assets and liabilities in foreign currencies | | | | (478,313) | | | | |
| Total change in net unrealized appreciation (depreciation) | | | | | | | | 79,632,320 |
| Net gain (loss) | | | | | | | | 818,765,484 |
| Net increase (decrease) in net assets resulting from operations | | | | | | $ | | 834,853,693 |
| |
| Statement of Changes in Net Assets | | | | | | | | |
| | | | | Year ended | | | | Year ended |
| | | | | December 31, | | | | December 31, |
| | | | | 2005 | | | | 2004 |
| Increase (Decrease) in Net Assets | | | | | | | | |
| Operations | | | | | | | | |
| Net investment income (loss) | | $ | | 16,088,209 | | $ | | (3,642,695) |
| Net realized gain (loss) | | | | 739,133,164 | | | | 195,434,513 |
| Change in net unrealized appreciation (depreciation) | | | | 79,632,320 | | | | 536,253,385 |
| Net increase (decrease) in net assets resulting from operations | | | | 834,853,693 | | | | 728,045,203 |
| Distributions to shareholders from net realized gain | | | | (69,737,263) | | | | — |
| Share transactions - net increase (decrease) | | | | 1,095,215,324 | | | | 835,964,194 |
| Total increase (decrease) in net assets | | | | 1,860,331,754 | | | | 1,564,009,397 |
| |
| Net Assets | | | | | | | | |
| Beginning of period | | | | 4,000,242,299 | | | | 2,436,232,902 |
| End of period (including undistributed net investment income of $15,998,697 and undistributed net investment income | | | | | | | | |
| of $68,191, respectively) | | $ | | 5,860,574,053 | | $ | | 4,000,242,299 |
See accompanying notes which are an integral part of the financial statements.
|
33 Annual Report
| Financial Highlights Initial Class | | | | | | | | | | |
| Years ended December 31, | | 2005 | | 2004 | | 2003G | | 2002 | | 2001 |
| Selected Per Share Data | | | | | | | | | | |
| Net asset value, beginning of period | | $ 30.18 | | $ 24.16 | | $ 17.51 | | $ 19.60 | | $ 20.26 |
| Income from Investment Operations | | | | | | | | | | |
| Net investment income (loss)C | | 16D | | .01 | | F | | .09 | | .20 |
| Net realized and unrealized gain (loss) | | 5.28 | | 6.01 | | 6.73 | | (2.00) | | (.86) |
| Total from investment operations | | 5.44 | | 6.02 | | 6.73 | | (1.91) | | (.66) |
| Distributions from net investment income | | — | | — | | (.08) | | (.18) | | — |
| Distributions from net realized gain | | (.51) | | — | | — | | — | | — |
| Total distributions | | (.51) | | — | | (.08) | | (.18) | | — |
| Net asset value, end of period | | $ 35.11 | | $ 30.18 | | $ 24.16 | | $ 17.51 | | $ 19.60 |
| Total ReturnA,B | | 18.30% | | 24.92% | | 38.64% | | (9.82)% | | (3.26)% |
| Ratios to Average Net AssetsE | | | | | | | | | | |
| Expenses before reductions | | 69% | | .71% | | .70% | | .70% | | .69% |
| Expenses net of fee waivers, if any | | 69% | | .71% | | .70% | | .70% | | .69% |
| Expenses net of all reductions | | 64% | | .68% | | .68% | | .63% | | .62% |
| Net investment income (loss) | | 50% | | .03% | | —% | | .51% | | 1.06% |
| Supplemental Data | | | | | | | | | | |
| Net assets, end of period (000 omitted) | | $1,276,302 | | $ 979,533 | | $ 678,480 | | $ 499,557 | | $ 574,934 |
| Portfolio turnover rate | | 107% | | 55% | | 51% | | 135% | | 144% |
A Total returns do not reflect charges attributable to your insurance company’s separate account. Inclusion of these charges would reduce the total returns shown.
B Total returns would have been lower had certain expenses not been reduced during the periods shown.
C Calculated based on average shares outstanding during the period.
D Investment income per share reflects a special dividend which amounted to $.04 per share. Excluding the special dividend, the ratio of net investment income to average net assets would have been .36%.
E Expense ratios reflect operating expenses of the class. Expenses before reductions do not reflect amounts reimbursed by the investment adviser or reductions from brokerage service arrangements or other expense offset arrangements and do not
represent the amount paid by the class during periods when reimbursements or reductions occur. Expenses net of fee waivers reflect expenses after reimbursement by the investment adviser but prior to reductions from brokerage service arrange
ments or other expense offset arrangements. Expenses net of all reductions represent the net expenses paid by the class.
F Amount represents less than $.01 per share.
G As the result of a correction made in the classification of distributions received on securities representing realized gains for the year ended December 31, 2003, amounts previously reported have been reclassified. The impact of this correction was a
decrease in net investment loss of $0.01 per share and a corresponding decrease in net realized and unrealized gain (loss). The ratio of net investment loss to average net assets decreased from (0.04)% to 0.00% . The reclassification had no
impact on total net assets or total return of the class.
|
| Financial Highlights Service Class | | | | | | | | | | |
| Years ended December 31, | | 2005 | | 2004 | | 2003F | | 2002 | | 2001 |
| Selected Per Share Data | | | | | | | | | | |
| Net asset value, beginning of period | | $ 30.07 | | $ 24.10 | | $ 17.46 | | $ 19.54 | | $ 20.22 |
| Income from Investment Operations | | | | | | | | | | |
| Net investment income (loss)C | | 12D | | (.02) | | (.02) | | .08 | | .18 |
| Net realized and unrealized gain (loss) | | 5.27 | | 5.99 | | 6.72 | | (2.00) | | (.86) |
| Total from investment operations | | 5.39 | | 5.97 | | 6.70 | | (1.92) | | (.68) |
| Distributions from net investment income | | — | | — | | (.06) | | (.16) | | — |
| Distributions from net realized gain | | (.51) | | — | | — | | — | | — |
| Total distributions | | (.51) | | — | | (.06) | | (.16) | | — |
| Net asset value, end of period | | $ 34.95 | | $ 30.07 | | $ 24.10 | | $ 17.46 | | $ 19.54 |
| Total ReturnA,B | | 18.20% | | 24.77% | | 38.52% | | (9.90)% | | (3.36)% |
| Ratios to Average Net AssetsE | | | | | | | | | | |
| Expenses before reductions | | 79% | | .81% | | .80% | | .80% | | .79% |
| Expenses net of fee waivers, if any | | 79% | | .81% | | .80% | | .80% | | .79% |
| Expenses net of all reductions | | 74% | | .78% | | .78% | | .73% | | .72% |
| Net investment income (loss) | | 40% | | (.07)% | | (.10)% | | .41% | | .96% |
| Supplemental Data | | | | | | | | | | |
| Net assets, end of period (000 omitted) | | $ 990,561 | | $ 819,412 | | $ 580,179 | | $ 378,264 | | $ 366,665 |
| Portfolio turnover rate | | 107% | | 55% | | 51% | | 135% | | 144% |
A Total returns do not reflect charges attributable to your insurance company’s separate account. Inclusion of these charges would reduce the total returns shown.
B Total returns would have been lower had certain expenses not been reduced during the periods shown.
C Calculated based on average shares outstanding during the period.
D Investment income per share reflects a special dividend which amounted to $.04 per share. Excluding the special dividend, the ratio of net investment income to average net assets would have been .26%.
E Expense ratios reflect operating expenses of the class. Expenses before reductions do not reflect amounts reimbursed by the investment adviser or reductions from brokerage service arrangements or other expense offset arrangements and do not
represent the amount paid by the class during periods when reimbursements or reductions occur. Expenses net of fee waivers reflect expenses after reimbursement by the investment adviser but prior to reductions from brokerage service arrange
ments or other expense offset arrangements. Expenses net of all reductions represent the net expenses paid by the class.
F As the result of a correction made in the classification of distributions received on securities representing realized gains for the year ended December 31, 2003, amounts previously reported have been reclassified. The impact of this correction was a
decrease in net investment loss of $0.01 per share and a corresponding decrease in net realized and unrealized gain (loss). The ratio of net investment loss to average net assets decreased from (0.14)% to (0.10)% . The reclassification had no
impact on total net assets or total return of the class.
|
See accompanying notes which are an integral part of the financial statements.
|
35 Annual Report
| Financial Highlights Service Class 2 | | | | | | | | | | |
| Years ended December 31, | | 2005 | | 2004 | | 2003F | | 2002 | | 2001 |
| Selected Per Share Data | | | | | | | | | | |
| Net asset value, beginning of period | | $ 29.88 | | $ 23.98 | | $ 17.39 | | $ 19.49 | | $ 20.20 |
| Income from Investment Operations | | | | | | | | | | |
| Net investment income (loss)C | | 08D | | (.06) | | (.05) | | .05 | | .15 |
| Net realized and unrealized gain (loss) | | 5.22 | | 5.96 | | 6.69 | | (1.99) | | (.86) |
| Total from investment operations | | 5.30 | | 5.90 | | 6.64 | | (1.94) | | (.71) |
| Distributions from net investment income | | — | | — | | (.05) | | (.16) | | — |
| Distributions from net realized gain | | (.51) | | — | | — | | — | | — |
| Total distributions | | (.51) | | — | | (.05) | | (.16) | | — |
| Net asset value, end of period | | $ 34.67 | | $ 29.88 | | $ 23.98 | | $ 17.39 | | $ 19.49 |
| Total ReturnA,B | | 18.02% | | 24.60% | | 38.31% | | (10.02)% | | (3.51)% |
| Ratios to Average Net AssetsE | | | | | | | | | | |
| Expenses before reductions | | 94% | | .96% | | .95% | | .95% | | .94% |
| Expenses net of fee waivers, if any | | 94% | | .96% | | .95% | | .95% | | .94% |
| Expenses net of all reductions | | 89% | | .93% | | .93% | | .88% | | .88% |
| Net investment income (loss) | | 26% | | (.22)% | | (.25)% | | .25% | | .81% |
| Supplemental Data | | | | | | | | | | |
| Net assets, end of period (000 omitted) | | $3,542,952 | | $2,201,298 | | $1,177,574 | | $ 520,933 | | $ 210,356 |
| Portfolio turnover rate | | 107% | | 55% | | 51% | | 135% | | 144% |
A Total returns do not reflect charges attributable to your insurance company’s separate account. Inclusion of these charges would reduce the total returns shown.
B Total returns would have been lower had certain expenses not been reduced during the periods shown.
C Calculated based on average shares outstanding during the period.
D Investment income per share reflects a special dividend which amounted to $.05 per share. Excluding the special dividend, the ratio of net investment income to average net assets would have been .11%.
E Expense ratios reflect operating expenses of the class. Expenses before reductions do not reflect amounts reimbursed by the investment adviser or reductions from brokerage service arrangements or other expense offset arrangements and do not
represent the amount paid by the class during periods when reimbursements or reductions occur. Expenses net of fee waivers reflect expenses after reimbursement by the investment adviser but prior to reductions from brokerage service arrange
ments or other expense offset arrangements. Expenses net of all reductions represent the net expenses paid by the class.
F As the result of a correction made in the classification of distributions received on securities representing realized gains for the year ended December 31, 2003, amounts previously reported have been reclassified. The impact of this correction was a
decrease in net investment loss of $0.01 per share and a corresponding decrease in net realized and unrealized gain (loss). The ratio of net investment loss to average net assets decreased from (0.29)% to (0.25)% . The reclassification had no
impact on total net assets or total return of the class.
|
| Financial Highlights Investor Class | | |
| Year ended December 31, | | 2005G |
| Selected Per Share Data | | |
| Net asset value, beginning of period | | $ 31.81 |
| Income from Investment Operations | | |
| Net investment income (loss)E | | 07F |
| Net realized and unrealized gain (loss) | | 3.20 |
| Total from investment operations | | 3.27 |
| Net asset value, end of period | | $ 35.08 |
| Total ReturnB,C,D | | 10.28% |
| Ratios to Average Net AssetsH | | |
| Expenses before reductions | | 86%A |
| Expenses net of fee waivers, if any | | 86%A |
| Expenses net of all reductions | | 80%A |
| Net investment income (loss) | | 45%A |
| Supplemental Data | | |
| Net assets, end of period (000 omitted) | | $ 50,760 |
| Portfolio turnover rate | | 107% |
A Annualized
B Total returns for periods of less than one year are not annualized.
C Total returns do not reflect charges attributable to your insurance company’s separate account. Inclusion of these charges would reduce the total returns shown.
D Total returns would have been lower had certain expenses not been reduced during the periods shown.
E Calculated based on average shares outstanding during the period.
F Investment income per share reflects a special dividend which amounted to $.04 per share. Excluding the special dividend, the ratio of net investment income to average net assets would have been .17%.
G For the period July 21, 2005 (commencement of sale of shares) to December 31, 2005.
H Expense ratios reflect operating expenses of the class. Expenses before reductions do not reflect amounts reimbursed by the investment adviser or reductions from brokerage service arrangements or other expense offset arrangements and do not
represent the amount paid by the class during periods when reimbursements or reductions occur. Expense ratios before reductions for start up periods may not be representative of longer term operating periods. Expenses net of fee waivers reflect
expenses after reimbursement by the investment adviser but prior to reductions from brokerage service arrangements or other expense offset arrangements. Expenses net of all reductions represent the net expenses paid by the class.
|
See accompanying notes which are an integral part of the financial statements.
| | |
| VIP Mid Cap Portfolio | | 36 |
Notes to Financial Statements
For the period ended December 31, 2005
|
1. Significant Accounting Policies.
|
VIP Mid Cap Portfolio (the fund) is a fund of Variable Insurance Products Fund III (the trust) (referred to in this report as Fidelity Variable Insurance Products: Mid Cap Portfolio) and is authorized to issue an unlimited number of shares. The trust is registered under the Investment Company Act of 1940, as amended (the 1940 Act), as an open end management investment company organized as a Massachusetts business trust. Shares of the fund may only be purchased by insurance companies for the purpose of funding variable annuity or variable life insurance contracts. The fund offers the following classes of shares: Initial Class shares, Service Class shares, Service Class 2 shares and Investor Class shares. The fund commenced sale of Investor Class shares on July 21, 2005. All classes have equal rights and voting privileges, except for matters affecting a single class. Investment income, realized and unrealized capital gains and losses, the common expenses of the fund, and certain fund level expense reductions, if any, are allocated on a pro rata basis to each class based on the relative net assets of each class to the total net assets of the fund. Each class differs with respect to transfer agent and distribution and service plan fees incurred. Certain expense reductions also differ by class.
The fund may invest in affiliated money market central funds (Money Market Central Funds) which are open end investment companies available to investment companies and other accounts managed by Fidelity Management & Research Company (FMR) and its affiliates. The financial statements have been prepared in conformity with accounting principles generally accepted in the United States of America, which require management to make certain estimates and assumptions at the date of the financial statements. The following summarizes the significant accounting policies of the fund:
Security Valuation. Investments are valued and net asset value (NAV) per share is calculated (NAV calculation) as of the close of business of the New York Stock Exchange (NYSE), normally 4:00 p.m. Eastern time. Wherever possible, the fund uses independent pricing services approved by the Board of Trustees to value its investments.
Equity securities, including restricted securities, for which market quotations are readily available, are valued at the last reported sale price or official closing price as reported by an independent pricing service on the primary market or exchange on which they are traded. In the event there were no sales during the day or closing prices are not available, securities are valued at the last quoted bid price. Investments in open end mutual funds, are valued at their closing net asset value each business day. Short term securities with remaining maturities of sixty days or less for which quotations are not readily available are valued at amortized cost, which approximates value.
When current market prices or quotations are not readily available or do not accurately reflect fair value, valuations may be determined in accordance with procedures adopted by the Board of Trustees. For example, when developments occur between the close of a market and the close of the NYSE that may materially affect the value of some or all of the securities, or when trading in a security is halted, those securities may be fair valued. Factors used in the determination of fair value may include monitoring news to identify significant market or security specific events such as changes in the value of U.S. securities markets, reviewing developments in foreign markets and evaluating the performance of ADRs, futures contracts and exchange-traded funds. Because the fund’s utilization of fair value pricing depends on market activity, the frequency with which fair value pricing is used can not be predicted and may be utilized to a significant extent. The value of securities used for NAV calculation under fair value pricing may differ from published prices for the same securities.
Foreign Currency. The fund uses foreign currency contracts to facilitate transactions in foreign denominated securities. Losses from these transac tions may arise from changes in the value of the foreign currency or if the counterparties do not perform under the contracts’ terms.
Foreign denominated assets, including investment securities, and liabilities are translated into U.S. dollars at the exchange rate at period end. Pur chases and sales of investment securities, income and dividends received and expenses denominated in foreign currencies are translated into U.S. dollars at the exchange rate in effect on the transaction date.
The effects of exchange rate fluctuations on investments are included with the net realized and unrealized gain (loss) on investment securities. Other foreign currency transactions resulting in realized and unrealized gain (loss) are disclosed separately.
Investment Transactions and Income. Security transactions are accounted for as of trade date. Gains and losses on securities sold are determined on the basis of identified cost and may include proceeds received from litigation. Dividend income is recorded on the ex dividend date, except for certain dividends from foreign securities where the ex dividend date may have passed, which are recorded as soon as the fund is informed of the ex dividend date. Non cash dividends included in dividend income, if any, are recorded at the fair market value of the securities received. Distributions received on securities that represent a return of capital or capital gain are recorded as a reduction of cost of investments and/or as a realized gain. The fund estimates the components of distributions received that may be considered return of capital distributions or capital gain distributions. Large, non recurring dividends recognized by the fund are presented separately on the Statement of Operations as “Special Dividends” and the impact of these dividends is presented in the Financial Highlights. Interest income is accrued as earned. Interest income includes coupon interest and amortization of premium and accretion of discount on debt securities. Investment income is recorded net of foreign taxes withheld where recovery of such taxes is uncertain.
37 Annual Report
Notes to Financial Statements continued
1. Significant Accounting Policies continued
Expenses. Most expenses of the trust can be directly attributed to a fund. Expenses which cannot be directly attributed are apportioned among each fund in the trust.
Income Tax Information and Distributions to Shareholders. Each year, the fund intends to qualify as a regulated investment company by distrib uting all of its taxable income and realized gains under Subchapter M of the Internal Revenue Code. As a result, no provision for income taxes is required in the accompanying financial statements. Foreign taxes are provided for based on the fund’s understanding of the tax rules and rates that exist in the foreign markets in which it invests.
Distributions are recorded on the ex dividend date. Income dividends and capital gain distributions are declared separately for each class. Income and capital gain distributions are determined in accordance with income tax regulations, which may differ from generally accepted accounting principles.
Capital accounts within the financial statements are adjusted for permanent book tax differences. These adjustments have no impact on net assets or the results of operations. Temporary book tax differences will reverse in a subsequent period.
Book tax differences are primarily due to foreign currency transactions, passive foreign investment companies (PFIC), partnerships, and losses deferred due to wash sales.
The tax basis components of distributable earnings and the federal tax cost as of period end were as follows:
| | | | |
| Unrealized appreciation | | | $ | 1,296,010,250 | | |
| Unrealized depreciation | | | | (80,825,730) | | |
| Net unrealized appreciation (depreciation) | | | | 1,215,184,520 | | |
| Undistributed ordinary income | | | | 83,848,087 | | |
| Undistributed long term capital gain | | | | 678,557,878 | | |
| |
| Cost for federal income tax purposes | | | $ | 4,786,693,873 | | |
| |
| The tax character of distributions paid was as follows: | | | | | | |
| | | | | December 31, 2005 | | December 31, 2004 |
| Long term Capital Gains | | | | 69,737,263 | | — |
| |
| |
| 2. Operating Policies. | | | | | | |
Repurchase Agreements. FMR has received an Exemptive Order from the Securities and Exchange Commission (the SEC) which permits the fund and other affiliated entities of FMR to transfer uninvested cash balances into joint trading accounts which are then invested in repurchase agreements. The fund may also invest directly with institutions in repurchase agreements. Repurchase agreements are collateralized by government or non government securities. Collateral is held in segregated accounts with custodian banks and may be obtained in the event of a default of the counterparty. The fund monitors, on a daily basis, the value of the collateral to ensure it is at least equal to the principal amount of the repurchase agreement (in cluding accrued interest). In the event of a default by the counterparty, realization of the collateral proceeds could be delayed, during which time the value of the collateral may decline.
Restricted Securities. The fund may invest in securities that are subject to legal or contractual restrictions on resale. These securities generally may be resold in transactions exempt from registration or to the public if the securities are registered. Disposal of these securities may involve time consuming negotiations and expense, and prompt sale at an acceptable price may be difficult. Information regarding restricted securities is included at the end of the fund’s Schedule of Investments.
3. Purchases and Sales of Investments.
Purchases and sales of securities, other than short term securities and U.S. government securities, aggregated $5,584,008,960 and $4,757,779,886, respectively.
4. Fees and Other Transactions with Affiliates.
|
Management Fee. FMR and its affiliates provide the fund with investment management related services for which the fund pays a monthly manage ment fee. The management fee is the sum of an individual fund fee rate that is based on an annual rate of .30% of the fund’s average net assets and a group fee rate that averaged .27% during the period. The group fee rate is based upon the average net assets of all the mutual funds advised by FMR. The group fee rate decreases as assets under management increase and increases as assets under management decrease. For the period, the total annual management fee rate was .57% of the fund’s average net assets.
Distribution and Service Plan. In accordance with Rule 12b 1 of the 1940 Act, the fund has adopted separate 12b 1 Plans for each Service Class of shares. Each Service Class pays Fidelity Distributors Corporation (FDC), an affiliate of FMR, a service fee. For the period, the service fee is based on an annual rate of .10% of Service Class’ average net assets and .25% of Service Class 2’s average net assets.
For the period, each class paid FDC the following amounts, all of which were re-allowed to insurance companies for the distribution of shares and providing shareholder support services:
| Service Class | | | $ | 878,432 |
| Service Class 2 | | | | 6,875,665 |
| | | | $ | 7,754,097 |
Transfer Agent Fees. Fidelity Investments Institutional Operations Company, Inc. (FIIOC), an affiliate of FMR, is the fund’s transfer, dividend disbursing, and shareholder servicing agent. FIIOC receives an asset based fee with respect to each class. FIIOC pays a portion of the expenses related to the typesetting, printing and mailing of shareholder reports, except proxy statements. Each class with the exception of Investor Class pays a transfer agent fee, excluding out of pocket expenses, equal to an annual rate of ..07% of their month end net assets. Investor Class pays an asset based transfer agent fee of .18% of its month end net assets. The total transfer agent fees paid by each class to FIIOC, including out of pocket expenses, were as follows:
| Initial Class | | | $ | 742,170 |
| Service Class | | | | 589,485 |
| Service Class 2 | | | | 1,868,585 |
| Investor Class | | | | 17,251 |
| | | | $ | 3,217,491 |
Accounting and Security Lending Fees. Fidelity Service Company, Inc. (FSC), an affiliate of FMR, maintains the fund’s accounting records. The accounting fee is based on the level of average net assets for the month. Under a separate contract, FSC administers the security lending program. The security lending fee is based on the number and duration of lending transactions.
Affiliated Central Funds. The fund may invest in Money Market Central Funds which seek preservation of capital and current income and are managed by Fidelity Investments Money Management, Inc. (FIMM), an affiliate of FMR.
The Money Market Central Funds do not pay a management fee.
|
Brokerage Commissions. The fund placed a portion of its portfolio transactions with brokerage firms which are affiliates of the investment adviser. The commissions paid to these affiliated firms were $283,889 for the period.
5. Committed Line of Credit.
|
The fund participates with other funds managed by FMR in a $4.2 billion credit facility (the “line of credit”) to be utilized for temporary or emergency purposes to fund shareholder redemptions or for other short term liquidity purposes. The fund has agreed to pay commitment fees on its pro rata portion of the line of credit. During the period, there were no borrowings on this line of credit.
The fund lends portfolio securities from time to time in order to earn additional income. On the settlement date of the loan, the fund receives collateral (in the form of U.S. Treasury obligations, letters of credit and/or cash) against the loaned securities and maintains collateral in an amount not less than 100% of the market value of the loaned securities during the period of the loan. The market value of the loaned securities is determined at the close of business of the fund and any additional required collateral is delivered to the fund on the next business day. If the borrower defaults on its obligation to return the securities loaned because of insolvency or other reasons, a fund could experience delays and costs in recovering the securities loaned or in gaining access to the collateral. Any cash collateral received is invested in the Fidelity Securities Lending Cash Central Fund. The value of loaned securities and cash collateral at period end are disclosed on the fund’s Statement of Assets and Liabilities. Security lending income represents the income earned on investing cash collateral, less fees and expenses associated with the loan, plus any premium payments that may be received on the loan of certain types of securities.
39 Annual Report
| Notes to Financial Statements continued |
7. Expense Reductions. | | |
Many of the brokers with whom FMR places trades on behalf of the fund provided services to the fund in addition to trade execution. These services included payments of certain expenses on behalf of the fund totaling $2,720,642 for the period. In addition, through arrangements with the fund’s custodian, credits realized as a result of uninvested cash balances were used to reduce the fund’s expenses. During the period, these credits reduced the fund’s custody expenses by $21,864.
The fund’s organizational documents provide former and current trustees and officers with a limited indemnification against liabilities arising in connection with the performance of their duties to the fund. In the normal course of business, the fund may also enter into contracts that provide general indemnifications. The fund’s maximum exposure under these arrangements is unknown as this would be dependent on future claims that may be made against the fund. The risk of material loss from such claims is considered remote.
At the end of the period, FMR or its affiliates were the owners of record of 16% of the total outstanding shares of the fund and one of otherwise unaffili ated shareholders were the owners of record of 30% of the total outstanding shares of the fund.
| 9. Distributions to Shareholders. | | | | | | | | | | |
| |
| Distributions to shareholders of each class were as follows: | | | | | | | | | | |
| |
| Years ended December 31, | | | | | | 2005 | | | | 2004 |
| From net realized gain | | | | | | | | | | |
| Initial Class | | | | | $ | 16,950,069 | | | $ | — |
| Service Class | | | | | | 13,863,435 | | | | — |
| Service Class 2 | | | | | | 38,923,759 | | | | — |
| Total | | | | | $ | 69,737,263 | | | $ | — |
| |
| 10. Share Transactions. | | | | | | | | | | |
| |
Transactions for each class of shares were as follows:
| | | | | | | | | | |
| | | Shares | | Dollars |
| | | Year ended | | Year ended | | Year ended | | | | Year ended |
| | | December 31, 2005 | | December 31, 2004 | | December 31, 2005 | | | | | | December 31, 2004 |
| Initial Class | | | | | | | | | | |
| Shares sold | | 8,278,806 | | 7,712,308 | | $ 262,377,760 | | | $ | 203,215,754 |
| Reinvestment of distributions | | 562,378 | | — | | 16,950,069 | | | | — |
| Shares redeemed | | (4,945,419) | | (3,341,075) | | (156,829,367) | | | | (83,674,683) |
| Net increase (decrease) | | 3,895,765 | | 4,371,233 | | $ 122,498,462 | | | $ | 119,541,071 |
| Service Class | | | | | | | | | | |
| Shares sold | | 2,901,802 | | 4,751,291 | | $ 90,813,964 | | | $ | 122,478,823 |
| Reinvestment of distributions | | 461,807 | | — | | 13,863,435 | | | | — |
| Shares redeemed | | (2,267,171) | | (1,581,671) | | (70,846,869) | | | | (40,224,756) |
| Net increase (decrease) | | 1,096,438 | | 3,169,620 | | $ 33,830,530 | | | $ | 82,254,067 |
| Service Class 2 | | | | | | | | | | |
| Shares sold | | 32,986,707 | | 29,867,543 | | $ 1,030,668,046 | | | $ | 766,867,153 |
| Reinvestment of distributions | | 1,305,290 | | — | | 38,923,759 | | | | — |
| Shares redeemed | | (5,764,389) | | (5,307,215) | | (179,268,926) | | | | (132,698,097) |
| Net increase (decrease) | | 28,527,608 | | 24,560,328 | | $ 890,322,879 | | | $ | 634,169,056 |
| Investor ClassA | | | | | | | | | | |
| Shares sold | | 1,448,928 | | — | | $ 48,632,982 | | | $ | — |
| Shares redeemed | | (2,028) | | — | | (69,529) | | | | — |
| Net increase (decrease) | | 1,446,900 | | — | | $ 48,563,453 | | | $ | — |
| |
| A Share transactions for Investor Class are for the period July 21, 2005 (commencement of sale of shares) to December 31, 2005 | | | | | | | | |
Report of Independent Registered Public Accounting Firm
To the Trustees of Variable Insurance Products Fund III and the Shareholders of VIP Mid Cap Portfolio:
In our opinion, the accompanying statement of assets and liabilities, including the schedule of investments, and the related statements of operations and of changes in net assets and the financial highlights present fairly, in all material respects, the financial position of VIP Mid Cap Portfolio (a fund of Variable Insurance Products Fund III) at December 31, 2005 and the results of its operations, the changes in its net assets and the financial high lights for the periods indicated, in conformity with accounting principles generally accepted in the United States of America. These financial statements and financial highlights (hereafter referred to as “financial statements”) are the responsibility of the VIP Mid Cap Portfolio’s management; our responsibility is to express an opinion on these financial statements based on our audits. We conducted our audits of these financial statements in accordance with the standards of the Public Company Accounting Oversight Board (United States). Those standards require that we plan and perform the audit to obtain reasonable assurance about whether the financial statements are free of material misstatement. An audit includes examining, on a test basis, evidence supporting the amounts and disclosures in the financial statements, assessing the accounting principles used and significant estimates made by management, and evaluating the overall financial statement presentation. We believe that our audits, which included confirmation of securities at December 31, 2005 by correspondence with the custodian and brokers, provide a reasonable basis for our opinion.
/s/ PricewaterhouseCoopers LLP
PricewaterhouseCoopers LLP
Boston, Massachusetts
February 17, 2006
|
41 Annual Report
The Trustees, Member of the Advisory Board, and executive officers of the trust and fund, as applicable, are listed below. The Board of Trustees governs the fund and is responsible for protecting the interests of shareholders. The Trustees are experienced executives who meet periodically throughout the year to oversee the fund’s activities, review contractual arrangements with companies that provide services to the fund, and review the fund’s performance. Except for William O. McCoy and Albert R. Gamper, Jr., each of the Trustees oversees 326 funds advised by FMR or an affiliate. Mr. McCoy oversees 328 funds advised by FMR or an affiliate. Mr. Gamper oversees 235 funds advised by FMR or an affiliate.
The Trustees hold office without limit in time except that (a) any Trustee may resign; (b) any Trustee may be removed by written instrument, signed by at least two thirds of the number of Trustees prior to such removal; (c) any Trustee who requests to be retired or who has become incapac itated by illness or injury may be retired by written instrument signed by a majority of the other Trustees; and (d) any Trustee may be removed at any special meeting of shareholders by a two thirds vote of the outstanding voting securities of the trust. Each Trustee who is not an interested person (as defined in the 1940 Act) (Independent Trustee), shall retire not later than the last day of the calendar year in which his or her 72nd birthday occurs. The Independent Trustees may waive this mandatory retirement age policy with respect to individual Trustees. The executive officers and Advisory Board Member hold office without limit in time, except that any officer and Advisory Board Member may resign or may be removed by a vote of a majority of the Trustees at any regular meeting or any special meeting of the Trustees. Except as indicated, each individual has held the office shown or other offices in the same company for the past five years.
The fund’s Statement of Additional Information (SAI) includes more information about the Trustees. To request a free copy, call Fidelity at 1-877-208-0098.
Correspondence intended for each Trustee who is an interested person may be sent to Fidelity Investments, 82 Devonshire Street, Boston, Massachusetts 02109.
| | Name, Age; Principal Occupation
Edward C. Johnson 3d (75)
|
Year of Election or Appointment: 1994
Mr. Johnson is Chairman of the Board of Trustees. Mr. Johnson serves as Chief Executive Officer, Chairman, and a Director of FMR Corp.; a Director and Chairman of the Board and of the Executive Committee of FMR; Chairman and a Director of Fidelity Man agement & Research (Far East) Inc.; Chairman and a Director of Fidelity Investments Money Management, Inc.; and Chairman (2001 present) and a Director (2000 present) of FMR Co., Inc.
Year of Election or Appointment: 2005
Mr. Jonas is Senior Vice President of VIP Mid Cap (2005 present). He also serves as Senior Vice President of other Fidelity funds (2005 present). Mr. Jonas is Executive Director of FMR (2005 present). Previously, Mr. Jonas served as President of Fidelity Enter prise Operations and Risk Services (2004 2005), Chief Administrative Officer (2002 2004), and Chief Financial Officer of FMR Co. (1998 2000). Mr. Jonas has been with Fidelity Investments since 1987 and has held various financial and management posi tions including Chief Financial Officer of FMR. In addition, he serves on the Boards of Boston Ballet (2003 present) and Simmons College (2003 present).
Year of Election or Appointment: 2003
Mr. Reynolds is a Director (2003 present) and Chief Operating Officer (2002 present) of FMR Corp. He also serves on the Board at Fidelity Investments Canada, Ltd. (2000 present). Previously, Mr. Reynolds served as President of Fidelity Investments Institutional Retirement Group (1996 2000).
* Trustees have been determined to be “Interested Trustees” by virtue of, among other things, their affiliation with the trust or various entities under common control with FMR.
Correspondence intended for each Independent Trustee (that is, the Trustees other than the Interested Trustees) may be sent to Fidelity Invest ments, P.O. Box 55235, Boston, Massachusetts 02205 5235.
| | Name, Age; Principal Occupation
Dennis J. Dirks (57)
|
Year of Election or Appointment: 2005
Prior to his retirement in May 2003, Mr. Dirks was Chief Operating Officer and a member of the Board of The Depository Trust & Clearing Corporation (DTCC) (1999 2003). He also served as President, Chief Operating Officer, and Board member of The De pository Trust Company (DTC) (1999 2003) and President and Board member of the National Securities Clearing Corporation (NSCC) (1999 2003). In addition, Mr. Dirks served as Chief Executive Officer and Board member of the Government Securities Clearing Corporation (2001 2003) and Chief Executive Officer and Board member of the Mortgage Backed Securities Clearing Corporation (2001 2003). Mr. Dirks also serves as a Trustee of Manhattan College (2005 present).
| | Albert R. Gamper, Jr. (63)
|
Year of Election or Appointment: 2006
Mr. Gamper also serves as a Trustee (2006 present) or Member of the Advisory Board (2005 present) of other investment compa nies advised by FMR. Prior to his retirement in December 2004, Mr. Gamper served as Chairman of the Board of CIT Group Inc. (commercial finance). During his tenure with CIT Group Inc. Mr. Gamper served in numerous senior management positions, includ ing Chairman (1987 1989; 1999 2001; 2002 2004), Chief Executive Officer (1987 2004), and President (1989 2002). He cur rently serves as a member of the Board of Directors of Public Service Enterprise Group (utilities, 2001 present), Chairman of the Board of Governors, Rutgers University (2004 present), and Chairman of the Board of Saint Barnabas Health Care System.
Year of Election or Appointment: 1997
Dr. Gates is Chairman of the Independent Trustees (2006 present). Dr. Gates is President of Texas A&M University (2002 present). He was Director of the Central Intelligence Agency (CIA) from 1991 to 1993. From 1989 to 1991, Dr. Gates served as Assistant to the President of the United States and Deputy National Security Advisor. Dr. Gates is a Director of NACCO Industries, Inc. (mining and manufacturing), Parker Drilling Co., Inc. (drilling and rental tools for the energy industry, 2001 present), and Brinker International (restaurant management, 2003 present). Previously, Dr. Gates served as a Director of LucasVarity PLC (automotive components and diesel engines), a Director of TRW Inc. (automotive, space, defense, and information technology), and Dean of the George Bush School of Government and Public Service at Texas A&M University (1999 2001). Dr. Gates also is a Trustee of the Forum for International Policy.
Year of Election or Appointment: 2004
Dr. Heilmeier is Chairman Emeritus of Telcordia Technologies (communication software and systems), where prior to his retirement, he served as company Chairman and Chief Executive Officer. He currently serves on the Boards of Directors of The Mitre Corpo ration (systems engineering and information technology support for the government), and HRL Laboratories (private research and development, 2004 present). He is Chairman of the General Motors Science & Technology Advisory Board and a Life Fellow of the Institute of Electrical and Electronics Engineers (IEEE) (2000 present). Dr. Heilmeier is a member of the Defense Science Board and the National Security Agency Advisory Board. He is also a member of the National Academy of Engineering, the American Academy of Arts and Sciences, and the Board of Overseers of the School of Engineering and Applied Science of the University of Pennsylvania. Previously, Dr. Heilmeier served as a Director of TRW Inc. (automotive, space, defense, and information technology, 1992 2002), Compaq (1994 2002), Automatic Data Processing, Inc. (ADP) (technology based business outsourcing, 1995 2002), INET Technologies Inc. (telecommunications network surveillance, 2001 2004), and Teletech Holdings (customer management ser vices). He is the recipient of the 2005 Kyoto Prize in Advanced Technology for his invention of the liquid display.
Year of Election or Appointment: 2001
Prior to Ms. Knowles’ retirement in June 2000, she served as Executive Vice President and Chief Financial Officer of Atlantic Rich field Company (ARCO) (diversified energy, 1996 2000). From 1993 to 1996, she was a Senior Vice President of ARCO and President of ARCO Transportation Company. She served as a Director of ARCO from 1996 to 1998. She currently serves as a Director of Phelps Dodge Corporation (copper mining and manufacturing) and McKesson Corporation (healthcare service, 2002 present). Ms. Knowles is a Trustee of the Brookings Institution and the Catalina Island Conservancy and also serves as a member of the Advisory Board for the School of Engineering of the University of Southern California.
43 Annual Report
Trustees and Officers - continued
|
| | Name, Age; Principal Occupation
Ned C. Lautenbach (61)
|
Year of Election or Appointment: 2000
Mr. Lautenbach has been a partner of Clayton, Dubilier & Rice, Inc. (private equity investment firm) since September 1998. Pre viously, Mr. Lautenbach was with the International Business Machines Corporation (IBM) from 1968 until his retirement in 1998. Mr. Lautenbach serves as a Director of Italtel Holding S.p.A. (telecommunications (Milan, Italy), 2004 present) and Eaton Corpora tion (diversified industrial) as well as the Philharmonic Center for the Arts in Naples, Florida. He also is a member of the Board of Trustees of Fairfield University (2005 present), as well as a member of the Council on Foreign Relations.
Year of Election or Appointment: 1997
Prior to his retirement in December 1994, Mr. McCoy was Vice Chairman of the Board of BellSouth Corporation (telecommunica tions) and President of BellSouth Enterprises. He is currently a Director of Liberty Corporation (holding company), Duke Realty Cor poration (real estate), and Progress Energy, Inc. (electric utility). He is also a partner of Franklin Street Partners (private investment management firm) and a member of the Research Triangle Foundation Board. In addition, Mr. McCoy served as the Interim Chan cellor (1999 2000) and a member of the Board of Visitors for the University of North Carolina at Chapel Hill and currently serves on the Board of Directors of the University of North Carolina Health Care System and the Board of Visitors of the Kenan Flagler Business School (University of North Carolina at Chapel Hill). He also served as Vice President of Finance for the University of North Carolina (16 school system).
Year of Election or Appointment: 2005
Ms. Small is a member (2000 present) and Chairperson (2002 present) of the Investment Committee, and a member (2002 present) of the Board of Trustees of Smith College. Previously, she served as Chief Investment Officer (1999 2000), Director of Global Equity Investments (1996 1999), and a member of the Board of Directors of Scudder, Stevens & Clark (1990 1997) and Scudder Kemper Investments (1997 1998). In addition, Ms. Small served as Co Chair (2000 2003) of the Annual Fund for the Fletcher School of Law and Diplomacy.
| | William S. Stavropoulos (66)
|
Year of Election or Appointment: 2002
Mr. Stavropoulos is Chairman of the Board (2000 present) and a Member of the Board of Directors of The Dow Chemical Com pany. Since joining The Dow Chemical Company in 1967, Mr. Stavropoulos served in numerous senior management positions, including President (1993 2000; 2002 2003), CEO (1995 2000; 2002 2004), and Chairman of the Executive Committee (2000 2004). Currently, he is a Director of NCR Corporation (data warehousing and technology solutions), BellSouth Corporation (telecommunications), Chemical Financial Corporation, Maersk Inc. (industrial conglomerate, 2002 present), and Metalmark Capi tal (private equity investment firm, 2005 present). He also serves as a member of the Board of Trustees of the American Enterprise Institute for Public Policy Research. In addition, Mr. Stavropoulos is a member of The Business Council, J.P. Morgan International Council and the University of Notre Dame Advisory Council for the College of Science.
Year of Election or Appointment: 2005
Prior to his retirement in 2001, Mr. Wolfe was Chairman and Chief Executive Officer of Hershey Foods Corporation (1993 2001). He currently serves as a member of the boards of Adelphia Communications Corporation (2003 present), Bausch & Lomb, Inc., and Revlon Inc. (2004 present).
Advisory Board Member and Executive Officers:
Correspondence intended for each executive officer and Mr. Lynch may be sent to Fidelity Investments, 82 Devonshire Street, Boston, Massachu setts 02109.
| | Name, Age; Principal Occupation
Peter S. Lynch (61)
|
Year of Election or Appointment: 2003
Member of the Advisory Board of Variable Insurance Products Fund III. Vice Chairman and a Director of FMR, and Vice Chairman (2001 present) and a Director (2000 present) of FMR Co., Inc. Previously, Mr. Lynch served as a Trustee of the Fidelity funds (1990 2003). In addition, he serves as a Trustee of Boston College, Massachusetts Eye & Ear Infirmary, Historic Deerfield, John F. Kennedy Library, and the Museum of Fine Arts of Boston.
Name, Age; Principal Occupation
Dwight D. Churchill (52)
|
Year of Election or Appointment: 2005
Vice President of VIP Mid Cap. Mr. Churchill also serves as Vice President of certain Equity Funds (2005 present) and certain High Income Funds (2005 present). Previously, he served as Head of Fidelity’s Fixed Income Division (2000 2005), Vice President of Fidelity’s Money Market Funds (2000 2005), Vice President of Fidelity’s Bond Funds, and Senior Vice President of FIMM (2000) and FMR. Mr. Churchill joined Fidelity in 1993 as Vice President and Group Leader of Taxable Fixed Income Investments.
Year of Election or Appointment: 2003
Vice President of VIP Mid Cap. Mr. Allen also serves as Vice President of another fund advised by FMR. Prior to assuming his current responsibilities, Mr. Allen worked as a research analyst and portfolio manager. Mr. Allen also serves as Vice President of FMR (2002) and FMR Co., Inc. (2002).
Year of Election or Appointment: 1998
Secretary of VIP Mid Cap. He also serves as Secretary of other Fidelity funds; Vice President, General Counsel, and Secretary of FMR Co., Inc. (2001 present) and FMR; Assistant Secretary of Fidelity Management & Research (U.K.) Inc. (2001 present), Fidelity Management & Research (Far East) Inc. (2001 present), and Fidelity Investments Money Management, Inc. (2001 present). Mr. Roiter is an Adjunct Member, Faculty of Law, at Boston College Law School (2003 present). Previously, Mr. Roiter served as Vice President and Secretary of Fidelity Distributors Corporation (FDC) (1998 2005).
Year of Election or Appointment: 2003
Assistant Secretary of VIP Mid Cap. Mr. Fross also serves as Assistant Secretary of other Fidelity funds (2003 present), Vice President and Secretary of FDC (2005 present), and is an employee of FMR.
Year of Election or Appointment: 2004
President, Treasurer, and Anti Money Laundering (AML) officer of VIP Mid Cap. Ms. Reynolds also serves as President, Treasurer, and AML officer of other Fidelity funds (2004) and is a Vice President (2003) and an employee (2002) of FMR. Before joining Fidelity Investments, Ms. Reynolds worked at PricewaterhouseCoopers LLP (PwC) (1980 2002), where she was most recently an audit partner with PwC’s investment management practice.
Year of Election or Appointment: 2005
Chief Financial Officer of VIP Mid Cap. Mr. Murphy also serves as Chief Financial Officer of other Fidelity funds (2005 present). He also serves as Senior Vice President of Fidelity Pricing and Cash Management Services Group (FPCMS).
Kenneth A. Rathgeber (58)
|
Year of Election or Appointment: 2004
Chief Compliance Officer of VIP Mid Cap. Mr. Rathgeber also serves as Chief Compliance Officer of other Fidelity funds (2004) and Executive Vice President of Risk Oversight for Fidelity Investments (2002). Previously, he served as Executive Vice President and Chief Operating Officer for Fidelity Investments Institutional Services Company, Inc. (1998 2002).
Year of Election or Appointment: 2003
Deputy Treasurer of VIP Mid Cap. Mr. Hebble also serves as Deputy Treasurer of other Fidelity funds (2003), and is an employee of FMR. Before joining Fidelity Investments, Mr. Hebble worked at Deutsche Asset Management where he served as Director of Fund Accounting (2002 2003) and Assistant Treasurer of the Scudder Funds (1998 2003).
Year of Election or Appointment: 2005
Deputy Treasurer of VIP Mid Cap. Mr. Mehrmann also serves as Deputy Treasurer of other Fidelity funds (2005 present) and is an employee of FMR. Previously, Mr. Mehrmann served as Vice President of Fidelity Investments Institutional Services Group (FIIS)/ Fidelity Investments Institutional Operations Corporation, Inc. (FIIOC) Client Services (1998 2004).
45 Annual Report
Trustees and Officers - continued
|
| | Name, Age; Principal Occupation
Kimberley H. Monasterio (42)
|
Year of Election or Appointment: 2004
Deputy Treasurer of VIP Mid Cap. Ms. Monasterio also serves as Deputy Treasurer of other Fidelity funds (2004) and is an em ployee of FMR (2004). Before joining Fidelity Investments, Ms. Monasterio served as Treasurer (2000 2004) and Chief Financial Officer (2002 2004) of the Franklin Templeton Funds and Senior Vice President of Franklin Templeton Services, LLC (2000 2004).
Year of Election or Appointment: 2005
Deputy Treasurer of VIP Mid Cap. Mr. Robins also serves as Deputy Treasurer of other Fidelity funds (2005 present) and is an employee of FMR (2004 present). Before joining Fidelity Investments, Mr. Robins worked at KPMG LLP, where he was a partner in KPMG’s department of professional practice (2002 2004) and a Senior Manager (1999 2000). In addition, Mr. Robins served as Assistant Chief Accountant, United States Securities and Exchange Commission (2000 2002).
Year of Election or Appointment: 2005
Assistant Treasurer of VIP Mid Cap. Mr. Byrnes also serves as Assistant Treasurer of other Fidelity funds (2005 present) and is an employee of FMR (2005 present). Previously, Mr. Byrnes served as Vice President of FPCMS (2003 2005). Before joining Fidelity Investments, Mr. Byrnes worked at Deutsche Asset Management where he served as Vice President of the Investment Operations Group (2000 2003).
Year of Election or Appointment: 1998
Assistant Treasurer of VIP Mid Cap. Mr. Costello also serves as Assistant Treasurer of other Fidelity funds and is an employee of FMR.
Year of Election or Appointment: 2004
Assistant Treasurer of VIP Mid Cap. Mr. Lydecker also serves as Assistant Treasurer of other Fidelity funds (2004) and is an employee of FMR.
Year of Election or Appointment: 2002
Assistant Treasurer of VIP Mid Cap. Mr. Osterheld also serves as Assistant Treasurer of other Fidelity funds (2002) and is an employee of FMR.
Year of Election or Appointment: 2005
Assistant Treasurer of VIP Mid Cap. Mr. Ryan also serves as Assistant Treasurer of other Fidelity funds (2005 present) and is an employee of FMR (2005 present). Previously, Mr. Ryan served as Vice President of Fund Reporting in FPCMS (1999 2005).
Year of Election or Appointment: 2005
Assistant Treasurer of VIP Mid Cap. Mr. Schiavone also serves as Assistant Treasurer of other Fidelity funds (2005 present) and is an employee of FMR (2005 present). Before joining Fidelity Investments, Mr. Schiavone worked at Deutsche Asset Management, where he most recently served as Assistant Treasurer (2003 2005) of the Scudder Funds and Vice President and Head of Fund Reporting (1996 2003).
The Board of Trustees of VIP Mid Cap Portfolio voted to pay to shareholders of record at the opening of business on record date, the following distributions per share derived from capital gains realized from sales of portfolio securities, and dividends derived from net investment income:
| | | Pay Date | | Record Date | | Dividends | | Capital Gains |
| Initial Class | | 02/10/06 | | 02/10/06 | | $.128 | | $4.334 |
| Service Class | | 02/10/06 | | 02/10/06 | | $.096 | | $4.334 |
| Service Class 2 | | 02/10/06 | | 02/10/06 | | $.065 | | $4.334 |
| Investor Class | | 02/10/06 | | 02/10/06 | | $.139 | | $4.334 |
The fund hereby designates as a capital gain dividend with respect to the taxable year ended December 31, 2005, $679,551,138 or, if subse quently determined to be different, the net capital gain of such year.
The fund will notify shareholders in January 2006 of amounts for use in preparing 2005 income tax returns.
47 Annual Report
Board Approval of Investment Advisory Contracts and Management Fees
Each year, typically in July, the Board of Trustees, including the independent Trustees (together, the Board), votes on the renewal of the management contract and sub advisory agreements (together, the Advisory Contracts) for the fund. The Board, assisted by the advice of fund counsel and indepen dent Trustees’ counsel, requests and considers a broad range of information throughout the year.
The Board meets regularly each month except August and takes into account throughout the year matters bearing on Advisory Contracts. The Board, acting directly and through its separate committees, considers at each of its meetings factors that are relevant to the annual renewal of the fund’s Advisory Contracts, including the services and support provided to the fund and its shareholders by Fidelity. At the time of the renewal, the Board had 11 standing committees, each composed of independent Trustees with varying backgrounds, to which the Board has assigned specific subject matter responsibilities in order to enhance effective decision making by the Board. Each committee has adopted a written charter outlining the structure and purposes of the committee. One such committee, the Equity Contract Committee, meets periodically during the first six months of each year and as necessary to consider matters specifically related to the annual renewal of Advisory Contracts. The committee requests and receives information on, and makes recommendations to the independent Trustees concerning, the approval and annual review of the Advisory Contracts.
At its July 2005 meeting, the Board of Trustees, including the independent Trustees, unanimously determined to renew the Advisory Contracts for the fund. In reaching its determination, the Board considered all factors it believed relevant, including (1) the nature, extent, and quality of the services to be provided to the fund and its shareholders by Fidelity (including the investment performance of the fund); (2) the competitiveness of the manage ment fee and total expenses of the fund; (3) the total costs of the services to be provided by and the profits to be realized by the investment adviser and its affiliates from the relationship with the fund; (4) the extent to which economies of scale would be realized as the fund grows; and (5) whether fee levels reflect these economies of scale, if any, for the benefit of fund shareholders.
In determining whether to renew the Advisory Contracts for the fund, the Board ultimately reached a determination, with the assistance of fund counsel and independent Trustees’ counsel, that the renewal of the Advisory Contracts and the compensation to be received by Fidelity under the management contract is consistent with Fidelity’s fiduciary duty under applicable law. In addition to evaluating the specific factors noted above, the Board, in reaching its determination, is aware that shareholders in the fund have a broad range of investment choices available to them, including a wide choice among mutual funds offered by competitors to Fidelity, and that the fund’s shareholders, with the opportunity to review and weigh the disclosure provided by the fund in its prospectus and other public disclosures, have chosen to invest in this fund, managed by Fidelity.
Nature, Extent, and Quality of Services Provided by Fidelity. The Board considered staffing within the investment adviser, FMR, and the sub advisers (together, the Investment Advisers), including the background of the fund’s portfolio manager and the fund’s investment objective and discipline. The independent Trustees also had discussions with senior management of Fidelity’s investment operations and investment groups. The Board considered the structure of the portfolio manager compensation program and whether this structure provides appropriate incentives.
Fidelity Resources Dedicated to Investment Management and Support Services. The Board reviewed the size, education, and experience of the Invest ment Advisers’ investment staff, their use of technology, and the Investment Advisers’ approach to recruiting, training, and retaining portfolio managers and other research, advisory, and management personnel. The Board considered Fidelity’s extensive global research capabilities that enable the Investment Advisers to aggregate data from various sources in an effort to produce positive investment results. The Board noted that Fidelity’s analysts have access to a variety of technological tools that enable them to perform both fundamental and quantitative analysis and to specialize in various disciplines. The Board also considered that Fidelity’s portfolio managers and analysts have access to daily portfolio attribution that allows for monitor ing of a fund’s portfolio, as well as an electronic communication system that provides immediate real time access to research concerning issuers and credit enhancers.
Shareholder and Administrative Services. The Board considered the nature, extent, quality, and cost of administrative, distribution, and shareholder services performed by the Investment Advisers and their affiliates under the Advisory Contracts and under separate agreements covering transfer agency, pricing and bookkeeping, and securities lending services for the fund. The Board also considered the nature and extent of the Investment Advisers’ supervision of third party service providers, principally custodians and subcustodians. The Board reviewed the allocation of fund brokerage, including allocations to brokers affiliated with the Investment Advisers, the use of brokerage commissions to pay fund expenses, and the use of “soft” commission dollars to pay for research services. The Board also considered that Fidelity voluntarily decided in 2004 to stop using “soft” commission dollars to pay for market data and, instead, to pay for that data out of its own resources. The Board also considered the resources devoted to, and the record of compliance with, the fund’s compliance policies and procedures.
The Board noted that the growth of fund assets across the complex allows Fidelity to reinvest in the development of services designed to enhance the value or convenience of the Fidelity funds as investment vehicles. These services include 24 hour access to account information and market informa tion through phone representatives and over the Internet, and investor education materials and asset allocation tools.
Investment in a Large Fund Family. The Board considered the benefits to shareholders of investing in a Fidelity fund, including the benefits of investing in a fund that is part of a large family of funds offering a variety of investment disciplines and providing for a large variety of mutual fund investor services. The Board noted that, since the last Advisory Contract renewals in July 2004, Fidelity has taken a number of actions that benefited particular
funds, including (i) voluntarily deciding in 2004 to stop using “soft” commission dollars to pay for market data and, instead, to pay for that data out of its own resources, (ii) contractually agreeing to impose management fee reductions and expense limitations on its five Spartan stock index funds and its stock index fund available through variable insurance products, (iii) contractually agreeing to eliminate the management fees on the Fidelity Freedom Funds and the Fidelity Advisor Freedom Funds, (iv) contractually agreeing to reduce the management fees on most of its investment grade taxable bond funds, and (v) contractually agreeing to impose expense limitations on its retail and Spartan investment grade taxable bond funds.
Investment Performance and Compliance. The Board considered whether the fund has operated within its investment objective, as well as its record of compliance with its investment restrictions. It also reviewed the fund’s absolute investment performance for each class, as well as the fund’s relative investment performance for each class measured against (i) a broad based securities market index, and (ii) a peer group of mutual funds deemed appropriate by the Board over multiple periods. The following charts considered by the Board show, over the one , three , and five year periods ended December 31, 2004, the returns of Service Class and Initial Class of the fund, the returns of a broad based securities market index (“benchmark”), and a range of returns of a peer group of mutual funds identified by Lipper Inc. as having an investment objective similar to that of the fund. The returns of Service Class and Initial Class represent the performance of classes with high and low 12b 1 fees, respectively (not necessarily with the highest and lowest total expenses). (Unlike Service Class, Service Class 2, which has a higher 12b 1 fee than Service Class, did not have five years of performance as of December 31, 2004.) The box within each chart shows the 25th percentile return (bottom of box) and the 75th percentile return (top of box) of the Lipper peer group. Returns shown above the box are in the first quartile and returns shown below the box are in the fourth quartile. The percentage beaten numbers noted below each chart correspond to the percentile box and represent the percentage of funds in the Lipper peer group whose performance was equal to or lower than that of the class indicated.
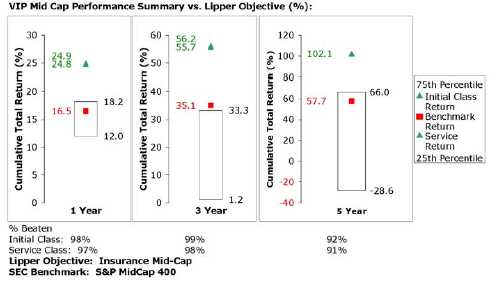
The Board reviewed the fund’s relative investment performance against its Lipper peer group and stated that the performance of Initial Class of the fund was in the first quartile for the one , three , and five year periods. The Board also stated that the relative investment performance of Initial Class of the fund has compared favorably to its benchmark over time. The Board considered that the variations in performance among the fund’s classes reflect the variations in class expenses, which result in lower performance for higher expense classes.
The Board has had thorough discussions with FMR throughout the year about the Board’s and FMR’s concerns about equity research, equity fund performance, and compliance with internal policies governing gifts and entertainment. FMR has taken steps that it believes will refocus and strengthen equity research and equity portfolio management and compliance. The Board noted with favor FMR’s recent reorganization of its senior management team and FMR’s plans to dedicate additional resources to investment research, and participated in the process that led to those changes.
Based on its review, and giving particular weight to the nature and quality of the resources dedicated by the Investment Advisers to maintain and improve relative performance, the Board concluded that the nature, extent, and quality of the services provided by Fidelity will benefit the fund’s shareholders, particularly in light of the Board’s view that the fund’s shareholders benefit from investing in a fund that is part of a large family of funds offering a variety of investment disciplines and services.
Competitiveness of Management Fee and Total Fund Expenses. The Board considered the fund’s management fee and total expenses compared to “mapped groups” of competitive funds and classes. Fidelity creates “mapped groups” by combining similar Lipper investment objective categories that have comparable management fee characteristics. Combining Lipper investment objective categories aids the Board’s management fee and total expense comparisons by broadening the competitive group used for comparison and by reducing the number of universes to which various Fidelity funds are compared.
49 Annual Report
Board Approval of Investment Advisory Contracts and Management Fees - continued
The Board considered two proprietary management fee comparisons for the 12 month periods shown in the chart below. The group of Lipper funds used by the Board for management fee comparisons is referred to below as the “Total Mapped Group” and, for the reasons explained above, is broader than the Lipper peer group used by the Board for performance comparisons. The Total Mapped Group comparison focuses on a fund’s standing relative to the total universe of comparable funds available to investors, in terms of gross management fees before expense reimbursements or caps. “TMG %” represents the percentage of funds in the Total Mapped Group that had management fees that were lower than the fund’s. For example, a TMG % of 11% means that 89% of the funds in the Total Mapped Group had higher management fees than the fund. The “Asset Size Peer Group” (ASPG) comparison focuses on a fund’s standing relative to non Fidelity funds similar in size to the fund within the Total Mapped Group. The ASPG represents at least 15% of the funds in the Total Mapped Group with comparable asset size and management fee characteristics, subject to a minimum of 50 funds (or all funds in the Total Mapped Group if fewer than 50). Additional information, such as the ASPG quartile (“quadrant”) in which the fund’s management fee ranked, is also included in the chart and considered by the Board.
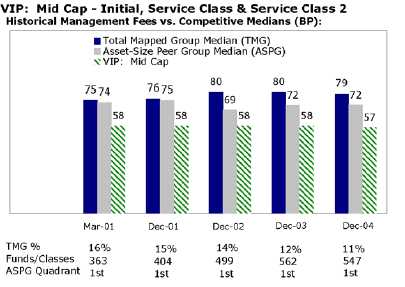
The Board noted that the fund’s management fee ranked below the median of its Total Mapped Group and below the median of its ASPG for 2004.
Based on its review, the Board concluded that the fund’s management fee was fair and reasonable in light of the services that the fund receives and the other factors considered.
In its review of each class’s total expenses, the Board considered the fund’s management fee as well as other fund or class expenses, as applicable, such as transfer agent fees, pricing and bookkeeping fees, fund paid 12b 1 fees, and custodial, legal, and audit fees. The Board also noted the effects of any waivers and reimbursements on fees and expenses. As part of its review, the Board also considered current and historical total expenses of each class of the fund compared to competitive fund median expenses. Each class of the fund is compared to those funds and classes in the Total Mapped Group (used by the Board for management fee comparisons) that have a similar sales load structure.
The Board noted that each class’s total expenses ranked below its competitive median for 2004.
In its review of total expenses, the Board also considered Fidelity fee structures and other information on clients that FMR and its affiliates service in other competitive markets, such as other mutual funds advised or subadvised by FMR or its affiliates, pension plan clients, and other institutional clients.
Based on its review, the Board concluded that the total expenses for each class of the fund were reasonable in light of the services that the fund and its shareholders receive and the other factors considered.
Costs of the Services and Profitability. The Board considered the revenues earned and the expenses incurred by Fidelity in conducting the busi ness of developing, marketing, distributing, managing, administering and servicing the fund and its shareholders. The Board also considered the level of Fidelity’s profits in respect of all the Fidelity funds.
On an annual basis, FMR presents to the Board Fidelity’s profitability for the fund. Fidelity calculates the profitability for each fund, as well as aggregate profitability for groups of Fidelity funds and all Fidelity funds, using a series of detailed revenue and cost allocation methodologies which originate with the audited books and records of Fidelity. The Audit Committee of the Board reviews any significant changes from the prior year’s methodologies.
PricewaterhouseCoopers LLP (PwC), independent registered accounting firm and auditor to Fidelity and certain Fidelity funds, has been engaged annually by the Board as part of the Board’s assessment of the results of Fidelity’s profitability analysis. PwC’s engagement includes the review and
assessment of Fidelity’s methodologies used in determining the revenues and expenses attributable to Fidelity’s mutual fund business, and completion of agreed upon procedures surrounding the mathematical accuracy of fund profitability and its conformity to allocation methodologies. After consider ing PwC’s reports issued under the engagement and information provided by Fidelity, the Board believes that while other allocation methods may also be reasonable, Fidelity’s profitability methodologies are reasonable in all material respects.
The Board has also reviewed Fidelity’s non fund businesses and any fall out benefits related to the mutual fund business as well as cases where Fidelity’s affiliates may benefit from or be related to the fund’s business. In addition, a special committee of the Board reviewed services provided to Fidelity by its affiliates and determined that the fees that Fidelity paid for such services were reasonable.
The Board considered the costs of the services provided by and the profits realized by Fidelity in connection with the operation of the fund and deter mined that the amount of profit is a fair entrepreneurial profit for the management of the fund.
Economies of Scale. The Board considered whether there have been economies of scale in respect of the management of the Fidelity funds, whether the Fidelity funds (including the fund) have appropriately benefited from any such economies of scale, and whether there is potential for realization of any further economies of scale. The Board considered the extent to which the fund will benefit from economies of scale through increased services to the fund, through waivers or reimbursements, or through fee or expense reductions.
The Board recognized that the fund’s management contract incorporates a “group fee” structure, which provides for lower fee rates as total fund assets under FMR’s management increase, and for higher fee rates as total fund assets under FMR’s management decrease. The Board considered that the group fee is designed to deliver the benefits of economies of scale to fund shareholders when total fund assets increase, even if assets of any particular fund are unchanged or have declined, because some portion of Fidelity’s costs are attributable to services provided to all Fidelity funds, and all funds benefit if those costs can be allocated among more assets. The Board concluded that, given the group fee structure, fund shareholders will achieve a certain level of economies of scale as assets under FMR’s management increase at the fund complex level, regardless of whether Fidelity achieves any such economies of scale.
The Board further concluded that any potential economies of scale are being shared between fund shareholders and Fidelity in an appropriate manner.
Additional Information Requested by the Board. In order to develop fully the factual basis for consideration of the Advisory Contracts, the Board requested additional information regarding (i) equity fund transfer agency fees; (ii) Fidelity’s fund profitability methodology and the impact of various changes in the methodology over time; (iii) benefits to shareholders from economies of scale; (iv) composition and characteristics of various fund and industry data used in comparisons; and (v) compensation of portfolio managers and research analysts.
Based on its evaluation of all of the conclusions noted above, and after considering all material factors, the Board ultimately concluded that the exist ing advisory fee structures are fair and reasonable, and that the fund’s existing Advisory Contracts should be renewed.
51 Annual Report
Investment Adviser
Fidelity Management & Research Company
Boston, MA
Investment Sub Advisers
FMR Co., Inc.
Fidelity Management & Research (U.K.) Inc.
Fidelity Management & Research (Far East) Inc.
Fidelity Investments Japan Limited
Fidelity International Investment Advisors
Fidelity International Investment Advisors (U.K.) Limited
General Distributor
Fidelity Distributors Corporation
Boston, MA
Transfer and Service Agents
Fidelity Investments Institutional Operations Company, Inc.
Boston, MA
Fidelity Service Company, Inc.
Boston, MA
Custodian
Brown Brothers Harriman & Co.
Boston, MA
|
VIPMID ANN 0206
1.735273.106
|
Fidelity® Variable Insurance Products:
Value Strategies Portfolio
|

Annual Report
December 31, 2005
|

| Contents | | | | |
| |
| Performance | | 3 | | How the fund has done over time. |
| Management’s Discussion | | 4 | | The manager’s review of fund performance, strategy and |
| | | | | outlook. |
| Shareholder Expense Example | | 5 | | An example of shareholder expenses. |
| Investment Changes | | 6 | | A summary of major shifts in the fund’s investments over the |
| | | | | past six months. |
| Investments | | 7 | | A complete list of the fund’s investments with their |
| | | | | market values. |
| Financial Statements | | 16 | | Statements of assets and liabilities, operations, and |
| | | | | changes in net assets, as well as financial highlights. |
| Notes | | 20 | | Notes to the financial statements. |
| Report of Independent Registered Public | | 24 | | |
| Accounting Firm | | | | |
| Trustees and Officers | | 25 | | |
| Distributions | | 30 | | |
| Board Approval of Investment Advisory | | 31 | | |
| Contracts and Management Fees | | | | |
| | To view a fund’s proxy voting guidelines and proxy voting record for the 12 month period ended June 30, visit www.fidelity.com/proxyvotingresults or visit the
Securities and Exchange Commission’s (SEC) web site at www.sec.gov. You may also call 1-877-208-0098 to request a free copy of the proxy voting guidelines.
Fidelity Variable Insurance Products are separate account options which are purchased through a variable insurance contract.
Standard & Poor’s, S&P and S&P 500 are registered service marks of The McGraw Hill Companies, Inc. and have been licensed for use by Fidelity Distributors
Corporation.
Other third party marks appearing herein are the property of their respective owners.
All other marks appearing herein are registered or unregistered trademarks or service marks of FMR Corp. or an affiliated company.
|
| | This report and the financial statements contained herein are submitted for the general information of the shareholders of the fund. This report is not authorized for
distribution to prospective investors in the fund unless preceded or accompanied by an effective prospectus.
A fund files its complete schedule of portfolio holdings with the SEC for the first and third quarters of each fiscal year on Form N Q. Forms N Q are available on
the SEC’s web site at http://www.sec.gov. A fund’s Forms N Q may be reviewed and copied at the SEC’s Public Reference Room in Washington, DC. Information
regarding the operation of the SEC’s Public Reference Room may be obtained by calling 1-800-SEC-0330. For a complete list of a fund’s portfolio holdings, view the
most recent quarterly holdings report, semiannual report, or annual report on Fidelity’s web site at http://www.advisor.fidelity.com.
NOT FDIC INSURED · MAY LOSE VALUE · NO BANK GUARANTEE
Neither the fund nor Fidelity Distributors Corporation is a bank.
|
VIP Value Strategies Portfolio 2
| | VIP Value Strategies Portfolio
Performance: The Bottom Line
|
Average annual total return reflects the change in the value of an investment, assuming reinvestment of the class’ dividend income and capital gains (the profits earned upon the sale of securities that have grown in value) and assuming a constant rate of performance each year. During periods of reimbursement by Fidelity, a fund’s total return will be greater than it would be had the reimbursement not occurred. Performance numbers are net of all underlying fund operating expenses, but do not include any insurance charges imposed by your insurance company’s separate account. If performance information included the effect of these additional charges, the total returns would have been lower. How a fund did yesterday is no guarantee of how it will do tomorrow.
| Average Annual Total Returns | | | | |
| Periods ended December 31, 2005 | | Past 1 | | Life of |
| | | | | year | | fundA |
| VIP Value Strategies - Initial Class | | 2.66% | | 10.36% |
| VIP Value Strategies - Service ClassB | | 2.55% | | 10.24% |
| VIP Value Strategies - Service Class 2C | | 2.43% | | 10.27% |
| VIP Value Strategies - Investor ClassD | | 2.59% | | 10.34% |
A From February 20, 2002.
B Performance for Service Class shares reflects an asset based service fee (12b 1 fee).
C Performance for Service Class 2 shares reflects an asset based service fee (12b 1 fee).
D The initial offering of Investor Class shares took place on July 21, 2005. Returns prior to July 21, 2005 are those of Initial Class. If Investor Class’s transfer agent fee
had been reflected, returns prior to July 21, 2005 would have been lower.
|
$10,000 Over Life of Fund
Let’s say hypothetically that $10,000 was invested in VIP Value Strategies Portfolio Initial Class on February 20, 2002, when the fund started. The chart shows how the value of your investment would have changed, and also shows how the Russell Midcap® Value Index performed over the same period.
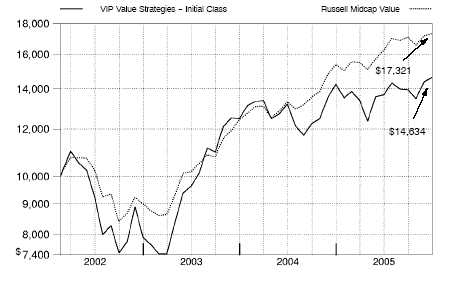
3 Annual Report
VIP Value Strategies Portfolio
Management’s Discussion of Fund Performance
|
Comments from Richard Fentin, Portfolio Manager of VIP Value Strategies Portfolio
U.S. equity benchmarks generally had positive results for the 12 months ending December 31, 2005, the third consecutive year that stocks finished in the black. Energy and utilities were the two best performing sectors, contributing greatly to the 4.91% gain of the Standard & Poor’s 500SM Index. Elsewhere, the NASDAQ Composite® Index returned 2.13%, while the Dow Jones Industrial AverageSM rose 1.72% . The U.S. economy did not decelerate as much as many had predicted, despite eight short term interest rate hikes, record high energy prices and the devastation caused by Hurricane Katrina. Meanwhile, corporate America notched its 14th consecutive quarter of double digit earnings gains through the third quarter of the year, an unprecedented streak in market history. From a style perspective, large cap stocks ended the six year reign of small caps by a narrow margin, but mid caps finished well ahead of both categories. The gap between growth and value stocks also was relatively narrow, with value gaining a slight edge.
During the past year, the fund lagged both the Russell® Midcap Value Index and the LipperSM Variable Annuity Mid Cap Funds Average, which rose 12.65% and 10.22%, respectively. (For specific portfolio performance results, please refer to the performance section of this report.) The largest factor in the fund’s underperformance relative to the Russell index was a substantial overweighting in technology stocks. Also, a number of the fund’s tech holdings performed poorly, including Take Two Interactive, Ulticom, Interwoven, EMC, i2 Technologies and Singapore based Flextronics, some of which were sold off during the period. Along those lines, the fund’s exposure to the technology sector has been dramatically reduced, from about 37% of net assets six months ago to less than 24% by December 31. A large position in slot machine maker WMS Industries also detracted, as did the fund’s underweighting in energy stocks, the period’s top performing market sector. However, since assuming the fund’s management, I’ve worked to reduce the fund’s volatility and company and industry specific concentration in an effort to spread the risks more evenly. There were a few bright spots during the period, including kids gaming software manufacturer THQ, which benefited from targeting a different customer base than most of the other gaming companies in the fund. Google and Monster Worldwide which were later sold benefited from huge growth in Internet advertising, while under weighting bank stocks paid off when short term interest rates rose, dampening banks’ revenue generating capacity. Elsewhere, Domino’s Pizza posted nice gains as well. In the six months since I assumed the fund’s management, I’ve significantly rearranged the portfolio’s assets and I believe its holdings are more balanced, with fewer oversized, concentrated positions in stocks that don’t offer adequate value for their risk level.
The views expressed in this statement reflect those of the portfolio manager only through the end of the period of the report as stated on the cover and do not necessarily represent the views of Fidelity or any other person in the Fidelity organization. Any such views are subject to change at any time based upon market or other conditions and Fidelity disclaims any responsibility to update such views. These views may not be relied on as invest ment advice and, because investment decisions for a Fidelity fund are based on numerous factors, may not be relied on as an indication of trading intent on behalf of any Fidelity fund.
VIP Value Strategies Portfolio 4
VIP Value Strategies Portfolio
Shareholder Expense Example
|
As a shareholder of the Fund, you incur two types of costs: (1) transaction costs, and (2) ongoing costs, including management fees, distribution and/or service (12b 1) fees and other Fund expenses. This Example is intended to help you understand your ongoing costs (in dollars) of investing in the Fund and to compare these costs with the ongoing costs of investing in other mutual funds.
The actual expense Example is based on an investment of $1,000 invested at the beginning of the period and held for the entire period (July 1, 2005 to December 31, 2005) for Initial Class, Service Class and Service Class 2 and for the entire period (July 21, 2005 to December 31, 2005) for Investor Class. The hypothetical expense Example is based on an investment of $1,000 invested for the one half year period (July 1, 2005 to December 31, 2005).
Actual Expenses
The first line of the table below for each class of the Fund provides information about actual account values and actual expenses. You may use the information in this line, together with the amount you invested, to estimate the expenses that you paid over the period. Simply divide your account value by $1,000.00 (for example, an $8,600 account value divided by $1,000.00 = 8.6), then multiply the result by the number in the first line for a class of the Fund under the heading entitled “Expenses Paid During Period” to estimate the expenses you paid on your account during this period. The estimate of expenses does not include any fees or other expenses of any variable annuity or variable life insurance product. If they were, the estimate of expenses you paid during the period would be higher, and your ending account value would be lower.
Hypothetical Example for Comparison Purposes
The second line of the table below for each class of the Fund provides information about hypothetical account values and hypothetical expenses based on a Class’ actual expense ratio and an assumed rate of return of 5% per year before expenses, which is not the Class’ actual return. The hypothetical account values and expenses may not be used to estimate the actual ending account balance or expenses you paid for the period. You may use this information to compare the ongoing costs of investing in the Fund and other funds. To do so, compare this 5% hypothetical example with the 5% hypothetical examples that appear in the shareholder reports of the other funds. The estimate of expenses does not include any fees or other expenses of any variable annuity or variable life insurance product. If they were, the estimate of expenses you paid during the period would be higher, and your ending account value would be lower.
Please note that the expenses shown in the table are meant to highlight your ongoing costs only and do not reflect any transaction costs. Therefore, the second line of the table is useful in comparing ongoing costs only, and will not help you determine the relative total costs of owning different funds.
| | | | | Ending | | | | |
| | | Beginning | | Account Value | | | | Expenses Paid |
| | | Account Value | | December 31, 2005 | | | | During Period |
| Initial Class | | | | | | | | |
| Actual | | $ 1,000.00 | | $ 1,069.50 | | | | $ 3.76B |
| HypotheticalA | | $ 1,000.00 | | $ 1,021.58 | | | | $ 3.67C |
| Service Class | | | | | | | | |
| Actual | | $ 1,000.00 | | $ 1,068.90 | | | | $ 4.28B |
| HypotheticalA | | $ 1,000.00 | | $ 1,021.07 | | | | $ 4.18C |
| Service Class 2 | | | | | | | | |
| Actual | | $ 1,000.00 | | $ 1,068.60 | | | | $ 5.06B |
| HypotheticalA | | $ 1,000.00 | | $ 1,020.32 | | | | $ 4.94C |
| Investor Class | | | | | | | | |
| Actual | | $ 1,000.00 | | $ 1,030.20 | | | | $ 4.24B |
| HypotheticalA | | $ 1,000.00 | | $ 1,020.52 | | | | $ 4.74C |
A 5% return per year before expenses
B Actual expenses are equal to each Class’ annualized expense ratio (shown in the table below); multiplied by the average account value over
the period, multiplied by 184/365 (to reflect the one half year period) for Initial Class, Service Class and Service Class 2 and multiplied by
164/365 (to reflect the period July 21, 2005 to December 31, 2005) for Investor Class.
C Hypothetical expenses are equal to each Class’ annualized expense ratio (shown in the table below); multiplied by the average account
value over the period, multiplied by 184/365 (to reflect the one-half year period).
|
| | | Annualized |
| | | Expense Ratio |
| Initial Class | | 72% |
| Service Class | | 82% |
| Service Class 2 | | 97% |
| Investor Class | | 93% |
55 Annual Report
| VIP Value Strategies Portfolio | | |
| Investment Changes | | |
| |
| |
| Top Ten Stocks as of December 31, 2005 |
| | | % of fund’s | | % of fund’s net assets |
| | | net assets | | 6 months ago |
| Baxter International, Inc. | | 1.9 | | 1.4 |
| Xerox Corp. | | 1.7 | | 1.3 |
| Safeway, Inc. | | 1.5 | | 0.0 |
| Belden CDT, Inc. | | 1.4 | | 1.2 |
| Endurance Specialty Holdings Ltd. | | 1.3 | | 1.4 |
| Western Digital Corp. | | 1.2 | | 1.1 |
| Tyco International Ltd. | | 1.1 | | 0.8 |
| McKesson Corp. | | 1.1 | | 1.2 |
| THQ, Inc. | | 1.1 | | 4.4 |
| Halliburton Co. | | 1.1 | | 0.9 |
| | | 13.4 | | |
Top Five Market Sectors as of December 31, 2005 |
| | | % of fund’s | | % of fund’s net assets |
| | | net assets | | 6 months ago |
| Information Technology | | 23.7 | | 37.0 |
| Consumer Discretionary | | 14.8 | | 16.8 |
| Health Care | | 13.2 | | 9.2 |
| Financials | | 13.1 | | 12.5 |
| Industrials | | 8.1 | | 8.7 |
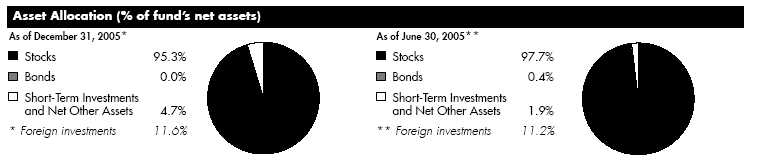
VIP Value Strategies Portfolio 6
| VIP Value Strategies Portfolio | | | | | | | | |
| Investments December 31, 2005 | | | | | | |
| Showing Percentage of Net Assets | | | | | | | | |
| |
| Common Stocks 95.3% | | | | | | | | |
| | | | | | | Shares | | Value (Note 1) |
| |
| CONSUMER DISCRETIONARY 14.8% | | | | | | | | |
| Auto Components – 0.1% | | | | | | | | | | |
| Lear Corp. | | | | | | 23,400 | | $ | | 665,964 |
| Automobiles – 0.3% | | | | | | | | | | |
| Monaco Coach Corp. | | | | | | 27,100 | | | | 360,430 |
| Nissan Motor Co. Ltd. | | | | | | 84,088 | | | | 852,255 |
| | | | | | | | | | | 1,212,685 |
| Diversified Consumer Services 0.1% | | | | | | | | |
| Service Corp. International (SCI) | | | | 49,800 | | | | 407,364 |
| Hotels, Restaurants & Leisure 4.8% | | | | | | | | |
| Applebee’s International, Inc. | | | | | | 19,300 | | | | 435,987 |
| Brinker International, Inc. | | | | | | 63,300 | | | | 2,447,178 |
| Carnival Corp. unit | | | | | | 43,200 | | | | 2,309,904 |
| CBRL Group, Inc. | | | | | | 19,700 | | | | 692,455 |
| Domino’s Pizza, Inc. | | | | | | 148,100 | | | | 3,584,020 |
| Outback Steakhouse, Inc. | | | | | | 64,000 | | | | 2,663,040 |
| Rare Hospitality International, Inc. (a) | | | | 12,651 | | | | 384,464 |
| Royal Caribbean Cruises Ltd. | | | | | | 83,300 | | | | 3,753,498 |
| Wendy’s International, Inc. | | | | | | 1,400 | | | | 77,364 |
| WMS Industries, Inc. (a)(d) | | | | | | 151,100 | | | | 3,791,099 |
| | | | | | | | | | | 20,139,009 |
| Household Durables 0.8% | | | | | | | | | | |
| Leggett & Platt, Inc. | | | | | | 51,600 | | | | 1,184,736 |
| Matsushita Electric Industrial Co. Ltd. | | | | 35,000 | | | | 678,300 |
| Newell Rubbermaid, Inc. | | | | | | 65,000 | | | | 1,545,700 |
| | | | | | | | | | | 3,408,736 |
| Leisure Equipment & Products 1.5% | | | | | | | | |
| Brunswick Corp. | | | | | | 54,400 | | | | 2,211,904 |
| Eastman Kodak Co. | | | | | | 146,300 | | | | 3,423,420 |
| K2, Inc. (a) | | | | | | 57,500 | | | | 581,325 |
| | | | | | | | | | | 6,216,649 |
| Media 2.6% | | | | | | | | | | |
| CCE Spinco, Inc. (a) | | | | | | 9,062 | | | | 118,712 |
| Citadel Broadcasting Corp. | | | | | | 10,500 | | | | 141,120 |
| Clear Channel Communications, Inc. | | | | 72,500 | | | | 2,280,125 |
| E.W. Scripps Co. Class A | | | | | | 23,100 | | | | 1,109,262 |
| Gannett Co., Inc. | | | | | | 31,100 | | | | 1,883,727 |
| Lamar Advertising Co. Class A (a) | | | | 29,600 | | | | 1,365,744 |
| The New York Times Co. Class A | | | | 37,800 | | | | 999,810 |
| The Reader’s Digest Association, Inc. (non vtg.) | | | | 72,100 | | | | 1,097,362 |
| Tribune Co. | | | | | | 33,300 | | | | 1,007,658 |
| Viacom, Inc. Class B (non vtg.) | | | | | | 30,200 | | | | 984,520 |
| | | | | | | | | | | 10,988,040 |
| Multiline Retail – 1.1% | | | | | | | | | | |
| Big Lots, Inc. (a) | | | | | | 160,900 | | | | 1,932,409 |
| Family Dollar Stores, Inc. | | | | | | 103,700 | | | | 2,570,723 |
| | | | | | | | | | | 4,503,132 |
| Specialty Retail 2.8% | | | | | | | | | | |
| AnnTaylor Stores Corp. (a) | | | | | | 116,700 | | | | 4,028,484 |
| |
| |
See accompanying notes which are an integral part of the financial statements.
| | | | | | |
| | | | | | | 7 | | Annual Report |
7
| VIP Value Strategies Portfolio | | | | |
| Investments - continued | | | | | | |
| |
| |
| |
| | | | | Shares | | Value (Note 1) |
| Best Buy Co., Inc. | | | | 11,300 | | $ 491,324 |
| Gap, Inc. | | | | 103,500 | | 1,825,740 |
| Hot Topic, Inc. (a) | | | | 52,900 | | 753,825 |
| Pier 1 Imports, Inc. | | | | 133,700 | | 1,167,201 |
| Sports Authority, Inc. (a) | | | | 50,600 | | 1,575,178 |
| Tiffany & Co., Inc. | | | | 54,000 | | 2,067,660 |
| | | | | | | 11,909,412 |
| Textiles, Apparel & Luxury Goods 0.7% | | | | |
| Liz Claiborne, Inc. | | | | 78,800 | | 2,822,616 |
| |
| TOTAL CONSUMER DISCRETIONARY | | | | 62,273,607 |
| |
| CONSUMER STAPLES 3.6% | | | | | | |
| Beverages 0.3% | | | | | | |
| Coca Cola Enterprises, Inc. | | | | 52,600 | | 1,008,342 |
| Food & Staples Retailing – 1.5% | | | | | | |
| Safeway, Inc. | | | | 271,303 | | 6,419,029 |
| Food Products – 0.4% | | | | | | |
| Corn Products International, Inc. | | | | 51,100 | | 1,220,779 |
| TreeHouse Foods, Inc. (a) | | | | 20,620 | | 386,006 |
| | | | | | | 1,606,785 |
| Household Products – 0.5% | | | | | | |
| Colgate Palmolive Co. | | | | 35,300 | | 1,936,205 |
| Personal Products 0.4% | | | | | | |
| Avon Products, Inc. | | | | 63,600 | | 1,815,780 |
| Tobacco – 0.5% | | | | | | |
| Altria Group, Inc. | | | | 28,700 | | 2,144,464 |
| |
| TOTAL CONSUMER STAPLES | | | | | | 14,930,605 |
| |
| ENERGY 7.4% | | | | | | |
| Energy Equipment & Services – 7.3% | | | | |
| Baker Hughes, Inc. | | | | 37,000 | | 2,248,860 |
| BJ Services Co. | | | | 48,500 | | 1,778,495 |
| Cooper Cameron Corp. (a) | | | | 70,600 | | 2,922,840 |
| ENSCO International, Inc. | | | | 26,600 | | 1,179,710 |
| FMC Technologies, Inc. (a) | | | | 39,900 | | 1,712,508 |
| GlobalSantaFe Corp. | | | | 27,000 | | 1,300,050 |
| Halliburton Co. | | | | 71,800 | | 4,448,728 |
| Helmerich & Payne, Inc. | | | | 38,300 | | 2,371,153 |
| Nabors Industries Ltd. (a) | | | | 22,700 | | 1,719,525 |
| National Oilwell Varco, Inc. (a) | | | | 69,100 | | 4,332,570 |
| Noble Corp. | | | | 22,100 | | 1,558,934 |
| Smith International, Inc. | | | | 46,000 | | 1,707,060 |
| Transocean, Inc. (a) | | | | 26,600 | | 1,853,754 |
| Weatherford International Ltd. (a) | | | | 40,600 | | 1,469,720 |
| | | | | | | 30,603,907 |
See accompanying notes which are an integral part of the financial statements.
| | |
| VIP Value Strategies Portfolio | | 8 |
| Common Stocks continued | | | | |
| | | Shares | | Value (Note 1) |
| |
| ENERGY – continued | | | | |
| Oil, Gas & Consumable Fuels 0.1% | | | | |
| Double Hull Tankers, Inc. | | 14,400 | | $ 189,648 |
| Houston Exploration Co. (a) | | 8,800 | | 464,640 |
| | | | | 654,288 |
| |
| TOTAL ENERGY | | | | 31,258,195 |
| |
| FINANCIALS 13.1% | | | | |
| Capital Markets 1.5% | | | | |
| Ameriprise Financial, Inc. | | 7,600 | | 311,600 |
| Ameritrade Holding Corp. | | 22,000 | | 528,000 |
| Janus Capital Group, Inc. | | 89,300 | | 1,663,659 |
| Lehman Brothers Holdings, Inc. | | 11,300 | | 1,448,321 |
| Merrill Lynch & Co., Inc. | | 37,300 | | 2,526,329 |
| | | | | 6,477,909 |
| Commercial Banks – 1.2% | | | | |
| Bank of America Corp. | | 24,400 | | 1,126,060 |
| UnionBanCal Corp. | | 21,100 | | 1,449,992 |
| Wachovia Corp. | | 47,100 | | 2,489,706 |
| | | | | 5,065,758 |
| Insurance – 5.8% | | | | |
| AFLAC, Inc. | | 41,300 | | 1,917,146 |
| AMBAC Financial Group, Inc. | | 27,600 | | 2,126,856 |
| Axis Capital Holdings Ltd. | | 74,400 | | 2,327,232 |
| Endurance Specialty Holdings Ltd. | | 150,400 | | 5,391,840 |
| Genworth Financial, Inc. Class A (non vtg.) | | 43,000 | | 1,486,940 |
| Hartford Financial Services Group, Inc. | | 15,000 | | 1,288,350 |
| MBIA, Inc. | | 34,100 | | 2,051,456 |
| MetLife, Inc. | | 27,600 | | 1,352,400 |
| Montpelier Re Holdings Ltd. | | 47,700 | | 901,530 |
| Prudential Financial, Inc. | | 18,900 | | 1,383,291 |
| Scottish Re Group Ltd. | | 33,200 | | 815,060 |
| The St. Paul Travelers Companies, Inc. | | 42,700 | | 1,907,409 |
| United America Indemnity Ltd. Class A (a) | | 68,500 | | 1,257,660 |
| | | | | 24,207,170 |
| Real Estate 2.7% | | | | |
| Alexandria Real Estate Equities, Inc. | | 11,900 | | 957,950 |
| American Financial Realty Trust (SBI) | | 60,500 | | 726,000 |
| Apartment Investment & Management Co. Class A | | 27,900 | | 1,056,573 |
| Developers Diversified Realty Corp. | | 14,300 | | 672,386 |
| Digital Realty Trust, Inc. | | 8,500 | | 192,355 |
| Equity Residential (SBI) | | 30,800 | | 1,204,896 |
| General Growth Properties, Inc. | | 42,900 | | 2,015,871 |
| IVG Immobilien AG | | 12,400 | | 259,978 |
| Kimco Realty Corp. | | 30,500 | | 978,440 |
| Pennsylvania (REIT) (SBI) | | 6,800 | | 254,048 |
| SL Green Realty Corp. | | 5,800 | | 443,062 |
See accompanying notes which are an integral part of the financial statements.
|
9
| VIP Value Strategies Portfolio | | | | |
| Investments - continued | | | | |
| |
| |
| |
| | | Shares | | Value (Note 1) |
| United Dominion Realty Trust, Inc. (SBI) | | 60,000 | | $ 1,406,400 |
| Vornado Realty Trust | | 14,100 | | 1,176,927 |
| | | | | 11,344,886 |
| Thrifts & Mortgage Finance – 1.9% | | | | |
| Countrywide Financial Corp. | | 49,200 | | 1,682,148 |
| Fannie Mae | | 53,400 | | 2,606,454 |
| Freddie Mac | | 36,500 | | 2,385,275 |
| Hudson City Bancorp, Inc. | | 112,000 | | 1,357,440 |
| | | | | 8,031,317 |
| |
| TOTAL FINANCIALS | | | | 55,127,040 |
| |
| HEALTH CARE 13.2% | | | | |
| Biotechnology – 1.2% | | | | |
| Cephalon, Inc. (a)(d) | | 34,600 | | 2,240,004 |
| Charles River Laboratories International, Inc. (a) | | 44,200 | | 1,872,754 |
| MedImmune, Inc. (a) | | 23,400 | | 819,468 |
| | | | | 4,932,226 |
| Health Care Equipment & Supplies 4.3% | | | | |
| Baxter International, Inc. | | 212,500 | | 8,000,626 |
| Becton, Dickinson & Co. | | 40,500 | | 2,433,240 |
| CONMED Corp. (a) | | 19,000 | | 449,540 |
| Dade Behring Holdings, Inc. | | 24,100 | | 985,449 |
| Fisher Scientific International, Inc. (a) | | 30,700 | | 1,899,102 |
| Hospira, Inc. (a) | | 11,100 | | 474,858 |
| Varian, Inc. (a) | | 73,500 | | 2,924,565 |
| Waters Corp. (a) | | 19,210 | | 726,138 |
| | | | | 17,893,518 |
| Health Care Providers & Services 6.4% | | | | |
| AmerisourceBergen Corp. | | 99,000 | | 4,098,600 |
| Community Health Systems, Inc. (a) | | 84,700 | | 3,247,398 |
| Emdeon Corp. (a) | | 98,400 | | 832,464 |
| HCA, Inc. | | 51,900 | | 2,620,950 |
| Health Net, Inc. (a) | | 15,900 | | 819,645 |
| McKesson Corp. | | 90,600 | | 4,674,054 |
| Omnicare, Inc. | | 9,600 | | 549,312 |
| Pediatrix Medical Group, Inc. (a) | | 8,000 | | 708,560 |
| Quest Diagnostics, Inc. | | 72,900 | | 3,752,892 |
| Sunrise Senior Living, Inc. (a) | | 36,000 | | 1,213,560 |
| Triad Hospitals, Inc. (a) | | 31,700 | | 1,243,591 |
| Universal Health Services, Inc. Class B | | 68,400 | | 3,197,016 |
| | | | | 26,958,042 |
| Pharmaceuticals 1.3% | | | | |
| Schering Plough Corp. | | 185,500 | | 3,867,675 |
| Teva Pharmaceutical Industries Ltd. sponsored ADR | | 41,300 | | 1,776,313 |
| | | | | 5,643,988 |
| |
| TOTAL HEALTH CARE | | | | 55,427,774 |
See accompanying notes which are an integral part of the financial statements.
| | |
| VIP Value Strategies Portfolio | | 10 |
| Common Stocks continued | | | | | | | | |
| | | | | Shares | | Value (Note 1) |
| |
| INDUSTRIALS – 8.1% | | | | | | | | |
| Aerospace & Defense – 0.8% | | | | | | | | |
| EADS NV | | | | 35,900 | | $ | | 1,355,757 |
| Honeywell International, Inc. | | | | 31,900 | | | | 1,188,275 |
| Precision Castparts Corp. | | | | 12,200 | | | | 632,082 |
| | | | | | | | | 3,176,114 |
| Airlines – 0.4% | | | | | | | | |
| ACE Aviation Holdings, Inc. Class A (a) | | | | 10,000 | | | | 326,868 |
| Ryanair Holdings PLC sponsored ADR (a) | | | | 25,600 | | | | 1,433,344 |
| | | | | | | | | 1,760,212 |
| Building Products – 1.0% | | | | | | | | |
| American Standard Companies, Inc. | | | | 6,700 | | | | 267,665 |
| Masco Corp. | | | | 132,700 | | | | 4,006,213 |
| | | | | | | | | 4,273,878 |
| Commercial Services & Supplies 1.4% | | | | | | | | |
| Aramark Corp. Class B | | | | 78,600 | | | | 2,183,508 |
| Manpower, Inc. | | | | 22,800 | | | | 1,060,200 |
| Navigant Consulting, Inc. (a) | | | | 49,200 | | | | 1,081,416 |
| The Brink’s Co. | | | | 30,700 | | | | 1,470,837 |
| | | | | | | | | 5,795,961 |
| Industrial Conglomerates 1.1% | | | | | | | | |
| Tyco International Ltd. | | | | 162,100 | | | | 4,678,206 |
| Machinery – 2.0% | | | | | | | | |
| Albany International Corp. Class A | | | | 26,300 | | | | 951,008 |
| Briggs & Stratton Corp. | | | | 48,800 | | | | 1,892,952 |
| Harsco Corp. | | | | 20,200 | | | | 1,363,702 |
| Kennametal, Inc. | | | | 21,700 | | | | 1,107,568 |
| SPX Corp. | | | | 69,800 | | | | 3,194,746 |
| | | | | | | | | 8,509,976 |
| Road & Rail 1.3% | | | | | | | | |
| Canadian National Railway Co. | | | | 21,900 | | | | 1,754,562 |
| CSX Corp. | | | | 9,500 | | | | 482,315 |
| Laidlaw International, Inc. | | | | 127,400 | | | | 2,959,502 |
| | | | | | | | | 5,196,379 |
| Transportation Infrastructure – 0.1% | | | | | | | | |
| Macquarie Infrastructure Co. Trust | | | | 16,602 | | | | 511,342 |
| |
| TOTAL INDUSTRIALS | | | | | | | | 33,902,068 |
| |
| INFORMATION TECHNOLOGY 23.7% | | | | | | | | |
| Communications Equipment – 3.5% | | | | | | | | |
| ADC Telecommunications, Inc. (a) | | | | 87,428 | | | | 1,953,142 |
| Alcatel SA sponsored ADR (a) | | | | 82,300 | | | | 1,020,520 |
| Belden CDT, Inc. | | | | 232,700 | | | | 5,684,861 |
| Dycom Industries, Inc. (a) | | | | 138,100 | | | | 3,038,200 |
| EVS Broadcast Equipment SA (d) | | | | 1,560 | | | | 52,985 |
| Motorola, Inc. | | | | 48,200 | | | | 1,088,838 |
| Nokia Corp. sponsored ADR | | | | 81,100 | | | | 1,484,130 |
| Powerwave Technologies, Inc. (a) | | | | 15,100 | | | | 189,807 |
| | | | | | | | | 14,512,483 |
| |
| |
See accompanying notes which are an integral part of the financial statements.
| | | | | | | | |
| | | 11 | | | | Annual Report |
11
| VIP Value Strategies Portfolio | | | | | | |
| Investments - continued | | | | | | |
| |
| |
| |
| | | | | Shares | | Value (Note 1) |
| Computers & Peripherals 2.8% | | | | | | |
| Maxtor Corp. (a) | | | | 225,200 | | $ 1,562,888 |
| NCR Corp. (a) | | | | 63,500 | | 2,155,190 |
| Seagate Technology | | | | 147,900 | | 2,956,521 |
| Western Digital Corp. (a) | | | | 282,000 | | 5,248,020 |
| | | | | | | 11,922,619 |
| Electronic Equipment & Instruments – 5.9% | | | | | | |
| Agilent Technologies, Inc. (a) | | | | 93,400 | | 3,109,286 |
| Avnet, Inc. (a) | | | | 159,800 | | 3,825,612 |
| AVX Corp. | | | | 122,200 | | 1,769,456 |
| Celestica, Inc. (sub. vtg.) (a) | | | | 230,700 | | 2,448,788 |
| Flextronics International Ltd. (a) | | | | 398,100 | | 4,156,164 |
| Ingram Micro, Inc. Class A (a) | | | | 38,200 | | 761,326 |
| Mettler Toledo International, Inc. (a) | | | | 37,900 | | 2,092,080 |
| Molex, Inc. | | | | 73,000 | | 1,894,350 |
| Symbol Technologies, Inc. | | | | 269,900 | | 3,460,118 |
| Tech Data Corp. (a) | | | | 21,300 | | 845,184 |
| Tektronix, Inc. | | | | 15,000 | | 423,150 |
| | | | | | | 24,785,514 |
| IT Services 2.4% | | | | | | |
| Accenture Ltd. Class A | | | | 35,000 | | 1,010,450 |
| Affiliated Computer Services, Inc. Class A (a) | | | | 45,800 | | 2,710,444 |
| Ceridian Corp. (a) | | | | 179,000 | | 4,448,150 |
| Hewitt Associates, Inc. Class A (a) | | | | 67,300 | | 1,885,073 |
| | | | | | | 10,054,117 |
| Office Electronics – 1.7% | | | | | | |
| Xerox Corp. (a) | | | | 473,800 | | 6,941,170 |
| Semiconductors & Semiconductor Equipment – 4.8% | | | | | | |
| Amkor Technology, Inc. (a) | | | | 64,000 | | 358,400 |
| Applied Materials, Inc. | | | | 96,100 | | 1,724,034 |
| Applied Micro Circuits Corp. (a) | | | | 536,100 | | 1,377,777 |
| ASM International NV (Nasdaq) (a) | | | | 37,600 | | 632,432 |
| ASML Holding NV (NY Shares) (a) | | | | 129,400 | | 2,598,352 |
| DSP Group, Inc. (a) | | | | 15,100 | | 378,406 |
| Fairchild Semiconductor International, Inc. (a) | | | | 75,600 | | 1,278,396 |
| MKS Instruments, Inc. (a) | | | | 34,900 | | 624,361 |
| National Semiconductor Corp. | | | | 81,600 | | 2,119,968 |
| Novellus Systems, Inc. (a) | | | | 14,500 | | 349,740 |
| Omnivision Technologies, Inc. (a)(d) | | | | 221,200 | | 4,415,152 |
| Samsung Electronics Co. Ltd. | | | | 3,690 | | 2,413,608 |
| Trident Microsystems, Inc. (a) | | | | 113,000 | | 2,034,000 |
| | | | | | | 20,304,626 |
| Software 2.6% | | | | | | |
| Activision, Inc. (a) | | | | 90,221 | | 1,239,637 |
| Cadence Design Systems, Inc. (a) | | | | 75,900 | | 1,284,228 |
| Hyperion Solutions Corp. (a) | | | | 21,900 | | 784,458 |
| |
| |
| |
| |
| See accompanying notes which are an integral part of the financial statements. | | | | | | |
| |
| VIP Value Strategies Portfolio | | 12 | | | | |
| Common Stocks continued | | | | |
| | | Shares | | Value (Note 1) |
| |
| INFORMATION TECHNOLOGY – continued | | | | |
| Software – continued | | | | |
| Take Two Interactive Software, Inc. (a) | | 172,750 | | $ 3,057,675 |
| THQ, Inc. (a) | | 187,741 | | 4,477,623 |
| | | | | 10,843,621 |
| |
| TOTAL INFORMATION TECHNOLOGY | | | | 99,364,150 |
| |
| MATERIALS 4.7% | | | | |
| Chemicals 2.5% | | | | |
| Albemarle Corp. | | 18,500 | | 709,475 |
| Ashland, Inc. | | 29,900 | | 1,731,210 |
| Celanese Corp. Class A | | 40,500 | | 774,360 |
| Chemtura Corp. | | 167,989 | | 2,133,460 |
| Cytec Industries, Inc. | | 42,400 | | 2,019,512 |
| Georgia Gulf Corp. | | 24,420 | | 742,856 |
| OM Group, Inc. (a) | | 16,500 | | 309,540 |
| Spartech Corp. | | 63,600 | | 1,396,020 |
| Valspar Corp. | | 29,800 | | 735,166 |
| | | | | 10,551,599 |
| Containers & Packaging – 1.1% | | | | |
| Owens Illinois, Inc. (a) | | 141,900 | | 2,985,576 |
| Packaging Corp. of America | | 71,600 | | 1,643,220 |
| | | | | 4,628,796 |
| Metals & Mining – 1.1% | | | | |
| Alcan, Inc. (d) | | 54,800 | | 2,251,299 |
| Alcoa, Inc. | | 67,600 | | 1,998,932 |
| Nucor Corp. | | 7,200 | | 480,384 |
| | | | | 4,730,615 |
| |
| TOTAL MATERIALS | | | | 19,911,010 |
| |
| TELECOMMUNICATION SERVICES 2.9% | | | | |
| Diversified Telecommunication Services – 1.7% | | | | |
| Alaska Communication Systems Group, Inc. | | 80,900 | | 821,944 |
| AT&T, Inc. | | 51,400 | | 1,258,786 |
| BellSouth Corp. | | 48,300 | | 1,308,930 |
| Citizens Communications Co. | | 87,200 | | 1,066,456 |
| Cogent Communications Group, Inc. (a)(d) | | 66,000 | | 362,340 |
| Iowa Telecommunication Services, Inc. | | 67,552 | | 1,046,380 |
| Verizon Communications, Inc. | | 39,600 | | 1,192,752 |
| | | | | 7,057,588 |
| Wireless Telecommunication Services – 1.2% | | | | |
| ALLTEL Corp. | | 19,000 | | 1,198,900 |
| American Tower Corp. Class A (a) | | 16,432 | | 445,307 |
See accompanying notes which are an integral part of the financial statements.
|
13 Annual Report
13
| VIP Value Strategies Portfolio | | | | | | |
| Investments - continued | | | | | | |
| |
| |
| |
| | | | | Shares | | Value (Note 1) |
| Dobson Communications Corp. | | | | | | |
| Class A (a) | | | | 140,900 | | $ 1,056,750 |
| Sprint Nextel Corp. | | | | 94,200 | | 2,200,512 |
| | | | | | | 4,901,469 |
| |
| TOTAL TELECOMMUNICATION SERVICES | | | | | | 11,959,057 |
| |
| UTILITIES 3.8% | | | | | | |
| Electric Utilities – 1.8% | | | | | | |
| Edison International | | | | 57,700 | | 2,516,297 |
| Entergy Corp. | | | | 24,900 | | 1,709,385 |
| Exelon Corp. | | | | 27,800 | | 1,477,292 |
| PPL Corp. | | | | 58,700 | | 1,725,780 |
| | | | | | | 7,428,754 |
| Independent Power Producers & Energy Traders 1.3% | | | | | | |
| AES Corp. (a) | | | | 70,800 | | 1,120,764 |
| Constellation Energy Group, Inc. | | | | 17,600 | | 1,013,760 |
| NRG Energy, Inc. (a) | | | | 33,600 | | 1,583,232 |
| TXU Corp. | | | | 36,000 | | 1,806,840 |
| | | | | | | 5,524,596 |
| Multi-Utilities – 0.7% | | | | | | |
| PG&E Corp. | | | | 46,500 | | 1,726,080 |
| Public Service Enterprise Group, Inc. | | | | 16,800 | | 1,091,496 |
| | | | | | | 2,817,576 |
| |
| TOTAL UTILITIES | | | | | | 15,770,926 |
| |
| TOTAL COMMON STOCKS | | | | | | |
| (Cost $373,549,538) | | | | | | 399,924,432 |
| |
| Money Market Funds 7.1% | | | | | | |
| |
| Fidelity Cash Central Fund, 4.28% (b) | | | | 20,800,088 | | 20,800,088 |
| Fidelity Securities Lending Cash Central Fund, 4.35% (b)(c) | | | | 9,040,775 | | 9,040,775 |
| TOTAL MONEY MARKET FUNDS | | | | | | |
| (Cost $29,840,863) | | | | | | 29,840,863 |
| |
| TOTAL INVESTMENT PORTFOLIO 102.4% | | | | | | |
| (Cost $403,390,401) | | | | | | 429,765,295 |
| |
| NET OTHER ASSETS (2.4)% | | | | | | (10,178,173) |
| NET ASSETS 100% | | | | | | $ 419,587,122 |
| |
| |
| |
| |
| See accompanying notes which are an integral part of the financial statements. | | | | | | |
| |
| VIP Value Strategies Portfolio | | 14 | | | | |
Legend
(a) Non-income producing
(b) Affiliated fund that is available only to investment companies and other accounts managed by Fidelity Investments. The rate quoted is the annualized seven-day
yield of the fund at period end. A complete unaudited listing of the fund’s holdings as of its most recent quarter end is available upon request.
(c) Investment made with cash collateral received from securities on loan.
(d) Security or a portion of the security is on loan at period end.
|
Affiliated Central Funds
Information regarding income received by the fund from the affiliated Central funds during the period is as follows:
| Fund | | Income received |
| Fidelity Cash Central Fund | | $ 389,993 |
| Fidelity Securities Lending Cash Central Fund | | 232,947 |
| Total | | $ 622,940 |
Other Information
Distribution of investments by country of issue, as a percentage of total net assets, is as follows:
| United States of America | | 88.4% |
| Bermuda | | 2.3% |
| Cayman Islands | | 1.9% |
| Canada | | 1.7% |
| Netherlands | | 1.0% |
| Singapore | | 1.0% |
| Others (individually less than 1%) | | 3.7% |
| | | 100.0% |
See accompanying notes which are an integral part of the financial statements.
15 Annual Report
| VIP Value Strategies Portfolio | | | | | | |
| |
| Financial Statements | | | | | | |
| |
| |
| Statement of Assets and Liabilities | | | | | | |
| | | December 31, 2005 |
| |
| Assets | | | | | | |
| Investment in securities, at value (including securities loaned of $8,820,320) — | | | | | | |
| See accompanying schedule: | | | | | | |
| Unaffiliated issuers (cost $373,549,538) | | $ 399,924,432 | | | | |
| Affiliated Central Funds (cost $29,840,863) | | 29,840,863 | | | | |
| Total Investments (cost $403,390,401) | | | | $ | | 429,765,295 |
| Cash | | | | | | 21,906 |
| Receivable for investments sold | | | | | | 2,180,146 |
| Receivable for fund shares sold | | | | | | 106,434 |
| Dividends receivable | | | | | | 569,152 |
| Interest receivable | | | | | | 67,860 |
| Prepaid expenses | | | | | | 2,309 |
| Other receivables | | | | | | 33,810 |
| Total assets | | | | | | 432,746,912 |
| |
| Liabilities | | | | | | |
| Payable to custodian bank | | $ 108,699 | | | | |
| Payable for investments purchased | | 2,951,085 | | | | |
| Payable for fund shares redeemed | | 725,528 | | | | |
| Accrued management fee | | 200,752 | | | | |
| Distribution fees payable | | 46,444 | | | | |
| Other affiliated payables | | 38,561 | | | | |
| Other payables and accrued expenses | | 47,946 | | | | |
| Collateral on securities loaned, at value | | 9,040,775 | | | | |
| Total liabilities | | | | | | 13,159,790 |
| |
| Net Assets | | | | $ | | 419,587,122 |
| Net Assets consist of: | | | | | | |
| Paid in capital | | | | $ | | 320,923,022 |
| Undistributed net investment income | | | | | | 1,933,663 |
| Accumulated undistributed net realized gain (loss) on investments and foreign currency transactions | | | | | | 70,355,732 |
| Net unrealized appreciation (depreciation) on investments and assets and liabilities in foreign currencies | | | | | | 26,374,705 |
| Net Assets | | | | $ | | 419,587,122 |
| |
| Statement of Assets and Liabilities continued | | | | | | |
| | | December 31, 2005 |
| |
| Initial Class: | | | | | | |
| Net Asset Value, offering price | | | | | | |
| and redemption price | | | | | | |
| per share ($144,684,987 ÷ 10,326,393 shares) | | | | $ | | 14.01 |
| Service Class: | | | | | | |
| Net Asset Value, offering price | | | | | | |
| and redemption price | | | | | | |
| per share ($74,697,611 ÷ 5,346,846 shares) | | | | $ | | 13.97 |
| Service Class 2: | | | | | | |
| Net Asset Value, offering price | | | | | | |
| and redemption price | | | | | | |
| per share ($191,844,601 ÷ 13,683,501 shares) | | | | $ | | 14.02 |
| Investor Class: | | | | | | |
| Net Asset Value, offering price | | | | | | |
| and redemption price | | | | | | |
| per share ($8,359,923 ÷ 597,210 shares) | | | | $ | | 14.00 |
See accompanying notes which are an integral part of the financial statements.
| | |
| VIP Value Strategies Portfolio | | 16 |
| Statement of Operations | | | | | | | | |
| | | | | Year ended December 31, 2005 |
| |
| Investment Income | | | | | | | | |
| Dividends | | | | | | $ | | 4,734,192 |
| Interest | | | | | | | | 70,707 |
| Income from affiliated Central Funds | | | | | | | | 622,940 |
| Total income | | | | | | | | 5,427,839 |
| |
| Expenses | | | | | | | | |
| Management fee | | | $ | 2,594,389 | | | | |
| Transfer agent fees | | | | 306,694 | | | | |
| Distribution fees | | | | 556,542 | | | | |
| Accounting and security lending fees | | | | 193,557 | | | | |
| Independent trustees’ compensation | | | | 2,073 | | | | |
| Custodian fees and expenses | | | | 40,383 | | | | |
| Registration fees | | | | 163 | | | | |
| Audit | | | | 41,954 | | | | |
| Legal | | | | 1,727 | | | | |
| Interest | | | | 2,229 | | | | |
| Miscellaneous | | | | 72,820 | | | | |
| Total expenses before reductions | | | | 3,812,531 | | | | |
| Expense reductions | | | | (263,022) | | | | 3,549,509 |
| |
| Net investment income (loss) | | | | | | | | 1,878,330 |
| Realized and Unrealized Gain (Loss) | | | | | | | | |
| Net realized gain (loss) on: | | | | | | | | |
| Investment securities: | | | | | | | | |
| Unaffiliated issuers | | | | 72,845,294 | | | | |
| Foreign currency transactions | | | | (5,347) | | | | |
| Total net realized gain (loss) | | | | | | | | 72,839,947 |
| Change in net unrealized appreciation (depreciation) on: | | | | | | | | |
| Investment securities | | | | (69,115,224) | | | | |
| Assets and liabilities in foreign currencies | | | | (415) | | | | |
| Total change in net unrealized appreciation (depreciation) | | | | | | | | (69,115,639) |
| Net gain (loss) | | | | | | | | 3,724,308 |
| Net increase (decrease) in net assets resulting from operations | | | | | | $ | | 5,602,638 |
| |
| Statement of Changes in Net Assets | | | | | | | | |
| | | | | Year ended | | | | Year ended |
| | | | | December 31, | | | | December 31, |
| | | | | 2005 | | | | 2004 |
| Increase (Decrease) in Net Assets | | | | | | | | |
| Operations | | | | | | | | |
| Net investment income (loss) | | | $ | 1,878,330 | | $ | | (62,058) |
| Net realized gain (loss) | | | | 72,839,947 | | | | 16,912,160 |
| Change in net unrealized appreciation (depreciation) | | | | (69,115,639) | | | | 34,804,061 |
| Net increase (decrease) in net assets resulting from operations | | | | 5,602,638 | | | | 51,654,163 |
| Distributions to shareholders from net realized gain | | | | (16,781,184) | | | | (1,244,891) |
| Share transactions - net increase (decrease) | | | | (104,368,329) | | | | 73,713,633 |
| Total increase (decrease) in net assets | | | | (115,546,875) | | | | 124,122,905 |
| |
| Net Assets | | | | | | | | |
| Beginning of period | | | | 535,133,997 | | | | 411,011,092 |
| End of period (including undistributed net investment income of $1,933,663 and undistributed net investment income of | | | | | | |
| $120,127, respectively) | | | $ | 419,587,122 | | $ | | 535,133,997 |
See accompanying notes which are an integral part of the financial statements.
|
17 Annual Report
| Financial Highlights Initial Class | | | | | | | | |
| Years ended December 31, | | 2005 | | 2004 | | 2003 | | 2002F |
| Selected Per Share Data | | | | | | | | |
| Net asset value, beginning of period | | $ 14.13 | | $ 12.41 | | $ 7.91 | | $ 10.00 |
| Income from Investment Operations | | | | | | | | |
| Net investment income (loss)E | | 07 | | .01 | | —H | | .01 |
| Net realized and unrealized gain (loss) | | 28 | | 1.74 | | 4.58 | | (2.10) |
| Total from investment operations | | 35 | | 1.75 | | 4.58 | | (2.09) |
| Distributions from net realized gain | | (.47) | | (.03) | | (.08) | | — |
| Net asset value, end of period | | $ 14.01 | | $ 14.13 | | $ 12.41 | | $ 7.91 |
| Total ReturnB,C,D | | 2.66% | | 14.13% | | 57.91% | | (20.90)% |
| Ratios to Average Net AssetsG | | | | | | | | |
| Expenses before reductions | | 72% | | .71% | | .76% | | 1.43%A |
| Expenses net of fee waivers, if any | | 72% | | .71% | | .76% | | 1.00%A |
| Expenses net of all reductions | | 66% | | .70% | | .73% | | .95%A |
| Net investment income (loss) | | 54% | | .10% | | .02% | | .13%A |
| Supplemental Data | | | | | | | | |
| Net assets, end of period (000 omitted) | | $ 144,685 | | $ 229,764 | | $ 161,705 | | $ 1,191 |
| Portfolio turnover rate | | 109% | | 41% | | 47% | | 65%A |
A Annualized
B Total returns for periods of less than one year are not annualized.
C Total returns do not reflect charges attributable to your insurance company’s separate account. Inclusion of these charges would reduce the total returns shown.
D Total returns would have been lower had certain expenses not been reduced during the periods shown.
E Calculated based on average shares outstanding during the period.
F For the period February 20, 2002 (commencement of operations) to December 31, 2002.
G Expense ratios reflect operating expenses of the class. Expenses before reductions do not reflect amounts reimbursed by the investment adviser or reductions from brokerage service arrangements or other expense offset arrangements and do not
represent the amount paid by the class during periods when reimbursements or reductions occur. Expense ratios before reductions for start up periods may not be representative of longer term operating periods. Expenses net of fee waivers reflect
expenses after reimbursement by the investment adviser but prior to reductions from brokerage service arrangements or other expense offset arrangements. Expenses net of all reductions represent the net expenses paid by the class.
H Amount represents less than $.01 per share.
|
| Financial Highlights Service Class | | | | | | | | |
| Years ended December 31, | | 2005 | | 2004 | | 2003 | | 2002F |
| Selected Per Share Data | | | | | | | | |
| Net asset value, beginning of period | | $ 14.09 | | $ 12.39 | | $ 7.90 | | $ 10.00 |
| Income from Investment Operations | | | | | | | | |
| Net investment income (loss)E | | 06 | | —H | | (.01) | | —H |
| Net realized and unrealized gain (loss) | | 27 | | 1.73 | | 4.58 | | (2.10) |
| Total from investment operations | | 33 | | 1.73 | | 4.57 | | (2.10) |
| Distributions from net realized gain | | (.45) | | (.03) | | (.08) | | — |
| Net asset value, end of period | | $ 13.97 | | $ 14.09 | | $ 12.39 | | $ 7.90 |
| Total ReturnB,C,D | | 2.55% | | 13.99% | | 57.79% | | (21.00)% |
| Ratios to Average Net AssetsG | | | | | | | | |
| Expenses before reductions | | 82% | | .81% | | .84% | | 1.52%A |
| Expenses net of fee waivers, if any | | 82% | | .81% | | .84% | | 1.10%A |
| Expenses net of all reductions | | 76% | | .80% | | .81% | | 1.05%A |
| Net investment income (loss) | | 44% | | —% | | (.06)% | | .03%A |
| Supplemental Data | | | | | | | | |
| Net assets, end of period (000 omitted) | | $ 74,698 | | $ 98,542 | | $ 83,146 | | $ 9,774 |
| Portfolio turnover rate | | 109% | | 41% | | 47% | | 65%A |
A Annualized
B Total returns for periods of less than one year are not annualized.
C Total returns do not reflect charges attributable to your insurance company’s separate account. Inclusion of these charges would reduce the total returns shown.
D Total returns would have been lower had certain expenses not been reduced during the periods shown.
E Calculated based on average shares outstanding during the period.
F For the period February 20, 2002 (commencement of operations) to December 31, 2002.
G Expense ratios reflect operating expenses of the class. Expenses before reductions do not reflect amounts reimbursed by the investment adviser or reductions from brokerage service arrangements or other expense offset arrangements and do not
represent the amount paid by the class during periods when reimbursements or reductions occur. Expense ratios before reductions for start up periods may not be representative of longer term operating periods. Expenses net of fee waivers reflect
expenses after reimbursement by the investment adviser but prior to reductions from brokerage service arrangements or other expense offset arrangements. Expenses net of all reductions represent the net expenses paid by the class.
H Amount represents less than $.01 per share.
|
See accompanying notes which are an integral part of the financial statements.
| | |
| VIP Value Strategies Portfolio | | 18 |
| Financial Highlights Service Class 2 | | | | | | | | |
| Years ended December 31, | | 2005 | | 2004 | | 2003 | | 2002F |
| Selected Per Share Data | | | | | | | | |
| Net asset value, beginning of period | | $ 14.14 | | $ 12.45 | | $ 7.95 | | $ 10.00 |
| Income from Investment Operations | | | | | | | | |
| Net investment income (loss)E | | 04 | | (.02) | | (.02) | | (.01) |
| Net realized and unrealized gain (loss) | | 28 | | 1.74 | | 4.58 | | (2.04) |
| Total from investment operations | | 32 | | 1.72 | | 4.56 | | (2.05) |
| Distributions from net realized gain | | (.44) | | (.03) | | (.06) | | — |
| Net asset value, end of period | | $ 14.02 | | $ 14.14 | | $ 12.45 | | $ 7.95 |
| Total ReturnB,C,D | | 2.43% | | 13.84% | | 57.36% | | (20.50)% |
| Ratios to Average Net AssetsG | | | | | | | | |
| Expenses before reductions | | 97% | | .97% | | .99% | | 1.68%A |
| Expenses net of fee waivers, if any | | 97% | | .97% | | .99% | | 1.25%A |
| Expenses net of all reductions | | 91% | | .95% | | .96% | | 1.21%A |
| Net investment income (loss) | | 29% | | (.15)% | | (.21)% | | (.12)%A |
| Supplemental Data | | | | | | | | |
| Net assets, end of period (000 omitted) | | $ 191,845 | | $ 206,828 | | $ 166,160 | | $ 43,505 |
| Portfolio turnover rate | | 109% | | 41% | | 47% | | 65%A |
A Annualized
B Total returns for periods of less than one year are not annualized.
C Total returns do not reflect charges attributable to your insurance company’s separate account. Inclusion of these charges would reduce the total returns shown.
D Total returns would have been lower had certain expenses not been reduced during the periods shown.
E Calculated based on average shares outstanding during the period.
F For the period February 20, 2002 (commencement of operations) to December 31, 2002.
G Expense ratios reflect operating expenses of the class. Expenses before reductions do not reflect amounts reimbursed by the investment adviser or reductions from brokerage service arrangements or other expense offset arrangements and do not
represent the amount paid by the class during periods when reimbursements or reductions occur. Expense ratios before reductions for start up periods may not be representative of longer term operating periods. Expenses net of fee waivers reflect
expenses after reimbursement by the investment adviser but prior to reductions from brokerage service arrangements or other expense offset arrangements. Expenses net of all reductions represent the net expenses paid by the class.
|
| Financial Highlights Investor Class | | |
| |
| Year ended December 31, | | 2005F |
| Selected Per Share Data | | |
| Net asset value, beginning of period | | $ 13.59 |
| Income from Investment Operations | | |
| Net investment income (loss)E | | 02 |
| Net realized and unrealized gain (loss) | | 39 |
| Total from investment operations | | 41 |
| Net asset value, end of period | | $ 14.00 |
| Total ReturnB,C,D | | 3.02% |
| Ratios to Average Net AssetsG | | |
| Expenses before reductions | | 93%A |
| Expenses net of fee waivers, if any | | 93%A |
| Expenses net of all reductions | | 87%A |
| Net investment income (loss) | | 35%A |
| Supplemental Data | | |
| Net assets, end of period (000 omitted) | | $ 8,360 |
| Portfolio turnover rate | | 109% |
A Annualized
B Total returns for periods of less than one year are not annualized.
C Total returns do not reflect charges attributable to your insurance company’s separate account. Inclusion of these charges would reduce the total returns shown.
D Total returns would have been lower had certain expenses not been reduced during the periods shown.
E Calculated based on average shares outstanding during the period.
F For the period July 21, 2005 (commencement of sale of shares) to December 31, 2005.
G Expense ratios reflect operating expenses of the class. Expenses before reductions do not reflect amounts reimbursed by the investment adviser or reductions from brokerage service arrangements or other expense offset arrangements and do not
represent the amount paid by the class during periods when reimbursements or reductions occur. Expense ratios before reductions for start up periods may not be representative of longer term operating periods. Expenses net of fee waivers reflect
expenses after reimbursement by the investment adviser but prior to reductions from brokerage service arrangments or other expense offset arrangements. Expenses net of all reductions represent the net expenses paid by the class.
|
See accompanying notes which are an integral part of the financial statements.
|
19 Annual Report
Notes to Financial Statements
For the period ended December 31, 2005
|
1. Significant Accounting Policies.
|
VIP Value Strategies Portfolio (the fund) is a fund of Variable Insurance Products Fund III (the trust) (referred to in this report as VIP Value Strategies Portfolio) and is authorized to issue an unlimited number of shares. The trust is registered under the Investment Company Act of 1940, as amended (the 1940 Act), as an open end management investment company organized as a Massachusetts business trust. Shares of the fund may only be pur chased by insurance companies for the purpose of funding variable annuity or variable life insurance contracts. The fund offers the following classes of shares: Initial Class shares, Service Class shares, Service Class 2 shares, and Investor Class. The fund commenced sale of Investor Class shares on July 21, 2005. All classes have equal rights and voting privileges, except for matters affecting a single class. Investment income, realized and unrealized capital gains and losses, the common expenses of the fund, and certain fund level expense reductions, if any, are allocated on a pro rata basis to each class based on the relative net assets of each class to the total net assets of the fund. Each class differs with respect to transfer agent and distribution and service plan fees incurred. Certain expense reductions also differ by class.
The fund may invest in affiliated money market central funds (Money Market Central Funds), which are open end investment companies available to investment companies and other accounts managed by Fidelity Management & Research Company (FMR) and its affiliates. The financial statements have been prepared in conformity with accounting principles generally accepted in the United States of America, which require management to make certain estimates and assumptions at the date of the financial statements. The following summarizes the significant accounting policies of the fund:
Security Valuation. Investments are valued and net asset value (NAV) per share is calculated (NAV calculation) as of the close of business of the New York Stock Exchange (NYSE), normally 4:00 p.m. Eastern time. Wherever possible, the fund uses independent pricing services approved by the Board of Trustees to value its investments. Equity securities, including restricted securities, for which market quotations are readily available, are valued at the last reported sale price or official closing price as reported by an independent pricing service on the primary market or exchange on which they are traded. In the event there were no sales during the day or closing prices are not available, securities are valued at the last quoted bid price. Investments in open end mutual funds, including Central Funds, are valued at their closing net asset value each business day. Short term securities with remaining maturities of sixty days or less for which quotations are not readily available are valued at amortized cost, which approximates value.
When current market prices or quotations are not readily available or do not accurately reflect fair value, valuations may be determined in accordance with procedures adopted by the Board of Trustees. For example, when developments occur between the close of a market and the close of the NYSE that may materially affect the value of some or all of the securities, or when trading in a security is halted, those securities may be fair valued. Factors used in the determination of fair value may include monitoring news to identify significant market or security specific events such as changes in the value of U.S. securities markets, reviewing developments in foreign markets and evaluating the performance of ADRs, futures contracts and exchange-traded funds. Because the fund’s utilization of fair value pricing depends on market activity, the frequency with which fair value pricing is used can not be predicted and may be utilized to a significant extent. The value of securities used for NAV calculation under fair value pricing may differ from published prices for the same securities.
Foreign Currency. The fund uses foreign currency contracts to facilitate transactions in foreign denominated securities. Losses from these transac tions may arise from changes in the value of the foreign currency or if the counterparties do not perform under the contracts’ terms.
Foreign denominated assets, including investment securities, and liabilities are translated into U.S. dollars at the exchange rate at period end. Pur chases and sales of investment securities, income and dividends received and expenses denominated in foreign currencies are translated into U.S. dollars at the exchange rate in effect on the transaction date.
The effects of exchange rate fluctuations on investments are included with the net realized and unrealized gain (loss) on investment securities. Other foreign currency transactions resulting in realized and unrealized gain (loss) are disclosed separately.
Investment Transactions and Income. Security transactions are accounted for as of trade date. Gains and losses on securities sold are determined on the basis of identified cost. Dividend income is recorded on the ex dividend date, except for certain dividends from foreign securities where the ex dividend date may have passed, which are recorded as soon as the fund is informed of the ex dividend date. Non cash dividends included in dividend income, if any, are recorded at the fair market value of the securities received. Distributions received on securities that represent a return of capital or capital gain are recorded as a reduction of cost of investments and/or as a realized gain. The fund estimates the components of distributions received that may be considered return of capital distributions or capital gain distributions. Interest income is accrued as earned. Interest income includes coupon interest and amortization of premium and accretion of discount on debt securities. Investment income is recorded net of foreign taxes withheld where recovery of such taxes is uncertain.
Expenses. Most expenses of the trust can be directly attributed to a fund. Expenses which cannot be directly attributed are apportioned among each fund in the trust.
VIP Value Strategies Portfolio
|
1. Significant Accounting Policies continued
|
Income Tax Information and Distributions to Shareholders. Each year, the fund intends to qualify as a regulated investment company by distrib uting all of its taxable income and realized gains under Subchapter M of the Internal Revenue Code. As a result, no provision for income taxes is required in the accompanying financial statements. Foreign taxes are provided for based on the fund’s understanding of the tax rules and rates that exist in the foreign markets in which it invests.
Distributions are recorded on the ex dividend date. Income dividends and capital gain distributions are declared separately for each class. Income and capital gain distributions are determined in accordance with income tax regulations, which may differ from generally accepted accounting principles.
Capital accounts within the financial statements are adjusted for permanent book tax differences. These adjustments have no impact on net assets or the results of operations. Temporary book tax differences will reverse in a subsequent period.
Book tax differences are primarily due to foreign currency transactions, market discount and losses deferred due to wash sales.
| | | | |
| The tax basis components of distributable earnings and the federal tax cost as of period end were as follows: | | | | | | |
| |
| Unrealized appreciation | | | $ | 40,746,711 | | | | |
| Unrealized depreciation | | | | (15,092,619) | | | | |
| Net unrealized appreciation (depreciation) | | | | 25,654,092 | | | | |
| Undistributed ordinary income | | | | 10,229,062 | | | | |
| Undistributed long term capital gain | | | | 62,780,947 | | | | |
| |
| Cost for federal income tax purposes | | | $ | 404,111,203 | | | | |
| The tax character of distributions paid was as follows: | | | | | | | | |
| |
| | | | | December 31, 2005 | | | | December 31, 2004 |
| Ordinary Income | | | $ | 1,132,407 | | $ | | 602,366 |
| Long term Capital Gains | | | | 15,648,777 | | | | 642,525 |
| Total | | | $ | 16,781,184 | | $ | | 1,244,891 |
| |
| 2. Operating Policies. | | | | | | | | |
Repurchase Agreements. FMR has received an Exemptive Order from the Securities and Exchange Commission (the SEC) which permits the fund and other affiliated entities of FMR to transfer uninvested cash balances into joint trading accounts which are then invested in repurchase agreements. The fund may also invest directly with institutions in repurchase agreements. Repurchase agreements are collateralized by government or non government securities. Collateral is held in segregated accounts with custodian banks and may be obtained in the event of a default of the counterparty. The fund monitors, on a daily basis, the value of the collateral to ensure it is at least equal to the principal amount of the repurchase agreement (including accrued interest). In the event of a default by the counterparty, realization of the collateral proceeds could be delayed, during which time the value of the collateral may decline.
3. Purchases and Sales of Investments.
Purchases and sales of securities, other than short term securities and U.S. government securities, aggregated $485,112,997 and $613,501,314, respectively.
4. Fees and Other Transactions with Affiliates.
Management Fee. FMR and its affiliates provide the fund with investment management related services for which the fund pays a monthly manage ment fee. The management fee is the sum of an individual fund fee rate that is based on an annual rate of .30% of the fund’s average net assets and a group fee rate that averaged .27% during the period. The group fee rate is based upon the average net assets of all the mutual funds advised by FMR. The group fee rate decreases as assets under management increase and increases as assets under management decrease. For the period, the total annual management fee rate was .57% of the fund’s average net assets.
Distribution and Service Plan. In accordance with Rule 12b 1 of the 1940 Act, the fund has adopted separate 12b 1 Plans for each Service Class of shares. Each Service Class pays Fidelity Distributors Corporation (FDC), an affiliate of FMR, a service fee. For the period, the service fee is based on an annual rate of .10% of Service Class’ average net assets and .25% of Service Class 2’s average net assets.
21 Annual Report
| Notes to Financial Statements continued | | |
| |
| 4. Fees and Other Transactions with Affiliates continued |
| Distribution and Service Plan continued | | |
For the period, each class paid FDC the following amounts, all of which were re allowed to insurance companies for the distribution of shares and providing shareholder support services:
| Service Class | | | $ | 78,135 |
| Service Class 2 | | | | 478,407 |
| | | | $ | 556,542 |
Transfer Agent Fees. Fidelity Investments Institutional Operations Company, Inc. (FIIOC), an affiliate of FMR, is the fund’s transfer, dividend disbursing, and shareholder servicing agent. FIIOC receives an asset based fee with respect to each class. FIIOC pays a portion of the expenses related to the typesetting, printing and mailing of shareholder reports, except proxy statements. Each class with the exception of Investor Class pays a transfer agent fee, excluding out of pocket expenses, equal to an annual rate of ..07% of their month end net assets. Investor Class pays an asset based transfer agent fee of .18% of its month end net assets. The total transfer agent fees paid by each class to FIIOC, including out of pocket expenses, were as follows:
| Initial Class | | | $ | 121,668 |
| Service Class | | | | 51,107 |
| Service Class 2 | | | | 130,843 |
| Investor Class | | | | 3,076 |
| | | | $ | 306,694 |
Accounting and Security Lending Fees. Fidelity Service Company, Inc. (FSC), an affiliate of FMR, maintains the fund’s accounting records. The accounting fee is based on the level of average net assets for the month. Under a separate contract, FSC administers the security lending program. The security lending fee is based on the number and duration of lending transactions.
Affiliated Central Funds. The fund may invest in Money Market Central Funds which seek preservation of capital and current income and are managed by Fidelity Investments Money Management, Inc. (FIMM), an affiliate of FMR. The Money Market Central Funds do not pay a management fee.
Brokerage Commissions. The fund placed a portion of its portfolio transactions with brokerage firms which are affiliates of the investment adviser. The commissions paid to these affiliated firms were $49,681 for the period.
Interfund Lending Program. Pursuant to an Exemptive Order issued by the SEC, the fund, along with other registered investment companies having management contracts with FMR, may participate in an interfund lending program. This program provides an alternative credit facility allowing the funds to borrow from, or lend money to, other participating affiliated funds. At period end, there were no interfund loans outstanding. The fund’s activity in this program during the period for which loans were outstanding was as follows:
| | | Average Daily | | Weighted Average | | | | Interest |
| Borrower or Lender | | Loan Balance | | Interest Rate | | | | Expense |
| Borrower | | $ 24,072,000 | | 3.33% | | | $ | 2,229 |
| |
| 5. Committed Line of Credit. | | | | | | | | |
The fund participates with other funds managed by FMR in a $4.2 billion credit facility (the “line of credit”) to be utilized for temporary or emergency purposes to fund shareholder redemptions or for other short term liquidity purposes. The fund has agreed to pay commitment fees on its pro rata portion of the line of credit. During the period, there were no borrowings on this line of credit.
The fund lends portfolio securities from time to time in order to earn additional income. On the settlement date of the loan, the fund receives collateral (in the form of U.S. Treasury obligations, letters of credit and/or cash) against the loaned securities and maintains collateral in an amount not less than 100% of the market value of the loaned securities during the period of the loan. The market value of the loaned securities is determined at the close of business of the fund and any additional required collateral is delivered to the fund on the next business day. If the borrower defaults on its obligation to return the securities loaned because of insolvency or other reasons, a fund could experience delays and costs in recovering the securities loaned or in gaining access to the collateral. Any cash collateral received is invested in the Fidelity Securities Lending Cash Central Fund. The value of loaned securities and cash collateral at period end are disclosed on the fund’s Statement of Assets and Liabilities. Security lending income represents the income earned on investing cash collateral, less fees and expenses associated with the loan, plus any premium payments that may be received on the loan of certain types of securities. Net income from lending portfolio securities during the period amounted to $232,947.
VIP Value Strategies Portfolio
|
Many of the brokers with whom FMR places trades on behalf of the fund provided services to the fund in addition to trade execution. These services included payments of certain expenses on behalf of the fund totaling $263,022 for the period.
The fund’s organizational documents provide former and current trustees and officers with a limited indemnification against liabilities arising in connection with the performance of their duties to the fund. In the normal course of business, the fund may also enter into contracts that provide general indemnifications. The fund’s maximum exposure under these arrangements is unknown as this would be dependent on future claims that may be made against the fund. The risk of material loss from such claims is considered remote.
At the end of the period, FMR or its affiliates were the owners of record of 35% of the total outstanding shares of the fund and two otherwise unaffiliated shareholders were the owners of record of 58% of the total outstanding shares of the fund.
| 9. Distributions to Shareholders. | | | | | | | | | | |
| |
| Distributions to shareholders of each class were as follows: | | | | | | | | | | |
| |
| | | | | | | Years ended December 31, |
| | | | | | | 2005 | | | | 2004 |
| From net realized gain | | | | | | | | | | |
| Initial Class | | | | | | $ 7,370,772 | | | $ | 553,633 |
| Service Class | | | | | | 2,939,666 | | | | 255,600 |
| Service Class 2 | | | | | | 6,470,746 | | | | 435,658 |
| Total | | | | | | $ 16,781,184 | | | $ | 1,244,891 |
| |
| 10. Share Transactions. | | | | | | | | | | |
| |
| Transactions for each class of shares were as follows: | | | | | | | | | | |
| |
| | | Shares | | Dollars |
| | | Years ended December 31, | | Years ended December 31, |
| | | 2005A | | 2004 | | 2005A | | | | 2004 |
| Initial Class | | | | | | | | | | |
| Shares sold | | 941,313 | | 8,638,945 | | $ 12,576,015 | | | $ | 114,457,333 |
| Reinvestment of distributions | | 561,369 | | 41,752 | | 7,370,772 | | | | 553,633 |
| Shares redeemed | | (7,437,088) | | (5,449,797) | | (99,160,238) | | | | (66,862,947) |
| Net increase (decrease) | | (5,934,406) | | 3,230,900 | | $ (79,213,451) | | | $ | 48,148,019 |
| Service Class | | | | | | | | | | |
| Shares sold | | 1,858,986 | | 6,485,433 | | $ 24,697,179 | | | $ | 84,977,022 |
| Reinvestment of distributions | | 224,402 | | 19,320 | | 2,939,666 | | | | 255,600 |
| Shares redeemed | | (3,731,194) | | (6,222,992) | | (49,009,601) | | | | (77,150,508) |
| Net increase (decrease) | | (1,647,806) | | 281,761 | | $ (21,372,756) | | | $ | 8,082,114 |
| Service Class 2 | | | | | | | | | | |
| Shares sold | | 2,865,534 | | 5,436,667 | | $ 38,335,617 | | | $ | 70,002,702 |
| Reinvestment of distributions | | 491,325 | | 32,756 | | 6,470,746 | | | | 435,658 |
| Shares redeemed | | (4,298,816) | | (4,188,055) | | (56,604,579) | | | | (52,954,860) |
| Net increase (decrease) | | (941,957) | | 1,281,368 | | $ (11,798,216) | | | $ | 17,483,500 |
| Investor Class | | | | | | | | | | |
| Shares sold | | 620,546 | | — | | $ 8,330,815 | | | $ | — |
| Shares redeemed | | (23,336) | | — | | (314,721) | | | | — |
| Net increase (decrease) | | 597,210 | | — | | $ 8,016,094 | | | $ | — |
| |
| A Share transactions for Investor Class are for the period July 21, 2005 (commencement of sale of shares) to December 31, 2005. | | | | | | | | | | |
23 Annual Report
Report of Independent Registered Public Accounting Firm
To the Trustees of Variable Insurance Products Fund III and Shareholders of VIP Value Strategies Portfolio:
We have audited the accompanying statement of assets and liabilities of VIP Value Strategies Portfolio (the Fund), a fund of Variable Insurance Products Fund III, including the schedule of investments as of December 31, 2005, and the related statement of operations for the year then ended, the statement of changes in net assets for each of the two years in the period then ended, and the financial highlights for each of the three years in the period then ended, and from February 20, 2002 (commencement of operations) to December 31, 2002. These financial statements and financial highlights are the responsibility of the Fund’s management. Our responsibility is to express an opinion on these financial statements and financial highlights based on our audits.
We conducted our audits in accordance with standards of the Public Company Accounting Oversight Board (United States). Those standards require that we plan and perform the audit to obtain reasonable assurance about whether the financial statements and financial highlights are free of material misstatement. The Fund is not required to have, nor were we engaged to perform, an audit of its internal control over financial reporting. Our audits included consideration of internal control over financial reporting as a basis for designing audit procedures that are appropriate in the circumstances, but not for the purpose of expressing an opinion on the effectiveness of the Fund’s internal control over financial reporting. Accordingly, we express no such opinion. An audit also includes examining, on a test basis, evidence supporting the amounts and disclosures in the financial statements, assessing the accounting principles used and significant estimates made by management, as well as evaluating the overall financial statement presentation. Our procedures included confirmation of securities owned as of December 31, 2005, by correspondence with the custodians and brokers; where replies were not received from brokers, we performed other auditing procedures. We believe that our audits provide a reasonable basis for our opinion.
In our opinion, the financial statements and financial highlights referred to above present fairly, in all material respects, the financial position of VIP Value Strategies Portfolio as of December 31, 2005, the results of its operations for the year then ended, the changes in its net assets for each of the two years in the period then ended, and its financial highlights for each of the three years in the period then ended, and from February 20, 2002 (com mencement of operations) to December 31, 2002, in conformity with accounting principles generally accepted in the United States of America.
/s/ Deloitte & Touche LLP
DELOITTE & TOUCHE LLP
Boston, Massachusetts
February 14, 2006
|
VIP Value Strategies Portfolio
|
The Trustees, Member of the Advisory Board, and executive officers of the trust and fund, as applicable, are listed below. The Board of Trustees governs the fund and is responsible for protecting the interests of shareholders. The Trustees are experienced executives who meet periodically throughout the year to oversee the fund’s activities, review contractual arrangements with companies that provide services to the fund, and review the fund’s performance. Except for William O. McCoy and Albert R. Gamper, Jr., each of the Trustees oversees 326 funds advised by FMR or an affiliate. Mr. McCoy oversees 328 funds advised by FMR or an affiliate. Mr. Gamper oversees 235 funds advised by FMR or an affiliate.
The Trustees hold office without limit in time except that (a) any Trustee may resign; (b) any Trustee may be removed by written instrument, signed by at least two thirds of the number of Trustees prior to such removal; (c) any Trustee who requests to be retired or who has become inca pacitated by illness or injury may be retired by written instrument signed by a majority of the other Trustees; and (d) any Trustee may be removed at any special meeting of shareholders by a two thirds vote of the outstanding voting securities of the trust. Each Trustee who is not an interested person (as defined in the 1940 Act) (Independent Trustee), shall retire not later than the last day of the calendar year in which his or her 72nd birthday occurs. The Independent Trustees may waive this mandatory retirement age policy with respect to individual Trustees. The executive officers and Advisory Board Member hold office without limit in time, except that any officer and Advisory Board Member may resign or may be removed by a vote of a majority of the Trustees at any regular meeting or any special meeting of the Trustees. Except as indicated, each individual has held the office shown or other offices in the same company for the past five years.
The fund’s Statement of Additional Information (SAI) includes more information about the Trustees. To request a free copy, call Fidelity at 1-877-208-0098.
Interested Trustees*:
Correspondence intended for each Trustee who is an interested person may be sent to Fidelity Investments, 82 Devonshire Street, Boston, Massachusetts 02109.
| | Name, Age; Principal Occupation
Edward C. Johnson 3d (75)
|
Year of Election or Appointment: 1994
Mr. Johnson is Chairman of the Board of Trustees. Mr. Johnson serves as Chief Executive Officer, Chairman, and a Director of FMR Corp.; a Director and Chairman of the Board and of the Executive Committee of FMR; Chairman and a Director of Fidelity Man agement & Research (Far East) Inc.; Chairman and a Director of Fidelity Investments Money Management, Inc.; and Chairman (2001 present) and a Director (2000 present) of FMR Co., Inc.
Year of Election or Appointment: 2005
Mr. Jonas is Senior Vice President of VIP Value Strategies (2005 present). He also serves as Senior Vice President of other Fidelity funds (2005 present). Mr. Jonas is Executive Director of FMR (2005 present). Previously, Mr. Jonas served as President of Fidelity Enterprise Operations and Risk Services (2004 2005), Chief Administrative Officer (2002 2004), and Chief Financial Officer of FMR Co. (1998 2000). Mr. Jonas has been with Fidelity Investments since 1987 and has held various financial and management positions including Chief Financial Officer of FMR. In addition, he serves on the Boards of Boston Ballet (2003 present) and Simmons College (2003 present).
Year of Election or Appointment: 2003
Mr. Reynolds is a Director (2003 present) and Chief Operating Officer (2002 present) of FMR Corp. He also serves on the Board at Fidelity Investments Canada, Ltd. (2000 present). Previously, Mr. Reynolds served as President of Fidelity Investments Institutional Retirement Group (1996 2000).
* Trustees have been determined to be “Interested Trustees” by virtue of, among other things, their affiliation with the trust or various entities under common control with FMR.
25 Annual Report
Trustees and Officers - continued
Independent Trustees:
|
Correspondence intended for each Independent Trustee (that is, the Trustees other than the Interested Trustees) may be sent to Fidelity Investments, P.O. Box 55235, Boston, Massachusetts 02205-5235.
| | Name, Age; Principal Occupation
Dennis J. Dirks (57)
|
Year of Election or Appointment: 2005
Prior to his retirement in May 2003, Mr. Dirks was Chief Operating Officer and a member of the Board of The Depository Trust & Clearing Corporation (DTCC) (1999 2003). He also served as President, Chief Operating Officer, and Board member of The Depository Trust Company (DTC) (1999 2003) and President and Board member of the National Securities Clearing Corporation (NSCC) (1999 2003). In addition, Mr. Dirks served as Chief Executive Officer and Board member of the Government Securities Clearing Corporation (2001 2003) and Chief Executive Officer and Board member of the Mortgage Backed Securities Clearing Corporation (2001 2003). Mr. Dirks also serves as a Trustee of Manhattan College (2005 present).
| | Albert R. Gamper, Jr. (63)
|
Year of Election or Appointment: 2006
Mr. Gamper also serves as a Trustee (2006 present) or Member of the Advisory Board (2005 present) of other investment companies advised by FMR. Prior to his retirement in December 2004, Mr. Gamper served as Chairman of the Board of CIT Group Inc. (commercial finance). During his tenure with CIT Group Inc. Mr. Gamper served in numerous senior management positions, includ ing Chairman (1987 1989; 1999 2001; 2002 2004), Chief Executive Officer (1987 2004), and President (1989 2002). He currently serves as a member of the Board of Directors of Public Service Enterprise Group (utilities, 2001 present), Chairman of the Board of Governors, Rutgers University (2004 present), and Chairman of the Board of Saint Barnabas Health Care System.
Year of Election or Appointment: 1997
Dr. Gates is Chairman of the Independent Trustees (2006 present). Dr. Gates is President of Texas A&M University (2002 present). He was Director of the Central Intelligence Agency (CIA) from 1991 to 1993. From 1989 to 1991, Dr. Gates served as Assistant to the President of the United States and Deputy National Security Advisor. Dr. Gates is a Director of NACCO Industries, Inc. (mining and manufacturing), Parker Drilling Co., Inc. (drilling and rental tools for the energy industry, 2001 present), and Brinker International (restaurant management, 2003 present). Previously, Dr. Gates served as a Director of LucasVarity PLC (automotive components and diesel engines), a Director of TRW Inc. (automotive, space, defense, and information technology), and Dean of the George Bush School of Government and Public Service at Texas A&M University (1999 2001). Dr. Gates also is a Trustee of the Forum for International Policy.
Year of Election or Appointment: 2004
Dr. Heilmeier is Chairman Emeritus of Telcordia Technologies (communication software and systems), where prior to his retirement, he served as company Chairman and Chief Executive Officer. He currently serves on the Boards of Directors of The Mitre Corpo ration (systems engineering and information technology support for the government), and HRL Laboratories (private research and development, 2004 present). He is Chairman of the General Motors Science & Technology Advisory Board and a Life Fellow of the Institute of Electrical and Electronics Engineers (IEEE) (2000 present). Dr. Heilmeier is a member of the Defense Science Board and the National Security Agency Advisory Board. He is also a member of the National Academy of Engineering, the American Academy of Arts and Sciences, and the Board of Overseers of the School of Engineering and Applied Science of the University of Pennsylvania. Previously, Dr. Heilmeier served as a Director of TRW Inc. (automotive, space, defense, and information technology, 1992 2002), Compaq (1994 2002), Automatic Data Processing, Inc. (ADP) (technology based business outsourcing, 1995 2002), INET Technologies Inc. (telecommunications network surveillance, 2001 2004), and Teletech Holdings (customer management services). He is the recipient of the 2005 Kyoto Prize in Advanced Technology for his invention of the liquid display.
Year of Election or Appointment: 2001
Prior to Ms. Knowles’ retirement in June 2000, she served as Executive Vice President and Chief Financial Officer of Atlantic Richfield Company (ARCO) (diversified energy, 1996 2000). From 1993 to 1996, she was a Senior Vice President of ARCO and President of ARCO Transportation Company. She served as a Director of ARCO from 1996 to 1998. She currently serves as a Director of Phelps Dodge Corporation (copper mining and manufacturing) and McKesson Corporation (healthcare service, 2002 present). Ms. Knowles is a Trustee of the Brookings Institution and the Catalina Island Conservancy and also serves as a member of the Advisory Board for the School of Engineering of the University of Southern California.
VIP Value Strategies Portfolio
|
Name, Age; Principal Occupation
Ned C. Lautenbach (61)
|
Year of Election or Appointment: 2000
Mr. Lautenbach has been a partner of Clayton, Dubilier & Rice, Inc. (private equity investment firm) since September 1998. Previously, Mr. Lautenbach was with the International Business Machines Corporation (IBM) from 1968 until his retirement in 1998. Mr. Lautenbach serves as a Director of Italtel Holding S.p.A. (telecommunications (Milan, Italy), 2004 present) and Eaton Corpora tion (diversified industrial) as well as the Philharmonic Center for the Arts in Naples, Florida. He also is a member of the Board of Trustees of Fairfield University (2005 present), as well as a member of the Council on Foreign Relations.
Year of Election or Appointment: 1997
Prior to his retirement in December 1994, Mr. McCoy was Vice Chairman of the Board of BellSouth Corporation (telecommu nications) and President of BellSouth Enterprises. He is currently a Director of Liberty Corporation (holding company), Duke Realty Corporation (real estate), and Progress Energy, Inc. (electric utility). He is also a partner of Franklin Street Partners (private invest ment management firm) and a member of the Research Triangle Foundation Board. In addition, Mr. McCoy served as the Interim Chancellor (1999 2000) and a member of the Board of Visitors for the University of North Carolina at Chapel Hill and currently serves on the Board of Directors of the University of North Carolina Health Care System and the Board of Visitors of the Kenan Flagler Business School (University of North Carolina at Chapel Hill). He also served as Vice President of Finance for the University of North Carolina (16 school system).
Year of Election or Appointment: 2005
Ms. Small is a member (2000 present) and Chairperson (2002 present) of the Investment Committee, and a member (2002 present) of the Board of Trustees of Smith College. Previously, she served as Chief Investment Officer (1999 2000), Director of Global Equity Investments (1996 1999), and a member of the Board of Directors of Scudder, Stevens & Clark (1990 1997) and Scudder Kemper Investments (1997 1998). In addition, Ms. Small served as Co Chair (2000 2003) of the Annual Fund for the Fletcher School of Law and Diplomacy.
William S. Stavropoulos (66)
|
Year of Election or Appointment: 2002
Mr. Stavropoulos is Chairman of the Board (2000 present) and a Member of the Board of Directors of The Dow Chemical Company. Since joining The Dow Chemical Company in 1967, Mr. Stavropoulos served in numerous senior management positions, including President (1993 2000; 2002 2003), CEO (1995 2000; 2002 2004), and Chairman of the Executive Committee (2000 2004). Currently, he is a Director of NCR Corporation (data warehousing and technology solutions), BellSouth Corporation (telecommu nications), Chemical Financial Corporation, Maersk Inc. (industrial conglomerate, 2002 present), and Metalmark Capital (private equity investment firm, 2005 present). He also serves as a member of the Board of Trustees of the American Enterprise Institute for Public Policy Research. In addition, Mr. Stavropoulos is a member of The Business Council, J.P. Morgan International Council and the University of Notre Dame Advisory Council for the College of Science.
Year of Election or Appointment: 2005
Prior to his retirement in 2001, Mr. Wolfe was Chairman and Chief Executive Officer of Hershey Foods Corporation (1993 2001). He currently serves as a member of the boards of Adelphia Communications Corporation (2003 present), Bausch & Lomb, Inc., and Revlon Inc. (2004 present).
27 Annual Report
Trustees and Officers - continued
|
Advisory Board Member and Executive Officers:
Correspondence intended for each executive officer and Mr. Lynch may be sent to Fidelity Investments, 82 Devonshire Street, Boston, Massachusetts 02109.
| | Name, Age; Principal Occupation
Peter S. Lynch (61)
|
Year of Election or Appointment: 2003
Member of the Advisory Board of Variable Insurance Products Fund III. Vice Chairman and a Director of FMR, and Vice Chairman (2001 present) and a Director (2000 present) of FMR Co., Inc. Previously, Mr. Lynch served as a Trustee of the Fidelity funds (1990 2003). In addition, he serves as a Trustee of Boston College, Massachusetts Eye & Ear Infirmary, Historic Deerfield, John F. Kennedy Library, and the Museum of Fine Arts of Boston.
Year of Election or Appointment: 2005
Vice President of VIP Value Strategies. Mr. Churchill also serves as Vice President of certain Equity Funds (2005 present) and certain High Income Funds (2005 present). Previously, he served as Head of Fidelity’s Fixed Income Division (2000 2005), Vice President of Fidelity’s Money Market Funds (2000 2005), Vice President of Fidelity’s Bond Funds, and Senior Vice President of FIMM (2000) and FMR. Mr. Churchill joined Fidelity in 1993 as Vice President and Group Leader of Taxable Fixed Income Investments.
Year of Election or Appointment: 2005
Vice President of VIP Value Strategies. Mr. Fentin also serves as Vice President of other funds advised by FMR. Prior to assuming his current responsibilities, Mr. Fentin has worked as a research analyst, portfolio assistant and manager.
Year of Election or Appointment: 2002
Secretary of VIP Value Strategies. He also serves as Secretary of other Fidelity funds; Vice President, General Counsel, and Secretary of FMR Co., Inc. (2001 present) and FMR; Assistant Secretary of Fidelity Management & Research (U.K.) Inc. (2001 present), Fidelity Management & Research (Far East) Inc. (2001 present), and Fidelity Investments Money Management, Inc. (2001 present). Mr. Roiter is an Adjunct Member, Faculty of Law, at Boston College Law School (2003 present). Previously, Mr. Roiter served as Vice President and Secretary of Fidelity Distributors Corporation (FDC) (1998 2005).
Year of Election or Appointment: 2003
Assistant Secretary of VIP Value Strategies. Mr. Fross also serves as Assistant Secretary of other Fidelity funds (2003 present), Vice President and Secretary of FDC (2005 present), and is an employee of FMR.
Year of Election or Appointment: 2004
President, Treasurer, and Anti Money Laundering (AML) officer of VIP Value Strategies. Ms. Reynolds also serves as President, Treasurer, and AML officer of other Fidelity funds (2004) and is a Vice President (2003) and an employee (2002) of FMR. Before joining Fidelity Investments, Ms. Reynolds worked at PricewaterhouseCoopers LLP (PwC) (1980 2002), where she was most recently an audit partner with PwC’s investment management practice.
Year of Election or Appointment: 2005
Chief Financial Officer of VIP Value Strategies. Mr. Murphy also serves as Chief Financial Officer of other Fidelity funds (2005 present). He also serves as Senior Vice President of Fidelity Pricing and Cash Management Services Group (FPCMS).
| | Kenneth A. Rathgeber (58)
|
Year of Election or Appointment: 2004
Chief Compliance Officer of VIP Value Strategies. Mr. Rathgeber also serves as Chief Compliance Officer of other Fidelity funds (2004) and Executive Vice President of Risk Oversight for Fidelity Investments (2002). Previously, he served as Executive Vice President and Chief Operating Officer for Fidelity Investments Institutional Services Company, Inc. (1998 2002).
VIP Value Strategies Portfolio
|
Name, Age; Principal Occupation
John R. Hebble (47)
|
Year of Election or Appointment: 2003
Deputy Treasurer of VIP Value Strategies. Mr. Hebble also serves as Deputy Treasurer of other Fidelity funds (2003), and is an employee of FMR. Before joining Fidelity Investments, Mr. Hebble worked at Deutsche Asset Management where he served as Director of Fund Accounting (2002 2003) and Assistant Treasurer of the Scudder Funds (1998 2003).
Year of Election or Appointment: 2005
Deputy Treasurer of VIP Value Strategies. Mr. Mehrmann also serves as Deputy Treasurer of other Fidelity funds (2005 present) and is an employee of FMR. Previously, Mr. Mehrmann served as Vice President of Fidelity Investments Institutional Services Group (FIIS)/Fidelity Investments Institutional Operations Corporation, Inc. (FIIOC) Client Services (1998 2004).
Kimberley H. Monasterio (42)
|
Year of Election or Appointment: 2004
Deputy Treasurer of VIP Value Strategies. Ms. Monasterio also serves as Deputy Treasurer of other Fidelity funds (2004) and is an employee of FMR (2004). Before joining Fidelity Investments, Ms. Monasterio served as Treasurer (2000 2004) and Chief Financial Officer (2002 2004) of the Franklin Templeton Funds and Senior Vice President of Franklin Templeton Services, LLC (2000 2004).
Year of Election or Appointment: 2005
Deputy Treasurer of VIP Value Strategies. Mr. Robins also serves as Deputy Treasurer of other Fidelity funds (2005 present) and is an employee of FMR (2004 present). Before joining Fidelity Investments, Mr. Robins worked at KPMG LLP, where he was a partner in KPMG’s department of professional practice (2002 2004) and a Senior Manager (1999 2000). In addition, Mr. Robins served as Assistant Chief Accountant, United States Securities and Exchange Commission (2000 2002).
Year of Election or Appointment: 2005
Assistant Treasurer of VIP Value Strategies. Mr. Byrnes also serves as Assistant Treasurer of other Fidelity funds (2005 present) and is an employee of FMR (2005 present). Previously, Mr. Byrnes served as Vice President of FPCMS (2003 2005). Before joining Fidelity Investments, Mr. Byrnes worked at Deutsche Asset Management where he served as Vice President of the Investment Operations Group (2000 2003).
Year of Election or Appointment: 2002
Assistant Treasurer of VIP Value Strategies. Mr. Costello also serves as Assistant Treasurer of other Fidelity funds and is an employee of FMR.
Year of Election or Appointment: 2004
Assistant Treasurer of VIP Value Strategies. Mr. Lydecker also serves as Assistant Treasurer of other Fidelity funds (2004) and is an employee of FMR.
Year of Election or Appointment: 2002
Assistant Treasurer of VIP Value Strategies. Mr. Osterheld also serves as Assistant Treasurer of other Fidelity funds (2002) and is an employee of FMR.
Year of Election or Appointment: 2005
Assistant Treasurer of VIP Value Strategies. Mr. Ryan also serves as Assistant Treasurer of other Fidelity funds (2005 present) and is an employee of FMR (2005 present). Previously, Mr. Ryan served as Vice President of Fund Reporting in FPCMS (1999 2005).
Year of Election or Appointment: 2005
Assistant Treasurer of VIP Value Strategies. Mr. Schiavone also serves as Assistant Treasurer of other Fidelity funds (2005 present) and is an employee of FMR (2005 present). Before joining Fidelity Investments, Mr. Schiavone worked at Deutsche Asset Manage ment, where he most recently served as Assistant Treasurer (2003 2005) of the Scudder Funds and Vice President and Head of Fund Reporting (1996 2003).
29 Annual Report
The Board of Trustees of Value Strategies Portfolio voted to pay to shareholders of record at the opening of business on record date, the following distributions per share derived from capital gains realized from sales of portfolio securities, and dividends derived from net investment income:
| | | Pay Date | | Record Date | | Dividends | | Capital Gains |
| Initial Class | | 02/10/06 | | 02/10/06 | | $.084 | | $2.44 |
| Service Class | | 02/10/06 | | 02/10/06 | | $.073 | | $2.44 |
| Service Class 2 | | 02/10/06 | | 02/10/06 | | $.051 | | $2.44 |
| Investor Class | | 02/10/06 | | 02/10/06 | | $.093 | | $2.44 |
The fund hereby designates as a capital gain dividend with respect to the taxable year ended December 31, 2005, $62,966,458 or, if subsequently determined to be different, the net capital gain of such year.
Initial Class, Service Class, and Service Class 2 designates 100% of the dividend distributed during the fiscal year as qualifying for the dividends received deduction for corporate shareholders.
The fund will notify shareholders in January 2006 of amounts for use in preparing 2005 income tax returns.
VIP Value Strategies Portfolio
|
Board Approval of Investment Advisory Contracts and Management Fees
VIP Value Strategies Portfolio
|
Each year, typically in July, the Board of Trustees, including the independent Trustees (together, the Board), votes on the renewal of the management contract and sub advisory agreements (together, the Advisory Contracts) for the fund. The Board, assisted by the advice of fund counsel and indepen dent Trustees’ counsel, requests and considers a broad range of information throughout the year.
The Board meets regularly each month except August and takes into account throughout the year matters bearing on Advisory Contracts. The Board, acting directly and through its separate committees, considers at each of its meetings factors that are relevant to the annual renewal of the fund’s Advisory Contracts, including the services and support provided to the fund and its shareholders by Fidelity. At the time of the renewal, the Board had 11 standing committees, each composed of independent Trustees with varying backgrounds, to which the Board has assigned specific subject matter responsibilities in order to enhance effective decision making by the Board. Each committee has adopted a written charter outlining the structure and purposes of the committee. One such committee, the Equity Contract Committee, meets periodically during the first six months of each year and as necessary to consider matters specifically related to the annual renewal of Advisory Contracts. The committee requests and receives information on, and makes recommendations to the independent Trustees concerning, the approval and annual review of the Advisory Contracts.
At its July 2005 meeting, the Board of Trustees, including the independent Trustees, unanimously determined to renew the Advisory Contracts for the fund. In reaching its determination, the Board considered all factors it believed relevant, including (1) the nature, extent, and quality of the services to be provided to the fund and its shareholders by Fidelity (including the investment performance of the fund); (2) the competitiveness of the manage ment fee and total expenses of the fund; (3) the total costs of the services to be provided by and the profits to be realized by the investment adviser and its affiliates from the relationship with the fund; (4) the extent to which economies of scale would be realized as the fund grows; and (5) whether fee levels reflect these economies of scale, if any, for the benefit of fund shareholders.
In determining whether to renew the Advisory Contracts for the fund, the Board ultimately reached a determination, with the assistance of fund counsel and independent Trustees’ counsel, that the renewal of the Advisory Contracts and the compensation to be received by Fidelity under the management contract is consistent with Fidelity’s fiduciary duty under applicable law. In addition to evaluating the specific factors noted above, the Board, in reaching its determination, is aware that shareholders in the fund have a broad range of investment choices available to them, including a wide choice among mutual funds offered by competitors to Fidelity, and that the fund’s shareholders, with the opportunity to review and weigh the disclosure provided by the fund in its prospectus and other public disclosures, have chosen to invest in this fund, managed by Fidelity.
Nature, Extent, and Quality of Services Provided by Fidelity. The Board considered staffing within the investment adviser, FMR, and the sub advisers (together, the Investment Advisers), including the background of the fund’s portfolio manager and the fund’s investment objective and discipline. The independent Trustees also had discussions with senior management of Fidelity’s investment operations and investment groups. The Board considered the structure of the portfolio manager compensation program and whether this structure provides appropriate incentives.
Fidelity Resources Dedicated to Investment Management and Support Services. The Board reviewed the size, education, and experience of the Invest ment Advisers’ investment staff, their use of technology, and the Investment Advisers’ approach to recruiting, training, and retaining portfolio managers and other research, advisory, and management personnel. The Board considered Fidelity’s extensive global research capabilities that enable the Investment Advisers to aggregate data from various sources in an effort to produce positive investment results. The Board noted that Fidelity’s analysts have access to a variety of technological tools that enable them to perform both fundamental and quantitative analysis and to specialize in various disciplines. The Board also considered that Fidelity’s portfolio managers and analysts have access to daily portfolio attribution that allows for monitor ing of a fund’s portfolio, as well as an electronic communication system that provides immediate real time access to research concerning issuers and credit enhancers.
Shareholder and Administrative Services. The Board considered the nature, extent, quality, and cost of administrative, distribution, and shareholder services performed by the Investment Advisers and their affiliates under the Advisory Contracts and under separate agreements covering transfer agency, pricing and bookkeeping, and securities lending services for the fund. The Board also considered the nature and extent of the Investment Advisers’ supervision of third party service providers, principally custodians and subcustodians. The Board reviewed the allocation of fund brokerage, including allocations to brokers affiliated with the Investment Advisers, the use of brokerage commissions to pay fund expenses, and the use of “soft” commission dollars to pay for research services. The Board also considered that Fidelity voluntarily decided in 2004 to stop using “soft” commission dollars to pay for market data and, instead, to pay for that data out of its own resources. The Board also considered the resources devoted to, and the record of compliance with, the fund’s compliance policies and procedures.
The Board noted that the growth of fund assets across the complex allows Fidelity to reinvest in the development of services designed to enhance the value or convenience of the Fidelity funds as investment vehicles. These services include 24 hour access to account information and market informa tion through phone representatives and over the Internet, and investor education materials and asset allocation tools.
Investment in a Large Fund Family. The Board considered the benefits to shareholders of investing in a Fidelity fund, including the benefits of investing in a fund that is part of a large family of funds offering a variety of investment disciplines and providing for a large variety of mutual fund investor services. The Board noted that, since the last Advisory Contract renewals in July 2004, Fidelity has taken a number of actions that benefited particular
31 Annual Report
Board Approval of Investment Advisory Contracts and Management Fees - continued
funds, including (i) voluntarily deciding in 2004 to stop using “soft” commission dollars to pay for market data and, instead, to pay for that data out of its own resources, (ii) contractually agreeing to impose management fee reductions and expense limitations on its five Spartan stock index funds and its stock index fund available through variable insurance products, (iii) contractually agreeing to eliminate the management fees on the Fidelity Freedom Funds and the Fidelity Advisor Freedom Funds, (iv) contractually agreeing to reduce the management fees on most of its investment grade taxable bond funds, and (v) contractually agreeing to impose expense limitations on its retail and Spartan investment grade taxable bond funds.
Investment Performance and Compliance. The Board considered whether the fund has operated within its investment objective, as well as its record of compliance with its investment restrictions. It also reviewed the fund’s absolute investment performance for each class, as well as the fund’s relative investment performance for each class measured against (i) a broad based securities market index, and (ii) a peer group of mutual funds deemed appropriate by the Board. Because the fund had been in existence less than three calendar years, the following chart considered by the Board shows, for the one year period ended December 31, 2004, the returns of Service Class 2 and Initial Class of the fund, the return of a broad based securities market index (“benchmark”), and a range of returns of a peer group of mutual funds identified by Lipper Inc. as having an investment objective similar to that of the fund. The returns of Service Class 2 and Initial Class represent the performance of classes with the highest and lowest 12b 1 fees, respectively (not necessarily with the highest and lowest total expenses). The box within the chart shows the 25th percentile return (bottom of box) and the 75th percentile return (top of box) of the Lipper peer group. Returns shown above the box are in the first quartile and returns shown below the box are in the fourth quartile. The percentage beaten numbers noted below the chart correspond to the percentile box and represent the percentage of funds in the Lipper peer group whose performance was equal to or lower than that of the class indicated.
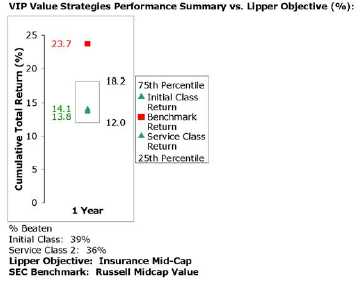
The Board reviewed the fund’s relative investment performance against its Lipper peer group and stated that the performance of Initial Class of the fund was in the third quartile for the one year period. The Board also stated that the relative investment performance of the fund was lower than its benchmark for the one year period. The Board considered that the variations in performance among the fund’s classes reflect the variations in class expenses, which result in lower performance for higher expense classes. The Board stated that it is difficult to evaluate in any comprehensive fashion the performance of the fund, in light of its relatively recent launch.
The Board has had thorough discussions with FMR throughout the year about the Board’s and FMR’s concerns about equity research, equity fund performance, and compliance with internal policies governing gifts and entertainment. FMR has taken steps that it believes will refocus and strengthen equity research and equity portfolio management and compliance. The Board noted with favor FMR’s recent reorganization of its senior management team and FMR’s plans to dedicate additional resources to investment research, and participated in the process that led to those changes.
Based on its review, and giving particular weight to the nature and quality of the resources dedicated by the Investment Advisers to maintain and improve relative performance, the Board concluded that the nature, extent, and quality of the services provided by Fidelity will benefit the fund’s shareholders, particularly in light of the Board’s view that the fund’s shareholders benefit from investing in a fund that is part of a large family of funds offering a variety of investment disciplines and services.
Competitiveness of Management Fee and Total Fund Expenses. The Board considered the fund’s management fee and total expenses compared to “mapped groups” of competitive funds and classes. Fidelity creates “mapped groups” by combining similar Lipper investment objective categories that have comparable management fee characteristics. Combining Lipper investment objective categories aids the Board’s management fee and total expense comparisons by broadening the competitive group used for comparison and by reducing the number of universes to which various Fidelity funds are compared.
VIP Value Strategies Portfolio
|
The Board considered two proprietary management fee comparisons for the 12 month (or shorter) periods shown in the chart below. The group of Lipper funds used by the Board for management fee comparisons is referred to below as the “Total Mapped Group” and, for the reasons explained above, is broader than the Lipper peer group used by the Board for performance comparisons. The Total Mapped Group comparison focuses on a fund’s standing relative to the total universe of comparable funds available to investors, in terms of gross management fees before expense reimbursements or caps. “TMG %” represents the percentage of funds in the Total Mapped Group that had management fees that were lower than the fund’s. For example, a TMG % of 11% means that 89% of the funds in the Total Mapped Group had higher management fees than the fund. The “Asset Size Peer Group” (ASPG) comparison focuses on a fund’s standing relative to non Fidelity funds similar in size to the fund within the Total Mapped Group. The ASPG represents at least 15% of the funds in the Total Mapped Group with comparable asset size and management fee characteristics, subject to a minimum of 50 funds (or all funds in the Total Mapped Group if fewer than 50). Additional information, such as the ASPG quartile (“quadrant”) in which the fund’s management fee ranked, is also included in the chart and considered by the Board.
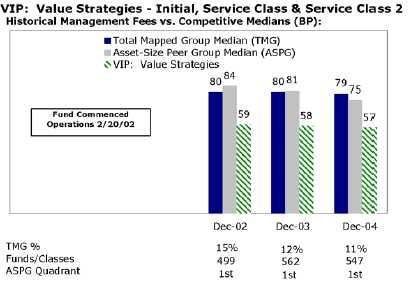
The Board noted that the fund’s management fee ranked below the median of its Total Mapped Group and below the median of its ASPG for 2004.
Based on its review, the Board concluded that the fund’s management fee was fair and reasonable in light of the services that the fund receives and the other factors considered.
In its review of each class’s total expenses, the Board considered the fund’s management fee as well as other fund or class expenses, as applicable, such as transfer agent fees, pricing and bookkeeping fees, fund paid 12b 1 fees, and custodial, legal, and audit fees. The Board also noted the effects of any waivers and reimbursements on fees and expenses. As part of its review, the Board also considered current and historical total expenses of each class of the fund compared to competitive fund median expenses. Each class of the fund is compared to those funds and classes in the Total Mapped Group (used by the Board for management fee comparisons) that have a similar sales load structure.
The Board noted that each class’s total expenses ranked below its competitive median for 2004.
In its review of total expenses, the Board also considered Fidelity fee structures and other information on clients that FMR and its affiliates service in other competitive markets, such as other mutual funds advised or subadvised by FMR or its affiliates, pension plan clients, and other institutional clients.
Based on its review, the Board concluded that the total expenses for each class of the fund were reasonable in light of the services that the fund and its shareholders receive and the other factors considered.
Costs of the Services and Profitability. The Board considered the revenues earned and the expenses incurred by Fidelity in conducting the busi ness of developing, marketing, distributing, managing, administering and servicing the fund and its shareholders. The Board also considered the level of Fidelity’s profits in respect of all the Fidelity funds.
On an annual basis, FMR presents to the Board Fidelity’s profitability for the fund. Fidelity calculates the profitability for each fund, as well as aggregate profitability for groups of Fidelity funds and all Fidelity funds, using a series of detailed revenue and cost allocation methodologies which originate with the audited books and records of Fidelity. The Audit Committee of the Board reviews any significant changes from the prior year’s methodologies.
PricewaterhouseCoopers LLP (PwC), independent registered accounting firm and auditor to Fidelity and certain Fidelity funds, has been engaged annually by the Board as part of the Board’s assessment of the results of Fidelity’s profitability analysis. PwC’s engagement includes the review and
33 Annual Report
Board Approval of Investment Advisory Contracts and Management Fees - continued
assessment of Fidelity’s methodologies used in determining the revenues and expenses attributable to Fidelity’s mutual fund business, and completion of agreed upon procedures surrounding the mathematical accuracy of fund profitability and its conformity to allocation methodologies. After consider ing PwC’s reports issued under the engagement and information provided by Fidelity, the Board believes that while other allocation methods may also be reasonable, Fidelity’s profitability methodologies are reasonable in all material respects.
The Board has also reviewed Fidelity’s non fund businesses and any fall out benefits related to the mutual fund business as well as cases where Fidelity’s affiliates may benefit from or be related to the fund’s business. In addition, a special committee of the Board reviewed services provided to Fidelity by its affiliates and determined that the fees that Fidelity paid for such services were reasonable.
The Board considered the costs of the services provided by and the profits realized by Fidelity in connection with the operation of the fund and deter mined that the amount of profit is a fair entrepreneurial profit for the management of the fund.
Economies of Scale. The Board considered whether there have been economies of scale in respect of the management of the Fidelity funds, whether the Fidelity funds (including the fund) have appropriately benefited from any such economies of scale, and whether there is potential for realization of any further economies of scale. The Board considered the extent to which the fund will benefit from economies of scale through increased services to the fund, through waivers or reimbursements, or through fee or expense reductions.
The Board recognized that the fund’s management contract incorporates a “group fee” structure, which provides for lower fee rates as total fund assets under FMR’s management increase, and for higher fee rates as total fund assets under FMR’s management decrease. The Board considered that the group fee is designed to deliver the benefits of economies of scale to fund shareholders when total fund assets increase, even if assets of any particular fund are unchanged or have declined, because some portion of Fidelity’s costs are attributable to services provided to all Fidelity funds, and all funds benefit if those costs can be allocated among more assets. The Board concluded that, given the group fee structure, fund shareholders will achieve a certain level of economies of scale as assets under FMR’s management increase at the fund complex level, regardless of whether Fidelity achieves any such economies of scale.
The Board further concluded that any potential economies of scale are being shared between fund shareholders and Fidelity in an appropriate manner.
Additional Information Requested by the Board. In order to develop fully the factual basis for consideration of the Advisory Contracts, the Board requested additional information regarding (i) equity fund transfer agency fees; (ii) Fidelity’s fund profitability methodology and the impact of various changes in the methodology over time; (iii) benefits to shareholders from economies of scale; (iv) composition and characteristics of various fund and industry data used in comparisons; and (v) compensation of portfolio managers and research analysts.
Based on its evaluation of all of the conclusions noted above, and after considering all material factors, the Board ultimately concluded that the exist ing advisory fee structures are fair and reasonable, and that the fund’s existing Advisory Contracts should be renewed.
VIP Value Strategies Portfolio
|
35 Annual Report
Investment Adviser
Fidelity Management & Research Company
Boston, MA
Investment Sub Advisers
FMR Co., Inc.
Fidelity Management & Research (U.K.) Inc.
Fidelity Management & Research (Far East) Inc.
Fidelity Investments Japan Limited
Fidelity International Investment Advisors
Fidelity International Investment Advisors
(U.K.) Limited
General Distributor
Fidelity Distributors Corporation
Boston, MA
Transfer and Service Agents
Fidelity Investments Institutional Operations Company, Inc.
Boston, MA
Fidelity Service Company, Inc.
Boston, MA
Custodian
Mellon Bank, N.A.
Pittsburgh, PA
|
VIPVS ANN 0206
1.781994.103
|
Fidelity® Variable Insurance Products
| | VIP Contrafund® Portfolio
VIP Equity-Income Portfolio
VIP Growth Portfolio
VIP Growth & Income Portfolio
VIP Growth Opportunities
Portfolio
VIP Index 500 Portfolio
VIP Mid Cap Portfolio
VIP Overseas Portfolio
|

| | Annual Report
December 31, 2005
|

| Contents | | | | | | |
| |
| |
| Shareholder Expense Example | | 4 | | | | An example of shareholder expenses |
| |
| VIP Contrafund | | 8 | | | | Performance |
| | | 9 | | | | Management’s Discussion |
| | | 10 | | | | Investment Changes |
| | | 11 | | | | Investments |
| | | 26 | | | | Financial Statements |
| |
| VIP Equity Income | | 31 | | | | Performance |
| | | 32 | | | | Management’s Discussion |
| | | 33 | | | | Investment Changes |
| | | 34 | | | | Investments |
| | | 45 | | | | Financial Statements |
| |
| VIP Growth | | 50 | | | | Performance |
| | | 51 | | | | Management’s Discussion |
| | | 52 | | | | Investment Changes |
| | | 53 | | | | Investments |
| | | 62 | | | | Financial Statements |
| |
| VIP Growth & Income | | 67 | | | | Performance |
| | | 68 | | | | Management’s Discussion |
| | | 69 | | | | Investment Changes |
| | | 70 | | | | Investments |
| | | 78 | | | | Financial Statements |
| |
| VIP Growth Opportunities | | 82 | | | | Performance |
| | | 83 | | | | Management’s Discussion |
| | | 84 | | | | Investment Changes |
| | | 85 | | | | Investments |
| | | 92 | | | | Financial Statements |
| |
| VIP Index 500 | | 96 | | | | Performance |
| | | 97 | | | | Management’s Discussion |
| | | 98 | | | | Investment Changes |
| | | 99 | | | | Investments |
| | | 114 | | | | Financial Statements |
| |
| VIP Mid Cap | | 118 | | | | Performance |
| | | 119 | | | | Management’s Discussion |
| | | 120 | | | | Investment Changes |
| | | 121 | | | | Investments |
| | | 147 | | | | Financial Statements |
| |
| VIP Overseas | | 152 | | | | Performance |
| | | 153 | | | | Management’s Discussion |
| | | 154 | | | | Investment Changes |
| | | 156 | | | | Investments |
| | | 163 | | | | Financial Statements |
| |
| |
| |
| |
| Annual Report | | | | 2 | | |
| Notes to Financial Statements | | 169 | | Notes to the Financial Statements |
| Report of Independent Registered | | 182 | | |
| Public Accounting Firm | | | | |
| Trustees and Officers | | 189 | | |
| Distributions | | 195 | | |
| Board Approval of Investment | | 197 | | |
| Advisory Contracts and | | | | |
| Management Fees | | | | |
To view a fund’s proxy voting guidelines and proxy voting record for the 12 month period ended June 30, visit www.fidelity.com/proxyvotingresults or visit the
Securities and Exchange Commission’s (SEC) web site at www.sec.gov. You may also call 1-877-208-0098 to request a free copy of the proxy voting guidelines.
Fidelity Variable Insurance Products are separate account options which are purchased through a variable insurance contract.
Standard & Poor’s, S&P and S&P 500 are registered service marks of The McGraw Hill Companies, Inc. and have been licensed for use by Fidelity Distributors
Corporation.
Other third party marks appearing herein are the property of their respective owners.
All other marks appearing herein are registered or unregistered trademarks or service marks of FMR Corp. or an affiliated company.
This report and the financial statements contained herein are submitted for the general information of the shareholders of the funds. This report is not
authorized for distribution to prospective investors in the funds unless preceded or accompanied by an effective prospectus.
A fund files its complete schedule of portfolio holdings with the SEC for the first and third quarters of each fiscal year on Form N-Q. Forms N-Q are available
on the SEC’s web site at http://www.sec.gov. A fund’s Forms N Q may be reviewed and copied at the SEC’s Public Reference Room in Washington, DC. Infor
mation regarding the operation of the SEC’s Public Reference Room may be obtained by calling 1-800-SEC-0330. For a complete list of a fund’s portfolio hold-
ings, view the most recent quarterly holdings report, semiannual report, or annual report on Fidelity’s web site at http://www.advisor.fidelity.com.
NOT FDIC INSURED · MAY LOSE VALUE · NO BANK GUARANTEE
Neither the funds nor Fidelity Distributors Corporation is a bank.
|
3 Annual Report
Shareholder Expense Example
|
As a shareholder of a Fund, you incur two types of costs: (1) transaction costs, including redemption fees, and (2) ongoing costs, including manage ment fees, distribution and/or service (12b 1) fees and other Fund expenses. This Example is intended to help you understand your ongoing costs (in dollars) of investing in the Funds and to compare these costs with the ongoing costs of investing in other mutual funds.
The actual expense Example is based on an investment of $1,000 invested at the beginning of the period and held for the entire period (July 1, 2005 to December 31, 2005) for Initial Class, Service Class, Service Class 2, Initial Class R, Service Class R and Service Class 2R and for the entire period (July 21, 2005 to December 31, 2005) for Investor Class and Investor Class R. The hypothetical expense Example is based on an investment of $1,000 invested for the one half year period (July 1, 2005 to December 31, 2005).
The first line of the table below for each class of each fund provides information about actual account values and actual expenses. You may use the information in this line, together with the amount you invested, to estimate the expenses that you paid over the period. Simply divide your account value by $1,000.00 (for example, an $8,600 account value divided by $1,000.00 = 8.6), then multiply the result by the number in the first line for a class of the fund under the heading entitled “Expenses Paid During Period” to estimate the expenses you paid on your account during this period. An annual index fund fee of $10 that is charged once a year may apply for certain accounts with a value of less than $10,000. This fee is not included in the table below. If it was, the estimate of expenses you paid during the period would be higher, and your ending account value lower, by this amount. The esti mate of expenses does not include any fees or other expenses of any variable annuity or variable life insurance product. If they were, the estimate of expenses you paid during the period would be higher, and your ending account value would be lower.
Hypothetical Example for Comparison Purposes
|
The second line of the table below for each class of each fund provides information about hypothetical account values and hypothetical expenses based on a Class’ actual expense ratio and an assumed rate of return of 5% per year before expenses, which is not the Class’ actual return. The hypothetical account values and expenses may not be used to estimate the actual ending account balance or expenses you paid for the period. You may use this information to compare the ongoing costs of investing in the Fund and other funds. To do so, compare this 5% hypothetical example with the 5% hypothetical examples that appear in the shareholder reports of the other funds. An annual index fund fee of $10 that is charged once a year may apply for certain accounts with a value of less than $10,000. This fee is not included in the table below. If it was, the estimate of expenses you paid during the period would be higher, and your ending account value lower, by this amount. The estimate of expenses does not include any fees or other expenses of any variable annuity or variable life insurance product. If they were, the estimate of expenses you paid during the period would be higher, and your ending account value would be lower.
Please note that the expenses shown in the table are meant to highlight your ongoing costs only and do not reflect any transaction costs. Therefore, the second line of the table is useful in comparing ongoing costs only, and will not help you determine the relative total costs of owning different funds. In addition, if these transactional costs were included, your costs would have been higher.
| | | | | Ending | | | | |
| | | Beginning | | Account Value | | | | Expenses Paid |
| | | Account Value | | December 31, 2005 | | | | During Period |
| VIP Contrafund | | | | | | | | | | |
| Initial Class | | | | | | | | | | |
| Actual | | $ 1,000.00 | | | | $ 1,128.80 | | | | $ 3.54B |
| HypotheticalA | | $ 1,000.00 | | | | $ 1,021.88 | | | | $ 3.36C |
| Service Class | | | | | | | | | | |
| Actual | | $ 1,000.00 | | | | $ 1,128.40 | | | | $ 4.08B |
| HypotheticalA | | $ 1,000.00 | | | | $ 1,021.37 | | | | $ 3.87C |
| Service Class 2 | | | | | | | | | | |
| Actual | | $ 1,000.00 | | | | $ 1,127.50 | | | | $ 4.88B |
| HypotheticalA | | $ 1,000.00 | | | | $ 1,020.62 | | | | $ 4.63C |
| Service Class 2R | | | | | | | | | | |
| Actual | | $ 1,000.00 | | | | $ 1,127.40 | | | | $ 4.88B |
| HypotheticalA | | $ 1,000.00 | | | | $ 1,020.62 | | | | $ 4.63C |
| Investor Class | | | | | | | | | | |
| Actual | | $ 1,000.00 | | | | $ 1,093.90 | | | | $ 3.90B |
| HypotheticalA | | $ 1,000.00 | | | | $ 1,021.02 | | | | $ 4.23C |
| | | | | Ending | | | | |
| | | Beginning | | Account Value | | | | Expenses Paid |
| | | Account Value | | December 31, 2005 | | | | During Period |
| VIP Equity Income | | | | | | | | | | |
| Initial Class | | | | | | | | | | |
| Actual | | $ 1,000.00 | | | | $ 1,072.40 | | | | $ 2.93B |
| HypotheticalA | | $ 1,000.00 | | | | $ 1,022.38 | | | | $ 2.85C |
| Service Class | | | | | | | | | | |
| Actual | | $ 1,000.00 | | | | $ 1,071.80 | | | | $ 3.45B |
| HypotheticalA | | $ 1,000.00 | | | | $ 1,021.88 | | | | $ 3.36C |
| Service Class 2 | | | | | | | | | | |
| Actual | | $ 1,000.00 | | | | $ 1,070.60 | | | | $ 4.23B |
| HypotheticalA | | $ 1,000.00 | | | | $ 1,021.12 | | | | $ 4.13C |
| Service Class 2R | | | | | | | | | | |
| Actual | | $ 1,000.00 | | | | $ 1,070.90 | | | | $ 4.23B |
| HypotheticalA | | $ 1,000.00 | | | | $ 1,021.12 | | | | $ 4.13C |
| Investor Class | | | | | | | | | | |
| Actual | | $ 1,000.00 | | | | $ 1,041.70 | | | | $ 3.39B |
| HypotheticalA | | $ 1,000.00 | | | | $ 1,021.48 | | | | $ 3.77C |
| VIP Growth | | | | | | | | | | |
| Initial Class | | | | | | | | | | |
| Actual | | $ 1,000.00 | | | | $ 1,080.10 | | | | $ 3.46B |
| HypotheticalA | | $ 1,000.00 | | | | $ 1,021.88 | | | | $ 3.36C |
| Service Class | | | | | | | | | | |
| Actual | | $ 1,000.00 | | | | $ 1,079.40 | | | | $ 3.98B |
| HypotheticalA | | $ 1,000.00 | | | | $ 1,021.37 | | | | $ 3.87C |
| Service Class 2 | | | | | | | | | | |
| Actual | | $ 1,000.00 | | | | $ 1,078.70 | | | | $ 4.77B |
| HypotheticalA | | $ 1,000.00 | | | | $ 1,020.62 | | | | $ 4.63C |
| Service Class 2R | | | | | | | | | | |
| Actual | | $ 1,000.00 | | | | $ 1,078.70 | | | | $ 4.77B |
| HypotheticalA | | $ 1,000.00 | | | | $ 1,020.62 | | | | $ 4.63C |
| Investor Class | | | | | | | | | | |
| Actual | | $ 1,000.00 | | | | $ 1,032.80 | | | | $ 3.79B |
| HypotheticalA | | $ 1,000.00 | | | | $ 1,021.02 | | | | $ 4.23C |
| VIP Growth & Income | | | | | | | | | | |
| Initial Class | | | | | | | | | | |
| Actual | | $ 1,000.00 | | | | $ 1,118.30 | | | | $ 3.15B |
| HypotheticalA | | $ 1,000.00 | | | | $ 1,022.23 | | | | $ 3.01C |
| Service Class | | | | | | | | | | |
| Actual | | $ 1,000.00 | | | | $ 1,118.20 | | | | $ 3.68B |
| HypotheticalA | | $ 1,000.00 | | | | $ 1,021.73 | | | | $ 3.52C |
| Service Class 2 | | | | | | | | | | |
| Actual | | $ 1,000.00 | | | | $ 1,116.80 | | | | $ 4.48B |
| HypotheticalA | | $ 1,000.00 | | | | $ 1,020.97 | | | | $ 4.28C |
| Investor Class | | | | | | | | | | |
| Actual | | $ 1,000.00 | | | | $ 1,080.60 | | | | $ 3.65B |
| HypotheticalA | | $ 1,000.00 | | | | $ 1,021.27 | | | | $ 3.97C |
| VIP Growth Opportunities | | | | | | | | | | |
| Initial Class | | | | | | | | | | |
| Actual | | $ 1,000.00 | | | | $ 1,098.90 | | | | $ 3.65B |
| HypotheticalA | | $ 1,000.00 | | | | $ 1,021.73 | | | | $ 3.52C |
| Service Class | | | | | | | | | | |
| Actual | | $ 1,000.00 | | | | $ 1,098.90 | | | | $ 4.18B |
| HypotheticalA | | $ 1,000.00 | | | | $ 1,021.22 | | | | $ 4.02C |
| Service Class 2 | | | | | | | | | | |
| Actual | | $ 1,000.00 | | | | $ 1,098.20 | | | | $ 5.08B |
| HypotheticalA | | $ 1,000.00 | | | | $ 1,020.37 | | | | $ 4.89C |
| Investor Class | | | | | | | | | | |
| Actual | | $ 1,000.00 | | | | $ 1,069.80 | | | | $ 4.05B |
| HypotheticalA | | $ 1,000.00 | | | | $ 1,020.82 | | | | $ 4.43C |
55 Annual Report
| Shareholder Expense Example continued | | | | | | | | | | | | |
| |
| |
| |
| | | | | | | | | Ending | | | | |
| | | | | | | Beginning | | Account Value | | | | Expenses Paid |
| | | | | | | Account Value | | December 31, 2005 | | | | During Period |
| VIP Index 500 | | | | | | | | | | | | | | |
| Initial Class | | | | | | | | | | | | | | |
| Actual | | | | | | $ 1,000.00 | | | | $ 1,057.20 | | | | $ .52B |
| HypotheticalA | | | | | | $ 1,000.00 | | | | $ 1,024.70 | | | | $ .51C |
| Service Class | | | | | | | | | | | | | | |
| Actual | | | | | | $ 1,000.00 | | | | $ 1,056.70 | | | | $ 1.04B |
| HypotheticalA | | | | | | $ 1,000.00 | | | | $ 1,024.20 | | | | $ 1.02C |
| Service Class 2 | | | | | | | | | | | | | | |
| Actual | | | | | | $ 1,000.00 | | | | $ 1,055.90 | | | | $ 1.81B |
| HypotheticalA | | | | | | $ 1,000.00 | | | | $ 1,023.44 | | | | $ 1.79C |
| VIP Mid Cap | | | | | | | | | | | | | | |
| Initial Class | | | | | | | | | | | | | | |
| Actual | | | | | | $ 1,000.00 | | | | $ 1,148.10 | | | | $ 3.74B |
| HypotheticalA | | | | | | $ 1,000.00 | | | | $ 1,021.73 | | | | $ 3.52C |
| Service Class | | | | | | | | | | | | | | |
| Actual | | | | | | $ 1,000.00 | | | | $ 1,147.80 | | | | $ 4.28B |
| HypotheticalA | | | | | | $ 1,000.00 | | | | $ 1,021.22 | | | | $ 4.02C |
| Service Class 2 | | | | | | | | | | | | | | |
| Actual | | | | | | $ 1,000.00 | | | | $ 1,146.90 | | | | $ 5.09B |
| HypotheticalA | | | | | | $ 1,000.00 | | | | $ 1,020.47 | | | | $ 4.79C |
| Investor Class | | | | | | | | | | | | | | |
| Actual | | | | | | $ 1,000.00 | | | | $ 1,102.80 | | | | $ 4.06B |
| HypotheticalA | | | | | | $ 1,000.00 | | | | $ 1,020.87 | | | | $ 4.38C |
| VIP Overseas | | | | | | | | | | | | | | |
| Initial Class | | | | | | | | | | | | | | |
| Actual | | | | | | $ 1,000.00 | | | | $ 1,210.30 | | | | $ 4.96B |
| HypotheticalA | | | | | | $ 1,000.00 | | | | $ 1,020.72 | | | | $ 4.53C |
| Service Class | | | | | | | | | | | | | | |
| Actual | | | | | | $ 1,000.00 | | | | $ 1,210.60 | | | | $ 5.52B |
| HypotheticalA | | | | | | $ 1,000.00 | | | | $ 1,020.21 | | | | $ 5.04C |
| Service Class 2 | | | | | | | | | | | | | | |
| Actual | | | | | | $ 1,000.00 | | | | $ 1,208.90 | | | | $ 6.35B |
| HypotheticalA | | | | | | $ 1,000.00 | | | | $ 1,019.46 | | | | $ 5.80C |
| Initial Class R | | | | | | | | | | | | | | |
| Actual | | | | | | $ 1,000.00 | | | | $ 1,210.70 | | | | $ 4.96B |
| HypotheticalA | | | | | | $ 1,000.00 | | | | $ 1,020.72 | | | | $ 4.53C |
| Service Class R | | | | | | | | | | | | | | |
| Actual | | | | | | $ 1,000.00 | | | | $ 1,210.20 | | | | $ 5.52B |
| HypotheticalA | | | | | | $ 1,000.00 | | | | $ 1,020.21 | | | | $ 5.04C |
| Service Class 2R | | | | | | | | | | | | | | |
| Actual | | | | | | $ 1,000.00 | | | | $ 1,209.50 | | | | $ 6.35B |
| HypotheticalA | | | | | | $ 1,000.00 | | | | $ 1,019.46 | | | | $ 5.80C |
| Investor Class R | | | | | | | | | | | | | | |
| Actual | | | | | | $ 1,000.00 | | | | $ 1,163.90 | | | | $ 5.20B |
| HypotheticalA | | | | | | $ 1,000.00 | | | | $ 1,019.81 | | | | $ 5.45C |
A 5% return per year before expenses
B Actual expenses are equal to each Class’ annualized expense ratio (shown in the table below); multiplied by the average account value over
the period, multiplied by 184/365 (to reflect the one half year period) for Initial Class, Service Class, Service Class 2, Initial Class R, Service
Class R and Service Class 2R and multiplied by 164/365 (to reflect the period July 21, 2005 to December 31, 2005) for Investor Class and Inves
tor Class R.
C Hypothetical expenses are equal to each Class’ annualized expense ratio (shown in the table below); multiplied by the average account
value over the period, multiplied by 184/365 (to reflect the one-half year period).
|
Annual Report 6
| | | Annualized |
| | | Expense Ratio |
| VIP Contrafund | | |
| Initial Class | | 66% |
| Service Class | | 76% |
| Service Class 2 | | 91% |
| Service Class 2R | | 91% |
| Investor Class | | 83% |
| VIP Equity Income | | |
| Initial Class | | 56% |
| Service Class | | 66% |
| Service Class 2 | | 81% |
| Service Class 2R | | 81% |
| Investor Class | | 74% |
| VIP Growth | | |
| Initial Class | | 66% |
| Service Class | | 76% |
| Service Class 2 | | 91% |
| Service Class 2R | | 91% |
| Investor Class | | 83% |
| VIP Growth & Income | | |
| Initial Class | | 59% |
| Service Class | | 69% |
| Service Class 2 | | 84% |
| Investor Class | | 78% |
| VIP Growth Opportunities | | |
| Initial Class | | 69% |
| Service Class | | 79% |
| Service Class 2 | | 96% |
| Investor Class | | 87% |
| VIP Index 500 | | |
| Initial Class | | 10% |
| Service Class | | 20% |
| Service Class 2 | | 35% |
| VIP Mid Cap | | |
| Initial Class | | 69% |
| Service Class | | 79% |
| Service Class 2 | | 94% |
| Investor Class | | 86% |
| VIP Overseas | | |
| Initial Class | | 89% |
| Service Class | | 99% |
| Service Class 2 | | 1.14% |
| Initial Class R | | 89% |
| Service Class R | | 99% |
| Service Class 2R | | 1.14% |
| Investor Class R | | 1.07% |
77 Annual Report
VIP Contrafund Portfolio
Performance: The Bottom Line
|
Average annual total return reflects the change in the value of an investment, assuming reinvestment of a class’ dividend income and capital gains (the profits earned upon the sale of securities that have grown in value) and assuming a constant rate of performance each year. During periods of reimbursement by Fidelity, a fund’s total return will be greater than it would be had the reimbursement not occurred. Performance numbers are net of all underlying fund operating expenses, but do not include any insurance charges imposed by your insurance company’s sepa rate account. If performance information included the effect of these additional charges, the total returns would have been lower. How a fund did yesterday is no guarantee of how it will do tomorrow.
| Average Annual Total Returns | | | | | | |
| Periods ended December 31, 2005 | | Past 1 | | Past 5 | | Past 10 |
| | | year | | years | | years |
| VIP Contrafund - Initial Class | | 16.94% | | 6.64% | | 12.09% |
| VIP Contrafund - Service ClassA | | 16.85% | | 6.55% | | 12.01% |
| VIP Contrafund - Service Class 2B | | 16.65% | | 6.38% | | 11.91% |
| VIP Contrafund - Investor ClassC | | 16.82% | | 6.62% | | 12.08% |
A The initial offering of Service Class shares took place on November 3, 1997. Performance for Service Class shares reflects an asset based service fee (12b 1 fee), and re
turns prior to November 3, 1997 are those of Initial Class and do not include the effects of Service Class’ 12b 1 fee. Had Service Class shares’ 12b 1 fee been reflected, returns
prior to November 3, 1997 would have been lower.
B The initial offering of Service Class 2 shares took place on January 12, 2000. Performance for Service Class 2 shares reflects an asset based service fee (12b 1 fee). Returns
from November 3, 1997 through January 12, 2000 are those of Service Class which reflect a different 12b 1 fee. Service Class 2 returns prior to November 3, 1997 are those of
Initial Class, and do not include the effects of a 12b 1 fee. Had Service Class 2’s 12b 1 fee been reflected, returns prior to January 12, 2000 would have been lower.
C The initial offering of Investor Class shares took place on July 21, 2005. Returns prior to July 21, 2005 are those of Initial Class. If Investor Class’s transfer agent fee
had been reflected, returns prior to July 21, 2005 would have been lower.
|
$10,000 Over 10 Years
Let’s say hypothetically that $10,000 was invested in VIP Contrafund Portfolio Initial Class on December 31, 1995. The chart shows how the value of your investment would have changed, and also shows how the Standard & Poor’s 500SM Index performed over the same period.
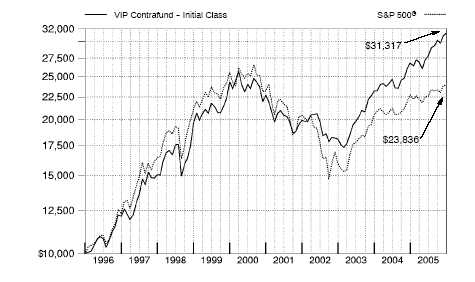
VIP Contrafund Portfolio 8
VIP Contrafund Portfolio
Management’s Discussion of Fund Performance
|
Comments from William Danoff, Portfolio Manager of VIP Contrafund Portfolio
U.S. equity benchmarks generally had positive results for the 12 months ending December 31, 2005, the third consecutive year that stocks finished in the black. Energy and utilities were the two best performing sectors, contributing greatly to the 4.91% gain of the Standard & Poor’s 500SM Index. Elsewhere, the NASDAQ Composite® Index returned 2.13%, while the Dow Jones Industrial AverageSM rose 1.72% . The U.S. economy did not decelerate as much as many had predicted, despite eight short term interest rate hikes, record high energy prices and the devastation caused by Hurricane Katrina. Meanwhile, corporate America notched its 14th consecutive quarter of double digit earnings gains through the third quarter of the year, an unprecedented streak in market history. From a style perspective, large cap stocks ended the six year reign of small caps by a narrow margin, but mid caps finished well ahead of both categories. The gap between growth and value stocks also was relatively narrow, with value gaining a slight edge.
For the year ending December 31, 2005, VIP Contrafund’s return was comfortably ahead of both the S&P 500® index and the LipperSM Variable Annuity Growth Funds Average, which returned 7.67% . (For specific portfolio performance results, please refer to the performance section of this report.) A continued emphasis on fast growing companies in expanding areas of the global economy, such as the Internet, wireless communications, health care and the emerging markets, helped drive overall performance, as did our commitment to the booming energy sector. The fund’s performance accelerated in the second half of 2005, aided by its bias toward growth oriented stocks, as well as by its overweighting versus the index in the materials sector, which rallied sharply during the past six months. Among the fund’s biggest contributors were Internet search firm Google, Canadian natural gas explorer EnCana, biotechnology leader Genentech, semiconductor provider Marvell Technology and Latin American telecommunication services operator American Movil. Detractors included such stocks as Avon Products, the direct seller of personal products for women, and dental equipment distributor Patterson Companies, both of which saw their share prices fall due to slower earnings growth. Weak results in some insurance industry holdings also hampered results, as did underweighting index component energy stocks such as Exxon Mobil.
The views expressed in this statement reflect those of the portfolio manager only through the end of the period of the report as stated on the cover and do not necessarily represent the views of Fidelity or any other person in the Fidelity organization. Any such views are subject to change at any time based upon market or other conditions and Fidelity disclaims any responsibility to update such views. These views may not be relied on as invest ment advice and, because investment decisions for a Fidelity fund are based on numerous factors, may not be relied on as an indication of trading intent on behalf of any Fidelity fund.
99 Annual Report
| VIP Contrafund Portfolio | | | | |
| Investment Changes | | |
| |
| |
| Top Ten Stocks as of December 31, 2005 |
| | | % of fund’s | | % of fund’s net assets |
| | | net assets | | 6 months ago |
| Google, Inc. Class A (sub. vtg.) | | 3.4 | | 2.0 |
| Genentech, Inc. | | 2.9 | | 2.8 |
| EnCana Corp. | | 2.6 | | 2.9 |
| Berkshire Hathaway, Inc. Class A | | 2.2 | | 2.4 |
| Marvell Technology Group Ltd. | | 1.9 | | 1.4 |
| Yahoo!, Inc. | | 1.6 | | 1.8 |
| Apple Computer, Inc. | | 1.5 | | 0.6 |
| Procter & Gamble Co. | | 1.5 | | 0.2 |
| Samsung Electronics Co. Ltd. | | 1.4 | | 1.2 |
| America Movil SA de CV Series L | | | | |
| sponsored ADR | | 1.4 | | 1.1 |
| | | 20.4 | | |
Top Five Market Sectors as of December 31, 2005 |
| | | % of fund’s | | % of fund’s net assets |
| | | net assets | | 6 months ago |
| Information Technology | | 17.9 | | 14.0 |
| Financials | | 16.7 | | 14.2 |
| Health Care | | 14.3 | | 14.3 |
| Energy | | 11.9 | | 13.8 |
| Industrials | | 8.0 | | 8.6 |
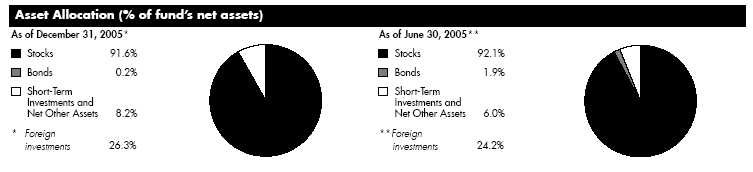
VIP Contrafund Portfolio 10
| VIP Contrafund Portfolio | | | | | | |
| Investments December 31, 2005 | | | | |
| Showing Percentage of Net Assets | | | | | | |
| |
| Common Stocks 91.6% | | | | | | |
| | | | | | | Shares | | Value (Note 1) |
| |
| CONSUMER DISCRETIONARY 6.2% | | | | | | |
| Auto Components – 0.1% | | | | | | | | |
| Bridgestone Corp. | | | | | | 264,000 | | $ 5,496,968 |
| Johnson Controls, Inc. | | | | | | 20,000 | | 1,458,200 |
| | | | | | | | | 6,955,168 |
| Automobiles – 0.6% | | | | | | | | |
| Honda Motor Co. Ltd. | | | | | | 135,000 | | 7,821,900 |
| Toyota Motor Corp. (d) | | | | | | 1,877,500 | | 98,212,031 |
| | | | | | | | | 106,033,931 |
| Distributors 0.1% | | | | | | | | |
| Li & Fung Ltd. | | | | | | 4,040,000 | | 7,789,622 |
| Diversified Consumer Services 0.1% | | | | | | |
| Education Management Corp. (a) | | | | 219,500 | | 7,355,445 |
| Laureate Education, Inc. (a) | | | | | | 223,791 | | 11,751,265 |
| | | | | | | | | 19,106,710 |
| Hotels, Restaurants & Leisure 2.1% | | | | | | |
| Ambassadors Group, Inc. | | | | | | 1,000,000 | | 22,890,000 |
| Aristocrat Leisure Ltd. | | | | | | 3,228,804 | | 29,179,787 |
| Boyd Gaming Corp. | | | | | | 138,900 | | 6,619,974 |
| Cosi, Inc. (a) | | | | | | 174,000 | | 1,444,200 |
| Domino’s Pizza, Inc. | | | | | | 327,700 | | 7,930,340 |
| Four Seasons Hotels, Inc. (ltd. vtg.) (d) | | | | 175,500 | | 8,731,599 |
| Gaylord Entertainment Co. (a) | | | | | | 52,827 | | 2,302,729 |
| Hilton Group PLC | | | | | | 1,090,498 | | 6,824,156 |
| Kerzner International Ltd. (a) | | | | | | 172,700 | | 11,873,125 |
| Las Vegas Sands Corp. | | | | | | 551,200 | | 21,755,864 |
| Life Time Fitness, Inc. (a) | | | | | | 223,582 | | 8,516,238 |
| Panera Bread Co. Class A (a) | | | | | | 921,036 | | 60,493,644 |
| Ruth’s Chris Steak House, Inc. | | | | | | 132,295 | | 2,394,540 |
| Shuffle Master, Inc. (a)(d) | | | | | | 256,772 | | 6,455,248 |
| Starbucks Corp. (a) | | | | | | 1,515,200 | | 45,471,152 |
| Station Casinos, Inc. | | | | | | 962,000 | | 65,223,600 |
| Texas Roadhouse, Inc. Class A (a) | | | | 364,812 | | 5,672,827 |
| The Cheesecake Factory, Inc. (a) | | | | 258,136 | | 9,651,705 |
| William Hill PLC | | | | | | 1,906,742 | | 17,578,064 |
| Wynn Resorts Ltd. (a)(d) | | | | | | 304,446 | | 16,698,863 |
| | | | | | | | | 357,707,655 |
| Household Durables 0.1% | | | | | | | | |
| Garmin Ltd. (d) | | | | | | 102,500 | | 6,800,875 |
| Matsushita Electric Industrial Co. Ltd. | | | | 526,000 | | 10,193,881 |
| Technical Olympic USA, Inc. | | | | | | 86,200 | | 1,817,958 |
| | | | | | | | | 18,812,714 |
| Internet & Catalog Retail 0.2% | | | | | | |
| Blue Nile, Inc. (a)(d) | | | | | | 216,000 | | 8,706,960 |
| Coldwater Creek, Inc. (a) | | | | | | 229,800 | | 7,015,794 |
| Expedia, Inc. (a) | | | | | | 562,100 | | 13,467,916 |
| NutriSystem, Inc. (a) | | | | | | 78,650 | | 2,832,973 |
| VistaPrint Ltd. | | | | | | 299,800 | | 6,821,649 |
| | | | | | | | | 38,845,292 |
| Media 0.8% | | | | | | | | |
| Getty Images, Inc. (a) | | | | | | 263,700 | | 23,540,499 |
See accompanying notes which are an integral part of the financial statements.
| | | | |
| | | | | 11 | | | | Annual Report |
11
| VIP Contrafund Portfolio | | | | |
| Investments - continued | | | | |
| |
| |
| |
| | | Shares | | Value (Note 1) |
| Harte Hanks, Inc. | | 187,500 | | $ 4,948,125 |
| Interactive Data Corp. | | 252,400 | | 5,732,004 |
| McGraw Hill Companies, Inc. | | 342,200 | | 17,667,786 |
| Pearson PLC | | 441,100 | | 5,220,708 |
| Pixar (a) | | 534,106 | | 28,158,068 |
| Reuters Group PLC | | 1,273,700 | | 9,439,738 |
| Sirius Satellite Radio, Inc. (a)(d) | | 4,299,400 | | 28,805,980 |
| The Weinstein Co. Holdings, LLC Class A 1 (g) | | 11,499 | | 11,499,000 |
| XM Satellite Radio Holdings, Inc. | | | | |
| Class A (a) | | 134,758 | | 3,676,198 |
| | | | | 138,688,106 |
| Multiline Retail – 0.4% | | | | |
| Marks & Spencer Group PLC | | 2,942,153 | | 25,578,571 |
| Target Corp. | | 797,400 | | 43,833,078 |
| | | | | 69,411,649 |
| Specialty Retail 1.2% | | | | |
| Abercrombie & Fitch Co. Class A | | 82,400 | | 5,370,832 |
| Bed Bath & Beyond, Inc. (a) | | 80,277 | | 2,902,014 |
| Best Buy Co., Inc. | | 163,450 | | 7,106,806 |
| Chico’s FAS, Inc. (a) | | 657,400 | | 28,879,582 |
| Circuit City Stores, Inc. | | 450,700 | | 10,181,313 |
| Esprit Holdings Ltd. | | 329,500 | | 2,341,536 |
| Hennes & Mauritz AB (H&M) (B Shares) | | 175,325 | | 5,958,556 |
| Inditex SA | | 50,792 | | 1,656,585 |
| Office Depot, Inc. (a) | | 1,262,500 | | 39,642,500 |
| Staples, Inc. | | 1,432,800 | | 32,538,888 |
| The Children’s Place Retail Stores, Inc. (a) | | 37,000 | | 1,828,540 |
| TJX Companies, Inc. | | 888,100 | | 20,630,563 |
| Too, Inc. (a) | | 66,000 | | 1,861,860 |
| Urban Outfitters, Inc. (a) | | 1,430,360 | | 36,202,412 |
| Volcom, Inc. | | 113,400 | | 3,856,734 |
| Wet Seal, Inc. Class A (a)(d) | | 1,141,500 | | 5,068,260 |
| Zumiez, Inc. | | 71,578 | | 3,093,601 |
| | | | | 209,120,582 |
| Textiles, Apparel & Luxury Goods 0.5% | | | | |
| Asics Corp. (d) | | 506,000 | | 5,373,072 |
| Burberry Group PLC | | 963,711 | | 7,129,882 |
| Coach, Inc. (a) | | 1,407,448 | | 46,924,316 |
| Deckers Outdoor Corp. (a) | | 44,100 | | 1,218,042 |
| Delta Woodside Industries, Inc. (a) | | 22,175 | | 11,309 |
| Geox Spa | | 219,882 | | 2,415,912 |
| Polo Ralph Lauren Corp. Class A | | 230,100 | | 12,917,814 |
| Puma AG | | 5,400 | | 1,575,823 |
| | | | | 77,566,170 |
| |
| TOTAL CONSUMER DISCRETIONARY | | | | 1,050,037,599 |
| |
| CONSUMER STAPLES 5.3% | | | | |
| Beverages 1.0% | | | | |
| Diageo PLC sponsored ADR | | 717,800 | | 41,847,740 |
| Hansen Natural Corp. (a) | | 22,696 | | 1,788,672 |
See accompanying notes which are an integral part of the financial statements.
| | |
| VIP Contrafund Portfolio | | 12 |
| Common Stocks continued | | | | | | |
| | | | | Shares | | Value (Note 1) |
| |
| CONSUMER STAPLES – continued | | | | | | |
| Beverages – continued | | | | | | |
| PepsiCo, Inc. | | | | 1,720,610 | | $ 101,653,639 |
| The Coca Cola Co. | | | | 641,000 | | 25,838,710 |
| | | | | | | 171,128,761 |
| Food & Staples Retailing – 1.0% | | | | | | |
| Sysco Corp. | | | | 400,700 | | 12,441,735 |
| Tesco PLC | | | | 2,688,890 | | 15,345,329 |
| Wal Mart de Mexico SA de CV Series V | | | | 1,930,998 | | 10,716,971 |
| Walgreen Co. | | | | 1,017,690 | | 45,042,959 |
| Whole Foods Market, Inc. | | | | 993,914 | | 76,919,004 |
| | | | | | | 160,465,998 |
| Food Products – 0.8% | | | | | | |
| Goodman Fielder Ltd. | | | | 2,202,500 | | 3,376,696 |
| Groupe Danone | | | | 103,740 | | 10,838,212 |
| Hershey Co. | | | | 546,100 | | 30,172,025 |
| Kellogg Co. | | | | 357,500 | | 15,451,150 |
| Nestle SA (Reg.) | | | | 93,417 | | 27,939,788 |
| Sara Lee Corp. | | | | 354,500 | | 6,700,050 |
| TreeHouse Foods, Inc. (a) | | | | 278,100 | | 5,206,032 |
| Wm. Wrigley Jr. Co. | | | | 611,300 | | 40,645,337 |
| | | | | | | 140,329,290 |
| Household Products – 1.7% | | | | | | |
| Colgate Palmolive Co. | | | | 703,700 | | 38,597,945 |
| Procter & Gamble Co. | | | | 4,300,509 | | 248,913,461 |
| | | | | | | 287,511,406 |
| Personal Products 0.8% | | | | | | |
| Avon Products, Inc. | | | | 4,143,356 | | 118,292,814 |
| Herbalife Ltd. | | | | 435,000 | | 14,146,200 |
| | | | | | | 132,439,014 |
| |
| TOTAL CONSUMER STAPLES | | | | | | 891,874,469 |
| |
| ENERGY 11.9% | | | | | | |
| Energy Equipment & Services – 1.7% | | | | | | |
| ENSCO International, Inc. | | | | 265,500 | | 11,774,925 |
| Halliburton Co. | | | | 857,600 | | 53,136,896 |
| Hydril Co. (a) | | | | 21,800 | | 1,364,680 |
| Noble Corp. | | | | 26,400 | | 1,862,256 |
| Schlumberger Ltd. (NY Shares) | | | | 1,849,000 | | 179,630,350 |
| Smith International, Inc. | | | | 1,165,450 | | 43,249,850 |
| | | | | | | 291,018,957 |
| Oil, Gas & Consumable Fuels 10.2% | | | | | | |
| Apache Corp. | | | | 273,980 | | 18,773,110 |
| BG Group PLC sponsored ADR | | | | 235,100 | | 11,677,417 |
| Bill Barrett Corp. | | | | 389,000 | | 15,019,290 |
| Blackrock Ventures, Inc. (a) | | | | 2,597,100 | | 25,690,637 |
| BP PLC sponsored ADR | | | | 1,618,932 | | 103,967,813 |
| Burlington Resources, Inc. | | | | 696,480 | | 60,036,576 |
| Canadian Natural Resources Ltd. | | | | 93,000 | | 4,610,202 |
| |
| |
See accompanying notes which are an integral part of the financial statements.
| | | | | | |
| | | 13 | | | | Annual Report |
13
| VIP Contrafund Portfolio | | | | |
| Investments - continued | | | | |
| |
| |
| |
| | | Shares | | Value (Note 1) |
| Canadian Oil Sands Trust unit | | 104,700 | | $ 11,347,641 |
| China Petroleum & Chemical Corp. sponsored ADR (d) | | 215,940 | | 10,710,624 |
| CNX Gas Corp. (a)(e) | | 115,300 | | 2,421,300 |
| CONSOL Energy, Inc. | | 263,600 | | 17,181,448 |
| Devon Energy Corp. | | 712,800 | | 44,578,512 |
| EnCana Corp. | | 9,926,184 | | 448,772,295 |
| Encore Acquisition Co. (a) | | 189,742 | | 6,079,334 |
| EOG Resources, Inc. | | 1,445,800 | | 106,078,346 |
| Exxon Mobil Corp. | | 3,002,400 | | 168,644,808 |
| Highpine Oil & Gas Ltd. | | 175,900 | | 3,132,020 |
| Imperial Oil Ltd. | | 96,700 | | 9,599,714 |
| Mariner Energy, Inc. (a)(e) | | 527,600 | | 9,364,900 |
| Murphy Oil Corp. | | 2,522,000 | | 136,162,780 |
| Noble Energy, Inc. | | 255,424 | | 10,293,587 |
| Peabody Energy Corp. | | 282,100 | | 23,250,682 |
| PetroChina Co. Ltd. sponsored ADR | | 703,300 | | 57,642,468 |
| Petroleo Brasileiro SA Petrobras sponsored ADR | | 244,800 | | 17,446,896 |
| Plains Exploration & Production Co. (a) | | 213,400 | | 8,478,382 |
| Quicksilver Resources, Inc. (a) | | 540,200 | | 22,693,802 |
| Range Resources Corp. | | 470,000 | | 12,379,800 |
| Sasol Ltd. sponsored ADR | | 560,700 | | 19,983,348 |
| Talisman Energy, Inc. | | 446,990 | | 23,684,645 |
| Total SA sponsored ADR | | 565,769 | | 71,513,202 |
| Ultra Petroleum Corp. (a) | | 267,450 | | 14,923,710 |
| Valero Energy Corp. | | 3,810,280 | | 196,610,448 |
| XTO Energy, Inc. | | 621,600 | | 27,313,104 |
| | | | | 1,720,062,841 |
| |
| TOTAL ENERGY | | | | 2,011,081,798 |
| |
| FINANCIALS 16.7% | | | | |
| Capital Markets 1.5% | | | | |
| Charles Schwab Corp. | | 2,502,600 | | 36,713,142 |
| E*TRADE Financial Corp. (a) | | 333,970 | | 6,966,614 |
| Goldman Sachs Group, Inc. | | 658,200 | | 84,058,722 |
| Lazard Ltd. Class A | | 195,800 | | 6,246,020 |
| Legg Mason, Inc. | | 169,400 | | 20,275,486 |
| Lehman Brothers Holdings, Inc. | | 733,500 | | 94,012,695 |
| Nuveen Investments, Inc. Class A | | 36,400 | | 1,551,368 |
| | | | | 249,824,047 |
| Commercial Banks – 2.5% | | | | |
| Allied Irish Banks PLC | | 1,156,100 | | 24,833,027 |
| Anglo Irish Bank Corp. PLC | | 1,722,482 | | 26,142,035 |
| Banco Itau Holding Financeira SA sponsored ADR (non vtg.) | | 398,000 | | 9,559,960 |
| Bank of America Corp. | | 1,093,500 | | 50,465,025 |
| HDFC Bank Ltd. | | 317,446 | | 5,000,330 |
| HDFC Bank Ltd. sponsored ADR | | 117,900 | | 6,001,110 |
| HSBC Holdings PLC sponsored ADR | | 124,517 | | 10,019,883 |
| M&T Bank Corp. | | 813,000 | | 88,657,650 |
See accompanying notes which are an integral part of the financial statements.
| | |
| VIP Contrafund Portfolio | | 14 |
| Common Stocks continued | | | | | | |
| | | | | Shares | | Value (Note 1) |
| |
| FINANCIALS – continued | | | | | | |
| Commercial Banks ��� continued | | | | | | |
| Mitsubishi UFJ Financial Group, Inc. | | | | 203 | | $ 2,779,070 |
| Royal Bank of Scotland Group PLC | | | | 996,500 | | 30,107,456 |
| Shinhan Financial Group Co. Ltd. | | | | 170,180 | | 6,933,886 |
| Uniao de Bancos Brasileiros SA (Unibanco) GDR | | | | 558,600 | | 35,510,202 |
| Wells Fargo & Co. | | | | 2,092,800 | | 131,490,624 |
| | | | | | | 427,500,258 |
| Consumer Finance – 1.4% | | | | | | |
| American Express Co. | | | | 2,086,650 | | 107,379,009 |
| SLM Corp. | | | | 2,443,500 | | 134,612,415 |
| | | | | | | 241,991,424 |
| Diversified Financial Services – 0.8% | | | | | | |
| Brookfield Asset Management, Inc. | | | | | | |
| Class A | | | | 186,400 | | 9,397,363 |
| Chicago Mercantile Exchange Holdings, Inc. Class A | | | | 24,700 | | 9,077,003 |
| JPMorgan Chase & Co. | | | | 700,100 | | 27,786,969 |
| Moody’s Corp. | | | | 1,361,500 | | 83,623,330 |
| | | | | | | 129,884,665 |
| Insurance – 8.9% | | | | | | |
| ACE Ltd. | | | | 526,400 | | 28,130,816 |
| Admiral Group PLC | | | | 1,736,600 | | 13,602,879 |
| AFLAC, Inc. | | | | 922,100 | | 42,803,882 |
| Allstate Corp. | | | | 2,443,000 | | 132,093,010 |
| American Equity Investment Life Holding Co. | | | | 110,100 | | 1,436,805 |
| American International Group, Inc. | | | | 2,502,914 | | 170,773,822 |
| Assurant, Inc. | | | | 880,450 | | 38,290,771 |
| Assured Guaranty Ltd. | | | | 66,100 | | 1,678,279 |
| Axis Capital Holdings Ltd. | | | | 1,247,000 | | 39,006,160 |
| Berkshire Hathaway, Inc. Class A (a) | | | | 4,240 | | 375,748,800 |
| Endurance Specialty Holdings Ltd. | | | | 111,800 | | 4,008,030 |
| Everest Re Group Ltd. | | | | 1,074,080 | | 107,783,928 |
| Fidelity National Financial, Inc. | | | | 130,600 | | 4,804,774 |
| Genworth Financial, Inc. Class A (non vtg.) | | | | 297,800 | | 10,297,924 |
| HCC Insurance Holdings, Inc. | | | | 153,450 | | 4,554,396 |
| Loews Corp. | | | | 358,500 | | 34,003,725 |
| Markel Corp. (a) | | | | 18,550 | | 5,881,278 |
| Mercury General Corp. | | | | 251,400 | | 14,636,508 |
| MetLife, Inc. | | | | 1,727,400 | | 84,642,600 |
| MetLife, Inc. unit | | | | 909,684 | | 25,061,794 |
| Millea Holdings, Inc. | | | | 132 | | 2,272,677 |
| Montpelier Re Holdings Ltd. | | | | 452,300 | | 8,548,470 |
| PartnerRe Ltd. | | | | 193,900 | | 12,733,413 |
| Progressive Corp. | | | | 526,700 | | 61,508,026 |
| Prudential Financial, Inc. | | | | 886,800 | | 64,904,892 |
| RenaissanceRe Holdings Ltd. | | | | 205,065 | | 9,045,417 |
| RLI Corp. | | | | 173,700 | | 8,662,419 |
| StanCorp Financial Group, Inc. | | | | 273,800 | | 13,676,310 |
| |
| |
| | | | | Shares | | Value (Note 1) |
| The Chubb Corp. | | | | 653,600 | | $ 63,824,040 |
| |
See accompanying notes which are an integral part of the financial statements.
| | | | | | |
| | | 15 | | | | Annual Report |
15
| VIP Contrafund Portfolio | | | | |
| Investments - continued | | | | |
| |
| |
| | Shares | | Value (Note 1) |
| | | | |
| | | | |
| The St. Paul Travelers Companies, Inc. | | 1,021,500 | | 45,630,405 |
| W.R. Berkley Corp. | | 992,775 | | 47,275,946 |
| White Mountains Insurance Group Ltd. | | 53,567 | | 29,919,848 |
| Willis Group Holdings Ltd. | | 219,900 | | 8,123,106 |
| | | | | 1,515,365,150 |
| Real Estate 0.7% | | | | |
| CB Richard Ellis Group, Inc. Class A (a) | | 767,900 | | 45,190,915 |
| CBL & Associates Properties, Inc. | | 436,642 | | 17,251,725 |
| Equity Office Properties Trust | | 10,200 | | 309,366 |
| Equity Residential (SBI) | | 274,000 | | 10,718,880 |
| General Growth Properties, Inc. | | 142,400 | | 6,691,376 |
| Global Signal, Inc. | | 152,900 | | 6,599,164 |
| Mitsui Fudosan Co. Ltd. | | 496,000 | | 10,075,231 |
| Vornado Realty Trust | | 289,400 | | 24,156,218 |
| | | | | 120,992,875 |
| Thrifts & Mortgage Finance – 0.9% | | | | |
| Golden West Financial Corp., Delaware | | 2,214,500 | | 146,157,000 |
| Hudson City Bancorp, Inc. | | 250,000 | | 3,030,000 |
| | | | | 149,187,000 |
| |
| TOTAL FINANCIALS | | | | 2,834,745,419 |
| |
| HEALTH CARE 14.3% | | | | |
| Biotechnology – 4.3% | | | | |
| Actelion Ltd. (Reg.) (a) | | 71,198 | | 5,889,819 |
| Amgen, Inc. (a) | | 371,600 | | 29,304,376 |
| Amylin Pharmaceuticals, Inc. (a) | | 39,700 | | 1,584,824 |
| Anadys Pharmaceuticals, Inc. (a) | | 475,900 | | 4,187,920 |
| Arena Pharmaceuticals, Inc. (a) | | 678,700 | | 9,651,114 |
| Biogen Idec, Inc. (a) | | 24,500 | | 1,110,585 |
| BioMarin Pharmaceutical, Inc. (a) | | 66,900 | | 721,182 |
| Celgene Corp. (a) | | 464,300 | | 30,086,640 |
| Cephalon, Inc. (a) | | 27,600 | | 1,786,824 |
| Exelixis, Inc. (a) | | 297,200 | | 2,799,624 |
| Genentech, Inc. (a) | | 5,304,900 | | 490,703,250 |
| Genmab AS (a) | | 66,000 | | 1,413,837 |
| Genzyme Corp. (a) | | 311,000 | | 22,012,580 |
| Gilead Sciences, Inc. (a) | | 1,153,700 | | 60,719,231 |
| ICOS Corp. (a) | | 148,800 | | 4,111,344 |
| Idenix Pharmaceuticals, Inc. (a) | | 416,000 | | 7,117,760 |
| MannKind Corp. (a)(d) | | 603,741 | | 6,798,124 |
| MannKind Corp. warrants 8/3/10 (a)(g) | | 86,731 | | 446,294 |
| Medarex, Inc. (a) | | 681,700 | | 9,441,545 |
| MedImmune, Inc. (a) | | 263,600 | | 9,231,272 |
| Myogen, Inc. (a) | | 110,124 | | 3,321,340 |
| Neurocrine Biosciences, Inc. (a) | | 25,000 | | 1,568,250 |
| Protein Design Labs, Inc. (a) | | 87,920 | | 2,498,686 |
| Seattle Genetics, Inc. (a) | | 712,300 | | 3,362,056 |
| Tanox, Inc. (a) | | 215,523 | | 3,528,112 |
See accompanying notes which are an integral part of the financial statements.
| | |
| VIP Contrafund Portfolio | | 16 |
| Common Stocks continued | | | | | | |
| | | | | Shares | | Value (Note 1) |
| |
| HEALTH CARE continued | | | | | | |
| Biotechnology – continued | | | | | | |
| Techne Corp. (a) | | | | 149,979 | | $ 8,421,321 |
| Theravance, Inc. (a) | | | | 115,900 | | 2,610,068 |
| United Therapeutics Corp. (a) | | | | 30,600 | | 2,115,072 |
| ViaCell, Inc. | | | | 196,800 | | 1,106,016 |
| | | | | | | 727,649,066 |
| Health Care Equipment & Supplies 3.7% | | | | | | |
| Alcon, Inc. | | | | 681,800 | | 88,361,280 |
| Aspect Medical Systems, Inc. (a) | | | | 71,400 | | 2,452,590 |
| C.R. Bard, Inc. | | | | 461,000 | | 30,389,120 |
| China Medical Technologies, Inc. sponsored ADR (d) | | | | 287,600 | | 9,160,060 |
| Conceptus, Inc. (a) | | | | 353,013 | | 4,455,024 |
| DENTSPLY International, Inc. | | | | 1,219,162 | | 65,456,808 |
| Foxhollow Technologies, Inc. (a)(d) | | | | 492,840 | | 14,681,704 |
| Gen Probe, Inc. (a) | | | | 578,100 | | 28,205,499 |
| Hospira, Inc. (a) | | | | 223,800 | | 9,574,164 |
| IDEXX Laboratories, Inc. (a) | | | | 28,270 | | 2,034,875 |
| Intuitive Surgical, Inc. (a) | | | | 675,305 | | 79,193,017 |
| IRIS International, Inc. (a) | | | | 71,500 | | 1,562,990 |
| Kyphon, Inc. (a) | | | | 694,800 | | 28,368,684 |
| LifeCell Corp. (a) | | | | 115,700 | | 2,206,399 |
| Medtronic, Inc. | | | | 749,340 | | 43,139,504 |
| Mentor Corp. | | | | 109,300 | | 5,036,544 |
| NeuroMetrix, Inc. (a) | | | | 87,600 | | 2,389,728 |
| NMT Medical, Inc. (a) | | | | 166,314 | | 2,661,024 |
| Nobel Biocare Holding AG (Switzerland) | | | | 50,349 | | 11,073,715 |
| NuVasive, Inc. (a) | | | | 206,437 | | 3,736,510 |
| ResMed, Inc. (a) | | | | 244,200 | | 9,355,302 |
| Respironics, Inc. (a) | | | | 65,700 | | 2,435,499 |
| Somanetics Corp. (a) | | | | 57,500 | | 1,840,000 |
| St. Jude Medical, Inc. (a) | | | | 2,835,652 | | 142,349,730 |
| Syneron Medical Ltd. (a) | | | | 170,600 | | 5,416,550 |
| Thermo Electron Corp. (a) | | | | 865,300 | | 26,071,489 |
| Varian Medical Systems, Inc. (a) | | | | 187,300 | | 9,428,682 |
| Viasys Healthcare, Inc. (a) | | | | 142,900 | | 3,672,530 |
| | | | | | | 634,709,021 |
| Health Care Providers & Services 4.0% | | | | | | |
| Aetna, Inc. | | | | 2,463,300 | | 232,313,823 |
| American Healthways, Inc. (a) | | | | 70,011 | | 3,167,998 |
| Caremark Rx, Inc. (a) | | | | 473,600 | | 24,527,744 |
| Cerner Corp. (a) | | | | 58,400 | | 5,309,144 |
| Chemed Corp. New | | | | 44,000 | | 2,185,920 |
| Health Net, Inc. (a) | | | | 353,000 | | 18,197,150 |
| Merge Technologies, Inc. (a)(d) | | | | 755,230 | | 18,910,959 |
| Patterson Companies, Inc. (a) | | | | 3,103,304 | | 103,650,354 |
| UnitedHealth Group, Inc. | | | | 3,135,060 | | 194,812,628 |
| VCA Antech, Inc. (a) | | | | 226,800 | | 6,395,760 |
| WebMD Health Corp. Class A | | | | 28,300 | | 822,115 |
| WellPoint, Inc. (a) | | | | 731,200 | | 58,342,448 |
| | | | | | | 668,636,043 |
| |
| |
See accompanying notes which are an integral part of the financial statements.
| | | | | | |
| | | 17 | | | | Annual Report |
17
| VIP Contrafund Portfolio | | | | | | |
| Investments - continued | | | | | | |
| |
| |
| |
| | | | | Shares | | Value (Note 1) |
| Pharmaceuticals 2.3% | | | | | | |
| Allergan, Inc. | | | | 58,500 | | $ 6,315,660 |
| Forest Laboratories, Inc. (a) | | | | 36,800 | | 1,497,024 |
| IVAX Corp. (a) | | | | 490,500 | | 15,367,365 |
| Johnson & Johnson | | | | 96,550 | | 5,802,655 |
| Kos Pharmaceuticals, Inc. (a) | | | | 176,300 | | 9,119,999 |
| New River Pharmaceuticals, Inc. (a) | | | | 26,700 | | 1,385,196 |
| Novartis AG sponsored ADR | | | | 1,042,300 | | 54,699,904 |
| Novo Nordisk AS Series B | | | | 7,637 | | 429,596 |
| Roche Holding AG (participation certificate) | | | | 1,440,137 | | 216,239,749 |
| Salix Pharmaceuticals Ltd. (a) | | | | 160,000 | | 2,812,800 |
| Sanofi Aventis sponsored ADR | | | | 346,900 | | 15,228,910 |
| Schering Plough Corp. | | | | 1,833,300 | | 38,224,305 |
| Teva Pharmaceutical Industries Ltd. sponsored ADR | | | | 546,400 | | 23,500,664 |
| | | | | | | 390,623,827 |
| |
| TOTAL HEALTH CARE | | | | | | 2,421,617,957 |
| |
| INDUSTRIALS – 8.0% | | | | | | |
| Aerospace & Defense – 0.7% | | | | | | |
| L 3 Communications Holdings, Inc. | | | | 135,500 | | 10,074,425 |
| Lockheed Martin Corp. | | | | 1,188,735 | | 75,639,208 |
| Precision Castparts Corp. | | | | 395,272 | | 20,479,042 |
| United Technologies Corp. | | | | 233,500 | | 13,054,985 |
| | | | | | | 119,247,660 |
| Air Freight & Logistics – 0.7% | | | | | | |
| C.H. Robinson Worldwide, Inc. | | | | 2,630,974 | | 97,424,967 |
| United Parcel Service, Inc. Class B | | | | 171,600 | | 12,895,740 |
| UTI Worldwide, Inc. | | | | 80,000 | | 7,427,200 |
| | | | | | | 117,747,907 |
| Airlines – 0.6% | | | | | | |
| Gol Linhas Aereas Inteligentes SA sponsored ADR (d) | | | | 422,000 | | 11,904,620 |
| JetBlue Airways Corp. (a) | | | | 120,450 | | 1,852,521 |
| Republic Airways Holdings, Inc. (a) | | | | 635,388 | | 9,657,898 |
| Ryanair Holdings PLC sponsored ADR (a) | | | | 1,322,551 | | 74,049,630 |
| Southwest Airlines Co. | | | | 146,400 | | 2,405,352 |
| US Airways Group, Inc. (a) | | | | 231,900 | | 8,612,766 |
| | | | | | | 108,482,787 |
| Commercial Services & Supplies 0.6% | | | | | | |
| Advisory Board Co. (a) | | | | 55,700 | | 2,655,219 |
| Aramark Corp. Class B | | | | 786,050 | | 21,836,469 |
| Corporate Executive Board Co. | | | | 90,500 | | 8,117,850 |
| Equifax, Inc. | | | | 182,600 | | 6,942,452 |
| Monster Worldwide, Inc. (a) | | | | 180,676 | | 7,375,194 |
| PHH Corp. (a) | | | | 133,200 | | 3,732,264 |
| Resources Connection, Inc. (a) | | | | 769,800 | | 20,060,988 |
| Robert Half International, Inc. | | | | 632,205 | | 23,954,247 |
| | | | | | | 94,674,683 |
| |
| |
| |
| |
| See accompanying notes which are an integral part of the financial statements. | | | | | | |
| |
| VIP Contrafund Portfolio | | 18 | | | | |
| Common Stocks continued | | | | | | |
| | | | | Shares | | Value (Note 1) |
| |
| INDUSTRIALS – continued | | | | | | |
| Construction & Engineering – 0.3% | | | | | | |
| Jacobs Engineering Group, Inc. (a) | | | | 563,620 | | $ 38,252,889 |
| URS Corp. (a) | | | | 251,700 | | 9,466,437 |
| | | | | | | 47,719,326 |
| Electrical Equipment 0.7% | | | | | | |
| Cooper Industries Ltd. Class A | | | | 963,800 | | 70,357,400 |
| Energy Conversion Devices, Inc. (a)(d) | | | | 264,300 | | 10,770,225 |
| Motech Industries, Inc. | | | | 921,515 | | 12,688,675 |
| NEOMAX Co. Ltd. (d) | | | | 202,000 | | 6,647,386 |
| Roper Industries, Inc. | | | | 127,600 | | 5,041,476 |
| SolarWorld AG | | | | 19,500 | | 2,608,613 |
| Ultralife Batteries, Inc. (a) | | | | 306,920 | | 3,683,040 |
| | | | | | | 111,796,815 |
| Industrial Conglomerates 1.1% | | | | | | |
| 3M Co. | | | | 2,156,020 | | 167,091,550 |
| Hutchison Whampoa Ltd. | | | | 2,327,000 | | 22,163,620 |
| Raven Industries, Inc. | | | | 7,343 | | 211,846 |
| | | | | | | 189,467,016 |
| Machinery – 2.5% | | | | | | |
| A.S.V., Inc. (a)(d) | | | | 326,328 | | 8,151,673 |
| Bucyrus International, Inc. Class A | | | | 291,700 | | 15,372,590 |
| Caterpillar, Inc. | | | | 951,500 | | 54,968,155 |
| Cummins, Inc. | | | | 347,200 | | 31,154,256 |
| Danaher Corp. | | | | 2,981,060 | | 166,283,527 |
| IDEX Corp. | | | | 413,400 | | 16,994,874 |
| Joy Global, Inc. | | | | 1,277,753 | | 51,110,120 |
| PACCAR, Inc. | | | | 1,146,943 | | 79,402,864 |
| Volvo AB sponsored ADR | | | | 134,400 | | 6,327,552 |
| | | | | | | 429,765,611 |
| Marine – 0.0% | | | | | | |
| American Commercial Lines, Inc. | | | | 63,300 | | 1,917,357 |
| Road & Rail 0.6% | | | | | | |
| Canadian National Railway Co. | | | | 545,800 | | 43,727,850 |
| Heartland Express, Inc. | | | | 458,968 | | 9,312,461 |
| Knight Transportation, Inc. | | | | 559,680 | | 11,602,166 |
| Landstar System, Inc. | | | | 754,144 | | 31,477,971 |
| | | | | | | 96,120,448 |
| Trading Companies & Distributors – 0.2% | | | | | | |
| Fastenal Co. | | | | 585,224 | | 22,934,929 |
| Mitsui & Co. Ltd. | | | | 1,334,000 | | 17,141,004 |
| | | | | | | 40,075,933 |
| |
| TOTAL INDUSTRIALS | | | | | | 1,357,015,543 |
| |
| INFORMATION TECHNOLOGY 17.9% | | | | | | |
| Communications Equipment – 1.6% | | | | | | |
| Comverse Technology, Inc. (a) | | | | 1,046,327 | | 27,821,835 |
| Corning, Inc. (a) | | | | 744,900 | | 14,644,734 |
| CSR PLC (a) | | | | 738,127 | | 11,893,963 |
| |
| |
See accompanying notes which are an integral part of the financial statements.
| | | | | | |
| | | 19 | | | | Annual Report |
19
| VIP Contrafund Portfolio | | | | |
| Investments - continued | | | | |
| |
| |
| |
| | | Shares | | Value (Note 1) |
| ECI Telecom Ltd. (a) | | 679,500 | | $ 5,089,455 |
| F5 Networks, Inc. (a) | | 156,038 | | 8,923,813 |
| Foxconn International Holdings Ltd. | | 3,533,000 | | 5,764,053 |
| Harris Corp. | | 532,200 | | 22,889,922 |
| Ixia (a) | | 355,500 | | 5,254,290 |
| JDS Uniphase Corp. (a) | | 600,200 | | 1,416,472 |
| Motorola, Inc. | | 3,317,838 | | 74,949,960 |
| Nokia Corp. sponsored ADR | | 300,000 | | 5,490,000 |
| Nortel Networks Corp. (a) | | 2,325,900 | | 7,117,254 |
| QUALCOMM, Inc. | | 1,923,200 | | 82,851,456 |
| Sycamore Networks, Inc. (a) | | 340,300 | | 1,470,096 |
| | | | | 275,577,303 |
| Computers & Peripherals 2.6% | | | | |
| Apple Computer, Inc. (a) | | 3,477,363 | | 249,987,626 |
| EMC Corp. (a) | | 864,300 | | 11,771,766 |
| Hewlett Packard Co. | | 4,408,200 | | 126,206,766 |
| Logitech International SA sponsored ADR (a) | | 315,800 | | 14,769,966 |
| Network Appliance, Inc. (a) | | 613,400 | | 16,561,800 |
| SanDisk Corp. (a) | | 292,669 | | 18,385,467 |
| Seagate Technology | | 152,400 | | 3,046,476 |
| | | | | 440,729,867 |
| Electronic Equipment & Instruments – 0.8% | | | | |
| Agilent Technologies, Inc. (a) | | 345,100 | | 11,488,379 |
| Amphenol Corp. Class A | | 502,200 | | 22,227,372 |
| Cogent, Inc. (a) | | 137,920 | | 3,128,026 |
| FLIR Systems, Inc. (a) | | 779,149 | | 17,398,397 |
| Hon Hai Precision Industry Co. Ltd. (Foxconn) | | 8,199,113 | | 44,958,809 |
| Hoya Corp. | | 131,400 | | 4,725,296 |
| Mettler Toledo International, Inc. (a) | | 232,100 | | 12,811,920 |
| National Instruments Corp. | | 222,623 | | 7,135,067 |
| Nidec Corp. | | 18,600 | | 1,582,274 |
| | | | | 125,455,540 |
| Internet Software & Services 5.4% | | | | |
| Akamai Technologies, Inc. (a) | | 1,689,483 | | 33,671,396 |
| Google, Inc. Class A (sub. vtg.) (a) | | 1,405,999 | | 583,292,742 |
| iVillage, Inc. (a) | | 1,107,313 | | 8,880,650 |
| Websense, Inc. (a) | | 112,967 | | 7,415,154 |
| WebSideStory, Inc. (a) | | 239,200 | | 4,336,696 |
| Yahoo!, Inc. (a) | | 7,070,186 | | 277,009,887 |
| | | | | 914,606,525 |
| IT Services 1.7% | | | | |
| Accenture Ltd. Class A | | 606,400 | | 17,506,768 |
| Anteon International Corp. (a) | | 407,000 | | 22,120,450 |
| Ceridian Corp. (a) | | 146,600 | | 3,643,010 |
| CheckFree Corp. (a) | | 341,602 | | 15,679,532 |
| Cognizant Technology Solutions Corp. Class A (a) | | 858,984 | | 43,249,844 |
| First Data Corp. | | 295,100 | | 12,692,251 |
| Fiserv, Inc. (a) | | 215,400 | | 9,320,358 |
| Global Payments, Inc. | | 526,000 | | 24,516,860 |
| Heartland Payment Systems, Inc. | | 16,000 | | 346,560 |
See accompanying notes which are an integral part of the financial statements.
| | |
| VIP Contrafund Portfolio | | 20 |
| Common Stocks continued | | | | |
| | | Shares | | Value (Note 1) |
| |
| INFORMATION TECHNOLOGY – continued | | | | |
| IT Services – continued | | | | |
| Infosys Technologies Ltd. sponsored ADR | | 704,900 | | $ 56,998,214 |
| MoneyGram International, Inc. | | 143,700 | | 3,747,696 |
| MPS Group, Inc. (a) | | 154,100 | | 2,106,547 |
| Paychex, Inc. | | 477,700 | | 18,209,924 |
| SRA International, Inc. Class A (a) | | 1,209,800 | | 36,947,292 |
| VeriFone Holdings, Inc. | | 665,200 | | 16,829,560 |
| Wright Express Corp. | | 180,400 | | 3,968,800 |
| | | | | 287,883,666 |
| Semiconductors & Semiconductor Equipment – 4.0% | | | | |
| Advanced Analogic Technologies, Inc. | | 168,400 | | 2,332,340 |
| ATI Technologies, Inc. (a) | | 188,000 | | 3,201,927 |
| Broadcom Corp. Class A (a) | | 861,900 | | 40,638,585 |
| Freescale Semiconductor, Inc. Class A (a) | | 57,300 | | 1,443,387 |
| Hittite Microwave Corp. | | 50,973 | | 1,179,515 |
| Lam Research Corp. (a) | | 219,700 | | 7,838,896 |
| Marvell Technology Group Ltd. (a) | | 5,685,200 | | 318,882,868 |
| MathStar, Inc. | | 85,100 | | 486,772 |
| MediaTek, Inc. | | 233,200 | | 2,749,254 |
| Monolithic Power Systems, Inc. (a) | | 297,100 | | 4,453,529 |
| National Semiconductor Corp. | | 480,900 | | 12,493,782 |
| NVIDIA Corp. (a) | | 688,500 | | 25,171,560 |
| Powertech Technology, Inc. | | 1,450,000 | | 4,770,536 |
| Samsung Electronics Co. Ltd. | | 372,754 | | 243,816,306 |
| Siliconware Precision Industries Co. Ltd. sponsored ADR (d) | | 220,200 | | 1,528,188 |
| SiRF Technology Holdings, Inc. (a) | | 324,800 | | 9,679,040 |
| | | | | 680,666,485 |
| Software 1.8% | | | | |
| Activision, Inc. (a) | | 1,300,680 | | 17,871,343 |
| Adobe Systems, Inc. | | 1,535,976 | | 56,769,673 |
| Altiris, Inc. (a) | | 761,839 | | 12,867,461 |
| Autodesk, Inc. (a) | | 855,422 | | 36,740,375 |
| Blackboard, Inc. (a) | | 157,500 | | 4,564,350 |
| Citrix Systems, Inc. (a) | | 204,889 | | 5,896,705 |
| FileNET Corp. (a) | | 524,159 | | 13,549,510 |
| Intuit, Inc. (a) | | 594,682 | | 31,696,551 |
| JAMDAT Mobile, Inc. (a) | | 68,806 | | 1,828,863 |
| McAfee, Inc. (a) | | 797,300 | | 21,630,749 |
| NAVTEQ Corp. (a) | | 759,300 | | 33,310,491 |
| NDS Group PLC sponsored ADR (a) | | 78,800 | | 3,242,620 |
| Quality Systems, Inc. | | 101,847 | | 7,817,776 |
| Red Hat, Inc. (a) | | 267,874 | | 7,296,888 |
| Salesforce.com, Inc. (a) | | 761,700 | | 24,412,485 |
| SAP AG sponsored ADR | | 363,000 | | 16,360,410 |
| Symantec Corp. (a) | | 314,298 | | 5,500,215 |
| THQ, Inc. (a) | | 117,300 | | 2,797,605 |
| | | | | 304,154,070 |
| |
| TOTAL INFORMATION TECHNOLOGY | | | | 3,029,073,456 |
See accompanying notes which are an integral part of the financial statements.
|
21 Annual Report
21
| VIP Contrafund Portfolio | | | | | | |
| Investments - continued | | | | | | |
| |
| |
| |
| | | | | Shares | | Value (Note 1) |
| |
| MATERIALS 7.7% | | | | | | |
| Chemicals 1.1% | | | | | | |
| Agrium, Inc. | | | | 420,700 | | $ 9,271,286 |
| Bayer AG | | | | 587,000 | | 24,513,121 |
| Celanese Corp. Class A | | | | 805,000 | | 15,391,600 |
| Chemtura Corp. | | | | 483,174 | | 6,136,310 |
| Ecolab, Inc. | | | | 1,696,800 | | 61,542,936 |
| Monsanto Co. | | | | 33,000 | | 2,558,490 |
| Nalco Holding Co. (a) | | | | 596,200 | | 10,558,702 |
| Praxair, Inc. | | | | 1,216,300 | | 64,415,248 |
| | | | | | | 194,387,693 |
| Construction Materials – 0.2% | | | | | | |
| Eagle Materials, Inc. | | | | 152,700 | | 18,684,372 |
| Florida Rock Industries, Inc. | | | | 39,300 | | 1,928,058 |
| Lafarge SA (Bearer) | | | | 18,197 | | 1,637,231 |
| Rinker Group Ltd. | | | | 1,514,565 | | 18,276,101 |
| | | | | | | 40,525,762 |
| Containers & Packaging – 0.2% | | | | | | |
| Crown Holdings, Inc. (a) | | | | 588,400 | | 11,491,452 |
| Owens Illinois, Inc. (a) | | | | 1,073,184 | | 22,579,791 |
| Peak International Ltd. (a) | | | | 200,000 | | 530,000 |
| | | | | | | 34,601,243 |
| Metals & Mining – 6.2% | | | | | | |
| Aber Diamond Corp. | | | | 248,450 | | 9,183,172 |
| Agnico Eagle Mines Ltd. | | | | 297,100 | | 5,882,966 |
| Anglo American PLC ADR (d) | | | | 2,019,572 | | 70,240,714 |
| Bema Gold Corp. (a) | | | | 4,417,100 | | 12,804,290 |
| BHP Billiton Ltd. sponsored ADR | | | | 3,581,270 | | 119,686,043 |
| Companhia Vale do Rio Doce sponsored ADR | | | | 1,048,700 | | 43,143,518 |
| Compania de Minas Buenaventura SA sponsored ADR | | | | 305,400 | | 8,642,820 |
| Compass Minerals International, Inc. | | | | 430,100 | | 10,554,654 |
| Eldorado Gold Corp. (a) | | | | 2,600,600 | | 12,728,411 |
| Falconbridge Ltd. | | | | 286,000 | | 8,487,377 |
| First Quantum Minerals Ltd. | | | | 590,500 | | 18,920,584 |
| Freeport McMoRan Copper & Gold, Inc. Class B | | | | 512,034 | | 27,547,429 |
| Gabriel Resources Ltd. (a) | | | | 1,532,200 | | 3,743,020 |
| Gerdau SA sponsored ADR | | | | 948,250 | | 15,816,810 |
| Glamis Gold Ltd. (a) | | | | 2,772,400 | | 76,240,702 |
| Goldcorp, Inc. | | | | 4,377,766 | | 97,530,549 |
| IPSCO, Inc. | | | | 626,900 | | 52,150,444 |
| Ivanhoe Mines Ltd. (a) | | | | 1,666,900 | | 11,972,487 |
| Lihir Gold Ltd. (a) | | | | 3,746,700 | | 5,991,494 |
| Meridian Gold, Inc. (a) | | | | 207,300 | | 4,543,464 |
| New Gold, Inc. (a) | | | | 210,500 | | 1,412,326 |
| Newcrest Mining Ltd. | | | | 644,400 | | 11,486,601 |
| Newmont Mining Corp. | | | | 3,313,151 | | 176,922,263 |
| Nucor Corp. | | | | 261,300 | | 17,433,936 |
| Phelps Dodge Corp. | | | | 142,800 | | 20,544,636 |
| |
| |
| |
| |
| See accompanying notes which are an integral part of the financial statements. | | | | | | |
| |
| VIP Contrafund Portfolio | | 22 | | | | |
| Common Stocks continued | | | | | | | | |
| | | | | | | Shares | | Value (Note 1) |
| |
| MATERIALS – continued | | | | | | | | |
| Metals & Mining – continued | | | | | | | | |
| POSCO sponsored ADR (d) | | | | | | 699,400 | | $ 34,627,294 |
| Rio Tinto PLC (Reg.) | | | | | | 2,527,375 | | 115,494,705 |
| Shore Gold, Inc. (a) | | | | | | 329,800 | | 2,178,714 |
| Southern Copper Corp. | | | | | | 105,700 | | 7,079,786 |
| Teck Cominco Ltd. Class B (sub. vtg.) | | | | | | 581,200 | | 31,020,997 |
| United States Steel Corp. | | | | | | 23,100 | | 1,110,417 |
| Xstrata PLC | | | | | | 333,900 | | 7,817,627 |
| | | | | | | | | 1,042,940,250 |
| |
| TOTAL MATERIALS | | | | | | | | 1,312,454,948 |
| |
| TELECOMMUNICATION SERVICES 3.3% | | | | | | | | |
| Diversified Telecommunication Services – 0.0% | | | | | | | | |
| NeuStar, Inc. Class A | | | | | | 94,500 | | 2,881,305 |
| PT Telkomunikasi Indonesia Tbk sponsored ADR | | | | | | 55,100 | | 1,314,686 |
| Telkom SA Ltd. | | | | | | 105,700 | | 2,250,980 |
| | | | | | | | | 6,446,971 |
| Wireless Telecommunication Services – 3.3% | | | | | | | | |
| ALLTEL Corp. | | | | | | 41,611 | | 2,625,654 |
| America Movil SA de CV Series L sponsored ADR | | | | | | 8,060,700 | | 235,856,082 |
| American Tower Corp. Class A (a) | | | | | | 1,254,280 | | 33,990,988 |
| China Mobile (Hong Kong) Ltd. sponsored ADR | | | | | | 564,400 | | 13,568,176 |
| Investcom LLC GDR | | | | | | 174,500 | | 2,451,725 |
| Leap Wireless International, Inc. (a) | | | | | | 85,800 | | 3,250,104 |
| MTN Group Ltd. | | | | | | 220,000 | | 2,160,885 |
| Nextel Partners, Inc. Class A (a) | | | | | | 2,676,000 | | 74,767,440 |
| NII Holdings, Inc. (a) | | | | | | 2,553,306 | | 111,528,406 |
| Rogers Communications, Inc. Class B (non vtg.) | | | | | | 346,800 | | 14,676,840 |
| Sprint Nextel Corp. | | | | | | 2,234,791 | | 52,204,718 |
| Turkcell Iletisim Hizmet AS sponsored ADR | | | | | | 82,000 | | 1,259,520 |
| Vimpel Communications sponsored ADR (a) | | | | | | 254,400 | | 11,252,112 |
| | | | | | | | | 559,592,650 |
| |
| TOTAL TELECOMMUNICATION SERVICES | | | | | | | | 566,039,621 |
| |
| |
| | | | | | | Shares | | Value (Note 1) |
| |
| UTILITIES 0.3% | | | | | | | | |
| Electric Utilities – 0.0% | | | | | | | | |
| Exelon Corp. | | | | | | 95,485 | �� | $ 5,074,073 |
| Gas Utilities 0.2% | | | | | | | | |
| Questar Corp. | | | | | | 133,800 | | 10,128,660 |
| Southern Union Co. | | | | | | 753,777 | | 17,811,751 |
| | | | | | | | | 27,940,411 |
| Independent Power Producers & Energy Traders 0.1% | | | | | | |
| AES Corp. (a) | | | | | | 699,600 | | 11,074,668 |
| NRG Energy, Inc. (a) | | | | | | 40,700 | | 1,917,784 |
| TXU Corp. | | | | | | 54,600 | | 2,740,374 |
| | | | | | | | | 15,732,826 |
| |
See accompanying notes which are an integral part of the financial statements.
| | | | | | |
| | | | | 23 | | | | Annual Report |
23
| VIP Contrafund Portfolio | | | | | | |
| Investments - continued | | | | | | |
| |
| | | | | | Shares | | Value (Note 1) |
| | | | | | | | |
| | | | | | | | |
| Water Utilities – 0.0% | | | | | | | | |
| Companhia de Saneamento Basico do Estado de Sao Paulo (SABESP) sponsored ADR | | 130,700 | | 2,204,909 |
| TOTAL UTILITIES | | | | | | | | 50,952,219 |
| |
| TOTAL COMMON STOCKS | | | | | | | | |
| (Cost $10,396,097,286) | | | | | | | | 15,524,893,029 |
| Nonconvertible Preferred Stocks 0.0% | | | | |
| |
| CONSUMER DISCRETIONARY 0.0% | | | | | | |
| Automobiles – 0.0% | | | | | | | | |
| Porsche AG (non vtg.) | | | | | | 5,253 | | 3,774,603 |
| TOTAL NONCONVERTIBLE PREFERRED STOCKS | | | | |
| (Cost $3,884,012) | | | | | | | | 3,774,603 |
| Nonconvertible Bonds 0.0% | | | | | | |
| | | | | | | Principal | | |
| | | | | | | Amount | | |
| INDUSTRIALS – 0.0% | | | | | | | | |
| Machinery – 0.0% | | | | | | | | |
| Rexnord Corp. 10.125% 12/15/12 | | | | $ 1,675,000 | | 1,804,813 |
| TOTAL NONCONVERTIBLE BONDS | | | | | | |
| (Cost $1,800,551) | | | | | | | | 1,804,813 |
| U.S. Treasury Obligations 0.2% | | | | | | |
| |
| U.S. Treasury Notes 4.25% 8/15/14 | | | | | | |
| (Cost $30,067,717) | | | | | | 29,700,000 | | 29,375,141 |
| Floating Rate Loans 0.0% | | | | | | |
| | | | | | | Principal | | Value (Note 1) |
| | | | | | | Amount | | |
| CONSUMER DISCRETIONARY 0.0% | | | | | | |
| Media 0.0% | | | | | | | | |
| Charter Communications Operating LLC Tranche B, term loan 7.5% 4/7/11 (f) | | $ 2,160,840 | | $ 2,166,242 |
| TOTAL FLOATING RATE LOANS | | | | | | |
| (Cost $2,126,750) | | | | | | | | 2,166,242 |
| Money Market Funds 9.7% | | | | | | |
| | | | | | | Shares | | |
| Fidelity Cash Central Fund, 4.28% (b) | | | | 1,447,426,428 | | 1,447,426,428 |
| Fidelity Securities Lending Cash Central Fund, 4.35% (b)(c) | | 202,374,983 | | 202,374,983 |
| |
| TOTAL MONEY MARKET FUNDS | | | | | | |
| (Cost $1,649,801,411) | | | | | | | | 1,649,801,411 |
| TOTAL INVESTMENT | | | | | | | | |
| PORTFOLIO 101.5% | | | | | | | | |
| (Cost $12,083,777,727) | | | | | | | | 17,211,815,239 |
| |
| NET OTHER ASSETS (1.5)% | | | | | | (252,866,807) |
| NET ASSETS 100% | | | | | | | | $ 16,958,948,432 |
See accompanying notes which are an integral part of the financial statements.
| | |
| VIP Contrafund Portfolio | | 24 |
Legend
(a) Non-income producing
(b) Affiliated fund that is available only to investment companies and other accounts managed by Fidelity Investments. The rate quoted is the annualized seven-day
yield of the fund at period end. A complete unaudited listing of the fund’s holdings as of its most recent quarter end is available upon request.
(c) Investment made with cash collateral received from securities on loan.
(d) Security or a portion of the security is on loan at period end.
(e) Security exempt from registration under Rule 144A of the Securities Act of 1933. These securities may be resold in transactions exempt from registration,
normally to qualified institutional buyers. At the period end, the value of these securities amounted to $11,786,200 or 0.1% of net assets.
(f) The coupon rate shown on floating or adjustable rate securities represents the rate at period end.
(g) Restricted securities – Investment in securities not registered under the Securities Act of 1933 (excluding 144A issues). At the end of the period, the value of
restricted securities (excluding 144A issues) amounted to $11,945,294 or 0.1% of net assets.
|
Additional information on each holding is as follows:
| Security | | | | Acquisition Date | | Acquisition Cost |
| MannKind Corp. warrants 8/3/10 | | | | 8/3/05 | | $ 2,168 |
| The Weinstein Co. Holdings, LLC | | | | | | |
| Class A 1 | | | | 10/19/05 | | 11,499,000 |
Affiliated Central Funds
Information regarding income received by the fund from the affiliated Central funds during the period is as follows:
| Fund | | Income received |
| Fidelity Cash Central Fund | | $ 35,535,248 |
| Fidelity Securities Lending Cash Central Fund | | 3,887,662 |
| Total | | $ 39,422,910 |
Other Information
Distribution of investments by country of issue, as a percentage of total net assets, is as follows:
| United States of America | | 73.7% |
| Canada | | 6.0% |
| Bermuda | | 3.8% |
| United Kingdom | | 3.0% |
| Switzerland | | 2.5% |
| Korea (South) | | 1.6% |
| Mexico | | 1.5% |
| Australia | | 1.1% |
| Netherlands Antilles | | 1.1% |
| Japan | | 1.1% |
| Others (individually less than 1%) | | 4.6% |
| | | 100.0% |
See accompanying notes which are an integral part of the financial statements.
25 Annual Report
| VIP Contrafund Portfolio | | | | | | |
| |
| Financial Statements | | | | | | |
| |
| |
| Statement of Assets and Liabilities | | | | | | |
| | | December 31, 2005 |
| |
| Assets | | | | | | |
| Investment in securities, at value (including securities loaned of $196,972,823) — See accompanying schedule: | | | | | | |
| Unaffiliated issuers (cost $10,433,976,316) | | $ 15,562,013,828 | | | | |
| Affiliated Central Funds (cost $1,649,801,411) | | 1,649,801,411 | | | | |
| Total Investments (cost $12,083,777,727) | | | | $ | | 17,211,815,239 |
| Cash | | | | | | 3,239 |
| Receivable for investments sold | | | | | | 19,343,735 |
| Receivable for fund shares sold | | | | | | 12,696,851 |
| Dividends receivable | | | | | | 16,299,473 |
| Interest receivable | | | | | | 5,572,434 |
| Prepaid expenses | | | | | | 70,319 |
| Other affiliated receivables | | | | | | 33,112 |
| Other receivables | | | | | | 1,243,953 |
| Total assets | | | | | | 17,267,078,355 |
| |
| Liabilities | | | | | | |
| Payable to custodian bank | | $ 1,519,243 | | | | |
| Payable for investments purchased | | 81,257,470 | | | | |
| Payable for fund shares redeemed | | 12,520,479 | | | | |
| Accrued management fee | | 8,054,634 | | | | |
| Distribution fees payable | | 877,808 | | | | |
| Other affiliated payables | | 1,216,717 | | | | |
| Other payables and accrued expenses | | 308,589 | | | | |
| Collateral on securities loaned, at value | | 202,374,983 | | | | |
| Total liabilities | | | | | | 308,129,923 |
| |
| Net Assets | | | | $ | | 16,958,948,432 |
| Net Assets consist of: | | | | | | |
| Paid in capital | | | | $ | | 11,607,000,642 |
| Undistributed net investment income | | | | | | 84,552,685 |
| Accumulated undistributed net realized gain (loss) on investments and foreign currency transactions | | | | | | 139,440,793 |
| Net unrealized appreciation (depreciation) on investments and assets and liabilities in foreign currencies | | | | | | 5,127,954,312 |
| Net Assets | | | | $ | | 16,958,948,432 |
| |
| Statement of Assets and Liabilities continued | | | | | | |
| | | December 31, 2005 |
| |
| Initial Class: | | | | | | |
| Net Asset Value, offering price and redemption price per share ($11,099,526,611 ÷ 357,705,074 shares) | | | | $ | | 31.03 |
| Service Class: | | | | | | |
| Net Asset Value, offering price and redemption price per share ($2,503,244,005 ÷ 80,941,419 shares) | | | | $ | | 30.93 |
| Service Class 2: | | | | | | |
| Net Asset Value, offering price and redemption price per share ($3,247,908,596 ÷ 105,831,199 shares) | | | | $ | | 30.69 |
| Service Class 2R: | | | | | | |
| Net Asset Value, offering price and redemption price per share ($19,596,139 ÷ 640,247 shares) | | | | $ | | 30.61 |
| Investor Class: | | | | | | |
| Net Asset Value, offering price and redemption price per share ($88,673,081 ÷ 2,860,028 shares) | | | | $ | | 31.00 |
See accompanying notes which are an integral part of the financial statements.
| | |
| VIP Contrafund Portfolio | | 26 |
| Statement of Operations | | | | | | |
| | | Year ended December 31, 2005 |
| |
| Investment Income | | | | | | |
| Dividends | | | | | | $ 137,245,150 |
| Interest | | | | | | 8,679,081 |
| Income from affiliated Central Funds (including $3,887,662 from security lending) | | | | | | 39,422,910 |
| Total income | | | | | | 185,347,141 |
| |
| Expenses | | | | | | |
| Management fee | | $ 81,763,602 | | |
| Transfer agent fees | | 9,634,988 | | |
| Distribution fees | | 7,839,458 | | |
| Accounting and security lending fees | | 1,621,862 | | |
| Independent trustees’ compensation | | 62,327 | | |
| Appreciation in deferred trustee compensation account | | 15,790 | | |
| Custodian fees and expenses | | 992,465 | | |
| Registration fees | | 27,303 | | |
| Audit | | 118,093 | | |
| Legal | | 77,043 | | |
| Interest | | 3,833 | | |
| Miscellaneous | | 678,204 | | |
| Total expenses before reductions | | 102,834,968 | | |
| Expense reductions | | (3,381,282) | | 99,453,686 |
| |
| Net investment income (loss) | | | | | | 85,893,455 |
| Realized and Unrealized Gain (Loss) | | | | | | |
| Net realized gain (loss) on: | | | | | | |
| Investment securities: | | | | | | |
| Unaffiliated issuers(net of foreign taxes of $7,354) | | 864,204,484 | | |
| Foreign currency transactions | | 28,613 | | |
| Total net realized gain (loss) | | | | | | 864,233,097 |
| Change in net unrealized appreciation (depreciation) on: | | | | | | |
| Investment securities (net of increase in deferred foreign taxes of $65,498) | | 1,358,640,955 | | |
| Assets and liabilities in foreign currencies | | (79,881) | | |
| Total change in net unrealized appreciation (depreciation) | | | | | | 1,358,561,074 |
| Net gain (loss) | | | | | | 2,222,794,171 |
| Net increase (decrease) in net assets resulting from operations | | | | | | $ 2,308,687,626 |
| |
| Statement of Changes in Net Assets | | | | | | |
| | | Year ended | | | | Year ended |
| | | December 31, | | | | December 31, |
| | | 2005 | | | | 2004 |
| Increase (Decrease) in Net Assets | | | | | | |
| Operations | | | | | | |
| Net investment income (loss) | | $ 85,893,455 | | | | $ 34,455,005 |
| Net realized gain (loss) | | 864,233,097 | | | | 556,167,741 |
| Change in net unrealized appreciation (depreciation) | | 1,358,561,074 | | | | 1,079,025,648 |
| Net increase (decrease) in net assets resulting from operations | | 2,308,687,626 | | | | 1,669,648,394 |
| Distributions to shareholders from net investment income | | (34,307,236) | | | | (33,283,266) |
| Distributions to shareholders from net realized gain | | (2,452,648) | | | | — |
| Total distributions | | (36,759,884) | | | | (33,283,266) |
| Share transactions - net increase (decrease) | | 1,801,725,122 | | | | 974,982,321 |
| Redemption fees | | 5,695 | | | | 5,434 |
| Total increase (decrease) in net assets | | 4,073,658,559 | | | | 2,611,352,883 |
| |
| Net Assets | | | | | | |
| Beginning of period | | 12,885,289,873 | | | | 10,273,936,990 |
| End of period (including undistributed net investment income of $84,552,685 and undistributed net investment | | | | | | |
| income of $30,613,930, respectively) | | $ 16,958,948,432 | | $ 12,885,289,873 |
| |
| |
| See accompanying notes which are an integral part of the financial statements. | | | | | | |
27 Annual Report
| Financial Highlights Initial Class | | | | | | | | | | |
| Years ended December 31, | | 2005 | | 2004 | | 2003 | | 2002 | | 2001 |
| Selected Per Share Data | | | | | | | | | | |
| Net asset value, beginning of period | | $ 26.62 | | $ 23.13 | | $ 18.10 | | $ 20.13 | | $ 23.75 |
| Income from Investment Operations | | | | | | | | | | |
| Net investment income (loss)C | | 18 | | .08 | | .07 | | .10 | | .16 |
| Net realized and unrealized gain (loss) | | 4.32 | | 3.49 | | 5.05 | | (1.97) | | (3.01) |
| Total from investment operations | | 4.50 | | 3.57 | | 5.12 | | (1.87) | | (2.85) |
| Distributions from net investment income | | (.08) | | (.08) | | (.09) | | (.16) | | (.17) |
| Distributions from net realized gain | | (.01) | | — | | — | | — | | (.60) |
| Total distributions | | (.09)F | | (.08) | | (.09) | | (.16) | | (.77) |
| Redemption fees added to paid in capitalC,E | | — | | — | | — | | — | | — |
| Net asset value, end of period | | $ 31.03 | | $ 26.62 | | $ 23.13 | | $ 18.10 | | $ 20.13 |
| Total ReturnA,B | | 16.94% | | 15.48% | | 28.46% | | (9.35)% | | (12.28)% |
| Ratios to Average Net AssetsD | | | | | | | | | | |
| Expenses before reductions | | 66% | | .68% | | .67% | | .68% | | .68% |
| Expenses net of fee waivers, if any | | 66% | | .68% | | .67% | | .68% | | .68% |
| Expenses net of all reductions | | 64% | | .66% | | .65% | | .64% | | .64% |
| Net investment income (loss) | | 66% | | .35% | | .34% | | .50% | | .77% |
| Supplemental Data | | | | | | | | | | |
| Net assets, end of period (000 omitted) | | $11,099,527 | | $9,127,616 | | $7,665,424 | | $5,956,028 | | $6,972,615 |
| Portfolio turnover rate | | 60% | | 64% | | 66% | | 84% | | 140% |
A Total returns do not reflect charges attributable to your insurance company’s separate account. Inclusion of these charges would reduce the total returns shown.
B Total returns would have been lower had certain expenses not been reduced during the periods shown.
C Calculated based on average shares outstanding during the period.
D Expense ratios reflect operating expenses of the class. Expenses before reductions do not reflect amounts reimbursed by the investment adviser or reductions from brokerage service arrangements or other expense offset arrangements and do not
represent the amount paid by the class during periods when reimbursements or reductions occur. Expenses net of fee waivers reflect expenses after reimbursement by the investment adviser but prior to reductions from brokerage service arrange
ments or other expense offset arrangements. Expenses net of all reductions represent the net expenses paid by the class.
E Amount represents less than $.01 per share.
F Total distribution of $.09 per share is comprised of distributions from net investment income of $.080 and distributions from net realized gain of $.005 per share.
|
| Financial Highlights Service Class | | | | | | | | | | |
| Years ended December 31, | | 2005 | | 2004 | | 2003 | | 2002 | | 2001 |
| Selected Per Share Data | | | | | | | | | | |
| Net asset value, beginning of period | | $ 26.53 | | $ 23.06 | | $ 18.04 | | $ 20.06 | | $ 23.67 |
| Income from Investment Operations | | | | | | | | | | |
| Net investment income (loss)C | | 16 | | .06 | | .05 | | .08 | | .14 |
| Net realized and unrealized gain (loss) | | 4.30 | | 3.47 | | 5.04 | | (1.96) | | (3.00) |
| Total from investment operations | | 4.46 | | 3.53 | | 5.09 | | (1.88) | | (2.86) |
| Distributions from net investment income | | (.06) | | (.06) | | (.07) | | (.14) | | (.15) |
| Distributions from net realized gain | | (.01) | | — | | — | | — | | (.60) |
| Total distributions | | (.06)F | | (.06) | | (.07) | | (.14) | | (.75) |
| Redemption fees added to paid in capitalC,E | | — | | — | | — | | — | | — |
| Net asset value, end of period | | $ 30.93 | | $ 26.53 | | $ 23.06 | | $ 18.04 | | $ 20.06 |
| Total ReturnA,B | | 16.85% | | 15.34% | | 28.35% | | (9.42)% | | (12.36)% |
| Ratios to Average Net AssetsD | | | | | | | | | | |
| Expenses before reductions | | 76% | | .78% | | .77% | | .78% | | .78% |
| Expenses net of fee waivers, if any | | 76% | | .78% | | .77% | | .78% | | .78% |
| Expenses net of all reductions | | 74% | | .76% | | .75% | | .74% | | .74% |
| Net investment income (loss) | | 56% | | .25% | | .24% | | .39% | | .67% |
| Supplemental Data | | | | | | | | | | |
| Net assets, end of period (000 omitted) | | $2,503,244 | | $2,111,969 | | $1,695,467 | | $1,183,683 | | $1,201,105 |
| Portfolio turnover rate | | 60% | | 64% | | 66% | | 84% | | 140% |
A Total returns do not reflect charges attributable to your insurance company’s separate account. Inclusion of these charges would reduce the total returns shown.
B Total returns would have been lower had certain expenses not been reduced during the periods shown.
C Calculated based on average shares outstanding during the period.
D Expense ratios reflect operating expenses of the class. Expenses before reductions do not reflect amounts reimbursed by the investment adviser or reductions from brokerage service arrangements or other expense offset arrangements and do not
represent the amount paid by the class during periods when reimbursements or reductions occur. Expenses net of fee waivers reflect expenses after reimbursement by the investment adviser but prior to reductions from brokerage service arrange
ments or other expense offset arrangements. Expenses net of all reductions represent the net expenses paid by the class.
E Amount represents less than $.01 per share.
F Total distribution of $.06 per share is comprised of distributions from net investment income of $.055 and distributions from net realized gain of $.005 per share.
|
See accompanying notes which are an integral part of the financial statements.
| | |
| VIP Contrafund Portfolio | | 28 |
| Financial Highlights Service Class 2 | | | | | | | | | | |
| Years ended December 31, | | 2005 | | 2004 | | 2003 | | 2002 | | 2001 |
| Selected Per Share Data | | | | | | | | | | |
| Net asset value, beginning of period | | $ 26.35 | | $ 22.93 | | $ 17.95 | | $ 20.00 | | $ 23.64 |
| Income from Investment Operations | | | | | | | | | | |
| Net investment income (loss)C | | 11 | | .02 | | .02 | | .05 | | .10 |
| Net realized and unrealized gain (loss) | | 4.27 | | 3.45 | | 5.02 | | (1.96) | | (2.98) |
| Total from investment operations | | 4.38 | | 3.47 | | 5.04 | | (1.91) | | (2.88) |
| Distributions from net investment income | | (.04) | | (.05) | | (.06) | | (.14) | | (.16) |
| Distributions from net realized gain | | (.01) | | — | | — | | — | | (.60) |
| Total distributions | | (.04)F | | (.05) | | (.06) | | (.14) | | (.76) |
| Redemption fees added to paid in capitalC,E | | — | | — | | — | | — | | — |
| Net asset value, end of period | | $ 30.69 | | $ 26.35 | | $ 22.93 | | $ 17.95 | | $ 20.00 |
| Total ReturnA,B | | 16.65% | | 15.16% | | 28.20% | | (9.60)% | | (12.47)% |
| Ratios to Average Net AssetsD | | | | | | | | | | |
| Expenses before reductions | | 91% | | .93% | | .93% | | .93% | | .94% |
| Expenses net of fee waivers, if any | | 91% | | .93% | | .93% | | .93% | | .94% |
| Expenses net of all reductions | | 89% | | .91% | | .90% | | .90% | | .90% |
| Net investment income (loss) | | 40% | | .10% | | .09% | | .24% | | .52% |
| Supplemental Data | | | | | | | | | | |
| Net assets, end of period (000 omitted) | | $3,247,909 | | $1,638,617 | | $ 910,341 | | $ 439,157 | | $ 231,686 |
| Portfolio turnover rate | | 60% | | 64% | | 66% | | 84% | | 140% |
A Total returns do not reflect charges attributable to your insurance company’s separate account. Inclusion of these charges would reduce the total returns shown.
B Total returns would have been lower had certain expenses not been reduced during the periods shown.
C Calculated based on average shares outstanding during the period.
D Expense ratios reflect operating expenses of the class. Expenses before reductions do not reflect amounts reimbursed by the investment adviser or reductions from brokerage service arrangements or other expense offset arrangements and do not
represent the amount paid by the class during periods when reimbursements or reductions occur. Expenses net of fee waivers reflect expenses after reimbursement by the investment adviser but prior to reductions from brokerage service arrange
ments or other expense offset arrangements. Expenses net of all reductions represent the net expenses paid by the class.
E Amount represents less than $.01 per share.
F Total distribution of $.04 per share is comprised of distributions from net investment income of $.035 and distributions from net realized gain of $.005 per share.
|
| Financial Highlights Service Class 2R | | | | | | | | |
| Years ended December 31, | | 2005 | | 2004 | | 2003 | | 2002F |
| Selected Per Share Data | | | | | | | | |
| Net asset value, beginning of period | | $ 26.29 | | $ 22.90 | | $ 17.95 | | $ 20.49 |
| Income from Investment Operations | | | | | | | | |
| Net investment income (loss)E | | 11 | | .02 | | .02 | | .03 |
| Net realized and unrealized gain (loss) | | 4.27 | | 3.44 | | 5.01 | | (2.57) |
| Total from investment operations | | 4.38 | | 3.46 | | 5.03 | | (2.54) |
| Distributions from net investment income | | (.05) | | (.07) | | (.08) | | — |
| Distributions from net realized gain | | (.01) | | — | | — | | — |
| Total distributions | | (.06)I | | (.07) | | (.08) | | — |
| Redemption fees added to paid in capitalE,H | | — | | — | | — | | — |
| Net asset value, end of period | | $ 30.61 | | $ 26.29 | | $ 22.90 | | $ 17.95 |
| Total ReturnB,C,D | | 16.67% | | 15.15% | | 28.18% | | (12.40)% |
| Ratios to Average Net AssetsG | | | | | | | | |
| Expenses before reductions | | 91% | | .93% | | .93% | | .96%A |
| Expenses net of fee waivers, if any | | 91% | | .93% | | .93% | | .96%A |
| Expenses net of all reductions | | 89% | | .91% | | .90% | | .92%A |
| Net investment income (loss) | | 39% | | .10% | | .08% | | .23%A |
| Supplemental Data | | | | | | | | |
| Net assets, end of period (000 omitted) | | $ 19,596 | | $ 7,088 | | $ 2,705 | | $ 810 |
| Portfolio turnover rate | | 60% | | 64% | | 66% | | 84% |
A Annualized
B Total returns for periods of less than one year are not annualized.
C Total returns do not reflect charges attributable to your insurance company’s separate account. Inclusion of these charges would reduce the total returns shown.
D Total returns would have been lower had certain expenses not been reduced during the periods shown.
E Calculated based on average shares outstanding during the period.
F For the period April 24, 2002 (commencement of sale of shares) to December 31, 2002.
G Expense ratios reflect operating expenses of the class. Expenses before reductions do not reflect amounts reimbursed by the investment adviser or reductions from brokerage service arrangements or other expense offset arrangements and do not
represent the amount paid by the class during periods when reimbursements or reductions occur. Expense ratios before reductions for start up periods may not be representative of longer term operating periods. Expenses net of fee waivers reflect
expenses after reimbursement by the investment adviser but prior to reductions from brokerage service arrangements or other expense offset arrangements. Expenses net of all reductions represent the net expenses paid by the class.
H Amount represents less than $.01 per share.
I Total distribution of $.06 per share is comprised of distributions from net investment income of $.050 and distributions from net realized gain of $.005 per share.
|
See accompanying notes which are an integral part of the financial statements.
|
29 Annual Report
| Financial Highlights Investor Class | | |
| Year ended December 31, | | 2005F |
| Selected Per Share Data | | |
| Net asset value, beginning of period | | $ 28.34 |
| Income from Investment Operations | | |
| Net investment income (loss)E | | 06 |
| Net realized and unrealized gain (loss) | | 2.60 |
| Total from investment operations | | 2.66 |
| Redemption fees added to paid in capitalE | | —H |
| Net asset value, end of period | | $ 31.00 |
| Total ReturnB,C,D | | 9.39% |
| Ratios to Average Net AssetsG | | |
| Expenses before reductions | | 83%A |
| Expenses net of fee waivers, if any | | 83%A |
| Expenses net of all reductions | | 81%A |
| Net investment income (loss) | | 43%A |
| Supplemental Data | | |
| Net assets, end of period (000 omitted) | | $ 88,673 |
| Portfolio turnover rate | | 60% |
A Annualized
B Total returns for periods of less than one year are not annualized.
C Total returns do not reflect charges attributable to your insurance company’s separate account. Inclusion of these charges would reduce the total returns shown.
D Total returns would have been lower had certain expenses not been reduced during the periods shown.
E Calculated based on average shares outstanding during the period.
F For the period July 21, 2005 (commencement of sale of shares) to December 31, 2005.
G Expense ratios reflect operating expenses of the class. Expenses before reductions do not reflect amounts reimbursed by the investment adviser or reductions from brokerage service arrangements or other expense offset arrangements and do not
represent the amount paid by the class during periods when reimbursements or reductions occur. Expense ratios before reductions for start up periods may not be representative of longer term operating periods. Expenses net of fee waivers reflect
expenses after reimbursement by the investment adviser but prior to reductions from brokerage service arrangements or other expense offset arrangements. Expenses net of all reductions represent the net expenses paid by the class.
H Amount represents less than $.01 per share.
|
See accompanying notes which are an integral part of the financial statements.
| | |
| VIP Contrafund Portfolio | | 30 |
VIP Equity-Income Portfolio
Performance: The Bottom Line
|
Average annual total return reflects the change in the value of an investment, assuming reinvestment of a class’ dividend income and capital gains (the profits earned upon the sale of securities that have grown in value) and assuming a constant rate of performance each year. During periods of reim bursement by Fidelity, a fund’s total return will be greater than it would be had the reimbursement not occurred. Performance numbers are net of all underlying fund operating expenses, but do not include any insurance charges imposed by your insurance company’s separate account. If performance information included the effect of these additional charges, the total returns would have been lower. How a fund did yesterday is no guarantee of how it will do tomorrow.
| Average Annual Total Returns | | | | | | |
| Periods ended December 31, 2005 | | Past 1 | | Past 5 | | Past 10 |
| | | | | year | | years | | years |
| VIP Equity Income Initial Class | | 5.87% | | 3.97% | | 8.63% |
| VIP Equity Income Service ClassA | | 5.76% | | 3.86% | | 8.54% |
| VIP Equity Income Service Class 2B | | 5.57% | | 3.69% | | 8.44% |
| VIP Equity Income Investor ClassC | | 5.82% | | 3.96% | | 8.63% |
A The initial offering of Service Class shares took place on November 3, 1997. Performance for Service Class shares reflects an asset based distribution fee (12b 1 fee), and
returns prior to November 3, 1997 are those of Initial Class and do not include the effects of Service Class’ 12b 1 fee. Had Service Class’ 12b 1 fee been reflected, returns prior
to November 3, 1997 would have been lower.
B The initial offering of Service Class 2 shares took place on January 12, 2000. Performance for Service Class 2 shares reflects an asset based distribution fee (12b 1 fee). Re
turns from November 3, 1997 to January 12, 2000 are those of Service Class which reflect a different 12b 1 fee. Service Class 2 returns prior to November 3, 1997 are those of Initial
Class, and do not include the effects of a 12b 1 fee. Had Service Class 2 shares’ 12b 1 fee been reflected, returns prior to January 12, 2000 would have been lower.
C The initial offering of Investor Class shares took place on July 21, 2005. Returns prior to July 21, 2005 are those of Initial Class. If Investor Class’s transfer agent fee
had been reflected, returns prior to July 21, 2005 would have been lower.
|
$10,000 Over 10 Years
Let’s say hypothetically that $10,000 was invested in VIP Equity Income Portfolio Initial Class on December 31, 1995. The chart shows how the value of your investment would have changed, and also shows how the Russell 3000® Value Index performed over the same period.

31 Annual Report
VIP Equity-Income Portfolio
Management’s Discussion of Fund Performance
|
Comments from Stephen Petersen, Portfolio Manager of VIP Equity Income Portfolio
U.S. equity benchmarks generally had positive results for the 12 months ending December 31, 2005, the third consecutive year that stocks finished in the black. Energy and utilities were the two best performing sectors, contributing greatly to the 4.91% gain of the Standard & Poor’s 500SM Index. Elsewhere, the NASDAQ Composite® Index returned 2.13%, while the Dow Jones Industrial AverageSM rose 1.72% . The U.S. economy did not decelerate as much as many had predicted, despite eight short term interest rate hikes, record high energy prices and the devastation caused by Hurricane Katrina. Meanwhile, corporate America notched its 14th consecutive quarter of double digit earnings gains through the third quarter of the year, an unprecedented streak in market history. From a style perspective, large cap stocks ended the six year reign of small caps by a narrow margin, but mid caps finished well ahead of both categories. The gap between growth and value stocks also was relatively narrow, with value gaining a slight edge.
For the 12 months ending December 31, 2005, the fund modestly trailed the Russell 3000® Value Index and was in line with the LipperSM Variable Annuity Equity Income Objective Funds Average, which returned 6.85% and 5.74%, respectively. (For specific portfolio performance results, please refer to the performance section of this report.) Early in the year, the fund lagged the index in an environment where taking larger positions in fewer sectors and in smaller companies would have helped short term performance. A slight underweighting and disappointing stock selection in the leading energy sector hurt the most for the 12 months overall. We also had a weak showing in financials despite favorable positioning on an industry basis. On the plus side, my choices within information technology provided a boost, as did some good picks in consumer discretionary and pockets of health care. Contributors included French energy holding Total SA and energy services company Schlumberger. Underweighting lagging pharmaceutical company Pfizer a component of the index also helped relative performance. Conversely, the fund’s overweighting in mortgage giant Fannie Mae detracted, as it continued to suffer from an ongoing investigation into its accounting practices and concerns that its business fundamentals were slowing. Investors were disappointed by Tyco International’s pace of recovery during the period, and the fund’s relatively sizable out of benchmark position in the indus trial conglomerate amplified its drag on performance. Wal Mart, whose revenue growth continued to disappoint investors, also held back returns.
The views expressed in this statement reflect those of the portfolio manager only through the end of the period of the report as stated on the cover and do not necessarily represent the views of Fidelity or any other person in the Fidelity organization. Any such views are subject to change at any time based upon market or other conditions and Fidelity disclaims any responsibility to update such views. These views may not be relied on as invest ment advice and, because investment decisions for a Fidelity fund are based on numerous factors, may not be relied on as an indication of trading intent on behalf of any Fidelity fund.
VIP Equity Income Portfolio 32
| VIP Equity-Income Portfolio | | | | |
| Investment Changes | | |
| |
| |
| Top Ten Stocks as of December 31, 2005 |
| | | % of fund’s | | % of fund’s net assets |
| | | net assets | | 6 months ago |
| Exxon Mobil Corp. | | 3.1 | | 3.4 |
| Bank of America Corp. | | 3.0 | | 3.2 |
| Citigroup, Inc. | | 2.7 | | 2.5 |
| American International Group, | | | | |
| Inc. | | 2.7 | | 2.5 |
| JPMorgan Chase & Co. | | 2.3 | | 2.2 |
| Total SA sponsored ADR | | 2.1 | | 2.1 |
| AT&T, Inc. | | 1.7 | | 0.0 |
| Wachovia Corp. | | 1.5 | | 1.4 |
| General Electric Co. | | 1.5 | | 1.5 |
| Schlumberger Ltd. (NY Shares) | | 1.3 | | 1.2 |
| | | 21.9 | | |
Top Five Market Sectors as of December 31, 2005 |
| | | % of fund’s | | % of fund’s net assets |
| | | net assets | | 6 months ago |
| Financials | | 28.9 | | 28.4 |
| Consumer Discretionary | | 11.9 | | 12.3 |
| Energy | | 11.8 | | 11.6 |
| Industrials | | 11.0 | | 11.1 |
| Information Technology | | 9.0 | | 8.4 |
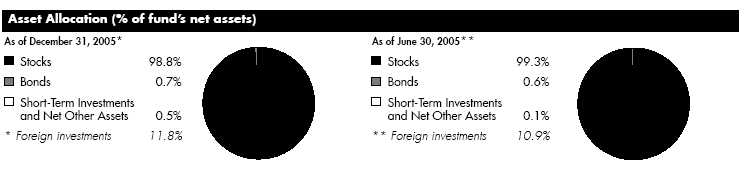
33 Annual Report
| VIP Equity-Income Portfolio | | | | | | | | |
| Investments December 31, 2005 | | | | |
| Showing Percentage of Net Assets | | | | | | | | |
| |
| Common Stocks 98.0% | | | | | | | | |
| | | | | | | Shares | | Value (Note 1) |
| |
| CONSUMER DISCRETIONARY 11.3% | | | | | | | | |
| Auto Components – 0.3% | | | | | | | | |
| American Axle & Manufacturing Holdings, Inc. | | | | | | 274,500 | | $ 5,031,585 |
| Johnson Controls, Inc. | | | | | | 291,600 | | 21,260,556 |
| TRW Automotive Holdings Corp. (a) | | | | | | 219,300 | | 5,778,555 |
| | | | | | | | | 32,070,696 |
| Automobiles – 0.9% | | | | | | | | |
| Ford Motor Co. | | | | | | 747,100 | | 5,767,612 |
| General Motors Corp. (d) | | | | | | 413,400 | | 8,028,228 |
| Harley Davidson, Inc. | | | | | | 249,400 | | 12,841,606 |
| Monaco Coach Corp. | | | | | | 188,200 | | 2,503,060 |
| Renault SA | | | | | | 229,101 | | 18,687,142 |
| Toyota Motor Corp. sponsored ADR | | | | | | 443,400 | | 46,388,508 |
| | | | | | | | | 94,216,156 |
| Diversified Consumer Services 0.1% | | | | | | | | |
| Service Corp. International (SCI) | | | | | | 1,347,700 | | 11,024,186 |
| Hotels, Restaurants & Leisure 0.4% | | | | | | | | |
| McDonald’s Corp. | | | | | | 1,009,800 | | 34,050,456 |
| Outback Steakhouse, Inc. | | | | | | 124,400 | | 5,176,284 |
| | | | | | | | | 39,226,740 |
| Household Durables 1.3% | | | | | | | | |
| Koninklijke Philips Electronics NV (NY Shares) | | | | | | 601,900 | | 18,719,090 |
| Maytag Corp. | | | | | | 1,549,620 | | 29,163,848 |
| Newell Rubbermaid, Inc. | | | | | | 2,583,200 | | 61,428,496 |
| Whirlpool Corp. | | | | | | 373,000 | | 31,242,480 |
| | | | | | | | | 140,553,914 |
| Leisure Equipment & Products 0.3% | | | | | | | | |
| Eastman Kodak Co. | | | | | | 1,489,000 | | 34,842,600 |
| Media 5.6% | | | | | | | | |
| CCE Spinco, Inc. (a) | | | | | | 372,625 | | 4,881,388 |
| Clear Channel Communications, Inc. | | | | | | 2,981,000 | | 93,752,450 |
| Comcast Corp. Class A (a)(d) | | | | | | 2,510,491 | | 65,172,346 |
| Discovery Holding Co. Class A (a) | | | | | | 368,167 | | 5,577,730 |
| Knight Ridder, Inc. | | | | | | 300,100 | | 18,996,330 |
| Lagardere S.C.A. (Reg.) | | | | | | 187,342 | | 14,416,014 |
| Liberty Media Corp. Class A (a) | | | | | | 3,681,676 | | 28,974,790 |
| News Corp. Class A | | | | | | 1,178,916 | | 18,332,144 |
| NTL, Inc. (a) | | | | | | 334,555 | | 22,776,504 |
| The New York Times Co. Class A | | | | | | 915,025 | | 24,202,411 |
| The Reader’s Digest Association, Inc. (non vtg.) | | | | | | 1,617,703 | | 24,621,440 |
| Time Warner, Inc. | | | | | | 6,064,450 | | 105,764,008 |
| Viacom, Inc. Class B (non vtg.) | | | | | | 3,071,886 | | 100,143,484 |
| Vivendi Universal SA sponsored ADR | | | | | | 725,400 | | 22,799,322 |
| Walt Disney Co. | | | | | | 2,379,300 | | 57,031,821 |
| | | | | | | | | 607,442,182 |
| Multiline Retail – 1.2% | | | | | | | | |
| Big Lots, Inc. (a) | | | | | | 2,348,156 | | 28,201,357 |
| Dollar Tree Stores, Inc. (a) | | | | | | 1,349,400 | | 32,304,636 |
See accompanying notes which are an integral part of the financial statements.
| | |
| VIP Equity Income Portfolio | | 34 |
| | | | | | | Shares | | Value (Note 1) |
| Family Dollar Stores, Inc. | | | | | | 1,072,100 | | $ 26,577,359 |
| Federated Department Stores, Inc. | | | | | | 559,300 | | 37,098,369 |
| Sears Holdings Corp. (a) | | | | | | 67,387 | | 7,785,220 |
| | | | | | | | | 131,966,941 |
| Specialty Retail 1.0% | | | | | | | | |
| AnnTaylor Stores Corp. (a) | | | | | | 1,113,050 | | 38,422,486 |
| Gap, Inc. | | | | | | 1,503,478 | | 26,521,352 |
| RadioShack Corp. | | | | | | 1,366,100 | | 28,729,083 |
| Tiffany & Co., Inc. | | | | | | 289,600 | | 11,088,784 |
| | | | | | | | | 104,761,705 |
| Textiles, Apparel & Luxury Goods 0.2% | | | | | | |
| Liz Claiborne, Inc. | | | | | | 490,240 | | 17,560,397 |
| |
| TOTAL CONSUMER DISCRETIONARY | | | | | | 1,213,665,517 |
| |
| CONSUMER STAPLES 5.7% | | | | | | | | |
| Beverages 0.9% | | | | | | | | |
| Anheuser Busch Companies, Inc. | | | | | | 1,295,000 | | 55,633,200 |
| Molson Coors Brewing Co. Class B | | | | | | 165,800 | | 11,106,942 |
| The Coca Cola Co. | | | | | | 672,200 | | 27,096,382 |
| | | | | | | | | 93,836,524 |
| Food & Staples Retailing – 1.4% | | | | | | | | |
| CVS Corp. | | | | | | 620,600 | | 16,396,252 |
| Safeway, Inc. | | | | | | 376,800 | | 8,915,088 |
| Wal Mart Stores, Inc. | | | | | | 2,664,800 | | 124,712,640 |
| | | | | | | | | 150,023,980 |
| Food Products – 0.4% | | | | | | | | |
| ConAgra Foods, Inc. | | | | | | 139,100 | | 2,820,948 |
| Corn Products International, Inc. | | | | | | 620,700 | | 14,828,523 |
| Kraft Foods, Inc. Class A | | | | | | 868,400 | | 24,436,776 |
| | | | | | | | | 42,086,247 |
| Household Products – 1.7% | | | | | | | | |
| Colgate Palmolive Co. | | | | | | 2,120,000 | | 116,282,000 |
| Kimberly Clark Corp. | | | | | | 788,000 | | 47,004,200 |
| Procter & Gamble Co. | | | | | | 284,042 | | 16,440,351 |
| | | | | | | | | 179,726,551 |
| Personal Products 0.4% | | | | | | | | |
| Avon Products, Inc. | | | | | | 1,440,300 | | 41,120,565 |
| Tobacco – 0.9% | | | | | | | | |
| Altria Group, Inc. | | | | | | 1,389,400 | | 103,815,968 |
| |
| TOTAL CONSUMER STAPLES | | | | | | | | 610,609,835 |
| |
| ENERGY 11.8% | | | | | | | | |
| Energy Equipment & Services – 3.1% | | | | | | |
| Baker Hughes, Inc. | | | | | | 1,198,500 | | 72,844,830 |
| BJ Services Co. | | | | | | 926,490 | | 33,974,388 |
| Halliburton Co. | | | | | | 662,600 | | 41,054,696 |
| Noble Corp. | | | | | | 693,200 | | 48,898,328 |
| Schlumberger Ltd. (NY Shares) | | | | | | 1,395,710 | | 135,593,227 |
| | | | | | | | | 332,365,469 |
| |
| |
See accompanying notes which are an integral part of the financial statements.
| | | | | | |
| | | | | 35 | | | | Annual Report |
35
| VIP Equity-Income Portfolio | | | | |
| Investments - continued | | | | |
| |
| |
| Common Stocks continued | | | | |
| | | Shares | | Value (Note 1) |
| |
| ENERGY – continued | | | | |
| Oil, Gas & Consumable Fuels 8.7% | | | | |
| Apache Corp. | | 601,580 | | $ 41,220,262 |
| BP PLC sponsored ADR | | 2,110,842 | | 135,558,273 |
| Chevron Corp. | | 2,095,142 | | 118,941,211 |
| ConocoPhillips | | 544,200 | | 31,661,556 |
| Double Hull Tankers, Inc. | | 409,300 | | 5,390,481 |
| El Paso Corp. | | 944,400 | | 11,483,904 |
| EOG Resources, Inc. | | 165,400 | | 12,135,398 |
| Exxon Mobil Corp. | | 5,974,036 | | 335,561,602 |
| Kerr McGee Corp. | | 145,000 | | 13,174,700 |
| Total SA: | | | | |
| Series B | | 186,100 | | 47,046,081 |
| sponsored ADR | | 1,433,996 | | 181,257,094 |
| | | | | 933,430,562 |
| |
| TOTAL ENERGY | | | | 1,265,796,031 |
| |
| FINANCIALS 28.6% | | | | |
| Capital Markets 4.7% | | | | |
| Ameriprise Financial, Inc. | | 620,002 | | 25,420,082 |
| Bank of New York Co., Inc. | | 2,948,900 | | 93,922,465 |
| Charles Schwab Corp. | | 1,213,520 | | 17,802,338 |
| Janus Capital Group, Inc. | | 1,779,900 | | 33,159,537 |
| Mellon Financial Corp. | | 1,567,600 | | 53,690,300 |
| Merrill Lynch & Co., Inc. | | 1,538,900 | | 104,229,697 |
| Morgan Stanley | | 1,992,500 | | 113,054,450 |
| Nomura Holdings, Inc. | | 1,706,400 | | 32,797,010 |
| State Street Corp. | | 464,456 | | 25,749,441 |
| | | | | 499,825,320 |
| Commercial Banks – 7.1% | | | | |
| Bank of America Corp. | | 6,959,766 | | 321,193,201 |
| Comerica, Inc. | | 581,900 | | 33,028,644 |
| FirstRand Ltd. | | 1,051,600 | | 3,066,301 |
| Kookmin Bank sponsored ADR (d) | | 397,000 | | 29,659,870 |
| Lloyds TSB Group PLC | | 2,118,800 | | 17,818,624 |
| Royal Bank of Scotland Group PLC | | 592,888 | | 17,913,045 |
| State Bank of India | | 312,882 | | 6,864,420 |
| U.S. Bancorp, Delaware | | 1,523,938 | | 45,550,507 |
| Wachovia Corp. | | 3,061,861 | | 161,849,972 |
| Wells Fargo & Co. | | 1,916,300 | | 120,401,129 |
| | | | | 757,345,713 |
| Consumer Finance – 0.9% | | | | |
| American Express Co. | | 1,230,296 | | 63,311,032 |
| MBNA Corp. | | 1,235,200 | | 33,535,680 |
| | | | | 96,846,712 |
| Diversified Financial Services – 5.2% | | | | |
| CIT Group, Inc. | | 496,600 | | 25,713,948 |
| Citigroup, Inc. | | 5,988,619 | | 290,627,680 |
| JPMorgan Chase & Co. | | 6,063,812 | | 240,672,698 |
| | | | | 557,014,326 |
See accompanying notes which are an integral part of the financial statements.
| | |
| VIP Equity Income Portfolio | | 36 |
| | | | | Shares | | Value (Note 1) |
| Insurance – 7.9% | | | | | | |
| ACE Ltd. | | | | 2,267,115 | | $ 121,154,626 |
| Allianz AG sponsored ADR | | | | 1,115,700 | | 16,891,698 |
| Allstate Corp. | | | | 1,444,700 | | 78,114,929 |
| American International Group, Inc. | | | | 4,163,050 | | 284,044,902 |
| Genworth Financial, Inc. Class A (non vtg.) | | 1,375,200 | | 47,554,416 |
| Hartford Financial Services Group, Inc. | | 980,000 | | 84,172,200 |
| MetLife, Inc. unit | | | | 835,300 | | 23,012,515 |
| Montpelier Re Holdings Ltd. | | | | 350,800 | | 6,630,120 |
| PartnerRe Ltd. | | | | 486,620 | | 31,956,335 |
| Swiss Reinsurance Co. (Reg.) | | | | 318,741 | | 23,335,528 |
| The St. Paul Travelers Companies, Inc. | | 2,278,026 | | 101,759,421 |
| XL Capital Ltd. Class A | | | | 379,420 | | 25,565,320 |
| | | | | | | 844,192,010 |
| Real Estate 0.4% | | | | | | |
| CarrAmerica Realty Corp. | | | | 145,540 | | 5,040,050 |
| Developers Diversified Realty Corp. | | | | 67,400 | | 3,169,148 |
| Equity Office Properties Trust | | | | 557,200 | | 16,899,876 |
| Equity Residential (SBI) | | | | 558,400 | | 21,844,608 |
| | | | | | | 46,953,682 |
| Thrifts & Mortgage Finance – 2.4% | | | | | | |
| Fannie Mae | | | | 2,706,000 | | 132,079,860 |
| Freddie Mac | | | | 851,900 | | 55,671,665 |
| Golden West Financial Corp., Delaware | | 248,700 | | 16,414,200 |
| Housing Development Finance Corp. Ltd. | | 913,295 | | 24,499,324 |
| Sovereign Bancorp, Inc. | | | | 1,420,750 | | 30,716,615 |
| | | | | | | 259,381,664 |
| |
| TOTAL FINANCIALS | | | | | | 3,061,559,427 |
| |
| HEALTH CARE 6.8% | | | | | | |
| Health Care Equipment & Supplies 0.9% | | | | |
| Baxter International, Inc. | | | | 2,444,400 | | 92,031,660 |
| Boston Scientific Corp. (a) | | | | 248,100 | | 6,075,969 |
| | | | | | | 98,107,629 |
| Health Care Providers & Services 0.4% | | | | |
| Cardinal Health, Inc. | | | | 447,000 | | 30,731,250 |
| Tenet Healthcare Corp. (a) | | | | 1,219,900 | | 9,344,434 |
| | | | | | | 40,075,684 |
| Pharmaceuticals 5.5% | | | | | | |
| Abbott Laboratories | | | | 743,200 | | 29,304,376 |
| Bristol Myers Squibb Co. | | | | 2,323,800 | | 53,400,924 |
| Eli Lilly & Co. | | | | 289,500 | | 16,382,805 |
| GlaxoSmithKline PLC sponsored ADR | | 405,100 | | 20,449,448 |
| Johnson & Johnson | | | | 1,852,700 | | 111,347,270 |
| Merck & Co., Inc. | | | | 1,898,400 | | 60,388,104 |
| Novartis AG sponsored ADR | | | | 497,000 | | 26,082,560 |
| Pfizer, Inc. | | | | 4,618,200 | | 107,696,424 |
See accompanying notes which are an integral part of the financial statements.
|
37 Annual Report
37
| VIP Equity-Income Portfolio | | | | |
| Investments - continued | | | | |
| |
| |
| Common Stocks continued | | | | |
| | | Shares | | Value (Note 1) |
| |
| HEALTH CARE continued | | | | |
| Pharmaceuticals – continued | | | | |
| Schering Plough Corp. | | 3,480,630 | | $ 72,571,136 |
| Wyeth | | 2,065,100 | | 95,139,157 |
| | | | | 592,762,204 |
| |
| TOTAL HEALTH CARE | | | | 730,945,517 |
| |
| INDUSTRIALS – 10.9% | | | | |
| Aerospace & Defense – 3.0% | | | | |
| EADS NV | | 1,325,515 | | 50,057,829 |
| Honeywell International, Inc. | | 2,694,425 | | 100,367,331 |
| Lockheed Martin Corp. | | 1,191,300 | | 75,802,419 |
| The Boeing Co. | | 505,700 | | 35,520,368 |
| United Technologies Corp. | | 1,032,040 | | 57,701,356 |
| | | | | 319,449,303 |
| Building Products – 0.1% | | | | |
| Masco Corp. | | 378,600 | | 11,429,934 |
| Commercial Services & Supplies 0.6% | | | | |
| Cendant Corp. | | 1,635,800 | | 28,217,550 |
| Waste Management, Inc. | | 1,207,400 | | 36,644,590 |
| | | | | 64,862,140 |
| Electrical Equipment 0.3% | | | | |
| Emerson Electric Co. | | 513,400 | | 38,350,980 |
| Industrial Conglomerates 3.2% | | | | |
| 3M Co. | | 507,300 | | 39,315,750 |
| General Electric Co. | | 4,617,590 | | 161,846,530 |
| Textron, Inc. | | 334,800 | | 25,772,904 |
| Tyco International Ltd. | | 4,072,646 | | 117,536,564 |
| | | | | 344,471,748 |
| Machinery – 2.7% | | | | |
| Briggs & Stratton Corp. | | 123,700 | | 4,798,323 |
| Caterpillar, Inc. | | 760,700 | | 43,945,639 |
| Deere & Co. | | 238,200 | | 16,223,802 |
| Dover Corp. | | 1,295,300 | | 52,446,697 |
| Eaton Corp. | | 165,700 | | 11,116,813 |
| Illinois Tool Works, Inc. | | 151,900 | | 13,365,681 |
| Ingersoll Rand Co. Ltd. Class A | | 1,505,888 | | 60,792,699 |
| Navistar International Corp. (a) | | 508,495 | | 14,553,127 |
| SPX Corp. | | 1,483,200 | | 67,886,064 |
| | | | | 285,128,845 |
| Road & Rail 1.0% | | | | |
| Burlington Northern Santa Fe Corp. | | 1,035,400 | | 73,327,028 |
| Laidlaw International, Inc. | | 268,000 | | 6,225,640 |
| Union Pacific Corp. | | 354,600 | | 28,548,846 |
| | | | | 108,101,514 |
| |
| TOTAL INDUSTRIALS | | | | 1,171,794,464 |
See accompanying notes which are an integral part of the financial statements.
| | |
| VIP Equity Income Portfolio | | 38 |
| | | | | Shares | | Value (Note 1) |
| |
| INFORMATION TECHNOLOGY 8.9% | | | | | | |
| Communications Equipment – 1.2% | | | | | | |
| Avaya, Inc. (a) | | | | 1,133,900 | | $ 12,098,713 |
| Cisco Systems, Inc. (a) | | | | 2,003,500 | | 34,299,920 |
| Lucent Technologies, Inc. (a) | | | | 4,816,600 | | 12,812,156 |
| Lucent Technologies, Inc. warrants 12/10/07 (a) | | | | 8,328 | | 4,705 |
| Motorola, Inc. | | | | 2,496,712 | | 56,400,724 |
| Nokia Corp. sponsored ADR | | | | 533,400 | | 9,761,220 |
| | | | | | | 125,377,438 |
| Computers & Peripherals 1.9% | | | | | | |
| EMC Corp. (a) | | | | 1,025,700 | | 13,970,034 |
| Hewlett Packard Co. | | | | 3,381,311 | | 96,806,934 |
| International Business Machines Corp. | | | | 1,029,500 | | 84,624,900 |
| Sun Microsystems, Inc. (a) | | | | 3,725,375 | | 15,609,321 |
| | | | | | | 211,011,189 |
| Electronic Equipment & Instruments – 1.2% | | | | | | |
| Agilent Technologies, Inc. (a) | | | | 1,183,300 | | 39,392,057 |
| Arrow Electronics, Inc. (a) | | | | 830,900 | | 26,613,727 |
| Avnet, Inc. (a) | | | | 1,481,530 | | 35,467,828 |
| Solectron Corp. (a) | | | | 5,784,200 | | 21,170,172 |
| Tektronix, Inc. | | | | 187,600 | | 5,292,196 |
| | | | | | | 127,935,980 |
| IT Services 0.3% | | | | | | |
| MoneyGram International, Inc. | | | | 1,161,000 | | 30,278,880 |
| Office Electronics – 0.3% | | | | | | |
| Xerox Corp. (a) | | | | 2,472,500 | | 36,222,125 |
| Semiconductors & Semiconductor Equipment – 2.8% | | | | | | |
| Analog Devices, Inc. | | | | 1,187,400 | | 42,592,038 |
| Applied Materials, Inc. | | | | 2,171,900 | | 38,963,886 |
| Freescale Semiconductor, Inc.: | | | | | | |
| Class A (a) | | | | 203,610 | | 5,128,936 |
| Class B (a) | | | | 1,646,977 | | 41,454,411 |
| Intel Corp. | | | | 4,291,400 | | 107,113,344 |
| Micron Technology, Inc. (a) | | | | 1,773,200 | | 23,601,292 |
| National Semiconductor Corp. | | | | 333,300 | | 8,659,134 |
| Samsung Electronics Co. Ltd. | | | | 32,680 | | 21,375,805 |
| Teradyne, Inc. (a) | | | | 670,800 | | 9,773,556 |
| | | | | | | 298,662,402 |
| Software 1.2% | | | | | | |
| Citrix Systems, Inc. (a) | | | | 646,044 | | 18,593,146 |
| Microsoft Corp. | | | | 3,513,800 | | 91,885,870 |
| Symantec Corp. (a) | | | | 869,033 | | 15,208,078 |
| | | | | | | 125,687,094 |
| |
| TOTAL INFORMATION TECHNOLOGY | | | | | | 955,175,108 |
| |
| MATERIALS 5.6% | | | | | | |
| Chemicals 3.0% | | | | | | |
| Air Products & Chemicals, Inc. | | | | 641,900 | | 37,994,061 |
| Albemarle Corp. | | | | 351,000 | | 13,460,850 |
| Arch Chemicals, Inc. | | | | 323,650 | | 9,677,135 |
| |
See accompanying notes which are an integral part of the financial statements.
| | | | | | |
| | | 39 | | | | Annual Report |
39
| VIP Equity-Income Portfolio | | | | |
| Investments - continued | | | | |
| |
| |
| Common Stocks continued | | | | |
| | | Shares | | Value (Note 1) |
| |
| MATERIALS – continued | | | | |
| Chemicals – continued | | | | |
| Ashland, Inc. | | 289,600 | | $ 16,767,840 |
| Celanese Corp. Class A | | 774,100 | | 14,800,792 |
| Chemtura Corp. | | 2,044,164 | | 25,960,885 |
| Dow Chemical Co. | | 1,351,100 | | 59,205,202 |
| E.I. du Pont de Nemours & Co. | | 662,900 | | 28,173,250 |
| Eastman Chemical Co. | | 379,200 | | 19,562,928 |
| Georgia Gulf Corp. | | 700,700 | | 21,315,294 |
| Lyondell Chemical Co. | | 1,841,393 | | 43,861,969 |
| PolyOne Corp. (a) | | 1,126,200 | | 7,241,466 |
| Praxair, Inc. | | 351,324 | | 18,606,119 |
| Rohm & Haas Co. | | 206,600 | | 10,003,572 |
| | | | | 326,631,363 |
| Containers & Packaging – 0.4% | | | | |
| Amcor Ltd. | | 1,784,800 | | 9,780,023 |
| Smurfit Stone Container Corp. (a) | | 2,320,072 | | 32,875,420 |
| | | | | 42,655,443 |
| Metals & Mining – 1.4% | | | | |
| Alcan, Inc. | | 756,400 | | 31,074,503 |
| Alcoa, Inc. | | 2,527,216 | | 74,729,777 |
| Freeport McMoRan Copper & Gold, Inc. Class B | | 448,004 | | 24,102,615 |
| Phelps Dodge Corp. | | 113,300 | | 16,300,471 |
| | | | | 146,207,366 |
| Paper & Forest Products 0.8% | | | | |
| Bowater, Inc. | | 391,300 | | 12,020,736 |
| International Paper Co. | | 1,313,800 | | 44,156,818 |
| Weyerhaeuser Co. | | 494,200 | | 32,785,228 |
| | | | | 88,962,782 |
| |
| TOTAL MATERIALS | | | | 604,456,954 |
| |
| TELECOMMUNICATION SERVICES 5.2% | | | | |
| Diversified Telecommunication Services – 4.5% | | | | |
| AT&T, Inc. | | 7,338,993 | | 179,731,939 |
| BellSouth Corp. | | 4,686,699 | | 127,009,543 |
| Consolidated Communications Holdings, Inc. | | 393,300 | | 5,108,967 |
| Philippine Long Distance Telephone Co. sponsored ADR (d) | | 650,700 | | 21,824,478 |
| Qwest Communications International, Inc. (a) | | 5,870,900 | | 33,170,585 |
| Verizon Communications, Inc. | | 3,967,802 | | 119,510,196 |
| | | | | 486,355,708 |
| Wireless Telecommunication Services – 0.7% | | | | |
| Crown Castle International Corp. (a) | | 262,600 | | 7,066,566 |
| |
| |
| | | Shares | | Value (Note 1) |
| Sprint Nextel Corp. | | 1,602,900 | | $ 37,443,744 |
| Vodafone Group PLC sponsored ADR | | 1,454,600 | | 31,230,262 |
| | | | | 75,740,572 |
| |
| TOTAL TELECOMMUNICATION SERVICES | | | | 562,096,280 |
See accompanying notes which are an integral part of the financial statements.
| | |
| VIP Equity Income Portfolio | | 40 |
| | | | | | | | Shares | | Value (Note 1) |
| | | | | | | | | | |
| | | | | | | | | | |
| UTILITIES 3.2% | | | | | | | | | | |
| Electric Utilities – 0.4% | | | | | | | | | | |
| Entergy Corp. | | | | | | | | 618,400 | | 42,453,160 |
| Independent Power Producers & Energy Traders 0.8% | | | | |
| AES Corp. (a) | | | | | | | | 1,105,300 | | 17,496,899 |
| Duke Energy Corp. | | | | | | | | 940,300 | | 25,811,235 |
| TXU Corp. | | | | | | | | 813,040 | | 40,806,478 |
| | | | | | | | | | | 84,114,612 |
| Multi-Utilities – 2.0% | | | | | | | | | | |
| Dominion Resources, Inc. | | | | | | 1,095,100 | | 84,541,720 |
| NorthWestern Energy Corp. | | | | | | 417,800 | | 12,981,046 |
| Public Service Enterprise Group, Inc. | | | | 987,100 | | 64,131,887 |
| Wisconsin Energy Corp. | | | | | | 1,337,900 | | 52,258,374 |
| | | | | | | | | | | 213,913,027 |
| |
| TOTAL UTILITIES | | | | | | | | | | 340,480,799 |
| |
| TOTAL COMMON STOCKS | | | | | | | | |
| (Cost $7,941,115,402) | | | | | | 10,516,579,932 |
| |
| Preferred Stocks 0.8% | | | | | | |
| |
| Convertible Preferred Stocks 0.8% | | | | | | |
| |
| CONSUMER DISCRETIONARY 0.3% | | | | | | |
| Automobiles – 0.2% | | | | | | | | | | |
| Ford Motor Co. Capital Trust II 6.50% | | | | 402,500 | | 11,153,275 |
| General Motors Corp.: | | | | | | | | | | |
| Series B, 5.25% | | | | | | | | 412,200 | | 6,108,804 |
| Series C, 6.25% | | | | | | | | 253,100 | | 3,953,422 |
| | | | | | | | | | | 21,215,501 |
| Hotels, Restaurants & Leisure 0.1% | | | | | | |
| Six Flags, Inc. 7.25% PIERS | | | | | | 384,900 | | 8,900,813 |
| |
| TOTAL CONSUMER DISCRETIONARY | | | | | | 30,116,314 |
| |
| FINANCIALS – 0.2% | | | | | | | | | | |
| Insurance – 0.2% | | | | | | | | | | |
| Conseco, Inc. Series B, 5.50% | | | | | | 143,400 | | 4,045,314 |
| The Chubb Corp. Series B, 7.00% | | | | 120,100 | | 4,239,530 |
| Travelers Property Casualty Corp. 4.50% | | | | 240,200 | | 5,856,076 |
| XL Capital Ltd. 6.50% | | | | | | | | 475,300 | | 10,580,178 |
| | | | | | | | | | | 24,721,098 |
| |
| HEALTH CARE 0.2% | | | | | | | | | | |
| Health Care Equipment & Supplies 0.1% | | | | | | |
| Baxter International, Inc. 7.00% | | | | | | 156,900 | | 8,444,358 |
See accompanying notes which are an integral part of the financial statements.
|
41 Annual Report
41
| VIP Equity-Income Portfolio | | | | |
| Investments - continued | | | | |
| |
| |
| Preferred Stocks continued | | | | |
| | | | | Shares | | Value (Note 1) |
| Convertible Preferred Stocks – continued | | | | |
| |
| HEALTH CARE continued | | | | | | |
| Pharmaceuticals 0.1% | | | | | | |
| Schering Plough Corp. 6.00% | | | | 187,400 | | $ 10,055,884 |
| TOTAL HEALTH CARE | | | | | | 18,500,242 |
| |
| INFORMATION TECHNOLOGY 0.1% | | | | |
| Office Electronics – 0.1% | | | | | | |
| Xerox Corp. Series C, 6.25% | | | | 135,550 | | 16,600,537 |
| MATERIALS 0.0% | | | | | | |
| Chemicals 0.0% | | | | | | |
| Celanese Corp. 4.25% | | | | 67,100 | | 1,877,458 |
| |
| TOTAL CONVERTIBLE PREFERRED STOCKS | | | | 91,815,649 |
| Nonconvertible Preferred Stocks 0.0% | | | | |
| |
| FINANCIALS – 0.0% | | | | | | |
| Capital Markets 0.0% | | | | | | |
| State Street Corp. 4.00% | | | | 24,901 | | 411,863 |
| TOTAL PREFERRED STOCKS | | | | |
| (Cost $106,733,791) | | | | | | 92,227,512 |
| |
| Corporate Bonds 0.7% | | | | |
| | | | | Principal | | |
| | | | | Amount | | |
| Convertible Bonds 0.6% | | | | | | |
| |
| CONSUMER DISCRETIONARY 0.3% | | | | |
| Hotels, Restaurants & Leisure 0.1% | | | | |
| Royal Caribbean Cruises Ltd. liquid yield option note 0% 2/2/21 | | $ 8,327,000 | | 4,549,040 |
| Six Flags, Inc. 4.5% 5/15/15 | | | | 3,640,000 | | 4,782,050 |
| | | | | | | 9,331,090 |
| Media 0.2% | | | | | | |
| Liberty Media Corp.3.5% 1/15/31 (e) | | 11,400,000 | | 11,699,250 |
| News America, Inc. liquid yield option note 0% 2/28/21 (e) | | 22,670,000 | | 13,318,625 |
| | | | | | | 25,017,875 |
| |
| TOTAL CONSUMER DISCRETIONARY | | | | 34,348,965 |
| |
| FINANCIALS – 0.1% | | | | | | |
| Diversified Financial Services – 0.1% | | | | |
| Navistar Financial Corp. 4.75% 4/1/09 (e) | | 2,760,000 | | 2,472,215 |
| |
| | | | | Principal | | Value (Note 1) |
| | | | | Amount | | |
| |
| INDUSTRIALS – 0.1% | | | | | | |
| Airlines – 0.0% | | | | | | |
| US Airways Group, Inc. 7% 9/30/20 (e) | | $ 3,110,000 | | $ 5,339,248 |
See accompanying notes which are an integral part of the financial statements.
| | |
| VIP Equity Income Portfolio | | 42 |
| | Principal | | Value (Note 1) |
| | Amount | | |
| | | | |
| Industrial Conglomerates 0.1% | | | | |
| Tyco International Group SA yankee 3.125% 1/15/23 | | 5,220,000 | | 7,127,910 |
| TOTAL INDUSTRIALS | | | | 12,467,158 |
| |
| TELECOMMUNICATION SERVICES 0.1% | | | | |
| Diversified Telecommunication Services – 0.1% | | | | |
| Level 3 Communications, Inc. 5.25% 12/15/11 (e) | | 11,850,000 | | 9,927,930 |
| TOTAL CONVERTIBLE BONDS | | | | 59,216,268 |
| Nonconvertible Bonds – 0.1% | | | | |
| MATERIALS 0.1% | | | | |
| Chemicals 0.1% | | | | |
| Hercules, Inc. 6.5% 6/30/29 unit | | 15,700,000 | | 11,872,340 |
| TOTAL CORPORATE BONDS | | | | |
| (Cost $72,515,698) | | | | 71,088,608 |
| Money Market Funds 1.0% | | | | |
| | | Shares | | |
| Fidelity Cash Central Fund, 4.28% (b) | | 45,676,456 | | 45,676,456 |
| Fidelity Securities Lending Cash Central Fund, 4.35% (b)(c) | | 59,034,750 | | 59,034,750 |
| TOTAL MONEY MARKET FUNDS | | | | |
| (Cost $104,711,206) | | | | 104,711,206 |
| |
| TOTAL INVESTMENT | | | | |
| PORTFOLIO 100.5% | | | | |
| (Cost $8,225,076,097) | | 10,784,607,258 |
| |
| NET OTHER ASSETS (0.5)% | | | | (58,270,920) |
| NET ASSETS 100% | | | | $ 10,726,336,338 |
Security Type Abbreviation
|
| PIERS — Preferred Income Equity Redeemable Securities |
Legend
(a) Non-income producing
(b) Affiliated fund that is available only to investment companies and other accounts managed by Fidelity Investments. The rate quoted is the annualized seven-day
yield of the fund at period end. A complete unaudited listing of the fund’s holdings as of its most recent quarter end is available upon request.
(c) Investment made with cash collateral received from securities on loan.
(d) Security or a portion of the security is on loan at period end.
(e) Security exempt from registration under Rule 144A of the Securities Act of 1933. These securities may be resold in transactions exempt from registration,
normally to qualified institutional buyers. At the period end, the value of these securities amounted to $42,757,268 or 0.4% of net assets.
|
Affiliated Central Funds
Information regarding income received by the fund from the affiliated Central funds during the period is as follows:
| Fund | | Income received |
| Fidelity Cash Central Fund | | $ 545,193 |
| Fidelity Securities Lending Cash Central Fund | | 1,302,772 |
| Total | | $ 1,847,965 |
Other Information
Distribution of investments by country of issue, as a percentage of total net assets, is as follows:
See accompanying notes which are an integral part of the financial statements.
43 Annual Report
| VIP Equity-Income Portfolio | | |
| Investments - continued | | |
| |
| |
| United States of America | | 88.2% |
| France | | 2.6% |
| United Kingdom | | 2.2% |
| Bermuda | | 1.5% |
| Netherlands Antilles | | 1.3% |
| Others (individually less than 1%) | | 4.2% |
| | | 100.0% |
See accompanying notes which are an integral part of the financial statements.
| | |
| VIP Equity Income Portfolio | | 44 |
| VIP Equity-Income Portfolio | | | | |
| |
| Financial Statements | | | | |
| |
| |
| Statement of Assets and Liabilities | | | | |
| | | December 31, 2005 |
| |
| Assets | | | | |
| Investment in securities, at value (including securities loaned of $57,513,075) — See accompanying schedule: | | | | |
| Unaffiliated issuers | | | | |
| (cost $8,120,364,891) | | $ 10,679,896,052 | | |
| Affiliated Central Funds | | | | |
| (cost $104,711,206) | | 104,711,206 | | |
| Total Investments (cost $8,225,076,097) | | | | $ | | 10,784,607,258 |
| Receivable for investments sold | | | | 14,065,285 |
| Receivable for fund shares sold | | | | 3,322,759 |
| Dividends receivable | | | | 15,432,059 |
| Interest receivable | | | | 791,577 |
| Prepaid expenses | | | | 53,445 |
| Other affiliated receivables | | | | 99,668 |
| Other receivables | | | | 314,411 |
| Total assets | | | | 10,818,686,462 |
| |
| Liabilities | | | | |
| Payable to custodian bank | | $ 77,860 | | |
| Payable for investments purchased | | 16,416,408 | | |
| Payable for fund shares redeemed | | 10,983,020 | | |
| Accrued management fee | | 4,245,088 | | |
| Distribution fees payable | | 452,604 | | |
| Other affiliated payables | | 969,563 | | |
| Other payables and accrued expenses | | 170,831 | | |
| Collateral on securities loaned, at value | | 59,034,750 | | |
| Total liabilities | | | | 92,350,124 |
| |
| Net Assets | | | | $ | | 10,726,336,338 |
| Net Assets consist of: | | | | |
| Paid in capital | | | | $ | | 7,453,928,938 |
| Undistributed net investment income | | | | 180,172,674 |
| Accumulated undistributed net realized gain (loss) on investments and foreign currency transactions | | | | 532,706,677 |
| Net unrealized appreciation (depreciation) on investments and assets and liabilities in foreign currencies | | | | 2,559,528,049 |
| Net Assets | | | | $ | | 10,726,336,338 |
| |
| Statement of Assets and Liabilities continued | | | | |
| | | December 31, 2005 |
| |
| Initial Class: | | | | |
| Net Asset Value, offering price | | | | |
| and redemption price | | | | |
| per share ($7,875,801,431 ÷ 308,992,833 shares) | | | | $ | | 25.49 |
| Service Class: | | | | |
| Net Asset Value, offering price | | | | |
| and redemption price | | | | |
| per share ($1,079,838,070 ÷ 42,530,004 shares) | | | | $ | | 25.39 |
| Service Class 2: | | | | |
| Net Asset Value, offering price | | | | |
| and redemption price | | | | |
| per share ($1,723,546,115 ÷ 68,468,604 shares) | | | | $ | | 25.17 |
| Service Class 2R: | | | | |
| Net Asset Value, offering price | | | | |
| and redemption price | | | | |
| per share ($9,651,085 ÷ 384,784 shares) | | | | $ | | 25.08 |
| Investor Class: | | | | |
| Net Asset Value, offering price | | | | |
| and redemption price | | | | |
| per share ($37,499,637 ÷ 1,471,854 shares) | | | | $ | | 25.48 |
See accompanying notes which are an integral part of the financial statements.
|
45 Annual Report
| VIP Equity-Income Portfolio | | | | | | |
| Financial Statements - continued | | | | | | |
| |
| |
| Statement of Operations | | | | | | |
| | | Year ended December 31, 2005 |
| |
| Investment Income | | | | | | |
| Dividends | | | | $ | | 239,632,712 |
| Interest | | | | | | 3,492,709 |
| Income from affiliated Central Funds (including $1,302,772 from security lending) | | | | | | 1,847,965 |
| Total income | | | | | | 244,973,386 |
| |
| Expenses | | | | | | |
| Management fee | | $ 50,995,618 | | | | |
| Transfer agent fees | | 7,184,447 | | | | |
| Distribution fees | | 4,970,223 | | | | |
| Accounting and security lending fees | | 1,415,587 | | | | |
| Independent trustees’ compensation | | 48,551 | | | | |
| Appreciation in deferred trustee compensation account | | 21,240 | | | | |
| Custodian fees and expenses | | 304,163 | | | | |
| Audit | | 118,203 | | | | |
| Legal | | 41,776 | | | | |
| Interest | | 98,129 | | | | |
| Miscellaneous | | 646,006 | | | | |
| Total expenses before reductions | | 65,843,943 | | | | |
| Expense reductions | | (1,157,298) | | | | 64,686,645 |
| |
| Net investment income (loss) | | | | | | 180,286,741 |
| Realized and Unrealized Gain (Loss) | | | | | | |
| Net realized gain (loss) on: | | | | | | |
| Investment securities: | | | | | | |
| Unaffiliated issuers | | 551,525,146 | | | | |
| Foreign currency transactions | | (118,651) | | | | |
| Total net realized gain (loss) | | | | | | 551,406,495 |
| Change in net unrealized appreciation (depreciation) on: | | | | | | |
| Investment securities | | (133,320,013) | | | | |
| Assets and liabilities in foreign currencies | | (6,670) | | | | |
| Total change in net unrealized appreciation (depreciation) | | | | | | (133,326,683) |
| Net gain (loss) | | | | | | 418,079,812 |
| Net increase (decrease) in net assets resulting from operations | | | | $ | | 598,366,553 |
| |
| Statement of Changes in Net Assets | | | | | | |
| | | Year ended | | | | Year ended |
| | | December 31, | | | | December 31, |
| | | 2005 | | | | 2004 |
| Increase (Decrease) in Net Assets | | | | | | |
| Operations | | | | | | |
| Net investment income (loss) | | $ 180,286,741 | | $ | | 177,276,620 |
| Net realized gain (loss) | | 551,406,495 | | | | 393,988,390 |
| Change in net unrealized appreciation (depreciation) | | (133,326,683) | | | | 595,176,710 |
| Net increase (decrease) in net assets resulting from operations | | 598,366,553 | | | | 1,166,441,720 |
| Distributions to shareholders from net investment income | | (175,959,121) | | | | (160,632,605) |
| Distributions to shareholders from net realized gain | | (394,382,958) | | | | (38,902,738) |
| Total distributions | | (570,342,079) | | | | (199,535,343) |
| Share transactions - net increase (decrease) | | (588,913,583) | | | | (72,700,137) |
| Redemption fees | | 2,560 | | | | 27 |
| Total increase (decrease) in net assets | | (560,886,549) | | | | 894,206,267 |
| |
| Net Assets | | | | | | |
| Beginning of period | | 11,287,222,887 | | | | 10,393,016,620 |
| End of period (including undistributed net investment income of $180,172,674 and undistributed net investment | | | | | | |
| income of $170,688,068, respectively) | | $ 10,726,336,338 | | $ | | 11,287,222,887 |
See accompanying notes which are an integral part of the financial statements.
| | |
| VIP Equity Income Portfolio | | 46 |
| Financial Highlights Initial Class | | | | | | | | | | |
| Years ended December 31, | | 2005 | | 2004 | | 2003 | | 2002 | | 2001 |
| Selected Per Share Data | | | | | | | | | | |
| Net asset value, beginning of period | | $ 25.37 | | $ 23.18 | | $ 18.16 | | $ 22.75 | | $ 25.52 |
| Income from Investment Operations | | | | | | | | | | |
| Net investment income (loss)C | | 42 | | .40 | | .36 | | .34 | | .34 |
| Net realized and unrealized gain (loss) | | 1.00 | | 2.24 | | 5.01 | | (4.08) | | (1.51) |
| Total from investment operations | | 1.42 | | 2.64 | | 5.37 | | (3.74) | | (1.17) |
| Distributions from net investment income | | (.41) | | (.36) | | (.35) | | (.36) | | (.42) |
| Distributions from net realized gain | | (.89) | | (.09) | | — | | (.49) | | (1.18) |
| Total distributions | | (1.30) | | (.45) | | (.35) | | (.85) | | (1.60) |
| Redemption fees added to paid in capital | | —C,E | | —C,E | | —C,E | | —C,E | | — |
| Net asset value, end of period | | $ 25.49 | | $ 25.37 | | $ 23.18 | | $ 18.16 | | $ 22.75 |
| Total ReturnA,B | | 5.87% | | 11.53% | | 30.33% | | (16.95)% | | (4.96)% |
| Ratios to Average Net AssetsD | | | | | | | | | | |
| Expenses before reductions | | 56% | | .58% | | .57% | | .57% | | .58% |
| Expenses net of fee waivers, if any | | 56% | | .58% | | .57% | | .57% | | .58% |
| Expenses net of all reductions | | 55% | | .57% | | .56% | | .56% | | .57% |
| Net investment income (loss) | | 1.71% | | 1.71% | | 1.83% | | 1.70% | | 1.47% |
| Supplemental Data | | | | | | | | | | |
| Net assets, end of period (000 omitted) | | $7,875,801 | | $8,689,829 | | $8,402,963 | | $6,895,940 | | $9,256,205 |
| Portfolio turnover rate | | 19% | | 22% | | 26% | | 25% | | 24% |
A Total returns do not reflect charges attributable to your insurance company’s separate account. Inclusion of these charges would reduce the total returns shown.
B Total returns would have been lower had certain expenses not been reduced during the periods shown.
C Calculated based on average shares outstanding during the period.
D Expense ratios reflect operating expenses of the class. Expenses before reductions do not reflect amounts reimbursed by the investment adviser or reductions from brokerage service arrangements or other expense offset arrangements and do not
represent the amount paid by the class during periods when reimbursements or reductions occur. Expenses net of fee waivers reflect expenses after reimbursement by the investment adviser but prior to reductions from brokerage service arrange
ments or other expense offset arrangements. Expenses net of all reductions represent the net expenses paid by the class.
E Amount represents less than $.01 per share.
|
| Financial Highlights Service Class | | | | | | | | | | |
| Years ended December 31, | | 2005 | | 2004 | | 2003 | | 2002 | | 2001 |
| Selected Per Share Data | | | | | | | | | | |
| Net asset value, beginning of period | | $ 25.28 | | $ 23.11 | | $ 18.10 | | $ 22.67 | | $ 25.45 |
| Income from Investment Operations | | | | | | | | | | |
| Net investment income (loss)C | | 39 | | .38 | | .34 | | .32 | | .31 |
| Net realized and unrealized gain (loss) | | 1.00 | | 2.22 | | 5.00 | | (4.06) | | (1.51) |
| Total from investment operations | | 1.39 | | 2.60 | | 5.34 | | (3.74) | | (1.20) |
| Distributions from net investment income | | (.39) | | (.34) | | (.33) | | (.34) | | (.40) |
| Distributions from net realized gain | | (.89) | | (.09) | | — | | (.49) | | (1.18) |
| Total distributions | | (1.28) | | (.43) | | (.33) | | (.83) | | (1.58) |
| Redemption fees added to paid in capital | | —C,E | | —C,E | | —C,E | | —C,E | | — |
| Net asset value, end of period | | $ 25.39 | | $ 25.28 | | $ 23.11 | | $ 18.10 | | $ 22.67 |
| Total ReturnA,B | | 5.76% | | 11.38% | | 30.22% | | (17.00)% | | (5.09)% |
| Ratios to Average Net AssetsD | | | | | | | | | | |
| Expenses before reductions | | 66% | | .68% | | .67% | | .67% | | .68% |
| Expenses net of fee waivers, if any | | 66% | | .68% | | .67% | | .67% | | .68% |
| Expenses net of all reductions | | 65% | | .67% | | .66% | | .66% | | .67% |
| Net investment income (loss) | | 1.61% | | 1.61% | | 1.73% | | 1.60% | | 1.37% |
| Supplemental Data | | | | | | | | | | |
| Net assets, end of period (000 omitted) | | $1,079,838 | | $1,170,778 | | $1,071,483 | | $ 771,516 | | $ 836,017 |
| Portfolio turnover rate | | 19% | | 22% | | 26% | | 25% | | 24% |
A Total returns do not reflect charges attributable to your insurance company’s separate account. Inclusion of these charges would reduce the total returns shown.
B Total returns would have been lower had certain expenses not been reduced during the periods shown.
C Calculated based on average shares outstanding during the period.
D Expense ratios reflect operating expenses of the class. Expenses before reductions do not reflect amounts reimbursed by the investment adviser or reductions from brokerage service arrangements or other expense offset arrangements and do not
represent the amount paid by the class during periods when reimbursements or reductions occur. Expenses net of fee waivers reflect expenses after reimbursement by the investment adviser but prior to reductions from brokerage service arrange
ments or other expense offset arrangements. Expenses net of all reductions represent the net expenses paid by the class.
E Amount represents less than $.01 per share.
|
See accompanying notes which are an integral part of the financial statements.
|
47 Annual Report
| Financial Highlights Service Class 2 | | | | | | | | | | |
| Years ended December 31, | | 2005 | | 2004 | | 2003 | | 2002 | | 2001 |
| Selected Per Share Data | | | | | | | | | | |
| Net asset value, beginning of period | | $ 25.09 | | $ 22.96 | | $ 18.00 | | $ 22.59 | | $ 25.41 |
| Income from Investment Operations | | | | | | | | | | |
| Net investment income (loss)C | | 35 | | .34 | | .31 | | .28 | | .27 |
| Net realized and unrealized gain (loss) | | 98 | | 2.21 | | 4.97 | | (4.04) | | (1.50) |
| Total from investment operations | | 1.33 | | 2.55 | | 5.28 | | (3.76) | | (1.23) |
| Distributions from net investment income | | (.36) | | (.33) | | (.32) | | (.34) | | (.41) |
| Distributions from net realized gain | | (.89) | | (.09) | | — | | (.49) | | (1.18) |
| Total distributions | | (1.25) | | (.42) | | (.32) | | (.83) | | (1.59) |
| Redemption fees added to paid in capital | | —C,E | | —C,E | | —C,E | | —C,E | | — |
| Net asset value, end of period | | $ 25.17 | | $ 25.09 | | $ 22.96 | | $ 18.00 | | $ 22.59 |
| Total ReturnA,B | | 5.57% | | 11.23% | | 30.03% | | (17.15)% | | (5.23)% |
| Ratios to Average Net AssetsD | | | | | | | | | | |
| Expenses before reductions | | 81% | | .83% | | .82% | | .83% | | .84% |
| Expenses net of fee waivers, if any | | 81% | | .83% | | .82% | | .83% | | .84% |
| Expenses net of all reductions | | 80% | | .82% | | .81% | | .82% | | .83% |
| Net investment income (loss) | | 1.46% | | 1.46% | | 1.58% | | 1.44% | | 1.21% |
| Supplemental Data | | | | | | | | | | |
| Net assets, end of period (000 omitted) | | $1,723,546 | | $1,420,999 | | $ 916,679 | | $ 403,632 | | $ 226,078 |
| Portfolio turnover rate | | 19% | | 22% | | 26% | | 25% | | 24% |
A Total returns do not reflect charges attributable to your insurance company’s separate account. Inclusion of these charges would reduce the total returns shown.
B Total returns would have been lower had certain expenses not been reduced during the periods shown.
C Calculated based on average shares outstanding during the period.
D Expense ratios reflect operating expenses of the class. Expenses before reductions do not reflect amounts reimbursed by the investment adviser or reductions from brokerage service arrangements or other expense offset arrangements and do not
represent the amount paid by the class during periods when reimbursements or reductions occur. Expenses net of fee waivers reflect expenses after reimbursement by the investment adviser but prior to reductions from brokerage service arrange
ments or other expense offset arrangements. Expenses net of all reductions represent the net expenses paid by the class.
E Amount represents less than $.01 per share.
|
| Financial Highlights Service Class 2R | | | | | | | | |
| Years ended December 31, | | 2005 | | 2004 | | 2003 | | 2002F |
| Selected Per Share Data | | | | | | | | |
| Net asset value, beginning of period | | $ 25.01 | | $ 22.91 | | $ 17.99 | | $ 21.82 |
| Income from Investment Operations | | | | | | | | |
| Net investment income (loss)E | | 35 | | .34 | | .31 | | .18 |
| Net realized and unrealized gain (loss) | | 99 | | 2.20 | | 4.96 | | (4.01) |
| Total from investment operations | | 1.34 | | 2.54 | | 5.27 | | (3.83) |
| Distributions from net investment income | | (.38) | | (.35) | | (.35) | | — |
| Distributions from net realized gain | | (.89) | | (.09) | | — | | — |
| Total distributions | | (1.27) | | (.44) | | (.35) | | — |
| Redemption fees added to paid in capitalE,H | | — | | — | | — | | — |
| Net asset value, end of period | | $ 25.08 | | $ 25.01 | | $ 22.91 | | $ 17.99 |
| Total ReturnB,C,D | | 5.61% | | 11.22% | | 30.05% | | (17.55)% |
| Ratios to Average Net AssetsG | | | | | | | | |
| Expenses before reductions | | 81% | | .83% | | .82% | | .85%A |
| Expenses net of fee waivers, if any | | 81% | | .83% | | .82% | | .85%A |
| Expenses net of all reductions | | 80% | | .82% | | .81% | | .84%A |
| Net investment income (loss) | | 1.46% | | 1.46% | | 1.57% | | 1.45%A |
| Supplemental Data | | | | | | | | |
| Net assets, end of period (000 omitted) | | $ 9,651 | | $ 5,617 | | $ 1,891 | | $ 471 |
| Portfolio turnover rate | | 19% | | 22% | | 26% | | 25% |
A Annualized
B Total returns for periods of less than one year are not annualized.
C Total returns do not reflect charges attributable to your insurance company’s separate account. Inclusion of these charges would reduce the total returns shown.
D Total returns would have been lower had certain expenses not been reduced during the periods shown.
E Calculated based on average shares outstanding during the period.
F For the period April 24, 2002 (commencement of sale of shares) to December 31, 2002.
G Expense ratios reflect operating expenses of the class. Expenses before reductions do not reflect amounts reimbursed by the investment adviser or reductions from brokerage service arrangements or other expense offset arrangements and do not
represent the amount paid by the class during periods when reimbursements or reductions occur. Expense ratios before reductions for start up periods may not be representative of longer term operating periods. Expenses net of fee waivers reflect
expenses after reimbursement by the investment adviser but prior to reductions from brokerage service arrangements or other expense offset arrangements. Expenses net of all reductions represent the net expenses paid by the class.
H Amount represents less than $.01 per share.
|
See accompanying notes which are an integral part of the financial statements.
| | |
| VIP Equity Income Portfolio | | 48 |
| Financial Highlights Investor Class | | |
| |
| Year ended December 31, | | 2005F |
| Selected Per-Share Data | | |
| Net asset value, beginning of period | | $ 24.46 |
| Income from Investment Operations | | |
| Net investment income (loss)E | | 17 |
| Net realized and unrealized gain (loss) | | 85 |
| Total from investment operations | | 1.02 |
| Redemption fees added to paid in capitalE,H | | — |
| Net asset value, end of period | | $ 25.48 |
| Total ReturnB,C,D | | 4.17% |
| Ratios to Average Net AssetsG | | |
| Expenses before reductions | | 74%A |
| Expenses net of fee waivers, if any | | 74%A |
| Expenses net of all reductions | | 73%A |
| Net investment income (loss) | | 1.54%A |
| Supplemental Data | | |
| Net assets, end of period (000 omitted) | | $ 37,500 |
| Portfolio turnover rate | | 19% |
A Annualized
B Total returns for periods of less than one year are not annualized.
C Total returns do not reflect charges attributable to your insurance company’s separate account. Inclusion of these charges would reduce the total returns shown.
D Total returns would have been lower had certain expenses not been reduced during the periods shown.
E Calculated based on average shares outstanding during the period.
F For the period July 21, 2005 (commencement of sale of shares) to December 31, 2005.
G Expense ratios reflect operating expenses of the class. Expenses before reductions do not reflect amounts reimbursed by the investment adviser or reductions from brokerage service arrangements or other expense offset arrangements and do not
represent the amount paid by the class during periods when reimbursements or reductions occur. Expense ratios before reductions for start up periods may not be representative of longer term operating periods. Expenses net of fee waivers reflect
expenses after reimbursement by the investment adviser but prior to reductions from brokerage service arrangements or other expense offset arrangements. Expenses net of all reductions represent the net expenses paid by the class.
H Amount represents less than $.01 per share.
|
See accompanying notes which are an integral part of the financial statements.
|
49 Annual Report
Performance: The Bottom Line
|
Average annual total return reflects the change in the value of an investment, assuming reinvestment of the class’ dividend income and capital gains (the profits earned upon the sale of securities that have grown in value) and assuming a constant rate of performance each year. During periods of reimbursement by Fidelity, a fund’s total return will be greater than it would be had the reimbursement not occurred. Performance numbers are net of all underlying fund operating expenses, but do not include any insurance charges imposed by your insurance company’s separate account. If performance information included the effect of these additional charges, the total returns would have been lower. How a fund did yesterday is no guarantee of how it will do tomorrow.
| Average Annual Total Returns | | | | | | |
| Periods ended December 31, 2005 | | Past 1 | | Past 5 | | Past 10 |
| | | year | | years | | years |
| VIP Growth - Initial Class | | 5.80% | | 3.52% | | 7.29% |
| VIP Growth - Service ClassA | | 5.67% | | 3.61% | | 7.20% |
| VIP Growth - Service Class 2B | | 5.50% | | 3.76% | | 7.10% |
| VIP Growth - Investor ClassC | | 5.70% | | 3.53% | | 7.28% |
A The initial offering of Service Class shares took place on November 3, 1997. Performance for Service Class shares reflects an asset based service fee (12b 1 fee), and re turns prior to November 3, 1997 are those of Initial Class and do not include the effects of Service Class 12b 1 fee. Had Service Class shares 12b 1 fee been reflected, returns prior to November 3, 1997 would have been lower.
B The initial offering of Service Class 2 shares took place on January 12, 2000. Performance for Service Class 2 shares reflects an asset based service fee (12b 1 fee). Returns from November 3, 1997 through January 12, 2000 are those of Service Class which reflect a different 12b 1 fee. Service Class 2 returns prior to November 3, 1997 are those of Initial Class, and do not include the effects of a 12b 1 fee. Had Service Class 2’s 12b 1 fee been reflected, returns prior to January 12, 2000 would have been lower.
C The initial offering of Investor Class shares took place on July 21, 2005. Returns prior to July 21, 2005 are those of Initial Class. If Investor Class’s transfer agent fee had been reflected, returns prior to July 21, 2005 would have been lower.
$10,000 Over 10 Years
Let’s say hypothetically that $10,000 was invested in VIP Growth Portfolio Initial Class on December 31, 1995. The chart shows how the value of your investment would have changed, and also shows how the Russell 3000® Growth Index performed over the same period.
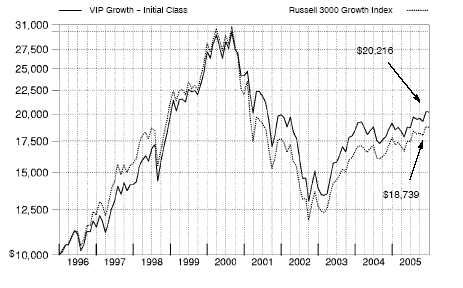
VIP Growth Portfolio 50
VIP Growth Portfolio
Management’s Discussion of Fund Performance
|
Comments from Jennifer Uhrig, Portfolio Manager of VIP Growth Portfolio
U.S. equity benchmarks generally had positive results for the 12 months ending December 31, 2005, the third consecutive year that stocks finished in the black. Energy and utilities were the two best performing sectors, contributing greatly to the 4.91% gain of the Standard & Poor’s 500SM Index. Elsewhere, the NASDAQ Composite® Index returned 2.13%, while the Dow Jones Industrial AverageSM rose 1.72% . The U.S. economy did not decelerate as much as many had predicted, despite eight short term interest rate hikes, record high energy prices and the devastation caused by Hurricane Katrina. Meanwhile, corporate America notched its 14th consecutive quarter of double digit earnings gains through the third quarter of the year, an unprecedented streak in market history. From a style perspective, large cap stocks ended the six year reign of small caps by a narrow margin, but mid caps finished well ahead of both categories. The gap between growth and value stocks also was relatively narrow, with value gaining a slight edge.
For the year ending December 31, 2005, the fund outperformed the Russell 3000® Growth Index, which returned 5.17%, but trailed the LipperSM Variable Annuity Growth Funds Average, which rose 7.67% . (For specific portfolio performance results, please refer to the performance section of this report.) A big overweighting versus the index in the booming energy sector, as well as strong stock selection there and in a variety of other areas including software/services and industrials drove most of the fund’s upside performance. Oil services provider Schlumberger and refiner Valero Energy made big contributions in energy, while Internet search company Google which was the top contributor on both an absolute and relative basis and Joy Global, which makes coal mining machinery, also produced good results. Unfavorable stock picking in some areas namely pharmaceuticals/biotechnology, retailing and pockets of technology offset a portion of these gains. Personal computer giant Dell turned in anemic earnings and stock price performance during the period, which hurt the fund’s relative performance, as did our underweighting in Texas Instruments, the strong performing semiconductor maker. In health care, not owning enough of managed care provider UnitedHealth Group also hurt.
The views expressed in this statement reflect those of the portfolio manager only through the end of the period of the report as stated on the cover and do not necessarily represent the views of Fidelity or any other person in the Fidelity organization. Any such views are subject to change at any time based upon market or other conditions and Fidelity disclaims any responsibility to update such views. These views may not be relied on as invest ment advice and, because investment decisions for a Fidelity fund are based on numerous factors, may not be relied on as an indication of trading intent on behalf of any Fidelity fund.
51 51 Annual Report
| VIP Growth Portfolio | | | | |
| Investment Changes | | |
| |
| |
| Top Ten Stocks as of December 31, 2005 |
| | | % of fund’s | | % of fund’s net assets |
| | | net assets | | 6 months ago |
| General Electric Co. | | 4.4 | | 2.1 |
| Microsoft Corp. | | 4.0 | | 3.7 |
| Johnson & Johnson | | 3.0 | | 3.5 |
| Wal Mart Stores, Inc. | | 2.8 | | 2.8 |
| Intel Corp. | | 2.6 | | 3.1 |
| American International Group, | | | | |
| Inc. | | 2.3 | | 2.2 |
| PepsiCo, Inc. | | 2.0 | | 1.9 |
| Amgen, Inc. | | 1.9 | | 0.7 |
| QUALCOMM, Inc. | | 1.6 | | 1.5 |
| Altria Group, Inc. | | 1.5 | | 0.5 |
| | | 26.1 | | |
Top Five Market Sectors as of December 31, 2005 |
| | | % of fund’s | | % of fund’s net assets |
| | | net assets | | 6 months ago |
| Information Technology | | 27.6 | | 28.3 |
| Health Care | | 16.0 | | 18.2 |
| Consumer Staples | | 14.1 | | 13.8 |
| Industrials | | 13.7 | | 11.9 |
| Consumer Discretionary | | 10.9 | | 11.4 |

VIP Growth Portfolio 52
| VIP Growth Portfolio | | | | | | | | |
| Investments December 31, 2005 | | | | |
| Showing Percentage of Net Assets | | | | | | |
| |
| Common Stocks 99.5% | | | | | | |
| | | | | | | Shares | | Value (Note 1) |
| |
| CONSUMER DISCRETIONARY 10.9% | | | | | | |
| Diversified Consumer Services 0.5% | | | | | | |
| Weight Watchers International, Inc. (a) | | | | 915,600 | | $ 45,258,108 |
| Household Durables 0.1% | | | | | | | | |
| Garmin Ltd. | | | | | | 147,920 | | 9,814,492 |
| Internet & Catalog Retail 1.4% | | | | | | |
| eBay, Inc. (a) | | | | | | 2,485,200 | | 107,484,900 |
| NutriSystem, Inc. (a)(d) | | | | | | 267,100 | | 9,620,942 |
| | | | | | | | | 117,105,842 |
| Media 1.7% | | | | | | | | |
| Gestevision Telecinco SA | | | | | | 202,911 | | 5,121,409 |
| Lamar Advertising Co. Class A (a) | | | | 942,560 | | 43,489,718 |
| Omnicom Group, Inc. | | | | | | 763,000 | | 64,954,190 |
| XM Satellite Radio Holdings, Inc. | | | | | | |
| Class A (a) | | | | | | 1,351,284 | | 36,863,028 |
| | | | | | | | | 150,428,345 |
| Multiline Retail – 2.4% | | | | | | | | |
| Dollar General Corp. | | | | | | 1,371,600 | | 26,156,412 |
| Dollar Tree Stores, Inc. (a) | | | | | | 1,408,700 | | 33,724,278 |
| Fred’s, Inc. Class A (e) | | | | | | 2,243,044 | | 36,494,326 |
| Kohl’s Corp. (a) | | | | | | 1,282,600 | | 62,334,360 |
| Target Corp. | | | | | | 819,000 | | 45,020,430 |
| | | | | | | | | 203,729,806 |
| Specialty Retail 4.8% | | | | | | | | |
| Bed Bath & Beyond, Inc. (a) | | | | | | 940,900 | | 34,013,535 |
| Best Buy Co., Inc. | | | | | | 1,769,625 | | 76,943,295 |
| Circuit City Stores, Inc. | | | | | | 1,409,400 | | 31,838,346 |
| Guitar Center, Inc. (a) | | | | | | 593,144 | | 29,663,131 |
| Home Depot, Inc. | | | | | | 1,652,500 | | 66,893,200 |
| Lowe’s Companies, Inc. | | | | | | 1,425,500 | | 95,023,830 |
| Staples, Inc. | | | | | | 2,014,950 | | 45,759,515 |
| The Men’s Wearhouse, Inc. (a) | | | | | | 1,088,400 | | 32,042,496 |
| Tiffany & Co., Inc. | | | | | | 208,900 | | 7,998,781 |
| | | | | | | | | 420,176,129 |
| |
| TOTAL CONSUMER DISCRETIONARY | | | | | | 946,512,722 |
| |
| CONSUMER STAPLES 14.1% | | | | | | | | |
| Beverages 3.0% | | | | | | | | |
| Brown Forman Corp. Class B (non vtg.) | | | | 715,600 | | 49,605,392 |
| Diageo PLC sponsored ADR | | | | | | 655,650 | | 38,224,395 |
| PepsiCo, Inc. | | | | | | 2,960,400 | | 174,900,432 |
| | | | | | | | | 262,730,219 |
| Food & Staples Retailing – 4.7% | | | | | | |
| CVS Corp. | | | | | | 1,992,200 | | 52,633,924 |
| Longs Drug Stores Corp. | | | | | | 310,400 | | 11,295,456 |
| Wal Mart Stores, Inc. | | | | | | 5,111,600 | | 239,222,880 |
| Walgreen Co. | | | | | | 2,397,300 | | 106,104,498 |
| | | | | | | | | 409,256,758 |
| Food Products – 2.2% | | | | | | | | |
| Bunge Ltd. | | | | | | 652,000 | | 36,909,720 |
| |
See accompanying notes which are an integral part of the financial statements.
| | | | |
| | | | | 53 | | | | Annual Report |
53
| VIP Growth Portfolio | | | | |
| Investments - continued | | | | |
| |
| |
| |
| | | Shares | | Value (Note 1) |
| Campbell Soup Co. | | 1,175,300 | | $ 34,988,681 |
| Groupe Danone | | 102,400 | | 10,698,216 |
| Groupe Danone sponsored ADR | | 1,035,700 | | 21,791,128 |
| Kellogg Co. | | 1,024,100 | | 44,261,602 |
| Wm. Wrigley Jr. Co. | | 617,200 | | 41,037,628 |
| | | | | 189,686,975 |
| Household Products – 1.2% | | | | |
| Church & Dwight Co., Inc. | | 915,600 | | 30,242,268 |
| Colgate Palmolive Co. | | 1,362,500 | | 74,733,125 |
| | | | | 104,975,393 |
| Personal Products 0.3% | | | | |
| Avon Products, Inc. | | 971,510 | | 27,736,611 |
| Tobacco – 2.7% | | | | |
| Altadis SA (Spain) | | 530,500 | | 24,066,203 |
| Altria Group, Inc. | | 1,800,500 | | 134,533,360 |
| British American Tobacco PLC | | 2,039,167 | | 45,636,863 |
| Imperial Tobacco Group PLC | | 754,400 | | 22,559,067 |
| Imperial Tobacco Group PLC sponsored ADR | | 72,900 | | 4,409,721 |
| | | | | 231,205,214 |
| |
| TOTAL CONSUMER STAPLES | | | | 1,225,591,170 |
| |
| ENERGY 5.9% | | | | |
| Energy Equipment & Services – 4.0% | | | | |
| Baker Hughes, Inc. | | 1,144,170 | | 69,542,653 |
| Halliburton Co. | | 1,223,400 | | 75,801,864 |
| National Oilwell Varco, Inc. (a) | | 763,200 | | 47,852,640 |
| Noble Corp. | | 281,400 | | 19,849,956 |
| Schlumberger Ltd. (NY Shares) | | 866,500 | | 84,180,475 |
| Smith International, Inc. | | 739,000 | | 27,424,290 |
| Weatherford International Ltd. (a) | | 673,680 | | 24,387,216 |
| | | | | 349,039,094 |
| Oil, Gas & Consumable Fuels 1.9% | | | | |
| Arch Coal, Inc. | | 445,400 | | 35,409,300 |
| BG Group PLC sponsored ADR | | 545,800 | | 27,109,886 |
| CONSOL Energy, Inc. | | 514,200 | | 33,515,556 |
| Massey Energy Co. | | 177,900 | | 6,737,073 |
| Peabody Energy Corp. | | 453,300 | | 37,360,986 |
| Sasol Ltd. sponsored ADR | | 771,700 | | 27,503,388 |
| | | | | 167,636,189 |
| |
| TOTAL ENERGY | | | | 516,675,283 |
| |
| FINANCIALS – 8.4% | | | | |
| Capital Markets 2.6% | | | | |
| Ameriprise Financial, Inc. | | 725,540 | | 29,747,140 |
| E*TRADE Financial Corp. (a) | | 1,902,300 | | 39,681,978 |
| Janus Capital Group, Inc. | | 560,200 | | 10,436,526 |
| Lazard Ltd. Class A | | 108,700 | | 3,467,530 |
| Merrill Lynch & Co., Inc. | | 656,700 | | 44,478,291 |
| Morgan Stanley | | 450 | | 25,533 |
See accompanying notes which are an integral part of the financial statements.
| | |
| VIP Growth Portfolio | | 54 |
| Common Stocks continued | | | | |
| | | Shares | | Value (Note 1) |
| |
| FINANCIALS – continued | | | | |
| Capital Markets – continued | | | | |
| State Street Corp. | | 743,100 | | $ 41,197,464 |
| UBS AG (NY Shares) | | 550,500 | | 52,380,075 |
| | | | | 221,414,537 |
| Commercial Banks – 0.3% | | | | |
| Bank of America Corp. | | 189,300 | | 8,736,195 |
| Standard Chartered PLC (United Kingdom) | | 490,713 | | 10,939,991 |
| Wells Fargo & Co. | | 139,400 | | 8,758,502 |
| | | | | 28,434,688 |
| Consumer Finance – 1.2% | | | | |
| American Express Co. | | 1,914,600 | | 98,525,316 |
| SLM Corp. | | 166,300 | | 9,161,467 |
| | | | | 107,686,783 |
| Insurance – 4.0% | | | | |
| ACE Ltd. | | 120,200 | | 6,423,488 |
| AFLAC, Inc. | | 1,500,320 | | 69,644,854 |
| American International Group, Inc. | | 2,946,766 | | 201,057,844 |
| Aspen Insurance Holdings Ltd. | | 341,300 | | 8,078,571 |
| Axis Capital Holdings Ltd. | | 322,100 | | 10,075,288 |
| Platinum Underwriters Holdings Ltd. | | 187,700 | | 5,831,839 |
| Prudential Financial, Inc. | | 557,500 | | 40,803,425 |
| The St. Paul Travelers Companies, Inc. | | 196,500 | | 8,777,655 |
| | | | | 350,692,964 |
| Real Estate 0.3% | | | | |
| Mitsui Fudosan Co. Ltd. | | 535,000 | | 10,867,436 |
| Tokyo Tatemono Co. Ltd. | | 1,040,000 | | 10,364,277 |
| | | | | 21,231,713 |
| |
| TOTAL FINANCIALS | | | | 729,460,685 |
| |
| HEALTH CARE 16.0% | | | | |
| Biotechnology – 4.5% | | | | |
| Amgen, Inc. (a) | | 2,114,610 | | 166,758,145 |
| Amylin Pharmaceuticals, Inc. (a)(d) | | 512,389 | | 20,454,569 |
| Genentech, Inc. (a) | | 827,600 | | 76,553,000 |
| Genzyme Corp. (a) | | 603,600 | | 42,722,808 |
| Gilead Sciences, Inc. (a) | | 177,200 | | 9,326,036 |
| ImClone Systems, Inc. (a) | | 1,263,000 | | 43,245,120 |
| Tanox, Inc. (a)(d) | | 1,770,800 | | 28,987,996 |
| | | | | 388,047,674 |
| Health Care Equipment & Supplies 3.9% | | | | |
| Alcon, Inc. | | 225,600 | | 29,237,760 |
| Baxter International, Inc. | | 2,095,000 | | 78,876,750 |
| Becton, Dickinson & Co. | | 1,153,000 | | 69,272,240 |
| C.R. Bard, Inc. | | 766,800 | | 50,547,456 |
| Medtronic, Inc. | | 1,737,347 | | 100,019,067 |
| Syneron Medical Ltd. (a) | | 431,171 | | 13,689,679 |
| | | | | 341,642,952 |
See accompanying notes which are an integral part of the financial statements.
|
55 Annual Report
55
| VIP Growth Portfolio | | | | |
| Investments - continued | | | | |
| |
| |
| |
| | | Shares | | Value (Note 1) |
| Health Care Providers & Services 0.8% | | | | |
| UnitedHealth Group, Inc. | | 1,101,600 | | $ 68,453,424 |
| Pharmaceuticals 6.8% | | | | |
| Allergan, Inc. | | 607,000 | | 65,531,720 |
| Barr Pharmaceuticals, Inc. (a) | | 571,075 | | 35,572,262 |
| Johnson & Johnson | | 4,347,120 | | 261,261,912 |
| Kos Pharmaceuticals, Inc. (a) | | 144,800 | | 7,490,504 |
| Roche Holding AG (participation certificate) | | 222,826 | | 33,457,816 |
| Schering Plough Corp. | | 4,910,000 | | 102,373,500 |
| Wyeth | | 1,928,100 | | 88,827,567 |
| | | | | 594,515,281 |
| |
| TOTAL HEALTH CARE | | | | 1,392,659,331 |
| |
| INDUSTRIALS – 13.7% | | | | |
| Aerospace & Defense – 1.3% | | | | |
| EADS NV | | 683,336 | | 25,806,058 |
| Meggitt PLC | | 776,433 | | 4,838,739 |
| Precision Castparts Corp. | | 643,548 | | 33,342,222 |
| Rolls Royce Group PLC | | 3,314,700 | | 24,394,953 |
| The Boeing Co. | | 374,400 | | 26,297,856 |
| | | | | 114,679,828 |
| Air Freight & Logistics – 1.7% | | | | |
| Expeditors International of Washington, Inc. | | 258,800 | | 17,471,588 |
| FedEx Corp. | | 843,500 | | 87,209,465 |
| United Parcel Service, Inc. Class B | | 345,600 | | 25,971,840 |
| UTI Worldwide, Inc. | | 177,256 | | 16,456,447 |
| | | | | 147,109,340 |
| Commercial Services & Supplies 2.8% | | | | |
| Cintas Corp. | | 1,066,060 | | 43,900,351 |
| Corporate Executive Board Co. | | 313,100 | | 28,085,070 |
| Equifax, Inc. | | 1,102,800 | | 41,928,456 |
| Herman Miller, Inc. | | 869,900 | | 24,522,481 |
| Monster Worldwide, Inc. (a) | | 1,169,880 | | 47,754,502 |
| Robert Half International, Inc. | | 1,470,300 | | 55,709,667 |
| | | | | 241,900,527 |
| Construction & Engineering – 0.4% | | | | |
| Chicago Bridge & Iron Co. NV (NY Shares) | | 905,300 | | 22,822,613 |
| Washington Group International, Inc. | | 209,200 | | 11,081,324 |
| | | | | 33,903,937 |
| Industrial Conglomerates 4.4% | | | | |
| General Electric Co. | | 10,918,340 | | 382,687,813 |
| Smiths Group PLC | | 257,700 | | 4,640,510 |
| | | | | 387,328,323 |
| Machinery – 1.2% | | | | |
| Deere & Co. | | 884,400 | | 60,236,484 |
See accompanying notes which are an integral part of the financial statements.
| | |
| VIP Growth Portfolio | | 56 |
| Common Stocks continued | | | | | | |
| | | | | Shares | | Value (Note 1) |
| |
| INDUSTRIALS – continued | | | | | | |
| Machinery – continued | | | | | | |
| Joy Global, Inc. | | | | 933,939 | | $ 37,357,560 |
| Watts Water Technologies, Inc. Class A | | | | 128,000 | | 3,877,120 |
| | | | | | | 101,471,164 |
| Marine – 0.2% | | | | | | |
| Alexander & Baldwin, Inc. | | | | 422,845 | | 22,935,113 |
| Road & Rail 1.4% | | | | | | |
| Burlington Northern Santa Fe Corp. | | | | 388,400 | | 27,506,488 |
| Canadian National Railway Co. | | | | 137,000 | | 10,976,027 |
| CSX Corp. | | | | 594,500 | | 30,182,765 |
| Norfolk Southern Corp. | | | | 698,600 | | 31,318,238 |
| Union Pacific Corp. | | | | 258,900 | | 20,844,039 |
| | | | | | | 120,827,557 |
| Trading Companies & Distributors – 0.3% | | | | | | |
| UAP Holding Corp. | | | | 1,193,563 | | 24,372,556 |
| |
| TOTAL INDUSTRIALS | | | | | | 1,194,528,345 |
| |
| INFORMATION TECHNOLOGY 27.6% | | | | | | |
| Communications Equipment – 4.2% | | | | | | |
| Andrew Corp. (a) | | | | 2,141,900 | | 22,982,587 |
| Avaya, Inc. (a) | | | | 3,155,098 | | 33,664,896 |
| Corning, Inc. (a) | | | | 3,146,300 | | 61,856,258 |
| Harris Corp. | | | | 815,200 | | 35,061,752 |
| Nokia Corp. sponsored ADR | | | | 2,349,100 | | 42,988,530 |
| QUALCOMM, Inc. | | | | 3,172,000 | | 136,649,760 |
| Research In Motion Ltd. (a) | | | | 455,490 | | 30,070,842 |
| | | | | | | 363,274,625 |
| Computers & Peripherals 3.0% | | | | | | |
| Apple Computer, Inc. (a) | | | | 1,775,734 | | 127,657,517 |
| Dell, Inc. (a) | | | | 2,251,686 | | 67,528,063 |
| EMC Corp. (a) | | | | 3,388,900 | | 46,156,818 |
| UNOVA, Inc. (a) | | | | 680,300 | | 22,994,140 |
| | | | | | | 264,336,538 |
| Electronic Equipment & Instruments – 1.6% | | | | | | |
| Agilent Technologies, Inc. (a) | | | | 1,279,300 | | 42,587,897 |
| Amphenol Corp. Class A | | | | 688,582 | | 30,476,639 |
| Arrow Electronics, Inc. (a) | | | | 615,400 | | 19,711,262 |
| Hon Hai Precision Industry Co. Ltd. (Foxconn) | | | | 9,294,709 | | 50,966,373 |
| | | | | | | 143,742,171 |
| Internet Software & Services 2.1% | | | | | | |
| aQuantive, Inc. (a) | | | | 975,807 | | 24,629,369 |
| Digital River, Inc. (a)(d) | | | | 655,847 | | 19,504,890 |
| Digitas, Inc. (a) | | | | 772,569 | | 9,672,564 |
| Google, Inc. Class A (sub. vtg.) (a) | | | | 305,000 | | 126,532,300 |
| | | | | | | 180,339,123 |
| IT Services 1.7% | | | | | | |
| First Data Corp. | | | | 2,209,300 | | 95,021,993 |
| |
| |
| |
See accompanying notes which are an integral part of the financial statements.
| | | | | | |
| | | 57 | | | | Annual Report |
57
| VIP Growth Portfolio | | | | |
| Investments - continued | | | | |
| |
| |
| |
| | | Shares | | Value (Note 1) |
| Global Payments, Inc. | | 207,000 | | $ 9,648,270 |
| Hitachi Information Systems Co. Ltd. | | 749,900 | | 19,843,842 |
| Nomura Research Institute Ltd. | | 165,500 | | 20,283,068 |
| | | | | 144,797,173 |
| Semiconductors & Semiconductor Equipment – 8.0% | | | | |
| Altera Corp. (a) | | 1,907,439 | | 35,344,845 |
| Analog Devices, Inc. | | 1,425,200 | | 51,121,924 |
| Applied Materials, Inc. | | 3,967,647 | | 71,179,587 |
| ASML Holding NV (NY Shares) (a) | | 1,663,776 | | 33,408,622 |
| Fairchild Semiconductor International, Inc. (a) | | 1,180,600 | | 19,963,946 |
| Freescale Semiconductor, Inc.: | | | | |
| Class A (a) | | 677,200 | | 17,058,668 |
| Class B (a) | | 649,919 | | 16,358,461 |
| Intel Corp. | | 9,096,300 | | 227,043,648 |
| Intersil Corp. Class A | | 794,048 | | 19,755,914 |
| KLA Tencor Corp. | | 192,900 | | 9,515,757 |
| Linear Technology Corp. | | 768,300 | | 27,712,581 |
| MEMC Electronic Materials, Inc. (a) | | 1,232,600 | | 27,326,742 |
| Micron Technology, Inc. (a) | | 1,128,400 | | 15,019,004 |
| PMC Sierra, Inc. (a) | | 3,441,682 | | 26,535,368 |
| Taiwan Semiconductor Manufacturing Co. Ltd. sponsored ADR | | 2,917,291 | | 28,910,354 |
| Teradyne, Inc. (a) | | 1,938,184 | | 28,239,341 |
| Xilinx, Inc. | | 1,546,332 | | 38,983,030 |
| | | | | 693,477,792 |
| Software 7.0% | | | | |
| Autodesk, Inc. (a) | | 942,100 | | 40,463,195 |
| Citrix Systems, Inc. (a) | | 1,401,144 | | 40,324,924 |
| Kronos, Inc. (a) | | 410,773 | | 17,194,958 |
| Microsoft Corp. | | 13,283,570 | | 347,365,356 |
| NAVTEQ Corp. (a) | | 683,400 | | 29,980,758 |
| Nippon System Development Co. Ltd. | | 625,700 | | 20,431,238 |
| Red Hat, Inc. (a) | | 1,516,300 | | 41,304,012 |
| SAP AG sponsored ADR | | 1,026,000 | | 46,241,820 |
| Take Two Interactive Software, Inc. (a) | | 1,650,950 | | 29,221,815 |
| | | | | 612,528,076 |
| |
| TOTAL INFORMATION TECHNOLOGY | | | | 2,402,495,498 |
| |
| MATERIALS 1.9% | | | | |
| Chemicals 1.9% | | | | |
| Ashland, Inc. | | 565,500 | | 32,742,450 |
| Chemtura Corp. | | 1,721,138 | | 21,858,453 |
| Monsanto Co. | | 958,300 | | 74,296,999 |
| Syngenta AG sponsored ADR | | 1,336,500 | | 33,292,215 |
| | | | | 162,190,117 |
| |
| TELECOMMUNICATION SERVICES 1.0% | | | | |
| Wireless Telecommunication Services – 1.0% | | | | |
| American Tower Corp. Class A (a) | | 587,500 | | 15,921,250 |
See accompanying notes which are an integral part of the financial statements.
| | |
| VIP Growth Portfolio | | 58 |
| Common Stocks continued | | | | |
| | | | | Shares | | Value (Note 1) |
| |
| TELECOMMUNICATION SERVICES continued | | | | |
| Wireless Telecommunication Services – continued | | | | |
| Crown Castle International Corp. (a) | | 1,017,600 | | $ 27,383,616 |
| Sprint Nextel Corp. | | | | 2,024,711 | | 47,297,249 |
| | | | | | | 90,602,115 |
| |
| TOTAL COMMON STOCKS | | | | | | |
| (Cost $6,977,054,358) | | | | | | 8,660,715,266 |
| |
| Preferred Stocks 0.0% | | | | |
| |
| Convertible Preferred Stocks 0.0% | | | | |
| |
| INFORMATION TECHNOLOGY 0.0% | | | | |
| Communications Equipment – 0.0% | | | | |
| Chorum Technologies, Inc. | | | | | | |
| Series E (a)(f) | | | | 88,646 | | 1 |
| Nonconvertible Preferred Stocks 0.0% | | | | |
| |
| HEALTH CARE 0.0% | | | | | | |
| Biotechnology – 0.0% | | | | | | |
| GeneProt, Inc. Series A (a)(f) | | | | 826,000 | | 826 |
| INDUSTRIALS – 0.0% | | | | | | |
| Aerospace & Defense – 0.0% | | | | | | |
| Rolls Royce Group PLC Series B | | | | 110,710,980 | | 195,359 |
| |
| TOTAL NONCONVERTIBLE PREFERRED STOCKS | | | | 196,185 |
| |
| TOTAL PREFERRED STOCKS | | | | | | |
| (Cost $5,989,204) | | | | | | 196,186 |
| |
| Money Market Funds 0.7% | | | | |
| | | | | Shares | | Value (Note 1) |
| Fidelity Cash Central Fund, 4.28% (b) | | 43,017,869 | | $ 43,017,869 |
| Fidelity Securities Lending Cash Central Fund, 4.35% (b)(c) | | 13,239,525 | | 13,239,525 |
| TOTAL MONEY MARKET FUNDS | | | | |
| (Cost $56,257,394) | | | | | | 56,257,394 |
| |
| TOTAL INVESTMENT PORTFOLIO 100.2% | | | | |
| (Cost $7,039,300,956) | | | | 8,717,168,846 |
| |
| NET OTHER ASSETS (0.2)% | | | | (16,179,293) |
| NET ASSETS 100% | | | | $ 8,700,989,553 |
Legend
(a) Non-income producing
(b) Affiliated fund that is available only to investment companies and other accounts managed by Fidelity Investments. The rate quoted is the annualized seven-day
yield of the fund at period end. A complete unaudited listing of the fund’s holdings as of its most recent quarter end is available upon request.
(c) Investment made with cash collateral received from securities on loan.
(d) Security or a portion of the security is on loan at period end.
|
See accompanying notes which are an integral part of the financial statements.
59 Annual Report
VIP Growth Portfolio
Investments - continued
|
(e) Affiliated company
(f) Restricted securities – Investment in securities not registered under the Securities Act of 1933 (excluding 144A issues). At the end of the period, the value of
restricted securities (excluding 144A issues) amounted to $827 or 0.0% of net assets.
|
Additional information on each holding is as follows:
| Security | | | | Acquisition Date | | Acquisition Cost |
| Chorum Technologies, Inc. Series E | | | | 9/19/00 | | $ 1,329,858 |
| GeneProt, Inc. Series A | | | | 7/7/00 | | $ 4,497,570 |
Affiliated Central Funds
Information regarding income received by the fund from the affiliated Central funds during the period is as follows:
| Fund | | Income received |
| Fidelity Cash Central Fund | | $ 1,255,834 |
| Fidelity Securities Lending Cash Central Fund | | 284,299 |
| Total | | $ 1,540,133 |
See accompanying notes which are an integral part of the financial statements.
VIP Growth Portfolio 60
Other Affiliated Issuers
An affiliated company is a company in which the fund has ownership of at least 5% of the voting securities. Transactions during the period with companies which are or were affiliates are as follows:
| | | Value, beginning | | Purchases | | | | Sales | | | | Dividend | | Value, end of |
| Affiliate | | of period | | | | | | Proceeds | | | | Income | | period |
| Fred’s, Inc. Class A | | $ | | 16,367,206 | | $ | | 22,007,599 | | | $ | — | | $ | | 139,608 | | $ | | 36,494,326 |
Distribution of investments by country of issue, as a percentage of total net assets, is as follows:
| United States of America | | 88.4% |
| United Kingdom | | 2.0% |
| Switzerland | | 1.7% |
| Netherlands Antilles | | 1.0% |
| Netherlands | | 1.0% |
| Japan | | 1.0% |
| Taiwan | | 1.0% |
| Others (individually less than 1%) | | 3.9% |
| | | 100.0% |
Income Tax Information
At December 31, 2005, the fund had a capital loss carryforward of approximately $2,797,244,204 of which $554,823,752, $2,197,712,598 and $44,707,854 will expire on December 31, 2009, 2010 and 2011, respectively.
See accompanying notes which are an integral part of the financial statements.
61 Annual Report
| VIP Growth Portfolio | | | | | | |
| |
| Financial Statements | | | | | | |
| |
| |
| Statement of Assets and Liabilities | | | | | | |
| | | December 31, 2005 |
| Assets | | | | | | |
| Investment in securities, at value (including securities loaned of $13,360,414) See accompanying schedule: | | | | �� | | |
| Unaffiliated issuers (cost $6,944,554,878) | | $ 8,624,417,126 | | | | |
| Affiliated Central Funds | | | | | | |
| (cost $56,257,394) | | 56,257,394 | | | | |
| Other affiliated issuers | | | | | | |
| (cost $38,488,684) | | 36,494,326 | | | | |
| Total Investments (cost $7,039,300,956) | | | | $ | | 8,717,168,846 |
| Cash | | | | | | 23,058 |
| Foreign currency held at value | | | | | | |
| (cost $22,342) | | | | | | 22,342 |
| Receivable for investments sold | | | | | | 4,082,092 |
| Receivable for fund shares sold | | | | | | 2,347,008 |
| Dividends receivable | | | | | | 9,846,468 |
| Interest receivable | | | | | | 138,579 |
| Prepaid expenses | | | | | | 44,113 |
| Other affiliated receivables | | | | | | 97,869 |
| Other receivables | | | | | | 790,399 |
| Total assets | | | | | | 8,734,560,774 |
| |
| Liabilities | | | | | | |
| Payable for investments purchased | | $ 2,429,107 | | | | |
| Payable for fund shares redeemed | | 12,435,982 | | | | |
| Accrued management fee | | 4,210,135 | | | | |
| Distribution fees payable | | 273,977 | | | | |
| Other affiliated payables | | 834,434 | | | | |
| Other payables and accrued expenses | | 148,061 | | | | |
| Collateral on securities loaned, at value | | 13,239,525 | | | | |
| Total liabilities | | | | | | 33,571,221 |
| |
| Net Assets | | | | $ | | 8,700,989,553 |
| Net Assets consist of: | | | | | | |
| Paid in capital | | | | $ | | 9,800,497,127 |
| Undistributed net investment income | | | | | | 27,754,269 |
| Accumulated undistributed net realized gain (loss) on investments and foreign currency transactions | | | | | | (2,805,123,023) |
| Net unrealized appreciation (depreciation) on investments and assets and liabilities in foreign currencies | | | | | | 1,677,861,180 |
| Net Assets | | | | $ | | 8,700,989,553 |
| |
| Statement of Assets and Liabilities continued | | | | | | |
| | | December 31, 2005 |
| Initial Class: | | | | | | |
| Net Asset Value, offering price | | | | | | |
| and redemption price per | | | | | | |
| share ($6,726,655,202 ÷ 199,629,921 shares) | | | | $ | | 33.70 |
| Service Class: | | | | | | |
| Net Asset Value, offering price | | | | | | |
| and redemption price per | | | | | | |
| share ($1,086,172,442 ÷ 32,366,638 shares) | | | | $ | | 33.56 |
| Service Class 2: | | | | | | |
| Net Asset Value, offering price | | | | | | |
| and redemption price per | | | | | | |
| share ($858,586,852 ÷ 25,791,489 shares) | | | | $ | | 33.29 |
| Service Class 2R: | | | | | | |
| Net Asset Value, offering price | | | | | | |
| and redemption price per share ($5,408,886 ÷ 163,027 shares) | | | | $ | | 33.18 |
| Investor Class: | | | | | | |
| Net Asset Value, offering price | | | | | | |
| and redemption price per share ($24,166,171 ÷ 717,809 shares) | | | | $ | | 33.67 |
See accompanying notes which are an integral part of the financial statements.
| | |
| VIP Growth Portfolio | | 62 |
| Statement of Operations | | | | | | | | |
| | | | | Year ended December 31, 2005 |
| |
| Investment Income | | | | | | | | |
| Dividends (including $139,608 received from other affiliated issuers) | | | | | | $ | | 86,872,141 |
| Interest | | | | | | | | 56,687 |
| Income from affiliated Central Funds (including $284,299 from security lending) | | | | | | | | 1,540,133 |
| Total income | | | | | | | | 88,468,961 |
| |
| Expenses | | | | | | | | |
| Management fee | | $ | | 51,256,288 | | | | |
| Transfer agent fees | | | | 5,953,337 | | | | |
| Distribution fees | | | | 3,183,558 | | | | |
| Accounting and security lending fees | | | | 1,326,993 | | | | |
| Independent trustees’ compensation | | | | 40,581 | | | | |
| Appreciation in deferred trustee compensation account | | | | 18,154 | | | | |
| Custodian fees and expenses | | | | 219,558 | | | | |
| Audit | | | | 102,025 | | | | |
| Legal | | | | 42,093 | | | | |
| Interest | | | | 28,830 | | | | |
| Miscellaneous | | | | 672,959 | | | | |
| Total expenses before reductions | | | | 62,844,376 | | | | |
| Expense reductions | | | | (3,565,538) | | | | 59,278,838 |
| |
| Net investment income (loss) | | | | | | | | 29,190,123 |
| Realized and Unrealized Gain (Loss) | | | | | | | | |
| Net realized gain (loss) on: | | | | | | | | |
| Investment securities: | | | | | | | | |
| Unaffiliated issuers | | | | 875,177,855 | | | | |
| Foreign currency transactions | | | | 699,325 | | | | |
| Total net realized gain (loss) | | | | | | | | 875,877,180 |
| Change in net unrealized appreciation (depreciation) on: | | | | | | | | |
| Investment securities | | | | (447,770,072) | | | | |
| Assets and liabilities in foreign currencies | | | | (503,613) | | | | |
| Total change in net unrealized appreciation (depreciation) | | | | | | | | (448,273,685) |
| Net gain (loss) | | | | | | | | 427,603,495 |
| Net increase (decrease) in net assets resulting from operations | | | | | | $ | | 456,793,618 |
| |
| Statement of Changes in Net Assets | | | | | | | | |
| | | | | Year ended | | | | Year ended |
| | | | | December 31, | | | | December 31, |
| | | | | 2005 | | | | 2004 |
| Increase (Decrease) in Net Assets | | | | | | | | |
| Operations | | | | | | | | |
| Net investment income (loss) | | $ | | 29,190,123 | | $ | | 45,137,740 |
| Net realized gain (loss) | | | | 875,877,180 | | | | 704,392,254 |
| Change in net unrealized appreciation (depreciation) | | | | (448,273,685) | | | | (448,655,386) |
| Net increase (decrease) in net assets resulting from operations | | | | 456,793,618 | | | | 300,874,608 |
| Distributions to shareholders from net investment income | | | | (43,821,998) | | | | (25,185,765) |
| Share transactions - net increase (decrease) | | (1,648,924,682) | | | | (945,720,754) |
| Redemption fees | | | | 117 | | | | 13 |
| Total increase (decrease) in net assets | | (1,235,952,945) | | | | (670,031,898) |
| |
| Net Assets | | | | | | | | |
| Beginning of period | | | | 9,936,942,498 | | 10,606,974,396 |
| End of period (including undistributed net investment income of $27,754,269 and undistributed net investment income | | | | | | | | |
| of $42,500,013, respectively) | | $ | | 8,700,989,553 | | $ | | 9,936,942,498 |
See accompanying notes which are an integral part of the financial statements.
|
63 Annual Report
| Financial Highlights Initial Class | | | | | | | | | | |
| Years ended December 31, | | 2005 | | 2004 | | 2003 | | 2002 | | 2001 |
| Selected Per Share Data | | | | | | | | | | |
| Net asset value, beginning of period | | $ 32.01 | | $ 31.04 | | $ 23.44 | | $ 33.61 | | $ 43.66 |
| Income from Investment Operations | | | | | | | | | | |
| Net investment income (loss)C | | 11 | | .15D,G | | .07 | | .07 | | .07 |
| Net realized and unrealized gain (loss) | | 1.74 | | .90 | | 7.60 | | (10.17) | | (7.27) |
| Total from investment operations | | 1.85 | | 1.05 | | 7.67 | | (10.10) | | (7.20) |
| Distributions from net investment income | | (.16) | | (.08) | | (.07) | | (.07) | | (.03) |
| Distributions from net realized gain | | — | | — | | — | | | | (2.82) |
| Total distributions | | (.16) | | (.08) | | (.07) | | (.07) | | (2.85) |
| Redemption fees added to paid in capital | | —C,F | | —C,F | | —C,F | | —C,F | | — |
| Net asset value, end of period | | $ 33.70 | | $ 32.01 | | $ 31.04 | | $ 23.44 | | $ 33.61 |
| Total ReturnA,B | | 5.80% | | 3.38% | | 32.85% | | (30.10)% | | (17.67)% |
| Ratios to Average Net AssetsE | | | | | | | | | | |
| Expenses before reductions | | 67% | | .68% | | .67% | | .67% | | .68% |
| Expenses net of fee waivers, if any | | 67% | | .68% | | .67% | | .67% | | .68% |
| Expenses net of all reductions | | 63% | | .65% | | .64% | | .61% | | .65% |
| Net investment income (loss) | | 36% | | .47%G | | .28% | | .25% | | .19% |
| Supplemental Data | | | | | | | | | | |
| Net assets, end of period (000 omitted) | | $6,726,655 | | $7,796,888 | | $8,594,509 | | $7,016,147 | | $11,458,659 |
| Portfolio turnover rate | | 79% | | 72% | | 61% | | 90% | | 105% |
A Total returns do not reflect charges attributable to your insurance company’s separate account. Inclusion of these charges would reduce the total returns shown.
B Total returns would have been lower had certain expenses not been reduced during the periods shown.
C Calculated based on average shares outstanding during the period.
D Investment income per share reflects a special dividend which amounted to $.08 per share.
E Expense ratios reflect operating expenses of the class. Expenses before reductions do not reflect amounts reimbursed by the investment adviser or reductions from brokerage service arrangements or other expense offset arrangements and do not
represent the amount paid by the class during periods when reimbursements or reductions occur. Expenses net of fee waivers reflect expenses after reimbursement by the investment adviser but prior to reductions from brokerage service arrange
ments or other expense offset arrangements. Expenses net of all reductions represent the net expenses paid by the class.
F Amount represents less than $.01 per share.
G As a result in the change in the estimate of the return of capital components of dividend income realized in the year ended December 31, 2003, net investment income per share and the ratio of net investment income to average net assets for the
year ended December 31, 2004 have been reduced by $.01 per share and .02%, respectively. The change in estimate has no impact on total net assets or total return of the class.
|
| Financial Highlights Service Class | | | | | | | | | | |
| Years ended December 31, | | 2005 | | 2004 | | 2003 | | 2002 | | 2001 |
| Selected Per Share Data | | | | | | | | | | |
| Net asset value, beginning of period | | $ 31.88 | | $ 30.92 | | $ 23.34 | | $ 33.48 | | $ 43.51 |
| Income from Investment Operations | | | | | | | | | | |
| Net investment income (loss)C | | 08 | | .11D,G | | .05 | | .04 | | .03 |
| Net realized and unrealized gain (loss) | | 1.72 | | .90 | | 7.58 | | (10.14) | | (7.24) |
| Total from investment operations | | 1.80 | | 1.01 | | 7.63 | | (10.10) | | (7.21) |
| Distributions from net investment income | | (.12) | | (.05) | | (.05) | | (.04) | | — |
| Distributions from net realized gain | | — | | — | | — | | | | (2.82) |
| Total distributions | | (.12) | | (.05) | | (.05) | | (.04) | | (2.82) |
| Redemption fees added to paid in capital | | —C,F | | —C,F | | —C,F | | —C,F | | — |
| Net asset value, end of period | | $ 33.56 | | $ 31.88 | | $ 30.92 | | $ 23.34 | | $ 33.48 |
| Total ReturnA,B | | 5.67% | | 3.26% | | 32.78% | | (30.20)% | | (17.74)% |
| Ratios to Average Net AssetsE | | | | | | | | | | |
| Expenses before reductions | | 77% | | .78% | | .77% | | .77% | | .78% |
| Expenses net of fee waivers, if any | | 77% | | .78% | | .77% | | .77% | | .78% |
| Expenses net of all reductions | | 73% | | .75% | | .74% | | .71% | | .75% |
| Net investment income (loss) | | 26% | | .37%G | | .18% | | .15% | | .09% |
| Supplemental Data | | | | | | | | | | |
| Net assets, end of period (000 omitted) | | $1,086,172 | | $1,326,262 | | $1,401,298 | | $1,058,738 | | $1,655,758 |
| Portfolio turnover rate | | 79% | | 72% | | 61% | | 90% | | 105% |
A Total returns do not reflect charges attributable to your insurance company’s separate account. Inclusion of these charges would reduce the total returns shown.
B Total returns would have been lower had certain expenses not been reduced during the periods shown.
C Calculated based on average shares outstanding during the period.
D Investment income per share reflects a special dividend which amounted to $.08 per share.
E Expense ratios reflect operating expenses of the class. Expenses before reductions do not reflect amounts reimbursed by the investment adviser or reductions from brokerage service arrangements or other expense offset arrangements and do not
represent the amount paid by the class during periods when reimbursements or reductions occur. Expenses net of fee waivers reflect expenses after reimbursement by the investment adviser but prior to reductions from brokerage service arrange
ments or other expense offset arrangements. Expenses net of all reductions represent the net expenses paid by the class.
F Amount represents less than $.01 per share.
G As a result in the change in the estimate of the return of capital components of dividend income realized in the year ended December 31, 2003, net investment income per share and the ratio of net investment income to average net assets for the
year ended December 31, 2004 have been reduced by $.01 per share and .02%, respectively. The change in estimate has no impact on total net assets or total return of the class.
|
See accompanying notes which are an integral part of the financial statements.
| | |
| VIP Growth Portfolio | | 64 |
| Financial Highlights Service Class 2 | | | | | | | | | | |
| Years ended December 31, | | 2005 | | 2004 | | 2003 | | 2002 | | 2001 |
| Selected Per Share Data | | | | | | | | | | |
| Net asset value, beginning of period | | $ 31.64 | | $ 30.72 | | $ 23.21 | | $ 33.34 | | $ 43.43 |
| Income from Investment Operations | | | | | | | | | | |
| Net investment income (loss)C | | 03 | | .07D,G | | .01 | | —F | | (.02) |
| Net realized and unrealized gain (loss) | | 1.71 | | .89 | | 7.53 | | (10.09) | | (7.22) |
| Total from investment operations | | 1.74 | | .96 | | 7.54 | | (10.09) | | (7.24) |
| Distributions from net investment income | | (.09) | | (.04) | | (.03) | | (.04) | | (.03) |
| Distributions from net realized gain | | — | | — | | — | | — | | (2.82) |
| Total distributions | | (.09) | | (.04) | | (.03) | | (.04) | | (2.85) |
| Redemption fees added to paid in capital | | —C,F | | —C,F | | —C,F | | —C,F | | — |
| Net asset value, end of period | | $ 33.29 | | $ 31.64 | | $ 30.72 | | $ 23.21 | | $ 33.34 |
| Total ReturnA,B | | 5.50% | | 3.12% | | 32.54% | | (30.30)% | | (17.87)% |
| Ratios to Average Net AssetsE | | | | | | | | | | |
| Expenses before reductions | | 92% | | .93% | | .92% | | .93% | | .93% |
| Expenses net of fee waivers, if any | | 92% | | .93% | | .92% | | .93% | | .93% |
| Expenses net of all reductions | | 88% | | .90% | | .89% | | .87% | | .90% |
| Net investment income (loss) | | 11% | | .22%G | | .02% | | (.01)% | | (.06)% |
| Supplemental Data | | | | | | | | | | |
| Net assets, end of period (000 omitted) | | $ 858,587 | | $ 811,126 | | $ 609,798 | | $ 238,543 | | $ 191,475 |
| Portfolio turnover rate | | 79% | | 72% | | 61% | | 90% | | 105% |
A Total returns do not reflect charges attributable to your insurance company’s separate account. Inclusion of these charges would reduce the total returns shown.
B Total returns would have been lower had certain expenses not been reduced during the periods shown.
C Calculated based on average shares outstanding during the period.
D Investment income per share reflects a special dividend which amounted to $.08 per share.
E Expense ratios reflect operating expenses of the class. Expenses before reductions do not reflect amounts reimbursed by the investment adviser or reductions from brokerage service arrangements or other expense offset arrangements and do not
represent the amount paid by the class during periods when reimbursements or reductions occur. Expenses net of fee waivers reflect expenses after reimbursement by the investment adviser but prior to reductions from brokerage service arrange
ments or other expense offset arrangements. Expenses net of all reductions represent the net expenses paid by the class.
F Amount represents less than $.01 per share.
G As a result in the change in the estimate of the return of capital components of dividend income realized in the year ended December 31, 2003, net investment income per share and the ratio of net investment income to average net assets for the
year ended December 31, 2004 have been reduced by $.01 per share and .02%, respectively. The change in estimate has no impact on total net assets or total return of the class.
|
| Financial Highlights Service Class 2R | | | | | | | | |
| Years ended December 31, | | 2005 | | 2004 | | 2003 | | 2002G |
| Selected Per Share Data | | | | | | | | |
| Net asset value, beginning of period | | $ 31.54 | | $ 30.65 | | $ 23.20 | | $ 31.05 |
| Income from Investment Operations | | | | | | | | |
| Net investment income (loss)E | | 04 | | .07F,J | | .01 | | (.01) |
| Net realized and unrealized gain (loss) | | 1.70 | | .88 | | 7.51 | | (7.84) |
| Total from investment operations | | 1.74 | | .95 | | 7.52 | | (7.85) |
| Distributions from net investment income | | (.10) | | (.06) | | (.07) | | — |
| Redemption fees added to paid in capitalE,I | | — | | — | | — | | — |
| Net asset value, end of period | | $ 33.18 | | $ 31.54 | | $ 30.65 | | $ 23.20 |
| Total ReturnB,C,D | | 5.52% | | 3.10% | | 32.54% | | (25.28)% |
| Ratios to Average Net AssetsH | | | | | | | | |
| Expenses before reductions | | 92% | | .93% | | .92% | | .96%A |
| Expenses net of fee waivers, if any | | 92% | | .93% | | .92% | | .96%A |
| Expenses net of all reductions | | 88% | | .90% | | .90% | | .90%A |
| Net investment income (loss) | | 12% | | .22%J | | .02% | | (.03)%A |
| Supplemental Data | | | | | | | | |
| Net assets, end of period (000 omitted) | | $ 5,409 | | $ 2,667 | | $ 1,369 | | $ 210 |
| Portfolio turnover rate | | 79% | | 72% | | 61% | | 90% |
A Annualized
B Total returns for periods of less than one year are not annualized.
C Total returns do not reflect charges attributable to your insurance company’s separate account. Inclusion of these charges would reduce the total returns shown.
D Total returns would have been lower had certain expenses not been reduced during the periods shown.
E Calculated based on average shares outstanding during the period.
F Investment income per share reflects a special dividend which amounted to $.08 per share.
G For the period April 24, 2002 (commencement of sale of shares) to December 31, 2002.
H Expense ratios reflect operating expenses of the class. Expenses before reductions do not reflect amounts reimbursed by the investment adviser or reductions from brokerage service arrangements or other expense offset arrangements and do not
represent the amount paid by the class during periods when reimbursements or reductions occur. Expense ratios before reductions for start up periods may not be representative of longer term operating periods. Expenses net of fee waivers reflect
expenses after reimbursement by the investment adviser but prior to reductions from brokerage service arrangements or other expense offset arrangements. Expenses net of all reductions represent the net expenses paid by the class.
I Amount represents less than $.01 per share.
J As a result in the change in the estimate of the return of capital components of dividend income realized in the year ended December 31, 2003, net investment income per share and the ratio of net investment income to average net assets for the
year ended December 31, 2004 have been reduced by $.01 per share and .02%, respectively. The change in estimate has no impact on total net assets or total return of the class.
|
See accompanying notes which are an integral part of the financial statements.
|
65 Annual Report
| Financial Highlights Investor Class | | |
| |
| Year ended December 31, | | 2005F |
| Selected Per Share Data | | |
| Net asset value, beginning of period | | $ 32.60 |
| Income from Investment Operations | | |
| Net investment income (loss)E | | 03 |
| Net realized and unrealized gain (loss) | | 1.04 |
| Total from investment operations | | 1.07 |
| Redemption fees added to paid in capitalE,H | | — |
| Net asset value, end of period | | $ 33.67 |
| Total ReturnB,C,D | | 3.28% |
| Ratios to Average Net AssetsG | | |
| Expenses before reductions | | 83%A |
| Expenses net of fee waivers, if any | | 83%A |
| Expenses net of all reductions | | 79%A |
| Net investment income (loss) | | 23%A |
| Supplemental Data | | |
| Net assets, end of period (000 omitted) | | $ 24,166 |
| Portfolio turnover rate | | 79% |
A Annualized
B Total returns for periods of less than one year are not annualized.
C Total returns do not reflect charges attributable to your insurance company’s separate account. Inclusion of these charges would reduce the total returns shown.
D Total returns would have been lower had certain expenses not been reduced during the periods shown.
E Calculated based on average shares outstanding during the period.
F For the period July 21, 2005 (commencement of sale of shares) to December 31, 2005.
G Expense ratios reflect operating expenses of the class. Expenses before reductions do not reflect amounts reimbursed by the investment adviser or reductions from brokerage service arrangements or other expense offset arrangements and do not
represent the amount paid by the class during periods when reimbursements or reductions occur. Expense ratios before reductions for start up periods may not be representative of longer term operating periods. Expenses net of fee waivers reflect
expenses after reimbursement by the investment adviser but prior to reductions from brokerage service arrangements or other expense offset arrangements. Expenses net of all reductions represent the net expenses paid by the class.
H Amount represents less than $.01 per share.
|
See accompanying notes which are an integral part of the financial statements.
| | |
| VIP Growth Portfolio | | 66 |
VIP Growth & Income Portfolio
Performance: The Bottom Line
|
Average annual total return reflects the change in the value of an investment, assuming reinvestment of the class’ dividend income and capital gains (the profits earned upon the sale of securities that have grown in value) and assuming a constant rate of performance each year. During periods of reimbursement by Fidelity, a fund’s total return will be greater than it would be had the reimbursement not occurred. Performance numbers are net of all underlying fund operating expenses, but do not include any insurance charges imposed by your insurance company’s separate account. If performance information included the effect of these additional charges, the total returns would have been lower. How a fund did yesterday is no guarantee of how it will do tomorrow.
| Average Annual Total Returns | | | | | | |
| Periods ended December 31, 2005 | | Past 1 | | Past 5 | | Life of |
| | | | | year | | years | | fundA |
| VIP Growth & Income - Initial Class | | 7.63% | | 1.41% | | 7.28% |
| VIP Growth & Income - Service ClassB | | 7.53% | | 1.31% | | 7.17% |
| VIP Growth & Income - Service Class 2C | | 7.40% | | 1.15% | | 7.06% |
| VIP Growth & Income - Investor ClassD | | 7.56% | | 1.40% | | 7.40% |
A From December 31, 1996.
B The initial offering of Service Class shares took place on November 3, 1997. Performance for Service Class shares reflects an asset based distribution fee (12b 1 fee), and
returns prior to November 3, 1997 are those of Initial Class and do not include the effects of Service Class’ 12b 1 fee. Had Service Class shares’ 12b 1 fee been reflected, returns
prior to November 3, 1997 would have been lower.
C The initial offering of Service Class 2 shares took place on January 12, 2000. Performance for Service Class 2 shares reflects an asset based distribution fee (12b 1 fee).
Returns from November 3, 1997 to January 12, 2000 are those of Service Class which reflect a different 12b 1 fee. Service Class 2 returns prior to November 3, 1997 are those
of the Initial Class and do not include the effects of a 12b 1 fee. Had Service Class 2’s 12b 1 fee been reflected, returns prior to January 12, 2000 would have been lower.
D The initial offering of Investor Class shares took place on July 21, 2005. Returns prior to July 21, 2005 are those of Initial Class. If Investor Class’s transfer agent fee had
been reflected, returns prior to July 21, 2005 would have been lower.
|
$10,000 Life of Fund
Let’s say hypothetically that $10,000 was invested in VIP Growth & Income Portfolio Initial Class on December 31, 1996, when the fund started. The chart shows how the value of your investment would have changed, and also shows how the Standard & Poor’s 500SM Index performed over the same period.

67 Annual Report
VIP Growth & Income Portfolio
Management’s Discussion of Fund Performance
|
Comments from James Catudal, who became Portfolio Manager of VIP Growth & Income Portfolio on October 31, 2005
U.S. equity benchmarks generally had positive results for the 12 months ending December 31, 2005, the third consecutive year that stocks finished in the black. Energy and utilities were the two best performing sectors, contributing greatly to the 4.91% gain of the Standard & Poor’s 500SM Index. Elsewhere, the NASDAQ Composite® Index returned 2.13%, while the Dow Jones Industrial AverageSM rose 1.72% . The U.S. economy did not decelerate as much as many had predicted, despite eight short term interest rate hikes, record high energy prices and the devastation caused by Hurricane Katrina. Meanwhile, corporate America notched its 14th consecutive quarter of double digit earnings gains through the third quarter of the year, an unprecedented streak in market history. From a style perspective, large cap stocks ended the six year reign of small caps by a narrow margin, but mid caps finished well ahead of both categories. The gap between growth and value stocks also was relatively narrow, with value gaining a slight edge.
For the 12 months that ended December 31, 2005, VIP Growth & Income Portfolio outperformed the S&P 500® as well as the 5.60% return of LipperSM Variable Annuity Growth & Income Funds Average. (For specific portfolio performance results, please refer to the performance section of this report.)
Stock selection, especially in the second half of the year, drove fund performance relative to the index. The single biggest contributor was Internet search firm Google, which continued to surpass earnings expectations. Several energy holdings performed especially well, including independent refiner Valero Energy, oil field services company Halliburton and Ultra Petroleum, an exploration and production company. The fund sold the position in Ultra Petroleum before period end. Other standouts were Swiss health care company Alcon, which specializes in eye care products, and financial services company Goldman Sachs. Holding back results were investments in two media names that declined in value despite posting good earnings results: EchoStar Communications, a satellite television provider, and Omnicom, a global advertising, marketing and public relations firm. The fund eliminated the investments in both companies as well as in telecommunication services provider Verizon, which also had disappointing results. The fund reduced its position in another poor performer during the first half of the period, Smurfit Stone Container, a producer of cardboard containers. I’d like to point out that I’ve made some major changes to the portfolio during the past two months in search of attractive investments.
The views expressed in this statement reflect those of the portfolio manager only through the end of the period of the report as stated on the cover and do not necessarily represent the views of Fidelity or any other person in the Fidelity organization. Any such views are subject to change at any time based upon market or other conditions and Fidelity disclaims any responsibility to update such views. These views may not be relied on as invest ment advice and, because investment decisions for a Fidelity fund are based on numerous factors, may not be relied on as an indication of trading intent on behalf of any Fidelity fund.
VIP Growth & Income Portfolio 68
| VIP Growth & Income Portfolio | | | | |
| Investment Changes | | | | |
| |
| |
| Top Ten Stocks as of December 31, 2005 | | | | |
| | | % of fund’s | | % of fund’s net assets |
| | | net assets | | 6 months ago |
| Microsoft Corp. | | 4.4 | | 3.0 |
| General Electric Co. | | 4.1 | | 0.0 |
| American International Group, Inc. | | 3.2 | | 3.2 |
| Johnson & Johnson | | 2.2 | | 0.0 |
| Exxon Mobil Corp. | | 2.2 | | 4.2 |
| UnitedHealth Group, Inc. | | 2.0 | | 1.0 |
| Bank of America Corp. | | 1.9 | | 0.0 |
| Wachovia Corp. | | 1.5 | | 0.0 |
| Schlumberger Ltd. (NY Shares) | | 1.4 | | 1.0 |
| Altria Group, Inc. | | 1.4 | | 1.7 |
| | | 24.3 | | |
| Top Five Market Sectors as of December 31, 2005 | | | | |
| | | % of fund’s | | % of fund’s net assets |
| | | net assets | | 6 months ago |
| Financials | | 19.3 | | 17.8 |
| Information Technology | | 18.4 | | 17.4 |
| Health Care | | 15.8 | | 7.7 |
| Industrials | | 13.5 | | 7.0 |
| Consumer Discretionary | | 9.0 | | 14.6 |
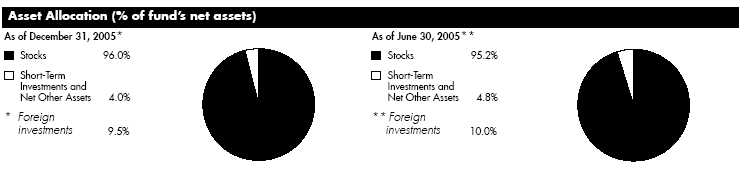
69 Annual Report
| VIP Growth & Income Portfolio | | | | | | | | |
| Investments December 31, 2005 | | | | |
| Showing Percentage of Net Assets | | | | | | | | |
| |
| Common Stocks 96.0% | | | | | | | | |
| | | | | | | | | Shares | | Value (Note 1) |
| |
| CONSUMER DISCRETIONARY 9.0% | | | | | | | | |
| Hotels, Restaurants & Leisure 1.4% | | | | | | | | |
| Ctrip.com International Ltd. sponsored ADR | | | | | | 20,000 | | $ 1,155,000 |
| Kerzner International Ltd. (a) | | | | | | | | 40,000 | | 2,750,000 |
| Marriott International, Inc. Class A | | | | | | 55,000 | | 3,683,350 |
| Sonic Corp. (a) | | | | | | | | 160,000 | | 4,720,000 |
| Starbucks Corp. (a) | | | | | | | | 172,200 | | 5,167,722 |
| Wendy’s International, Inc. | | | | | | | | 64,700 | | 3,575,322 |
| Wynn Resorts Ltd. (a)(d) | | | | | | | | 35,400 | | 1,941,690 |
| | | | | | | | | | | 22,993,084 |
| Household Durables 0.7% | | | | | | | | | | |
| Sharp Corp. | | | | | | | | 690,000 | | 10,498,792 |
| Internet & Catalog Retail 0.7% | | | | | | | | |
| eBay, Inc. (a) | | | | | | | | 222,500 | | 9,623,125 |
| Expedia, Inc. (a) | | | | | | | | 57,200 | | 1,370,512 |
| | | | | | | | | | | 10,993,637 |
| Media 2.4% | | | | | | | | | | |
| CCE Spinco, Inc. (a) | | | | | | | | 10,625 | | 139,188 |
| Clear Channel Communications, Inc. | | | | | | 85,000 | | 2,673,250 |
| E.W. Scripps Co. Class A | | | | | | | | 175,000 | | 8,403,500 |
| Lamar Advertising Co. Class A (a) | | | | | | 74,200 | | 3,423,588 |
| News Corp. Class A | | | | | | | | 150,000 | | 2,332,500 |
| Time Warner, Inc. | | | | | | | | 440,700 | | 7,685,808 |
| Univision Communications, Inc. Class A (a) | | | | | | 188,900 | | 5,551,771 |
| Walt Disney Co. | | | | | | | | 205,000 | | 4,913,850 |
| XM Satellite Radio Holdings, Inc. Class A (a) | | | | | | 90,700 | | 2,474,296 |
| | | | | | | | | | | 37,597,751 |
| Multiline Retail – 0.9% | | | | | | | | | | |
| Dollar General Corp. | | | | | | | | 137,500 | | 2,622,125 |
| JCPenney Co., Inc. | | | | | | | | 80,000 | | 4,448,000 |
| Target Corp. | | | | | | | | 141,600 | | 7,783,752 |
| | | | | | | | | | | 14,853,877 |
| Specialty Retail 2.9% | | | | | | | | | | |
| Bed Bath & Beyond, Inc. (a) | | | | | | | | 126,600 | | 4,576,590 |
| Best Buy Co., Inc. | | | | | | | | 182,300 | | 7,926,404 |
| Chico’s FAS, Inc. (a) | | | | | | | | 10,000 | | 439,300 |
| Home Depot, Inc. | | | | | | | | 265,000 | | 10,727,200 |
| Lowe’s Companies, Inc. | | | | | | | | 79,500 | | 5,299,470 |
| PETsMART, Inc. | | | | | | | | 160,000 | | 4,105,600 |
| Staples, Inc. | | | | | | | | 386,000 | | 8,766,060 |
| Tiffany & Co., Inc. | | | | | | | | 125,000 | | 4,786,250 |
| | | | | | | | | | | 46,626,874 |
| |
| TOTAL CONSUMER DISCRETIONARY | | | | | | | | 143,564,015 |
| |
| CONSUMER STAPLES 5.5% | | | | | | | | | | |
| Beverages 0.8% | | | | | | | | | | |
| PepsiCo, Inc. | | | | | | | | 210,000 | | 12,406,800 |
See accompanying notes which are an integral part of the financial statements.
| | |
| VIP Growth & Income Portfolio | | 70 |
| | | | | Shares | | Value (Note 1) |
| Food & Staples Retailing – 0.8% | | | | | | |
| CVS Corp. | | | | 258,300 | | $ 6,824,286 |
| Safeway, Inc. | | | | 80,000 | | 1,892,800 |
| Wal Mart Stores, Inc. | | | | 90,200 | | 4,221,360 |
| | | | | | | 12,938,446 |
| Food Products – 1.1% | | | | | | |
| Bunge Ltd. | | | | 82,600 | | 4,675,986 |
| Corn Products International, Inc. | | | | 26,500 | | 633,085 |
| Nestle SA sponsored ADR | | | | 158,900 | | 11,877,775 |
| | | | | | | 17,186,846 |
| Household Products – 1.4% | | | | | | |
| Colgate Palmolive Co. | | | | 340,000 | | 18,649,000 |
| Procter & Gamble Co. | | | | 64,100 | | 3,710,108 |
| | | | | | | 22,359,108 |
| Tobacco – 1.4% | | | | | | |
| Altria Group, Inc. | | | | 303,960 | | 22,711,891 |
| |
| TOTAL CONSUMER STAPLES | | | | | | 87,603,091 |
| |
| ENERGY 8.8% | | | | | | |
| Energy Equipment & Services – 5.1% | | | | | | |
| Cooper Cameron Corp. (a) | | | | 420,000 | | 17,388,000 |
| Diamond Offshore Drilling, Inc. | | | | 300 | | 20,868 |
| ENSCO International, Inc. | | | | 245,000 | | 10,865,750 |
| Halliburton Co. | | | | 297,400 | | 18,426,904 |
| Nabors Industries Ltd. (a) | | | | 77,600 | | 5,878,200 |
| Schlumberger Ltd. (NY Shares) | | | | 234,700 | | 22,801,105 |
| Smith International, Inc. | | | | 11,900 | | 441,609 |
| Weatherford International Ltd. (a) | | | | 150,000 | | 5,430,000 |
| | | | | | | 81,252,436 |
| Oil, Gas & Consumable Fuels 3.7% | | | | | | |
| ConocoPhillips | | | | 135,700 | | 7,895,026 |
| Exxon Mobil Corp. | | | | 607,000 | | 34,095,190 |
| Peabody Energy Corp. | | | | 61,600 | | 5,077,072 |
| Valero Energy Corp. | | | | 225,400 | | 11,630,640 |
| | | | | | | 58,697,928 |
| |
| TOTAL ENERGY | | | | | | 139,950,364 |
| |
| FINANCIALS 19.3% | | | | | | |
| Capital Markets 3.3% | | | | | | |
| Ameriprise Financial, Inc. | | | | 136,000 | | 5,576,000 |
| Ameritrade Holding Corp. | | | | 125,000 | | 3,000,000 |
| Charles Schwab Corp. | | | | 139,300 | | 2,043,531 |
| Franklin Resources, Inc. | | | | 31,600 | | 2,970,716 |
| Goldman Sachs Group, Inc. | | | | 65,300 | | 8,339,463 |
| Investors Financial Services Corp. | | | | 111,300 | | 4,099,179 |
| Merrill Lynch & Co., Inc. | | | | 187,200 | | 12,679,056 |
| Nomura Holdings, Inc. sponsored ADR | | | | 228,000 | | 4,382,160 |
| State Street Corp. | | | | 185,800 | | 10,300,752 |
| | | | | | | 53,390,857 |
| |
| |
See accompanying notes which are an integral part of the financial statements.
| | | | | | |
| | | 71 | | | | Annual Report |
71
| VIP Growth & Income Portfolio | | | | |
| Investments - continued | | | | |
| |
| |
| Common Stocks continued | | | | |
| | | Shares | | Value (Note 1) |
| |
| FINANCIALS – continued | | | | |
| Commercial Banks – 5.2% | | | | |
| Bank of America Corp. | | 664,800 | | $ 30,680,520 |
| Mitsui Trust Holdings, Inc. | | 125,000 | | 1,501,209 |
| Mizuho Financial Group, Inc. | | 85 | | 674,781 |
| Nishi Nippon City Bank Ltd. | | 300,000 | | 1,791,273 |
| Standard Chartered PLC (United Kingdom) | | 239,600 | | 5,341,660 |
| Sumitomo Mitsui Financial Group, Inc. | | 250 | | 2,650,439 |
| Wachovia Corp. | | 449,700 | | 23,771,142 |
| Wells Fargo & Co. | | 263,400 | | 16,549,422 |
| | | | | 82,960,446 |
| Consumer Finance – 0.7% | | | | |
| American Express Co. | | 118,600 | | 6,103,156 |
| Capital One Financial Corp. (d) | | 66,300 | | 5,728,320 |
| | | | | 11,831,476 |
| Diversified Financial Services – 0.7% | | | | |
| Citigroup, Inc. | | 194,400 | | 9,434,232 |
| NETeller PLC (a) | | 112,600 | | 1,424,772 |
| | | | | 10,859,004 |
| Insurance – 7.3% | | | | |
| AFLAC, Inc. | | 55,000 | | 2,553,100 |
| American International Group, Inc. | | 748,505 | | 51,070,496 |
| Endurance Specialty Holdings Ltd. | | 64,600 | | 2,315,910 |
| Everest Re Group Ltd. | | 55,000 | | 5,519,250 |
| Fidelity National Financial, Inc. | | 190,000 | | 6,990,100 |
| Fidelity National Title Group, Inc. Class A | | 70,000 | | 1,704,500 |
| Hartford Financial Services Group, Inc. | | 169,100 | | 14,523,999 |
| National Financial Partners Corp. | | 92,000 | | 4,834,600 |
| PartnerRe Ltd. | | 26,400 | | 1,733,688 |
| Prudential Financial, Inc. | | 106,700 | | 7,809,373 |
| PXRE Group Ltd. | | 205,700 | | 2,665,872 |
| W.R. Berkley Corp. | | 89,400 | | 4,257,228 |
| XL Capital Ltd. Class A | | 145,700 | | 9,817,266 |
| | | | | 115,795,382 |
| Real Estate 0.4% | | | | |
| Equity Residential (SBI) | | 120,000 | | 4,694,400 |
| Vornado Realty Trust | | 15,900 | | 1,327,173 |
| | | | | 6,021,573 |
| Thrifts & Mortgage Finance – 1.7% | | | | |
| Freddie Mac | | 104,200 | | 6,809,470 |
| Golden West Financial Corp., Delaware | | 152,600 | | 10,071,600 |
| Hudson City Bancorp, Inc. | | 410,000 | | 4,969,200 |
| Washington Mutual, Inc. | | 118,300 | | 5,146,050 |
| | | | | 26,996,320 |
| |
| TOTAL FINANCIALS | | | | 307,855,058 |
| |
| HEALTH CARE 15.8% | | | | |
| Biotechnology – 3.5% | | | | |
| Affymetrix, Inc. (a) | | 230,900 | | 11,025,475 |
See accompanying notes which are an integral part of the financial statements.
| | |
| VIP Growth & Income Portfolio | | 72 |
| | | | | | | Shares | | Value (Note 1) |
| Amgen, Inc. (a) | | | | | | 222,300 | | $ 17,530,578 |
| Biogen Idec, Inc. (a) | | | | | | 78,000 | | 3,535,740 |
| Cephalon, Inc. (a) | | | | | | 58,000 | | 3,754,920 |
| Genentech, Inc. (a) | | | | | | 500 | | 46,250 |
| ImClone Systems, Inc. (a) | | | | | | 24,300 | | 832,032 |
| Invitrogen Corp. (a) | | | | | | 135,300 | | 9,016,392 |
| MedImmune, Inc. (a) | | | | | | 60,000 | | 2,101,200 |
| Protein Design Labs, Inc. (a) | | | | | | 234,800 | | 6,673,016 |
| Serono SA sponsored ADR (d) | | | | | | 61,000 | | 1,211,460 |
| | | | | | | | | 55,727,063 |
| Health Care Equipment & Supplies 2.2% | | | | | | |
| Alcon, Inc. | | | | | | 38,000 | | 4,924,800 |
| Baxter International, Inc. | | | | | | 201,100 | | 7,571,415 |
| Becton, Dickinson & Co. | | | | | | 135,000 | | 8,110,800 |
| Cooper Companies, Inc. | | | | | | 80,100 | | 4,109,130 |
| DJ Orthopedics, Inc. (a) | | | | | | 35,400 | | 976,332 |
| Medtronic, Inc. | | | | | | 79,200 | | 4,559,544 |
| Millipore Corp. (a) | | | | | | 1,000 | | 66,040 |
| St. Jude Medical, Inc. (a) | | | | | | 49,500 | | 2,484,900 |
| Zimmer Holdings, Inc. (a) | | | | | | 28,500 | | 1,922,040 |
| | | | | | | | | 34,725,001 |
| Health Care Providers & Services 3.7% | | | | | | |
| Aetna, Inc. | | | | | | 64,800 | | 6,111,288 |
| American Healthways, Inc. (a) | | | | | | 30,000 | | 1,357,500 |
| American Retirement Corp. (a) | | | | | | 36,700 | | 922,271 |
| Brookdale Senior Living, Inc. | | | | | | 18,200 | | 542,542 |
| Cardinal Health, Inc. | | | | | | 76,300 | | 5,245,625 |
| Emdeon Corp. (a) | | | | | | 131,000 | | 1,108,260 |
| Henry Schein, Inc. (a) | | | | | | 209,200 | | 9,129,488 |
| IMS Health, Inc. | | | | | | 99,100 | | 2,469,572 |
| UnitedHealth Group, Inc. | | | | | | 524,200 | | 32,573,788 |
| | | | | | | | | 59,460,334 |
| Pharmaceuticals 6.4% | | | | | | | | |
| Johnson & Johnson | | | | | | 589,100 | | 35,404,910 |
| Novartis AG sponsored ADR | | | | | | 143,800 | | 7,546,624 |
| Pfizer, Inc. | | | | | | 821,600 | | 19,159,712 |
| Roche Holding AG (participation certificate) | | | | 83,509 | | 12,539,061 |
| Schering Plough Corp. | | | | | | 190,800 | | 3,978,180 |
| Sepracor, Inc. (a) | | | | | | 40,000 | | 2,064,000 |
| Teva Pharmaceutical Industries Ltd. sponsored ADR | | | | 107,800 | | 4,636,478 |
| Wyeth | | | | | | 375,000 | | 17,276,250 |
| | | | | | | | | 102,605,215 |
| |
| TOTAL HEALTH CARE | | | | | | | | 252,517,613 |
| |
| INDUSTRIALS – 13.5% | | | | | | | | |
| Aerospace & Defense – 3.6% | | | | | | | | |
| Aviall, Inc. (a) | | | | | | 242,800 | | 6,992,640 |
| EDO Corp. | | | | | | 129,300 | | 3,498,858 |
| Goodrich Corp. | | | | | | 50,000 | | 2,055,000 |
| Honeywell International, Inc. | | | | | | 459,800 | | 17,127,550 |
| |
| |
See accompanying notes which are an integral part of the financial statements.
| | | | | | |
| | | | | 73 | | | | Annual Report |
73
| VIP Growth & Income Portfolio | | | | |
| Investments - continued | | | | |
| |
| |
| Common Stocks continued | | | | |
| | | | | Shares | | Value (Note 1) |
| |
| INDUSTRIALS – continued | | | | | | |
| Aerospace & Defense – continued | | | | |
| The Boeing Co. | | | | 75,000 | | $ 5,268,000 |
| United Technologies Corp. | | | | 404,300 | | 22,604,413 |
| | | | | | | 57,546,461 |
| Air Freight & Logistics – 1.1% | | | | | | |
| Expeditors International of Washington, Inc. | | 48,294 | | 3,260,328 |
| FedEx Corp. | | | | 130,200 | | 13,461,378 |
| | | | | | | 16,721,706 |
| Airlines – 0.3% | | | | | | |
| Southwest Airlines Co. | | | | 310,000 | | 5,093,300 |
| Commercial Services & Supplies 0.3% | | | | |
| Aramark Corp. Class B | | | | 90,000 | | 2,500,200 |
| Robert Half International, Inc. | | | | 40,100 | | 1,519,389 |
| | | | | | | 4,019,589 |
| Construction & Engineering – 0.7% | | | | |
| McDermott International, Inc. (a) | | | | 261,800 | | 11,678,898 |
| Electrical Equipment 0.0% | | | | | | |
| Evergreen Solar, Inc. (a) | | | | 50,000 | | 532,500 |
| Industrial Conglomerates 5.3% | | | | | | |
| 3M Co. | | | | 197,600 | | 15,314,000 |
| General Electric Co. | | | | 1,852,300 | | 64,923,115 |
| Tyco International Ltd. | | | | 145,000 | | 4,184,700 |
| | | | | | | 84,421,815 |
| Machinery – 1.0% | | | | | | |
| Danaher Corp. | | | | 112,700 | | 6,286,406 |
| Deere & Co. | | | | 81,900 | | 5,578,209 |
| Pentair, Inc. | | | | 110,000 | | 3,797,200 |
| | | | | | | 15,661,815 |
| Road & Rail 1.2% | | | | | | |
| Laidlaw International, Inc. | | | | 165,800 | | 3,851,534 |
| Landstar System, Inc. | | | | 46,246 | | 1,930,308 |
| Norfolk Southern Corp. | | | | 310,000 | | 13,897,300 |
| | | | | | | 19,679,142 |
| |
| TOTAL INDUSTRIALS | | | | | | 215,355,226 |
| |
| INFORMATION TECHNOLOGY 18.4% | | | | |
| Communications Equipment – 3.6% | | | | |
| Alcatel SA sponsored ADR (a) | | | | 228,200 | | 2,829,680 |
| Cisco Systems, Inc. (a) | | | | 649,300 | | 11,116,016 |
| Comverse Technology, Inc. (a) | | | | 77,065 | | 2,049,158 |
| Corning, Inc. (a) | | | | 685,600 | | 13,478,896 |
| Juniper Networks, Inc. (a) | | | | 219,600 | | 4,897,080 |
| Motorola, Inc. | | | | 353,700 | | 7,990,083 |
| QUALCOMM, Inc. | | | | 260,000 | | 11,200,800 |
| Research In Motion Ltd. (a) | | | | 53,100 | | 3,505,591 |
| | | | | | | 57,067,304 |
| Computers & Peripherals 2.7% | | | | | | |
| Apple Computer, Inc. (a) | | | | 163,800 | | 11,775,582 |
See accompanying notes which are an integral part of the financial statements.
| | |
| VIP Growth & Income Portfolio | | 74 |
| | | Shares | | Value (Note 1) |
| Dell, Inc. (a) | | 409,500 | | $ 12,280,905 |
| EMC Corp. (a) | | 926,400 | | 12,617,568 |
| Hewlett Packard Co. | | 6,900 | | 197,547 |
| NEC Corp. sponsored ADR | | 76,200 | | 471,678 |
| Seagate Technology | | 114,500 | | 2,288,855 |
| Sun Microsystems, Inc. (a) | | 648,000 | | 2,715,120 |
| | | | | 42,347,255 |
| Electronic Equipment & Instruments – 0.5% | | | | |
| Agilent Technologies, Inc. (a) | | 199,014 | | 6,625,176 |
| Symbol Technologies, Inc. | | 145,200 | | 1,861,464 |
| | | | | 8,486,640 |
| Internet Software & Services 1.5% | | | | |
| Akamai Technologies, Inc. (a) | | 17,600 | | 350,768 |
| China Finance Online Co. Ltd. ADR (a) | | 56,800 | | 372,608 |
| Google, Inc. Class A (sub. vtg.) (a) | | 33,000 | | 13,690,380 |
| Yahoo! Japan Corp | | 1,137 | | 1,726,161 |
| Yahoo!, Inc. (a) | | 219,900 | | 8,615,682 |
| | | | | 24,755,599 |
| IT Services 1.0% | | | | |
| First Data Corp. | | 171,400 | | 7,371,914 |
| Paychex, Inc. | | 207,200 | | 7,898,464 |
| | | | | 15,270,378 |
| Semiconductors & Semiconductor Equipment – 4.0% | | | | |
| Altera Corp. (a) | | 192,600 | | 3,568,878 |
| Analog Devices, Inc. | | 170,000 | | 6,097,900 |
| ASML Holding NV (NY Shares) (a) | | 300,000 | | 6,024,000 |
| Entegris, Inc. (a) | | 98,800 | | 930,696 |
| Freescale Semiconductor, Inc. Class A (a) | | 302,800 | | 7,627,532 |
| Intel Corp. | | 905,800 | | 22,608,768 |
| Lam Research Corp. (a) | | 115,000 | | 4,103,200 |
| Microchip Technology, Inc. | | 105,400 | | 3,388,610 |
| National Semiconductor Corp. | | 253,000 | | 6,572,940 |
| Taiwan Semiconductor Manufacturing Co. Ltd. sponsored ADR | | 83,600 | | 828,476 |
| Teradyne, Inc. (a) | | 140,000 | | 2,039,800 |
| | | | | 63,790,800 |
| Software 5.1% | | | | |
| BEA Systems, Inc. (a) | | 260,000 | | 2,444,000 |
| Cognos, Inc. (a) | | 79,000 | | 2,755,537 |
| FileNET Corp. (a) | | 1,100 | | 28,435 |
| Microsoft Corp. | | 2,697,200 | | 70,531,779 |
| Oracle Corp. (a) | | 230,000 | | 2,808,300 |
| Symantec Corp. (a) | | 198,200 | | 3,468,500 |
| | | | | 82,036,551 |
| |
| TOTAL INFORMATION TECHNOLOGY | | | | 293,754,527 |
| |
| MATERIALS 3.2% | | | | |
| Chemicals 1.9% | | | | |
| Ashland, Inc. | | 180,000 | | 10,422,000 |
See accompanying notes which are an integral part of the financial statements.
|
75 Annual Report
75
| VIP Growth & Income Portfolio | | | | | | |
| Investments - continued | | | | | | |
| |
| |
| Common Stocks continued | | | | | | |
| | | | | Shares | | Value (Note 1) |
| |
| MATERIALS – continued | | | | | | |
| Chemicals – continued | | | | | | |
| Monsanto Co. | | | | 96,010 | | $ 7,443,655 |
| Praxair, Inc. | | | | 238,800 | | 12,646,848 |
| | | | | | | 30,512,503 |
| Containers & Packaging – 0.2% | | | | | | |
| Smurfit Stone Container Corp. (a) | | | | 230,000 | | 3,259,100 |
| Metals & Mining – 1.1% | | | | | | |
| Alcoa, Inc. | | | | 160,000 | | 4,731,200 |
| Newmont Mining Corp. | | | | 246,200 | | 13,147,080 |
| | | | | | | 17,878,280 |
| |
| TOTAL MATERIALS | | | | | | 51,649,883 |
| |
| TELECOMMUNICATION SERVICES 1.5% | | | | | | |
| Diversified Telecommunication Services – 0.6% | | | | | | |
| AT&T, Inc. | | | | 302,600 | | 7,410,674 |
| Qwest Communications International, Inc. (a) | | | | 580,000 | | 3,277,000 |
| | | | | | | 10,687,674 |
| Wireless Telecommunication Services – 0.9% | | | | | | |
| Nextel Partners, Inc. Class A (a) | | | | 235,000 | | 6,565,900 |
| Sprint Nextel Corp. | | | | 321,466 | | 7,509,446 |
| | | | | | | 14,075,346 |
| |
| TOTAL TELECOMMUNICATION SERVICES | | | | | | 24,763,020 |
| |
| UTILITIES 1.0% | | | | | | |
| Independent Power Producers & Energy Traders 0.6% | | | | | | |
| TXU Corp. | | | | 185,700 | | 9,320,283 |
| |
| | | | | Shares | | Value (Note 1) |
| Multi-Utilities – 0.4% | | | | | | |
| Public Service Enterprise Group, Inc. | | | | 105,900 | | $ 6,880,323 |
| TOTAL UTILITIES | | | | | | 16,200,606 |
| |
| TOTAL COMMON STOCKS | | | | | | |
| (Cost $1,435,009,084) | | | | 1,533,213,403 |
| |
| Money Market Funds 4.2% | | | | | | |
| |
| Fidelity Cash Central Fund, 4.28% (b) | | | | 62,804,740 | | 62,804,740 |
| Fidelity Securities Lending Cash Central Fund, 4.35% (b)(c) | | | | 4,647,650 | | 4,647,650 |
| TOTAL MONEY MARKET FUNDS | | | | | | |
| (Cost $67,452,390) | | | | | | 67,452,390 |
| |
| TOTAL INVESTMENT PORTFOLIO 100.2% | | | | | | |
| (Cost $1,502,461,474) | | | | 1,600,665,793 |
| |
| NET OTHER ASSETS (0.2)% | | | | | | (3,685,849) |
| NET ASSETS 100% | | | | $ 1,596,979,944 |
| |
See accompanying notes which are an integral part of the financial statements.
| | | | | | |
| VIP Growth & Income Portfolio | | 76 | | | | |
Legend
(a) Non-income producing
(b) Affiliated fund that is available only to investment companies and other accounts managed by Fidelity Investments. The rate quoted is the annualized seven-day
yield of the fund at period end. A complete unaudited listing of the fund’s holdings as of its most recent quarter end is available upon request.
(c) Investment made with cash collateral received from securities on loan.
(d) Security or a portion of the security is on loan at period end.
|
Affiliated Central Funds
Information regarding income received by the fund from the affiliated Central funds during the period is as follows:
| Fund | | Income received |
| Fidelity Cash Central Fund | | $ 2,972,486 |
| Fidelity Securities Lending Cash Central Fund | | 18,128 |
| Total | | $ 2,990,614 |
See accompanying notes which are an integral part of the financial statements.
77 Annual Report
| VIP Growth & Income Portfolio | | | | |
| |
| Financial Statements | | | | |
| |
| |
| Statement of Assets and Liabilities | | | | |
| | | December 31, 2005 |
| |
| Assets | | | | |
| Investment in securities, at value (including securities loaned of $4,533,286) — See accompanying schedule: | | | | |
| Unaffiliated issuers (cost $1,435,009,084) | | $1,533,213,403 | | |
| Affiliated Central Funds (cost $67,452,390) | | 67,452,390 | | |
| Total Investments (cost $1,502,461,474) | | | $ | 1,600,665,793 |
| Cash | | | | 88,393 |
| Receivable for fund shares sold | | | | 434,737 |
| Dividends receivable | | | | 1,469,324 |
| Interest receivable | | | | 222,714 |
| Prepaid expenses | | | | 7,556 |
| Other receivables | | | | 281,277 |
| Total assets | | | | 1,603,169,794 |
| |
| Liabilities | | | | |
| Payable for fund shares redeemed | | $ 548,513 | | |
| Accrued management fee | | 634,137 | | |
| Distribution fees payable | | 158,079 | | |
| Other affiliated payables | | 133,578 | | |
| Other payables and accrued expenses | | 67,893 | | |
| Collateral on securities loaned, at value | | 4,647,650 | | |
| Total liabilities | | | | 6,189,850 |
| |
| Net Assets | | | $ | 1,596,979,944 |
| Net Assets consist of: | | | | |
| Paid in capital | | | $ | 1,448,917,539 |
| Undistributed net investment income | | | | 13,071,943 |
| Accumulated undistributed net realized gain (loss) on investments and foreign currency transactions | | | | 36,786,143 |
| Net unrealized appreciation (depreciation) on investments | | | | 98,204,319 |
| Net Assets | | | $ | 1,596,979,944 |
| |
| Statement of Assets and Liabilities continued | | | | |
| | | December 31, 2005 |
| |
| Initial Class: | | | | |
| Net Asset Value, offering price and redemption price per share ($606,101,885 ÷ 41,081,215 shares) | | | $ | 14.75 |
| Service Class: | | | | |
| Net Asset Value, offering price and redemption price per share ($384,526,645 ÷ 26,236,435 shares) | | | $ | 14.66 |
| Service Class 2: | | | | |
| Net Asset Value, offering price and redemption price per share ($596,787,338 ÷ 41,077,054 shares) | | | $ | 14.53 |
| Investor Class: | | | | |
| Net Asset Value, offering price and redemption price per share ($9,564,076 ÷ 648,822 shares) | | | $ | 14.74 |
See accompanying notes which are an integral part of the financial statements.
| | |
| VIP Growth & Income Portfolio | | 78 |
| Statement of Operations | | | | | | | | |
| | | | | Year ended December 31, 2005 |
| |
| Investment Income | | | | | | | | |
| Dividends | | | | | | $ | | 20,302,284 |
| Interest | | | | | | | | 154,557 |
| Income from affiliated Central Funds (including $18,128 from security lending) | | | | | | | | 2,990,614 |
| Total income | | | | | | | | 23,447,455 |
| |
| Expenses | | | | | | | | |
| Management fee | | $ | | 7,365,883 | | | | |
| Transfer agent fees | | | | 1,057,472 | | | | |
| Distribution fees | | | | 1,746,694 | | | | |
| Accounting and security lending fees | | | | 518,731 | | | | |
| Independent trustees’ compensation | | | | 6,997 | | | | |
| Custodian fees and expenses | | | | 45,672 | | | | |
| Audit | | | | 51,284 | | | | |
| Legal | | | | 5,128 | | | | |
| Interest | | | | 9,146 | | | | |
| Miscellaneous | | | | 191,042 | | | | |
| Total expenses before reductions | | | | 10,998,049 | | | | |
| Expense reductions | | | | (873,199) | | | | 10,124,850 |
| |
| Net investment income (loss) | | | | | | | | 13,322,605 |
| Realized and Unrealized Gain (Loss) | | | | | | | | |
| Net realized gain (loss) on: | | | | | | | | |
| Investment securities: | | | | | | | | |
| Unaffiliated issuers | | | | 199,907,620 | | | | |
| Foreign currency transactions | | | | (21,184) | | | | |
| Total net realized gain (loss) | | | | | | | | 199,886,436 |
| Change in net unrealized appreciation (depreciation) on investment securities | | | | | | | | (101,373,471) |
| Net gain (loss) | | | | | | | | 98,512,965 |
| Net increase (decrease) in net assets resulting from operations | | | | | | $ | | 111,835,570 |
| |
| Statement of Changes in Net Assets | | | | | | | | |
| | | | | Year ended | | | | Year ended |
| | | | | December 31, | | | | December 31, |
| | | | | 2005 | | | | 2004 |
| Increase (Decrease) in Net Assets | | | | | | | | |
| Operations | | | | | | | | |
| Net investment income (loss) | | $ | | 13,322,605 | | $ | | 22,894,276 |
| Net realized gain (loss) | | | | 199,886,436 | | | | 6,132,638 |
| Change in net unrealized appreciation (depreciation) | | | | (101,373,471) | | | | 59,376,943 |
| Net increase (decrease) in net assets resulting from operations | | | | 111,835,570 | | | | 88,403,857 |
| Distributions to shareholders from net investment income | | | | (22,706,700) | | | | (12,447,351) |
| Share transactions - net increase (decrease) | | | | (123,504,452) | | | | 70,330,734 |
| Total increase (decrease) in net assets | | | | (34,375,582) | | | | 146,287,240 |
| |
| Net Assets | | | | | | | | |
| Beginning of period | | | | 1,631,355,526 | | | | 1,485,068,286 |
| End of period (including undistributed net investment income of $13,071,943 and undistributed net investment income | | | | | | | | |
| of $22,467,135, respectively) | | $ | | 1,596,979,944 | | $ | | 1,631,355,526 |
See accompanying notes which are an integral part of the financial statements.
|
79 Annual Report
| Financial Highlights Initial Class | | | | | | | | | | |
| Years ended December 31, | | 2005 | | 2004 | | 2003 | | 2002 | | 2001 |
| Selected Per Share Data | | | | | | | | | | |
| Net asset value, beginning of period | | $ 13.91 | | $ 13.26 | | $ 10.86 | | $ 13.19 | | $ 15.26 |
| Income from Investment Operations | | | | | | | | | | |
| Net investment income (loss)C | | 13 | | .21D | | .12 | | .15 | | .18 |
| Net realized and unrealized gain (loss) | | 92 | | .56 | | 2.42 | | (2.32) | | (1.45) |
| Total from investment operations | | 1.05 | | .77 | | 2.54 | | (2.17) | | (1.27) |
| Distributions from net investment income | | (.21) | | (.12) | | (.14) | | (.16) | | (.19) |
| Distributions from net realized gain | | — | | — | | — | | — | | (.61) |
| Total distributions | | (.21) | | (.12) | | (.14) | | (.16) | | (.80) |
| Net asset value, end of period | | $ 14.75 | | $ 13.91 | | $ 13.26 | | $ 10.86 | | $ 13.19 |
| Total ReturnA,B | | 7.63% | | 5.80% | | 23.77% | | (16.61)% | | (8.75)% |
| Ratios to Average Net AssetsE | | | | | | | | | | |
| Expenses before reductions | | 59% | | .60% | | .59% | | .59% | | .58% |
| Expenses net of fee waivers, if any | | 59% | | .60% | | .59% | | .59% | | .58% |
| Expenses net of all reductions | | 54% | | .60% | | .59% | | .58% | | .56% |
| Net investment income (loss) | | 97% | | 1.58% | | 1.02% | | 1.30% | | 1.34% |
| Supplemental Data | | | | | | | | | | |
| Net assets, end of period (000 omitted) | | $ 606,102 | | $ 704,460 | | $ 785,494 | | $ 638,124 | | $ 893,359 |
| Portfolio turnover rate | | 206% | | 23% | | 25% | | 43% | | 58% |
A Total returns do not reflect charges attributable to your insurance company’s separate account. Inclusion of these charges would reduce the total returns shown.
B Total returns would have been lower had certain expenses not been reduced during the periods shown.
C Calculated based on average shares outstanding during the period.
D Investment income per share reflects a special dividend which amounted to $.05 per share.
E Expense ratios reflect operating expenses of the class. Expenses before reductions do not reflect amounts reimbursed by the investment adviser or reductions from brokerage service arrangements or other expense offset arrangements and do
not represent the amount paid by the class during periods when reimbursements or reductions occur. Expenses net of fee waivers reflect expenses after reimbursement by the investment adviser but prior to reductions from brokerage service
arrangements or other expense offset arrangements. Expenses net of all reductions represent the net expenses paid by the class.
|
| Financial Highlights Service Class | | | | | | | | | | |
| Years ended December 31, | | 2005 | | 2004 | | 2003 | | 2002 | | 2001 |
| Selected Per Share Data | | | | | | | | | | |
| Net asset value, beginning of period | | $ 13.83 | | $ 13.18 | | $ 10.80 | | $ 13.12 | | $ 15.19 |
| Income from Investment Operations | | | | | | | | | | |
| Net investment income (loss)C | | 12 | | .19D | | .11 | | .14 | | .16 |
| Net realized and unrealized gain (loss) | | 91 | | .57 | | 2.40 | | (2.31) | | (1.44) |
| Total from investment operations | | 1.03 | | .76 | | 2.51 | | (2.17) | | (1.28) |
| Distributions from net investment income | | (.20) | | (.11) | | (.13) | | (.15) | | (.18) |
| Distributions from net realized gain | | — | | — | | — | | — | | (.61) |
| Total distributions | | (.20) | | (.11) | | (.13) | | (.15) | | (.79) |
| Net asset value, end of period | | $ 14.66 | | $ 13.83 | | $ 13.18 | | $ 10.80 | | $ 13.12 |
| Total ReturnA,B | | 7.53% | | 5.75% | | 23.60% | | (16.69)% | | (8.85)% |
| Ratios to Average Net AssetsE | | | | | | | | | | |
| Expenses before reductions | | 69% | | .70% | | .69% | | .69% | | .68% |
| Expenses net of fee waivers, if any | | 69% | | .70% | | .69% | | .69% | | .68% |
| Expenses net of all reductions | | 64% | | .70% | | .69% | | .68% | | .66% |
| Net investment income (loss) | | 87% | | 1.48% | | .92% | | 1.20% | | 1.24% |
| Supplemental Data | | | | | | | | | | |
| Net assets, end of period (000 omitted) | | $ 384,527 | | $ 401,392 | | $ 357,585 | | $ 250,160 | | $ 281,194 |
| Portfolio turnover rate | | 206% | | 23% | | 25% | | 43% | | 58% |
A Total returns do not reflect charges attributable to your insurance company’s separate account. Inclusion of these charges would reduce the total returns shown.
B Total returns would have been lower had certain expenses not been reduced during the periods shown.
C Calculated based on average shares outstanding during the period.
D Investment income per share reflects a special dividend which amounted to $.05 per share.
E Expense ratios reflect operating expenses of the class. Expenses before reductions do not reflect amounts reimbursed by the investment adviser or reductions from brokerage service arrangements or other expense offset arrangements and do
not represent the amount paid by the class during periods when reimbursements or reductions occur. Expenses net of fee waivers reflect expenses after reimbursement by the investment adviser but prior to reductions from brokerage service
arrangements or other expense offset arrangements. Expenses net of all reductions represent the net expenses paid by the class.
|
See accompanying notes which are an integral part of the financial statements.
| | |
| VIP Growth & Income Portfolio | | 80 |
| Financial Highlights Service Class 2 | | | | | | | | | | |
| Years ended December 31, | | 2005 | | 2004 | | 2003 | | 2002 | | 2001 |
| Selected Per Share Data | | | | | | | | | | |
| Net asset value, beginning of period | | $ 13.71 | | $ 13.09 | | $ 10.73 | | $ 13.07 | | $ 15.17 |
| Income from Investment Operations | | | | | | | | | | |
| Net investment income (loss)C | | 10 | | .17D | | .09 | | .12 | | .14 |
| Net realized and unrealized gain (loss) | | 90 | | .55 | | 2.39 | | (2.30) | | (1.44) |
| Total from investment operations | | 1.00 | | .72 | | 2.48 | | (2.18) | | (1.30) |
| Distributions from net investment income | | (.18) | | (.10) | | (.12) | | (.16) | | (.19) |
| Distributions from net realized gain | | — | | — | | — | | — | | (.61) |
| Total distributions | | (.18) | | (.10) | | (.12) | | (.16) | | (.80) |
| Net asset value, end of period | | $ 14.53 | | $ 13.71 | | $ 13.09 | | $ 10.73 | | $ 13.07 |
| Total ReturnA,B | | 7.40% | | 5.52% | | 23.44% | | (16.84)% | | (9.01)% |
| Ratios to Average Net AssetsE | | | | | | | | | | |
| Expenses before reductions | | 84% | | .85% | | .85% | | .85% | | .84% |
| Expenses net of fee waivers, if any | | 84% | | .85% | | .85% | | .85% | | .84% |
| Expenses net of all reductions | | 79% | | .85% | | .84% | | .84% | | .82% |
| Net investment income (loss) | | 70% | | 1.33% | | .76% | | 1.05% | | 1.08% |
| Supplemental Data | | | | | | | | | | |
| Net assets, end of period (000 omitted) | | $ 596,787 | | $ 525,504 | | $ 341,989 | | $ 140,890 | | $ 76,237 |
| Portfolio turnover rate | | 206% | | 23% | | 25% | | 43% | | 58% |
A Total returns do not reflect charges attributable to your insurance company’s separate account. Inclusion of these charges would reduce the total returns shown.
B Total returns would have been lower had certain expenses not been reduced during the periods shown.
C Calculated based on average shares outstanding during the period.
D Investment income per share reflects a special dividend which amounted to $.05 per share.
E Expense ratios reflect operating expenses of the class. Expenses before reductions do not reflect amounts reimbursed by the investment adviser or reductions from brokerage service arrangements or other expense offset arrangements and do
not represent the amount paid by the class during periods when reimbursements or reductions occur. Expenses net of fee waivers reflect expenses after reimbursement by the investment adviser but prior to reductions from brokerage service
arrangements or other expense offset arrangements. Expenses net of all reductions represent the net expenses paid by the class.
|
| Financial Highlights Investor Class | | |
| Year ended December 31, | | 2005F |
| Selected Per Share Data | | |
| Net asset value, beginning of period | | $ 13.64 |
| Income from Investment Operations | | |
| Net investment income (loss)E | | 03 |
| Net realized and unrealized gain (loss) | | 1.07 |
| Total from investment operations | | 1.10 |
| Net asset value, end of period | | $ 14.74 |
| Total ReturnB,C,D | | 8.06% |
| Ratios to Average Net AssetsG | | |
| Expenses before reductions | | 78%A |
| Expenses net of fee waivers, if any | | 78%A |
| Expenses net of all reductions | | 72%A |
| Net investment income (loss) | | 49%A |
| Supplemental Data | | |
| Net assets, end of period (000 omitted) | | $ 9,564 |
| Portfolio turnover rate | | 206% |
A Annualized
B Total returns for periods of less than one year are not annualized.
C Total returns do not reflect charges attributable to your insurance company’s separate account. Inclusion of these charges would reduce the total returns shown.
D Total returns would have been lower had certain expenses not been reduced during the periods shown.
E Calculated based on average shares outstanding during the period.
F For the period July 21, 2005 (commencement of sale of shares) to December 31, 2005.
G Expense ratios reflect operating expenses of the class. Expenses before reductions do not reflect amounts reimbursed by the investment adviser or reductions from brokerage service arrangements or other expense offset arrangements and do
not represent the amount paid by the class during periods when reimbursements or reductions occur. Expense ratios before reductions for start up periods may not be representative of longer term operating periods. Expenses net of fee waivers
reflect expenses after reimbursement by the investment adviser but prior to reductions from brokerage service arrangements or other expense offset arrangements. Expenses net of all reductions represent the net expenses paid by the class.
|
See accompanying notes which are an integral part of the financial statements.
|
81 Annual Report
VIP Growth Opportunities Portfolio
Performance: The Bottom Line
|
Average annual total return reflects the change in the value of an investment, assuming reinvestment of the class’ dividend income and capital gains (the profits earned upon the sale of securities that have grown in value) and assuming a constant rate of performance each year. During periods of reimbursement by Fidelity, a fund’s total return will be greater than it would be had the reimbursement not occurred. Performance numbers are net of all underlying fund operating expenses, but do not include any insurance charges imposed by your insurance company’s separate account. If performance information included the effect of these additional charges, the total returns would have been lower. How a fund did yesterday is no guarantee of how it will do tomorrow.
| Average Annual Total Returns | | | | | | |
| Periods ended December 31, 2005 | | Past 1 | | Past 5 | | Past 10 |
| | | year | | years | | years |
| VIP Growth Opportunities - Initial Class | | 8.89% | | 0.28% | | 5.32% |
| VIP Growth Opportunities - Service ClassA | | 8.86% | | 0.18% | | 5.24% |
| VIP Growth Opportunities - Service Class 2B | | 8.68% | | 0.02% | | 5.14% |
| VIP Growth Opportunities - Investor ClassC | | 8.83% | | 0.26% | | 5.31% |
A The initial offering of Service Class shares took place November 3, 1997. Performance for Service Class shares reflects an asset based service fee (12b 1 fee), and returns
prior to November 3, 1997 are those of Initial Class and do not include the effects of Service Class 12b 1 fee. Had Service Class shares’ 12b 1 fee been reflected, returns prior to
November 3, 1997 would have been lower.
B The initial offering of Service Class 2 shares took place January 12, 2000. Performance for Service Class 2 shares reflects an asset based service fee (12b 1 fee). Returns
from November 3, 1997 to January 12, 2000 are those of Service Class which reflect a different 12b 1 fee. Service Class 2 returns prior to November 3, 1997 are those of Initial
Class and do not include the effects of a 12b 1 fee. Had Service Class 2 shares’ 12b 1 fee been reflected, returns prior to January 12, 2000 would have been lower.
C The initial offering of Investor Class took place on July 21, 2005. Returns prior to July 21, 2005 are those of Initial Class. If Investor Class’s transfer agent fee had been
reflected, returns prior to July 21, 2005 would have been lower.
|
$10,000 Over 10 Years
Let’s say hypothetically that $10,000 was invested in VIP Growth Opportunities Portfolio Initial Class on December 31, 1995. The chart shows how the value of your investment would have changed, and also shows how the S&P 500® Index performed over the same period.
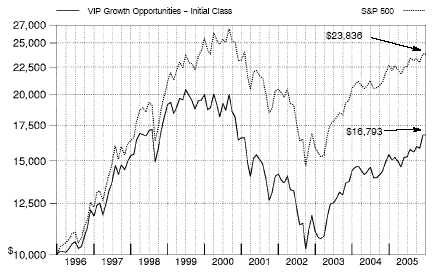
VIP Growth Opportunities Portfolio 82
VIP Growth Opportunities Portfolio
Management’s Discussion of Fund Performance
|
Comments from John Porter, who became Portfolio Manager of VIP Growth Opportunities Portfolio on September 19, 2005
U.S. equity benchmarks generally had positive results for the 12 months ending December 31, 2005, the third consecutive year that stocks finished in the black. Energy and utilities were the two best performing sectors, contributing greatly to the 4.91% gain of the Standard & Poor’s 500SM Index. Elsewhere, the NASDAQ Composite® Index returned 2.13%, while the Dow Jones Industrial AverageSM rose 1.72% . The U.S. economy did not decelerate as much as many had predicted, despite eight short term interest rate hikes, record high energy prices and the devastation caused by Hurricane Katrina. Meanwhile, corporate America notched its 14th consecutive quarter of double digit earnings gains through the third quarter of the year, an unprecedented streak in market history. From a style perspective, large cap stocks ended the six year reign of small caps by a narrow margin, but mid caps finished well ahead of both categories. The gap between growth and value stocks also was relatively narrow, with value gaining a slight edge.
During the past year, the fund beat both the LipperSM Variable Annuity Growth Funds Average, which gained 7.67%, and the S&P 500®. (For specific portfolio performance results, please refer to the performance section of this report.) Strong stock selection drove the fund’s significant outperformance relative to the index, led by technology stocks Google and Yahoo!, two large holdings that benefited from strong growth in Internet advertising. In consumer discretionary an area I added to considerably, along with technology retailer eBay contributed to returns when its core online auction business regained momentum. Sizable positions in energy services companies Halliburton and Schlumberger performed well in the high oil price environment, while some good picks in health care and consumer staples including insurer UnitedHealth Group and consumer products giant Gillette, which was acquired by Procter & Gamble also contributed. Procter & Gamble is no longer held in the fund. On the other hand, several technology hardware and equipment stocks detracted from relative performance, including Network Appliance and Juniper Networks. Canada based Research In Motion, the manufacturer of the BlackBerry wireless communications device, also was weak due to concerns that alleged patent violations might cause the product’s withdrawal from the U.S. market. Symantec, the desktop security software giant, stumbled in response to a merger announce ment with VERITAS that was poorly received by the market. Elsewhere, weak results in the industrials and consumer durables/apparel, as well as an underweighting in surging utilities stocks, also worked against the fund.
The views expressed in this statement reflect those of the portfolio manager only through the end of the period of the report as stated on the cover and do not necessarily represent the views of Fidelity or any other person in the Fidelity organization. Any such views are subject to change at any time based upon market or other conditions and Fidelity disclaims any responsibility to update such views. These views may not be relied on as invest ment advice and, because investment decisions for a Fidelity fund are based on numerous factors, may not be relied on as an indication of trading intent on behalf of any Fidelity fund.
83 83 Annual Report
| VIP Growth Opportunities Portfolio | | |
| Investment Changes | | |
| |
| |
| Top Ten Stocks as of December 31, 2005 |
| | | % of fund’s | | % of fund’s net assets |
| | | net assets | | 6 months ago |
| Google, Inc. Class A (sub. vtg.) | | 8.4 | | 1.1 |
| eBay, Inc. | | 5.8 | | 0.0 |
| Yahoo!, Inc. | | 5.4 | | 1.2 |
| UnitedHealth Group, Inc. | | 4.8 | | 1.3 |
| Sprint Nextel Corp. | | 3.7 | | 0.0 |
| Halliburton Co. | | 2.7 | | 1.4 |
| General Electric Co. | | 2.6 | | 4.7 |
| KB Home | | 2.5 | | 0.0 |
| D.R. Horton, Inc. | | 2.0 | | 0.0 |
| Research In Motion Ltd. | | 1.5 | | 0.0 |
| | | 39.4 | | |
| Top Five Market Sectors as of December 31, 2005 |
| | | % of fund’s | | % of fund’s net assets |
| | | net assets | | 6 months ago |
| Information Technology | | 30.0 | | 20.1 |
| Consumer Discretionary | | 26.0 | | 15.9 |
| Health Care | | 12.7 | | 12.5 |
| Energy | | 10.1 | | 7.9 |
| Financials | | 8.8 | | 14.1 |
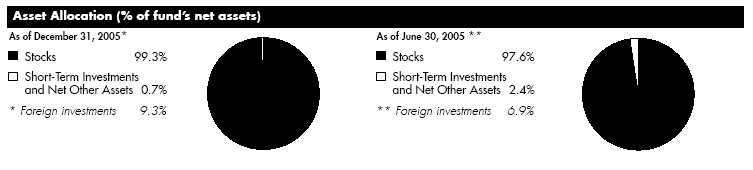
VIP Growth Opportunities Portfolio 84
| VIP Growth Opportunities Portfolio | | | | | | |
| Investments December 31, 2005 | | | | |
| Showing Percentage of Net Assets | | | | | | |
| |
| Common Stocks 99.3% | | | | | | |
| | | | | | | Shares | | Value (Note 1) |
| |
| CONSUMER DISCRETIONARY 26.0% | | | | | | |
| Diversified Consumer Services 0.1% | | | | | | |
| Apollo Group, Inc. Class A (a) | | | | | | 7,000 | | $ 423,220 |
| Hotels, Restaurants & Leisure 2.6% | | | | | | |
| Carnival Corp. unit | | | | | | 24,800 | | 1,326,056 |
| Harrah’s Entertainment, Inc. | | | | | | 10,600 | | 755,674 |
| Hilton Hotels Corp. | | | | | | 23,770 | | 573,095 |
| Las Vegas Sands Corp. | | | | | | 176,900 | | 6,982,243 |
| Sportingbet PLC | | | | | | 209,200 | | 1,237,109 |
| Starbucks Corp. (a) | | | | | | 21,400 | | 642,214 |
| Starwood Hotels & Resorts Worldwide, Inc. unit | | | | 28,800 | | 1,839,168 |
| Wynn Resorts Ltd. (a) | | | | | | 67,800 | | 3,718,830 |
| | | | | | | | | 17,074,389 |
| Household Durables 7.3% | | | | | | | | |
| D.R. Horton, Inc. | | | | | | 380,533 | | 13,596,444 |
| Garmin Ltd. (d) | | | | | | 25,200 | | 1,672,020 |
| Harman International Industries, Inc. | | | | 27,700 | | 2,710,445 |
| KB Home | | | | | | 230,000 | | 16,711,800 |
| Lennar Corp. Class A | | | | | | 14,300 | | 872,586 |
| Pulte Homes, Inc. | | | | | | 145,100 | | 5,711,136 |
| Ryland Group, Inc. | | | | | | 24,900 | | 1,796,037 |
| Toll Brothers, Inc. (a) | | | | | | 160,900 | | 5,573,576 |
| | | | | | | | | 48,644,044 |
| Internet & Catalog Retail 5.8% | | | | | | |
| eBay, Inc. (a)(d) | | | | | | 895,000 | | 38,708,750 |
| Overstock.com, Inc. (a) | | | | | | 7,200 | | 202,680 |
| Submarino SA | | | | | | 2,900 | | 51,705 |
| | | | | | | | | 38,963,135 |
| Media 5.2% | | | | | | | | |
| Central European Media Enterprises Ltd. Class A (a) | | | | 3,500 | | 202,650 |
| Getty Images, Inc. (a) | | | | | | 500 | | 44,635 |
| Lamar Advertising Co. Class A (a) | | | | 7,100 | | 327,594 |
| McGraw Hill Companies, Inc. | | | | | | 40,366 | | 2,084,097 |
| Omnicom Group, Inc. | | | | | | 74,600 | | 6,350,698 |
| Time Warner, Inc. | | | | | | 432,000 | | 7,534,080 |
| Univision Communications, Inc. | | | | | | | | |
| Class A (a) | | | | | | 276,800 | | 8,135,152 |
| Walt Disney Co. | | | | | | 277,000 | | 6,639,690 |
| XM Satellite Radio Holdings, Inc. | | | | | | |
| Class A (a) | | | | | | 127,400 | | 3,475,472 |
| | | | | | | | | 34,794,068 |
| Multiline Retail – 0.7% | | | | | | | | |
| Federated Department Stores, Inc. | | | | 10,900 | | 722,997 |
| Nordstrom, Inc. | | | | | | 28,100 | | 1,050,940 |
| Sears Holdings Corp. (a) | | | | | | 15,400 | | 1,779,162 |
| Target Corp. | | | | | | 22,300 | | 1,225,831 |
| | | | | | | | | 4,778,930 |
| |
| |
| | | | | | | Shares | | Value (Note 1) |
| Specialty Retail 4.2% | | | | | | | | |
| Bed Bath & Beyond, Inc. (a) | | | | | | 10,800 | | $ 390,420 |
See accompanying notes which are an integral part of the financial statements.
| | | | |
| | | | | 85 | | | | Annual Report |
85
| VIP Growth Opportunities Portfolio | | | | |
| Investments - continued | | | | |
| |
| |
| | Shares | | Value (Note 1) |
| | | | |
| | | | |
| Best Buy Co., Inc. | | 171,000 | | 7,435,080 |
| Chico’s FAS, Inc. (a) | | 88,800 | | 3,900,984 |
| Circuit City Stores, Inc. | | 251,300 | | 5,676,867 |
| Dick’s Sporting Goods, Inc. (a)(d) | | 10,700 | | 355,668 |
| Gamestop Corp. Class B (a) | | 21,600 | | 624,240 |
| Home Depot, Inc. | | 22,700 | | 918,896 |
| Lowe’s Companies, Inc. | | 12,100 | | 806,586 |
| Staples, Inc. | | 166,195 | | 3,774,288 |
| Urban Outfitters, Inc. (a) | | 125,000 | | 3,163,750 |
| Zumiez, Inc. | | 15,123 | | 653,616 |
| | | | | 27,700,395 |
| Textiles, Apparel & Luxury Goods 0.1% | | | | |
| Coach, Inc. (a) | | 28,000 | | 933,520 |
| Under Armour, Inc. Class A | | 600 | | 22,986 |
| | | | | 956,506 |
| |
| TOTAL CONSUMER DISCRETIONARY | | | | 173,334,687 |
| |
| CONSUMER STAPLES 2.0% | | | | |
| Food & Staples Retailing – 0.5% | | | | |
| CVS Corp. | | 69,500 | | 1,836,190 |
| Wal Mart Stores, Inc. | | 19,210 | | 899,028 |
| Walgreen Co. | | 14,000 | | 619,640 |
| | | | | 3,354,858 |
| Food Products – 0.2% | | | | |
| Nestle SA sponsored ADR | | 13,900 | | 1,039,025 |
| Tobacco – 1.3% | | | | |
| Altria Group, Inc. | | 118,720 | | 8,870,758 |
| |
| TOTAL CONSUMER STAPLES | | | | 13,264,641 |
| |
| ENERGY 10.1% | | | | |
| Energy Equipment & Services – 6.8% | | | | |
| Baker Hughes, Inc. | | 107,600 | | 6,539,928 |
| BJ Services Co. | | 128,500 | | 4,712,095 |
| GlobalSantaFe Corp. | | 14,000 | | 674,100 |
| Grant Prideco, Inc. (a) | | 14,200 | | 626,504 |
| Halliburton Co. | | 296,700 | | 18,383,532 |
| National Oilwell Varco, Inc. (a) | | 28,900 | | 1,812,030 |
| Schlumberger Ltd. (NY Shares) | | 103,800 | | 10,084,170 |
| Transocean, Inc. (a) | | 39,000 | | 2,717,910 |
| | | | | 45,550,269 |
| Oil, Gas & Consumable Fuels 3.3% | | | | |
| Amerada Hess Corp. | | 2,800 | | 355,096 |
| Anadarko Petroleum Corp | | 7,000 | | 663,250 |
| Apache Corp. | | 13,900 | | 952,428 |
| BP PLC sponsored ADR | | 17,690 | | 1,136,052 |
| Burlington Resources, Inc. | | 11,500 | | 991,300 |
| ConocoPhillips | | 21,600 | | 1,256,688 |
| EnCana Corp. | | 21,500 | | 972,036 |
| Exxon Mobil Corp. | | 140,000 | | 7,863,800 |
See accompanying notes which are an integral part of the financial statements.
| | |
| VIP Growth Opportunities Portfolio | | 86 |
| Common Stocks continued | | | | |
| | | Shares | | Value (Note 1) |
| |
| ENERGY – continued | | | | |
| Oil, Gas & Consumable Fuels – continued | | | | |
| Plains Exploration & Production Co. (a) | | 27,800 | | $ 1,104,494 |
| Total SA sponsored ADR | | 7,000 | | 884,800 |
| Valero Energy Corp. | | 107,800 | | 5,562,480 |
| | | | | 21,742,424 |
| |
| TOTAL ENERGY | | | | 67,292,693 |
| |
| FINANCIALS – 8.8% | | | | |
| Capital Markets 3.0% | | | | |
| Ameritrade Holding Corp. | | 164,210 | | 3,941,040 |
| Calamos Asset Management, Inc. | | | | |
| Class A | | 14,000 | | 440,300 |
| Charles Schwab Corp. | | 34,900 | | 511,983 |
| E*TRADE Financial Corp. (a) | | 97,600 | | 2,035,936 |
| Federated Investors, Inc. Class B (non vtg.) | | 13,900 | | 514,856 |
| Goldman Sachs Group, Inc. | | 16,100 | | 2,056,131 |
| Lazard Ltd. Class A | | 49,200 | | 1,569,480 |
| Legg Mason, Inc. | | 3,600 | | 430,884 |
| Merrill Lynch & Co., Inc. | | 103,200 | | 6,989,736 |
| optionsXpress Holdings, Inc. | | 14,400 | | 353,520 |
| UBS AG (NY Shares) | | 12,600 | | 1,198,890 |
| | | | | 20,042,756 |
| Commercial Banks – 1.0% | | | | |
| Bank of America Corp. | | 65,200 | | 3,008,980 |
| Standard Chartered PLC (United Kingdom) | | 34,900 | | 778,063 |
| Wachovia Corp. | | 26,800 | | 1,416,648 |
| Wells Fargo & Co. | | 27,300 | | 1,715,259 |
| | | | | 6,918,950 |
| Consumer Finance – 0.4% | | | | |
| American Express Co. | | 58,500 | | 3,010,410 |
| Diversified Financial Services – 0.7% | | | | |
| IntercontinentalExchange, Inc. | | 33,350 | | 1,212,273 |
| JPMorgan Chase & Co. | | 27,900 | | 1,107,351 |
| NETeller PLC (a) | | 179,848 | | 2,275,687 |
| | | | | 4,595,311 |
| Insurance – 3.3% | | | | |
| ACE Ltd. | | 86,930 | | 4,645,539 |
| AFLAC, Inc. | | 64,800 | | 3,008,016 |
| American International Group, Inc. | | 108,662 | | 7,414,008 |
| Aspen Insurance Holdings Ltd. | | 50,800 | | 1,202,436 |
| Axis Capital Holdings Ltd. | | 22,300 | | 697,544 |
| Genworth Financial, Inc. Class A (non vtg.) | | 115,200 | | 3,983,616 |
| Montpelier Re Holdings Ltd. | | 49,100 | | 927,990 |
| | | | | 21,879,149 |
| Thrifts & Mortgage Finance – 0.4% | | | | |
| Countrywide Financial Corp. | | 35,600 | | 1,217,164 |
See accompanying notes which are an integral part of the financial statements.
|
87 Annual Report
87
| VIP Growth Opportunities Portfolio | | | | |
| Investments - continued | | | | |
| |
| |
| |
| | | | | Shares | | Value (Note 1) |
| Fannie Mae | | | | 4,900 | | $ 239,169 |
| Golden West Financial Corp., Delaware | | 13,900 | | 917,400 |
| | | | | | | 2,373,733 |
| |
| TOTAL FINANCIALS | | | | | | 58,820,309 |
| |
| HEALTH CARE 12.7% | | | | | | |
| Biotechnology – 1.5% | | | | | | |
| Amgen, Inc. (a) | | | | 34,200 | | 2,697,012 |
| Genentech, Inc. (a) | | | | 34,500 | | 3,191,250 |
| Gilead Sciences, Inc. (a) | | | | 42,600 | | 2,242,038 |
| ImClone Systems, Inc. (a) | | | | 14,379 | | 492,337 |
| MedImmune, Inc. (a) | | | | 28,500 | | 998,070 |
| | | | | | | 9,620,707 |
| Health Care Equipment & Supplies 2.2% | | | | |
| Alcon, Inc. | | | | 15,900 | | 2,060,640 |
| Becton, Dickinson & Co. | | | | 81,000 | | 4,866,480 |
| C.R. Bard, Inc. | | | | 100,800 | | 6,644,736 |
| Foxhollow Technologies, Inc. (a) | | | | 100 | | 2,979 |
| Kinetic Concepts, Inc. (a) | | | | 32,400 | | 1,288,224 |
| | | | | | | 14,863,059 |
| Health Care Providers & Services 5.4% | | | | |
| Aetna, Inc. | | | | 7,000 | | 660,170 |
| UnitedHealth Group, Inc. | | | | 510,800 | | 31,741,112 |
| WebMD Health Corp. Class A | | | | 4,400 | | 127,820 |
| WellPoint, Inc. (a) | | | | 41,100 | | 3,279,369 |
| | | | | | | 35,808,471 |
| Pharmaceuticals 3.6% | | | | | | |
| Allergan, Inc. | | | | 28,600 | | 3,087,656 |
| Johnson & Johnson | | | | 65,900 | | 3,960,590 |
| Novartis AG sponsored ADR | | | | 32,600 | | 1,710,848 |
| Pfizer, Inc. | | | | 298,693 | | 6,965,521 |
| Roche Holding AG (participation certificate) | | 14,405 | | 2,162,943 |
| Sepracor, Inc. (a) | | | | 36,000 | | 1,857,600 |
| Wyeth | | | | 94,700 | | 4,362,829 |
| | | | | | | 24,107,987 |
| |
| TOTAL HEALTH CARE | | | | | | 84,400,224 |
| |
| INDUSTRIALS – 4.6% | | | | | | |
| Aerospace & Defense – 0.2% | | | | | | |
| Honeywell International, Inc. | | | | 41,600 | | 1,549,600 |
| Air Freight & Logistics – 0.3% | | | | | | |
| FedEx Corp. | | | | 18,700 | | 1,933,393 |
| Commercial Services & Supplies 0.3% | | | | |
| Robert Half International, Inc. | | | | 45,760 | | 1,733,846 |
| Construction & Engineering – 0.7% | | | | |
| Fluor Corp. | | | | 59,500 | | 4,596,970 |
See accompanying notes which are an integral part of the financial statements.
| | |
| VIP Growth Opportunities Portfolio | | 88 |
| Common Stocks continued | | | | | | |
| | | | | Shares | | Value (Note 1) |
| |
| INDUSTRIALS – continued | | | | | | |
| Electrical Equipment 0.3% | | | | | | |
| ABB Ltd. sponsored ADR (a) | | | | 144,000 | | $ 1,399,680 |
| Rockwell Automation, Inc. | | | | 7,100 | | 420,036 |
| | | | | | | 1,819,716 |
| Industrial Conglomerates 2.6% | | | | | | |
| General Electric Co. | | | | 501,350 | | 17,572,318 |
| Road & Rail 0.2% | | | | | | |
| Burlington Northern Santa Fe Corp. | | | | 10,700 | | 757,774 |
| Laidlaw International, Inc. | | | | 34,800 | | 808,404 |
| | | | | | | 1,566,178 |
| |
| TOTAL INDUSTRIALS | | | | | | 30,772,021 |
| |
| INFORMATION TECHNOLOGY 30.0% | | | | | | |
| Communications Equipment – 5.4% | | | | | | |
| F5 Networks, Inc. (a) | | | | 29,700 | | 1,698,543 |
| Juniper Networks, Inc. (a) | | | | 327,650 | | 7,306,595 |
| Motorola, Inc. | | | | 148,600 | | 3,356,874 |
| Nokia Corp. sponsored ADR | | | | 235,400 | | 4,307,820 |
| QUALCOMM, Inc. | | | | 212,800 | | 9,167,424 |
| Research In Motion Ltd. (a) | | | | 156,800 | | 10,351,727 |
| | | | | | | 36,188,983 |
| Computers & Peripherals 2.6% | | | | | | |
| Apple Computer, Inc. (a) | | | | 104,500 | | 7,512,505 |
| Dell, Inc. (a) | | | | 24,800 | | 743,752 |
| EMC Corp. (a) | | | | 271,700 | | 3,700,554 |
| Network Appliance, Inc. (a) | | | | 205,700 | | 5,553,900 |
| | | | | | | 17,510,711 |
| Electronic Equipment & Instruments – 0.1% | | | | | | |
| Cogent, Inc. (a) | | | | 28,800 | | 653,184 |
| Sunpower Corp. Class A | | | | 500 | | 16,995 |
| | | | | | | 670,179 |
| Internet Software & Services 14.7% | | | | | | |
| Google, Inc. Class A (sub. vtg.) (a) | | | | 133,800 | | 55,508,266 |
| NetEase.com, Inc. sponsored ADR (a)(d) | | | | 14,200 | | 797,472 |
| Yahoo! Japan Corp | | | | 3,595 | | 5,457,827 |
| Yahoo!, Inc. (a) | | | | 920,800 | | 36,076,944 |
| | | | | | | 97,840,509 |
| IT Services 1.3% | | | | | | |
| First Data Corp. | | | | 205,100 | | 8,821,351 |
| Semiconductors & Semiconductor Equipment – 3.1% | | | | | | |
| Altera Corp. (a) | | | | 69,700 | | 1,291,541 |
| Analog Devices, Inc. | | | | 103,000 | | 3,694,610 |
| Freescale Semiconductor, Inc. Class B (a) | | | | 96,286 | | 2,423,519 |
| Intel Corp. | | | | 128,810 | | 3,215,098 |
| Linear Technology Corp. | | | | 27,900 | | 1,006,353 |
| Marvell Technology Group Ltd. (a) | | | | 49,900 | | 2,798,891 |
| National Semiconductor Corp. | | | | 138,500 | | 3,598,230 |
| |
| |
| |
See accompanying notes which are an integral part of the financial statements.
| | | | | | |
| | | 89 | | | | Annual Report |
| VIP Growth Opportunities Portfolio | | | | |
| Investments - continued | | | | |
| |
| |
| |
| | | Shares | | Value (Note 1) |
| NVIDIA Corp. (a) | | 14,000 | | $ 511,840 |
| Texas Instruments, Inc. | | 59,100 | | 1,895,337 |
| | | | | 20,435,419 |
| Software 2.8% | | | | |
| Activision, Inc. (a) | | 405,466 | | 5,571,103 |
| Autodesk, Inc. (a) | | 42,800 | | 1,838,260 |
| Microsoft Corp. | | 113,400 | | 2,965,410 |
| Symantec Corp. (a) | | 455,778 | | 7,976,115 |
| | | | | 18,350,888 |
| |
| TOTAL INFORMATION TECHNOLOGY | | | | 199,818,040 |
| |
| MATERIALS 1.1% | | | | |
| Chemicals 1.1% | | | | |
| Monsanto Co. | | 15,200 | | 1,178,456 |
| Praxair, Inc. | | 120,400 | | 6,376,384 |
| | | | | 7,554,840 |
| |
| TELECOMMUNICATION SERVICES 3.8% | | | | |
| Wireless Telecommunication Services – 3.8% | | | | |
| American Tower Corp. Class A (a) | | 14,400 | | 390,240 |
| Crown Castle International Corp. (a) | | 10,800 | | 290,628 |
| SBA Communications Corp. Class A (a) | | 14,400 | | 257,760 |
| Sprint Nextel Corp. | | 1,045,500 | | 24,422,880 |
| | | | | 25,361,508 |
| |
| UTILITIES 0.2% | | | | |
| Electric Utilities – 0.2% | | | | |
| Exelon Corp. | | 21,600 | | 1,147,824 |
| TOTAL COMMON STOCKS | | | | |
| (Cost $530,373,135) | | | | 661,766,787 |
| |
| Money Market Funds 5.1% | | | | |
| |
| Fidelity Cash Central Fund, 4.28% (b) | | 1,999,525 | | 1,999,525 |
| Fidelity Securities Lending Cash Central Fund, 4.35% (b)(c) | | 31,810,925 | | 31,810,925 |
| TOTAL MONEY MARKET FUNDS | | | | |
| (Cost $33,810,450) | | | | 33,810,450 |
| |
| TOTAL INVESTMENT PORTFOLIO 104.4% | | | | |
| (Cost $564,183,585) | | | | 695,577,237 |
| |
| NET OTHER ASSETS (4.4)% | | | | (29,376,864) |
| NET ASSETS 100% | | | | $ 666,200,373 |
See accompanying notes which are an integral part of the financial statements.
| | |
| VIP Growth Opportunities Portfolio | | 90 |
Legend
(a) Non-income producing
(b) Affiliated fund that is available only to investment companies and other accounts managed by Fidelity Investments. The rate quoted is the annualized seven-day
yield of the fund at period end. A complete unaudited listing of the fund’s holdings as of its most recent quarter end is available upon request.
(c) Investment made with cash collateral received from securities on loan.
(d) Security or a portion of the security is on loan at period end.
|
Affiliated Central Funds
Information regarding income received by the fund from the affiliated Central funds during the period is as follows:
| Fund | | Income received |
| Fidelity Cash Central Fund | | $ 453,920 |
| Fidelity Securities Lending Cash Central Fund | | 628,062 |
| Total | | $ 1,081,982 |
Income Tax Information
At December 31, 2005, the fund had a capital loss carryforward of approximately $190,130,062 of which $74,515,185 and $115,614,877 will expire on December 31, 2009 and 2010, respectively.
See accompanying notes which are an integral part of the financial statements.
91 Annual Report
| VIP Growth Opportunities Portfolio | | | | | | |
| |
| Financial Statements | | | | | | |
| |
| |
| Statement of Assets and Liabilities | | | | | | |
| | | December 31, 2005 |
| |
| Assets | | | | | | |
| Investment in securities, at value (including securities loaned of $30,759,741) — See accompanying schedule: | | | | | | |
| Unaffiliated issuers (cost $530,373,135) | | $ 661,766,787 | | | | |
| Affiliated Central Funds (cost $33,810,450) | | 33,810,450 | | | | |
| Total Investments (cost $564,183,585) | | | | $ | | 695,577,237 |
| Receivable for investments sold | | | | | | 5,628,507 |
| Receivable for fund shares sold | | | | | | 178,830 |
| Dividends receivable | | | | | | 519,089 |
| Interest receivable | | | | | | 10,985 |
| Prepaid expenses | | | | | | 3,304 |
| Other receivables | | | | | | 123,007 |
| Total assets | | | | | | 702,040,959 |
| |
| Liabilities | | | | | | |
| Payable for investments purchased | | $ 2,245,216 | | | | |
| Payable for fund shares redeemed | | 1,321,444 | | | | |
| Accrued management fee | | 323,772 | | | | |
| Distribution fees payable | | 29,848 | | | | |
| Other affiliated payables | | 59,392 | | | | |
| Other payables and accrued expenses | | 49,989 | | | | |
| Collateral on securities loaned, at value | | 31,810,925 | | | | |
| Total liabilities | | | | | | 35,840,586 |
| |
| Net Assets | | | | $ | | 666,200,373 |
| Net Assets consist of: | | | | | | |
| Paid in capital | | | | $ | | 721,658,994 |
| Undistributed net investment income | | | | | | 3,933,365 |
| Accumulated undistributed net realized gain (loss) on investments and foreign currency transactions | | | | | | (190,785,581) |
| Net unrealized appreciation (depreciation) on investments and assets and liabilities in foreign currencies | | | | | | 131,393,595 |
| Net Assets | | | | $ | | 666,200,373 |
| |
| Statement of Assets and Liabilities continued | | | | | | |
| | | December 31, 2005 |
| |
| Initial Class: | | | | | | |
| Net Asset Value, offering price | | | | | | |
| and redemption price | | | | | | |
| per share ($400,643,585 ÷ 23,102,952 shares) | | | | $ | | 17.34 |
| Service Class: | | | | | | |
| Net Asset Value, offering price | | | | | | |
| and redemption price | | | | | | |
| per share ($200,797,838 ÷ 11,589,782 shares) | | | | $ | | 17.33 |
| Service Class 2: | | | | | | |
| Net Asset Value, offering price | | | | | | |
| and redemption price | | | | | | |
| per share ($60,405,723 ÷ 3,506,828 shares) | | | | $ | | 17.23 |
| Investor Class: | | | | | | |
| Net Asset Value, offering price | | | | | | |
| and redemption price per share ($4,353,227 ÷ 251,224 shares) | | | | $ | | 17.33 |
See accompanying notes which are an integral part of the financial statements.
| | |
| VIP Growth Opportunities Portfolio | | 92 |
| Statement of Operations | | | | | | | | |
| | | | | Year ended December 31, 2005 |
| |
| Investment Income | | | | | | | | |
| Dividends | | | | | | $ | | 7,672,433 |
| Interest | | | | | | | | 477 |
| Income from affiliated Central Funds (including $628,062 from security lending) | | | | | | | | 1,081,982 |
| Total income | | | | | | | | 8,754,892 |
| |
| Expenses | | | | | | | | |
| Management fee | | | | $ 3,860,769 | | | | |
| Transfer agent fees | | | | 471,061 | | | | |
| Distribution fees | | | | 339,034 | | | | |
| Accounting and security lending fees | | | | 259,528 | | | | |
| Independent trustees’ compensation | | | | 3,043 | | | | |
| Custodian fees and expenses | | | | 31,916 | | | | |
| Audit | | | | 46,589 | | | | |
| Legal | | | | 3,635 | | | | |
| Miscellaneous | | | | 52,393 | | | | |
| Total expenses before reductions | | | | 5,067,968 | | | | |
| Expense reductions | | | | (313,468) | | | | 4,754,500 |
| |
| Net investment income (loss) | | | | | | | | 4,000,392 |
| Realized and Unrealized Gain (Loss) | | | | | | | | |
| Net realized gain (loss) on: | | | | | | | | |
| Investment securities: | | | | | | | | |
| Unaffiliated issuers | | | | 76,610,223 | | | | |
| Foreign currency transactions | | | | 8,727 | | | | |
| Total net realized gain (loss) | | | | | | | | 76,618,950 |
| Change in net unrealized appreciation (depreciation) on: | | | | | | | | |
| Investment securities | | | | (25,503,259) | | | | |
| Assets and liabilities in foreign currencies | | | | (57) | | | | |
| Total change in net unrealized appreciation (depreciation) | | | | | | | | (25,503,316) |
| Net gain (loss) | | | | | | | | 51,115,634 |
| Net increase (decrease) in net assets resulting from operations | | | | | | $ | | 55,116,026 |
| |
| Statement of Changes in Net Assets | | | | | | | | |
| | | | | Year ended | | | | Year ended |
| | | | | December 31, | | | | December 31, |
| | | | | 2005 | | | | 2004 |
| Increase (Decrease) in Net Assets | | | | | | | | |
| Operations | | | | | | | | |
| Net investment income (loss) | | | | $ 4,000,392 | | $ | | 6,314,997 |
| Net realized gain (loss) | | | | 76,618,950 | | | | 14,949,483 |
| Change in net unrealized appreciation (depreciation) | | | | (25,503,316) | | | | 26,748,507 |
| Net increase (decrease) in net assets resulting from operations | | | | 55,116,026 | | | | 48,012,987 |
| Distributions to shareholders from net investment income | | | | (6,184,820) | | | | (3,865,122) |
| Share transactions - net increase (decrease) | | | | (116,534,058) | | | | (85,843,295) |
| Total increase (decrease) in net assets | | | | (67,602,852) | | | | (41,695,430) |
| |
| Net Assets | | | | | | | | |
| Beginning of period | | | | 733,803,225 | | | | 775,498,655 |
| End of period (including undistributed net investment income of $3,933,365 and undistributed net investment income of | | | | | | |
| $6,108,550, respectively) | | | | $ 666,200,373 | | $ | | 733,803,225 |
| |
| |
| |
| |
| See accompanying notes which are an integral part of the financial statements. | | | | | | | | |
| |
| 93 | | | | | | Annual Report |
| Financial Highlights Initial Class | | | | | | | | | | |
| Years ended December 31, | | 2005 | | 2004 | | 2003 | | 2002 | | 2001 |
| Selected Per Share Data | | | | | | | | | | |
| Net asset value, beginning of period | | $ 16.07 | | $ 15.07 | | $ 11.71 | | $ 15.13 | | $ 17.74 |
| Income from Investment Operations | | | | | | | | | | |
| Net investment income (loss)C | | 10 | | .14D | | .08 | | .09 | | .12 |
| Net realized and unrealized gain (loss) | | 1.32 | | .94 | | 3.38 | | (3.37) | | (2.67) |
| Total from investment operations | | 1.42 | | 1.08 | | 3.46 | | (3.28) | | (2.55) |
| Distributions from net investment income | | (.15) | | (.08) | | (.10) | | (.14) | | (.06) |
| Net asset value, end of period | | $ 17.34 | | $ 16.07 | | $ 15.07 | | $ 11.71 | | $ 15.13 |
| Total ReturnA,B | | 8.89% | | 7.19% | | 29.87% | | (21.84)% | | (14.42)% |
| Ratios to Average Net AssetsE | | | | | | | | | | |
| Expenses before reductions | | 70% | | .72% | | .72% | | .70% | | .69% |
| Expenses net of fee waivers, if any | | 70% | | .72% | | .72% | | .70% | | .69% |
| Expenses net of all reductions | | 65% | | .70% | | .70% | | .66% | | .67% |
| Net investment income (loss) | | 65% | | .91% | | .64% | | .68% | | .79% |
| Supplemental Data | | | | | | | | | | |
| Net assets, end of period (000 omitted) | | $ 400,644 | | $ 459,975 | | $ 490,710 | | $ 403,476 | | $ 652,493 |
| Portfolio turnover rate | | 123% | | 65% | | 62% | | 60% | | 89% |
A Total returns do not reflect charges attributable to your insurance company’s separate account. Inclusion of these charges would reduce the total returns shown.
B Total returns would have been lower had certain expenses not been reduced during the periods shown.
C Calculated based on average shares outstanding during the period.
D Investment income per share reflects a special dividend which amounted to $.04 per share.
E Expense ratios reflect operating expenses of the class. Expenses before reductions do not reflect amounts reimbursed by the investment adviser or reductions from brokerage service arrangements or other expense offset arrangements and do not
represent the amount paid by the class during periods when reimbursements or reductions occur. Expenses net of fee waivers reflect expenses after reimbursement by the investment adviser but prior to reductions from brokerage service arrange
ments or other expense offset arrangements. Expenses net of all reductions represent the net expenses paid by the class.
|
| Financial Highlights Service Class | | | | | | | | | | |
| Years ended December 31, | | 2005 | | 2004 | | 2003 | | 2002 | | 2001 |
| Selected Per Share Data | | | | | | | | | | |
| Net asset value, beginning of period | | $ 16.05 | | $ 15.06 | | $ 11.70 | | $ 15.11 | | $ 17.71 |
| Income from Investment Operations | | | | | | | | | | |
| Net investment income (loss)C | | 09 | | .12D | | .07 | | .08 | | .11 |
| Net realized and unrealized gain (loss) | | 1.32 | | .94 | | 3.37 | | (3.37) | | (2.67) |
| Total from investment operations | | 1.41 | | 1.06 | | 3.44 | | (3.29) | | (2.56) |
| Distributions from net investment income | | (.13) | | (.07) | | (.08) | | (.12) | | (.04) |
| Net asset value, end of period | | $ 17.33 | | $ 16.05 | | $ 15.06 | | $ 11.70 | | $ 15.11 |
| Total ReturnA,B | | 8.86% | | 7.06% | | 29.66% | | (21.92)% | | (14.49)% |
| Ratios to Average Net AssetsE | | | | | | | | | | |
| Expenses before reductions | | 80% | | .82% | | .82% | | .80% | | .79% |
| Expenses net of fee waivers, if any | | 80% | | .82% | | .82% | | .80% | | .79% |
| Expenses net of all reductions | | 75% | | .80% | | .80% | | .77% | | .77% |
| Net investment income (loss) | | 54% | | .81% | | .54% | | .58% | | .69% |
| Supplemental Data | | | | | | | | | | |
| Net assets, end of period (000 omitted) | | $ 200,798 | | $ 212,890 | | $ 224,660 | | $ 188,318 | | $ 278,446 |
| Portfolio turnover rate | | 123% | | 65% | | 62% | | 60% | | 89% |
A Total returns do not reflect charges attributable to your insurance company’s separate account. Inclusion of these charges would reduce the total returns shown.
B Total returns would have been lower had certain expenses not been reduced during the periods shown.
C Calculated based on average shares outstanding during the period.
D Investment income per share reflects a special dividend which amounted to $.04 per share.
E Expense ratios reflect operating expenses of the class. Expenses before reductions do not reflect amounts reimbursed by the investment adviser or reductions from brokerage service arrangements or other expense offset arrangements and do not
represent the amount paid by the class during periods when reimbursements or reductions occur. Expenses net of fee waivers reflect expenses after reimbursement by the investment adviser but prior to reductions from brokerage service arrange
ments or other expense offset arrangements. Expenses net of all reductions represent the net expenses paid by the class.
|
See accompanying notes which are an integral part of the financial statements.
| | |
| VIP Growth Opportunities Portfolio | | 94 |
| Financial Highlights Service Class 2 | | | | | | | | | | |
| Years ended December 31, | | 2005 | | 2004 | | 2003 | | 2002 | | 2001 |
| Selected Per Share Data | | | | | | | | | | |
| Net asset value, beginning of period | | $ 15.96 | | $ 14.98 | | $ 11.64 | | $ 15.04 | | $ 17.68 |
| Income from Investment Operations | | | | | | | | | | |
| Net investment income (loss)C | | 06 | | .10D | | .05 | | .05 | | .08 |
| Net realized and unrealized gain (loss) | | 1.32 | | .93 | | 3.35 | | (3.34) | | (2.66) |
| Total from investment operations | | 1.38 | | 1.03 | | 3.40 | | (3.29) | | (2.58) |
| Distributions from net investment income | | (.11) | | (.05) | | (.06) | | (.11) | | (.06) |
| Net asset value, end of period | | $ 17.23 | | $ 15.96 | | $ 14.98 | | $ 11.64 | | $ 15.04 |
| Total ReturnA,B | | 8.68% | | 6.89% | | 29.40% | | (22.01)% | | (14.64)% |
| Ratios to Average Net AssetsE | | | | | | | | | | |
| Expenses before reductions | | 96% | | .98% | | .99% | | .97% | | .95% |
| Expenses net of fee waivers, if any | | 96% | | .98% | | .99% | | .97% | | .95% |
| Expenses net of all reductions | | 92% | | .96% | | .96% | | .94% | | .93% |
| Net investment income (loss) | | 38% | | .65% | | .37% | | .41% | | .53% |
| Supplemental Data | | | | | | | | | | |
| Net assets, end of period (000 omitted) | | $ 60,406 | | $ 60,938 | | $ 60,129 | | $ 41,486 | | $ 44,643 |
| Portfolio turnover rate | | 123% | | 65% | | 62% | | 60% | | 89% |
A Total returns do not reflect charges attributable to your insurance company’s separate account. Inclusion of these charges would reduce the total returns shown.
B Total returns would have been lower had certain expenses not been reduced during the periods shown.
C Calculated based on average shares outstanding during the period.
D Investment income per share reflects a special dividend which amounted to $.04 per share.
E Expense ratios reflect operating expenses of the class. Expenses before reductions do not reflect amounts reimbursed by the investment adviser or reductions from brokerage service arrangements or other expense offset arrangements and do not
represent the amount paid by the class during periods when reimbursements or reductions occur. Expenses net of fee waivers reflect expenses after reimbursement by the investment adviser but prior to reductions from brokerage service arrange
ments or other expense offset arrangements. Expenses net of all reductions represent the net expenses paid by the class.
|
| Financial Highlights Investor Class | | |
| |
| Year ended December 31, | | 2005F |
| Selected Per Share Data | | |
| Net asset value, beginning of period | | $ 16.20 |
| Income from Investment Operations | | |
| Net investment income (loss)E | | 02 |
| Net realized and unrealized gain (loss) | | 1.11 |
| Total from investment operations | | 1.13 |
| Net asset value, end of period | | $ 17.33 |
| Total ReturnB,C,D | | 6.98% |
| Ratios to Average Net AssetsG | | |
| Expenses before reductions | | 87%A |
| Expenses net of fee waivers, if any | | 87%A |
| Expenses net of all reductions | | 83%A |
| Net investment income (loss) | | 33%A |
| Supplemental Data | | |
| Net assets, end of period (000 omitted) | | $ 4,353 |
| Portfolio turnover rate | | 123% |
A Annualized
B Total returns for periods of less than one year are not annualized.
C Total returns do not reflect charges attributable to your insurance company’s separate account. Inclusion of these charges would reduce the total returns shown.
D Total returns would have been lower had certain expenses not been reduced during the periods shown.
E Calculated based on average shares outstanding during the period.
F For the period July 21, 2005 (commencement of sale of shares) to December 31, 2005.
G Expense ratios reflect operating expenses of the class. Expenses before reductions do not reflect amounts reimbursed by the investment adviser or reductions from brokerage service arrangements or other expense offset arrangements and do not
represent the amount paid by the class during periods when reimbursements or reductions occur. Expense ratios before reductions for start up periods may not be representative of longer term operating periods. Expenses net of fee waivers reflect
expenses after reimbursement by the investment adviser but prior to reductions from brokerage service arrangements or other expense offset arrangements. Expenses net of all reductions represent the net expenses paid by the class.
|
See accompanying notes which are an integral part of the financial statements.
|
95 Annual Report
| | VIP Index 500 Portfolio
Performance: The Bottom Line
|
Average annual total return reflects the change in the value of an investment, assuming reinvestment of a class’ dividend income and capital gains (the profits earned upon the sale of securities that have grown in value) and assuming a constant rate of performance each year. During periods of reimbursement by Fidelity, a fund’s total return will be greater than it would be had the reimbursement not occurred. Perfor mance numbers are net of all underlying fund operating expenses, but do not include any insurance charges imposed by your insurance company’s separate account. If performance information included the effect of these additional charges, the total returns would have been lower. How a fund did yesterday is no guarantee of how it will do tomorrow.
| Average Annual Total Returns | | | | | | |
| Periods ended December 31, 2005 | | Past 1 | | Past 5 | | Past 10 |
| | | | | year | | years | | years |
| VIP Index 500 Initial Class | | 4.82% | | 0.35% | | 8.81% |
| VIP Index 500 Service ClassA | | 4.71% | | 0.25% | | 8.75% |
| VIP Index 500 Service Class 2B | | 4.55% | | 0.10% | | 8.65% |
A The initial offering of Service Class shares took place on July 7, 2000. Performance for Service Class shares reflects an asset based service fee (12b 1 fee), and returns
prior to July 7, 2000 are those of Initial Class and do not include the effects of Service Class’ 12b 1 fee. Had Service Class shares’ 12b 1 fee been reflected, returns prior to
July 7, 2000 would have been lower.
B The initial offering of Service Class 2 shares took place on January 12, 2000. Performance for Service Class 2 shares reflects an asset based service fee (12b 1 fee), and
returns prior to January 12, 2000 are those of Initial Class and do not include the effects of Service Class 2’s 12b 1 fee. Had Service Class 2 shares’ 12b 1 fee been reflected,
returns prior to January 12, 2000 would have been lower.
|
$10,000 Over 10 Years
Let’s say hypothetically that $10,000 was invested in VIP Index 500 Portfolio Initial Class on December 31, 1995. The chart shows how the value of your investment would have changed, and also shows how the Standard & Poor’sSM 500 Index performed over the same period.
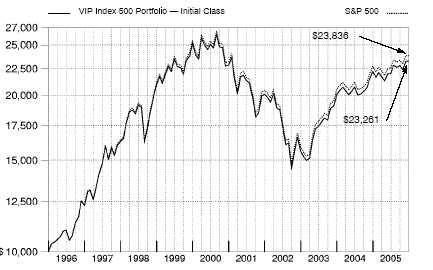
VIP Index 500 Portfolio 96
VIP Index 500 Portfolio
Management’s Discussion of Fund Performance
|
Comments from Jeffrey Adams, who oversees the VIP Index 500 Portfolio’s investment management team as Head of Indexing for Geode Capital Management, LLC
U.S. equity benchmarks generally had positive results for the 12 months ending December 31, 2005, the third consecutive year that stocks finished in the black. Energy and utilities were the two best performing sectors, contributing greatly to the 4.91% gain of the Standard & Poor’s 500SM Index. Elsewhere, the Dow Jones Industrial AverageSM rose 1.72% . The U.S. economy did not decelerate as much as many had predicted, despite eight short term interest rate hikes, record high energy prices and the devastation caused by Hurricane Katrina. Meanwhile, corporate America notched its 14th consecutive quarter of double digit earnings gains through the third quarter of the year, an unprecedented streak in market history. From a style perspective, large cap stocks ended the six year reign of small caps by a narrow margin, but mid caps finished well ahead of both categories. The gap between growth and value stocks also was relatively narrow, with value gaining a slight edge.
The fund performed roughly in line with the market, as represented by the S&P 500®, during the 12 months ending December 31, 2005. During that same time frame, the fund’s peer group average, the LipperSM Variable Annuity S&P 500 Index Objective Funds Average, returned 4.52% . (For specific portfolio performance results, please refer to the performance section of this report.) Energy stocks were particular standouts, as the sector benefited greatly from the strength in oil and natural gas prices during most of 2005. On the negative side, the consumer discretionary sector was a notable detractor, with automotive stocks bringing up the rear. In energy, Exxon Mobil, ConocoPhillips and Schlumberger all had a very good year. In the lagging technology sector, Apple Computer was a solid performer. The company’s shares soared on strong sales of its iPod digital music player, as well as optimism that higher iPod sales could lead to greater interest in Apple’s more profitable Macintosh computer line. Conversely, Dell was a noteworthy underperformer in the tech space. The direct retailer of personal computers and consumer electronics has been battling fierce global competition, and its severe price cutting contributed to missed sales targets in August and October. Online auction house eBay also disappointed, with its shares falling sharply early in the period on weaker than expected earnings and revenues. Other negative performers for the year included drug maker Pfizer and retail giant Wal Mart.
The views expressed in this statement reflect those of the portfolio manager only through the end of the period of the report as stated on the cover and do not necessarily represent the views of Fidelity or any other person in the Fidelity organization. Any such views are subject to change at any time based upon market or other conditions and Fidelity disclaims any responsibility to update such views. These views may not be relied on as invest ment advice and, because investment decisions for a Fidelity fund are based on numerous factors, may not be relied on as an indication of trading intent on behalf of any Fidelity fund.
97 97 Annual Report
| VIP Index 500 Portfolio | | | | |
| Investment Changes | | |
| |
| |
| Top Ten Stocks as of December 31, 2005 |
| | | % of fund’s | | % of fund’s net assets |
| | | net assets | | 6 months ago |
| General Electric Co. | | 3.3 | | 3.3 |
| Exxon Mobil Corp. | | 3.1 | | 3.3 |
| Citigroup, Inc. | | 2.2 | | 2.2 |
| Microsoft Corp. | | 2.1 | | 2.3 |
| Procter & Gamble Co. | | 1.7 | | 1.2 |
| Johnson & Johnson | | 1.6 | | 1.7 |
| Bank of America Corp. | | 1.6 | | 1.7 |
| American International Group, | | | | |
| Inc. | | 1.6 | | 1.4 |
| Pfizer, Inc. | | 1.5 | | 1.9 |
| Altria Group, Inc. | | 1.4 | | 1.2 |
| | | 20.1 | | |
Market Sectors as of December 31, 2005 |
| | | % of fund’s | | % of fund’s net assets |
| | | net assets | | 6 months ago |
| Financials | | 21.3 | | 20.0 |
| Information Technology | | 15.1 | | 14.9 |
| Health Care | | 13.3 | | 13.2 |
| Industrials | | 11.3 | | 11.0 |
| Consumer Discretionary | | 10.9 | | 11.2 |
| Consumer Staples | | 9.5 | | 10.0 |
| Energy | | 9.3 | | 8.7 |
| Utilities | | 3.4 | | 3.4 |
| Telecommunication Services | | 3.0 | | 3.1 |
| Materials | | 3.0 | | 2.9 |
Asset Allocation
To match the Standard & Poor’s 500 Index, the VIP Index 500 Portfolio seeks 100% investment exposure to stocks at all times.
VIP Index 500 Portfolio 98
| VIP Index 500 Portfolio | | | | | | | | |
| Investments December 31, 2005 | | | | |
| Showing Percentage of Net Assets | | | | | | | | |
| |
| Common Stocks 100.1% | | | | | | | | |
| | | | | | | | | Shares | | Value (Note 1) |
| |
| CONSUMER DISCRETIONARY 10.9% | | | | | | | | |
| Auto Components – 0.2% | | | | | | | | | | |
| Cooper Tire & Rubber Co. | | | | | | | | 15,375 | | $ 235,545 |
| Dana Corp. | | | | | | | | 37,708 | | 270,743 |
| Goodyear Tire & Rubber Co. (a)(d) | | | | | | 44,233 | | 768,770 |
| Johnson Controls, Inc. | | | | | | | | 48,388 | | 3,527,969 |
| | | | | | | | | | | 4,803,027 |
| Automobiles – 0.4% | | | | | | | | | | |
| Ford Motor Co. | | | | | | | | 465,799 | | 3,595,968 |
| General Motors Corp. (d) | | | | | | | | 141,802 | | 2,753,795 |
| Harley Davidson, Inc. | | | | | | | | 68,861 | | 3,545,653 |
| | | | | | | | | | | 9,895,416 |
| Distributors 0.1% | | | | | | | | | | |
| Genuine Parts Co. | | | | | | | | 43,511 | | 1,911,003 |
| Diversified Consumer Services 0.1% | | | | | | | | |
| Apollo Group, Inc. Class A (a) | | | | | | | | 36,491 | | 2,206,246 |
| H&R Block, Inc. | | | | | | | | 82,156 | | 2,016,930 |
| | | | | | | | | | | 4,223,176 |
| Hotels, Restaurants & Leisure 1.5% | | | | | | | | |
| Carnival Corp. unit | | | | | | | | 108,635 | | 5,808,713 |
| Darden Restaurants, Inc. | | | | | | | | 32,837 | | 1,276,703 |
| Harrah’s Entertainment, Inc. | | | | | | | | 46,083 | | 3,285,257 |
| Hilton Hotels Corp. | | | | | | | | 82,259 | | 1,983,264 |
| International Game Technology | | | | | | | | 84,491 | | 2,600,633 |
| Marriott International, Inc. Class A | | | | | | 41,277 | | 2,764,321 |
| McDonald’s Corp. | | | | | | | | 315,589 | | 10,641,661 |
| Starbucks Corp. (a) | | | | | | | | 192,695 | | 5,782,777 |
| Starwood Hotels & Resorts Worldwide, Inc. unit | | | | | | 54,973 | | 3,510,576 |
| Wendy’s International, Inc. | | | | | | | | 29,148 | | 1,610,718 |
| Yum! Brands, Inc. | | | | | | | | 70,978 | | 3,327,449 |
| | | | | | | | | | | 42,592,072 |
| Household Durables 0.7% | | | | | | | | | | |
| Black & Decker Corp. | | | | | | | | 19,662 | | 1,709,808 |
| Centex Corp. | | | | | | | | 32,033 | | 2,290,039 |
| D.R. Horton, Inc. | | | | | | | | 68,258 | | 2,438,858 |
| Fortune Brands, Inc. | | | | | | | | 36,638 | | 2,858,497 |
| KB Home | | | | | | | | 19,630 | | 1,426,316 |
| Leggett & Platt, Inc. | | | | | | | | 46,130 | | 1,059,145 |
| Lennar Corp. Class A | | | | | | | | 34,441 | | 2,101,590 |
| Maytag Corp. | | | | | | | | 20,099 | | 378,263 |
| Newell Rubbermaid, Inc. | | | | | | | | 69,082 | | 1,642,770 |
| Pulte Homes, Inc. | | | | | | | | 53,794 | | 2,117,332 |
| Snap On, Inc. | | | | | | | | 14,526 | | 545,597 |
| The Stanley Works | | | | | | | | 18,240 | | 876,250 |
| Whirlpool Corp. | | | | | | | | 16,917 | | 1,416,968 |
| | | | | | | | | | | 20,861,433 |
See accompanying notes which are an integral part of the financial statements.
|
99 Annual Report
99
99
| VIP Index 500 Portfolio | | | | |
| Investments - continued | | | | |
| |
| |
| |
| | | Shares | | Value (Note 1) |
| Internet & Catalog Retail 0.6% | | | | |
| Amazon.com, Inc. (a) | | 76,908 | | $ 3,626,212 |
| eBay, Inc. (a) | | 286,581 | | 12,394,628 |
| | | | | 16,020,840 |
| Leisure Equipment & Products 0.2% | | | | |
| Brunswick Corp. | | 24,188 | | 983,484 |
| Eastman Kodak Co. (d) | | 72,016 | | 1,685,174 |
| Hasbro, Inc. | | 44,722 | | 902,490 |
| Mattel, Inc. | | 101,257 | | 1,601,886 |
| | | | | 5,173,034 |
| Media 3.4% | | | | |
| CCE Spinco, Inc. (a)(d) | | 11 | | 144 |
| Clear Channel Communications, Inc. | | 135,537 | | 4,262,639 |
| Comcast Corp. Class A (a) | | 544,507 | | 14,135,402 |
| Dow Jones & Co., Inc. | | 14,794 | | 525,039 |
| E.W. Scripps Co. Class A | | 21,597 | | 1,037,088 |
| Gannett Co., Inc. | | 60,153 | | 3,643,467 |
| Interpublic Group of Companies, Inc. (a) | | 107,955 | | 1,041,766 |
| Knight Ridder, Inc. | | 17,401 | | 1,101,483 |
| McGraw Hill Companies, Inc. | | 94,007 | | 4,853,581 |
| Meredith Corp. | | 10,510 | | 550,093 |
| News Corp. Class A | | 610,157 | | 9,487,941 |
| Omnicom Group, Inc. | | 45,213 | | 3,848,983 |
| The New York Times Co. Class A | | 36,381 | | 962,277 |
| Time Warner, Inc. | | 1,169,157 | | 20,390,098 |
| Tribune Co. | | 65,651 | | 1,986,599 |
| Univision Communications, Inc. | | | | |
| Class A (a)(d) | | 56,065 | | 1,647,750 |
| Viacom, Inc. Class B (non vtg) (f) | | 440,077 | | 14,346,510 |
| Walt Disney Co. | | 482,348 | | 11,561,882 |
| | | | | 95,382,742 |
| Multiline Retail – 1.1% | | | | |
| Big Lots, Inc. (a) | | 28,571 | | 343,138 |
| Dillard’s, Inc. Class A | | 15,446 | | 383,370 |
| Dollar General Corp. | | 79,395 | | 1,514,063 |
| Family Dollar Stores, Inc. | | 38,933 | | 965,149 |
| Federated Department Stores, Inc. | | 68,259 | | 4,527,619 |
| JCPenney Co., Inc. | | 58,235 | | 3,237,866 |
| Kohl’s Corp. (a) | | 86,447 | | 4,201,324 |
| Nordstrom, Inc. | | 54,815 | | 2,050,081 |
| Sears Holdings Corp. (a) | | 25,027 | | 2,891,369 |
| Target Corp. | | 220,457 | | 12,118,521 |
| | | | | 32,232,500 |
| Specialty Retail 2.2% | | | | |
| AutoNation, Inc. (a) | | 45,398 | | 986,499 |
| AutoZone, Inc. (a) | | 13,844 | | 1,270,187 |
| Bed Bath & Beyond, Inc. (a) | | 74,438 | | 2,690,934 |
| Best Buy Co., Inc. | | 102,489 | | 4,456,222 |
| Circuit City Stores, Inc. | | 39,273 | | 887,177 |
| Gap, Inc. | | 143,920 | | 2,538,749 |
| Home Depot, Inc. | | 532,668 | | 21,562,401 |
See accompanying notes which are an integral part of the financial statements.
| | |
| VIP Index 500 Portfolio | | 100 |
| Common Stocks continued | | | | | | |
| | | | | Shares | | Value (Note 1) |
| |
| CONSUMER DISCRETIONARY – continued | | | | | | |
| Specialty Retail – continued | | | | | | |
| Limited Brands, Inc. | | | | 87,320 | | $ 1,951,602 |
| Lowe’s Companies, Inc. | | | | 196,067 | | 13,069,826 |
| Office Depot, Inc. (a) | | | | 77,446 | | 2,431,804 |
| OfficeMax, Inc. | | | | 17,753 | | 450,216 |
| RadioShack Corp. | | | | 33,757 | | 709,910 |
| Sherwin Williams Co. | | | | 28,150 | | 1,278,573 |
| Staples, Inc. | | | | 183,397 | | 4,164,946 |
| Tiffany & Co., Inc. | | | | 35,668 | | 1,365,728 |
| TJX Companies, Inc. | | | | 115,519 | | 2,683,506 |
| | | | | | | 62,498,280 |
| Textiles, Apparel & Luxury Goods 0.4% | | | | | | |
| Coach, Inc. (a) | | | | 95,303 | | 3,177,402 |
| Jones Apparel Group, Inc | | | | 29,294 | | 899,912 |
| Liz Claiborne, Inc. | | | | 26,742 | | 957,898 |
| NIKE, Inc. Class B | | | | 47,667 | | 4,137,019 |
| Reebok International Ltd. | | | | 13,204 | | 768,869 |
| VF Corp. | | | | 22,302 | | 1,234,193 |
| | | | | | | 11,175,293 |
| |
| TOTAL CONSUMER DISCRETIONARY | | | | | | 306,768,816 |
| |
| CONSUMER STAPLES 9.5% | | | | | | |
| Beverages 2.1% | | | | | | |
| Anheuser Busch Companies, Inc. | | | | 194,667 | | 8,362,894 |
| Brown Forman Corp. Class B (non vtg.) | | | | 20,830 | | 1,443,936 |
| Coca Cola Enterprises, Inc. | | | | 75,990 | | 1,456,728 |
| Constellation Brands, Inc. Class A (sub. vtg.) (a) | | | | 49,331 | | 1,293,952 |
| Molson Coors Brewing Co. Class B | | | | 14,157 | | 948,377 |
| Pepsi Bottling Group, Inc. | | | | 34,378 | | 983,555 |
| PepsiCo, Inc. | | | | 416,045 | | 24,579,939 |
| The Coca Cola Co. | | | | 519,025 | | 20,921,898 |
| | | | | | | 59,991,279 |
| Food & Staples Retailing – 2.4% | | | | | | |
| Albertsons, Inc. | | | | 92,472 | | 1,974,277 |
| Costco Wholesale Corp. | | | | 118,380 | | 5,856,259 |
| CVS Corp. | | | | 204,161 | | 5,393,934 |
| Kroger Co. (a) | | | | 181,762 | | 3,431,667 |
| Safeway, Inc. | | | | 112,663 | | 2,665,607 |
| SUPERVALU, Inc. | | | | 34,149 | | 1,109,160 |
| Sysco Corp. | | | | 155,541 | | 4,829,548 |
| Wal Mart Stores, Inc. | | | | 626,401 | | 29,315,567 |
| Walgreen Co. | | | | 253,781 | | 11,232,347 |
| Whole Foods Market, Inc. | | | | 34,496 | | 2,669,645 |
| | | | | | | 68,478,011 |
| Food Products – 1.0% | | | | | | |
| Archer Daniels Midland Co. | | | | 163,786 | | 4,038,963 |
| Campbell Soup Co. | | | | 46,669 | | 1,389,336 |
| ConAgra Foods, Inc. | | | | 130,119 | | 2,638,813 |
| General Mills, Inc. | | | | 89,086 | | 4,393,722 |
| |
| |
See accompanying notes which are an integral part of the financial statements.
| | | | | | |
| | | 101 | | | | Annual Report |
| 101 |
101
| VIP Index 500 Portfolio | | | | |
| Investments - continued | | | | |
| |
| |
| |
| | | Shares | | Value (Note 1) |
| H.J. Heinz Co. | | 83,919 | | $ 2,829,749 |
| Hershey Co. | | 45,410 | | 2,508,903 |
| Kellogg Co. | | 64,400 | | 2,783,368 |
| McCormick & Co., Inc. (non vtg.) | | 33,565 | | 1,037,830 |
| Sara Lee Corp. | | 190,455 | | 3,599,600 |
| Tyson Foods, Inc. Class A | | 63,112 | | 1,079,215 |
| Wm. Wrigley Jr. Co. | | 44,990 | | 2,991,385 |
| | | | | 29,290,884 |
| Household Products – 2.3% | | | | |
| Clorox Co. | | 37,789 | | 2,149,816 |
| Colgate Palmolive Co. | | 129,903 | | 7,125,180 |
| Kimberly Clark Corp. | | 117,148 | | 6,987,878 |
| Procter & Gamble Co. | | 840,460 | | 48,645,825 |
| | | | | 64,908,699 |
| Personal Products 0.2% | | | | |
| Alberto Culver Co. | | 18,930 | | 866,048 |
| Avon Products, Inc. | | 114,943 | | 3,281,623 |
| | | | | 4,147,671 |
| Tobacco – 1.5% | | | | |
| Altria Group, Inc. | | 522,157 | | 39,015,571 |
| Reynolds American, Inc. | | 21,438 | | 2,043,685 |
| UST, Inc. | | 41,015 | | 1,674,642 |
| | | | | 42,733,898 |
| |
| TOTAL CONSUMER STAPLES | | | | 269,550,442 |
| |
| ENERGY 9.3% | | | | |
| Energy Equipment & Services – 1.7% | | | | |
| Baker Hughes, Inc. | | 85,718 | | 5,209,940 |
| BJ Services Co. | | 80,828 | | 2,963,963 |
| Halliburton Co. | | 128,595 | | 7,967,746 |
| Nabors Industries Ltd. (a) | | 39,623 | | 3,001,442 |
| National Oilwell Varco, Inc. (a) | | 43,706 | | 2,740,366 |
| Noble Corp. | | 34,332 | | 2,421,779 |
| Rowan Companies, Inc. | | 27,410 | | 976,892 |
| Schlumberger Ltd. (NY Shares) | | 147,715 | | 14,350,512 |
| Transocean, Inc. (a) | | 82,769 | | 5,768,172 |
| Weatherford International Ltd. (a) | | 87,170 | | 3,155,554 |
| | | | | 48,556,366 |
| Oil, Gas & Consumable Fuels 7.6% | | | | |
| Amerada Hess Corp. | | 20,063 | | 2,544,390 |
| Anadarko Petroleum Corp | | 59,478 | | 5,635,541 |
| Apache Corp. | | 82,571 | | 5,657,765 |
| Burlington Resources, Inc. | | 94,793 | | 8,171,157 |
| Chevron Corp. | | 562,933 | | 31,957,706 |
| ConocoPhillips | | 347,934 | | 20,242,800 |
| Devon Energy Corp. | | 111,409 | | 6,967,519 |
| El Paso Corp. | | 165,329 | | 2,010,401 |
| EOG Resources, Inc. | | 60,577 | | 4,444,534 |
| Exxon Mobil Corp. | | 1,560,275 | | 87,640,647 |
| Kerr McGee Corp. | | 29,085 | | 2,642,663 |
| Kinder Morgan, Inc. | | 26,388 | | 2,426,377 |
See accompanying notes which are an integral part of the financial statements.
| | |
| VIP Index 500 Portfolio | | 102 |
| Common Stocks continued | | | | | | |
| | | | | Shares | | Value (Note 1) |
| |
| ENERGY – continued | | | | | | |
| Oil, Gas & Consumable Fuels – continued | | | | | | |
| Marathon Oil Corp. | | | | 91,895 | | $ 5,602,838 |
| Murphy Oil Corp. | | | | 41,405 | | 2,235,456 |
| Occidental Petroleum Corp. | | | | 100,802 | | 8,052,064 |
| Sunoco, Inc. | | | | 34,134 | | 2,675,423 |
| Valero Energy Corp. | | | | 154,714 | | 7,983,242 |
| Williams Companies, Inc. | | | | 143,684 | | 3,329,158 |
| XTO Energy, Inc. | | | | 91,072 | | 4,001,704 |
| | | | | | | 214,221,385 |
| |
| TOTAL ENERGY | | | | | | 262,777,751 |
| |
| FINANCIALS 21.3% | | | | | | |
| Capital Markets 3.2% | | | | | | |
| Ameriprise Financial, Inc. | | | | 61,685 | | 2,529,085 |
| Bank of New York Co., Inc. | | | | 193,133 | | 6,151,286 |
| Bear Stearns Companies, Inc. | | | | 28,414 | | 3,282,669 |
| Charles Schwab Corp. | | | | 258,668 | | 3,794,660 |
| E*TRADE Financial Corp. (a) | | | | 102,576 | | 2,139,735 |
| Federated Investors, Inc. Class B (non vtg.) | | | | 21,233 | | 786,470 |
| Franklin Resources, Inc. | | | | 37,225 | | 3,499,522 |
| Goldman Sachs Group, Inc. | | | | 113,039 | | 14,436,211 |
| Janus Capital Group, Inc. | | | | 54,086 | | 1,007,622 |
| Lehman Brothers Holdings, Inc. | | | | 67,179 | | 8,610,332 |
| Mellon Financial Corp. | | | | 104,845 | | 3,590,941 |
| Merrill Lynch & Co., Inc. | | | | 230,428 | | 15,606,888 |
| Morgan Stanley | | | | 270,291 | | 15,336,311 |
| Northern Trust Corp. | | | | 46,517 | | 2,410,511 |
| State Street Corp. | | | | 82,223 | | 4,558,443 |
| T. Rowe Price Group, Inc. | | | | 32,771 | | 2,360,495 |
| | | | | | | 90,101,181 |
| Commercial Banks – 5.7% | | | | | | |
| AmSouth Bancorp. | | | | 87,402 | | 2,290,806 |
| Bank of America Corp. | | | | 967,629 | | 44,656,078 |
| BB&T Corp. | | | | 135,982 | | 5,699,006 |
| Comerica, Inc. | | | | 41,441 | | 2,352,191 |
| Compass Bancshares, Inc. | | | | 31,229 | | 1,508,048 |
| Fifth Third Bancorp | | | | 139,130 | | 5,247,984 |
| First Horizon National Corp. | | | | 31,595 | | 1,214,512 |
| Huntington Bancshares, Inc. | | | | 57,221 | | 1,358,999 |
| KeyCorp | | | | 102,253 | | 3,367,191 |
| M&T Bank Corp. | | | | 20,006 | | 2,181,654 |
| Marshall & Ilsley Corp. | | | | 52,446 | | 2,257,276 |
| National City Corp. | | | | 138,202 | | 4,639,441 |
| North Fork Bancorp, Inc., New York | | | | 119,277 | | 3,263,419 |
| PNC Financial Services Group, Inc. | | | | 73,278 | | 4,530,779 |
| Regions Financial Corp. | | | | 114,825 | | 3,922,422 |
| SunTrust Banks, Inc. | | | | 90,622 | | 6,593,657 |
| Synovus Financial Corp. | | | | 78,312 | | 2,115,207 |
| U.S. Bancorp, Delaware | | | | 455,452 | | 13,613,460 |
| |
| |
See accompanying notes which are an integral part of the financial statements.
| | | | | | |
| | | 103 | | | | Annual Report |
| 103 |
103
| VIP Index 500 Portfolio | | | | |
| Investments - continued | | | | |
| |
| |
| |
| | | Shares | | Value (Note 1) |
| Wachovia Corp. | | 389,535 | | $ 20,590,820 |
| Wells Fargo & Co. | | 419,318 | | 26,345,750 |
| Zions Bancorp | | 26,185 | | 1,978,539 |
| | | | | 159,727,239 |
| Consumer Finance – 1.4% | | | | |
| American Express Co. | | 311,355 | | 16,022,328 |
| Capital One Financial Corp. | | 75,103 | | 6,488,899 |
| MBNA Corp. | | 393,394 | | 10,680,647 |
| SLM Corp. | | 104,642 | | 5,764,728 |
| | | | | 38,956,602 |
| Diversified Financial Services – 3.8% | | | | |
| CIT Group, Inc. | | 50,094 | | 2,593,867 |
| Citigroup, Inc. | | 1,268,547 | | 61,562,586 |
| JPMorgan Chase & Co. | | 877,396 | | 34,823,847 |
| Moody’s Corp. | | 62,220 | | 3,821,552 |
| Principal Financial Group, Inc. | | 70,248 | | 3,331,863 |
| | | | | 106,133,715 |
| Insurance – 4.9% | | | | |
| ACE Ltd. | | 80,824 | | 4,319,235 |
| AFLAC, Inc. | | 125,468 | | 5,824,225 |
| Allstate Corp. | | 162,648 | | 8,794,377 |
| AMBAC Financial Group, Inc. | | 26,376 | | 2,032,535 |
| American International Group, Inc. | | 650,853 | | 44,407,700 |
| Aon Corp. | | 80,244 | | 2,884,772 |
| Cincinnati Financial Corp. | | 43,809 | | 1,957,386 |
| Genworth Financial, Inc. Class A (non vtg.) | | 94,440 | | 3,265,735 |
| Hartford Financial Services Group, Inc. | | 75,320 | | 6,469,235 |
| Jefferson Pilot Corp. | | 33,609 | | 1,913,360 |
| Lincoln National Corp. | | 43,440 | | 2,303,623 |
| Loews Corp. | | 34,001 | | 3,224,995 |
| Marsh & McLennan Companies, Inc. | | 136,584 | | 4,337,908 |
| MBIA, Inc. | | 33,616 | | 2,022,339 |
| MetLife, Inc. | | 189,888 | | 9,304,512 |
| Progressive Corp. | | 49,461 | | 5,776,056 |
| Prudential Financial, Inc. | | 126,630 | | 9,268,050 |
| SAFECO Corp. | | 30,977 | | 1,750,201 |
| The Chubb Corp. | | 50,128 | | 4,894,999 |
| The St. Paul Travelers Companies, Inc. | | 173,633 | | 7,756,186 |
| Torchmark Corp. | | 26,022 | | 1,446,823 |
| UnumProvident Corp. | | 74,729 | | 1,700,085 |
| XL Capital Ltd. Class A | | 43,723 | | 2,946,056 |
| | | | | 138,600,393 |
| Real Estate 0.7% | | | | |
| Apartment Investment & Management Co. Class A | | 23,998 | | 908,804 |
| Archstone Smith Trust | | 53,157 | | 2,226,747 |
| Equity Office Properties Trust | | 101,848 | | 3,089,050 |
| Equity Residential (SBI) | | 72,258 | | 2,826,733 |
| Plum Creek Timber Co., Inc. | | 46,151 | | 1,663,744 |
| ProLogis Trust | | 61,057 | | 2,852,583 |
| Public Storage, Inc. | | 20,732 | | 1,403,971 |
See accompanying notes which are an integral part of the financial statements.
| | |
| VIP Index 500 Portfolio | | 104 |
| Common Stocks continued | | | | | | | | |
| | | | | Shares | | Value (Note 1) |
| |
| FINANCIALS – continued | | | | | | | | |
| Real Estate continued | | | | | | | | |
| Simon Property Group, Inc. | | | | 46,753 | | $ | | 3,582,682 |
| Vornado Realty Trust | | | | 29,603 | | | | 2,470,962 |
| | | | | | | | | 21,025,276 |
| Thrifts & Mortgage Finance – 1.6% | | | | | | | | |
| Countrywide Financial Corp. | | | | 149,744 | | | | 5,119,747 |
| Fannie Mae | | | | 242,703 | | | | 11,846,333 |
| Freddie Mac | | | | 173,269 | | | | 11,323,129 |
| Golden West Financial Corp., Delaware | | | | 63,902 | | | | 4,217,532 |
| MGIC Investment Corp. | | | | 22,751 | | | | 1,497,471 |
| Sovereign Bancorp, Inc. | | | | 89,558 | | | | 1,936,244 |
| Washington Mutual, Inc. | | | | 247,419 | | | | 10,762,727 |
| | | | | | | | | 46,703,183 |
| |
| TOTAL FINANCIALS | | | | | | 601,247,589 |
| |
| HEALTH CARE 13.3% | | | | | | | | |
| Biotechnology – 1.5% | | | | | | | | |
| Amgen, Inc. (a) | | | | 309,508 | | | | 24,407,801 |
| Applera Corp. – Applied Biosystems Group | | | | 47,120 | | | | 1,251,507 |
| Biogen Idec, Inc. (a) | | | | 85,108 | | | | 3,857,946 |
| Chiron Corp. (a) | | | | 27,426 | | | | 1,219,360 |
| Genzyme Corp. (a) | | �� | | 64,751 | | | | 4,583,076 |
| Gilead Sciences, Inc. (a) | | | | 114,824 | | | | 6,043,187 |
| MedImmune, Inc. (a) | | | | 61,699 | | | | 2,160,699 |
| | | | | | | | | 43,523,576 |
| Health Care Equipment & Supplies 2.2% | | | | | | | | |
| Bausch & Lomb, Inc. | | | | 13,483 | | | | 915,496 |
| Baxter International, Inc. | | | | 156,374 | | | | 5,887,481 |
| Becton, Dickinson & Co. | | | | 63,200 | | | | 3,797,056 |
| Biomet, Inc. | | | | 62,456 | | | | 2,284,016 |
| Boston Scientific Corp. (a) | | | | 147,951 | | | | 3,623,320 |
| C.R. Bard, Inc. | | | | 26,296 | | | | 1,733,432 |
| Fisher Scientific International, Inc. (a) | | | | 30,749 | | | | 1,902,133 |
| Guidant Corp. | | | | 83,199 | | | | 5,387,135 |
| Hospira, Inc. (a) | | | | 40,334 | | | | 1,725,489 |
| Medtronic, Inc. | | | | 303,308 | | | | 17,461,442 |
| Millipore Corp. (a) | | | | 13,057 | | | | 862,284 |
| PerkinElmer, Inc. | | | | 32,798 | | | | 772,721 |
| St. Jude Medical, Inc. (a) | | | | 91,921 | | | | 4,614,434 |
| Stryker Corp. | | | | 73,117 | | | | 3,248,588 |
| Thermo Electron Corp. (a) | | | | 40,665 | | | | 1,225,236 |
| Waters Corp. (a) | | | | 27,751 | | | | 1,048,988 |
| Zimmer Holdings, Inc. (a) | | | | 62,129 | | | | 4,189,980 |
| | | | | | | | | 60,679,231 |
| Health Care Providers & Services 3.2% | | | | | | | | |
| Aetna, Inc. | | | | 71,718 | | | | 6,763,725 |
| AmerisourceBergen Corp. | | | | 52,288 | | | | 2,164,723 |
| Cardinal Health, Inc. | | | | 107,379 | | | | 7,382,306 |
| |
| |
| |
See accompanying notes which are an integral part of the financial statements.
| | | | | | | | |
| | | 105 | | | | Annual Report |
| 105 |
| VIP Index 500 Portfolio | | | | |
| Investments - continued | | | | |
| |
| |
| |
| | | Shares | | Value (Note 1) |
| Caremark Rx, Inc. (a) | | 112,780 | | $ 5,840,876 |
| CIGNA Corp. | | 31,540 | | 3,523,018 |
| Coventry Health Care, Inc. (a) | | 40,736 | | 2,320,323 |
| Express Scripts, Inc. (a) | | 36,518 | | 3,060,208 |
| HCA, Inc. | | 106,298 | | 5,368,049 |
| Health Management Associates, Inc. Class A | | 61,983 | | 1,361,147 |
| Humana, Inc. (a) | | 40,820 | | 2,217,751 |
| IMS Health, Inc. | | 58,098 | | 1,447,802 |
| Laboratory Corp. of America Holdings (a) | | 33,330 | | 1,794,821 |
| Manor Care, Inc. | | 19,838 | | 788,957 |
| McKesson Corp. | | 77,149 | | 3,980,117 |
| Medco Health Solutions, Inc. (a) | | 77,120 | | 4,303,296 |
| Patterson Companies, Inc. (a) | | 34,673 | | 1,158,078 |
| Quest Diagnostics, Inc. | | 41,552 | | 2,139,097 |
| Tenet Healthcare Corp. (a) | | 117,704 | | 901,613 |
| UnitedHealth Group, Inc. | | 341,956 | | 21,249,146 |
| WellPoint, Inc. (a) | | 165,489 | | 13,204,367 |
| | | | | 90,969,420 |
| Pharmaceuticals 6.4% | | | | |
| Abbott Laboratories | | 388,973 | | 15,337,205 |
| Allergan, Inc. | | 33,001 | | 3,562,788 |
| Bristol Myers Squibb Co. | | 490,601 | | 11,274,011 |
| Eli Lilly & Co. | | 285,011 | | 16,128,772 |
| Forest Laboratories, Inc. (a) | | 84,702 | | 3,445,677 |
| Johnson & Johnson | | 745,968 | | 44,832,677 |
| King Pharmaceuticals, Inc. (a) | | 60,630 | | 1,025,860 |
| Merck & Co., Inc. | | 548,301 | | 17,441,455 |
| Mylan Laboratories, Inc. | | 54,815 | | 1,094,107 |
| Pfizer, Inc. | | 1,848,389 | | 43,104,431 |
| Schering Plough Corp. | | 370,584 | | 7,726,676 |
| Watson Pharmaceuticals, Inc. (a) | | 25,430 | | 826,729 |
| Wyeth | | 336,574 | | 15,505,964 |
| | | | | 181,306,352 |
| |
| TOTAL HEALTH CARE | | | | 376,478,579 |
| |
| INDUSTRIALS – 11.3% | | | | |
| Aerospace & Defense – 2.2% | | | | |
| General Dynamics Corp. | | 50,477 | | 5,756,902 |
| Goodrich Corp. | | 30,821 | | 1,266,743 |
| Honeywell International, Inc. | | 211,323 | | 7,871,782 |
| L 3 Communications Holdings, Inc. | | 30,124 | | 2,239,719 |
| Lockheed Martin Corp. | | 89,660 | | 5,705,066 |
| Northrop Grumman Corp. | | 89,093 | | 5,355,380 |
| Raytheon Co. | | 112,016 | | 4,497,442 |
| Rockwell Collins, Inc. | | 43,320 | | 2,013,080 |
| The Boeing Co. | | 202,423 | | 14,218,192 |
| United Technologies Corp. | | 255,429 | | 14,281,035 |
| | | | | 63,205,341 |
| Air Freight & Logistics – 1.0% | | | | |
| FedEx Corp. | | 75,987 | | 7,856,296 |
See accompanying notes which are an integral part of the financial statements.
| | |
| VIP Index 500 Portfolio | | 106 |
| Common Stocks continued | | | | | | | | |
| | | | | Shares | | Value (Note 1) |
| |
| INDUSTRIALS – continued | | | | | | | | |
| Air Freight & Logistics – continued | | | | | | | | |
| Ryder System, Inc. | | | | 16,092 | | $ | | 660,094 |
| United Parcel Service, Inc. Class B | | | | 276,717 | | | | 20,795,283 |
| | | | | | | | | 29,311,673 |
| Airlines – 0.1% | | | | | | | | |
| Southwest Airlines Co. | | | | 174,924 | | | | 2,874,001 |
| Building Products – 0.2% | | | | | | | | |
| American Standard Companies, Inc. | | | | 45,842 | | | | 1,831,388 |
| Masco Corp. | | | | 106,269 | | | | 3,208,261 |
| | | | | | | | | 5,039,649 |
| Commercial Services & Supplies 0.7% | | | | | | | | |
| Allied Waste Industries, Inc. (a)(d) | | | | 54,730 | | | | 478,340 |
| Avery Dennison Corp. | | | | 27,699 | | | | 1,530,924 |
| Cendant Corp. | | | | 256,864 | | | | 4,430,904 |
| Cintas Corp. | | | | 34,536 | | | | 1,422,192 |
| Equifax, Inc. | | | | 32,565 | | | | 1,238,121 |
| Monster Worldwide, Inc. (a) | | | | 30,868 | | | | 1,260,032 |
| Pitney Bowes, Inc. | | | | 57,200 | | | | 2,416,700 |
| R.R. Donnelley & Sons Co. | | | | 54,488 | | | | 1,864,034 |
| Robert Half International, Inc. | | | | 42,704 | | | | 1,618,055 |
| Waste Management, Inc. | | | | 138,374 | | | | 4,199,651 |
| | | | | | | | | 20,458,953 |
| Construction & Engineering – 0.1% | | | | | | | | |
| Fluor Corp. | | | | 21,772 | | | | 1,682,105 |
| Electrical Equipment 0.5% | | | | | | | | |
| American Power Conversion Corp. | | | | 43,098 | | | | 948,156 |
| Cooper Industries Ltd. Class A | | | | 22,975 | | | | 1,677,175 |
| Emerson Electric Co. | | | | 103,012 | | | | 7,694,996 |
| Rockwell Automation, Inc. | | | | 44,919 | | | | 2,657,408 |
| | | | | | | | | 12,977,735 |
| Industrial Conglomerates 4.4% | | | | | | | | |
| 3M Co. | | | | 190,554 | | | | 14,767,935 |
| General Electric Co. | | | | 2,649,483 | | | | 92,864,379 |
| Textron, Inc. | | | | 33,192 | | | | 2,555,120 |
| Tyco International Ltd. | | | | 504,777 | | | | 14,567,864 |
| | | | | | | 124,755,298 |
| Machinery – 1.4% | | | | | | | | |
| Caterpillar, Inc. | | | | 170,563 | | | | 9,853,425 |
| Cummins, Inc. | | | | 11,741 | | | | 1,053,520 |
| Danaher Corp. | | | | 59,488 | | | | 3,318,241 |
| Deere & Co. | | | | 60,480 | | | | 4,119,293 |
| Dover Corp. | | | | 50,819 | | | | 2,057,661 |
| Eaton Corp. | | | | 37,111 | | | | 2,489,777 |
| Illinois Tool Works, Inc. | | | | 51,346 | | | | 4,517,935 |
| Ingersoll Rand Co. Ltd. Class A | | | | 82,957 | | | | 3,348,974 |
| ITT Industries, Inc. | | | | 23,154 | | | | 2,380,694 |
| Navistar International Corp. (a) | | | | 15,470 | | | | 442,751 |
| PACCAR, Inc. | | | | 42,450 | | | | 2,938,814 |
| |
| |
| |
See accompanying notes which are an integral part of the financial statements.
| | | | | | | | |
| | | 107 | | | | Annual Report |
| 107 |
107
| VIP Index 500 Portfolio | | | | |
| Investments - continued | | | | |
| |
| |
| |
| | | Shares | | Value (Note 1) |
| Pall Corp. | | 31,239 | | $ 839,080 |
| Parker Hannifin Corp. | | 30,032 | | 1,980,911 |
| | | | | 39,341,076 |
| Road & Rail 0.7% | | | | |
| Burlington Northern Santa Fe Corp. | | 93,637 | | 6,631,372 |
| CSX Corp. | | 54,473 | | 2,765,594 |
| Norfolk Southern Corp. | | 101,910 | | 4,568,625 |
| Union Pacific Corp. | | 66,434 | | 5,348,601 |
| | | | | 19,314,192 |
| Trading Companies & Distributors – 0.0% | | | | |
| W.W. Grainger, Inc. | | 19,062 | | 1,355,308 |
| |
| TOTAL INDUSTRIALS | | | | 320,315,331 |
| |
| INFORMATION TECHNOLOGY 15.1% | | | | |
| Communications Equipment – 2.7% | | | | |
| ADC Telecommunications, Inc. (a) | | 29,213 | | 652,618 |
| Andrew Corp. (a) | | 40,735 | | 437,087 |
| Avaya, Inc. (a) | | 105,007 | | 1,120,425 |
| CIENA Corp. (a) | | 144,925 | | 430,427 |
| Cisco Systems, Inc. (a) | | 1,540,253 | | 26,369,131 |
| Comverse Technology, Inc. (a) | | 50,653 | | 1,346,863 |
| Corning, Inc. (a) | | 382,135 | | 7,512,774 |
| JDS Uniphase Corp. (a) | | 414,344 | | 977,852 |
| Lucent Technologies, Inc. (a)(d) | | 1,114,553 | | 2,964,711 |
| Motorola, Inc. | | 624,571 | | 14,109,059 |
| QUALCOMM, Inc. | | 412,283 | | 17,761,152 |
| Scientific Atlanta, Inc. | | 38,506 | | 1,658,453 |
| Tellabs, Inc. (a) | | 112,450 | | 1,225,705 |
| | | | | 76,566,257 |
| Computers & Peripherals 3.7% | | | | |
| Apple Computer, Inc. (a) | | 211,325 | | 15,192,154 |
| Dell, Inc. (a) | | 590,149 | | 17,698,569 |
| EMC Corp. (a) | | 599,470 | | 8,164,781 |
| Gateway, Inc. (a) | | 66,432 | | 166,744 |
| Hewlett Packard Co. | | 718,401 | | 20,567,821 |
| International Business Machines Corp. | | 396,066 | | 32,556,625 |
| Lexmark International, Inc. Class A (a) | | 29,099 | | 1,304,508 |
| NCR Corp. (a) | | 46,038 | | 1,562,530 |
| Network Appliance, Inc. (a) | | 93,306 | | 2,519,262 |
| QLogic Corp. (a) | | 20,177 | | 655,954 |
| Sun Microsystems, Inc. (a) | | 856,129 | | 3,587,181 |
| | | | | 103,976,129 |
| Electronic Equipment & Instruments – 0.3% | | | | |
| Agilent Technologies, Inc. (a) | | 103,084 | | 3,431,666 |
| Jabil Circuit, Inc. (a) | | 43,627 | | 1,618,125 |
| Molex, Inc. | | 35,995 | | 934,070 |
| Sanmina SCI Corp. (a) | | 131,800 | | 561,468 |
| Solectron Corp. (a) | | 229,087 | | 838,458 |
| Symbol Technologies, Inc. | | 62,931 | | 806,775 |
| Tektronix, Inc. | | 20,910 | | 589,871 |
| | | | | 8,780,433 |
See accompanying notes which are an integral part of the financial statements.
| | |
| VIP Index 500 Portfolio | | 108 |
| Common Stocks continued | | | | | | |
| | | | | Shares | | Value (Note 1) |
| |
| INFORMATION TECHNOLOGY – continued | | | | | | |
| Internet Software & Services 0.5% | | | | | | |
| Yahoo!, Inc. (a) | | | | 316,618 | | $ 12,405,093 |
| IT Services 1.0% | | | | | | |
| Affiliated Computer Services, Inc. | | | | | | |
| Class A (a) | | | | 31,164 | | 1,844,286 |
| Automatic Data Processing, Inc. | | | | 144,583 | | 6,634,914 |
| Computer Sciences Corp. (a) | | | | 46,391 | | 2,349,240 |
| Convergys Corp. (a) | | | | 35,102 | | 556,367 |
| Electronic Data Systems Corp. | | | | 130,777 | | 3,143,879 |
| First Data Corp. | | | | 191,588 | | 8,240,200 |
| Fiserv, Inc. (a) | | | | 46,262 | | 2,001,757 |
| Paychex, Inc. | | | | 83,628 | | 3,187,899 |
| Sabre Holdings Corp. Class A | | | | 32,906 | | 793,364 |
| Unisys Corp. (a) | | | | 85,574 | | 498,896 |
| | | | | | | 29,250,802 |
| Office Electronics – 0.1% | | | | | | |
| Xerox Corp. (a) | | | | 240,822 | | 3,528,042 |
| Semiconductors & Semiconductor Equipment – 3.2% | | | | | | |
| Advanced Micro Devices, Inc. (a) | | | | 101,321 | | 3,100,423 |
| Altera Corp. (a)(d) | | | | 90,888 | | 1,684,155 |
| Analog Devices, Inc. | | | | 91,984 | | 3,299,466 |
| Applied Materials, Inc. | | | | 406,842 | | 7,298,745 |
| Applied Micro Circuits Corp. (a) | | | | 74,913 | | 192,526 |
| Broadcom Corp. Class A (a) | | | | 72,517 | | 3,419,177 |
| Freescale Semiconductor, Inc. Class B (a) | | | | 102,907 | | 2,590,169 |
| Intel Corp. | | | | 1,511,781 | | 37,734,054 |
| KLA Tencor Corp. | | | | 49,501 | | 2,441,884 |
| Linear Technology Corp. | | | | 76,421 | | 2,756,505 |
| LSI Logic Corp. (a) | | | | 98,219 | | 785,752 |
| Maxim Integrated Products, Inc. | | | | 82,200 | | 2,978,928 |
| Micron Technology, Inc. (a) | | | | 154,962 | | 2,062,544 |
| National Semiconductor Corp. | | | | 86,176 | | 2,238,852 |
| Novellus Systems, Inc. (a)(d) | | | | 33,445 | | 806,693 |
| NVIDIA Corp. (a) | | | | 42,923 | | 1,569,265 |
| PMC Sierra, Inc. (a) | | | | 45,948 | | 354,259 |
| Teradyne, Inc. (a) | | | | 49,373 | | 719,365 |
| Texas Instruments, Inc. | | | | 405,729 | | 13,011,729 |
| Xilinx, Inc. | | | | 87,392 | | 2,203,152 |
| | | | | | | 91,247,643 |
| Software 3.6% | | | | | | |
| Adobe Systems, Inc. | | | | 150,756 | | 5,571,942 |
| Autodesk, Inc. (a) | | | | 57,873 | | 2,485,645 |
| BMC Software, Inc. (a) | | | | 54,237 | | 1,111,316 |
| Citrix Systems, Inc. (a) | | | | 44,220 | | 1,272,652 |
| Computer Associates International, Inc. | | | | 115,063 | | 3,243,626 |
| Compuware Corp. (a) | | | | 97,153 | | 871,462 |
| Electronic Arts, Inc. (a) | | | | 75,371 | | 3,942,657 |
| Intuit, Inc. (a) | | | | 44,369 | | 2,364,868 |
| Mercury Interactive Corp. (a)(d) | | | | 21,716 | | 603,488 |
| Microsoft Corp. | | | | 2,295,485 | | 60,026,933 |
| Novell, Inc. (a) | | | | 95,785 | | 845,782 |
| |
See accompanying notes which are an integral part of the financial statements.
| | | | | | |
| | | 109 | | | | Annual Report |
| 109 |
109
| VIP Index 500 Portfolio | | | | |
| Investments - continued | | | | |
| |
| |
| |
| | | Shares | | Value (Note 1) |
| Oracle Corp. (a) | | 943,034 | | $ 11,514,445 |
| Parametric Technology Corp. (a) | | 68,283 | | 416,526 |
| Siebel Systems, Inc. | | 132,671 | | 1,403,659 |
| Symantec Corp. (a) | | 271,182 | | 4,745,685 |
| | | | | 100,420,686 |
| |
| TOTAL INFORMATION TECHNOLOGY | | | | 426,175,085 |
| |
| MATERIALS 3.0% | | | | |
| Chemicals 1.6% | | | | |
| Air Products & Chemicals, Inc. | | 55,642 | | 3,293,450 |
| Ashland, Inc. | | 17,996 | | 1,041,968 |
| Dow Chemical Co. | | 242,006 | | 10,604,703 |
| E.I. du Pont de Nemours & Co. | | 230,534 | | 9,797,695 |
| Eastman Chemical Co. | | 20,432 | | 1,054,087 |
| Ecolab, Inc. | | 46,223 | | 1,676,508 |
| Engelhard Corp. | | 30,067 | | 906,520 |
| Hercules, Inc. (a) | | 28,275 | | 319,508 |
| International Flavors & Fragrances, Inc. | | 20,263 | | 678,811 |
| Monsanto Co. | | 67,323 | | 5,219,552 |
| PPG Industries, Inc. | | 41,882 | | 2,424,968 |
| Praxair, Inc. | | 80,818 | | 4,280,121 |
| Rohm & Haas Co. | | 36,113 | | 1,748,591 |
| Sigma Aldrich Corp. | | 16,857 | | 1,066,880 |
| | | | | 44,113,362 |
| Construction Materials – 0.1% | | | | |
| Vulcan Materials Co. | | 25,535 | | 1,729,996 |
| Containers & Packaging – 0.2% | | | | |
| Ball Corp. | | 26,089 | | 1,036,255 |
| Bemis Co., Inc. | | 26,404 | | 735,879 |
| Pactiv Corp. (a) | | 35,929 | | 790,438 |
| Sealed Air Corp. (a) | | 20,410 | | 1,146,430 |
| Temple Inland, Inc. | | 28,143 | | 1,262,214 |
| | | | | 4,971,216 |
| Metals & Mining – 0.8% | | | | |
| Alcoa, Inc. | | 218,207 | | 6,452,381 |
| Allegheny Technologies, Inc. | | 21,325 | | 769,406 |
| Freeport McMoRan Copper & Gold, Inc. Class B | | 46,150 | | 2,482,870 |
| Newmont Mining Corp. | | 112,032 | | 5,982,509 |
| Nucor Corp. | | 39,022 | | 2,603,548 |
| Phelps Dodge Corp. | | 25,464 | | 3,663,506 |
| United States Steel Corp. | | 28,431 | | 1,366,678 |
| | | | | 23,320,898 |
| Paper & Forest Products 0.3% | | | | |
| International Paper Co. | | 122,993 | | 4,133,795 |
| Louisiana Pacific Corp. | | 26,523 | | 728,587 |
| MeadWestvaco Corp. | | 45,502 | | 1,275,421 |
| Weyerhaeuser Co. | | 60,992 | | 4,046,209 |
| | | | | 10,184,012 |
| |
| TOTAL MATERIALS | | | | 84,319,484 |
See accompanying notes which are an integral part of the financial statements.
| | |
| VIP Index 500 Portfolio | | 110 |
| Common Stocks continued | | | | | | |
| | | | | Shares | | Value (Note 1) |
| |
| TELECOMMUNICATION SERVICES 3.0% | | | | | | |
| Diversified Telecommunication Services – 2.2% | | | | | | |
| AT&T, Inc. | | | | 979,535 | | $ 23,988,812 |
| BellSouth Corp. | | | | 458,530 | | 12,426,163 |
| CenturyTel, Inc. | | | | 32,847 | | 1,089,207 |
| Citizens Communications Co. | | | | 83,725 | | 1,023,957 |
| Qwest Communications International, Inc. (a) | | | | 387,109 | | 2,187,166 |
| Verizon Communications, Inc. | | | | 693,322 | | 20,882,859 |
| | | | | | | 61,598,164 |
| Wireless Telecommunication Services – 0.8% | | | | | | |
| ALLTEL Corp. | | | | 96,016 | | 6,058,610 |
| Sprint Nextel Corp. | | | | 740,837 | | 17,305,952 |
| | | | | | | 23,364,562 |
| |
| TOTAL TELECOMMUNICATION SERVICES | | | | | | 84,962,726 |
| |
| UTILITIES 3.4% | | | | | | |
| Electric Utilities – 1.6% | | | | | | |
| Allegheny Energy, Inc. (a) | | | | 40,836 | | 1,292,459 |
| American Electric Power Co., Inc. | | | | 98,717 | | 3,661,414 |
| Cinergy Corp. | | | | 50,009 | | 2,123,382 |
| Edison International | | | | 81,698 | | 3,562,850 |
| Entergy Corp. | | | | 52,027 | | 3,571,654 |
| Exelon Corp. | | | | 167,308 | | 8,890,747 |
| FirstEnergy Corp. | | | | 82,707 | | 4,051,816 |
| FPL Group, Inc. | | | | 99,011 | | 4,114,897 |
| Pinnacle West Capital Corp. | | | | 24,824 | | 1,026,472 |
| PPL Corp. | | | | 95,320 | | 2,802,408 |
| Progress Energy, Inc. | | | | 63,105 | | 2,771,572 |
| Southern Co. | | | | 185,931 | | 6,420,197 |
| | | | | | | 44,289,868 |
| Gas Utilities 0.0% | | | | | | |
| Nicor, Inc. | | | | 11,077 | | 435,437 |
| Peoples Energy Corp. | | | | 9,564 | | 335,409 |
| | | | | | | 770,846 |
| Independent Power Producers & Energy Traders 0.7% | | | | |
| AES Corp. (a) | | | | 163,785 | | 2,592,717 |
| Constellation Energy Group, Inc. | | | | 44,754 | | 2,577,830 |
| Duke Energy Corp. | | | | 232,589 | | 6,384,568 |
| Dynegy, Inc. Class A (a) | | | | 75,546 | | 365,643 |
| TXU Corp. | | | | 121,070 | | 6,076,503 |
| | | | | | | 17,997,261 |
| Multi-Utilities – 1.1% | | | | | | |
| Ameren Corp. | | | | 51,222 | | 2,624,615 |
| CenterPoint Energy, Inc. | | | | 77,760 | | 999,216 |
| CMS Energy Corp. (a) | | | | 55,189 | | 800,792 |
| Consolidated Edison, Inc. | | | | 61,424 | | 2,845,774 |
| Dominion Resources, Inc. | | | | 87,080 | | 6,722,576 |
| DTE Energy Co. | | | | 44,590 | | 1,925,842 |
See accompanying notes which are an integral part of the financial statements.
|
111 Annual Report
111
111
| VIP Index 500 Portfolio | | | | | | | | | | |
| Investments - continued | | | | | | | | | | |
| |
| |
| | | | | | | Shares | | Value (Note 1) |
| KeySpan Corp. | | | | | | 43,721 | | $ | | 1,560,402 |
| NiSource, Inc. | | | | | | 68,360 | | | | 1,425,990 |
| PG&E Corp. | | | | | | 86,034 | | | | 3,193,582 |
| Public Service Enterprise Group, Inc. | | | | | | 62,862 | | | | 4,084,144 |
| Sempra Energy | | | | | | 64,465 | | | | 2,890,611 |
| TECO Energy, Inc. | | | | | | 52,181 | | | | 896,470 |
| Xcel Energy, Inc. | | | | | | 101,025 | | | | 1,864,922 |
| | | | | | | | | 31,834,936 |
| |
| TOTAL UTILITIES | | | | | | | | 94,892,911 |
| |
| TOTAL COMMON STOCKS | | | | | | | | | | |
| (Cost $1,732,467,486) | | | | | | 2,827,488,714 |
| U.S. Treasury Obligations 0.1% | | | | | | | | |
| | | | | | | Principal | | | | |
| | | | | | | Amount | | | | |
| U.S. Treasury Bills, yield at date of purchase 3.93% 3/23/06 (e) | | | | | | | | |
| (Cost $2,973,418) | | | | | | $ 3,000,000 | | 2,974,026 |
| Money Market Funds 0.4% | | | | | | | | |
| | | | | | | Shares | | | | |
| Fidelity Securities Lending Cash Central Fund, 4.35% (b)(c) | | | | | | | | |
| (Cost $12,714,996) | | | | | | 12,714,996 | | 12,714,996 |
| TOTAL INVESTMENT PORTFOLIO 100.6% | | | | | | | | |
| (Cost $1,748,155,900) | | | | | | 2,843,177,736 |
| |
| NET OTHER ASSETS (0.6)% | | | | | | (18,178,027) |
| NET ASSETS 100% | | | | | | $ 2,824,999,709 |
| |
| Futures Contracts | | | | | | | | | | |
| | | | | | | Underlying | | | | Unrealized |
| | | | | Expiration | | Face Amount | | | | Appreciation/ |
| | | | | Date | | at Value | | | | (Depreciation) |
| Purchased | | | | | | | | | | |
| Equity Index Contracts | | | | | | | | | | |
| 46 S&P 500 E Mini Index Contracts | | | | March 2006 | | $ 2,886,040 | | | | $ (25,852) |
| TOTAL EQUITY INDEX CONTRACTS | | | | $ 2,886,040 | | | | $ (25,852) |
The face value of futures purchased as a percentage of net assets - 0.1%
Legend
(a) Non-income producing
(b) Affiliated fund that is available only to investment companies and other accounts managed by Fidelity Investments. The rate quoted is the annualized seven-day
yield of the fund at period end. A complete unaudited listing of the fund’s holdings as of its most recent quarter end is available upon request.
(c) Investment made with cash collateral received from securities on loan.
(d) Security or a portion of the security is on loan at period end.
(e) Security or a portion of the security was pledged to cover margin requirements for futures contracts. At the period end, the value of securities pledged amounted
to $2,974,026.
(f) A portion of the security is subject to a forward commitment to sell.
|
See accompanying notes which are an integral part of the financial statements.
VIP Index 500 Portfolio 112
Affiliated Central Funds
Information regarding income received by the fund from the affiliated Central funds during the period is as follows:
| Fund | | Income received |
| Fidelity Cash Central Fund | | $ 546,955 |
| Fidelity Securities Lending Cash Central Fund | | 159,958 |
| Total | | $ 706,913 |
Income Tax Information
At December 31, 2005, the fund had a capital loss carryforward of approximately $153,711,966 of which $119,767,806 and $33,944,160 will expire on December 31, 2010 and 2011, respectively.
See accompanying notes which are an integral part of the financial statements.
113 Annual Report
113
| VIP Index 500 Portfolio | | | | | | |
| |
| Financial Statements | | | | | | |
| |
| |
| Statement of Assets and Liabilities | | | | | | |
| | | December 31, 2005 |
| |
| Assets | | | | | | |
| Investment in securities, at value (including securities loaned of $11,859,741) — See accompanying schedule: | | | | | | |
| Unaffiliated issuers (cost $1,735,440,904) | | $2,830,462,740 | | | | |
| Affiliated Central Funds (cost $12,714,996) | | 12,714,996 | | | | |
| Total Investments (cost $1,748,155,900) | | | | $ | | 2,843,177,736 |
| Commitment to sell securities on a when-issued basis | | (752,440) | | | | |
| Receivable for securities sold on a when-issued basis | | 740,604 | | | | (11,836) |
| Receivable for investments sold | | | | | | 5,153,491 |
| Receivable for fund shares sold | | | | | | 572,073 |
| Dividends receivable | | | | | | 3,720,731 |
| Interest receivable | | | | | | 27,184 |
| Other affiliated receivables | | | | | | 10,074 |
| Other receivables | | | | | | 14,127 |
| Total assets | | | | 2,852,663,580 |
| |
| Liabilities | | | | | | |
| Payable to custodian bank | | $ 4,696,046 | | | | |
| Payable for investments purchased | | 7,399,732 | | | | |
| Payable for fund shares redeemed | | 2,504,789 | | | | |
| Accrued management fee | | 239,224 | | | | |
| Distribution fees payable | | 34,710 | | | | |
| Payable for daily variation on futures contracts | | 39,903 | | | | |
| Other affiliated payables | | 34,471 | | | | |
| Collateral on securities loaned, at value | | 12,714,996 | | | | |
| Total liabilities | | | | | | 27,663,871 |
| |
| Net Assets | | | | $ | | 2,824,999,709 |
| Net Assets consist of: | | | | | | |
| Paid in capital | | | | $ | | 1,839,378,592 |
| Undistributed net investment income | | | | | | 48,409,064 |
| Accumulated undistributed net realized gain (loss) on investments and foreign currency transactions | | | | | | (157,772,093) |
| Net unrealized appreciation (depreciation) on investments | | | | 1,094,984,146 |
| Net Assets | | | | $ | | 2,824,999,709 |
| |
| Statement of Assets and Liabilities continued | | | | | | |
| | | December 31, 2005 |
| |
| Initial Class: | | | | | | |
| Net Asset Value, offering price and redemption price per share ($2,641,526,504 ÷ 18,618,233 shares) | | | | $ | | 141.88 |
| Service Class: | | | | | | |
| Net Asset Value, offering price and redemption price per share ($27,178,307 ÷ 192,101 shares) | | | | $ | | 141.48 |
| Service Class 2: | | | | | | |
| Net Asset Value, offering price and redemption price per share ($156,294,898 ÷ 1,110,996 shares) | | | | $ | | 140.68 |
See accompanying notes which are an integral part of the financial statements.
| | |
| VIP Index 500 Portfolio | | 114 |
| Statement of Operations | | | | | | | | |
| | | | | Year ended December 31, 2005 |
| |
| Investment Income | | | | | | | | |
| Dividends | | | | | | $ | | 51,705,591 |
| Interest | | | | | | | | 79,799 |
| Income from affiliated Central Funds (including $159,958 from security lending) | | | | | | | | 706,913 |
| Total income | | | | | | | | 52,492,303 |
| |
| Expenses | | | | | | | | |
| Management fee | | $ | | 3,476,728 | | | | |
| Transfer agent fees | | | | 314,841 | | | | |
| Distribution fees | | | | 349,518 | | | | |
| Accounting and security lending fees | | | | 120,267 | | | | |
| Independent trustees’ compensation | | | | 9,798 | | | | |
| Appreciation in deferred trustee compensation account | | | | 2,685 | | | | |
| Custodian fees and expenses | | | | 10,899 | | | | |
| Audit | | | | 9,692 | | | | |
| Legal | | | | 219 | | | | |
| Miscellaneous | | | | 64,227 | | | | |
| Total expenses before reductions | | | | 4,358,874 | | | | |
| Expense reductions | | | | (327,730) | | | | 4,031,144 |
| |
| Net investment income (loss) | | | | | | | | 48,461,159 |
| Realized and Unrealized Gain (Loss) | | | | | | | | |
| Net realized gain (loss) on: | | | | | | | | |
| Investment securities: | | | | | | | | |
| Unaffiliated issuers | | | | 35,998,551 | | | | |
| Foreign currency transactions | | | | (18) | | | | |
| Futures contracts | | | | 1,677,631 | | | | |
| Total net realized gain (loss) | | | | | | | | 37,676,164 |
| Change in net unrealized appreciation (depreciation) on: | | | | | | | | |
| Investment securities | | | | 44,727,819 | | | | |
| Futures contracts | | | | (229,943) | | | | |
| When-issued commitments | | | | (11,836) | | | | |
| Total change in net unrealized appreciation (depreciation) | | | | | | | | 44,486,040 |
| Net gain (loss) | | | | | | | | 82,162,204 |
| Net increase (decrease) in net assets resulting from operations | | | | | | $ | | 130,623,363 |
| |
| Statement of Changes in Net Assets | | | | | | | | |
| | | | | Year ended | | | | Year ended |
| | | | | December 31, | | | | December 31, |
| | | | | 2005 | | | | 2004 |
| Increase (Decrease) in Net Assets | | | | | | | | |
| Operations | | | | | | | | |
| Net investment income (loss) | | $ | | 48,461,159 | | $ | | 49,877,022 |
| Net realized gain (loss) | | | | 37,676,164 | | | | 49,126,244 |
| Change in net unrealized appreciation (depreciation) | | | | 44,486,040 | | | | 190,069,405 |
| Net increase (decrease) in net assets resulting from operations | | | | 130,623,363 | | | | 289,072,671 |
| Distributions to shareholders from net investment income | | | | (49,776,021) | | | | (40,638,037) |
| Share transactions - net increase (decrease) | | | | (163,340,650) | | | | (452,730,560) |
| Total increase (decrease) in net assets | | | | (82,493,308) | | | | (204,295,926) |
| |
| Net Assets | | | | | | | | |
| Beginning of period | | | | 2,907,493,017 | | | | 3,111,788,943 |
| End of period (including undistributed net investment income of $48,409,064 and undistributed net investment income | | | | | | | | |
| of $49,696,311, respectively) | | $ | | 2,824,999,709 | | $ | | 2,907,493,017 |
See accompanying notes which are an integral part of the financial statements.
|
115 Annual Report
| Financial Highlights Initial Class | | | | | | | | | | |
| |
| Years ended December 31, | | 2005 | | 2004 | | 2003 | | 2002 | | 2001 |
| Selected Per Share Data | | | | | | | | | | |
| Net asset value, beginning of period | | $ 137.76 | | $ 126.13 | | $ 99.92 | | $ 130.08 | | $ 149.53 |
| Income from Investment Operations | | | | | | | | | | |
| Net investment income (loss)C | | 2.36 | | 2.18D | | 1.63 | | 1.51 | | 1.48 |
| Net realized and unrealized gain (loss) | | 4.15 | | 11.10 | | 26.18 | | (30.18) | | (19.34) |
| Total from investment operations | | 6.51 | | 13.28 | | 27.81 | | (28.67) | | (17.86) |
| Distributions from net investment income | | (2.39) | | (1.65) | | (1.60) | | (1.49) | | (1.59) |
| Net asset value, end of period | | $ 141.88 | | $ 137.76 | | $ 126.13 | | $ 99.92 | | $ 130.08 |
| Total ReturnA,B | | 4.82% | | 10.62% | | 28.41% | | (22.25)% | | (12.09)% |
| Ratios to Average Net AssetsE | | | | | | | | | | |
| Expenses before reductions | | 14% | | .35% | | .34% | | .33% | | .35% |
| Expenses net of fee waivers, if any | | 13% | | .28% | | .28% | | .28% | | .28% |
| Expenses net of all reductions | | 13% | | .28% | | .28% | | .28% | | .28% |
| Net investment income (loss) | | 1.73% | | 1.71% | | 1.50% | | 1.34% | | 1.09% |
| Supplemental Data | | | | | | | | | | |
| Net assets, end of period (000 omitted) | | $2,641,527 | | $2,778,226 | | $3,031,540 | | $2,497,252 | | $3,475,357 |
| Portfolio turnover rate | | 7% | | 5% | | 6% | | 7% | | 9% |
A Total returns do not reflect charges attributable to your insurance company’s separate account. Inclusion of these charges would reduce the total returns shown.
B Total returns would have been lower had certain expenses not been reduced during the periods shown.
C Calculated based on average shares outstanding during the period.
D Investment income per share reflects a special dividend which amounted to $.36 per share.
E Expense ratios reflect operating expenses of the class. Expenses before reductions do not reflect amounts reimbursed by the investment adviser or reductions from brokerage service arrangements or other expense offset arrangements and do not
represent the amount paid by the class during periods when reimbursements or reductions occur. Expenses net of fee waivers reflect expenses after reimbursement by the investment adviser but prior to reductions from brokerage service arrange
ments or other expense offset arrangements. Expenses net of all reductions represent the net expenses paid by the class.
|
| Financial Highlights Service Class | | | | | | | | | | |
| |
| Years ended December 31, | | 2005 | | 2004 | | 2003 | | 2002 | | 2001 |
| Selected Per Share Data | | | | | | | | | | |
| Net asset value, beginning of period | | $ 137.41 | | $ 125.86 | | $ 99.74 | | $ 129.94 | | $ 149.46 |
| Income from Investment Operations | | | | | | | | | | |
| Net investment income (loss)C | | 2.22 | | 2.05D | | 1.54 | | 1.34 | | 1.24 |
| Net realized and unrealized gain (loss) | | 4.14 | | 11.07 | | 26.11 | | (30.07) | | (19.23) |
| Total from investment operations | | 6.36 | | 13.12 | | 27.65 | | (28.73) | | (17.99) |
| Distributions from net investment income | | (2.29) | | (1.57) | | (1.53) | | (1.47) | | (1.53) |
| Net asset value, end of period | | $ 141.48 | | $ 137.41 | | $ 125.86 | | $ 99.74 | | $ 129.94 |
| Total ReturnA,B | | 4.71% | | 10.51% | | 28.27% | | (22.32)% | | (12.18)% |
| Ratios to Average Net AssetsE | | | | | | | | | | |
| Expenses before reductions | | 24% | | .47% | | .46% | | .47% | | .56% |
| Expenses net of fee waivers, if any | | 23% | | .38% | | .38% | | .38% | | .38% |
| Expenses net of all reductions | | 23% | | .38% | | .38% | | .38% | | .38% |
| Net investment income (loss) | | 1.63% | | 1.61% | | 1.40% | | 1.24% | | .99% |
| Supplemental Data | | | | | | | | | | |
| Net assets, end of period (000 omitted) | | $ 27,178 | | $ 23,216 | | $ 15,404 | | $ 7,494 | | $ 3,278 |
| Portfolio turnover rate | | 7% | | 5% | | 6% | | 7% | | 9% |
A Total returns do not reflect charges attributable to your insurance company’s separate account. Inclusion of these charges would reduce the total returns shown.
B Total returns would have been lower had certain expenses not been reduced during the periods shown.
C Calculated based on average shares outstanding during the period.
D Investment income per share reflects a special dividend which amounted to $.36 per share.
E Expense ratios reflect operating expenses of the class. Expenses before reductions do not reflect amounts reimbursed by the investment adviser or reductions from brokerage service arrangements or other expense offset arrangements and do not
represent the amount paid by the class during periods when reimbursements or reductions occur. Expenses net of fee waivers reflect expenses after reimbursement by the investment adviser but prior to reductions from brokerage service arrange
ments or other expense offset arrangements. Expenses net of all reductions represent the net expenses paid by the class.
|
See accompanying notes which are an integral part of the financial statements.
| | |
| VIP Index 500 Portfolio | | 116 |
| Financial Highlights Service Class 2 | | | | | | | | | | |
| |
| Years ended December 31, | | 2005 | | 2004 | | 2003 | | 2002 | | 2001 |
| Selected Per Share Data | | | | | | | | | | |
| Net asset value, beginning of period | | $ 136.71 | | $ 125.31 | | $ 99.29 | | $ 129.43 | | $ 149.18 |
| Income from Investment Operations | | | | | | | | | | |
| Net investment income (loss)C | | 2.01 | | 1.85D | | 1.37 | | 1.19 | | 1.09 |
| Net realized and unrealized gain (loss) | | 4.11 | | 11.01 | | 26.03 | | (30.00) | | (19.23) |
| Total from investment operations | | 6.12 | | 12.86 | | 27.40 | | (28.81) | | (18.14) |
| Distributions from net investment income | | (2.15) | | (1.46) | | (1.38) | | (1.33) | | (1.61) |
| Net asset value, end of period | | $ 140.68 | | $ 136.71 | | $ 125.31 | | $ 99.29 | | $ 129.43 |
| Total ReturnA,B | | 4.55% | | 10.34% | | 28.09% | | (22.45)% | | (12.31)% |
| Ratios to Average Net AssetsE | | | | | | | | | | |
| Expenses before reductions | | 39% | | .61% | | .60% | | .60% | | .61% |
| Expenses net of fee waivers, if any | | 38% | | .53% | | .53% | | .53% | | .53% |
| Expenses net of all reductions | | 38% | | .53% | | .53% | | .53% | | .53% |
| Net investment income (loss) | | 1.48% | | 1.46% | | 1.25% | | 1.09% | | .84% |
| Supplemental Data | | | | | | | | | | |
| Net assets, end of period (000 omitted) | | $ 156,295 | | $ 106,051 | | $ 64,844 | | $ 31,035 | | $ 19,338 |
| Portfolio turnover rate | | 7% | | 5% | | 6% | | 7% | | 9% |
A Total returns do not reflect charges attributable to your insurance company’s separate account. Inclusion of these charges would reduce the total returns shown.
B Total returns would have been lower had certain expenses not been reduced during the periods shown.
C Calculated based on average shares outstanding during the period.
D Investment income per share reflects a special dividend which amounted to $.36 per share.
E Expense ratios reflect operating expenses of the class. Expenses before reductions do not reflect amounts reimbursed by the investment adviser or reductions from brokerage service arrangements or other expense offset arrangements and do not
represent the amount paid by the class during periods when reimbursements or reductions occur. Expenses net of fee waivers reflect expenses after reimbursement by the investment adviser but prior to reductions from brokerage service arrange
ments or other expense offset arrangements. Expenses net of all reductions represent the net expenses paid by the class.
|
See accompanying notes which are an integral part of the financial statements.
|
117 Annual Report
VIP Mid Cap Portfolio
Performance: The Bottom Line
|
Average annual total return reflects the change in the value of an investment, assuming reinvestment of the class’ dividend income and capital gains (the profits earned upon the sale of securities that have grown in value) and assuming a constant rate of performance each year. During periods of reimbursement by Fidelity, a fund’s total return will be greater than it would be had the reimbursement not occurred. Perfor mance numbers are net of all underlying fund operating expenses, but do not include any insurance charges imposed by your insurance company’s separate account. If performance information included the effect of these additional charges, the total returns would have been lower. How a fund did yesterday is no guarantee of how it will do tomorrow.
| Average Annual Total Returns | | | | | | |
| Periods ended December 31, 2005 | | Past 1 | | Past 5 | | Life of |
| | | year | | years | | fundA |
| VIP Mid Cap — Initial Class | | 18.30% | | 12.32% | | 20.39% |
| VIP Mid Cap — Service ClassB | | 18.20% | | 12.21% | | 20.26% |
| VIP Mid Cap — Service Class 2C | | 18.02% | | 12.04% | | 20.11% |
| VIP Mid Cap — Investor ClassD | | 18.20% | | 12.30% | | 20.37% |
A From December 28, 1998.
B Performance for Service Class shares reflects an asset based distribution fee (12b 1).
C The initial offering of Service Class 2 shares took place January 12, 2000. Performance for Service Class 2 shares reflects an asset based distribution fee (12b 1 fee).
Returns from December 28, 1998 to January 12, 2000 are those of Service Class which reflect a different 12b 1 fee. Had Service Class 2’s 12b 1 fee been reflected, returns prior
to January 12, 2000 would have been lower.
D The initial offering of Investor Class shares took place on July 21, 2005. Returns prior to July 21, 2005 are those of Initial Class. If Investor Class’s transfer agent fee had
been reflected, returns prior to July 21, 2005 would have been lower.
|
$10,000 Over Life of Fund
Let’s say hypothetically that $10,000 was invested in VIP Mid Cap Portfolio Initial Class on December 28, 1998, when the fund started. The chart shows how the value of your investment would have changed, and also shows how the S&P® MidCap 400 Index performed the same period.
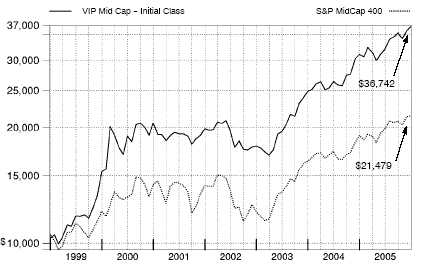
VIP Mid Cap Portfolio 118
VIP Mid Cap Portfolio
Management’s Discussion of Fund Performance
|
Comments from Thomas Allen, Portfolio Manager of VIP Mid Cap Portfolio
U.S. equity benchmarks generally had positive results for the 12 months ending December 31, 2005, the third consecutive year that stocks finished in the black. Energy and utilities were the two best performing sectors, contributing greatly to the 4.91% gain of the Standard & Poor’s 500SM Index. Elsewhere, the NASDAQ Composite® Index returned 2.13%, while the Dow Jones Industrial AverageSM rose 1.72% . The U.S. economy did not decelerate as much as many had predicted, despite eight short term interest rate hikes, record high energy prices and the devastation caused by Hurricane Katrina. Meanwhile, corporate America notched its 14th consecutive quarter of double digit earnings gains through the third quarter of the year, an unprecedented streak in market history. From a style perspective, large cap stocks ended the six year reign of small caps by a narrow margin, but mid caps finished well ahead of both categories. The gap between growth and value stocks also was relatively narrow, with value gaining a slight edge.
During the past year, the fund significantly outperformed the 12.56% return of the Standard & Poor’s® MidCap 400 Index and the 10.22% gain of the LipperSM Variable Annuity Mid Cap Funds Average. (For specific portfolio performance results, please refer to the performance section of this report.)
Most of the outperformance relative to the index came from a significant overweighting in energy, along with effective stock picking in the sector. Also aiding the fund’s performance was timely stock selection in financials and materials. On the other hand, my choices in consumer staples and technology dampened results. Valero Energy was the fund’s top contributor both in absolute terms and compared with the index. The crude oil refiner benefited from strong demand and limited industrywide capacity. Southwestern Energy, an exploration and production company, was aided by some natural gas discoveries that significantly boosted its reserves. Within technology, Apple Computer was a standout, spurred by robust sales of the iPod, the company’s personal digital media player. Conversely, Symbol Technologies, a maker of bar code scanners, was the fund’s largest detractor both in absolute terms and versus the index. Lackluster sales growth derailed the stock. Household and personal products marketer Avon Products also had a negative impact on the fund’s results, primarily because of its disappointing sales growth in the United States and abroad. In absolute terms, currency fluctuations —particularly the depreciation of the Japanese yen versus the U.S. dollar acted as a mild head wind given the fund’s significant foreign exposure.
The views expressed in this statement reflect those of the portfolio manager only through the end of the period of the report as stated on the cover and do not necessarily represent the views of Fidelity or any other person in the Fidelity organization. Any such views are subject to change at any time based upon market or other conditions and Fidelity disclaims any responsibility to update such views. These views may not be relied on as invest ment advice and, because investment decisions for a Fidelity fund are based on numerous factors, may not be relied on as an indication of trading intent on behalf of any Fidelity fund.
119 119 Annual Report
| VIP Mid Cap Portfolio | | | | |
| Investment Changes | | |
| |
| |
| Top Ten Stocks as of December 31, 2005 |
| | | % of fund’s | | % of fund’s net assets |
| | | net assets | | 6 months ago |
| Newmont Mining Corp. | | 1.6 | | 1.6 |
| Rockwell Automation, Inc. | | 1.4 | | 0.9 |
| Assurant, Inc. | | 1.4 | | 1.7 |
| Nabors Industries Ltd. | | 1.3 | | 0.6 |
| Thermo Electron Corp. | | 1.3 | | 0.2 |
| CONSOL Energy, Inc. | | 1.3 | | 1.1 |
| Humana, Inc. | | 1.2 | | 0.3 |
| Freeport McMoRan Copper & | | | | |
| Gold, Inc. Class B | | 1.2 | | 1.1 |
| QIAGEN NV | | 1.2 | | 1.3 |
| Covance, Inc. | | 1.1 | | 0.9 |
| | | 13.0 | | |
| |
| Top Five Market Sectors as of December 31, 2005 |
| | | % of fund’s | | % of fund’s net assets |
| | | net assets | | 6 months ago |
| Health Care | | 17.2 | | 17.3 |
| Energy | | 16.5 | | 15.5 |
| Industrials | | 13.9 | | 10.6 |
| Information Technology | | 10.7 | | 14.0 |
| Consumer Discretionary | | 10.6 | | 13.2 |
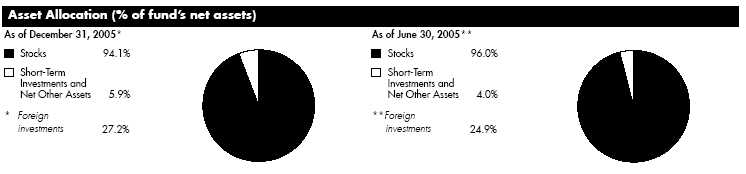
VIP Mid Cap Portfolio 120
| VIP Mid Cap Portfolio | | | | | | |
| Investments December 31, 2005 | | | | |
| Showing Percentage of Net Assets | | | | | | |
| |
| Common Stocks 94.1% | | | | | | |
| | | | | | | Shares | | Value (Note 1) |
| |
| CONSUMER DISCRETIONARY 10.6% | | | | | | |
| Auto Components – 0.9% | | | | | | |
| BorgWarner, Inc. | | | | | | 290,200 | | $ 17,594,826 |
| China Yuchai International Ltd. | | | | 100 | | 783 |
| Continental AG | | | | | | 100 | | 8,877 |
| ElringKlinger AG | | | | | | 200 | | 7,236 |
| Gentex Corp. | | | | | | 672,400 | | 13,111,800 |
| IMPCO Technologies, Inc. (e) | | | | 1,806,793 | | 9,268,848 |
| Jinheng Automotive Safety Technology Holdings Ltd. | | | | 2,000 | | 217 |
| LKQ Corp. (a) | | | | | | 356,481 | | 12,341,372 |
| New Focus Auto Tech Holdings Ltd. | | | | 5,804,000 | | 845,862 |
| Quantum Fuel Systems Technologies Worldwide, Inc. (a) | | | | 46 | | 123 |
| | | | | | | | | 53,179,944 |
| Automobiles – 0.6% | | | | | | | | |
| Bajaj Auto Ltd. | | | | | | 270,533 | | 12,031,639 |
| Denway Motors Ltd. | | | | | | 4,000 | | 1,328 |
| Geely Automobile Holdings Ltd. | | | | 59,050,200 | | 2,475,133 |
| Harley Davidson, Inc. | | | | | | 65,100 | | 3,351,999 |
| Hero Honda Motors Ltd. | | | | 94 | | 1,795 |
| Hyundai Motor Co. | | | | | | 83,220 | | 8,037,030 |
| Hyundai Motor Co. GDR (f) | | | | 100 | | 4,861 |
| Mahindra & Mahindra Ltd. | | | | 169,496 | | 1,927,195 |
| Maruti Udyog Ltd. | | | | | | 481,168 | | 6,799,125 |
| Renault SA | | | | | | 100 | | 8,157 |
| Thor Industries, Inc. | | | | | | 200 | | 8,014 |
| | | | | | | | | 34,646,276 |
| Distributors 0.0% | | | | | | | | |
| China Resources Enterprise Ltd. | | | | 2,000 | | 3,573 |
| Educational Development Corp. | | | | 100 | | 810 |
| Li & Fung Ltd. | | | | | | 2,000 | | 3,856 |
| | | | | | | | | 8,239 |
| Diversified Consumer Services 0.2% | | | | | | |
| Alderwoods Group, Inc. (a) | | | | 100 | | 1,587 |
| Apollo Group, Inc. Class A (a) | | | | 311 | | 18,803 |
| Benesse Corp. | | | | | | 100 | | 3,503 |
| Bright Horizons Family Solutions, Inc. (a) | | | | 105,214 | | 3,898,179 |
| Concorde Career Colleges, Inc. (a) | | | | 100 | | 1,480 |
| Educate, Inc. (a) | | | | | | 100 | | 1,180 |
| Education Management Corp. (a) | | | | 58,800 | | 1,970,388 |
| ITT Educational Services, Inc. (a) | | | | 100 | | 5,911 |
| Matthews International Corp. Class A | | | | 100 | | 3,641 |
| Princeton Review, Inc. (a) | | | | 29 | | 149 |
| Service Corp. International (SCI) | | | | 358,000 | | 2,928,440 |
| | | | | | | | | 8,833,261 |
| Hotels, Restaurants & Leisure 0.9% | | | | | | |
| Accor SA | | | | | | 100 | | 5,500 |
| Ambassadors Group, Inc. | | | | 200 | | 4,578 |
| BJ’s Restaurants, Inc. (a) | | | | 100 | | 2,286 |
| Indian Hotels Co. Ltd. | | | | | | 100 | | 2,203 |
| Krispy Kreme Doughnuts, Inc. (a) | | | | 100 | | 574 |
| |
| |
See accompanying notes which are an integral part of the financial statements.
| | | | |
| | | | | 121 | | | | Annual Report |
121
| VIP Mid Cap Portfolio | | | | |
| Investments - continued | | | | |
| |
| |
| |
| | | Shares | | Value (Note 1) |
| Kuoni Reisen Holding AG Class B (Reg.) | | 100 | | $ 41,400 |
| Life Time Fitness, Inc. (a) | | 100 | | 3,809 |
| Minor International PCL (For. Reg.) | | 100 | | 16 |
| Outback Steakhouse, Inc. | | 100 | | 4,161 |
| P.F. Chang’s China Bistro, Inc. (a) | | 100 | | 4,963 |
| Red Robin Gourmet Burgers, Inc. (a) | | 100 | | 5,096 |
| Royal Caribbean Cruises Ltd. | | 366,700 | | 16,523,502 |
| Ruby Tuesday, Inc. | | 100 | | 2,589 |
| Shangri La Asia Ltd. | | 2,000 | | 3,340 |
| Sonic Corp. (a) | | 363,283 | | 10,716,849 |
| St. Marc Co. Ltd. | | 353,700 | | 24,628,957 |
| TAJ GVK Hotels & Resorts Ltd. | | 717,595 | | 2,868,307 |
| | | | | 54,818,130 |
| Household Durables 0.9% | | | | |
| Alba PLC | | 26 | | 180 |
| Chitaly Holdings Ltd. | | 894,000 | | 429,494 |
| Garmin Ltd. | | 51 | | 3,384 |
| George Wimpey PLC | | 100 | | 826 |
| Goldcrest Co. Ltd. (d) | | 188,100 | | 17,022,409 |
| Harman International Industries, Inc. | | 100 | | 9,785 |
| Joint Corp. | | 200 | | 6,921 |
| LG Electronics, Inc. | | 123,160 | | 10,916,317 |
| Makita Corp. sponsored ADR | | 100 | | 2,418 |
| Nihon Eslead Corp. | | 262,700 | | 7,553,141 |
| Rational AG | | 39,471 | | 5,246,124 |
| Sekisui House Ltd. (d) | | 661,000 | | 8,319,614 |
| Skyworth Digital Holdings Ltd. | | 2,052 | | 307 |
| Steinhoff International Holdings Ltd. | | 100 | | 296 |
| Toll Brothers, Inc. (a) | | 100 | | 3,464 |
| William Lyon Homes, Inc. (a) | | 100 | | 10,090 |
| | | | | 49,524,770 |
| Internet & Catalog Retail 0.1% | | | | |
| 1 800 FLOWERS.com, Inc. Class A (a) | | 100 | | 642 |
| Alloy, Inc. (a)(d) | | 49,600 | | 143,344 |
| ASKUL Corp. | | 103,800 | | 3,222,154 |
| ASKUL Corp. New | | 103,800 | | 3,222,154 |
| Audible, Inc. (a) | | 100 | | 1,284 |
| Coldwater Creek, Inc. (a) | | 100 | | 3,053 |
| dELiA*s, Inc. (a) | | 24,800 | | 205,840 |
| dELiA*s, Inc. rights 1/27/06 (a) | | 2,865 | | 2,865 |
| GSI Commerce, Inc. (a) | | 100 | | 1,509 |
| | | | | 6,802,845 |
| Leisure Equipment & Products 0.3% | | | | |
| Giant Manufacturing Co. Ltd. | | 512,000 | | 990,419 |
| Jumbo SA | | 681,816 | | 7,409,801 |
| Li Ning Co. Ltd. | | 2,000 | | 1,419 |
| MarineMax, Inc. (a) | | 100 | | 3,157 |
| Mega Bloks, Inc. (a) | | 100 | | 2,376 |
| Nautilus, Inc. | | 100 | | 1,866 |
| Nidec Copal Corp. | | 100 | | 1,357 |
| Oakley, Inc. (d) | | 105,300 | | 1,546,857 |
| Polaris Industries, Inc. | | 100 | | 5,020 |
See accompanying notes which are an integral part of the financial statements.
| | |
| VIP Mid Cap Portfolio | | 122 |
| Common Stocks continued | | | | |
| | | Shares | | Value (Note 1) |
| |
| CONSUMER DISCRETIONARY – continued | | | | |
| Leisure Equipment & Products – continued | | | | |
| SHIMANO, Inc. | | 100 | | $ 2,629 |
| Trigano SA (d) | | 210,800 | | 9,388,281 |
| | | | | 19,353,182 |
| Media 2.2% | | | | |
| Astral Media, Inc. Class A (non vtg.) | | 365,800 | | 9,640,972 |
| Astro All Asia Networks PLC | | 100 | | 139 |
| Austar United Communications Ltd. (a) | | 100 | | 87 |
| Balaji Telefilms Ltd. (a) | | 100 | | 321 |
| Central European Media Enterprises Ltd. Class A (a) | | 100 | | 5,790 |
| Chum Ltd. Class B (non vtg.) | | 200 | | 4,817 |
| Clear Media Ltd. (a) | | 243,000 | | 197,443 |
| E.W. Scripps Co. Class A | | 592,000 | | 28,427,840 |
| Focus Media Holding Ltd. ADR | | 100 | | 3,377 |
| Getty Images, Inc. (a) | | 5,900 | | 526,693 |
| Grupo Televisa SA de CV (CPO) sponsored ADR | | 100 | | 8,050 |
| Harris Interactive, Inc. (a) | | 1,749,767 | | 7,541,496 |
| Insignia Systems, Inc. (a) | | 100 | | 72 |
| JC Decaux SA (a) | | 100 | | 2,332 |
| Modern Times Group AB (MTG) (B Shares) (a) | | 100 | | 4,173 |
| News Corp. Class A | | 204 | | 3,172 |
| Omnicom Group, Inc. | | 714,800 | | 60,850,924 |
| Salem Communications Corp. Class A (a) | | 187,132 | | 3,272,939 |
| Scholastic Corp. (a) | | 100 | | 2,851 |
| Sogecable SA (a) | | 100 | | 4,009 |
| Trader Classified Media NV: | | | | |
| (A Shares) | | 100 | | 1,532 |
| Class A (NY Shares) | | 76,800 | | 1,178,880 |
| Univision Communications, Inc. | | | | |
| Class A (a) | | 570,100 | | 16,755,239 |
| Zee Telefilms Ltd. | | 88 | | 307 |
| | | | | 128,433,455 |
| Multiline Retail – 0.4% | | | | |
| Dollar General Corp. | | 100 | | 1,907 |
| Don Quijote Co. Ltd. | | 100 | | 8,363 |
| Hudson’s Bay Co. | | 200 | | 2,550 |
| JCPenney Co., Inc. | | 100 | | 5,560 |
| Kohl’s Corp. (a) | | 100 | | 4,860 |
| Lifestyle International Holdings Ltd. | | 1,980,500 | | 2,758,623 |
| Lojas Renner SA | | 252,200 | | 8,089,210 |
| Pantaloon Retail India Ltd. | | 70,800 | | 2,669,693 |
| Pantaloon Retail India Ltd. rights 2/22/06 | | 14,160 | | 376,588 |
| Parkson Retail Group Ltd. | | 500 | | 903 |
| PT Mitra Adiperkasa Tbk | | 2,633,000 | | 235,710 |
| Ryohin Keikaku Co. Ltd. | | 92,300 | | 8,055,359 |
| | | | | 22,209,326 |
| Specialty Retail 3.6% | | | | |
| Abercrombie & Fitch Co. Class A | | 70,800 | | 4,614,744 |
See accompanying notes which are an integral part of the financial statements.
|
123 Annual Report
123
| VIP Mid Cap Portfolio | | | | |
| Investments - continued | | | | |
| |
| |
| |
| | | Shares | | Value (Note 1) |
| A.C. Moore Arts & Crafts, Inc. (a) | | 205,094 | | $ 2,984,118 |
| Advance Auto Parts, Inc. (a) | | 126,300 | | 5,488,998 |
| Best Buy Co., Inc. | | 216,200 | | 9,400,376 |
| Blacks Leisure Group PLC | | 100 | | 853 |
| Build A Bear Workshop, Inc. (a)(d) | | 823,000 | | 24,393,720 |
| CarMax, Inc. (a) | | 486,300 | | 13,460,784 |
| Charming Shoppes, Inc. (a) | | 100 | | 1,320 |
| Chico’s FAS, Inc. (a) | | 200 | | 8,786 |
| Chow Sang Sang Holdings International Ltd. | | 2,000 | | 761 |
| Circuit City Stores, Inc. | | 1,237,300 | | 27,950,607 |
| Cost Plus, Inc. (a) | | 842,500 | | 14,448,875 |
| DSG International PLC | | 5,601,500 | | 15,790,842 |
| DSG International PLC sponsored ADR | | 100 | | 865 |
| DSW, Inc. Class A | | 100 | | 2,622 |
| Edgars Consolidated Stores Ltd. | | 2,039,700 | | 11,333,995 |
| Ellerine Holdings Ltd. | | 100 | | 980 |
| Esprit Holdings Ltd. | | 500 | | 3,553 |
| Fantastic Holdings Ltd. | | 110 | | 238 |
| Gamestop Corp. Class B (a) | | 564,100 | | 16,302,490 |
| GOME Electrical Appliances Holdings Ltd. | | 100 | | 68 |
| Guess?, Inc. (a) | | 89,200 | | 3,175,520 |
| JB Hi Fi Ltd. | | 100 | | 296 |
| JD Group Ltd. | | 100 | | 1,211 |
| KOMERI Co. Ltd. (d) | | 687,500 | | 29,562,997 |
| Lithia Motors, Inc. Class A (sub. vtg.) | | 100 | | 3,144 |
| Michaels Stores, Inc. | | 200 | | 7,074 |
| Nitori Co. Ltd. | | 232,300 | | 21,672,534 |
| O’Reilly Automotive, Inc. (a) | | 200 | | 6,402 |
| Pacific Sunwear of California, Inc. (a) | | 372,400 | | 9,280,208 |
| RONA, Inc. (a) | | 100 | | 1,845 |
| Ross Stores, Inc. | | 100 | | 2,890 |
| Sa Sa International Holdings Ltd. | | 2,000 | | 696 |
| Select Comfort Corp. (a) | | 100 | | 2,735 |
| Shimamura Co. Ltd. | | 100 | | 13,842 |
| Shopper’s Stop Ltd. | | 100 | | 969 |
| Tiffany & Co., Inc. | | 57,100 | | 2,186,359 |
| Truworths International Ltd. | | 100 | | 379 |
| United Auto Group, Inc. | | 100 | | 3,820 |
| Williams Sonoma, Inc. (a) | | 100 | | 4,315 |
| Yamada Denki Co. Ltd. | | 100 | | 12,519 |
| | | | | 212,129,350 |
| Textiles, Apparel & Luxury Goods 0.5% | | | | |
| Billabong International Ltd. | | 100 | | 1,065 |
| Cherokee, Inc. | | 100 | | 3,439 |
| Columbia Sportswear Co. (a)(d) | | 73,290 | | 3,498,132 |
| Compagnie Financiere Richemont unit | | 100 | | 4,353 |
| Folli Follie SA | | 80 | | 2,131 |
| Gildan Activewear, Inc. Class A (a) | | 200 | | 8,602 |
| K Swiss, Inc. Class A | | 200 | | 6,488 |
| Luxottica Group Spa sponsored ADR | | 100 | | 2,531 |
| NIKE, Inc. Class B | | 100 | | 8,679 |
| Polo Ralph Lauren Corp. Class A | | 100 | | 5,614 |
See accompanying notes which are an integral part of the financial statements.
| | |
| VIP Mid Cap Portfolio | | 124 |
| Common Stocks continued | | | | |
| | | Shares | | Value (Note 1) |
| |
| CONSUMER DISCRETIONARY – continued | | | | |
| Textiles, Apparel & Luxury Goods – continued | | | | |
| Ports Design Ltd. | | 2,687,500 | | $ 3,119,499 |
| Quiksilver, Inc. (a) | | 257,168 | | 3,559,205 |
| Ted Baker PLC | | 1,176,408 | | 10,440,139 |
| The Swatch Group AG (Bearer) | | 100 | | 14,840 |
| Tod’s Spa | | 53,800 | | 3,631,031 |
| Wacoal Holdings Corp. sponsored ADR | | 59,600 | | 4,035,516 |
| Weyco Group, Inc. | | 200 | | 3,820 |
| Wolverine World Wide, Inc. | | 150 | | 3,369 |
| | | | | 28,348,453 |
| |
| TOTAL CONSUMER DISCRETIONARY | | | | 618,287,231 |
| |
| CONSUMER STAPLES 5.0% | | | | |
| Beverages 0.1% | | | | |
| Boston Beer Co., Inc. Class A (a) | | 100 | | 2,500 |
| Brick Brewing Co. Ltd. (a) | | 100 | | 191 |
| C&C Group PLC | | 43,900 | | 280,643 |
| Companhia de Bebidas das Americas (AmBev): | | | | |
| (PN) sponsored ADR | | 100 | | 3,805 |
| sponsored ADR | | 20 | | 654 |
| Constellation Brands, Inc. Class A (sub. vtg.) (a) | | 100 | | 2,623 |
| Fomento Economico Mexicano SA de CV sponsored ADR | | 37,700 | | 2,733,627 |
| Grupo Modelo SA de CV Series C | | 241,800 | | 875,551 |
| Hansen Natural Corp. (a) | | 41,500 | | 3,270,615 |
| Jones Soda Co. (a) | | 198,359 | | 1,071,139 |
| MGP Ingredients, Inc. | | 200 | | 2,360 |
| Pernod Ricard SA | | 100 | | 17,450 |
| Tsingtao Brewery Co. Ltd. (H Shares) | | 3,000 | | 3,173 |
| Yantai Changyu Pioneer Wine Co. | | | | |
| (B Shares) | | 100 | | 171 |
| | | | | 8,264,502 |
| Food & Staples Retailing – 0.9% | | | | |
| Alimentation Couche Tard, Inc. Class B (sub. vtg.) | | 100 | | 2,013 |
| Central European Distribution Corp. (a) | | 150 | | 6,021 |
| Daikokutenbussan Co. Ltd. | | 37,200 | | 2,012,943 |
| Heng Tai Consumables Group Ltd. | | 15,898,000 | | 2,275,932 |
| Lianhua Supermarket Holdings Co. | | | | |
| (H Shares) (a) | | 1,000 | | 935 |
| Massmart Holdings Ltd. | | 1,111,569 | | 9,073,495 |
| Metro AG | | 84,100 | | 4,062,121 |
| Plant Co. Ltd. | | 127,000 | | 1,109,453 |
| Pyaterochka Holding NV GDR (a) | | 100 | | 1,445 |
| Shinsegae Co. Ltd. | | 3,490 | | 1,534,561 |
| Sugi Pharmacy Co. Ltd. (d) | | 502,600 | | 23,999,306 |
| Tesco PLC | | 101 | | 576 |
| Valor Co. Ltd. | | 47,500 | | 1,845,130 |
See accompanying notes which are an integral part of the financial statements.
|
125 Annual Report
125
| VIP Mid Cap Portfolio | | | | |
| Investments - continued | | | | |
| |
| |
| |
| | | Shares | | Value (Note 1) |
| Wal Mart de Mexico SA de CV sponsored ADR | | 101 | | $ 5,641 |
| Whole Foods Market, Inc. | | 57,200 | | 4,426,708 |
| | | | | 50,356,280 |
| Food Products – 2.8% | | | | |
| Archer Daniels Midland Co. | | 267,600 | | 6,599,016 |
| Barry Callebaut AG | | 85 | | 27,719 |
| Britannia Industries Ltd. | | 60,541 | | 1,830,223 |
| Chaoda Modern Agriculture (Holdings) Ltd. | | 1,151,700 | | 479,030 |
| China Mengniu Dairy Co. Ltd. | | 3,305,000 | | 2,813,256 |
| COFCO International Ltd. | | 2,000 | | 890 |
| Green Mountain Coffee Roasters, Inc. (a) | | 81,568 | | 3,311,661 |
| Groupe Danone | | 378,800 | | 39,575,040 |
| Groupe Danone sponsored ADR | | 427,300 | | 8,990,392 |
| Heritage Foods (INDIA) Ltd. | | 100 | | 357 |
| Hershey Co. | | 755,800 | | 41,757,950 |
| Hokuto Corp. | | 100 | | 1,587 |
| Hormel Foods Corp. | | 100 | | 3,268 |
| IAWS Group PLC (Ireland) | | 25,450 | | 366,067 |
| Lindt & Spruengli AG | | 1,200 | | 20,045,662 |
| Lindt & Spruengli AG (participation certificate) | | 2,767 | | 4,710,639 |
| McCormick & Co., Inc. (non vtg.) | | 270,700 | | 8,370,044 |
| Peet’s Coffee & Tea, Inc. (a) | | 100 | | 3,035 |
| Poore Brothers, Inc. (a) | | 27 | | 76 |
| PT Indofood Sukses Makmur Tbk | | 58,698,500 | | 5,433,919 |
| Rocky Mountain Chocolate Factory, Inc. | | 100 | | 1,628 |
| Tingyi (Cayman Island) Holding Corp. | | 1,238,000 | | 610,725 |
| Want Want Holdings Ltd. | | 1,645,000 | | 1,636,775 |
| Wimm Bill Dann Foods OJSC sponsored ADR (a) | | 76,800 | | 1,845,504 |
| Wm. Wrigley Jr. Co. | | 240,500 | | 15,990,845 |
| | | | | 164,405,308 |
| Household Products – 0.0% | | | | |
| Hindustan Lever Ltd. | | 104,300 | | 457,117 |
| Kao Corp. | | 1,000 | | 26,801 |
| Reckitt Benckiser PLC | | 300 | | 9,916 |
| | | | | 493,834 |
| Personal Products 1.2% | | | | |
| AmorePacific Corp. | | 100 | | 31,365 |
| Avon Products, Inc. | | 524,279 | | 14,968,165 |
| Body Shop International PLC | | 100 | | 453 |
| Concern Kalina OJSC: | | | | |
| GDR (a)(f) | | 43,243 | | 1,712,183 |
| sponsored ADR | | 43,600 | | 1,726,318 |
| Dabur India Ltd. | | 865,295 | | 4,055,800 |
| Elizabeth Arden, Inc. (a) | | 100 | | 2,006 |
| Godrej Consumer Products Ltd. | | 216,376 | | 2,532,361 |
| Hengan International Group Co. Ltd. | | 33,796,200 | | 38,356,975 |
| Kose Corp. | | 100 | | 4,003 |
| Marico Ltd. | | 100 | | 818 |
See accompanying notes which are an integral part of the financial statements.
| | |
| VIP Mid Cap Portfolio | | 126 |
| Common Stocks continued | | | | | | | | |
| | | | | Shares | | Value (Note 1) |
| |
| CONSUMER STAPLES – continued | | | | | | | | |
| Personal Products – continued | | | | | | | | |
| Natura Cosmeticos SA | | | | 100 | | $ | | 4,426 |
| Shiseido Co. Ltd. sponsored ADR | | | | 321,700 | | | | 5,967,535 |
| | | | | | | | | 69,362,408 |
| Tobacco – 0.0% | | | | | | | | |
| ITC Ltd. | | | | 1,500 | | | | 4,737 |
| |
| TOTAL CONSUMER STAPLES | | | | | | 292,887,069 |
| |
| ENERGY 16.5% | | | | | | | | |
| Energy Equipment & Services 12.0% | | | | | | | | |
| BJ Services Co. | | | | 96,620 | | | | 3,543,055 |
| Cal Dive International, Inc. (a) | | | | 1,041,000 | | | | 37,361,490 |
| Carbo Ceramics, Inc. | | | | 150 | | | | 8,478 |
| Compagnie Generale de Geophysique SA (a) | | | | 100 | | | | 8,849 |
| Cooper Cameron Corp. (a) | | | | 788,400 | | | | 32,639,760 |
| Core Laboratories NV (a) | | | | 934,100 | | | | 34,897,976 |
| Dril Quip, Inc. (a) | | | | 67,800 | | | | 3,200,160 |
| FMC Technologies, Inc. (a) | | | | 580,900 | | | | 24,932,228 |
| Global Industries Ltd. (a) | | | | 922,189 | | | | 10,466,845 |
| GlobalSantaFe Corp. | | | | 728,150 | | | | 35,060,423 |
| Grant Prideco, Inc. (a) | | | | 78,700 | | | | 3,472,244 |
| Gulf Island Fabrication, Inc. | | | | 416,600 | | | | 10,127,546 |
| Helmerich & Payne, Inc. | | | | 226,000 | | | | 13,991,660 |
| Hydril Co. (a) | | | | 100 | | | | 6,260 |
| Input/Output, Inc. (a)(d) | | | | 763,000 | | | | 5,363,890 |
| Nabors Industries Ltd. (a) | | | | 1,020,600 | | | | 77,310,450 |
| National Oilwell Varco, Inc. (a) | | | | 768,362 | | | | 48,176,297 |
| Newpark Resources, Inc. (a) | | | | 818,500 | | | | 6,245,155 |
| Noble Corp. | | | | 827,500 | | | | 58,371,850 |
| NS Group, Inc. (a) | | | | 100 | | | | 4,181 |
| Oceaneering International, Inc. (a) | | | | 388,286 | | | | 19,328,877 |
| Parker Drilling Co. (a)(e) | | | | 5,481,500 | | | | 59,364,645 |
| Pason Systems, Inc. | | | | 1,512,600 | | | | 37,601,944 |
| Patterson UTI Energy, Inc. | | | | 298,700 | | | | 9,842,165 |
| Pioneer Drilling Co. (a) | | | | 198,444 | | | | 3,558,101 |
| Precision Drilling Trust | | | | 442,800 | | | | 14,618,437 |
| Pride International, Inc. (a) | | | | 716,700 | | | | 22,038,525 |
| Rowan Companies, Inc. | | | | 757,300 | | | | 26,990,172 |
| SEACOR Holdings, Inc. (a) | | | | 100 | | | | 6,810 |
| Smith International, Inc. | | | | 598,580 | | | | 22,213,304 |
| Superior Energy Services, Inc. (a) | | | | 634,600 | | | | 13,358,330 |
| Transocean, Inc. (a) | | | | 504,000 | | | | 35,123,760 |
| Unit Corp. (a) | | | | 100 | | | | 5,503 |
| Veritas DGC, Inc. (a) | | | | 100 | | | | 3,549 |
| W H Energy Services, Inc. (a) | | | | 551,900 | | | | 18,256,852 |
| Weatherford International Ltd. (a) | | | | 464,400 | | | | 16,811,280 |
| | | | | | | 704,311,051 |
| Oil, Gas & Consumable Fuels 4.5% | | | | | | | | |
| Amerada Hess Corp. | | | | 52,300 | | | | 6,632,686 |
| Arch Coal, Inc. | | | | 189,100 | | | | 15,033,450 |
| |
See accompanying notes which are an integral part of the financial statements.
| | | | | | | | |
| | | 127 | | | | Annual Report |
127
| VIP Mid Cap Portfolio | | | | |
| Investments - continued | | | | |
| |
| |
| |
| | | Shares | | Value (Note 1) |
| Cameco Corp. | | 61,700 | | $ 3,916,256 |
| Canadian Natural Resources Ltd. | | 378,200 | | 18,748,154 |
| Chesapeake Energy Corp. | | 205,700 | | 6,526,861 |
| China Petroleum & Chemical Corp. sponsored ADR | | 100 | | 4,960 |
| CONSOL Energy, Inc. | | 1,150,900 | | 75,015,662 |
| Forest Oil Corp. (a) | | 499,300 | | 22,753,101 |
| Golar LNG Ltd. (Nasdaq) (a) | | 21,393 | | 283,457 |
| Goodrich Petroleum Corp. (a) | | 295,300 | | 7,426,795 |
| International Coal Group, Inc. (a) | | 604,800 | | 5,745,600 |
| JKX Oil & Gas | | 91 | | 388 |
| Newfield Exploration Co. (a) | | 286,400 | | 14,340,048 |
| Niko Resources Ltd. | | 100 | | 4,750 |
| Oil Search Ltd. | | 1,048,800 | | 2,838,891 |
| OMV AG | | 100 | | 5,860 |
| OPTI Canada, Inc. (a) | | 100 | | 3,283 |
| Peabody Energy Corp. | | 167,700 | | 13,821,834 |
| PetroChina Co. Ltd. sponsored ADR | | 100 | | 8,196 |
| Petroleo Brasileiro SA Petrobras: | | | | |
| (PN) sponsored ADR (non vtg.) | | 100 | | 6,437 |
| sponsored ADR | | 100 | | 7,127 |
| Ship Finance International Ltd. | | | | |
| (NY Shares) | | 446,700 | | 7,549,230 |
| Southwestern Energy Co. (a) | | 408,800 | | 14,692,272 |
| Surgutneftegaz JSC sponsored ADR | | 100 | | 5,347 |
| Talisman Energy, Inc. | | 100 | | 5,299 |
| Tesoro Corp. | | 170,100 | | 10,469,655 |
| TransCanada Corp. (d) | | 646,300 | | 20,374,947 |
| TransMontaigne, Inc. (a) | | 500 | | 3,300 |
| Valero Energy Corp. | | 250,722 | | 12,937,255 |
| Whiting Petroleum Corp. (a) | | 1,600 | | 64,000 |
| World Fuel Services Corp. | | 46,600 | | 1,571,352 |
| XTO Energy, Inc. | | 166 | | 7,294 |
| | | | | 260,803,747 |
| |
| TOTAL ENERGY | | | | 965,114,798 |
| |
| FINANCIALS – 9.1% | | | | |
| Capital Markets 0.3% | | | | |
| Ameriprise Financial, Inc. | | 20 | | 820 |
| Ameritrade Holding Corp. | | 100 | | 2,400 |
| BlackRock, Inc. Class A | | 100 | | 10,848 |
| Deutsche Bank AG (NY Shares) | | 100 | | 9,687 |
| Eaton Vance Corp. (non vtg.) | | 200 | | 5,472 |
| Indiabulls Financial Services Ltd. | | 300 | | 1,268 |
| International Assets Holding Corp. (a) | | 100 | | 910 |
| Korea Investment Holdings Co. Ltd. | | 383,270 | | 16,357,928 |
| Legg Mason, Inc. | | 100 | | 11,969 |
| Matsui Securities Co. Ltd. | | 100 | | 1,388 |
| Nuveen Investments, Inc. Class A | | 100 | | 4,262 |
| optionsXpress Holdings, Inc. | | 100 | | 2,455 |
| T. Rowe Price Group, Inc. | | 200 | | 14,406 |
| TradeStation Group, Inc. (a) | | 10,100 | | 125,038 |
| | | | | 16,548,851 |
See accompanying notes which are an integral part of the financial statements.
| | |
| VIP Mid Cap Portfolio | | 128 |
| Common Stocks continued | | | | |
| | | Shares | | Value (Note 1) |
| |
| FINANCIALS – continued | | | | |
| Commercial Banks – 2.8% | | | | |
| Allahabad Bank | | 71,000 | | $ 131,207 |
| Banco Itau Holding Financeira SA: | | | | |
| (PN) | | 9,000 | | 214,810 |
| sponsored ADR (non vtg.) | | 235,500 | | 5,656,710 |
| Banco Pastor SA (Reg.) | | 478,600 | | 22,963,917 |
| Bank of Baroda | | 1,460,904 | | 7,831,640 |
| Bank of Fukuoka Ltd. | | 3,538,600 | | 30,282,410 |
| Bank of India | | 2,962,900 | | 8,356,307 |
| Boston Private Financial Holdings, Inc. | | 386,867 | | 11,768,494 |
| Canara Bank | | 660,149 | | 3,539,526 |
| Capitalia Spa | | 79 | | 457 |
| Cathay General Bancorp | | 20 | | 719 |
| Center Financial Corp., California | | 103,900 | | 2,614,124 |
| Colonial Bancgroup, Inc. | | 234,100 | | 5,576,262 |
| Commerce Bancorp, Inc., New Jersey | | 200 | | 6,882 |
| Corp. Bank | | 479,299 | | 3,867,840 |
| CVB Financial Corp. | | 137 | | 2,782 |
| DnB NOR ASA | | 100 | | 1,067 |
| Erste Bank der Oesterreichischen Sparkassen AG | | 100 | | 5,570 |
| Fulton Financial Corp. | | 13 | | 229 |
| HDFC Bank Ltd. sponsored ADR | | 84,900 | | 4,321,410 |
| Hiroshima Bank Ltd. | | 1,563,900 | | 10,107,221 |
| Hokuhoku Financial Group, Inc. | | 100 | | 467 |
| ICICI Bank Ltd. sponsored ADR | | 62,100 | | 1,788,480 |
| Industrial & Commercial Bank of China (Asia) Ltd. | | 1,000 | | 1,225 |
| Juroku Bank Ltd. | | 1,155,400 | | 8,711,680 |
| Lakeland Financial Corp. | | 100 | | 4,038 |
| M&T Bank Corp. | | 100 | | 10,905 |
| Oriental Bank of Commerce | | 89,627 | | 559,653 |
| OTP Bank Rt. | | 100 | | 3,265 |
| PrivateBancorp, Inc. | | 66,700 | | 2,372,519 |
| PT Bank Central Asia Tbk | | 500 | | 173 |
| Punjab National Bank | | 99,500 | | 1,092,919 |
| Sberbank RF GDR (a) | | 200 | | 26,213 |
| State Bancorp, Inc., New York | | 6 | | 100 |
| State Bank of India | | 689,845 | | 15,134,735 |
| Sumitomo Trust & Banking Co. Ltd. | | 811,000 | | 8,288,495 |
| TCF Financial Corp. | | 200 | | 5,428 |
| Texas Regional Bancshares, Inc. Class A | | 150 | | 4,245 |
| The Keiyo Bank Ltd. | | 806,400 | | 5,751,940 |
| UCBH Holdings, Inc. | | 100 | | 1,788 |
| Uti Bank Ltd. | | 673,100 | | 4,292,611 |
| Westcorp | | 100 | | 6,661 |
| Wintrust Financial Corp. | | 100 | | 5,490 |
| | | | | 165,312,614 |
| Consumer Finance – 0.0% | | | | |
| Advanta Corp. Class B | | 100 | | 3,244 |
See accompanying notes which are an integral part of the financial statements.
|
129 Annual Report
129
| VIP Mid Cap Portfolio | | | | |
| Investments - continued | | | | |
| |
| |
| |
| | | Shares | | Value (Note 1) |
| American Express Co. | | 100 | | $ 5,146 |
| First Cash Financial Services, Inc. (a) | | 150 | | 4,374 |
| | | | | 12,764 |
| Diversified Financial Services – 0.8% | | | | |
| Alliance Capital Management Holding LP | | 236,400 | | 13,354,236 |
| Infrastructure Development Finance Co. Ltd. | | 100 | | 163 |
| IntercontinentalExchange, Inc. | | 176,100 | | 6,401,235 |
| Kotak Mahindra Bank Ltd. | | 1,473,664 | | 7,316,734 |
| Moody’s Corp. | | 156,853 | | 9,633,911 |
| Power Financial Corp. | | 100 | | 2,873 |
| Principal Financial Group, Inc. | | 100 | | 4,743 |
| TSX Group, Inc. | | 203,300 | | 8,189,359 |
| | | | | 44,903,254 |
| Insurance – 3.4% | | | | |
| ACE Ltd. | | 100 | | 5,344 |
| Admiral Group PLC | | 367,500 | | 2,878,647 |
| AFLAC, Inc. | | 783,600 | | 36,374,712 |
| American International Group, Inc. | | 254,700 | | 17,378,181 |
| Assurant, Inc. | | 1,841,000 | | 80,065,090 |
| Baloise Holdings AG (Reg.) | | 100 | | 5,841 |
| Brown & Brown, Inc. | | 209,800 | | 6,407,292 |
| Erie Indemnity Co. Class A | | 100 | | 5,320 |
| Everest Re Group Ltd. | | 156,000 | | 15,654,600 |
| Genworth Financial, Inc. Class A (non vtg.) | | 100 | | 3,458 |
| Hilb Rogal & Hobbs Co. | | 200 | | 7,702 |
| Mercury General Corp. | | 100 | | 5,822 |
| Ohio Casualty Corp. | | 122,800 | | 3,477,696 |
| Ping An Insurance (Group) Co. of China, Ltd. (H Shares) | | 5,779,500 | | 10,659,090 |
| Progressive Corp. | | 90,200 | | 10,533,556 |
| Reinsurance Group of America, Inc. | | 100 | | 4,776 |
| UNIPOL Assicurazioni Spa | | 100 | | 281 |
| Universal American Financial Corp. (a) | | 577,116 | | 8,702,909 |
| UnumProvident Corp. | | 100 | | 2,275 |
| USI Holdings Corp. (a) | | 168,300 | | 2,317,491 |
| W.R. Berkley Corp. | | 113,513 | | 5,405,465 |
| Zenith National Insurance Corp. | | 450 | | 20,754 |
| | | | | 199,916,302 |
| Real Estate 1.6% | | | | |
| Aeon Mall Co. Ltd. | | 335,000 | | 16,337,306 |
| British Land Co. PLC | | 100 | | 1,835 |
| Corporate Office Properties Trust (SBI) | | 100 | | 3,554 |
| Diamond City Co. Ltd. | | 417,400 | | 17,063,467 |
| Digital Realty Trust, Inc. | | 900,800 | | 20,385,104 |
| Equity Office Properties Trust | | 210,400 | | 6,381,432 |
| Equity Residential (SBI) | | 558,700 | | 21,856,344 |
| General Growth Properties, Inc. | | 172,400 | | 8,101,076 |
| Land Securities Group PLC | | 100 | | 2,863 |
| Mitsui Fudosan Co. Ltd. | | 31,000 | | 629,702 |
| Plum Creek Timber Co., Inc. | | 100 | | 3,605 |
| Shun Tak Holdings Ltd. | | 530,200 | | 488,922 |
See accompanying notes which are an integral part of the financial statements.
| | |
| VIP Mid Cap Portfolio | | 130 |
| Common Stocks continued | | | | | | | | |
| | | | | Shares | | Value (Note 1) |
| |
| FINANCIALS – continued | | | | | | | | |
| Real Estate continued | | | | | | | | |
| W.P. Carey & Co. LLC | | | | 8,000 | | $ | | 202,880 |
| Weingarten Realty Investors (SBI) | | | | 161,300 | | | | 6,098,753 |
| | | | | | | | | 97,556,843 |
| Thrifts & Mortgage Finance – 0.2% | | | | | | | | |
| Doral Financial Corp. | | | | 100 | | | | 1,060 |
| Housing Development Finance Corp. Ltd. | | | | 163,904 | | | | 4,396,758 |
| MGIC Investment Corp. | | | | 100 | | | | 6,582 |
| NetBank, Inc. | | | | 943,664 | | | | 6,775,508 |
| Radian Group, Inc. | | | | 100 | | | | 5,859 |
| | | | | | | | | 11,185,767 |
| |
| TOTAL FINANCIALS | | | | | | 535,436,395 |
| |
| HEALTH CARE 17.2% | | | | | | | | |
| Biotechnology – 2.4% | | | | | | | | |
| Albany Molecular Research, Inc. (a) | | | | 620,902 | | | | 7,543,959 |
| Alexion Pharmaceuticals, Inc. (a) | | | | 100 | | | | 2,025 |
| Alnylam Pharmaceuticals, Inc. (a) | | | | 100 | | | | 1,336 |
| Applera Corp. – Celera Genomics Group (a) | | | | 100 | | | | 1,096 |
| Bachem Holding AG (B Shares) | | | | 100 | | | | 5,746 |
| BioCryst Pharmaceuticals, Inc. (a) | | | | 100 | | | | 1,675 |
| Celgene Corp. (a) | | | | 200 | | | | 12,960 |
| Ciphergen Biosystems, Inc. (a) | | | | 100 | | | | 118 |
| CSL Ltd. | | | | 83 | | | | 2,588 |
| CuraGen Corp. (a) | | | | 100 | | | | 308 |
| CytRx Corp. (a) | | | | 100 | | | | 103 |
| deCODE genetics, Inc. (a) | | | | 100 | | | | 826 |
| Dendreon Corp. (a) | | | | 100 | | | | 542 |
| Digene Corp. (a) | | | | 100 | | | | 2,917 |
| Genentech, Inc. (a) | | | | 25,500 | | | | 2,358,750 |
| Harvard Bioscience, Inc. (a)(e) | | | | 2,496,047 | | | | 11,107,409 |
| Illumina, Inc. (a) | | | | 100 | | | | 1,410 |
| ImmunoGen, Inc. (a) | | | | 139,700 | | | | 716,661 |
| Invitrogen Corp. (a) | | | | 273,630 | | | | 18,234,703 |
| Lexicon Genetics, Inc. (a) | | | | 100 | | | | 365 |
| Luminex Corp. (a) | | | | 100 | | | | 1,162 |
| Martek Biosciences (a) | | | | 98 | | | | 2,412 |
| MedImmune, Inc. (a) | | | | 100 | | | | 3,502 |
| Myriad Genetics, Inc. (a) | | | | 87,000 | | | | 1,809,600 |
| Nektar Therapeutics (a) | | | | 100 | | | | 1,646 |
| Orchid Cellmark, Inc. (a) | | | | 100 | | | | 760 |
| Orthologic Corp. (a) | | | | 100,600 | | | | 492,940 |
| OSI Pharmaceuticals, Inc. (a) | | | | 135,700 | | | | 3,805,028 |
| Pro Pharmaceuticals, Inc. (a) | | | | 100 | | | | 305 |
| QIAGEN NV (a) | | | | 5,693,500 | | | | 66,898,625 |
| Renovis, Inc. (a) | | | | 100 | | | | 1,530 |
| Sangamo Biosciences, Inc. (a) | | | | 100 | | | | 403 |
| Seattle Genetics, Inc. (a) | | | | 3,600 | | | | 16,992 |
| Serologicals Corp. (a) | | | | 100 | | | | 1,974 |
| Sirna Therapeutics, Inc. (a) | | | | 100 | | | | 303 |
| |
See accompanying notes which are an integral part of the financial statements.
| | | | | | | | |
| | | 131 | | | | Annual Report |
| VIP Mid Cap Portfolio | | | | | | |
| Investments - continued | | | | | | |
| |
| |
| |
| | | | | Shares | | Value (Note 1) |
| Stratagene Corp. (e) | | | | 1,441,447 | | $ 14,472,128 |
| Tanox, Inc. (a) | | | | 100 | | 1,637 |
| Telik, Inc. (a) | | | | 100 | | 1,699 |
| ViroPharma, Inc. (a) | | | | 569,600 | | 10,566,080 |
| | | | | | | 138,074,223 |
| Health Care Equipment & Supplies 4.2% | | | | |
| ArthroCare Corp. (a) | | | | 95,000 | | 4,003,300 |
| Beckman Coulter, Inc. | | | | 316,900 | | 18,031,610 |
| Bio Rad Laboratories, Inc. Class A (a) | | | | 100 | | 6,544 |
| BioLase Technology, Inc. (a) | | | | 100 | | 799 |
| bioMerieux SA | | | | 100 | | 5,276 |
| Biophan Technologies, Inc. (a) | | | | 100 | | 152 |
| Bruker BioSciences Corp. (a) | | | | 24,463 | | 118,890 |
| Clarient, Inc. (a) | | | | 100 | | 130 |
| Cyberonics, Inc. (a) | | | | 200 | | 6,460 |
| Cytyc Corp. (a) | | | | 100 | | 2,823 |
| DENTSPLY International, Inc. | | | | 172,400 | | 9,256,156 |
| Dionex Corp. (a) | | | | 100 | | 4,908 |
| Edwards Lifesciences Corp. (a) | | | | 100 | | 4,161 |
| Endocare, Inc. (a) | | | | 144,600 | | 396,204 |
| Epix Pharmaceuticals, Inc. (a) | | | | 178,600 | | 721,544 |
| Fisher Scientific International, Inc. (a) | | | | 100 | | 6,186 |
| Gen Probe, Inc. (a) | | | | 100 | | 4,879 |
| Greatbatch, Inc. (a) | | | | 800 | | 20,808 |
| Haemonetics Corp. (a) | | | | 996,325 | | 48,680,440 |
| Hospira, Inc. (a) | | | | 100 | | 4,278 |
| IDEXX Laboratories, Inc. (a) | | | | 42,500 | | 3,059,150 |
| INAMED Corp. (a) | | | | 70,450 | | 6,177,056 |
| IntraLase Corp. (a) | | | | 100 | | 1,783 |
| Intuitive Surgical, Inc. (a) | | | | 100 | | 11,727 |
| Kinetic Concepts, Inc. (a) | | | | 200 | | 7,952 |
| Millipore Corp. (a) | | | | 744,700 | | 49,179,988 |
| Neogen Corp. (a) | | | | 109,363 | | 2,297,722 |
| Osteotech, Inc. (a) | | | | 100 | | 497 |
| PolyMedica Corp. | | | | 82 | | 2,745 |
| Possis Medical, Inc. (a) | | | | 100 | | 995 |
| SonoSite, Inc. (a) | | | | 100 | | 3,501 |
| Stereotaxis, Inc. (a) | | | | 100 | | 861 |
| Strategic Diagnostics, Inc. (a)(e) | | | | 1,481,500 | | 5,392,660 |
| Synthes, Inc. | | | | 81 | | 9,099 |
| Thermo Electron Corp. (a) | | | | 2,554,200 | | 76,958,046 |
| Thoratec Corp. (a) | | | | 100 | | 2,069 |
| Varian Medical Systems, Inc. (a) | | | | 100 | | 5,034 |
| Ventana Medical Systems, Inc. (a) | | | | 115,600 | | 4,895,660 |
| Waters Corp. (a) | | | | 392,420 | | 14,833,476 |
| Young Innovations, Inc. | | | | 100 | | 3,408 |
| Zimmer Holdings, Inc. (a) | | | | 100 | | 6,744 |
| Zoll Medical Corp. (a) | | | | 100 | | 2,519 |
| | | | | | | 244,128,240 |
| Health Care Providers & Services 8.4% | | | | |
| Aetna, Inc. | | | | 428,100 | | 40,374,111 |
| American Dental Partners, Inc. (a) | | | | 50 | | 904 |
| American Retirement Corp. (a) | | | | 511,100 | | 12,843,943 |
See accompanying notes which are an integral part of the financial statements.
| | |
| VIP Mid Cap Portfolio | | 132 |
| Common Stocks continued | | | | | | | | |
| | | | | Shares | | Value (Note 1) |
| |
| HEALTH CARE continued | | | | | | | | |
| Health Care Providers & Services continued | | | | | | | | |
| Apollo Hospitals Enterprise Ltd. | | | | 57,000 | | $ | | 631,567 |
| Apollo Hospitals Enterprise Ltd. GDR (a)(f) | | | | 126,100 | | | | 1,395,188 |
| Bio Imaging Technologies, Inc. (a) | | | | 100 | | | | 320 |
| Caremark Rx, Inc. (a) | | | | 1,103,106 | | | | 57,129,860 |
| Cerner Corp. (a) | | | | 54,917 | | | | 4,992,504 |
| Community Health Systems, Inc. (a) | | | | 557,100 | | | | 21,359,214 |
| Covance, Inc. (a) | | | | 1,343,100 | | | | 65,207,505 |
| Coventry Health Care, Inc. (a) | | | | 75 | | | | 4,272 |
| Diagnosticos da America SA (a) | | | | 141,400 | | | | 2,660,736 |
| Dynacq Healthcare, Inc. (a)(d) | | | | 100 | | | | 243 |
| Eclipsys Corp. (a)(e) | | | | 2,486,200 | | | | 47,063,766 |
| Emageon, Inc. | | | | 489,800 | | | | 7,787,820 |
| Evotec OAI AG (a) | | | | 100 | | | | 296 |
| Gambro AB (A Shares) | | | | 100 | | | | 1,092 |
| Health Grades, Inc. (a) | | | | 328,311 | | | | 2,058,510 |
| Health Net, Inc. (a) | | | | 100 | | | | 5,155 |
| Humana, Inc. (a) | | | | 1,284,200 | | | | 69,770,586 |
| ICON PLC sponsored ADR (a) | | | | 199,126 | | | | 8,192,044 |
| IMS Health, Inc. | | | | 2,247,400 | | | | 56,005,208 |
| iSoft Group PLC | | | | 35 | | | | 235 |
| Merge Technologies, Inc. (a) | | | | 41,800 | | | | 1,046,672 |
| National Research Corp. | | | | 100 | | | | 1,730 |
| NDCHealth Corp. (a) | | | | 100 | | | | 1,923 |
| Omnicare, Inc. | | | | 472,650 | | | | 27,045,033 |
| Per Se Technologies, Inc. (a) | | | | 100 | | | | 2,336 |
| Pharmaceutical Product Development, Inc. | | | | 2,300 | | | | 142,485 |
| Quest Diagnostics, Inc. | | | | 100 | | | | 5,148 |
| Ramsay Health Care Ltd. | | | | 100 | | | | 697 |
| Renal Care Group, Inc. (a) | | | | 50 | | | | 2,366 |
| ResCare, Inc. (a)(e) | | | | 1,627,003 | | | | 28,261,042 |
| Sunrise Senior Living, Inc. (a)(d) | | | | 766,600 | | | | 25,842,086 |
| TriZetto Group, Inc. (a) | | | | 546,900 | | | | 9,291,831 |
| VCA Antech, Inc. (a) | | | | 170,800 | | | | 4,816,560 |
| WellPoint, Inc. (a) | | | | 400 | | | | 31,916 |
| | | | | | | 493,976,904 |
| Pharmaceuticals 2.2% | | | | | | | | |
| Able Laboratories, Inc. (a) | | | | 100 | | | | 15 |
| Allergan, Inc. | | | | 164,400 | | | | 17,748,624 |
| American Pharmaceutical Partners, Inc. (a) | | | | 50 | | | | 1,940 |
| Aventis Pharma Ltd. | | | | 100 | | | | 3,695 |
| Bentley Pharmaceuticals, Inc. (a) | | | | 256,000 | | | | 4,200,960 |
| Boiron SA | | | | 55 | | | | 1,413 |
| Caraco Pharmaceutical Laboratories Ltd. (a) | | | | 100 | | | | 898 |
| Cipla Ltd. | | | | 50,500 | | | | 502,811 |
| Connetics Corp. (a) | | | | 100 | | | | 1,445 |
| Dr. Reddy’s Laboratories Ltd. sponsored ADR | | | | 85,100 | | | | 1,838,160 |
| |
| |
| | | | | Shares | | Value (Note 1) |
| Eisai Co. Ltd. sponsored ADR | | | | 100 | | $ | | 4,250 |
| GlaxoSmithkline Pharmaceuticals Ltd. | | | | 100 | | | | 2,493 |
See accompanying notes which are an integral part of the financial statements.
| | | | | | | | |
| | | 133 | | | | Annual Report |
133
| VIP Mid Cap Portfolio | | | | |
| Investments - continued | | | | |
| |
| |
| | Shares | | Value (Note 1) |
| | | | |
| | | | |
| Kos Pharmaceuticals, Inc. (a) | | 640,193 | | 33,117,184 |
| Medicis Pharmaceutical Corp. Class A | | 180,000 | | 5,769,000 |
| Merck KGaA | | 375,821 | | 31,121,853 |
| New River Pharmaceuticals, Inc. (a) | | 100 | | 5,188 |
| Pfizer Ltd. | | 100 | | 2,259 |
| Ranbaxy Laboratories Ltd. sponsored GDR | | 527,746 | | 4,216,691 |
| Roche Holding AG: | | | | |
| (participation certificate) | | 154,849 | | 23,250,919 |
| sponsored ADR | | 62,700 | | 4,708,770 |
| Schering Plough Corp. | | 100 | | 2,085 |
| Sepracor, Inc. (a) | | 100 | | 5,160 |
| SuperGen, Inc. (a) | | 100 | | 505 |
| Valeant Pharmaceuticals International | | 211,500 | | 3,823,920 |
| | | | | 130,330,238 |
| |
| TOTAL HEALTH CARE | | | | 1,006,509,605 |
See accompanying notes which are an integral part of the financial statements.
| | |
| VIP Mid Cap Portfolio | | 134 |
| | Shares | | Value (Note 1) |
| | | | |
| | | | |
| INDUSTRIALS – 13.9% | | | | |
| Aerospace & Defense – 1.0% | | | | |
| CAE, Inc. | | 1,045,200 | | 7,659,975 |
| Ceradyne, Inc. (a)(d) | | 349,734 | | 15,318,349 |
| EDO Corp. | | 100 | | 2,706 |
| Embraer – Empresa Brasileira de Aeronautica SA sponsored ADR | | 100 | | 3,910 |
| Esterline Technologies Corp. (a) | | 708,691 | | 26,356,218 |
| General Dynamics Corp. | | 100 | | 11,405 |
| L 3 Communications Holdings, Inc. | | 88,300 | | 6,565,105 |
| Precision Castparts Corp. | | 200 | | 10,362 |
| Rockwell Collins, Inc. | | 100 | | 4,647 |
| | | | | 55,932,677 |
| Air Freight & Logistics – 0.2% | | | | |
| Business Post Group PLC | | 200 | | 1,153 |
| Expeditors International of Washington, Inc. | | 100 | | 6,751 |
| Forward Air Corp. | | 150 | | 5,498 |
| Hub Group, Inc. Class A (a) | | 341,067 | | 12,056,718 |
| UTI Worldwide, Inc. | | 100 | | 9,284 |
| | | | | 12,079,404 |
| Airlines – 0.2% | | | | |
| ACE Aviation Holdings, Inc. Class A (a) | | 312,800 | | 10,224,420 |
| Air China Ltd. (H Shares) (a) | | 2,000 | | 638 |
| easyJet PLC (a) | | 100 | | 651 |
| Ryanair Holdings PLC sponsored ADR (a) | | 64,000 | | 3,583,360 |
| Southwest Airlines Co. | | 100 | | 1,643 |
| | | | | 13,810,712 |
| Building Products – 0.2% | | | | |
| American Woodmark Corp. | | 200 | | 4,958 |
| Simpson Manufacturing Co. Ltd. | | 228,200 | | 8,295,070 |
| Trex Co., Inc. (a) | | 100 | | 2,805 |
See accompanying notes which are an integral part of the financial statements.
135 Annual Report
| VIP Mid Cap Portfolio | | | | |
| Investments - continued | | | | |
| |
| |
| Common Stocks continued | | | | |
| | | Shares | | Value (Note 1) |
| |
| INDUSTRIALS – continued | | | | |
| Building Products – continued | | | | |
| USG Corp. (a) | | 100 | | $ 6,500 |
| Wienerberger Baustoffindust AG | | 100 | | 4,001 |
| | | | | 8,313,334 |
| Commercial Services & Supplies 3.0% | | | | |
| Advisory Board Co. (a) | | 100 | | 4,767 |
| Bennett Environmental, Inc. (a) | | 167,100 | | 518,886 |
| CDI Corp. | | 621,600 | | 17,031,840 |
| ChoicePoint, Inc. (a) | | 1,134,700 | | 50,505,497 |
| Cintas Corp. | | 917,325 | | 37,775,444 |
| Corporate Executive Board Co. | | 100 | | 8,970 |
| CoStar Group, Inc. (a) | | 100 | | 4,317 |
| Dun & Bradstreet Corp. (a) | | 100 | | 6,696 |
| Fullcast Co. Ltd. (d) | | 5,746 | | 19,103,788 |
| GFK AG | | 20 | | 670 |
| Intertek Group PLC | | 436,200 | | 5,234,053 |
| Monster Worldwide, Inc. (a) | | 317,300 | | 12,952,186 |
| PICO Holdings, Inc. (a) | | 100 | | 3,226 |
| Pike Electric Corp. | | 100 | | 1,622 |
| Randstad Holdings NV | | 86,700 | | 3,765,854 |
| Ritchie Brothers Auctioneers, Inc. | | 33,100 | | 1,398,475 |
| Robert Half International, Inc. | | 100 | | 3,789 |
| Rollins, Inc. | | 100 | | 1,971 |
| Societe Generale de Surveillance Holding SA (SGS) (Reg.) | | 14,791 | | 12,472,167 |
| Stericycle, Inc. (a) | | 222,100 | | 13,077,248 |
| Tele Atlas NV (a) | | 65,600 | | 1,755,905 |
| | | | | 175,627,371 |
| Construction & Engineering – 1.8% | | | | |
| Arcadis NV | | 9,700 | | 307,754 |
| Arcadis NV (NY Shares) | | 200 | | 6,320 |
| Chicago Bridge & Iron Co. NV | | | | |
| (NY Shares) | | 605,600 | | 15,267,176 |
| Daelim Industrial Co. | | 58,000 | | 4,144,914 |
| EMCOR Group, Inc. (a) | | 100 | | 6,753 |
| Fluor Corp. | | 136,100 | | 10,515,086 |
| Infrasource Services, Inc. (a) | | 100 | | 1,308 |
| Insituform Technologies, Inc. Class A (a) | | 100 | | 1,937 |
| Jacobs Engineering Group, Inc. (a) | | 430,900 | | 29,245,183 |
| Larsen & Toubro Ltd. | | 100 | | 4,101 |
| LG Engineering & Construction Co. Ltd. | | 100 | | 5,261 |
| Orascom Construction Industries SAE GDR | | 100 | | 7,500 |
| PTC India Ltd. | | 100 | | 132 |
| Quanta Services, Inc. (a) | | 100 | | 1,317 |
| Shaw Group, Inc. (a) | | 1,283,700 | | 37,342,833 |
| SNC Lavalin Group, Inc. | | 100 | | 6,563 |
| United Group Ltd. | | 1,285,700 | | 10,883,665 |
| | | | | 107,747,803 |
| Electrical Equipment 1.8% | | | | |
| AstroPower, Inc. (a) | | 100 | | 0 |
See accompanying notes which are an integral part of the financial statements.
| | |
| VIP Mid Cap Portfolio | | 136 |
| | | Shares | | Value (Note 1) |
| Bharat Heavy Electricals Ltd. | | 100 | | $ 3,114 |
| C&D Technologies, Inc. | | 490,700 | | 3,739,134 |
| Crompton Greaves Ltd. | | 144,396 | | 2,441,045 |
| Fujikura Ltd. | | 1,000 | | 8,108 |
| II VI, Inc. (a) | | 200 | | 3,574 |
| Johnson Electric Holdings Ltd. sponsored ADR | | 100 | | 940 |
| Rockwell Automation, Inc. | | 1,401,100 | | 82,889,076 |
| Roper Industries, Inc. | | 281,300 | | 11,114,163 |
| Shanghai Electric (Group) Corp. | | | | |
| (H Shares) | | 2,000 | | 684 |
| SolarWorld AG | | 27,100 | | 3,625,304 |
| | | | | 103,825,142 |
| Industrial Conglomerates 0.8% | | | | |
| Aditya Birla Nuvo Ltd. | | 100 | | 1,478 |
| Fu Sheng Industrial Co. Ltd. | | 2,295,000 | | 2,922,365 |
| Hutchison Whampoa Ltd. ADR | | 100 | | 4,740 |
| Max India Ltd. (a) | | 395,174 | | 5,273,964 |
| Shanghai Industrial Holdings Ltd. Class H | | 1,000 | | 2,083 |
| Smiths Group PLC | | 100 | | 1,801 |
| Teleflex, Inc. | | 582,400 | | 37,844,352 |
| | | | | 46,050,783 |
| Machinery – 4.4% | | | | |
| AGCO Corp. (a) | | 3,632,500 | | 60,190,525 |
| Badger Meter, Inc. | | 258,700 | | 10,151,388 |
| Bucher Holding AG | | 500 | | 39,878 |
| Danaher Corp. | | 100 | | 5,578 |
| Deutz AG (a) | | 100 | | 490 |
| Dover Corp. | | 260,700 | | 10,555,743 |
| Eicher Motors Ltd. | | 342,065 | | 1,744,345 |
| Flowserve Corp. (a) | | 458,000 | | 18,118,480 |
| Graco, Inc. | | 326,300 | | 11,903,424 |
| Harsco Corp. | | 954,799 | | 64,458,480 |
| Heidelberger Druckmaschinen AG | | 178,400 | | 6,825,947 |
| Hexagon AB (B Shares) | | 100 | | 2,983 |
| Jain Irrigation Systems Ltd. (a) | | 100 | | 466 |
| Koyo Seiko Co. Ltd. | | 1,000 | | 18,617 |
| Krones AG | | 2,900 | | 292,197 |
| MAN AG | | 100 | | 5,337 |
| Manitowoc Co., Inc. | | 100 | | 5,022 |
| Middleby Corp. (a) | | 100 | | 8,650 |
| PACCAR, Inc. | | 150 | | 10,385 |
| Pall Corp. | | 100 | | 2,686 |
| Pentair, Inc. | | 654,500 | | 22,593,340 |
| Railpower Technologies Corp. (a) | | 100 | | 556 |
| Tata Motors Ltd. | | 452,400 | | 6,569,578 |
| Tata Motors Ltd. sponsored ADR (d) | | 17,100 | | 245,727 |
| Terex Corp. (a) | | 495,200 | | 29,414,880 |
| Timken Co. | | 148,800 | | 4,764,576 |
| Toshiba Machine Co. Ltd. | | 1,000 | | 9,898 |
| Valmont Industries, Inc. | | 100 | | 3,346 |
See accompanying notes which are an integral part of the financial statements.
|
137 Annual Report
137
| VIP Mid Cap Portfolio | | | | |
| Investments - continued | | | | |
| |
| |
| Common Stocks continued | | | | |
| | | Shares | | Value (Note 1) |
| |
| INDUSTRIALS – continued | | | | |
| Machinery – continued | | | | |
| Wabtec Corp. | | 246,700 | | $ 6,636,230 |
| Zenon Environmental, Inc. (a) | | 336,100 | | 4,862,760 |
| | | | | 259,441,512 |
| Marine – 0.1% | | | | |
| Alexander & Baldwin, Inc. | | 100,745 | | 5,464,409 |
| Hanjin Shipping Co. Ltd. | | 80 | | 1,826 |
| Odfjell ASA: | | | | |
| (A Shares) | | 41,500 | | 842,908 |
| (B Shares) | | 400 | | 6,938 |
| | | | | 6,316,081 |
| Road & Rail 0.0% | | | | |
| Burlington Northern Santa Fe Corp. | | 100 | | 7,082 |
| CNF, Inc. | | 100 | | 5,589 |
| Guangshen Railway Co. Ltd. sponsored ADR | | 100 | | 1,552 |
| Heartland Express, Inc. | | 150 | | 3,044 |
| Knight Transportation, Inc. | | 225 | | 4,664 |
| Old Dominion Freight Lines, Inc. (a) | | 225 | | 6,071 |
| | | | | 28,002 |
| Trading Companies & Distributors – 0.4% | | | | |
| Bunzl PLC | | 78 | | 857 |
| Fastenal Co. | | 233,200 | | 9,139,108 |
| GATX Corp. | | 100 | | 3,608 |
| MSC Industrial Direct Co., Inc. Class A | | 288,300 | | 11,595,426 |
| NuCo2, Inc. (a) | | 64,000 | | 1,784,320 |
| Richelieu Hardware Ltd | | 100 | | 2,039 |
| STB Leasing Co. Ltd. | | 100 | | 2,036 |
| United Rentals, Inc. (a) | | 100 | | 2,339 |
| W.W. Grainger, Inc. | | 27,600 | | 1,962,360 |
| WESCO International, Inc. (a) | | 100 | | 4,273 |
| | | | | 24,496,366 |
| Transportation Infrastructure – 0.0% | | | | |
| Anhui Expressway Co. Ltd. (H Shares) | | 2,000 | | 967 |
| Macquarie Infrastructure Group unit | | 100 | | 261 |
| Sea Containers Ltd. Class B (a) | | 7,900 | | 96,933 |
| | | | | 98,161 |
| |
| TOTAL INDUSTRIALS | | | | 813,767,348 |
| |
| INFORMATION TECHNOLOGY 10.7% | | | | |
| Communications Equipment – 0.5% | | | | |
| Arris Group, Inc. (a) | | 100 | | 947 |
| AudioCodes Ltd. (a) | | 100 | | 1,110 |
| Avaya, Inc. (a) | | 100 | | 1,067 |
| Black Box Corp. | | 100 | | 4,738 |
| Comtech Telecommunications Corp. (a) | | 150 | | 4,581 |
| EFJ, Inc. (a) | | 100 | | 1,015 |
| Foxconn International Holdings Ltd. | | 1,000 | | 1,631 |
| Harris Corp. | | 100 | | 4,301 |
| Ixia (a) | | 869,100 | | 12,845,298 |
See accompanying notes which are an integral part of the financial statements.
| | |
| VIP Mid Cap Portfolio | | 138 |
| | | | | Shares | | Value (Note 1) |
| Juniper Networks, Inc. (a) | | | | 200 | | $ | | 4,460 |
| NETGEAR, Inc. (a) | | | | 724,500 | | | | 13,946,625 |
| Option NV (a) | | | | 90 | | | | 6,686 |
| Plantronics, Inc. | | | | 100 | | | | 2,830 |
| Polycom, Inc. (a) | | | | 200 | | | | 3,060 |
| Powerwave Technologies, Inc. (a) | | | | 100 | | | | 1,257 |
| Redback Networks, Inc. (a) | | | | 100 | | | | 1,406 |
| Research In Motion Ltd. (a) | | | | 100 | | | | 6,602 |
| TANDBERG ASA | | | | 26,600 | | | | 162,871 |
| | | | | | | | | 27,000,485 |
| Computers & Peripherals 1.7% | | | | | | | | |
| Apple Computer, Inc. (a) | | | | 806,100 | | | | 57,950,529 |
| Compal Electronics, Inc. | | | | 1,113 | | | | 1,004 |
| Creative Technology Ltd. (Nasdaq) | | | | 100 | | | | 842 |
| Foxconn Technology Co. Ltd. | | | | 1,100 | | | | 5,479 |
| Gemplus International SA sponsored ADR (a) | | | | 100 | | | | 530 |
| Komag, Inc. (a) | | | | 209,875 | | | | 7,274,268 |
| Logitech International SA (Reg.) (a) | | | | 55,000 | | | | 2,584,665 |
| M Systems Flash Disk Pioneers Ltd. (a) | | | | 900 | | | | 29,808 |
| Moser Baer India Ltd. | | | | 200 | | | | 876 |
| NCR Corp. (a) | | | | 100 | | | | 3,394 |
| NEC Corp. sponsored ADR | | | | 1,672,800 | | | | 10,354,632 |
| Oberthur Card Systems (d) | | | | 683,600 | | | | 5,932,021 |
| Psion PLC | | | | 33 | | | | 94 |
| SanDisk Corp. (a) | | | | 221,842 | | | | 13,936,114 |
| Synaptics, Inc. (a) | | | | 100 | | | | 2,472 |
| | | | | | | | | 98,076,728 |
| Electronic Equipment & Instruments – 3.7% | | | | | | | | |
| Agilent Technologies, Inc. (a) | | | | 6 | | | | 200 |
| Amphenol Corp. Class A | | | | 100 | | | | 4,426 |
| Applied Films Corp. (a) | | | | 100 | | | | 2,077 |
| Brightpoint, Inc. (a) | | | | 225 | | | | 6,225 |
| CDW Corp. | | | | 1,112,791 | | | | 64,063,378 |
| CellStar Corp. (a) | | | | 100 | | | | 190 |
| Cogent, Inc. (a) | | | | 200 | | | | 4,536 |
| Excel Technology, Inc. (a) | | | | 100 | | | | 2,378 |
| FLIR Systems, Inc. (a) | | | | 409,600 | | | | 9,146,368 |
| Hon Hai Precision Industry Co. Ltd. (Foxconn) | | | | 10,565,597 | | | | 57,935,127 |
| I. D. Systems Inc. (a) | | | | 100 | | | | 2,385 |
| Iteris, Inc. (a) | | | | 100 | | | | 240 |
| Itron, Inc. (a) | | | | 100 | | | | 4,004 |
| KEMET Corp. (a) | | | | 1,177,700 | | | | 8,326,339 |
| Keyence Corp. | | | | 14,300 | | | | 4,069,081 |
| Mercury Computer Systems, Inc. (a) | | | | 1,500 | | | | 30,945 |
| Metrologic Instruments, Inc. (a) | | | | 200 | | | | 3,852 |
| Mettler Toledo International, Inc. (a) | | | | 487,100 | | | | 26,887,920 |
| Molex, Inc. | | | | 100 | | | | 2,595 |
| MTS Systems Corp. | | | | 100 | | | | 3,464 |
| National Instruments Corp. | | | | 2,800 | | | | 89,740 |
| Robotic Vision Systems, Inc. (a) | | | | 100 | | | | 0 |
| ScanSource, Inc. (a) | | | | 100 | | | | 5,468 |
| |
| |
See accompanying notes which are an integral part of the financial statements.
| | | | | | | | |
| | | 139 | | | | Annual Report |
139
| VIP Mid Cap Portfolio | | | | |
| Investments - continued | | | | |
| |
| |
| Common Stocks continued | | | | |
| | | Shares | | Value (Note 1) |
| |
| INFORMATION TECHNOLOGY – continued | | | | |
| Electronic Equipment & Instruments – continued | | | | |
| Sunpower Corp. Class A | | 4,400 | | $ 149,556 |
| Symbol Technologies, Inc. | | 189 | | 2,423 |
| Universal Display Corp. (a) | | 100 | | 1,051 |
| Vishay Intertechnology, Inc. (a) | | 3,482,500 | | 47,919,200 |
| Xyratex Ltd. (a) | | 18,700 | | 330,616 |
| Yageo Corp. sponsored GDR (a) | | 100 | | 218 |
| | | | | 218,994,002 |
| Internet Software & Services 1.6% | | | | |
| Akamai Technologies, Inc. (a) | | 100 | | 1,993 |
| Answers Corp. (a) | | 100 | | 1,147 |
| aQuantive, Inc. (a) | | 157,611 | | 3,978,102 |
| Baidu.com, Inc. sponsored ADR | | 100 | | 6,292 |
| Bankrate, Inc. (a) | | 100 | | 2,952 |
| eCollege.com (a) | | 649,100 | | 11,703,273 |
| Entrust, Inc. (a) | | 100 | | 484 |
| Iliad Group SA | | 100 | | 6,192 |
| iMergent, Inc. (a) | | 100 | | 660 |
| InfoSpace, Inc. (a) | | 100 | | 2,582 |
| LookSmart Ltd. (a) | | 20 | | 75 |
| MIVA, Inc. (a) | | 100 | | 495 |
| Neoforma, Inc. (a) | | 100 | | 990 |
| NHN Corp. (a) | | 100 | | 26,799 |
| Online Resources Corp. (a) | | 100 | | 1,105 |
| Open Text Corp. (a) | | 100 | | 1,415 |
| RealNetworks, Inc. (a) | | 4,022,404 | | 31,213,855 |
| Sify Ltd. sponsored ADR (a) | | 100 | | 1,076 |
| Sina Corp. (a) | | 100 | | 2,416 |
| SonicWALL, Inc. (a) | | 100 | | 792 |
| Tencent Holdings Ltd. | | 1,000 | | 1,070 |
| ValueClick, Inc. (a) | | 1,170,495 | | 21,197,664 |
| VeriSign, Inc. (a) | | 968,664 | | 21,233,115 |
| WebSideStory, Inc. (a) | | 100 | | 1,813 |
| Yahoo! Japan Corp | | 3,300 | | 5,009,966 |
| | | | | 94,396,323 |
| IT Services 0.5% | | | | |
| Affiliated Computer Services, Inc. | | | | |
| Class A (a) | | 16 | | 947 |
| CheckFree Corp. (a) | | 100 | | 4,590 |
| Computershare Ltd. | | 100 | | 498 |
| DST Systems, Inc. (a) | | 600 | | 35,946 |
| Global Payments, Inc. | | 200 | | 9,322 |
| Hewitt Associates, Inc. Class A (a) | | 100 | | 2,801 |
| Infosys Technologies Ltd. | | 15,605 | | 1,039,356 |
| Infosys Technologies Ltd. sponsored ADR | | 200 | | 16,172 |
| infoUSA, Inc. | | 100 | | 1,093 |
| Lionbridge Technologies, Inc. (a) | | 1,323,300 | | 9,289,566 |
| ManTech International Corp. Class A (a) | | 188,332 | | 5,246,930 |
| Maximus, Inc. | | 328,200 | | 12,041,658 |
| Obic Co. Ltd. | | 100 | | 22,035 |
| RightNow Technologies, Inc. (a) | | 100 | | 1,846 |
See accompanying notes which are an integral part of the financial statements.
| | |
| VIP Mid Cap Portfolio | | 140 |
| | | | | Shares | | Value (Note 1) |
| Satyam Computer Services Ltd. | | | | 100 | | $ | | 1,640 |
| StarTek, Inc. | | | | 100 | | | | 1,800 |
| Syntel, Inc. | | | | 100 | | | | 2,083 |
| TALX Corp. | | | | 150 | | | | 6,857 |
| TietoEnator Oyj | | | | 100 | | | | 3,652 |
| Tyler Technologies, Inc. (a) | | | | 100 | | | | 878 |
| | | | | | | | | 27,729,670 |
| Office Electronics – 0.0% | | | | | | | | |
| Zebra Technologies Corp. Class A (a) | | | | 75 | | | | 3,214 |
| Semiconductors & Semiconductor Equipment – 0.8% | | | | | | | | |
| Agere Systems, Inc. (a) | | | | 10 | | | | 129 |
| Analog Devices, Inc. | | | | 100 | | | | 3,587 |
| ARM Holdings PLC sponsored ADR | | | | 100 | | | | 621 |
| ASM Pacific Technology Ltd. | | | | 500 | | | | 2,821 |
| ASML Holding NV (NY Shares) (a) | | | | 100 | | | | 2,008 |
| ATI Technologies, Inc. (a) | | | | 100 | | | | 1,703 |
| Axcelis Technologies, Inc. (a) | | | | 100 | | | | 477 |
| Credence Systems Corp. (a) | | | | 772,500 | | | | 5,376,600 |
| Freescale Semiconductor, Inc. Class A (a) | | | | 100 | | | | 2,519 |
| Integrated Device Technology, Inc. (a) | | | | 1,020,000 | | | | 13,443,600 |
| International Rectifier Corp. (a) | | | | 100 | | | | 3,190 |
| KLA Tencor Corp. | | | | 100 | | | | 4,933 |
| Marvell Technology Group Ltd. (a) | | | | 200 | | | | 11,218 |
| Mattson Technology, Inc. (a) | | | | 482,810 | | | | 4,857,069 |
| Microchip Technology, Inc. | | | | 100 | | | | 3,215 |
| National Semiconductor Corp. | | | | 200 | | | | 5,196 |
| NVIDIA Corp. (a) | | | | 248,900 | | | | 9,099,784 |
| PortalPlayer, Inc. (a) | | | | 100 | | | | 2,832 |
| Rambus, Inc. (a) | | | | 100 | | | | 1,619 |
| Saifun Semiconductors Ltd. | | | | 6,300 | | | | 198,261 |
| Silicon Image, Inc. (a) | | | | 100 | | | | 905 |
| Veeco Instruments, Inc. (a) | | | | 397,500 | | | | 6,888,675 |
| Zoran Corp. (a) | | | | 625,137 | | | | 10,133,471 |
| | | | | | | | | 50,044,433 |
| Software 1.9% | | | | | | | | |
| Activision, Inc. (a) | | | | 518,772 | | | | 7,127,927 |
| Adobe Systems, Inc. | | | | 138 | | | | 5,100 |
| Advent Software, Inc. (a) | | | | 143,911 | | | | 4,160,467 |
| Altiris, Inc. (a) | | | | 100 | | | | 1,689 |
| Autonomy Corp. PLC (a) | | | | 200 | | | | 1,347 |
| Blackboard, Inc. (a) | | | | 100 | | | | 2,898 |
| Bottomline Technologies, Inc. (a) | | | | 11 | | | | 121 |
| Cadence Design Systems, Inc. (a) | | | | 100 | | | | 1,692 |
| CCC Information Services Group, Inc. (a) | | | | 100 | | | | 2,622 |
| Cognos, Inc. (a) | | | | 984,600 | | | | 34,343,065 |
| Concur Technologies, Inc. (a) | | | | 100 | | | | 1,289 |
| FactSet Research Systems, Inc. | | | | 150 | | | | 6,174 |
| FileNET Corp. (a) | | | | 100 | | | | 2,585 |
| Hitachi Software Engineerng Co. Ltd. | | | | 100 | | | | 2,095 |
| Hyperion Solutions Corp. (a) | | | | 396,591 | | | | 14,205,890 |
| Informatica Corp. (a) | | | | 100 | | | | 1,200 |
| Intuit, Inc. (a) | | | | 100 | | | | 5,330 |
| KOEI Co. Ltd. (d) | | | | 429,020 | | | | 11,898,524 |
See accompanying notes which are an integral part of the financial statements.
| | | | | | | | |
| | | 141 | | | | Annual Report |
141
| VIP Mid Cap Portfolio | | | | |
| Investments - continued | | | | |
| |
| |
| Common Stocks continued | | | | |
| | | Shares | | Value (Note 1) |
| |
| INFORMATION TECHNOLOGY – continued | | | | |
| Software – continued | | | | |
| Kronos, Inc. (a) | | 100 | | $ 4,186 |
| Manhattan Associates, Inc. (a) | | 100 | | 2,048 |
| Midway Games, Inc. (a) | | 100 | | 1,897 |
| Napster, Inc. (a) | | 100 | | 352 |
| NAVTEQ Corp. (a) | | 100 | | 4,387 |
| NDS Group PLC sponsored ADR (a) | | 100 | | 4,115 |
| Net 1 UEPS Technologies, Inc. (a) | | 17,100 | | 493,335 |
| Nuance Communications, Inc. (a) | | 299,200 | | 2,282,896 |
| Open Solutions, Inc. (a)(e) | | 1,102,309 | | 25,264,922 |
| Plato Learning, Inc. (a) | | 82,400 | | 654,256 |
| Quality Systems, Inc. | | 100 | | 7,676 |
| Renaissance Learning, Inc. | | 71 | | 1,343 |
| RSA Security, Inc. (a) | | 251 | | 2,819 |
| Salesforce.com, Inc. (a) | | 36,100 | | 1,157,005 |
| Scientific Learning Corp. (a) | | 100 | | 565 |
| Subex Systems Ltd. | | 100 | | 1,702 |
| Symantec Corp. (a) | | 100 | | 1,750 |
| Tata Elxsi Ltd. | | 100 | | 455 |
| Temenos Group AG (a) | | 100 | | 974 |
| THQ, Inc. (a) | | 487,650 | | 11,630,453 |
| Ultimate Software Group, Inc. (a) | | 100 | | 1,907 |
| | | | | 113,289,058 |
| |
| TOTAL INFORMATION TECHNOLOGY | | | | 629,533,913 |
| |
| MATERIALS 8.9% | | | | |
| Chemicals 3.2% | | | | |
| Air Products & Chemicals, Inc. | | 100 | | 5,919 |
| Airgas, Inc. | | 1,898,800 | | 62,470,520 |
| Albemarle Corp. | | 100 | | 3,835 |
| American Vanguard Corp. | | 200 | | 4,700 |
| Asian Paints India Ltd. | | 880,007 | | 11,319,126 |
| Balchem Corp. | | 150 | | 4,472 |
| Ecolab, Inc. (d) | | 1,361,700 | | 49,388,859 |
| Filtrona PLC | | 50 | | 245 |
| Jubilant Organosys Ltd. | | 100 | | 2,389 |
| Kuraray Co. Ltd. | | 223,000 | | 2,311,234 |
| Lonza Group AG | | 10 | | 612 |
| Monsanto Co. | | 272,800 | | 21,150,184 |
| Mosaic Co. (a) | | 100 | | 1,463 |
| Nitto Denko Corp. | | 113,500 | | 8,846,657 |
| Praxair, Inc. | | 222,700 | | 11,794,192 |
| Quaker Chemical Corp. | | 100 | | 1,923 |
| Recticel SA | | 100 | | 888 |
| Sasa Dupont Sabanci Polyester Sanayi AS | | 1 | | 1 |
| Sinopec Shanghai Petrochemical Co. Ltd.: | | | | |
| (H Shares) | | 2,000 | | 767 |
| sponsored ADR | | 200 | | 7,574 |
| Syngenta AG sponsored ADR | | 100 | | 2,491 |
See accompanying notes which are an integral part of the financial statements.
| | |
| VIP Mid Cap Portfolio | | 142 |
| | | Shares | | Value (Note 1) |
| Tokuyama Corp. | | 1,493,000 | | $ 19,184,048 |
| United Phosphorous Ltd. | | 455 | | 2,425 |
| | | | | 186,504,524 |
| Construction Materials – 0.1% | | | | |
| Cemex SA de CV sponsored ADR | | 108 | | 6,408 |
| Florida Rock Industries, Inc. | | 149,175 | | 7,318,526 |
| Headwaters, Inc. (a) | | 100 | | 3,544 |
| | | | | 7,328,478 |
| Containers & Packaging – 0.0% | | | | |
| Essel Propack Ltd. | | 270,100 | | 2,150,835 |
| Sealed Air Corp. (a) | | 100 | | 5,617 |
| Silgan Holdings, Inc. | | 68 | | 2,456 |
| | | | | 2,158,908 |
| Metals & Mining – 5.2% | | | | |
| Agnico Eagle Mines Ltd. | | 1,143,930 | | 22,651,300 |
| Agnico Eagle Mines Ltd. (a) | | 23,350 | | 102,974 |
| Aleris International, Inc. (a) | | 100 | | 3,224 |
| Barrick Gold Corp. | | 100 | | 2,788 |
| BHP Billiton Ltd. sponsored ADR | | 100 | | 3,342 |
| BlueScope Steel Ltd. | | 100 | | 511 |
| Boliden AB (a) | | 556,000 | | 4,549,059 |
| Compania de Minas Buenaventura SA sponsored ADR | | 452,000 | | 12,791,600 |
| Dofasco, Inc. | | 100 | | 5,589 |
| Falconbridge Ltd. | | 277 | | 8,220 |
| FNX Mining Co., Inc. (a) | | 100 | | 1,169 |
| Fording Canadian Coal Trust (d) | | 116,700 | | 4,037,395 |
| Freeport McMoRan Copper & Gold, Inc. Class B (d) | | 1,285,900 | | 69,181,420 |
| Glamis Gold Ltd. (a) | | 100 | | 2,750 |
| Goldcorp, Inc. | | 146,800 | | 3,270,500 |
| Golden Star Resources Ltd. (a) | | 250,000 | | 664,488 |
| Grupo Mexico SA de CV Series B | | 100 | | 233 |
| Harmony Gold Mining Co. Ltd. (a) | | 1,096,300 | | 14,306,716 |
| High River Gold Mines Ltd. (a) | | 1,989,600 | | 2,532,887 |
| Inco Ltd. | | 100 | | 4,344 |
| Inmet Mining Corp. | | 100 | | 2,538 |
| Ivanhoe Mines Ltd. (a) | | 100 | | 718 |
| Kinross Gold Corp. (a) | | 6,605,666 | | 61,025,206 |
| Mechel Steel Group OAO sponsored ADR | | 100 | | 2,417 |
| Meridian Gold, Inc. (a) | | 100 | | 2,192 |
| Mittal Steel Co. NV Class A (NY Shares) | | 3,044 | | 80,135 |
| Newmont Mining Corp. | | 1,782,180 | | 95,168,404 |
| Northern Orion Resources, Inc. (a) | | 100 | | 326 |
| Nucor Corp. | | 100 | | 6,672 |
| Phelps Dodge Corp. | | 100 | | 14,387 |
| POSCO sponsored ADR | | 100 | | 4,951 |
| Sumitomo Metal Mining Co. Ltd. | | 2,000 | | 24,749 |
| Teck Cominco Ltd. Class B (sub. vtg.) | | 279,600 | | 14,923,384 |
| Xstrata PLC | | 100 | | 2,341 |
| | | | | 305,378,929 |
See accompanying notes which are an integral part of the financial statements.
|
143 Annual Report
143
| VIP Mid Cap Portfolio | | | | |
| Investments - continued | | | | |
| |
| |
| Common Stocks continued | | | | |
| | | | | Shares | | Value (Note 1) |
| |
| MATERIALS – continued | | | | | | |
| Paper & Forest Products 0.4% | | | | |
| Cathay Forest Products Corp. (a) | | 40,100 | | $ 26,905 |
| International Forest Products Ltd. (Interfor) Class A (sub. vtg.) (a) | | 9,100 | | 56,359 |
| Lee & Man Paper Manufacturing Ltd. | | 10,218,000 | | 11,333,346 |
| MAXXAM, Inc. (a) | | | | 100 | | 3,505 |
| Pope Resources, Inc. LP | | | | 100 | | 3,102 |
| Sino Forest Corp. (a) | | | | 2,546,500 | | 10,820,791 |
| Votorantim Celulose e Papel SA sponsored ADR (non vtg.) | | 250 | | 3,073 |
| | | | | | | 22,247,081 |
| |
| TOTAL MATERIALS | | | | | | 523,617,920 |
| |
| TELECOMMUNICATION SERVICES 1.2% | | | | |
| Diversified Telecommunication Services – 0.0% | | | | |
| Cable & Wireless PLC sponsored ADR | | 100 | | 616 |
| Covad Communications Group, Inc. (a) | | 61 | | 60 |
| Golden Telecom, Inc. | | | | 100 | | 2,596 |
| Philippine Long Distance Telephone Co. | | 100 | | 3,460 |
| Pipex Communications PLC (a) | | 100 | | 21 |
| PT Indosat Tbk sponsored ADR | | 100 | | 2,909 |
| PT Telkomunikasi Indonesia Tbk sponsored ADR | | 100 | | 2,386 |
| | | | | | | 12,048 |
| Wireless Telecommunication Services – 1.2% | | | | |
| America Movil SA de CV Series L sponsored ADR | | 389,700 | | 11,402,622 |
| Bharti Televentures Ltd. (a) | | 1,055,400 | | 8,264,700 |
| MTN Group Ltd. | | | | 100 | | 982 |
| Nextel Partners, Inc. Class A (a) | | 100 | | 2,794 |
| NII Holdings, Inc. (a) | | | | 1,009,816 | | 44,108,763 |
| Telemig Celular Participacoes SA sponsored ADR | | 100 | | 3,941 |
| USA Mobility, Inc. | | | | 286,340 | | 7,937,345 |
| | | | | | | 71,721,147 |
| |
| TOTAL TELECOMMUNICATION SERVICES | | | | 71,733,195 |
| |
| UTILITIES 1.0% | | | | | | |
| Electric Utilities – 0.0% | | | | | | |
| FPL Group, Inc. | | | | 200 | | 8,312 |
| Korea Electric Power Corp. sponsored ADR | | 100 | | 1,949 |
| PPL Corp. | | | | 200 | | 5,880 |
| | | | | | | 16,141 |
| Gas Utilities 0.3% | | | | | | |
| PT Perusahaan Gas Negara Tbk Series B | | 500 | | 351 |
| SEMCO Energy, Inc. (a) | | | | 1,613,700 | | 9,068,994 |
| Xinao Gas Holdings Ltd. | | | | 11,158,000 | | 8,850,245 |
| | | | | | | 17,919,590 |
| |
| |
| | | | | Shares | | Value (Note 1) |
| Independent Power Producers & Energy Traders 0.6% | | | | |
| AES Corp. (a) | | | | 2,066,600 | | $ 32,714,278 |
See accompanying notes which are an integral part of the financial statements.
| | |
| VIP Mid Cap Portfolio | | 144 |
| | | | Shares | | Value (Note 1) |
| | | | | | |
| | | | | | |
| Multi-Utilities – 0.1% | | | | | | |
| Public Service Enterprise Group, Inc. | | 105,000 | | 6,821,850 |
| TOTAL UTILITIES | | | | | | 57,471,859 |
| TOTAL COMMON STOCKS | | | | | | |
| (Cost $4,282,979,998) | | | | 5,514,359,333 |
| Nonconvertible Preferred Stocks 0.0% | | | | |
| |
| CONSUMER DISCRETIONARY 0.0% | | | | |
| Household Durables 0.0% | | | | | | |
| Fedders Corp. Series A, 8.60% | | | | | | |
| (Cost $119) | | | | 5 | | 45 |
| Money Market Funds 8.3% | | | | |
| Fidelity Cash Central Fund, 4.28% (b) | | 372,876,046 | | 372,876,046 |
| Fidelity Securities Lending Cash Central Fund, 4.35% (b)(c) | | 114,642,969 | | 114,642,969 |
| TOTAL MONEY MARKET FUNDS | | | | |
| (Cost $487,519,015) | | | | | | 487,519,015 |
| TOTAL INVESTMENT PORTFOLIO 102.4% | | | | |
| (Cost $4,770,499,132) | | | | 6,001,878,393 |
| |
| NET OTHER ASSETS (2.4)% | | (141,304,340) |
| NET ASSETS 100% | | | | $ 5,860,574,053 |
Legend
(a) Non-income producing
(b) Affiliated fund that is available only to investment companies and other accounts managed by Fidelity Investments. The rate quoted is the annualized seven-day
yield of the fund at period end. A complete unaudited listing of the fund’s holdings as of its most recent quarter end is available upon request.
(c) Investment made with cash collateral received from securities on loan.
(d) Security or a portion of the security is on loan at period end.
(e) Affiliated company
(f) Security exempt from registration under Rule 144A of the Securities Act of 1933. These securities may be resold in transactions exempt from registration,
normally to qualified institutional buyers. At the period end, the value of these securities amounted to $3,112,232 or 0.1% of net assets.
|
Affiliated Central Funds
Information regarding income received by the fund from the affiliated Central funds during the period is as follows:
| Fund | | Income received |
| Fidelity Cash Central Fund | | $ 10,697,508 |
| Fidelity Securities Lending Cash Central Fund | | 1,173,532 |
| Total | | $ 11,871,040 |
Other Affiliated Issuers
An affiliated company is a company in which the fund has ownership of at least 5% of the voting securities. Transactions during the period with companies which are or were affiliates are as follows:
| | | Value, beginning | | | | | | | | Value, end of |
| Affiliate | | of period | | Purchases | | Sales Proceeds | | Dividend Income | | period |
| Eclipsys Corp. | | $ | | 2,043 | | $ | | 44,996,485 | | $ | | 4,829,543 | | $ | | — | | $ | | 47,063,766 |
| Harvard Bioscience, Inc. | | | | 13,996,708 | | — | | 1,599,168 | | — | | 11,107,409 |
| IMPCO Technologies, Inc. | | | | 11,373,320 | | 7,701,234 | | 5,209,047 | | — | | 9,268,848 |
| LKQ Corp. | | | | 6,328,814 | | 27,305,192 | | 30,196,332 | | — | | — |
| Open Solutions, Inc. | | | | 11,349,946 | | 14,785,536 | | — | | — | | 25,264,922 |
See accompanying notes which are an integral part of the financial statements.
145 Annual Report
| VIP Mid Cap Portfolio | | | | | | | | | | | | | | |
| Investments - continued | | | | | | | | | | | | | | |
| |
| |
| | Value, beginning | | | | | | | | | | | | Value, end of |
| | of period | | Purchases | | | | Sales Proceeds | | | | Dividend Income | | period |
| | | | | | | | | | | | | | |
| Parker Drilling Co. | | $ | | 7,847,424 | | $ | | 25,100,378 | | | | $ | | — | | | | $ | | — | | $ | | 59,364,645 |
| ResCare, Inc. | | 18,093,582 | | 11,382,634 | | | | | | 3,120,143 | | | | | | — | | 28,261,042 |
| SEMCO Energy, Inc. | | — | | 9,501,356 | | | | — | | | | — | | — |
| Stratagene Corp. | | 6,584,400 | | 6,768,249 | | | | 1,381,366 | | | | | | 360,362 | | 14,472,128 |
| Strategic Diagnostics, Inc. | | 2,773,050 | | 2,383,669 | | | | — | | | | — | | 5,392,660 |
| Total | | $ | | 78,349,287 | | $ | | 149,924,733 | | | | $ | | 46,335,599 | | | | $ | | 360,362 | | $ | | 200,195,420 |
| |
| Other Information | | | | | | | | | | | | | | |
| Distribution of investments by country of issue, as a percentage of total net assets, is as follows: | | | | | | | | | | |
| |
| United States of America | | | | | | | | | | | | | | 72.8% |
| Japan | | | | | | | | | | | | | | 5.8% |
| Canada | | | | | | | | | | | | | | 5.1% |
| India | | | | | | | | | | | | | | 2.2% |
| Netherlands | | | | | | | | | | | | | | 2.1% |
| Cayman Islands | | | | | | | | | | | | | | 2.0% |
| Switzerland | | | | | | | | | | | | | | 1.2% |
| France | | | | | | | | | | | | | | 1.2% |
| Taiwan | | | | | | | | | | | | | | 1.1% |
| Others (individually less than 1%) | | | | | | | | | | | | | | 6.5% |
| | | | | | | | | | | | | | | 100.0% |
See accompanying notes which are an integral part of the financial statements.
| | |
| VIP Mid Cap Portfolio | | 146 |
| VIP Mid Cap Portfolio | | | | | | |
| |
| Financial Statements | | | | | | |
| |
| |
| Statement of Assets and Liabilities | | | | | | |
| | | December 31, 2005 |
| |
| Assets | | | | | | |
| Investment in securities, at value (including securities loaned of $109,479,789) — See accompanying schedule: | | | | | | |
| Unaffiliated issuers (cost $4,135,029,460) | | $5,314,163,958 | | | | |
| Affiliated Central Funds (cost $487,519,015) | | 487,519,015 | | | | |
| Other affiliated issuers (cost $147,950,657) | | 200,195,420 | | | | |
| Total Investments (cost $4,770,499,132) | | | | $ | | 6,001,878,393 |
| Foreign currency held at value (cost $3,939,086) | | | | | | 3,939,073 |
| Receivable for investments sold | | | | | | 3,023,285 |
| Receivable for fund shares sold | | | | | | 4,185,895 |
| Dividends receivable | | | | | | 3,319,781 |
| Interest receivable | | | | | | 1,278,741 |
| Prepaid expenses | | | | | | 23,423 |
| Other affiliated receivables | | | | | | 1,311 |
| Other receivables | | | | | | 1,051,712 |
| Total assets | | | | 6,018,701,614 |
| |
| Liabilities | | | | | | |
| Payable to custodian bank | | $ 1,817 | | | | |
| Payable for investments purchased | | 33,815,197 | | | | |
| Payable for fund shares redeemed | | 2,826,714 | | | | |
| Accrued management fee | | 2,756,501 | | | | |
| Distribution fees payable | | 811,709 | | | | |
| Other affiliated payables | | 426,970 | | | | |
| Other payables and accrued expenses | | 2,845,684 | | | | |
| Collateral on securities loaned, at value | | 114,642,969 | | | | |
| Total liabilities | | | | | | 158,127,561 |
| |
| Net Assets | | | | $ | | 5,860,574,053 |
| Net Assets consist of: | | | | | | |
| Paid in capital | | | | $3,882,983,567 |
| Undistributed net investment income | | | | | | 15,998,697 |
| Accumulated undistributed net realized gain (loss) on investments and foreign currency transactions | | | | | | 732,865,298 |
| Net unrealized appreciation (depreciation) on investments and assets and liabilities in foreign currencies | | | | 1,228,726,491 |
| Net Assets | | | | $ | | 5,860,574,053 |
| |
| Statement of Assets and Liabilities continued | | | | | | |
| | | December 31, 2005 |
| |
| Initial Class: | | | | | | |
| Net Asset Value, offering price and redemption price per share ($1,276,301,578 ÷ 36,352,772 shares) | | | | $ | | 35.11 |
| Service Class: | | | | | | |
| Net Asset Value, offering price and redemption price per share ($990,560,917 ÷ 28,343,115 shares) | | | | $ | | 34.95 |
| Service Class 2: | | | | | | |
| Net Asset Value, offering price and redemption price per share ($3,542,951,507 ÷ 102,202,703 shares) | | | | $ | | 34.67 |
| Investor Class: | | | | | | |
| Net Asset Value, offering price and redemption price per share ($50,760,051 ÷ 1,446,900 shares) | | | | $ | | 35.08 |
| |
| |
| |
| |
| See accompanying notes which are an integral part of the financial statements. | | | | | | |
| |
| 147 | | | | Annual Report |
| Financial Statements - continued | | | | | | | | |
| |
| |
| Statement of Operations | | | | | | | | |
| | | | | | | Year ended December 31, 2005 |
| |
| Investment Income | | | | | | | | | | |
| Dividends (including $360,362 received from other affiliated issuers) | | | | | | $ | | 35,322,015 |
| Special dividends | | | | | | | | | | 6,755,487 |
| Interest | | | | | | | | | | 44,739 |
| Income from affiliated Central Funds (including $1,173,532 from security lending) | | | | | | | | 11,871,040 |
| Total income | | | | | | | | | | 53,993,281 |
| |
| Expenses | | | | | | | | | | |
| Management fee | | | | $ | | 27,032,934 | | | | |
| Transfer agent fees | | | | | | 3,217,491 | | | | |
| Distribution fees | | | | | | 7,754,097 | | | | |
| Accounting and security lending fees | | | | 1,151,450 | | | | |
| Independent trustees’ compensation | | | | 20,396 | | | | |
| Custodian fees and expenses | | | | 862,268 | | | | |
| Registration fees | | | | | | 8,689 | | | | |
| Audit | | | | | | 77,475 | | | | |
| Legal | | | | | | 17,668 | | | | |
| Miscellaneous | | | | | | 505,110 | | | | |
| Total expenses before reductions | | | | 40,647,578 | | | | |
| Expense reductions | | | | | | (2,742,506) | | | | 37,905,072 |
| |
| Net investment income (loss) | | | | | | | | 16,088,209 |
| Realized and Unrealized Gain (Loss) | | | | | | | | |
| Net realized gain (loss) on: | | | | | | | | |
| Investment securities: | | | | | | | | | | |
| Unaffiliated issuers (net of foreign taxes of $175,374) | | | | 737,345,770 | | | | |
| Other affiliated issuers | | | | 1,991,693 | | | | |
| Foreign currency transactions | | | | (204,299) | | | | |
| Total net realized gain (loss) | | | | | | | | 739,133,164 |
| Change in net unrealized appreciation (depreciation) on: | | | | | | | | |
| Investment securities (net of increase in deferred foreign taxes of $1,404,806) | | | | 80,110,633 | | | | |
| Assets and liabilities in foreign currencies | | | | (478,313) | | | | |
| Total change in net unrealized appreciation (depreciation) | | | | | | | | 79,632,320 |
| Net gain (loss) | | | | | | | | | | 818,765,484 |
| Net increase (decrease) in net assets resulting from operations | | | | | | $ | | 834,853,693 |
| |
| Statement of Changes in Net Assets | | | | | | | | |
| | | | | | | Year ended | | | | Year ended |
| | | | | | | December 31, | | | | December 31, |
| | | | | | | 2005 | | | | 2004 |
| Increase (Decrease) in Net Assets | | | | | | | | |
| Operations | | | | | | | | | | |
| Net investment income (loss) | | $ | | 16,088,209 | | $ | | (3,642,695) |
| Net realized gain (loss) | | | | 739,133,164 | | | | 195,434,513 |
| Change in net unrealized appreciation (depreciation) | | | | 79,632,320 | | | | 536,253,385 |
| Net increase (decrease) in net assets resulting from operations | | | | 834,853,693 | | | | 728,045,203 |
| Distributions to shareholders from net realized gain | | | | (69,737,263) | | | | — |
| Share transactions - net increase (decrease) | | | | 1,095,215,324 | | | | 835,964,194 |
| Total increase (decrease) in net assets | | | | 1,860,331,754 | | | | 1,564,009,397 |
| |
| Net Assets | | | | | | | | | | |
| Beginning of period | | | | | | 4,000,242,299 | | | | 2,436,232,902 |
| End of period (including undistributed net investment income of $15,998,697 and undistributed net investment income | | | | | | | | |
| of $68,191, respectively) | | $ | | 5,860,574,053 | | $ | | 4,000,242,299 |
See accompanying notes which are an integral part of the financial statements.
| | |
| VIP Mid Cap Portfolio | | 148 |
| Financial Highlights Initial Class | | | | | | | | | | |
| Years ended December 31, | | 2005 | | 2004 | | 2003G | | 2002 | | 2001 |
| Selected Per Share Data | | | | | | | | | | |
| Net asset value, beginning of period | | $ 30.18 | | $ 24.16 | | $ 17.51 | | $ 19.60 | | $ 20.26 |
| Income from Investment Operations | | | | | | | | | | |
| Net investment income (loss)C | | 16D | | .01 | | F | | .09 | | .20 |
| Net realized and unrealized gain (loss) | | 5.28 | | 6.01 | | 6.73 | | (2.00) | | (.86) |
| Total from investment operations | | 5.44 | | 6.02 | | 6.73 | | (1.91) | | (.66) |
| Distributions from net investment income | | — | | — | | (.08) | | (.18) | | — |
| Distributions from net realized gain | | (.51) | | — | | — | | — | | — |
| Total distributions | | (.51) | | — | | (.08) | | (.18) | | — |
| Net asset value, end of period | | $ 35.11 | | $ 30.18 | | $ 24.16 | | $ 17.51 | | $ 19.60 |
| Total ReturnA,B | | 18.30% | | 24.92% | | 38.64% | | (9.82)% | | (3.26)% |
| Ratios to Average Net AssetsE | | | | | | | | | | |
| Expenses before reductions | | 69% | | .71% | | .70% | | .70% | | .69% |
| Expenses net of fee waivers, if any | | 69% | | .71% | | .70% | | .70% | | .69% |
| Expenses net of all reductions | | 64% | | .68% | | .68% | | .63% | | .62% |
| Net investment income (loss) | | 50% | | .03% | | —% | | .51% | | 1.06% |
| Supplemental Data | | | | | | | | | | |
| Net assets, end of period (000 omitted) | | $1,276,302 | | $ 979,533 | | $ 678,480 | | $ 499,557 | | $ 574,934 |
| Portfolio turnover rate | | 107% | | 55% | | 51% | | 135% | | 144% |
A Total returns do not reflect charges attributable to your insurance company’s separate account. Inclusion of these charges would reduce the total returns shown.
B Total returns would have been lower had certain expenses not been reduced during the periods shown.
C Calculated based on average shares outstanding during the period.
D Investment income per share reflects a special dividend which amounted to $.04 per share. Excluding the special dividend, the ratio of net investment income to average net assets would have been .36%.
E Expense ratios reflect operating expenses of the class. Expenses before reductions do not reflect amounts reimbursed by the investment adviser or reductions from brokerage service arrangements or other expense offset arrangements and do not
represent the amount paid by the class during periods when reimbursements or reductions occur. Expenses net of fee waivers reflect expenses after reimbursement by the investment adviser but prior to reductions from brokerage service arrange
ments or other expense offset arrangements. Expenses net of all reductions represent the net expenses paid by the class.
F Amount represents less than $.01 per share.
G As the result of a correction made in the classification of distributions received on securities representing realized gains for the year ended December 31, 2003, amounts previously reported have been reclassified. The impact of this correction was a
decrease in net investment loss of $0.01 per share and a corresponding decrease in net realized and unrealized gain (loss). The ratio of net investment loss to average net assets decreased from (0.04)% to 0.00% . The reclassification had no
impact on total net assets or total return of the class.
|
| Financial Highlights Service Class | | | | | | | | | | |
| Years ended December 31, | | 2005 | | 2004 | | 2003F | | 2002 | | 2001 |
| Selected Per Share Data | | | | | | | | | | |
| Net asset value, beginning of period | | $ 30.07 | | $ 24.10 | | $ 17.46 | | $ 19.54 | | $ 20.22 |
| Income from Investment Operations | | | | | | | | | | |
| Net investment income (loss)C | | 12D | | (.02) | | (.02) | | .08 | | .18 |
| Net realized and unrealized gain (loss) | | 5.27 | | 5.99 | | 6.72 | | (2.00) | | (.86) |
| Total from investment operations | | 5.39 | | 5.97 | | 6.70 | | (1.92) | | (.68) |
| Distributions from net investment income | | — | | — | | (.06) | | (.16) | | — |
| Distributions from net realized gain | | (.51) | | — | | — | | — | | — |
| Total distributions | | (.51) | | — | | (.06) | | (.16) | | — |
| Net asset value, end of period | | $ 34.95 | | $ 30.07 | | $ 24.10 | | $ 17.46 | | $ 19.54 |
| Total ReturnA,B | | 18.20% | | 24.77% | | 38.52% | | (9.90)% | | (3.36)% |
| Ratios to Average Net AssetsE | | | | | | | | | | |
| Expenses before reductions | | 79% | | .81% | | .80% | | .80% | | .79% |
| Expenses net of fee waivers, if any | | 79% | | .81% | | .80% | | .80% | | .79% |
| Expenses net of all reductions | | 74% | | .78% | | .78% | | .73% | | .72% |
| Net investment income (loss) | | 40% | | (.07)% | | (.10)% | | .41% | | .96% |
| Supplemental Data | | | | | | | | | | |
| Net assets, end of period (000 omitted) | | $ 990,561 | | $ 819,412 | | $ 580,179 | | $ 378,264 | | $ 366,665 |
| Portfolio turnover rate | | 107% | | 55% | | 51% | | 135% | | 144% |
A Total returns do not reflect charges attributable to your insurance company’s separate account. Inclusion of these charges would reduce the total returns shown.
B Total returns would have been lower had certain expenses not been reduced during the periods shown.
C Calculated based on average shares outstanding during the period.
D Investment income per share reflects a special dividend which amounted to $.04 per share. Excluding the special dividend, the ratio of net investment income to average net assets would have been .26%.
E Expense ratios reflect operating expenses of the class. Expenses before reductions do not reflect amounts reimbursed by the investment adviser or reductions from brokerage service arrangements or other expense offset arrangements and do not
represent the amount paid by the class during periods when reimbursements or reductions occur. Expenses net of fee waivers reflect expenses after reimbursement by the investment adviser but prior to reductions from brokerage service arrange
ments or other expense offset arrangements. Expenses net of all reductions represent the net expenses paid by the class.
F As the result of a correction made in the classification of distributions received on securities representing realized gains for the year ended December 31, 2003, amounts previously reported have been reclassified. The impact of this correction was a
decrease in net investment loss of $0.01 per share and a corresponding decrease in net realized and unrealized gain (loss). The ratio of net investment loss to average net assets decreased from (0.14)% to (0.10)% . The reclassification had no
impact on total net assets or total return of the class.
|
See accompanying notes which are an integral part of the financial statements.
| | |
| VIP Mid Cap Portfolio | | 150 |
| Financial Highlights Service Class 2 | | | | | | | | | | |
| Years ended December 31, | | 2005 | | 2004 | | 2003F | | 2002 | | 2001 |
| Selected Per Share Data | | | | | | | | | | |
| Net asset value, beginning of period | | $ 29.88 | | $ 23.98 | | $ 17.39 | | $ 19.49 | | $ 20.20 |
| Income from Investment Operations | | | | | | | | | | |
| Net investment income (loss)C | | 08D | | (.06) | | (.05) | | .05 | | .15 |
| Net realized and unrealized gain (loss) | | 5.22 | | 5.96 | | 6.69 | | (1.99) | | (.86) |
| Total from investment operations | | 5.30 | | 5.90 | | 6.64 | | (1.94) | | (.71) |
| Distributions from net investment income | | — | | — | | (.05) | | (.16) | | — |
| Distributions from net realized gain | | (.51) | | — | | — | | — | | — |
| Total distributions | | (.51) | | — | | (.05) | | (.16) | | — |
| Net asset value, end of period | | $ 34.67 | | $ 29.88 | | $ 23.98 | | $ 17.39 | | $ 19.49 |
| Total ReturnA,B | | 18.02% | | 24.60% | | 38.31% | | (10.02)% | | (3.51)% |
| Ratios to Average Net AssetsE | | | | | | | | | | |
| Expenses before reductions | | 94% | | .96% | | .95% | | .95% | | .94% |
| Expenses net of fee waivers, if any | | 94% | | .96% | | .95% | | .95% | | .94% |
| Expenses net of all reductions | | 89% | | .93% | | .93% | | .88% | | .88% |
| Net investment income (loss) | | 26% | | (.22)% | | (.25)% | | .25% | | .81% |
| Supplemental Data | | | | | | | | | | |
| Net assets, end of period (000 omitted) | | $3,542,952 | | $2,201,298 | | $1,177,574 | | $ 520,933 | | $ 210,356 |
| Portfolio turnover rate | | 107% | | 55% | | 51% | | 135% | | 144% |
A Total returns do not reflect charges attributable to your insurance company’s separate account. Inclusion of these charges would reduce the total returns shown.
B Total returns would have been lower had certain expenses not been reduced during the periods shown.
C Calculated based on average shares outstanding during the period.
D Investment income per share reflects a special dividend which amounted to $.05 per share. Excluding the special dividend, the ratio of net investment income to average net assets would have been .11%.
E Expense ratios reflect operating expenses of the class. Expenses before reductions do not reflect amounts reimbursed by the investment adviser or reductions from brokerage service arrangements or other expense offset arrangements and do not
represent the amount paid by the class during periods when reimbursements or reductions occur. Expenses net of fee waivers reflect expenses after reimbursement by the investment adviser but prior to reductions from brokerage service arrange
ments or other expense offset arrangements. Expenses net of all reductions represent the net expenses paid by the class.
F As the result of a correction made in the classification of distributions received on securities representing realized gains for the year ended December 31, 2003, amounts previously reported have been reclassified. The impact of this correction was a
decrease in net investment loss of $0.01 per share and a corresponding decrease in net realized and unrealized gain (loss). The ratio of net investment loss to average net assets decreased from (0.29)% to (0.25)% . The reclassification had no
impact on total net assets or total return of the class.
|
| Financial Highlights Investor Class | | |
| Year ended December 31, | | 2005G |
| Selected Per Share Data | | |
| Net asset value, beginning of period | | $ 31.81 |
| Income from Investment Operations | | |
| Net investment income (loss)E | | 07F |
| Net realized and unrealized gain (loss) | | 3.20 |
| Total from investment operations | | 3.27 |
| Net asset value, end of period | | $ 35.08 |
| Total ReturnB,C,D | | 10.28% |
| Ratios to Average Net AssetsH | | |
| Expenses before reductions | | 86%A |
| Expenses net of fee waivers, if any | | 86%A |
| Expenses net of all reductions | | 80%A |
| Net investment income (loss) | | 45%A |
| Supplemental Data | | |
| Net assets, end of period (000 omitted) | | $ 50,760 |
| Portfolio turnover rate | | 107% |
A Annualized
B Total returns for periods of less than one year are not annualized.
C Total returns do not reflect charges attributable to your insurance company’s separate account. Inclusion of these charges would reduce the total returns shown.
D Total returns would have been lower had certain expenses not been reduced during the periods shown.
E Calculated based on average shares outstanding during the period.
F Investment income per share reflects a special dividend which amounted to $.04 per share. Excluding the special dividend, the ratio of net investment income to average net assets would have been .17%.
G For the period July 21, 2005 (commencement of sale of shares) to December 31, 2005.
H Expense ratios reflect operating expenses of the class. Expenses before reductions do not reflect amounts reimbursed by the investment adviser or reductions from brokerage service arrangements or other expense offset arrangements and do not
represent the amount paid by the class during periods when reimbursements or reductions occur. Expense ratios before reductions for start up periods may not be representative of longer term operating periods. Expenses net of fee waivers reflect
expenses after reimbursement by the investment adviser but prior to reductions from brokerage service arrangements or other expense offset arrangements. Expenses net of all reductions represent the net expenses paid by the class.
|
See accompanying notes which are an integral part of the financial statements.
|
151 Annual Report
VIP Overseas Portfolio
Performance: The Bottom Line
|
Average annual total return reflects the change in the value of an investment, assuming reinvestment of the class’ dividend income and capital gains (the profits earned upon the sale of securities that have grown in value) and assuming a constant rate of performance each year. During periods of reimbursement by Fidelity, a fund’s total return will be greater than it would be had the reimbursement not occurred. Performance numbers are net of all underlying fund operating expenses, but do not include any insurance charges imposed by your insurance company’s sepa rate account. If performance information included the effect of these additional charges, the total returns would have been lower. How a fund did yesterday is no guarantee of how it will do tomorrow.
| Average Annual Total Returns | | | | | | |
| Periods ended December 31, 2005 | | Past 1 | | Past 5 | | Past 10 |
| | | year | | years | | years |
| VIP Overseas - Initial Class | | 19.06% | | 4.02% | | 7.18% |
| VIP Overseas - Service ClassA | | 18.97% | | 3.93% | | 7.10% |
| VIP Overseas - Service Class 2B | | 18.72% | | 3.82% | | 7.03% |
| | A The initial offering of Service Class shares took place on November 3, 1997. Performance for Service Class shares reflects an asset based distribution fee (12b 1 fee), and
returns prior to November 3, 1997 are those of Initial Class and do not include the effects of Service Class’ 12b 1 fee. Had Service Class shares’ 12b 1 fee been reflected, returns
prior to November 3, 1997 would have been lower.
B The initial offering of Service Class 2 shares took place on January 12, 2000. Performance for Service Class 2 shares reflects an asset based distribution fee (12b 1 fee).
Returns from November 3, 1997 to January 12, 2000 are those of Service Class which reflect a different 12b 1 fee. Service Class 2 returns prior to November 3, 1997 are those
of Initial Class, and do not include the effects of a 12b 1 fee. Had Service Class 2 shares’ 12b 1 fee been reflected, returns prior to January 12, 2000 would have been lower.
|
$10,000 Over 10 Years
Let’s say hypothetically that $10,000 was invested in VIP Overseas Portfolio Initial Class on December 31, 1995. The chart shows how the value of your investment would have changed, and also shows how the MSCI® EAFE Index performed over the same period.
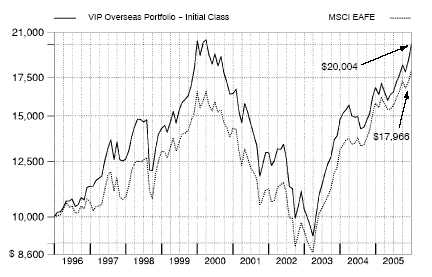
VIP Overseas Portfolio 152
VIP Overseas Portfolio
Management’s Discussion of Fund Performance
|
Comments from Graeme Rockett, who became Portfolio Manager of VIP Overseas Portfolio on January 1, 2006
Foreign stock markets outpaced their U.S. counterparts for the year ending December 31, 2005, encouraged by solid corporate earnings and markedly improved economies. During this period, the Morgan Stanley Capital InternationalSM Europe, Australasia, Far East (MSCI® EAFE®) Index — a performance measure of developed stock markets outside the United States and Canada gained 13.72% . In comparison, the U.S. market rose only 4.91% as measured by the Standard & Poor’s 500SM Index. Of the countries representing more than 1.00% of the MSCI benchmark on average during the period, the Japanese component had the highest return. Positive economic indicators and Prime Minister Koizumi’s election victory helped attract record inflows from overseas investors. Elsewhere, despite strong performance from several Nordic countries, European equities overall were among the weaker developed market performers. Economic growth in the region was not up to par with other developed markets. Overseas returns for U.S. investors were dampened by the negative currency effect of a strengthening dollar relative to most of the world’s major currencies during the period.
For the year ending December 31, 2005, the performance of VIP Overseas Portfolio exceeded the gains of both the MSCI EAFE index and the LipperSM Variable Annuity International Funds Average, which was up 14.74% . (For specific portfolio performance results, please refer to the performance section of this report.) Astute security selection in the financial, information technology and consumer discretionary sectors boosted performance versus the index. The three strongest relative contributors were all Japanese financials: Nikko Cordial and Daiwa Securities brokerages that appreciated as the Japanese equity market advanced and Sumitomo Mitsui a bank with an improving loan portfolio. Good stock picking in Asia excluding Australia and New Zealand and a substantial underweighting in Europe bolstered relative returns as well. Strong results also came from South Korea’s Kookmin Bank and Canada’s Talisman Energy, helped in part by favorable currency movements in these countries. However, the fund’s over weighting in semiconductor stocks hurt relative performance, with United Microelectronics, a Taiwanese chip maker, the largest detractor. Lyondell Chemical, a U.S. company affected by the Gulf Coast hurricanes, and Alcatel, a French telecommunications equipment company, also detracted. The fund’s position in Alcatel was sold by period end.
The views expressed in this statement reflect those of the portfolio manager only through the end of the period of the report as stated on the cover and do not necessarily represent the views of Fidelity or any other person in the Fidelity organization. Any such views are subject to change at any time based upon market or other conditions and Fidelity disclaims any responsibility to update such views. These views may not be relied on as invest ment advice and, because investment decisions for a Fidelity fund are based on numerous factors, may not be relied on as an indication of trading intent on behalf of any Fidelity fund.
153 153 Annual Report
| | VIP Overseas Portfolio
Investment Changes
|
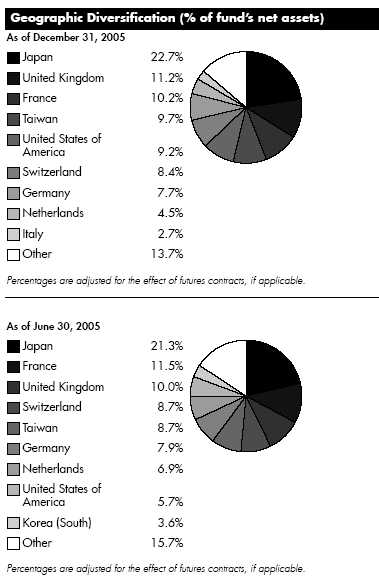
| Asset Allocation | | | | |
| | | % of fund’s | | % of fund’s net assets |
| | | net assets | | 6 months ago |
| Stocks | | 95.0 | | 97.8 |
| Short Term Investments and Net Other Assets | | 5.0 | | 2.2 |
Top Ten Stocks as of December 31, 2005 | | | | |
| | | % of fund’s | | % of fund’s net assets |
| | | net assets | | 6 months ago |
| Nikko Cordial Corp. (Japan, Capital Markets) | | 3.5 | | 1.8 |
| Total SA Series B (France, Oil, Gas & Consumable Fuels) | | 2.9 | | 4.5 |
| United Microelectronics Corp. (Taiwan, Semiconductors & Semiconductor Equipment) | | 2.7 | | 3.5 |
| Toyota Motor Corp. (Japan, Automobiles) | | 2.4 | | 1.1 |
| Novartis AG (Reg.) (Switzerland, Pharmaceuticals) | | 2.1 | | 1.6 |
| Tokyo Electron Ltd. (Japan, Semiconductors & Semiconductor Equipment) | | 2.0 | | 2.3 |
| Roche Holding AG (participation certificate) (Switzerland, Pharmaceuticals) | | 1.9 | | 1.8 |
| Yahoo! Japan Corp. (Japan, Internet Software & Services) | | 1.8 | | 1.1 |
VIP Overseas Portfolio 154
| | % of fund’s | | % of fund’s net assets |
| | net assets | | 6 months ago |
| | | | |
| Muenchener Rueckversicherungs Gesellschaft AG (Reg.) (Germany, Insurance) | | 1.6 | | 0.0 |
| Aeon Co. Ltd. (Japan, Food & Staples Retailing) | | 1.6 | | 0.6 |
| | | 22.5 | | |
| Market Sectors as of December 31, 2005 | | | | |
| | | % of fund’s | | % of fund’s net assets |
| | | net assets | | 6 months ago |
| Financials | | 26.9 | | 25.1 |
| Information Technology | | 20.4 | | 27.2 |
| Consumer Discretionary | | 9.8 | | 10.3 |
| Energy | | 9.1 | | 10.3 |
| Health Care | | 7.9 | | 6.3 |
| Materials | | 6.4 | | 6.1 |
| Consumer Staples | | 6.2 | | 4.0 |
| Telecommunication Services | | 3.9 | | 3.5 |
| Industrials | | 3.1 | | 4.2 |
| Utilities | | 1.3 | | 0.8 |
155 Annual Report
| VIP Overseas Portfolio | | | | | | |
| Investments December 31, | | 2005 | | | | |
| Showing Percentage of Net Assets | | | | | | |
| |
| Common Stocks 94.7% | | | | | | |
| | | | | | | Shares | | Value (Note 1) |
| Australia 0.1% | | | | | | | | |
| Australia & New Zealand Banking Group Ltd. | | | | 192,900 | | $ 3,388,968 |
| Austria 0.4% | | | | | | | | |
| OMV AG | | | | | | 185,600 | | 10,876,267 |
| Belgium – 0.3% | | | | | | | | |
| InBev SA | | | | | | 159,700 | | 6,951,767 |
| Canada 1.9% | | | | | | | | |
| Canadian Natural Resources Ltd. | | | | 290,400 | | 14,395,727 |
| EnCana Corp. | | | | | | 288,200 | | 13,029,798 |
| Inmet Mining Corp. | | | | | | 252,600 | | 6,409,789 |
| Talisman Energy, Inc. | | | | | | 334,700 | | 17,734,738 |
| TOTAL CANADA | | | | | | | | 51,570,052 |
| |
| Cayman Islands 0.5% | | | | | | |
| GlobalSantaFe Corp. | | | | | | 288,500 | | 13,891,275 |
| Suntech Power Holdings Co. Ltd. sponsored ADR | | | | 13,100 | | 356,975 |
| TOTAL CAYMAN ISLANDS | | | | | | 14,248,250 |
| |
| Denmark – 0.2% | | | | | | | | |
| Danske Bank AS | | | | | | 152,900 | | 5,386,195 |
| Finland – 0.2% | | | | | | | | |
| Neste Oil Oyj | | | | | | 156,700 | | 4,429,962 |
| France – 10.2% | | | | | | | | |
| Accor SA | | | | | | 254,852 | | 14,017,286 |
| AXA SA | | | | | | 619,904 | | 20,041,494 |
| BNP Paribas SA | | | | | | 227,002 | | 18,368,127 |
| France Telecom SA | | | | | | 305,161 | | 7,580,200 |
| L’Air Liquide SA | | | | | | 37,800 | | 7,271,799 |
| L’Oreal SA | | | | | | 154,695 | | 11,500,920 |
| Lagardere S.C.A. (Reg.) | | | | 146,900 | | 11,303,992 |
| Louis Vuitton Moet Hennessy (LVMH) | | | | 94,700 | | 8,413,900 |
| Pernod Ricard SA | | | | | | 172,900 | | 30,170,962 |
| Renault SA | | | | | | 95,500 | | 7,789,674 |
| Sanofi Aventis sponsored ADR | | | | 610,600 | | 26,805,340 |
| Societe Generale Series A | | | | 56,300 | | 6,925,013 |
| Total SA Series B | | | | | | 317,400 | | 80,238,721 |
| Vinci SA | | | | | | 74,500 | | 6,407,499 |
| Vivendi Universal SA sponsored ADR | | | | 748,300 | | 23,519,069 |
| TOTAL FRANCE | | | | | | | | 280,353,996 |
| |
| Germany 7.5% | | | | | | | | |
| Allianz AG (Reg.) | | | | | | 269,800 | | 40,847,719 |
| BASF AG | | | | | | 172,725 | | 13,210,008 |
| Bayer AG | | | | | | 177,800 | | 7,424,928 |
| DaimlerChrysler AG | | | | | | 302,400 | | 15,431,472 |
| Deutsche Bank AG (NY Shares) | | | | 95,200 | | 9,222,024 |
| Deutsche Post AG | | | | | | 152,400 | | 3,694,976 |
| Deutsche Postbank AG (d) | | | | 123,300 | | 7,152,467 |
| Deutsche Telekom AG sponsored ADR | | | | 854,000 | | 14,202,020 |
| E.ON AG | | | | | | 273,044 | | 28,276,437 |
| GFK AG | | | | | | 64,969 | | 2,176,653 |
| |
| |
| See accompanying notes which are an integral part of the financial statements. | | | | |
| |
| VIP Overseas Portfolio | | 156 | | | | |
| | | Shares | | Value (Note 1) |
| Hypo Real Estate Holding AG | | 147,300 | | $ 7,669,281 |
| Muenchener Rueckversicherungs | | | | |
| Gesellschaft AG (Reg.) | | 318,800 | | 43,168,314 |
| RWE AG | | 97,000 | | 7,182,832 |
| SAP AG sponsored ADR | | 182,500 | | 8,225,275 |
| TOTAL GERMANY | | | | 207,884,406 |
| |
| Greece 0.1% | | | | |
| Greek Organization of Football Prognostics SA | | 109,500 | | 3,772,279 |
| Hong Kong – 1.7% | | | | |
| ASM Pacific Technology Ltd. (d) | | 3,559,500 | | 20,084,493 |
| Cheung Kong Holdings Ltd. | | 318,000 | | 3,262,580 |
| Esprit Holdings Ltd. | | 850,500 | | 6,043,934 |
| Hong Kong Exchanges & Clearing Ltd. | | 1,942,500 | | 8,054,449 |
| Hutchison Whampoa Ltd. | | 475,600 | | 4,529,874 |
| Wharf Holdings Ltd. | | 1,541,000 | | 5,445,616 |
| TOTAL HONG KONG | | | | 47,420,946 |
| |
| India 0.7% | | | | |
| Cipla Ltd. | | 418,002 | | 4,161,905 |
| Infosys Technologies Ltd. | | 112,723 | | 7,507,810 |
| Satyam Computer Services Ltd. | | 499,509 | | 8,193,413 |
| State Bank of India | | 21,195 | | 465,004 |
| TOTAL INDIA | | | | 20,328,132 |
| |
| Ireland 0.6% | | | | |
| Allied Irish Banks PLC | | 226,500 | | 4,865,220 |
| DEPFA BANK PLC | | 428,600 | | 6,337,402 |
| Ryanair Holdings PLC sponsored ADR (a) | | 119,400 | | 6,685,206 |
| TOTAL IRELAND | | | | 17,887,828 |
| |
| Italy 2.6% | | | | |
| Banca Intesa Spa | | 3,733,100 | | 19,776,951 |
| ENI Spa | | 859,386 | | 23,969,997 |
| FASTWEB Spa (a) | | 111,700 | | 5,108,278 |
| Mediaset Spa | | 185,900 | | 1,969,696 |
| Telecom Italia Spa | | 1,118,300 | | 3,256,793 |
| Unicredito Italiano Spa | | 2,457,400 | | 16,922,776 |
| TOTAL ITALY | | | | 71,004,491 |
| |
| Japan 22.7% | | | | |
| Advantest Corp. | | 135,500 | | 13,664,349 |
| Aeon Co. Ltd. | | 1,687,100 | | 42,926,935 |
| Astellas Pharma, Inc. | | 185,100 | | 7,221,577 |
| Canon, Inc. | | 274,100 | | 16,125,304 |
| Credit Saison Co. Ltd. | | 150,700 | | 7,528,290 |
| Dainippon Screen Manufacturing Co. Ltd. | | 425,000 | | 3,557,737 |
| Daiwa Securities Group, Inc. | | 1,462,000 | | 16,578,551 |
| FamilyMart Co. Ltd. | | 113,000 | | 3,824,011 |
| Hoya Corp. | | 92,900 | | 3,340,792 |
| JAFCO Co. Ltd. (d) | | 339,500 | | 30,320,472 |
| Marui Co. Ltd. | | 176,500 | | 3,465,481 |
See accompanying notes which are an integral part of the financial statements.
|
157 Annual Report
157
| VIP Overseas Portfolio | | | | |
| Investments - continued | | | | |
| |
| |
| Common Stocks continued | | | | |
| | | Shares | | Value (Note 1) |
| Japan continued | | | | |
| Millea Holdings, Inc. | | 284 | | $ 4,889,700 |
| Mitsubishi Estate Co. Ltd. | | 1,073,000 | | 22,296,342 |
| Mitsui & Co. Ltd. | | 698,000 | | 8,968,831 |
| Mitsui Fudosan Co. Ltd. | | 1,082,000 | | 21,978,628 |
| Mizuho Financial Group, Inc. | | 2,764 | | 21,942,277 |
| Nikko Cordial Corp. | | 6,150,000 | | 97,436,073 |
| Nippon Electric Glass Co. Ltd. | | 371,000 | | 8,102,498 |
| Nitto Denko Corp. | | 527,800 | | 41,138,902 |
| ORIX Corp. | | 22,300 | | 5,683,517 |
| Sega Sammy Holdings, Inc. | | 49,300 | | 1,651,626 |
| Sompo Japan Insurance, Inc | | 704,000 | | 9,523,600 |
| Sumco Corp. | | 76,900 | | 4,037,242 |
| Sumitomo Electric Industries Ltd. | | 227,900 | | 3,461,846 |
| Sumitomo Mitsui Financial Group, Inc. | | 3,198 | | 33,904,416 |
| T&D Holdings, Inc. | | 97,750 | | 6,483,228 |
| Takefuji Corp. | | 121,310 | | 8,241,323 |
| Tokuyama Corp. | | 413,000 | | 5,306,773 |
| Tokyo Electron Ltd. | | 876,700 | | 55,098,150 |
| Toyota Motor Corp. | | 1,261,400 | | 65,983,838 |
| USS Co. Ltd. | | 34,750 | | 2,216,361 |
| Yahoo! Japan Corp | | 32,261 | | 48,977,731 |
| TOTAL JAPAN | | | | 625,876,401 |
| |
| Korea (South) – 1.4% | | | | |
| Hyundai Motor Co. | | 20,523 | | 1,982,023 |
| Kookmin Bank | | 105,390 | | 8,002,319 |
| LG Electronics, Inc. | | 46,530 | | 4,124,198 |
| LG.Philips LCD Co. Ltd. sponsored ADR (a)(d) | | 269,000 | | 5,772,740 |
| Samsung Electronics Co. Ltd. | | 22,352 | | 14,620,318 |
| Shinhan Financial Group Co. Ltd. | | 43,904 | | 1,788,843 |
| Shinsegae Co. Ltd. | | 2,458 | | 1,080,788 |
| TOTAL KOREA (SOUTH) | | | | 37,371,229 |
| |
| Netherlands – 4.5% | | | | |
| ABN AMRO Holding NV sponsored ADR | | 280,600 | | 7,334,884 |
| Aegon NV | | 882,300 | | 14,362,024 |
| ASML Holding NV (a) | | 849,139 | | 17,050,713 |
| EADS NV | | 46,500 | | 1,756,064 |
| ING Groep NV (Certificaten Van Aandelen) | | 799,624 | | 27,842,908 |
| Koninklijke KPN NV sponsored ADR | | 858,000 | | 8,614,320 |
| Koninklijke Numico NV (a) | | 203,300 | | 8,418,871 |
| Koninklijke Philips Electronics NV (NY Shares) | | 260,100 | | 8,089,110 |
| Reed Elsevier NV | | 387,300 | | 5,410,360 |
| Unilever NV (NY Shares) | | 95,100 | | 6,528,615 |
| VNU NV | | 559,525 | | 18,553,647 |
| TOTAL NETHERLANDS | | | | 123,961,516 |
| |
| Netherlands Antilles – 0.1% | | | | |
| Schlumberger Ltd. (NY Shares) | | 39,700 | | 3,856,855 |
See accompanying notes which are an integral part of the financial statements.
| | |
| VIP Overseas Portfolio | | 158 |
| | | Shares | | Value (Note 1) |
| Norway 0.6% | | | | |
| DnB NOR ASA | | 487,800 | | $ 5,206,980 |
| Statoil ASA | | 516,400 | | 11,866,688 |
| TOTAL NORWAY | | | | 17,073,668 |
| |
| Philippines – 0.1% | | | | |
| Philippine Long Distance Telephone Co. sponsored ADR (d) | | 47,300 | | 1,586,442 |
| Singapore – 1.5% | | | | |
| STATS ChipPAC Ltd. (a) | | 39,118,000 | | 26,110,815 |
| United Test & Assembly Center Ltd. (a) | | 37,990,000 | | 16,676,809 |
| TOTAL SINGAPORE | | | | 42,787,624 |
| |
| South Africa – 0.3% | | | | |
| FirstRand Ltd. | | 2,436,200 | | 7,103,578 |
| Spain 2.1% | | | | |
| Banco Bilbao Vizcaya Argentaria SA | | 854,700 | | 15,256,391 |
| Banco Santander Central Hispano SA | | 1,077,700 | | 14,214,858 |
| Gestevision Telecinco SA | | 344,477 | | 8,694,490 |
| Telefonica SA | | 1,268,080 | | 19,029,661 |
| TOTAL SPAIN | | | | 57,195,400 |
| |
| Sweden 0.9% | | | | |
| Gambro AB (A Shares) | | 488,200 | | 5,330,902 |
| Telefonaktiebolaget LM Ericsson (B Shares) sponsored ADR | | 558,300 | | 19,205,520 |
| TOTAL SWEDEN | | | | 24,536,422 |
| |
| Switzerland 8.4% | | | | |
| Compagnie Financiere Richemont unit | | 296,004 | | 12,885,410 |
| Credit Suisse Group (Reg.) | | 568,055 | | 28,942,402 |
| Nestle SA (Reg.) | | 98,719 | | 29,525,546 |
| Novartis AG (Reg.) | | 1,108,217 | | 58,159,228 |
| Roche Holding AG (participation certificate) | | 346,843 | | 52,079,242 |
| Societe Generale de Surveillance Holding SA (SGS) (Reg.) | | 4,155 | | 3,503,607 |
| Swiss Reinsurance Co. (Reg.) | | 96,976 | | 7,099,765 |
| Syngenta AG sponsored ADR | | 153,600 | | 3,826,176 |
| The Swatch Group AG (Reg.) | | 126,695 | | 3,832,668 |
| UBS AG (Reg.) | | 302,164 | | 28,750,905 |
| Zurich Financial Services AG | | 17,183 | | 3,661,522 |
| TOTAL SWITZERLAND | | | | 232,266,471 |
| |
| Taiwan 9.7% | | | | |
| Advanced Semiconductor Engineering, Inc. | | 36,589,617 | | 33,550,561 |
| Advanced Semiconductor Engineering, Inc. sponsored ADR | | 331,100 | | 1,486,639 |
| ASE Test Ltd. (a) | | 1,624,900 | | 12,755,465 |
| AU Optronics Corp. | | 10,858,580 | | 16,208,564 |
| AU Optronics Corp. sponsored ADR | | 622,500 | | 9,343,725 |
| Chi Mei Optoelectronics Corp. | | 12,201,429 | | 18,064,352 |
| Chi Mei Optoelectronics Corp. GDR (e) | | 436,159 | | 6,215,266 |
See accompanying notes which are an integral part of the financial statements.
|
159 Annual Report
159
| VIP Overseas Portfolio | | | | |
| Investments - continued | | | | |
| |
| |
| Common Stocks continued | | | | |
| | | Shares | | Value (Note 1) |
| Taiwan continued | | | | |
| Hon Hai Precision Industry Co. Ltd. (Foxconn) | | 1,278,409 | | $ 7,009,996 |
| King Yuan Electronics Co. Ltd. | | 20,673,316 | | 22,640,419 |
| Siliconware Precision Industries Co. Ltd. | | 24,550,738 | | 34,440,513 |
| Sunplus Technology Co. Ltd. | | 12,625,735 | | 16,000,200 |
| Taiwan Semiconductor Manufacturing Co. Ltd. | | 1,191,000 | | 2,267,604 |
| United Microelectronics Corp. | | 113,416,781 | | 64,263,694 |
| United Microelectronics Corp. sponsored ADR (d) | | 3,877,881 | | 12,098,989 |
| Yageo Corp. (a) | | 29,599,000 | | 12,623,521 |
| TOTAL TAIWAN | | | | 268,969,508 |
| |
| United Kingdom – 11.2% | | | | |
| AstraZeneca PLC (United Kingdom) | | 169,800 | | 8,252,279 |
| BAE Systems PLC | | 2,469,200 | | 16,227,625 |
| BHP Billiton PLC | | 1,710,695 | | 27,963,221 |
| BP PLC | | 2,410,206 | | 25,797,257 |
| British American Tobacco PLC | | 158,400 | | 3,545,016 |
| British Land Co. PLC | | 501,400 | | 9,201,554 |
| Capita Group PLC | | 286,600 | | 2,056,229 |
| Enterprise Inns PLC | | 216,800 | | 3,500,917 |
| GlaxoSmithKline PLC | | 1,168,800 | | 29,500,519 |
| HSBC Holdings PLC (United Kingdom) (Reg.) | | 790,626 | | 12,724,332 |
| Informa PLC | | 487,200 | | 3,638,031 |
| ITV PLC | | 4,352,554 | | 8,429,782 |
| O2 PLC | | 2,520,300 | | 8,580,021 |
| Prudential PLC | | 750,600 | | 7,107,075 |
| Reckitt Benckiser PLC | | 162,700 | | 5,377,847 |
| Rio Tinto PLC (Reg.) | | 336,706 | | 15,386,621 |
| Royal Bank of Scotland Group PLC | | 884,600 | | 26,726,599 |
| Smiths Group PLC | | 857,000 | | 15,432,353 |
| Standard Chartered PLC (United Kingdom) | | 183,900 | | 4,099,880 |
| Tesco PLC | | 4,037,541 | | 23,041,997 |
| Vodafone Group PLC | | 16,794,125 | | 36,056,930 |
| WPP Group PLC | | 204,800 | | 2,217,687 |
| Xstrata PLC | | 367,500 | | 8,604,307 |
| Yell Group PLC | | 595,100 | | 5,496,412 |
| TOTAL UNITED KINGDOM | | | | 308,964,491 |
| |
| United States of America – 4.2% | | | | |
| Baker Hughes, Inc. | | 56,900 | | 3,458,382 |
| BJ Services Co. | | 104,700 | | 3,839,349 |
| Diamond Offshore Drilling, Inc. | | 56,700 | | 3,944,052 |
| Freeport McMoRan Copper & Gold, Inc. Class B | | 165,900 | | 8,925,420 |
| Halliburton Co. | | 125,400 | | 7,769,784 |
| Honeywell International, Inc. | | 303,200 | | 11,294,200 |
| |
| |
| | | Shares | | Value (Note 1) |
| Lyondell Chemical Co. | | 1,238,500 | | $ 29,501,070 |
| Nabors Industries Ltd. (a) | | 48,900 | | 3,704,175 |
| NTL, Inc. (a) | | 165,100 | | 11,240,008 |
| Synthes, Inc. | | 229,259 | | 25,752,381 |
See accompanying notes which are an integral part of the financial statements.
| | |
| VIP Overseas Portfolio | | 160 |
| | Shares | | Value (Note 1) |
| | | | |
| | | | |
| Transocean, Inc. (a) | | 56,700 | | 3,951,423 |
| Weatherford International Ltd. (a) | | 97,800 | | 3,540,360 |
| TOTAL UNITED STATES OF AMERICA | | | | 116,920,604 |
| |
| TOTAL COMMON STOCKS | | | | |
| (Cost $1,996,760,620) | | 2,613,973,748 |
| Nonconvertible Preferred Stocks 0.3% | | | | |
| |
| Germany 0.2% | | | | |
| Porsche AG (non vtg.) | | 6,600 | | 4,742,505 |
| Italy 0.1% | | | | |
| Telecom Italia Spa (Risp) | | 1,335,500 | | 3,312,261 |
| TOTAL NONCONVERTIBLE PREFERRED STOCKS | | | | |
| (Cost $7,984,780) | | | | 8,054,766 |
| Money Market Funds 4.7% | | | | |
| Fidelity Cash Central Fund, 4.28% (b) | | 101,089,929 | | 101,089,929 |
| Fidelity Securities Lending Cash Central Fund, 4.35% (b)(c) | | 27,976,752 | | 27,976,752 |
| TOTAL MONEY MARKET FUNDS | | | | |
| (Cost $129,066,681) | | | | 129,066,681 |
| TOTAL INVESTMENT PORTFOLIO 99.7% | | | | |
| (Cost $2,133,812,081) | | 2,751,095,195 |
| |
| NET OTHER ASSETS 0.3% | | | | 9,252,851 |
| NET ASSETS 100% | | $2,760,348,046 |
Legend
(a) Non-income producing
(b) Affiliated fund that is available only to investment companies and other accounts managed by Fidelity Investments. The rate quoted is the annualized seven-day
yield of the fund at period end. A complete unaudited listing of the fund’s holdings as of its most recent quarter end is available upon request.
(c) Investment made with cash collateral received from securities on loan.
(d) Security or a portion of the security is on loan at period end.
(e) Security exempt from registration under Rule 144A of the Securities Act of 1933. These securities may be resold in transactions exempt from registration,
normally to qualified institutional buyers. At the period end, the value of these securities amounted to $6,215,266 or 0.2% of net assets.
|
See accompanying notes which are an integral part of the financial statements.
161 Annual Report
VIP Overseas Portfolio
Investments - continued
|
Affiliated Central Funds
Information regarding income received by the fund from the affiliated Central funds during the period is as follows:
| Fund | | Income received |
| Fidelity Cash Central Fund | | $ 2,176,949 |
| Fidelity Securities Lending Cash Central Fund | | 2,139,747 |
| Total | | $ 4,316,696 |
Income Tax Information
At December 31, 2005, the fund had a capital loss carryforward of approximately $156,501,171 of which $109,194,861 and $47,306,310 will expire on December 31, 2010 and 2011, respectively.
See accompanying notes which are an integral part of the financial statements.
VIP Overseas Portfolio 162
| VIP Overseas Portfolio | | | | |
| |
| Financial Statements | | | | |
| |
| |
| Statement of Assets and Liabilities | | | | |
| | | December 31, 2005 |
| |
| Assets | | | | |
| Investment in securities, at value (including securities loaned of $26,838,424) — See accompanying schedule: | | | | |
| Unaffiliated issuers (cost $2,004,745,400) | | $ | | 2,622,028,514 | | |
| Affiliated Central Funds (cost $129,066,681) | | 129,066,681 | | |
| Total Investments (cost $2,133,812,081) | | | | | | $ | | 2,751,095,195 |
| Cash | | | | 15,463,634 |
| Foreign currency held at value (cost $4,603,721) | | | | 4,569,004 |
| Receivable for investments sold | | | | 115,364,273 |
| Receivable for fund shares sold | | | | 1,616,939 |
| Dividends receivable | | | | 1,756,462 |
| Interest receivable | | | | 485,180 |
| Prepaid expenses | | | | 11,436 |
| Other affiliated receivables | | | | 20,187 |
| Other receivables | | | | 451,867 |
| Total assets | | | | 2,890,834,177 |
| |
| Liabilities | | | | |
| Payable for investments purchased | | $ | | 95,798,100 | | |
| Payable for fund shares redeemed | | 4,207,308 | | |
| Accrued management fee | | 1,615,341 | | |
| Distribution fees payable | | 147,813 | | |
| Other affiliated payables | | 311,611 | | |
| Other payables and accrued expenses | | 429,206 | | |
| Collateral on securities loaned, at value | | 27,976,752 | | |
| Total liabilities | | | | 130,486,131 |
| |
| Net Assets | | | | | | $ | | 2,760,348,046 |
| Net Assets consist of: | | | | |
| Paid in capital | | $2,272,775,899 |
| Undistributed net investment income | | | | 24,125,361 |
| Accumulated undistributed net realized gain (loss) on investments and foreign currency transactions | | | | (153,512,945) |
| Net unrealized appreciation (depreciation) on investments and assets and liabilities in foreign currencies | | | | 616,959,731 |
| Net Assets | | | | | | $ | | 2,760,348,046 |
| |
| Statement of Assets and Liabilities continued | | | | |
| | | December 31, 2005 |
| |
| Initial Class: | | | | |
| Net Asset Value, offering price and redemption price per share ($1,549,178,663 ÷ 75,186,543 shares) | | | | $ | | 20.60 |
| Service Class: | | | | |
| Net Asset Value, offering price and redemption price per share ($329,758,920 ÷ 16,073,633 shares) | | | | $ | | 20.52 |
| Service Class 2: | | | | |
| Net Asset Value, offering price and redemption price per share ($502,800,530 ÷ 24,606,154 shares) | | | | $ | | 20.43 |
| Initial Class R: | | | | |
| Net Asset Value, offering price and redemption price per share ($184,244,852 ÷ 8,956,194 shares) | | | | $ | | 20.57 |
| Service Class R: | | | | |
| Net Asset Value, offering price and redemption price per share ($115,448,802 ÷ 5,632,849 shares) | | | | $ | | 20.50 |
| Service Class 2R: | | | | |
| Net Asset Value, offering price and redemption price per share ($49,372,754 ÷ 2,429,601 shares) | | | | $ | | 20.32 |
| Investor Class R: | | | | |
| Net Asset Value, offering price and redemption price per share ($29,543,525 ÷ 1,434,755 shares) | | | | $ | | 20.59 |
See accompanying notes which are an integral part of the financial statements.
|
163 Annual Report
| VIP Overseas Portfolio | | | | | | | | |
| Financial Statements - continued | | | | | | | | |
| |
| |
| Statement of Operations | | | | | | | | |
| | | | | Year ended December 31, 2005 |
| |
| Investment Income | | | | | | | | |
| Dividends | | | | | | $ | | 47,922,718 |
| Interest | | | | | | | | 20,541 |
| Income from affiliated Central Funds (including $2,139,747 from security lending) | | | | | | | | 4,316,696 |
| | | | | | | | | 52,259,955 |
| Less foreign taxes withheld | | | | | | | | (6,229,572) |
| Total income | | | | | | | | 46,030,383 |
| |
| Expenses | | | | | | | | |
| Management fee | | $ | | 17,341,800 | | | | |
| Transfer agent fees | | | | 1,645,574 | | | | |
| Distribution fees | | | | 1,469,482 | | | | |
| Accounting and security lending fees | | | | 1,137,209 | | | | |
| Independent trustees’ compensation | | | | 10,611 | | | | |
| Appreciation in deferred trustee compensation account | | | | 7,280 | | | | |
| Custodian fees and expenses | | | | 999,267 | | | | |
| Audit | | | | 83,838 | | | | |
| Legal | | | | 9,377 | | | | |
| Interest | | | | 4,028 | | | | |
| Miscellaneous | | | | 274,958 | | | | |
| Total expenses before reductions | | | | 22,983,424 | | | | |
| Expense reductions | | | | (1,740,137) | | | | 21,243,287 |
| |
| Net investment income (loss) | | | | | | | | 24,787,096 |
| Realized and Unrealized Gain (Loss) | | | | | | | | |
| Net realized gain (loss) on: | | | | | | | | |
| Investment securities: | | | | | | | | |
| Unaffiliated issuers | | | | 345,470,000 | | | | |
| Foreign currency transactions | | | | (621,729) | | | | |
| Total net realized gain (loss) | | | | | | | | 344,848,271 |
| Change in net unrealized appreciation (depreciation) on: | | | | | | | | |
| Investment securities (net of decrease in deferred foreign taxes of $1,045,629) | | | | 66,441,690 | | | | |
| Assets and liabilities in foreign currencies | | | | (964,917) | | | | |
| Total change in net unrealized appreciation (depreciation) | | | | | | | | 65,476,773 |
| Net gain (loss) | | | | | | | | 410,325,044 |
| Net increase (decrease) in net assets resulting from operations | | | | | | $ | | 435,112,140 |
| |
| Statement of Changes in Net Assets | | | | | | | | |
| | | | | Year ended | | | | Year ended |
| | | | | December 31, | | | | December 31, |
| | | | | 2005 | | | | 2004 |
| Increase (Decrease) in Net Assets | | | | | | | | |
| Operations | | | | | | | | |
| Net investment income (loss) | | $ | | 24,787,096 | | $ | | 15,719,326 |
| Net realized gain (loss) | | | | 344,848,271 | | | | 146,009,083 |
| Change in net unrealized appreciation (depreciation) | | | | 65,476,773 | | | | 114,577,658 |
| Net increase (decrease) in net assets resulting from operations | | | | 435,112,140 | | | | 276,306,067 |
| Distributions to shareholders from net investment income | | | | (14,837,058) | | | | (22,557,627) |
| Distributions to shareholders from net realized gain | | | | (12,260,637) | | | | — |
| Total distributions | | | | (27,097,695) | | | | (22,557,627) |
| Share transactions - net increase (decrease) | | | | (27,675,205) | | | | 199,907,441 |
| Redemption fees | | | | 31,974 | | | | 51,279 |
| Total increase (decrease) in net assets | | | | 380,371,214 | | | | 453,707,160 |
| |
| Net Assets | | | | | | | | |
| Beginning of period | | | | 2,379,976,832 | | | | 1,926,269,672 |
| End of period (including undistributed net investment income of $24,125,361 and undistributed net investment income | | | | | | | | |
| of $1,867,057, respectively) | | $ | | 2,760,348,046 | | $ | | 2,379,976,832 |
See accompanying notes which are an integral part of the financial statements.
| | |
| VIP Overseas Portfolio | | 164 |
| Financial Highlights Initial Class | | | | | | | | | | |
| Years ended December 31, | | 2005 | | 2004 | | 2003 | | 2002 | | 2001 |
| Selected Per Share Data | | | | | | | | | | |
| Net asset value, beginning of period | | $ 17.51 | | $ 15.59 | | $ 10.98 | | $ 13.88 | | $ 20.00 |
| Income from Investment Operations | | | | | | | | | | |
| Net investment income (loss)C | | 20 | | .13 | | .11 | | .10 | | .14 |
| Net realized and unrealized gain (loss) | | 3.10 | | 1.97 | | 4.60 | | (2.90) | | (3.86) |
| Total from investment operations | | 3.30 | | 2.10 | | 4.71 | | (2.80) | | (3.72) |
| Distributions from net investment income | | (.12) | | (.18) | | (.10) | | (.10) | | (.93) |
| Distributions from net realized gain | | (.09) | | — | | — | | | | (1.47) |
| Total distributions | | (.21) | | (.18) | | (.10) | | (.10) | | (2.40) |
| Redemption fees added to paid in capitalC | | —E | | —E | | —E | | —E | | — |
| Net asset value, end of period | | $ 20.60 | | $ 17.51 | | $ 15.59 | | $ 10.98 | | $ 13.88 |
| Total ReturnA,B | | 19.06% | | 13.57% | | 43.37% | | (20.28)% | | (21.21)% |
| Ratios to Average Net AssetsD | | | | | | | | | | |
| Expenses before reductions | | 89% | | .91% | | .90% | | .90% | | .92% |
| Expenses net of fee waivers, if any | | 89% | | .91% | | .90% | | .90% | | .92% |
| Expenses net of all reductions | | 82% | | .87% | | .86% | | .86% | | .87% |
| Net investment income (loss) | | 1.11% | | .80% | | .87% | | .79% | | .91% |
| Supplemental Data | | | | | | | | | | |
| Net assets, end of period (000 omitted) | | $1,549,179 | | $1,491,485 | | $1,436,137 | | $1,031,489 | | $1,496,873 |
| Portfolio turnover rate | | 92% | | 84% | | 99% | | 77% | | 98% |
A Total returns do not reflect charges attributable to your insurance company’s separate account. Inclusion of these charges would reduce the total returns shown.
B Total returns would have been lower had certain expenses not been reduced during the periods shown.
C Calculated based on average shares outstanding during the period.
D Expense ratios reflect operating expenses of the class. Expenses before reductions do not reflect amounts reimbursed by the investment adviser or reductions from brokerage service arrangements or other expense offset arrangements and do not
represent the amount paid by the class during periods when reimbursements or reductions occur. Expenses net of fee waivers reflect expenses after reimbursement by the investment adviser but prior to reductions from brokerage service arrange
ments or other expense offset arrangements. Expenses net of all reductions represent the net expenses paid by the class.
E Amount represents less than $.01 per share.
|
| Financial Highlights Service Class | | | | | | | | | | |
| Years ended December 31, | | 2005 | | 2004 | | 2003 | | 2002 | | 2001 |
| Selected Per Share Data | | | | | | | | | | |
| Net asset value, beginning of period | | $ 17.44 | | $ 15.53 | | $ 10.94 | | $ 13.83 | | $ 19.94 |
| Income from Investment Operations | | | | | | | | | | |
| Net investment income (loss)C | | 18 | | .11 | | .09 | | .09 | | .12 |
| Net realized and unrealized gain (loss) | | 3.09 | | 1.97 | | 4.59 | | (2.89) | | (3.84) |
| Total from investment operations | | 3.27 | | 2.08 | | 4.68 | | (2.80) | | (3.72) |
| Distributions from net investment income | | (.10) | | (.17) | | (.09) | | (.09) | | (.92) |
| Distributions from net realized gain | | (.09) | | — | | — | | | | (1.47) |
| Total distributions | | (.19) | | (.17) | | (.09) | | (.09) | | (2.39) |
| Redemption fees added to paid in capitalC | | —E | | —E | | —E | | —E | | — |
| Net asset value, end of period | | $ 20.52 | | $ 17.44 | | $ 15.53 | | $ 10.94 | | $ 13.83 |
| Total ReturnA,B | | 18.97% | | 13.49% | | 43.20% | | (20.34)% | | (21.27)% |
| Ratios to Average Net AssetsD | | | | | | | | | | |
| Expenses before reductions | | 99% | | 1.01% | | 1.00% | | 1.00% | | 1.03% |
| Expenses net of fee waivers, if any | | 99% | | 1.01% | | 1.00% | | 1.00% | | 1.03% |
| Expenses net of all reductions | | 92% | | .97% | | .96% | | .96% | | .97% |
| Net investment income (loss) | | 1.02% | | .69% | | .77% | | .69% | | .81% |
| Supplemental Data | | | | | | | | | | |
| Net assets, end of period (000 omitted) | | $ 329,759 | | $ 322,649 | | $ 246,632 | | $ 177,322 | | $ 240,525 |
| Portfolio turnover rate | | 92% | | 84% | | 99% | | 77% | | 98% |
A Total returns do not reflect charges attributable to your insurance company’s separate account. Inclusion of these charges would reduce the total returns shown.
B Total returns would have been lower had certain expenses not been reduced during the periods shown.
C Calculated based on average shares outstanding during the period.
D Expense ratios reflect operating expenses of the class. Expenses before reductions do not reflect amounts reimbursed by the investment adviser or reductions from brokerage service arrangements or other expense offset arrangements and do not
represent the amount paid by the class during periods when reimbursements or reductions occur. Expenses net of fee waivers reflect expenses after reimbursement by the investment adviser but prior to reductions from brokerage service arrange
ments or other expense offset arrangements. Expenses net of all reductions represent the net expenses paid by the class.
E Amount represents less than $.01 per share.
|
See accompanying notes which are an integral part of the financial statements.
|
165 Annual Report
| Financial Highlights Service Class 2 | | | | | | | | | | |
| Years ended December 31, | | 2005 | | 2004 | | 2003 | | 2002 | | 2001 |
| Selected Per Share Data | | | | | | | | | | |
| Net asset value, beginning of period | | $ 17.39 | | $ 15.50 | | $ 10.90 | | $ 13.81 | | $ 19.91 |
| Income from Investment Operations | | | | | | | | | | |
| Net investment income (loss)C | | 14 | | .08 | | .08 | | .07 | | .10 |
| Net realized and unrealized gain (loss) | | 3.08 | | 1.97 | | 4.58 | | (2.88) | | (3.80) |
| Total from investment operations | | 3.22 | | 2.05 | | 4.66 | | (2.81) | | (3.70) |
| Distributions from net investment income | | (.09) | | (.16) | | (.06) | | (.10) | | (.93) |
| Distributions from net realized gain | | (.09) | | — | | — | | | | (1.47) |
| Total distributions | | (.18) | | (.16) | | (.06) | | (.10) | | (2.40) |
| Redemption fees added to paid in capitalC | | —E | | —E | | —E | | —E | | — |
| Net asset value, end of period | | $ 20.43 | | $ 17.39 | | $ 15.50 | | $ 10.90 | | $ 13.81 |
| Total ReturnA,B | | 18.72% | | 13.31% | | 43.04% | | (20.46)% | | (21.20)% |
| Ratios to Average Net AssetsD | | | | | | | | | | |
| Expenses before reductions | | 1.14% | | 1.16% | | 1.16% | | 1.16% | | 1.18% |
| Expenses net of fee waivers, if any | | 1.14% | | 1.16% | | 1.16% | | 1.16% | | 1.18% |
| Expenses net of all reductions | | 1.07% | | 1.12% | | 1.12% | | 1.12% | | 1.12% |
| Net investment income (loss) | | 79% | | .54% | | .61% | | .53% | | .65% |
| Supplemental Data | | | | | | | | | | |
| Net assets, end of period (000 omitted) | | $ 502,801 | | $ 319,708 | | $ 140,822 | | $ 47,824 | | $ 48,843 |
| Portfolio turnover rate | | 92% | | 84% | | 99% | | 77% | | 98% |
A Total returns do not reflect charges attributable to your insurance company’s separate account. Inclusion of these charges would reduce the total returns shown.
B Total returns would have been lower had certain expenses not been reduced during the periods shown.
C Calculated based on average shares outstanding during the period.
D Expense ratios reflect operating expenses of the class. Expenses before reductions do not reflect amounts reimbursed by the investment adviser or reductions from brokerage service arrangements or other expense offset arrangements and do not
represent the amount paid by the class during periods when reimbursements or reductions occur. Expenses net of fee waivers reflect expenses after reimbursement by the investment adviser but prior to reductions from brokerage service arrange
ments or other expense offset arrangements. Expenses net of all reductions represent the net expenses paid by the class.
E Amount represents less than $.01 per share.
|
| Financial Highlights Initial Class R | | | | | | | | |
| Years ended December 31, | | 2005 | | 2004 | | 2003 | | 2002F |
| Selected Per Share Data | | | | | | | | |
| Net asset value, beginning of period | | $ 17.49 | | $ 15.57 | | $ 10.98 | | $ 14.05 |
| Income from Investment Operations | | | | | | | | |
| Net investment income (loss)E | | 19 | | .12 | | .11 | | .06 |
| Net realized and unrealized gain (loss) | | 3.10 | | 1.98 | | 4.59 | | (3.13) |
| Total from investment operations | | 3.29 | | 2.10 | | 4.70 | | (3.07) |
| Distributions from net investment income | | (.12) | | (.18) | | (.11) | | — |
| Distributions from net realized gain | | (.09) | | — | | — | | — |
| Total distributions | | (.21) | | (.18) | | (.11) | | — |
| Redemption fees added to paid in capitalE,H | | — | | — | | — | | — |
| Net asset value, end of period | | $ 20.57 | | $ 17.49 | | $ 15.57 | | $ 10.98 |
| Total ReturnB,C,D | | 19.05% | | 13.59% | | 43.32% | | (21.85)% |
| Ratios to Average Net AssetsG | | | | | | | | |
| Expenses before reductions | | 89% | | .91% | | .90% | | .91%A |
| Expenses net of fee waivers, if any | | 89% | | .91% | | .90% | | .91%A |
| Expenses net of all reductions | | 82% | | .87% | | .86% | | .87%A |
| Net investment income (loss) | | 1.08% | | .79% | | .87% | | .79%A |
| Supplemental Data | | | | | | | | |
| Net assets, end of period (000 omitted) | | $ 184,245 | | $ 132,064 | | $ 39,466 | | $ 15,649 |
| Portfolio turnover rate | | 92% | | 84% | | 99% | | 77% |
A Annualized
B Total returns for periods of less than one year are not annualized.
C Total returns do not reflect charges attributable to your insurance company’s separate account. Inclusion of these charges would reduce the total returns shown.
D Total returns would have been lower had certain expenses not been reduced during the periods shown.
E Calculated based on average shares outstanding during the period.
F For the period April 24, 2002 (commencement of sale of shares) to December 31, 2002.
G Expense ratios reflect operating expenses of the class. Expenses before reductions do not reflect amounts reimbursed by the investment adviser or reductions from brokerage service arrangements or other expense offset arrangements and do not
represent the amount paid by the class during periods when reimbursements or reductions occur. Expenses net of fee waivers reflect expenses after reimbursement by the investment adviser but prior to reductions from brokerage service arrange
ments or other expense offset arrangements. Expenses net of all reductions represent the net expenses paid by the class.
H Amount represents less than $.01 per share.
|
See accompanying notes which are an integral part of the financial statements.
| | |
| VIP Overseas Portfolio | | 166 |
| Financial Highlights Service Class R | | | | | | | | |
| Years ended December 31, | | 2005 | | 2004 | | 2003 | | 2002F |
| Selected Per Share Data | | | | | | | | |
| Net asset value, beginning of period | | $ 17.43 | | $ 15.52 | | $ 10.94 | | $ 14.01 |
| Income from Investment Operations | | | | | | | | |
| Net investment income (loss)E | | 17 | | .11 | | .10 | | .05 |
| Net realized and unrealized gain (loss) | | 3.09 | | 1.97 | | 4.58 | | (3.12) |
| Total from investment operations | | 3.26 | | 2.08 | | 4.68 | | (3.07) |
| Distributions from net investment income | | (.10) | | (.17) | | (.10) | | — |
| Distributions from net realized gain | | (.09) | | — | | — | | — |
| Total distributions | | (.19) | | (.17) | | (.10) | | — |
| Redemption fees added to paid in capitalE,H | | — | | — | | — | | — |
| Net asset value, end of period | | $ 20.50 | | $ 17.43 | | $ 15.52 | | $ 10.94 |
| Total ReturnB,C,D | | 18.92% | | 13.50% | | 43.25% | | (21.91)% |
| Ratios to Average Net AssetsG | | | | | | | | |
| Expenses before reductions | | 99% | | 1.01% | | 1.00% | | 1.01%A |
| Expenses net of fee waivers, if any | | 99% | | 1.01% | | 1.00% | | 1.01%A |
| Expenses net of all reductions | | 92% | | .96% | | .96% | | .97%A |
| Net investment income (loss) | | 96% | | .70% | | .77% | | .69%A |
| Supplemental Data | | | | | | | | |
| Net assets, end of period (000 omitted) | | $ 115,449 | | $ 86,509 | | $ 56,141 | | $ 17,997 |
| Portfolio turnover rate | | 92% | | 84% | | 99% | | 77% |
A Annualized
B Total returns for periods of less than one year are not annualized.
C Total returns do not reflect charges attributable to your insurance company’s separate account. Inclusion of these charges would reduce the total returns shown.
D Total returns would have been lower had certain expenses not been reduced during the periods shown.
E Calculated based on average shares outstanding during the period.
F For the period April 24, 2002 (commencement of sale of shares) to December 31, 2002.
G Expense ratios reflect operating expenses of the class. Expenses before reductions do not reflect amounts reimbursed by the investment adviser or reductions from brokerage service arrangements or other expense offset arrangements and do not
represent the amount paid by the class during periods when reimbursements or reductions occur. Expenses net of fee waivers reflect expenses after reimbursement by the investment adviser but prior to reductions from brokerage service arrange
ments or other expense offset arrangements. Expenses net of all reductions represent the net expenses paid by the class.
H Amount represents less than $.01 per share.
|
| Financial Highlights Service Class 2R | | | | | | | | |
| Years ended December 31, | | 2005 | | 2004 | | 2003 | | 2002F |
| Selected Per Share Data | | | | | | | | |
| Net asset value, beginning of period | | $ 17.30 | | $ 15.42 | | $ 10.90 | | $ 13.96 |
| Income from Investment Operations | | | | | | | | |
| Net investment income (loss)E | | 14 | | .08 | | .08 | | .04 |
| Net realized and unrealized gain (loss) | | 3.07 | | 1.96 | | 4.55 | | (3.10) |
| Total from investment operations | | 3.21 | | 2.04 | | 4.63 | | (3.06) |
| Distributions from net investment income | | (.10) | | (.16) | | (.11) | | — |
| Distributions from net realized gain | | (.09) | | — | | — | | — |
| Total distributions | | (.19) | | (.16) | | (.11) | | — |
| Redemption fees added to paid in capitalE,H | | — | | — | | — | | — |
| Net asset value, end of period | | $ 20.32 | | $ 17.30 | | $ 15.42 | | $ 10.90 |
| Total ReturnB,C,D | | 18.74% | | 13.32% | | 43.00% | | (21.92)% |
| Ratios to Average Net AssetsG | | | | | | | | |
| Expenses before reductions | | 1.14% | | 1.16% | | 1.15% | | 1.17%A |
| Expenses net of fee waivers, if any | | 1.14% | | 1.16% | | 1.15% | | 1.17%A |
| Expenses net of all reductions | | 1.07% | | 1.11% | | 1.11% | | 1.14%A |
| Net investment income (loss) | | 77% | | .55% | | .62% | | .52%A |
| Supplemental Data | | | | | | | | |
| Net assets, end of period (000 omitted) | | $ 49,373 | | $ 27,562 | | $ 7,072 | | $ 1,616 |
| Portfolio turnover rate | | 92% | | 84% | | 99% | | 77% |
A Annualized
B Total returns for periods of less than one year are not annualized.
C Total returns do not reflect charges attributable to your insurance company’s separate account. Inclusion of these charges would reduce the total returns shown.
D Total returns would have been lower had certain expenses not been reduced during the periods shown.
E Calculated based on average shares outstanding during the period.
F For the period April 24, 2002 (commencement of sale of shares) to December 31, 2002.
G Expense ratios reflect operating expenses of the class. Expenses before reductions do not reflect amounts reimbursed by the investment adviser or reductions from brokerage service arrangements or other expense offset arrangements and do not
represent the amount paid by the class during periods when reimbursements or reductions occur. Expenses net of fee waivers reflect expenses after reimbursement by the investment adviser but prior to reductions from brokerage service arrange
ments or other expense offset arrangements. Expenses net of all reductions represent the net expenses paid by the class.
H Amount represents less than $.01 per share.
|
See accompanying notes which are an integral part of the financial statements.
|
167 Annual Report
| Financial Highlights Investor Class R | | |
| Year ended December 31, | | 2005F |
| Selected Per Share Data | | |
| Net asset value, beginning of period | | $ 17.69 |
| Income from Investment Operations | | |
| Net investment income (loss)E | | 02 |
| Net realized and unrealized gain (loss) | | 2.88 |
| Total from investment operations | | 2.90 |
| Redemption fees added to paid in capital | | —H |
| Net asset value, end of period | | $ 20.59 |
| Total ReturnB,C,D | | 16.39% |
| Ratios to Average Net AssetsG | | |
| Expenses before reductions | | 1.07%A |
| Expenses net of fee waivers, if any | | 1.07%A |
| Expenses net of all reductions | | 1.00%A |
| Net investment income (loss) | | 23%A |
| Supplemental Data | | |
| Net assets, end of period (000 omitted) | | $ 29,544 |
| Portfolio turnover rate | | 92% |
A Annualized
B Total returns for periods of less than one year are not annualized.
C Total returns do not reflect charges attributable to your insurance company’s separate account. Inclusion of these charges would reduce the total returns shown.
D Total returns would have been lower had certain expenses not been reduced during the periods shown.
E Calculated based on average shares outstanding during the period.
F For the period July 21, 2005 (commencement of sale of shares) to December 31, 2005.
G Expense ratios reflect operating expenses of the class. Expenses before reductions do not reflect amounts reimbursed by the investment adviser or reductions from brokerage service arrangements or other expense offset arrangements and do not
represent the amount paid by the class during periods when reimbursements or reductions occur. Expense ratios before reductions for start up periods may not be representative of longer term operating periods. Expenses net of fee waivers reflect
expenses after reimbursement by the investment adviser but prior to reductions from brokerage service arrangements or other expense offset arrangements. Expenses net of all reductions represent the net expenses paid by the class.
H Amount represents less than $.01 per share.
|
See accompanying notes which are an integral part of the financial statements.
| | |
| VIP Overseas Portfolio | | 168 |
Notes to Financial Statements
For the period ended December 31, 2005
|
1. Significant Accounting Policies.
|
VIP Equity Income Portfolio, VIP Growth Portfolio, and VIP Overseas Portfolio (the funds) are funds of Variable Insurance Products Fund. VIP Contrafund Portfolio and VIP Index 500 Portfolio (the funds) are funds of Variable Insurance Products Fund II. VIP Growth & Income Portfolio, VIP Mid Cap Portfolio, and VIP Growth Opportunities Portfolio (the funds) are funds of Variable Insurance Products Fund III. The Variable Insurance Products Fund, Variable Insurance Products Fund II and Variable Insurance Products Fund III (the trusts) (referred to in this report as Fidelity Variable Insurance Products) are registered under the Investment Company Act of 1940, as amended (the 1940 Act), as open end management investment companies organized as Massachusetts business trusts. Each fund is authorized to issue an unlimited number of shares. Shares of each fund may only be purchased by insurance companies for the purpose of funding variable annuity or variable life insurance contracts. Each fund (excluding VIP Index 500 Portfolio and VIP Overseas Portfolio for the Investor Class shares) offers the following classes of shares: Initial Class shares, Service Class shares, Service Class 2 shares and Investor Class shares. VIP Equity Income Portfolio, VIP Growth Portfolio and VIP Contrafund Portfolio also offer Service Class 2R shares. VIP Overseas Portfolio also offers Initial Class R, Service Class R, Service Class 2R and Investor Class R shares. The funds commenced sale of Investor Class and Investor Class R shares on July 21, 2005. All classes have equal rights and voting privileges, except for matters affecting a single class. Investment income, realized and unrealized capital gains and losses, the common expenses of the fund, and certain fund level expense reductions, if any, are allocated on a pro rata basis to each class based on the relative net assets of each class to the total net assets of the fund. Each class differs with respect to transfer agent and distribution and service plan fees incurred. Certain expense reductions also differ by class.
Certain funds investments in emerging markets can be subject to social, economic, regulatory, and political uncertainties and can be extremely volatile. Certain funds may invest in affiliated money market central funds (Money Market Central Funds) which are open end investment companies available to investment companies and other accounts managed by Fidelity Management & Research Company (FMR) and its affiliates. The financial statements have been prepared in conformity with accounting principles generally accepted in the United States of America, which require manage ment to make certain estimates and assumptions at the date of the financial statements. The following summarizes the significant accounting policies of the funds:
Security Valuation. Investments are valued and net asset value (NAV) per share is calculated (NAV calculation) as of the close of business of the New York Stock Exchange (NYSE), normally 4:00 p.m. Eastern time. Wherever possible, each fund uses independent pricing services approved by the Board of Trustees to value their investments.
Equity securities, including restricted securities, for which market quotations are readily available, are valued at the last reported sale price or official closing price as reported by an independent pricing service on the primary market or exchange on which they are traded. In the event there were no sales during the day or closing prices are not available, securities are valued at the last quoted bid price. Debt securities, including restricted securities, for which quotations are readily available, are valued by independent pricing services or by dealers who make markets in such securities. Pricing services consider yield or price of bonds of comparable quality, coupon, maturity and type as well as dealer supplied prices. Investments in open end mutual funds, are valued at their closing net asset value each business day. Short term securities with remaining maturities of sixty days or less for which quotations are not readily available are valued at amortized cost, which approximates value.
When current market prices or quotations are not readily available or do not accurately reflect fair value, valuations may be determined in accordance with procedures adopted by the Board of Trustees. For example, when developments occur between the close of a market and the close of the NYSE that may materially affect the value of some or all of the securities, or when trading in a security is halted, those securities may be fair valued. Factors used in the determination of fair value may include monitoring news to identify significant market or security specific events such as changes in the value of U.S. securities markets, reviewing developments in foreign markets and evaluating the performance of ADRs, futures contracts and exchange-traded funds. Because each fund’s utilization of fair value pricing depends on market activity, the frequency with which fair value pricing is used can not be predicted and may be utilized to a significant extent. The value of securities used for NAV calculation under fair value pricing may differ from published prices for the same securities.
Foreign Currency. Certain funds may use foreign currency contracts to facilitate transactions in foreign denominated securities. Losses from these transactions may arise from changes in the value of the foreign currency or if the counterparties do not perform under the contracts’ terms.
Foreign denominated assets, including investment securities, and liabilities are translated into U.S. dollars at the exchange rate at period end. Pur chases and sales of investment securities, income and dividends received and expenses denominated in foreign currencies are translated into U.S. dollars at the exchange rate in effect on the transaction date.
The effects of exchange rate fluctuations on investments are included with the net realized and unrealized gain (loss) on investment securities. Other foreign currency transactions resulting in realized and unrealized gain (loss) are disclosed separately.
Investment Transactions and Income. Security transactions are accounted for as of trade date. Gains and losses on securities sold are determined on the basis of identified cost and may include proceeds received from litigation. Dividend income is recorded on the ex dividend date, except for certain dividends from foreign securities where the ex dividend date may have passed, which are recorded as soon as the funds are informed of the ex dividend date. Non cash dividends included in dividend income, if any, are recorded at the fair market value of the securities received. Distributions
169 Annual Report
| Notes to Financial Statements continued |
| |
| |
| 1. Significant Accounting Policies continued |
Investment Transactions and Income continued |
received on securities that represent a return of capital or capital gain are recorded as a reduction of cost of investments and/or as a realized gain. The funds estimate the components of distributions received that may be considered return of capital distributions or capital gain distributions. Large, non recurring dividends recognized by the funds are presented separately on the Statement of Operations as “Special Dividends” and the impact of these dividends is presented in the Financial Highlights. Interest income is accrued as earned. Interest income includes coupon interest and amortiza tion of premium and accretion of discount on debt securities. Investment income is recorded net of foreign taxes withheld where recovery of such taxes is uncertain.
Expenses. Most expenses of each trust can be directly attributed to a fund. Expenses which cannot be directly attributed are apportioned among each fund in the trust.
Deferred Trustee Compensation. Under a Deferred Compensation Plan (the Plan) independent Trustees must defer receipt of a portion of, and may elect to defer receipt of an additional portion of, their annual compensation. Deferred amounts are treated as though equivalent dollar amounts had been invested in a cross section of other Fidelity funds, and are marked to market. Deferred amounts remain in the fund until distributed in accor dance with the Plan.
Income Tax Information and Distributions to Shareholders. Each year, each fund intends to qualify as a regulated investment company by distributing all of its taxable income and realized gains under Subchapter M of the Internal Revenue Code. As a result, no provision for income taxes is required in the accompanying financial statements. Foreign taxes are provided for based on each fund’s understanding of the tax rules and rates that exist in the foreign markets in which it invests.
Distributions are recorded on the ex dividend date. Income dividends and capital gain distributions are declared separately for each class. Income and capital gain distributions are determined in accordance with income tax regulations, which may differ from generally accepted accounting principles.
Capital accounts within the financial statements are adjusted for permanent book tax differences. These adjustments have no impact on net assets or the results of operations. Temporary book tax differences will reverse in a subsequent period.
Book tax differences are primarily due to short term capital gains, futures transactions, foreign currency transactions, passive foreign investment companies (PFIC), market discount, partnerships, deferred trustees compensation, capital loss carryforwards and losses deferred due to wash sales.
The tax basis components of distributable earnings and the federal tax cost as of period end were as follows for each fund:
| | | | |
| | | | | | | | | | | | | Net Unrealized |
| | | Cost for Federal | | Unrealized | | | | Unrealized | | | | Appreciation/ |
| | | Income Tax Purposes | | Appreciation | | | | Depreciation | | | | (Depreciation) |
| VIP Contrafund | | $ | | 12,104,456,496 | | $ | | 5,207,591,359 | | $ | | (100,232,616) | | $ | | 5,107,358,743 |
| VIP Equity Income | | 8,246,450,419 | | 3,034,888,843 | | | | (496,732,004) | | | | 2,538,156,839 |
| VIP Growth | | 7,047,885,810 | | 1,843,484,871 | | | | (174,201,835) | | | | 1,669,283,036 |
| VIP Growth & Income | | 1,506,216,595 | | 113,614,524 | | | | (19,165,326) | | | | 94,449,198 |
| VIP Growth Opportunities | | 564,847,890 | | 139,486,144 | | | | (8,756,797) | | | | 130,729,347 |
| VIP Index 500 | | 1,752,256,102 | | 1,284,351,596 | | | | (193,429,962) | | | | 1,090,921,634 |
| VIP Mid Cap | | 4,786,693,873 | | 1,296,010,250 | | | | (80,825,730) | | | | 1,215,184,520 |
| VIP Overseas | | 2,148,412,566 | | 637,447,085 | | | | (34,764,456) | | | | 602,682,629 |
| |
| | | | | | | | | Undistributed | | | | |
| | | | | Undistributed | | | | Long-term | | | | Capital Loss |
| | | | | Ordinary Income | | | | Capital Gain | | | | Carryforward |
| VIP Contrafund | | | | $ | | 84,475,997 | | $ | | 160,245,183 | | $ | | — |
| VIP Equity Income | | | | 268,254,744 | | | | 466,251,594 | | | | — |
| VIP Growth | | | | 28,691,778 | | | | — | | (2,797,244,204) |
| VIP Growth & Income | | | | 13,029,206 | | | | 40,583,998 | | | | — |
| VIP Growth Opportunities | | | | 3,942,443 | | | | — | | | | (190,130,062) |
| VIP Index 500 | | | | 48,445,922 | | | | — | | | | (153,711,966) |
| VIP Mid Cap | | | | 83,848,087 | | | | 678,557,878 | | | | — |
| VIP Overseas | | | | 41,446,125 | | | | — | | | | (156,501,171) |
| 1. Significant Accounting Policies continued | | | | | | | | | | |
| |
| Income Tax Information and Distributions to Shareholders continued | | | | | | | | |
| |
| The tax character of distributions paid was as follows: | | | | | | | | | | |
| | | | | | | | | Long-term | | |
| December 31, 2005 | | | | Ordinary Income | | | | Capital Gains | | Total |
| |
| VIP Contrafund | | | | $ | | 36,759,884 | | $ | | — | | $ | | 36,759,884 |
| VIP Equity Income | | | | 222,487,447 | | | | 347,854,632 | | 570,342,079 |
| VIP Growth | | | | 43,821,998 | | | | — | | 43,821,998 |
| VIP Growth & Income | | | | 22,706,700 | | | | — | | 22,706,700 |
| VIP Growth Opportunities | | | | 6,184,820 | | | | — | | 6,184,820 |
| VIP Index 500 | | | | 49,776,021 | | | | — | | 49,776,021 |
| VIP Mid Cap | | | | — | | | | 69,737,263 | | 69,737,263 |
| VIP Overseas | | | | 27,097,695 | | | | — | | 27,097,695 |
| |
| | | | | | | | | Long-term | | |
| December 31, 2004 | | | | Ordinary Income | | | | Capital Gains | | Total |
| |
| VIP Contrafund | | | | $ | | 33,283,266 | | $ | | — | | $ | | 33,283,266 |
| VIP Equity Income | | | | 160,632,605 | | | | 38,902,738 | | 199,535,343 |
| VIP Growth | | | | 25,185,765 | | | | — | | 25,185,765 |
| VIP Growth & Income | | | | 12,447,351 | | | | — | | 12,447,351 |
| VIP Growth Opportunities | | | | 3,865,122 | | | | — | | 3,865,122 |
| VIP Index 500 | | | | 40,638,037 | | | | — | | 40,638,037 |
| VIP Overseas | | | | 22,557,627 | | | | — | | 22,557,627 |
Trading (Redemption) Fees. Initial Class R shares, Service Class R shares, Service Class 2 R shares and Investor Class R shares held less than 60 days are subject to a redemption fee equal to 1% of the proceeds of the redeemed shares. All redemption fees, including any estimated redemption fees paid by FMR, are retained by the applicable fund and accounted for as an addition to paid in capital.
Repurchase Agreements. FMR has received an Exemptive Order from the Securities and Exchange Commission (the SEC) which permits certain funds and other affiliated entities of FMR to transfer uninvested cash balances into joint trading accounts which are then invested in repurchase agreements. Certain funds may also invest directly with institutions in repurchase agreements. Repurchase agreements are collateralized by government or non government securities. Collateral is held in segregated accounts with custodian banks and may be obtained in the event of a default of the counterparty. Each applicable fund monitors, on a daily basis, the value of the collateral to ensure it is at least equal to the principal amount of the repurchase agreement (including accrued interest). In the event of a default by the counterparty, realization of the collateral proceeds could be delayed, during which time the value of the collateral may decline.
Delayed Delivery Transactions and When Issued Securities. Certain funds may purchase or sell securities on a delayed delivery or when issued basis. Payment and delivery may take place after the customary settlement period for that security. The price of the underlying securities and the date when the securities will be delivered and paid for are fixed at the time the transaction is negotiated. During the time a delayed delivery sell is outstand ing, the contract is marked to market daily and equivalent deliverable securities are held for the transaction. Losses may arise due to changes in the value of the underlying securities or if the counterparty does not perform under the contract’s terms, or if the issuer does not issue the securities due to political, economic, or other factors.
Futures Contracts. Certain funds may use futures contracts to manage their exposure to the stock markets. Buying futures tends to increase a fund’s exposure to the underlying instrument, while selling futures tends to decrease a fund’s exposure to the underlying instrument or hedge other fund investments. Futures contracts involve, to varying degrees, risk of loss in excess of any futures variation margin reflected in each applicable fund’s Statement of Assets and Liabilities. The underlying face amount at value of any open futures contracts at period end is shown in each applicable fund’s Schedule of Investments under the caption “Futures Contracts.” This amount reflects each contract’s exposure to the underlying instrument at period end. Losses may arise from changes in the value of the underlying instruments or if the counterparties do not perform under the contracts’ terms. Gains (losses) are realized upon the expiration or closing of the futures contracts. Futures contracts are valued at the settlement price established each day by the board of trade or exchange on which they are traded.
171 Annual Report
Notes to Financial Statements continued
2. Operating Policies continued
Restricted Securities. Certain funds may invest in securities that are subject to legal or contractual restrictions on resale. These securities generally may be resold in transactions exempt from registration or to the public if the securities are registered. Disposal of these securities may involve time consuming negotiations and expense, and prompt sale at an acceptable price may be difficult. Information regarding restricted securities is included at the end of each applicable fund’s Schedule of Investments.
Loans and Other Direct Debt Instruments. Certain funds may invest in loans and loan participations, trade claims or other receivables. These investments may include standby financing commitments, including revolving credit facilities, that obligate the fund to supply additional cash to the borrower on demand. Loan participations involve a risk of insolvency of the lending bank or other financial intermediary. A fund may be contractually obligated to receive approval from the agent bank and/or borrower prior to the sale of these investments.
| 3. Purchases and Sales of Investments. | | | | |
| |
Purchases and sales of securities, other than short term securities and U.S. government securities, are noted in the table below.
| | |
| | | Purchases ($) | | Sales ($) |
| VIP Contrafund | | 9,379,586,762 | | 7,667,991,926 |
| VIP Equity Income | | 2,074,131,362 | | 3,085,299,351 |
| VIP Growth | | 7,061,761,017 | | 8,697,725,539 |
| VIP Growth & Income | | 3,020,508,357 | | 3,061,997,245 |
| VIP Growth Opportunities | | 810,143,696 | | 896,677,386 |
| VIP Index 500 | | 186,663,986 | | 317,546,390 |
| VIP Mid Cap | | 5,584,008,960 | | 4,757,779,886 |
| VIP Overseas | | 2,138,802,165 | | 2,200,947,628 |
4. Fees and Other Transactions with Affiliates.
Management Fee. FMR and its affiliates provide the funds with investment management related services for which the funds pay a monthly manage ment fee.
For all funds except VIP Index 500, the management fee is the sum of an individual fund fee rate applied to the average net assets of each fund and a group fee rate. The group fee rate is based upon the average net assets of all the mutual funds advised by FMR. The group fee rates decrease as assets under management increase and increase as assets under management decrease. The annual individual fund fee rate is .45% of the fund’s average net assets for VIP Overseas, .30% for VIP Contrafund, VIP Growth, VIP Growth Opportunities, and VIP Mid Cap, and .20% for VIP Equity Income and VIP Growth & Income. The group fee rate averaged .27% during the period.
For VIP Index 500, from January 1, 2005, through February 28, 2005, the management fee was based on an annual rate of .24% of the fund’s average net assets. Effective March 1, 2005, an amendment to the management contract was approved by the Board of Trustees lowering the management fee from .24% to .10% of the fund’s average net assets. Under the amended contract, FMR pays all other fund level expenses, except the compensation of the independent Trustees and certain other expenses such as interest expense. In addition, effective March 1, 2005, a new expense contract with FMR was approved by the Board of Trustees in which FMR pays all class level expenses except distribution and service fees.
For the period each fund’s total annual management fee rate, expressed as a percentage of each fund’s average net assets, was as follows:
| VIP Contrafund | | 57% |
| VIP Equity Income | | 47% |
| VIP Growth | | 57% |
| VIP Growth & Income | | 47% |
| VIP Growth Opportunities | | 57% |
| VIP Index 500 | | 10% |
| VIP Mid Cap | | 57% |
| VIP Overseas | | 72% |
Sub Adviser. Geode Capital Management, LLC (Geode), serves as sub adviser for VIP Index 500. Geode provides discretionary investment advisory services to the fund and is paid by FMR for providing these services.
Distribution and Service Plan. In accordance with Rule 12b 1 of the 1940 Act, the funds have adopted separate 12b 1 Plans for each Service Class of shares. Each Service Class pays Fidelity Distributors Corporation (FDC), an affiliate of FMR, a service fee. For the period, the service fee is based on an annual rate of .10% of Service Class and Service Class R’s average net assets and .25% of Service Class 2 and Service Class 2 R’s average net assets.
| 4. Fees and Other Transactions with Affiliates continued |
Distribution and Service Plan continued | | |
For the period, each class paid FDC the following amounts, all of which were re allowed to insurance companies for the distribution of shares and providing shareholder support services:
| | | Service | | Service | | Service | | Service |
| | | Class | | Class 2 | | Class R | | Class 2R |
| VIP Contrafund | | $ | | 2,213,246 | | $ | | 5,597,016 | | $ | | — | | $ | | 29,196 |
| VIP Equity Income | | $ | | 1,103,323 | | $ | | 3,848,462 | | $ | | — | | $ | | 18,438 |
| VIP Growth | | $ | | 1,152,815 | | $ | | 2,021,885 | | $ | | — | | $ | | 8,858 |
| VIP Growth & Income | | $ | | 382,538 | | $ | | 1,364,156 | | $ | | — | | $ | | — |
| VIP Growth Opportunities | | $ | | 196,341 | | $ | | 142,693 | | $ | | — | | $ | | — |
| VIP Index 500 | | $ | | 24,516 | | $ | | 325,002 | | $ | | — | | $ | | — |
| VIP Mid Cap | | $ | | 878,432 | | $ | | 6,875,665 | | $ | | — | | $ | | — |
| VIP Overseas | | $ | | 305,052 | | $ | | 981,228 | | $ | | 93,904 | | $ | | 89,298 |
Transfer Agent Fees. Fidelity Investment Institutional Operations Company, Inc. (FIIOC), an affiliate of FMR, is the funds’ transfer, dividend disburs ing and shareholder servicing agent. FIIOC receives an asset based fee with respect to each class. FIIOC pays a portion of the expenses related to the typesetting, printing and mailing of shareholder reports, except proxy statements. Each class with the exception of the Investor Class pays a transfer agent fee, excluding out of pocket expenses, equal to an annual rate of ..07% of their month end net assets. Effective March 1, 2005, under the new expense contract, each class of VIP Index 500 no longer pays a transfer agent fee. Investor Class and Investor Class R pay an asset based transfer agent fee of .18% of its month end net assets. For the period, the total transfer agent fees paid by each class to FIIOC, including out of pocket expenses, were as follows:
| VIP Contrafund | | | | |
| Initial Class | | | $ | 6,571,892 |
| Service Class | | | | 1,482,474 |
| Service Class 2 | | | | 1,542,956 |
| Service Class 2 R | | | | 8,039 |
| Investor Class | | | | 29,627 |
| | | | $ | 9,634,988 |
| VIP Equity Income | | | | |
| Initial Class | | | $ | 5,396,018 |
| Service Class | | | | 727,708 |
| Service Class 2 | | | | 1,042,631 |
| Service Class 2 R | | | | 4,984 |
| Investor Class | | | | 13,106 |
| | | | $ | 7,184,447 |
| VIP Growth | | | | |
| Initial Class | | | $ | 4,626,241 |
| Service Class | | | | 765,825 |
| Service Class 2 | | | | 549,413 |
| Service Class 2 R | | | | 2,390 |
| Investor Class | | | | 9,468 |
| | | | $ | 5,953,337 |
| VIP Growth & Income | | | | |
| Initial Class | | | $ | 427,648 |
| Service Class | | | | 255,582 |
| Service Class 2 | | | | 370,341 |
| Investor Class | | | | 3,901 |
| | | | $ | 1,057,472 |
| VIP Growth Opportunities | | | | |
| Initial Class | | | $ | 286,871 |
| Service Class | | | | 135,181 |
| Service Class 2 | | | | 47,132 |
| Investor Class | | | | 1,877 |
| | | | $ | 471,061 |
173 Annual Report
| Notes to Financial Statements continued | | | | | | |
| |
| |
| |
| 4. Fees and Other Transactions with Affiliates continued | | | | |
| |
| Transfer Agent Fees continued | | | | | | |
| VIP Index 500* | | | | | | |
| Initial Class | | | | | $ | 297,716 |
| Service Class | | | | | | 3,204 |
| Service Class 2 | | | | | | 13,921 |
| | | | | | $ | 314,841 |
| VIP Mid Cap | | | | | | |
| Initial Class | | | | | $ | 742,170 |
| Service Class | | | | | | 589,485 |
| Service Class 2 | | | | | | 1,868,585 |
| Investor Class | | | | | | 17,251 |
| | | | | | $ | 3,217,491 |
| VIP Overseas | | | | | | |
| Initial Class | | | | | $ | 967,236 |
| Service Class | | | | | | 208,225 |
| Service Class 2 | | | | | | 272,268 |
| Initial Class R | | | | | | 101,521 |
| Service Class R | | | | | | 62,739 |
| Service Class 2R | | | | | | 24,118 |
| Investor Class R | | | | | | 9,467 |
| | | | | | $ | 1,645,574 |
| |
| * From January 1, 2005 through February 28, 2005. | | | | | | |
Accounting and Security Lending Fees. Fidelity Service Company, Inc. (FSC), an affiliate of FMR, maintains each fund’s accounting records. The accounting fee is based on the level of average net assets for the month. Under a separate contract, FSC administers the security lending program. The security lending fee is based on the number and duration of lending transactions. Effective March 1, 2005, FMR pays these fees for VIP Index 500.
Affiliated Central Funds. Certain funds may invest in Money Market Central Funds which seek preservation of capital and current income and are managed by Fidelity Investments Money Management, Inc. (FIMM) an affiliate of FMR.
The Money Market Central Funds do not pay a management fee.
|
Brokerage Commissions. Certain funds placed a portion of their portfolio transactions with brokerage firms which are affiliates of the investment adviser. The commissions paid to these affiliated firms were as follows:
| | | Amount |
| VIP Contrafund | | $ 214,955 |
| VIP Equity Income | | 74,596 |
| VIP Growth | | 287,955 |
| VIP Growth & Income | | 43,302 |
| VIP Growth Opportunities | | 24,428 |
| VIP Mid Cap | | 283,889 |
| VIP Overseas | | 1,985 |
Interfund Lending Program. Pursuant to an Exemptive Order issued by the SEC, the funds, along with other registered investment companies having management contracts with FMR, may participate in an interfund lending program. This program provides an alternative credit facility allowing the funds to borrow from, or lend money to, other participating affiliated funds. At period end, there were no interfund loans outstanding. Each applica ble fund’s activity in this program during the period for which loans were outstanding was as follows:
| | | | | | | Weighted | | |
| | | Borrower or | | Average Daily | | Average | | Interest |
| | | Lender | | Loan Balance | | Interest Rate | | Expense |
| VIP Equity Income | | Borrower | | $ | | 10,826,185 | | 3.27% | | $ | | 90,407 |
| VIP Growth | | Borrower | | 11,641,000 | | 2.88% | | 28,830 |
| VIP Growth & Income | | Borrower | | 17,164,500 | | 3.20% | | 9,146 |
| VIP Overseas | | Borrower | | 4,002,000 | | 2.71% | | 604 |
5. Committed Line of Credit.
|
Certain funds participate with other funds managed by FMR in a $4.2 billion credit facility (the “line of credit”) to be utilized for temporary or emergency purposes to fund shareholder redemptions or for other short term liquidity purposes. The participating funds have agreed to pay commit ment fees on their pro rata portion of the line of credit. During the period, there were no borrowings on this line of credit.
Certain funds lend portfolio securities from time to time in order to earn additional income. On the settlement date of the loan, each applicable fund receives collateral (in the form of U.S. Treasury obligations, letters of credit and/or cash) against the loaned securities and maintains collateral in an amount not less than 100% of the market value of the loaned securities during the period of the loan. The market value of the loaned securities is determined at the close of business of the funds and any additional required collateral is delivered to the funds on the next business day. If the borrower defaults on its obligation to return the securities loaned because of insolvency or other reasons, a fund could experience delays and costs in recovering the securities loaned or in gaining access to the collateral. Any cash collateral received is invested in the Fidelity Securities Lending Cash Central Fund. The value of loaned securities and cash collateral at period end are disclosed on each applicable fund’s Statement of Assets and Liabilities. Security lending income represents the income earned on investing cash collateral, less fees and expenses associated with the loan, plus any premium payments that may be received on the loan of certain types of securities.
Each fund is permitted to have bank borrowings for temporary or emergency purposes to fund shareholder redemptions. Each fund has established borrowing arrangements with certain banks. The interest rate on the borrowings is the bank’s base rate, as revised from time to time. At period end, there were no bank borrowings outstanding. Each applicable fund’s activity in this program during the period for which loans were outstanding was as follows:
| | | Average Daily | | Weighted Average |
| | | Loan Balance | | Interest Rate |
| VIP Contrafund | | $ | | 11,499,000 | | 4.00% |
| VIP Equity Income | | $ | | 12,648,833 | | 3.66% |
| VIP Overseas | | $ | | 8,284,600 | | 2.98% |
| |
| |
| 8. Expense Reductions. | | | | |
For the period January 1, 2005 through February 28, 2005, for VIP Index 500, FMR voluntarily agreed to reimburse each class to the extent annual operating expenses exceeded certain levels of average net assets as noted in the table below. Some expenses, for example interest expense, are ex cluded from this reimbursement.
The following classes of each applicable fund were in reimbursement during the period:
| | | | | | |
| | | Expense | | | | Reimbursement |
| | | Limitations | | | | from adviser |
| VIP Index 500 | | | | | | |
| Initial Class | | 28% | | | $ | 308,669 |
| Service Class | | 38% | | | | 3,314 |
| Service Class 2 | | 53% | | | | 14,601 |
| | | | | | $ | 326,584 |
Effective March 1, 2005 the voluntary expense limitations for VIP Index 500 were eliminated in conjunction with the new expense contract. Under the new contract, total expenses for each class are contractually limited to .10% of average net assets plus the distribution and service fees applicable to each class, excluding the compensation of the independent Trustees and certain other expenses such as interest expense.
175 Annual Report
| Notes to Financial Statements continued |
8. Expense Reductions - continued |
Many of the brokers with whom FMR places trades on behalf of certain funds provided services to these funds in addition to trade execution. These services included payments of expenses on behalf of each applicable fund. In addition, through arrangements with each applicable fund’s custodian, credits realized as a result of uninvested cash balances were used to reduce the fund’s expenses. All of the applicable expense reductions are noted in the table below.
| | | | | | | Custody |
| | | Brokerage Service | | | | expense |
| | | Arrangement | | | | reduction |
| VIP Contrafund | | $ | | 3,360,840 | | | $ | 20,442 |
| VIP Equity Income | | 1,157,298 | | | | — |
| VIP Growth | | 3,564,630 | | | | 908 |
| VIP Growth & Income | | 871,655 | | | | 1,544 |
| VIP Growth Opportunities | | 313,468 | | | | — |
| VIP Index 500 | | — | | | | 1,146 |
| VIP Mid Cap | | 2,720,642 | | | | 21,864 |
| VIP Overseas | | 1,739,350 | | | | 787 |
| |
| |
| 9. Other. | | | | | | |
The funds’ organizational documents provide former and current trustees and officers with a limited indemnification against liabilities arising in connection with the performance of their duties to the funds. In the normal course of business, the funds may also enter into contracts that provide general indemnifications. The funds’ maximum exposure under these arrangements is unknown as this would be dependent on future claims that may be made against the funds. The risk of material loss from such claims is considered remote.
At the end of the period, FMR or its affiliates and certain otherwise unaffiliated shareholders each were owners of record of more than 10% of the outstanding shares of the following funds:
| | | | | Number of | | | | |
| | | | | Unaffiliated | | | | Unaffiliated |
| | | Affiliated % | | Shareholders | | | | Shareholders % |
| VIP Contrafund | | 11% | | 2 | | | | 31% |
| VIP Equity Income | | 11% | | 1 | | | | 23% |
| VIP Growth | | 11% | | 2 | | | | 34% |
| VIP Growth & Income | | 18% | | 1 | | | | 51% |
| VIP Growth Opportunities | | 21% | | 1 | | | | 42% |
| VIP Index 500 | | 34% | | — | | | | — |
| VIP Mid Cap | | 16% | | 1 | | | | 30% |
| VIP Overseas | | 13% | | 2 | | | | 40% |
| |
| |
| 10. Distributions to Shareholders. | | | | | | | | |
| |
| Distributions to shareholders of each class were as follows: | | | | | | | | |
| Years ended December 31, | | | | 2005 | | | | 2004 |
| VIP Contrafund | | | | | | | | |
| From net investment income | | | | | | | | |
| Initial Class | | | | $ | | 27,596,709 | | $ | | 26,671,383 |
| Service Class | | | | 4,430,034 | | | | 4,498,414 |
| Service Class 2 | | | | 2,265,082 | | | | 2,105,112 |
| Service Class 2R | | | | 15,411 | | | | 8,357 |
| Total | | | | $ | | 34,307,236 | | $ | | 33,283,266 |
| From net realized gain | | | | | | | | |
| Initial Class | | | | $ | | 1,724,794 | | $ | | — |
| Service Class | | | | 402,730 | | | | — |
| Service Class 2 | | | | 323,583 | | | | — |
| Service Class 2R | | | | 1,541 | | | | — |
| Total | | | | $ | | 2,452,648 | | $ | | — |
10. Distributions to Shareholders - continued
| | | | | | |
| Years ended December 31, | | 2005 | | | | 2004 |
| VIP Equity Income | | | | | | |
| From net investment income | | | | | | |
| Initial Class | | $ | | 137,602,640 | | $ | | 130,573,823 |
| Service Class | | 17,563,270 | | | | 16,025,683 |
| Service Class 2 | | 20,698,826 | | | | 13,995,319 |
| Service Class 2R | | 94,385 | | | | 37,780 |
| Total | | $ | | 175,959,121 | | $ | | 160,632,605 |
| From net realized gain | | | | | | |
| Initial Class | | $ | | 302,386,049 | | $ | | 31,192,635 |
| Service Class | | 40,600,805 | | | | 4,053,555 |
| Service Class 2 | | 51,172,097 | | | | 3,647,265 |
| Service Class 2R | | 224,007 | | | | 9,283 |
| Total | | $ | | 394,382,958 | | $ | | 38,902,738 |
| VIP Growth | | | | | | |
| From net investment income | | | | | | |
| Initial Class | | $ | | 36,754,599 | | $ | | 22,052,984 |
| Service Class | | 4,880,141 | | | | 2,279,802 |
| Service Class 2 | | 2,179,216 | | | | 849,771 |
| Service Class 2R | | 8,042 | | | | 3,208 |
| Total | | $ | | 43,821,998 | | $ | | 25,185,765 |
| VIP Growth & Income | | | | | | |
| From net investment income | | | | | | |
| Initial Class | | $ | | 10,102,093 | | $ | | 6,722,963 |
| Service Class | | 5,620,334 | | | | 2,898,471 |
| Service Class 2 | | 6,984,273 | | | | 2,825,917 |
| Total | | $ | | 22,706,700 | | $ | | 12,447,351 |
| VIP Growth Opportunities | | | | | | |
| From net investment income | | | | | | |
| Initial Class | | $ | | 4,113,187 | | $ | | 2,623,558 |
| Service Class | | 1,676,409 | | | | 1,042,625 |
| Service Class 2 | | 395,224 | | | | 198,939 |
| Total | | $ | | 6,184,820 | | $ | | 3,865,122 |
| VIP Index 500 | | | | | | |
| From net investment income | | | | | | |
| Initial Class | | $ | | 47,629,866 | | $ | | 39,642,996 |
| Service Class | | 396,447 | | | | 202,925 |
| Service Class 2 | | 1,749,708 | | | | 792,116 |
| Total | | $ | | 49,776,021 | | $ | | 40,638,037 |
| VIP Mid Cap | | | | | | |
| From net realized gain | | | | | | |
| Initial Class | | $ | | 16,950,069 | | $ | | — |
| Service Class | | 13,863,435 | | | | — |
| Service Class 2 | | 38,923,759 | | | | — |
| Total | | $ | | 69,737,263 | | $ | | — |
177 Annual Report
| Notes to Financial Statements continued | | | | | | | | | | |
| |
| |
| |
10. Distributions to Shareholders - continued
| | | | | | | | | | |
| Years ended December 31, | | | | | | 2005 | | | | 2004 |
| VIP Overseas | | | | | | | | | | | | |
| From net investment income | | | | | | | | | | | | |
| Initial Class | | | | | | $ | | 9,625,631 | | $ | | 16,877,656 |
| Service Class | | | | | | | | 1,847,002 | | | | 2,818,947 |
| Service Class 2 | | | | | | | | 1,745,414 | | | | 1,619,063 |
| Initial Class R | | | | | | | | 965,865 | | | | 497,678 |
| Service Class R | | | | | | | | 492,968 | | | | 665,579 |
| Service Class 2R | | | | | | | | 160,178 | | | | 78,704 |
| Total | | | | | | $ | | 14,837,058 | | | | 22,557,627 |
| From net realized gain | | | | | | | | | | | | |
| Initial Class | | | | | | $ | | 7,533,103 | | $ | | — |
| Service Class | | | | | | | | 1,662,302 | | | | — |
| Service Class 2 | | | | | | | | 1,745,414 | | | | — |
| Initial Class R | | | | | | | | 724,399 | | | | — |
| Service Class R | | | | | | | | 443,671 | | | | — |
| Service Class 2R | | | | | | | | 151,748 | | | | — |
| Total | | | | | | $ | | 12,260,637 | | $ | | — |
| |
| |
| 11. Share Transactions. | | | | | | | | | | | | |
| |
| Transactions for each class of shares were as follows: | | | | | | | | | | |
| | | | | Shares | | Dollars |
| Years ended December 31, | | | | 2005 | | 2004 | | 2005 | | | | 2004 |
| VIP Contrafund | | | | | | | | | | | | |
| Initial Class | | | | | | | | | | | | |
| Shares sold | | | | 40,419,583 | | 39,676,965 | | $ 1,135,988,432 | | $ | | 959,621,838 |
| Reinvestment of distributions | | | | 1,094,903 | | 1,123,479 | | 29,321,503 | | | | 26,671,383 |
| Shares redeemed | | | | (26,717,231) | | (29,262,778) | | (748,214,024) | | | | (701,529,337) |
| Net increase (decrease) | | | | 14,797,255 | | 11,537,666 | | $ 417,095,911 | | $ | | 284,763,884 |
| Service Class | | | | | | | | | | | | |
| Shares sold | | | | 13,881,593 | | 15,203,443 | | $ 390,402,116 | | $ | | 366,229,990 |
| Reinvestment of distributions | | | | 180,935 | | 189,967 | | 4,832,764 | | | | 4,498,414 |
| Shares redeemed | | | | (12,721,990) | | (9,311,680) | | (341,955,975) | | | | (223,414,420) |
| Net increase (decrease) | | | | 1,340,538 | | 6,081,730 | | $ 53,278,905 | | $ | | 147,313,984 |
| Service Class 2 | | | | | | | | | | | | |
| Shares sold | | | | 49,771,629 | | 27,599,342 | | $ 1,404,920,897 | | $ | | 660,559,920 |
| Reinvestment of distributions | | | | 97,538 | | 89,389 | | 2,588,665 | | | | 2,105,112 |
| Shares redeemed | | | | (6,228,028) | | (5,203,844) | | (172,711,539) | | | | (123,399,434) |
| Net increase (decrease) | | | | 43,641,139 | | 22,484,887 | | $1,234,798,023 | | $ | | 539,265,598 |
| Service Class 2R | | | | | | | | | | | | |
| Shares sold | | | | 476,311 | | 256,799 | | $ 13,422,433 | | $ | | 6,150,098 |
| Reinvestment of distributions | | | | 640 | | 356 | | 16,952 | | | | 8,357 |
| Shares redeemed | | | | (106,287) | | (105,684) | | (2,956,035) | | | | (2,519,600) |
| Net increase (decrease) | | | | 370,664 | | 151,471 | | $ 10,483,350 | | $ | | 3,638,855 |
| Investor ClassA | | | | | | | | | | | | |
| Shares sold | | | | 2,862,608 | | — | | $ 86,146,173 | | $ | | — |
| Shares redeemed | | | | (2,580) | | — | | (77,240) | | | | — |
| Net increase (decrease) | | | | 2,860,028 | | — | | $ 86,068,933 | | $ | | — |
11. Share Transactions - continued
| | | | | | | | | | |
| | | Shares | | | | Dollars | | |
| Years ended December 31, | | 2005 | | 2004 | | 2005 | | | | 2004 |
| VIP Equity Income | | | | | | | | | | |
| Initial Class | | | | | | | | | | |
| Shares sold | | 9,995,592 | | 19,642,612 | | $ 243,588,116 | | $ | | 460,321,782 |
| Reinvestment of distributions | | 18,234,094 | | 6,898,356 | | 439,988,689 | | | | 161,766,458 |
| Shares redeemed | | (61,778,854) | | (46,454,587) | | (1,504,207,375) | | (1,086,286,467) |
| Net increase (decrease) | | (33,549,168) | | (19,913,619) | | $ (820,630,570) | | $ | | (464,198,227) |
| Service Class | | | | | | | | | | |
| Shares sold | | 1,664,065 | | 4,254,175 | | $ 40,334,290 | | $ | | 99,280,265 |
| Reinvestment of distributions | | 2,417,459 | | 858,454 | | 58,164,074 | | | | 20,079,238 |
| Shares redeemed | | (7,864,758) | | (5,170,065) | | (190,937,287) | | | | (119,952,965) |
| Net increase (decrease) | | (3,783,234) | | (57,436) | | $ (92,438,923) | | $ | | (593,462) |
| Service Class 2 | | | | | | | | | | |
| Shares sold | | 15,407,445 | | 21,126,824 | | $ 370,175,387 | | $ | | 490,310,488 |
| Reinvestment of distributions | | 3,009,670 | | 759,147 | | 71,870,922 | | | | 17,642,584 |
| Shares redeemed | | (6,593,873) | | (5,169,545) | | (158,371,244) | | | | (119,145,127) |
| Net increase (decrease) | | 11,823,242 | | 16,716,426 | | $ 283,675,065 | | $ | | 388,807,945 |
| Service Class 2R | | | | | | | | | | |
| Shares sold | | 229,939 | | 207,129 | | $ 5,501,232 | | $ | | 4,777,338 |
| Reinvestment of distributions | | 13,378 | | 2,031 | | 318,391 | | | | 47,063 |
| Shares redeemed | | (83,085) | | (67,130) | | (1,983,529) | | | | (1,540,794) |
| Net increase (decrease) | | 160,232 | | 142,030 | | $ 3,836,094 | | $ | | 3,283,607 |
| Investor ClassA | | | | | | | | | | |
| Shares sold | | 1,480,945 | �� | — | | $ 36,874,007 | | $ | | — |
| Shares redeemed | | (9,091) | | — | | (229,256) | | | | — |
| Net increase (decrease) | | 1,471,854 | | — | | $ 36,644,751 | | $ | | — |
| VIP Growth | | | | | | | | | | |
| Initial Class | | | | | | | | | | |
| Shares sold | | 5,020,349 | | 10,173,829 | | $ 159,510,141 | | $ | | 317,143,990 |
| Reinvestment of distributions | | 1,168,668 | | 677,303 | | 36,754,598 | | | | 22,052,984 |
| Shares redeemed | | (50,113,556) | | (44,148,491) | | (1,589,683,859) | | (1,353,451,648) |
| Net increase (decrease) | | (43,924,539) | | (33,297,359) | | $(1,393,419,120) | | $ | | (1,014,254,674) |
| Service Class | | | | | | | | | | |
| Shares sold | | 1,583,330 | | 3,809,653 | | $ 49,875,519 | | $ | | 118,147,419 |
| Reinvestment of distributions | | 155,666 | | 70,256 | | 4,880,142 | | | | 2,279,802 |
| Shares redeemed | | (10,974,628) | | (7,601,708) | | (341,802,898) | | | | (232,412,004) |
| Net increase (decrease) | | (9,235,632) | | (3,721,799) | | $ (287,047,237) | | $ | | (111,984,783) |
| Service Class 2 | | | | | | | | | | |
| Shares sold | | 4,801,863 | | 9,957,726 | | $ 150,862,050 | | $ | | 305,162,849 |
| Reinvestment of distributions | | 69,981 | | 26,349 | | 2,179,216 | | | | 849,771 |
| Shares redeemed | | (4,718,596) | | (4,196,333) | | (147,633,784) | | | | (126,744,925) |
| Net increase (decrease) | | 153,248 | | 5,787,742 | | $ 5,407,482 | | $ | | 179,267,695 |
| Service Class 2R | | | | | | | | | | |
| Shares sold | | 97,483 | | 63,032 | | $ 3,094,057 | | $ | | 1,941,136 |
| Reinvestment of distributions | | 259 | | 100 | | 8,042 | | | | 3,208 |
| Shares redeemed | | (19,254) | | (23,264) | | (605,298) | | | | (693,336) |
| Net increase (decrease) | | 78,488 | | 39,868 | | $ 2,496,801 | | $ | | 1,251,008 |
| Investor ClassA | | | | | | | | | | |
| Shares sold | | 720,556 | | — | | $ 23,727,387 | | $ | | — |
| Shares redeemed | | (2,747) | | — | | (89,995) | | | | — |
| Net increase (decrease) | | 717,809 | | — | | $ 23,637,392 | | $ | | — |
179 Annual Report
| Notes to Financial Statements continued | | | | | | | | | | | | |
| |
| |
| |
11. Share Transactions - continued
| | | | | | | | | | | | |
| | | | | Shares | | | | Dollars |
| Years ended December 31, | | | | 2005 | | 2004 | | | | 2005 | | | | 2004 |
| VIP Growth & Income | | | | | | | | | | | | | | |
| Initial Class | | | | | | | | | | | | | | |
| Shares sold | | | | 2,834,273 | | 2,753,905 | | | | $ 39,200,777 | | $ | | 36,538,808 |
| Reinvestment of distributions | | | | 741,166 | | 498,736 | | | | 10,102,093 | | | | 6,722,963 |
| Shares redeemed | | | | (13,127,442) | | (11,869,073) | | | | (181,187,562) | | | | (156,807,050) |
| Net increase (decrease) | | | | (9,552,003) | | (8,616,432) | | | | $ (131,884,692) | | $ | | (113,545,279) |
| Service Class | | | | | | | | | | | | | | |
| Shares sold | | | | 434,637 | | 2,759,500 | | | | $ 5,919,559 | | $ | | 36,240,477 |
| Reinvestment of distributions | | | | 414,785 | | 216,142 | | | | 5,620,334 | | | | 2,898,471 |
| Shares redeemed | | | | (3,644,857) | | (1,077,681) | | | | (50,018,197) | | | | (14,210,796) |
| Net increase (decrease) | | | | (2,795,435) | | 1,897,961 | | | | $ (38,478,304) | | $ | | 24,928,152 |
| Service Class 2 | | | | | | | | | | | | | | |
| Shares sold | | | | 4,647,860 | | 13,125,821 | | | | $ 63,603,372 | | $ | | 171,074,614 |
| Reinvestment of distributions | | | | 519,277 | | 212,315 | | | | 6,984,273 | | | | 2,825,917 |
| Shares redeemed | | | | (2,412,711) | | (1,149,269) | | | | (33,058,649) | | | | (14,952,670) |
| Net increase (decrease) | | | | 2,754,426 | | 12,188,867 | | | | $ 37,528,996 | | $ | | 158,947,861 |
| Investor ClassA | | | | | | | | | | | | | | |
| Shares sold | | | | 662,399 | | — | | | | $ 9,527,602 | | $ | | — |
| Shares redeemed | | | | (13,577) | | — | | | | (198,054) | | | | — |
| Net increase (decrease) | | | | 648,822 | | — | | | | $ 9,329,548 | | $ | | — |
| VIP Growth Opportunities | | | | | | | | | | | | | | |
| Initial Class | | | | | | | | | | | | | | |
| Shares sold | | | | 2,043,068 | | 2,729,868 | | | | $ 32,630,211 | | $ | | 41,720,058 |
| Reinvestment of distributions | | | | 259,671 | | 170,805 | | | | 4,113,187 | | | | 2,623,558 |
| Shares redeemed | | | | (7,829,217) | | (6,832,162) | | | | (126,275,246) | | | | (102,539,187) |
| Net increase (decrease) | | | | (5,526,478) | | (3,931,489) | | | | $ (89,531,848) | | $ | | (58,195,571) |
| Service Class | | | | | | | | | | | | | | |
| Shares sold | | | | 1,133,176 | | 870,070 | | | | $ 18,609,478 | | $ | | 13,156,606 |
| Reinvestment of distributions | | | | 105,834 | | 67,879 | | | | 1,676,409 | | | | 1,042,625 |
| Shares redeemed | | | | (2,911,194) | | (2,590,797) | | | | (46,797,036) | | | | (38,992,902) |
| Net increase (decrease) | | | | (1,672,184) | | (1,652,848) | | | | $ (26,511,149) | | $ | | (24,793,671) |
| Service Class 2 | | | | | | | | | | | | | | |
| Shares sold | | | | 586,782 | | 885,612 | | | | $ 9,623,165 | | $ | | 13,251,573 |
| Reinvestment of distributions | | | | 25,062 | | 13,011 | | | | 395,224 | | | | 198,939 |
| Shares redeemed | | | | (922,792) | | (1,093,977) | | | | (14,688,498) | | | | (16,304,565) |
| Net increase (decrease) | | | | (310,948) | | (195,354) | | | | $ (4,670,109) | | $ | | (2,854,053) |
| Investor ClassA | | | | | | | | | | | | | | |
| Shares sold | | | | 260,971 | | — | | | | $ 4,346,383 | | $ | | — |
| Shares redeemed | | | | (9,747) | | — | | | | (167,335) | | | | — |
| Net increase (decrease) | | | | 251,224 | | — | | | | $ 4,179,048 | | $ | | — |
| VIP Index 500 | | | | | | | | | | | | | | |
| Initial Class | | | | | | | | | | | | | | |
| Shares sold | | | | 1,147,551 | | 1,899,337 | | | | $ 156,365,229 | | $ | | 242,942,892 |
| Reinvestment of distributions | | | | 353,180 | | 308,386 | | | | 47,629,866 | | | | 39,642,996 |
| Shares redeemed | | | | (3,050,219) | | (6,074,596) | | | | (415,532,468) | | | | (774,302,513) |
| Net increase (decrease) | | | | (1,549,488) | | (3,866,873) | | | | $ (211,537,373) | | $ | | (491,716,625) |
| Service Class | | | | | | | | | | | | | | |
| Shares sold | | | | 41,683 | | 63,065 | | | | $ 5,655,385 | | $ | | 7,949,025 |
| Reinvestment of distributions | | | | 2,945 | | 1,581 | | | | 396,447 | | | | 202,925 |
| Shares redeemed | | | | (21,485) | | (18,076) | | | | (2,921,334) | | | | (2,314,988) |
| Net increase (decrease) | | | | 23,143 | | 46,570 | | | | $ 3,130,498 | | $ | | 5,836,962 |
| Service Class 2 | | | | | | | | | | | | | | |
| Shares sold | | | | 540,862 | | 511,841 | | | | $ 72,886,987 | | $ | | 65,071,581 |
| Reinvestment of distributions | | | | 13,056 | | 6,195 | | | | 1,749,708 | | | | 792,116 |
| Shares redeemed | | | | (218,660) | | (259,750) | | | | (29,570,470) | | | | (32,714,594) |
| Net increase (decrease) | | | | 335,258 | | 258,286 | | | | $ 45,066,225 | | $ | | 33,149,103 |
11. Share Transactions - continued
| | | | | | | | | | |
| | | Shares | | Dollars |
| Years ended December 31, | | 2005 | | 2004 | | 2005 | | | | 2004 |
| VIP Mid Cap | | | | | | | | | | |
| Initial Class | | | | | | | | | | |
| Shares sold | | 8,278,806 | | 7,712,308 | | $ 262,377,760 | | $ | | 203,215,754 |
| Reinvestment of distributions | | 562,378 | | — | | 16,950,069 | | | | — |
| Shares redeemed | | (4,945,419) | | (3,341,075) | | (156,829,367) | | | | (83,674,683) |
| Net increase (decrease) | | 3,895,765 | | 4,371,233 | | $ 122,498,462 | | $ | | 119,541,071 |
| Service Class | | | | | | | | | | |
| Shares sold | | 2,901,802 | | 4,751,291 | | $ 90,813,964 | | $ | | 122,478,823 |
| Reinvestment of distributions | | 461,807 | | — | | 13,863,435 | | | | — |
| Shares redeemed | | (2,267,171) | | (1,581,671) | | (70,846,869) | | | | (40,224,756) |
| Net increase (decrease) | | 1,096,438 | | 3,169,620 | | $ 33,830,530 | | $ | | 82,254,067 |
| Service Class 2 | | | | | | | | | | |
| Shares sold | | 32,986,707 | | 29,867,543 | | $1,030,668,046 | | $ | | 766,867,153 |
| Reinvestment of distributions | | 1,305,290 | | — | | 38,923,759 | | | | — |
| Shares redeemed | | (5,764,389) | | (5,307,215) | | (179,268,926) | | | | (132,698,097) |
| Net increase (decrease) | | 28,527,608 | | 24,560,328 | | $ 890,322,879 | | $ | | 634,169,056 |
| Investor ClassA | | | | | | | | | | |
| Shares sold | | 1,448,928 | | — | | $ 48,632,982 | | $ | | — |
| Shares redeemed | | (2,028) | | — | | (69,529) | | | | — |
| Net increase (decrease) | | 1,446,900 | | — | | $ 48,563,453 | | $ | | — |
| VIP Overseas | | | | | | | | | | |
| Initial Class | | | | | | | | | | |
| Shares sold | | 7,401,949 | | 14,747,796 | | $ 132,174,303 | | $ | | 235,040,834 |
| Reinvestment of distributions | | 1,002,262 | | 1,047,651 | | 17,158,734 | | | | 16,877,656 |
| Shares redeemed | | (18,372,431) | | (22,763,135) | | (325,484,696) | | | | (358,049,999) |
| Net increase (decrease) | | (9,968,220) | | (6,967,688) | | $ (176,151,659) | | $ | | (106,131,509) |
| Service Class | | | | | | | | | | |
| Shares sold | | 2,681,647 | | 5,622,052 | | $ 47,720,466 | | $ | | 88,487,632 |
| Reinvestment of distributions | | 205,704 | | 175,526 | | 3,509,304 | | | | 2,818,947 |
| Shares redeemed | | (5,311,978) | | (3,179,061) | | (91,468,586) | | | | (49,596,873) |
| Net increase (decrease) | | (2,424,627) | | 2,618,517 | | $ (40,238,816) | | $ | | 41,709,706 |
| Service Class 2 | | | | | | | | | | |
| Shares sold | | 7,706,445 | | 11,770,833 | | $ 135,627,664 | | $ | | 185,307,863 |
| Reinvestment of distributions | | 205,102 | | 101,002 | | 3,490,828 | | | | 1,619,063 |
| Shares redeemed | | (1,690,309) | | (2,573,003) | | (30,166,445) | | | | (40,549,211) |
| Net increase (decrease) | | 6,221,238 | | 9,298,832 | | $ 108,952,047 | | $ | | 146,377,715 |
| Initial Class R | | | | | | | | | | |
| Shares sold | | 2,614,989 | | 5,679,220 | | $ 46,966,500 | | $ | | 89,613,678 |
| Reinvestment of distributions | | 98,846 | | 30,931 | | 1,690,264 | | | | 497,678 |
| Shares redeemed | | (1,307,426) | | (695,245) | | (22,938,002) | | | | (10,848,287) |
| Net increase (decrease) | | 1,406,409 | | 5,014,906 | | $ 25,718,762 | | $ | | 79,263,069 |
| Service Class R | | | | | | | | | | |
| Shares sold | | 1,192,156 | | 1,860,289 | | $ 21,053,947 | | $ | | 29,201,895 |
| Reinvestment of distributions | | 54,935 | | 41,469 | | 936,639 | | | | 665,579 |
| Shares redeemed | | (578,793) | | (555,521) | | (10,225,074) | | | | (8,516,411) |
| Net increase (decrease) | | 668,298 | | 1,346,237 | | $ 11,765,512 | | $ | | 21,351,063 |
| Service Class 2R | | | | | | | | | | |
| Shares sold | | 998,545 | | 1,379,237 | | $ 17,565,601 | | $ | | 21,125,719 |
| Reinvestment of distributions | | 18,435 | | 4,934 | | 311,926 | | | | 78,704 |
| Shares redeemed | | (180,588) | | (249,620) | | (3,145,256) | | | | (3,867,026) |
| Net increase (decrease) | | 836,392 | | 1,134,551 | | $ 14,732,271 | | $ | | 17,337,397 |
| Investor Class RA | | | | | | | | | | |
| Shares sold | | 1,438,624 | | — | | $ 27,620,203 | | $ | | — |
| Shares redeemed | | (3,869) | | — | | (73,525) | | | | — |
| Net increase (decrease) | | 1,434,755 | | — | | $ 27,546,678 | | $ | | — |
A Share transactions for Investor Class and Investor Class R are for the period July 21, 2005 (commencement of sale of shares) to December 31, 2005. | | | | | | | | |
181 Annual Report
Report of Independent Registered Public Accounting Firm
To the Trustees of Variable Insurance Products Fund II and Shareholders of VIP Index 500 Portfolio:
We have audited the accompanying statement of assets and liabilities of VIP Index 500 Portfolio (the Fund), a fund of Variable Insurance Products Fund II, including the schedule of investments as of December 31, 2005, and the related statement of operations for the year then ended, the state ment of changes in net assets for each of the two years in the period then ended, and the financial highlights for each of the five years in the period then ended. These financial statements and financial highlights are the responsibility of the Fund’s management. Our responsibility is to express an opinion on these financial statements and financial highlights based on our audits.
We conducted our audits in accordance with standards of the Public Company Accounting Oversight Board (United States). Those standards require that we plan and perform the audit to obtain reasonable assurance about whether the financial statements and financial highlights are free of material misstatement. The Fund is not required to have, nor were we engaged to perform, an audit of its internal control over financial reporting. Our audits included consideration of internal control over financial reporting as a basis for designing audit procedures that are appropriate in the circumstances, but not for the purpose of expressing an opinion on the effectiveness of the Fund’s internal control over financial reporting. Accordingly, we express no such opinion. An audit also includes examining, on a test basis, evidence supporting the amounts and disclosures in the financial statements, assessing the accounting principles used and significant estimates made by management, as well as evaluating the overall financial statement presentation. Our procedures included confirmation of securities owned as of December 31, 2005, by correspondence with the custodians and brokers; where replies were not received from brokers, we performed other auditing procedures. We believe that our audits provide a reasonable basis for our opinion.
In our opinion, the financial statements and financial highlights referred to above present fairly, in all material respects, the financial position of VIP Index 500 Portfolio as of December 31, 2005, the results of its operations for the year then ended, the changes in its net assets for each of the two years in the period then ended, and its financial highlights for each of the five years in the period then ended, in conformity with accounting principles generally accepted in the United States of America.
/s/ Deloitte & Touche LLP
DELOITTE & TOUCHE LLP
Boston, Massachusetts
February 17, 2006
|
Report of Independent Registered Public Accounting Firm
To the Trustees of Variable Insurance Products Fund II and Shareholders of VIP Contrafund Portfolio:
We have audited the accompanying statement of assets and liabilities of VIP Contrafund Portfolio (the Fund), a fund of Variable Insurance Products Fund II, including the schedule of investments as of December 31, 2005, and the related statement of operations for the year then ended, the state ment of changes in net assets for each of the two years in the period then ended, and the financial highlights for each of the five years in the period then ended. These financial statements and financial highlights are the responsibility of the Fund’s management. Our responsibility is to express an opinion on these financial statements and financial highlights based on our audits.
We conducted our audits in accordance with standards of the Public Company Accounting Oversight Board (United States). Those standards require that we plan and perform the audit to obtain reasonable assurance about whether the financial statements and financial highlights are free of material misstatement. The Fund is not required to have, nor were we engaged to perform, an audit of its internal control over financial reporting. Our audits included consideration of internal control over financial reporting as a basis for designing audit procedures that are appropriate in the circumstances, but not for the purpose of expressing an opinion on the effectiveness of the Fund’s internal control over financial reporting. Accordingly, we express no such opinion. An audit also includes examining, on a test basis, evidence supporting the amounts and disclosures in the financial statements, assessing the accounting principles used and significant estimates made by management, as well as evaluating the overall financial statement presentation. Our procedures included confirmation of securities owned as of December 31, 2005, by correspondence with the custodians and brokers; where replies were not received from brokers, we performed other auditing procedures. We believe that our audits provide a reasonable basis for our opinion.
In our opinion, the financial statements and financial highlights referred to above present fairly, in all material respects, the financial position of VIP Contrafund Portfolio as of December 31, 2005, the results of its operations for the year then ended, the changes in its net assets for each of the two years in the period then ended, and its financial highlights for each of the five years in the period then ended, in conformity with accounting principles generally accepted in the United States of America.
/s/ Deloitte & Touche LLP
DELOITTE & TOUCHE LLP
Boston, Massachusetts
February 14, 2006
|
183 Annual Report
Report of Independent Registered Public Accounting Firm
To the Trustees of Variable Insurance Products Fund III and Shareholders of VIP Mid Cap Portfolio:
In our opinion, the accompanying statement of assets and liabilities, including the schedule of investments, and the related statements of operations and of changes in net assets and the financial highlights present fairly, in all material respects, the financial position of VIP Mid Cap Portfolio (a fund of Variable Insurance Products Fund III) at December 31, 2005 and the results of its operations, the changes in its net assets and the financial high lights for the periods indicated, in conformity with accounting principles generally accepted in the United States of America. These financial statements and financial highlights (hereafter referred to as “financial statements”) are the responsibility of VIP Mid Cap Portfolio’s management; our responsibility is to express an opinion on these financial statements based on our audits. We conducted our audits of these financial statements in accordance with the standards of the Public Company Accounting Oversight Board (United States). Those standards require that we plan and perform the audit to obtain reasonable assurance about whether the financial statements are free of material misstatement. An audit includes examining, on a test basis, evidence supporting the amounts and disclosures in the financial statements, assessing the accounting principles used and significant estimates made by management, and evaluating the overall financial statement presentation. We believe that our audits, which included confirmation of securities at December 31, 2005 by correspondence with the custodian and brokers, provide a reasonable basis for our opinion.
/s/ PricewaterhouseCoopers LLP
PricewaterhouseCoopers LLP
Boston, Massachusetts
February 17, 2006
|
Report of Independent Registered Public Accounting Firm
To the Trustees of Variable Insurance Products Fund and the Shareholders of VIP Equity Income Portfolio:
In our opinion, the accompanying statement of assets and liabilities, including the schedule of investments, and the related statements of operations and of changes in net assets and the financial highlights present fairly, in all material respects, the financial position of VIP Equity Income Portfolio (a fund of Variable Insurance Products Fund) at December 31, 2005 and the results of its operations, the changes in its net assets and the financial highlights for the periods indicated, in conformity with accounting principles generally accepted in the United States of America. These financial statements and financial highlights (hereafter referred to as “financial statements”) are the responsibility of the VIP Equity Income Portfolio’s management; our responsibility is to express an opinion on these financial statements based on our audits. We conducted our audits of these financial statements in accordance with the standards of the Public Company Accounting Oversight Board (United States). Those standards require that we plan and perform the audit to obtain reasonable assurance about whether the financial statements are free of material misstatement. An audit includes examining, on a test basis, evidence supporting the amounts and disclosures in the financial statements, assessing the accounting principles used and significant estimates made by management, and evaluating the overall financial statement presentation. We believe that our audits, which included confirmation of securities at December 31, 2005 by correspondence with the custodian and brokers, provide a reasonable basis for our opinion.
/s/ PricewaterhouseCoopers LLP
PricewaterhouseCoopers LLP
Boston, Massachusetts
February 9, 2006
|
185 Annual Report
Report of Independent Registered Public Accounting Firm
To the Trustees of Variable Insurance Products Fund and the Shareholders of VIP Growth Portfolio:
In our opinion, the accompanying statement of assets and liabilities, including the schedule of investments, and the related statements of operations and of changes in net assets and the financial highlights present fairly, in all material respects, the financial position of VIP Growth Portfolio (a fund of Variable Insurance Products Fund) at December 31, 2005 and the results of its operations, the changes in its net assets and the financial highlights for the periods indicated, in conformity with accounting principles generally accepted in the United States of America. These financial statements and financial highlights (hereafter referred to as “financial statements”) are the responsibility of the VIP Growth Portfolio’s management; our responsi bility is to express an opinion on these financial statements based on our audits. We conducted our audits of these financial statements in accordance with the standards of the Public Company Accounting Oversight Board (United States). Those standards require that we plan and perform the audit to obtain reasonable assurance about whether the financial statements are free of material misstatement. An audit includes examining, on a test basis, evidence supporting the amounts and disclosures in the financial statements, assessing the accounting principles used and significant estimates made by management, and evaluating the overall financial statement presentation. We believe that our audits, which included confirmation of securities at December 31, 2005 by correspondence with the custodian and brokers, provide a reasonable basis for our opinion.
/s/ PricewaterhouseCoopers LLP
PricewaterhouseCoopers LLP
Boston, Massachusetts
February 7, 2006
|
Report of Independent Registered Public Accounting Firm
To the Trustees of Variable Insurance Products Fund and the Shareholders of VIP Overseas Portfolio:
In our opinion, the accompanying statement of assets and liabilities, including the schedule of investments, and the related statements of operations and of changes in net assets and the financial highlights present fairly, in all material respects, the financial position of VIP Overseas Portfolio (a fund of Variable Insurance Products Fund) at December 31, 2005 and the results of its operations, the changes in its net assets and the financial highlights for the periods indicated, in conformity with accounting principles generally accepted in the United States of America. These financial statements and financial highlights (hereafter referred to as “financial statements”) are the responsibility of the VIP Overseas Portfolio’s management; our responsi bility is to express an opinion on these financial statements based on our audits. We conducted our audits of these financial statements in accordance with the standards of the Public Company Accounting Oversight Board (United States). Those standards require that we plan and perform the audit to obtain reasonable assurance about whether the financial statements are free of material misstatement. An audit includes examining, on a test basis, evidence supporting the amounts and disclosures in the financial statements, assessing the accounting principles used and significant estimates made by management, and evaluating the overall financial statement presentation. We believe that our audits, which included confirmation of securities at December 31, 2005 by correspondence with the custodian and brokers, provide a reasonable basis for our opinion.
/s/ PricewaterhouseCoopers LLP
PricewaterhouseCoopers LLP
Boston, Massachusetts
February 14, 2006
|
187 Annual Report
Report of Independent Registered Public Accounting Firm
To the Trustees of Variable Insurance Products Fund III and Shareholders of VIP Growth & Income Portfolio and VIP Growth Opportunities Portfolio:
We have audited the accompanying statements of assets and liabilities of VIP Growth & Income Portfolio and VIP Growth Opportunities Portfolio, (the Funds), funds of Variable Insurance Products III, including the schedules of investments, as of December 31, 2005, and the related statements of operations for the year then ended, the statements of changes in net assets for each of the two years in the period then ended, and the financial highlights for each of the five years in the period then ended. These financial statements and financial highlights are the responsibility of the Funds’ management. Our responsibility is to express an opinion on these financial statements and financial highlights based on our audits.
We conducted our audits in accordance with standards of the Public Company Accounting Oversight Board (United States). Those standards require that we plan and perform the audit to obtain reasonable assurance about whether the financial statements and financial highlights are free of material misstatement. The Funds are not required to have, nor were we engaged to perform, an audit of its internal control over financial reporting. Our audits included consideration of internal control over financial reporting as a basis for designing audit procedures that are appropriate in the circumstances, but not for the purpose of expressing an opinion on the effectiveness of the Fund’s internal control over financial reporting. Accordingly, we express no such opinion. An audit also includes examining, on a test basis, evidence supporting the amounts and disclosures in the financial statements, assessing the accounting principles used and significant estimates made by management, as well as evaluating the overall financial statement presentation. Our procedures included confirmation of securities owned as of December 31, 2005, by correspondence with the custodians and brokers; where replies were not received from brokers, we performed other auditing procedures. We believe that our audits provide a reasonable basis for our opinion.
In our opinion, the financial statements and financial highlights referred to above present fairly, in all material respects, the financial position of VIP Growth & Income Portfolio and VIP Growth Opportunities Portfolio as of December 31, 2005, the results of their operations for the year then ended, the changes in their net assets for each of the two years in the period then ended, and their financial highlights for each of the five years in the period then ended, in conformity with accounting principles generally accepted in the United States of America.
/s/ Deloitte & Touche LLP
DELOITTE & TOUCHE LLP
Boston, Massachusetts
February 14, 2006
|
The Trustees, Member of the Advisory Board, and executive officers of the trusts and funds, as applicable, are listed below. The Board of Trustees governs each fund and is responsible for protecting the interests of shareholders. The Trustees are experienced executives who meet periodically throughout the year to oversee each fund’s activities, review contractual arrangements with companies that provide services to each fund, and review each fund’s performance. Except for William O. McCoy and Albert R. Gamper, Jr., each of the Trustees oversees 326 funds advised by FMR or an affiliate. Mr. McCoy oversees 328 funds advised by FMR or an affiliate. Mr. Gamper oversees 235 funds advised by FMR or an affiliate.
The Trustees hold office without limit in time except that (a) any Trustee may resign; (b) any Trustee may be removed by written instrument, signed by at least two thirds of the number of Trustees prior to such removal; (c) any Trustee who requests to be retired or who has become incapac itated by illness or injury may be retired by written instrument signed by a majority of the other Trustees; and (d) any Trustee may be removed at any special meeting of shareholders by a two thirds vote of the outstanding voting securities of the trust. Each Trustee who is not an interested person (as defined in the 1940 Act) (Independent Trustee), shall retire not later than the last day of the calendar year in which his or her 72nd birthday occurs. The Independent Trustees may waive this mandatory retirement age policy with respect to individual Trustees. The executive officers and Advisory Board Member hold office without limit in time, except that any officer and Advisory Board Member may resign or may be removed by a vote of a majority of the Trustees at any regular meeting or any special meeting of the Trustees. Except as indicated, each individual has held the office shown or other offices in the same company for the past five years.
The fund’s Statement of Additional Information (SAI) includes more information about the Trustees. To request a free copy, call Fidelity at 1-877-208-0098.
Correspondence intended for each Trustee who is an interested person may be sent to Fidelity Investments, 82 Devonshire Street, Boston, Massachusetts 02109.
| | Name, Age; Principal Occupation
Edward C. Johnson 3d (75)
|
Year of Election or Appointment: 1981, 1988, or 1994
Trustee of Variable Insurance Products Fund (1981), Variable Insurance Products Fund II (1988), and Variable Insurance Products Fund III (1994). Mr. Johnson is Chairman of the Board of Trustees. Mr. Johnson serves as Chief Executive Officer, Chairman, and a Director of FMR Corp.; a Director and Chairman of the Board and of the Executive Committee of FMR; Chairman and a Director of Fidelity Management & Research (Far East) Inc.; Chairman and a Director of Fidelity Investments Money Management, Inc.; and Chairman (2001 present) and a Director (2000 present) of FMR Co., Inc.
Year of Election or Appointment: 2005
Mr. Jonas is Senior Vice President of VIP Contrafund (2005 present), VIP Equity Income (2005 present), VIP Growth
(2005 present), VIP Growth & Income (2005 present), VIP Growth Opportunities (2005 present), VIP Index 500 (2005 present), VIP Mid Cap (2005 present), and VIP Overseas (2005 present). He also serves as Senior Vice President of other Fidelity funds (2005 present). Mr. Jonas is Executive Director of FMR (2005 present). Previously, Mr. Jonas served as President of Fidelity Enter prise Operations and Risk Services (2004 2005), Chief Administrative Officer (2002 2004), and Chief Financial Officer of FMR Co. (1998 2000). Mr. Jonas has been with Fidelity Investments since 1987 and has held various financial and management posi tions including Chief Financial Officer of FMR. In addition, he serves on the Boards of Boston Ballet (2003 present) and Simmons College (2003 present).
Year of Election or Appointment: 2003
Mr. Reynolds is a Director (2003 present) and Chief Operating Officer (2002 present) of FMR Corp. He also serves on the Board at Fidelity Investments Canada, Ltd. (2000 present). Previously, Mr. Reynolds served as President of Fidelity Investments Institutional Retirement Group (1996 2000).
* Trustees have been determined to be “Interested Trustees” by virtue of, among other things, their affiliation with the trusts or various entities under common control with FMR.
189 Annual Report
Trustees and Officers - continued
Independent Trustees:
|
Correspondence intended for each Independent Trustee (that is, the Trustees other than the Interested Trustees) may be sent to Fidelity Investments, P.O. Box 55235, Boston, Massachusetts 02205-5235.
| | Name, Age; Principal Occupation
Dennis J. Dirks (57)
|
Year of Election or Appointment: 2005
Prior to his retirement in May 2003, Mr. Dirks was Chief Operating Officer and a member of the Board of The Depository Trust & Clearing Corporation (DTCC) (1999 2003). He also served as President, Chief Operating Officer, and Board member of The De pository Trust Company (DTC) (1999 2003) and President and Board member of the National Securities Clearing Corporation (NSCC) (1999 2003). In addition, Mr. Dirks served as Chief Executive Officer and Board member of the Government Securities Clearing Corporation (2001 2003) and Chief Executive Officer and Board member of the Mortgage Backed Securities Clearing Corporation (2001 2003). Mr. Dirks also serves as a Trustee of Manhattan College (2005 present).
| | Albert R. Gamper, Jr. (63)
|
Year of Election or Appointment: 2006
Mr. Gamper also serves as a Trustee (2006 present) or Member of the Advisory Board (2005 present) of other investment compa nies advised by FMR. Prior to his retirement in December 2004, Mr. Gamper served as Chairman of the Board of CIT Group Inc. (commercial finance). During his tenure with CIT Group Inc. Mr. Gamper served in numerous senior management positions, includ ing Chairman (1987 1989; 1999 2001; 2002 2004), Chief Executive Officer (1987 2004), and President (1989 2002). He cur rently serves as a member of the Board of Directors of Public Service Enterprise Group (utilities, 2001 present), Chairman of the Board of Governors, Rutgers University (2004 present), and Chairman of the Board of Saint Barnabas Health Care System.
Year of Election or Appointment: 1997
Dr. Gates is Chairman of the Independent Trustees (2006 present). Dr. Gates is President of Texas A&M University (2002 present). He was Director of the Central Intelligence Agency (CIA) from 1991 to 1993. From 1989 to 1991, Dr. Gates served as Assistant to the President of the United States and Deputy National Security Advisor. Dr. Gates is a Director of NACCO Industries, Inc. (mining and manufacturing), Parker Drilling Co., Inc. (drilling and rental tools for the energy industry, 2001 present), and Brinker International (restaurant management, 2003 present). Previously, Dr. Gates served as a Director of LucasVarity PLC (automotive components and diesel engines), a Director of TRW Inc. (automotive, space, defense, and information technology), and Dean of the George Bush School of Government and Public Service at Texas A&M University (1999 2001). Dr. Gates also is a Trustee of the Forum for International Policy.
Year of Election or Appointment: 2004
Dr. Heilmeier is Chairman Emeritus of Telcordia Technologies (communication software and systems), where prior to his retirement, he served as company Chairman and Chief Executive Officer. He currently serves on the Boards of Directors of The Mitre Corpo ration (systems engineering and information technology support for the government), and HRL Laboratories (private research and development, 2004 present). He is Chairman of the General Motors Science & Technology Advisory Board and a Life Fellow of the Institute of Electrical and Electronics Engineers (IEEE) (2000 present). Dr. Heilmeier is a member of the Defense Science Board and the National Security Agency Advisory Board. He is also a member of the National Academy of Engineering, the American Academy of Arts and Sciences, and the Board of Overseers of the School of Engineering and Applied Science of the University of Pennsylvania. Previously, Dr. Heilmeier served as a Director of TRW Inc. (automotive, space, defense, and information technology, 1992 2002), Compaq (1994 2002), Automatic Data Processing, Inc. (ADP) (technology based business outsourcing, 1995 2002), INET Technologies Inc. (telecommunications network surveillance, 2001 2004), and Teletech Holdings (customer management ser vices). He is the recipient of the 2005 Kyoto Prize in Advanced Technology for his invention of the liquid display.
Year of Election or Appointment: 2001
Prior to Ms. Knowles’ retirement in June 2000, she served as Executive Vice President and Chief Financial Officer of Atlantic Rich field Company (ARCO) (diversified energy, 1996 2000). From 1993 to 1996, she was a Senior Vice President of ARCO and President of ARCO Transportation Company. She served as a Director of ARCO from 1996 to 1998. She currently serves as a Director of Phelps Dodge Corporation (copper mining and manufacturing) and McKesson Corporation (healthcare service, 2002 present). Ms. Knowles is a Trustee of the Brookings Institution and the Catalina Island Conservancy and also serves as a member of the Advisory Board for the School of Engineering of the University of Southern California.
| | Name, Age; Principal Occupation
Ned C. Lautenbach (61)
|
Year of Election or Appointment: 2000
Mr. Lautenbach has been a partner of Clayton, Dubilier & Rice, Inc. (private equity investment firm) since September 1998. Pre viously, Mr. Lautenbach was with the International Business Machines Corporation (IBM) from 1968 until his retirement in 1998. Mr. Lautenbach serves as a Director of Italtel Holding S.p.A. (telecommunications (Milan, Italy), 2004 present) and Eaton Corpora tion (diversified industrial) as well as the Philharmonic Center for the Arts in Naples, Florida. He also is a member of the Board of Trustees of Fairfield University (2005 present), as well as a member of the Council on Foreign Relations.
Year of Election or Appointment: 1997
Prior to his retirement in December 1994, Mr. McCoy was Vice Chairman of the Board of BellSouth Corporation (telecommunica tions) and President of BellSouth Enterprises. He is currently a Director of Liberty Corporation (holding company), Duke Realty Cor poration (real estate), and Progress Energy, Inc. (electric utility). He is also a partner of Franklin Street Partners (private investment management firm) and a member of the Research Triangle Foundation Board. In addition, Mr. McCoy served as the Interim Chan cellor (1999 2000) and a member of the Board of Visitors for the University of North Carolina at Chapel Hill and currently serves on the Board of Directors of the University of North Carolina Health Care System and the Board of Visitors of the Kenan Flagler Business School (University of North Carolina at Chapel Hill). He also served as Vice President of Finance for the University of North Carolina (16 school system).
Year of Election or Appointment: 2005
Ms. Small is a member (2000 present) and Chairperson (2002 present) of the Investment Committee, and a member (2002 present) of the Board of Trustees of Smith College. Previously, she served as Chief Investment Officer (1999 2000), Director of Global Equity Investments (1996 1999), and a member of the Board of Directors of Scudder, Stevens & Clark (1990 1997) and Scudder Kemper Investments (1997 1998). In addition, Ms. Small served as Co Chair (2000 2003) of the Annual Fund for the Fletcher School of Law and Diplomacy.
| | William S. Stavropoulos (66)
|
Year of Election or Appointment: 2001 or 2002
Trustee of Variable Insurance Products Fund (2001), Variable Insurance Products Fund II (2001), and Variable Insurance Products Fund III (2002). Mr. Stavropoulos is Chairman of the Board (2000 present) and a Member of the Board of Directors of The Dow Chemical Company. Since joining The Dow Chemical Company in 1967, Mr. Stavropoulos served in numerous senior manage ment positions, including President (1993 2000; 2002 2003), CEO (1995 2000; 2002 2004), and Chairman of the Executive Committee (2000 2004). Currently, he is a Director of NCR Corporation (data warehousing and technology solutions), BellSouth Corporation (telecommunications), Chemical Financial Corporation, Maersk Inc. (industrial conglomerate, 2002 present), and Metalmark Capital (private equity investment firm, 2005 present). He also serves as a member of the Board of Trustees of the American Enterprise Institute for Public Policy Research. In addition, Mr. Stavropoulos is a member of The Business Council, J.P. Morgan International Council and the University of Notre Dame Advisory Council for the College of Science.
Year of Election or Appointment: 2005
Prior to his retirement in 2001, Mr. Wolfe was Chairman and Chief Executive Officer of Hershey Foods Corporation (1993 2001). He currently serves as a member of the boards of Adelphia Communications Corporation (2003 present), Bausch & Lomb, Inc., and Revlon Inc. (2004 present).
Advisory Board Member and Executive Officers:
Correspondence intended for each executive officer and Mr. Lynch may be sent to Fidelity Investments, 82 Devonshire Street, Boston, Massachu setts 02109.
| | Name, Age; Principal Occupation
|
Year of Election or Appointment: 2003
Vice Chairman and a Director of FMR, and Vice Chairman (2001 present) and a Director (2000 present) of FMR Co., Inc. Pre viously, Mr. Lynch served as a Trustee of the Fidelity funds (1990 2003). In addition, he serves as a Trustee of Boston College, Massachusetts Eye & Ear Infirmary, Historic Deerfield, John F. Kennedy Library, and the Museum of Fine Arts of Boston.
191 Annual Report
Trustees and Officers - continued
|
| | Name, Age; Principal Occupation
Dwight D. Churchill (52)
|
Year of Election or Appointment: 2005
Vice President of VIP Contrafund, VIP Equity Income, VIP Growth, VIP Growth & Income, VIP Growth Opportunities, VIP Index 500, VIP Mid Cap, and VIP Overseas. Mr. Churchill also serves as Vice President of certain Equity Funds (2005 present) and cer tain High Income Funds (2005 present). Previously, he served as Head of Fidelity’s Fixed Income Division (2000 2005), Vice Presi dent of Fidelity’s Money Market Funds (2000 2005), Vice President of Fidelity’s Bond Funds, and Senior Vice President of FIMM (2000) and FMR. Mr. Churchill joined Fidelity in 1993 as Vice President and Group Leader of Taxable Fixed Income Investments.
Year of Election or Appointment: 1995
Vice President of VIP Contrafund. Mr. Danoff serves as Vice President of other funds advised by FMR. Mr. Danoff also serves as Senior Vice President of FMR and FMR Co., Inc. (2001).
Year of Election or Appointment: 1997
Vice President of VIP Equity Income. Mr. Petersen serves as Vice President of other funds advised by FMR. Mr. Petersen also serves as Senior Vice President of FMR and FMR Co., Inc. (2001).
Year of Election or Appointment: 1997
Vice President of VIP Growth. Ms. Uhrig serves as Vice President of another fund advised by FMR. Ms. Uhrig also serves as Vice President of FMR and FMR Co., Inc. (2001).
Year of Election or Appointment: 2005
Vice President of VIP Growth & Income. Mr. Thay also serves as Vice President of other funds advised by FMR. Prior to assuming his current responsibilities, Mr. Thay managed a variety of Fidelity Funds. Mr. Thay also serves as Vice President of FMR (2003) and FMR Co., Inc. (2003).
Year of Election or Appointment: 2005
Vice President of VIP Growth Opportunities. Mr. Porter also serves as Vice President of another fund advised by FMR. Prior to assuming his current responsibilities, Mr. Porter worked as a research analyst and portfolio manager. Mr. Porter also serves as Vice President of FMR (2004) and FMR Co., Inc. (2004).
Year of Election or Appointment: 2003
Vice President of VIP Mid Cap. Mr. Allen also serves as Vice President of another fund advised by FMR. Prior to assuming his current responsibilities, Mr. Allen worked as a research analyst and manager. Mr. Allen also serves as Vice President of FMR (2002) and FMR Co., Inc. (2002).
Year of Election or Appointment: 2002
Vice President of VIP Overseas. Mr. Mace also serves as Vice President of other funds advised by FMR. Prior to assuming his current responsibilities, Mr. Mace managed a variety of Fidelity funds. Mr. Mace also serves as Senior Vice President of FMR (2001) and FMR Co., Inc. (2001).
Year of Election or Appointment: 1998
Secretary of VIP Contrafund, VIP Equity Income, VIP Growth, VIP Growth & Income, VIP Growth Opportunities, VIP Index 500, VIP Mid Cap, and VIP Overseas. He also serves as Secretary of other Fidelity funds; Vice President, General Counsel, and Secretary of FMR Co., Inc. (2001 present) and FMR; Assistant Secretary of Fidelity Management & Research (U.K.) Inc. (2001 present), Fidelity Management & Research (Far East) Inc. (2001 present), and Fidelity Investments Money Management, Inc. (2001 present). Mr. Roiter is an Adjunct Member, Faculty of Law, at Boston College Law School (2003 present). Previously, Mr. Roiter served as Vice President and Secretary of Fidelity Distributors Corporation (FDC) (1998 2005).
Year of Election or Appointment: 2003
Assistant Secretary of VIP Contrafund, VIP Equity Income, VIP Growth, VIP Growth & Income, VIP Growth Opportunities, VIP Index 500, VIP Mid Cap, and VIP Overseas. Mr. Fross also serves as Assistant Secretary of other Fidelity funds (2003 present), Vice President and Secretary of FDC (2005 present), and is an employee of FMR.
Name, Age; Principal Occupation
Christine Reynolds (47)
|
Year of Election or Appointment: 2004
President, Treasurer, and Anti Money Laundering (AML) officer of VIP Contrafund, VIP Equity Income, VIP Growth, VIP Growth & Income, VIP Growth Opportunities, VIP Index 500, VIP Mid Cap, and VIP Overseas. Ms. Reynolds also serves as President, Treasurer, and AML officer of other Fidelity funds (2004) and is a Vice President (2003) and an employee (2002) of FMR. Before joining Fidelity Investments, Ms. Reynolds worked at PricewaterhouseCoopers LLP (PwC) (1980 2002), where she was most recently an audit partner with PwC’s investment management practice.
Year of Election or Appointment: 2005
Chief Financial Officer of VIP Contrafund, VIP Equity Income, VIP Growth, VIP Growth & Income, VIP Growth Opportunities, VIP Index 500, VIP Mid Cap, and VIP Overseas. Mr. Murphy also serves as Chief Financial Officer of other Fidelity funds (2005 present). He also serves as Senior Vice President of Fidelity Pricing and Cash Management Services Group (FPCMS).
Kenneth A. Rathgeber (58)
|
Year of Election or Appointment: 2004
Chief Compliance Officer of VIP Contrafund, VIP Equity Income, VIP Growth, VIP Growth & Income, VIP Growth Opportunities, VIP Index 500, VIP Mid Cap, and VIP Overseas. Mr. Rathgeber also serves as Chief Compliance Officer of other Fidelity funds (2004) and Executive Vice President of Risk Oversight for Fidelity Investments (2002). Previously, he served as Executive Vice Presi dent and Chief Operating Officer for Fidelity Investments Institutional Services Company, Inc. (1998 2002).
Year of Election or Appointment: 2003
Deputy Treasurer of VIP Contrafund, VIP Equity Income, VIP Growth, VIP Growth & Income, VIP Growth Opportunities, VIP Index 500, VIP Mid Cap, and VIP Overseas. Mr. Hebble also serves as Deputy Treasurer of other Fidelity funds (2003), and is an em ployee of FMR. Before joining Fidelity Investments, Mr. Hebble worked at Deutsche Asset Management where he served as Director of Fund Accounting (2002 2003) and Assistant Treasurer of the Scudder Funds (1998 2003).
Year of Election or Appointment: 2005
Deputy Treasurer of VIP Contrafund, VIP Equity Income, VIP Growth, VIP Growth & Income, VIP Growth Opportunities, VIP Index 500, VIP Mid Cap, and VIP Overseas. Mr. Mehrmann also serves as Deputy Treasurer of other Fidelity funds (2005 present) and is an employee of FMR. Previously, Mr. Mehrmann served as Vice President of Fidelity Investments Institutional Services Group (FIIS)/Fidelity Investments Institutional Operations Corporation, Inc. (FIIOC) Client Services (1998 2004).
Kimberley H. Monasterio (42)
|
Year of Election or Appointment: 2004
Deputy Treasurer of VIP Contrafund, VIP Equity Income, VIP Growth, VIP Growth & Income, VIP Growth Opportunities, VIP Index 500, VIP Mid Cap, and VIP Overseas. Ms. Monasterio also serves as Deputy Treasurer of other Fidelity funds (2004) and is an employee of FMR (2004). Before joining Fidelity Investments, Ms. Monasterio served as Treasurer (2000 2004) and Chief Finan cial Officer (2002 2004) of the Franklin Templeton Funds and Senior Vice President of Franklin Templeton Services, LLC
(2000 2004).
Year of Election or Appointment:2005
Deputy Treasurer of VIP Contrafund, VIP Equity Income, VIP Growth, VIP Growth & Income, VIP Growth Opportunities, VIP Index 500, VIP Mid Cap, and VIP Overseas. Mr. Robins also serves as Deputy Treasurer of other Fidelity funds (2005 present) and is an employee of FMR (2004 present). Before joining Fidelity Investments, Mr. Robins worked at KPMG LLP, where he was a partner in KPMG’s department of professional practice (2002 2004) and a Senior Manager (1999 2000). In addition, Mr. Robins served as Assistant Chief Accountant, United States Securities and Exchange Commission (2000 2002).
Year of Election or Appointment: 2005
Assistant Treasurer of VIP Contrafund, VIP Equity Income, VIP Growth, VIP Growth & Income, VIP Growth Opportunities, VIP Index 500, VIP Mid Cap, and VIP Overseas. Mr. Byrnes also serves as Assistant Treasurer of other Fidelity funds (2005 present) and is an employee of FMR (2005 present). Previously, Mr. Byrnes served as Vice President of FPCMS (2003 2005). Before joining Fidelity Investments, Mr. Byrnes worked at Deutsche Asset Management where he served as Vice President of the Investment Op erations Group (2000 2003).
193 Annual Report
Trustees and Officers - continued
|
| | Name, Age; Principal Occupation
John H. Costello (59)
|
Year of Election or Appointment: 1986, 1987, 1992, 1995, 1996, or 1998
Assistant Treasurer of VIP Contrafund (1995), VIP Equity Income (1986), VIP Growth (1986), VIP Growth & Income (1996), VIP Growth Opportunities (1995), VIP Index 500 (1992), VIP Mid Cap (1998), and VIP Overseas (1987). Mr. Costello also serves as Assistant Treasurer of other Fidelity funds and is an employee of FMR.
Year of Election or Appointment: 2004
Assistant Treasurer of VIP Contrafund, VIP Equity Income, VIP Growth, VIP Growth & Income, VIP Growth Opportunities, VIP Index 500, VIP Mid Cap, and VIP Overseas. Mr. Lydecker also serves as Assistant Treasurer of other Fidelity funds (2004) and is an em ployee of FMR.
Year of Election or Appointment: 2002
Assistant Treasurer of VIP Contrafund, VIP Equity Income, VIP Growth, VIP Growth & Income, VIP Growth Opportunities, VIP Index 500, VIP Mid Cap, and VIP Overseas. Mr. Osterheld also serves as Assistant Treasurer of other Fidelity funds (2002) and is an employee of FMR.
Year of Election or Appointment: 2005
Assistant Treasurer of VIP Contrafund, VIP Equity Income, VIP Growth, VIP Growth & Income, VIP Growth Opportunities, VIP Index 500, VIP Mid Cap, and VIP Overseas. Mr. Ryan also serves as Assistant Treasurer of other Fidelity funds (2005 present) and is an employee of FMR (2005 present). Previously, Mr. Ryan served as Vice President of Fund Reporting in FPCMS (1999 2005).
Year of Election or Appointment: 2005
Assistant Treasurer of VIP Contrafund, VIP Equity Income, VIP Growth, VIP Growth & Income, VIP Growth Opportunities, VIP Index 500, VIP Mid Cap, and VIP Overseas. Mr. Schiavone also serves as Assistant Treasurer of other Fidelity funds (2005 present) and is an employee of FMR (2005 present). Before joining Fidelity Investments, Mr. Schiavone worked at Deutsche Asset Management, where he most recently served as Assistant Treasurer (2003 2005) of the Scudder Funds and Vice President and Head of Fund Reporting (1996 2003).
The Board of Trustees of each fund voted to pay to shareholders of record at the opening of business on record date, the following distributions per share derived from capital gains realized from sales of portfolio securities, and dividends derived from net investment income:
| Fund | | Pay Date | | Record Date | | Dividends | | Capital Gains |
| VIP Contrafund | | | | | | | | |
| Initial Class | | 02/10/06 | | 02/10/06 | | $.164 | | $.290 |
| Service Class | | 02/10/06 | | 02/10/06 | | $.138 | | $.290 |
| Service Class 2 | | 02/10/06 | | 02/10/06 | | $.120 | | $.290 |
| Investor Class | | 02/10/06 | | 02/10/06 | | $.175 | | $.290 |
| VIP Equity-Income | | | | | | | | |
| Initial Class | | 02/10/06 | | 02/10/06 | | $.446 | | $1.340 |
| Service Class | | 02/10/06 | | 02/10/06 | | $.420 | | $1.340 |
| Service Class 2 | | 02/10/06 | | 02/10/06 | | $.393 | | $1.340 |
| Investor Class | | 02/10/06 | | 02/10/06 | | $.457 | | $1.340 |
| VIP Growth & Income | | | | | | | | |
| Initial Class | | 02/10/06 | | 02/10/06 | | $.136 | | $.380 |
| Service Class | | 02/10/06 | | 02/10/06 | | $.122 | | $.380 |
| Service Class 2 | | 02/10/06 | | 02/10/06 | | $.105 | | $.380 |
| Investor Class | | 02/10/06 | | 02/10/06 | | $.142 | | $.380 |
| VIP Mid Cap | | | | | | | | |
| Initial Class | | 02/10/06 | | 02/10/06 | | $.128 | | $4.334 |
| Service Class | | 02/10/06 | | 02/10/06 | | $.096 | | $4.334 |
| Service Class 2 | | 02/10/06 | | 02/10/06 | | $.065 | | $4.334 |
| Investor Class | | 02/10/06 | | 02/10/06 | | $.139 | | $4.334 |
| VIP Overseas | | | | | | | | |
| Initial Class | | 02/10/06 | | 02/10/06 | | $.187 | | $.130 |
| Service Class | | 02/10/06 | | 02/10/06 | | $.167 | | $.130 |
| Service Class 2 | | 02/10/06 | | 02/10/06 | | $.150 | | $.130 |
The funds hereby designate as capital gain dividend the amounts noted below for the taxable year ended December 31, 2005, or, if subsequently determined to be different, the net capital gain of such year.
| Fund | | |
| VIP Contrafund | | $160,245,183 |
| VIP Equity-Income | | $467,659,601 |
| VIP Growth & Income | | $40,583,998 |
| VIP Mid Cap | | $679,551,138 |
195 Annual Report
Distributions - continued
|
A percentage of the dividends distributed during the fiscal year for the following funds qualifies for the dividends received deduction for cor porate shareholders:
| Fund | | |
| VIP Contrafund | | |
| Initial Class | | 100% |
| Service Class | | 100% |
| Service Class 2 | | 100% |
| VIP Equity-Income | | |
| Initial Class | | 87% |
| Service Class | | 90% |
| Service Class 2 | | 95% |
| VIP Growth | | |
| Initial Class | | 100% |
| Service Class | | 100% |
| Service Class 2 | | 100% |
| VIP Growth & Income | | |
| Initial Class | | 100% |
| Service Class | | 100% |
| Service Class 2 | | 100% |
| VIP Growth Opportunities | | |
| Initial Class | | 100% |
| Service Class | | 100% |
| Service Class 2 | | 100% |
| VIP Index 500 | | |
| Initial Class | | 100% |
| Service Class | | 100% |
| Service Class 2 | | 100% |
The amounts per share which represent income derived from sources within, and taxes paid to, foreign countries or possessions of the United States are as follows:
| Fund | | Pay Date | | Income | | Taxes |
| VIP Overseas | | | | | | |
| Initial Class | | 02/11/05 | | $.216 | | $.011 |
| Service Class | | 02/11/05 | | $.201 | | $.011 |
| Service Class 2 | | 02/11/05 | | $.191 | | $.011 |
The funds will notify shareholders in January 2006 of amounts for use in preparing 2005 income tax returns.
Board Approval of Investment Advisory Contracts and Management Fees
VIP Contrafund Portfolio
VIP Equity-Income Portfolio
VIP Growth Portfolio
VIP Growth & Income Portfolio
VIP Growth Opportunities Portfolio
VIP Index 500 Portfolio
VIP Mid Cap Portfolio
VIP Overseas Portfolio
|
Each year, typically in July, the Board of Trustees, including the independent Trustees (together, the Board), votes on the renewal of the management contract and sub advisory agreements (together, the Advisory Contracts) for each fund. The Board, assisted by the advice of fund counsel and independent Trustees’ counsel, requests and considers a broad range of information throughout the year.
The Board meets regularly each month except August and takes into account throughout the year matters bearing on Advisory Contracts. The Board, acting directly and through its separate committees, considers at each of its meetings factors that are relevant to the annual renewal of each fund’s Advisory Contracts, including the services and support provided to each fund and its shareholders by Fidelity. At the time of the renewal, the Board had 11 standing committees, each composed of independent Trustees with varying backgrounds, to which the Board has assigned specific subject matter responsibilities in order to enhance effective decision making by the Board. Each committee has adopted a written charter outlining the structure and purposes of the committee. One such committee, the Equity Contract Committee, meets periodically during the first six months of each year and as necessary to consider matters specifically related to the annual renewal of Advisory Contracts. The committee requests and receives information on, and makes recommendations to the independent Trustees concerning, the approval and annual review of the Advisory Contracts.
At its July 2005 meeting, the Board of Trustees, including the independent Trustees, unanimously determined to renew the Advisory Contracts for each fund. In reaching its determination, the Board considered all factors it believed relevant, including (1) the nature, extent, and quality of the services to be provided to each fund and its shareholders by Fidelity (including the investment performance of each fund); (2) the competitiveness of the man agement fee and total expenses of each fund; (3) the total costs of the services to be provided by and the profits to be realized by the investment adviser and its affiliates from the relationship with each fund; (4) the extent to which economies of scale would be realized as each fund grows; and (5) whether fee levels reflect these economies of scale, if any, for the benefit of fund shareholders.
In determining whether to renew the Advisory Contracts for each fund, the Board ultimately reached a determination, with the assistance of fund counsel and independent Trustees’ counsel, that the renewal of the Advisory Contracts and the compensation to be received by Fidelity under the management contracts is consistent with Fidelity’s fiduciary duty under applicable law. In addition to evaluating the specific factors noted above, the Board, in reaching its determination, is aware that shareholders in each fund have a broad range of investment choices available to them, including a wide choice among mutual funds offered by competitors to Fidelity, and that each fund’s shareholders, with the opportunity to review and weigh the disclosure provided by the fund in its prospectus and other public disclosures, have chosen to invest in that fund, managed by Fidelity.
Nature, Extent, and Quality of Services Provided by Fidelity. The Board considered staffing within the investment adviser, FMR, and the sub advisers (together, the Investment Advisers), including the background of the funds’ portfolio managers and the funds’ investment objectives and disciplines. The independent Trustees also had discussions with senior management of Fidelity’s investment operations and investment groups. The Board considered the structure of the portfolio manager compensation program and whether this structure provides appropriate incentives.
Fidelity Resources Dedicated to Investment Management and Support Services (except VIP Index 500 Portfolio). The Board reviewed the size, educa tion, and experience of the Investment Advisers’ investment staff, their use of technology, and the Investment Advisers’ approach to recruiting, train ing, and retaining portfolio managers and other research, advisory, and management personnel. The Board considered Fidelity’s extensive global research capabilities that enable the Investment Advisers to aggregate data from various sources in an effort to produce positive investment results. The Board noted that Fidelity’s analysts have access to a variety of technological tools that enable them to perform both fundamental and quantitative analysis and to specialize in various disciplines. The Board also considered that Fidelity’s portfolio managers and analysts have access to daily portfolio attribution that allows for monitoring of a fund’s portfolio, as well as an electronic communication system that provides immediate real time access to research concerning issuers and credit enhancers.
Fidelity Resources Dedicated to Investment Management and Support Services (VIP Index 500 Portfolio). The Board reviewed the size, education, and experience of the Investment Advisers’ investment staff, their use of technology, and the Investment Advisers’ approach to recruiting, training, and retaining portfolio managers and other research, advisory, and management personnel.
Shareholder and Administrative Services (except VIP Index 500 Portfolio). The Board considered the nature, extent, quality, and cost of administra tive, distribution, and shareholder services performed by the Investment Advisers and their affiliates under the Advisory Contracts and under separate agreements covering transfer agency, pricing and bookkeeping, and securities lending services for each fund. The Board also considered the nature and extent of the Investment Advisers’ supervision of third party service providers, principally custodians and subcustodians. The Board reviewed the
197 Annual Report
Board Approval of Investment Advisory Contracts and Management Fees - continued
allocation of fund brokerage, including allocations to brokers affiliated with the Investment Advisers, the use of brokerage commissions to pay fund expenses, and the use of “soft” commission dollars to pay for research services. The Board also considered that Fidelity voluntarily decided in 2004 to stop using “soft” commission dollars to pay for market data and, instead, to pay for that data out of its own resources. The Board also considered the resources devoted to, and the record of compliance with, each fund’s compliance policies and procedures.
The Board noted that the growth of fund assets across the complex allows Fidelity to reinvest in the development of services designed to enhance the value or convenience of the Fidelity funds as investment vehicles. These services include 24 hour access to account information and market informa tion through phone representatives and over the Internet, and investor education materials and asset allocation tools.
Shareholder and Administrative Services (VIP Index 500 Portfolio). The Board considered the nature, extent, quality, and cost of administrative, distribution, and shareholder services performed by the Investment Advisers and their affiliates under the Advisory Contracts and under separate agreements covering transfer agency, pricing and bookkeeping, and securities lending services for the fund. The Board also considered the nature and extent of the Investment Advisers’ supervision of third party service providers, principally custodians and subcustodians. The Board reviewed the allocation of fund brokerage, including allocations to brokers affiliated with the Investment Advisers. The Board also considered the resources devoted to, and the record of compliance with, the fund’s compliance policies and procedures.
The Board noted that the growth of fund assets across the complex allows Fidelity to reinvest in the development of services designed to enhance the value or convenience of the Fidelity funds as investment vehicles. These services include 24 hour access to account information and market informa tion through phone representatives and over the Internet, and investor education materials and asset allocation tools.
Investment in a Large Fund Family. The Board considered the benefits to shareholders of investing in a Fidelity fund, including the benefits of investing in a fund that is part of a large family of funds offering a variety of investment disciplines and providing for a large variety of mutual fund investor services. The Board noted that, since the last Advisory Contract renewals in July 2004, Fidelity has taken a number of actions that benefited particular funds, including (i) voluntarily deciding in 2004 to stop using “soft” commission dollars to pay for market data and, instead, to pay for that data out of its own resources, (ii) contractually agreeing to impose management fee reductions and expense limitations on its five Spartan stock index funds and its stock index fund available through variable insurance products, (iii) contractually agreeing to eliminate the management fees on the Fidelity Freedom Funds and the Fidelity Advisor Freedom Funds, (iv) contractually agreeing to reduce the management fees on most of its investment grade taxable bond funds, and (v) contractually agreeing to impose expense limitations on its retail and Spartan investment grade taxable bond funds.
Investment Performance and Compliance (except VIP Index 500 Portfolio). The Board considered whether each fund has operated within its invest ment objective, as well as its record of compliance with its investment restrictions. It also reviewed each fund’s absolute investment performance for each class, as well as each fund’s relative investment performance for each class measured against (i) a broad based securities market index, and (ii) a peer group of mutual funds deemed appropriate by the Board over multiple periods. For each fund, the following charts considered by the Board show, over the one , three , and five year periods ended December 31, 2004, the returns of Service Class and Initial Class of the fund, the returns of a broad based securities market index (“benchmark”), and a range of returns of a peer group of mutual funds identified by Lipper Inc. as having an investment objective similar to that of the fund. The returns of Service Class and Initial Class represent the performance of classes with high and low 12b 1 fees, respectively (not necessarily with the highest and lowest total expenses). (Unlike Service Class, Service Class 2, which has a higher 12b 1 fee than Service Class, did not have five years of performance as of December 31, 2004.) The box within each chart shows the 25th percentile return (bottom of box) and the 75th percentile return (top of box) of the Lipper peer group. Returns shown above the box are in the first quartile and returns shown below the box are in the fourth quartile. The percentage beaten numbers noted below each chart correspond to the percentile box and represent the percentage of funds in the Lipper peer group whose performance was equal to or lower than that of the class indicated.

The Board reviewed the fund’s relative investment performance against its Lipper peer group and stated that the performance of Initial Class of the fund was in the first quartile for the one , three , and five year periods. The Board also stated that the relative investment performance of Initial Class of the fund has compared favorably to its benchmark over time. The Board considered that the variations in performance among the fund’s classes reflect the variations in class expenses, which result in lower performance for higher expense classes.
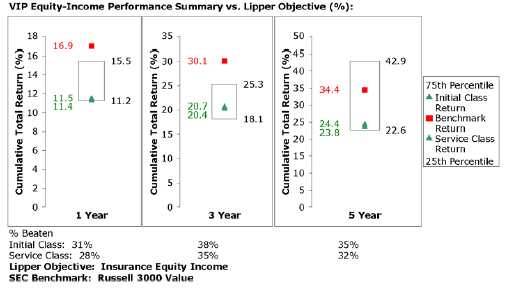
The Board reviewed the fund’s relative investment performance against its Lipper peer group and stated that the performance of Initial Class of the fund was in the third quartile for the one , three , and five year periods. The Board also stated that the relative investment performance of the fund was lower than its benchmark over time. The Board considered that the variations in performance among the fund’s classes reflect the variations in class expenses, which result in lower performance for higher expense classes. The Board discussed with FMR actions to be taken by FMR to improve the fund’s disappointing performance.
199 Annual Report
Board Approval of Investment Advisory Contracts and Management Fees - continued
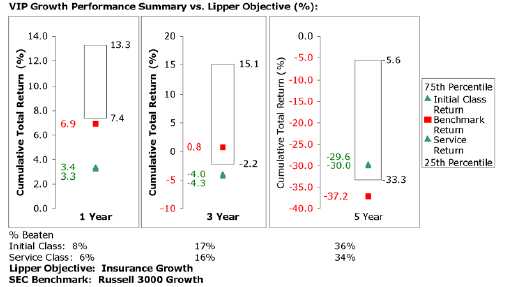
The Board reviewed the fund’s relative investment performance against its Lipper peer group and stated that the performance of Initial Class of the fund was in the fourth quartile for the one and three year periods and the third quartile for the five year period. The Board also stated that the relative investment performance of the fund was lower than its benchmark for certain periods, although the five year cumulative total return of the fund was higher than its benchmark. The Board considered that the variations in performance among the fund’s classes reflect the variations in class expenses, which result in lower performance for higher expense classes. The Board discussed with FMR actions to be taken by FMR to improve the fund’s disap pointing performance.
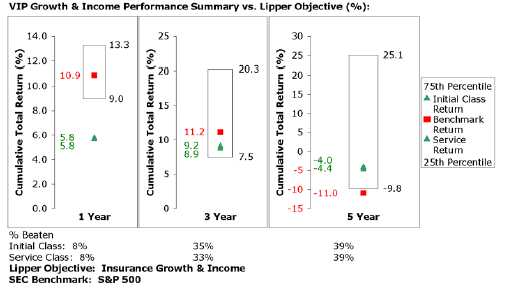
The Board reviewed the fund’s relative investment performance against its Lipper peer group and stated that the performance of Initial Class of the fund was in the fourth quartile for the one year period and the third quartile for the three and five year periods. The Board also stated that the relative investment performance of the fund was lower than its benchmark for certain periods, although the five year cumulative total return of the fund was higher than its benchmark. The Board considered that the variations in performance among the fund’s classes reflect the variations in class expenses, which result in lower performance for higher expense classes. The Board discussed with FMR actions to be taken by FMR to improve the fund’s disap pointing performance.
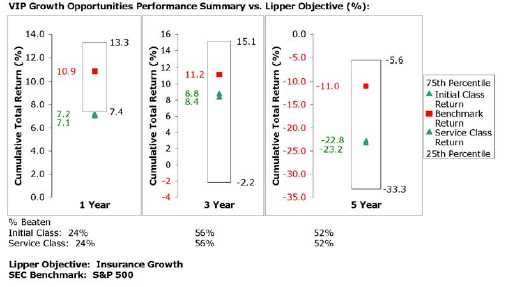
The Board reviewed the fund’s relative investment performance against its Lipper peer group and stated that the performance of Initial Class of the fund was in the fourth quartile for the one year period and the second quartile for the three and five year periods. The Board also stated that the relative investment performance of the fund was lower than its benchmark over time. The Board considered that the variations in performance among the fund’s classes reflect the variations in class expenses, which result in lower performance for higher expense classes.
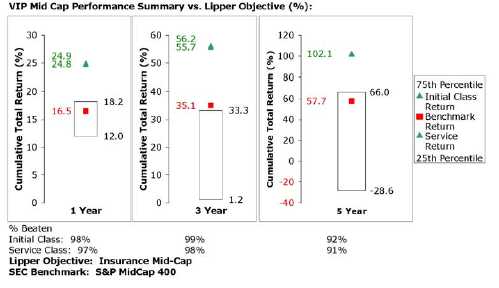
The Board reviewed the fund’s relative investment performance against its Lipper peer group and stated that the performance of Initial Class of the fund was in the first quartile for the one , three , and five year periods. The Board also stated that the relative investment performance of Initial Class of the fund has compared favorably to its benchmark over time. The Board considered that the variations in performance among the fund’s classes reflect the variations in class expenses, which result in lower performance for higher expense classes.
201 Annual Report
Board Approval of Investment Advisory Contracts and Management Fees - continued
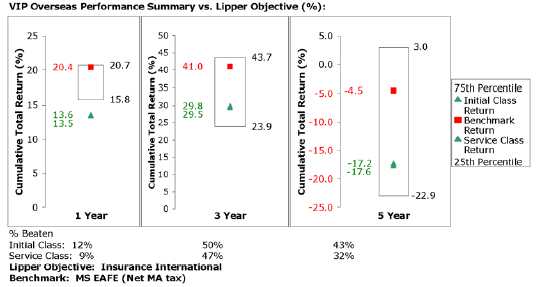
The Board reviewed the fund’s relative investment performance against its Lipper peer group and stated that the performance of Initial Class of the fund was in the fourth quartile for the one year period, the second quartile for the three year period, and the third quartile for the five year period. The Board also stated that the relative investment performance of the fund was lower than its benchmark over time. The Board considered that the varia tions in performance among the fund’s classes reflect the variations in class expenses, which result in lower performance for higher expense classes.
The Board has had thorough discussions with FMR throughout the year about the Board’s and FMR’s concerns about equity research, equity fund performance, and compliance with internal policies governing gifts and entertainment. FMR has taken steps that it believes will refocus and strengthen equity research and equity portfolio management and compliance. The Board noted with favor FMR’s recent reorganization of its senior management team and FMR’s plans to dedicate additional resources to investment research, and participated in the process that led to those changes.
Based on its review, and giving particular weight to the nature and quality of the resources dedicated by the Investment Advisers to maintain and improve relative performance, the Board concluded that the nature, extent, and quality of the services provided by Fidelity will benefit each fund’s shareholders, particularly in light of the Board’s view that each fund’s shareholders benefit from investing in a fund that is part of a large family of funds offering a variety of investment disciplines and services.
Investment Performance (VIP Index 500 Portfolio). The Board considered whether the fund has operated within its investment objective, as well as its record of compliance with its investment restrictions. It also reviewed the fund’s absolute investment performance for each class, as well as the fund’s relative investment performance for each class measured against (i) a broad based securities market index, and (ii) a peer group of mutual funds deemed appropriate by the Board over multiple periods. The following charts considered by the Board show, over the one , three , and five year periods ended December 31, 2004, as applicable, the returns of Service Class 2 and Initial Class of the fund, the returns of a broad based securities market index (“benchmark”), and a range of returns of a peer group of mutual funds identified by Lipper Inc. as having an investment objective similar to that of the fund. The returns of Service Class 2 and Initial Class represent the performance of classes with the highest and lowest 12b 1 fees, respectively (not necessarily with the highest and lowest total expenses). The box within each chart shows the 25th percentile return (bottom of box) and the 75th percentile return (top of box) of the Lipper peer group. Returns shown above the box are in the first quartile and returns shown below the box are in the fourth quartile. The percentage beaten numbers noted below each chart correspond to the percentile box and represent the percentage of funds in the Lipper peer group whose performance was equal to or lower than that of the class indicated.
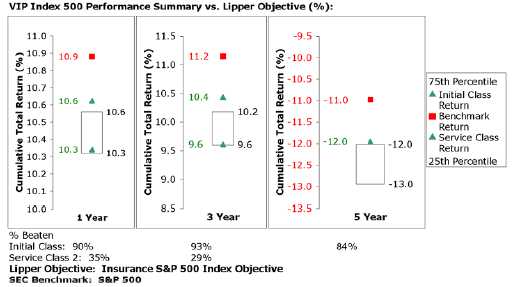
The Board reviewed the fund’s relative investment performance against its Lipper peer group and stated that the performance of the Initial Class of the fund was in the first quartile for the one , three and five year periods. The Board also stated that the relative investment performance of the fund was lower than its benchmark over time, but considered that, unlike the benchmark, the fund has fees and transaction costs. The Board considered that the variations in performance among the fund’s classes reflect the variations in class expenses, which result in lower performance for higher expense classes.
Based on its review, and giving particular weight to the nature and quality of the resources dedicated by the Investment Advisers to maintain and improve relative performance, the Board concluded that the nature, extent, and quality of the services provided by Fidelity will benefit the fund’s shareholders, particularly in light of the Board’s view that the fund’s shareholders benefit from investing in a fund that is part of a large family of funds offering a variety of investment disciplines and services.
Competitiveness of Management Fee and Total Fund Expenses. The Board considered each fund’s management fee and total expenses compared to “mapped groups” of competitive funds and classes. Fidelity creates “mapped groups” by combining similar Lipper investment objective categories that have comparable management fee characteristics. Combining Lipper investment objective categories aids the Board’s management fee and total expense comparisons by broadening the competitive group used for comparison and by reducing the number of universes to which various Fidelity funds are compared.
The Board considered two proprietary management fee comparisons for the 12 month periods shown in the charts below. The group of Lipper funds used by the Board for management fee comparisons is referred to below as the “Total Mapped Group” and, for the reasons explained above, is broader than the Lipper peer group used by the Board for performance comparisons. The Total Mapped Group comparison focuses on a fund’s standing relative to the total universe of comparable funds available to investors, in terms of gross management fees before expense reimbursements or caps. “TMG %” represents the percentage of funds in the Total Mapped Group that had management fees that were lower than a fund’s. For example, a TMG % of 21% would mean that 79% of the funds in the Total Mapped Group had higher management fees than a fund. The “Asset Size Peer Group” (ASPG) compari son focuses on a fund’s standing relative to non Fidelity funds similar in size to the fund within the Total Mapped Group. The ASPG represents at least 15% of the funds in the Total Mapped Group with comparable asset size and management fee characteristics, subject to a minimum of 50 funds (or all funds in the Total Mapped Group if fewer than 50). Additional information, such as the ASPG quartile (“quadrant”) in which a fund’s management fee ranked, is also included in the charts and considered by the Board.
203 Annual Report
Board Approval of Investment Advisory Contracts and Management Fees - continued
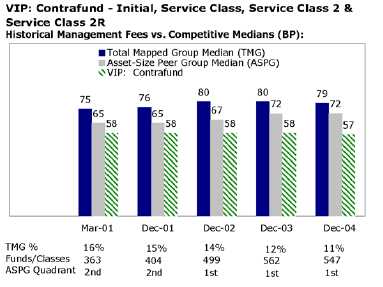
The Board noted that the fund’s management fee ranked below the median of its Total Mapped Group and below the median of its ASPG for 2004.
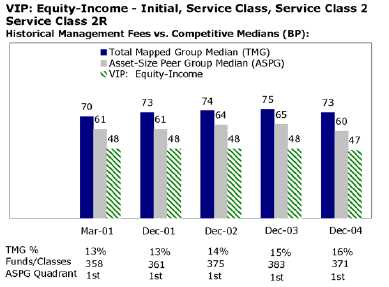
The Board noted that the fund’s management fee ranked below the median of its Total Mapped Group and below the median of its ASPG for 2004.
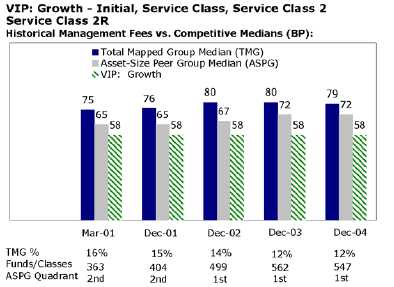
The Board noted that the fund’s management fee ranked below the median of its Total Mapped Group and below the median of its ASPG for 2004.
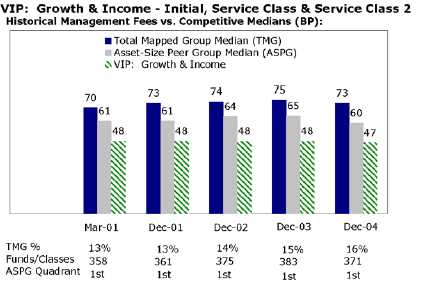
The Board noted that the fund’s management fee ranked below the median of its Total Mapped Group and below the median of its ASPG for 2004.
205 Annual Report
Board Approval of Investment Advisory Contracts and Management Fees - continued

The Board noted that the fund’s management fee ranked below the median of its Total Mapped Group and below the median of its ASPG for 2004.
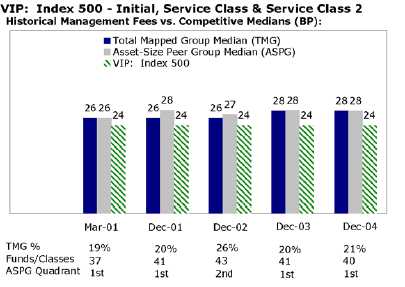
The Board noted that the fund’s management fee ranked below the median of its Total Mapped Group and below the median of its ASPG for 2004.
Furthermore, the Board considered that on February 17, 2005, after the periods shown in the chart above, it had approved an amendment (effective March 1, 2005) to the fund’s management contract that reduced the fund’s management fee from 24 basis points to 10 basis points.

The Board noted that the fund’s management fee ranked below the median of its Total Mapped Group and below the median of its ASPG for 2004.

The Board noted that the fund’s management fee ranked below the median of its Total Mapped Group and below the median of its ASPG for 2004.
Based on its review, the Board concluded that each fund’s management fee was fair and reasonable in light of the services that the fund receives and the other factors considered.
In its review of the total expenses of each class of each fund, the Board considered the fund’s management fee as well as other fund or class expenses, as applicable, such as transfer agent fees, pricing and bookkeeping fees, fund paid 12b 1 fees, and custodial, legal, and audit fees. The Board also noted the effects of any waivers and reimbursements on fees and expenses. As part of its review, the Board also considered current and historical total expenses of each class of each fund compared to competitive fund median expenses. Each class of each fund is compared to those funds and classes in the Total Mapped Group (used by the Board for management fee comparisons) that have a similar sales load structure.
The Board noted that the total expenses of each class of each fund (except VIP Index 500 Portfolio) ranked below its competitive median for 2004.
The Board noted that the total expenses of each of Initial Class and Service Class of VIP Index 500 Portfolio ranked below its competitive median for 2004, and the total expenses of Service Class 2 ranked above its competitive median for 2004. The Board noted that the fund offers multiple classes, each of which has a different 12b 1 fee structure, and that the multiple structures are intended to offer a range of pricing options for the intermediary market. The Board also noted that the total expenses of the classes vary primarily by the level of their 12b 1 fees.
207 Annual Report
Board Approval of Investment Advisory Contracts and Management Fees - continued
Furthermore, the Board considered that on February 17, 2005, it had approved changes (effective March 1, 2005) in the contractual arrangements for VIP Index 500 Portfolio that (i) have the effect of setting the total “fund level” expenses (including, among other expenses, the management fee) at 10 basis points, and (ii) limit the total expenses of the fund’s existing classes of shareholders to 10 basis points for Initial Class, 20 basis points for Service Class, and 35 basis points for Service Class 2. The new contractual expense limits may not be increased without the approval of the Board and the shareholders of the relevant class. The Board considered that, if the new contractual expense limits had been in effect in 2004, the total expenses of Service Class 2 would have ranked below the median.
In its review of total expenses, the Board also considered Fidelity fee structures and other information on clients that FMR and its affiliates service in other competitive markets, such as other mutual funds advised or subadvised by FMR or its affiliates, pension plan clients, and other institutional clients.
Based on its review, the Board concluded that the total expenses for each class of each fund were reasonable, although in one case above the median of the universe presented for comparison, in light of the services that the fund and its shareholders receive and the other factors considered.
Costs of the Services and Profitability. The Board considered the revenues earned and the expenses incurred by Fidelity in conducting the busi ness of developing, marketing, distributing, managing, administering and servicing each fund and its shareholders. The Board also considered the level of Fidelity’s profits in respect of all the Fidelity funds.
On an annual basis, FMR presents to the Board Fidelity’s profitability for each fund. Fidelity calculates the profitability for each fund, as well as aggre gate profitability for groups of Fidelity funds and all Fidelity funds, using a series of detailed revenue and cost allocation methodologies which originate with the audited books and records of Fidelity. The Audit Committee of the Board reviews any significant changes from the prior year’s methodologies.
PricewaterhouseCoopers LLP (PwC), independent registered accounting firm and auditor to Fidelity and certain Fidelity funds, has been engaged annually by the Board as part of the Board’s assessment of the results of Fidelity’s profitability analysis. PwC’s engagement includes the review and assessment of Fidelity’s methodologies used in determining the revenues and expenses attributable to Fidelity’s mutual fund business, and completion of agreed upon procedures surrounding the mathematical accuracy of fund profitability and its conformity to allocation methodologies. After consider ing PwC’s reports issued under the engagement and information provided by Fidelity, the Board believes that while other allocation methods may also be reasonable, Fidelity’s profitability methodologies are reasonable in all material respects.
The Board has also reviewed Fidelity’s non fund businesses and any fall out benefits related to the mutual fund business as well as cases where Fidelity’s affiliates may benefit from or be related to the funds’ business. In addition, a special committee of the Board reviewed services provided to Fidelity by its affiliates and determined that the fees that Fidelity paid for such services were reasonable.
The Board considered the costs of the services provided by and the profits realized by Fidelity in connection with the operation of each fund and determined that the amount of profit is a fair entrepreneurial profit for the management of each fund.
Economies of Scale (except VIP Index 500 Portfolio). The Board considered whether there have been economies of scale in respect of the management of the Fidelity funds, whether the Fidelity funds (including each fund) have appropriately benefited from any such economies of scale, and whether there is potential for realization of any further economies of scale. The Board considered the extent to which each fund will benefit from economies of scale through increased services to the fund, through waivers or reimbursements, or through fee or expense reductions.
The Board recognized that each fund’s management contract incorporates a “group fee” structure, which provides for lower fee rates as total fund assets under FMR’s management increase, and for higher fee rates as total fund assets under FMR’s management decrease. The Board considered that the group fee is designed to deliver the benefits of economies of scale to fund shareholders when total fund assets increase, even if assets of any particu lar fund are unchanged or have declined, because some portion of Fidelity’s costs are attributable to services provided to all Fidelity funds, and all funds benefit if those costs can be allocated among more assets. The Board concluded that, given the group fee structure, fund shareholders will achieve a certain level of economies of scale as assets under FMR’s management increase at the fund complex level, regardless of whether Fidelity achieves any such economies of scale.
The Board further concluded that any potential economies of scale are being shared between fund shareholders and Fidelity in an appropriate manner.
Economies of Scale (VIP Index 500 Portfolio). The Board considered whether there have been economies of scale in respect of the management of the Fidelity funds, whether the Fidelity funds (including the fund) have appropriately benefited from any such economies of scale, and whether there is potential for realization of any further economies of scale. The Board considered the extent to which the fund will benefit from economies of scale through increased services to the fund, through waivers or reimbursements, or through fee or expense reductions.
The Board concluded that any potential economies of scale are being shared between fund shareholders and Fidelity in an appropriate manner.
Additional Information Requested by the Board. In order to develop fully the factual basis for consideration of the Advisory Contracts, the Board requested additional information regarding (i) equity fund transfer agency fees; (ii) Fidelity’s fund profitability methodology and the impact of various
changes in the methodology over time; (iii) benefits to shareholders from economies of scale; (iv) composition and characteristics of various fund and industry data used in comparisons; and (v) compensation of portfolio managers and research analysts.
Based on its evaluation of all of the conclusions noted above, and after considering all material factors, the Board ultimately concluded that the exist ing advisory fee structures are fair and reasonable, and that each fund’s existing Advisory Contracts should be renewed.
209 Annual Report
211 Annual Report
Investment Adviser
Fidelity Management & Research Company
Boston, MA
Investment Sub Advisers
FMR Co., Inc.
Contrafund, Equity-Income, Growth,
Growth & Income, Growth Opportunities,
Index 500, Mid Cap, and Overseas Portfolios
Fidelity Management & Research (U.K.) Inc.
Contrafund, Equity-Income, Growth,
Growth & Income, Growth Opportunities,
Mid Cap, and Overseas Portfolios
Fidelity Management & Research (Far East) Inc.
Contrafund, Equity-Income, Growth,
Growth & Income, Growth Opportunities,
Mid Cap, and Overseas Portfolios
Fidelity International Investment Advisors
Contrafund, Equity-Income, Growth,
Growth & Income, Growth Opportunities,
Mid Cap, and Overseas Portfolios
Fidelity International Investment Advisors (U.K.) Limited
Contrafund, Equity-Income, Growth,
Growth & Income, Growth Opportunities,
Mid Cap, and Overseas Portfolios
Fidelity Investments Japan Limited
Contrafund, Equity-Income, Growth,
Growth & Income, Growth Opportunities,
Mid Cap, and Overseas Portfolios
Geode Capital Management, LLC
Index 500 Portfolio
General Distributor
Fidelity Distributors Corporation
Boston, MA
Transfer and Service Agents
Fidelity Investments Institutional Operations Company, Inc.
Boston, MA
Fidelity Service Company, Inc.
Boston, MA
Custodian
JPMorgan Chase Bank, New York, NY
Growth & Income and Overseas Portfolios
Brown Brothers Harriman & Co., Boston, MA
Contrafund and Mid Cap Portfolios
Mellon Bank, N.A., Pittsburgh, PA
Growth, Growth Opportunities, and Index 500 Portfolios
The Northern Trust Company, Chicago, IL
Equity-Income Portfolio
|
VIPGRP1 ANN 0206
1.768592.104
|
Fidelity® Variable Insurance Products
VIP Asset Manager Portfolio
VIP Asset Manager: Growth® Portfolio
VIP Balanced Portfolio
VIP High Income Portfolio
VIP Investment Grade Bond Portfolio
VIP Money Market Portfolio
|

Annual Report
December 31, 2005
|

| Contents | | | | |
| |
| |
| Shareholder Expense Example | | 4 | | An example of shareholder expenses |
| Asset Manager Portfolio | | 7 | | Performance |
| | | 8 | | Management’s Discussion |
| | | 9 | | Investment Changes |
| | | 10 | | Investments |
| | | 41 | | Financial Statements |
| Asset Manager: Growth Portfolio | | 45 | | Performance |
| | | 46 | | Management’s Discussion |
| | | 47 | | Investment Changes |
| | | 48 | | Investments |
| | | 68 | | Financial Statements |
| Balanced Portfolio | | 72 | | Performance |
| | | 73 | | Management’s Discussion |
| | | 74 | | Investment Changes |
| | | 75 | | Investments |
| | | 110 | | Financial Statements |
| High Income Portfolio | | 114 | | Performance |
| | | 115 | | Management’s Discussion |
| | | 116 | | Investment Changes |
| | | 117 | | Investments |
| | | 132 | | Financial Statements |
| Investment Grade Bond Portfolio | | 138 | | Performance |
| | | 139 | | Management’s Discussion |
| | | 140 | | Investment Changes |
| | | 141 | | Investments |
| | | 163 | | Financial Statements |
| Money Market Portfolio | | 167 | | Performance |
| | | 168 | | Investment Changes |
| | | 169 | | Investments |
| | | 177 | | Financial Statements |
| Notes to Financial Statements | | 182 | | Notes to the Financial Statements |
| Report of Independent Registered | | 194 | | |
| Public Accounting Firm | | | | |
| Trustees and Officers | | 199 | | |
| Distributions | | 206 | | |
| Board Approval of Investment | | 207 | | Board Approval of Investment Advisory Contracts for |
| Advisory Contracts and | | | | Asset Manager Portfolio, Asset Manager: Growth |
| Management Fees | | | | Portfolio, and Balanced Portfolio |
| |
| |
| |
| |
| Annual Report | | | | 2 |
To view a fund’s proxy voting guidelines and proxy voting record for the 12 month period ended June 30, visit www.fidelity.com/proxyvotingresults or visit the
Securities and Exchange Commission’s (SEC) web site at www.sec.gov. You may also call 1-877-208-0098 to request a free copy of the proxy voting guidelines.
Fidelity Variable Insurance Products are separate account options which are purchased through a variable insurance contract.
Standard & Poor’s, S&P and S&P 500 are registered service marks of The McGraw Hill Companies, Inc. and have been licensed for use by Fidelity Distributors
Corporation.
Other third party marks appearing herein are the property of their respective owners.
All other marks appearing herein are registered or unregistered trademarks or service marks of FMR Corp. or an affiliated company.
This report and the financial statements contained herein are submitted for the general information of the shareholders of the funds. This report is not
authorized for distribution to prospective investors in the funds unless preceded or accompanied by an effective prospectus.
A fund files its complete schedule of portfolio holdings with the SEC for the first and third quarters of each fiscal year on Form N-Q. Forms N-Q are available
on the SEC’s web site at http://www.sec.gov. A fund’s Forms N Q may be reviewed and copied at the SEC’s Public Reference Room in Washington, DC. Infor
mation regarding the operation of the SEC’s Public Reference Room may be obtained by calling 1-800-SEC-0330. For a complete list of a fund’s portfolio hold-
ings, view the most recent quarterly holdings report, semiannual report, or annual report on Fidelity’s web site at http://www.advisor.fidelity.com.
NOT FDIC INSURED · MAY LOSE VALUE · NO BANK GUARANTEE
Neither the funds nor Fidelity Distributors Corporation is a bank.
|
3 Annual Report
Shareholder Expense Example
|
As a shareholder of a Fund, you incur two types of costs: (1) transaction costs, including redemption fees, and (2) ongoing costs, including manage ment fees, distribution and/or service (12b 1) fees and other Fund expenses. This Example is intended to help you understand your ongoing costs (in dollars) of investing in the Funds and to compare these costs with the ongoing costs of investing in other mutual funds.
The actual expense Example is based on an investment of $1,000 invested at the beginning of the period and held for the entire period (July 1, 2005 to December 31, 2005) for Initial Class, Service Class, Service Class 2, Initial Class R, Service Class R and Service Class 2R and for the entire period (July 21, 2005 to December 31, 2005) for the Investor Class. The hypothetical expense Example is based on an investment of $1,000 invested for one half year period (July, 1, 2005 to December 31, 2005).
The first line of the table below for each class of each fund provides information about actual account values and actual expenses. You may use the information in this line, together with the amount you invested, to estimate the expenses that you paid over the period. Simply divide your account value by $1,000.00 (for example, an $8,600 account value divided by $1,000.00 = 8.6), then multiply the result by the number in the first line for a class of the fund under the heading entitled “Expenses Paid During Period” to estimate the expenses you paid on your account during this period. The estimate of expenses does not include any fees or other expenses of any variable annuity or variable life insurance product. If they were, the estimate of expenses you paid during the period would be higher, and your ending account value would be lower. In addition, the fund, as a shareholder in the underlying affiliated central funds, will indirectly bear its pro rata share of the fees and expenses incurred by the underlying affiliated central funds. These fees and expenses are not included in the fund’s annualized expense ratio used to calculate the expense estimate in the table below.
Hypothetical Example for Comparison Purposes
|
The second line of the table below for each class of each fund provides information about hypothetical account values and hypothetical expenses based on a Class’ actual expense ratio and an assumed rate of return of 5% per year before expenses, which is not the Class’ actual return. The hypothetical account values and expenses may not be used to estimate the actual ending account balance or expenses you paid for the period. You may use this information to compare the ongoing costs of investing in the Fund and other funds. To do so, compare this 5% hypothetical example with the 5% hypothetical examples that appear in the shareholder reports of the other funds. The estimate of expenses does not include any fees or other expenses of any variable annuity or variable life insurance product. If they were, the estimate of expenses you paid during the period would be higher, and your ending account value would be lower. In addition, the fund, as a shareholder in the underlying affiliated central funds, will indirectly bear its pro rata share of the fees and expenses incurred by the underlying affiliated central funds. These fees and expenses are not included in the fund’s annualized expense ratio used to calculate the expense estimate in the table below.
Please note that the expenses shown in the table are meant to highlight your ongoing costs only and do not reflect any transaction costs. Therefore, the second line of the table is useful in comparing ongoing costs only, and will not help you determine the relative total costs of owning different funds. In addition, if these transactional costs were included, your costs would have been higher.
| | | | | Ending | | | | |
| | | Beginning | | Account Value | | Expenses Paid |
| | | Account Value | | December 31, 2005 | | During Period |
| VIP Asset Manager | | | | | | | | | | |
| Initial Class | | | | | | | | | | |
| Actual | | $ 1,000.00 | | | | $ 1,043.70 | | | | $ 3.30B |
| HypotheticalA | | $ 1,000.00 | | | | $ 1,021.98 | | | | $ 3.26C |
| Service Class | | | | | | | | | | |
| Actual | | $ 1,000.00 | | | | $ 1,043.30 | | | | $ 3.81B |
| HypotheticalA | | $ 1,000.00 | | | | $ 1,021.48 | | | | $ 3.77C |
| Service Class 2 | | | | | | | | | | |
| Actual | | $ 1,000.00 | | | | $ 1,042.90 | | | | $ 4.63B |
| HypotheticalA | | $ 1,000.00 | | | | $ 1,020.67 | | | | $ 4.58C |
| Investor Class | | | | | | | | | | |
| Actual | | $ 1,000.00 | | | | $ 1,027.30 | | | | $ 3.73B |
| HypotheticalA | | $ 1,000.00 | | | | $ 1,021.07 | | | | $ 4.18C |
| VIP Asset Manager: Growth | | | | | | | | | | |
| Initial Class | | | | | | | | | | |
| Actual | | $ 1,000.00 | | | | $ 1,053.60 | | | | $ 3.78B |
| HypotheticalA | | $ 1,000.00 | | | | $ 1,021.53 | | | | $ 3.72C |
| Service Class | | | | | | | | | | |
| Actual | | $ 1,000.00 | | | | $ 1,053.10 | | | | $ 4.30B |
| HypotheticalA | | $ 1,000.00 | | | | $ 1,021.02 | | | | $ 4.23C |
| Service Class 2 | | | | | | | | | | |
| Actual | | $ 1,000.00 | | | | $ 1,050.70 | | | | $ 5.33B |
| HypotheticalA | | $ 1,000.00 | | | | $ 1,020.01 | | | | $ 5.24C |
| Investor Class | | | | | | | | | | |
| Actual | | $ 1,000.00 | | | | $ 1,028.60 | | | | $ 4.38B |
| HypotheticalA | | $ 1,000.00 | | | | $ 1,020.37 | | | | $ 4.89C |
| | | | | Ending | | | | |
| | | Beginning | | Account Value | | Expenses Paid |
| | | Account Value | | December 31, 2005 | | During Period |
| VIP Balanced | | | | | | | | | | |
| Initial Class | | | | | | | | | | |
| Actual | | $ 1,000.00 | | | | $ 1,078.80 | | | | $ 3.04B |
| HypotheticalA | | $ 1,000.00 | | | | $ 1,022.28 | | | | $ 2.96C |
| Service Class | | | | | | | | | | |
| Actual | | $ 1,000.00 | | | | $ 1,078.50 | | | | $ 3.61B |
| HypotheticalA | | $ 1,000.00 | | | | $ 1,021.73 | | | | $ 3.52C |
| Service Class 2 | | | | | | | | | | |
| Actual | | $ 1,000.00 | | | | $ 1,077.40 | | | | $ 4.40B |
| HypotheticalA | | $ 1,000.00 | | | | $ 1,020.97 | | | | $ 4.28C |
| Investor Class | | | | | | | | | | |
| Actual | | $ 1,000.00 | | | | $ 1,058.00 | | | | $ 3.51B |
| HypotheticalA | | $ 1,000.00 | | | | $ 1,021.37 | | | | $ 3.87C |
| VIP High Income | | | | | | | | | | |
| Initial Class | | | | | | | | | | |
| Actual | | $ 1,000.00 | | | | $ 1,029.80 | | | | $ 3.58B |
| HypotheticalA | | $ 1,000.00 | | | | $ 1,021.68 | | | | $ 3.57C |
| Service Class | | | | | | | | | | |
| Actual | | $ 1,000.00 | | | | $ 1,028.90 | | | | $ 4.09B |
| HypotheticalA | | $ 1,000.00 | | | | $ 1,021.17 | | | | $ 4.08C |
| Service Class 2 | | | | | | | | | | |
| Actual | | $ 1,000.00 | | | | $ 1,027.40 | | | | $ 4.85B |
| HypotheticalA | | $ 1,000.00 | | | | $ 1,020.42 | | | | $ 4.84C |
| Initial Class R | | | | | | | | | | |
| Actual | | $ 1,000.00 | | | | $ 1,029.90 | | | | $ 3.58B |
| HypotheticalA | | $ 1,000.00 | | | | $ 1,021.68 | | | | $ 3.57C |
| Service Class R | | | | | | | | | | |
| Actual | | $ 1,000.00 | | | | $ 1,028.90 | | | | $ 4.09B |
| HypotheticalA | | $ 1,000.00 | | | | $ 1,021.17 | | | | $ 4.08C |
| Service Class 2R | | | | | | | | | | |
| Actual | | $ 1,000.00 | | | | $ 1,027.80 | | | | $ 4.80B |
| HypotheticalA | | $ 1,000.00 | | | | $ 1,020.47 | | | | $ 4.79C |
| Investor Class | | | | | | | | | | |
| Actual | | $ 1,000.00 | | | | $ 1,016.00 | | | | $ 3.71B |
| HypotheticalA | | $ 1,000.00 | | | | $ 1,021.07 | | | | $ 4.18C |
| VIP Investment Grade Bond | | | | | | | | | | |
| Initial Class | | | | | | | | | | |
| Actual | | $ 1,000.00 | | | | $ 999.20 | | | | $ 2.22B |
| HypotheticalA | | $ 1,000.00 | | | | $ 1,022.99 | | | | $ 2.24C |
| Service Class | | | | | | | | | | |
| Actual | | $ 1,000.00 | | | | $ 998.40 | | | | $ 2.72B |
| HypotheticalA | | $ 1,000.00 | | | | $ 1,022.48 | | | | $ 2.75C |
| Service Class 2 | | | | | | | | | | |
| Actual | | $ 1,000.00 | | | | $ 997.60 | | | | $ 3.47B |
| HypotheticalA | | $ 1,000.00 | | | | $ 1,021.73 | | | | $ 3.52C |
| Investor Class | | | | | | | | | | |
| Actual | | $ 1,000.00 | | | | $ 1,007.90 | | | | $ 2.21B |
| HypotheticalA | | $ 1,000.00 | | | | $ 1,022.74 | | | | $ 2.50C |
55 Annual Report
| Shareholder Expense Example continued | | | | | | | | | | | | |
| |
| |
| |
| | | | | | | | | Ending | | | | |
| | | | | | | Beginning | | Account Value | | Expenses Paid |
| | | | | | | Account Value | | December 31, 2005 | | During Period |
| VIP Money Market | | | | | | | | | | | | | | |
| Initial Class | | | | | | | | | | | | | | |
| Actual | | | | | | $ 1,000.00 | | | | $ 1,017.80 | | | | $ 1.47B |
| HypotheticalA | | | | | | $ 1,000.00 | | | | $ 1,023.74 | | | | $ 1.48C |
| Service Class | | | | | | | | | | | | | | |
| Actual | | | | | | $ 1,000.00 | | | | $ 1,017.30 | | | | $ 2.03B |
| HypotheticalA | | | | | | $ 1,000.00 | | | | $ 1,023.19 | | | | $ 2.04C |
| Service Class 2 | | | | | | | | | | | | | | |
| Actual | | | | | | $ 1,000.00 | | | | $ 1,016.50 | | | | $ 2.74B |
| HypotheticalA | | | | | | $ 1,000.00 | | | | $ 1,022.48 | | | | $ 2.75C |
| Investor Class | | | | | | | | | | | | | | |
| Actual | | | | | | $ 1,000.00 | | | | $ 1,015.80 | | | | $ 1.63B |
| HypotheticalA | | | | | | $ 1,000.00 | | | | $ 1,023.39 | | | | $ 1.84C |
| | A 5% return per year before expenses
B Actual expenses are equal to each Class’ annualized expense ratio (shown in the table below); multiplied by the average account value over
the period, multiplied by 184/365 (to reflect the one half year period) for Initial Class, Service Class, Service Class 2, Initial Class R, Service
Class R, and Service Class 2R and multiplied by 164/365 (to reflect the period July 21, 2005 to December 31, 2005) for Investor Class. The fees
and expenses of the underlying affiliated central funds in which the funds invest are not included in the funds’ annualized expense ratios.
C Hypothetical expenses are equal to each Class’ annualized expense ratio (shown in the table below); multiplied by the average account
value over the period, multiplied by 184/365 (to reflect the one half year period). The fees and expenses of the underlying affiliated central
funds in which the funds invest are not included in the funds’ annualized expense ratios.
|
| | | Annualized |
| | | Expense Ratio |
| VIP Asset Manager | | |
| Initial Class | | 64% |
| Service Class | | 74% |
| Service Class 2 | | 90% |
| Investor Class | | 82% |
| VIP Asset Manager: Growth | | |
| Initial Class | | 73% |
| Service Class | | 83% |
| Service Class 2 | | 1.03% |
| Investor Class | | 96% |
| VIP Balanced | | |
| Initial Class | | 58% |
| Service Class | | 69% |
| Service Class 2 | | 84% |
| Investor Class | | 76% |
| VIP High Income | | |
| Initial Class | | 70% |
| Service Class | | 80% |
| Service Class 2 | | 95% |
| Initial Class R | | 70% |
| Service Class R | | 80% |
| Service Class 2R | | 94% |
| Investor Class | | 82% |
| VIP Investment Grade Bond | | |
| Initial Class | | 44% |
| Service Class | | 54% |
| Service Class 2 | | 69% |
| Investor Class | | 49% |
| VIP Money Market | | |
| Initial Class | | 29% |
| Service Class | | 40% |
| Service Class 2 | | 54% |
| Investor Class | | 36% |
Annual Report 6
VIP Asset Manager Portfolio
Performance: The Bottom Line
|
Average annual total return reflects the change in the value of an investment, assuming reinvestment of the class’ dividend income and capital gains (the profits earned upon the sale of securities that have grown in value) and assuming a constant rate of performance each year. During periods of reimbursement by Fidelity, a fund’s total return will be greater than it would be had the reimbursement not occurred. Perfor mance numbers are net of all underlying fund operating expenses, but do not include any insurance charges imposed by your insurance company’s separate account. If performance information included the effect of these additional charges, the total returns would have been lower. How a fund did yesterday is no guarantee of how it will do tomorrow.
| Average Annual Total Returns | | | | | | |
| Periods ended December 31, 2005 | | Past 1 | | Past 5 | | Past 10 |
| | | | | year | | years | | years |
| VIP Asset Manager Initial Class | | 4.04% | | 2.52% | | 6.76% |
| VIP Asset Manager Service ClassA | | 3.93% | | 2.42% | | 6.65% |
| VIP Asset Manager Service Class 2B | | 3.85% | | 2.25% | | 6.55% |
| VIP Asset Manager Investor ClassC | | 3.97% | | 2.51% | | 6.76% |
A The initial offering of Service Class shares took place on November 3, 1997. Performance for Service Class shares reflects an asset based distribution fee (12b 1 fee) and
returns prior to November 3, 1997 are those for Initial Class and do not include the effects of Service Class’ 12b 1 fee. Had Service Class shares’ 12b 1 fee been reflected, returns
prior to November 3, 1997 would have been lower.
B The initial offering of Service Class 2 shares took place on January 12, 2000. Performance for Service Class 2 shares reflect an asset based distribution fee (12b 1 fee).
Returns from November 3, 1997 to January 12, 2000 are those of Service Class which reflect a different 12b 1 fee. Service Class 2 returns prior to November 3, 1997 are those
of Initial Class and do not include the effect of a 12b 1 fee. Had Service Class 2’s 12b 1 fee been reflected, returns prior to January 12, 2000 would have been lower.
C The initial offering of Investor Class shares took place on July 21, 2005. Returns prior to July 21, 2005 are those of Initial Class. If Investor Class’s transfer agent fee had
been reflected, returns prior to July 21, 2005 would have been lower.
|
$10,000 Over 10 Years
Let’s say hypothetically that $10,000 was invested in VIP Asset Manager Portfolio Initial Class on December 31, 1995. The chart shows how the value of your investment would have changed, and also shows how the S&P 500 Index performed over the same period.
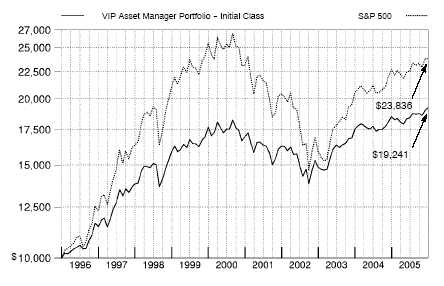
7 Annual Report
VIP Asset Manager Portfolio
Management’s Discussion of Fund Performance
|
Comments from Richard Habermann and Ford O’Neil, Co Managers of VIP Asset Manager Portfolio
U.S. equities outperformed investment grade and high yield debt during the 12 month period ending December 31, 2005, a positive year for all three asset classes. Energy and utilities were the two best performing equity market sectors, and significant contributors to the 4.91% gain of the Standard & Poor’s 500SM Index. Elsewhere, the NASDAQ Composite® Index returned 2.13%, while the Dow Jones Industrial AverageSM rose 1.72% . The investment grade bond market also ended 2005 in the black, marking six consecutive years of gains for the debt category. However, the 2.43% advance of the Lehman Brothers® Aggregate Bond Index was its lowest return in that streak, which reflects the trying investment conditions bonds encountered in the form of higher interest rates and rising inflation. Amid the uncertainty, Treasuries outperformed corporate, agency and mortgage backed debt. High yield also struggled, rising only 2.74% according to the Merrill Lynch® U.S. High Yield Master II Index. Intermittent weakness in the automotive and air transportation industries tempered high yield debt performance.
VIP Asset Manager finished the year ending December 31, 2005, about even with the Fidelity Asset Manager Composite Index, which rose 3.82%, while lagging the LipperSM Variable Annuity Flexible Portfolio Funds Average, which returned 4.88% . (For specific portfolio performance results, please refer to the performance section of this report.) It paid to overweight stocks and high yield securities relative to the index, while underweighting investment grade debt. Within the equity allocation, a modest stake in foreign stocks was a significant positive, while overweighting cash detracted slightly versus the index. Despite a solid showing in the second half of 2005, the fund’s domestic equities trailed the S&P 500® for the year overall and were the biggest drag on relative performance. The subportfolio was hurt by underweighting surging energy and utilities stocks, as well as by fears of a slowdown in consumer spending caused by rapidly rising oil prices. Weak stock picking in banks further detracted, led by an overweighting in mortgage giant Fannie Mae. Other major holdings that disappointed included retailer Home Depot and security software provider Symantec. Conversely, some good picks among health care and consumer related stocks provided most of the upside, led by medical supplier Cardinal Health and pharmacy chain CVS. In fixed income, good sector selection helped our high yield and investment grade holdings comfortably outpace the Lehman Brothers index. The strategic cash portion of the fund topped its benchmark as well.
Note to shareholders: Effective January 17, 2006, Robert Bertelson will assume responsibility for managing the fund’s domestic equity subportfolio.
The views expressed in this statement reflect those of the portfolio managers only through the end of the period of the report as stated on the cover and do not necessarily represent the views of Fidelity or any other person in the Fidelity organization. Any such views are subject to change at any time based upon market or other conditions and Fidelity disclaims any responsibility to update such views. These views may not be relied on as invest ment advice and, because investment decisions for a Fidelity fund are based on numerous factors, may not be relied on as an indication of trading intent on behalf of any Fidelity fund.
VIP Asset Manager Portfolio 8
| VIP Asset Manager Portfolio | | |
| Investment Changes | | |
| |
| |
| Top Five Stocks as of December 31, 2005 |
| | | % of fund’s | | % of fund’s net assets |
| | | net assets | | 6 months ago |
| Cardinal Health, Inc. | | 3.1 | | 2.8 |
| American International Group, | | | | |
| Inc. | | 2.6 | | 2.5 |
| Home Depot, Inc. | | 2.4 | | 2.5 |
| Wyeth | | 2.0 | | 2.0 |
| Microsoft Corp. | | 2.0 | | 2.1 |
| | | 12.1 | | |
Top Five Bond Issuers as of December 31, 2005 |
| (with maturities greater than one | | % of fund’s | | % of fund’s net assets |
| year) | | net assets | | 6 months ago |
| Fannie Mae | | 8.8 | | 9.2 |
| U.S. Treasury Obligations | | 4.7 | | 6.6 |
| Freddie Mac | | 1.0 | | 1.5 |
| Thirteen Affiliates of General | | | | |
| Growth Properties, Inc. | | 0.5 | | 0.5 |
| Government National Mortgage | | | | |
| Association | | 0.3 | | 0.4 |
| | | 15.3 | | |
Top Five Market Sectors as of December 31, 2005 |
| | | % of fund’s | | % of fund’s net assets |
| | | net assets | | 6 months ago |
| Financials | | 13.7 | | 13.6 |
| Consumer Discretionary | | 8.8 | | 8.6 |
| Health Care | | 8.7 | | 9.0 |
| Information Technology | | 8.1 | | 9.0 |
| Industrials | | 5.0 | | 5.2 |
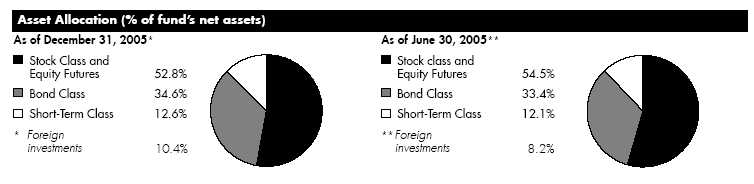
Asset allocations in the pie charts reflect the categorization of assets as defined in the fund’s prospectus in effect as of the time periods indicated above. Financial Statement categorizations conform to accounting standards and will differ from the pie chart. Percentages are adjusted for the effect of futures contracts and swap contracts, if applicable.
The information in the above tables is based on the combined investments of the fund and its pro rata share of the investments of Fidelity’s fixed income central funds.
For an unaudited list of holdings for each fixed income central fund, visit advisor.fidelity.com.
9 Annual Report
| VIP Asset Manager Portfolio | | | | | | | | |
| Investments December 31, 2005 | | | | |
| Showing Percentage of Net Assets | | | | | | | | |
| |
| Common Stocks 47.4% | | | | | | | | |
| | | | | | | | | Shares | | Value (Note 1) |
| |
| CONSUMER DISCRETIONARY 6.3% | | | | | | | | |
| Auto Components – 0.1% | | | | | | | | | | |
| Aisin Seiki Co. Ltd. | | | | | | | | 10,500 | | $ 385,607 |
| NOK Corp. | | | | | | | | 9,900 | | 268,691 |
| Stanley Electric Co. Ltd. | | | | | | | | 45,800 | | 744,655 |
| Tong Yang Industry Co. Ltd. | | | | | | | | 184,000 | | 224,489 |
| | | | | | | | | | | 1,623,442 |
| Automobiles – 0.2% | | | | | | | | | | |
| Harley Davidson, Inc. | | | | | | | | 14,500 | | 746,605 |
| Hyundai Motor Co. | | | | | | | | 11,430 | | 1,103,860 |
| Kia Motors Corp. | | | | | | | | 13,210 | | 348,115 |
| Toyota Motor Corp. | | | | | | | | 45,400 | | 2,374,874 |
| | | | | | | | | | | 4,573,454 |
| Diversified Consumer Services 0.0% | | | | | | | | |
| ABC Learning Centres Ltd. | | | | | | | | 49,863 | | 263,354 |
| Raffles Education Corp. Ltd. | | | | | | | | 426,000 | | 430,368 |
| YBM Sisa.com, Inc. | | | | | | | | 8,869 | | 190,144 |
| | | | | | | | | | | 883,866 |
| Hotels, Restaurants & Leisure 0.4% | | | | | | | | |
| Carnival Corp. unit | | | | | | | | 48,200 | | 2,577,254 |
| Hilton Group PLC | | | | | | | | 152,900 | | 956,823 |
| McDonald’s Corp. | | | | | | | | 92,687 | | 3,125,406 |
| Royal Caribbean Cruises Ltd. | | | | | | | | 26,700 | | 1,203,102 |
| St. Marc Co. Ltd. | | | | | | | | 2,700 | | 188,007 |
| William Hill PLC | | | | | | | | 62,100 | | 572,494 |
| | | | | | | | | | | 8,623,086 |
| Household Durables 0.3% | | | | | | | | | | |
| Barratt Developments PLC | | | | | | | | 29,200 | | 495,655 |
| Casio Computer Co. Ltd. | | | | | | | | 17,000 | | 284,619 |
| Chitaly Holdings Ltd. | | | | | | | | 278,000 | | 133,556 |
| George Wimpey PLC | | | | | | | | 116,800 | | 965,170 |
| Hitachi Koki Co. Ltd. | | | | | | | | 15,000 | | 248,336 |
| HTL International Holdings Ltd. | | | | | | | | 355,000 | | 277,519 |
| Koninklijke Philips Electronics NV | | | | | | 7,700 | | 239,470 |
| Koninklijke Philips Electronics NV | | | | | | | | |
| (NY Shares) | | | | | | | | 45,700 | | 1,421,270 |
| LG Electronics, Inc. | | | | | | | | 4,150 | | 367,836 |
| Matsushita Electric Industrial Co. Ltd. | | | | | | 37,000 | | 717,060 |
| Sony Corp. | | | | | | | | 14,300 | | 583,440 |
| Sumitomo Forestry Co. Ltd. | | | | | | | | 36,000 | | 360,290 |
| Techtronic Industries Co. Ltd. | | | | | | | | 195,000 | | 464,007 |
| Wilson Bowden PLC | | | | | | | | 20,500 | | 511,731 |
| | | | | | | | | | | 7,069,959 |
| Leisure Equipment & Products 0.0% | | | | | | | | |
| Aruze Corp. | | | | | | | | 11,100 | | 228,298 |
| Asia Optical Co., Inc. | | | | | | | | 25,294 | | 173,756 |
| Li Ning Co. Ltd. | | | | | | | | 272,000 | | 192,941 |
| Sankyo Co. Ltd. (Gunma) | | | | | | | | 3,400 | | 196,955 |
| | | | | | | | | | | 791,950 |
See accompanying notes which are an integral part of the financial statements.
| | |
| VIP Asset Manager Portfolio | | 10 |
| | | Shares | | Value (Note 1) |
| Media 2.7% | | | | |
| Bandai Visual Co. Ltd. | | 68 | | $ 257,224 |
| Beijing Media Corp. Ltd. (H Shares) | | 80,000 | | 109,884 |
| CCE Spinco, Inc. (a) | | 172,971 | | 2,265,920 |
| Clear Channel Communications, Inc. | | 1,336,568 | | 42,035,064 |
| Clear Channel Outdoor Holding, Inc. Class A | | 133,000 | | 2,666,650 |
| Cyber Agent Ltd. | | 118 | | 268,216 |
| E.W. Scripps Co. Class A | | 31,069 | | 1,491,933 |
| Fuji Television Network, Inc. | | 116 | | 292,201 |
| ITV PLC | | 838,971 | | 1,624,872 |
| Lagardere S.C.A. (Reg.) | | 14,600 | | 1,123,474 |
| livedoor MARKETING Co. Ltd. (a) | | 1,692 | | 89,404 |
| Macquarie Communications Infrastructure Group unit | | 58,300 | | 242,911 |
| Modern Times Group AB (MTG) | | | | |
| (B Shares) (a) | | 10,850 | | 452,738 |
| News Corp. Class A | | 423,100 | | 6,579,205 |
| Omnicom Group, Inc. | | 87,800 | | 7,474,414 |
| Oricon, Inc. (d) | | 52 | | 70,124 |
| S.M.Entertainment Co. Ltd. | | 23,444 | | 248,983 |
| S.M.Entertainment Co. Ltd. rights 1/12/06 (a) | | 4,266 | | 13,591 |
| Seek Ltd. | | 172,400 | | 381,921 |
| Television Broadcasts Ltd. | | 44,000 | | 233,800 |
| Yedang Entertainment Co. Ltd. (a) | | 21,782 | | 251,871 |
| | | | | 68,174,400 |
| Multiline Retail – 0.0% | | | | |
| Parco Co. Ltd. | | 23,000 | | 264,323 |
| Specialty Retail 2.6% | | | | |
| Esprit Holdings Ltd. | | 133,500 | | 948,695 |
| Hikari Tsushin, Inc. | | 4,000 | | 376,574 |
| Home Depot, Inc. | | 1,456,100 | | 58,942,928 |
| Jeans Mate Corp. | | 13,100 | | 246,101 |
| Osim International Ltd. | | 148,000 | | 141,508 |
| Pertama Holdings Ltd. | | 703,000 | | 141,619 |
| TJX Companies, Inc. | | 202,900 | | 4,713,367 |
| Tsutsumi Jewelry Co. Ltd. | | 6,400 | | 244,264 |
| USS Co. Ltd. | | 3,580 | | 228,333 |
| | | | | 65,983,389 |
| Textiles, Apparel & Luxury Goods 0.0% | | | | |
| Asics Corp. | | 35,000 | | 371,655 |
| Billabong International Ltd. | | 29,500 | | 314,209 |
| Shenzhou International Group Holdings Ltd. | | 206,000 | | 77,048 |
| | | | | 762,912 |
| |
| TOTAL CONSUMER DISCRETIONARY | | | | 158,750,781 |
| |
| CONSUMER STAPLES 4.1% | | | | |
| Beverages 0.2% | | | | |
| Asahi Breweries Ltd. | | 19,100 | | 233,111 |
| C&C Group PLC | | 112,300 | | 717,910 |
See accompanying notes which are an integral part of the financial statements.
|
11 Annual Report
11
| VIP Asset Manager Portfolio | | | | |
| Investments - continued | | | | |
| |
| |
| Common Stocks continued | | | | |
| | | Shares | | Value (Note 1) |
| |
| CONSUMER STAPLES – continued | | | | |
| Beverages – continued | | | | |
| Pernod Ricard SA | | 14,000 | | $ 2,442,993 |
| Takara Holdings, Inc. (d) | | 30,000 | | 178,110 |
| Yantai Changyu Pioneer Wine Co. | | | | |
| (B Shares) | | 122,800 | | 209,691 |
| | | | | 3,781,815 |
| Food & Staples Retailing – 2.8% | | | | |
| Aeon Co. Ltd. | | 15,200 | | 386,752 |
| CVS Corp. | | 822,000 | | 21,717,240 |
| Safeway, Inc. | | 243,800 | | 5,768,308 |
| Valor Co. Ltd. | | 300 | | 11,653 |
| Wal Mart Stores, Inc. | | 877,200 | | 41,052,960 |
| | | | | 68,936,913 |
| Food Products – 0.1% | | | | |
| Binggrea Co. Ltd. | | 4,130 | | 163,355 |
| China Mengniu Dairy Co. Ltd. | | 250,000 | | 212,803 |
| China Sun Bio chem Technology Group Co. Ltd. (a) | | 467,000 | | 129,180 |
| Global Bio Chem Technology Group Co. Ltd. | | 474,000 | | 207,850 |
| Hokuto Corp. | | 4,100 | | 65,062 |
| Orion Corp. | | 3,320 | | 924,328 |
| | | | | 1,702,578 |
| Household Products – 0.1% | | | | |
| Colgate Palmolive Co. | | 58,800 | | 3,225,180 |
| LG Household & Health Care Ltd. | | 4,600 | | 251,117 |
| Uni Charm Corp. | | 3,900 | | 175,311 |
| | | | | 3,651,608 |
| Personal Products 0.3% | | | | |
| Alberto Culver Co. | | 135,550 | | 6,201,413 |
| Avon Products, Inc. | | 44,300 | | 1,264,765 |
| | | | | 7,466,178 |
| Tobacco – 0.6% | | | | |
| Altria Group, Inc. | | 215,800 | | 16,124,576 |
| |
| TOTAL CONSUMER STAPLES | | | | 101,663,668 |
| |
| ENERGY 2.5% | | | | |
| Energy Equipment & Services – 1.5% | | | | |
| Diamond Offshore Drilling, Inc. | | 131,600 | | 9,154,096 |
| ENSCO International, Inc. | | 121,000 | | 5,366,350 |
| Expro International Group PLC | | 34,500 | | 338,543 |
| GlobalSantaFe Corp. | | 201,800 | | 9,716,670 |
| Ocean RIG ASA (a) | | 76,500 | | 1,049,095 |
| Petroleum Geo Services ASA (a) | | 49,850 | | 1,537,234 |
| Transocean, Inc. (a) | | 125,200 | | 8,725,188 |
| WorleyParsons Ltd. | | 43,900 | | 396,095 |
| | | | | 36,283,271 |
| Oil, Gas & Consumable Fuels 1.0% | | | | |
| BG Group PLC | | 143,900 | | 1,423,215 |
See accompanying notes which are an integral part of the financial statements.
| | |
| VIP Asset Manager Portfolio | | 12 |
| | | | | Shares | | Value (Note 1) |
| BowLeven PLC | | | | 27,800 | | $ | | 139,988 |
| CNOOC Ltd. | | | | 559,000 | | | | 379,953 |
| ConocoPhillips | | | | 53,500 | | | | 3,112,630 |
| Cosmo Oil Co. Ltd. | | | | 42,000 | | | | 210,169 |
| ENI Spa | | | | 64,700 | | | | 1,804,613 |
| Exxon Mobil Corp. | | | | 165,800 | | | | 9,312,986 |
| Formosa Petrochemical Corp. | | | | 71,028 | | | | 125,930 |
| Nippon Mining Holdings, Inc. | | | | 51,500 | | | | 366,469 |
| OMV AG | | | | 20,800 | | | | 1,218,892 |
| PetroChina Co. Ltd. (H Shares) | | | | 384,000 | | | | 314,726 |
| Statoil ASA | | | | 108,300 | | | | 2,488,695 |
| Total SA sponsored ADR | | | | 42,400 | | | | 5,359,360 |
| | | | | | | | | 26,257,626 |
| |
| TOTAL ENERGY | | | | | | | | 62,540,897 |
| |
| FINANCIALS 10.9% | | | | | | | | |
| Capital Markets 1.1% | | | | | | | | |
| Credit Suisse Group (Reg.) | | | | 26,442 | | | | 1,347,220 |
| DAB Bank AG | | | | 52,400 | | | | 421,829 |
| E*TRADE Securities Co. Ltd. (d) | | | | 52 | | | | 401,781 |
| Goldman Sachs Group, Inc. | | | | 51,100 | | | | 6,525,981 |
| JAFCO Co. Ltd. | | | | 4,100 | | | | 366,168 |
| kiwoom.com Securities Co. Ltd. | | | | 8,735 | | | | 334,661 |
| Korea Investment Holdings Co. Ltd. | | | | 6,140 | | | | 262,055 |
| Macquarie Bank Ltd. | | | | 11,200 | | | | 559,904 |
| Merrill Lynch & Co., Inc. | | | | 192,900 | | | | 13,065,117 |
| Monex Beans Holdings, Inc. (d) | | | | 198 | | | | 265,332 |
| Morgan Stanley | | | | 29,600 | | | | 1,679,504 |
| Nikko Cordial Corp. | | | | 37,000 | | | | 586,201 |
| Nuveen Investments, Inc. Class A | | | | 37,800 | | | | 1,611,036 |
| SBI Holdings, Inc. (d) | | | | 528 | | | | 357,359 |
| | | | | | | | | 27,784,148 |
| Commercial Banks – 2.2% | | | | | | | | |
| Banca Intesa Spa | | | | 196,020 | | | | 1,038,458 |
| Banco Bilbao Vizcaya Argentaria SA | | | | 60,700 | | | | 1,083,495 |
| Bank of America Corp. | | | | 693,910 | | | | 32,023,947 |
| China Construction Bank Corp. | | | | | | | | |
| (H Shares) | | | | 420,000 | | | | 146,254 |
| Hokuhoku Financial Group, Inc. | | | | 91,000 | | | | 425,266 |
| Kansai Urban Banking Corp. | | | | 65,000 | | | | 337,390 |
| Kookmin Bank | | | | 6,180 | | | | 469,251 |
| Mitsui Trust Holdings, Inc. | | | | 25,000 | | | | 300,242 |
| Mizuho Financial Group, Inc. | | | | 170 | | | | 1,349,561 |
| Nishi Nippon City Bank Ltd. | | | | 44,000 | | | | 262,720 |
| Shinhan Financial Group Co. Ltd. | | | | 6,010 | | | | 244,874 |
| Standard Chartered PLC (United Kingdom) | | | | 80,100 | | | | 1,785,755 |
| Sumitomo Mitsui Financial Group, Inc. | | | | 189 | | | | 2,003,732 |
| Synovus Financial Corp. | | | | 65,500 | | | | 1,769,155 |
| Tokyo Tomin Bank Ltd. | | | | 6,200 | | | | 241,890 |
| Unicredito Italiano Spa | | | | 320,000 | | | | 2,203,666 |
| Wachovia Corp. | | | | 184,074 | | | | 9,730,140 |
| |
| |
See accompanying notes which are an integral part of the financial statements.
| | | | | | | | |
| | | 13 | | | | Annual Report |
13
| VIP Asset Manager Portfolio | | | | |
| Investments - continued | | | | |
| |
| |
| Common Stocks continued | | | | |
| | | Shares | | Value (Note 1) |
| |
| FINANCIALS – continued | | | | |
| Commercial Banks – continued | | | | |
| Wells Fargo & Co. | | 6,100 | | $ 383,263 |
| Woori Finance Holdings Co. Ltd. | | 14,230 | | 283,894 |
| | | | | 56,082,953 |
| Consumer Finance – 0.3% | | | | |
| Capital One Financial Corp. | | 19,800 | | 1,710,720 |
| Credit Saison Co. Ltd. | | 14,000 | | 699,377 |
| MBNA Corp. | | 68,400 | | 1,857,060 |
| Nissin Co. Ltd. | | 230,500 | | 564,985 |
| ORIX Corp. | | 3,600 | | 917,518 |
| SFCG Co. Ltd. | | 2,100 | | 507,612 |
| UCS Co. Ltd. | | 2,500 | | 157,966 |
| | | | | 6,415,238 |
| Diversified Financial Services – 0.9% | | | | |
| Banca Italease Spa | | 66,000 | | 1,687,697 |
| Citigroup, Inc. | | 338,600 | | 16,432,258 |
| Deutsche Boerse AG | | 6,794 | | 696,209 |
| ING Groep NV (Certificaten Van Aandelen) | | 47,700 | | 1,660,914 |
| OMX AB (a)(d) | | 125,600 | | 1,746,970 |
| Singapore Exchange Ltd. | | 99,000 | | 172,645 |
| | | | | 22,396,693 |
| Insurance – 5.5% | | | | |
| ACE Ltd. | | 178,800 | | 9,555,072 |
| AFLAC, Inc. | | 19,300 | | 895,906 |
| AMBAC Financial Group, Inc. | | 87,700 | | 6,758,162 |
| American International Group, Inc. | | 955,400 | | 65,186,942 |
| Amlin PLC | | 228,100 | | 975,824 |
| Amlin PLC (RFD) (a) | | 72,577 | | 293,621 |
| AMP Ltd. | | 36,300 | | 204,768 |
| AXA SA | | 32,500 | | 1,050,725 |
| Baloise Holdings AG (Reg.) | | 8,259 | | 482,404 |
| Benfield Group PLC | | 357,300 | | 2,214,395 |
| Chaucer Holdings PLC | | 1,959,700 | | 2,032,667 |
| Hartford Financial Services Group, Inc. | | 240,700 | | 20,673,723 |
| MBIA, Inc. | | 89,000 | | 5,354,240 |
| MetLife, Inc. | | 137,000 | | 6,713,000 |
| Ping An Insurance (Group) Co. of China, Ltd. (H Shares) | | 125,000 | | 230,537 |
| Prudential PLC | | 156,700 | | 1,483,718 |
| QBE Insurance Group Ltd. | | 30,635 | | 440,457 |
| Skandia Foersaekrings AB | | 175,800 | | 1,053,317 |
| Sompo Japan Insurance, Inc | | 63,000 | | 852,254 |
| Swiss Reinsurance Co. (Reg.) | | 39,045 | | 2,858,546 |
| T&D Holdings, Inc. | | 10,750 | | 712,989 |
| The Chubb Corp. | | 68,296 | | 6,669,104 |
| Transatlantic Holdings, Inc. | | 12,900 | | 866,880 |
| | | | | 137,559,251 |
| Real Estate 0.2% | | | | |
| British Land Co. PLC | | 79,800 | | 1,464,467 |
| CapitaLand Ltd. | | 137,000 | | 283,400 |
See accompanying notes which are an integral part of the financial statements.
| | |
| VIP Asset Manager Portfolio | | 14 |
| | | Shares | | Value (Note 1) |
| China Overseas Land & Investment Ltd. | | 718,000 | | $ 307,900 |
| Keihanshin Real Estate Co. Ltd. | | 4,000 | | 37,149 |
| KK daVinci Advisors (a) | | 52 | | 392,078 |
| Shun Tak Holdings Ltd. | | 344,000 | | 317,218 |
| Sumitomo Realty & Development Co. Ltd. | | 41,000 | | 891,947 |
| Toc Co. Ltd. | | 25,000 | | 172,173 |
| Urban Corp. | | 5,400 | | 583,487 |
| Wharf Holdings Ltd. | | 65,000 | | 229,698 |
| | | | | 4,679,517 |
| Thrifts & Mortgage Finance – 0.7% | | | | |
| Fannie Mae | | 298,900 | | 14,589,309 |
| MGIC Investment Corp. | | 30,700 | | 2,020,674 |
| | | | | 16,609,983 |
| |
| TOTAL FINANCIALS | | | | 271,527,783 |
| |
| HEALTH CARE 8.3% | | | | |
| Biotechnology – 0.0% | | | | |
| Actelion Ltd. (Reg.) (a) | | 11,204 | | 926,845 |
| Health Care Equipment & Supplies 0.1% | | | | |
| Axis Shield PLC (a) | | 83,100 | | 434,905 |
| Cochlear Ltd. | | 5,500 | | 184,499 |
| Miraca Holdings, Inc. | | 12,000 | | 261,567 |
| Phonak Holding AG | | 1,593 | | 68,618 |
| Pihsiang Machinery Manufacturing Co. | | 36,360 | | 55,714 |
| ResMed, Inc. CHESS Depositary Interests (a) | | 45,800 | | 176,382 |
| Sysmex Corp. | | 4,600 | | 175,565 |
| Terumo Corp. | | 7,700 | | 227,921 |
| | | | | 1,585,171 |
| Health Care Providers & Services 3.4% | | | | |
| Cardinal Health, Inc. | | 1,137,300 | | 78,189,369 |
| Sonic Healthcare Ltd. | | 24,400 | | 264,900 |
| UnitedHealth Group, Inc. | | 124,500 | | 7,736,430 |
| | | | | 86,190,699 |
| Pharmaceuticals 4.8% | | | | |
| Astellas Pharma, Inc. | | 13,300 | | 518,892 |
| AstraZeneca PLC sponsored ADR | | 42,100 | | 2,046,060 |
| Chugai Pharmaceutical Co. Ltd. | | 9,400 | | 201,705 |
| Eisai Co. Ltd. | | 6,500 | | 272,889 |
| GlaxoSmithKline PLC | | 73,900 | | 1,865,236 |
| GlaxoSmithKline PLC sponsored ADR | | 18,800 | | 949,024 |
| Johnson & Johnson | | 461,800 | | 27,754,180 |
| Novartis AG: | | | | |
| (Reg.) | | 57,136 | | 2,998,497 |
| sponsored ADR | | 9,300 | | 488,064 |
| Pfizer, Inc. | | 1,348,200 | | 31,440,024 |
| Sanofi Aventis sponsored ADR | | 33,100 | | 1,453,090 |
| Takeda Pharamaceutical Co. Ltd. | | 8,500 | | 459,947 |
See accompanying notes which are an integral part of the financial statements.
|
15 Annual Report
15
| VIP Asset Manager Portfolio | | | | |
| Investments - continued | | | | |
| |
| |
| Common Stocks continued | | | | |
| | | Shares | | Value (Note 1) |
| |
| HEALTH CARE continued | | | | |
| Pharmaceuticals – continued | | | | |
| Tong Ren Tang Technologies Co. Ltd. | | | | |
| (H Shares) | | 65,000 | | $ 112,334 |
| Wyeth | | 1,057,800 | | 48,732,846 |
| | | | | 119,292,788 |
| |
| TOTAL HEALTH CARE | | | | 207,995,503 |
| |
| INDUSTRIALS – 3.8% | | | | |
| Aerospace & Defense – 0.7% | | | | |
| BAE Systems PLC | | 422,900 | | 2,779,306 |
| Honeywell International, Inc. | | 145,100 | | 5,404,975 |
| Lockheed Martin Corp. | | 64,500 | | 4,104,135 |
| United Technologies Corp. | | 82,300 | | 4,601,393 |
| | | | | 16,889,809 |
| Building Products – 0.0% | | | | |
| Daikin Industries Ltd. | | 9,700 | | 283,830 |
| Commercial Services & Supplies 0.0% | | | | |
| Citiraya Industries Ltd. (a) | | 181,000 | | 1 |
| Downer EDI Ltd. | | 87,918 | | 463,054 |
| PMP Ltd. (a) | | 103,600 | | 117,793 |
| S1 Corp. | | 3,210 | | 139,551 |
| Taiwan Secom Co. | | 124,540 | | 191,591 |
| | | | | 911,990 |
| Construction & Engineering – 0.1% | | | | |
| Bilfinger Berger AG | | 11,400 | | 543,884 |
| Chiyoda Corp. | | 19,000 | | 436,708 |
| Commuture Corp. | | 23,000 | | 238,378 |
| Doosan Heavy Industries & Construction Co. Ltd. | | 13,540 | | 510,018 |
| Hyundai Engineering & Construction Co. Ltd. (a) | | 10,200 | | 457,102 |
| Keangnam Enterprises (a) | | 11,370 | | 152,917 |
| PYI Corp. Ltd. | | 1,690,871 | | 320,569 |
| United Group Ltd. | | 40,582 | | 343,533 |
| | | | | 3,003,109 |
| Electrical Equipment 0.0% | | | | |
| Shanghai Electric (Group) Corp. | | | | |
| (H Shares) | | 666,000 | | 227,622 |
| Sumitomo Electric Industries Ltd. | | 38,200 | | 580,266 |
| | | | | 807,888 |
| Industrial Conglomerates 2.2% | | | | |
| 3M Co. | | 201,400 | | 15,608,500 |
| General Electric Co. | | 885,300 | | 31,029,765 |
| Hutchison Whampoa Ltd. | | 40,000 | | 380,982 |
| Keppel Corp. Ltd. | | 51,000 | | 337,352 |
| Shanghai Industrial Holdings Ltd. Class H | | 74,000 | | 154,134 |
| Tyco International Ltd. | | 261,700 | | 7,552,662 |
| | | | | 55,063,395 |
| Machinery – 0.5% | | | | |
| Aida Engineering Ltd. | | 34,000 | | 271,931 |
See accompanying notes which are an integral part of the financial statements.
| | |
| VIP Asset Manager Portfolio | | 16 |
| | | | | Shares | | Value (Note 1) |
| Bradken Ltd. | | | | 120,256 | | $ | | 388,141 |
| Ingersoll Rand Co. Ltd. Class A | | | | 204,200 | | | | 8,243,554 |
| Kitz Corp. | | | | 35,000 | | | | 304,567 |
| Kurita Water Industries Ltd. | | | | 12,500 | | | | 238,009 |
| MAN AG | | | | 21,000 | | | | 1,120,727 |
| Metso Corp. | | | | 45,600 | | | | 1,248,100 |
| Nabtesco Corp. | | | | 30,000 | | | | 386,498 |
| Nittoku Engineering Co. Ltd. | | | | 13,500 | | | | 171,748 |
| Sumitomo Heavy Industries Ltd. | | | | 41,000 | | | | 344,260 |
| TSM Tech Co. Ltd. | | | | 17,877 | | | | 255,513 |
| Weichai Power Co. Ltd. (H Shares) | | | | 68,000 | | | | 114,888 |
| | | | | | | | | 13,087,936 |
| Marine – 0.0% | | | | | | | | |
| Alexander & Baldwin, Inc. | | | | 5,063 | | | | 274,617 |
| Road & Rail 0.1% | | | | | | | | |
| Burlington Northern Santa Fe Corp. | | | | 9,500 | | | | 672,790 |
| East Japan Railway Co | | | | 79 | | | | 543,395 |
| Hamakyorex Co. Ltd. | | | | 17,400 | | | | 833,807 |
| | | | | | | | | 2,049,992 |
| Trading Companies & Distributors – 0.1% | | | | | | | | |
| Mitsubishi Corp. | | | | 38,000 | | | | 841,186 |
| Mitsui & Co. Ltd. | | | | 64,000 | | | | 822,357 |
| | | | | | | | | 1,663,543 |
| Transportation Infrastructure – 0.1% | | | | | | | | |
| ConnectEast Group unit | | | | 462,033 | | | | 388,068 |
| Kamigumi Co. Ltd. | | | | 22,000 | | | | 195,361 |
| Macquarie Airports unit | | | | 82,348 | | | | 191,488 |
| Macquarie Infrastructure Group unit | | | | 236,758 | | | | 618,279 |
| The Sumitomo Warehouse Co. Ltd. | | | | 25,000 | | | | 215,216 |
| | | | | | | | | 1,608,412 |
| |
| TOTAL INDUSTRIALS | | | | | | | | 95,644,521 |
| |
| INFORMATION TECHNOLOGY 7.4% | | | | | | | | |
| Communications Equipment – 1.2% | | | | | | | | |
| Cisco Systems, Inc. (a) | | | | 1,163,500 | | | | 19,919,120 |
| Comverse Technology, Inc. (a) | | | | 57,900 | | | | 1,539,561 |
| Lightron Fiber Optic Devices, Inc. | | | | 11,600 | | | | 73,687 |
| Motorola, Inc. | | | | 31,500 | | | | 711,585 |
| Nokia Corp. sponsored ADR | | | | 357,400 | | | | 6,540,420 |
| TANDBERG Television ASA (a) | | | | 72,800 | | | | 963,277 |
| | | | | | | | | 29,747,650 |
| Computers & Peripherals 1.1% | | | | | | | | |
| Acer, Inc. | | | | 116,600 | | | | 293,041 |
| Dell, Inc. (a) | | | | 366,800 | | | | 11,000,332 |
| EMC Corp. (a) | | | | 138,900 | | | | 1,891,818 |
| Fujitsu Ltd. | | | | 81,000 | | | | 616,920 |
| GES International Ltd. | | | | 287,000 | | | | 160,504 |
| Hanny Holdings Ltd. | | | | 246,312 | | | | 119,127 |
| International Business Machines Corp. | | | | 157,500 | | | | 12,946,500 |
| NEC Corp. | | | | 78,000 | | | | 485,577 |
| | | | | | | | | 27,513,819 |
| |
See accompanying notes which are an integral part of the financial statements.
| | | | | | | | |
| | | 17 | | | | Annual Report |
17
| VIP Asset Manager Portfolio | | | | |
| Investments - continued | | | | |
| |
| |
| Common Stocks continued | | | | |
| | | Shares | | Value (Note 1) |
| |
| INFORMATION TECHNOLOGY – continued | | | | |
| Electronic Equipment & Instruments – 0.3% | | | | |
| Flextronics International Ltd. (a) | | 151,800 | | $ 1,584,792 |
| Hamamatsu Photonics KK | | 3,200 | | 93,906 |
| Hon Hai Precision Industry Co. Ltd. (Foxconn) | | 91,149 | | 499,802 |
| Horiba Ltd. | | 6,000 | | 173,021 |
| Hoya Corp. | | 12,400 | | 445,918 |
| Jabil Circuit, Inc. (a) | | 23,200 | | 860,488 |
| KH Vatec Co. Ltd. | | 6,747 | | 220,324 |
| Kingboard Chemical Holdings Ltd. | | 135,500 | | 366,988 |
| Kinsus Interconnect Technology Corp. | | 60,000 | | 207,454 |
| Nidec Corp. | | 3,700 | | 314,753 |
| Nippon Chemi con Corp. | | 49,000 | | 302,549 |
| Nippon Electric Glass Co. Ltd. | | 59,000 | | 1,288,537 |
| Optimax Technology Corp. | | 62,727 | | 107,200 |
| Phoenix Precision Technology Corp. | | 118,000 | | 309,140 |
| SFA Engineering Corp. | | 17,800 | | 448,754 |
| Yageo Corp. (a) | | 478,000 | | 203,860 |
| Yaskawa Electric Corp. (a) | | 34,000 | | 343,158 |
| | | | | 7,770,644 |
| Internet Software & Services 0.2% | | | | |
| 3Soft, Inc. (a) | | 19,272 | | 246,758 |
| CDNetworks Co. Ltd. | | 12,600 | | 350,174 |
| Dip Corp. (a)(d) | | 51 | | 83,050 |
| Index Corp. | | 208 | | 377,524 |
| livedoor Co. Ltd. (a) | | 48,572 | | 302,790 |
| NHN Corp. (a) | | 4,578 | | 1,226,859 |
| Softbank Corp. | | 23,400 | | 988,355 |
| Telewave, Inc. | | 33 | | 245,460 |
| Yahoo! Japan Corp | | 418 | | 634,596 |
| | | | | 4,455,566 |
| IT Services 0.1% | | | | |
| Computershare Ltd. | | 113,300 | | 564,325 |
| First Data Corp. | | 46,800 | | 2,012,868 |
| | | | | 2,577,193 |
| Office Electronics – 0.0% | | | | |
| Konica Minolta Holdings, Inc. | | 38,000 | | 387,074 |
| Semiconductors & Semiconductor Equipment – 1.5% | | | | |
| Advanced Semiconductor Engineering, Inc. | | 295,000 | | 270,498 |
| Analog Devices, Inc. | | 36,800 | | 1,320,016 |
| Applied Materials, Inc. | | 409,600 | | 7,348,224 |
| ASM Pacific Technology Ltd. | | 29,500 | | 166,454 |
| Chipbond Technology Corp. | | 153,760 | | 250,595 |
| Core Logic, Inc. | | 5,186 | | 231,890 |
| Holtek Semiconductor, Inc. | | 109,196 | | 154,015 |
| Intel Corp. | | 644,800 | | 16,094,208 |
| KLA Tencor Corp. | | 52,000 | | 2,565,160 |
| Lam Research Corp. (a) | | 78,200 | | 2,790,176 |
| Linear Technology Corp. | | 21,100 | | 761,077 |
See accompanying notes which are an integral part of the financial statements.
| | |
| VIP Asset Manager Portfolio | | 18 |
| | | | | Shares | | Value (Note 1) |
| MediaTek, Inc. | | | | 27,600 | | $ | | 325,383 |
| Novellus Systems, Inc. (a) | | | | 49,300 | | | | 1,189,116 |
| Phoenix PDE Co. Ltd. | | | | 55,867 | | | | 302,209 |
| Samsung Electronics Co. Ltd. | | | | 1,800 | | | | 1,177,370 |
| Solomon Systech Ltd. | | | | 598,000 | | | | 248,728 |
| Taiwan Semiconductor Manufacturing Co. Ltd. sponsored ADR | | | | 160,145 | | | | 1,587,032 |
| Xilinx, Inc. | | | | 14,400 | | | | 363,024 |
| | | | | | | | | 37,145,175 |
| Software 3.0% | | | | | | | | |
| Aplix Corp. (a) | | | | 15 | | | | 185,743 |
| BEA Systems, Inc. (a) | | | | 320,900 | | | | 3,016,460 |
| Intelligent Wave, Inc. | | | | 144 | | | | 585,013 |
| KOEI Co. Ltd. | | | | 7,730 | | | | 214,385 |
| Microsoft Corp. | | | | 1,859,492 | | | | 48,625,716 |
| Oracle Corp. (a) | | | | 556,200 | | | | 6,791,202 |
| SAP AG | | | | 5,500 | | | | 991,540 |
| Springsoft, Inc. | | | | 113,362 | | | | 185,791 |
| Symantec Corp. (a) | | | | 787,522 | | | | 13,781,635 |
| Trend Micro, Inc. | | | | 11,500 | | | | 435,011 |
| | | | | | | | | 74,812,496 |
| |
| TOTAL INFORMATION TECHNOLOGY | | | | | | 184,409,617 |
| |
| MATERIALS 0.7% | | | | | | | | |
| Chemicals 0.6% | | | | | | | | |
| BASF AG | | | | 49,400 | | | | 3,778,112 |
| Bayer AG | | | | 80,400 | | | | 3,357,504 |
| Ise Chemical Corp. | | | | 35,000 | | | | 198,889 |
| JSR Corp. | | | | 14,700 | | | | 386,498 |
| Nitto Denko Corp. | | | | 8,600 | | | | 670,319 |
| Praxair, Inc. | | | | 64,700 | | | | 3,426,512 |
| Syngenta AG (Switzerland) | | | | 18,435 | | | | 2,296,079 |
| Teijin Ltd | | | | 58,000 | | | | 368,449 |
| | | | | | | | | 14,482,362 |
| Containers & Packaging – 0.0% | | | | | | | | |
| Vision Grande Group Holdings Ltd. | | | | 172,000 | | | | 110,361 |
| Metals & Mining – 0.1% | | | | | | | | |
| BHP Billiton Ltd. | | | | 80,800 | | | | 1,350,168 |
| Hitachi Metals Ltd. | | | | 17,000 | | | | 185,709 |
| Newcrest Mining Ltd. | | | | 25,800 | | | | 459,892 |
| | | | | | | | | 1,995,769 |
| |
| TOTAL MATERIALS | | | | | | | | 16,588,492 |
| |
| TELECOMMUNICATION SERVICES 3.3% | | | | | | | | |
| Diversified Telecommunication Services – 3.0% | | | | | | | | |
| AT&T, Inc. | | | | 1,903,900 | | | | 46,626,511 |
| BellSouth Corp. | | | | 362,100 | | | | 9,812,910 |
| Completel Europe NV (a) | | | | 19,556 | | | | 1,025,606 |
| FASTWEB Spa (a) | | | | 40,400 | | | | 1,847,578 |
| Qwest Communications International, Inc. (a) | | | | 1,219,400 | | | | 6,889,610 |
| |
| |
See accompanying notes which are an integral part of the financial statements.
| | | | | | | | |
| | | 19 | | | | Annual Report |
19
| VIP Asset Manager Portfolio | | | | |
| Investments - continued | | | | |
| |
| |
| Common Stocks continued | | | | |
| | | | | Shares | | Value (Note 1) |
| |
| TELECOMMUNICATION SERVICES continued | | | | |
| Diversified Telecommunication Services – continued | | | | |
| Telefonica SA sponsored ADR | | | | 33,560 | | $ 1,510,871 |
| Verizon Communications, Inc. | | | | 195,000 | | 5,873,400 |
| | | | | | | 73,586,486 |
| Wireless Telecommunication Services – 0.3% | | | | |
| Millicom International Cellular SA unit (a) | | 122,800 | | 3,315,577 |
| Sprint Nextel Corp. | | | | 140,501 | | 3,282,103 |
| Vodafone Group PLC | | | | 676,600 | | 1,452,658 |
| | | | | | | 8,050,338 |
| |
| TOTAL TELECOMMUNICATION SERVICES | | | | 81,636,824 |
| |
| UTILITIES 0.1% | | | | | | |
| Electric Utilities – 0.1% | | | | | | |
| E.ON AG | | | | 21,400 | | 2,216,184 |
| Gas Utilities 0.0% | | | | | | |
| Hong Kong & China Gas Co. Ltd. | | | | 121,000 | | 258,272 |
| Xinao Gas Holdings Ltd. | | | | 254,000 | | 201,466 |
| | | | | | | 459,738 |
| |
| TOTAL UTILITIES | | | | | | 2,675,922 |
| |
| TOTAL COMMON STOCKS | | | | | | |
| (Cost $1,009,948,134) | | | | 1,183,434,008 |
| |
| Preferred Stocks 0.0% | | | | | | |
| |
| Convertible Preferred Stocks 0.0% | | | | |
| |
| TELECOMMUNICATION SERVICES | | 0.0% | | | | |
| Diversified Telecommunication Services – 0.0% | | | | |
| Cincinnati Bell, Inc. Series B, 6.75% | | | | 7,700 | | 292,985 |
| Nonconvertible Preferred Stocks 0.0% | | | | |
| |
| CONSUMER DISCRETIONARY 0.0% | | | | |
| Automobiles – 0.0% | | | | | | |
| Porsche AG (non vtg.) | | | | 1,110 | | 797,603 |
| TOTAL PREFERRED STOCKS | | | | | | |
| (Cost $911,684) | | | | | | 1,090,588 |
| |
| Corporate Bonds 4.9% | | | | | | |
| | | | | Principal | | |
| | | | | Amount | | |
| Convertible Bonds 0.2% | | | | | | |
| |
| TELECOMMUNICATION SERVICES 0.2% | | | | |
| Diversified Telecommunication Services – 0.2% | | | | |
| Qwest Communications International, Inc. 3.5% 11/15/25 | | $ 3,350,000 | | 3,883,655 |
See accompanying notes which are an integral part of the financial statements.
| | |
| VIP Asset Manager Portfolio | | 20 |
| | | Principal | | Value |
| | | Amount | | (Note 1) |
| Nonconvertible Bonds – 4.7% | | | | |
| |
| CONSUMER DISCRETIONARY 0.5% | | | | |
| Automobiles – 0.1% | | | | |
| Ford Motor Co.: | | | | |
| 6.625% 10/1/28 | | $ 300,000 | | $ 193,500 |
| 7.45% 7/16/31 | | 2,010,000 | | 1,366,800 |
| General Motors Corp. 8.375% 7/15/33 | | 3,290,000 | | 2,171,400 |
| | | | | 3,731,700 |
| Media 0.3% | | | | |
| AOL Time Warner, Inc.: | | | | |
| 6.875% 5/1/12 | | 215,000 | | 228,863 |
| 7.625% 4/15/31 | | 500,000 | | 556,825 |
| Cox Communications, Inc. 7.125% 10/1/12 | | 820,000 | | 878,610 |
| Liberty Media Corp. 8.25% 2/1/30 | | 1,805,000 | | 1,768,640 |
| News America Holdings, Inc. 7.75% 12/1/45 | | 595,000 | | 682,129 |
| News America, Inc. 6.2% 12/15/34 | | 1,155,000 | | 1,147,262 |
| Time Warner Entertainment Co. LP 8.375% 7/15/33 | | 1,000,000 | | 1,181,258 |
| Time Warner, Inc. 6.625% 5/15/29 | | 1,500,000 | | 1,497,893 |
| | | | | 7,941,480 |
| Multiline Retail – 0.1% | | | | |
| The May Department Stores Co. 6.7% 7/15/34 | | 1,160,000 | | 1,235,508 |
| |
| TOTAL CONSUMER DISCRETIONARY | | | | 12,908,688 |
| |
| CONSUMER STAPLES 0.1% | | | | |
| Beverages 0.0% | | | | |
| FBG Finance Ltd. 5.125% 6/15/15 (e) | | 795,000 | | 773,467 |
| Food Products – 0.1% | | | | |
| H.J. Heinz Co. 6.428% 12/1/08 (e)(j) | | 880,000 | | 903,998 |
| Tobacco – 0.0% | | | | |
| Altria Group, Inc. 7% 11/4/13 | | 380,000 | | 415,812 |
| |
| TOTAL CONSUMER STAPLES | | | | 2,093,277 |
| |
| ENERGY 0.7% | | | | |
| Energy Equipment & Services – 0.1% | | | | |
| Petronas Capital Ltd. 7% 5/22/12 (e) | | 1,365,000 | | 1,502,615 |
| Oil, Gas & Consumable Fuels 0.6% | | | | |
| Amerada Hess Corp. 6.65% 8/15/11 | | 285,000 | | 306,247 |
| Duke Capital LLC: | | | | |
| 4.37% 3/1/09 | | 3,175,000 | | 3,098,991 |
See accompanying notes which are an integral part of the financial statements.
|
21 Annual Report
21
| VIP Asset Manager Portfolio | | | | |
| Investments - continued | | | | |
| |
| |
| Corporate Bonds continued | | | | |
| | | Principal | | Value |
| | | Amount | | (Note 1) |
| Nonconvertible Bonds – continued | | | | |
| |
| ENERGY – continued | | | | |
| Oil, Gas & Consumable Fuels – continued | | | | |
| Duke Capital LLC: – continued | | | | |
| 6.75% 2/15/32 | | $ 100,000 | | $ 108,825 |
| Empresa Nacional de Petroleo 6.75% 11/15/12 (e) | | 940,000 | | 1,012,098 |
| EnCana Holdings Finance Corp. 5.8% 5/1/14 | | 525,000 | | 547,241 |
| Enterprise Products Operating LP 5.75% 3/1/35 | | 700,000 | | 643,614 |
| Kinder Morgan Energy Partners LP: | | | | |
| 5.125% 11/15/14 | | 400,000 | | 391,206 |
| 5.8% 3/15/35 | | 600,000 | | 573,963 |
| Nexen, Inc. 5.875% 3/10/35 | | 1,140,000 | | 1,120,984 |
| Pemex Project Funding Master Trust: | | | | |
| 6.125% 8/15/08 | | 2,770,000 | | 2,825,400 |
| 6.625% 6/15/35 (e) | | 1,470,000 | | 1,473,675 |
| 7.875% 2/1/09 (j) | | 3,000,000 | | 3,208,500 |
| | | | | 15,310,744 |
| |
| TOTAL ENERGY | | | | 16,813,359 |
| |
| FINANCIALS – 1.9% | | | | |
| Capital Markets 0.3% | | | | |
| Goldman Sachs Group, Inc. 6.6% 1/15/12 | | 4,075,000 | | 4,377,320 |
| Lazard Group LLC 7.125% 5/15/15 | | 1,165,000 | | 1,223,355 |
| Merrill Lynch & Co., Inc. 4.25% 2/8/10 | | 1,710,000 | | 1,663,358 |
| Morgan Stanley 6.6% 4/1/12 | | 1,750,000 | | 1,881,019 |
| | | | | 9,145,052 |
| Commercial Banks – 0.2% | | | | |
| Bank of America Corp. 7.4% 1/15/11 | | 1,165,000 | | 1,283,275 |
| Korea Development Bank 3.875% 3/2/09 | | 2,000,000 | | 1,935,078 |
| Wachovia Bank NA 4.875% 2/1/15 | | 580,000 | | 565,626 |
| Wachovia Corp. 4.875% 2/15/14 | | 735,000 | | 719,315 |
| | | | | 4,503,294 |
| Consumer Finance – 0.3% | | | | |
| Capital One Financial Corp.: | | | | |
| 4.8% 2/21/12 | | 400,000 | | 388,086 |
| 5.5% 6/1/15 | | 1,500,000 | | 1,491,224 |
| Ford Motor Credit Co. 7.375% 2/1/11 | | 1,250,000 | | 1,095,648 |
| Household Finance Corp. 4.125% 11/16/09 | | 1,300,000 | | 1,255,136 |
| Household International, Inc. 5.836% 2/15/08 | | 1,225,000 | | 1,245,296 |
See accompanying notes which are an integral part of the financial statements.
| | |
| VIP Asset Manager Portfolio | | 22 |
| | | Principal | | Value |
| | | Amount | | (Note 1) |
| MBNA America Bank NA 7.125% 11/15/12 | | $ 750,000 | | $ 838,427 |
| MBNA Corp. 7.5% 3/15/12 | | 535,000 | | 602,588 |
| | | | | 6,916,405 |
| Diversified Financial Services – 0.2% | | | | |
| JPMorgan Chase Capital XVII 5.85% 8/1/35 | | 3,495,000 | | 3,457,963 |
| Prime Property Funding, Inc. 5.125% 6/1/15 (e) | | 935,000 | | 904,142 |
| | | | | 4,362,105 |
| Insurance – 0.1% | | | | |
| Axis Capital Holdings Ltd. 5.75% 12/1/14 | | 1,500,000 | | 1,500,321 |
| Marsh & McLennan Companies, Inc. 5.75% 9/15/15 | | 660,000 | | 665,303 |
| Principal Life Global Funding I 6.25% 2/15/12 (e) | | 850,000 | | 902,889 |
| | | | | 3,068,513 |
| Real Estate 0.6% | | | | |
| Archstone Smith Operating Trust 5.25% 5/1/15 | | 1,350,000 | | 1,331,328 |
| CarrAmerica Realty Corp.: | | | | |
| 5.125% 9/1/11 | | 1,980,000 | | 1,940,709 |
| 5.5% 12/15/10 | | 825,000 | | 823,744 |
| Colonial Properties Trust 5.5% 10/1/15 | | 1,700,000 | | 1,657,022 |
| Developers Diversified Realty Corp.: | | | | |
| 5% 5/3/10 | | 675,000 | | 665,057 |
| 5.25% 4/15/11 | | 395,000 | | 391,018 |
| EOP Operating LP 4.65% 10/1/10 | | 3,340,000 | | 3,236,163 |
| Regency Centers LP 6.75% 1/15/12 | | 1,990,000 | | 2,127,049 |
| Simon Property Group LP: | | | | |
| 5.1% 6/15/15 | | 915,000 | | 884,947 |
| 5.625% 8/15/14 | | 1,325,000 | | 1,334,013 |
| | | | | 14,391,050 |
| Thrifts & Mortgage Finance – 0.2% | | | | |
| Countrywide Home Loans, Inc. 4% 3/22/11 | | 935,000 | | 879,777 |
| Independence Community Bank Corp. 3.75% 4/1/14 (j) | | 1,120,000 | | 1,072,832 |
| Residential Capital Corp. 6.375% 6/30/10 | | 1,210,000 | | 1,229,499 |
| Washington Mutual, Inc. 4.625% 4/1/14 | | 1,500,000 | | 1,410,540 |
| | | | | 4,592,648 |
| |
| TOTAL FINANCIALS | | | | 46,979,067 |
| |
| INDUSTRIALS – 0.3% | | | | |
| Aerospace & Defense – 0.1% | | | | |
| BAE Systems Holdings, Inc. 4.75% 8/15/10 (e) | | 980,000 | | 962,451 |
See accompanying notes which are an integral part of the financial statements.
|
23 Annual Report
23
| VIP Asset Manager Portfolio | | | | |
| Investments - continued | | | | |
| |
| |
| Corporate Bonds continued | | | | |
| | | Principal | | Value |
| | | Amount | | (Note 1) |
| Nonconvertible Bonds – continued | | | | |
| |
| INDUSTRIALS – continued | | | | |
| Aerospace & Defense – continued | | | | |
| Bombardier, Inc.: | | | | |
| 6.3% 5/1/14 (e) | | $ 1,030,000 | | $ 901,250 |
| 7.45% 5/1/34 (e) | | 420,000 | | 354,900 |
| | | | | 2,218,601 |
| Airlines – 0.1% | | | | |
| American Airlines, Inc. pass thru trust certificates: | | | | |
| 6.855% 10/15/10 | | 109,643 | | 111,547 |
| 6.978% 10/1/12 | | 232,816 | | 240,022 |
| 7.024% 4/15/11 | | 610,000 | | 625,427 |
| 7.858% 4/1/13 | | 975,000 | | 1,028,002 |
| Continental Airlines, Inc. pass thru trust certificates 6.795% 2/2/20 | | 805,440 | | 724,896 |
| Delta Air Lines, Inc. pass thru trust certificates 7.57% 11/18/10 | | 840,000 | | 827,647 |
| | | | | 3,557,541 |
| Industrial Conglomerates 0.1% | | | | |
| Hutchison Whampoa International 03/13 Ltd. 6.5% 2/13/13 (e) | | 390,000 | | 412,985 |
| Hutchison Whampoa International 03/33 Ltd. 7.45% 11/24/33 (e) | | 800,000 | | 924,030 |
| | | | | 1,337,015 |
| |
| TOTAL INDUSTRIALS | | | | 7,113,157 |
| |
| INFORMATION TECHNOLOGY 0.1% | | | | |
| Semiconductors & Semiconductor Equipment – 0.1% | | | | |
| Chartered Semiconductor Manufacturing Ltd. 6.375% 8/3/15 | | 1,350,000 | | 1,342,189 |
| |
| MATERIALS 0.0% | | | | |
| Metals & Mining – 0.0% | | | | |
| Newmont Mining Corp. 5.875% 4/1/35 | | 830,000 | | 819,062 |
| Paper & Forest Products 0.0% | | | | |
| International Paper Co. 4.25% 1/15/09 | | 480,000 | | 465,852 |
| |
| TOTAL MATERIALS | | | | 1,284,914 |
| |
| TELECOMMUNICATION SERVICES 0.5% | | | | |
| Diversified Telecommunication Services – 0.5% | | | | |
| AT&T Broadband Corp. 8.375% 3/15/13 | | 500,000 | | 578,739 |
| BellSouth Capital Funding Corp. 7.875% 2/15/30 | | 765,000 | | 923,520 |
| BellSouth Corp. 5.2% 9/15/14 | | 430,000 | | 427,710 |
| British Telecommunications PLC 8.875% 12/15/30 | | 1,500,000 | | 2,006,913 |
See accompanying notes which are an integral part of the financial statements.
| | |
| VIP Asset Manager Portfolio | | 24 |
| | | Principal | | Value |
| | | Amount | | (Note 1) |
| SBC Communications, Inc.: | | | | |
| 6.15% 9/15/34 | | $ 1,000,000 | | $ 1,004,462 |
| 6.45% 6/15/34 | | 555,000 | | 577,519 |
| Sprint Capital Corp.: | | | | |
| 6.875% 11/15/28 | | 1,245,000 | | 1,360,399 |
| 8.375% 3/15/12 | | 730,000 | | 846,043 |
| Telecom Italia Capital: | | | | |
| 4.95% 9/30/14 | | 705,000 | | 673,337 |
| 5.25% 11/15/13 | | 1,700,000 | | 1,668,166 |
| Verizon Global Funding Corp.: | | | | |
| 5.85% 9/15/35 | | 1,390,000 | | 1,339,504 |
| 7.75% 12/1/30 | | 720,000 | | 855,833 |
| Verizon New York, Inc. 6.875% 4/1/12 | | 300,000 | | 312,729 |
| | | | | 12,574,874 |
| Wireless Telecommunication Services – 0.0% | | | | |
| America Movil SA de CV 4.125% 3/1/09 | | 450,000 | | 437,400 |
| AT&T Wireless Services, Inc. 7.875% 3/1/11 | | 400,000 | | 448,822 |
| | | | | 886,222 |
| |
| TOTAL TELECOMMUNICATION SERVICES | | | | 13,461,096 |
| |
| UTILITIES 0.6% | | | | |
| Electric Utilities – 0.3% | | | | |
| Cleveland Electric Illuminating Co. 5.65% 12/15/13 | | 1,205,000 | | 1,228,417 |
| Exelon Corp.: | | | | |
| 4.9% 6/15/15 | | 1,460,000 | | 1,393,399 |
| 5.625% 6/15/35 | | 155,000 | | 146,069 |
| 6.75% 5/1/11 | | 835,000 | | 888,959 |
| FirstEnergy Corp. 6.45% 11/15/11 | | 760,000 | | 805,598 |
| Progress Energy, Inc. 7.1% 3/1/11 | | 2,000,000 | | 2,157,840 |
| TXU Energy Co. LLC 7% 3/15/13 | | 2,295,000 | | 2,445,699 |
| | | | | 9,065,981 |
| Independent Power Producers & Energy Traders 0.1% | | | | |
| Constellation Energy Group, Inc. 7% 4/1/12 | | 1,560,000 | | 1,702,091 |
| Multi-Utilities – 0.2% | | | | |
| Dominion Resources, Inc.: | | | | |
| 4.75% 12/15/10 | | 1,000,000 | | 977,295 |
| 5.95% 6/15/35 | | 2,230,000 | | 2,176,674 |
See accompanying notes which are an integral part of the financial statements.
|
25 Annual Report
25
| VIP Asset Manager Portfolio | | | | | | |
| Investments - continued | | | | | | |
| |
| |
| Corporate Bonds continued | | | | | | |
| | | | | Principal | | Value |
| | | | | Amount | | (Note 1) |
| Nonconvertible Bonds – continued | | | | | | |
| |
| UTILITIES – continued | | | | | | |
| Multi-Utilities – continued | | | | | | |
| Dominion Resources, Inc.: - continued | | | | | | |
| 6.25% 6/30/12 | | | | $ 540,000 | | $ 564,952 |
| MidAmerican Energy Holdings, Inc. 5.875% 10/1/12 | | | | 1,235,000 | | 1,274,968 |
| | | | | | | 4,993,889 |
| |
| TOTAL UTILITIES | | | | | | 15,761,961 |
| |
| TOTAL NONCONVERTIBLE BONDS | | | | | | 117,757,708 |
| |
| TOTAL CORPORATE BONDS | | | | | | |
| (Cost $122,270,134) | | | | | | 121,641,363 |
| |
| U.S. Government and Government Agency Obligations 7.1% | | | | |
| |
| U.S. Government Agency Obligations – 2.1% | | | | | | |
| Fannie Mae: | | | | | | |
| 2.5% 6/15/06 | | | | 4,570,000 | | 4,527,476 |
| 3.25% 1/15/08 | | | | 2,661,000 | | 2,585,010 |
| 3.25% 8/15/08 | | | | 600,000 | | 578,471 |
| 3.25% 2/15/09 | | | | 1,800,000 | | 1,724,062 |
| 3.375% 12/15/08 | | | | 205,000 | | 197,582 |
| 4.625% 5/1/13 | | | | 7,000,000 | | 6,798,351 |
| 4.75% 12/15/10 | | | | 9,400,000 | | 9,400,103 |
| 5.5% 3/15/11 | | | | 1,975,000 | | 2,041,453 |
| 6.25% 2/1/11 | | | | 3,505,000 | | 3,701,666 |
| Freddie Mac: | | | | | | |
| 4% 6/12/13 | | | | 11,318,000 | | 10,699,924 |
| 5.875% 3/21/11 | | | | 7,760,000 | | 8,086,223 |
| U.S. Department of Housing and Urban Development Government guaranteed participation certificates Series | | | | |
| 1996 A, 7.63% 8/1/14 | | | | 2,810,000 | | 2,812,793 |
| |
| TOTAL U.S. GOVERNMENT AGENCY OBLIGATIONS | | | | | | 53,153,114 |
| U.S. Treasury Inflation Protected Obligations – 1.5% | | | | | | |
| U.S. Treasury Inflation Indexed Bonds 2.375% 1/15/25 | | | | 6,340,260 | | 6,673,260 |
| U.S. Treasury Inflation Indexed Notes: | | | | | | |
| 0.875% 4/15/10 | | | | 6,308,520 | | 5,999,100 |
| 2% 1/15/14 | | | | 24,255,000 | | 24,120,675 |
| |
| TOTAL U.S. TREASURY INFLATION PROTECTED | | | | | | |
| OBLIGATIONS | | | | | | 36,793,035 |
See accompanying notes which are an integral part of the financial statements.
| | |
| VIP Asset Manager Portfolio | | 26 |
| | | Principal | | Value |
| | | Amount | | (Note 1) |
| U.S. Treasury Obligations – 3.5% | | | | |
| U.S. Treasury Bills, yield at date of purchase 3.67% to 3.98% 1/12/06 to 3/9/06 (g) | | $ 7,000,000 | | $ 6,965,936 |
| U.S. Treasury Bonds 6.25% 5/15/30 | | 15,190,000 | | 18,865,266 |
| U.S. Treasury Notes: | | | | |
| 4.375% 12/15/10 | | 1,630,000 | | 1,631,273 |
| 4.75% 5/15/14 | | 31,300,000 | | 32,061,717 |
| 6.5% 2/15/10 | | 25,000,000 | | 26,967,775 |
| |
| TOTAL U.S. TREASURY OBLIGATIONS | | | | 86,491,967 |
| |
| TOTAL U.S. GOVERNMENT AND GOVERNMENT AGENCY OBLIGATIONS | | | | |
| (Cost $176,485,402) | | | | 176,438,116 |
| |
| U.S. Government Agency Mortgage | | | | |
| Securities 8.0% | | | | |
| |
| Fannie Mae – 7.4% | | | | |
| 3.477% 4/1/34 (j) | | 225,686 | | 224,278 |
| 3.726% 1/1/35 (j) | | 155,932 | | 153,678 |
| 3.752% 10/1/33 (j) | | 105,534 | | 103,091 |
| 3.76% 12/1/34 (j) | | 113,379 | | 111,804 |
| 3.787% 12/1/34 (j) | | 17,206 | | 16,978 |
| 3.793% 6/1/34 (j) | | 460,853 | | 444,165 |
| 3.82% 6/1/33 (j) | | 82,539 | | 81,089 |
| 3.83% 1/1/35 (j) | | 95,657 | | 94,453 |
| 3.847% 1/1/35 (j) | | 287,488 | | 283,799 |
| 3.869% 1/1/35 (j) | | 167,208 | | 166,868 |
| 3.889% 12/1/34 (j) | | 100,545 | | 100,430 |
| 3.906% 10/1/34 (j) | | 124,712 | | 123,319 |
| 3.952% 5/1/34 (j) | | 43,108 | | 43,754 |
| 3.964% 1/1/35 (j) | | 132,048 | | 130,872 |
| 3.968% 5/1/33 (j) | | 29,870 | | 29,471 |
| 3.983% 12/1/34 (j) | | 673,821 | | 671,544 |
| 3.984% 12/1/34 (j) | | 121,609 | | 120,888 |
| 3.991% 12/1/34 (j) | | 96,762 | | 96,180 |
| 3.993% 1/1/35 (j) | | 75,108 | | 74,569 |
| 4% 6/1/19 | | 3,078,406 | | 2,943,076 |
| 4.002% 2/1/35 (j) | | 81,380 | | 80,641 |
| 4.023% 12/1/34 (j) | | 55,220 | | 54,798 |
| 4.029% 2/1/35 (j) | | 79,229 | | 78,433 |
| 4.034% 10/1/18 (j) | | 104,200 | | 102,268 |
| 4.037% 1/1/35 (j) | | 41,017 | | 40,756 |
| 4.057% 1/1/35 (j) | | 76,527 | | 75,646 |
| 4.064% 4/1/33 (j) | | 33,850 | | 33,611 |
| 4.066% 12/1/34 (j) | | 184,342 | | 183,379 |
| 4.079% 1/1/35 (j) | | 180,502 | | 179,156 |
| 4.095% 2/1/35 (j) | | 58,879 | | 58,467 |
| 4.099% 2/1/35 (j) | | 155,206 | | 153,828 |
| 4.101% 2/1/35 (j) | | 59,255 | | 58,737 |
| 4.105% 2/1/35 (j) | | 324,192 | | 321,685 |
See accompanying notes which are an integral part of the financial statements.
|
27 Annual Report
27
| VIP Asset Manager Portfolio | | | | | | |
| Investments - continued | | | | | | | | |
| |
| |
| U.S. Government Agency Mortgage | | | | | | |
| Securities continued | | | | | | | | |
| | | | | | | Principal | | Value |
| | | | | | | Amount | | (Note 1) |
| Fannie Mae – continued | | | | | | | | |
| 4.111% 1/1/35 (j) | | | | | | $ 181,483 | | $ 179,664 |
| 4.12% 11/1/34 (j) | | | | | | 155,976 | | 154,720 |
| 4.122% 1/1/35 (j) | | | | | | 332,039 | | 329,036 |
| 4.123% 1/1/35 (j) | | | | | | 185,378 | | 184,810 |
| 4.126% 2/1/35 (j) | | | | | | 213,717 | | 213,143 |
| 4.144% 1/1/35 (j) | | | | | | 274,707 | | 274,969 |
| 4.161% 2/1/35 (j) | | | | | | 160,146 | | 158,687 |
| 4.176% 11/1/34 (j) | | | | | | 44,993 | | 44,657 |
| 4.176% 1/1/35 (j) | | | | | | 336,611 | | 334,033 |
| 4.176% 1/1/35 (j) | | | | | | 152,940 | | 151,673 |
| 4.185% 1/1/35 (j) | | | | | | 215,937 | | 211,876 |
| 4.205% 3/1/34 (j) | | | | | | 99,883 | | 98,441 |
| 4.214% 10/1/34 (j) | | | | | | 261,934 | | 261,848 |
| 4.25% 2/1/35 (j) | | | | | | 111,458 | | 109,143 |
| 4.278% 2/1/35 (j) | | | | | | 53,985 | | 53,458 |
| 4.288% 8/1/33 (j) | | | | | | 211,435 | | 209,015 |
| 4.291% 1/1/35 (j) | | | | | | 102,720 | | 101,494 |
| 4.292% 3/1/33 (j) | | | | | | 140,078 | | 139,094 |
| 4.298% 7/1/34 (j) | | | | | | 74,515 | | 74,776 |
| 4.299% 3/1/35 (j) | | | | | | 105,764 | | 104,950 |
| 4.308% 5/1/35 (j) | | | | | | 148,032 | | 146,338 |
| 4.313% 3/1/33 (j) | | | | | | 58,483 | | 57,390 |
| 4.327% 12/1/34 (j) | | | | | | 63,891 | | 63,791 |
| 4.33% 10/1/33 (j) | | | | | | 53,343 | | 52,793 |
| 4.332% 1/1/35 (j) | | | | | | 131,857 | | 130,020 |
| 4.342% 6/1/33 (j) | | | | | | 63,604 | | 62,803 |
| 4.348% 1/1/35 (j) | | | | | | 112,287 | | 110,318 |
| 4.367% 2/1/34 (j) | | | | | | 244,490 | | 240,829 |
| 4.374% 4/1/35 (j) | | | | | | 60,773 | | 59,927 |
| 4.394% 2/1/35 (j) | | | | | | 149,519 | | 146,842 |
| 4.409% 5/1/35 (j) | | | | | | 310,159 | | 306,735 |
| 4.442% 10/1/34 (j) | | | | | | 523,012 | | 523,212 |
| 4.445% 3/1/35 (j) | | | | | | 136,020 | | 133,867 |
| 4.447% 4/1/34 (j) | | | | | | 159,222 | | 158,477 |
| 4.467% 8/1/34 (j) | | | | | | 319,947 | | 316,270 |
| 4.48% 1/1/35 (j) | | | | | | 157,157 | | 156,449 |
| 4.481% 5/1/35 (j) | | | | | | 84,201 | | 83,024 |
| 4.497% 3/1/35 (j) | | | | | | 320,073 | | 314,888 |
| 4.5% 4/1/19 to 10/1/33 | | | | 28,427,830 | | 27,227,004 |
| 4.5% 1/1/21 (f) | | | | 11,399,398 | | 11,089,477 |
| 4.52% 8/1/34 (j) | | | | | | 666,816 | | 670,996 |
| 4.522% 3/1/35 (j) | | | | | | 298,534 | | 294,247 |
| 4.545% 2/1/35 (j) | | | | | | 702,808 | | 699,276 |
| 4.545% 7/1/35 (j) | | | | | | 379,765 | | 376,957 |
| 4.55% 2/1/35 (j) | | | | | | 110,271 | | 109,333 |
| 4.559% 1/1/35 (j) | | | | | | 241,227 | | 240,304 |
| 4.56% 2/1/35 (j) | | | | | | 64,794 | | 64,457 |
| 4.571% 9/1/34 (j) | | | | | | 464,849 | | 461,088 |
| 4.584% 2/1/35 (j) | | | | | | 985,702 | | 974,108 |
| 4.607% 8/1/34 (j) | | | | | | 164,690 | | 163,639 |
| 4.607% 2/1/35 (j) | | | | | | 317,960 | | 314,518 |
See accompanying notes which are an integral part of the financial statements.
| | |
| VIP Asset Manager Portfolio | | 28 |
| | | | | Principal | | Value |
| | | | | Amount | | (Note 1) |
| 4.627% 1/1/33 (j) | | | | $ 77,338 | | $ 76,661 |
| 4.629% 9/1/34 (j) | | | | 37,589 | | 37,341 |
| 4.642% 11/1/34 (j) | | | | 337,533 | | 335,183 |
| 4.653% 3/1/35 (j) | | | | 59,282 | | 59,254 |
| 4.674% 11/1/34 (j) | | | | 368,727 | | 365,995 |
| 4.695% 3/1/35 (j) | | | | 861,580 | | 858,472 |
| 4.703% 2/1/33 (j) | | | | 23,743 | | 23,713 |
| 4.71% 10/1/32 (j) | | | | 29,993 | | 29,970 |
| 4.722% 3/1/35 (j) | | | | 167,671 | | 166,230 |
| 4.729% 7/1/34 (j) | | | | 303,739 | | 301,579 |
| 4.732% 10/1/32 (j) | | | | 30,271 | | 30,249 |
| 4.803% 12/1/34 (j) | | | | 279,013 | | 278,249 |
| 4.815% 5/1/33 (j) | | | | 10,674 | | 10,665 |
| 4.816% 12/1/32 (j) | | | | 152,862 | | 152,813 |
| 4.83% 1/1/35 (j) | | | | 16,952 | | 17,091 |
| 4.832% 8/1/34 (j) | | | | 127,254 | | 126,215 |
| 4.838% 12/1/34 (j) | | | | 115,698 | | 115,396 |
| 4.904% 12/1/32 (j) | | | | 14,192 | | 14,236 |
| 4.984% 11/1/32 (j) | | | | 86,678 | | 87,256 |
| 5% 2/1/18 to 6/1/34 | | | | 13,401,850 | | 13,253,607 |
| 5% 1/1/36 (f) | | | | 12,462,807 | | 12,077,239 |
| 5.029% 2/1/35 (j) | | | | 61,740 | | 61,973 |
| 5.05% 7/1/34 (j) | | | | 72,056 | | 72,256 |
| 5.067% 11/1/34 (j) | | | | 28,657 | | 28,705 |
| 5.111% 5/1/35 (j) | | | | 728,743 | | 732,711 |
| 5.199% 6/1/35 (j) | | | | 531,747 | | 534,025 |
| 5.222% 8/1/33 (j) | | | | 172,554 | | 171,992 |
| 5.333% 7/1/35 (j) | | | | 76,017 | | 76,162 |
| 5.5% 12/1/18 to 10/1/34 | | | | 57,122,643 | | 56,720,746 |
| 6% 6/1/13 to 1/1/34 | | | | 18,503,490 | | 18,797,711 |
| 6.5% 6/1/11 to 9/1/32 | | | | 15,397,374 | | 15,841,928 |
| 7% 3/1/15 to 2/1/32 | | | | 4,397,601 | | 4,599,693 |
| 7.5% 7/1/16 to 11/1/31 | | | | 1,872,379 | | 1,964,589 |
| 8% 1/1/30 to 6/1/30 | | | | 157,716 | | 168,472 |
| |
| TOTAL FANNIE MAE | | | | | | 184,762,952 |
| Freddie Mac 0.3% | | | | | | |
| 4.056% 12/1/34 (j) | | | | 108,099 | | 106,928 |
| 4.103% 12/1/34 (j) | | | | 166,632 | | 164,336 |
| 4.188% 1/1/35 (j) | | | | 504,967 | | 498,347 |
| 4.269% 3/1/35 (j) | | | | 140,555 | | 139,427 |
| 4.3% 5/1/35 (j) | | | | 251,681 | | 249,547 |
| 4.307% 12/1/34 (j) | | | | 169,234 | | 166,197 |
| 4.364% 3/1/35 (j) | | | | 230,136 | | 225,677 |
| 4.375% 2/1/35 (j) | | | | 314,453 | | 312,623 |
| 4.39% 2/1/35 (j) | | | | 303,107 | | 300,266 |
| 4.445% 3/1/35 (j) | | | | 142,766 | | 140,100 |
| 4.447% 2/1/34 (j) | | | | 156,566 | | 154,657 |
| 4.468% 6/1/35 (j) | | | | 177,212 | | 174,820 |
| 4.489% 3/1/35 (j) | | | | 158,217 | | 155,479 |
| 4.49% 3/1/35 (j) | | | | 1,021,493 | | 1,007,687 |
| 4.552% 2/1/35 (j) | | | | 238,520 | | 235,401 |
| |
See accompanying notes which are an integral part of the financial statements.
| | | | | | |
| | | 29 | | | | Annual Report |
29
| VIP Asset Manager Portfolio | | | | | | |
| Investments - continued | | | | | | |
| |
| |
| U.S. Government Agency Mortgage | | | | | | |
| Securities continued | | | | | | |
| | | Principal | | | | Value |
| | | Amount | | | | (Note 1) |
| Freddie Mac – continued | | | | | | |
| 4.807% 10/1/32 (j) | | $ 20,020 | | $ | | 20,001 |
| 5.017% 4/1/35 (j) | | 823,929 | | | | 822,797 |
| 5.285% 8/1/33 (j) | | 66,885 | | | | 67,692 |
| 5.375% 3/1/33 (j) | | 61,095 | | | | 60,820 |
| 5.662% 4/1/32 (j) | | 39,173 | | | | 39,703 |
| 6% 5/1/33 | | 1,308,574 | | | | 1,325,572 |
| 7.5% 5/1/17 to 11/1/31 | | 501,271 | | | | 526,735 |
| 8% 7/1/17 to 5/1/27 | | 56,414 | | | | 60,326 |
| |
| TOTAL FREDDIE MAC | | | | | | 6,955,138 |
| Government National Mortgage Association – 0.3% | | | | | | |
| 6% 12/15/08 to 6/15/09 | | 269,982 | | | | 275,731 |
| 6.5% 6/15/08 to 8/15/27 | | 3,888,589 | | | | 4,048,220 |
| 7% 7/15/28 to 7/15/32 | | 2,106,973 | | | | 2,213,211 |
| 7.5% 9/15/22 to 12/15/27 | | 1,374,810 | | | | 1,450,785 |
| 8% 5/15/25 to 1/15/31 | | 330,178 | | | | 353,481 |
| 8.5% 12/15/16 to 3/15/30 | | 91,673 | | | | 98,906 |
| |
| TOTAL GOVERNMENT NATIONAL MORTGAGE | | | | | | |
| ASSOCIATION | | | | | | 8,440,334 |
| |
| TOTAL U.S. GOVERNMENT AGENCY - MORTGAGE SECURITIES | | | | | | |
| (Cost $201,094,443) | | | | 200,158,424 |
| |
| Asset Backed Securities 0.9% | | | | | | |
| |
| ACE Securities Corp.: | | | | | | |
| Series 2004 HE1: | | | | | | |
| Class M1, 4.8788% 2/25/34 (j) | | 250,000 | | | | 250,527 |
| Class M2, 5.4788% 2/25/34 (j) | | 300,000 | | | | 301,993 |
| Series 2005 SD1 Class A1, 4.7788% 11/25/50 (j) | | 224,184 | | | | 224,454 |
| Aesop Funding II LLC Series 2005 1A Class A1, 3.95% 4/20/08 (e) | | 1,000,000 | | | | 978,571 |
| Ameriquest Mortgage Securities, Inc. Series 2004 R2: | | | | | | |
| Class M1, 4.8088% 4/25/34 (j) | | 145,000 | | | | 144,999 |
| Class M2, 4.8588% 4/25/34 (j) | | 125,000 | | | | 124,999 |
| Amortizing Residential Collateral Trust Series 2002 BC1 Class M2, 5.4788% 1/25/32 (j) | | 80,927 | | | | 81,251 |
| ARG Funding Corp. Series 2005 1A Class A1, 4.02% 4/20/09 (e) | | 1,300,000 | | | | 1,273,449 |
| Argent Securities, Inc. Series 2004 W5 Class M1, 4.9788% 4/25/34 (j) . | | 475,000 | | | | 475,568 |
See accompanying notes which are an integral part of the financial statements.
| | |
| VIP Asset Manager Portfolio | | 30 |
| | | Principal | | Value |
| | | Amount | | (Note 1) |
| Asset Backed Securities Corp. Home Equity Loan Trust Series 2004 HE3: | | | | |
| Class M1, 4.9188% 6/25/34 (j) | | $ 175,000 | | $ 175,882 |
| Class M2, 5.4988% 6/25/34 (j) | | 400,000 | | 404,584 |
| Capital One Multi Asset Execution Trust: | | | | |
| Series 2003 B4 Class B4, 5.1694% 7/15/11 (j) | | 780,000 | | 791,147 |
| Series 2004 6 Class B, 4.15% 7/16/12 | | 1,295,000 | | 1,259,509 |
| CDC Mortgage Capital Trust Series 2004 HE2 Class M2, 5.5788% 7/26/34 (j) | | 265,000 | | 267,138 |
| Cendant Timeshare Receivables Funding LLC Series 2005 1A Class A1, 4.67% 5/20/17 (e) | | 500,500 | | 495,344 |
| Citibank Credit Card Issuance Trust Series 2002 C1 Class C1, 5.2806% 2/9/09 (j) | | 1,750,000 | | 1,764,411 |
| Countrywide Home Loans, Inc.: | | | | |
| Series 2004 2 Class M1, 4.8788% 5/25/34 (j) | | 890,000 | | 891,633 |
| Series 2004 3 Class M1, 4.8788% 6/25/34 (j) | | 175,000 | | 175,348 |
| Series 2004 4: | | | | |
| Class A, 4.7488% 8/25/34 (j) | | 202,968 | | 203,164 |
| Class M1, 4.8588% 7/25/34 (j) | | 450,000 | | 451,416 |
| Class M2, 4.9088% 6/25/34 (j) | | 525,000 | | 525,655 |
| Series 2005 1: | | | | |
| Class MV1, 4.7788% 7/25/35 (j) | | 350,000 | | 349,996 |
| Class MV2, 4.8188% 7/25/35 (j) | | 420,000 | | 419,864 |
| Crown Castle Towers LLC/Crown Atlantic Holdings Sub LLC/Crown Communication, Inc. Series 2005 1A: | | | | |
| Class B, 4.878% 6/15/35 (e) | | 569,000 | | 554,138 |
| Class C, 5.074% 6/15/35 (e) | | 516,000 | | 503,736 |
| Discover Card Master Trust I Series 2003 4 Class B1, 4.6994% 5/16/11 (j) | | 1,015,000 | | 1,020,819 |
| First Franklin Mortgage Loan Trust Series 2004 FF2: | | | | |
| Class M3, 4.9288% 3/25/34 (j) | | 50,000 | | 50,086 |
| Class M4, 5.2788% 3/25/34 (j) | | 25,000 | | 25,219 |
| Fremont Home Loan Trust: | | | | |
| Series 2004 A: | | | | |
| Class M1, 4.9288% 1/25/34 (j) | | 550,000 | | 551,700 |
| Class M2, 5.5288% 1/25/34 (j) | | 625,000 | | 632,546 |
| Series 2005 A: | | | | |
| Class M1, 4.8088% 1/25/35 (j) | | 200,000 | | 200,672 |
See accompanying notes which are an integral part of the financial statements.
|
31 Annual Report
31
| VIP Asset Manager Portfolio | | | | |
| Investments - continued | | | | |
| |
| |
| Asset Backed Securities continued | | | | |
| | | Principal | | Value |
| | | Amount | | (Note 1) |
| Fremont Home Loan Trust: - continued | | | | |
| Class M2, 4.8388% 1/25/35 (j) | | $ 275,000 | | $ 275,269 |
| Class M3, 4.8688% 1/25/35 (j) | | 150,000 | | 150,372 |
| Class M4, 5.0588% 1/25/35 (j) | | 100,000 | | 100,666 |
| GSAMP Trust Series 2004 FM2: | | | | |
| Class M1, 4.8788% 1/25/34 (j) | | 500,000 | | 499,995 |
| Class M2, 5.4788% 1/25/34 (j) | | 200,000 | | 199,998 |
| Class M3, 5.6788% 1/25/34 (j) | | 200,000 | | 199,998 |
| HSBC Home Equity Loan Trust Series 2005 2: | | | | |
| Class M1, 4.83% 1/20/35 (j) | | 268,173 | | 268,198 |
| Class M2, 4.86% 1/20/35 (j) | | 202,101 | | 202,164 |
| Long Beach Mortgage Loan Trust Series 2004 2: | | | | |
| Class M1, 4.9088% 6/25/34 (j) | | 500,000 | | 501,082 |
| Class M2, 5.4588% 6/25/34 (j) | | 160,000 | | 161,624 |
| Meritage Mortgage Loan Trust Series 2004 1: | | | | |
| Class M1, 4.8788% 7/25/34 (j) | | 250,000 | | 249,998 |
| Class M2, 4.9288% 7/25/34 (j) | | 50,000 | | 50,000 |
| Class M3, 5.3288% 7/25/34 (j) | | 100,000 | | 99,999 |
| Class M4, 5.4788% 7/25/34 (j) | | 75,000 | | 75,157 |
| Morgan Stanley ABS Capital I, Inc.: | | | | |
| Series 2003 NC5 Class M2, 6.3788% 4/25/33 (j) | | 325,000 | | 327,451 |
| Series 2004 NC2 Class M1, 4.9288% 12/25/33 (j) | | 290,000 | | 291,181 |
| Morgan Stanley Dean Witter Capital I Trust Series 2003 NC1 Class M1, 5.4288% 11/25/32 (j) | | 285,468 | | 287,062 |
| National Collegiate Student Loan Trust Series 2005 GT1 Class AIO, 6.75% 12/25/09 (l) | | 450,000 | | 107,332 |
| Onyx Acceptance Owner Trust Series 2005 A Class A3, 3.69% 5/15/09 | | 450,000 | | 444,125 |
| Park Place Securities, Inc. Series 2005 WCH1 Class M2, 4.8988% 1/25/35 (j) | | 475,000 | | 475,513 |
| Saxon Asset Securities Trust Series 2004 1 Class M1, 4.9088% 3/25/35 (j) | | 495,000 | | 495,601 |
| Specialty Underwriting & Residential Finance Series 2003 BC4 Class M1, 4.9788% 11/25/34 (j) | | 200,000 | | 201,005 |
See accompanying notes which are an integral part of the financial statements.
| | |
| VIP Asset Manager Portfolio | | 32 |
| | | | | Principal | | | | Value |
| | | | | Amount | | | | (Note 1) |
| Structured Asset Securities Corp. Series 2004 GEL1 Class A, 4.7388% 2/25/34 (j) | | $ 86,360 | | $ | | 86,360 |
| Volkswagen Auto Lease Trust Series 2005 A Class A4, 3.94% 10/20/10 . | | 1,835,000 | | | | 1,806,744 |
| TOTAL ASSET BACKED SECURITIES | | | | | | | | |
| (Cost $23,235,129) | | | | | | 23,126,712 |
| |
| Collateralized Mortgage Obligations 1.1% | | | | | | |
| |
| Private Sponsor 0.7% | | | | | | | | |
| Adjustable Rate Mortgage Trust floater: | | | | | | | | |
| Series 2005 1 Class 5A2, 4.7088% 5/25/35 (j) | | 509,986 | | | | 508,255 |
| Series 2005 2 Class 6A2, 4.6588% 6/25/35 (j) | | 222,236 | | | | 222,296 |
| Series 2005 3 Class 8A2, 4.6188% 7/25/35 (j) | | 1,251,518 | | | | 1,250,267 |
| Bear Stearns Alt A Trust floater Series 2005 1 Class A1, 4.6588% 1/25/35 (j) | | 908,143 | | | | 908,143 |
| CS First Boston Mortgage Securities Corp. floater: | | | | | | | | |
| Series 2004 AR3 Class 6A2, 4.7488% 4/25/34 (j) | | 188,003 | | | | 188,234 |
| Series 2004 AR5 Class 11A2, 4.7488% 6/25/34 (j) | | 263,632 | | | | 263,135 |
| Impac CMB Trust floater: | | | | | | | | |
| Series 2005 1: | | | | | | | | |
| Class M1, 4.8388% 4/25/35 (j) | | | | 305,307 | | | | 305,175 |
| Class M2, 4.8788% 4/25/35 (j) | | | | 549,553 | | | | 549,359 |
| Series 2005 2 Class 1A2, 4.6888% 4/25/35 (j) | | 1,031,568 | | | | 1,030,762 |
| Lehman Structured Securities Corp. floater Series 2005 1 Class A2, 4.59% 9/26/45 (e)(j) | | 1,145,114 | | | | 1,145,114 |
| Master Alternative Loan Trust Series 2004 3 Class 3A1, 6% 4/25/34 | | 169,266 | | | | 169,001 |
| Merrill Lynch Mortgage Investors, Inc. floater: | | | | | | | | |
| Series 2005 A Class A2, 4.9338% 2/25/30 (j) | | | | 964,828 | | | | 963,860 |
| Series 2005 B Class A2, 4.79% 7/25/30 (j) | | | | 965,639 | | | | 965,006 |
| Opteum Mortgage Acceptance Corp. floater Series 2005 3 | | | | | | |
| Class APT, 4.6688% 7/25/35 (j) | | | | 640,902 | | | | 641,277 |
| Residential Asset Mortgage Products, Inc. sequential pay Series 2004 SL2 Class A1, 6.5% 10/25/16 | | 147,067 | | | | 149,688 |
| Sequoia Mortgage Trust floater: | | | | | | | | |
| Series 2005 1 Class A2, 4.1% 2/20/35 (j) | | | | 666,896 | | | | 664,365 |
See accompanying notes which are an integral part of the financial statements.
|
33 Annual Report
33
| VIP Asset Manager Portfolio | | | | |
| Investments - continued | | | | |
| |
| |
| Collateralized Mortgage Obligations continued | | | | |
| | | Principal | | Value |
| | | Amount | | (Note 1) |
| Private Sponsor – continued | | | | |
| Sequoia Mortgage Trust floater: - continued | | | | |
| Series 2005 2 Class A2, 4.29% 3/20/35 (j) | | $ 758,653 | | $ 758,653 |
| Thornburg Mortgage Securities Trust floater Series 2005 3 | | | | |
| Class A4, 4.6488% 10/25/35 (j) | | 1,149,294 | | 1,149,294 |
| Wells Fargo Mortgage Backed Securities Trust: | | | | |
| Series 2005 AR10 Class 2A2, 4.1101% 6/25/35 (j) | | 1,463,412 | | 1,436,608 |
| Series 2005 AR12 Class 2A6, 4.3214% 7/25/35 (j) | | 1,568,026 | | 1,534,561 |
| Series 2005 AR4 Class 2A2, 4.5345% 4/25/35 (j) | | 1,195,101 | | 1,171,363 |
| Series 2005 AR9 Class 2A1, 4.3624% 5/25/35 (j) | | 645,637 | | 637,214 |
| |
| TOTAL PRIVATE SPONSOR | | | | 16,611,630 |
| U.S. Government Agency – 0.4% | | | | |
| Fannie Mae planned amortization class: | | | | |
| Series 1999 54 Class PH, 6.5% 11/18/29 | | 3,300,000 | | 3,426,132 |
| Series 1999 57 Class PH, 6.5% 12/25/29 | | 2,600,000 | | 2,686,547 |
| Fannie Mae Grantor Trust Series 2005 90 Class FG, 4.6288% 10/25/35 (j) | | 3,006,137 | | 2,998,881 |
| Fannie Mae guaranteed REMIC pass thru certificates planned amortization class Series 2004 81 Class KC, 4.5% | | | | |
| 4/25/17 | | 2,390,000 | | 2,337,954 |
| |
| TOTAL U.S. GOVERNMENT AGENCY | | | | 11,449,514 |
| |
| TOTAL COLLATERALIZED MORTGAGE OBLIGATIONS | | | | |
| (Cost $27,430,700) | | | | 28,061,144 |
| |
| Commercial Mortgage Securities 1.5% | | | | |
| |
| Bayview Commercial Asset Trust floater: | | | | |
| Series 2004 1: | | | | |
| Class A, 4.7388% 4/25/34 (e)(j) | | 686,574 | | 686,897 |
| Class B, 6.2788% 4/25/34 (e)(j) | | 76,286 | | 77,159 |
| Class M1, 4.9388% 4/25/34 (e)(j) | | 76,286 | | 76,620 |
| Class M2, 5.5788% 4/25/34 (e)(j) | | 76,286 | | 77,180 |
See accompanying notes which are an integral part of the financial statements.
| | |
| VIP Asset Manager Portfolio | | 34 |
| | | Principal | | Value |
| | | Amount | | (Note 1) |
| Series 2004 3: | | | | |
| Class A1, 4.7488% 1/25/35 (e)(j) | | $ 724,634 | | $ 725,424 |
| Class A2, 4.7988% 1/25/35 (e)(j) | | 90,579 | | 90,608 |
| Class M1, 4.8788% 1/25/35 (e)(j) | | 135,869 | | 136,053 |
| Class M2, 5.3788% 1/25/35 (e)(j) | | 90,579 | | 91,118 |
| COMM: | | | | |
| floater Series 2002 FL7 Class D, 4.9394% 11/15/14 (e)(j) | | 67,429 | | 67,630 |
| Series 2004 LBN2 Class X2, 1.1989% 3/10/39 (e)(j)(l) | | 1,931,490 | | 65,372 |
| CS First Boston Mortgage Securities Corp.: | | | | |
| sequential pay: | | | | |
| Series 1999 C1 Class A2, 7.29% 9/15/41 | | 1,500,000 | | 1,596,007 |
| Series 2004 C1 Class A3, 4.321% 1/15/37 | | 615,000 | | 592,879 |
| Series 1998 C1 Class D, 7.17% 5/17/40 | | 580,000 | | 627,585 |
| Series 2004 C1 Class ASP, 1.1065% 1/15/37 (e)(j)(l) | | 9,482,020 | | 307,806 |
| Deutsche Mortgage & Asset Receiving Corp. sequential pay Series 1998 C1 Class D, 7.231% 6/15/31 | | 3,550,000 | | 3,712,137 |
| Equitable Life Assurance Society of the United States Series 174: | | | | |
| Class B1, 7.33% 5/15/06 (e) | | 3,500,000 | | 3,528,082 |
| Class C1, 7.52% 5/15/06 (e) | | 2,300,000 | | 2,318,984 |
| Class D1, 7.77% 5/15/06 (e) | | 2,200,000 | | 2,214,917 |
| Fannie Mae sequential pay Series 1999 10 Class MZ, 6.5% 9/17/38 | | 1,430,938 | | 1,476,584 |
| GS Mortgage Securities Corp. II: | | | | |
| sequential pay Series 2001 LIBA Class A2, 6.615% 2/14/16 (e) | | 840,000 | | 898,519 |
| Series 1998 GLII Class E, 7.1906% 4/13/31 (j) | | 1,205,000 | | 1,248,816 |
| Leafs CMBS I Ltd./Leafs CMBS I Corp. Series 2002 1A: | | | | |
| Class B, 4.13% 11/20/37 (e) | | 1,050,000 | | 977,872 |
| Class C, 4.13% 11/20/37 (e) | | 1,050,000 | | 947,189 |
| Morgan Stanley Capital I, Inc.: | | | | |
| sequential pay Series 2004 HQ3 Class A2, 4.05% 1/13/41 | | 630,000 | | 607,185 |
| Series 2005 IQ9 Class X2, 1.203% 7/15/56 (e)(j)(l) | | 7,680,000 | | 354,481 |
| Thirteen Affiliates of General Growth Properties, Inc.: | | | | |
| sequential pay Series 1 Class A2, 6.602% 11/15/07 (e) | | 4,200,000 | | 4,316,922 |
See accompanying notes which are an integral part of the financial statements.
|
35 Annual Report
35
| VIP Asset Manager Portfolio | | | | | | |
| Investments - continued | | | | | | |
| |
| |
| Commercial Mortgage Securities continued | | | | | | |
| | | | | Principal | | Value |
| | | | | Amount | | (Note 1) |
| Thirteen Affiliates of General Growth Properties, Inc.: continued | | | | | | |
| Series 1: | | | | | | |
| Class D2, 6.992% 11/15/07 (e) | | | | $ 4,120,000 | | $ 4,238,528 |
| Class E2, 7.224% 11/15/07 (e) | | | | 2,450,000 | | 2,536,773 |
| Wachovia Bank Commercial Mortgage Trust sequential pay: | | | | | | |
| Series 2003 C6 Class A2, 4.498% 8/15/35 | | | | 1,015,000 | | 996,730 |
| Series 2003 C7 Class A1, 4.241% 10/15/35 (e) | | | | 1,372,416 | | 1,336,683 |
| TOTAL COMMERCIAL MORTGAGE SECURITIES | | | | | | |
| (Cost $36,440,954) | | | | | | 36,928,740 |
| |
| Foreign Government and Government Agency Obligations 0.2% | | | | |
| |
| Israeli State 4.625% 6/15/13 | | | | 230,000 | | 221,806 |
| United Mexican States: | | | | | | |
| 5.875% 1/15/14 | | | | 185,000 | | 191,475 |
| 6.75% 9/27/34 | | | | 795,000 | | 869,531 |
| 7.5% 4/8/33 | | | | 2,350,000 | | 2,782,400 |
| TOTAL FOREIGN GOVERNMENT AND GOVERNMENT AGENCY OBLIGATIONS | | | | |
| (Cost $3,447,617) | | | | | | 4,065,212 |
| |
| Fixed Income Funds 11.3% | | | | | | |
| | | | | Shares | | |
| Fidelity Floating Rate Central Investment Portfolio (k) | | | | 464,992 | | 46,624,748 |
| Fidelity High Income Central Investment Portfolio 1 (k) | | | | 1,496,200 | | 144,892,045 |
| Fidelity Ultra Short Central Fund (k) | | | | 924,696 | | 91,970,264 |
| TOTAL FIXED-INCOME FUNDS | | | | | | |
| (Cost $278,270,852) | | | | | | 283,487,057 |
| |
| Money Market Funds 18.3% | | | | | | |
| | | | | Shares | | Value (Note 1) |
| |
| Fidelity Cash Central Fund, 4.28% (b) | | | | 331,414,915 | | $ 331,414,915 |
| Fidelity Money Market Central Fund, 4.35% (b) | | | | 123,860,162 | | 123,860,162 |
| Fidelity Securities Lending Cash Central Fund, 4.35% (b)(c) | | | | 1,004,333 | | 1,004,333 |
| TOTAL MONEY MARKET FUNDS | | | | | | |
| (Cost $456,279,410) | | | | | | 456,279,410 |
| |
| TOTAL INVESTMENT PORTFOLIO 100.7% | | | | | | |
| (Cost $2,335,814,459) | | | | 2,514,710,774 |
| |
| NET OTHER ASSETS (0.7)% | | | | | | (17,320,401) |
| NET ASSETS 100% | | | | $ 2,497,390,373 |
See accompanying notes which are an integral part of the financial statements.
| | |
| VIP Asset Manager Portfolio | | 36 |
| Futures Contracts | | | | | | |
| | | | | Underlying Face | | Unrealized |
| | | Expiration | | Amount at | | Appreciation/ |
| | | Date | | Value | | (Depreciation) |
| Purchased | | | | | | |
| Equity Index Contracts | | | | | | |
| 422 S&P 500 Index Contracts | | March 2006 | | $132,381,400 | | $ (1,336,685) |
| TOTAL EQUITY INDEX CONTRACTS | | | | $132,381,400 | | $ (1,336,685) |
| |
| The face value of futures purchased as a percentage of net assets - 5.3% | | | | | | |
See accompanying notes which are an integral part of the financial statements.
|
37 Annual Report
37
| VIP Asset Manager Portfolio | | | | | | | | |
| Investments - continued | | | | | | | | |
| |
| |
| Swap Agreements | | | | | | | | |
| | | Expiration | | Notional | | | | Value |
| | | Date | | Amount | | | | |
| |
| Credit Default Swaps | | | | | | | | |
| Receive quarterly a fixed rate of .4% multiplied by the notional amount and pay to Merrill Lynch, Inc., upon | | | | | | | | |
| each default event of one of the issues of Dow Jones CDX N.A. Investment Grade 4, par value of the | | | | | | | | |
| proportional notional amount (i) | | June 2010 | | $10,000,000 | | | | $ (39,700) |
| Receive quarterly a fixed rate of .5% multiplied by the notional amount and pay to Merrill Lynch, Inc., upon | | | | | | | | |
| each default event of one of the issues of Dow Jones CDX N.A. Investment Grade 3, par value of the | | | | | | | | |
| proportional notional amount (h) | | March 2010 | | 3,472,000 | | | | 11,041 |
| Receive quarterly a fixed rate of .65% multiplied by the notional amount and pay to Merrill Lynch, Inc., upon | | | | | | | | |
| each default event of one of the issues of Dow Jones CDX N.A. Investment Grade 4, par value of the | | | | | | | | |
| proportional notional amount (i) | | June 2015 | | 12,500,000 | | | | (54,500) |
| Receive quarterly a fixed rate of .7% multiplied by the notional amount and pay to Deutsche Bank, upon | | | | | | | | |
| each default event of one of the issues of Dow Jones CDX N.A. Investment Grade 3, par value of the | | | | | | | | |
| proportional notional amount (h) | | March 2015 | | 3,472,000 | | | | 10,659 |
| Receive quarterly notional amount multiplied by .41% and pay Goldman Sachs upon default event of | | | | | | | | |
| Sempra Energy, par value of the notional amount of Sempra Energy 7.95% 3/1/10 | | Sept. 2010 | | 700,000 | | | | 245 |
| Receive quarterly notional amount multiplied by .42% and pay Morgan Stanley, Inc. upon default event of | | | | | | | | |
| Sempra Energy, par value of the notional amount of Sempra Energy 6% 2/1/13 | | Sept. 2010 | | 1,000,000 | | | | 770 |
| Receive monthly notional amount multiplied by 1.6% and pay Morgan Stanley, Inc. upon default event of | | | | | | | | |
| Park Place Securities, Inc., par value of the notional amount of Park Place Securities, Inc. Series | | | | | | | | |
| 2005 WHQ2 Class M7, 5.4413% 5/25/35 | | June 2035 | | 170,000 | | | | 760 |
| Receive monthly notional amount multiplied by 2.79% and pay Merrill Lynch, Inc. upon default event of New | | | | | | | | |
| Century Home Equity Loan Trust, par value of the notional amount of New Century Home Equity Loan Trust | | | | | | | | |
| Series 2004 4 Class M9, 7.0788% 2/25/35 | | March 2035 | | 465,000 | | | | (1,042) |
| Receive monthly notional amount multiplied by 3.3% and pay to Morgan Stanley, Inc. upon each default | | | | | | | | |
| event of Ameriquest Mortgage Securities, Inc., par value of the notional amount of Ameriquest Mortgage | | | | | | | | |
| Securities, Inc. Series 2004 R11, Class M9, 7.6913% 11/25/34 | | Dec. 2034 | | 210,000 | | | | 1,342 |
| |
| TOTAL CREDIT DEFAULT SWAPS | | | | $31,989,000 | | | | $ (70,425) |
See accompanying notes which are an integral part of the financial statements.
| | |
| VIP Asset Manager Portfolio | | 38 |
| Swap Agreements continued | | | | | | | | |
| | | Expiration | | Notional | | | | Value |
| | | Date | | Amount | | | | |
| |
| Interest Rate Swaps | | | | | | | | |
| Receive quarterly a fixed rate equal to 4.3875% and pay quarterly a floating rate based on 3 month LIBOR | | | | | | | | |
| with Credit Suisse First Boston | | March 2010 | | $ 3,500,000 | | | | $ (57,785) |
| Receive quarterly a fixed rate equal to 4.774% and pay quarterly a floating rate based on 3 month LIBOR | | | | | | | | |
| with Credit Suisse First Boston | | March 2015 | | 3,500,000 | | | | (30,625) |
| Receive semi annually a fixed rate equal to 4.378% and pay quarterly a floating rate based on 3 month | | | | | | | | |
| LIBOR with Lehman Brothers, Inc. | | Sept. 2008 | | 25,000,000 | | | | (20,750) |
| Receive semi annually a fixed rate equal to 4.921% and pay quarterly a floating rate based on 3 month | | | | | | | | |
| LIBOR with Lehman Brothers, Inc. | | Dec. 2008 | | 20,000,000 | | | | 49,600 |
| TOTAL INTEREST RATE SWAPS | | | | $ 52,000,000 | | | | $ (59,560) |
| |
| Total Return Swaps | | | | | | | | |
| Receive monthly a return equal to Banc of America Securities LLC AAA 10 Yr Commercial Mortgage Backed | | | | | | | | |
| Securities Daily Index and pay monthly a floating rate based on 1 month LIBOR minus 20 basis points | | | | | | | | |
| with Bank of America | | July 2006 | | 2,500,000 | | | | 28,143 |
| Receive monthly a return equal to Banc of America Securities LLC AAA 10 Yr Commercial Mortgage Backed | | | | | | | | |
| Securities Daily Index and pay monthly a floating rate based on 1 month LIBOR minus 40 basis points | | | | | | | | |
| with Bank of America | | March 2006 | | 2,500,000 | | | | 35,501 |
| Receive monthly a return equal to Lehman Brothers CMBS AAA 8.5+ Index and pay monthly a floating rate | | | | | | | | |
| based on 1 month LIBOR minus 25 basis points with Deutsche Bank | | April 2006 | | 2,500,000 | | | | 27,564 |
| Receive quarterly a return equal to Bank of America Securities LLC AAA 10Yr Commercial Mortgage | | | | | | | | |
| Backed Securities Daily Index and pay quarterly a floating rate based on 3 month LIBOR minus 30 basis | | | | | | | | |
| points with Bank of America | | May 2006 | | 12,500,000 | | | | 118,873 |
| TOTAL TOTAL RETURN SWAPS | | | | $ 20,000,000 | | | | $ 210,081 |
| |
| |
| | | | | $ 103,989,000 | | | | $ 80,096 |
Legend
(a) Non-income producing
(b) Affiliated fund that is available only to investment companies and other accounts managed by Fidelity Investments. The rate quoted is the annualized seven-day
yield of the fund at period end. A complete unaudited listing of the fund’s holdings as of its most recent quarter end is available upon request.
(c) Investment made with cash collateral received from securities on loan.
(d) Security or a portion of the security is on loan at period end.
(e) Security exempt from registration under Rule 144A of the Securities Act of 1933. These securities may be resold in transactions exempt from registration,
normally to qualified institutional buyers. At the period end, the value of these securities amounted to $42,049,669 or 1.7% of net assets.
(f) Security or a portion of the security purchased on a delayed delivery or when-issued basis.
(g) Security or a portion of the security was pledged to cover margin requirements for futures contracts. At the period end, the value of securities pledged amounted
to $6,965,936.
(h) Dow Jones CDX N.A. Investment Grade 3 is a tradable index of credit default swaps on investment grade debt of U.S. companies.
(i) Dow Jones CDX N.A. Investment Grade 4 is a tradable index of credit default swaps on investment grade debt of U.S. companies.
(j) The coupon rate shown on floating or adjustable rate securities represents the rate at period end.
(k) Affiliated fund that is available only to investment companies and other accounts managed by Fidelity Investments. A complete unaudited list of holdings for
each fixed-income central fund, as of the investing fund’s report date, is available upon request or at advisor.fidelity.com. The reports are located just after the
fund’s financial statements and quarterly reports but are not part of the financial statements or quarterly reports. In addition, the fixed-income central fund’s
financial statements, which are not covered by the investing fund’s Report of Independent Registered Public Accounting Firm, are available on the EDGAR
Database on the SEC’s web site www.sec.gov or upon request.
(l) Security represents right to receive monthly interest payments on an underlying pool of mortgages. Principal shown is the par amount of the mortgage pool.
|
Affiliated Central Funds
Information regarding income received by the fund from the affiliated Central funds during the period is as follows:
See accompanying notes which are an integral part of the financial statements.
39 Annual Report
| VIP Asset Manager Portfolio | | |
| Investments - continued | | |
| |
| |
| Fund | | Income received |
| Fidelity Cash Central Fund | | $ 10,759,145 |
| Fidelity Floating Rate Central Investment Portfolio | | 2,188,029 |
| Fidelity High Income Central Investment Portfolio 1 | | 10,927,105 |
| Fidelity Money Market Central Fund | | 4,090,628 |
| Fidelity Securities Lending Cash Central Fund | | 75,927 |
| Fidelity Ultra Short Central Fund | | 1,347,707 |
| Total | | $ 29,388,541 |
Additional information regarding the fund’s purchases and sales, including the ownership percentage, of the following fixed income Central Funds during the period is as follows:
| | | Value, | | | | | | | | | | |
| | | beginning of | | | | | | | | Value, end of | | % ownership, end |
| Fund | | period | | Purchases | | Sales Proceeds | | period | | of period |
| Fidelity Floating Rate Central Investment Portfolio | | $ | | 14,250,008 | | $ | | 32,290,110 | | $ | | — | | $ | | 46,624,748 | | 7.1% |
| Fidelity High Income Central Investment Portfolio 1 | | 150,547,682 | | — | | | | — | | 144,892,045 | | 13.8% |
| Fidelity Ultra Short Central Fund | | — | | 91,998,005 | | | | — | | 91,970,264 | | 1.3% |
| Total | | $ | | 164,797,690 | | $ | | 124,288,115 | | $ | | — | | $ | | 283,487,057 | | |
| |
Other Information
| | | | | | | | | | | | |
The composition of credit quality ratings as a percentage of net assets is as follows (ratings are unaudited):
| | | | | | | | |
| U.S.Government and U.S.Government Agency Obligations | | | | | | | | | | | | 15.6% |
| AAA, AA, A | | | | | | | | | | | | 5.7% |
| BBB | | | | | | | | | | | | 4.1% |
| BB | | | | | | | | | | | | 2.6% |
| B | | | | | | | | | | | | 4.0% |
| CCC, CC, C | | | | | | | | | | | | 0.3% |
| Not Rated | | | | | | | | | | | | 0.9% |
| Equities | | | | | | | | | | | | 52.7% |
| Short-Term Investments and Net Other Assets | | | | | | | | | | | | 14.1% |
| | | | | | | | | | | | | 100.0% |
We have used ratings from Moody’s Investors Services, Inc. Where Moody’s ratings are not available, we have used S&P ratings. Percentages are adjusted for the effect of futures contracts, if applicable.
Distribution of investments by country of issue, as a percentage of total net assets, is as follows:
| | |
| United States of America | | 90.0% |
| United Kingdom | | 1.9% |
| Japan | | 1.1% |
| Others (individually less than 1%) | | 7.0% |
| | | 100.0% |
The information in the above tables is based on the combined investments of the fund and its pro rata share of the investments of Fidelity’s fixed income central funds.
At December 31, 2005, the fund had a capital loss carryforward of approximately $98,979,772 of which $24,358,272, $33,903,363 and $40,718,137 will expire on December 31, 2009, 2010 and 2011, respectively.
See accompanying notes which are an integral part of the financial statements.
| | |
| VIP Asset Manager Portfolio | | 40 |
| VIP Asset Manager Portfolio | | | | | | |
| |
| Financial Statements | | | | | | |
| |
| |
| Statement of Assets and Liabilities | | | | | | |
| | | December 31, 2005 |
| |
| Assets | | | | | | |
| Investment in securities, at value (including securities loaned of $956,020) — See accompanying schedule: | | | | | | |
| Unaffiliated issuers (cost $1,601,264,197) | | $1,774,944,307 | | | | |
| Affiliated Central Funds (cost $734,550,262) | | 739,766,467 | | | | |
| Total Investments (cost $2,335,814,459) | | | | $ | | 2,514,710,774 |
| Foreign currency held at value (cost $195,491) | | | | | | 195,491 |
| Receivable for investments sold | | | | | | 2,782,395 |
| Receivable for swap agreements | | | | | | 377 |
| Receivable for fund shares sold | | | | | | 338,296 |
| Dividends receivable | | | | | | 1,352,013 |
| Interest receivable | | | | | | 7,824,791 |
| Swap agreements, at value | | | | | | 80,096 |
| Prepaid expenses | | | | | | 12,820 |
| Other affiliated receivables | | | | | | 39,319 |
| Other receivables | | | | | | 69,852 |
| Total assets | | | | 2,527,406,224 |
| |
| Liabilities | | | | | | |
| Payable for investments purchased | | | | | | |
| Regular delivery | | $ 1,631,251 | | | | |
| Delayed delivery | | 23,036,558 | | | | |
| Payable for fund shares redeemed | | 2,288,941 | | | | |
| Accrued management fee | | 1,087,377 | | | | |
| Distribution fees payable | | 13,016 | | | | |
| Payable for daily variation on futures contracts | | 559,150 | | | | |
| Other affiliated payables | | 296,670 | | | | |
| Other payables and accrued expenses | | 98,555 | | | | |
| Collateral on securities loaned, at value | | 1,004,333 | | | | |
| Total liabilities | | | | | | 30,015,851 |
| |
| Net Assets | | | | $ | | 2,497,390,373 |
| Net Assets consist of: | | | | | | |
| Paid in capital | | | | $ | | 2,364,194,972 |
| Undistributed net investment income | | | | | | 63,399,938 |
| Accumulated undistributed net realized gain (loss) on investments and foreign currency transactions | | | | | | (108,218,421) |
| Net unrealized appreciation (depreciation) on investments and assets and liabilities in foreign currencies | | | | | | 178,013,884 |
| Net Assets | | | | $ | | 2,497,390,373 |
| |
| Statement of Assets and Liabilities continued | | | | | | |
| | | December 31, 2005 |
| |
| Initial Class: | | | | | | |
| Net Asset Value, offering price and redemption price per share ($2,407,112,796 ÷ 160,064,069 shares) | | | | $ | | 15.04 |
| Service Class: | | | | | | |
| Net Asset Value, offering price and redemption price per share ($29,382,285 ÷ 1,966,743 shares) | | | | $ | | 14.94 |
| Service Class 2: | | | | | | |
| Net Asset Value, offering price and redemption price per share ($51,573,691 ÷ 3,481,099 shares) | | | | $ | | 14.82 |
| Investor Class: | | | | | | |
| Net Asset Value, offering price and redemption price per share ($9,321,601 ÷ 620,396 shares) | | | | $ | | 15.03 |
| | | | | | | |
See accompanying notes which are an integral part of the financial statements.
|
41 Annual Report
| VIP Asset Manager Portfolio | | | | | | | | |
| Financial Statements - continued | | | | | | | | |
| |
| |
| Statement of Operations | | | | | | | | |
| | | | | Year ended December 31, 2005 |
| |
| Investment Income | | | | | | | | |
| Dividends | | | | | | $ | | 23,425,274 |
| Interest | | | | | | | | 31,420,318 |
| Income from affiliated Central Funds | | | | | | | | 29,388,541 |
| Total income | | | | | | | | 84,234,133 |
| |
| Expenses | | | | | | | | |
| Management fee | | $ | | 13,602,603 | | | | |
| Transfer agent fees | | | | 1,749,255 | | | | |
| Distribution fees | | | | 142,032 | | | | |
| Accounting and security lending fees | | | | 822,194 | | | | |
| Independent trustees’ compensation | | | | 11,802 | | | | |
| Appreciation in deferred trustee compensation account | | | | 5,010 | | | | |
| Custodian fees and expenses | | | | 208,944 | | | | |
| Audit | | | | 70,586 | | | | |
| Legal | | | | 12,541 | | | | |
| Miscellaneous | | | | 192,656 | | | | |
| Total expenses before reductions | | | | 16,817,623 | | | | |
| Expense reductions | | | | (268,590) | | | | 16,549,033 |
| |
| Net investment income (loss) | | | | | | | | 67,685,100 |
| Realized and Unrealized Gain (Loss) | | | | | | | | |
| Net realized gain (loss) on: | | | | | | | | |
| Investment securities: | | | | | | | | |
| Unaffiliated issuers | | | | 70,388,660 | | | | |
| Foreign currency transactions | | | | 45,301 | | | | |
| Futures contracts | | | | 3,906,857 | | | | |
| Swap agreements | | | | (481,184) | | | | |
| Total net realized gain (loss) | | | | | | | | 73,859,634 |
| Change in net unrealized appreciation (depreciation) on: | | | | | | | | |
| Investment securities | | | | (42,012,963) | | | | |
| Assets and liabilities in foreign currencies | | | | (102,392) | | | | |
| Futures contracts | | | | (2,152,569) | | | | |
| Swap agreements | | | | 391,545 | | | | |
| Total change in net unrealized appreciation (depreciation) | | | | | | | | (43,876,379) |
| Net gain (loss) | | | | | | | | 29,983,255 |
| Net increase (decrease) in net assets resulting from operations | | | | | | $ | | 97,668,355 |
| |
| Statement of Changes in Net Assets | | | | | | | | |
| | | | | Year ended | | | | Year ended |
| | | | | December 31, | | | | December 31, |
| | | | | 2005 | | | | 2004 |
| Increase (Decrease) in Net Assets | | | | | | | | |
| Operations | | | | | | | | |
| Net investment income (loss) | | $ | | 67,685,100 | | $ | | 73,103,026 |
| Net realized gain (loss) | | | | 73,859,634 | | | | 76,478,625 |
| Change in net unrealized appreciation (depreciation) | | | | (43,876,379) | | | | 577,366 |
| Net increase (decrease) in net assets resulting from operations | | | | 97,668,355 | | | | 150,159,017 |
| Distributions to shareholders from net investment income | | | | (72,542,784) | | | | (81,683,788) |
| Distributions to shareholders from net realized gain | | | | (931,463) | | | | — |
| Total distributions | | | | (73,474,247) | | | | (81,683,788) |
| Share transactions — net increase (decrease) | | | | (347,778,441) | | | | (313,880,450) |
| Total increase (decrease) in net assets | | | | (323,584,333) | | | | (245,405,221) |
| |
| Net Assets | | | | | | | | |
| Beginning of period | | | | 2,820,974,706 | | | | 3,066,379,927 |
| End of period (including undistributed net investment income of $63,399,938 and undistributed net investment income | | | | | | | | |
| of $75,292,815, respectively) | | $ | | 2,497,390,373 | | $ | | 2,820,974,706 |
See accompanying notes which are an integral part of the financial statements.
| | |
| VIP Asset Manager Portfolio | | 42 |
| Financial Highlights Initial Class | | | | | | | | | | |
| |
| Years ended December 31, | | 2005 | | 2004 | | 2003 | | 2002 | | 2001 |
| Selected Per Share Data | | | | | | | | | | |
| Net asset value, beginning of period | | $ 14.85 | | $ 14.46 | | $ 12.75 | | $ 14.51 | | $ 16.01 |
| Income from Investment Operations | | | | | | | | | | |
| Net investment income (loss)C | | 38 | | .36E | | .36 | | .46 | | .51 |
| Net realized and unrealized gain (loss) | | 21 | | .42 | | 1.83 | | (1.69) | | (1.13) |
| Total from investment operations | | 59 | | .78 | | 2.19 | | (1.23) | | (.62) |
| Distributions from net investment income | | (.39) | | (.39) | | (.48) | | (.53) | | (.64) |
| Distributions from net realized gain | | (.01) | | — | | — | | — | | (.24) |
| Total distributions | | (.40)G | | (.39) | | (.48) | | (.53) | | (.88) |
| Net asset value, end of period | | $ 15.04 | | $ 14.85 | | $ 14.46 | | $ 12.75 | | $ 14.51 |
| Total ReturnA,B | | 4.04% | | 5.47% | | 17.97% | | (8.73)% | | (4.15)% |
| Ratios to Average Net AssetsD,F | | | | | | | | | | |
| Expenses before reductions | | 64% | | .66% | | .63% | | .63% | | .64% |
| Expenses net of fee waivers, if any | | 64% | | .66% | | .63% | | .63% | | .64% |
| Expenses net of all reductions | | 63% | | .65% | | .62% | | .61% | | .63% |
| Net investment income (loss) | | 2.60% | | 2.53% | | 2.71% | | 3.49% | | 3.53% |
| Supplemental Data | | | | | | | | | | |
| Net assets, end of period (000 omitted) | | $2,407,113 | | $2,751,094 | | $3,011,837 | | $2,784,945 | | $3,547,730 |
| Portfolio turnover rate | | 44% | | 66% | | 82% | | 140% | | 108% |
A Total returns do not reflect charges attributable to your insurance company’s separate account. Inclusion of these charges would reduce the total returns shown.
B Total returns would have been lower had certain expenses not been reduced during the periods shown.
C Calculated based on average shares outstanding during the period.
D Amounts do not include the activity of the affiliated central funds.
E Investment income per share reflects a special dividend which amounted to $.04 per share.
F Expense ratios reflect operating expenses of the class. Expenses before reductions do not reflect amounts reimbursed by the investment adviser or reductions from brokerage service arrangements or other expense offset arrangements and do not
represent the amount paid by the class during periods when reimbursements or reductions occur. Expenses net of fee waivers reflect expenses after reimbursement by the investment adviser but prior to reductions from brokerage service arrange
ments or other expense offset arrangements. Expenses net of all reductions represent the net expenses paid by the class.
G Total distributions of $.40 per share is comprised of distributions from net investment income of $.39 and distributions from net realized gain of $.005 per share.
|
| Financial Highlights Service Class | | | | | | | | | | |
| |
| Years ended December 31, | | 2005 | | 2004 | | 2003 | | 2002 | | 2001 |
| Selected Per Share Data | | | | | | | | | | |
| Net asset value, beginning of period | | $ 14.75 | | $ 14.37 | | $ 12.66 | | $ 14.41 | | $ 15.91 |
| Income from Investment Operations | | | | | | | | | | |
| Net investment income (loss)C | | 36 | | .34E | | .34 | | .44 | | .49 |
| Net realized and unrealized gain (loss) | | 21 | | .42 | | 1.83 | | (1.68) | | (1.12) |
| Total from investment operations | | 57 | | .76 | | 2.17 | | (1.24) | | (.63) |
| Distributions from net investment income | | (.37) | | (.38) | | (.46) | | (.51) | | (.63) |
| Distributions from net realized gain | | (.01) | | — | | — | | — | | (.24) |
| Total distributions | | (.38)G | | (.38) | | (.46) | | (.51) | | (.87) |
| Net asset value, end of period | | $ 14.94 | | $ 14.75 | | $ 14.37 | | $ 12.66 | | $ 14.41 |
| Total ReturnA,B | | 3.93% | | 5.36% | | 17.91% | | (8.85)% | | (4.24)% |
| Ratios to Average Net AssetsD,F | | | | | | | | | | |
| Expenses before reductions | | 74% | | .77% | | .74% | | .74% | | .74% |
| Expenses net of fee waivers, if any | | 74% | | .77% | | .74% | | .74% | | .74% |
| Expenses net of all reductions | | 73% | | .76% | | .73% | | .72% | | .73% |
| Net investment income (loss) | | 2.50% | | 2.41% | | 2.59% | | 3.38% | | 3.43% |
| Supplemental Data | | | | | | | | | | |
| Net assets, end of period (000 omitted) | | $ 29,382 | | $ 33,118 | | $ 32,087 | | $ 25,692 | | $ 31,324 |
| Portfolio turnover rate | | 44% | | 66% | | 82% | | 140% | | 108% |
A Total returns do not reflect charges attributable to your insurance company’s separate account. Inclusion of these charges would reduce the total returns shown.
B Total returns would have been lower had certain expenses not been reduced during the periods shown.
C Calculated based on average shares outstanding during the period.
D Amounts do not include the activity of the affiliated central funds.
E Investment income per share reflects a special dividend which amounted to $.04 per share.
F Expense ratios reflect operating expenses of the class. Expenses before reductions do not reflect amounts reimbursed by the investment adviser or reductions from brokerage service arrangements or other expense offset arrangements and do not
represent the amount paid by the class during periods when reimbursements or reductions occur. Expenses net of fee waivers reflect expenses after reimbursement by the investment adviser but prior to reductions from brokerage service arrange
ments or other expense offset arrangements. Expenses net of all reductions represent the net expenses paid by the class.
G Total distributions of $.38 per share is comprised of distributions from net investment income of $.37 and distributions from net realized gain of $.005 per share.
|
See accompanying notes which are an integral part of the financial statements.
|
43 Annual Report
| Financial Highlights Service Class 2 | | | | | | | | | | |
| |
| Years ended December 31, | | 2005 | | 2004 | | 2003 | | 2002 | | 2001 |
| Selected Per Share Data | | | | | | | | | | |
| Net asset value, beginning of period | | $ 14.64 | | $ 14.27 | | $ 12.59 | | $ 14.36 | | $ 15.89 |
| Income from Investment Operations | | | | | | | | | | |
| Net investment income (loss)C | | 34 | | .32E | | .32 | | .41 | | .46 |
| Net realized and unrealized gain (loss) | | 21 | | .41 | | 1.81 | | (1.67) | | (1.11) |
| Total from investment operations | | 55 | | .73 | | 2.13 | | (1.26) | | (.65) |
| Distributions from net investment income | | (.37) | | (.36) | | (.45) | | (.51) | | (.64) |
| Distributions from net realized gain | | (.01) | | — | | — | | — | | (.24) |
| Total distributions | | (.37)G | | (.36) | | (.45) | | (.51) | | (.88) |
| Net asset value, end of period | | $ 14.82 | | $ 14.64 | | $ 14.27 | | $ 12.59 | | $ 14.36 |
| Total ReturnA,B | | 3.85% | | 5.18% | | 17.66% | | (9.03)% | | (4.38)% |
| Ratios to Average Net AssetsD,F | | | | | | | | | | |
| Expenses before reductions | | 90% | | .93% | | .91% | | .90% | | .90% |
| Expenses net of fee waivers, if any | | 90% | | .93% | | .91% | | .90% | | .90% |
| Expenses net of all reductions | | 89% | | .92% | | .89% | | .88% | | .89% |
| Net investment income (loss) | | 2.34% | | 2.25% | | 2.43% | | 3.22% | | 3.27% |
| Supplemental Data | | | | | | | | | | |
| Net assets, end of period (000 omitted) | | $ 51,574 | | $ 36,763 | | $ 22,456 | | $ 16,367 | | $ 11,993 |
| Portfolio turnover rate | | 44% | | 66% | | 82% | | 140% | | 108% |
A Total returns do not reflect charges attributable to your insurance company’s separate account. Inclusion of these charges would reduce the total returns shown.
B Total returns would have been lower had certain expenses not been reduced during the periods shown.
C Calculated based on average shares outstanding during the period.
D Amounts do not include the activity of the affiliated central funds.
E Investment income per share reflects a special dividend which amounted to $.04 per share.
F Expense ratios reflect operating expenses of the class. Expenses before reductions do not reflect amounts reimbursed by the investment adviser or reductions from brokerage service arrangements or other expense offset arrangements and do not
represent the amount paid by the class during periods when reimbursements or reductions occur. Expenses net of fee waivers reflect expenses after reimbursement by the investment adviser but prior to reductions from brokerage service arrange
ments or other expense offset arrangements. Expenses net of all reductions represent the net expenses paid by the class.
G Total distributions of $.37 per share is comprised of distributions from net investment income of $.365 and distributions from net realized gains of $.005 per share.
|
| Financial Highlights Investor Class | | |
| |
| Year ended December 31, | | 2005G |
| Selected Per Share Data | | |
| Net asset value, beginning of period | | $ 14.63 |
| Income from Investment Operations | | |
| Net investment income (loss)E | | 16 |
| Net realized and unrealized gain (loss) | | 24 |
| Total from investment operations | | 40 |
| Net asset value, end of period | | $ 15.03 |
| Total ReturnB,C,D | | 2.73% |
| Ratios to Average Net AssetsF,H | | |
| Expenses before reductions | | 82%A |
| Expenses net of fee waivers, if any | | 82%A |
| Expenses net of all reductions | | 81%A |
| Net investment income (loss) | | 2.52%A |
| Supplemental Data | | |
| Net assets, end of period (000 omitted) | | $ 9,322 |
| Portfolio turnover rate | | 44% |
A Annualized
B Total returns for periods of less than one year are not annualized.
C Total returns do not reflect charges attributable to your insurance company’s separate account. Inclusion of these charges would reduce the total returns shown.
D Total returns would have been lower had certain expenses not been reduced during the periods shown.
E Calculated based on average shares outstanding during the period.
F Amounts do not include the activity of the affiliated central funds.
G For the period July 21, 2005 (commencement of sale of shares) to December 31, 2005.
H Expense ratios reflect operating expenses of the class. Expenses before reductions do not reflect amounts reimbursed by the investment adviser or reductions from brokerage service arrangements or other expense offset arrangements and do not
represent the amount paid by the class during periods when reimbursements or reductions occur. Expense ratios before reductions for start up periods may not be representative of longer term operating periods. Expenses net of fee waivers reflect
expenses after reimbursement by the investment adviser but prior to reductions from brokerage service arrangements or other expense offset arrangements. Expenses net of all reductions represent the net expenses paid by the class.
|
See accompanying notes which are an integral part of the financial statements.
| | |
| VIP Asset Manager Portfolio | | 44 |
VIP Asset Manager: Growth Portfolio
Performance: The Bottom Line
|
Average annual total return reflects the change in the value of an investment, assuming reinvestment of the class’ dividend income and capital gains (the profits earned upon the sale of securities that have grown in value) and assuming a constant rate of performance each year. During periods of reimbursement by Fidelity, a fund’s total return will be greater than it would be had the reimbursement not occurred. Performance numbers are net of all underlying fund operating expenses, but do not include any insurance charges imposed by your insurance company’s separate account. If performance information included the effect of these additional charges, the total returns would have been lower. How a fund did yesterday is no guarantee of how it will do tomorrow.
| Average Annual Total Returns | | | | | | |
| Periods ended December 31, 2005 | | Past 1 | | Past 5 | | Past 10 |
| | | | | year | | years | | years |
| VIP Asset Mgr: Growth - Initial Class | | 3.89% | | 1.22% | | 6.58% |
| VIP Asset Mgr: Growth - Service ClassA | | 3.79% | | 1.10% | | 6.46% |
| VIP Asset Mgr: Growth - Service Class 2B | | 3.65% | | 0.92% | | 6.35% |
| VIP Asset Mgr: Growth - Investor ClassC | | 3.81% | | 1.20% | | 6.57% |
| | A The initial offering of Service Class shares took place on November 3, 1997. Performance for Service Class shares reflects an asset based service fee (12b 1 fee), and re
turns prior to November 3, 1997 are those of Initial Class and do not include the effects of Service Class’ 12b 1 fee. Had Service Class shares’ 12b 1 fee been reflected, returns
prior to November 3, 1997 would have been lower.
B The initial offering of Service Class 2 shares took place on January 12, 2000. Performance for Service Class 2 shares reflects an asset based service fee (12b 1 fee). Re
turns from November 3, 1997 to January 12, 2000 are those of Service Class which reflect a different 12b 1 fee. Service Class 2 returns prior to November 3, 1997 are those of Ini
tial Class and do not include the effects of a 12b 1 fee. Had Service Class 2’s 12b 1 fee been reflected, returns prior to January 12, 2000 would have been lower.
C The initial offering of Investor Class shares took place on July 21, 2005. Returns prior to July 21, 2005 are those of Initial Class. If Investor Class’s transfer agent fee
had been reflected, returns prior to July 21, 2005 would have been lower.
|
$10,000 Over 10 Years
Let’s say hypothetically that $10,000 was invested in VIP Asset Manager: Growth Portfolio Initial Class on December 31, 1995. The chart shows how the value of your investment would have changed, and also shows how the S&P 500® Index performed over the same period.
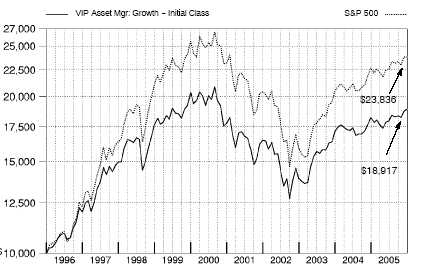
45 Annual Report
VIP Asset Manager: Growth Portfolio
Management’s Discussion of Fund Performance
|
Comments from Richard Habermann and Ford O’Neil, Co Managers of VIP Asset Manager: Growth Portfolio
U.S. equities outperformed investment grade and high yield debt during the 12 month period ending December 31, 2005, a positive year for all three asset classes. Energy and utilities were the two best performing equity market sectors, and significant contributors to the 4.91% gain of the Standard & Poor’s 500SM Index. Elsewhere, the NASDAQ Composite® Index returned 2.13%, while the Dow Jones Industrial AverageSM rose 1.72% . The investment grade bond market also ended 2005 in the black, marking six consecutive years of gains for the debt category. However, the 2.43% advance of the Lehman Brothers®Aggregate Bond Index was its lowest return in that streak, which reflects the trying investment conditions bonds encountered in the form of higher interest rates and rising inflation. Amid the uncertainty, Treasuries outperformed corporate, agency and mortgage backed debt. High yield also struggled, rising only 2.74% according to the Merrill Lynch® U.S. High Yield Master II Index. Intermittent weakness in the automotive and air transportation industries tempered high yield debt performance.
VIP Asset Manager: Growth finished the year ending December 31, 2005, modestly behind both the Fidelity Asset Manager: Growth Composite Index, which rose 4.27%, and the LipperSM Variable Annuity Flexible Portfolio Funds Average, which returned 4.88% . (For specific portfolio performance results, please refer to the performance section of this report.) It paid to overweight stocks and high yield securities relative to the index, while under weighting investment grade debt. Within the equity allocation, a modest stake in foreign stocks was a significant positive, while overweighting cash detracted slightly versus the index. Despite a solid showing in the second half of 2005, the fund’s domestic equities trailed the S&P 500® for the year overall and were the biggest drag on relative performance. The subportfolio was hurt by underweighting surging energy and utilities stocks, as well as by fears of a slowdown in consumer spending caused by rapidly rising oil prices. Weak stock picking in banks and pockets of technology further de tracted, led by overweightings in mortgage giant Fannie Mae and security software provider Symantec, respectively. Another major holding that disappointed was retailer Home Depot. Conversely, some good picks among health care and consumer related stocks provided most of the upside, led by medical supplier Cardinal Health and pharmacy chain CVS. In fixed income, good sector selection helped our collective bond holdings comfortably outpace the Lehman Brothers index. The strategic cash portion of the fund topped its benchmark as well.
Note to shareholders: Effective January 17, 2006, Robert Bertelson will assume responsibility for managing the fund’s domestic equity subportfolio.
The views expressed in this statement reflect those of the portfolio managers only through the end of the period of the report as stated on the cover and do not necessarily represent the views of Fidelity or any other person in the Fidelity organization. Any such views are subject to change at any time based upon market or other conditions and Fidelity disclaims any responsibility to update such views. These views may not be relied on as invest ment advice and, because investment decisions for a Fidelity fund are based on numerous factors, may not be relied on as an indication of trading intent on behalf of any Fidelity fund.
VIP Asset Manager: Growth Portfolio 46
| VIP Asset Manager: Growth Portfolio | | |
| Investment Changes | | |
| |
| Top Ten Stocks as of December 31, 2005 |
| | | % of fund’s | | % of fund’s net assets |
| | | net assets | | 6 months ago |
| Cardinal Health, Inc. | | 4.7 | | 4.0 |
| American International Group, | | | | |
| Inc. | | 4.0 | | 3.6 |
| Home Depot, Inc. | | 3.6 | | 3.6 |
| Wyeth | | 3.0 | | 2.8 |
| Microsoft Corp. | | 3.0 | | 3.0 |
| AT&T, Inc. | | 2.9 | | 2.9 |
| Clear Channel Communications, | | | | |
| Inc. | | 2.6 | | 2.5 |
| Wal Mart Stores, Inc. | | 2.4 | | 0.7 |
| Bank of America Corp. | | 2.0 | | 0.8 |
| General Electric Co. | | 1.9 | | 2.5 |
| | | 30.1 | | |
Market Sectors as of December 31, 2005 |
| (stocks only) | | % of fund’s | | % of fund’s net assets |
| | | net assets | | 6 months ago |
| Financials | | 15.4 | | 16.3 |
| Health Care | | 12.1 | | 12.0 |
| Information Technology | | 11.3 | | 12.4 |
| Consumer Discretionary | | 8.4 | | 8.8 |
| Consumer Staples | | 6.0 | | 5.5 |
| Industrials | | 4.9 | | 5.9 |
| Telecommunication Services | | 4.6 | | 4.9 |
| Energy | | 3.7 | | 3.6 |
| Materials | | 0.4 | | 0.6 |
| Utilities | | 0.3 | | 0.4 |

Asset allocations in the pie chart reflect the categorization of assets as defined in the fund’s prospectus in effect as of the time period indicated above. Financial Statement categorizations conform to accounting standards and will differ from the pie chart. Percentages are adjusted for the effect of futures contracts and swap contracts, if applicable.
The information in the above tables is based on the combined investments of the fund and its pro rata shares of the investments of Fidelity’s fixed income central funds.
For an unaudited list of holdings for each fixed income central fund, visit advisor.fidelity.com.
47 Annual Report
| VIP Asset Manager: Growth Portfolio | | | | | | | | |
| Investments December 31, 2005 | | | | |
| Showing Percentage of Net Assets | | | | | | | | |
| |
| Common Stocks 67.1% | | | | | | | | |
| | | | | | | | | Shares | | Value (Note 1) |
| |
| CONSUMER DISCRETIONARY 8.4% | | | | | | | | |
| Automobiles – 0.1% | | | | | | | | | | |
| Harley Davidson, Inc. | | | | | | | | 2,300 | | $ 118,427 |
| Hotels, Restaurants & Leisure 0.4% | | | | | | | | |
| Carnival Corp. unit | | | | | | | | 7,700 | | 411,719 |
| McDonald’s Corp. | | | | | | | | 15,400 | | 519,288 |
| Royal Caribbean Cruises Ltd. | | | | | | | | 4,200 | | 189,252 |
| | | | | | | | | | | 1,120,259 |
| Media 4.0% | | | | | | | | | | |
| CCE Spinco, Inc. (a) | | | | | | | | 27,838 | | 364,671 |
| Clear Channel Communications, Inc. | | | | | | 222,700 | | 7,003,915 |
| Clear Channel Outdoor Holding, Inc. Class A | | | | | | 21,200 | | 425,060 |
| E.W. Scripps Co. Class A | | | | | | | | 4,900 | | 235,298 |
| Lagardere S.C.A. (Reg.) | | | | | | | | 3,600 | | 277,021 |
| News Corp. Class A | | | | | | | | 72,600 | | 1,128,930 |
| Omnicom Group, Inc. | | | | | | | | 14,843 | | 1,263,585 |
| Vivendi Universal SA sponsored ADR | | | | | | 9,000 | | 282,870 |
| | | | | | | | | | | 10,981,350 |
| Specialty Retail 3.9% | | | | | | | | | | |
| Home Depot, Inc. | | | | | | | | 242,600 | | 9,820,448 |
| TJX Companies, Inc. | | | | | | | | 35,500 | | 824,665 |
| | | | | | | | | | | 10,645,113 |
| |
| TOTAL CONSUMER DISCRETIONARY | | | | | | | | 22,865,149 |
| |
| CONSUMER STAPLES 6.0% | | | | | | | | | | |
| Beverages 0.1% | | | | | | | | | | |
| Pernod Ricard SA | | | | | | | | 2,000 | | 348,999 |
| Food & Staples Retailing – 4.2% | | | | | | | | |
| CVS Corp. | | | | | | | | 138,800 | | 3,667,096 |
| Safeway, Inc. | | | | | | | | 37,800 | | 894,348 |
| Tesco PLC | | | | | | | | 62,000 | | 353,830 |
| Wal Mart Stores, Inc. | | | | | | | | 140,100 | | 6,556,680 |
| | | | | | | | | | | 11,471,954 |
| Household Products – 0.2% | | | | | | | | | | |
| Colgate Palmolive Co. | | | | | | | | 9,400 | | 515,590 |
| Personal Products 0.5% | | | | | | | | | | |
| Alberto Culver Co. | | | | | | | | 23,700 | | 1,084,275 |
| Avon Products, Inc. | | | | | | | | 7,000 | | 199,850 |
| | | | | | | | | | | 1,284,125 |
| Tobacco – 1.0% | | | | | | | | | | |
| Altria Group, Inc. | | | | | | | | 36,400 | | 2,719,808 |
| |
| TOTAL CONSUMER STAPLES | | | | | | | | | | 16,340,476 |
| |
| ENERGY 3.7% | | | | | | | | | | |
| Energy Equipment & Services – 2.0% | | | | | | | | |
| Diamond Offshore Drilling, Inc. | | | | | | | | 21,900 | | 1,523,364 |
| ENSCO International, Inc. | | | | | | | | 21,100 | | 935,785 |
See accompanying notes which are an integral part of the financial statements.
| | |
| VIP Asset Manager: Growth Portfolio | | 48 |
| | | | | Shares | | Value (Note 1) |
| GlobalSantaFe Corp. | | | | 33,600 | | $ 1,617,840 |
| Transocean, Inc. (a) | | | | 20,900 | | 1,456,521 |
| | | | | | | 5,533,510 |
| Oil, Gas & Consumable Fuels 1.7% | | | | | | |
| BP PLC | | | | 34,300 | | 367,125 |
| Canadian Natural Resources Ltd. | | | | 7,400 | | 366,833 |
| ConocoPhillips | | | | 9,300 | | 541,074 |
| EnCana Corp. | | | | 7,400 | | 334,561 |
| Exxon Mobil Corp. | | | | 27,600 | | 1,550,292 |
| OMV AG | | | | 3,000 | | 175,802 |
| Statoil ASA | | | | 6,600 | | 151,666 |
| Talisman Energy, Inc. | | | | 5,100 | | 270,234 |
| Total SA Series B | | | | 3,070 | | 776,096 |
| | | | | | | 4,533,683 |
| |
| TOTAL ENERGY | | | | | | 10,067,193 |
| |
| FINANCIALS 15.4% | | | | | | |
| Capital Markets 2.0% | | | | | | |
| Credit Suisse Group (Reg.) | | | | 7,583 | | 386,354 |
| Goldman Sachs Group, Inc. | | | | 8,600 | | 1,098,306 |
| Merrill Lynch & Co., Inc. | | | | 32,100 | | 2,174,133 |
| Morgan Stanley | | | | 4,900 | | 278,026 |
| Nikko Cordial Corp. | | | | 55,000 | | 871,380 |
| Nuveen Investments, Inc. Class A | | | | 6,100 | | 259,982 |
| UBS AG (NY Shares) | | | | 4,100 | | 390,115 |
| | | | | | | 5,458,296 |
| Commercial Banks – 3.1% | | | | | | |
| Banca Intesa Spa | | | | 29,200 | | 154,694 |
| Bank of America Corp. | | | | 115,628 | | 5,336,232 |
| BNP Paribas SA | | | | 3,500 | | 283,207 |
| FirstRand Ltd. | | | | 28,900 | | 84,268 |
| Shinhan Financial Group Co. Ltd. | | | | 2,160 | | 88,008 |
| Sumitomo Mitsui Financial Group, Inc. | | | | 59 | | 625,504 |
| Synovus Financial Corp. | | | | 10,200 | | 275,502 |
| Wachovia Corp. | | | | 31,031 | | 1,640,304 |
| Wells Fargo & Co. | | | | 1,000 | | 62,830 |
| | | | | | | 8,550,549 |
| Consumer Finance – 0.3% | | | | | | |
| Capital One Financial Corp. | | | | 3,100 | | 267,840 |
| Credit Saison Co. Ltd. | | | | 5,100 | | 254,773 |
| MBNA Corp. | | | | 10,700 | | 290,505 |
| | | | | | | 813,118 |
| Diversified Financial Services – 1.1% | | | | | | |
| Citigroup, Inc. | | | | 56,400 | | 2,737,092 |
| ING Groep NV (Certificaten Van Aandelen) | | | | 9,600 | | 334,272 |
| | | | | | | 3,071,364 |
| Insurance – 7.9% | | | | | | |
| ACE Ltd. | | | | 27,700 | | 1,480,288 |
| AFLAC, Inc. | | | | 3,200 | | 148,544 |
| Allianz AG (Reg.) | | | | 1,400 | | 211,960 |
| |
See accompanying notes which are an integral part of the financial statements.
| | | | | | |
| | | 49 | | | | Annual Report |
49
| VIP Asset Manager: Growth Portfolio | | | | |
| Investments - continued | | | | |
| |
| |
| Common Stocks continued | | | | |
| | | Shares | | Value (Note 1) |
| |
| FINANCIALS – continued | | | | |
| Insurance – continued | | | | |
| AMBAC Financial Group, Inc. | | 15,200 | | $ 1,171,312 |
| American International Group, Inc. | | 159,200 | | 10,862,216 |
| Hartford Financial Services Group, Inc. | | 40,100 | | 3,444,189 |
| MBIA, Inc. | | 14,800 | | 890,368 |
| MetLife, Inc. | | 23,400 | | 1,146,600 |
| Muenchener Rueckversicherungs Gesellschaft AG (Reg.) | | 3,200 | | 433,308 |
| Swiss Reinsurance Co. (Reg.) | | 6,211 | | 454,717 |
| The Chubb Corp. | | 11,400 | | 1,113,210 |
| Transatlantic Holdings, Inc. | | 2,100 | | 141,120 |
| | | | | 21,497,832 |
| Thrifts & Mortgage Finance – 1.0% | | | | |
| Fannie Mae | | 49,843 | | 2,432,837 |
| MGIC Investment Corp. | | 5,100 | | 335,682 |
| | | | | 2,768,519 |
| |
| TOTAL FINANCIALS | | | | 42,159,678 |
| |
| HEALTH CARE 12.1% | | | | |
| Health Care Providers & Services 5.2% | | | | |
| Cardinal Health, Inc. | | 189,550 | | 13,031,545 |
| UnitedHealth Group, Inc. | | 20,700 | | 1,286,298 |
| | | | | 14,317,843 |
| Pharmaceuticals 6.9% | | | | |
| Cipla Ltd. | | 12,110 | | 120,575 |
| Johnson & Johnson | | 74,000 | | 4,447,400 |
| Novartis AG (Reg.) | | 11,583 | | 607,876 |
| Pfizer, Inc. | | 214,800 | | 5,009,136 |
| Roche Holding AG (participation certificate) | | 4,101 | | 615,774 |
| Wyeth | | 176,340 | | 8,123,984 |
| | | | | 18,924,745 |
| |
| TOTAL HEALTH CARE | | | | 33,242,588 |
| |
| INDUSTRIALS – 4.9% | | | | |
| Aerospace & Defense – 0.9% | | | | |
| Honeywell International, Inc. | | 25,230 | | 939,818 |
| Lockheed Martin Corp. | | 11,240 | | 715,201 |
| United Technologies Corp. | | 14,300 | | 799,513 |
| | | | | 2,454,532 |
| Industrial Conglomerates 3.5% | | | | |
| 3M Co. | | 34,000 | | 2,635,000 |
| General Electric Co. | | 147,480 | | 5,169,174 |
| Smiths Group PLC | | 24,800 | | 446,584 |
| Tyco International Ltd. | | 44,200 | | 1,275,612 |
| | | | | 9,526,370 |
See accompanying notes which are an integral part of the financial statements.
| | |
| VIP Asset Manager: Growth Portfolio | | 50 |
| | | | | Shares | | Value (Note 1) |
| Machinery – 0.5% | | | | | | |
| Ingersoll Rand Co. Ltd. Class A | | | | 34,000 | | $ 1,372,580 |
| Marine – 0.0% | | | | | | |
| Alexander & Baldwin, Inc. | | | | 800 | | 43,392 |
| Road & Rail 0.0% | | | | | | |
| Burlington Northern Santa Fe Corp. | | | | 1,500 | | 106,230 |
| |
| TOTAL INDUSTRIALS | | | | | | 13,503,104 |
| |
| INFORMATION TECHNOLOGY 11.3% | | | | | | |
| Communications Equipment – 1.8% | | | | | | |
| Cisco Systems, Inc. (a) | | | | 193,902 | | 3,319,602 |
| Comverse Technology, Inc. (a) | | | | 9,700 | | 257,923 |
| Motorola, Inc. | | | | 4,920 | | 111,143 |
| Nokia Corp. sponsored ADR | | | | 59,500 | | 1,088,850 |
| Research In Motion Ltd. (a) | | | | 1,800 | | 118,834 |
| | | | | | | 4,896,352 |
| Computers & Peripherals 1.6% | | | | | | |
| Dell, Inc. (a) | | | | 61,100 | | 1,832,389 |
| EMC Corp. (a) | | | | 21,500 | | 292,830 |
| International Business Machines Corp. | | | | 26,200 | | 2,153,640 |
| | | | | | | 4,278,859 |
| Electronic Equipment & Instruments – 0.3% | | | | | | |
| AU Optronics Corp. sponsored ADR | | | | 33,194 | | 498,242 |
| Flextronics International Ltd. (a) | | | | 25,300 | | 264,132 |
| Jabil Circuit, Inc. (a) | | | | 3,700 | | 137,233 |
| | | | | | | 899,607 |
| Internet Software & Services 0.2% | | | | | | |
| Yahoo! Japan Corp | | | | 311 | | 472,151 |
| IT Services 0.1% | | | | | | |
| First Data Corp. | | | | 7,500 | | 322,575 |
| Satyam Computer Services Ltd. | | | | 7,155 | | 117,363 |
| | | | | | | 439,938 |
| Office Electronics – 0.1% | | | | | | |
| Canon, Inc. | | | | 3,800 | | 223,554 |
| Semiconductors & Semiconductor Equipment – 2.8% | | | | | | |
| Advanced Semiconductor Engineering, Inc. | | | | 859,000 | | 787,653 |
| Analog Devices, Inc. | | | | 5,800 | | 208,046 |
| Applied Materials, Inc. | | | | 68,300 | | 1,225,302 |
| ASML Holding NV (NY Shares) (a) | | | | 17,500 | | 351,400 |
| Intel Corp. | | | | 108,842 | | 2,716,696 |
| KLA Tencor Corp. | | | | 8,200 | | 404,506 |
| Lam Research Corp. (a) | | | | 12,500 | | 446,000 |
| Linear Technology Corp. | | | | 3,100 | | 111,817 |
| Novellus Systems, Inc. (a) | | | | 7,900 | | 190,548 |
| STATS ChipPAC Ltd. sponsored ADR (a) | | | | 46,100 | | 313,480 |
| Taiwan Semiconductor Manufacturing Co. Ltd. sponsored ADR | | | | 25,205 | | 249,783 |
| Tokyo Electron Ltd. | | | | 11,200 | | 703,889 |
| Xilinx, Inc. | | | | 2,100 | | 52,941 |
| | | | | | | 7,762,061 |
| |
| |
| |
See accompanying notes which are an integral part of the financial statements.
| | | | | | |
| | | 51 | | | | Annual Report |
51
| VIP Asset Manager: Growth Portfolio | | | | | | |
| Investments - continued | | | | | | |
| |
| |
| Common Stocks continued | | | | | | |
| | | | | Shares | | Value (Note 1) |
| |
| INFORMATION TECHNOLOGY – continued | | | | | | |
| Software 4.4% | | | | | | | | |
| BEA Systems, Inc. (a) | | | | 53,500 | | $ | | 502,900 |
| Microsoft Corp. | | | | 310,075 | | | | 8,108,461 |
| Oracle Corp. (a) | | | | 92,700 | | | | 1,131,867 |
| Symantec Corp. (a) | | | | 131,220 | | | | 2,296,350 |
| | | | | | | | | 12,039,578 |
| |
| TOTAL INFORMATION TECHNOLOGY | | | | | | 31,012,100 |
| |
| MATERIALS 0.4% | | | | | | | | |
| Chemicals 0.3% | | | | | | | | |
| Nitto Denko Corp. | | | | 3,800 | | | | 296,188 |
| Praxair, Inc. | | | | 11,500 | | | | 609,040 |
| | | | | | | | | 905,228 |
| Metals & Mining – 0.1% | | | | | | | | |
| BHP Billiton Ltd. sponsored ADR | | | | 8,900 | | | | 297,438 |
| TOTAL MATERIALS | | | | | | | | 1,202,666 |
| |
| TELECOMMUNICATION SERVICES 4.6% | | | | | | |
| Diversified Telecommunication Services – 4.3% | | | | | | |
| AT&T, Inc. | | | | 317,200 | | | | 7,768,228 |
| BellSouth Corp. | | | | 60,300 | | | | 1,634,130 |
| Qwest Communications International, Inc. (a) | | 208,900 | | | | 1,180,285 |
| TDC AS | | | | 1,300 | | | | 77,872 |
| Verizon Communications, Inc. | | | | 33,800 | | | | 1,018,056 |
| | | | | | | | | 11,678,571 |
| Wireless Telecommunication Services – 0.3% | | | | | | |
| Sprint Nextel Corp. | | | | 24,524 | | | | 572,881 |
| Vodafone Group PLC | | | | 177,100 | | | | 380,233 |
| | | | | | | | | 953,114 |
| |
| TOTAL TELECOMMUNICATION SERVICES | | | | | | 12,631,685 |
| |
| UTILITIES 0.3% | | | | | | | | |
| Electric Utilities – 0.3% | | | | | | | | |
| E.ON AG | | | | 6,900 | | | | 714,564 |
| TOTAL COMMON STOCKS | | | | | | | | |
| (Cost $159,849,269) | | | | | | 183,739,203 |
| |
| Convertible Preferred Stocks 0.0% | | | | | | |
| |
| TELECOMMUNICATION SERVICES 0.0% | | | | | | |
| Diversified Telecommunication Services – 0.0% | | | | | | |
| Cincinnati Bell, Inc. Series B, 6.75% | | | | 1,300 | | | | 49,465 |
| TOTAL CONVERTIBLE PREFERRED STOCKS | | | | | | |
| (Cost $38,260) | | | | | | | | 49,465 |
See accompanying notes which are an integral part of the financial statements.
| | |
| VIP Asset Manager: Growth Portfolio | | 52 |
| Corporate Bonds 1.8% | | | | |
| | | Principal | | Value (Note 1) |
| | | Amount | | |
| Convertible Bonds 0.2% | | | | |
| |
| TELECOMMUNICATION SERVICES 0.2% | | | | |
| Diversified Telecommunication Services – 0.2% | | | | |
| Qwest Communications International, Inc. 3.5% 11/15/25 | | $ 530,000 | | $ 614,429 |
| Nonconvertible Bonds – 1.6% | | | | |
| |
| CONSUMER DISCRETIONARY 0.2% | | | | |
| Automobiles – 0.1% | | | | |
| Ford Motor Co.: | | | | |
| 6.625% 10/1/28 | | 10,000 | | 6,450 |
| 7.45% 7/16/31 | | 65,000 | | 44,200 |
| General Motors Corp. 8.375% 7/15/33 | | 60,000 | | 39,600 |
| | | | | 90,250 |
| Media 0.1% | | | | |
| AOL Time Warner, Inc.: | | | | |
| 6.875% 5/1/12 | | 5,000 | | 5,322 |
| 7.625% 4/15/31 | | 25,000 | | 27,841 |
| Cox Communications, Inc. 7.125% 10/1/12 | | 20,000 | | 21,430 |
| Liberty Media Corp. 8.25% 2/1/30 | | 55,000 | | 53,892 |
| News America Holdings, Inc. 7.75% 12/1/45 | | 35,000 | | 40,125 |
| News America, Inc. 6.2% 12/15/34 | | 65,000 | | 64,565 |
| Time Warner Entertainment Co. LP 8.375% 7/15/33 | | 50,000 | | 59,063 |
| | | | | 272,238 |
| Multiline Retail – 0.0% | | | | |
| The May Department Stores Co. 6.7% 7/15/34 | | 40,000 | | 42,604 |
| |
| TOTAL CONSUMER DISCRETIONARY | | | | 405,092 |
| |
| CONSUMER STAPLES 0.0% | | | | |
| Beverages 0.0% | | | | |
| FBG Finance Ltd. 5.125% 6/15/15 (c) | | 25,000 | | 24,323 |
| Molson Coors Capital Finance ULC 4.85% 9/22/10 | | 40,000 | | 39,451 |
| | | | | 63,774 |
| Food Products – 0.0% | | | | |
| H.J. Heinz Co. 6.428% 12/1/08 (c)(i) | | 35,000 | | 35,954 |
| |
| TOTAL CONSUMER STAPLES | | | | 99,728 |
| |
| ENERGY 0.2% | | | | |
| Energy Equipment & Services – 0.0% | | | | |
| Petronas Capital Ltd. 7% 5/22/12 (c) | | 55,000 | | 60,545 |
See accompanying notes which are an integral part of the financial statements.
|
53 Annual Report
53
| VIP Asset Manager: Growth Portfolio | | | | |
| Investments - continued | | | | |
| |
| |
| Corporate Bonds continued | | | | |
| | | Principal | | Value (Note 1) |
| | | Amount | | |
| Nonconvertible Bonds – continued | | | | |
| |
| ENERGY – continued | | | | |
| Oil, Gas & Consumable Fuels 0.2% | | | | |
| Amerada Hess Corp. 6.65% 8/15/11 | | $ 10,000 | | $ 10,746 |
| Duke Capital LLC: | | | | |
| 6.25% 2/15/13 | | 50,000 | | 52,071 |
| 6.75% 2/15/32 | | 55,000 | | 59,854 |
| Empresa Nacional de Petroleo 6.75% 11/15/12 (c) | | 25,000 | | 26,918 |
| EnCana Holdings Finance Corp. 5.8% 5/1/14 | | 35,000 | | 36,483 |
| Enterprise Products Operating LP 5.75% 3/1/35 | | 25,000 | | 22,986 |
| Kinder Morgan Energy Partners LP: | | | | |
| 5.125% 11/15/14 | | 10,000 | | 9,780 |
| 5.8% 3/15/35 | | 20,000 | | 19,132 |
| Nexen, Inc. 5.875% 3/10/35 | | 35,000 | | 34,416 |
| Pemex Project Funding Master Trust: | | | | |
| 5.75% 12/15/15 (c) | | 100,000 | | 99,500 |
| 6.125% 8/15/08 | | 50,000 | | 51,000 |
| 6.625% 6/15/35 (c) | | 45,000 | | 45,113 |
| 7.875% 2/1/09 (i) | | 100,000 | | 106,950 |
| | | | | 574,949 |
| |
| TOTAL ENERGY | | | | 635,494 |
| |
| FINANCIALS – 0.7% | | | | |
| Capital Markets 0.1% | | | | |
| Goldman Sachs Group, Inc. 6.6% 1/15/12 | | 125,000 | | 134,274 |
| Lazard Group LLC 7.125% 5/15/15 | | 35,000 | | 36,753 |
| Merrill Lynch & Co., Inc. 4.25% 2/8/10 | | 100,000 | | 97,272 |
| Morgan Stanley 6.6% 4/1/12 | | 90,000 | | 96,738 |
| | | | | 365,037 |
| Commercial Banks – 0.1% | | | | |
| Bank of America Corp. 7.4% 1/15/11 | | 125,000 | | 137,691 |
| Korea Development Bank 3.875% 3/2/09 | | 75,000 | | 72,565 |
| Wachovia Bank NA 4.875% 2/1/15 | | 15,000 | | 14,628 |
| Wachovia Corp. 4.875% 2/15/14 | | 25,000 | | 24,467 |
| | | | | 249,351 |
| Consumer Finance – 0.1% | | | | |
| Capital One Bank 6.5% 6/13/13 | | 25,000 | | 26,561 |
| Capital One Financial Corp. 5.5% 6/1/15 | | 25,000 | | 24,854 |
| Ford Motor Credit Co. 7.375% 2/1/11 | | 25,000 | | 21,913 |
See accompanying notes which are an integral part of the financial statements.
| | |
| VIP Asset Manager: Growth Portfolio | | 54 |
| | | Principal | | Value (Note 1) |
| | | Amount | | |
| Household Finance Corp. 4.125% 11/16/09 | | $ 20,000 | | $ 19,310 |
| Household International, Inc. 5.836% 2/15/08 | | 75,000 | | 76,243 |
| MBNA Corp. 7.5% 3/15/12 | | 45,000 | | 50,685 |
| | | | | 219,566 |
| Diversified Financial Services – 0.1% | | | | |
| JPMorgan Chase & Co. 6.75% 2/1/11 | | 100,000 | | 107,108 |
| JPMorgan Chase Capital XVII 5.85% 8/1/35 | | 105,000 | | 103,887 |
| Prime Property Funding, Inc. 5.125% 6/1/15 (c) | | 50,000 | | 48,350 |
| | | | | 259,345 |
| Insurance – 0.0% | | | | |
| Axis Capital Holdings Ltd. 5.75% 12/1/14 | | 60,000 | | 60,013 |
| Marsh & McLennan Companies, Inc. 5.75% 9/15/15 | | 20,000 | | 20,161 |
| Principal Life Global Funding I 6.25% 2/15/12 (c) | | 25,000 | | 26,556 |
| | | | | 106,730 |
| Real Estate 0.2% | | | | |
| Archstone Smith Operating Trust 5.25% 5/1/15 | | 45,000 | | 44,378 |
| Arden Realty LP 5.25% 3/1/15 | | 100,000 | | 101,043 |
| CarrAmerica Realty Corp.: | | | | |
| 5.125% 9/1/11 | | 75,000 | | 73,512 |
| 5.5% 12/15/10 | | 35,000 | | 34,947 |
| Colonial Properties Trust 5.5% 10/1/15 | | 45,000 | | 43,862 |
| Developers Diversified Realty Corp.: | | | | |
| 5% 5/3/10 | | 20,000 | | 19,705 |
| 5.25% 4/15/11 | | 10,000 | | 9,899 |
| EOP Operating LP 4.65% 10/1/10 | | 90,000 | | 87,202 |
| Regency Centers LP 6.75% 1/15/12 | | 45,000 | | 48,099 |
| Simon Property Group LP: | | | | |
| 5.1% 6/15/15 | | 30,000 | | 29,015 |
| 5.625% 8/15/14 | | 40,000 | | 40,272 |
| | | | | 531,934 |
| Thrifts & Mortgage Finance – 0.1% | | | | |
| Countrywide Home Loans, Inc. 4% 3/22/11 | | 30,000 | | 28,228 |
| Independence Community Bank Corp. 3.75% 4/1/14 (i) | | 40,000 | | 38,315 |
| Residential Capital Corp. 6.375% 6/30/10 | | 30,000 | | 30,483 |
| Washington Mutual, Inc. 4.625% 4/1/14 | | 100,000 | | 94,036 |
| | | | | 191,062 |
| |
| TOTAL FINANCIALS | | | | 1,923,025 |
See accompanying notes which are an integral part of the financial statements.
|
55 Annual Report
55
| VIP Asset Manager: Growth Portfolio | | | | |
| Investments - continued | | | | |
| |
| |
| Corporate Bonds continued | | | | |
| | | Principal | | Value (Note 1) |
| | | Amount | | |
| Nonconvertible Bonds – continued | | | | |
| |
| INDUSTRIALS – 0.1% | | | | |
| Aerospace & Defense – 0.0% | | | | |
| BAE Systems Holdings, Inc. 4.75% 8/15/10 (c) | | $ 30,000 | | $ 29,463 |
| Airlines – 0.1% | | | | |
| American Airlines, Inc. pass thru trust certificates: | | | | |
| 6.855% 10/15/10 | | 3,323 | | 3,380 |
| 6.978% 10/1/12 | | 8,328 | | 8,586 |
| 7.024% 4/15/11 | | 20,000 | | 20,506 |
| 7.858% 4/1/13 | | 25,000 | | 26,359 |
| Delta Air Lines, Inc. pass thru trust certificates 7.57% 11/18/10 | | 30,000 | | 29,559 |
| | | | | 88,390 |
| Industrial Conglomerates 0.0% | | | | |
| Hutchison Whampoa International 03/13 Ltd. 6.5% 2/13/13 (c) | | 10,000 | | 10,589 |
| Hutchison Whampoa International 03/33 Ltd. 7.45% 11/24/33 (c) | | 25,000 | | 28,876 |
| | | | | 39,465 |
| |
| TOTAL INDUSTRIALS | | | | 157,318 |
| |
| INFORMATION TECHNOLOGY 0.0% | | | | |
| Semiconductors & Semiconductor Equipment – 0.0% | | | | |
| Chartered Semiconductor Manufacturing Ltd. 6.375% 8/3/15 | | 40,000 | | 39,769 |
| |
| MATERIALS 0.0% | | | | |
| Metals & Mining – 0.0% | | | | |
| Newmont Mining Corp. 5.875% 4/1/35 | | 25,000 | | 24,671 |
| Paper & Forest Products 0.0% | | | | |
| International Paper Co. 4.25% 1/15/09 | | 20,000 | | 19,411 |
| |
| TOTAL MATERIALS | | | | 44,082 |
| |
| TELECOMMUNICATION SERVICES 0.2% | | | | |
| Diversified Telecommunication Services – 0.2% | | | | |
| AT&T Broadband Corp. 8.375% 3/15/13 | | 50,000 | | 57,874 |
| BellSouth Capital Funding Corp. 7.875% 2/15/30 | | 25,000 | | 30,180 |
| BellSouth Corp. 5.2% 9/15/14 | | 15,000 | | 14,920 |
| British Telecommunications PLC 8.875% 12/15/30 | | 50,000 | | 66,897 |
| SBC Communications, Inc.: | | | | |
| 6.15% 9/15/34 | | 30,000 | | 30,134 |
| 6.45% 6/15/34 | | 15,000 | | 15,609 |
| Sprint Capital Corp.: | | | | |
| 6.875% 11/15/28 | | 25,000 | | 27,317 |
See accompanying notes which are an integral part of the financial statements.
| | |
| VIP Asset Manager: Growth Portfolio | | 56 |
| | | Principal | | Value (Note 1) |
| | | Amount | | |
| 8.375% 3/15/12 | | $ 25,000 | | $ 28,974 |
| Telecom Italia Capital: | | | | |
| 4.95% 9/30/14 | | 25,000 | | 23,877 |
| 5.25% 11/15/13 | | 50,000 | | 49,064 |
| Verizon Global Funding Corp.: | | | | |
| 5.85% 9/15/35 | | 40,000 | | 38,547 |
| 7.75% 12/1/30 | | 30,000 | | 35,660 |
| Verizon New York, Inc. 6.875% 4/1/12 | | 5,000 | | 5,212 |
| | | | | 424,265 |
| Wireless Telecommunication Services – 0.0% | | | | |
| America Movil SA de CV 4.125% 3/1/09 | | 20,000 | | 19,440 |
| AT&T Wireless Services, Inc. 7.875% 3/1/11 | | 5,000 | | 5,610 |
| | | | | 25,050 |
| |
| TOTAL TELECOMMUNICATION SERVICES | | | | 449,315 |
| |
| UTILITIES 0.2% | | | | |
| Electric Utilities – 0.1% | | | | |
| Cleveland Electric Illuminating Co. 5.65% 12/15/13 | | 30,000 | | 30,583 |
| Exelon Corp.: | | | | |
| 4.9% 6/15/15 | | 40,000 | | 38,175 |
| 6.75% 5/1/11 | | 30,000 | | 31,939 |
| FirstEnergy Corp. 6.45% 11/15/11 | | 15,000 | | 15,900 |
| Progress Energy, Inc. 7.1% 3/1/11 | | 50,000 | | 53,946 |
| TXU Energy Co. LLC 7% 3/15/13 | | 80,000 | | 85,253 |
| | | | | 255,796 |
| Independent Power Producers & Energy Traders 0.0% | | | | |
| Constellation Energy Group, Inc. 7% 4/1/12 | | 55,000 | | 60,010 |
| Multi-Utilities – 0.1% | | | | |
| Dominion Resources, Inc.: | | | | |
| 4.75% 12/15/10 | | 30,000 | | 29,319 |
| 5.95% 6/15/35 | | 30,000 | | 29,283 |
| 6.25% 6/30/12 | | 45,000 | | 47,079 |
| MidAmerican Energy Holdings, Inc. 5.875% 10/1/12 | | 40,000 | | 41,295 |
| | | | | 146,976 |
| |
| TOTAL UTILITIES | | | | 462,782 |
| |
| TOTAL NONCONVERTIBLE BONDS | | | | 4,216,605 |
| |
| TOTAL CORPORATE BONDS | | | | |
| (Cost $4,739,792) | | | | 4,831,034 |
See accompanying notes which are an integral part of the financial statements.
|
57 Annual Report
57
| VIP Asset Manager: Growth Portfolio | | | | | | |
| Investments - continued | | | | | | |
| |
| |
| U.S. Government and Government Agency Obligations 3.1% | | | | |
| | | | | Principal | | Value (Note 1) |
| | | | | Amount | | |
| U.S. Government Agency Obligations – 0.5% | | | | | | |
| Fannie Mae: | | | | | | |
| 3.25% 1/15/08 | | | | $ 71,000 | | $ 68,972 |
| 3.25% 8/15/08 | | | | 90,000 | | 86,771 |
| 3.25% 2/15/09 | | | | 270,000 | | 258,609 |
| 3.375% 12/15/08 | | | | 29,000 | | 27,951 |
| 4.625% 5/1/13 | | | | 200,000 | | 194,239 |
| 4.75% 12/15/10 | | | | 165,000 | | 165,002 |
| 5.5% 3/15/11 | | | | 35,000 | | 36,178 |
| 6.25% 2/1/11 | | | | 105,000 | | 110,892 |
| Freddie Mac: | | | | | | |
| 4% 6/12/13 | | | | 87,000 | | 82,249 |
| 5.875% 3/21/11 | | | | 170,000 | | 177,147 |
| |
| TOTAL U.S. GOVERNMENT AGENCY OBLIGATIONS | | | | | | 1,208,010 |
| U.S. Treasury Inflation Protected Obligations – 0.5% | | | | | | |
| U.S. Treasury Inflation Indexed Bonds 2.375% 1/15/25 | | | | 211,342 | | 222,442 |
| U.S. Treasury Inflation Indexed Notes: | | | | | | |
| 0.875% 4/15/10 | | | | 210,284 | | 199,970 |
| 2% 1/15/14 | | | | 1,024,100 | | 1,018,429 |
| |
| TOTAL U.S. TREASURY INFLATION PROTECTED OBLIGATIONS | | | | | | 1,440,841 |
| U.S. Treasury Obligations – 2.1% | | | | | | |
| U.S. Treasury Bills, yield at date of purchase 3.67% to 3.98% 1/12/06 to 3/9/06 (e) | | 800,000 | | 795,890 |
| U.S. Treasury Bonds 6.25% 5/15/30 | | | | 255,000 | | 316,698 |
| U.S. Treasury Notes: | | | | | | |
| 3.875% 7/31/07 | | | | 291,000 | | 288,636 |
| 4.375% 12/15/10 | | | | 25,000 | | 25,020 |
| 4.75% 5/15/14 | | | | 620,000 | | 635,088 |
| 6.5% 2/15/10 | | | | 3,400,000 | | 3,667,617 |
| |
| TOTAL U.S. TREASURY OBLIGATIONS | | | | | | 5,728,949 |
| |
| TOTAL U.S. GOVERNMENT AND GOVERNMENT AGENCY OBLIGATIONS | | | | |
| (Cost $8,407,767) | | | | | | 8,377,800 |
| |
| U.S. Government Agency | | | | | | |
| Mortgage Securities 2.8% | | | | | | |
| |
| Fannie Mae – 2.6% | | | | | | |
| 3.477% 4/1/34 (i) | | | | 18,807 | | 18,690 |
| 3.726% 1/1/35 (i) | | | | 20,517 | | 20,221 |
| 3.793% 6/1/34 (i) | | | | 20,948 | | 20,189 |
| 3.83% 1/1/35 (i) | | | | 19,131 | | 18,891 |
| 3.889% 12/1/34 (i) | | | | 20,109 | | 20,086 |
| 3.952% 5/1/34 (i) | | | | 10,777 | | 10,939 |
See accompanying notes which are an integral part of the financial statements.
| | |
| VIP Asset Manager: Growth Portfolio | | 58 |
| | | | | Principal | | Value (Note 1) |
| | | | | Amount | | |
| 3.964% 1/1/35 (i) | | | | $ | | 18,864 | | $ | | 18,696 |
| 3.993% 1/1/35 (i) | | | | | | 18,777 | | | | 18,642 |
| 4.029% 2/1/35 (i) | | | | | | 19,807 | | | | 19,608 |
| 4.034% 10/1/18 (i) | | | | | | 13,025 | | | | 12,783 |
| 4.037% 1/1/35 (i) | | | | | | 20,509 | | | | 20,378 |
| 4.095% 2/1/35 (i) | | | | | | 19,626 | | | | 19,489 |
| 4.099% 2/1/35 (i) | | | | | | 19,401 | | | | 19,229 |
| 4.101% 2/1/35 (i) | | | | | | 19,752 | | | | 19,579 |
| 4.105% 2/1/35 (i) | | | | | | 19,070 | | | | 18,923 |
| 4.111% 1/1/35 (i) | | | | | | 7,259 | | | | 7,187 |
| 4.122% 1/1/35 (i) | | | | | | 20,246 | | | | 20,063 |
| 4.123% 1/1/35 (i) | | | | | | 18,538 | | | | 18,481 |
| 4.126% 2/1/35 (i) | | | | | | 19,429 | | | | 19,377 |
| 4.161% 2/1/35 (i) | | | | | | 20,018 | | | | 19,836 |
| 4.176% 1/1/35 (i) | | | | | | 17,716 | | | | 17,581 |
| 4.176% 1/1/35 (i) | | | | | | 19,117 | | | | 18,959 |
| 4.196% 11/1/34 (i) | | | | | | 42,971 | | | | 43,419 |
| 4.205% 3/1/34 (i) | | | | | | 16,647 | | | | 16,407 |
| 4.272% 10/1/34 (i) | | | | | | 74,681 | | | | 74,385 |
| 4.288% 8/1/33 (i) | | | | | | 10,572 | | | | 10,451 |
| 4.291% 1/1/35 (i) | | | | | | 20,544 | | | | 20,299 |
| 4.299% 3/1/35 (i) | | | | | | 21,153 | | | | 20,990 |
| 4.332% 1/1/35 (i) | | | | | | 18,837 | | | | 18,574 |
| 4.447% 4/1/34 (i) | | | | | | 13,269 | | | | 13,206 |
| 4.467% 8/1/34 (i) | | | | | | 18,820 | | | | 18,604 |
| 4.48% 1/1/35 (i) | | | | | | 17,462 | | | | 17,383 |
| 4.5% 5/1/19 to 10/1/33 | | | | | | 1,260,105 | | | | 1,197,365 |
| 4.5% 1/1/21 (d) | | | | | | 522,483 | | | | 508,278 |
| 4.5% 1/1/21 (d) | | | | | | 120,000 | | | | 116,738 |
| 4.5% 1/1/36 (d) | | | | | | 400,000 | | | | 376,750 |
| 4.522% 3/1/35 (i) | | | | | | 22,964 | | | | 22,634 |
| 4.545% 2/1/35 (i) | | | | | | 19,522 | | | | 19,424 |
| 4.545% 7/1/35 (i) | | | | | | 22,339 | | | | 22,174 |
| 4.674% 11/1/34 (i) | | | | | | 20,485 | | | | 20,333 |
| 4.695% 3/1/35 (i) | | | | | | 27,045 | | | | 26,948 |
| 4.729% 7/1/34 (i) | | | | | | 16,874 | | | | 16,754 |
| 4.816% 12/1/32 (i) | | | | | | 19,108 | | | | 19,102 |
| 5% 7/1/18 | | | | | | 632,864 | | | | 627,003 |
| 5% 1/1/36 (d) | | | | | | 356,171 | | | | 345,152 |
| 5.5% 4/1/16 to 9/1/34 | | | | | | 1,919,153 | | | | 1,912,575 |
| 5.5% 1/1/36 (d) | | | | | | 400,000 | | | | 396,125 |
| 6% 4/1/13 to 4/1/33 | | | | | | 290,696 | | | | 295,100 |
| 6.5% 5/1/17 to 1/1/33 | | | | | | 528,912 | | | | 543,980 |
| 6.5% 1/1/36 (d) | | | | | | 30,447 | | | | 31,237 |
| 7.5% 5/1/24 to 2/1/28 | | | | | | 27,222 | | | | 28,591 |
| |
| TOTAL FANNIE MAE | | | | | | | | | | 7,177,808 |
| Freddie Mac 0.1% | | | | | | | | | | |
| 4.056% 12/1/34 (i) | | | | | | 18,017 | | | | 17,821 |
| 4.103% 12/1/34 (i) | | | | | | 18,515 | | | | 18,260 |
| 4.188% 1/1/35 (i) | | | | | | 15,898 | | | | 15,690 |
| 4.3% 5/1/35 (i) | | | | | | 20,973 | | | | 20,796 |
| |
See accompanying notes which are an integral part of the financial statements.
| | | | | | | | | | |
| | | 59 | | | | | | Annual Report |
59
| VIP Asset Manager: Growth Portfolio | | | | |
| Investments - continued | | | | |
| |
| |
| U.S. Government Agency | | | | |
| Mortgage Securities continued | | | | |
| | | Principal | | Value (Note 1) |
| | | Amount | | |
| Freddie Mac – continued | | | | |
| 4.364% 3/1/35 (i) | | $ 23,014 | | $ 22,568 |
| 4.39% 2/1/35 (i) | | 21,651 | | 21,448 |
| 4.445% 3/1/35 (i) | | 23,794 | | 23,350 |
| 4.49% 3/1/35 (i) | | 31,225 | | 30,803 |
| 5.017% 4/1/35 (i) | | 20,096 | | 20,068 |
| 6% 5/1/33 | | 40,208 | | 40,730 |
| 7.5% 8/1/28 | | 4,744 | | 4,992 |
| |
| TOTAL FREDDIE MAC | | | | 236,526 |
| Government National Mortgage Association – 0.1% | | | | |
| 6.5% 8/15/27 | | 62,737 | | 65,694 |
| 7% 7/15/28 to 7/15/32 | | 88,765 | | 93,257 |
| 7.5% 1/15/26 to 8/15/28 | | 43,221 | | 45,518 |
| 8.5% 11/15/30 | | 19,681 | | 21,244 |
| |
| TOTAL GOVERNMENT NATIONAL MORTGAGE ASSOCIATION | | | | 225,713 |
| |
| TOTAL U.S. GOVERNMENT AGENCY - MORTGAGE SECURITIES | | | | |
| (Cost $7,645,981) | | | | 7,640,047 |
| |
| Asset Backed Securities 0.2% | | | | |
| |
| ACE Securities Corp. Series 2005 SD1 Class A1, 4.7788% 11/25/50 (i) | | 12,455 | | 12,470 |
| Ameriquest Mortgage Securities, Inc. Series 2004 R2 Class M1, 4.8088% 4/25/34 (i) | | 5,000 | | 5,000 |
| Amortizing Residential Collateral Trust Series 2002 BC1 Class M2, 5.4788% 1/25/32 (i) | | 2,653 | | 2,664 |
| Argent Securities, Inc. Series 2004 W5 Class M1, 4.9788% 4/25/34 (i) . | | 15,000 | | 15,018 |
| Capital One Multi Asset Execution Trust: | | | | |
| Series 2003 B4 Class B4, 5.1694% 7/15/11 (i) | | 25,000 | | 25,357 |
| Series 2004 6 Class B, 4.15% 7/16/12 | | 40,000 | | 38,904 |
| CDC Mortgage Capital Trust Series 2004 HE2 Class M2, 5.5788% 7/26/34 (i) | | 10,000 | | 10,081 |
| Cendant Timeshare Receivables Funding LLC Series 2005 1A Class A1, 4.67% 5/20/17 (c) | | 12,012 | | 11,888 |
| Citibank Credit Card Issuance Trust Series 2002 C1 Class C1, 5.2806% 2/9/09 (i) | | 50,000 | | 50,412 |
See accompanying notes which are an integral part of the financial statements.
| | |
| VIP Asset Manager: Growth Portfolio | | 60 |
| | | Principal | | Value (Note 1) |
| | | Amount | | | | |
| Countrywide Home Loans, Inc.: | | | | | | |
| Series 2004 2 Class M1, 4.8788% 5/25/34 (i) | | $ 25,000 | | $ | | 25,046 |
| Series 2004 4: | | | | | | |
| Class A, 4.7488% 8/25/34 (i) | | 8,119 | | | | 8,127 |
| Class M1, 4.8588% 7/25/34 (i) | | 25,000 | | | | 25,079 |
| Class M2, 4.9088% 6/25/34 (i) | | 15,000 | | | | 15,019 |
| Series 2005 1: | | | | | | |
| Class MV1, 4.7788% 7/25/35 (i) | | 25,000 | | | | 25,000 |
| Class MV2, 4.8188% 7/25/35 (i) | | 25,000 | | | | 24,992 |
| Crown Castle Towers LLC/Crown Atlantic Holdings Sub LLC/Crown Communication, Inc. Series 2005 1A: | | | | | | |
| Class B, 4.878% 6/15/35 (c) | | 32,000 | | | | 31,164 |
| Class C, 5.074% 6/15/35 (c) | | 29,000 | | | | 28,311 |
| Discover Card Master Trust I Series 2003 4 Class B1, 4.6994% 5/16/11 (i) | | 30,000 | | | | 30,172 |
| Fremont Home Loan Trust: | | | | | | |
| Series 2004 A: | | | | | | |
| Class M1, 4.9288% 1/25/34 (i) | | 25,000 | | | | 25,077 |
| Class M2, 5.5288% 1/25/34 (i) | | 25,000 | | | | 25,302 |
| Series 2005 A: | | | | | | |
| Class M1, 4.8088% 1/25/35 (i) | | 25,000 | | | | 25,084 |
| Class M2, 4.8388% 1/25/35 (i) | | 25,000 | | | | 25,024 |
| Class M3, 4.8688% 1/25/35 (i) | | 25,000 | | | | 25,062 |
| Class M4, 5.0588% 1/25/35 (i) | | 25,000 | | | | 25,166 |
| HSBC Home Equity Loan Trust Series 2005 2: | | | | | | |
| Class M1, 4.83% 1/20/35 (i) | | 7,773 | | | | 7,774 |
| Class M2, 4.86% 1/20/35 (i) | | 7,773 | | | | 7,776 |
| Long Beach Mortgage Loan Trust Series 2004 2 Class M1, 4.9088% 6/25/34 (i) | | 25,000 | | | | 25,054 |
| Morgan Stanley Dean Witter Capital I Trust Series 2003 NC1 Class M1, 5.4288% 11/25/32 (i) | | 9,360 | | | | 9,412 |
| National Collegiate Student Loan Trust Series 2005 GT1 Class AIO, 6.75% 12/25/09 (k) | | 50,000 | | | | 11,926 |
See accompanying notes which are an integral part of the financial statements.
|
61 Annual Report
61
| VIP Asset Manager: Growth Portfolio | | | | |
| Investments - continued | | | | |
| |
| |
| Asset Backed Securities continued | | | | |
| | | Principal | | Value (Note 1) |
| | | Amount | | |
| Park Place Securities, Inc. Series 2005 WCH1 Class M2, 4.8988% 1/25/35 (i) | | $ 25,000 | | $ 25,027 |
| Volkswagen Auto Lease Trust Series 2005 A Class A4, 3.94% 10/20/10 . | | 55,000 | | 54,153 |
| TOTAL ASSET BACKED SECURITIES | | | | |
| (Cost $678,705) | | | | 676,541 |
| |
| Collateralized Mortgage Obligations 0.3% | | | | |
| |
| Private Sponsor 0.2% | | | | |
| Adjustable Rate Mortgage Trust floater: | | | | |
| Series 2005 1 Class 5A2, 4.7088% 5/25/35 (i) | | 14,571 | | 14,522 |
| Series 2005 2 Class 6A2, 4.6588% 6/25/35 (i) | | 13,890 | | 13,894 |
| Series 2005 3 Class 8A2, 4.6188% 7/25/35 (i) | | 40,290 | | 40,249 |
| Bear Stearns Alt A Trust floater Series 2005 1 Class A1, 4.6588% 1/25/35 (i) | | 27,943 | | 27,943 |
| CS First Boston Mortgage Securities Corp. floater: | | | | |
| Series 2004 AR3 Class 6A2, 4.7488% 4/25/34 (i) | | 5,785 | | 5,792 |
| Series 2004 AR5 Class 11A2, 4.7488% 6/25/34 (i) | | 8,788 | | 8,771 |
| Impac CMB Trust floater Series 2005 1: | | | | |
| Class M1, 4.8388% 4/25/35 (i) | | 19,083 | | 19,075 |
| Class M2, 4.8788% 4/25/35 (i) | | 19,083 | | 19,076 |
| Lehman Structured Securities Corp. floater Series 2005 1 Class A2, 4.59% 9/26/45 (c)(i) | | 32,953 | | 32,953 |
| Merrill Lynch Mortgage Investors, Inc. floater: | | | | |
| Series 2005 A Class A2, 4.9338% 2/25/30 (i) | | 28,694 | | 28,665 |
| Series 2005 B Class A2, 4.79% 7/25/30 (i) | | 26,612 | | 26,595 |
| Opteum Mortgage Acceptance Corp. floater Series 2005 3 Class APT, 4.6688% 7/25/35 (i) | | 22,727 | | 22,740 |
| Sequoia Mortgage Trust floater: | | | | |
| Series 2005 1 Class A2, 4.1% 2/20/35 (i) | | 20,733 | | 20,654 |
| Series 2005 2 Class A2, 4.29% 3/20/35 (i) | | 23,165 | | 23,165 |
| Thornburg Mortgage Securities Trust floater Series 2005 3 Class A4, 4.6488% 10/25/35 (i) | | 34,677 | | 34,677 |
| Wells Fargo Mortgage Backed Securities Trust: | | | | |
| Series 2005 AR10 Class 2A2, 4.1101% 6/25/35 (i) | | 40,033 | | 39,299 |
See accompanying notes which are an integral part of the financial statements.
| | |
| VIP Asset Manager: Growth Portfolio | | 62 |
| | | | | Principal | | Value (Note 1) |
| | | | | Amount | | |
| Series 2005 AR12 Class 2A6, 4.3214% 7/25/35 (i) | | $ 45,188 | | $ 44,224 |
| Series 2005 AR4 Class 2A2, 4.5345% 4/25/35 (i) | | 39,399 | | 38,616 |
| Series 2005 AR9 Class 2A1, 4.3624% 5/25/35 (i) | | 20,693 | | 20,424 |
| |
| TOTAL PRIVATE SPONSOR | | | | | | 481,334 |
| U.S. Government Agency – 0.1% | | | | | | |
| Fannie Mae planned amortization class: | | | | | | |
| Series 1999 54 Class PH, 6.5% 11/18/29 | | 100,000 | | 103,822 |
| Series 1999 57 Class PH, 6.5% 12/25/29 | | 100,000 | | 103,329 |
| Fannie Mae Grantor Trust Series 2005 90 Class FG, 4.6288% 10/25/35 (i) | | 113,906 | | 113,631 |
| Fannie Mae guaranteed REMIC pass thru certificates planned amortization class Series 2004 81 Class KC, 4.5% | | | | |
| 4/25/17 | | | | 75,000 | | 73,367 |
| |
| TOTAL U.S. GOVERNMENT AGENCY | | | | | | 394,149 |
| |
| TOTAL COLLATERALIZED MORTGAGE OBLIGATIONS | | | | |
| (Cost $853,365) | | | | | | 875,483 |
| |
| Commercial Mortgage Securities 0.3% | | | | |
| |
| Asset Securitization Corp. sequential pay Series 1995 MD4 Class A1, 7.1% 8/13/29 | | 6,367 | | 6,477 |
| Bank of America Large Loan, Inc. Series 2005 MIB1: | | | | |
| Class C, 4.6794% 3/15/22 (c)(i) | | | | 5,000 | | 5,001 |
| Class D, 4.7294% 3/15/22 (c)(i) | | | | 5,000 | | 5,001 |
| Class F, 4.8394% 3/15/22 (c)(i) | | | | 5,000 | | 5,001 |
| Class G, 4.8994% 3/15/22 (c)(i) | | | | 5,000 | | 5,001 |
| Bayview Commercial Asset Trust floater Series 2004 3 Class A1, 4.7488% 1/25/35 (c)(i) | | 45,290 | | 45,339 |
| COMM: | | | | | | |
| floater Series 2002 FL7 Class D, 4.9394% 11/15/14 (c)(i) | | 2,286 | | 2,293 |
| Series 2004 LBN2 Class X2, 1.1989% 3/10/39 (c)(i)(k) | | 56,948 | | 1,927 |
| Commercial Mortgage Pass-Through Certificates Series 2005 FL11: | | | | |
| Class B, 4.6194% 11/15/17 (c)(i) | | | | 14,999 | | 14,999 |
| Class E, 4.7594% 11/15/17 (c)(i) | | | | 5,000 | | 5,000 |
| Class F, 4.8194% 11/15/17 (c)(i) | | | | 5,000 | | 5,000 |
See accompanying notes which are an integral part of the financial statements.
|
63 Annual Report
63
| VIP Asset Manager: Growth Portfolio | | | | | | |
| Investments - continued | | | | | | |
| |
| |
| Commercial Mortgage Securities continued | | | | | | |
| | | | | Principal | | Value (Note 1) |
| | | | | Amount | | |
| CS First Boston Mortgage Securities Corp.: | | | | | | |
| sequential pay: | | | | | | |
| Series 1999 C1 Class A2, 7.29% 9/15/41 | | | $ | 50,000 | | $ 53,200 |
| Series 2004 C1 Class A3, 4.321% 1/15/37 | | | | 20,000 | | 19,281 |
| Series 1998 C1 Class D, 7.17% 5/17/40 | | | | 15,000 | | 16,231 |
| Series 2004 C1 Class ASP, 1.1065% 1/15/37 (c)(i)(k) | | | | 280,280 | | 9,098 |
| Deutsche Mortgage & Asset Receiving Corp. sequential pay Series 1998 C1 Class D, 7.231% 6/15/31 | | | | 120,000 | | 125,481 |
| Fannie Mae sequential pay Series 1999 10 Class MZ, 6.5% 9/17/38 | | | | 39,384 | | 40,640 |
| GS Mortgage Securities Corp. II: | | | | | | |
| sequential pay Series 2001 LIBA Class A2, 6.615% 2/14/16 (c) | | | | 25,000 | | 26,742 |
| Series 1998 GLII Class E, 7.1906% 4/13/31 (i) | | | | 45,000 | | 46,636 |
| Leafs CMBS I Ltd./Leafs CMBS I Corp. Series 2002 1A Class B, 4.13% 11/20/37 (c) | | | | 100,000 | | 93,131 |
| Morgan Stanley Capital I, Inc.: | | | | | | |
| sequential pay Series 2004 HQ3 Class A2, 4.05% 1/13/41 | | | | 20,000 | | 19,276 |
| Series 2005 IQ9 Class X2, 1.203% 7/15/56 (c)(i)(k) | | | | 245,000 | | 11,308 |
| Thirteen Affiliates of General Growth Properties, Inc. Series 1: | | | | | | |
| Class D2, 6.992% 11/15/07 (c) | | | | 140,000 | | 144,028 |
| Class E2, 7.224% 11/15/07 (c) | | | | 100,000 | | 103,542 |
| Wachovia Bank Commercial Mortgage Trust sequential pay Series 2003 C6 Class A2, 4.498% 8/15/35 | | | | 30,000 | | 29,460 |
| TOTAL COMMERCIAL MORTGAGE SECURITIES | | | | | | |
| (Cost $841,423) | | | | | | 839,093 |
| |
| Foreign Government and Government | | | | | | |
| Agency Obligations 0.1% | | | | | | |
| | | | | Principal | | Value (Note 1) |
| | | | | Amount | | |
| United Mexican States: | | | | | | |
| 5.875% 1/15/14 | | | $ | 5,000 | | $ 5,175 |
| 6.75% 9/27/34 | | | | 25,000 | | 27,344 |
| 7.5% 4/8/33 | | | | 100,000 | | 118,400 |
| TOTAL FOREIGN GOVERNMENT AND GOVERNMENT AGENCY OBLIGATIONS | | | | | | |
| (Cost $124,964) | | | | | | 150,919 |
| |
| Fixed Income Funds 10.9% | | | | | | |
| | | | | Shares | | |
| Fidelity Floating Rate Central Investment Portfolio (j) | | | | 49,778 | | 4,991,240 |
| Fidelity High Income Central Investment Portfolio 1 (j) | | | | 227,807 | | 22,060,795 |
| Fidelity Ultra Short Central Fund (j) | | | | 28,142 | | 2,799,003 |
| TOTAL FIXED-INCOME FUNDS | | | | | | |
| (Cost $29,261,290) | | | | | | 29,851,038 |
| |
| Money Market Funds 13.8% | | | | | | |
| |
| Fidelity Cash Central Fund, 4.28% (b) | | | | | | |
| (Cost $37,879,849) | | 37,879,849 | | 37,879,849 |
| |
| TOTAL INVESTMENT PORTFOLIO 100.4% | | | | | | |
| (Cost $250,320,665) | | | | | | 274,910,472 |
| |
| NET OTHER ASSETS (0.4)% | | | | | | (1,155,053) |
| NET ASSETS 100% | | | | | | $ 273,755,419 |
See accompanying notes which are an integral part of the financial statements.
| | |
| VIP Asset Manager: Growth Portfolio | | 64 |
| Futures Contracts | | | | | | | | | | |
| | | Expiration | | Underlying | | Unrealized |
| | | Date | | Face Amount | | Appreciation/ |
| | | | | at Value | | (Depreciation) |
| Purchased | | | | | | | | | | |
| |
| Equity Index Contracts | | | | | | | | | | |
| 47 S&P 500 Index Contracts | | March 2006 | | 14,743,900 | | $ | | (148,873) |
| |
| The face value of futures purchased as a percentage of net assets - 5.4% | | | | | | | | | | |
| |
| Swap Agreements | | | | | | | | | | |
| | | Expiration | | Notional | | | | Value |
| | | Date | | Amount | | | | |
| |
| Credit Default Swaps | | | | | | | | | | |
| Receive quarterly a fixed rate of .4% multiplied by the notional amount and pay to Morgan Stanley, Inc., | | | | | | | | | | |
| upon each default event of one of the issues of Dow Jones CDX N.A. Investment Grade 4, par value of the | | | | | | | | |
| proportional notional amount (g) | | June 2010 | | $ | | 500,000 | | $ | | (1,985) |
| Receive quarterly a fixed rate of .45% multiplied by the notional amount and pay to Goldman Sachs, upon | | | | | | | | |
| each default event of one of the issues of Dow Jones CDX N.A. Investment Grade 5, par value of the | | | | | | | | | | |
| proportional notional amount (h) | | Dec. 2010 | | | | 700,000 | | | | (63) |
| Receive quarterly a fixed rate of .5% multiplied by the notional amount and pay to Merrill Lynch, Inc., upon | | | | | | | | |
| each default event of one of the issues of Dow Jones CDX N.A. Investment Grade 3, par value of the | | | | | | | | | | |
| proportional notional amount (f) | | March 2010 | | | | 74,400 | | | | 237 |
| Receive quarterly a fixed rate of .7% multiplied by the notional amount and pay to Deutsche Bank, upon | | | | | | | | | | |
| each default event of one of the issues of Dow Jones CDX N.A. Investment Grade 3, par value of the | | | | | | | | | | |
| proportional notional amount (f) | | March 2015 | | | | 74,400 | | | | 228 |
| Receive quarterly notional amount multiplied by .41% and pay Goldman Sachs upon default event of | | | | | | | | | | |
| Sempra Energy, par value of the notional amount of Sempra Energy 7.95% 3/1/10 | | Sept. 2010 | | | | 20,000 | | | | 7 |
| |
| |
| | | Expiration | | Notional | | | | Value |
| | | Date | | Amount | | | | |
| |
| Credit Default Swaps continued | | | | | | | | | | |
| Receive quarterly notional amount multiplied by .42% and pay Morgan Stanley, Inc. upon default event of | | | | | | | | |
| Sempra Energy, par value of the notional amount of Sempra Energy 6% 2/1/13 | | Sept. 2010 | | $ | | 25,000 | | $ | | 19 |
| Receive monthly notional amount multiplied by 1.6% and pay Morgan Stanley, Inc. upon default event of | | | | | | | | | | |
| Park Place Securities, Inc., par value of the notional amount of Park Place Securities, Inc. Series | | | | | | | | | | |
| 2005 WHQ2 Class M7, 5.4413% 5/25/35 | | June 2035 | | | | 10,000 | | | | 45 |
| Receive monthly notional amount multiplied by 2.79% and pay Merrill Lynch, Inc. upon default event of New | | | | | | | | |
| Century Home Equity Loan Trust, par value of the notional amount of New Century Home Equity Loan Trust | | | | | | | | |
| Series 2004 4 Class M9, 7.0788% 2/25/35 | | March 2035 | | | | 15,000 | | | | (34) |
| Receive monthly notional amount multiplied by 3.3% and pay to Morgan Stanley, Inc. upon each default | | | | | | | | | | |
| event of Ameriquest Mortgage Securities, Inc., par value of the notional amount of Ameriquest Mortgage | | | | | | | | |
| Securities, Inc. Series 2004 R11, Class M9, 7.6913% 11/25/34 | | Dec 2034 | | | | 10,000 | | | | 64 |
| TOTAL CREDIT DEFAULT SWAPS | | | | $ | | 1,428,800 | | $ | | (1,482) |
| Interest Rate Swaps | | | | | | | | | | |
| Receive quarterly a fixed rate equal to 4.3875% and pay quarterly a floating rate based on 3 month LIBOR | | | | | | | | |
| with Credit Suisse First Boston | | March 2010 | | | | 75,000 | | | | (1,238) |
| Receive semi annually a fixed rate equal to 4.492% and pay quarterly a floating rate based on 3 month | | | | | | | | | | |
| LIBOR with Lehman Brothers, Inc. | | Sept. 2010 | | | | 500,000 | | | | (2,350) |
See accompanying notes which are an integral part of the financial statements.
|
65 Annual Report
65
| VIP Asset Manager: Growth Portfolio | | | | | | | | |
| Investments - continued | | | | | | | | |
| |
| |
| Swap Agreements continued | | | | | | | | |
| | | Expiration | | Notional | | | | Value |
| | | Date | | Amount | | | | |
| |
| Interest Rate Swaps continued | | | | | | | | |
| Receive quarterly a fixed rate equal to 4.774% and pay quarterly a floating rate based on 3 month LIBOR | | | | | | | | |
| with Credit Suisse First Boston | | March 2015 | | $ | | 75,000 | | $ | | (656) |
| Receive semi annually a fixed rate equal to 4.378% and pay quarterly a floating rate based on 3 month | | | | | | | | |
| LIBOR with Lehman Brothers, Inc. | | Sept. 2008 | | 900,000 | | | | (747) |
| Receive semi annually a fixed rate equal to 4.921% and pay quarterly a floating rate based on 3 month | | | | | | | | |
| LIBOR with Lehman Brothers, Inc. | | Dec. 2008 | | 250,000 | | | | 620 |
| Receive semi annually a fixed rate equal to 4.93% and pay quarterly a floating rate based on 3 month | | | | | | | | |
| LIBOR with Lehman Brothers, Inc. | | Nov. 2010 | | 1,000,000 | | | | 3,495 |
| TOTAL INTEREST RATE SWAPS | | | | $ | | 2,800,000 | | $ | | (876) |
| Total Return Swaps | | | | | | | | |
| Receive monthly a return equal to Lehman Brothers CMBS AAA 8.5+ Index and pay monthly a floating rate | | | | | | | | |
| based on 1 month LIBOR minus 25 basis points with Deutsche Bank | | April 2006 | | 75,000 | | | | 827 |
| Receive monthly a return equal to Lehman Brothers CMBS U.S. Aggregate Index and pay monthly a floating | | | | | | | | |
| rate based on 1 month LIBOR minus 15 basis points with Citibank | | April 2006 | | 105,000 | | | | 511 |
| |
| |
| | | Expiration | | Notional | | | | Value |
| | | Date | | Amount | | | | |
| |
| Total Return Swaps continued | | | | | | | | |
| Receive monthly a return equal to Lehman Brothers CMBS U.S. Aggregate Index and pay monthly a floating | | | | | | | | |
| rate based on 1 month LIBOR minus 20 basis points with Lehman Brothers, Inc. | | March 2006 | | $ | | 545,000 | | $ | | 2,841 |
| Receive quarterly a return equal to Bank of America Securities LLC AAA 10Yr Commercial Mortgage Backed | | | | | | | | |
| Securities Daily Index and pay quarterly a floating rate based on 3 month LIBOR minus 30 basis points | | | | | | | | |
| with Bank of America | | May 2006 | | 200,000 | | | | 1,902 |
| TOTAL TOTAL RETURN SWAPS | | | | $ | | 925,000 | | $ | | 6,081 |
| | | | | $ | | 5,153,800 | | $ | | 3,723 |
Legend
(a) Non-income producing
(b) Affiliated fund that is available only to investment companies and other accounts managed by Fidelity Investments. The rate quoted is the annualized seven-day
yield of the fund at period end. A complete unaudited listing of the fund’s holdings as of its most recent quarter end is available upon request.
(c) Security exempt from registration under Rule 144A of the Securities Act of 1933. These securities may be resold in transactions exempt from registration, normally
to qualified institutional buyers. At the period end, the value of these securities amounted to $1,022,914 or 0.4% of net assets.
(d) Security or a portion of the security purchased on a delayed delivery or when-issued basis.
(e) Security or a portion of the security was pledged to cover margin requirements for futures contracts. At the period end, the value of securities pledged amounted
to $795,890.
(f) Dow Jones CDX N.A. Investment Grade 3 is a tradable index of credit default swaps on investment grade debt of U.S. companies.
(g) Dow Jones CDX N.A. Investment Grade 4 is a tradable index of credit default swaps on investment grade debt of U.S. companies.
(h) Dow Jones CDX N.A. Investment Grade 5 is a tradable index of credit default swaps on investment grade debt of U.S. companies.
(i) The coupon rate shown on floating or adjustable rate securities represents the rate at period end.
|
See accompanying notes which are an integral part of the financial statements.
VIP Asset Manager: Growth Portfolio 66
| | (j) Affiliated fund that is available only to investment companies and other accounts managed by Fidelity Investments. A complete unaudited list of holdings for
each fixed-income central fund, as of the investing fund’s report date, is available upon request or at advisor.fidelity.com. The reports are located just after the
fund’s financial statements and quarterly reports but are not part of the financial statements or quarterly reports. In addition, the fixed-income central fund’s
financial statements, which are not covered by the investing fund’s Report of Independent Registered Public Accounting Firm are available on the EDGAR
Database on the SEC’s web site, www.sec.gov., or upon request.
(k) Security represents right to receive monthly interest payments on an underlying pool of mortgages. Principal shown is the par amount of the mortgage pool.
|
Affiliated Central Funds
Information regarding income received by the fund from the affiliated Central funds during the period is as follows:
| Fund | | Income received |
| Fidelity Cash Central Fund | | $ 1,152,698 |
| Fidelity Floating Rate Central Investment Portfolio | | 233,657 |
| Fidelity High Income Central Investment Portfolio 1 | | 1,663,726 |
| Fidelity Securities Lending Cash Central Fund | | 1,772 |
| Fidelity Ultra Short Central Fund | | 39,324 |
| Total | | $ 3,091,177 |
Additional information regarding the fund’s purchases and sales, including the ownership percentage, of the following fixed income Central Funds during the period is as follows:
| | | Value, beginning | | Purchases | | | | Sales | | Value, | | % ownership, |
| Fund | | of period | | | | | | Proceeds | | end of period | | end of period |
| Fidelity Floating Rate Central Investment Portfolio | | $ | | 1,500,048 | | $ | | 3,482,107 | | $ | | — | | $ | | 4,991,240 | | 0.8% |
| Fidelity High Income Central Investment Portfolio 1 | | 22,921,904 | | — | | | | — | | 22,060,795 | | 2.1% |
| Fidelity Ultra Short Central Fund | | — | | 2,799,848 | | | | — | | 2,799,003 | | 0.0% |
| Total | | $ | | 24,421,952 | | $ | | 6,281,955 | | $ | | 0 | | $ | | 29,851,038 | | |
Other Information
The composition of credit quality ratings as a percentage of net assets is as follows (ratings are unaudited):
| U.S.Government and U.S.Government Agency Obligations | | 5.8% |
| AAA,AA,A | | 1.5% |
| BBB | | 1.4% |
| BB | | 3.7% |
| B | | 4.4% |
| CCC,CC,C | | 0.6% |
| Not Rated | | 1.2% |
| Equities | | 72.5% |
| Short-Term Investments and Net Other Assets | | 8.9% |
| | | 100.0% |
We have used ratings from Moody’s Investors Services, Inc. Where Moody’s ratings are not available, we have used S&P ratings. Percentages are adjusted for the effect of futures contracts, if applicable.
Income Tax Information
At December 31, 2005, the fund had a capital loss carryforward of approximately $58,627,384 of which $38,871,131, $11,142,366 and $8,613,887 will expire on December 31, 2009, 2010 and 2011, respectively.
See accompanying notes which are an integral part of the financial statements.
67 Annual Report
| VIP Asset Manager: Growth Portfolio | | | | | | |
| |
| Financial Statements | | | | | | |
| |
| |
| Statement of Assets and Liabilities | | | | | | |
| | | December 31, 2005 |
| |
| Assets | | | | | | |
| Investment in securities, at value — See accompanying schedule: | | | | | | |
| Unaffiliated issuers (cost $183,179,526) | | $ 207,179,585 | | | | |
| Affiliated Central Funds (cost $67,141,139) | | 67,730,887 | | | | |
| Total Investments (cost $250,320,665) | | | | $ | | 274,910,472 |
| Receivable for investments sold | | | | | | 407,051 |
| Receivable for swap agreements | | | | | | 17 |
| Receivable for fund shares sold | | | | | | 52,460 |
| Dividends receivable | | | | | | 213,619 |
| Interest receivable | | | | | | 537,764 |
| Swap agreements, at value | | | | | | 3,723 |
| Prepaid expenses | | | | | | 1,414 |
| Total assets | | | | | | 276,126,520 |
| |
| Liabilities | | | | | | |
| Payable for investments purchased | | | | | | |
| Regular delivery | | $ 100,854 | | | | |
| Delayed delivery | | 1,763,876 | | | | |
| Payable for fund shares redeemed | | 238,084 | | | | |
| Accrued management fee | | 131,068 | | | | |
| Distribution fees payable | | 1,688 | | | | |
| Payable for daily variation on futures contracts | | 62,275 | | | | |
| Other affiliated payables | | 24,908 | | | | |
| Other payables and accrued expenses | | 48,348 | | | | |
| Total liabilities | | | | | | 2,371,101 |
| |
| Net Assets | | | | $ | | 273,755,419 |
| Net Assets consist of: | | | | | | |
| Paid in capital | | | | $ | | 304,099,504 |
| Undistributed net investment income | | | | | | 5,885,132 |
| Accumulated undistributed net realized gain (loss) on investments and foreign currency transactions | | | | | | (60,668,552) |
| Net unrealized appreciation (depreciation) on investments and assets and liabilities in foreign currencies | | | | | | 24,439,335 |
| Net Assets | | | | $ | | 273,755,419 |
| |
| Statement of Assets and Liabilities continued | | | | | | |
| | | December 31, 2005 |
| |
| Initial Class: | | | | | | |
| Net Asset Value, offering price and redemption price per share ($260,967,510 ÷ 20,118,933 shares) | | | | $ | | 12.97 |
| Service Class: | | | | | | |
| Net Asset Value, offering price and redemption price per share ($5,603,762 ÷ 435,036 shares) | | | | $ | | 12.88 |
| Service Class 2: | | | | | | |
| Net Asset Value, offering price and redemption price per share ($5,854,293 ÷ 457,158 shares) | | | | $ | | 12.81 |
| Investor Class: | | | | | | |
| Net Asset Value, offering price and redemption price per share ($1,329,854 ÷ 102,629 shares) | | | | $ | | 12.96 |
See accompanying notes which are an integral part of the financial statements.
| | |
| VIP Asset Manager: Growth Portfolio | | 68 |
| Statement of Operations | | | | | | | | |
| | | | | Year ended December 31, 2005 |
| |
| Investment Income | | | | | | | | |
| Dividends | | | | | | $ | | 3,554,916 |
| Interest | | | | | | | | 991,062 |
| Income from affiliated Central Funds | | | | | | | | 3,091,177 |
| Total income | | | | | | | | 7,637,155 |
| |
| Expenses | | | | | | | | |
| Management fee | | | $ | 1,645,214 | | | | |
| Transfer agent fees | | | | 200,525 | | | | |
| Distribution fees | | | | 20,148 | | | | |
| Accounting and security lending fees | | | | 118,938 | | | | |
| Independent trustees’ compensation | | | | 1,306 | | | | |
| Custodian fees and expenses | | | | 53,887 | | | | |
| Registration fees | | | | 9 | | | | |
| Audit | | | | 56,815 | | | | |
| Legal | | | | 1,533 | | | | |
| Miscellaneous | | | | 49,123 | | | | |
| Total expenses before reductions | | | | 2,147,498 | | | | |
| Expense reductions | | | | (49,523) | | | | 2,097,975 |
| |
| Net investment income (loss) | | | | | | | | 5,539,180 |
| Realized and Unrealized Gain (Loss) | | | | | | | | |
| Net realized gain (loss) on: | | | | | | | | |
| Investment securities: | | | | | | | | |
| Unaffiliated issuers (net of foreign taxes of $4,059) | | | | 10,053,652 | | | | |
| Foreign currency transactions | | | | 25,710 | | | | |
| Futures contracts | | | | 399,961 | | | | |
| Swap agreements | | | | (22,264) | | | | |
| Total net realized gain (loss) | | | | | | | | 10,457,059 |
| Change in net unrealized appreciation (depreciation) on: | | | | | | | | |
| Investment securities (net of increase in deferred foreign taxes of $5,890) | | | | (5,866,389) | | | | |
| Assets and liabilities in foreign currencies | | | | (69,566) | | | | |
| Futures contracts | | | | (217,034) | | | | |
| Swap agreements | | | | 1,680 | | | | |
| Total change in net unrealized appreciation (depreciation) | | | | | | | | (6,151,309) |
| Net gain (loss) | | | | | | | | 4,305,750 |
| Net increase (decrease) in net assets resulting from operations | | | | | | $ | | 9,844,930 |
| |
| Statement of Changes in Net Assets | | | | | | | | |
| | | | | Year ended | | | | Year ended |
| | | | | December 31, | | | | December 31, |
| | | | | 2005 | | | | 2004 |
| Increase (Decrease) in Net Assets | | | | | | | | |
| Operations | | | | | | | | |
| Net investment income (loss) | | | $ | 5,539,180 | | $ | | 7,101,232 |
| Net realized gain (loss) | | | | 10,457,059 | | | | 7,086,339 |
| Change in net unrealized appreciation (depreciation) | | | | (6,151,309) | | | | 3,930,593 |
| Net increase (decrease) in net assets resulting from operations | | | | 9,844,930 | | | | 18,118,164 |
| Distributions to shareholders from net investment income | | | | (7,156,575) | | | | (7,897,225) |
| Share transactions - net increase (decrease) | | | | (47,376,524) | | | | (40,448,482) |
| Total increase (decrease) in net assets | | | | (44,688,169) | | | | (30,227,543) |
| Net Assets | | | | | | | | |
| Beginning of period | | | | 318,443,588 | | | | 348,671,131 |
| End of period (including undistributed net investment income of $5,885,132 and undistributed net investment income of | | | | | | |
| $7,446,942, respectively) | | | $ | 273,755,419 | | $ | | 318,443,588 |
| |
| |
| |
| |
| See accompanying notes which are an integral part of the financial statements. | | | | | | | | |
| |
| | | 69 | | | | Annual Report |
| Financial Highlights Initial Class | | | | | | | | | | |
| Years ended December 31, | | 2005 | | 2004 | | 2003 | | 2002 | | 2001 |
| Selected Per Share Data | | | | | | | | | | |
| Net asset value, beginning of period | | $ 12.78 | | $ 12.33 | | $ 10.33 | | $ 12.56 | | $ 14.41 |
| Income from Investment Operations | | | | | | | | | | |
| Net investment income (loss)C | | 24 | | .26E | | .26 | | .32 | | .32 |
| Net realized and unrealized gain (loss) | | 25 | | .47 | | 2.06 | | (2.23) | | (1.31) |
| Total from investment operations | | 49 | | .73 | | 2.32 | | (1.91) | | (.99) |
| Distributions from net investment income | | (.30) | | (.28) | | (.32) | | (.32) | | (.39) |
| Distributions from net realized gain | | — | | — | | — | | — | | (.47) |
| Total distributions | | (.30) | | (.28) | | (.32) | | (.32) | | (.86) |
| Net asset value, end of period | | $ 12.97 | | $ 12.78 | | $ 12.33 | | $ 10.33 | | $ 12.56 |
| Total ReturnA,B | | 3.89% | | 5.98% | | 23.34% | | (15.53)% | | (7.39)% |
| Ratios to Average Net AssetsD,F | | | | | | | | | | |
| Expenses before reductions | | 74% | | .75% | | .73% | | .73% | | .73% |
| Expenses net of fee waivers, if any | | 74% | | .75% | | .73% | | .73% | | .73% |
| Expenses net of all reductions | | 72% | | .74% | | .72% | | .69% | | .72% |
| Net investment income (loss) | | 1.93% | | 2.15% | | 2.33% | | 2.88% | | 2.55% |
| Supplemental Data | | | | | | | | | | |
| Net assets, end of period (000 omitted) | | $ 260,968 | | $ 306,137 | | $ 335,285 | | $ 284,298 | | $ 399,273 |
| Portfolio turnover rate | | 43% | | 57% | | 65% | | 149% | | 111% |
A Total returns do not reflect charges attributable to your insurance company’s separate account. Inclusion of these charges would reduce the total returns shown.
B Total returns would have been lower had certain expenses not been reduced during the periods shown.
C Calculated based on average shares outstanding during the period.
D Amounts do not include the activity of the affiliated central funds.
E Investment income per share reflects a special dividend which amounted to $.04 per share.
F Expense ratios reflect operating expenses of the class. Expenses before reductions do not reflect amounts reimbursed by the investment adviser or reductions from brokerage service arrangements or other expense offset arrangements and do not
represent the amount paid by the class during periods when reimbursements or reductions occur. Expenses net of fee waivers reflect expenses after reimbursement by the investment adviser but prior to reductions from brokerage service arrange
ments or other expense offset arrangements. Expenses net of all reductions represent the net expenses paid by the class.
|
| Financial Highlights Service Class | | | | | | | | | | |
| Years ended December 31, | | 2005 | | 2004 | | 2003 | | 2002 | | 2001 |
| Selected Per Share Data | | | | | | | | | | |
| Net asset value, beginning of period | | $ 12.69 | | $ 12.25 | | $ 10.27 | | $ 12.47 | | $ 14.32 |
| Income from Investment Operations | | | | | | | | | | |
| Net investment income (loss)C | | 23 | | .25E | | .24 | | .30 | | .31 |
| Net realized and unrealized gain (loss) | | 24 | | .46 | | 2.05 | | (2.20) | | (1.32) |
| Total from investment operations | | 47 | | .71 | | 2.29 | | (1.90) | | (1.01) |
| Distributions from net investment income | | (.28) | | (.27) | | (.31) | | (.30) | | (.37) |
| Distributions from net realized gain | | — | | — | | — | | — | | (.47) |
| Total distributions | | (.28) | | (.27) | | (.31) | | (.30) | | (.84) |
| Net asset value, end of period | | $ 12.88 | | $ 12.69 | | $ 12.25 | | $ 10.27 | | $ 12.47 |
| Total ReturnA,B | | 3.79% | | 5.85% | | 23.15% | | (15.54)% | | (7.57)% |
| Ratios to Average Net AssetsD,F | | | | | | | | | | |
| Expenses before reductions | | 84% | | .88% | | .85% | | .84% | | .83% |
| Expenses net of fee waivers, if any | | 84% | | .88% | | .85% | | .84% | | .83% |
| Expenses net of all reductions | | 82% | | .87% | | .84% | | .80% | | .82% |
| Net investment income (loss) | | 1.83% | | 2.02% | | 2.21% | | 2.77% | | 2.44% |
| Supplemental Data | | | | | | | | | | |
| Net assets, end of period (000 omitted) | | $ 5,604 | | $ 5,907 | | $ 6,692 | | $ 6,105 | | $ 9,542 |
| Portfolio turnover rate | | 43% | | 57% | | 65% | | 149% | | 111% |
A Total returns do not reflect charges attributable to your insurance company’s separate account. Inclusion of these charges would reduce the total returns shown.
B Total returns would have been lower had certain expenses not been reduced during the periods shown.
C Calculated based on average shares outstanding during the period.
D Amounts do not include the activity of the affiliated central funds.
E Investment income per share reflects a special dividend which amounted to $.04 per share.
F Expense ratios reflect operating expenses of the class. Expenses before reductions do not reflect amounts reimbursed by the investment adviser or reductions from brokerage service arrangements or other expense offset arrangements and do not
represent the amount paid by the class during periods when reimbursements or reductions occur. Expenses net of fee waivers reflect expenses after reimbursement by the investment adviser but prior to reductions from brokerage service arrange
ments or other expense offset arrangements. Expenses net of all reductions represent the net expenses paid by the class.
|
See accompanying notes which are an integral part of the financial statements.
| | |
| VIP Asset Manager: Growth Portfolio | | 70 |
| Financial Highlights Service Class 2 | | | | | | | | | | |
| Years ended December 31, | | 2005 | | 2004 | | 2003 | | 2002 | | 2001 |
| Selected Per Share Data | | | | | | | | | | |
| Net asset value, beginning of period | | $ 12.61 | | $ 12.19 | | $ 10.21 | | $ 12.43 | | $ 14.30 |
| Income from Investment Operations | | | | | | | | | | |
| Net investment income (loss)C | | 20 | | .22E | | .22 | | .28 | | .28 |
| Net realized and unrealized gain (loss) | | 25 | | .46 | | 2.05 | | (2.21) | | (1.30) |
| Total from investment operations | | 45 | | .68 | | 2.27 | | (1.93) | | (1.02) |
| Distributions from net investment income | | (.25) | | (.26) | | (.29) | | (.29) | | (.38) |
| Distributions from net realized gain | | — | | — | | — | | — | | (.47) |
| Total distributions | | (.25) | | (.26) | | (.29) | | (.29) | | (.85) |
| Net asset value, end of period | | $ 12.81 | | $ 12.61 | | $ 12.19 | | $ 10.21 | | $ 12.43 |
| Total ReturnA,B | | 3.65% | | 5.63% | | 23.03% | | (15.83)% | | (7.66)% |
| Ratios to Average Net AssetsD,F | | | | | | | | | | |
| Expenses before reductions | | 1.03% | | 1.06% | | 1.05% | | 1.03% | | 1.00% |
| Expenses net of fee waivers, if any | | 1.03% | | 1.06% | | 1.05% | | 1.03% | | 1.00% |
| Expenses net of all reductions | | 1.02% | | 1.05% | | 1.04% | | .99% | | .99% |
| Net investment income (loss) | | 1.64% | | 1.84% | | 2.01% | | 2.58% | | 2.28% |
| Supplemental Data | | | | | | | | | | |
| Net assets, end of period (000 omitted) | | $ 5,854 | | $ 6,399 | | $ 6,694 | | $ 4,044 | | $ 5,213 |
| Portfolio turnover rate | | 43% | | 57% | | 65% | | 149% | | 111% |
A Total returns do not reflect charges attributable to your insurance company’s separate account. Inclusion of these charges would reduce the total returns shown.
B Total returns would have been lower had certain expenses not been reduced during the periods shown.
C Calculated based on average shares outstanding during the period.
D Amounts do not include the activity of the affiliated central funds.
E Investment income per share reflects a special dividend which amounted to $.04 per share.
F Expense ratios reflect operating expenses of the class. Expenses before reductions do not reflect amounts reimbursed by the investment adviser or reductions from brokerage service arrangements or other expense offset arrangements and do not
represent the amount paid by the class during periods when reimbursements or reductions occur. Expenses net of fee waivers reflect expenses after reimbursement by the investment adviser but prior to reductions from brokerage service arrange
ments or other expense offset arrangements. Expenses net of all reductions represent the net expenses paid by the class.
|
| Financial Highlights Investor Class | | |
| Year ended December 31, | | 2005G |
| Selected Per Share Data | | |
| Net asset value, beginning of period | | $ 12.60 |
| Income from Investment Operations | | |
| Net investment income (loss)E | | 10 |
| Net realized and unrealized gain (loss) | | 26 |
| Total from investment operations | | 36 |
| Net asset value, end of period | | $ 12.96 |
| Total ReturnB,C,D | | 2.86% |
| Ratios to Average Net AssetsF,H | | |
| Expenses before reductions | | 96%A |
| Expenses net of fee waivers, if any | | 96%A |
| Expenses net of all reductions | | 94%A |
| Net investment income (loss) | | 1.83%A |
| Supplemental Data | | |
| Net assets, end of period (000 omitted) | | $ 1,330 |
| Portfolio turnover rate | | 43% |
A Annualized
B Total returns for periods of less than one year are not annualized.
C Total returns do not reflect charges attributable to your insurance company’s separate account. Inclusion of these charges would reduce the total returns shown.
D Total returns would have been lower had certain expenses not been reduced during the periods shown.
E Calculated based on average shares outstanding during the period.
F Amounts do not include the activity of the affiliated central funds.
G For the period July 21, 2005 (commencement of sale of shares) to December 31, 2005.
H Expense ratios reflect operating expenses of the class. Expenses before reductions do not reflect amounts reimbursed by the investment adviser or reductions from brokerage service arrangements or other expense offset arrangements and do not
represent the amount paid by the class during periods when reimbursements or reductions occur. Expense ratios before reductions for start up periods may not be representative of longer term operating periods. Expenses net of fee waivers reflect
expenses after reimbursement by the investment adviser but prior to reductions from brokerage service arrangements or other expense offset arrangements. Expenses net of all reductions represent the net expenses paid by the class.
|
See accompanying notes which are an integral part of the financial statements.
|
71 Annual Report
VIP Balanced Portfolio
Performance: The Bottom Line
|
Average annual total return reflects the change in the value of an investment, assuming reinvestment of the class’ dividend income and capital gains (the profits earned upon the sale of securities that have grown in value) and assuming a constant rate of performance each year. During periods of reimbursement by Fidelity, a fund’s total return will be greater than it would be had the reimbursement not occurred. Performance numbers are net of all underlying fund operating expenses, but do not include any insurance charges imposed by your insurance company’s separate account. If performance information included the effect of these additional charges, the total returns would have been lower. How a fund did yesterday is no guarantee of how it will do tomorrow.
| Average Annual Total Returns | | | | | | |
| Periods ended December 31, 2005 | | Past 1 | | Past 5 | | Past 10 |
| | | year | | years | | years |
| VIP Balanced - Initial Class | | 5.77% | | 3.36% | | 6.44% |
| VIP Balanced - Service ClassA | | 5.61% | | 3.25% | | 6.33% |
| VIP Balanced - Service Class 2B | | 5.53% | | 3.09% | | 6.23% |
| VIP Balanced - Investor ClassC | | 5.69% | | 3.35% | | 6.43% |
A The initial offering of Service Class shares took place on November 3, 1997. Performance for Service Class shares reflects an asset based service fee (12b 1 fee), and returns prior to
November 3, 1997 are those of Initial Class and do not include the effects of Service Class’ 12b 1 fee. Had Service Class shares’ 12b 1 fee been reflected, returns prior to November 3, 1997
would have been lower.
B The initial offering of Service Class 2 shares took place on January 12, 2000. Performance for Service Class 2 shares reflects an asset based service fee (12b 1 fee). Returns
from November 3, 1997 through January 12, 2000 are those of Service Class which reflects a different 12b 1 fee. Service Class 2 returns prior to November 3, 1997 are those of
Initial Class, and do not include the effects of a 12b 1 fee. Had Service Class 2’s 12b 1 fee been reflected, returns prior to January 12, 2000 would have been lower.
C The initial offering of Investor Class shares took place on July 21, 2005. Returns prior to July 21, 2005 are those of Initial Class. If Investor Class’s transfer agent fee had
been reflected, returns prior to July 21, 2005 would have been lower.
|
$10,000 Over 10 Years
Let’s say hypothetically that $10,000 was invested in VIP Balanced Portfolio Initial Class on December 31, 1995. The chart shows how the value of your investment would have changed, and also shows how the Standard & Poor’s 500SM Index performed over the same period.

VIP Balanced Portfolio 72
VIP Balanced Portfolio
Management’s Discussion of Fund Performance
|
Comments from Lawrence Rakers and Ford O’Neil, Co Portfolio Managers of VIP Balanced Portfolio
U.S. equities outperformed investment grade and high yield debt during the 12 month period ending December 31, 2005, a positive year for all three asset classes. Energy and utilities were the two best performing equity market sectors, and significant contributors to the 4.91% gain of the Standard & Poor’s 500SM Index. Elsewhere, the NASDAQ Composite® Index returned 2.13%, while the Dow Jones Industrial AverageSM rose 1.72% . The investment grade bond market also ended 2005 in the black, marking six consecutive years of gains for the debt category. However, the 2.43% advance of the Lehman Brothers® Aggregate Bond Index was its lowest return in that streak, which reflects the trying investment conditions bonds encountered in the form of higher interest rates and rising inflation. Amid the uncertainty, Treasuries outperformed corporate, agency and mortgage backed debt. High yield also struggled, rising only 2.74% according to the Merrill Lynch® U.S. High Yield Master II Index. Intermittent weakness in the automotive and air transportation industries tempered high yield debt performance.
During the past year, the fund outperformed both the 4.00% return of the Fidelity Balanced 60/40 Composite Index and the 4.78% gain of the LipperSM Variable Annuity Balanced Funds Average. (For specific portfolio performance results, please refer to the performance section of this report.) While poor performance in the equity subportfolio during the period’s first half hampered overall results, both the equity and fixed income subportfolios comfort ably outperformed their respective benchmarks in the final six months, enabling the fund to finish ahead of its benchmarks. Stock picking in energy, industrials and health care added the most value versus the Fidelity Composite index. Diversified energy services provider Halliburton was by far the best overall contributor, aided by rising demand in its energy services division. News of strong same store sales boosted the stock price of clothing retailer Kohl’s, and I sold the position to lock in profits. Conversely, the fund was hurt by its position in satellite TV provider EchoStar Communications the equity subportfolio’s largest detractor as concerns about increasing competition hurt the stock. Also holding back performance was cardboard container maker Smurfit Stone Container, which suffered from weaker than expected demand for containerboard. In the fixed income subportfolio, an out of index exposure to high yield securities was helpful, as they outperformed investment grade bonds. In the investment grade category, our holdings in floating rate securities and securitized products aided performance, along with an overweighting in securities with longer maturities.
The views expressed in this statement reflect those of the portfolio managers only through the end of the period of the report as stated on the cover and do not necessarily represent the views of Fidelity or any other person in the Fidelity organization. Any such views are subject to change at any time based upon market or other conditions and Fidelity disclaims any responsibility to update such views. These views may not be relied on as invest ment advice and, because investment decisions for a Fidelity fund are based on numerous factors, may not be relied on as an indication of trading intent on behalf of any Fidelity fund.
73 73 Annual Report
| VIP Balanced Portfolio | | | | |
| Investment Changes | | |
| |
| |
| Top Five Stocks as of December 31, 2005 |
| | | % of fund’s | | % of fund’s net assets |
| | | net assets | | 6 months ago |
| General Electric Co. | | 1.6 | | 2.0 |
| Halliburton Co. | | 1.2 | | 2.3 |
| American International Group, Inc. | | 1.2 | | 1.2 |
| Pride International, Inc. | | 1.2 | | 1.0 |
| National Oilwell Varco, Inc. | | 1.1 | | 0.0 |
| | | 6.3 | | |
Top Five Bond Issuers as of December 31, 2005 |
| (with maturities greater than one year) | | % of fund’s | | % of fund’s net assets |
| | | net assets | | 6 months ago |
| Fannie Mae | | 10.2 | | 11.1 |
| U.S. Treasury Obligations | | 5.0 | | 5.6 |
| Freddie Mac | | 1.4 | | 1.4 |
| CS First Boston Mortgage Securities | | | | |
| Corp. | | 0.3 | | 0.4 |
| Goldman Sachs Group, Inc. | | 0.2 | | 0.3 |
| | | 17.1 | | |
Top Five Market Sectors as of December 31, 2005 |
| | | % of fund’s | | % of fund’s net assets |
| | | net assets | | 6 months ago |
| Financials | | 15.5 | | 13.8 |
| Information Technology | | 11.1 | | 9.2 |
| Energy | | 9.7 | | 8.2 |
| Industrials | | 8.6 | | 8.6 |
| Health Care | | 7.6 | | 7.9 |
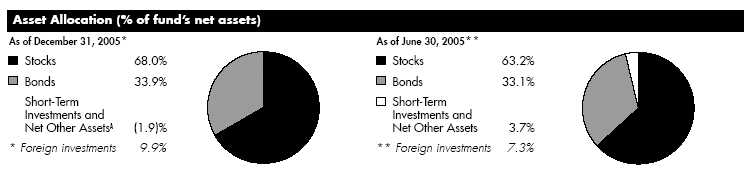
A Short Term Investments and Net Other Assets are not included in the pie chart. Percentages are adjusted for the effect of futures contracts and swaps, if applicable.
The information in the above tables is based on the combined investments of the fund and its pro rata share of the investments of Fidelity’s fixed income central funds. For an unaudited list of holdings for each fixed income central fund, visit advisor.fidelity.com.
VIP Balanced Portfolio 74
| VIP Balanced Portfolio | | | | | | | | |
| Investments December 31, 2005 | | | | | | |
| Showing Percentage of Net Assets | | | | | | | | |
Common Stocks 67.9% | | | | | | | | |
| | | | | Shares | | | | Value |
| | | | | | | | | (Note 1) |
| CONSUMER DISCRETIONARY 6.3% | | | | | | | | |
| Auto Components – 0.2% | | | | | | | | |
| American Axle & Manufacturing Holdings, Inc. | | | | 19,800 | | $ | | 362,934 |
| LKQ Corp. (a) | | | | 5,100 | | | | 176,562 |
| | | | | | | | | 539,496 |
| Diversified Consumer Services 0.1% | | | | | | | | |
| Carriage Services, Inc. Class A (a) | | | | 12,700 | | | | 63,500 |
| Service Corp. International (SCI) | | | | 16,400 | | | | 134,152 |
| | | | | | | | | 197,652 |
| Hotels, Restaurants & Leisure 1.3% | | | | | | | | |
| Applebee’s International, Inc. | | | | 7,000 | | | | 158,130 |
| Boyd Gaming Corp. | | | | 4,600 | | | | 219,236 |
| Brinker International, Inc. | | | | 6,600 | | | | 255,156 |
| Carnival Corp. unit | | | | 4,500 | | | | 240,615 |
| Gaylord Entertainment Co. (a) | | | | 5,600 | | | | 244,104 |
| Kerzner International Ltd. (a) | | | | 8,900 | | | | 611,875 |
| McDonald’s Corp. | | | | 26,400 | | | | 890,208 |
| Outback Steakhouse, Inc. | | | | 10,200 | | | | 424,422 |
| Royal Caribbean Cruises Ltd. | | | | 12,000 | | | | 540,720 |
| Ruby Tuesday, Inc. | | | | 900 | | | | 23,301 |
| Six Flags, Inc. (a) | | | | 10,600 | | | | 81,726 |
| Starwood Hotels & Resorts Worldwide, Inc. unit | | | | 4,400 | | | | 280,984 |
| Station Casinos, Inc. | | | | 2,900 | | | | 196,620 |
| WMS Industries, Inc. (a) | | | | 10,000 | | | | 250,900 |
| | | | | | | | | 4,417,997 |
| Household Durables 1.0% | | | | | | | | |
| Cyrela Brazil Realty SA | | | | 8,000 | | | | 108,455 |
| D.R. Horton, Inc. | | | | 15,000 | | | | 535,950 |
| Directed Electronics, Inc. | | | | 1,900 | | | | 27,265 |
| Interface, Inc. Class A (a) | | | | 30,212 | | | | 248,343 |
| KB Home | | | | 19,700 | | | | 1,431,402 |
| Pulte Homes, Inc. | | | | 1,000 | | | | 39,360 |
| Ryland Group, Inc. | | | | 6,800 | | | | 490,484 |
| Sharp Corp. | | | | 8,000 | | | | 121,725 |
| Standard Pacific Corp. | | | | 8,800 | | | | 323,840 |
| Techtronic Industries Co. Ltd. | | | | 142,000 | | | | 337,892 |
| | | | | | | | | 3,664,716 |
| Internet & Catalog Retail 0.1% | | | | | | | | |
| eBay, Inc. (a) | | | | 11,200 | | | | 484,400 |
| Leisure Equipment & Products 0.1% | | | | | | | | |
| Brunswick Corp. | | | | 7,300 | | | | 296,818 |
| Media 2.2% | | | | | | | | |
| CCE Spinco, Inc. (a) | | | | 7,800 | | | | 102,180 |
| Citadel Broadcasting Corp. | | | | 24,700 | | | | 331,968 |
| Clear Channel Communications, Inc. | | | | 10,800 | | | | 339,660 |
| E.W. Scripps Co. Class A | | �� | | 6,600 | | | | 316,932 |
| EchoStar Communications Corp. Class A | | | | 20,036 | | | | 544,378 |
| Gannett Co., Inc. | | | | 700 | | | | 42,399 |
| Lagardere S.C.A. (Reg.) | | | | 3,300 | | | | 253,936 |
| Lamar Advertising Co. Class A (a) | | | | 19,200 | | | | 885,888 |
| |
| |
See accompanying notes which are an integral part of the financial statements.
| | | | | | |
| | | 75 | | | | Annual Report |
75
| VIP Balanced Portfolio | | | | |
| Investments - continued | | | | |
| |
| |
| |
| | | Shares | | Value |
| | | | | (Note 1) |
| Liberty Global, Inc.: | | | | |
| Class A | | 13,000 | | $ 292,500 |
| Class C (a) | | 11,100 | | 235,320 |
| Liberty Media Corp. Class A (a) | | 47,300 | | 372,251 |
| McGraw Hill Companies, Inc. | | 5,200 | | 268,476 |
| News Corp. Class A | | 44,700 | | 695,085 |
| NTL, Inc. (a) | | 13,600 | | 925,888 |
| Omnicom Group, Inc. | | 3,800 | | 323,494 |
| Radio One, Inc. Class D (non vtg.) (a) | | 11,000 | | 113,850 |
| Salem Communications Corp. Class A (a) | | 6,300 | | 110,187 |
| SES Global unit | | 4,228 | | 72,577 |
| The DIRECTV Group, Inc. (a) | | 16,300 | | 230,156 |
| TVN SA | | 24,756 | | 594,418 |
| Walt Disney Co. | | 27,000 | | 647,190 |
| | | | | 7,698,733 |
| Multiline Retail – 0.4% | | | | |
| Dollar Tree Stores, Inc. (a) | | 4,600 | | 110,124 |
| Family Dollar Stores, Inc. | | 3,600 | | 89,244 |
| Federated Department Stores, Inc. | | 5,300 | | 351,549 |
| Fred’s, Inc. Class A | | 20,600 | | 335,162 |
| JCPenney Co., Inc. | | 7,000 | | 389,200 |
| Target Corp. | | 4,100 | | 225,377 |
| | | | | 1,500,656 |
| Specialty Retail 0.9% | | | | |
| Aeropostale, Inc. (a) | | 12,100 | | 318,230 |
| Best Buy Co., Inc. | | 5,750 | | 250,010 |
| Big 5 Sporting Goods Corp. | | 9,500 | | 207,955 |
| Circuit City Stores, Inc. | | 3,800 | | 85,842 |
| Edgars Consolidated Stores Ltd. | | 10,300 | | 57,234 |
| Foot Locker, Inc. | | 13,400 | | 316,106 |
| Home Depot, Inc. | | 16,200 | | 655,776 |
| Linens ’N Things, Inc. (a) | | 5,600 | | 148,960 |
| OfficeMax, Inc. | | 4,700 | | 119,192 |
| Pacific Sunwear of California, Inc. (a) | | 15,300 | | 381,276 |
| Ross Stores, Inc. | | 6,700 | | 193,630 |
| Staples, Inc. | | 13,700 | | 311,127 |
| TJX Companies, Inc. | | 10,500 | | 243,915 |
| | | | | 3,289,253 |
| |
| TOTAL CONSUMER DISCRETIONARY | | | | 22,089,721 |
| |
| CONSUMER STAPLES 3.5% | | | | |
| Beverages 0.2% | | | | |
| The Coca Cola Co. | | 14,400 | | 580,464 |
| Food & Staples Retailing – 0.8% | | | | |
| CVS Corp. | | 23,700 | | 626,154 |
| Safeway, Inc. | | 20,100 | | 475,566 |
| Wal Mart de Mexico SA de CV Series V | | 12,800 | | 71,040 |
| Wal Mart Stores, Inc. | | 32,800 | | 1,535,040 |
| | | | | 2,707,800 |
| Food Products – 0.7% | | | | |
| Archer Daniels Midland Co. | | 4,300 | | 106,038 |
See accompanying notes which are an integral part of the financial statements.
| | |
| VIP Balanced Portfolio | | 76 |
| Common Stocks continued | | | | | | | | |
| | | | | Shares | | | | Value |
| | | | | | | | | (Note 1) |
| CONSUMER STAPLES – continued | | | | | | | | |
| Food Products – continued | | | | | | | | |
| Bunge Ltd. | | | | 4,800 | | ��$ | | 271,728 |
| Corn Products International, Inc. | | | | 20,500 | | | | 489,745 |
| General Mills, Inc. | | | | 6,600 | | | | 325,512 |
| Global Bio Chem Technology | | | | | | | | |
| Group Co. Ltd. | | | | 280,000 | | | | 122,781 |
| Groupe Danone | | | | 2,000 | | | | 208,950 |
| Kellogg Co. | | | | 5,500 | | | | 237,710 |
| Nestle SA (Reg.) | | | | 854 | | | | 255,420 |
| The J.M. Smucker Co. | | | | 7,000 | | | | 308,000 |
| TreeHouse Foods, Inc. (a) | | | | 5,040 | | | | 94,349 |
| Tyson Foods, Inc. Class A | | | | 10,500 | | | | 179,550 |
| | | | | | | | | 2,599,783 |
| Household Products – 0.5% | | | | | | | | |
| Colgate Palmolive Co. | | | | 14,900 | | | | 817,265 |
| Procter & Gamble Co. | | | | 15,340 | | | | 887,879 |
| | | | | | | | | 1,705,144 |
| Personal Products 0.2% | | | | | | | | |
| Alberto Culver Co. | | | | 4,400 | | | | 201,300 |
| Avon Products, Inc. | | | | 12,700 | | | | 362,585 |
| Playtex Products, Inc. (a) | | | | 1,400 | | | | 19,138 |
| | | | | | | | | 583,023 |
| Tobacco – 1.1% | | | | | | | | |
| Altria Group, Inc. | | | | 51,850 | | | | 3,874,232 |
| |
| TOTAL CONSUMER STAPLES | | | | | | | | 12,050,446 |
| |
| ENERGY 8.7% | | | | | | | | |
| Energy Equipment & Services – 5.7% | | | | | | | | |
| Basic Energy Services, Inc. | | | | 2,500 | | | | 49,875 |
| BJ Services Co. | | | | 47,400 | | | | 1,738,158 |
| Grant Prideco, Inc. (a) | | | | 68,000 | | | | 3,000,160 |
| Grey Wolf, Inc. (a) | | | | 52,800 | | | | 408,144 |
| Halliburton Co. | | | | 69,000 | | | | 4,275,240 |
| Nabors Industries Ltd. (a) | | | | 6,000 | | | | 454,500 |
| National Oilwell Varco, Inc. (a) | | | | 63,100 | | | | 3,956,370 |
| Pride International, Inc. (a) | | | | 132,800 | | | | 4,083,600 |
| Smith International, Inc. | | | | 1,200 | | | | 44,532 |
| Union Drilling, Inc. | | | | 12,400 | | | | 180,172 |
| Weatherford International Ltd. (a) | | | | 44,400 | | | | 1,607,280 |
| | | | | | | | | 19,798,031 |
| Oil, Gas & Consumable Fuels 3.0% | | | | | | | | |
| Arch Coal, Inc. | | | | 1,900 | | | | 151,050 |
| Cabot Oil & Gas Corp. | | | | 6,500 | | | | 293,150 |
| Canadian Natural Resources Ltd. | | | | 5,300 | | | | 262,732 |
| Chesapeake Energy Corp. | | | | 23,600 | | | | 748,828 |
| CNX Gas Corp. (a)(f) | | | | 2,600 | | | | 54,600 |
| CONSOL Energy, Inc. | | | | 2,100 | | | | 136,878 |
| Double Hull Tankers, Inc. | | | | 9,600 | | | | 126,432 |
| El Paso Corp. | | | | 16,100 | | | | 195,776 |
| |
See accompanying notes which are an integral part of the financial statements.
| | | | | | | | |
| | | 77 | | | | Annual Report |
77
| VIP Balanced Portfolio | | | | |
| Investments - continued | | | | |
| |
| |
| |
| | | Shares | | Value |
| | | | | (Note 1) |
| EnCana Corp. | | 13,300 | | $ 601,306 |
| Energy Partners Ltd. (a) | | 3,300 | | 71,907 |
| Goodrich Petroleum Corp. (a) | | 3,800 | | 95,570 |
| Holly Corp. | | 10,200 | | 600,474 |
| Houston Exploration Co. (a) | | 4,700 | | 248,160 |
| International Coal Group, Inc. (a) | | 18,400 | | 174,800 |
| KCS Energy, Inc. (a) | | 1,900 | | 46,018 |
| Maritrans, Inc. | | 3,800 | | 98,876 |
| Massey Energy Co. | | 2,300 | | 87,101 |
| McMoRan Exploration Co. (a)(e) | | 9,700 | | 191,769 |
| OMI Corp. | | 9,600 | | 174,240 |
| Overseas Shipholding Group, Inc. | | 1,400 | | 70,546 |
| Penn Virginia Corp. | | 6,700 | | 384,580 |
| Petroleum Development Corp. (a) | | 4,400 | | 146,696 |
| Plains Exploration & Production Co. (a) | | 6,800 | | 270,164 |
| Quicksilver Resources, Inc. (a) | | 13,900 | | 583,939 |
| Range Resources Corp. | | 22,950 | | 604,503 |
| Southwestern Energy Co. (a) | | 10,400 | | 373,776 |
| Ultra Petroleum Corp. (a) | | 5,100 | | 284,580 |
| Valero Energy Corp. | | 67,000 | | 3,457,200 |
| | | | | 10,535,651 |
| |
| TOTAL ENERGY | | | | 30,333,682 |
| |
| FINANCIALS 12.9% | | | | |
| Capital Markets 1.9% | | | | |
| Affiliated Managers Group, Inc. (a) | | 1,000 | | 80,250 |
| Ameriprise Financial, Inc. | | 2,780 | | 113,980 |
| Ameritrade Holding Corp. | | 12,600 | | 302,400 |
| E*TRADE Financial Corp. (a) | | 43,300 | | 903,238 |
| Goldman Sachs Group, Inc. | | 7,300 | | 932,283 |
| Investors Financial Services Corp. | | 1,500 | | 55,245 |
| Janus Capital Group, Inc. | | 11,400 | | 212,382 |
| Lazard Ltd.: | | | | |
| unit | | 4,400 | | 129,844 |
| Class A | | 8,500 | | 271,150 |
| Lehman Brothers Holdings, Inc. | | 7,400 | | 948,458 |
| Merrill Lynch & Co., Inc. | | 21,100 | | 1,429,103 |
| Morgan Stanley | | 6,000 | | 340,440 |
| Nuveen Investments, Inc. Class A | | 5,600 | | 238,672 |
| Piper Jaffray Companies (a) | | 8,900 | | 359,560 |
| State Street Corp. | | 6,400 | | 354,816 |
| | | | | 6,671,821 |
| Commercial Banks – 2.6% | | | | |
| Banco Nossa Caixa SA | | 5,100 | | 76,447 |
| Bank of America Corp. | | 85,400 | | 3,941,210 |
| China Construction Bank Corp. | | | | |
| (H Shares) | | 990,000 | | 344,741 |
| ICICI Bank Ltd. sponsored ADR | | 5,300 | | 152,640 |
| Mitsubishi UFJ Financial Group, Inc. | | 18 | | 246,420 |
| SVB Financial Group (a) | | 7,200 | | 337,248 |
| UCBH Holdings, Inc. | | 31,900 | | 570,372 |
| Unicredito Italiano Spa | | 37,700 | | 259,619 |
See accompanying notes which are an integral part of the financial statements.
| | |
| VIP Balanced Portfolio | | 78 |
| Common Stocks continued | | | | | | | | |
| | | | | Shares | | | | Value |
| | | | | | | | | (Note 1) |
| FINANCIALS – continued | | | | | | | | |
| Commercial Banks – continued | | | | | | | | |
| UnionBanCal Corp. | | | | 3,800 | | $ | | 261,136 |
| Wachovia Corp. | | | | 36,900 | | | | 1,950,534 |
| Wells Fargo & Co. | | | | 5,600 | | | | 351,848 |
| Wilshire Bancorp, Inc. | | | | 16,700 | | | | 287,073 |
| Wintrust Financial Corp. | | | | 5,000 | | | | 274,500 |
| | | | | | | | | 9,053,788 |
| Consumer Finance – 0.5% | | | | | | | | |
| American Express Co. | | | | 9,400 | | | | 483,724 |
| Capital One Financial Corp. (e) | | | | 5,000 | | | | 432,000 |
| MBNA Corp. | | | | 6,600 | | | | 179,190 |
| SLM Corp. | | | | 11,200 | | | | 617,008 |
| | | | | | | | | 1,711,922 |
| Diversified Financial Services – 1.8% | | | | | | | | |
| Citigroup, Inc. | | | | 81,000 | | | | 3,930,930 |
| JPMorgan Chase & Co. | | | | 58,200 | | | | 2,309,958 |
| | | | | | | | | 6,240,888 |
| Insurance – 3.6% | | | | | | | | |
| ACE Ltd. | | | | 23,100 | | | | 1,234,464 |
| AFLAC, Inc. | | | | 8,600 | | | | 399,212 |
| AMBAC Financial Group, Inc. | | | | 5,600 | | | | 431,536 |
| American International Group, Inc. | | | | 61,350 | | | | 4,185,911 |
| Aspen Insurance Holdings Ltd. | | | | 15,100 | | | | 357,417 |
| Axis Capital Holdings Ltd. | | | | 3,300 | | | | 103,224 |
| Endurance Specialty Holdings Ltd. | | | | 5,600 | | | | 200,760 |
| Hartford Financial Services Group, Inc. | | | | 10,200 | | | | 876,078 |
| Hilb Rogal & Hobbs Co. | | | | 4,400 | | | | 169,444 |
| IPC Holdings Ltd. | | | | 4,500 | | | | 123,210 |
| MBIA, Inc. | | | | 9,100 | | | | 547,456 |
| Montpelier Re Holdings Ltd. | | | | 11,700 | | | | 221,130 |
| Navigators Group, Inc. (a) | | | | 1,100 | | | | 47,971 |
| PartnerRe Ltd. | | | | 7,800 | | | | 512,226 |
| Platinum Underwriters Holdings Ltd. | | | | 8,200 | | | | 254,774 |
| PXRE Group Ltd. | | | | 22,400 | | | | 290,304 |
| Scottish Re Group Ltd. | | | | 38,600 | | | | 947,630 |
| Specialty Underwriters’ Alliance, Inc. (a) | | | | 13,100 | | | | 80,696 |
| T&D Holdings, Inc. | | | | 1,700 | | | | 112,752 |
| The St. Paul Travelers Companies, Inc. | | | | 13,549 | | | | 605,234 |
| Universal American Financial Corp. (a) | | | | 7,100 | | | | 107,068 |
| USI Holdings Corp. (a) | | | | 17,900 | | | | 246,483 |
| XL Capital Ltd. Class A | | | | 7,600 | | | | 512,088 |
| | | | | | | | | 12,567,068 |
| Real Estate 0.8% | | | | | | | | |
| Apartment Investment & Management Co. Class A | | | | 5,400 | | | | 204,498 |
| CBL & Associates Properties, Inc. | | | | 2,900 | | | | 114,579 |
| Developers Diversified Realty Corp. | | | | 200 | | | | 9,404 |
| Digital Realty Trust, Inc. | | | | 3,800 | | | | 85,994 |
| Duke Realty Corp. | | | | 2,300 | | | | 76,820 |
| Education Realty Trust, Inc. (m) | | | | 4,406 | | | | 51,114 |
| Equity Lifestyle Properties, Inc. | | | | 900 | | | | 40,050 |
| |
See accompanying notes which are an integral part of the financial statements.
| | | | | | | | |
| | | 79 | | | | Annual Report |
79
| VIP Balanced Portfolio | | | | |
| Investments - continued | | | | |
| |
| |
| |
| | | Shares | | Value |
| | | | | (Note 1) |
| Equity Office Properties Trust | | 5,700 | | $ 172,881 |
| Equity Residential (SBI) | | 3,400 | | 133,008 |
| General Growth Properties, Inc. | | 7,200 | | 338,328 |
| Highwoods Properties, Inc. (SBI) | | 2,300 | | 65,435 |
| Mitsui Fudosan Co. Ltd. | | 13,000 | | 264,069 |
| Pennsylvania (REIT) (SBI) | | 2,800 | | 104,608 |
| Reckson Associates Realty Corp. | | 4,600 | | 165,508 |
| Trizec Properties, Inc. | | 10,000 | | 229,200 |
| United Dominion Realty Trust, Inc. (SBI) | | 25,700 | | 602,408 |
| Vornado Realty Trust | | 2,900 | | 242,063 |
| | | | | 2,899,967 |
| Thrifts & Mortgage Finance – 1.7% | | | | |
| Countrywide Financial Corp. | | 11,100 | | 379,509 |
| Doral Financial Corp. | | 24,800 | | 262,880 |
| Fannie Mae | | 21,300 | | 1,039,653 |
| Fidelity Bankshares, Inc. | | 2,200 | | 71,940 |
| First Niagara Financial Group, Inc. | | 3,900 | | 56,433 |
| Freddie Mac | | 26,600 | | 1,738,310 |
| Golden West Financial Corp., Delaware | | 2,500 | | 165,000 |
| Hudson City Bancorp, Inc. | | 20,900 | | 253,308 |
| KNBT Bancorp, Inc. | | 4,000 | | 65,160 |
| MGIC Investment Corp. | | 2,000 | | 131,640 |
| NetBank, Inc. | | 30,300 | | 217,554 |
| New York Community Bancorp, Inc. | | 1,100 | | 18,172 |
| NewAlliance Bancshares, Inc. | | 15,500 | | 225,370 |
| R&G Financial Corp. Class B | | 29,900 | | 394,680 |
| Sovereign Bancorp, Inc. | | 27,800 | | 601,036 |
| W Holding Co., Inc. | | 34,700 | | 285,581 |
| | | | | 5,906,226 |
| |
| TOTAL FINANCIALS | | | | 45,051,680 |
| |
| HEALTH CARE 7.5% | | | | |
| Biotechnology – 0.8% | | | | |
| Biogen Idec, Inc. (a) | | 7,000 | | 317,310 |
| Cephalon, Inc. (a) | | 11,400 | | 738,036 |
| Charles River Laboratories International, Inc. (a) | | 9,600 | | 406,752 |
| Genentech, Inc. (a) | | 3,500 | | 323,750 |
| InterMune, Inc. (a)(e) | | 5,300 | | 89,040 |
| Invitrogen Corp. (a) | | 4,200 | | 279,888 |
| MedImmune, Inc. (a) | | 4,000 | | 140,080 |
| OSI Pharmaceuticals, Inc. (a) | | 12,500 | | 350,500 |
| Serologicals Corp. (a) | | 12,000 | | 236,880 |
| | | | | 2,882,236 |
| Health Care Equipment & Supplies 2.1% | | | | |
| Bausch & Lomb, Inc. | | 3,600 | | 244,440 |
| Baxter International, Inc. | | 28,600 | | 1,076,790 |
| Becton, Dickinson & Co. | | 7,100 | | 426,568 |
| C.R. Bard, Inc. | | 8,800 | | 580,096 |
| CONMED Corp. (a) | | 6,400 | | 151,424 |
| Cooper Companies, Inc. | | 11,400 | | 584,820 |
| Cytyc Corp. (a) | | 5,100 | | 143,973 |
See accompanying notes which are an integral part of the financial statements.
| | |
| VIP Balanced Portfolio | | 80 |
| Common Stocks continued | | | | |
| | | Shares | | Value |
| | | | | (Note 1) |
| HEALTH CARE continued | | | | |
| Health Care Equipment & Supplies – continued | | | | |
| Dade Behring Holdings, Inc. | | 23,814 | | $ 973,754 |
| Fisher & Paykel Healthcare Corp. | | 19,793 | | 51,363 |
| Fisher Scientific International, Inc. (a) | | 5,100 | | 315,486 |
| Guidant Corp. | | 3,000 | | 194,250 |
| INAMED Corp. (a) | | 1,100 | | 96,448 |
| Inverness Medical Innovations, Inc. (a) | | 4,700 | | 111,437 |
| Inverness Medical Innovations, Inc. (a)(m) | | 900 | | 21,339 |
| Kinetic Concepts, Inc. (a) | | 4,600 | | 182,896 |
| Medtronic, Inc. | | 4,200 | | 241,794 |
| St. Jude Medical, Inc. (a) | | 2,000 | | 100,400 |
| Synthes, Inc. | | 2,810 | | 315,644 |
| Thermo Electron Corp. (a) | | 15,000 | | 451,950 |
| Varian, Inc. (a) | | 8,400 | | 334,236 |
| Waters Corp. (a) | | 17,500 | | 661,500 |
| | | | | 7,260,608 |
| Health Care Providers & Services 2.7% | | | | |
| Aetna, Inc. | | 4,600 | | 433,826 |
| American Retirement Corp. (a) | | 4,900 | | 123,137 |
| Cardinal Health, Inc. | | 17,700 | | 1,216,875 |
| Caremark Rx, Inc. (a) | | 6,200 | | 321,098 |
| Emdeon Corp. (a) | | 37,600 | | 318,096 |
| Health Net, Inc. (a) | | 15,000 | | 773,250 |
| Humana, Inc. (a) | | 8,900 | | 483,537 |
| IMS Health, Inc. | | 2,400 | | 59,808 |
| Medco Health Solutions, Inc. (a) | | 7,400 | | 412,920 |
| Omnicare, Inc. | | 4,100 | | 234,602 |
| Psychiatric Solutions, Inc. (a) | | 2,300 | | 135,102 |
| Quest Diagnostics, Inc. | | 2,600 | | 133,848 |
| Sierra Health Services, Inc. (a) | | 2,200 | | 175,912 |
| Sunrise Senior Living, Inc. (a) | | 12,700 | | 428,117 |
| UnitedHealth Group, Inc. | | 54,600 | | 3,392,844 |
| WebMD Health Corp. Class A | | 600 | | 17,430 |
| WellPoint, Inc. (a) | | 9,300 | | 742,047 |
| | | | | 9,402,449 |
| Pharmaceuticals 1.9% | | | | |
| Atherogenics, Inc. (a) | | 16,100 | | 322,161 |
| Barr Pharmaceuticals, Inc. (a) | | 8,100 | | 504,549 |
| Cipla Ltd. | | 11,414 | | 113,645 |
| Johnson & Johnson | | 29,800 | | 1,790,980 |
| Novartis AG sponsored ADR | | 17,600 | | 923,648 |
| Pfizer, Inc. | | 25,000 | | 583,000 |
| Schering Plough Corp. | | 13,200 | | 275,220 |
| Teva Pharmaceutical Industries Ltd. sponsored ADR | | 20,900 | | 898,909 |
| Wyeth | | 25,900 | | 1,193,213 |
| | | | | 6,605,325 |
| |
| TOTAL HEALTH CARE | | | | 26,150,618 |
See accompanying notes which are an integral part of the financial statements.
|
81 Annual Report
81
| VIP Balanced Portfolio | | | | |
| Investments - continued | | | | |
| |
| |
| |
| | | Shares | | Value |
| | | | | (Note 1) |
| INDUSTRIALS – 8.2% | | | | |
| Aerospace & Defense – 1.2% | | | | |
| EADS NV | | 11,600 | | $ 438,072 |
| Goodrich Corp. | | 1,000 | | 41,100 |
| Hexcel Corp. (a) | | 14,700 | | 265,335 |
| Honeywell International, Inc. | | 23,800 | | 886,550 |
| Lockheed Martin Corp. | | 5,100 | | 324,513 |
| Meggitt PLC | | 32,778 | | 204,273 |
| Precision Castparts Corp. | | 11,850 | | 613,949 |
| Raytheon Co. | | 7,800 | | 313,170 |
| Rockwell Collins, Inc. | | 6,400 | | 297,408 |
| United Technologies Corp. | | 13,700 | | 765,967 |
| | | | | 4,150,337 |
| Air Freight & Logistics – 0.3% | | | | |
| EGL, Inc. (a) | | 11,200 | | 420,784 |
| FedEx Corp. | | 2,500 | | 258,475 |
| Forward Air Corp. | | 500 | | 18,325 |
| UTI Worldwide, Inc. | | 3,000 | | 278,520 |
| | | | | 976,104 |
| Airlines – 0.6% | | | | |
| ACE Aviation Holdings, Inc. Class A (a) | | 10,600 | | 346,480 |
| AirTran Holdings, Inc. (a) | | 72,500 | | 1,162,175 |
| Frontier Airlines, Inc. (a)(e) | | 73,500 | | 679,140 |
| | | | | 2,187,795 |
| Building Products – 0.2% | | | | |
| American Standard Companies, Inc. | | 3,900 | | 155,805 |
| Masco Corp. | | 15,100 | | 455,869 |
| | | | | 611,674 |
| Commercial Services & Supplies 0.4% | | | | |
| Banta Corp. | | 1,300 | | 64,740 |
| Cendant Corp. | | 30,200 | | 520,950 |
| Cintas Corp. | | 2,600 | | 107,068 |
| Corrections Corp. of America (a) | | 2,800 | | 125,916 |
| HNI Corp. | | 1,100 | | 60,423 |
| Kforce, Inc. (a) | | 10,100 | | 112,716 |
| PICO Holdings, Inc. (a) | | 1,000 | | 32,260 |
| The Brink’s Co. | | 6,200 | | 297,042 |
| | | | | 1,321,115 |
| Construction & Engineering – 1.4% | | | | |
| Chicago Bridge & Iron Co. NV | | | | |
| (NY Shares) | | 11,200 | | 282,352 |
| Fluor Corp. | | 25,200 | | 1,946,952 |
| Foster Wheeler Ltd. (a) | | 10,100 | | 371,478 |
| Granite Construction, Inc. | | 5,900 | | 211,869 |
| Infrasource Services, Inc. (a) | | 8,100 | | 105,948 |
| McDermott International, Inc. (a) | | 4,700 | | 209,667 |
| Perini Corp. (a) | | 19,400 | | 468,510 |
| Punj Lloyd Ltd. | | 574 | | 8,930 |
| Shaw Group, Inc. (a) | | 24,100 | | 701,069 |
See accompanying notes which are an integral part of the financial statements.
| | |
| VIP Balanced Portfolio | | 82 |
| Common Stocks continued | | | | | | | | |
| | | | | Shares | | | | Value |
| | | | | | | | | (Note 1) |
| INDUSTRIALS – continued | | | | | | | | |
| Construction & Engineering – continued | | | | | | | | |
| URS Corp. (a) | | | | 14,600 | | $ | | 549,106 |
| Washington Group International, Inc. | | | | 1,700 | | | | 90,049 |
| | | | | | | | | 4,945,930 |
| Electrical Equipment 0.1% | | | | | | | | |
| Cooper Industries Ltd. Class A | | | | 1,900 | | | | 138,700 |
| Rockwell Automation, Inc. | | | | 600 | | | | 35,496 |
| | | | | | | | | 174,196 |
| Industrial Conglomerates 2.3% | | | | | | | | |
| 3M Co. | | | | 7,300 | | | | 565,750 |
| Carlisle Companies, Inc. | | | | 900 | | | | 62,235 |
| General Electric Co. | | | | 162,200 | | | | 5,685,110 |
| Smiths Group PLC | | | | 21,169 | | | | 381,199 |
| Tyco International Ltd. | | | | 51,000 | | | | 1,471,860 |
| | | | | | | | | 8,166,154 |
| Machinery – 0.6% | | | | | | | | |
| Atlas Copco AB (B Shares) | | | | 14,400 | | | | 287,293 |
| Briggs & Stratton Corp. | | | | 8,400 | | | | 325,836 |
| Danaher Corp. | | | | 5,100 | | | | 284,478 |
| Deere & Co. | | | | 5,700 | | | | 388,227 |
| SPX Corp. | | | | 9,300 | | | | 425,661 |
| Timken Co. | | | | 9,800 | | | | 313,796 |
| Watts Water Technologies, Inc. Class A | | | | 2,700 | | | | 81,783 |
| | | | | | | | | 2,107,074 |
| Marine – 0.1% | | | | | | | | |
| Alexander & Baldwin, Inc. | | | | 8,500 | | | | 461,040 |
| Road & Rail 0.6% | | | | | | | | |
| Burlington Northern Santa Fe Corp. | | | | 9,600 | | | | 679,872 |
| Laidlaw International, Inc. | | | | 29,200 | | | | 678,316 |
| Norfolk Southern Corp. | | | | 18,200 | | | | 815,906 |
| | | | | | | | | 2,174,094 |
| Trading Companies & Distributors – 0.4% | | | | | | | | |
| UAP Holding Corp. | | | | 12,400 | | | | 253,208 |
| United Rentals, Inc. (a) | | | | 2,700 | | | | 63,153 |
| WESCO International, Inc. (a) | | | | 27,800 | | | | 1,187,894 |
| | | | | | | | | 1,504,255 |
| |
| TOTAL INDUSTRIALS | | | | | | | | 28,779,768 |
| |
| INFORMATION TECHNOLOGY 10.8% | | | | | | | | |
| Communications Equipment – 0.8% | | | | | | | | |
| Andrew Corp. (a) | | | | 14,000 | | | | 150,220 |
| Avaya, Inc. (a) | | | | 15,900 | | | | 169,653 |
| Avocent Corp. (a) | | | | 7,000 | | | | 190,330 |
| Dycom Industries, Inc. (a) | | | | 32,500 | | | | 715,000 |
| Harris Corp. | | | | 8,200 | | | | 352,682 |
| Juniper Networks, Inc. (a) | | | | 7,200 | | | | 160,560 |
| MasTec, Inc. (a) | | | | 19,800 | | | | 207,306 |
| |
| |
| |
See accompanying notes which are an integral part of the financial statements.
| | | | | | | | |
| | | 83 | | | | Annual Report |
83
| VIP Balanced Portfolio | | | | |
| Investments - continued | | | | |
| |
| |
| |
| | | Shares | | Value |
| | | | | (Note 1) |
| Motorola, Inc. | | 27,500 | | $ 621,225 |
| QUALCOMM, Inc. | | 8,400 | | 361,872 |
| | | | | 2,928,848 |
| Computers & Peripherals 1.3% | | | | |
| Dell, Inc. (a) | | 7,400 | | 221,926 |
| EMC Corp. (a) | | 23,000 | | 313,260 |
| Hewlett Packard Co. | | 13,900 | | 397,957 |
| Maxtor Corp. (a) | | 143,900 | | 998,666 |
| McDATA Corp. Class A (a) | | 28,100 | | 106,780 |
| NCR Corp. (a) | | 8,900 | | 302,066 |
| Seagate Technology | | 53,000 | | 1,059,470 |
| Sun Microsystems, Inc. (a) | | 72,200 | | 302,518 |
| UNOVA, Inc. (a) | | 1,900 | | 64,220 |
| Western Digital Corp. (a) | | 33,200 | | 617,852 |
| | | | | 4,384,715 |
| Electronic Equipment & Instruments – 2.2% | | | | |
| Agilent Technologies, Inc. (a) | | 26,300 | | 875,527 |
| Avnet, Inc. (a) | | 14,600 | | 349,524 |
| Bell Microproducts, Inc. (a) | | 19,500 | | 149,175 |
| Benchmark Electronics, Inc. (a) | | 8,600 | | 289,218 |
| Celestica, Inc. (sub. vtg.) (a) | | 52,600 | | 558,328 |
| Flextronics International Ltd. (a) | | 133,700 | | 1,395,828 |
| Hon Hai Precision Industry Co. Ltd. (Foxconn) unit | | 46,037 | | 529,428 |
| Ibiden Co. Ltd. | | 1,900 | | 101,845 |
| Ingram Micro, Inc. Class A (a) | | 28,800 | | 573,984 |
| KEMET Corp. (a) | | 10,300 | | 72,821 |
| Littelfuse, Inc. (a) | | 4,300 | | 117,175 |
| Mettler Toledo International, Inc. (a) | | 5,300 | | 292,560 |
| Molex, Inc. | | 8,600 | | 223,170 |
| Sanmina SCI Corp. (a) | | 2,800 | | 11,928 |
| Solectron Corp. (a) | | 248,900 | | 910,974 |
| Symbol Technologies, Inc. | | 64,600 | | 828,172 |
| Tektronix, Inc. | | 10,300 | | 290,563 |
| Vishay Intertechnology, Inc. (a) | | 18,700 | | 257,312 |
| | | | | 7,827,532 |
| Internet Software & Services 0.6% | | | | |
| Google, Inc. Class A (sub. vtg.) (a) | | 2,950 | | 1,223,837 |
| Openwave Systems, Inc. (a) | | 6,600 | | 115,302 |
| Yahoo!, Inc. (a) | | 15,900 | | 622,962 |
| | | | | 1,962,101 |
| IT Services 0.4% | | | | |
| Alliance Data Systems Corp. (a) | | 6,600 | | 234,960 |
| Ceridian Corp. (a) | | 22,500 | | 559,125 |
| First Data Corp. | | 12,700 | | 546,227 |
| Wright Express Corp. | | 5,900 | | 129,800 |
| | | | | 1,470,112 |
| Office Electronics – 0.2% | | | | |
| Xerox Corp. (a) | | 49,400 | | 723,710 |
| Semiconductors & Semiconductor Equipment – 4.0% | | | | |
| Advanced Energy Industries, Inc. (a) | | 9,900 | | 117,117 |
| Agere Systems, Inc. (a) | | 81,000 | | 1,044,900 |
See accompanying notes which are an integral part of the financial statements.
| | |
| VIP Balanced Portfolio | | 84 |
| Common Stocks continued | | | | |
| | | Shares | | Value |
| | | | | (Note 1) |
| INFORMATION TECHNOLOGY – continued | | | | |
| Semiconductors & Semiconductor Equipment – continued | | | | |
| AMIS Holdings, Inc. (a) | | 4,200 | | $ 44,730 |
| Amkor Technology, Inc. (a) | | 48,600 | | 272,160 |
| Analog Devices, Inc. | | 3,600 | | 129,132 |
| Applied Micro Circuits Corp. (a) | | 7,500 | | 19,275 |
| Asat Holdings Ltd. sponsored ADR (a) | | 33,200 | | 25,564 |
| ASM International NV (Nasdaq) (a) | | 9,800 | | 164,836 |
| ASML Holding NV (NY Shares) (a) | | 30,500 | | 612,440 |
| ATI Technologies, Inc. (a) | | 14,500 | | 246,957 |
| ATMI, Inc. (a) | | 39,300 | | 1,099,221 |
| Axcelis Technologies, Inc. (a) | | 73,800 | | 352,026 |
| Cascade Microtech, Inc. | | 6,500 | | 81,900 |
| Credence Systems Corp. (a) | | 34,300 | | 238,728 |
| Cymer, Inc. (a) | | 12,700 | | 450,977 |
| Cypress Semiconductor Corp. (a) | | 9,900 | | 141,075 |
| DSP Group, Inc. (a) | | 9,400 | | 235,564 |
| Fairchild Semiconductor International, Inc. (a) | | 47,100 | | 796,461 |
| FormFactor, Inc. (a) | | 11,800 | | 288,274 |
| Freescale Semiconductor, Inc.: | | | | |
| Class A (a) | | 42,200 | | 1,063,018 |
| Class B (a) | | 90,000 | | 2,265,300 |
| Integrated Device Technology, Inc. (a) | | 7,300 | | 96,214 |
| Intel Corp. | | 4,300 | | 107,328 |
| Intersil Corp. Class A | | 13,200 | | 328,416 |
| Linear Technology Corp. | | 3,600 | | 129,852 |
| LTX Corp. (a) | | 72,400 | | 325,800 |
| Maxim Integrated Products, Inc. | | 1,400 | | 50,736 |
| Microchip Technology, Inc. | | 5,900 | | 189,685 |
| National Semiconductor Corp. | | 46,000 | | 1,195,080 |
| ON Semiconductor Corp. (a) | | 24,900 | | 137,697 |
| Samsung Electronics Co. Ltd. | | 1,260 | | 824,159 |
| Silicon Laboratories, Inc. (a) | | 11,300 | | 414,258 |
| Teradyne, Inc. (a) | | 20,700 | | 301,599 |
| | | | | 13,790,479 |
| Software 1.3% | | | | |
| Activision, Inc. (a) | | 12,433 | | 170,829 |
| BEA Systems, Inc. (a) | | 60,100 | | 564,940 |
| Citrix Systems, Inc. (a) | | 5,800 | | 166,924 |
| Cognos, Inc. (a) | | 12,300 | | 429,027 |
| FileNET Corp. (a) | | 6,000 | | 155,100 |
| Hyperion Solutions Corp. (a) | | 8,100 | | 290,142 |
| JDA Software Group, Inc. (a) | | 7,200 | | 122,472 |
| Macrovision Corp. (a) | | 16,506 | | 276,145 |
| McAfee, Inc. (a) | | 1,900 | | 51,547 |
| Microsoft Corp. | | 70,800 | | 1,851,420 |
| Nintendo Co. Ltd. | | 700 | | 84,602 |
| Oracle Corp. (a) | | 7,500 | | 91,575 |
| Symantec Corp. (a) | | 12,905 | | 225,838 |
See accompanying notes which are an integral part of the financial statements.
|
85 Annual Report
85
| VIP Balanced Portfolio | | | | |
| Investments - continued | | | | |
| |
| |
| |
| | | Shares | | Value |
| | | | | (Note 1) |
| Take Two Interactive Software, Inc. (a) | | 10,200 | | $ 180,540 |
| TIBCO Software, Inc. (a) | | 1,500 | | 11,205 |
| | | | | 4,672,306 |
| |
| TOTAL INFORMATION TECHNOLOGY | | | | 37,759,803 |
| |
| MATERIALS 4.6% | | | | |
| Chemicals 1.8% | | | | |
| Air Products & Chemicals, Inc. | | 5,600 | | 331,464 |
| Airgas, Inc. | | 16,100 | | 529,690 |
| Albemarle Corp. | | 12,100 | | 464,035 |
| Ashland, Inc. | | 16,500 | | 955,350 |
| Celanese Corp. Class A | | 24,500 | | 468,440 |
| Chemtura Corp. | | 64,900 | | 824,230 |
| Cytec Industries, Inc. | | 1,300 | | 61,919 |
| Georgia Gulf Corp. | | 9,200 | | 279,864 |
| Lyondell Chemical Co. | | 10,600 | | 252,492 |
| Monsanto Co. | | 9,700 | | 752,041 |
| Mosaic Co. (a) | | 48,300 | | 706,629 |
| NOVA Chemicals Corp. | | 1,800 | | 60,090 |
| Praxair, Inc. | | 7,000 | | 370,720 |
| Rhodia SA (a) | | 167,059 | | 357,969 |
| | | | | 6,414,933 |
| Construction Materials – 0.4% | | | | |
| Florida Rock Industries, Inc. | | 1,550 | | 76,043 |
| Martin Marietta Materials, Inc. | | 6,000 | | 460,320 |
| Rinker Group Ltd. | | 29,000 | | 349,940 |
| Texas Industries, Inc. | | 7,000 | | 348,880 |
| Vulcan Materials Co. | | 2,900 | | 196,475 |
| | | | | 1,431,658 |
| Containers & Packaging – 0.8% | | | | |
| Ball Corp. | | 1,900 | | 75,468 |
| Crown Holdings, Inc. (a) | | 7,200 | | 140,616 |
| Owens Illinois, Inc. (a) | | 46,100 | | 969,944 |
| Packaging Corp. of America | | 15,500 | | 355,725 |
| Pactiv Corp. (a) | | 36,600 | | 805,200 |
| Smurfit Stone Container Corp. (a) | | 27,102 | | 384,035 |
| | | | | 2,730,988 |
| Metals & Mining – 1.5% | | | | |
| Agnico Eagle Mines Ltd. | | 16,700 | | 330,682 |
| Alcoa, Inc. | | 43,600 | | 1,289,252 |
| Boliden AB (a) | | 3,000 | | 24,545 |
| Chaparral Steel Co. (a) | | 4,300 | | 130,075 |
| Companhia Vale do Rio Doce sponsored ADR | | 4,100 | | 168,674 |
| Compass Minerals International, Inc. | | 8,300 | | 203,682 |
| Falconbridge Ltd. | | 21,220 | | 629,728 |
| Goldcorp, Inc. | | 31,000 | | 690,637 |
| Ivanhoe Mines Ltd. (a) | | 7,100 | | 50,996 |
| Meridian Gold, Inc. (a) | | 38,100 | | 835,051 |
| Newmont Mining Corp. | | 1,000 | | 53,400 |
| RTI International Metals, Inc. (a) | | 4,800 | | 182,160 |
See accompanying notes which are an integral part of the financial statements.
| | |
| VIP Balanced Portfolio | | 86 |
| Common Stocks continued | | | | | | | | |
| | | | | Shares | | | | Value |
| | | | | | | | | (Note 1) |
| MATERIALS – continued | | | | | | | | |
| Metals & Mining – continued | | | | | | | | |
| Stillwater Mining Co. (a) | | | | 27,400 | | $ | | 317,018 |
| Teck Cominco Ltd. Class B (sub. vtg.) | | | | 7,900 | | | | 421,655 |
| | | | | | | | | 5,327,555 |
| Paper & Forest Products 0.1% | | | | | | | | |
| Votorantim Celulose e Papel SA sponsored ADR (non vtg.) | | | | 15,700 | | | | 192,953 |
| |
| TOTAL MATERIALS | | | | | | | | 16,098,087 |
| |
| TELECOMMUNICATION SERVICES 3.2% | | | | | | | | |
| Diversified Telecommunication Services – 1.8% | | | | | | | | |
| AT&T, Inc. | | | | 106,270 | | | | 2,602,552 |
| BellSouth Corp. | | | | 9,700 | | | | 262,870 |
| Covad Communications Group, Inc. (a) | | | | 314,200 | | | | 307,916 |
| Telewest Global, Inc. (a) | | | | 11,000 | | | | 262,020 |
| Verizon Communications, Inc. | | | | 87,300 | | | | 2,629,476 |
| | | | | | | | | 6,064,834 |
| Wireless Telecommunication Services – 1.4% | | | | | | | | |
| American Tower Corp. Class A (a) | | | | 80,970 | | | | 2,194,287 |
| Bharti Televentures Ltd. (a) | | | | 5,183 | | | | 40,587 |
| Crown Castle International Corp. (a) | | | | 22,900 | | | | 616,239 |
| DigitalGlobe, Inc. (f) | | | | 163 | | | | 408 |
| Nextel Partners, Inc. Class A (a) | | | | 22,000 | | | | 614,680 |
| NII Holdings, Inc. (a) | | | | 10,900 | | | | 476,112 |
| Sprint Nextel Corp. | | | | 42,262 | | | | 987,240 |
| Wireless Facilities, Inc. (a) | | | | 7,000 | | | | 35,700 |
| | | | | | | | | 4,965,253 |
| |
| TOTAL TELECOMMUNICATION SERVICES | | | | | | | | 11,030,087 |
| |
| UTILITIES 2.2% | | | | | | | | |
| Electric Utilities – 0.5% | | | | | | | | |
| E.ON AG | | | | 2,400 | | | | 248,544 |
| Edison International | | | | 2,800 | | | | 122,108 |
| Entergy Corp. | | | | 4,200 | | | | 288,330 |
| Exelon Corp. | | | | 15,800 | | | | 839,612 |
| ITC Holdings Corp. | | | | 2,600 | | | | 73,034 |
| Northeast Utilities | | | | 3,300 | | | | 64,977 |
| PPL Corp. | | | | 9,100 | | | | 267,540 |
| | | | | | | | | 1,904,145 |
| Independent Power Producers & Energy Traders 1.2% | | | | | | | | |
| AES Corp. (a) | | | | 108,000 | | | | 1,709,640 |
| Dynegy, Inc. Class A (a) | | | | 500 | | | | 2,420 |
| NRG Energy, Inc. (a) | | | | 7,900 | | | | 372,248 |
| TXU Corp. | | | | 39,600 | | | | 1,987,524 |
| | | | | | | | | 4,071,832 |
| Multi-Utilities – 0.5% | | | | | | | | |
| CMS Energy Corp. (a) | | | | 32,900 | | | | 477,379 |
| Dominion Resources, Inc. | | | | 7,500 | | | | 579,000 |
| |
| |
See accompanying notes which are an integral part of the financial statements.
| | | | | | | | |
| | | 87 | | | | Annual Report |
87
| VIP Balanced Portfolio | | | | | | | | |
| Investments - continued | | | | | | |
| |
| |
| |
| | | | | Shares | | | | Value |
| | | | | | | | | (Note 1) |
| MDU Resources Group, Inc. | | | | 500 | | $ | | 16,370 |
| PG&E Corp. | | | | 12,100 | | | | 449,152 |
| Public Service Enterprise Group, Inc. | | 4,400 | | | | 285,868 |
| | | | | | | | | 1,807,769 |
| |
| TOTAL UTILITIES | | | | | | | | 7,783,746 |
| |
| TOTAL COMMON STOCKS | | | | | | | | |
| (Cost $212,360,226) | | | | | | 237,127,638 |
| |
| Convertible Preferred Stocks 0.1% | | | | | | |
| |
| FINANCIALS – 0.1% | | | | | | | | |
| Insurance – 0.1% | | | | | | | | |
| Platinum Underwriters Holdings Ltd. Series A, 6.00% | | 1,800 | | | | 55,836 |
| XL Capital Ltd. 6.50% | | | | 9,100 | | | | 202,566 |
| | | | | | | | | 258,402 |
| |
| UTILITIES 0.0% | | | | | | | | |
| Electric Utilities – 0.0% | | | | | | | | |
| Entergy Corp. 7.25% | | | | 3,200 | | | | 159,200 |
| TOTAL CONVERTIBLE PREFERRED STOCKS | | | | | | |
| (Cost $423,662) | | | | | | | | 417,602 |
| |
| Corporate Bonds 7.2% | | | | | | | | |
| | | | | Principal | | | | |
| | | | | Amount | | | | |
| Convertible Bonds 0.2% | | | | | | | | |
| |
| ENERGY 0.1% | | | | | | | | |
| Oil, Gas & Consumable Fuels 0.1% | | | | | | |
| McMoRan Exploration Co. 6% 7/2/08 | | $ 180,000 | | | | 255,168 |
| HEALTH CARE 0.0% | | | | | | | | |
| Health Care Providers & Services 0.0% | | | | | | |
| Omnicare, Inc. 3.25% 12/15/35 | | | | 110,000 | | | | 109,175 |
| TELECOMMUNICATION SERVICES 0.1% | | | | | | |
| Wireless Telecommunication Services – 0.1% | | | | | | |
| Nextel Communications, Inc. 5.25% 1/15/10 | | 150,000 | | | | 150,375 |
| |
| TOTAL CONVERTIBLE BONDS | | | | | | | | 514,718 |
| Nonconvertible Bonds – 7.0% | | | | | | | | |
| |
| CONSUMER DISCRETIONARY 0.8% | | | | | | |
| Auto Components – 0.0% | | | | | | | | |
| Delco Remy International, Inc. 9.375% 4/15/12 | | 55,000 | | | | 15,950 |
| Automobiles – 0.1% | | | | | | | | |
| Ford Motor Co.: | | | | | | | | |
| 6.625% 10/1/28 | | | | 40,000 | | | | 25,800 |
See accompanying notes which are an integral part of the financial statements.
| | |
| VIP Balanced Portfolio | | 88 |
| Corporate Bonds continued | | | | |
| | | Principal | | Value |
| | | Amount | | (Note 1) |
| Nonconvertible Bonds – continued | | | | |
| |
| CONSUMER DISCRETIONARY – continued | | | | |
| Automobiles – continued | | | | |
| Ford Motor Co.: – continued | | | | |
| 7.45% 7/16/31 | | $ 145,000 | | $ 98,600 |
| General Motors Corp. 8.375% 7/15/33 | | 515,000 | | 339,900 |
| | | | | 464,300 |
| Diversified Consumer Services 0.0% | | | | |
| Carriage Services, Inc. 7.875% 1/15/15 | | 50,000 | | 50,875 |
| Hotels, Restaurants & Leisure 0.1% | | | | |
| Carrols Corp. 9% 1/15/13 | | 100,000 | | 97,250 |
| Mandalay Resort Group 6.5% 7/31/09 | | 95,000 | | 96,069 |
| MGM MIRAGE 5.875% 2/27/14 | | 90,000 | | 85,950 |
| Six Flags, Inc.: | | | | |
| 9.625% 6/1/14 | | 15,000 | | 14,550 |
| 9.75% 4/15/13 | | 20,000 | | 19,600 |
| | | | | 313,419 |
| Media 0.5% | | | | |
| AOL Time Warner, Inc.: | | | | |
| 6.875% 5/1/12 | | 30,000 | | 31,934 |
| 7.625% 4/15/31 | | 100,000 | | 111,365 |
| Cablevision Systems Corp. 8.7163% 4/1/09 (j) | | 90,000 | | 90,450 |
| Charter Communications Operating LLC/Charter Communications Operating Capital Corp. 8% 4/30/12 (f) | | 80,000 | | 79,800 |
| Cox Communications, Inc. 7.125% 10/1/12 | | 100,000 | | 107,148 |
| CSC Holdings, Inc. 7.625% 4/1/11 | | 40,000 | | 39,800 |
| Dex Media West LLC/Dex Media West Finance Co. 9.875% 8/15/13 | | 39,000 | | 43,241 |
| Houghton Mifflin Co. 9.875% 2/1/13 | | 170,000 | | 179,563 |
| Liberty Media Corp.: | | | | |
| 5.7% 5/15/13 | | 150,000 | | 139,875 |
| 8.25% 2/1/30 | | 185,000 | | 181,273 |
| News America Holdings, Inc. 7.75% 12/1/45 | | 85,000 | | 97,447 |
| News America, Inc. 6.2% 12/15/34 | | 165,000 | | 163,895 |
| Time Warner Entertainment Co. LP 8.375% 7/15/33 | | 250,000 | | 295,315 |
| Time Warner, Inc. 6.625% 5/15/29 | | 105,000 | | 104,852 |
| | | | | 1,665,958 |
| Multiline Retail – 0.1% | | | | |
| The May Department Stores Co. 6.7% 7/15/34 | | 190,000 | | 202,368 |
See accompanying notes which are an integral part of the financial statements.
|
89 Annual Report
89
| VIP Balanced Portfolio | | | | |
| Investments - continued | | | | |
| |
| |
| |
| | | Principal | | Value |
| | | Amount | | (Note 1) |
| Specialty Retail 0.0% | | | | |
| Asbury Automotive Group, Inc. 8% 3/15/14 | | $ 80,000 | | $ 76,400 |
| Sonic Automotive, Inc. 8.625% 8/15/13 | | 110,000 | | 106,425 |
| | | | | 182,825 |
| Textiles, Apparel & Luxury Goods 0.0% | | | | |
| Levi Strauss & Co. 8.8044% 4/1/12 (j) | | 30,000 | | 30,150 |
| |
| TOTAL CONSUMER DISCRETIONARY | | | | 2,925,845 |
| |
| CONSUMER STAPLES 0.1% | | | | |
| Beverages 0.0% | | | | |
| FBG Finance Ltd. 5.125% 6/15/15 (f) | | 125,000 | | 121,614 |
| Food Products – 0.1% | | | | |
| H.J. Heinz Co. 6.428% 12/1/08 (f)(j) | | 135,000 | | 138,681 |
| Tobacco – 0.0% | | | | |
| Altria Group, Inc. 7% 11/4/13 | | 55,000 | | 60,183 |
| |
| TOTAL CONSUMER STAPLES | | | | 320,478 |
| |
| ENERGY 0.9% | | | | |
| Energy Equipment & Services – 0.2% | | | | |
| Hornbeck Offshore Services, Inc. 6.125% 12/1/14 | | 40,000 | | 39,050 |
| Petronas Capital Ltd. 7% 5/22/12 (f) | | 395,000 | | 434,823 |
| Seabulk International, Inc. 9.5% 8/15/13 | | 80,000 | | 89,800 |
| | | | | 563,673 |
| Oil, Gas & Consumable Fuels 0.7% | | | | |
| Amerada Hess Corp. 6.65% 8/15/11 | | 40,000 | | 42,982 |
| Chesapeake Energy Corp. 7.5% 6/15/14 | | 40,000 | | 42,200 |
| Duke Capital LLC: | | | | |
| 4.37% 3/1/09 | | 400,000 | | 390,424 |
| 6.75% 2/15/32 | | 210,000 | | 228,533 |
| El Paso Corp.: | | | | |
| 6.5% 5/15/06 (f) | | 10,000 | | 10,074 |
| 7.625% 9/1/08 (f) | | 10,000 | | 10,118 |
| 7.75% 6/15/10 (f) | | 35,000 | | 35,823 |
| 7.875% 6/15/12 | | 85,000 | | 87,125 |
| Empresa Nacional de Petroleo 6.75% 11/15/12 (f) | | 120,000 | | 129,204 |
| EnCana Holdings Finance Corp. 5.8% 5/1/14 | | 80,000 | | 83,389 |
| Enterprise Products Operating LP 5.75% 3/1/35 | | 125,000 | | 114,931 |
| Kinder Morgan Energy Partners LP: | | | | |
| 5.125% 11/15/14 | | 35,000 | | 34,231 |
| 5.8% 3/15/35 | | 100,000 | | 95,661 |
See accompanying notes which are an integral part of the financial statements.
| | |
| VIP Balanced Portfolio | | 90 |
| Corporate Bonds continued | | | | |
| | | Principal | | Value |
| | | Amount | | (Note 1) |
| Nonconvertible Bonds – continued | | | | |
| |
| ENERGY – continued | | | | |
| Oil, Gas & Consumable Fuels – continued | | | | |
| Massey Energy Co. 6.875% 12/15/13 (f) | | $ 40,000 | | $ 40,350 |
| Nexen, Inc. 5.875% 3/10/35 | | 190,000 | | 186,831 |
| Pemex Project Funding Master Trust: | | | | |
| 5.75% 12/15/15 (f) | | 100,000 | | 99,500 |
| 6.125% 8/15/08 | | 400,000 | | 408,000 |
| 6.625% 6/15/35 (f) | | 235,000 | | 235,588 |
| 7.875% 2/1/09 (j) | | 180,000 | | 192,510 |
| Plains Exploration & Production Co. 7.125% 6/15/14 | | 25,000 | | 25,875 |
| | | | | 2,493,349 |
| |
| TOTAL ENERGY | | | | 3,057,022 |
| |
| FINANCIALS – 2.4% | | | | |
| Capital Markets 0.5% | | | | |
| Goldman Sachs Group, Inc.: | | | | |
| 5.25% 10/15/13 | | 500,000 | | 499,880 |
| 6.6% 1/15/12 | | 410,000 | | 440,417 |
| Lazard Group LLC 7.125% 5/15/15 | | 195,000 | | 204,768 |
| Merrill Lynch & Co., Inc. 4.25% 2/8/10 | | 480,000 | | 466,908 |
| Morgan Stanley 6.6% 4/1/12 | | 160,000 | | 171,979 |
| | | | | 1,783,952 |
| Commercial Banks – 0.2% | | | | |
| Bank of America Corp. 7.4% 1/15/11 | | 155,000 | | 170,736 |
| Korea Development Bank 3.875% 3/2/09 | | 250,000 | | 241,885 |
| Wachovia Bank NA 4.875% 2/1/15 | | 90,000 | | 87,770 |
| Wachovia Corp. 4.875% 2/15/14 | | 25,000 | | 24,467 |
| | | | | 524,858 |
| Consumer Finance – 0.4% | | | | |
| Capital One Bank 6.5% 6/13/13 | | 250,000 | | 265,610 |
| Ford Motor Credit Co.: | | | | |
| 7.375% 2/1/11 | | 100,000 | | 87,652 |
| 7.875% 6/15/10 | | 200,000 | | 179,978 |
| General Motors Acceptance Corp.: | | | | |
| 6.75% 12/1/14 | | 40,000 | | 36,000 |
| 6.875% 9/15/11 | | 35,000 | | 31,938 |
| 6.875% 8/28/12 | | 15,000 | | 13,520 |
| 8% 11/1/31 | | 15,000 | | 14,550 |
| Household Finance Corp. 4.125% 11/16/09 | | 300,000 | | 289,647 |
| Household International, Inc. 5.836% 2/15/08 | | 150,000 | | 152,485 |
See accompanying notes which are an integral part of the financial statements.
|
91 Annual Report
91
| VIP Balanced Portfolio | | | | |
| Investments - continued | | | | |
| |
| |
| |
| | | Principal | | Value |
| | | Amount | | (Note 1) |
| MBNA America Bank NA 7.125% 11/15/12 | | $ 325,000 | | $ 363,318 |
| MBNA Corp. 7.5% 3/15/12 | | 75,000 | | 84,475 |
| | | | | 1,519,173 |
| Diversified Financial Services – 0.2% | | | | |
| Alliance Capital Management LP 5.625% 8/15/06 | | 150,000 | | 150,621 |
| JPMorgan Chase Capital XVII 5.85% 8/1/35 | | 565,000 | | 559,013 |
| Prime Property Funding, Inc. 5.125% 6/1/15 (f) | | 160,000 | | 154,720 |
| | | | | 864,354 |
| Insurance – 0.1% | | | | |
| Axis Capital Holdings Ltd. 5.75% 12/1/14 | | 250,000 | | 250,054 |
| Marsh & McLennan Companies, Inc. 5.75% 9/15/15 | | 110,000 | | 110,884 |
| Principal Life Global Funding I 6.25% 2/15/12 (f) | | 85,000 | | 90,289 |
| | | | | 451,227 |
| Real Estate 0.8% | | | | |
| Archstone Smith Operating Trust 5.25% 5/1/15 | | 210,000 | | 207,095 |
| Arden Realty LP 5.25% 3/1/15 | | 525,000 | | 530,476 |
| BRE Properties, Inc. 5.95% 3/15/07 | | 250,000 | | 252,137 |
| CarrAmerica Realty Corp.: | | | | |
| 5.125% 9/1/11 | | 300,000 | | 294,047 |
| 5.5% 12/15/10 | | 120,000 | | 119,817 |
| Colonial Properties Trust 5.5% 10/1/15 | | 260,000 | | 253,427 |
| Developers Diversified Realty Corp.: | | | | |
| 5% 5/3/10 | | 115,000 | | 113,306 |
| 5.25% 4/15/11 | | 65,000 | | 64,345 |
| EOP Operating LP: | | | | |
| 4.65% 10/1/10 | | 200,000 | | 193,782 |
| 7% 7/15/11 | | 200,000 | | 214,069 |
| Simon Property Group LP: | | | | |
| 5.1% 6/15/15 | | 145,000 | | 140,237 |
| 5.625% 8/15/14 | | 200,000 | | 201,360 |
| Ventas Realty LP/Ventas Capital Corp. 6.5% 6/1/16 (f) | | 30,000 | | 30,225 |
| | | | | 2,614,323 |
| Thrifts & Mortgage Finance – 0.2% | | | | |
| Countrywide Home Loans, Inc. 4% 3/22/11 | | 145,000 | | 136,436 |
| Independence Community Bank Corp. 3.75% 4/1/14 (j) | | 165,000 | | 158,051 |
See accompanying notes which are an integral part of the financial statements.
| | |
| VIP Balanced Portfolio | | 92 |
| Corporate Bonds continued | | | | |
| | | Principal | | Value |
| | | Amount | | (Note 1) |
| Nonconvertible Bonds – continued | | | | |
| |
| FINANCIALS – continued | | | | |
| Thrifts & Mortgage Finance – continued | | | | |
| Residential Capital Corp. 6.375% 6/30/10 | | $ 185,000 | | $ 187,981 |
| Washington Mutual, Inc. 4.625% 4/1/14 | | 200,000 | | 188,072 |
| | | | | 670,540 |
| |
| TOTAL FINANCIALS | | | | 8,428,427 |
| |
| HEALTH CARE 0.1% | | | | |
| Health Care Providers & Services 0.1% | | | | |
| DaVita, Inc. 7.25% 3/15/15 | | 165,000 | | 167,063 |
| HCA, Inc. 6.375% 1/15/15 | | 70,000 | | 70,694 |
| Psychiatric Solutions, Inc. 7.75% 7/15/15 | | 30,000 | | 30,900 |
| Skilled Healthcare Group, Inc. 11% 1/15/14 (f) | | 20,000 | | 20,200 |
| | | | | 288,857 |
| |
| INDUSTRIALS – 0.4% | | | | |
| Aerospace & Defense – 0.1% | | | | |
| BAE Systems Holdings, Inc. 4.75% 8/15/10 (f) | | 145,000 | | 142,403 |
| Bombardier, Inc. 6.3% 5/1/14 (f) | | 200,000 | | 175,000 |
| | | | | 317,403 |
| Airlines – 0.2% | | | | |
| American Airlines, Inc. pass thru trust certificates: | | | | |
| 6.855% 10/15/10 | | 14,951 | | 15,211 |
| 6.978% 10/1/12 | | 37,551 | | 38,713 |
| 7.024% 4/15/11 | | 100,000 | | 102,529 |
| 7.377% 5/23/19 | | 68,586 | | 56,241 |
| 7.379% 11/23/17 | | 41,055 | | 33,665 |
| 7.858% 4/1/13 | | 155,000 | | 163,426 |
| Continental Airlines, Inc. pass thru trust certificates 6.795% 2/2/20 | | 209,287 | | 188,359 |
| Delta Air Lines, Inc. pass thru trust certificates 7.57% 11/18/10 | | 80,000 | | 78,824 |
| Northwest Airlines, Inc. 7.875% 3/15/08 (d) | | 255,000 | | 94,350 |
| | | | | 771,318 |
| Commercial Services & Supplies 0.0% | | | | |
| Allied Waste North America, Inc. 8.5% 12/1/08 | | 60,000 | | 63,000 |
| IKON Office Solutions, Inc. 7.75% 9/15/15 (f) | | 10,000 | | 9,775 |
| | | | | 72,775 |
See accompanying notes which are an integral part of the financial statements.
|
93 Annual Report
93
| VIP Balanced Portfolio | | | | |
| Investments - continued | | | | |
| |
| |
| |
| | | Principal | | Value |
| | | Amount | | (Note 1) |
| Industrial Conglomerates 0.1% | | | | |
| Hutchison Whampoa International 03/13 Ltd. 6.5% 2/13/13 (f) | | $ 55,000 | | $ 58,241 |
| Hutchison Whampoa International 03/33 Ltd. 7.45% 11/24/33 (f) | | 120,000 | | 138,605 |
| | | | | 196,846 |
| Machinery – 0.0% | | | | |
| Invensys PLC 9.875% 3/15/11 (f) | | 80,000 | | 79,200 |
| Marine – 0.0% | | | | |
| American Commercial Lines LLC/ACL Finance Corp. 9.5% 2/15/15 | | 68,000 | | 73,100 |
| Road & Rail 0.0% | | | | |
| Hertz Corp.: | | | | |
| 8.875% 1/1/14 (f) | | 30,000 | | 30,413 |
| 10.5% 1/1/16 (f) | | 20,000 | | 20,425 |
| | | | | 50,838 |
| |
| TOTAL INDUSTRIALS | | | | 1,561,480 |
| |
| INFORMATION TECHNOLOGY 0.3% | | | | |
| Communications Equipment – 0.0% | | | | |
| L 3 Communications Corp. 6.125% 1/15/14 | | 95,000 | | 94,288 |
| IT Services 0.0% | | | | |
| SunGard Data Systems, Inc.: | | | | |
| 8.5248% 8/15/13 (f)(j) | | 30,000 | | 30,938 |
| 9.125% 8/15/13 (f) | | 50,000 | | 51,688 |
| | | | | 82,626 |
| Office Electronics – 0.1% | | | | |
| Xerox Capital Trust I 8% 2/1/27 | | 170,000 | | 174,675 |
| Xerox Corp. 7.125% 6/15/10 | | 35,000 | | 36,313 |
| | | | | 210,988 |
| Semiconductors & Semiconductor Equipment – 0.2% | | | | |
| Amkor Technology, Inc. 9.25% 2/15/08 | | 20,000 | | 19,450 |
| Chartered Semiconductor Manufacturing Ltd.: | | | | |
| 5.75% 8/3/10 | | 195,000 | | 194,316 |
| 6.375% 8/3/15 | | 145,000 | | 144,161 |
| Freescale Semiconductor, Inc.: | | | | |
| 6.9% 7/15/09 (j) | | 70,000 | | 71,575 |
| 7.125% 7/15/14 | | 80,000 | | 84,600 |
| | | | | 514,102 |
| |
| TOTAL INFORMATION TECHNOLOGY | | | | 902,004 |
| |
| MATERIALS 0.2% | | | | |
| Chemicals 0.1% | | | | |
| BCP Crystal U.S. Holdings Corp. 9.625% 6/15/14 | | 62,000 | | 69,285 |
See accompanying notes which are an integral part of the financial statements.
| | |
| VIP Balanced Portfolio | | 94 |
| Corporate Bonds continued | | | | |
| | | Principal | | Value |
| | | Amount | | (Note 1) |
| Nonconvertible Bonds – continued | | | | |
| |
| MATERIALS – continued | | | | |
| Chemicals – continued | | | | |
| Huntsman International LLC 9.875% 3/1/09 | | $ 60,000 | | $ 63,225 |
| Lyondell Chemical Co. | | | | |
| 9.5% 12/15/08 | | 94,000 | | 98,583 |
| | | | | 231,093 |
| Construction Materials – 0.0% | | | | |
| RMCC Acquisition Co. 9.5% | | | | |
| 11/1/12 (f) | | 90,000 | | 90,450 |
| Containers & Packaging – 0.0% | | | | |
| Owens-Brockway Glass Container, Inc.: | | | | |
| 7.75% 5/15/11 | | 50,000 | | 52,125 |
| 8.75% 11/15/12 | | 25,000 | | 26,875 |
| | | | | 79,000 |
| Metals & Mining – 0.0% | | | | |
| Newmont Mining Corp. 5.875% | | | | |
| 4/1/35 | | 130,000 | | 128,287 |
| Paper & Forest Products 0.1% | | | | |
| Georgia Pacific Corp.: | | | | |
| 7.5% 5/15/06 | | 120,000 | | 120,600 |
| 8.125% 5/15/11 | | 120,000 | | 120,000 |
| International Paper Co. 4.25% | | | | |
| 1/15/09 | | 70,000 | | 67,937 |
| | | | | 308,537 |
| |
| TOTAL MATERIALS | | | | 837,367 |
| |
| TELECOMMUNICATION SERVICES 0.9% | | | | |
| Diversified Telecommunication Services – 0.7% | | | | |
| AT&T Broadband Corp. 8.375% 3/15/13 | | 100,000 | | 115,748 |
| BellSouth Capital Funding Corp. 7.875% 2/15/30 | | 115,000 | | 138,830 |
| BellSouth Corp. 5.2% 9/15/14 | | 55,000 | | 54,707 |
| British Telecommunications PLC 8.875% 12/15/30 | | 200,000 | | 267,588 |
| Koninklijke KPN NV yankee 8% | | | | |
| 10/1/10 | | 200,000 | | 219,650 |
| Qwest Capital Funding, Inc. 7% | | | | |
| 8/3/09 | | 60,000 | | 60,225 |
| Qwest Corp.: | | | | |
| 7.7413% 6/15/13 (f)(j) | | 140,000 | | 149,800 |
| 8.875% 3/15/12 | | 85,000 | | 95,838 |
| SBC Communications, Inc.: | | | | |
| 6.15% 9/15/34 | | 150,000 | | 150,669 |
| 6.45% 6/15/34 | | 55,000 | | 57,232 |
| Sprint Capital Corp.: | | | | |
| 6.875% 11/15/28 | | 145,000 | | 158,440 |
| 8.375% 3/15/12 | | 135,000 | | 156,460 |
See accompanying notes which are an integral part of the financial statements.
|
95 Annual Report
95
| VIP Balanced Portfolio | | | | |
| Investments - continued | | | | |
| |
| |
| |
| | | Principal | | Value |
| | | Amount | | (Note 1) |
| Telecom Italia Capital: | | | | |
| 4.95% 9/30/14 | | $ 95,000 | | $ 90,733 |
| 5.25% 11/15/13 | | 250,000 | | 245,319 |
| Verizon Global Funding Corp.: | | | | |
| 5.85% 9/15/35 | | 230,000 | | 221,645 |
| 7.75% 12/1/30 | | 200,000 | | 237,731 |
| Verizon New York, Inc. 6.875% 4/1/12 | | 45,000 | | 46,909 |
| | | | | 2,467,524 |
| Wireless Telecommunication Services – 0.2% | | | | |
| America Movil SA de CV 4.125% 3/1/09 | | 100,000 | | 97,200 |
| AT&T Wireless Services, Inc. 7.875% 3/1/11 | | 55,000 | | 61,713 |
| Intelsat Ltd.: | | | | |
| 6.5% 11/1/13 | | 25,000 | | 18,594 |
| 8.695% 1/15/12 (f)(j) | | 70,000 | | 71,225 |
| Nextel Communications, Inc. 7.375% 8/1/15 | | 160,000 | | 169,531 |
| Rogers Communications, Inc.: | | | | |
| 6.375% 3/1/14 | | 115,000 | | 115,144 |
| 7.6163% 12/15/10 (j) | | 50,000 | | 51,625 |
| | | | | 585,032 |
| |
| TOTAL TELECOMMUNICATION SERVICES | | | | 3,052,556 |
| |
| UTILITIES 0.9% | | | | |
| Electric Utilities – 0.4% | | | | |
| Cleveland Electric Illuminating Co. 5.65% 12/15/13 | | 145,000 | | 147,818 |
| Exelon Corp.: | | | | |
| 4.9% 6/15/15 | | 190,000 | | 181,333 |
| 5.625% 6/15/35 | | 25,000 | | 23,560 |
| 6.75% 5/1/11 | | 110,000 | | 117,108 |
| FirstEnergy Corp. 6.45% 11/15/11 | | 90,000 | | 95,400 |
| Niagara Mohawk Power Corp. 8.875% 5/15/07 | | 75,000 | | 78,952 |
| Progress Energy, Inc. 7.1% 3/1/11 | | 270,000 | | 291,308 |
| TXU Energy Co. LLC 7% 3/15/13 | | 375,000 | | 399,624 |
| | | | | 1,335,103 |
| Gas Utilities 0.1% | | | | |
| Sonat, Inc.: | | | | |
| 6.625% 2/1/08 | | 65,000 | | 64,431 |
| 6.75% 10/1/07 | | 70,000 | | 69,913 |
| Texas Eastern Transmission Corp. 7.3% 12/1/10 | | 185,000 | | 201,536 |
| | | | | 335,880 |
| Independent Power Producers & Energy Traders 0.2% | | | | |
| AES Corp.: | | | | |
| 8.75% 5/15/13 (f) | | 170,000 | | 185,088 |
| 9.5% 6/1/09 | | 59,000 | | 63,499 |
See accompanying notes which are an integral part of the financial statements.
| | |
| VIP Balanced Portfolio | | 96 |
| Corporate Bonds continued | | | | |
| | | Principal | | Value |
| | | Amount | | (Note 1) |
| Nonconvertible Bonds – continued | | | | |
| |
| UTILITIES – continued | | | | |
| Independent Power Producers & Energy Traders continued | | | | |
| Constellation Energy Group, Inc. 7% 4/1/12 | | $ 345,000 | | $ 376,424 |
| Mirant North America LLC / Mirant North America Finance Corp. 7.375% 12/31/13 (f) | | 20,000 | | 20,150 |
| | | | | 645,161 |
| Multi-Utilities – 0.2% | | | | |
| CMS Energy Corp.: | | | | |
| 8.5% 4/15/11 | | 85,000 | | 92,650 |
| 8.9% 7/15/08 | | 125,000 | | 133,750 |
| Dominion Resources, Inc.: | | | | |
| 4.75% 12/15/10 | | 155,000 | | 151,481 |
| 5.95% 6/15/35 | | 115,000 | | 112,250 |
| 6.25% 6/30/12 | | 370,000 | | 387,097 |
| | | | | 877,228 |
| |
| TOTAL UTILITIES | | | | 3,193,372 |
| |
| TOTAL NONCONVERTIBLE BONDS | | | | 24,567,408 |
| |
| TOTAL CORPORATE BONDS | | | | |
| (Cost $25,121,550) | | | | 25,082,126 |
| |
| U.S. Government and Government | | | | |
| Agency Obligations 6.9% | | | | |
| |
| U.S. Government Agency Obligations – 1.9% | | | | |
| Fannie Mae: | | | | |
| 2.5% 6/15/06 | | 410,000 | | 406,185 |
| 3.25% 1/15/08 | | 318,000 | | 308,919 |
| 3.25% 8/15/08 | | 400,000 | | 385,647 |
| 3.25% 2/15/09 | | 1,216,000 | | 1,164,699 |
| 3.375% 12/15/08 | | 140,000 | | 134,934 |
| 4.625% 5/1/13 | | 1,250,000 | | 1,213,991 |
| 5.5% 3/15/11 | | 210,000 | | 217,066 |
| 6.25% 2/1/11 | | 280,000 | | 295,711 |
| Freddie Mac: | | | | |
| 4% 6/12/13 | | 1,575,000 | | 1,488,989 |
| 6.625% 9/15/09 | | 475,000 | | 504,660 |
| 6.75% 3/15/31 | | 404,000 | | 506,397 |
| |
| TOTAL U.S. GOVERNMENT AGENCY OBLIGATIONS | | | | 6,627,198 |
| U.S. Treasury Inflation Protected Obligations – 1.8% | | | | |
| U.S. Treasury Inflation Indexed Bonds 2.375% 1/15/25 | | 1,056,710 | | 1,112,210 |
See accompanying notes which are an integral part of the financial statements.
|
97 Annual Report
97
| VIP Balanced Portfolio | | | | | | |
| Investments - continued | | | | | | |
| |
| |
| |
| | | | | Principal | | Value |
| | | | | Amount | | (Note 1) |
| U.S. Treasury Inflation Indexed Notes: | | | | | | |
| 0.875% 4/15/10 | | | | $ 1,051,420 | | $ 999,850 |
| 2% 1/15/14 | | | | 4,042,500 | | 4,020,113 |
| |
| TOTAL U.S. TREASURY INFLATION PROTECTED OBLIGATIONS | | | | 6,132,173 |
| U.S. Treasury Obligations – 3.2% | | | | | | |
| U.S. Treasury Bonds 6.25% 5/15/30 | | | | 1,040,000 | | 1,291,631 |
| U.S. Treasury Notes: | | | | | | |
| 4.375% 12/15/10 | | | | 170,000 | | 170,133 |
| 4.75% 5/15/14 | | | | 4,955,000 | | 5,075,585 |
| 6.5% 2/15/10 | | | | 4,320,000 | | 4,660,032 |
| |
| TOTAL U.S. TREASURY OBLIGATIONS | | | | | | 11,197,381 |
| |
| TOTAL U.S. GOVERNMENT AND GOVERNMENT AGENCY OBLIGATIONS | | | | |
| (Cost $24,331,213) | | | | | | 23,956,752 |
| |
| U.S. Government Agency Mortgage | | | | |
| Securities 9.1% | | | | | | |
| |
| Fannie Mae – 8.6% | | | | | | |
| 3.477% 4/1/34 (j) | | | | 37,614 | | 37,380 |
| 3.726% 1/1/35 (j) | | | | 24,621 | | 24,265 |
| 3.752% 10/1/33 (j) | | | | 17,589 | | 17,182 |
| 3.76% 12/1/34 (j) | | | | 18,896 | | 18,634 |
| 3.793% 6/1/34 (j) | | | | 83,791 | | 80,757 |
| 3.82% 6/1/33 (j) | | | | 13,757 | | 13,515 |
| 3.83% 1/1/35 (j) | | | | 19,131 | | 18,891 |
| 3.847% 1/1/35 (j) | | | | 41,070 | | 40,543 |
| 3.869% 1/1/35 (j) | | | | 20,901 | | 20,858 |
| 3.889% 12/1/34 (j) | | | | 20,109 | | 20,086 |
| 3.906% 10/1/34 (j) | | | | 17,816 | | 17,617 |
| 3.952% 5/1/34 (j) | | | | 10,777 | | 10,939 |
| 3.964% 1/1/35 (j) | | | | 18,864 | | 18,696 |
| 3.983% 12/1/34 (j) | | | | 96,260 | | 95,935 |
| 3.984% 12/1/34 (j) | | | | 20,268 | | 20,148 |
| 3.991% 12/1/34 (j) | | | | 19,352 | | 19,236 |
| 3.993% 1/1/35 (j) | | | | 18,777 | | 18,642 |
| 4.002% 2/1/35 (j) | | | | 20,345 | | 20,160 |
| 4.023% 12/1/34 (j) | | | | 18,407 | | 18,266 |
| 4.029% 2/1/35 (j) | | | | 19,807 | | 19,608 |
| 4.034% 10/1/18 (j) | | | | 13,025 | | 12,783 |
| 4.037% 1/1/35 (j) | | | | 20,509 | | 20,378 |
| 4.057% 1/1/35 (j) | | | | 19,132 | | 18,911 |
| 4.064% 4/1/33 (j) | | | | 8,463 | | 8,403 |
| 4.066% 12/1/34 (j) | | | | 20,482 | | 20,375 |
| 4.079% 1/1/35 (j) | | | | 36,100 | | 35,831 |
| 4.095% 2/1/35 (j) | | | | 19,626 | | 19,489 |
| 4.099% 2/1/35 (j) | | | | 19,401 | | 19,229 |
| 4.101% 2/1/35 (j) | | | | 19,752 | | 19,579 |
See accompanying notes which are an integral part of the financial statements.
| | |
| VIP Balanced Portfolio | | 98 |
| U.S. Government Agency Mortgage | | | | | | | | | | |
| Securities continued | | | | | | | | | | | | |
| | | | | | | | | Principal | | | | Value |
| | | | | | | | | Amount | | | | (Note 1) |
| Fannie Mae – continued | | | | | | | | | | | | |
| 4.105% 2/1/35 (j) | | | | | | | | $ 57,210 | | $ | | 56,768 |
| 4.111% 1/1/35 (j) | | | | | | | | 29,037 | | | | 28,746 |
| 4.12% 11/1/34 (j) | | | | | | | | 17,331 | | | | 17,191 |
| 4.122% 1/1/35 (j) | | | | | | | | 52,640 | | | | 52,164 |
| 4.123% 1/1/35 (j) | | | | | | | | 37,076 | | | | 36,962 |
| 4.126% 2/1/35 (j) | | | | | | | | 38,858 | | | | 38,753 |
| 4.144% 1/1/35 (j) | | | | | | | | 42,263 | | | | 42,303 |
| 4.161% 2/1/35 (j) | | | | | | | | 20,018 | | | | 19,836 |
| 4.176% 11/1/34 (j) | | | | | | | | 14,998 | | | | 14,886 |
| 4.176% 1/1/35 (j) | | | | | | | | 53,149 | | | | 52,742 |
| 4.176% 1/1/35 (j) | | | | | | | | 19,117 | | | | 18,959 |
| 4.185% 1/1/35 (j) | | | | | | | | 43,187 | | | | 42,375 |
| 4.205% 3/1/34 (j) | | | | | | | | 16,647 | | | | 16,407 |
| 4.214% 10/1/34 (j) | | | | | | | | 37,419 | | | | 37,407 |
| 4.25% 2/1/35 (j) | | | | | | | | 22,292 | | | | 21,829 |
| 4.278% 2/1/35 (j) | | | | | | | | 17,995 | | | | 17,819 |
| 4.288% 8/1/33 (j) | | | | | | | | 31,715 | | | | 31,352 |
| 4.291% 1/1/35 (j) | | | | | | | | 20,544 | | | | 20,299 |
| 4.298% 7/1/34 (j) | | | | | | | | 14,903 | | | | 14,955 |
| 4.299% 3/1/35 (j) | | | | | | | | 21,153 | | | | 20,990 |
| 4.308% 5/1/35 (j) | | | | | | | | 24,672 | | | | 24,390 |
| 4.313% 3/1/33 (j) | | | | | | | | 14,621 | | | | 14,348 |
| 4.327% 12/1/34 (j) | | | | | | | | 21,297 | | | | 21,264 |
| 4.332% 1/1/35 (j) | | | | | | | | 18,837 | | | | 18,574 |
| 4.348% 1/1/35 (j) | | | | | | | | 22,457 | | | | 22,064 |
| 4.367% 2/1/34 (j) | | | | | | | | 39,118 | | | | 38,533 |
| 4.394% 2/1/35 (j) | | | | | | | | 21,360 | | | | 20,977 |
| 4.409% 5/1/35 (j) | | | | | | | | 44,308 | | | | 43,819 |
| 4.442% 10/1/34 (j) | | | | | | | | 86,022 | | | | 86,055 |
| 4.445% 3/1/35 (j) | | | | | | | | 22,670 | | | | 22,311 |
| 4.447% 4/1/34 (j) | | | | | | | | 26,537 | | | | 26,413 |
| 4.467% 8/1/34 (j) | | | | | | | | 56,461 | | | | 55,812 |
| 4.48% 1/1/35 (j) | | | | | | | | 17,462 | | | | 17,383 |
| 4.497% 3/1/35 (j) | | | | | | | | 45,725 | | | | 44,984 |
| 4.5% 10/1/18 to 10/1/33 | | | | | | | | 4,690,247 | | | | 4,467,806 |
| 4.5% 1/1/21 (g) | | | | | | | | 2,050,000 | | | | 1,994,266 |
| 4.52% 8/1/34 (j) | | | | | | | | 94,001 | | | | 94,590 |
| 4.522% 3/1/35 (j) | | | | | | | | 45,928 | | | | 45,269 |
| 4.545% 2/1/35 (j) | | | | | | | | 117,135 | | | | 116,546 |
| 4.545% 7/1/35 (j) | | | | | | | | 44,678 | | | | 44,348 |
| 4.55% 2/1/35 (j) | | | | | | | | 18,378 | | | | 18,222 |
| 4.56% 2/1/35 (j) | | | | | | | | 16,198 | | | | 16,114 |
| 4.584% 2/1/35 (j) | | | | | | | | 161,970 | | | | 160,065 |
| 4.607% 2/1/35 (j) | | | | | | | | 51,561 | | | | 51,003 |
| 4.642% 11/1/34 (j) | | | | | | | | 54,441 | | | | 54,062 |
| 4.674% 11/1/34 (j) | | | | | | | | 61,455 | | | | 60,999 |
| 4.695% 3/1/35 (j) | | | | | | | | 142,953 | | | | 142,437 |
| 4.722% 3/1/35 (j) | | | | | | | | 20,959 | | | | 20,779 |
| 4.729% 7/1/34 (j) | | | | | | | | 50,623 | | | | 50,263 |
| 4.803% 12/1/34 (j) | | | | | | | | 39,859 | | | | 39,750 |
| |
| |
See accompanying notes which are an integral part of the financial statements.
| | | | | | | | | | |
| | | | | 99 | | | | | | Annual Report |
99
| VIP Balanced Portfolio | | | | | | |
| Investments - continued | | | | | | |
| |
| |
| |
| | | Principal | | | | Value |
| | | Amount | | | | (Note 1) |
| 4.816% 12/1/32 (j) | | $ 19,108 | | $ | | 19,102 |
| 4.838% 12/1/34 (j) | | 19,283 | | | | 19,233 |
| 5% 11/1/17 to 8/1/35 | | 7,682,322 | | | | 7,521,552 |
| 5.111% 5/1/35 (j) | | 107,168 | | | | 107,752 |
| 5.199% 6/1/35 (j) | | 88,625 | | | | 89,004 |
| 5.5% 2/1/11 to 6/1/29 | | 1,250,972 | | | | 1,256,533 |
| 5.5% 1/1/36 (g) | | 7,934,740 | | | | 7,857,854 |
| 6% 7/1/13 to 3/1/33 | | 1,864,593 | | | | 1,896,003 |
| 6% 1/1/36 (g) | | 299,817 | | | | 302,628 |
| 6.5% 6/1/15 to 7/1/32 | | 1,184,699 | | | | 1,219,323 |
| 7% 12/1/24 to 2/1/28 | | 94,129 | | | | 98,472 |
| 7.5% 10/1/26 to 8/1/28 | | 349,249 | | | | 366,601 |
| |
| TOTAL FANNIE MAE | | | | 29,916,582 |
| Freddie Mac 0.3% | | | | | | |
| 4.056% 12/1/34 (j) | | 18,017 | | | | 17,821 |
| 4.103% 12/1/34 (j) | | 18,515 | | | | 18,260 |
| 4.188% 1/1/35 (j) | | 79,492 | | | | 78,450 |
| 4.269% 3/1/35 (j) | | 20,079 | | | | 19,918 |
| 4.3% 5/1/35 (j) | | 41,947 | | | | 41,591 |
| 4.307% 12/1/34 (j) | | 42,309 | | | | 41,549 |
| 4.364% 3/1/35 (j) | | 46,027 | | | | 45,135 |
| 4.375% 2/1/35 (j) | | 55,492 | | | | 55,169 |
| 4.39% 2/1/35 (j) | | 43,301 | | | | 42,895 |
| 4.445% 3/1/35 (j) | | 23,794 | | | | 23,350 |
| 4.447% 2/1/34 (j) | | 28,467 | | | | 28,119 |
| 4.489% 3/1/35 (j) | | 22,602 | | | | 22,211 |
| 4.49% 3/1/35 (j) | | 151,663 | | | | 149,613 |
| 4.5% 5/1/19 | | 49,787 | | | | 48,522 |
| 4.552% 2/1/35 (j) | | 43,367 | | | | 42,800 |
| 5.017% 4/1/35 (j) | | 140,671 | | | | 140,478 |
| 5.285% 8/1/33 (j) | | 16,721 | | | | 16,923 |
| 6% 5/1/33 | | 219,314 | | | | 222,163 |
| 7.5% 1/1/27 | | 23,847 | | | | 25,095 |
| |
| TOTAL FREDDIE MAC | | | | | | 1,080,062 |
| Government National Mortgage Association – 0.2% | | | | | | |
| 6.5% 10/15/27 to 9/15/32 | | 349,475 | | | | 365,650 |
| 7% 1/15/28 to 7/15/32 | | 266,913 | | | | 280,268 |
| 7.5% 6/15/27 to 3/15/28 | | 109,525 | | | | 115,350 |
| |
| TOTAL GOVERNMENT NATIONAL MORTGAGE ASSOCIATION | | | | | | 761,268 |
| |
| TOTAL U.S. GOVERNMENT AGENCY - MORTGAGE SECURITIES | | | | | | |
| (Cost $32,133,938) | | | | 31,757,912 |
See accompanying notes which are an integral part of the financial statements.
| | |
| VIP Balanced Portfolio | | 100 |
| Asset Backed Securities 0.9% | | | | |
| | | | | Principal | | Value |
| | | | | Amount | | (Note 1) |
| ACE Securities Corp.: | | | | | | |
| Series 2004 HE1: | | | | | | |
| Class M1, 4.8788% 2/25/34 (j) | | $ 50,000 | | $ 50,105 |
| Class M2, 5.4788% 2/25/34 (j) | | 50,000 | | 50,332 |
| Series 2005 SD1 Class A1, 4.7788% 11/25/50 (j) | | 37,364 | | 37,409 |
| Aesop Funding II LLC Series 2005 1A Class A1, 3.95% 4/20/08 (f) | | 200,000 | | 195,714 |
| American Express Credit Account Master Trust Series 2001 6 Class B, 4.7194% 12/15/08 (j) | | 200,000 | | 200,084 |
| Ameriquest Mortgage Securities, Inc. Series 2004 R2: | | | | |
| Class M1, 4.8088% 4/25/34 (j) | | 25,000 | | 25,000 |
| Class M2, 4.8588% 4/25/34 (j) | | 25,000 | | 25,000 |
| Amortizing Residential Collateral Trust Series 2002 BC1 Class M2, 5.4788% 1/25/32 (j) | | 11,940 | | 11,988 |
| Argent Securities, Inc. | | | | | | |
| Series 2004 W5 Class M1, 4.9788% 4/25/34 (j) | | 75,000 | | 75,090 |
| Capital One Multi Asset Execution Trust: | | | | |
| Series 2003 B4 Class B4, 5.1694% 7/15/11 (j) | | 105,000 | | 106,501 |
| Series 2004 6 Class B, 4.15% 7/16/12 | | 125,000 | | 121,574 |
| Cendant Timeshare Receivables Funding LLC Series 2005 1A Class A1, 4.67% 5/20/17 (f) | | 80,080 | | 79,255 |
| Citibank Credit Card Issuance Trust | | | | |
| Series 2002 C1 Class C1, 5.2806% 2/9/09 (j) | | 250,000 | | 252,059 |
| Countrywide Home Loans, Inc.: | | | | | | |
| Series 2004 2 Class M1, 4.8788% 5/25/34 (j) | | 140,000 | | 140,257 |
| Series 2004 3 Class M1, 4.8788% 6/25/34 (j) | | 25,000 | | 25,050 |
| Series 2004 4: | | | | | | |
| Class A, 4.7488% 8/25/34 (j) | | 32,475 | | 32,506 |
| Class M1, 4.8588% 7/25/34 (j) | | 75,000 | | 75,236 |
| Class M2, 4.9088% 6/25/34 (j) | | 80,000 | | 80,100 |
| Series 2005 1: | | | | | | |
| Class MV1, 4.7788% 7/25/35 (j) | | 60,000 | | 59,999 |
| Class MV2, 4.8188% 7/25/35 (j) | | 70,000 | | 69,977 |
| Crown Castle Towers LLC/Crown Atlantic Holdings Sub LLC/Crown Communication, Inc. Series 2005 1A: | | | | |
| Class B, 4.878% 6/15/35 (f) | | | | 97,000 | | 94,466 |
| Class C, 5.074% 6/15/35 (f) | | | | 88,000 | | 85,908 |
See accompanying notes which are an integral part of the financial statements.
|
101 Annual Report
101
| VIP Balanced Portfolio | | | | |
| Investments - continued | | | | |
| |
| |
| |
| | | Principal | | Value |
| | | Amount | | (Note 1) |
| Discover Card Master Trust I Series 2003 4 Class B1, 4.6994% 5/16/11 (j) | | $ 155,000 | | $ 155,889 |
| Fremont Home Loan Trust: | | | | |
| Series 2004 A: | | | | |
| Class M1, 4.9288% 1/25/34 (j) | | 75,000 | | 75,232 |
| Class M2, 5.5288% 1/25/34 (j) | | 100,000 | | 101,207 |
| Series 2005 A: | | | | |
| Class M1, 4.8088% 1/25/35 (j) | | 25,000 | | 25,084 |
| Class M2, 4.8388% 1/25/35 (j) | | 50,000 | | 50,049 |
| Class M3, 4.8688% 1/25/35 (j) | | 25,000 | | 25,062 |
| Class M4, 5.0588% 1/25/35 (j) | | 25,000 | | 25,166 |
| HSBC Home Equity Loan Trust | | | | |
| Series 2005 2: | | | | |
| Class M1, 4.83% 1/20/35 (j) | | 42,752 | | 42,756 |
| Class M2, 4.86% 1/20/35 (j) | | 31,093 | | 31,102 |
| Meritage Mortgage Loan Trust | | | | |
| Series 2004 1: | | | | |
| Class M1, 4.8788% 7/25/34 (j) | | 50,000 | | 50,000 |
| Class M3, 5.3288% 7/25/34 (j) | | 25,000 | | 25,000 |
| Morgan Stanley ABS Capital I, Inc. | | | | |
| Series 2003 NC5 Class M2, 6.3788% 4/25/33 (j) | | 50,000 | | 50,377 |
| Morgan Stanley Dean Witter Capital I Trust Series 2003 NC1 Class M1, 5.4288% 11/25/32 (j) | | 42,118 | | 42,353 |
| National Collegiate Student Loan Trust Series 2005 GT1 Class AIO, 6.75% 12/25/09 (l) | | 100,000 | | 23,852 |
| Park Place Securities, Inc. Series 2005 WCH1 Class M2, 4.8988% 1/25/35 (j) | | 75,000 | | 75,081 |
| Structured Asset Securities Corp. | | | | |
| Series 2004 GEL1 Class A, 4.7388% 2/25/34 (j) | | 15,702 | | 15,702 |
| Volkswagen Auto Lease Trust | | | | |
| Series 2005 A Class A4, 3.94% 10/20/10 | | 305,000 | | 300,304 |
| TOTAL ASSET BACKED SECURITIES | | | | |
| (Cost $3,021,154) | | | | 3,007,826 |
| |
| Collateralized Mortgage Obligations 1.1% | | | | |
| |
| Private Sponsor 0.7% | | | | |
| Adjustable Rate Mortgage Trust floater: | | | | |
| Series 2005 1 Class 5A2, 4.7088% 5/25/35 (j) | | 87,426 | | 87,129 |
See accompanying notes which are an integral part of the financial statements.
| | |
| VIP Balanced Portfolio | | 102 |
| Collateralized Mortgage Obligations continued | | | | |
| | | Principal | | Value |
| | | Amount | | (Note 1) |
| Private Sponsor – continued | | | | |
| Adjustable Rate Mortgage Trust floater: – continued | | | | |
| Series 2005 2 Class 6A2, 4.6588% 6/25/35 (j) | | $ 41,669 | | $ 41,681 |
| Series 2005 3 Class 8A2, 4.6188% 7/25/35 (j) | | 204,394 | | 204,189 |
| Bear Stearns Alt A Trust floater Series 2005 1 Class A1, 4.6588% 1/25/35 (j) | | 139,714 | | 139,714 |
| CS First Boston Mortgage Securities Corp. floater Series 2004 AR3 Class 6A2, 4.7488% 4/25/34 (j) | | 28,923 | | 28,959 |
| Impac CMB Trust floater Series 2005 1: | | | | |
| Class M1, 4.8388% 4/25/35 (j) | | 57,245 | | 57,220 |
| Class M2, 4.8788% 4/25/35 (j) | | 87,776 | | 87,745 |
| Lehman Structured Securities Corp. floater Series 2005 1 Class A2, 4.59% 9/26/45 (f)(j) | | 168,884 | | 168,884 |
| Master Alternative Loan Trust Series 2004 3 Class 3A1, 6% 4/25/34 | | 16,927 | | 16,900 |
| Merrill Lynch Mortgage Investors, Inc. floater Series 2005 B Class A2, 4.79% 7/25/30 (j) | | 155,871 | | 155,769 |
| Opteum Mortgage Acceptance Corp. floater Series 2005 3 Class APT, 4.6688% 7/25/35 (j) | | 99,999 | | 100,057 |
| Residential Asset Mortgage Products, Inc. sequential pay Series 2004 SL2 | | | | |
| Class A1, 6.5% 10/25/16 | | 22,626 | | 23,029 |
| Sequoia Mortgage Trust floater: | | | | |
| Series 2005 1 Class A2, 4.1% 2/20/35 (j) | | 103,663 | | 103,269 |
| Series 2005 2 Class A2, 4.29% 3/20/35 (j) | | 124,512 | | 124,512 |
| Thornburg Mortgage Securities Trust floater Series 2005 3 Class A4, 4.6488% 10/25/35 (j) | | 183,293 | | 183,293 |
| WAMU Mortgage pass thru certificates floater Series 2005 AR13 Class A1C1, 4.3838% 10/25/45 (j) | | 189,577 | | 189,577 |
| Wells Fargo Mortgage Backed Securities Trust: | | | | |
| Series 2005 AR10 Class 2A2, 4.1101% 6/25/35 (j) | | 235,747 | | 231,429 |
| Series 2005 AR12 Class 2A6, 4.3214% 7/25/35 (j) | | 248,534 | | 243,230 |
| Series 2005 AR4 Class 2A2, 4.5345% 4/25/35 (j) | | 201,372 | | 197,373 |
| Series 2005 AR9 Class 2A1, 4.3624% 5/25/35 (j) | | 107,606 | | 106,202 |
| |
| TOTAL PRIVATE SPONSOR | | | | 2,490,161 |
See accompanying notes which are an integral part of the financial statements.
|
103 Annual Report
103
| VIP Balanced Portfolio | | | | |
| Investments - continued | | | | |
| |
| |
| |
| | | Principal | | Value |
| | | Amount | | (Note 1) |
| U.S. Government Agency – 0.4% | | | | |
| Fannie Mae guaranteed REMIC pass thru certificates planned amortization class Series 2004 81: | | | | |
| Class KC, 4.5% 4/25/17 | | $ 380,000 | | $ 371,725 |
| Class KD, 4.5% 7/25/18 | | 170,000 | | 163,753 |
| Freddie Mac Multi class participation certificates guaranteed planned amortization class: | | | | |
| Series 2677 Class LD, 4.5% 3/15/17 | | 560,000 | | 544,235 |
| Series 2885 Class PC, 4.5% 3/15/18 | | 165,000 | | 161,450 |
| |
| TOTAL U.S. GOVERNMENT AGENCY | | | | 1,241,163 |
| |
| TOTAL COLLATERALIZED MORTGAGE OBLIGATIONS | | | | |
| (Cost $3,782,190) | | | | 3,731,324 |
| |
| Commercial Mortgage Securities 1.1% | | | | |
| |
| Bayview Commercial Asset Trust floater: | | | | |
| Series 2004 1 Class A, 4.7388% 4/25/34 (f)(j) | | 76,286 | | 76,322 |
| Series 2004 3 Class A1, 4.7488% 1/25/35 (f)(j) | | 135,869 | | 136,017 |
| COMM: | | | | |
| floater Series 2002 FL7 Class D, 4.9394% 11/15/14 (f)(j) | | 10,286 | | 10,317 |
| Series 2004 LBN2 Class X2, 1.1989% 3/10/39 (f)(j)(l) | | 298,978 | | 10,119 |
| CS First Boston Mortgage Securities Corp.: | | | | |
| sequential pay: | | | | |
| Series 1999 C1 Class A2, 7.29% 9/15/41 | | 250,000 | | 266,001 |
| Series 2000 C1 Class A2, 7.545% 4/15/62 | | 500,000 | | 541,988 |
| Series 2004 C1 Class A3, 4.321% 1/15/37 | | 95,000 | | 91,583 |
| Series 1997 C2 Class D, 7.27% 1/17/35 | | 150,000 | | 158,082 |
| Series 2004 C1 Class ASP, 1.1065% 1/15/37 (f)(j)(l) | | 1,463,157 | | 47,497 |
| DLJ Commercial Mortgage Corp. sequential pay Series 2000 CF1 | | | | |
| Class A1B, 7.62% 6/10/33 | | 500,000 | | 545,727 |
| Fannie Mae sequential pay Series 1999 10 Class MZ, 6.5% 9/17/38 | | 223,174 | | 230,293 |
See accompanying notes which are an integral part of the financial statements.
| | |
| VIP Balanced Portfolio | | 104 |
| Commercial Mortgage Securities continued | | | | |
| | | Principal | | Value |
| | | Amount | | (Note 1) |
| GS Mortgage Securities Corp. II: | | | | |
| sequential pay: | | | | |
| Series 2001 LIBA Class A2, 6.615% 2/14/16 (f) | | $ 130,000 | | $ 139,056 |
| Series 2003 C1 Class A2A, 3.59% 1/10/40 | | 125,000 | | 122,000 |
| Series 1998 GLII Class E, 7.1906% 4/13/31 (j) | | 120,000 | | 124,363 |
| J.P. Morgan Commercial Mortgage Finance Corp. sequential pay Series 2000 C9 Class A2, 7.77% 10/15/32 | | 225,000 | | 244,172 |
| Leafs CMBS I Ltd./Leafs CMBS I Corp. Series 2002 1A: | | | | |
| Class B, 4.13% 11/20/37 (f) | | 110,000 | | 102,444 |
| Class C, 4.13% 11/20/37 (f) | | 110,000 | | 99,229 |
| Merrill Lynch Mortgage Trust sequential pay Series 2004 KEY2 Class A2, 4.166% 8/12/39 | | 215,000 | | 207,692 |
| Morgan Stanley Capital I, Inc.: | | | | |
| sequential pay Series 2004 HQ3 | | | | |
| Class A2, 4.05% 1/13/41 | | 105,000 | | 101,198 |
| Series 2005 IQ9 Class X2, 1.203% 7/15/56 (f)(j)(l) | | 1,285,000 | | 59,311 |
| Thirteen Affiliates of General Growth Properties, Inc. sequential pay Series 1 Class A2, 6.602% 11/15/07 (f) | | 500,000 | | 513,919 |
| Wachovia Bank Commercial Mortgage Trust sequential pay Series 2003 C6 Class A2, 4.498% 8/15/35 | | 165,000 | | 162,030 |
| TOTAL COMMERCIAL MORTGAGE SECURITIES | | | | |
| (Cost $3,931,300) | | | | 3,989,360 |
| |
| Foreign Government and Government Agency Obligations 0.2% | | | | |
| |
| Israeli State 4.625% 6/15/13 | | 30,000 | | 28,931 |
| United Mexican States: | | | | |
| 5.875% 1/15/14 | | 30,000 | | 31,050 |
| 6.375% 1/16/13 | | 300,000 | | 318,750 |
| 6.75% 9/27/34 | | 270,000 | | 295,313 |
| 7.5% 4/8/33 | | 175,000 | | 207,200 |
| TOTAL FOREIGN GOVERNMENT AND GOVERNMENT AGENCY OBLIGATIONS | | | | |
| (Cost $807,867) | | | | 881,244 |
| |
| Fixed Income Funds 4.1% | | | | |
| | | Shares | | |
| Fidelity Ultra Short Central Fund (k) | | | | |
| (Cost $14,499,872) | | 145,742 | | 14,495,499 |
| |
| Money Market Funds 4.2% | | | | |
| | | Shares | | Value |
| | | | | (Note 1) |
| Fidelity Cash Central Fund, 4.28% (b) | | 13,810,568 | | $ 13,810,568 |
| Fidelity Securities Lending Cash Central Fund, 4.35% (b)(c) | | 970,845 | | 970,845 |
| TOTAL MONEY MARKET FUNDS | | | | |
| (Cost $14,781,413) | | | | 14,781,413 |
| |
| TOTAL INVESTMENT PORTFOLIO 102.8% | | | | |
| (Cost $335,194,385) | | | | 359,228,696 |
| |
| NET OTHER ASSETS (2.8)% | | | | (9,856,053) |
| NET ASSETS 100% | | $ 349,372,643) |
See accompanying notes which are an integral part of the financial statements.
|
105 Annual Report
105
| VIP Balanced Portfolio | | | | | | | | |
| Investments - continued | | | | | | | | |
| |
| |
| Swap Agreements | | | | | | | | |
| | | Expiration | | Notional | | | | Value |
| | | Date | | Amount | | | | |
| |
| Credit Default Swaps | | | | | | | | |
| Receive quarterly a fixed rate of .4% multiplied by the notional amount and pay to Merrill Lynch, Inc., | | | | | | | | |
| upon each default event of one of the issues of Dow Jones CDX N.A. Investment Grade 4, par value of | | | | | | | | |
| the proportional notional amount (i) | | June 2010 | | $ | | 500,000 | | $ | | (1,985) |
| Receive quarterly a fixed rate of .4% multiplied by the notional amount and pay to Morgan Stanley, Inc., | | | | | | | | |
| upon each default event of one of the issues of Dow Jones CDX N.A. Investment Grade 4, par value of | | | | | | | | |
| the proportional notional amount (i) | | June 2010 | | 1,000,000 | | | | (3,970) |
See accompanying notes which are an integral part of the financial statements.
| | |
| VIP Balanced Portfolio | | 106 |
| Swap Agreements continued | | | | | | | | |
| |
| | | Expiration | | Notional | | | | Value |
| | | Date | | Amount | | | | |
| |
| Credit Default Swaps continued | | | | | | | | |
| Receive quarterly a fixed rate of .5% multiplied by the notional amount and pay to Merrill Lynch, Inc., | | | | | | | | |
| upon each default event of one of the issues of Dow Jones CDX N.A. Investment Grade 3, par value of | | | | | | | | |
| the proportional notional amount (h) | | March 2010 | | $ | | 248,000 | | $ | | 789 |
| Receive quarterly a fixed rate of .65% multiplied by the notional amount and pay to Merrill Lynch, Inc., | | | | | | | | |
| upon each default event of one of the issues of Dow Jones CDX N.A. Investment Grade 4, par value of | | | | | | | | |
| the proportional notional amount (i) | | June 2015 | | 500,000 | | | | (2,180) |
| Receive quarterly a fixed rate of .7% multiplied by the notional amount and pay to Deutsche Bank, upon | | | | | | | | |
| each default event of one of the issues of Dow Jones CDX N.A. Investment Grade 3, par value of the | | | | | | | | |
| proportional notional amount (h) | | March 2015 | | 248,000 | | | | 761 |
| Receive quarterly notional amount multiplied by .41% and pay Goldman Sachs upon default event of | | | | | | | | |
| Sempra Energy, par value of the notional amount of Sempra Energy 7.95% 3/1/10 | | Sept. 2010 | | 100,000 | | | | 35 |
| Receive quarterly notional amount multiplied by .42% and pay Morgan Stanley, Inc. upon default event of | | | | | | | | |
| Sempra Energy, par value of the notional amount of Sempra Energy 6% 2/1/13 | | Sept. 2010 | | 150,000 | | | | 116 |
| |
| |
| | | Expiration | | Notional | | | | Value |
| | | Date | | Amount | | | | |
| |
| Receive monthly notional amount multiplied by 1.6% and pay Morgan Stanley, Inc. upon default event of Park | | | | | | | | |
| Place Securities, Inc., par value of the notional amount of Park Place Securities, Inc. Series 2005 WHQ2 | | | | | | | | |
| Class M7, 5.4413% 5/25/35 | | June 2035 | | $ | | 30,000 | | $ | | 134 |
| Receive monthly notional amount multiplied by 2.79% and pay Merrill Lynch, Inc. upon default event of | | | | | | | | |
| New Century Home Equity Loan Trust, par value of the notional amount of New Century Home Equity | | | | | | | | |
| Loan Trust Series 2004 4 Class M9, 7.0788% 2/25/35 | | March 2035 | | 70,000 | | | | (157) |
| Receive monthly notional amount multiplied by 3.3% and pay to Morgan Stanley, Inc. upon each default | | | | | | | | |
| event of Ameriquest Mortgage Securities, Inc., par value of the notional amount of Ameriquest | | | | | | | | |
| Mortgage Securities, Inc. Series 2004 R11, Class M9, 7.6913% 11/25/34 | | Dec. 2034 | | 30,000 | | | | 192 |
| |
| TOTAL CREDIT DEFAULT SWAPS | | | | 2,876,000 | | | | (6,265) |
See accompanying notes which are an integral part of the financial statements.
|
107 Annual Report
107
| VIP Balanced Portfolio | | | | | | | | |
| Investments - continued | | | | | | | | |
| |
| |
| Swap Agreements continued | | | | | | | | |
| | | Expiration | | Notional | | | | Value |
| | | Date | | Amount | | | | |
| |
| Interest Rate Swaps | | | | | | | | |
| Receive quarterly a fixed rate equal to 4.3875% and pay quarterly a floating rate based on 3 month | | | | | | | | |
| LIBOR with Credit Suisse First Boston | | March 2010 | | $ | | 250,000 | | $ | | (4,128) |
| Receive semi annually a fixed rate equal to 4.492% and pay quarterly a floating rate based on 3 month | | | | | | | | |
| LIBOR with Lehman Brothers, Inc. | | Sept. 2010 | | 1,000,000 | | | | (4,700) |
| Receive quarterly a fixed rate equal to 4.774% and pay quarterly a floating rate based on 3 month | | | | | | | | |
| LIBOR with Credit Suisse First Boston | | March 2015 | | 250,000 | | | | (2,188) |
| Receive semi annually a fixed rate equal to 4.8575% and pay quarterly a floating rate based on 3 month | | | | | | | | |
| LIBOR with Lehman Brothers, Inc. | | Dec. 2008 | | 6,000,000 | | | | 3,900 |
| TOTAL INTEREST RATE SWAPS | | | | 7,500,000 | | | | (7,116) |
| Total Return Swaps | | | | | | | | |
| Receive monthly a return equal to Lehman Brothers CMBS U.S. Aggregate Index and pay monthly a | | | | | | | | |
| floating rate based on 1 month LIBOR minus 15 basis points with Citibank | | April 2006 | | 1,430,000 | | | | 6,962 |
| Receive monthly a return equal to Lehman Brothers CMBS U.S. Aggregate Index and pay monthly a | | | | | | | | |
| floating rate based on 1 month LIBOR minus 20 basis points with Lehman Brothers, Inc. | | March 2006 | | 3,070,000 | | | | 16,004 |
| |
| |
| | | Expiration | | Notional | | | | Value |
| | | Date | | Amount | | | | |
| Receive monthly a return equal to Lehman Brothers Commercial Mortgage Backed Securities AAA Daily | | | | | | | | |
| Index and pay monthly a floating rate based on 1 month LIBOR minus 10 basis points with Citibank | | March 2006 | | $ | | 490,000 | | $ | | 2,410 |
| Receive quarterly a return equal to Banc of America Securities LLC AAA 10Yr Commercial Mortgage | | | | | | | | |
| Backed Securities Daily Index and pay quarterly a floating rate based on 3 month LIBOR minus 30 basis | | | | | | | | |
| points with Bank of America | | May 2006 | | 500,000 | | | | 4,755 |
| TOTAL TOTAL RETURN SWAPS | | | | 5,490,000 | | | | 30,131 |
| |
| | | | | $ | | 15,866,000 | | $ | | 16,750 |
Legend
(a) Non income producing
(b) Affiliated fund that is available only to investment companies and other accounts managed by Fidelity Investments. The rate quoted is the annualized seven day
yield of the fund at period end. A complete unaudited listing of the fund’s holdings as of its most recent quarter end is available upon request.
(c) Investment made with cash collateral received from securities on loan.
(d) Non income producing Issuer is in default.
(e) Security or a portion of the security is on loan at period end.
(f) Security exempt from registration under Rule 144A of the Securities Act of 1933. These securities may be resold in transactions exempt from registration, normally
to qualified institutional buyers. At the period end, the value of these securities amounted to $4,757,876 or 1.4% of net assets.
(g) Security or a portion of the security purchased on a delayed delivery or when issued basis.
(h) Dow Jones CDX N.A. Investment Grade 3 is a tradable index of credit default swaps on investment grade debt of U.S. companies.
(i) Dow Jones CDX N.A. Investment Grade 4 is a tradable index of credit default swaps on investment grade debt of U.S. companies.
(j) The coupon rate shown on floating or adjustable rate securities represents the rate at period end.
(k) Affiliated fund that is available only to investment companies and other accounts managed by Fidelity Investments. A complete unaudited list of holdings for each
fixed income central fund, as of the investing fund’s report date, is available upon request or at advisor.fidelity.com. The reports are located just after the fund’s
financial statements and quarterly reports but are not part of the financial statements or quarterly reports. In addition, the fixed income central fund’s financial
statements, which are not covered by the investing fund’s Report of Independent Registered Public Accounting Firm, are available on the EDGAR Database on the
SEC’s web site, www.sec.gov, or upon request.
(l) Security represents right to receive monthly interest payments on an underlying pool of mortgages. Principal shown is the par amount of the mortgage pool.
|
See accompanying notes which are an integral part of the financial statements.
VIP Balanced Portfolio 108
| | (m) Restricted securities Investment in securities not registered under the Securities Act of 1933 (excluding 144A issues). At the end of the period, the value of
restricted securities (excluding 144A issues) amounted to $72,453 or 0.0% of net assets.
|
Additional information on each holding is as follows:
| Security | | | | Acquisition Date | | Acquisition Cost |
| Education Realty Trust, Inc. | | | | 9/29/05 | | $ 70,496 |
| Inverness Medical Innovations, Inc. | | | | 12/14/05 | | $ 20,772 |
Affiliated Central Funds
Information regarding income received by the fund from the affiliated Central funds during the period is as follows:
| Fund | | Income received |
| Fidelity Cash Central Fund | | $ 762,489 |
| Fidelity Securities Lending Cash Central Fund | | 7,896 |
| Fidelity Ultra Short Central Fund | | 253,752 |
| Total | | $ 1,024,137 |
Additional information regarding the fund’s purchases and sales, including the ownership percentage, of the following fixed income Central Fund during the period is as follows:
| | | Value, beginning | | | | Purchases | | | | Sales Proceeds | | | | Value, | | % ownership, |
| Fund | | of period | | | | | | | | | | | | end of period | | end of period |
| |
| Fidelity Ultra Short Central Fund | | $ | | — | | $ | | 14,499,872 | | $ | | — | | $ | | 14,495,499 | | 0.2% |
Other Information
The composition of credit quality ratings as a percentage of net assets is as follows (ratings are unaudited):
| U.S.Government and U.S.Government Agency Obligations | | 17.0% |
| AAA,AA,A | | 5.7% |
| BBB | | 4.8% |
| BB | | 1.1% |
| B | | 0.4% |
| CCC,CC,C | | 0.1% |
| Not Rated | | 0.2% |
| Equities | | 68.0% |
| Short-Term Investments and Net Other Assets | | 2.7% |
| | | 100.0% |
We have used ratings from Moody’s® Investors Services, Inc. Where Moody’s ratings are not available, we have used S&P® ratings.
See accompanying notes which are an integral part of the financial statements.
109 Annual Report
| VIP Balanced Portfolio | | | | |
| |
| Financial Statements | | | | |
| |
| |
| Statement of Assets and Liabilities | | | | |
| | | December 31, 2005 |
| |
| Assets | | | | |
| Investment in securities, at value (including securities loaned of $948,486) — See | | | | |
| accompanying schedule: | | | | |
| Unaffiliated issuers (cost $305,913,100) | | $ 329,951,784 | | |
| Affiliated Central Funds (cost $29,281,285) | | 29,276,912 | | |
| Total Investments (cost $335,194,385) | | | | $ | | 359,228,696 |
| Cash | | | | 24,004 |
| Foreign currency held at value (cost $15,755) | | | | 15,723 |
| Receivable for investments sold | | | | 413,418 |
| Receivable for swap agreements | | | | 58 |
| Receivable for fund shares sold | | | | 284,766 |
| Dividends receivable | | | | 249,763 |
| Interest receivable | | | | 928,149 |
| Swap agreements, at value | | | | 16,750 |
| Prepaid expenses | | | | 1,631 |
| Other receivables | | | | 63,682 |
| Total assets | | | | 361,226,640 |
| |
| Liabilities | | | | |
| Payable for investments purchased | | | | |
| Regular delivery | | $ 422,146 | | |
| Delayed delivery | | 10,097,824 | | |
| Payable for fund shares redeemed | | 133,669 | | |
| Accrued management fee | | 121,543 | | |
| Distribution fees payable | | 10,041 | | |
| Other affiliated payables | | 32,663 | | |
| Other payables and accrued expenses | | 65,266 | | |
| Collateral on securities loaned, | | | | |
| at value | | 970,845 | | |
| Total liabilities | | | | 11,853,997 |
| |
| Net Assets | | | | $ | | 349,372,643 |
| Net Assets consist of: | | | | |
| Paid in capital | | | | $ | | 306,499,337 |
| Undistributed net investment income | | | | 7,582,792 |
| Accumulated undistributed net realized gain (loss) on investments and foreign currency transactions | | | | 11,220,784 |
| Net unrealized appreciation (depreciation) on investments and assets and liabilities in foreign currencies | | | | 24,069,730 |
| Net Assets | | | | $ | | 349,372,643 |
| |
| Statement of Assets and Liabilities continued | | | | |
| | | December 31, 2005 |
| |
| Initial Class: | | | | |
| Net Asset Value, offering price | | | | |
| and redemption price | | | | |
| per share ($276,342,815 ÷ 18,699,525 shares) | | | | $ | | 14.78 |
| Service Class: | | | | |
| Net Asset Value, offering price | | | | |
| and redemption price | | | | |
| per share ($18,180,924 ÷ 1,236,502 shares) | | | | $ | | 14.70 |
| Service Class 2: | | | | |
| Net Asset Value, offering price | | | | |
| and redemption price | | | | |
| per share ($40,715,962 ÷ 2,784,328 shares) | | | | $ | | 14.62 |
| Investor Class: | | | | |
| Net Asset Value, offering price | | | | |
| and redemption price | | | | $ | | 14.77 |
| per share ($14,132,942 ÷ 957,114 shares) | | | | |
See accompanying notes which are an integral part of the financial statements.
| | |
| VIP Balanced Portfolio | | 110 |
| Statement of Operations | | | | | | | | |
| | | | | Year ended December 31, 2005 |
| |
| Investment Income | | | | | | | | |
| Dividends | | | | | | | $ | 3,161,844 |
| Interest | | | | | | | | 5,067,606 |
| Income from affiliated Central Funds | | | | | | | | 1,024,137 |
| Total income | | | | | | | | 9,253,587 |
| |
| Expenses | | | | | | | | |
| Management fee | | | $ | 1,414,139 | | | | |
| Transfer agent fees | | | | 237,061 | | | | |
| Distribution fees | | | | 114,818 | | | | |
| Accounting and security lending fees | | | | 138,748 | | | | |
| Independent trustees’ compensation | | | | 1,503 | | | | |
| Custodian fees and expenses | | | | 69,718 | | | | |
| Registration fees | | | | 10 | | | | |
| Audit | | | | 49,628 | | | | |
| Legal | | | | 1,478 | | | | |
| Miscellaneous | | | | 26,099 | | | | |
| Total expenses before reductions | | | | 2,053,202 | | | | |
| Expense reductions | | | | (112,588) | | | | 1,940,614 |
| |
| Net investment income (loss) | | | | | | | | 7,312,973 |
| Realized and Unrealized Gain (Loss) | | | | | | | | |
| Net realized gain (loss) on: | | | | | | | | |
| Investment securities: | | | | | | | | |
| Unaffiliated issuers | | | | 23,595,902 | | | | |
| Foreign currency transactions | | | | (4,529) | | | | |
| Swap agreements | | | | (108,634) | | | | |
| Total net realized gain (loss) | | | | | | | | 23,482,739 |
| Change in net unrealized appreciation (depreciation) on: | | | | | | | | |
| Investment securities (net of increase in deferred foreign taxes of $2,603) | | | | (12,137,531) | | | | |
| Assets and liabilities in foreign currencies | | | | (77) | | | | |
| Swap agreements | | | | 10,189 | | | | |
| Total change in net unrealized appreciation (depreciation) | | | | | | | | (12,127,419) |
| Net gain (loss) | | | | | | | | 11,355,320 |
| Net increase (decrease) in net assets resulting from operations | | | | | | | $ | 18,668,293 |
| |
| Statement of Changes in Net Assets | | | | | | | | |
| | | | | Year ended | | | | Year ended |
| | | | | December 31, | | | | December 31, |
| | | | | 2005 | | | | 2004 |
| Increase (Decrease) in Net Assets | | | | | | | | |
| Operations | | | | | | | | |
| Net investment income (loss) | | | | $ 7,312,973 | | | $ | 8,902,920 |
| Net realized gain (loss) | | | | 23,482,739 | | | | 8,580,364 |
| Change in net unrealized appreciation (depreciation) | | | | (12,127,419) | | | | 573,968 |
| Net increase (decrease) in net assets resulting from operations | | | | 18,668,293 | | | | 18,057,252 |
| Distributions to shareholders from net investment income | | | | (8,716,691) | | | | (6,988,389) |
| Distributions to shareholders from net realized gain | | | | (241,563) | | | | — |
| Total distributions | | | | (8,958,254) | | | | (6,988,389) |
| Share transactions - net increase (decrease) | | | | (9,761,182) | | | | (8,689,636) |
| Total increase (decrease) in net assets | | | | (51,143) | | | | 2,379,227 |
| |
| Net Assets | | | | | | | | |
| Beginning of period | | | | 349,423,786 | | | | 347,044,559 |
| End of period (including undistributed net investment income of $7,582,792 and undistributed net investment income of | | | | | | |
| $9,092,580, respectively) | | | | $ 349,372,643 | | | $ | 349,423,786 |
| |
| |
| |
| See accompanying notes which are an integral part of the financial statements. | | | | | | | | |
| |
| | | 111 | | | | Annual Report |
| Financial Highlights Initial Class | | | | | | | | | | |
| Years ended December 31, | | 2005 | | 2004 | | 2003 | | 2002 | | 2001 |
| Selected Per Share Data | | | | | | | | | | |
| Net asset value, beginning of period | | $ 14.35 | | $ 13.88 | | $ 12.16 | | $ 13.72 | | $ 14.45 |
| Income from Investment Operations | | | | | | | | | | |
| Net investment income (loss)C | | 31 | | .36E | | .30 | | .36 | | .42 |
| Net realized and unrealized gain (loss) | | 50 | | .39 | | 1.78 | | (1.53) | | (.63) |
| Total from investment operations | | 81 | | .75 | | 2.08 | | (1.17) | | (.21) |
| Distributions from net investment income | | (.37) | | (.28) | | (.36) | | (.39) | | (.52) |
| Distributions from net realized gain | | (.01) | | — | | — | | — | | — |
| Total distributions | | (.38) | | (.28) | | (.36) | | (.39) | | (.52) |
| Net asset value, end of period | | $ 14.78 | | $ 14.35 | | $ 13.88 | | $ 12.16 | | $ 13.72 |
| Total ReturnA,B | | 5.77% | | 5.47% | | 17.72% | | (8.72)% | | (1.58)% |
| Ratios to Average Net AssetsD,F | | | | | | | | | | |
| Expenses before reductions | | 58% | | .56% | | .59% | | .57% | | .57% |
| Expenses net of fee waivers, if any | | 58% | | .56% | | .59% | | .57% | | .57% |
| Expenses net of all reductions | | 54% | | .56% | | .58% | | .55% | | .55% |
| Net investment income (loss) | | 2.22% | | 2.60% | | 2.32% | | 2.84% | | 3.11% |
| Supplemental Data | | | | | | | | | | |
| Net assets, end of period (000 omitted) | | $ 276,343 | | $ 291,176 | | $ 295,656 | | $ 235,064 | | $ 264,608 |
| Portfolio turnover rate | | 140% | | 74% | | 102% | | 134% | | 126% |
A Total returns do not reflect charges attributable to your insurance company’s separate account. Inclusion of these charges would reduce the total returns shown.
B Total returns would have been lower had certain expenses not been reduced during the periods shown.
C Calculated based on average shares outstanding during the period.
D Amounts do not include the activity of the affiliated central funds.
E Investment income per share reflects a special dividend which amounted to $.03 per share.
F Expense ratios reflect operating expenses of the class. Expenses before reductions do not reflect amounts reimbursed by the investment adviser or reductions from brokerage service arrangements or other expense offset arrangements and do not
represent the amount paid by the class during periods when reimbursements or reductions occur. Expenses net of fee waivers reflect expenses after reimbursement by the investment adviser but prior to reductions from brokerage service arrange
ments or other expense offset arrangements. Expenses net of all reductions represent the net expenses paid by the class.
|
| Financial Highlights Service Class | | | | | | | | | | |
| Years ended December 31, | | 2005 | | 2004 | | 2003 | | 2002 | | 2001 |
| Selected Per Share Data | | | | | | | | | | |
| Net asset value, beginning of period | | $ 14.28 | | $ 13.81 | | $ 12.11 | | $ 13.66 | | $ 14.39 |
| Income from Investment Operations | | | | | | | | | | |
| Net investment income (loss)C | | 30 | | .34E | | .28 | | .34 | | .41 |
| Net realized and unrealized gain (loss) | | 48 | | .40 | | 1.77 | | (1.51) | | (.64) |
| Total from investment operations | | 78 | | .74 | | 2.05 | | (1.17) | | (.23) |
| Distributions from net investment income | | (.35) | | (.27) | | (.35) | | (.38) | | (.50) |
| Distributions from net realized gain | | (.01) | | — | | — | | — | | — |
| Total distributions | | (.36) | | (.27) | | (.35) | | (.38) | | (.50) |
| Net asset value, end of period | | $ 14.70 | | $ 14.28 | | $ 13.81 | | $ 12.11 | | $ 13.66 |
| Total ReturnA,B | | 5.61% | | 5.42% | | 17.53% | | (8.75)% | | (1.72)% |
| Ratios to Average Net AssetsD,F | | | | | | | | | | |
| Expenses before reductions | | 68% | | .67% | | .69% | | .67% | | .67% |
| Expenses net of fee waivers, if any | | 68% | | .67% | | .69% | | .67% | | .67% |
| Expenses net of all reductions | | 65% | | .67% | | .68% | | .65% | | .65% |
| Net investment income (loss) | | 2.12% | | 2.50% | | 2.22% | | 2.74% | | 3.01% |
| Supplemental Data | | | | | | | | | | |
| Net assets, end of period (000 omitted) | | $ 18,181 | | $ 21,228 | | $ 21,903 | | $ 20,019 | | $ 25,455 |
| Portfolio turnover rate | | 140% | | 74% | | 102% | | 134% | | 126% |
A Total returns do not reflect charges attributable to your insurance company’s separate account. Inclusion of these charges would reduce the total returns shown.
B Total returns would have been lower had certain expenses not been reduced during the periods shown.
C Calculated based on average shares outstanding during the period.
D Amounts do not include the activity of the affiliated central funds.
E Investment income per share reflects a special dividend which amounted to $.03 per share.
F Expense ratios reflect operating expenses of the class. Expenses before reductions do not reflect amounts reimbursed by the investment adviser or reductions from brokerage service arrangements or other expense offset arrangements and do not
represent the amount paid by the class during periods when reimbursements or reductions occur. Expenses net of fee waivers reflect expenses after reimbursement by the investment adviser but prior to reductions from brokerage service arrange
ments or other expense offset arrangements. Expenses net of all reductions represent the net expenses paid by the class.
|
See accompanying notes which are an integral part of the financial statements.
| | |
| VIP Balanced Portfolio | | 112 |
| Financial Highlights Service Class 2 | | | | | | | | | | |
| Years ended December 31, | | 2005 | | 2004 | | 2003 | | 2002 | | 2001 |
| Selected Per Share Data | | | | | | | | | | |
| Net asset value, beginning of period | | $ 14.20 | | $ 13.75 | | $ 12.05 | | $ 13.61 | | $ 14.37 |
| Income from Investment Operations | | | | | | | | | | |
| Net investment income (loss)C | | 27 | | .32E | | .26 | | .32 | | .38 |
| Net realized and unrealized gain (loss) | | 50 | | .38 | | 1.77 | | (1.51) | | (.63) |
| Total from investment operations | | 77 | | .70 | | 2.03 | | (1.19) | | (.25) |
| Distributions from net investment income | | (.34) | | (.25) | | (.33) | | (.37) | | (.51) |
| Distributions from net realized gain | | (.01) | | — | | — | | — | | — |
| Total distributions | | (.35) | | (.25) | | (.33) | | (.37) | | (.51) |
| Net asset value, end of period | | $ 14.62 | | $ 14.20 | | $ 13.75 | | $ 12.05 | | $ 13.61 |
| Total ReturnA,B | | 5.53% | | 5.15% | | 17.41% | | (8.93)% | | (1.87)% |
| Ratios to Average Net AssetsD,F | | | | | | | | | | |
| Expenses before reductions | | 83% | | .82% | | .84% | | .83% | | .83% |
| Expenses net of fee waivers, if any | | 83% | | .82% | | .84% | | .83% | | .83% |
| Expenses net of all reductions | | 80% | | .82% | | .84% | | .81% | | .81% |
| Net investment income (loss) | | 1.95% | | 2.35% | | 2.06% | | 2.58% | | 2.85% |
| Supplemental Data | | | | | | | | | | |
| Net assets, end of period (000 omitted) | | $ 40,716 | | $ 37,020 | | $ 29,485 | | $ 18,577 | | $ 16,798 |
| Portfolio turnover rate | | 140% | | 74% | | 102% | | 134% | | 126% |
A Total returns do not reflect charges attributable to your insurance company’s separate account. Inclusion of these charges would reduce the total returns shown.
B Total returns would have been lower had certain expenses not been reduced during the periods shown.
C Calculated based on average shares outstanding during the period.
D Amounts do not include the activity of the affiliated central funds.
E Investment income per share reflects a special dividend which amounted to $.03 per share.
F Expense ratios reflect operating expenses of the class. Expenses before reductions do not reflect amounts reimbursed by the investment adviser or reductions from brokerage service arrangements or other expense offset arrangements and do not
represent the amount paid by the class during periods when reimbursements or reductions occur. Expenses net of fee waivers reflect expenses after reimbursement by the investment adviser but prior to reductions from brokerage service arrange
ments or other expense offset arrangements. Expenses net of all reductions represent the net expenses paid by the class.
|
| Financial Highlights Investor Class | | |
| |
| Year ended December 31, | | 2005G |
| Selected Per Share Data | | |
| Net asset value, beginning of period | | $ 13.96 |
| Income from Investment Operations | | |
| Net investment income (loss)E | | 11 |
| Net realized and unrealized gain (loss) | | 70 |
| Total from investment operations | | 81 |
| Net asset value, end of period | | $ 14.77 |
| Total ReturnB,C,D | | 5.80% |
| Ratios to Average Net AssetsF,H | | |
| Expenses before reductions | | 76%A |
| Expenses net of fee waivers, if any | | 76%A |
| Expenses net of all reductions | | 73%A |
| Net investment income (loss) | | 1.73%A |
| Supplemental Data | | |
| Net assets, end of period (000 omitted) | | $ 14,133 |
| Portfolio turnover rate | | 140% |
A Annualized
B Total returns for periods of less than one year are not annualized.
C Total returns do not reflect charges attributable to your insurance company’s separate account. Inclusion of these charges would reduce the total returns shown.
D Total returns would have been lower had certain expenses not been reduced during the periods shown.
E Calculated based on average shares outstanding during the period.
F Amounts do not include the activity of the affiliated central funds.
G For the period July 21, 2005 (commencement of sale of shares) to December 31, 2005.
H Expense ratios reflect operating expenses of the class. Expenses before reductions do not reflect amounts reimbursed by the investment adviser or reductions from brokerage service arrangements or other expense offset arrangements and do not
represent the amount paid by the class during periods when reimbursements or reductions occur. Expense ratios before reductions for start up periods may not be representative of longer term operating periods. Expenses net of fee waivers reflect
expenses after reimbursement by the investment adviser but prior to reductions from brokerage service arrangements or other expense offset arrangements. Expenses net of all reductions represent the net expenses paid by the class.
|
See accompanying notes which are an integral part of the financial statements.
|
113 Annual Report
VIP High Income Portfolio
Performance: The Bottom Line
|
Average annual total return reflects the change in the value of an investment, assuming reinvestment of a class’ dividend income and capital gains (the profits earned upon the sale of securities that have grown in value) and assuming a constant rate of performance each year. During periods of reimbursement by Fidelity, a fund’s total return will be greater than it would be had the reimbursement not occurred. Perfor mance numbers are net of all underlying fund operating expenses, but do not include any insurance charges imposed by your insurance company’s separate account. If performance information included the effect of these additional charges, the total returns would be lower. How a fund did yesterday is no guarantee of how it will do tomorrow.
| Average Annual Total Returns | | | | | | |
| Periods ended December 31, 2005 | | Past 1 | | Past 5 | | Past 10 |
| | | year | | years | | years |
| VIP High Income - Initial Class | | 2.70% | | 5.52% | | 3.48% |
| VIP High Income - Service ClassA | | 2.52% | | 5.40% | | 3.38% |
| VIP High Income - Service Class 2B | | 2.31% | | 5.23% | | 3.27% |
| VIP High Income - Investor ClassC | | 2.58% | | 5.49% | | 3.47% |
| | A The initial offering of Service Class shares took place on November 3, 1997. Performance for Service Class shares reflects an asset based distribution fee (12b 1 fee), and returns
prior to November 3, 1997 are those of Initial Class and do not include the effects of Service Class’ 12b 1 fee. Had Service Class’ 12b 1 fee been reflected, returns prior to November 3, 1997
would have been lower.
B The initial offering of Service Class 2 shares took place on January 12, 2000. Performance for Service Class 2 shares reflects an asset based distribution fee (12b 1 fee). Returns from
November 3, 1997 to January 12, 2000 are those of Service Class which reflect a different 12b 1 fee. Service Class 2 returns prior to November 3, 1997 are those of Initial Class and do not
include the effects of a 12b 1 fee. Had Service Class 2’s 12b 1 fee been reflected, returns prior to January 12, 2000 would have been lower.
C The initial offering of Investor Class shares took place on July 21, 2005. Returns prior to July 21, 2005 are those of Initial Class. If Investor Class’s transfer agent fee had been
reflected, returns prior to July 21, 2005 would have been lower.
|
$10,000 Over 10 Years
Let’s say hypothetically that $10,000 was invested in VIP High Income Portfolio Initial Class on December 31, 1995. The chart shows how the value of your investment would have changed, and also shows how the ML® U.S. High Yield Master II Index performed over the same period.
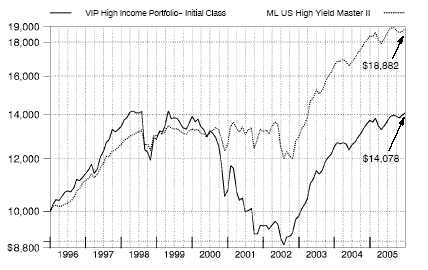
VIP High Income Portfolio 114
VIP High Income Portfolio
Management’s Discussion of Fund Performance
|
Comments from Matthew Conti, Portfolio Manager of VIP High Income Portfolio
The high yield bond market rose 2.74% for the year ending December 31, 2005, according to the Merrill Lynch® U.S. High Yield Master II Index. High yield turned in weak performance from the beginning of 2005 through mid May on soaring oil prices, weakness in the automotive sector and concerns about rising interest rates. The asset class rallied in the latter half of the second quarter, though, when investors concluded the market had become oversold. Slower issuance was a positive and, with the 10 year Treasury yield hovering around 4.00%, demand for lower quality bonds accelerated as investors searched for better yields. The smoother than anticipated transition of General Motors debt into the high yield arena and increased merger activity also supported the rally, which lasted through the end of August. But the market stumbled again in September and October due to the devastation caused by Hurricane Katrina, several bankruptcy filings and growing inflation concerns. Nevertheless, high yield recovered in November and December, helped by the rebound in the air transportation sector.
For the 12 months that ended December 31, 2005, the fund performed roughly in line with the Merrill Lynch index and of the LipperSM Variable Annuity High Current Yield Funds Average, which returned 2.56% . (For specific portfolio performance results, please refer to the performance section of this report.) Underweighting the weak automotive sector helped relative to the index, as did security selection in the electric utilities group. In autos, underweighting major index components Ford and General Motors provided a nice boost, as did avoiding parts suppliers such as Collins & Aikman. Underweighting distressed power producers such as Calpine was critical to our success in utilities. Another meaningful contributor was our over weighted position in financial services systems provider SunGard Data Systems, which outperformed. Conversely, airline bonds were a drag on performance. Although the fund did not own the bonds of Delta and Northwest when those companies defaulted in the fall, positions held earlier in the period declined in value. Security selection in telecommunications also detracted. In particular, not owning index component AT&T was a negative, as the company’s bonds rallied when SBC Communications, an investment grade company, purchased the firm. Other notable detractors included bath and kitchen product manufacturer Maax and automotive parts manufacturer Delco Remy.
The views expressed in this statement reflect those of the portfolio manager only through the end of the period of the report as stated on the cover and do not necessarily represent the views of Fidelity or any other person in the Fidelity organization. Any such views are subject to change at any time based upon market or other conditions and Fidelity disclaims any responsibility to update such views. These views may not be relied on as invest ment advice and, because investment decisions for a Fidelity fund are based on numerous factors, may not be relied on as an indication of trading intent on behalf of any Fidelity fund.
115 115 Annual Report
| VIP High Income Portfolio | | | | |
| Investment Changes | | | | |
| |
| |
| Top Five Holdings as of December 31, 2005 | | | | |
| (by issuer, excluding cash equivalents) | | % of fund’s | | % of fund’s net assets |
| | | net assets | | 6 months ago |
| MGM MIRAGE | | 1.8 | | 1.6 |
| AES Corp. | | 1.7 | | 1.7 |
| EchoStar DBS Corp. | | 1.6 | | 1.5 |
| Ship Finance International Ltd. | | 1.6 | | 1.5 |
| General Motors Acceptance Corp. | | 1.5 | | 0.0 |
| | | 8.2 | | |
Top Five Market Sectors as of December 31, 2005 | | | | |
| | | % of fund’s | | % of fund’s net assets |
| | | net assets | | 6 months ago |
| Energy | | 9.2 | | 10.2 |
| Electric Utilities | | 7.9 | | 8.5 |
| Technology | | 7.5 | | 5.8 |
| Telecommunications | | 7.5 | | 10.8 |
| Gaming | | 7.0 | | 6.0 |
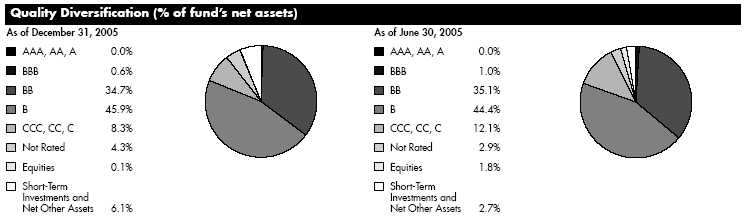
We have used ratings from Moody’s® Investors Services, Inc. Where Moody’s ratings are not available, we have used S&P® ratings.
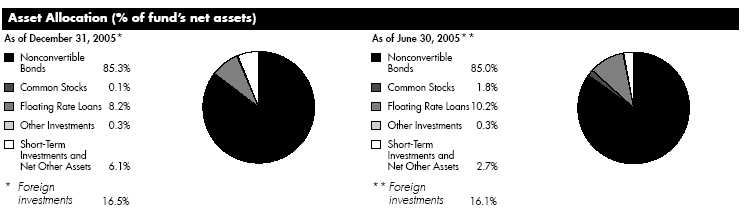
VIP High Income Portfolio 116
| VIP High Income Portfolio | | | | |
| Investments December 31, 2005 | | | | |
| Showing Percentage of Net Assets | | | | |
| |
| Nonconvertible Bonds 85.3% | | | | |
| | | Principal | | Value |
| | | Amount | | (Note 1) |
| Aerospace 1.5% | | | | |
| L 3 Communications Corp.: | | | | |
| 6.375% 10/15/15 (c) | | $ 5,520,000 | | $ 5,520,000 |
| 7.625% 6/15/12 | | 5,245,000 | | 5,533,475 |
| Orbital Sciences Corp. 9% 7/15/11 | | 5,900,000 | | 6,298,250 |
| Primus International, Inc. 11.5% 4/15/09 (c) | | 4,505,000 | | 4,775,300 |
| | | | | 22,127,025 |
| Air Transportation 0.5% | | | | |
| American Airlines, Inc. pass thru trust certificates 6.817% 5/23/11 | | 6,115,000 | | 5,870,400 |
| Continental Airlines, Inc. pass thru trust certificates 9.798% 4/1/21 | | 1,933,617 | | 1,933,617 |
| | | | | 7,804,017 |
| Automotive – 2.8% | | | | |
| Ford Motor Co. 7.45% 7/16/31 | | 2,805,000 | | 1,907,400 |
| Ford Motor Credit Co.: | | | | |
| 6.625% 6/16/08 | | 730,000 | | 662,151 |
| 7% 10/1/13 | | 4,235,000 | | 3,618,625 |
| 7.26% 11/2/07 (d) | | 6,110,000 | | 5,842,028 |
| General Motors Acceptance Corp.: | | | | |
| 5.05% 1/16/07 (d) | | 1,630,000 | | 1,548,653 |
| 5.125% 5/9/08 | | 2,885,000 | | 2,568,325 |
| 5.625% 5/15/09 | | 1,705,000 | | 1,516,925 |
| 6.125% 9/15/06 | | 1,645,000 | | 1,597,879 |
| 6.125% 2/1/07 | | 2,310,000 | | 2,205,235 |
| 6.75% 12/1/14 | | 675,000 | | 607,500 |
| 6.875% 9/15/11 | | 7,250,000 | | 6,615,625 |
| 8% 11/1/31 | | 6,200,000 | | 6,014,000 |
| Goodyear Tire & Rubber Co. 9% 7/1/15 (c) | | 4,490,000 | | 4,433,875 |
| Navistar International Corp.: | | | | |
| 6.25% 3/1/12 | | 1,680,000 | | 1,503,600 |
| 7.5% 6/15/11 | | 2,315,000 | | 2,193,463 |
| | | | | 42,835,284 |
| Banks and Thrifts – 0.4% | | | | |
| Western Financial Bank 9.625% 5/15/12 | | 5,125,000 | | 5,740,000 |
| Broadcasting – 0.2% | | | | |
| Paxson Communications Corp.: | | | | |
| 7.75% 1/15/12 (c)(d) | | 1,550,000 | | 1,538,375 |
| 10.75% 1/15/13 (c)(d) | | 1,550,000 | | 1,499,625 |
| | | | | 3,038,000 |
| Building Materials – 1.5% | | | | |
| Anixter International, Inc. 5.95% 3/1/15 | | 3,710,000 | | 3,359,553 |
| Goodman Global Holdings, Inc.: | | | | |
| 7.4913% 6/15/12 (c)(d) | | 4,905,000 | | 4,880,475 |
| 7.875% 12/15/12 (c) | | 2,980,000 | | 2,771,400 |
| Maax Holdings, Inc. 0% 12/15/12 (b) | | 9,895,000 | | 3,562,200 |
See accompanying notes which are an integral part of the financial statements.
|
117 Annual Report
117
| VIP High Income Portfolio | | | | | | |
| Investments - continued | | | | | | |
| |
| |
| |
| | | | | Principal | | Value |
| | | | | Amount | | (Note 1) |
| Nortek, Inc. 8.5% 9/1/14 | | | | $ 5,060,000 | | $ 4,908,200 |
| NTK Holdings, Inc. 0% 3/1/14 (b) | | | | 4,555,000 | | 2,846,875 |
| | | | | | | 22,328,703 |
| Cable TV 3.2% | | | | | | |
| Cablevision Systems Corp.: | | | | | | |
| 8% 4/15/12 | | | | 4,755,000 | | 4,422,150 |
| 8.7163% 4/1/09 (d) | | | | 6,165,000 | | 6,195,825 |
| CCH I LLC / CCH I Capital Corp. 11% 10/1/15 (c) | | | | 585,000 | | 485,550 |
| CSC Holdings, Inc. 7% 4/15/12 (c)(d) | | | | 1,055,000 | | 996,975 |
| EchoStar DBS Corp. 5.75% 10/1/08 | | | | 24,875,000 | | 24,439,668 |
| GCI, Inc. 7.25% 2/15/14 | | | | 4,080,000 | | 4,018,800 |
| iesy Repository GmbH 10.375% 2/15/15 (c) | | | | 3,290,000 | | 3,413,375 |
| Insight Midwest LP/Insight Capital, Inc. 10.5% 11/1/10 | | | | 1,370,000 | | 1,443,706 |
| Kabel Deutschland GmbH 10.625% 7/1/14 (c) | | | | 2,690,000 | | 2,844,675 |
| Mediacom Broadband LLC/Mediacom Broadband Corp. 8.5% 10/15/15 (c) | | 140,000 | | 129,500 |
| | | | | | | 48,390,224 |
| Capital Goods 2.1% | | | | | | |
| Amsted Industries, Inc. 10.25% 10/15/11 (c) | | | | 6,840,000 | | 7,173,450 |
| Chart Industries, Inc. 9.125% 10/15/15 (c) | | | | 810,000 | | 826,200 |
| Invensys PLC 9.875% 3/15/11 (c) | | | | 11,075,000 | | 10,964,250 |
| Leucadia National Corp. 7% 8/15/13 | | | | 5,375,000 | | 5,348,125 |
| Park Ohio Industries, Inc. 8.375% 11/15/14 | | | | 3,645,000 | | 3,171,150 |
| Sensus Metering Systems, Inc. 8.625% 12/15/13 | | | | 4,160,000 | | 3,681,600 |
| | | | | | | 31,164,775 |
| Chemicals 3.7% | | | | | | |
| Borden US Finance Corp./Nova Scotia Finance ULC 8.9% 7/15/10 (c)(d) | | 4,720,000 | | 4,767,200 |
| Crystal US Holding 3 LLC/Crystal US Sub 3 Corp.: | | | | | | |
| Series A, 0% 10/1/14 (b) | | | | 2,905,000 | | 2,109,756 |
| Series B, 0% 10/1/14 (b) | | | | 1,965,000 | | 1,424,625 |
| Equistar Chemicals LP 7.55% 2/15/26 | | | | 3,715,000 | | 3,529,250 |
| Equistar Chemicals LP/Equistar Funding Corp.: | | | | | | |
| 8.75% 2/15/09 | | | | 1,995,000 | | 2,107,219 |
| 10.125% 9/1/08 | | | | 2,800,000 | | 3,038,000 |
| Huntsman LLC 11.4% 7/15/11 (d) | | | | 5,700,000 | | 6,042,000 |
| Millennium America, Inc.: | | | | | | |
| 7.625% 11/15/26 | | | | 610,000 | | 582,550 |
| 9.25% 6/15/08 | | | | 11,875,000 | | 12,795,313 |
| |
| |
| |
| |
| See accompanying notes which are an integral part of the financial statements. | | | | | | |
| |
| VIP High Income Portfolio | | 118 | | | | |
| Nonconvertible Bonds continued | | | | |
| | | Principal | | Value |
| | | Amount | | (Note 1) |
| Chemicals – continued | | | | |
| Nalco Co. 7.75% 11/15/11 | | $ 3,755,000 | | $ 3,858,263 |
| Nell AF Sarl 8.375% 8/15/15 (c) | | 2,690,000 | | 2,656,375 |
| NOVA Chemicals Corp.: | | | | |
| 7.4% 4/1/09 | | 5,225,000 | | 5,316,438 |
| 7.5469% 11/15/13 (c)(d) | | 3,060,000 | | 3,128,850 |
| Tronox Worldwide LLC / Tronox Worldwide Finance Corp. 9.5% 12/1/12 (c) | | 4,300,000 | | 4,396,750 |
| | | | | 55,752,589 |
| Consumer Products – 1.0% | | | | |
| IKON Office Solutions, Inc. 7.75% 9/15/15 (c) | | 8,575,000 | | 8,382,063 |
| Jostens Holding Corp. 0% 12/1/13 (b) | | 3,050,000 | | 2,226,500 |
| Jostens IH Corp. 7.625% 10/1/12 | | 1,970,000 | | 1,950,300 |
| Samsonite Corp. 8.875% 6/1/11 | | 2,045,000 | | 2,121,688 |
| | | | | 14,680,551 |
| Containers – 1.9% | | | | |
| Berry Plastics Corp. 10.75% 7/15/12 | | 3,000,000 | | 3,210,000 |
| BWAY Corp. 10% 10/15/10 | | 7,005,000 | | 7,346,494 |
| Crown Americas LLC / Crown Americas Capital Corp.: | | | | |
| 7.625% 11/15/13 (c) | | 2,890,000 | | 2,976,700 |
| 7.75% 11/15/15 (c) | | 2,890,000 | | 2,976,700 |
| Owens Brockway Glass Container, Inc. 8.25% 5/15/13 | | 4,040,000 | | 4,171,300 |
| Owens Illinois, Inc.: | | | | |
| 7.35% 5/15/08 | | 4,105,000 | | 4,146,050 |
| 7.5% 5/15/10 | | 3,230,000 | | 3,242,113 |
| | | | | 28,069,357 |
| Diversified Financial Services – 0.7% | | | | |
| E*TRADE Financial Corp.: | | | | |
| 7.375% 9/15/13 (c) | | 1,600,000 | | 1,624,000 |
| 7.875% 12/1/15 | | 4,320,000 | | 4,460,400 |
| 8% 6/15/11 (c) | | 3,370,000 | | 3,513,225 |
| Triad Acquisition Corp. 11.125% 5/1/13 (c) | | 620,000 | | 607,600 |
| | | | | 10,205,225 |
| Diversified Media 1.0% | | | | |
| Corus Entertainment, Inc. 8.75% 3/1/12 | | 6,140,000 | | 6,600,500 |
| LBI Media Holdings, Inc. 0% 10/15/13 (b) | | 6,440,000 | | 4,701,200 |
| LBI Media, Inc. 10.125% 7/15/12 | | 3,285,000 | | 3,482,100 |
| | | | | 14,783,800 |
| Electric Utilities – 6.4% | | | | |
| AES Corp.: | | | | |
| 8.875% 2/15/11 | | 13,026,000 | | 14,084,363 |
| 9.375% 9/15/10 | | 6,433,000 | | 7,011,970 |
| 9.5% 6/1/09 | | 4,549,000 | | 4,895,861 |
See accompanying notes which are an integral part of the financial statements.
|
119 Annual Report
119
| VIP High Income Portfolio | | | | | | |
| Investments - continued | | | | | | |
| |
| |
| |
| | | | | Principal | | Value |
| | | | | Amount | | (Note 1) |
| AES Gener SA 7.5% 3/25/14 | | | | $ 5,290,000 | | $ 5,369,350 |
| Aquila, Inc. 14.875% 7/1/12 | | | | 2,555,000 | | 3,417,313 |
| CMS Energy Corp.: | | | | | | |
| 6.3% 2/1/12 | | | | 3,905,000 | | 3,865,950 |
| 6.875% 12/15/15 | | | | 2,690,000 | | 2,716,900 |
| 7.5% 1/15/09 | | | | 5,680,000 | | 5,836,200 |
| Mirant North America LLC / Mirant North America Finance Corp. 7.375% 12/31/13 (c) | | 2,480,000 | | 2,498,600 |
| MSW Energy Holdings II LLC/MSW Finance Co. II, Inc. 7.375% 9/1/10 . | | 7,490,000 | | 7,658,525 |
| MSW Energy Holdings LLC/MSW Energy Finance Co., Inc. 8.5% 9/1/10 | | 2,505,000 | | 2,655,300 |
| NRG Energy, Inc. 8% 12/15/13 | | | | 8,369,000 | | 9,310,513 |
| Sierra Pacific Resources: | | | | | | |
| 6.75% 8/15/17 (c) | | | | 2,190,000 | | 2,190,000 |
| 8.625% 3/15/14 | | | | 1,850,000 | | 2,007,250 |
| TECO Energy, Inc. 6.25% 5/1/10 (d) | | | | 3,850,000 | | 3,917,375 |
| Tenaska Alabama Partners LP 7% 6/30/21 (c) | | | | 3,313,837 | | 3,330,406 |
| TXU Corp. 6.5% 11/15/24 | | | | 6,115,000 | | 5,778,675 |
| Utilicorp Canada Finance Corp. 7.75% 6/15/11 | | | | 8,600,000 | | 8,772,000 |
| Utilicorp United, Inc. 9.95% 2/1/11 (d) | | | | 1,105,000 | | 1,215,500 |
| | | | | | | 96,532,051 |
| Energy – 8.3% | | | | | | |
| Atlas Pipeline Partners LP / Atlas Pipeline Partners Finance Corp. 8.125% 12/15/15 (c) | | 2,720,000 | | 2,747,200 |
| Chaparral Energy, Inc. 8.5% 12/1/15 (c) | | | | 4,800,000 | | 4,908,000 |
| Chesapeake Energy Corp.: | | | | | | |
| 6.5% 8/15/17 (c) | | | | 3,770,000 | | 3,765,288 |
| 7.5% 6/15/14 | | | | 2,095,000 | | 2,210,225 |
| 7.75% 1/15/15 | | | | 6,100,000 | | 6,450,750 |
| El Paso Corp.: | | | | | | |
| 6.375% 2/1/09 (c) | | | | 9,790,000 | | 9,594,200 |
| 6.5% 6/1/08 (c) | | | | 1,510,000 | | 1,489,373 |
| 7.75% 6/15/10 (c) | | | | 7,174,000 | | 7,342,589 |
| 9.625% 5/15/12 (c) | | | | 1,305,000 | | 1,409,400 |
| Hanover Compressor Co.: | | | | | | |
| 0% 3/31/07 | | | | 5,595,000 | | 4,979,550 |
| 8.625% 12/15/10 | | | | 2,560,000 | | 2,707,200 |
| 9% 6/1/14 | | | | 2,465,000 | | 2,680,688 |
| Hanover Equipment Trust 8.75% 9/1/11 | | | | 775,000 | | 815,688 |
| Hilcorp Energy I LP/Hilcorp Finance Co.: | | | | | | |
| 7.75% 11/1/15 (c) | | | | 3,440,000 | | 3,483,000 |
| 10.5% 9/1/10 (c) | | | | 2,828,000 | | 3,117,870 |
| |
| |
| |
| |
| See accompanying notes which are an integral part of the financial statements. | | | | | | |
| |
| VIP High Income Portfolio | | 120 | | | | |
| Nonconvertible Bonds continued | | | | |
| | | Principal | | Value |
| | | Amount | | (Note 1) |
| Energy – continued | | | | |
| Markwest Energy Partners LP/ Markwest Energy Finance Corp. 6.875% 11/1/14 (c) | | $ 2,236,000 | | $ 2,057,120 |
| Newfield Exploration Co. 6.625% 9/1/14 | | 2,800,000 | | 2,835,000 |
| Pacific Energy Partners LP/Pacific Energy Finance Corp. 6.25% 9/15/15 (c) | | 3,530,000 | | 3,485,875 |
| Parker Drilling Co.: | | | | |
| 9.16% 9/1/10 (d) | | 10,995,000 | | 11,407,313 |
| 9.625% 10/1/13 | | 2,960,000 | | 3,307,800 |
| Pogo Producing Co. 6.875% 10/1/17 (c) | | 2,255,000 | | 2,204,263 |
| Range Resources Corp. 7.375% 7/15/13 | | 10,885,000 | | 11,184,338 |
| Sonat, Inc. 7.625% 7/15/11 | | 8,680,000 | | 8,810,200 |
| Stone Energy Corp. 6.75% 12/15/14 | | 4,635,000 | | 4,356,900 |
| Targa Resources, Inc. / Targa Resources Finance Corp. 8.5% 11/1/13 (c) | | 2,535,000 | | 2,598,375 |
| Tesoro Corp.: | | | | |
| 6.25% 11/1/12 (c) | | 2,740,000 | | 2,750,275 |
| 6.625% 11/1/15 (c) | | 2,740,000 | | 2,767,400 |
| Williams Companies, Inc. 6.375% 10/1/10 (c) | | 8,760,000 | | 8,781,900 |
| | | | | 124,247,780 |
| Environmental – 0.8% | | | | |
| Allied Waste North America, Inc.: | | | | |
| 5.75% 2/15/11 | | 4,345,000 | | 4,084,300 |
| 8.5% 12/1/08 | | 3,965,000 | | 4,163,250 |
| 8.875% 4/1/08 | | 4,000,000 | | 4,220,000 |
| | | | | 12,467,550 |
| Food and Drug Retail – 0.3% | | | | |
| Stater Brothers Holdings, Inc.: | | | | |
| 7.9913% 6/15/10 (d) | | 2,235,000 | | 2,229,413 |
| 8.125% 6/15/12 | | 1,975,000 | | 1,955,250 |
| | | | | 4,184,663 |
| Food/Beverage/Tobacco – 1.8% | | | | |
| National Beef Packing Co. LLC/National Beef Finance Corp. 10.5% 8/1/11 | | 2,820,000 | | 2,918,700 |
| RJ Reynolds Tobacco Holdings, Inc.: | | | | |
| 6.5% 7/15/10 (c) | | 7,310,000 | | 7,236,900 |
| 7.3% 7/15/15 (c) | | 2,885,000 | | 2,939,094 |
| Smithfield Foods, Inc. 7% 8/1/11 | | 3,340,000 | | 3,410,975 |
| UAP Holding Corp. 0% 7/15/12 (b) | | 6,050,000 | | 5,233,250 |
| United Agriculture Products, Inc. 8.25% 12/15/11 | | 4,949,000 | | 5,196,450 |
| | | | | 26,935,369 |
See accompanying notes which are an integral part of the financial statements.
|
121 Annual Report
121
VIP High Income Portfolio
Investments - continued
|
| | | Principal | | Value |
| | | Amount | | (Note 1) |
| Gaming – 7.0% | | | | |
| Chukchansi Economic Development Authority: | | | | |
| 7.9662% 11/15/12 (c)(d) | | $ 1,010,000 | | $ 1,022,625 |
| 8% 11/15/13 (c) | | 3,210,000 | | 3,266,175 |
| Kerzner International Ltd. 6.75% 10/1/15 (c) | | 7,150,000 | | 6,935,500 |
| Mandalay Resort Group: | | | | |
| 9.375% 2/15/10 | | 4,655,000 | | 5,103,044 |
| 10.25% 8/1/07 | | 3,125,000 | | 3,332,031 |
| MGM MIRAGE: | | | | |
| 6% 10/1/09 | | 14,545,000 | | 14,472,275 |
| 6.625% 7/15/15 | | 3,350,000 | | 3,341,625 |
| 6.75% 9/1/12 | | 8,910,000 | | 9,032,513 |
| Mohegan Tribal Gaming Authority: | | | | |
| 6.375% 7/15/09 | | 11,815,000 | | 11,888,844 |
| 7.125% 8/15/14 | | 2,220,000 | | 2,286,600 |
| 8% 4/1/12 | | 1,220,000 | | 1,284,050 |
| MTR Gaming Group, Inc. 9.75% 4/1/10 | | 3,690,000 | | 3,929,850 |
| Scientific Games Corp. 6.25% 12/15/12 | | 3,275,000 | | 3,217,688 |
| Seneca Gaming Corp.: | | | | |
| 7.25% 5/1/12 (Reg. S) (c) | | 4,600,000 | | 4,634,500 |
| 7.25% 5/1/12 | | 6,020,000 | | 6,065,150 |
| Station Casinos, Inc. 6.875% 3/1/16 | | 9,520,000 | | 9,722,300 |
| Virgin River Casino Corp./RBG LLC/B&BB, Inc.: | | | | |
| 0% 1/15/13 (b) | | 2,100,000 | | 1,428,000 |
| 9% 1/15/12 | | 3,610,000 | | 3,682,200 |
| Wheeling Island Gaming, Inc. 10.125% 12/15/09 | | 6,730,000 | | 7,058,088 |
| Wynn Las Vegas LLC/Wynn Las Vegas Capital Corp. 6.625% 12/1/14 | | 3,630,000 | | 3,543,788 |
| | | | | 105,246,846 |
| Healthcare – 4.2% | | | | |
| Accellent, Inc. 10.5% 12/1/13 (c) | | 3,315,000 | | 3,414,450 |
| CDRV Investors, Inc. 0% 1/1/15 (b) | | 10,710,000 | | 6,559,875 |
| Concentra Operating Corp.: | | | | |
| 9.125% 6/1/12 | | 5,135,000 | | 5,289,050 |
| 9.5% 8/15/10 | | 2,145,000 | | 2,220,075 |
| DaVita, Inc. 6.625% 3/15/13 | | 4,080,000 | | 4,151,400 |
| HealthSouth Corp.: | | | | |
| 7.625% 6/1/12 | | 1,190,000 | | 1,201,900 |
| 8.5% 2/1/08 | | 1,740,000 | | 1,753,050 |
| IASIS Healthcare LLC/IASIS Capital Corp. 8.75% 6/15/14 | | 3,690,000 | | 3,874,500 |
| Mylan Laboratories, Inc.: | | | | |
| 5.75% 8/15/10 (c) | | 1,400,000 | | 1,403,500 |
| 6.375% 8/15/15 (c) | | 2,580,000 | | 2,586,450 |
See accompanying notes which are an integral part of the financial statements.
| | |
| VIP High Income Portfolio | | 122 |
| Nonconvertible Bonds continued | | | | |
| | | Principal | | Value |
| | | Amount | | (Note 1) |
| Healthcare – continued | | | | |
| Omega Healthcare Investors, Inc.: | | | | |
| 7% 4/1/14 | | $ 7,230,000 | | $ 7,257,113 |
| 7% 4/1/14 (c) | | 2,740,000 | | 2,750,275 |
| 7% 1/15/16 (c) | | 2,820,000 | | 2,795,325 |
| Senior Housing Properties Trust 8.625% 1/15/12 | | 10,645,000 | | 11,656,275 |
| Team Finance LLC / Health Finance Corp. 11.25% 12/1/13 (c) | | 4,310,000 | | 4,374,650 |
| Ventas Realty LP/Ventas Capital Corp. 6.625% 10/15/14 | | 2,320,000 | | 2,372,200 |
| | | | | 63,660,088 |
| Homebuilding/Real Estate – 3.9% | | | | |
| American Real Estate Partners/American Real Estate Finance Corp.: | | | | |
| 7.125% 2/15/13 (c) | | 5,020,000 | | 5,007,450 |
| 8.125% 6/1/12 | | 11,900,000 | | 12,316,500 |
| K. Hovnanian Enterprises, Inc.: | | | | |
| 6% 1/15/10 | | 1,330,000 | | 1,263,500 |
| 8.875% 4/1/12 | | 1,240,000 | | 1,284,950 |
| KB Home 7.75% 2/1/10 | | 10,470,000 | | 10,784,100 |
| Standard Pacific Corp.: | | | | |
| 5.125% 4/1/09 | | 7,040,000 | | 6,652,800 |
| 6.875% 5/15/11 | | 2,825,000 | | 2,697,875 |
| Technical Olympic USA, Inc.: | | | | |
| 7.5% 1/15/15 | | 5,115,000 | | 4,245,450 |
| 10.375% 7/1/12 | | 4,125,000 | | 4,063,125 |
| Ventas Realty LP/Ventas Capital Corp. 6.5% 6/1/16 (c) | | 4,530,000 | | 4,563,975 |
| WCI Communities, Inc.: | | | | |
| 6.625% 3/15/15 | | 3,135,000 | | 2,727,450 |
| 7.875% 10/1/13 | | 2,605,000 | | 2,448,700 |
| | | | | 58,055,875 |
| Hotels – 1.0% | | | | |
| Grupo Posadas SA de CV 8.75% 10/4/11 (c) | | 7,725,000 | | 7,918,125 |
| Host Marriott LP 7.125% 11/1/13 | | 6,855,000 | | 7,112,063 |
| | | | | 15,030,188 |
| Insurance – 0.8% | | | | |
| Crum & Forster Holdings Corp. 10.375% 6/15/13 | | 4,895,000 | | 5,139,750 |
| Fairfax Financial Holdings Ltd. 7.75% 4/26/12 | | 3,400,000 | | 3,179,000 |
| UnumProvident Finance Co. PLC 6.85% 11/15/15 (c) | | 3,930,000 | | 4,057,725 |
| | | | | 12,376,475 |
| Leisure 2.1% | | | | |
| Equinox Holdings Ltd. 9% 12/15/09 | | 4,525,000 | | 4,841,750 |
| Town Sports International Holdings, Inc. 0% 2/1/14 (b) | | 1,610,000 | | 1,094,800 |
| Town Sports International, Inc. 9.625% 4/15/11 | | 8,330,000 | | 8,663,200 |
See accompanying notes which are an integral part of the financial statements.
|
123 Annual Report
123
| VIP High Income Portfolio | | | | |
| Investments - continued | | | | |
| |
| |
| |
| | | Principal | | Value |
| | | Amount | | (Note 1) |
| Universal City Development Partners Ltd./UCDP Finance, Inc. 11.75% 4/1/10 | | $ 10,015,000 | | $ 11,166,725 |
| Universal City Florida Holding Co. I/II 9% 5/1/10 (d) | | 5,345,000 | | 5,371,725 |
| | | | | 31,138,200 |
| Metals/Mining – 2.7% | | | | |
| Arch Western Finance LLC 6.75% 7/1/13 | | 4,945,000 | | 4,969,725 |
| Century Aluminum Co. 7.5% 8/15/14 | | 1,735,000 | | 1,717,650 |
| Compass Minerals International, Inc.: | | | | |
| 0% 12/15/12 (b) | | 5,940,000 | | 5,375,700 |
| 0% 6/1/13 (b) | | 9,470,000 | | 8,191,550 |
| Massey Energy Co. 6.875% 12/15/13 (c) | | 4,200,000 | | 4,236,750 |
| Southern Peru Copper Corp. 6.375% 7/27/15 (c) | | 5,890,000 | | 5,901,780 |
| Vedanta Resources PLC 6.625% 2/22/10 (c) | | 10,775,000 | | 10,519,094 |
| | | | | 40,912,249 |
| Paper 1.0% | | | | |
| Catalyst Paper Corp. 8.625% 6/15/11 | | 4,060,000 | | 3,917,900 |
| Georgia Pacific Corp.: | | | | |
| 8% 1/15/24 | | 1,985,000 | | 1,890,713 |
| 8.125% 5/15/11 | | 5,175,000 | | 5,175,000 |
| 8.875% 5/15/31 | | 3,535,000 | | 3,535,000 |
| | | | | 14,518,613 |
| Publishing/Printing – 1.5% | | | | |
| Dex Media West LLC/Dex Media West Finance Co.: | | | | |
| 8.5% 8/15/10 | | 2,175,000 | | 2,289,188 |
| 9.875% 8/15/13 | | 1,420,000 | | 1,574,425 |
| Houghton Mifflin Co. 9.875% 2/1/13 | | 5,435,000 | | 5,740,719 |
| R.H. Donnelley Finance Corp. I 10.875% 12/15/12 | | 2,505,000 | | 2,814,994 |
| The Reader’s Digest Association, Inc. 6.5% 3/1/11 | | 11,160,000 | | 10,964,700 |
| | | | | 23,384,026 |
| Railroad 0.9% | | | | |
| Kansas City Southern Railway Co.: | | | | |
| 7.5% 6/15/09 | | 13,525,000 | | 13,964,563 |
| 9.5% 10/1/08 | | 150,000 | | 162,750 |
| | | | | 14,127,313 |
| Restaurants 1.1% | | | | |
| Carrols Corp. 9% 1/15/13 | | 4,900,000 | | 4,765,250 |
| Friendly Ice Cream Corp. 8.375% 6/15/12 | | 5,375,000 | | 4,824,063 |
| Landry’s Seafood Restaurants, Inc. 7.5% 12/15/14 | | 6,915,000 | | 6,500,100 |
| | | | | 16,089,413 |
See accompanying notes which are an integral part of the financial statements.
| | |
| VIP High Income Portfolio | | 124 |
| Nonconvertible Bonds continued | | | | |
| | | Principal | | Value |
| | | Amount | | (Note 1) |
| Services – 1.7% | | | | |
| Corrections Corp. of America: | | | | |
| 6.25% 3/15/13 | | $ 1,070,000 | | $ 1,059,300 |
| 7.5% 5/1/11 | | 1,870,000 | | 1,930,775 |
| FTI Consulting, Inc. 7.625% 6/15/13 (c) | | 3,990,000 | | 4,124,663 |
| Iron Mountain, Inc.: | | | | |
| 8.25% 7/1/11 | | 5,555,000 | | 5,610,550 |
| 8.625% 4/1/13 | | 5,270,000 | | 5,480,800 |
| Rural/Metro Corp.: | | | | |
| 0% 3/15/16 (b)(c) | | 3,930,000 | | 2,377,650 |
| 9.875% 3/15/15 (c) | | 1,035,000 | | 1,060,875 |
| United Rentals North America, Inc. 7% 2/15/14 | | 4,090,000 | | 3,803,700 |
| | | | | 25,448,313 |
| Shipping – 3.6% | | | | |
| Hertz Corp.: | | | | |
| 8.875% 1/1/14 (c) | | 1,460,000 | | 1,480,075 |
| 10.5% 1/1/16 (c) | | 3,260,000 | | 3,329,275 |
| OMI Corp. 7.625% 12/1/13 | | 9,595,000 | | 9,738,925 |
| Overseas Shipholding Group, Inc.: | | | | |
| 7.5% 2/15/24 | | 295,000 | | 293,525 |
| 8.25% 3/15/13 | | 1,295,000 | | 1,369,463 |
| Ship Finance International Ltd. 8.5% 12/15/13 | | 25,180,000 | | 23,795,100 |
| Teekay Shipping Corp. 8.875% 7/15/11 | | 12,158,000 | | 13,677,750 |
| | | | | 53,684,113 |
| Steels 0.9% | | | | |
| Allegheny Technologies, Inc. 8.375% 12/15/11 | | 5,820,000 | | 6,300,150 |
| Gerdau AmeriSteel Corp./GUSAP Partners 10.375% 7/15/11 | | 6,380,000 | | 7,033,950 |
| | | | | 13,334,100 |
| Super Retail 1.4% | | | | |
| GSC Holdings Corp./Gamestop, Inc. 8% 10/1/12 (c) | | 16,795,000 | | 15,661,338 |
| NBC Acquisition Corp. 0% 3/15/13 (b) | | 1,665,000 | | 1,165,500 |
| Nebraska Book Co., Inc. 8.625% 3/15/12 | | 2,530,000 | | 2,327,600 |
| Sonic Automotive, Inc. 8.625% 8/15/13 | | 2,410,000 | | 2,331,675 |
| | | | | 21,486,113 |
| Technology – 6.5% | | | | |
| Advanced Micro Devices, Inc. 7.75% 11/1/12 | | 4,210,000 | | 4,231,050 |
| Amkor Technology, Inc.: | | | | |
| 7.125% 3/15/11 | | 1,465,000 | | 1,289,200 |
| 7.75% 5/15/13 | | 1,475,000 | | 1,290,625 |
| 10.5% 5/1/09 | | 1,285,000 | | 1,178,988 |
| Avago Technologies Finance Ltd.: | | | | |
| 9.91% 6/1/13 (c)(d) | | 4,400,000 | | 4,488,000 |
See accompanying notes which are an integral part of the financial statements.
|
125 Annual Report
125
VIP High Income Portfolio
Investments - continued
|
| | | Principal | | Value |
| | | Amount | | (Note 1) |
| 10.125% 12/1/13 (c) | | $ 5,775,000 | | $ 5,933,813 |
| 11.875% 12/1/15 (c) | | 1,475,000 | | 1,486,063 |
| Celestica, Inc.: | | | | |
| 7.625% 7/1/13 | | 2,785,000 | | 2,746,706 |
| 7.875% 7/1/11 | | 10,440,000 | | 10,492,200 |
| Freescale Semiconductor, Inc. 6.875% 7/15/11 | | 10,965,000 | | 11,458,425 |
| Lucent Technologies, Inc.: | | | | |
| 6.45% 3/15/29 | | 6,900,000 | | 5,882,250 |
| 6.5% 1/15/28 | | 2,210,000 | | 1,864,688 |
| MagnaChip Semiconductor SA/MagnaChip Semiconductor Finance Co. 7.7413% 12/15/11 (d) | | 5,820,000 | | 5,892,750 |
| New ASAT Finance Ltd. 9.25% 2/1/11 | | 2,000,000 | | 1,450,000 |
| Sanmina SCI Corp. 6.75% 3/1/13 | | 6,800,000 | | 6,426,000 |
| STATS ChipPAC Ltd. 7.5% 7/19/10 | | 5,980,000 | | 6,009,900 |
| SunGard Data Systems, Inc.: | | | | |
| 8.5248% 8/15/13 (c)(d) | | 3,535,000 | | 3,645,469 |
| 9.125% 8/15/13 (c) | | 6,195,000 | | 6,404,081 |
| Unisys Corp. 8% 10/15/12 | | 1,520,000 | | 1,398,400 |
| Xerox Capital Trust I 8% 2/1/27 | | 6,315,000 | | 6,488,663 |
| Xerox Corp.: | | | | |
| 6.875% 8/15/11 | | 2,780,000 | | 2,866,875 |
| 7.625% 6/15/13 | | 4,585,000 | | 4,848,638 |
| | | | | 97,772,784 |
| Telecommunications – 6.4% | | | | |
| Digicel Ltd. 9.25% 9/1/12 (c) | | 4,530,000 | | 4,665,900 |
| Innova S. de R.L. 9.375% 9/19/13 | | 950,000 | | 1,056,875 |
| Intelsat Ltd.: | | | | |
| 5.25% 11/1/08 | | 2,535,000 | | 2,313,188 |
| 6.5% 11/1/13 | | 10,960,000 | | 8,151,500 |
| 7.625% 4/15/12 | | 7,910,000 | | 6,347,775 |
| 8.695% 1/15/12 (c)(d) | | 4,220,000 | | 4,293,850 |
| MCI, Inc. 8.735% 5/1/14 (d) | | 4,175,000 | | 4,618,594 |
| Millicom International Cellular SA 10% 12/1/13 | | 7,280,000 | | 7,498,400 |
| Mobile Telesystems Finance SA 8% 1/28/12 (c) | | 3,330,000 | | 3,406,590 |
| New Skies Satellites BV: | | | | |
| 9.125% 11/1/12 | | 4,360,000 | | 4,654,300 |
| 9.5725% 11/1/11 (d) | | 4,890,000 | | 5,085,600 |
| PanAmSat Corp. 9% 8/15/14 | | 5,374,000 | | 5,642,700 |
| PanAmSat Holding Corp. 0% 11/1/14 (b) | | 1,070,000 | | 747,663 |
| Qwest Corp.: | | | | |
| 7.7413% 6/15/13 (c)(d) | | 10,630,000 | | 11,374,100 |
| 8.875% 3/15/12 | | 785,000 | | 885,088 |
| Rogers Communications, Inc.: | | | | |
| 7.25% 12/15/12 | | 2,085,000 | | 2,197,069 |
| 9.625% 5/1/11 | | 8,545,000 | | 9,784,025 |
See accompanying notes which are an integral part of the financial statements.
| | |
| VIP High Income Portfolio | | 126 |
| Nonconvertible Bonds continued | | | | |
| | | Principal | | Value |
| | | Amount | | (Note 1) |
| Telecommunications – continued | | | | |
| SBA Communications Corp. 8.5% 12/1/12 | | $ 3,540,000 | | $ 3,938,250 |
| Time Warner Telecom, Inc. 10.125% 2/1/11 | | 1,585,000 | | 1,656,325 |
| U.S. West Capital Funding, Inc. 6.375% 7/15/08 | | 2,695,000 | | 2,668,050 |
| U.S. West Communications 7.5% 6/15/23 | | 3,335,000 | | 3,301,650 |
| Wind Acquisition Finance SA 10.75% 12/1/15 (c) | | 2,570,000 | | 2,643,888 |
| | | | | 96,931,380 |
| Textiles & Apparel 0.5% | | | | |
| Levi Strauss & Co.: | | | | |
| 8.8044% 4/1/12 (d) | | 2,980,000 | | 2,994,900 |
| 12.25% 12/15/12 | | 1,560,000 | | 1,731,600 |
| Tommy Hilfiger USA, Inc. 6.85% 6/1/08 | | 2,950,000 | | 2,979,500 |
| | | | | 7,706,000 |
| |
| TOTAL NONCONVERTIBLE BONDS | | | | |
| (Cost $1,277,348,136) | | 1,282,189,052 |
| |
| Commercial Mortgage Securities 0.3% | | | | |
| |
| Banc of America Commercial Mortgage, Inc. Series 2003 2: | | | | |
| Class BWD, 6.947% 10/11/37 (c) | | 608,089 | | 613,941 |
| Class BWE, 7.226% 10/11/37 (c) | | 822,302 | | 829,661 |
| Class BWF, 7.55% 10/11/37 (c) | | 725,932 | | 733,810 |
| Class BWG, 8.155% 10/11/37 (c) | | 702,124 | | 703,212 |
| Class BWH, 9.073% 10/11/37 (c) | | 367,223 | | 373,628 |
| Class BWJ, 9.99% 10/11/37 (c) | | 607,102 | | 616,137 |
| Class BWK, 10.676% 10/11/37 (c) | | 472,848 | | 482,524 |
| Class BWL, 10.1596% 10/11/37 (c) | | 788,739 | | 746,962 |
| LB Multi family Mortgage Trust Series 1991 4 Class A1, 7.0403% 4/25/21 (c)(d) | | 194,743 | | 175,269 |
| TOTAL COMMERCIAL MORTGAGE SECURITIES | | | | |
| (Cost $5,033,785) | | | | 5,275,144 |
| |
| Common Stocks 0.1% | | | | |
| | | Shares | | |
| Chemicals 0.1% | | | | |
| Huntsman Corp. (e) | | 93,936 | | 1,455,820 |
| |
| |
| | | Shares | | Value (Note 1) |
| Textiles & Apparel 0.0% | | | | |
| Arena Brands Holding Corp. Class B (e) | | 48,889 | | $ 633,113 |
| TOTAL COMMON STOCKS | | | | |
| (Cost $2,621,103) | | | | 2,088,933 |
| |
| |
| |
| |
See accompanying notes which are an integral part of the financial statements.
| | | | |
| 127 | | Annual Report |
| VIP High Income Portfolio | | | | |
| Investments - continued | | | | |
| |
| |
| Floating Rate Loans 8.2% | | | | |
| | | Principal | | |
| | | Amount | | |
| Aerospace 0.3% | | | | |
| Transdigm, Inc. term loan 9.31% 11/10/11 (d) | | $ 4,840,000 | | 4,767,400 |
| Air Transportation 0.4% | | | | |
| US Airways Group, Inc.: | | | | |
| Tranche 1A, term loan 10.5269% 9/30/10 (d) | | 3,763,463 | | 3,857,549 |
| Tranche 2B, term loan 12.9269% 9/30/08 (d) | | 1,588,852 | | 1,636,518 |
| | | | | 5,494,067 |
| Building Materials – 0.5% | | | | |
| Masonite International Corp. term loan 9.3838% 4/6/15 (d) | | 7,930,000 | | 7,920,088 |
| Chemicals 0.0% | | | | |
| Huntsman International LLC Tranche B, term loan 6.12% 8/16/12 (d) | | 332,142 | | 333,387 |
| Diversified Financial Services – 0.3% | | | | |
| LPL Holdings, Inc. Tranche B, term loan 7.7364% 6/27/13 (d) | | 4,910,000 | | 4,885,450 |
| Electric Utilities – 1.5% | | | | |
| Covanta Energy Corp.: | | | | |
| Tranche 1: | | | | |
| Credit Linked Deposit 7.5269% 6/24/12 (d) | | 4,566,504 | | 4,623,585 |
| term loan 7.5053% 6/24/12 (d) | | 3,079,872 | | 3,118,370 |
| Tranche 2, term loan 9.9491% 6/24/13 (d) | | 7,835,000 | | 7,952,525 |
| Riverside Energy Center LLC: | | | | |
| term loan 8.4931% 6/24/11 (d) | | 5,680,322 | | 5,680,322 |
| Credit Linked Deposit 8.4931% 6/24/11 (d) | | 264,557 | | 264,557 |
| | | | | 21,639,359 |
| Energy – 0.9% | | | | |
| Boart Longyear Holdings, Inc.: | | | | |
| Tranche 1, term loan 7.53% 7/28/12 (d) | | 638,400 | | 644,784 |
| Tranche 2, term loan 11.53% 1/28/13 (d) | | 1,590,000 | | 1,590,000 |
| Coffeyville Resources LLC: | | | | |
| Credit Linked Deposit 6.8625% 7/8/11 (d) | | 264,000 | | 266,640 |
See accompanying notes which are an integral part of the financial statements.
| | |
| VIP High Income Portfolio | | 128 |
| Floating Rate Loans continued | | | | | | |
| | | | | | | Principal | | Value |
| | | | | | | Amount | | (Note 1) |
| Energy – continued | | | | | | | | |
| Coffeyville Resources LLC: - continued | | | | | | |
| Tranche 2, term loan 11.3125% 7/8/13 (d) | | | | $ 4,480,000 | | $ 4,580,800 |
| Tranche B1, term loan 7.0625% 7/8/12 (d) | | | | 395,010 | | 398,960 |
| Targa Resources, Inc. / Targa Resources Finance Corp.: | | | | | | |
| Credit Linked Deposit 6.6519% 10/31/12 (d) | | | | 605,806 | | 608,835 |
| term loan: | | | | | | | | |
| 6.6366% 10/31/12 (d) | | | | | | 2,520,867 | | 2,533,471 |
| 6.83% 10/31/07 (d) | | | | | | 3,190,000 | | 3,205,950 |
| | | | | | | | | 13,829,440 |
| Environmental – 0.8% | | | | | | | | |
| Envirocare of Utah, Inc.: | | | | | | | | |
| Tranche 1, term loan 6.95% 4/13/10 (d) | | | | 3,440,432 | | 3,474,837 |
| Tranche 2, term loan 9.7% 4/13/10 (d) | | | | 7,680,000 | | 7,843,200 |
| | | | | | | | | 11,318,037 |
| Healthcare – 0.1% | | | | | | | | |
| Team Health, Inc. term loan 6.88% 11/22/12 (d) | | | | 750,000 | | 755,625 |
| Homebuilding/Real Estate – 1.3% | | | | | | |
| Capital Automotive (REIT) term loan 6.12% 12/16/10 (d) | | | | 6,480,000 | | 6,496,200 |
| LNR Property Corp.: | | | | | | | | |
| Tranche A, term loan 8.7665% 2/3/08 (d) | | | | 6,370,000 | | 6,401,850 |
| Tranche B, term loan: | | | | | �� | | | |
| 7.2681% 2/3/08 (d) | | | | | | 3,380,897 | | 3,385,123 |
| 9.5165% 2/3/08 (d) | | | | | | 3,700,000 | | 3,718,500 |
| | | | | | | | | 20,001,673 |
| Technology – 1.0% | | | | | | | | |
| Fidelity National Information Solutions, Inc.: | | | | | | |
| Tranche A, term loan 5.86% 3/9/11 (d) | | | | 6,118,762 | | 6,118,762 |
| Tranche B, term loan 6.11% 3/9/13 (d) | | | | 2,411,200 | | 2,423,256 |
| Infor Global Solutions AG Tranche 2, term loan 11.8009% 4/18/12 (d) | | . | | 2,660,000 | | 2,686,600 |
| Open Solutions, Inc. Tranche 2, term loan LIBOR + 2.5% 12/14/11 (d) | | | | 4,240,000 | | 4,298,300 |
| | | | | | | | | 15,526,918 |
| Telecommunications – 1.1% | | | | | | | | |
| Qwest Corp. Tranche B, term loan 6.95% 6/30/10 (d) | | | | 5,900,000 | | 5,966,375 |
| Wind Telecomunicazioni Spa: | | | | | | |
| Tranche 2, term loan 10.62% 3/21/15 (d) | | | | 5,450,000 | | 5,654,375 |
See accompanying notes which are an integral part of the financial statements.
|
129 Annual Report
129
| VIP High Income Portfolio | | | | |
| Investments - continued | | | | |
| |
| |
| | | Principal | | Value |
| | | Amount | | (Note 1) |
| Tranche B, term loan 7.12% 9/21/13 (d) | | $ 2,345,000 | | $ 2,339,138 |
| Tranche C, term loan 7.62% 9/21/14 (d) | | 2,345,000 | | 2,339,138 |
| | | | | 16,299,026 |
| TOTAL FLOATING RATE LOANS | | | | |
| (Cost $121,715,934) | | 122,770,470 |
| Money Market Funds 4.8% | | | | |
| | | Shares | | |
| Fidelity Cash Central Fund, 4.28% (a) | | | | |
| (Cost $72,016,583) | | 72,016,583 | | 72,016,583 |
| Cash Equivalents 0.3% | | | | |
| | | Maturity | | |
| | | Amount | | |
| Investments in repurchase agreements (Collateralized by U.S. Government Obligations, in a joint trading account at | | | | |
| 3.51%, dated 12/30/05 due 1/3/06) | | | | |
| (Cost $4,810,000) | | $ 4,811,875 | | 4,810,000 |
| TOTAL INVESTMENT PORTFOLIO 99.0% | | | | |
| (Cost $1,483,545,541) | | 1,489,150,182 |
| |
| NET OTHER ASSETS 1.0% | | | | 14,601,264 |
| NET ASSETS 100% | | $ 1,503,751,446 |
Legend
(a) Affiliated fund that is available only to investment companies and other accounts managed by Fidelity Investments. The rate quoted is the annualized seven-day
yield of the fund at period end. A complete unaudited listing of the fund’s holdings as of its most recent quarter end is available upon request.
(b) Debt obligation initially issued in zero coupon form which converts to coupon form at a specified rate and date. The rate shown is the rate at period end.
(c) Security exempt from registration under Rule 144A of the Securities Act of 1933. These securities may be resold in transactions exempt from registration,
normally to qualified institutional buyers. At the period end, the value of these securities amounted to $325,018,739 or 21.6% of net assets.
(d) The coupon rate shown on floating or adjustable rate securities represents the rate at period end.
(e) Restricted securities – Investment in securities not registered under the Securities Act of 1933 (excluding 144A issues). At the end of the period, the value of
restricted securities (excluding 144A issues) amounted to $2,088,933 or 0.1% of net assets.
|
See accompanying notes which are an integral part of the financial statements.
VIP High Income Portfolio 130
Additional information on each holding is as follows:
| Security | | Acquisition Date | | Acquisition Cost |
| Arena Brands Holding Corp. Class B | | 6/18/97 | | $ 1,974,627 |
| Huntsman Corp. | | 7/28/03 | | $ 553,819 |
Affiliated Central Funds
Information regarding income received by the fund from the affiliated Central funds during the period is as follows:
| Fund | | Income received |
| Fidelity Cash Central Fund | | $ 2,313,904 |
Other Information
Distribution of investments by country of issue, as a percentage of total net assets, is as follows:
| United States of America | | 83.5% |
| Canada | | 4.8% |
| Bermuda | | 3.3% |
| United Kingdom | | 1.7% |
| Marshall Islands | | 1.6% |
| Luxembourg | | 1.5% |
| Others (individually less than 1%) | | 3.6% |
| | | 100.0% |
Income Tax Information
At December 31, 2005, the fund had a capital loss carryforward of approximately $1,130,214,603 of which $269,179,718, $772,554,243 and $88,480,642 will expire on December 31, 2008, 2009 and 2010, respectively.
See accompanying notes which are an integral part of the financial statements.
131 Annual Report
| VIP High Income Portfolio | | | | | | |
| |
| Financial Statements | | | | | | |
| |
| |
| Statement of Assets and Liabilities | | | | | | |
| | | December 31, 2005 |
| |
| Assets | | | | | | |
| Investment in securities, at value (including repurchase agreements of $4,810,000) — See accompanying schedule: | | | | | | |
| Unaffiliated issuers (cost $1,411,528,958) | | $1,417,133,599 | | | | |
| Affiliated Central Funds (cost $72,016,583) | | 72,016,583 | | | | |
| Total Investments (cost $1,483,545,541) | | | | $1,489,150,182 |
| Cash | | | | | | 7,044,062 |
| Receivable for investments sold | | | | | | 6,552,944 |
| Receivable for fund shares sold | | | | | | 288,300 |
| Interest receivable | | | | | | 24,862,484 |
| Prepaid expenses | | | | | | 8,085 |
| Other receivables | | | | | | 1,712 |
| Total assets | | | | 1,527,907,769 |
| |
| Liabilities | | | | | | |
| Payable for investments purchased | | $ 19,607,565 | | | | |
| Payable for fund shares redeemed | | 3,571,880 | | | | |
| Accrued management fee | | 719,293 | | | | |
| Distribution fees payable | | 44,741 | | | | |
| Other affiliated payables | | 130,889 | | | | |
| Other payables and accrued expenses | | 81,955 | | | | |
| Total liabilities | | | | | | 24,156,323 |
| |
| Net Assets | | | | $ 1,503,751,446 |
| Net Assets consist of: | | | | | | |
| Paid in capital | | | | $2,623,368,779 |
| Undistributed net investment income | | | | | | 5,394,674 |
| Accumulated undistributed net realized gain (loss) on investments | | | | (1,130,616,648) |
| Net unrealized appreciation (depreciation) on investments | | | | | | 5,604,641 |
| Net Assets | | | | $ 1,503,751,446 |
| |
| Statement of Assets and Liabilities continued | | | | | | |
| | | December 31, 2005 |
| |
| Initial Class: | | | | | | |
| Net Asset Value, offering price and redemption price per share ($1,080,001,710 ÷ 175,098,266 shares) | | | | $ | | 6.17 |
| Service Class: | | | | | | |
| Net Asset Value, offering price and redemption price per share ($319,379,911 ÷ 52,003,481 shares) | | | | $ | | 6.14 |
| Service Class 2: | | | | | | |
| Net Asset Value, offering price and redemption price per share ($86,757,293 ÷ 14,266,301 shares) | | | | $ | | 6.08 |
| Initial Class R: | | | | | | |
| Net Asset Value, offering price and redemption price per share ($83,235 ÷ 13,509 shares) | | | | $ | | 6.16 |
| Service Class R: | | | | | | |
| Net Asset Value, offering price and redemption price per share ($83,101 ÷ 13,534 shares) | | | | $ | | 6.14 |
| Service Class 2R: | | | | | | |
| Net Asset Value, offering price and redemption price per share ($82,881 ÷ 13,629 shares) | | | | $ | | 6.08 |
| Investor Class: | | | | | | |
| Net Asset Value, offering price and redemption price per share ($17,363,315 ÷ 2,818,163 shares) | | | | $ | | 6.16 |
See accompanying notes which are an integral part of the financial statements.
| | |
| VIP High Income Portfolio | | 132 |
| Statement of Operations | | | | | | |
| | | Year ended December 31, 2005 |
| |
| Investment Income | | | | | | |
| Dividends | | | | $ | | 15,062 |
| Interest | | | | | | 119,889,332 |
| Income from affiliated Central Funds | | | | | | 2,313,904 |
| Total income | | | | | | 122,218,298 |
| |
| Expenses | | | | | | |
| Management fee | | $ 9,138,183 | | | | |
| Transfer agent fees | | 1,085,513 | | | | |
| Distribution fees | | 544,643 | | | | |
| Accounting fees and expenses | | 568,878 | | | | |
| Independent trustees’ compensation | | 7,332 | | | | |
| Custodian fees and expenses | | 50,213 | | | | |
| Audit | | 76,005 | | | | |
| Legal | | 21,718 | | | | |
| Interest | | 37,564 | | | | |
| Miscellaneous | | 141,054 | | | | |
| Total expenses before reductions | | 11,671,103 | | | | |
| Expense reductions | | (25,527) | | | | 11,645,576 |
| |
| Net investment income | | | | | | 110,572,722 |
| Realized and Unrealized Gain (Loss) | | | | | | |
| Net realized gain (loss) on: | | | | | | |
| Investment securities: | | | | | | |
| Unaffiliated issuers | | | | | | 14,492,871 |
| Change in net unrealized appreciation (depreciation) on: | | | | | | |
| Investment securities | | (85,880,606) | | | | |
| Assets and liabilities in foreign currencies | | (743) | | | | |
| Total change in net unrealized appreciation (depreciation) | | | | | | (85,881,349) |
| Net gain (loss) | | | | | | (71,388,478) |
| Net increase (decrease) in net assets resulting from operations | | | | $ | | 39,184,244 |
| |
| Statement of Changes in Net Assets | | | | | | |
| | | Year ended | | | | Year ended |
| | | December 31, | | | | December 31, |
| | | 2005 | | | | 2004 |
| Increase (Decrease) in Net Assets | | | | | | |
| Operations | | | | | | |
| Net investment income | | $ 110,572,722 | | $ | | 133,821,874 |
| Net realized gain (loss) | | 14,492,871 | | | | 76,148,906 |
| Change in net unrealized appreciation (depreciation) | | (85,881,349) | | | | (47,643,478) |
| Net increase (decrease) in net assets resulting from operations | | 39,184,244 | | | | 162,327,302 |
| Distributions to shareholders from net investment income | | (242,303,630) | | | | (155,517,698) |
| Share transactions - net increase (decrease) | | (136,476,901) | | | | (251,486,736) |
| Redemption fees | | — | | | | — |
| Total increase (decrease) in net assets | | (339,596,287) | | | | (244,677,132) |
| |
| Net Assets | | | | | | |
| Beginning of period | | 1,843,347,733 | | | | 2,088,024,865 |
| End of period (including undistributed net investment income of $5,394,674 and undistributed net investment income | | | | | | |
| of $142,574,339, respectively) | | $ 1,503,751,446 | | $ | | 1,843,347,733 |
See accompanying notes which are an integral part of the financial statements.
|
133 Annual Report
| Financial Highlights Initial Class | | | | | | | | | | |
| Years ended December 31, | | 2005 | | 2004 | | 2003 | | 2002 | | 2001 |
| Selected Per Share Data | | | | | | | | | | |
| Net asset value, beginning of period | | $ 7.00 | | $ 6.95 | | $ 5.93 | | $ 6.41 | | $ 8.18 |
| Income from Investment Operations | | | | | | | | | | |
| Net investment incomeC | | 457 | | .494 | | .520 | | .496F | | .774E,F |
| Net realized and unrealized gain (loss) | | (.281) | | .126 | | .980 | | (.306)F | | (1.544)E,F |
| Total from investment operations | | 176 | | .620 | | 1.500 | | .190 | | (.770) |
| Distributions from net investment income | | (1.006) | | (.570) | | (.480) | | (.670) | | (1.000) |
| Net asset value, end of period | | $ 6.17 | | $ 7.00 | | $ 6.95 | | $ 5.93 | �� | $ 6.41 |
| Total ReturnA,B | | 2.70% | | 9.59% | | 27.26% | | 3.44% | | (11.73)% |
| Ratios to Average Net AssetsD | | | | | | | | | | |
| Expenses before reductions | | 70% | | .71% | | .69% | | .70% | | .71% |
| Expenses net of fee waivers, if any | | 70% | | .71% | | .69% | | .70% | | .71% |
| Expenses net of all reductions | | 70% | | .71% | | .69% | | .70% | | .70% |
| Net investment income | | 6.98% | | 7.43% | | 8.25% | | 8.65%F | | 11.00%E,F |
| Supplemental Data | | | | | | | | | | |
| Net assets, end of period (000 omitted) | | $1,080,002 | | $1,371,736 | | $1,593,714 | | $1,145,562 | | $1,201,085 |
| Portfolio turnover rate | | 95% | | 128% | | 130% | | 96% | | 138% |
A Total returns do not reflect charges attributable to your insurance company’s separate account. Inclusion of these charges would reduce the total returns shown.
B Total returns would have been lower had certain expenses not been reduced during the periods shown.
C Calculated based on average shares outstanding during the period.
D Expense ratios reflect operating expenses of the class. Expenses before reductions do not reflect amounts reimbursed by the investment adviser or reductions from brokerage service arrangements or other expense offset arrangements and do not
represent the amount paid by the class during periods when reimbursements or reductions occur. Expenses net of fee waivers reflect expenses after reimbursement by the investment adviser but prior to reductions from brokerage service arrange
ments or other expense offset arrangements. Expenses net of all reductions represent the net expenses paid by the class.
E Effective January 1, 2001, the fund adopted the provisions of the AICPA Audit and Accounting Guide for Investment Companies and began amortizing premium and discount on all debt securities. Per share data and ratios for periods prior to adop
tion have not been restated to reflect this change.
F As a result of a revision to reflect accretion of market discount using the interest method, certain amounts for the years ended December 31, 2002 and December 31, 2001 have been reclassified from what was previously reported. The impact of
this change was a decrease to net investment income (loss) of $.017 and $.075 per share with a corresponding increase to net realized and unrealized gain (loss) per share, respectively. The ratio of net investment income (loss) to average net
assets decreased from 8.95% and 12.08% to 8.65% and 11.00%, respectively. The reclassification has no impact on the net assets of the fund.
|
| Financial Highlights Service Class | | | | | | | | | | |
| Years ended December 31, | | 2005 | | 2004 | | 2003 | | 2002 | | 2001 |
| Selected Per Share Data | | | | | | | | | | |
| Net asset value, beginning of period | | $ 6.97 | | $ 6.92 | | $ 5.91 | | $ 6.38 | | $ 8.15 |
| Income from Investment Operations | | | | | | | | | | |
| Net investment incomeC | | 448 | | .486 | | .513 | | .488F | | .758E,F |
| Net realized and unrealized gain (loss) | | (.283) | | .124 | | .967 | | (.288)F | | (1.538)E,F |
| Total from investment operations | | 165 | | .610 | | 1.480 | | .200 | | (.780) |
| Distributions from net investment income | | (.995) | | (.560) | | (.470) | | (.670) | | (.990) |
| Net asset value, end of period | | $ 6.14 | | $ 6.97 | | $ 6.92 | | $ 5.91 | | $ 6.38 |
| Total ReturnA,B | | 2.52% | | 9.47% | | 26.97% | | 3.62% | | (11.90)% |
| Ratios to Average Net AssetsD | | | | | | | | | | |
| Expenses before reductions | | 80% | | .81% | | .79% | | .80% | | .81% |
| Expenses net of fee waivers, if any | | 80% | | .81% | | .79% | | .80% | | .81% |
| Expenses net of all reductions | | 80% | | .81% | | .79% | | .80% | | .81% |
| Net investment income | | 6.88% | | 7.33% | | 8.15% | | 8.55%F | | 10.90%E,F |
| Supplemental Data | | | | | | | | | | |
| Net assets, end of period (000 omitted) | | $ 319,380 | | $ 377,122 | | $ 417,928 | | $ 260,489 | | $ 234,204 |
| Portfolio turnover rate | | 95% | | 128% | | 130% | | 96% | | 138% |
A Total returns do not reflect charges attributable to your insurance company’s separate account. Inclusion of these charges would reduce the total returns shown.
B Total returns would have been lower had certain expenses not been reduced during the periods shown.
C Calculated based on average shares outstanding during the period.
D Expense ratios reflect operating expenses of the class. Expenses before reductions do not reflect amounts reimbursed by the investment adviser or reductions from brokerage service arrangements or other expense offset arrangements and do not
represent the amount paid by the class during periods when reimbursements or reductions occur. Expenses net of fee waivers reflect expenses after reimbursement by the investment adviser but prior to reductions from brokerage service arrange
ments or other expense offset arrangements. Expenses net of all reductions represent the net expenses paid by the class.
E Effective January 1, 2001, the fund adopted the provisions of the AICPA Audit and Accounting Guide for Investment Companies and began amortizing premium and discount on all debt securities. Per share data and ratios for periods prior to adop
tion have not been restated to reflect this change.
F As a result of a revision to reflect accretion of market discount using the interest method, certain amounts for the years ended December 31, 2002 and December 31, 2001 have been reclassified from what was previously reported. The impact of
this change was a decrease to net investment income (loss) of $.017 and $.075 per share with a corresponding increase to net realized and unrealized gain (loss) per share, respectively. The ratio of net investment income (loss) to average net
assets decreased from 8.85% and 11.97% to 8.55% and 10.90%, respectively. The reclassification has no impact on the net assets of the fund.
|
See accompanying notes which are an integral part of the financial statements.
| | |
| VIP High Income Portfolio | | 134 |
| Financial Highlights Service Class 2 | | | | | | | | | | |
| Years ended December 31, | | 2005 | | 2004 | | 2003 | | 2002 | | 2001 |
| Selected Per Share Data | | | | | | | | | | |
| Net asset value, beginning of period | | $ 6.91 | | $ 6.87 | | $ 5.87 | | $ 6.36 | | $ 8.13 |
| Income from Investment Operations | | | | | | | | | | |
| Net investment incomeC | | 433 | | .470 | | .501 | | .472F | | .716E,F |
| Net realized and unrealized gain (loss) | | (.284) | | .130 | | .959 | | (.292)F | | (1.496)E,F |
| Total from investment operations | | 149 | | .600 | | 1.460 | | .180 | | (.780) |
| Distributions from net investment income | | (.979) | | (.560) | | (.460) | | (.670) | | (.990) |
| Net asset value, end of period | | $ 6.08 | | $ 6.91 | | $ 6.87 | | $ 5.87 | | $ 6.36 |
| Total ReturnA,B | | 2.31% | | 9.38% | | 26.75% | | 3.30% | | (11.93)% |
| Ratios to Average Net AssetsD | | | | | | | | | | |
| Expenses before reductions | | 95% | | .97% | | .95% | | .97% | | .98% |
| Expenses net of fee waivers, if any | | 95% | | .97% | | .95% | | .97% | | .98% |
| Expenses net of all reductions | | 95% | | .97% | | .95% | | .97% | | .98% |
| Net investment income | | 6.72% | | 7.17% | | 7.99% | | 8.38%F | | 10.73%E,F |
| Supplemental Data | | | | | | | | | | |
| Net assets, end of period (000 omitted) | | $ 86,757 | | $ 94,246 | | $ 76,383 | | $ 32,499 | | $ 16,508 |
| Portfolio turnover rate | | 95% | | 128% | | 130% | | 96% | | 138% |
A Total returns do not reflect charges attributable to your insurance company’s separate account. Inclusion of these charges would reduce the total returns shown.
B Total returns would have been lower had certain expenses not been reduced during the periods shown.
C Calculated based on average shares outstanding during the period.
D Expense ratios reflect operating expenses of the class. Expenses before reductions do not reflect amounts reimbursed by the investment adviser or reductions from brokerage service arrangements or other expense offset arrangements and do not
represent the amount paid by the class during periods when reimbursements or reductions occur. Expenses net of fee waivers reflect expenses after reimbursement by the investment adviser but prior to reductions from brokerage service arrange
ments or other expense offset arrangements. Expenses net of all reductions represent the net expenses paid by the class.
E Effective January 1, 2001, the fund adopted the provisions of the AICPA Audit and Accounting Guide for Investment Companies and began amortizing premium and discount on all debt securities. Per share data and ratios for periods prior to adop
tion have not been restated to reflect this change.
F As a result of a revision to reflect accretion of market discount using the interest method, certain amounts for the years ended December 31, 2002 and December 31, 2001 have been reclassified from what was previously reported. The impact of
this change was a decrease to net investment income (loss) of $.017 and $.072 per share with a corresponding increase to net realized and unrealized gain (loss) per share, respectively. The ratio of net investment income (loss) to average net
assets decreased from 8.68% and 11.81% to 8.38% and 10.73%, respectively. The reclassification has no impact on the net assets of the fund.
|
| Financial Highlights Initial Class R | | | | |
| Years ended December 31, | | 2005 | | 2004F |
| Selected Per Share Data | | | | |
| Net asset value, beginning of period | | $ 7.00 | | $ 6.47 |
| Income from Investment Operations | | | | |
| Net investment incomeE | | 455 | | .338 |
| Net realized and unrealized gain (loss) | | (.288) | | .192 |
| Total from investment operations | | 167 | | .530 |
| Distributions from net investment income | | (1.007) | | — |
| Net asset value, end of period | | $ 6.16 | | $ 7.00 |
| Total ReturnB,C,D | | 2.55% | | 8.19% |
| Ratios to Average Net AssetsG | | | | |
| Expenses before reductions | | 70% | | .71%A |
| Expenses net of fee waivers, if any | | 70% | | .71%A |
| Expenses net of all reductions | | 70% | | .71%A |
| Net investment income | | 6.98% | | 7.16%A |
| Supplemental Data | | | | |
| Net assets, end of period (000 omitted) | | $ 83 | | $ 81 |
| Portfolio turnover rate | | 95% | | 128% |
A Annualized
B Total returns for periods of less than one year are not annualized.
C Total returns do not reflect charges attributable to your insurance company’s separate account. Inclusion of these charges would reduce the total returns shown.
D Total returns would have been lower had certain expenses not been reduced during the periods shown.
E Calculated based on average shares outstanding during the period.
F For the period April 14, 2004 (commencement of sale of shares) to December 31, 2004.
G Expense ratios reflect operating expenses of the class. Expenses before reductions do not reflect amounts reimbursed by the investment adviser or reductions from brokerage service arrangements or other expense offset arrangements and do not
represent the amount paid by the class during periods when reimbursements or reductions occur. Expenses net of fee waivers reflect expenses after reimbursement by the investment adviser but prior to reductions from brokerage service arrange
ments or other expense offset arrangements. Expenses net of all reductions represent the net expenses paid by the class.
|
See accompanying notes which are an integral part of the financial statements.
|
135 Annual Report
| Financial Highlights Service Class R | | | | |
| Years ended December 31, | | 2005 | | 2004F |
| Selected Per Share Data | | | | |
| Net asset value, beginning of period | | $ 6.97 | | $ 6.45 |
| Income from Investment Operations | | | | |
| Net investment incomeE | | 447 | | .332 |
| Net realized and unrealized gain (loss) | | (.282) | | .188 |
| Total from investment operations | | 165 | | .520 |
| Distributions from net investment income | | (.995) | | — |
| Net asset value, end of period | | $ 6.14 | | $ 6.97 |
| Total ReturnB,C,D | | 2.53% | | 8.06% |
| Ratios to Average Net AssetsG | | | | |
| Expenses before reductions | | 80% | | .81%A |
| Expenses net of fee waivers, if any | | 80% | | .81%A |
| Expenses net of all reductions | | 80% | | .81%A |
| Net investment income | | 6.88% | | 7.05%A |
| Supplemental Data | | | | |
| Net assets, end of period (000 omitted) | | $ 83 | | $ 81 |
| Portfolio turnover rate | | 95% | | 128% |
A Annualized
B Total returns for periods of less than one year are not annualized.
C Total returns do not reflect charges attributable to your insurance company’s separate account. Inclusion of these charges would reduce the total returns shown.
D Total returns would have been lower had certain expenses not been reduced during the periods shown.
E Calculated based on average shares outstanding during the period.
F For the period April 14, 2004 (commencement of sale of shares) to December 31, 2004.
G Expense ratios reflect operating expenses of the class. Expenses before reductions do not reflect amounts reimbursed by the investment adviser or reductions from brokerage service arrangements or other expense offset arrangements and do not
represent the amount paid by the class during periods when reimbursements or reductions occur. Expenses net of fee waivers reflect expenses after reimbursement by the investment adviser but prior to reductions from brokerage service arrange
ments or other expense offset arrangements. Expenses net of all reductions represent the net expenses paid by the class.
|
| Financial Highlights Service Class 2R | | | | |
| Years ended December 31, | | 2005 | | 2004F |
| Selected Per Share Data | | | | |
| Net asset value, beginning of period | | $ 6.91 | | $ 6.40 |
| Income from Investment Operations | | | | |
| Net investment incomeE | | 433 | | .322 |
| Net realized and unrealized gain (loss) | | (.282) | | .188 |
| Total from investment operations | | 151 | | .510 |
| Distributions from net investment income | | (.981) | | — |
| Net asset value, end of period | | $ 6.08 | | $ 6.91 |
| Total ReturnB,C,D | | 2.33% | | 7.97% |
| Ratios to Average Net AssetsG | | | | |
| Expenses before reductions | | 94% | | .96%A |
| Expenses net of fee waivers, if any | | 94% | | .96%A |
| Expenses net of all reductions | | 94% | | .96%A |
| Net investment income | | 6.73% | | 6.90%A |
| Supplemental Data | | | | |
| Net assets, end of period (000 omitted) | | $ 83 | | $ 81 |
| Portfolio turnover rate | | 95% | | 128% |
A Annualized
B Total returns for periods of less than one year are not annualized.
C Total returns do not reflect charges attributable to your insurance company’s separate account. Inclusion of these charges would reduce the total returns shown.
D Total returns would have been lower had certain expenses not been reduced during the periods shown.
E Calculated based on average shares outstanding during the period.
F For the period April 14, 2004 (commencement of sale of shares) to December 31, 2004.
G Expense ratios reflect operating expenses of the class. Expenses before reductions do not reflect amounts reimbursed by the investment adviser or reductions from brokerage service arrangements or other expense offset arrangements and do not
represent the amount paid by the class during periods when reimbursements or reductions occur. Expenses net of fee waivers reflect expenses after reimbursement by the investment adviser but prior to reductions from brokerage service arrange
ments or other expense offset arrangements. Expenses net of all reductions represent the net expenses paid by the class.
|
See accompanying notes which are an integral part of the financial statements.
| | |
| VIP High Income Portfolio | | 136 |
| Financial Highlights Investor Class | | |
| Year ended December 31, | | 2005F |
| Selected Per Share Data | | |
| Net asset value, beginning of period | | $ 6.54 |
| Income from Investment Operations | | |
| Net investment incomeE | | 193 |
| Net realized and unrealized gain (loss) | | (.089) |
| Total from investment operations | | 104 |
| Distributions from net investment income | | (.484) |
| Net asset value, end of period | | $ 6.16 |
| Total ReturnB,C,D | | 1.60% |
| Ratios to Average Net AssetsG | | |
| Expenses before reductions | | 82%A |
| Expenses net of fee waivers, if any | | 82%A |
| Expenses net of all reductions | | 82%A |
| Net investment income | | 6.86%A |
| Supplemental Data | | |
| Net assets, end of period (000 omitted) | | $ 17,363 |
| Portfolio turnover rate | | 95% |
A Annualized
B Total returns for periods of less than one year are not annualized.
C Total returns do not reflect charges attributable to your insurance company’s separate account. Inclusion of these charges would reduce the total returns shown.
D Total returns would have been lower had certain expenses not been reduced during the periods shown.
E Calculated based on average shares outstanding during the period.
F For the period July 21, 2005 (commencement of sale of shares) to December 31, 2005.
G Expense ratios reflect operating expenses of the class. Expenses before reductions do not reflect amounts reimbursed by the investment adviser or reductions from brokerage service arrangements or other expense offset arrangements and do not
represent the amount paid by the class during periods when reimbursements or reductions occur. Expense ratios before reductions for start up periods may not be representative of longer term operating periods. Expenses net of fee waivers reflect
expenses after reimbursement by the investment adviser but prior to reductions from brokerage service arrangements or other expense offset arrangements. Expenses net of all reductions represent the net expenses paid by the class.
|
See accompanying notes which are an integral part of the financial statements.
|
137 Annual Report
VIP Investment Grade Bond Portfolio
Performance: The Bottom Line
|
Average annual total return reflects the change in the value of an investment, assuming reinvestment of the class’ dividend income and capital gains (the profits earned upon the sale of securities that have grown in value) and assuming a constant rate of performance each year. During periods of reimbursement by Fidelity, a fund’s total return will be greater than it would be had the reimbursement not occurred. Performance numbers are net of all underlying fund operating expenses, but do not include any insurance charges imposed by your insurance company’s separate account. If performance information included the effect of these additional charges, the total returns would have been lower. How a fund did yesterday is no guarantee of how it will do tomorrow.
| Average Annual Total Returns | | | | | | |
| Periods ended December 31, 2005 | | Past 1 | | Past 5 | | Past 10 |
| | | | | year | | years | | years |
| VIP Investment Grade Bond - Initial Class | | 2.19% | | 6.09% | | 6.12% |
| VIP Investment Grade Bond - Service Class A | | 2.08% | | 5.95% | | 6.05% |
| VIP Investment Grade Bond - Service Class 2 B | | 1.89% | | 5.80% | | 5.94% |
| VIP Investment Grade Bond - Investor Class C | | 2.11% | | 6.08% | | 6.12% |
| | A The initial offering of Service Class shares took place on July 7, 2000. Performance for Service Class shares reflects an asset based service fee (12b 1 fee), and returns
prior to July 7, 2000 are those of Initial Class and do not include the effects of Service Class’ 12b 1 fee. Had Service Class’ 12b 1 fee been reflected, returns prior to July 7, 2000
would have been lower.
B The initial offering of Service Class 2 shares took place on January 12, 2000. Performance for Service Class 2 shares reflects an asset based service fee (12b 1 fee), and returns
prior to January 12, 2000 are those of Initial Class and do not include the effects of Service Class 2’s 12b 1 fee. Had Service Class 2’s 12b 1 fee been reflected, returns prior to Janu
ary 12, 2000 would have been lower.
C The initial offering of Investor Class shares took place on July 21, 2005. Returns prior to July 21, 2005 are those of Initial Class. If Investor Class’s transfer agent fee had
been reflected, returns prior to July 21, 2005 would have been lower.
|
$10,000 Over 10 Years
Let’s say hypothetically that $10,000 was invested in VIP Investment Grade Bond Portfolio Initial Class on December 31, 1995. The chart shows how the value of your investment would have changed, and also shows how the Lehman Brothers® Aggregate Bond Index performed over the same period.
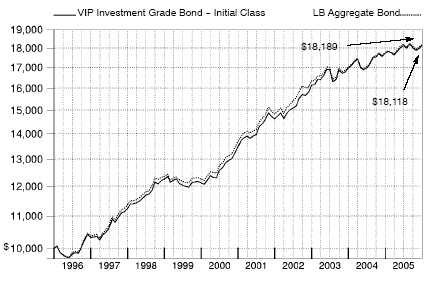
VIP Investment Grade Bond Portfolio 138
VIP Investment Grade Bond Portfolio
Management’s Discussion of Fund Performance
|
Comments from Ford O’Neil, Portfolio Manager of VIP Investment Grade Bond Portfolio
The investment grade bond market ended 2005 in the black, marking six consecutive years of gains for the asset class. However, the 2.43% advance of the Lehman Brothers® Aggregate Bond Index was the lowest return of that streak, which reflects the trying investment conditions bonds encountered during the year. Two of the most challenging tests that bonds can face higher interest rates and rising inflation were prevalent themes in 2005. The Federal Reserve Board hiked short term interest rates eight times during the year, but long term rates barely budged, hurting flows into the market as investors began to find money market yields increasingly attractive. Meanwhile, inflation levels accelerated along with record high prices for oil, which reached $70 per barrel after Hurricane Katrina devastated the Gulf Coast’s production and refining facilities. On the upside, core inflation which excludes volatile energy and food prices remained relatively tame, and quarterly gross domestic product (GDP) growth showed the economy was solid, but not overheated. Amid the uncertainty, Treasuries outperformed corporate, agency and mortgage backed debt.
During the past year, the fund marginally trailed the Lehman Brothers index and was roughly in line with the LipperSM Variable Annuity Intermediate Investment Grade Debt Funds Average, which returned 1.99% . (For specific portfolio performance results, please refer to the performance section of this report.) A major contributor to the fund’s performance was advantageous sector allocation. Our investments outside of the index in high quality spread sectors, particularly asset backed securities and collateralized mortgage obligations, saw solid gains due to robust demand for higher yielding alterna tives to U.S. Treasury securities. Modest out of index positions in foreign government bonds, including those issued in Chile, Malaysia and Mexico, also worked out well, bolstered by the perceived improvement in the fiscal and economic health of these emerging markets countries. Performance was further aided by a large position in the Fidelity® Ultra Short Central Fund, a diversified internal pool of short term assets designed to outperform cash like instruments with similar risk characteristics. My decision to maintain a much smaller stake than the index in Treasuries detracted from results, as they performed surprisingly well thanks to strong demand for longer maturity bonds in the sector. An out of benchmark position in Treasury Inflation Protected Securities (TIPS) helped erase some of what we lost from heavily underweighting plain vanilla Treasuries. Security selection within the corporate sector was another modest detractor. Although the fund benefited from some successful holdings, particularly investments in utilities and real estate investment trusts (REITs), these gains were offset by losses in poor performing auto manufacturers. Unfavorable security selection within the corporate sector was somewhat offset by my decision to modestly underweight the sector compared with the Lehman Brothers index.
The views expressed in this statement reflect those of the portfolio manager only through the end of the period of the report as stated on the cover and do not necessarily represent the views of Fidelity or any other person in the Fidelity organization. Any such views are subject to change at any time based upon market or other conditions and Fidelity disclaims any responsibility to update such views. These views may not be relied on as invest ment advice and, because investment decisions for a Fidelity fund are based on numerous factors, may not be relied on as an indication of trading intent on behalf of any Fidelity fund.
139 139 Annual Report
VIP Investment Grade Bond Portfolio
Investment Changes
|
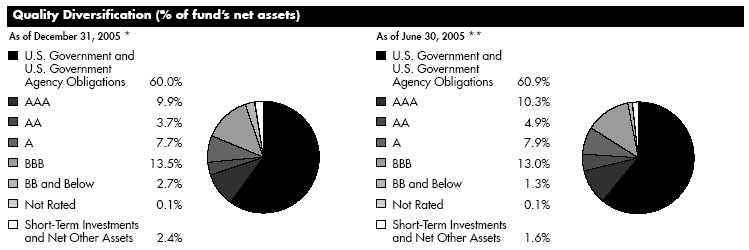
We have used ratings from Moody’s® Investors Services, Inc. Where Moody’s ratings are not available, we have used S&P® ratings. Securities rated BB or below were rated investment grade at the time of acquisition.
| Average Years to Maturity as of December 31, 2005 | | | | |
| | | | | | | 6 months ago |
| Years | | | | 6.2 | | 5.8 |
Average years to maturity is based on the average time remaining until principal payments are expected from each of the fund’s bonds, weighted by dollar amount.
| Duration as of December 31, 2005 | | | | |
| | | | | | | 6 months ago |
| Years | | | | 4.3 | | 3.9 |
Duration shows how much a bond fund’s price fluctuates with changes in comparable interest rates. If rates rise 1%, for example, a fund with a five year duration is likely to lose about 5% of its value. Other factors also can influence a bond fund’s performance and share price. Accordingly, a bond fund’s actual performance may differ from this example.

For an unaudited list of holdings for each fixed income central fund, visit advisor.fidelity.com.
The information in the above tables is based on the combined investments of the fund and its pro rata share of the investments of Fidelity’s fixed income central funds.
VIP Investment Grade Bond Portfolio 140
| VIP Investment Grade Bond Portfolio | | | | | | |
| Investments December 31, 2005 | | | | |
| Showing Percentage of Net Assets | | | | | | |
| |
| Nonconvertible Bonds 17.7% | | | | | | |
| | | | | | | Principal | | Value |
| | | | | | | Amount | | (Note 1) |
| |
| CONSUMER DISCRETIONARY 1.9% | | | | | | |
| Automobiles – 0.4% | | | | | | | | |
| Ford Motor Co.: | | | | | | | | |
| 6.625% 10/1/28 | | | | | | $ 6,850,000 | | $ 4,418,250 |
| 7.45% 7/16/31 | | | | | | 4,675,000 | | 3,179,000 |
| | | | | | | | | 7,597,250 |
| Media 1.3% | | | | | | | | |
| AOL Time Warner, Inc.: | | | | | | | | |
| 6.875% 5/1/12 | | | | | | 485,000 | | 516,273 |
| 7.625% 4/15/31 | | | | | | 1,000,000 | | 1,113,649 |
| Cox Communications, Inc.: | | | | | | | | |
| 4.625% 1/15/10 | | | | | | 3,350,000 | | 3,242,978 |
| 7.125% 10/1/12 | | | | | | 785,000 | | 841,109 |
| Liberty Media Corp.: | | | | | | | | |
| 5.7% 5/15/13 | | | | | | 2,500,000 | | 2,331,250 |
| 8.25% 2/1/30 | | | | | | 2,465,000 | | 2,415,345 |
| News America Holdings, Inc. 7.75% 12/1/45 | | | | 1,190,000 | | 1,364,259 |
| News America, Inc. 6.2% 12/15/34 | | | | 2,310,000 | | 2,294,523 |
| Time Warner Entertainment Co. LP 8.375% 7/15/33 | | | | 5,000,000 | | 5,906,290 |
| Time Warner, Inc. 6.625% 5/15/29 | | | | 1,745,000 | | 1,742,548 |
| | | | | | | | | 21,768,224 |
| Multiline Retail – 0.2% | | | | | | | | |
| The May Department Stores Co. 6.7% 7/15/34 | | | | 2,655,000 | | 2,827,822 |
| |
| TOTAL CONSUMER DISCRETIONARY | | | | | | 32,193,296 |
| |
| CONSUMER STAPLES 0.4% | | | | | | | | |
| Beverages 0.1% | | | | | | | | |
| FBG Finance Ltd. 5.125% 6/15/15 (a) | | | | 1,860,000 | | 1,809,620 |
| Food Products – 0.1% | | | | | | | | |
| H.J. Heinz Co. 6.428% 12/1/08 (a)(f) | | | | 1,885,000 | | 1,936,404 |
| Tobacco – 0.2% | | | | | | | | |
| Altria Group, Inc. 7% 11/4/13 | | | | | | 495,000 | | 541,650 |
| Philip Morris Companies, Inc. 7.65% 7/1/08 | | | | 2,500,000 | | 2,647,835 |
| | | | | | | | | 3,189,485 |
| |
| TOTAL CONSUMER STAPLES | | | | | | | | 6,935,509 |
| |
| ENERGY 2.0% | | | | | | | | |
| Energy Equipment & Services – 0.3% | | | | | | |
| Petronas Capital Ltd. 7% 5/22/12 (a) | | | | 4,320,000 | | 4,755,529 |
See accompanying notes which are an integral part of the financial statements.
|
141 Annual Report
141
| VIP Investment Grade Bond Portfolio | | | | |
| Investments - continued | | | | |
| |
| |
| |
| | | Principal | | Value |
| | | Amount | | (Note 1) |
| Oil, Gas & Consumable Fuels 1.7% | | | | |
| Amerada Hess Corp. 6.65% 8/15/11 | | $ 710,000 | | $ 762,932 |
| Duke Capital LLC: | | | | |
| 6.25% 2/15/13 | | 805,000 | | 838,346 |
| 6.75% 2/15/32 | | 4,610,000 | | 5,016,851 |
| Empresa Nacional de Petroleo 6.75% 11/15/12 (a) | | 5,050,000 | | 5,437,335 |
| Enterprise Products Operating LP 5.75% 3/1/35 | | 1,500,000 | | 1,379,172 |
| Kerr McGee Corp. 6.95% 7/1/24 | | 1,000,000 | | 1,060,682 |
| Kinder Morgan Energy Partners LP: | | | | |
| 5.125% 11/15/14 | | 600,000 | | 586,809 |
| 5.8% 3/15/35 | | 1,500,000 | | 1,434,908 |
| Nexen, Inc. 5.875% 3/10/35 | | 2,740,000 | | 2,694,294 |
| Pemex Project Funding Master Trust: | | | | |
| 6.125% 8/15/08 | | 3,630,000 | | 3,702,600 |
| 6.625% 6/15/35 (a) | | 3,405,000 | | 3,413,513 |
| 7.375% 12/15/14 | | 2,000,000 | | 2,222,000 |
| 7.875% 2/1/09 (f) | | 1,200,000 | | 1,283,400 |
| | | | | 29,832,842 |
| |
| TOTAL ENERGY | | | | 34,588,371 |
| |
| FINANCIALS – 7.5% | | | | |
| Capital Markets 1.2% | | | | |
| Goldman Sachs Group, Inc.: | | | | |
| 5.25% 10/15/13 | | 3,270,000 | | 3,269,212 |
| 5.7% 9/1/12 | | 2,935,000 | | 3,019,170 |
| Lazard Group LLC 7.125% 5/15/15 | | 2,815,000 | | 2,956,003 |
| Merrill Lynch & Co., Inc. 4.25% 2/8/10 | | 4,985,000 | | 4,849,029 |
| Morgan Stanley 6.6% 4/1/12 | | 5,695,000 | | 6,121,373 |
| | | | | 20,214,787 |
| Commercial Banks – 1.0% | | | | |
| Bank of America Corp. 7.4% 1/15/11 | | 5,680,000 | | 6,256,656 |
| Corporacion Andina de Fomento 5.2% 5/21/13 | | 1,560,000 | | 1,553,676 |
| Korea Development Bank 3.875% 3/2/09 | | 3,500,000 | | 3,386,387 |
| SouthTrust Corp. 5.8% 6/15/14 | | 1,440,000 | | 1,499,106 |
| Wachovia Bank NA 4.875% 2/1/15 | | 1,455,000 | | 1,418,941 |
| Wachovia Corp. 5.5% 8/1/35 | | 3,790,000 | | 3,692,635 |
| | | | | 17,807,401 |
| Consumer Finance – 0.7% | | | | |
| Capital One Financial Corp.: | | | | |
| 4.8% 2/21/12 | | 700,000 | | 679,150 |
| 5.5% 6/1/15 | | 2,000,000 | | 1,988,298 |
| Ford Motor Credit Co. 7.375% 2/1/11 | | 2,500,000 | | 2,191,295 |
See accompanying notes which are an integral part of the financial statements.
| | |
| VIP Investment Grade Bond Portfolio | | 142 |
| Nonconvertible Bonds continued | | | | |
| | | Principal | | Value |
| | | Amount | | (Note 1) |
| |
| FINANCIALS – continued | | | | |
| Consumer Finance – continued | | | | |
| Household Finance Corp. 4.125% 11/16/09 | | $ 2,085,000 | | $ 2,013,045 |
| Household International, Inc. 5.836% 2/15/08 | | 3,775,000 | | 3,837,544 |
| MBNA Corp. 7.5% 3/15/12 | | 1,205,000 | | 1,357,230 |
| | | | | 12,066,562 |
| Diversified Financial Services – 1.2% | | | | |
| Alliance Capital Management LP 5.625% 8/15/06 | | 2,475,000 | | 2,485,239 |
| JPMorgan Chase & Co. 5.75% 1/2/13 | | 3,500,000 | | 3,609,494 |
| JPMorgan Chase Capital XVII 5.85% 8/1/35 | | 8,310,000 | | 8,221,939 |
| Prime Property Funding, Inc. 5.125% 6/1/15 (a) | | 2,230,000 | | 2,156,403 |
| ZFS Finance USA Trust II 6.45% 12/15/65 (a)(f) | | 3,400,000 | | 3,447,260 |
| | | | | 19,920,335 |
| Insurance – 0.6% | | | | |
| Axis Capital Holdings Ltd. 5.75% 12/1/14 | | 1,505,000 | | 1,505,322 |
| Marsh & McLennan Companies, Inc. 7.125% 6/15/09 | | 3,109,000 | | 3,291,125 |
| Principal Life Global Funding I 6.25% 2/15/12 (a) | | 1,350,000 | | 1,434,000 |
| The St. Paul Travelers Companies, Inc. 5.5% 12/1/15 | | 4,060,000 | | 4,089,220 |
| | | | | 10,319,667 |
| Real Estate 2.2% | | | | |
| Archstone Smith Operating Trust 5.25% 5/1/15 | | 3,270,000 | | 3,224,773 |
| Arden Realty LP 7% 11/15/07 | | 5,000,000 | | 5,186,445 |
| AvalonBay Communities, Inc. 5% 8/1/07 | | 2,315,000 | | 2,314,169 |
| CarrAmerica Realty Corp.: | | | | |
| 5.125% 9/1/11 | | 4,255,000 | | 4,170,564 |
| 5.5% 12/15/10 | | 2,355,000 | | 2,351,416 |
| Colonial Properties Trust 5.5% 10/1/15 | | 3,645,000 | | 3,552,851 |
| Developers Diversified Realty Corp.: | | | | |
| 5% 5/3/10 | | 1,625,000 | | 1,601,064 |
| 5.25% 4/15/11 | | 925,000 | | 915,676 |
| EOP Operating LP: | | | | |
| 4.65% 10/1/10 | | 6,570,000 | | 6,365,745 |
| 7% 7/15/11 | | 1,725,000 | | 1,846,342 |
| Simon Property Group LP: | | | | |
| 5.1% 6/15/15 | | 2,120,000 | | 2,050,369 |
| 5.625% 8/15/14 | | 2,985,000 | | 3,005,304 |
| | | | | 36,584,718 |
See accompanying notes which are an integral part of the financial statements.
|
143 Annual Report
143
| VIP Investment Grade Bond Portfolio | | | | |
| Investments - continued | | | | |
| |
| |
| |
| | | Principal | | Value |
| | | Amount | | (Note 1) |
| Thrifts & Mortgage Finance – 0.6% | | | | |
| Countrywide Home Loans, Inc. 4% 3/22/11 | | $ 1,435,000 | | $ 1,350,246 |
| Independence Community Bank Corp. 3.75% 4/1/14 (f) | | 2,495,000 | | 2,389,926 |
| Residential Capital Corp. 6.375% 6/30/10 | | 2,830,000 | | 2,875,605 |
| Washington Mutual, Inc. 4.625% 4/1/14 | | 3,500,000 | | 3,291,260 |
| | | | | 9,907,037 |
| |
| TOTAL FINANCIALS | | | | 126,820,507 |
| |
| INDUSTRIALS – 1.1% | | | | |
| Aerospace & Defense – 0.3% | | | | |
| BAE Systems Holdings, Inc. 4.75% 8/15/10 (a) | | 2,310,000 | | 2,268,635 |
| Bombardier, Inc.: | | | | |
| 6.3% 5/1/14 (a) | | 2,445,000 | | 2,139,375 |
| 7.45% 5/1/34 (a) | | 840,000 | | 709,800 |
| | | | | 5,117,810 |
| Airlines – 0.6% | | | | |
| American Airlines, Inc. pass thru trust certificates: | | | | |
| 6.855% 10/15/10 | | 260,817 | | 265,346 |
| 6.978% 10/1/12 | | 565,767 | | 583,279 |
| 7.024% 4/15/11 | | 1,450,000 | | 1,486,670 |
| 7.858% 4/1/13 | | 2,325,000 | | 2,451,390 |
| Continental Airlines, Inc. pass thru trust certificates 6.795% 2/2/20 | | 3,373,967 | | 3,036,571 |
| Delta Air Lines, Inc. pass thru trust certificates: | | | | |
| 7.111% 3/18/13 | | 1,290,000 | | 1,270,650 |
| 7.57% 11/18/10 | | 1,335,000 | | 1,315,368 |
| | | | | 10,409,274 |
| Industrial Conglomerates 0.2% | | | | |
| Hutchison Whampoa International 03/13 Ltd. 6.5% 2/13/13 (a) | | 830,000 | | 878,916 |
| Hutchison Whampoa International 03/33 Ltd. 7.45% 11/24/33 (a) | | 1,630,000 | | 1,882,712 |
| | | | | 2,761,628 |
| |
| TOTAL INDUSTRIALS | | | | 18,288,712 |
| |
| INFORMATION TECHNOLOGY 0.2% | | | | |
| Semiconductors & Semiconductor Equipment – 0.2% | | | | |
| Chartered Semiconductor Manufacturing Ltd. 6.375% 8/3/15 | | 3,295,000 | | 3,275,935 |
| |
| MATERIALS 0.2% | | | | |
| Metals & Mining – 0.1% | | | | |
| Newmont Mining Corp. 5.875% 4/1/35 | | 2,000,000 | | 1,973,644 |
See accompanying notes which are an integral part of the financial statements.
| | |
| VIP Investment Grade Bond Portfolio | | 144 |
| Nonconvertible Bonds continued | | | | |
| | | Principal | | Value |
| | | Amount | | (Note 1) |
| |
| MATERIALS – continued | | | | |
| Paper & Forest Products 0.1% | | | | |
| International Paper Co. 4.25% 1/15/09 | | $ 1,330,000 | | $ 1,290,800 |
| |
| TOTAL MATERIALS | | | | 3,264,444 |
| |
| TELECOMMUNICATION SERVICES 2.2% | | | | |
| Diversified Telecommunication Services – 2.0% | | | | |
| AT&T Broadband Corp. 8.375% 3/15/13 | | 1,500,000 | | 1,736,216 |
| BellSouth Capital Funding Corp. 7.875% 2/15/30 | | 1,920,000 | | 2,317,855 |
| BellSouth Corp. 5.2% 9/15/14 | | 2,285,000 | | 2,272,830 |
| British Telecommunications PLC 8.875% 12/15/30 | | 3,000,000 | | 4,013,826 |
| SBC Communications, Inc. 6.45% 6/15/34 | | 2,995,000 | | 3,116,519 |
| Sprint Capital Corp.: | | | | |
| 6.875% 11/15/28 | | 3,040,000 | | 3,321,778 |
| 8.375% 3/15/12 | | 1,745,000 | | 2,022,390 |
| Telecom Italia Capital: | | | | |
| 4.95% 9/30/14 | | 1,175,000 | | 1,122,228 |
| 5.25% 11/15/13 | | 4,500,000 | | 4,415,733 |
| Verizon Global Funding Corp.: | | | | |
| 5.85% 9/15/35 | | 3,370,000 | | 3,247,575 |
| 7.75% 12/1/30 | | 5,000,000 | | 5,943,285 |
| Verizon New York, Inc. 6.875% 4/1/12 | | 745,000 | | 776,610 |
| | | | | 34,306,845 |
| Wireless Telecommunication Services – 0.2% | | | | |
| America Movil SA de CV 4.125% 3/1/09 | | 1,185,000 | | 1,151,820 |
| AT&T Wireless Services, Inc. 7.875% 3/1/11 | | 1,070,000 | | 1,200,600 |
| | | | | 2,352,420 |
| |
| TOTAL TELECOMMUNICATION SERVICES | | | | 36,659,265 |
| |
| UTILITIES 2.2% | | | | |
| Electric Utilities – 1.4% | | | | |
| Cleveland Electric Illuminating Co. 5.65% 12/15/13 | | 3,260,000 | | 3,323,352 |
| Exelon Corp.: | | | | |
| 4.9% 6/15/15 | | 3,385,000 | | 3,230,586 |
| 5.625% 6/15/35 | | 935,000 | | 881,125 |
| 6.75% 5/1/11 | | 1,255,000 | | 1,336,099 |
| FirstEnergy Corp. 6.45% 11/15/11 | | 2,115,000 | | 2,241,894 |
| Monongahela Power Co. 5% 10/1/06 | | 2,260,000 | | 2,258,852 |
See accompanying notes which are an integral part of the financial statements.
|
145 Annual Report
145
| VIP Investment Grade Bond Portfolio | | | | | | |
| Investments - continued | | | | | | |
| |
| |
| |
| | | | | Principal | | Value |
| | | | | Amount | | (Note 1) |
| Progress Energy, Inc. 7.1% 3/1/11 | | | | $ 4,660,000 | | $ 5,027,767 |
| TXU Energy Co. LLC 7% 3/15/13 | | | | 4,525,000 | | 4,822,130 |
| | | | | | | 23,121,805 |
| Independent Power Producers & Energy Traders 0.3% | | | | | | |
| Constellation Energy Group, Inc. 7% 4/1/12 | | | | 3,565,000 | | 3,889,714 |
| TXU Corp. 5.55% 11/15/14 | | | | 980,000 | | 935,617 |
| | | | | | | 4,825,331 |
| Multi-Utilities – 0.5% | | | | | | |
| Dominion Resources, Inc.: | | | | | | |
| 4.75% 12/15/10 | | | | 2,355,000 | | 2,301,530 |
| 5.95% 6/15/35 | | | | 2,690,000 | | 2,625,674 |
| 6.25% 6/30/12 | | | | 2,275,000 | | 2,380,121 |
| MidAmerican Energy Holdings, Inc. 5.875% 10/1/12 | | | | 1,605,000 | | 1,656,943 |
| | | | | | | 8,964,268 |
| |
| TOTAL UTILITIES | | | | | | 36,911,404 |
| |
| TOTAL NONCONVERTIBLE BONDS | | | | | | |
| (Cost $299,095,268) | | | | | | 298,937,443 |
| |
| U.S. Government and Government Agency Obligations 22.8% | | | | |
| |
| U.S. Government Agency Obligations – 3.8% | | | | | | |
| Fannie Mae: | | | | | | |
| 2.5% 6/15/06 | | | | 2,185,000 | | 2,164,669 |
| 3.25% 1/15/08 | | | | 8,515,000 | | 8,271,837 |
| 4.625% 5/1/13 | | | | 12,000,000 | | 11,654,316 |
| 5.25% 8/1/12 | | | | 10,000,000 | | 10,095,920 |
| 5.5% 3/15/11 | | | | 7,395,000 | | 7,643,820 |
| Freddie Mac: | | | | | | |
| 4% 6/12/13 | | | | 4,640,000 | | 4,386,610 |
| 5.75% 1/15/12 | | | | 7,740,000 | | 8,120,901 |
| 5.875% 3/21/11 | | | | 6,035,000 | | 6,288,705 |
| 6.625% 9/15/09 | | | | 3,000,000 | | 3,187,326 |
| 6.75% 3/15/31 | | | | 2,459,000 | | 3,082,256 |
| Government Loan Trusts (assets of Trust guaranteed by U.S. Government through Agency for International Development) | | | | |
| Series 1 B, 8.5% 4/1/06 | | | | 160,823 | | 164,140 |
| Guaranteed Export Trust Certificates (assets of Trust guaranteed by U.S. Government through Export Import Bank) Series | | | | |
| 1994 A, 7.12% 4/15/06 | | | | 607 | | 609 |
| Guaranteed Trade Trust Certificates (assets of Trust guaranteed by U.S. Government through Export Import Bank) Series | | | | |
| 1994 B, 7.5% 1/26/06 | | | | 320 | | 323 |
| |
| TOTAL U.S. GOVERNMENT AGENCY OBLIGATIONS | | | | | | 65,061,432 |
See accompanying notes which are an integral part of the financial statements.
| | |
| VIP Investment Grade Bond Portfolio | | 146 |
| U.S. Government and Government Agency Obligations continued | | | | |
| | | | | | | Principal | | Value |
| | | | | | | Amount | | (Note 1) |
| U.S. Treasury Inflation Protected Obligations – 5.1% | | | | | | | | |
| U.S. Treasury Inflation Indexed Bonds 2.375% 1/15/25 | | | | | | $ 21,134,200 | | $ 22,244,200 |
| U.S. Treasury Inflation Indexed Notes: | | | | | | | | |
| 0.875% 4/15/10 | | | | | | 15,771,300 | | 14,997,750 |
| 2% 1/15/14 | | | | | | 48,510,000 | | 48,241,350 |
| |
| TOTAL U.S. TREASURY INFLATION PROTECTED OBLIGATIONS | | | | | | | | 85,483,300 |
| U.S. Treasury Obligations – 13.9% | | | | | | | | |
| U.S. Treasury Bonds 6.25% 5/15/30 | | | | | | 5,610,000 | | 6,967,356 |
| U.S. Treasury Notes: | | | | | | | | |
| 3.375% 12/15/08 | | | | | | 65,000,000 | | 63,209,965 |
| 3.375% 10/15/09 | | | | | | 20,000,000 | | 19,313,280 |
| 3.625% 4/30/07 | | | | | | 27,312,000 | | 27,026,071 |
| 3.875% 7/31/07 | | | | | | 13,796,000 | | 13,683,908 |
| 4.25% 8/15/13 | | | | | | 45,417,000 | | 45,010,745 |
| 4.375% 12/15/10 | | | | | | 6,110,000 | | 6,114,772 |
| 4.75% 5/15/14 | | | | | | 50,810,000 | | 52,046,512 |
| 6.5% 2/15/10 | | | | | | 2,500,000 | | 2,696,778 |
| |
| TOTAL U.S. TREASURY OBLIGATIONS | | | | | | | | 236,069,387 |
| |
| TOTAL U.S. GOVERNMENT AND GOVERNMENT AGENCY OBLIGATIONS | | | | |
| (Cost $389,224,224) | | | | | | | | 386,614,119 |
| |
| U.S. Government Agency Mortgage Securities 33.3% | | | | | | |
| |
| Fannie Mae – 31.2% | | | | | | | | |
| 3.477% 4/1/34 (f) | | | | | | 545,408 | | 542,004 |
| 3.726% 1/1/35 (f) | | | | | | 377,519 | | 372,062 |
| 3.752% 10/1/33 (f) | | | | | | 246,245 | | 240,547 |
| 3.76% 12/1/34 (f) | | | | | | 283,447 | | 279,510 |
| 3.787% 12/1/34 (f) | | | | | | 68,825 | | 67,912 |
| 3.793% 6/1/34 (f) | | | | | | 1,089,289 | | 1,049,845 |
| 3.82% 6/1/33 (f) | | | | | | 192,592 | | 189,208 |
| 3.83% 1/1/35 (f) | | | | | | 248,708 | | 245,577 |
| 3.847% 1/1/35 (f) | | | | | | 698,184 | | 689,227 |
| 3.869% 1/1/35 (f) | | | | | | 418,020 | | 417,170 |
| 3.889% 12/1/34 (f) | | | | | | 221,199 | | 220,946 |
| 3.906% 10/1/34 (f) | | | | | | 302,872 | | 299,488 |
| 3.952% 5/1/34 (f) | | | | | | 86,217 | | 87,509 |
| 3.964% 1/1/35 (f) | | | | | | 320,688 | | 317,832 |
| 3.968% 5/1/33 (f) | | | | | | 89,611 | | 88,413 |
| 3.983% 12/1/34 (f) | | | | | | 1,597,919 | | 1,592,520 |
| 3.984% 12/1/34 (f) | | | | | | 304,021 | | 302,221 |
| 3.991% 12/1/34 (f) | | | | | | 251,581 | | 250,067 |
| 3.993% 1/1/35 (f) | | | | | | 187,770 | | 186,421 |
See accompanying notes which are an integral part of the financial statements.
|
147 Annual Report
147
| VIP Investment Grade Bond Portfolio | | | | |
| Investments - continued | | | | |
| |
| |
| |
| | | Principal | | Value |
| | | Amount | | (Note 1) |
| 4% 8/1/18 to 10/1/18 | | $ 1,273,174 | | $ 1,218,045 |
| 4% 12/1/20 (b)(c) | | 5,000,000 | | 4,773,438 |
| 4.002% 2/1/35 (f) | | 223,794 | | 221,761 |
| 4.023% 12/1/34 (f) | | 147,252 | | 146,129 |
| 4.029% 2/1/35 (f) | | 217,879 | | 215,691 |
| 4.034% 10/1/18 (f) | | 234,450 | | 230,102 |
| 4.037% 1/1/35 (f) | | 102,543 | | 101,889 |
| 4.057% 1/1/35 (f) | | 210,450 | | 208,025 |
| 4.064% 4/1/33 (f) | | 84,625 | | 84,027 |
| 4.066% 12/1/34 (f) | | 430,132 | | 427,884 |
| 4.079% 1/1/35 (f) | | 432,083 | | 428,861 |
| 4.095% 2/1/35 (f) | | 157,011 | | 155,913 |
| 4.099% 2/1/35 (f) | | 388,015 | | 384,571 |
| 4.101% 2/1/35 (f) | | 158,013 | | 156,631 |
| 4.105% 2/1/35 (f) | | 800,944 | | 794,751 |
| 4.111% 1/1/35 (f) | | 435,559 | | 431,193 |
| 4.12% 11/1/34 (f) | | 363,944 | | 361,013 |
| 4.122% 1/1/35 (f) | | 793,653 | | 786,476 |
| 4.123% 1/1/35 (f) | | 444,907 | | 443,545 |
| 4.126% 2/1/35 (f) | | 505,149 | | 503,793 |
| 4.144% 1/1/35 (f) | | 655,070 | | 655,694 |
| 4.161% 2/1/35 (f) | | 400,365 | | 396,718 |
| 4.176% 11/1/34 (f) | | 119,982 | | 119,086 |
| 4.176% 1/1/35 (f) | | 1,195,902 | | 1,186,514 |
| 4.185% 1/1/35 (f) | | 496,654 | | 487,314 |
| 4.205% 3/1/34 (f) | | 216,414 | | 213,290 |
| 4.214% 10/1/34 (f) | | 617,417 | | 617,212 |
| 4.25% 2/1/35 (f) | | 245,208 | | 240,115 |
| 4.278% 2/1/35 (f) | | 143,961 | | 142,556 |
| 4.288% 8/1/33 (f) | | 496,873 | | 491,184 |
| 4.291% 1/1/35 (f) | | 246,528 | | 243,585 |
| 4.292% 3/1/33 (f) | | 299,346 | | 297,242 |
| 4.298% 7/1/34 (f) | | 193,739 | | 194,417 |
| 4.299% 3/1/35 (f) | | 232,680 | | 230,890 |
| 4.301% 10/1/34 (f) | | 71,906 | | 72,401 |
| 4.308% 5/1/35 (f) | | 345,407 | | 341,456 |
| 4.313% 3/1/33 (f) | | 131,587 | | 129,128 |
| 4.327% 12/1/34 (f) | | 170,377 | | 170,108 |
| 4.33% 10/1/33 (f) | | 116,846 | | 115,641 |
| 4.332% 1/1/35 (f) | | 282,550 | | 278,614 |
| 4.342% 6/1/33 (f) | | 137,809 | | 136,074 |
| 4.348% 1/1/35 (f) | | 247,031 | | 242,700 |
| 4.367% 2/1/34 (f) | | 590,037 | | 581,201 |
| 4.374% 4/1/35 (f) | | 162,062 | | 159,806 |
| 4.394% 2/1/35 (f) | | 384,478 | | 377,594 |
| 4.409% 5/1/35 (f) | | 722,228 | | 714,254 |
| 4.442% 10/1/34 (f) | | 1,304,089 | | 1,304,587 |
| 4.445% 3/1/35 (f) | | 340,051 | | 334,668 |
| 4.447% 4/1/34 (f) | | 384,787 | | 382,987 |
| 4.467% 8/1/34 (f) | | 771,637 | | 762,769 |
| 4.48% 1/1/35 (f) | | 384,162 | | 382,430 |
| 4.481% 5/1/35 (f) | | 252,604 | | 249,073 |
| 4.497% 3/1/35 (f) | | 800,182 | | 787,221 |
See accompanying notes which are an integral part of the financial statements.
| | |
| VIP Investment Grade Bond Portfolio | | 148 |
| U.S. Government Agency Mortgage Securities continued | | | | |
| | | | | | | Principal | | Value |
| | | | | | | Amount | | (Note 1) |
| Fannie Mae – continued | | | | | | | | |
| 4.5% 11/1/19 to 3/1/35 | | | | | | $ 41,092,357 | | $ 39,542,588 |
| 4.5% 1/1/21 (b) | | | | | | 91,434,930 | | 88,949,043 |
| 4.512% 10/1/35 (f) | | | | | | 92,517 | | 91,862 |
| 4.52% 8/1/34 (f) | | | | | | 1,653,821 | | 1,664,189 |
| 4.522% 3/1/35 (f) | | | | | | 734,852 | | 724,301 |
| 4.545% 2/1/35 (f) | | | | | | 1,639,885 | | 1,631,643 |
| 4.545% 7/1/35 (f) | | | | | | 893,565 | | 886,957 |
| 4.55% 2/1/35 (f) | | | | | | 257,299 | | 255,109 |
| 4.559% 1/1/35 (f) | | | | | | 522,658 | | 520,658 |
| 4.56% 2/1/35 (f) | | | | | | 161,984 | | 161,141 |
| 4.571% 9/1/34 (f) | | | | | | 1,003,249 | | 995,133 |
| 4.584% 2/1/35 (f) | | | | | | 2,350,877 | | 2,323,225 |
| 4.607% 8/1/34 (f) | | | | | | 351,132 | | 348,891 |
| 4.607% 2/1/35 (f) | | | | | | 764,824 | | 756,542 |
| 4.627% 1/1/33 (f) | | | | | | 167,566 | | 166,099 |
| 4.629% 9/1/34 (f) | | | | | | 93,971 | | 93,351 |
| 4.642% 11/1/34 (f) | | | | | | 805,723 | | 800,115 |
| 4.653% 3/1/35 (f) | | | | | | 128,445 | | 128,384 |
| 4.674% 11/1/34 (f) | | | | | | 880,849 | | 874,322 |
| 4.695% 3/1/35 (f) | | | | | | 2,070,883 | | 2,063,414 |
| 4.703% 2/1/33 (f) | | | | | | 51,676 | | 51,612 |
| 4.71% 10/1/32 (f) | | | | | | 67,484 | | 67,433 |
| 4.722% 3/1/35 (f) | | | | | | 419,177 | | 415,574 |
| 4.729% 7/1/34 (f) | | | | | | 725,599 | | 720,439 |
| 4.732% 10/1/32 (f) | | | | | | 64,866 | | 64,820 |
| 4.803% 12/1/34 (f) | | | | | | 677,602 | | 675,747 |
| 4.815% 5/1/33 (f) | | | | | | 21,347 | | 21,330 |
| 4.816% 12/1/32 (f) | | | | | | 343,940 | | 343,829 |
| 4.83% 1/1/35 (f) | | | | | | 50,856 | | 51,272 |
| 4.832% 8/1/34 (f) | | | | | | 274,087 | | 271,847 |
| 4.838% 12/1/34 (f) | | | | | | 269,962 | | 269,258 |
| 4.904% 12/1/32 (f) | | | | | | 28,385 | | 28,472 |
| 4.984% 11/1/32 (f) | | | | | | 186,440 | | 187,682 |
| 5% 10/1/17 to 8/1/35 | | | | | | 106,818,128 | | 104,249,044 |
| 5% 1/1/21 (b) | | | | | | 3,860,997 | | 3,818,767 |
| 5% 1/1/36 (b) | | | | | | 12,837,916 | | 12,440,743 |
| 5.029% 2/1/35 (f) | | | | | | 137,200 | | 137,719 |
| 5.05% 7/1/34 (f) | | | | | | 152,760 | | 153,182 |
| 5.067% 11/1/34 (f) | | | | | | 61,928 | | 62,031 |
| 5.111% 5/1/35 (f) | | | | | | 1,714,690 | | 1,724,026 |
| 5.199% 6/1/35 (f) | | | | | | 1,240,743 | | 1,246,058 |
| 5.222% 8/1/33 (f) | | | | | | 368,336 | | 367,138 |
| 5.333% 7/1/35 (f) | | | | | | 165,450 | | 165,763 |
| 5.5% 6/1/09 to 10/1/35 | | | | | | 109,297,302 | | 108,776,232 |
| 5.5% 1/1/36 (b) | | | | | | 41,506,139 | | 41,104,048 |
| 6% 2/1/13 to 3/1/33 | | | | | | 24,270,121 | | 24,671,210 |
| 6% 1/1/36 (b) | | | | | | 339,133 | | 342,312 |
See accompanying notes which are an integral part of the financial statements.
|
149 Annual Report
149
| VIP Investment Grade Bond Portfolio | | | | |
| Investments - continued | | | | |
| |
| |
| |
| | | Principal | | Value |
| | | Amount | | (Note 1) |
| 6.5% 6/1/15 to 2/1/33 | | $ 46,435,449 | | $ 47,750,060 |
| 7% 3/1/15 to 8/1/32 | | 980,218 | | 1,024,761 |
| 7.5% 8/1/08 to 11/1/31 | | 2,002,902 | | 2,101,829 |
| 8% 3/1/30 | | 2,073 | | 2,214 |
| 8.5% 3/1/25 to 6/1/25 | | 1,544 | | 1,675 |
| |
| TOTAL FANNIE MAE | | | | 528,835,840 |
| Freddie Mac 1.2% | | | | |
| 4% 2/1/20 | | 4,532,500 | | 4,324,898 |
| 4.056% 12/1/34 (f) | | 252,232 | | 249,500 |
| 4.103% 12/1/34 (f) | | 388,809 | | 383,452 |
| 4.188% 1/1/35 (f) | | 1,221,156 | | 1,205,149 |
| 4.269% 3/1/35 (f) | | 341,348 | | 338,608 |
| 4.3% 5/1/35 (f) | | 608,230 | | 603,072 |
| 4.307% 12/1/34 (f) | | 338,468 | | 332,393 |
| 4.364% 3/1/35 (f) | | 529,313 | | 519,058 |
| 4.375% 2/1/35 (f) | | 758,386 | | 753,972 |
| 4.39% 2/1/35 (f) | | 692,817 | | 686,321 |
| 4.445% 3/1/35 (f) | | 356,915 | | 350,251 |
| 4.447% 2/1/34 (f) | | 384,299 | | 379,612 |
| 4.468% 6/1/35 (f) | | 531,636 | | 524,461 |
| 4.489% 3/1/35 (f) | | 384,240 | | 377,591 |
| 4.49% 3/1/35 (f) | | 2,386,457 | | 2,354,202 |
| 4.552% 2/1/35 (f) | | 563,775 | | 556,403 |
| 4.807% 10/1/32 (f) | | 46,713 | | 46,669 |
| 5.017% 4/1/35 (f) | | 1,929,200 | | 1,926,549 |
| 5.285% 8/1/33 (f) | | 154,344 | | 156,205 |
| 5.375% 3/1/33 (f) | | 130,259 | | 129,672 |
| 5.662% 4/1/32 (f) | | 83,244 | | 84,369 |
| 6% 5/1/33 | | 3,205,641 | | 3,247,282 |
| 8.5% 3/1/20 to 1/1/28 | | 312,344 | | 338,133 |
| |
| TOTAL FREDDIE MAC | | | | 19,867,822 |
| Government National Mortgage Association – 0.9% | | | | |
| 4.25% 7/20/34 (f) | | 790,622 | | 779,194 |
| 6% 8/15/08 to 8/15/29 | | 3,794,354 | | 3,889,205 |
| 6.5% 10/15/27 to 9/15/32 | | 1,493,074 | | 1,562,953 |
| 7% 1/15/28 to 11/15/32 | | 7,410,612 | | 7,782,747 |
| 7.5% 3/15/06 to 10/15/28 | | 596,060 | | 629,741 |
| 8% 2/15/17 | | 15,888 | | 17,003 |
| |
| TOTAL GOVERNMENT NATIONAL MORTGAGE ASSOCIATION | | | | 14,660,843 |
| |
| TOTAL U.S. GOVERNMENT AGENCY - MORTGAGE SECURITIES | | | | |
| (Cost $569,209,481) | | | | 563,364,505 |
See accompanying notes which are an integral part of the financial statements.
| | |
| VIP Investment Grade Bond Portfolio | | 150 |
| Asset Backed Securities 2.8% | | | | |
| | | | | Principal | | Value |
| | | | | Amount | | (Note 1) |
| ACE Securities Corp.: | | | | | | |
| Series 2004 HE1: | | | | | | |
| Class M1, 4.8788% 2/25/34 (f) | | $ 650,000 | | $ 651,369 |
| Class M2, 5.4788% 2/25/34 (f) | | 725,000 | | 729,816 |
| Series 2005 SD1 Class A1, 4.7788% 11/25/50 (f) | | 548,006 | | 548,666 |
| Aircraft Lease Securitization Ltd. Series 2005 1 Class C1, 8.0813% 9/9/30 (a)(f) | | 464,001 | | 468,641 |
| AmeriCredit Automobile Receivables Trust Series 2003 BX Class A4B, 4.7113% 1/6/10 (f) | | 1,386,267 | | 1,389,539 |
| Ameriquest Mortgage Securities, Inc. Series 2004 R2: | | | | |
| Class M1, 4.8088% 4/25/34 (f) | | 360,000 | | 359,997 |
| Class M2, 4.8588% 4/25/34 (f) | | 275,000 | | 274,998 |
| Amortizing Residential Collateral Trust Series 2002 BC1 Class M2, 5.4788% 1/25/32 (f) | | 197,674 | | 198,466 |
| Argent Securities, Inc. Series 2004 W5 Class M1, 4.9788% 4/25/34 (f) . | | 1,165,000 | | 1,166,393 |
| Asset Backed Securities Corp. Home Equity Loan Trust Series 2004 HE2 Class M1, 4.9288% 4/25/34 (f) | | 1,660,000 | | 1,666,459 |
| Capital One Multi Asset Execution Trust: | | | | |
| Series 2003 B4 Class B4, 5.1694% 7/15/11 (f) | | 2,230,000 | | 2,261,868 |
| Series 2004 6 Class B, 4.15% 7/16/12 | | 3,005,000 | | 2,922,645 |
| Cendant Timeshare Receivables Funding LLC Series 2005 1A Class A1, 4.67% 5/20/17 (a) | | 1,197,197 | | 1,184,863 |
| Citibank Credit Card Issuance Trust Series 2002 C1 Class C1, 5.2806% 2/9/09 (f) | | 4,500,000 | | 4,537,056 |
| Countrywide Home Loans, Inc.: | | | | | | |
| Series 2004 2 Class M1, 4.8788% 5/25/34 (f) | | 2,090,000 | | 2,093,835 |
| Series 2004 3 Class M1, 4.8788% 6/25/34 (f) | | 425,000 | | 425,844 |
| Series 2005 1: | | | | | | |
| Class MV1, 4.7788% 7/25/35 (f) | | 840,000 | | 839,991 |
| Class MV2, 4.8188% 7/25/35 (f) | | 1,005,000 | | 1,004,675 |
| Crown Castle Towers LLC/Crown Atlantic Holdings Sub LLC/Crown Communication, Inc. Series 2005 1A: | | | | |
| Class B, 4.878% 6/15/35 (a) | | | | 1,354,000 | | 1,318,634 |
| Class C, 5.074% 6/15/35 (a) | | | | 1,229,000 | | 1,199,789 |
See accompanying notes which are an integral part of the financial statements.
|
151 Annual Report
151
| VIP Investment Grade Bond Portfolio | | | | |
| Investments - continued | | | | |
| |
| |
| |
| | | Principal | | Value |
| | | Amount | | (Note 1) |
| Discover Card Master Trust I Series 2003 4 Class B1, 4.6994% 5/16/11 (f) | | $ 2,620,000 | | $ 2,635,020 |
| First Franklin Mortgage Loan Trust Series 2004 FF2: | | | | |
| Class M3, 4.9288% 3/25/34 (f) | | 125,000 | | 125,214 |
| Class M4, 5.2788% 3/25/34 (f) | | 100,000 | | 100,876 |
| Fremont Home Loan Trust Series 2004 A: | | | | |
| Class M1, 4.9288% 1/25/34 (f) | | 1,350,000 | | 1,354,172 |
| Class M2, 5.5288% 1/25/34 (f) | | 1,550,000 | | 1,568,713 |
| GSAMP Trust Series 2004 FM2: | | | | |
| Class M1, 4.8788% 1/25/34 (f) | | 1,000,000 | | 999,990 |
| Class M2, 5.4788% 1/25/34 (f) | | 400,000 | | 399,996 |
| Class M3, 5.6788% 1/25/34 (f) | | 400,000 | | 399,996 |
| HSBC Home Equity Loan Trust Series 2005 2: | | | | |
| Class M1, 4.83% 1/20/35 (f) | | 637,397 | | 637,457 |
| Class M2, 4.86% 1/20/35 (f) | | 478,048 | | 478,196 |
| MBNA Credit Card Master Note Trust: | | | | |
| Series 2003 B3 Class B3, 4.7444% 1/18/11 (f) | | 1,810,000 | | 1,819,040 |
| Series 2003 B5 Class B5, 4.7394% 2/15/11 (f) | | 725,000 | | 729,764 |
| Meritage Mortgage Loan Trust Series 2004 1: | | | | |
| Class M1, 4.8788% 7/25/34 (f) | | 625,000 | | 624,994 |
| Class M2, 4.9288% 7/25/34 (f) | | 100,000 | | 99,999 |
| Class M3, 5.3288% 7/25/34 (f) | | 225,000 | | 224,998 |
| Class M4, 5.4788% 7/25/34 (f) | | 150,000 | | 150,314 |
| Morgan Stanley ABS Capital I, Inc.: | | | | |
| Series 2003 NC5 Class M2, 6.3788% 4/25/33 (f) | | 825,000 | | 831,221 |
| Series 2004 NC2 Class M1, 4.9288% 12/25/33 (f) | | 695,000 | | 697,830 |
| Morgan Stanley Dean Witter Capital I Trust Series 2003 NC1 Class M1, 5.4288% 11/25/32 (f) | | 701,971 | | 705,891 |
| National Collegiate Student Loan Trust Series 2005 GT1 Class AIO, 6.75% 12/25/09 (h) | | 1,150,000 | | 274,293 |
| Park Place Securities, Inc. Series 2005 WCH1: | | | | |
| Class M2, 4.8988% 1/25/35 (f) | | 1,125,000 | | 1,126,215 |
| Class M4, 5.2088% 1/25/35 (f) | | 3,650,000 | | 3,661,191 |
| Saxon Asset Securities Trust Series 2004 1 Class M1, 4.9088% 3/25/35 (f) | | 1,180,000 | | 1,181,433 |
See accompanying notes which are an integral part of the financial statements.
| | |
| VIP Investment Grade Bond Portfolio | | 152 |
| Asset Backed Securities continued | | | | | | |
| | | | | Principal | | Value |
| | | | | Amount | | (Note 1) |
| Specialty Underwriting & Residential Finance Series 2003 BC4 Class M1, 4.9788% 11/25/34 (f) | | $ 485,000 | | $ 487,436 |
| Structured Asset Securities Corp. Series 2004 GEL1 Class A, 4.7388% 2/25/34 (f) | | 211,975 | | 211,974 |
| TOTAL ASSET BACKED SECURITIES | | | | | | |
| (Cost $46,835,921) | | | | | | 46,769,767 |
| |
| Collateralized Mortgage Obligations 4.6% | | | | |
| |
| Private Sponsor 2.6% | | | | | | |
| Adjustable Rate Mortgage Trust floater: | | | | | | |
| Series 2005 1 Class 5A2, 4.7088% 5/25/35 (f) | | 1,253,109 | | 1,248,856 |
| Series 2005 2 Class 6A2, 4.6588% 6/25/35 (f) | | 569,479 | | 569,635 |
| Bear Stearns Alt A Trust floater Series 2005 1 Class A1, 4.6588% 1/25/35 (f) | | 2,095,716 | | 2,095,716 |
| CS First Boston Mortgage Securities Corp. floater Series 2004 AR3 Class 6A2, 4.7488% 4/25/34 (f) | | 459,883 | | 460,449 |
| Impac CMB Trust floater Series 2005 1: | | | | | | |
| Class M1, 4.8388% 4/25/35 (f) | | | | 763,269 | | 762,937 |
| Class M2, 4.8788% 4/25/35 (f) | | | | 1,320,455 | | 1,319,988 |
| Lehman Structured Securities Corp. floater Series 2005 1 Class A2, 4.59% 9/26/45 (a)(f) | | 2,714,498 | | 2,714,498 |
| Master Alternative Loan Trust Series 2004 3 Class 3A1, 6% 4/25/34 | | 406,238 | | 405,604 |
| Merrill Lynch Mortgage Investors, Inc. floater: | | | | | | |
| Series 2005 A Class A2, 4.9338% 2/25/30 (f) | | | | 2,410,277 | | 2,407,858 |
| Series 2005 B Class A2, 4.79% 7/25/30 (f) | | | | 2,262,027 | | 2,260,544 |
| Opteum Mortgage Acceptance Corp. floater Series 2005 3 Class APT, 4.6688% 7/25/35 (f) | | 1,495,437 | | 1,496,313 |
| Residential Asset Mortgage Products, Inc. sequential pay Series 2004 SL2 Class A1, 6.5% 10/25/16 | | 316,760 | | 322,405 |
| Residential Finance LP/Residential Finance Development Corp. floater Series 2003 CB1: | | | | |
| Class B3, 5.81% 6/10/35 (a)(f) | | | | 1,181,197 | | 1,201,130 |
| Class B4, 6.01% 6/10/35 (a)(f) | | | | 1,056,861 | | 1,076,016 |
| Class B5, 6.61% 6/10/35 (a)(f) | | | | 722,108 | | 737,453 |
| Class B6, 7.11% 6/10/35 (a)(f) | | | | 425,614 | | 435,722 |
| Sequoia Mortgage Trust floater: | | | | | | |
| Series 2005 1 Class A2, 4.1% 2/20/35 (f) | | | | 1,599,858 | | 1,593,787 |
See accompanying notes which are an integral part of the financial statements.
|
153 Annual Report
153
| VIP Investment Grade Bond Portfolio | | | | |
| Investments - continued | | | | |
| |
| |
| |
| | | Principal | | Value |
| | | Amount | | (Note 1) |
| Series 2005 2 Class A2, 4.29% 3/20/35 (f) | | $ 1,887,945 | | $ 1,887,945 |
| Structured Adjustable Rate Mortgage Loan Trust floater Series 2001 14 Class A1, 4.6888% 7/25/35 (f) | | 4,598,129 | | 4,591,653 |
| Thornburg Mortgage Securities Trust floater Series 2005 3 Class A4, 4.6488% 10/25/35 (f) | | 2,635,449 | | 2,635,449 |
| WAMU Mortgage pass thru certificates floater Series 2005 AR13 Class A1C1, 4.3838% 10/25/45 (f) | | 2,843,660 | | 2,843,660 |
| Wells Fargo Mortgage Backed Securities Trust: | | | | |
| Series 2005 AR10 Class 2A2, 4.1101% 6/25/35 (f) | | 3,433,902 | | 3,371,006 |
| Series 2005 AR12 Class 2A6, 4.3214% 7/25/35 (f) | | 3,687,346 | | 3,608,651 |
| Series 2005 AR4 Class 2A2, 4.5345% 4/25/35 (f) | | 2,933,032 | | 2,874,774 |
| Series 2005 AR9 Class 2A1, 4.3624% 5/25/35 (f) | | 1,556,150 | | 1,535,849 |
| |
| TOTAL PRIVATE SPONSOR | | | | 44,457,898 |
| U.S. Government Agency – 2.0% | | | | |
| Fannie Mae guaranteed REMIC pass thru certificates planned amortization class Series 2004 81: | | | | |
| Class KC, 4.5% 4/25/17 | | 5,810,000 | | 5,683,478 |
| Class KD, 4.5% 7/25/18 | | 2,455,000 | | 2,364,786 |
| Freddie Mac Multi class participation certificates guaranteed: | | | | |
| planned amortization class: | | | | |
| Series 2500 Class TE, 5.5% 9/15/17 | | 10,275,186 | | 10,426,907 |
| Series 2677 Class LD, 4.5% 3/15/17 | | 8,240,218 | | 8,008,245 |
| Series 2702 Class WB, 5% 4/15/17 | | 2,947,632 | | 2,941,359 |
| Series 2885 Class PC, 4.5% 3/15/18 | | 2,395,000 | | 2,343,472 |
| sequential pay Series 2750 Class ZT, 5% 2/15/34 | | 2,125,834 | | 1,899,846 |
| |
| TOTAL U.S. GOVERNMENT AGENCY | | | | 33,668,093 |
| |
| TOTAL COLLATERALIZED MORTGAGE OBLIGATIONS | | | | |
| (Cost $79,079,325) | | | | 78,125,991 |
See accompanying notes which are an integral part of the financial statements.
| | |
| VIP Investment Grade Bond Portfolio | | 154 |
| Commercial Mortgage Securities 4.9% | | | | |
| | | | | Principal | | Value |
| | | | | Amount | | (Note 1) |
| Bank of America Large Loan, Inc.: | | | | | | |
| floater Series 2005 ESHA: | | | | | | |
| Class E, 4.9475% 7/14/08 (a)(f) | | | | $ 835,000 | | $ 834,888 |
| Class F, 5.1175% 7/14/08 (a)(f) | | | | 505,000 | | 504,932 |
| Class G, 5.2475% 7/14/08 (a)(f) | | | | 250,000 | | 249,966 |
| Class H, 5.4675% 7/14/08 (a)(f) | | | | 335,000 | | 334,955 |
| Series 2005 MIB1: | | | | | | |
| Class C, 4.6794% 3/15/22 (a)(f) | | | | 385,000 | | 385,076 |
| Class D, 4.7294% 3/15/22 (a)(f) | | | | 390,000 | | 390,079 |
| Class F, 4.8394% 3/15/22 (a)(f) | | | | 380,000 | | 380,077 |
| Class G, 4.8994% 3/15/22 (a)(f) | | | | 245,000 | | 245,050 |
| Bayview Commercial Asset Trust floater Series 2004 3: | | | | |
| Class A1, 4.7488% 1/25/35 (a)(f) | | | | 1,811,586 | | 1,813,561 |
| Class A2, 4.7988% 1/25/35 (a)(f) | | | | 271,738 | | 271,823 |
| Class M1, 4.8788% 1/25/35 (a)(f) | | | | 317,028 | | 317,456 |
| Class M2, 5.3788% 1/25/35 (a)(f) | | | | 181,159 | | 182,236 |
| Chase Commercial Mortgage Securities Corp. Series 2001 245 Class A2, 6.4842% 2/12/16 (a)(f) | | 1,345,000 | | 1,421,509 |
| Chase Manhattan Bank First Union National Bank Commercial Mortgage Trust sequential pay Series 1999 1 Class | | | | |
| A2, 7.439% 8/15/31 | | | | 5,000,000 | | 5,365,864 |
| COMM: | | | | | | |
| floater Series 2002 FL7 Class D, 4.9394% 11/15/14 (a)(f) | | 168,000 | | 168,503 |
| Series 2004 LBN2 Class X2, 1.1989% 3/10/39 (a)(f)(h) | | 4,740,930 | | 160,458 |
| Commercial Mortgage Pass-Through Certificates Series 2005 FL11: | | | | |
| Class B, 4.6194% 11/15/17 (a)(f) | | | | 834,961 | | 834,961 |
| Class E, 4.7594% 11/15/17 (a)(f) | | | | 379,982 | | 379,982 |
| Class F, 4.8194% 11/15/17 (a)(f) | | | | 344,984 | | 344,984 |
See accompanying notes which are an integral part of the financial statements.
|
155 Annual Report
155
| VIP Investment Grade Bond Portfolio | | | | |
| Investments - continued | | | | |
| |
| |
| |
| | | Principal | | Value |
| | | Amount | | (Note 1) |
| CS First Boston Mortgage Securities Corp.: | | | | |
| sequential pay: | | | | |
| Series 1997 C2 Class A3, 6.55% 1/17/35 | | $ 2,075,000 | | $ 2,124,821 |
| Series 1999 C1 Class A2, 7.29% 9/15/41 | | 3,500,000 | | 3,724,016 |
| Series 2000 C1 Class A2, 7.545% 4/15/62 | | 1,100,000 | | 1,192,373 |
| Series 2004 C1: | | | | |
| Class A3, 4.321% 1/15/37 | | 1,505,000 | | 1,450,867 |
| Class A4, 4.75% 1/15/37 | | 3,035,000 | | 2,950,861 |
| Series 1997 C2 Class D, 7.27% 1/17/35 | | 1,750,000 | | 1,844,287 |
| Series 1998 C1 Class C, 6.78% 5/17/40 | | 5,000,000 | | 5,246,603 |
| Series 2001 CKN5 Class AX, 1.1731% 9/15/34 (a)(f)(h) | | 30,009,865 | | 1,774,387 |
| Series 2004 C1 Class ASP, 1.1065% 1/15/37 (a)(f)(h) | | 23,268,004 | | 755,328 |
| Deutsche Mortgage & Asset Receiving Corp. sequential pay Series 1998 C1 Class D, 7.231% 6/15/31 | | 1,270,000 | | 1,328,004 |
| DLJ Commercial Mortgage Corp. sequential pay Series 2000 CF1 Class A1B, 7.62% 6/10/33 | | 3,000,000 | | 3,274,361 |
| Equitable Life Assurance Society of the United States Series 174: | | | | |
| Class B1, 7.33% 5/15/06 (a) | | 500,000 | | 504,012 |
| Class C1, 7.52% 5/15/06 (a) | | 500,000 | | 504,127 |
| Fannie Mae sequential pay Series 1999 10 Class MZ, 6.5% 9/17/38 | | 3,583,908 | | 3,698,235 |
| GGP Mall Properties Trust sequential pay Series 2001 C1A Class A2, 5.007% 11/15/11 (a) | | 3,363,093 | | 3,365,620 |
| Ginnie Mae guaranteed REMIC pass thru securities sequential pay: | | | | |
| Series 2002 83 Class B, 4.6951% 12/16/24 | | 1,860,000 | | 1,833,853 |
| Series 2003 22 Class B, 3.963% 5/16/32 | | 3,295,000 | | 3,152,930 |
| GS Mortgage Securities Corp. II: | | | | |
| sequential pay: | | | | |
| Series 2001 LIBA Class A2, 6.615% 2/14/16 (a) | | 1,995,000 | | 2,133,981 |
| Series 2003 C1 Class A2A, 3.59% 1/10/40 | | 3,220,000 | | 3,142,721 |
| Series 1998 GLII Class E, 7.1906% 4/13/31 (f) | | 245,000 | | 253,909 |
| J.P. Morgan Commercial Mortgage Finance Corp. sequential pay Series 2000 C9 Class A2, 7.77% 10/15/32 | | 3,745,000 | | 4,064,099 |
See accompanying notes which are an integral part of the financial statements.
| | |
| VIP Investment Grade Bond Portfolio | | 156 |
| Commercial Mortgage Securities continued | | | | |
| | | Principal | | Value |
| | | Amount | | (Note 1) |
| LB UBS Commercial Mortgage Trust sequential pay: | | | | |
| Series 2000 C3 Class A2, 7.95% 1/15/10 | | $ 2,180,000 | | $ 2,397,958 |
| Series 2001 C3 Class A1, 6.058% 6/15/20 | | 4,850,163 | | 4,943,190 |
| Leafs CMBS I Ltd./Leafs CMBS I Corp. Series 2002 1A: | | | | |
| Class B, 4.13% 11/20/37 (a) | | 2,600,000 | | 2,421,398 |
| Class C, 4.13% 11/20/37 (a) | | 2,600,000 | | 2,345,421 |
| Morgan Stanley Capital I, Inc.: | | | | |
| sequential pay Series 2004 HQ3 Class A2, 4.05% 1/13/41 | | 1,480,000 | | 1,426,403 |
| Series 2005 IQ9 Class X2, 1.203% 7/15/56 (a)(f)(h) | | 19,175,000 | | 885,049 |
| Thirteen Affiliates of General Growth Properties, Inc. sequential pay Series 1 Class A2, 6.602% 11/15/07 (a) | | 2,500,000 | | 2,569,597 |
| Trizechahn Office Properties Trust Series 2001 TZHA Class E3, 7.253% 3/15/13 (a) | | 1,390,000 | | 1,423,565 |
| Wachovia Bank Commercial Mortgage Trust sequential pay Series 2003 C6 Class A2, 4.498% 8/15/35 | | 2,385,000 | | 2,342,070 |
| TOTAL COMMERCIAL MORTGAGE SECURITIES | | | | |
| (Cost $84,365,356) | | | | 83,660,406 |
| |
| Foreign Government and Government Agency Obligations 1.0% | | | | |
| |
| Israeli State 4.625% 6/15/13 | | 725,000 | | 699,172 |
| United Mexican States: | | | | |
| 5.875% 1/15/14 | | 430,000 | | 445,050 |
| 6.75% 9/27/34 | | 5,645,000 | | 6,174,219 |
| 7.5% 4/8/33 | | 8,587,000 | | 10,167,008 |
| TOTAL FOREIGN GOVERNMENT AND GOVERNMENT AGENCY OBLIGATIONS | | | | |
| (Cost $15,428,312) | | | | 17,485,449 |
| |
| Supranational Obligations 0.1% | | | | |
| |
| Corporacion Andina de Fomento 6.875% 3/15/12 | | | | |
| (Cost $1,706,548) | | 1,725,000 | | 1,876,555 |
| |
| Fixed Income Funds 15.4% | | | | |
| | | Shares | | |
| Fidelity Specialized High Income Central Investment Portfolio (g) | | 200,090 | | 19,830,920 |
| Fidelity Ultra Short Central Fund (g) | | 2,411,882 | | 239,885,774 |
| TOTAL FIXED-INCOME FUNDS | | | | |
| (Cost $259,738,984) | | | | 259,716,694 |
| |
| Cash Equivalents 5.6% | | | | |
| | | Maturity | | Value |
| | | Amount | | (Note 1) |
| Investments in repurchase agreements (Collateralized by U.S. Government Obligations, in a joint trading account at | | | | |
| 4.28%, dated 12/30/05 due 1/3/06) | | | | |
| (Cost $94,398,000) | | $ 94,442,919 | | $ 94,398,000 |
| |
| TOTAL INVESTMENT PORTFOLIO 108.2% | | | | |
| (Cost $1,839,081,419) | | 1,830,948,929 |
| |
| |
| NET OTHER ASSETS (8.2)% | | (138,672,068) |
| NET ASSETS 100% | | $ 1,692,276,861 |
See accompanying notes which are an integral part of the financial statements.
|
157 Annual Report
157
| VIP Investment Grade Bond Portfolio | | | | | | |
| Investments - continued | | | | | | |
| |
| |
| Swap Agreements | | | | | | |
| | | Expiration | | Notional | | Value |
| | | Date | | Amount | | |
| |
| Credit Default Swaps | | | | | | |
| Receive quarterly a fixed rate of .4% multiplied by the notional amount and pay to Merrill Lynch, Inc., | | | | | | |
| upon each default event of one of the issues of Dow Jones CDX N.A. Investment Grade 4, par value of | | | | | | |
| the proportional notional amount (e) | | June 2010 | | $10,000,000 | | $ (39,700) |
| Receive quarterly a fixed rate of .5% multiplied by the notional amount and pay to Merrill Lynch, Inc., | | | | | | |
| upon each default event of one of the issues of Dow Jones CDX N.A. Investment Grade 3, par value of | | | | | | |
| the proportional notional amount (d) | | March 2010 | | 7,936,000 | | 25,236 |
See accompanying notes which are an integral part of the financial statements.
| | |
| VIP Investment Grade Bond Portfolio | | 158 |
| Swap Agreements continued | | | | | | | | |
| | | Expiration | | Notional | | | | Value |
| | | Date | | Amount | | | | |
| |
| Credit Default Swaps continued | | | | | | | | |
| Receive quarterly a fixed rate of .65% multiplied by the notional amount and pay to Merrill Lynch, Inc., | | | | | | | | |
| upon each default event of one of the issues of Dow Jones CDX N.A. Investment Grade 4, par value of | | | | | | | | |
| the proportional notional amount (e) | | June 2015 | | $17,000,000 | | | | $ (74,120) |
| Receive quarterly a fixed rate of .7% multiplied by the notional amount and pay to Deutsche Bank, upon | | | | | | | | |
| each default event of one of the issues of Dow Jones CDX N.A. Investment Grade 3, par value of the | | | | | | | | |
| proportional notional amount (d) | | March 2015 | | 7,936,000 | | | | 24,364 |
| Receive quarterly notional amount multiplied by .35% and pay Goldman Sachs upon default event of | | | | | | | | |
| Southern California Edison Co., par value of the notional amount of Southern California Edison Co. | | | | | | | | |
| 7.625% 1/15/10 | | Sept. 2010 | | 1,900,000 | | | | 627 |
| Receive quarterly notional amount multiplied by .41% and pay Goldman Sachs upon default event of | | | | | | | | |
| Sempra Energy, par value of the notional amount of Sempra Energy 7.95% 3/1/10 | | Sept. 2010 | | 1,600,000 | | | | 560 |
| Receive quarterly notional amount multiplied by .41% and pay Merrill Lynch, Inc. upon default event of | | | | | | | | |
| Talisman Energy, Inc., par value of the notional amount of Talisman Energy, Inc. 7.25% 10/15/27 | | March 2009 | | 1,400,000 | | | | 7,294 |
| |
| |
| | | Expiration | | Notional | | | | Value |
| | | Date | | Amount | | | | |
| Receive quarterly notional amount multiplied by .42% and pay Morgan Stanley, Inc. upon default event | | | | | | | | |
| of Sempra Energy, par value of the notional amount of Sempra Energy 6% 2/1/13 | | Sept. 2010 | | $ 2,500,000 | | | | $ 1,925 |
| Receive quarterly notional amount multiplied by .48% and pay JPMorgan Chase, Inc. upon default event | | | | | | | | |
| of Fannie Mae, par value of the notional amount of Fannie Mae 4.625% 5/1/13 | | June 2010 | | 4,000,000 | | | | 48,800 |
| Receive monthly notional amount multiplied by .82% and pay UBS upon default event of Morgan Stanley | | | | | | | | |
| ABS Capital I, Inc., par value of the notional amount of Morgan Stanley ABS Capital I, Inc. Series | | | | | | | | |
| 2004 NC6 Class M3, 5.6413% 7/25/34 | | August 2034 | | 465,000 | | | | 189 |
| Receive monthly notional amount multiplied by .85% and pay UBS upon default event of Ameriquest | | | | | | | | |
| Mortgage Securities, Inc., par value of the notional amount of Ameriquest Mortgage Securities, Inc. | | | | | | | | |
| Series 2004 R9 Class M5, 5.5913% 10/25/34 | | Nov. 2034 | | 465,000 | | | | 293 |
| Receive monthly notional amount multiplied by .85% and pay UBS upon default event of Morgan Stanley | | | | | | | | |
| ABS Capital I, Inc., par value of the notional amount of Morgan Stanley ABS Capital I, Inc. Series | | | | | | | | |
| 2004 NC8 Class M6, 5.4413% 9/25/34 | | Oct. 2034 | | 465,000 | | | | 304 |
See accompanying notes which are an integral part of the financial statements.
|
159 Annual Report
159
| VIP Investment Grade Bond Portfolio | | | | | | | | |
| Investments - continued | | | | | | | | |
| |
| |
| |
| Swap Agreements continued | | | | | | | | |
| |
| | | Expiration | | Notional | | | | Value |
| | | Date | | Amount | | | | |
| |
| Credit Default Swaps continued | | | | | | | | |
| Receive monthly notional amount multiplied by 1.6% and pay Morgan Stanley, Inc. upon default event of | | | | | | | | |
| Park Place Securities, Inc., par value of the notional amount of Park Place Securities, Inc. Series | | | | | | | | |
| 2005 WHQ2 Class M7, 5.4413% 5/25/35 | | June 2035 | | $ 430,000 | | | | $ 1,922 |
| Receive monthly notional amount multiplied by 1.66% and pay Morgan Stanley, Inc. upon default event | | | | | | | | |
| of Park Place Securities, Inc., par value of the notional amount of Park Place Securities, Inc. Series | | | | | | | | |
| 2005 WHQ2 Class M7, 5.4413% 5/25/35 | | June 2035 | | 465,000 | | | | 2,902 |
| Receive monthly notional amount multiplied by 2.54% and pay Merrill Lynch upon default event of | | | | | | | | |
| Countrywide Home Loans, Inc., par value of the notional amount of Countrywide Home Loans, Inc. | | | | | | | | |
| Series 2003 BC1 Class B1, 7.6913% 3/25/32 | | April 2032 | | 465,000 | | | | 670 |
| Receive monthly notional amount multiplied by 2.79% and pay Merrill Lynch, Inc. upon default event of | | | | | | | | |
| New Century Home Equity Loan Trust, par value of the notional amount of New Century Home Equity | | | | | | | | |
| Loan Trust Series 2004 4 Class M9, 7.0788% 2/25/35 | | March 2035 | | 1,165,000 | | | | (2,611) |
| |
| |
| | | Expiration | | Notional | | | | Value |
| | | Date | | Amount | | | | |
| |
| Receive monthly notional amount multiplied by 3.3% and pay to Morgan Stanley, Inc. upon each default | | | | | | | | |
| event of Ameriquest Mortgage Securities, Inc., par value of the notional amount of Ameriquest | | | | | | | | |
| Mortgage Securities, Inc. Series 2004 R11 Class M9, 7.6913% 11/25/34 | | Dec. 2034 | | $ 525,000 | | | | $ 3,356 |
| Receive monthly notional amount multiplied by 3.35% and pay Morgan Stanley, Inc. upon default event | | | | | | | | |
| of Morgan Stanley ABS Capital I, Inc., par value of the notional amount of Morgan Stanley ABS | | | | | | | | |
| Capital I, Inc. Series 2004 HE8 Class B3, 7.3913% 9/25/34 | | Oct. 2034 | | 465,000 | | | | 4,333 |
| Receive monthly notional amount multiplied by 3.35% and pay Morgan Stanley, Inc. upon each default | | | | | | | | |
| event of Morgan Stanley ABS Capital I, Inc., par value of the notional anount of Morgan Stanley ABS | | | | | | | | |
| Capital I, Inc. Series 2004 NC7 Class B3, 7.6913% 7/25/34 | | August 2034 | | 465,000 | | | | 4,019 |
See accompanying notes which are an integral part of the financial statements.
| | |
| VIP Investment Grade Bond Portfolio | | 160 |
| Swap Agreements continued | | | | | | |
| | | Expiration | | Notional | | Value |
| | | Date | | Amount | | |
| |
| Credit Default Swaps continued | | | | | | |
| Receive monthly notional amount multiplied by 3.35% and pay Morgan Stanley, Inc. upon each default | | | | | | |
| event of Morgan Stanley ABS Capital I, Inc., par value of the notional amount of Morgan Stanley ABS | | | | | | |
| Capital I, Inc. Series 2004 HE7 Class B3, 7.6913% 8/25/34 | | Sept. 2034 | | $ 465,000 | | $ 4,291 |
| Receive monthly notional amount multiplied by 5% and pay Deutsche Bank upon default event of MASTR | | | | | | |
| Asset Backed Securities Trust, par value of the notional amount of MASTR Asset Backed Securities Trust | | | | | | |
| Series 2003 NC1 Class M6, 8.1913% 4/25/33 | | May 2033 | | 465,000 | | (795) |
| TOTAL CREDIT DEFAULT SWAPS | | | | 60,577,000 | | 13,859 |
| Interest Rate Swaps | | | | | | |
| Receive quarterly a fixed rate equal to 4% and pay quarterly a floating rate based on 3 month LIBOR | | | | | | |
| with JPMorgan Chase, Inc. | | July 2009 | | 42,000,000 | | (1,121,400) |
| Receive quarterly a fixed rate equal to 4.3875% and pay quarterly a floating rate based on 3 month | | | | | | |
| LIBOR with Credit Suisse First Boston | | March 2010 | | 8,000,000 | | (132,080) |
| Receive quarterly a fixed rate equal to 4.774% and pay quarterly a floating rate based on 3 month | | | | | | |
| LIBOR with Credit Suisse First Boston | | March 2015 | | 8,000,000 | | (70,000) |
| |
| |
| | | Expiration | | Notional | | Value |
| | | Date | | Amount | | |
| Receive semi annually a fixed rate equal to 4.8575% and pay quarterly a floating rate based on | | | | | | |
| 3 month LIBOR with Lehman Brothers, Inc. | | Dec. 2008 | | $26,000,000 | | $ 16,900 |
| Receive semi annually a fixed rate equal to 4.921% and pay quarterly a floating rate based on 3 month | | | | | | |
| LIBOR with Lehman Brothers, Inc. | | Dec. 2008 | | 90,000,000 | | 223,200 |
| TOTAL INTEREST RATE SWAPS | | | | 174,000,000 | | (1,083,380) |
| Total Return Swaps | | | | | | |
| Receive monthly a return equal to Banc of America Securities LLC AAA 10 Yr Commercial Mortgage | | | | | | |
| Backed Securities Daily Index and pay monthly a floating rate based on 1 month LIBOR minus 20 basis | | | | | | |
| points with Bank of America | | July 2006 | | 10,000,000 | | 112,572 |
| Receive monthly a return equal to Banc of America Securities LLC AAA 10 Yr Commercial Mortgage | | | | | | |
| Backed Securities Daily Index and pay monthly a floating rate based on 1 month LIBOR minus 40 basis | | | | | | |
| points with Bank of America | | March 2006 | | 10,000,000 | | 142,004 |
See accompanying notes which are an integral part of the financial statements.
|
161 Annual Report
161
| VIP Investment Grade Bond Portfolio | | | | | | |
| Investments - continued | | | | | | |
| |
| |
| Swap Agreements continued | | | | | | |
| | | Expiration | | Notional | | Value |
| | | Date | | Amount | | |
| |
| Total Return Swaps continued | | | | | | |
| Receive monthly a return equal to Lehman Brothers CMBS AAA 8.5+ Index and pay monthly a floating | | | | | | |
| rate based on 1 month LIBOR minus 25 basis points with Deutsche Bank | | April 2006 | | $10,000,000 | | $ 110,257 |
| Receive quarterly a return equal to Banc of America Securities LLC AAA 10 Yr Commercial Mortgage | | | | | | |
| Backed Securities Daily Index and pay quarterly a floating rate based on 3 month LIBOR minus 30 | | | | | | |
| basis points with Bank of America | | May 2006 | | 10,000,000 | | 95,099 |
| TOTAL TOTAL RETURN SWAPS | | | | 40,000,000 | | 459,932 |
| |
| |
| | | | | $274,577,000 | | $ (609,589) |
Legend
(a) Security exempt from registration under Rule 144A of the Securities Act of 1933. These securities may be resold in transactions exempt from registration,
normally to qualified institutional buyers. At the period end, the value of these securities amounted to $70,509,229 or 4.2% of net assets.
(b) Security or a portion of the security purchased on a delayed delivery or when-issued basis.
(c) Security or a portion of the security is subject to a forward commitment to sell.
(d) Dow Jones CDX N.A. Investment Grade 3 is a tradable index of credit default swaps on investment grade debt of U.S. companies.
(e) Dow Jones CDX N.A. Investment Grade 4 is a tradable index of credit default swaps on investment grade debt of U.S. companies.
(f) The coupon rate shown on floating or adjustable rate securities represents the rate at period end.
(g) Affiliated fund that is available only to investment companies and other accounts managed by Fidelity Investments. A complete unaudited list of holdings for
each fixed-income central fund, as of the investing fund’s report date, is available upon request or at advisor.fidelity.com. The reports are located just after the
fund’s financial statements or quarterly reports but are not part of the financial statements and quarterly reports. In addition, the fixed-income central fund’s
financial statements, which are not covered by the investing fund’s Report of Independent Registered Public Accounting Firm, are available on the EDGAR
Database on the SEC’s web site, www.sec.gov, or upon request.
(h) Security represents right to receive monthly interest payments on an underlying pool of mortgages. Principal shown is the par amount of the mortgage pool.
|
Affiliated Central Funds
Information regarding income received by the fund from the affiliated Central funds during the period is as follows:
| Fund | | Income received |
| Fidelity Specialized High Income Central Investment Portfolio | | $ 344,417 |
| Fidelity Ultra Short Central Fund | | 8,506,318 |
| Total | | $ 8,850,735 |
Additional information regarding the fund’s purchases and sales, including the ownership percentage, of the following fixed income Central Funds during the period is as follows:
| | | Value, | | Purchases | | Sales Proceeds | | Value, | | % ownership, |
| | | beginning of | | | | | | | | end of period | | end of period |
| Fund | | period | | | | | | | | | | |
| Fidelity Specialized High Income Central Investment Portfolio | | $ | | — | | $ | | 19,986,476 | | $ | | — | | $ | | 19,830,920 | | 9.5% |
| Fidelity Ultra Short Central Fund | | 190,016,425 | | 49,999,990 | | | | — | | 239,885,774 | | 3.4% |
| Total | | $ | | 190,016,425 | | $ | | 69,986,466 | | $ | | — | | $ | | 259,716,694 | | |
See accompanying notes which are an integral part of the financial statements.
VIP Investment Grade Bond Portfolio 162
| VIP Investment Grade Bond Portfolio | | | | | | |
| |
| Financial Statements | | | | | | |
| |
| |
| Statement of Assets and Liabilities | | | | | | |
| | | December 31, 2005 |
| |
| Assets | | | | | | |
| Investment in securities, at value (including repurchase agreements of $94,398,000) — See accompanying schedule: | | | | | | |
| Unaffiliated issuers (cost $1,579,342,435) | | $1,571,232,235 | | | | |
| Affiliated Central Funds (cost $259,738,984) | | 259,716,694 | | | | |
| Total Investments (cost $1,839,081,419) | | | | $1,830,948,929 |
| Commitment to sell securities on a delayed delivery basis | | $ (37,114,589) | | | | |
| Receivable for securities sold on a delayed delivery basis | | 36,948,240 | | | | (166,349) |
| Receivable for investments sold, regular delivery | | | | | | 240,801 |
| Cash | | | | | | 155,538 |
| Receivable for swap agreements | | | | | | 8,599 |
| Receivable for fund shares sold | | | | | | 2,122,071 |
| Interest receivable | | | | | | 12,107,218 |
| Prepaid expenses | | | | | | 8,086 |
| Total assets | | | | 1,845,424,893 |
| |
| Liabilities | | | | | | |
| Payable for investments purchased on a delayed delivery basis | | $ 150,783,486 | | | | |
| Payable for fund shares redeemed | | 988,258 | | | | |
| Swap agreements, at value | | 609,589 | | | | |
| Accrued management fee | | 454,298 | | | | |
| Distribution fees payable | | 65,911 | | | | |
| Other affiliated payables | | 144,819 | | | | |
| Other payables and accrued expenses | | 101,671 | | | | |
| Total liabilities | | | | | | 153,148,032 |
| |
| Net Assets | | | | $ 1,692,276,861 |
| Net Assets consist of: | | | | | | |
| Paid in capital | | | | $1,634,041,356 |
| Undistributed net investment income | | | | | | 67,307,813 |
| Accumulated undistributed net realized gain (loss) on investments | | | | | | (613,070) |
| Net unrealized appreciation (depreciation) on investments | | | | | | (8,459,238) |
| Net Assets | | | | $ 1,692,276,861 |
| |
| Statement of Assets and Liabilities continued | | | | | | |
| �� | | December 31, 2005 |
| |
| Initial Class: | | | | | | |
| Net Asset Value, offering price and redemption price per share ($1,284,599,729 ÷ 100,681,250 shares) | | | | $ | | 12.76 |
| Service Class: | | | | | | |
| Net Asset Value, offering price and redemption price per share ($79,205,016 ÷ 6,244,618 shares) | | | | $ | | 12.68 |
| Service Class 2: | | | | | | |
| Net Asset Value, offering price and redemption price per share ($285,527,869 ÷ 22,707,655 shares) | | | | $ | | 12.57 |
| Investor Class: | | | | | | |
| Net Asset Value, offering price and redemption price per share ($42,944,247 ÷ 3,368,810 shares) | | | | $ | | 12.75 |
See accompanying notes which are an integral part of the financial statements.
|
163 Annual Report
| VIP Investment Grade Bond Portfolio | | | | | | | | |
| Financial Statements - continued | | | | | | | | |
| |
| |
| Statement of Operations | | | | | | | | |
| | | | | Year ended December 31, 2005 |
| |
| Investment Income | | | | | | | | |
| Interest | | | | | | $ | | 67,011,894 |
| Income from affiliated Central Funds | | | | | | | | 8,850,735 |
| Total income | | | | | | | | 75,862,629 |
| |
| Expenses | | | | | | | | |
| Management fee | | $ | | 5,995,165 | | | | |
| Transfer agent fees | | | | 1,125,446 | | | | |
| Distribution fees | | | | 653,579 | | | | |
| Accounting and security lending fees | | | | 587,118 | | | | |
| Independent trustees’ compensation | | | | 7,343 | | | | |
| Custodian fees and expenses | | | | 84,929 | | | | |
| Audit | | | | 54,228 | | | | |
| Legal | | | | 4,700 | | | | |
| Miscellaneous | | | | 128,547 | | | | |
| Total expenses before reductions | | | | 8,641,055 | | | | |
| Expense reductions | | | | (10,113) | | | | 8,630,942 |
| |
| Net investment income | | | | | | | | 67,231,687 |
| Realized and Unrealized Gain (Loss) | | | | | | | | |
| Net realized gain (loss) on: | | | | | | | | |
| Investment securities: | | | | | | | | |
| Unaffiliated issuers | | | | 3,083,214 | | | | |
| Swap agreements | | | | (1,686,743) | | | | |
| Total net realized gain (loss) | | | | | | | | 1,396,471 |
| Change in net unrealized appreciation (depreciation) on: | | | | | | | | |
| Investment securities | | | | (34,242,413) | | | | |
| Swap agreements | | | | 205,651 | | | | |
| Delayed delivery commitments | | | | (166,349) | | | | |
| Total change in net unrealized appreciation (depreciation) | | | | | | | | (34,203,111) |
| Net gain (loss) | | | | | | | | (32,806,640) |
| Net increase (decrease) in net assets resulting from operations | | | | | | $ | | 34,425,047 |
| |
| Statement of Changes in Net Assets | | | | | | | | |
| | | | | Year ended | | | | Year ended |
| | | | | December 31, | | | | December 31, |
| | | | | 2005 | | | | 2004 |
| Increase (Decrease) in Net Assets | | | | | | | | |
| Operations | | | | | | | | |
| Net investment income | | $ | | 67,231,687 | | $ | | 57,762,877 |
| Net realized gain (loss) | | | | 1,396,471 | | | | 37,173,175 |
| Change in net unrealized appreciation (depreciation) | | | | (34,203,111) | | | | (26,687,390) |
| Net increase (decrease) in net assets resulting from operations | | | | 34,425,047 | | | | 68,248,662 |
| Distributions to shareholders from net investment income | | | | (58,445,252) | | | | (66,752,508) |
| Distributions to shareholders from net realized gain | | | | (35,504,454) | | | | (48,129,691) |
| Total distributions | | | | (93,949,706) | | | | (114,882,199) |
| Share transactions - net increase (decrease) | | | | 140,385,374 | | | | (4,083,226) |
| Total increase (decrease) in net assets | | | | 80,860,715 | | | | (50,716,763) |
| |
| Net Assets | | | | | | | | |
| Beginning of period | | | | 1,611,416,146 | | | | 1,662,132,909 |
| End of period (including undistributed net investment income of $67,307,813 and undistributed net investment income | | | | | | | | |
| of $59,329,661, respectively) | | $ | | 1,692,276,861 | | $ | | 1,611,416,146 |
See accompanying notes which are an integral part of the financial statements.
| | |
| VIP Investment Grade Bond | | 164 |
| Financial Highlights Initial Class | | | | | | | | | | |
| |
| Years ended December 31, | | 2005 | | 2004 | | 2003 | | 2002 | | 2001 |
| Selected Per Share Data | | | | | | | | | | |
| Net asset value, beginning of period | | $ 13.25 | | $ 13.65 | | $ 13.70 | | $ 12.92 | | $ 12.59 |
| Income from Investment Operations | | | | | | | | | | |
| Net investment incomeC | | 523 | | .476 | | .467 | | .610 | | .685F |
| Net realized and unrealized gain (loss) | | (.243) | | .104 | | .213 | | .680 | | .335F |
| Total from investment operations | | 280 | | .580 | | .680 | | 1.290 | | 1.020 |
| Distributions from net investment income | | (.480) | | (.570) | | (.540) | | (.510) | | (.690) |
| Distributions from net realized gain | | (.290) | | (.410) | | (.190) | | — | | — |
| Total distributions | | (.770) | | (.980) | | (.730) | | (.510) | | (.690) |
| Net asset value, end of period | | $ 12.76 | | $ 13.25 | | $ 13.65 | | $ 13.70 | | $ 12.92 |
| Total ReturnA,B | | 2.19% | | 4.46% | | 5.20% | | 10.34% | | 8.46% |
| Ratios to Average Net AssetsD,E | | | | | | | | | | |
| Expenses before reductions | | 49% | | .56% | | .54% | | .54% | | .54% |
| Expenses net of fee waivers, if any | | 49% | | .56% | | .54% | | .54% | | .54% |
| Expenses net of all reductions | | 49% | | .56% | | .54% | | .53% | | .54% |
| Net investment income | | 4.12% | | 3.65% | | 3.48% | | 4.71% | | 5.47%F |
| Supplemental Data | | | | | | | | | | |
| Net assets, end of period (000 omitted) | | $1,284,600 | | $1,374,972 | | $1,528,417 | | $1,965,036 | | $1,445,925 |
| Portfolio turnover rate | | 157% | | 170% | | 218% | | 192% | | 278% |
A Total returns do not reflect charges attributable to your insurance company’s separate account. Inclusion of these charges would reduce the total returns shown.
B Total returns would have been lower had certain expenses not been reduced during the periods shown.
C Calculated based on average shares outstanding during the period.
D Amounts do not include the activity of the affiliated central funds.
E Expense ratios reflect operating expenses of the class. Expenses before reductions do not reflect amounts reimbursed by the investment adviser or expense offset arrangements and do not represent the amount paid by the class during periods when
reimbursements or reductions occur. Expenses net of fee waivers reflect expenses after reimbursement by the investment adviser but prior to reductions from expense offset arrangements. Expenses net of all reductions represent the net expenses
paid by the class.
F Effective July 1, 2001, the fund adopted the provisions of the AICPA Audit and Accounting Guide for Investment Companies and began amortizing premium and discount on all debt securities. Per share data and ratios for periods prior to adoption
have not been restated to reflect this change.
|
| Financial Highlights Service Class | | | | | | | | | | |
| |
| Years ended December 31, | | 2005 | | 2004 | | 2003 | | 2002 | | 2001 |
| Selected Per Share Data | | | | | | | | | | |
| Net asset value, beginning of period | | $ 13.18 | | $ 13.61 | | $ 13.66 | | $ 12.89 | | $ 12.58 |
| Income from Investment Operations | | | | | | | | | | |
| Net investment incomeC | | 511 | | .456 | | .448 | | .591 | | .674F |
| Net realized and unrealized gain (loss) | | (.246) | | .104 | | .212 | | .679 | | .326F |
| Total from investment operations | | 265 | | .560 | | .660 | | 1.270 | | 1.000 |
| Distributions from net investment income | | (.475) | | (.580) | | (.520) | | (.500) | | (.690) |
| Distributions from net realized gain | | (.290) | | (.410) | | (.190) | | — | | — |
| Total distributions | | (.765) | | (.990) | | (.710) | | (.500) | | (.690) |
| Net asset value, end of period | | $ 12.68 | | $ 13.18 | | $ 13.61 | | $ 13.66 | | $ 12.89 |
| Total ReturnA,B | | 2.08% | | 4.32% | | 5.06% | | 10.20% | | 8.30% |
| Ratios to Average Net AssetsD,E | | | | | | | | | | |
| Expenses before reductions | | 58% | | .66% | | .64% | | .64% | | .64% |
| Expenses net of fee waivers, if any | | 58% | | .66% | | .64% | | .64% | | .64% |
| Expenses net of all reductions | | 58% | | .66% | | .64% | | .64% | | .64% |
| Net investment income | | 4.06% | | 3.54% | | 3.38% | | 4.60% | | 5.37%F |
| Supplemental Data | | | | | | | | | | |
| Net assets, end of period (000 omitted) | | $ 79,205 | | $ 50,143 | | $ 18,305 | | $ 975 | | $ 115 |
| Portfolio turnover rate | | 157% | | 170% | | 218% | | 192% | | 278% |
A Total returns do not reflect charges attributable to your insurance company’s separate account. Inclusion of these charges would reduce the total returns shown.
B Total returns would have been lower had certain expenses not been reduced during the periods shown.
C Calculated based on average shares outstanding during the period.
D Amounts do not include the activity of the affiliated central funds.
E Expense ratios reflect operating expenses of the class. Expenses before reductions do not reflect amounts reimbursed by the investment adviser or expense offset arrangements and do not represent the amount paid by the class during periods when
reimbursements or reductions occur. Expenses net of fee waivers reflect expenses after reimbursement by the investment adviser but prior to reductions from expense offset arrangements. Expenses net of all reductions represent the net expenses
paid by the class.
F Effective July 1, 2001, the fund adopted the provisions of the AICPA Audit and Accounting Guide for Investment Companies and began amortizing premium and discount on all debt securities. Per share data and ratios for periods prior to adoption
have not been restated to reflect this change.
|
See accompanying notes which are an integral part of the financial statements.
|
165 Annual Report
| Financial Highlights Service Class 2 | | | | | | | | | | |
| |
| Years ended December 31, | | 2005 | | 2004 | | 2003 | | 2002 | | 2001 |
| Selected Per Share Data | | | | | | | | | | |
| Net asset value, beginning of period | | $ 13.08 | | $ 13.50 | | $ 13.57 | | $ 12.82 | | $ 12.54 |
| Income from Investment Operations | | | | | | | | | | |
| Net investment incomeC | | 488 | | .435 | | .427 | | .571 | | .643F |
| Net realized and unrealized gain (loss) | | (.248) | | .105 | | .213 | | .679 | | .327F |
| Total from investment operations | | 240 | | .540 | | .640 | | 1.250 | | .970 |
| Distributions from net investment income | | (.460) | | (.550) | | (.520) | | (.500) | | (.690) |
| Distributions from net realized gain | | (.290) | | (.410) | | (.190) | | — | | — |
| Total distributions | | (.750) | | (.960) | | (.710) | | (.500) | | (.690) |
| Net asset value, end of period | | $ 12.57 | | $ 13.08 | | $ 13.50 | | $ 13.57 | | $ 12.82 |
| Total ReturnA,B | | 1.89% | | 4.19% | | 4.94% | | 10.09% | | 8.08% |
| Ratios to Average Net AssetsD,E | | | | | | | | | | |
| Expenses before reductions | | 73% | | .81% | | .79% | | .79% | | .82% |
| Expenses net of fee waivers, if any | | 73% | | .81% | | .79% | | .79% | | .82% |
| Expenses net of all reductions | | 73% | | .81% | | .79% | | .79% | | .82% |
| Net investment income | | 3.90% | | 3.39% | | 3.23% | | 4.45% | | 5.19%F |
| Supplemental Data | | | | | | | | | | |
| Net assets, end of period (000 omitted) | | $ 285,528 | | $ 186,302 | | $ 115,411 | | $ 71,631 | | $ 18,225 |
| Portfolio turnover rate | | 157% | | 170% | | 218% | | 192% | | 278% |
A Total returns do not reflect charges attributable to your insurance company’s separate account. Inclusion of these charges would reduce the total returns shown.
B Total returns would have been lower had certain expenses not been reduced during the periods shown.
C Calculated based on average shares outstanding during the period.
D Amounts do not include the activity of the affiliated central funds.
E Expense ratios reflect operating expenses of the class. Expenses before reductions do not reflect amounts reimbursed by the investment adviser or expense offset arrangements and do not represent the amount paid by the class during periods when
reimbursements or reductions occur. Expenses net of fee waivers reflect expenses after reimbursement by the investment adviser but prior to reductions from expense offset arrangements. Expenses net of all reductions represent the net expenses
paid by the class.
F Effective July 1, 2001, the fund adopted the provisions of the AICPA Audit and Accounting Guide for Investment Companies and began amortizing premium and discount on all debt securities. Per share data and ratios for periods prior to adoption
have not been restated to reflect this change.
|
| Financial Highlights Investor Class | | |
| |
| Year ended December 31, | | 2005G |
| Selected Per Share Data | | |
| Net asset value, beginning of period | | $ 12.65 |
| Income from Investment Operations | | |
| Net investment incomeE | | 242 |
| Net realized and unrealized gain (loss) | | (.142) |
| Total from investment operations | | 100 |
| Net asset value, end of period | | $ 12.75 |
| Total ReturnB,C,D | | 79% |
| Ratios to Average Net AssetsF,H | | |
| Expenses before reductions | | 49%A |
| Expenses net of fee waivers, if any | | 49%A |
| Expenses net of all reductions | | 49%A |
| Net investment income | | 4.40%A |
| Supplemental Data | | |
| Net assets, end of period (000 omitted) | | $ 42,944 |
| Portfolio turnover rate | | 157% |
A Annualized
B Total returns for periods of less than one year are not annualized.
C Total returns do not reflect charges attributable to your insurance company’s separate account. Inclusion of these charges would reduce the total returns shown.
D Total returns would have been lower had certain expenses not been reduced during the periods shown.
E Calculated based on average shares outstanding during the period.
F Amounts do not include the activity of the affiliated central funds.
G For the period July 21, 2005 (commencement of sale of shares) to December 31, 2005.
H Expense ratios reflect operating expenses of the class. Expenses before reductions do not reflect amounts reimbursed by the investment adviser or expense offset arrangements and do not represent the amount paid by the class during periods when
reimbursements or reductions occur. Expense ratios before reductions for start up periods may not be representative of longer term operating periods. Expenses net of fee waivers reflect expenses after reimbursement by the investment adviser but
prior to reductions from expense offset arrangements. Expenses net of all reductions represent the net expenses paid by the class.
|
See accompanying notes which are an integral part of the financial statements.
| | |
| VIP Investment Grade Bond Portfolio | | 166 |
VIP Money Market Portfolio
Performance: The Bottom Line
|
Average annual total return reflects the change in the value of an investment, assuming reinvestment of the class’ dividend income and capital gains (the profits earned upon the sale of securities that have grown in value) and assuming a constant rate of performance each year. During periods of reimbursement by Fidelity, a fund’s total return will be greater than it would be had the reimbursement not occurred. Performance numbers are net of all underlying fund operating expenses, but do not include any insurance charges imposed by your insurance company’s separate account. If performance information included the effect of these additional charges, the total returns would have been lower. How a fund did yesterday is no guarantee of how it will do tomorrow.
| Average Annual Total Returns | | | | | | |
| Periods ended December 31, 2005 | | Past 1 | | Past 5 | | Past 10 |
| | | year | | years | | years |
| VIP Money Market - Initial Class | | 3.03% | | 2.22% | | 3.88% |
| VIP Money Market - Service ClassA | | 2.92% | | 2.12% | | 3.83% |
| VIP Money Market - Service Class 2B | | 2.77% | | 1.97% | | 3.73% |
| VIP Money Market - Investor ClassC | | 3.01% | | 2.21% | | 3.88% |
A The initial offering of Service Class shares took place on July 7, 2000. Performance for Service Class shares reflects an asset based service fee (12b 1 fee), and returns
prior to July 7, 2000 are those of Initial Class and do not include the effects of Service Class’ 12b 1 fee. Had Service Class’ 12b 1 fee been reflected, returns prior to July 7, 2000
would have been lower.
B The initial offering of Service Class 2 shares took place on January 12, 2000. Performance for Service Class 2 shares reflects an asset based service fee (12b 1 fee), and returns
prior to January 12, 2000 are those of Initial Class and do not include the effects of Service Class 2’s 12b 1 fee. Had Service Class 2’s 12b 1 fee been reflected, returns prior to Janu
ary 12, 2000 would have been lower.
C The initial offering of Investor Class shares took place on July 21, 2005. Returns prior to July 21, 2005 are those of Initial Class. If Investor Class’s transfer agent fee had
been reflected, returns prior to July 21, 2005 would have been lower.
|
167 Annual Report
| VIP Money Market Portfolio | | | | |
| Investment Changes | | |
| |
| |
| Maturity Diversification | | | | |
| Days | | % of fund’s | | % of fund’s | | % of fund’s |
| | | investments | | investments | | investments |
| | | 12/31/05 | | 6/30/05 | | 12/31/04 |
| 0 – 30 | | 66.2 | | 54.5 | | 34.6 |
| 31 – 90 | | 30.2 | | 37.1 | | 44.8 |
| 91 – 180 | | 3.1 | | 6.4 | | 19.2 |
| 181 – 397 | | 0.5 | | 2.0 | | 1.4 |
Weighted Average Maturity | | | | |
| | | 12/31/05 | | 6/30/05 | | 12/31/04 |
| VIP Money Market Portfolio | | 31 Days | | 40 Days | | 56 Days |
| All Taxable Money Market | | | | | | |
| Funds Average* | | 36 Days | | 36 Days | | 38 Days |
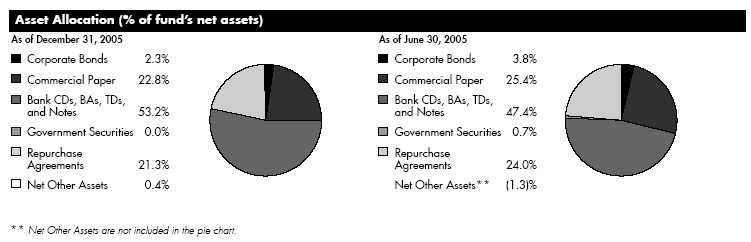
* Source: iMoneyNet, Inc.
VIP Money Market Portfolio 168
| VIP Money Market Portfolio | | | | | | | | | | |
| Investments December 31, 2005 | | | | | | | | |
| Showing Percentage of Net Assets | | | | | | | | | | |
| |
| Corporate Bonds 2.3% | | | | | | | | | | |
| Due | | | | | | Annualized Yield | | Principal | | | | Value |
| Date | | | | | | at Time of | | Amount | | | | (Note 1) |
| | | | | | | Purchase | | | | | | |
| AOL Time Warner, Inc. | | | | | | | | | | | | |
| 4/15/06 | | | | | | 4.03% | | $ 945,000 | | $ | | 950,027 |
| 4/15/06 | | | | | | 4.14 | | 450,000 | | | | 452,267 |
| Bell Trace Obligated Group | | | | | | | | | | | | |
| 1/30/06 | | | | | | 4.29 (c) | | 14,735,000 | | | | 14,735,000 |
| Comcast Cable Communications, Inc. | | | | | | | | | | |
| 1/30/06 | | | | | | 3.74 | | 4,000,000 | | | | 4,007,650 |
| 1/30/06 | | | | | | 3.91 | | 620,000 | | | | 621,082 |
| 1/30/06 | | | | | | 4.43 | | 320,000 | | | | 320,455 |
| 1/30/06 | | | | | | 4.47 | | 175,000 | | | | 175,241 |
| Continental Cablevision, Inc. | | | | | | | | | | | | |
| 5/15/06 | | | | | | 4.70 | | 1,200,000 | | | | 1,215,501 |
| France Telecom SA | | | | | | | | | | | | |
| 3/1/06 | | | | | | 3.37 | | 90,000 | | | | 90,517 |
| 3/1/06 | | | | | | 3.41 | | 270,000 | | | | 271,576 |
| 3/1/06 | | | | | | 3.43 | | 265,000 | | | | 266,513 |
| 3/1/06 | | | | | | 3.45 | | 85,000 | | | | 85,476 |
| 3/1/06 | | | | | | 3.54 | | 350,000 | | | | 351,957 |
| 3/1/06 | | | | | | 3.55 | | 535,000 | | | | 537,970 |
| 3/1/06 | | | | | | 3.56 | | 660,000 | | | | 663,667 |
| 3/1/06 | | | | | | 3.59 | | 140,000 | | | | 140,774 |
| Household Finance Corp. | | | | | | | | | | | | |
| 1/24/06 | | | | | | 2.98 | | 10,000,000 | | | | 10,020,700 |
| TCI Communications, Inc. | | | | | | | | | | | | |
| 2/15/06 | | | | | | 4.51 | | 250,000 | | | | 250,655 |
| TOTAL CORPORATE BONDS | | | | | | | | | | 35,157,028 |
| |
| Certificates of Deposit | | 19.1% | | | | | | | | | | |
| |
| Domestic Certificates Of Deposit | | 0.8% | | | | | | | | | | |
| Huntington National Bank, Columbus | | | | | | | | | | |
| 3/23/06 | | | | | | 4.31 | | 2,000,000 | | | | 2,000,000 |
| Washington Mutual Bank FA | | | | | | | | | | | | |
| 3/14/06 | | | | | | 4.45 | | 10,000,000 | | | | 10,000,000 |
| | | | | | | | | | | | | 12,000,000 |
| London Branch, Eurodollar, Foreign Banks – 5.1% | | | | | | | | | | |
| Credit Agricole SA | | | | | | | | | | | | |
| 3/31/06 | | | | | | 3.88 | | 10,000,000 | | | | 10,000,000 |
| Credit Industriel et Commercial | | | | | | | | | | | | |
| 1/13/06 | | | | | | 4.11 | | 15,000,000 | | | | 15,000,000 |
| 1/30/06 | | | | | | 4.08 | | 15,000,000 | | | | 15,000,000 |
| 4/20/06 | | | | | | 3.95 | | 10,000,000 | | | | 10,000,000 |
| Royal Bank of Scotland PLC | | | | | | | | | | | | |
| 1/31/06 | | | | | | 4.29 | | 10,000,000 | | | | 10,000,000 |
| Societe Generale | | | | | | | | | | | | |
| 4/28/06 | | | | | | 4.00 | | 15,000,000 | | | | 15,000,000 |
| 12/6/06 | | | | | | 4.80 | | 5,000,000 | | | | 5,000,000 |
| | | | | | | | | | | | | 80,000,000 |
See accompanying notes which are an integral part of the financial statements.
|
169 Annual Report
169
| VIP Money Market Portfolio | | | | | | |
| Investments - continued | | | | | | |
| |
| |
| |
| Due | | Annualized Yield | | Principal | | Value |
| Date | | at Time of | | Amount | | (Note 1) |
| | | Purchase | | | | |
| New York Branch, Yankee Dollar, Foreign Banks – 13.2% | | | | | | |
| Bank of Tokyo Mitsubishi Ltd. | | | | | | |
| 1/17/06 | | 4.38% | | $ 15,000,000 | | $ 15,000,000 |
| 1/27/06 | | 4.34 | | 15,000,000 | | 15,000,000 |
| 1/30/06 | | 4.30 | | 10,000,000 | | 10,000,000 |
| Canadian Imperial Bank of Commerce | | | | | | |
| 1/15/06 | | 4.43 (c) | | 20,000,000 | | 20,000,000 |
| Credit Industriel et Commercial | | | | | | |
| 2/13/06 | | 4.00 | | 8,000,000 | | 8,000,000 |
| 2/15/06 | | 4.01 | | 10,000,000 | | 10,000,000 |
| Credit Suisse First Boston New York Branch | | | | | | |
| 1/19/06 | | 4.14 (c) | | 10,000,000 | | 10,000,000 |
| 1/19/06 | | 4.35 (c) | | 10,000,000 | | 10,000,000 |
| DEPFA BANK PLC | | | | | | |
| 2/1/06 | | 4.30 | | 10,000,000 | | 10,000,000 |
| Dresdner Bank AG | | | | | | |
| 1/13/06 | | 3.78 | | 10,000,000 | | 10,000,000 |
| Eurohypo AG | | | | | | |
| 1/30/06 | | 4.27 | | 5,000,000 | | 5,000,000 |
| 1/31/06 | | 4.27 | | 5,000,000 | | 5,000,000 |
| 3/28/06 | | 4.35 (a) | | 6,000,000 | | 6,000,000 |
| Mizuho Corporate Bank Ltd. | | | | | | |
| 1/30/06 | | 4.37 | | 15,000,000 | | 15,000,000 |
| Royal Bank of Scotland PLC | | | | | | |
| 1/31/06 | | 4.28 | | 15,000,000 | | 15,000,000 |
| Skandinaviska Enskilda Banken AB | | | | | | |
| 1/6/06 | | 4.05 (c) | | 20,000,000 | | 19,998,479 |
| Toronto Dominion Bank | | | | | | |
| 4/7/06 | | 3.86 | | 10,000,000 | | 10,000,000 |
| Unicredito Italiano Spa | | | | | | |
| 2/13/06 | | 4.28 (c) | | 10,000,000 | | 9,999,464 |
| | | | | | | 203,997,943 |
| |
| TOTAL CERTIFICATES OF DEPOSIT | | | | | | 295,997,943 |
| |
| Commercial Paper 22.8% | | | | | | |
| |
| Bank of America Corp. | | | | | | |
| 2/1/06 | | 4.31 | | 15,000,000 | | 14,944,717 |
| Barclays U.S. Funding Corp. | | | | | | |
| 1/24/06 | | 4.24 | | 10,000,000 | | 9,973,135 |
| Citibank Credit Card Master Trust I (Dakota Certificate Program) | | | | | | |
| 1/24/06 | | 4.30 | | 5,000,000 | | 4,986,360 |
| 2/1/06 | | 4.33 | | 5,000,000 | | 4,981,486 |
| 2/2/06 | | 4.35 | | 10,000,000 | | 9,961,600 |
| Citigroup Funding, Inc. | | | | | | |
| 1/24/06 | | 4.28 | | 5,000,000 | | 4,986,424 |
| 1/26/06 | | 4.30 | | 5,000,000 | | 4,985,174 |
| 1/31/06 | | 4.30 | | 5,000,000 | | 4,982,208 |
See accompanying notes which are an integral part of the financial statements.
| | |
| VIP Money Market Portfolio | | 170 |
| Commercial Paper continued | | | | | | | | | | |
| Due | | | | Annualized Yield | | Principal | | | | Value |
| Date | | | | at Time of | | Amount | | | | (Note 1) |
| | | | | Purchase | | | | | | |
| Comcast Corp. | | | | | | | | | | |
| 1/25/06 | | | | 4.44% (b) | | $ 1,000,000 | | $ | | 997,050 |
| Countrywide Financial Corp. | | | | | | | | | | |
| 1/27/06 | | | | 4.33 | | 5,000,000 | | | | 4,984,472 |
| DaimlerChrysler NA Holding Corp. | | | | | | | | | | |
| 1/4/06 | | | | 4.45 | | 1,000,000 | | | | 999,631 |
| 1/27/06 | | | | 4.52 | | 2,000,000 | | | | 1,993,500 |
| 1/30/06 | | | | 4.54 | | 2,000,000 | | | | 1,992,718 |
| 1/31/06 | | | | 4.52 | | 3,500,000 | | | | 3,486,875 |
| Dominion Resources, Inc. | | | | | | | | | | |
| 1/31/06 | | | | 4.45 | | 500,000 | | | | 498,154 |
| Emerald (MBNA Credit Card Master Note Trust) | | | | | | | | | | |
| 2/2/06 | | | | 4.36 | | 17,000,000 | | | | 16,934,569 |
| 2/9/06 | | | | 4.38 | | 5,000,000 | | | | 4,976,438 |
| 3/14/06 | | | | 4.48 | | 5,000,000 | | | | 4,955,700 |
| FCAR Owner Trust | | | | | | | | | | |
| 3/15/06 | | | | 4.46 | | 5,000,000 | | | | 4,955,288 |
| 4/4/06 | | | | 4.52 | | 5,000,000 | | | | 4,942,392 |
| Federated Retail Holdings, Inc. | | | | | | | | | | |
| 1/5/06 | | | | 4.27 | | 1,000,000 | | | | 999,529 |
| 1/9/06 | | | | 4.30 | | 1,000,000 | | | | 999,049 |
| 1/26/06 | | | | 4.37 | | 500,000 | | | | 498,493 |
| Fortune Brands, Inc. | | | | | | | | | | |
| 1/9/06 | | | | 4.30 | | 1,000,000 | | | | 999,053 |
| 1/17/06 | | | | 4.34 | | 1,000,000 | | | | 998,089 |
| 1/23/06 | | | | 4.30 | | 6,000,000 | | | | 5,984,417 |
| 1/24/06 | | | | 4.30 | | 1,000,000 | | | | 997,285 |
| 2/1/06 | | | | 4.35 | | 1,000,000 | | | | 996,289 |
| 2/21/06 | | | | 4.55 | | 5,000,000 | | | | 4,968,125 |
| Giro Funding US Corp. | | | | | | | | | | |
| 1/10/06 | | | | 4.26 | | 25,000,000 | | | | 24,973,500 |
| 3/21/06 | | | | 4.45 | | 5,000,000 | | | | 4,951,832 |
| Govco, Inc. | | | | | | | | | | |
| 3/16/06 | | | | 4.01 | | 5,000,000 | | | | 4,959,608 |
| Grampian Funding LLC | | | | | | | | | | |
| 3/28/06 | | | | 4.42 | | 5,000,000 | | | | 4,948,042 |
| HSBC Finance Corp. | | | | | | | | | | |
| 1/31/06 | | | | 4.31 | | 5,000,000 | | | | 4,982,167 |
| Johnson Controls, Inc. | | | | | | | | | | |
| 1/17/06 | | | | 4.42 (b) | | 15,000,000 | | | | 14,970,667 |
| Kellogg Co. | | | | | | | | | | |
| 1/17/06 | | | | 4.38 | | 1,500,000 | | | | 1,497,093 |
| 1/26/06 | | | | 4.42 | | 500,000 | | | | 498,472 |
| Motown Notes Program | | | | | | | | | | |
| 1/9/06 | | | | 4.12 | | 28,200,000 | | | | 28,174,432 |
| 2/6/06 | | | | 4.39 | | 5,000,000 | | | | 4,978,200 |
| Nationwide Building Society | | | | | | | | | | |
| 2/1/06 | | | | 4.31 | | 5,000,000 | | | | 4,981,572 |
| Newport Funding Corp. | | | | | | | | | | |
| 1/17/06 | | | | 4.24 | | 15,000,000 | | | | 14,971,933 |
| |
See accompanying notes which are an integral part of the financial statements.
| | | | | | | | | | |
| | | 171 | | | | | | Annual Report |
171
| VIP Money Market Portfolio | | | | | | | | |
| Investments - continued | | | | | | | | |
| |
| |
| |
| Due | | Annualized Yield | | Principal | | | | Value |
| Date | | at Time of | | Amount | | | | (Note 1) |
| | | Purchase | | | | | | |
| Nissan Motor Acceptance Corp. | | | | | | | | |
| 1/20/06 | | 4.44% | | $ 1,000,000 | | $ | | 997,667 |
| 3/20/06 | | 4.53 | | 2,000,000 | | | | 1,980,587 |
| 3/23/06 | | 4.56 | | 1,500,000 | | | | 1,484,779 |
| Oracle Corp. | | | | | | | | |
| 1/30/06 | | 4.37 | | 14,849,000 | | | | 14,796,967 |
| 1/30/06 | | 4.39 | | 4,000,000 | | | | 3,985,951 |
| Paradigm Funding LLC | | | | | | | | |
| 1/9/06 | | 4.06 | | 10,000,000 | | | | 9,991,078 |
| Park Granada LLC | | | | | | | | |
| 1/23/06 | | 4.20 | | 5,000,000 | | | | 4,987,304 |
| 1/24/06 | | 4.22 | | 5,000,000 | | | | 4,986,663 |
| 3/16/06 | | 4.48 | | 5,000,000 | | | | 4,954,469 |
| Skandinaviska Enskilda Banken AB | | | | | | | | |
| 1/30/06 | | 4.35 (c) | | 20,000,000 | | | | 20,000,000 |
| Strand Capital LLC | | | | | | | | |
| 1/17/06 | | 3.91 | | 5,000,000 | | | | 4,991,422 |
| 2/13/06 | | 4.17 | | 5,000,000 | | | | 4,975,454 |
| Stratford Receivables Co. LLC | | | | | | | | |
| 1/19/06 | | 4.28 | | 5,000,000 | | | | 4,989,375 |
| 1/30/06 | | 4.35 | | 5,000,000 | | | | 4,982,600 |
| 2/8/06 | | 4.39 | | 5,000,000 | | | | 4,976,989 |
| The Walt Disney Co. | | | | | | | | |
| 2/1/06 | | 4.43 | | 2,500,000 | | | | 2,490,528 |
| Weatherford International Ltd. | | | | | | | | |
| 1/26/06 | | 4.45 (b) | | 1,500,000 | | | | 1,495,385 |
| 1/31/06 | | 4.47 (b) | | 500,000 | | | | 498,146 |
| 3/22/06 | | 4.56 (b) | | 900,000 | | | | 890,980 |
| White Pine Finance LLC | | | | | | | | |
| 1/23/06 | | 4.32 (b)(c) | | 10,000,000 | | | | 9,999,362 |
| TOTAL COMMERCIAL PAPER | | | | | | 352,301,444 |
| |
| Master Notes 3.0% | | | | | | | | |
| |
| Goldman Sachs Group, Inc. | | | | | | | | |
| 1/9/06 | | 3.69 (f) | | 6,000,000 | | | | 6,000,000 |
| 1/11/06 | | 4.42 (c)(f) | | 5,000,000 | | | | 5,000,000 |
| 2/27/06 | | 4.45 (c)(f) | | 36,000,000 | | | | 36,000,000 |
| TOTAL MASTER NOTES | | | | | | 47,000,000 |
| |
| Medium Term Notes 25.0% | | | | | | | | |
| |
| AIG Matched Funding Corp. | | | | | | | | |
| 1/3/06 | | 4.06 (c) | | 10,000,000 | | | | 10,000,000 |
| 1/11/06 | | 4.13 (c) | | 10,000,000 | | | | 10,000,000 |
| 1/23/06 | | 4.02 (c) | | 10,000,000 | | | | 10,000,000 |
| 3/15/06 | | 4.51 (c) | | 10,000,000 | | | | 10,000,000 |
| Allstate Life Global Funding II | | | | | | | | |
| 1/27/06 | | 4.37 (b)(c) | | 1,000,000 | | | | 1,000,000 |
| See accompanying notes which are an integral part of the financial statements. | | |
| VIP Money Market Portfolio | | 172 |
| Medium Term Notes continued | | | | | | |
| Due | | | | Annualized Yield | | Principal | | Value |
| Date | | | | at Time of | | Amount | | (Note 1) |
| | | | | Purchase | | | | |
| American Express Credit Corp. | | | | | | | | |
| 1/5/06 | | | | 4.39% (c) | | $ 10,000,000 | | $ 10,000,628 |
| Australia & New Zealand Banking Group Ltd. | | | | | | |
| 1/23/06 | | | | 4.35 (b)(c) | | 5,000,000 | | 5,000,000 |
| Bank of New York Co., Inc. | | | | | | | | |
| 1/30/06 | | | | 4.42 (b)(c) | | 15,000,000 | | 15,000,000 |
| Bayerische Landesbank Girozentrale | | | | | | |
| 1/17/06 | | | | 4.13 (c) | | 10,000,000 | | 10,000,000 |
| 2/20/06 | | | | 4.38 (c) | | 15,000,000 | | 15,000,000 |
| BellSouth Corp. | | | | | | | | |
| 4/26/06 | | | | 4.26 (b)(c) | | 975,000 | | 975,098 |
| BellSouth Telecommunications | | | | | | | | |
| 1/4/06 | | | | 4.50 (c) | | 5,000,000 | | 5,000,000 |
| BMW U.S. Capital LLC | | | | | | | | |
| 1/17/06 | | | | 4.34 (c) | | 2,000,000 | | 2,000,000 |
| Commonwealth Bank of Australia | | | | | | |
| 1/24/06 | | | | 4.35 (c) | | 4,000,000 | | 4,000,000 |
| Cullinan Finance Corp. | | | | | | | | |
| 1/25/06 | | | | 4.34 (b)(c) | | 5,000,000 | | 4,999,553 |
| Descartes Funding Trust | | | | | | | | |
| 1/17/06 | | | | 4.37 (c) | | 5,000,000 | | 5,000,000 |
| General Electric Capital Corp. | | | | | | | | |
| 3/30/06 | | | | 3.85 | | 14,073,000 | | 14,119,110 |
| HBOS Treasury Services PLC | | | | | | | | |
| 3/24/06 | | | | 4.57 (c) | | 20,000,000 | | 20,000,000 |
| HSBC Finance Corp. | | | | | | | | |
| 1/24/06 | | | | 4.37 (c) | | 6,000,000 | | 6,000,000 |
| HSBC USA, Inc. | | | | | | | | |
| 1/17/06 | | | | 4.35 (c) | | 5,000,000 | | 5,000,000 |
| HSH Nordbank AG | | | | | | | | |
| 1/23/06 | | | | 4.37 (b)(c) | | 6,000,000 | | 6,000,000 |
| ING USA Annuity & Life Insurance Co. | | | | | | |
| 3/24/06 | | | | 4.60 (c)(f) | | 3,000,000 | | 3,000,000 |
| International Lease Finance Corp. | | | | | | |
| 1/17/06 | | | | 4.00 | | 4,000,000 | | 3,999,740 |
| Links Finance LLC | | | | | | | | |
| 1/19/06 | | | | 4.33 (b)(c) | | 10,000,000 | | 9,998,553 |
| MBIA Global Funding LLC | | | | | | | | |
| 1/17/06 | | | | 4.11 (b)(c) | | 2,000,000 | | 2,000,000 |
| Merrill Lynch & Co., Inc. | | | | | | | | |
| 1/4/06 | | | | 4.34 (c) | | 4,000,000 | | 4,003,837 |
| 1/17/06 | | | | 4.35 (c) | | 9,000,000 | | 9,000,000 |
| Metropolitan Life Insurance Co. | | | | | | |
| 1/6/06 | | | | 4.31 (b)(c) | | 3,884,000 | | 3,884,000 |
See accompanying notes which are an integral part of the financial statements.
|
173 Annual Report
173
| VIP Money Market Portfolio | | | | | | |
| Investments - continued | | | | | | |
| |
| |
| |
| Due | | Annualized Yield | | Principal | | Value |
| Date | | at Time of | | Amount | | (Note 1) |
| | | Purchase | | | | |
| Morgan Stanley | | | | | | |
| 1/3/06 | | 4.30% (c) | | $ 25,000,000 | | $ 25,000,000 |
| 1/3/06 | | 4.33 (c) | | 2,000,000 | | 2,000,000 |
| 1/4/06 | | 4.34 (c) | | 5,000,000 | | 5,000,000 |
| 1/17/06 | | 4.40 (c) | | 5,000,000 | | 5,000,000 |
| 1/27/06 | | 4.45 (c) | | 11,000,000 | | 11,000,245 |
| RACERS | | | | | | |
| 1/23/06 | | 4.37 (b)(c) | | 15,000,000 | | 15,000,000 |
| Royal Bank of Scotland PLC | | | | | | |
| 1/23/06 | | 4.34 (b)(c) | | 10,000,000 | | 10,000,000 |
| SBC Communications, Inc. | | | | | | |
| 6/5/06 | | 3.96 (b) | | 3,920,000 | | 3,925,959 |
| Security Life of Denver Insurance Co. | | | | | | |
| 2/28/06 | | 4.48 (c)(f) | | 2,000,000 | | 2,000,000 |
| Verizon Global Funding Corp. | | | | | | |
| 3/15/06 | | 4.60 (c) | | 50,000,000 | | 50,000,081 |
| Washington Mutual Bank FA | | | | | | |
| 1/17/06 | | 4.35 (c) | | 2,000,000 | | 2,000,000 |
| Washington Mutual Bank, California | | | | | | |
| 1/27/06 | | 4.20 (c) | | 10,000,000 | | 10,000,000 |
| 2/6/06 | | 4.26 (c) | | 10,000,000 | | 10,000,000 |
| 3/20/06 | | 4.48 (c) | | 8,000,000 | | 8,000,000 |
| 3/27/06 | | 4.50 (c) | | 10,000,000 | | 9,999,741 |
| WestLB AG | | | | | | |
| 1/10/06 | | 4.37 (b)(c) | | 6,000,000 | | 6,000,000 |
| 3/30/06 | | 4.53 (b)(c) | | 7,000,000 | | 7,000,000 |
| TOTAL MEDIUM-TERM NOTES | | | | | | 386,906,545 |
| |
| Short Term Notes 5.0% | | | | | | |
| |
| Jackson National Life Insurance Co. | | | | | | |
| 1/2/06 | | 4.19 (c)(f) | | 7,000,000 | | 7,000,000 |
| Metropolitan Life Insurance Co. | | | | | | |
| 1/2/06 | | 4.19 (c)(f) | | 10,000,000 | | 10,000,000 |
| 1/30/06 | | 4.45 (b)(c) | | 5,000,000 | | 5,000,000 |
| 2/1/06 | | 4.41 (c)(f) | | 5,000,000 | | 5,000,000 |
| Monumental Life Insurance Co. | | | | | | |
| 1/3/06 | | 4.43 (c)(f) | | 5,000,000 | | 5,000,000 |
| 1/3/06 | | 4.46 (c)(f) | | 5,000,000 | | 5,000,000 |
| New York Life Insurance Co. | | | | | | |
| 1/3/06 | | 4.15 (c)(f) | | 30,000,000 | | 30,000,000 |
| Transamerica Occidental Life Insurance Co. | | | | | | |
| 2/1/06 | | 4.42 (c)(f) | | 10,000,000 | | 10,000,000 |
| TOTAL SHORT TERM NOTES | | | | | | 77,000,000 |
See accompanying notes which are an integral part of the financial statements.
| | |
| VIP Money Market Portfolio | | 174 |
| Municipal Securities 1.1% | | | | | | | | |
| | | | | | | Principal | | Value |
| | | | | | | Amount | | (Note 1) |
| California Econ. Recovery Series 2004 C20, 3.52% (XL Cap. Assurance, Inc. Insured), VRDN (c) | | $ | | 1,600,000 | | $ 1,599,808 |
| California Statewide Cmntys. | | | | | | | | |
| Dev. Auth. Rev. TRAN Series C3, 3.93% 6/30/06 | | | | | | 2,950,000 | | 2,950,000 |
| District of Columbia Gen. Oblig. Series B, 3.55% (FSA Insured), VRDN (c) | | | | | | 400,000 | | 399,952 |
| San Jose Redev. Agcy. Rev. Series A, 4.45%, LOC JPMorgan Chase Bank, VRDN (c)(d) | | | | 11,250,000 | | 11,250,000 |
| Waco Edl. Fin. Corp. Rev. (Baylor Univ. Proj.) Series A, 3.52% (XL Cap. Assurance, Inc. Insured), VRDN (c) | | | | 600,000 | | 599,928 |
| TOTAL MUNICIPAL SECURITIES | | | | | | | | 16,799,688 |
| |
| Repurchase Agreements 21.3% | | | | | | | | |
| | | | | | | Maturity | | |
| | | | | | | Amount | | |
| In a joint trading account (Collateralized by U.S. Government Obligations dated 12/30/05 due 1/3/06 At 4.3%) | | $ | | 596,285 | | 596,000 |
| With:�� | | | | | | | | |
| Barclays Capital, Inc. At 4.36%, dated 12/30/05 due 1/3/06 (Collateralized by Equity Securities valued at | | | | | | |
| $66,150,005) | | | | | | 63,030,520 | | 63,000,000 |
| Citigroup Global Markets, Inc. At 4.35%, dated 12/30/05 due 1/3/06 (Collateralized by Corporate Obligations | | | | | | |
| valued at $77,520,000, 5.5% 7.7%, 4/1/11 12/1/45) | | | | | | 76,036,733 | | 76,000,000 |
| Countrywide Securities Corp. At 4.32%, dated: | | | | | | | | |
| 12/16/05 due 1/3/06 (Collateralized by Mortgage | | | | | | | | |
| Loan Obligations valued at $8,400,000, 4.3% 5.55%, 12/25/35 10/25/43) (c)(e) | | | | 8,017,280 | | 8,000,000 |
| 12/19/05 due 1/3/06 (Collateralized by Mortgage | | | | | | | | |
| Loan Obligations valued at $8,400,001, 5.33% 5.55%, 7/20/35 2/25/36) (c)(e) | | | | 8,014,400 | | 8,000,000 |
| Goldman Sachs & Co. At 4.35%, dated: | | | | | | | | |
| 12/19/05 due 2/22/06 (Collateralized by Corporate Obligations valued at $25,588,597, 4.5% – 7.5%, 3/20/10 | | | | |
| – 9/25/35) (c)(e) | | | | | | 25,196,354 | | 25,000,000 |
| 12/30/05 due 1/3/06 (Collateralized by Mortgage | | | | | | | | |
| Loan Obligations valued at $4,200,001, 4.64%, 12/25/35) | | | | | | 4,001,933 | | 4,000,000 |
| |
| |
| | | | | | | Maturity | | Value |
| | | | | | | Amount | | (Note 1) |
| J.P. Morgan Securities, Inc. At 4.38%, dated 12/14/05 due 2/1/06 (Collateralized by Corporate Obligations valued | | | | | | |
| at $17,888,092, 6.63% 12%, 11/15/09 10/1/28) | | | | $ | | 17,101,348 | | $ 17,000,000 |
| Merrill Lynch, Pierce, Fenner & Smith At 4.39%, dated 10/25/05 due 1/23/06 (Collateralized by Corporate | | | | | | |
| Obligations valued at $24,174,108, 5.16% 8.3%, 3/18/08 3/18/13) (c)(e) | | | | 23,252,425 | | 23,000,000 |
| Morgan Stanley & Co. At: | | | | | | | | |
| 4.38%, dated 12/14/05 due 2/1/06 (Collateralized by Mortgage Loan Obligations valued at $21,107,061, | | | | | | |
| 0.25% – 4.69%, 2/10/24 – 7/19/45) | | | | | | 20,119,233 | | 20,000,000 |
| 4.4%, dated 12/30/05 due 1/3/06 (Collateralized by Equity Securities valued at $8,400,020) | | | | 8,003,911 | | 8,000,000 |
| Wachovia Securities, Inc. At 4.32%, dated 12/30/05 due 1/3/06 (Collateralized by Mortgage Loan Obligations | | | | | | |
| valued at $77,520,001, 0.36% 7.3%, 1/20/08 8/15/42) | | | | | | 76,036,480 | | 76,000,000 |
| TOTAL REPURCHASE AGREEMENTS | | | | | | | | 328,596,000 |
| |
| TOTAL INVESTMENT PORTFOLIO 99.6% | | | | | | | | |
| (Cost $1,539,758,648) | | | | | | 1,539,758,648 |
| |
| NET OTHER ASSETS 0.4% | | | | | | | | 6,395,506 |
| NET ASSETS 100% | | | | | | $ 1,546,154,154 |
| Security Type Abbreviations |
| TRAN | | — | | TAX AND REVENUE ANTICIPATION NOTE |
| VRDN | | — | | VARIABLE RATE DEMAND NOTE |
See accompanying notes which are an integral part of the financial statements.
175 Annual Report
175
VIP Money Market Portfolio
Investments - continued
|
Legend
(a) Debt obligation initially issued at one coupon which converts to a higher coupon at a specified date. The rate shown is the rate at period end.
(b) Security exempt from registration under Rule 144A of the Securities Act of 1933. These securities may be resold in transactions exempt from registration,
normally to qualified institutional buyers. At the period end, the value of these securities amounted to $124,634,753 or 8.1% of net assets.
(c) The coupon rate shown on floating or adjustable rate securities represents the rate at period end. The due dates on these types of securities reflect the next
interest rate reset date or, when applicable, the final maturity date.
(d) Private activity obligations whose interest is subject to the federal alternative minimum tax for individuals.
(e) The maturity amount is based on the rate at period end.
(f) Restricted securities – Investment in securities not registered under the Securities Act of 1933 (excluding 144A issues). At the end of the period, the value of
restricted securities (excluding 144A issues) amounted to $124,000,000 or 8.0% of net assets.
|
Additional information on each holding is as follows:
| Security | | Acquisition Date | | Cost | | |
| Goldman Sachs Group, Inc.: | | | | | | |
| 3.69%, 1/9/06 | | 4/12/05 | | $ 6,000,000 | | |
| 4.42%, 1/11/06 | | 10/11/05 | | $ 5,000,000 | | |
| 4.45%, 2/27/06 | | 8/26/04 | | $ 36,000,000 | | |
| ING USA Annuity & Life Insurance Co. 4.6%, 3/24/06 | | 6/23/05 | | $ 3,000,000 | | |
| Jackson National Life Insurance Co. 4.19%, 1/2/06 | | 3/31/03 | | $ 7,000,000 | | |
| Metropolitan Life Insurance Co.: | | | | | | |
| 4.19%, 1/2/06 | | 3/26/02 | | $ 10,000,000 | | |
| 4.41%, 2/1/06 | | 2/24/03 | | $ 5,000,000 | | |
| Monumental Life Insurance Co.: | | | | | | |
| 4.43%, 1/3/06 | | 9/17/98 | | $ 5,000,000 | | |
| 4.46%, 1/3/06 | | 3/12/99 | | $ 5,000,000 | | |
| New York Life Insurance Co. | | | | | | |
| 4.15%, 1/3/06 | | 2/28/02 - 12/19/02 | | $ 30,000,000 | | |
| Security Life of Denver Insurance Co. | | | | | | |
| 4.48%, 2/28/06 | | 8/26/05 | | $ 2,000,000 | | |
| Transamerica Occidental Life Insurance Co. 4.42%, 2/1/06 | | 4/28/00 | | $ 10,000,000 | | |
Income Tax Information
At December 31, 2005, the fund had a capital loss carryforward of approximately $389,008 of which $108,598, $174,987 and $105,423 will expire on December 31, 2011, 2012 and 2013, respectively.
See accompanying notes which are an integral part of the financial statements.
VIP Money Market Portfolio 176
| VIP Money Market Portfolio | | | | | | |
| |
| Financial Statements | | | | | | |
| |
| |
| Statement of Assets and Liabilities | | | | | | |
| | | December 31, 2005 |
| |
| Assets | | | | | | |
| Investment in securities, at value (including repurchase agreements of $328,596,000) — See accompanying schedule: | | | | | | |
| Unaffiliated issuers (cost $1,539,758,648) | | | | $ | | 1,539,758,648 |
| Cash | | | | | | 87,453 |
| Receivable for fund shares sold | | | | | | 3,647,376 |
| Interest receivable | | | | | | 5,903,067 |
| Prepaid expenses | | | | | | 7,271 |
| Other receivables | | | | | | 10 |
| Total assets | | | | | | 1,549,403,825 |
| |
| Liabilities | | | | | | |
| Payable for fund shares redeemed | | $ 2,616,075 | | | | |
| Distributions payable | | 175,776 | | | | |
| Accrued management fee | | 278,512 | | | | |
| Distribution fees payable | | 11,747 | | | | |
| Other affiliated payables | | 106,817 | | | | |
| Other payables and accrued expenses | | 60,744 | | | | |
| Total liabilities | | | | | | 3,249,671 |
| |
| Net Assets | | | | $ | | 1,546,154,154 |
| Net Assets consist of: | | | | | | |
| Paid in capital | | | | $ | | 1,546,490,042 |
| Distributions in excess of net investment income | | | | | | (25,356) |
| Accumulated undistributed net realized gain (loss) on investments | | | | | | (310,532) |
| Net Assets | | | | $ | | 1,546,154,154 |
| |
| Initial Class: | | | | | | |
| Net Asset Value, offering price and redemption price | | | | | | |
| per share ($1,347,642,354 ÷ 1,347,945,039 shares) | | | | $ | | 1.00 |
| Service Class: | | | | | | |
| Net Asset Value, offering price | | | | | | |
| and redemption price | | | | | | |
| per share ($20,987,178 ÷ 20,990,018 shares) | | | | $ | | 1.00 |
| Service Class 2: | | | | | | |
| Net Asset Value, offering price | | | | | | |
| and redemption price | | | | | | |
| per share ($51,300,573 ÷ 51,305,199 shares) | | | | $ | | 1.00 |
| Investor Class: | | | | | | |
| Net Asset Value, offering price and redemption price | | | | | | |
| per share ($126,224,049 ÷ 126,224,500 shares) | | | | $ | | 1.00 |
See accompanying notes which are an integral part of the financial statements.
|
177 Annual Report
| VIP Money Market Portfolio | | | | | | | | |
| Financial Statements - continued | | | | | | | | |
| |
| |
| Statement of Operations | | | | | | | | |
| | | | | Year ended December 31, 2005 |
| |
| Investment Income | | | | | | | | |
| Interest (including $17,929 from affiliated interfund lending) | | | | | | | $ | 49,864,460 |
| |
| Expenses | | | | | | | | |
| Management fee | | | | $ | | 3,053,839 | | |
| Transfer agent fees | | | | | | 1,039,225 | | |
| Distribution fees | | | | | | 108,870 | | |
| Accounting fees and expenses | | | | | | 165,551 | | |
| Independent trustees’ compensation | | | | | | 6,746 | | |
| Custodian fees and expenses | | | | | | 39,643 | | |
| Audit | | | | | | 42,049 | | |
| Legal | | | | | | 3,967 | | |
| Miscellaneous | | | | | | 52,597 | | |
| Total expenses before reductions | | | | | | 4,512,487 | | |
| Expense reductions | | | | | | (3,425) | | 4,509,062 |
| |
| Net investment income | | | | | | | | 45,355,398 |
| Realized and Unrealized Gain (Loss) | | | | | | | | |
| Net realized gain (loss) on: | | | | | | | | |
| Investment securities: | | | | | | | | |
| Unaffiliated issuers | | | | | | | | (105,423) |
| Net increase in net assets resulting from operations | | | | | | | $ | 45,249,975 |
See accompanying notes which are an integral part of the financial statements.
| | |
| VIP Money Market Portfolio | | 178 |
| Statement of Changes in Net Assets | | | | |
| | | Year ended | | Year ended |
| | | December 31, | | December 31, |
| | | 2005 | | 2004 |
| Increase (Decrease) in Net Assets | | | | |
| Operations | | | | |
| Net investment income | | $ 45,355,398 | | $ 19,774,748 |
| Net realized gain (loss) | | (105,423) | | (174,987) |
| Net increase in net assets resulting from operations | | 45,249,975 | | 19,599,761 |
| Distributions to shareholders from net investment income | | (45,352,183) | | (19,778,361) |
| Share transactions - net increase (decrease) | | 119,003,253 | | (412,681,844) |
| Total increase (decrease) in net assets | | 118,901,045 | | (412,860,444) |
| |
| Net Assets | | | | |
| Beginning of period | | 1,427,253,109 | | 1,840,113,553 |
| End of period (including distributions in excess of net investment income of $25,356 and undistributed net investment | | | | |
| income of $49,905, respectively) | | $ 1,546,154,154 | | $ 1,427,253,109 |
See accompanying notes which are an integral part of the financial statements.
|
179 Annual Report
| Financial Highlights Initial Class | | | | | | | | | | |
| Years ended December 31, | | 2005 | | 2004 | | 2003 | | 2002 | | 2001 |
| Selected Per Share Data | | | | | | | | | | |
| Net asset value, beginning of period | | $ 1.00 | | $ 1.00 | | $ 1.00 | | $ 1.00 | | $ 1.00 |
| Income from Investment Operations | | | | | | | | | | |
| Net investment income | | 030 | | .012 | | .010 | | .017 | | .041 |
| Distributions from net investment income | | (.030) | | (.012) | | (.010) | | (.017) | | (.041) |
| Net asset value, end of period | | $ 1.00 | | $ 1.00 | | $ 1.00 | | $ 1.00 | | $ 1.00 |
| Total ReturnA,B | | 3.03% | | 1.21% | | 1.00% | | 1.69% | | 4.18% |
| Ratios to Average Net AssetsC | | | | | | | | | | |
| Expenses before reductions | | 29% | | .29% | | .29% | | .29% | | .28% |
| Expenses net of fee waivers, if any | | 29% | | .29% | | .29% | | .29% | | .28% |
| Expenses net of all reductions | | 29% | | .29% | | .29% | | .29% | | .28% |
| Net investment income | | 3.00% | | 1.18% | | 1.00% | | 1.68% | | 3.99% |
| Supplemental Data | | | | | | | | | | |
| Net assets, end of period (000 omitted) | | $1,347,642 | | $1,392,449 | | $1,817,440 | | $2,705,069 | | $2,753,379 |
A Total returns do not reflect charges attributable to your insurance company’s separate account. Inclusion of these charges would reduce the total returns shown.
B Total returns would have been lower had certain expenses not been reduced during the periods shown.
C Expense ratios reflect operating expenses of the class. Expenses before reductions do not reflect amounts reimbursed by the investment adviser or expense offset arrangements and do not represent the amount paid by the class during periods when
reimbursements or reductions occur. Expenses net of fee waivers reflect expenses after reimbursement by the investment adviser but prior to reductions from expense offset arrangements. Expenses net of all reductions represent the net expenses
paid by the class.
|
| Financial Highlights Service Class | | | | | | | | | | |
| Years ended December 31, | | 2005 | | 2004 | | 2003 | | 2002 | | 2001 |
| Selected Per Share Data | | | | | | | | | | |
| Net asset value, beginning of period | | $ 1.00 | | $ 1.00 | | $ 1.00 | | $ 1.00 | | $ 1.00 |
| Income from Investment Operations | | | | | | | | | | |
| Net investment income | | 029 | | .011 | | .009 | | .016 | | .040 |
| Distributions from net investment income | | (.029) | | (.011) | | (.009) | | (.016) | | (.040) |
| Net asset value, end of period | | $ 1.00 | | $ 1.00 | | $ 1.00 | | $ 1.00 | | $ 1.00 |
| Total ReturnA,B | | 2.92% | | 1.10% | | .90% | | 1.61% | | 4.10% |
| Ratios to Average Net AssetsC | | | | | | | | | | |
| Expenses before reductions | | 40% | | .40% | | .38% | | .39% | | .39% |
| Expenses net of fee waivers, if any | | 40% | | .40% | | .38% | | .39% | | .39% |
| Expenses net of all reductions | | 40% | | .40% | | .38% | | .39% | | .39% |
| Net investment income | | 2.88% | | 1.08% | | .91% | | 1.58% | | 3.87% |
| Supplemental Data | | | | | | | | | | |
| Net assets, end of period (000 omitted) | | $ 20,987 | | $ 13,905 | | $ 19,606 | | $ 8,017 | | $ 6,143 |
A Total returns do not reflect charges attributable to your insurance company’s separate account. Inclusion of these charges would reduce the total returns shown.
B Total returns would have been lower had certain expenses not been reduced during the periods shown.
C Expense ratios reflect operating expenses of the class. Expenses before reductions do not reflect amounts reimbursed by the investment adviser or expense offset arrangements and do not represent the amount paid by the class during periods when
reimbursements or reductions occur. Expenses net of fee waivers reflect expenses after reimbursement by the investment adviser but prior to reductions from expense offset arrangements. Expenses net of all reductions represent the net expenses
paid by the class.
|
See accompanying notes which are an integral part of the financial statements.
| | |
| VIP Money Market Portfolio | | 180 |
| Financial Highlights Service Class 2 | | | | | | | | | | |
| Years ended December 31, | | 2005 | | 2004 | | 2003 | | 2002 | | 2001 |
| Selected Per Share Data | | | | | | | | | | |
| Net asset value, beginning of period | | $ 1.00 | | $ 1.00 | | $ 1.00 | | $ 1.00 | | $ 1.00 |
| Income from Investment Operations | | | | | | | | | | |
| Net investment income | | 027 | | .009 | | .007 | | .014 | | .039 |
| Distributions from net investment income | | (.027) | | (.009) | | (.007) | | (.014) | | (.039) |
| Net asset value, end of period | | $ 1.00 | | $ 1.00 | | $ 1.00 | | $ 1.00 | | $ 1.00 |
| Total ReturnA,B | | 2.77% | | .95% | | .75% | | 1.45% | | 3.96% |
| Ratios to Average Net AssetsC | | | | | | | | | | |
| Expenses before reductions | | 54% | | .55% | | .54% | | .54% | | .55% |
| Expenses net of fee waivers, if any | | 54% | | .55% | | .54% | | .54% | | .55% |
| Expenses net of all reductions | | 54% | | .55% | | .54% | | .54% | | .55% |
| Net investment income | | 2.90% | | .93% | | .75% | | 1.43% | | 3.71% |
| Supplemental Data | | | | | | | | | | |
| Net assets, end of period (000 omitted) | | $ 51,301 | | $ 20,899 | | $ 3,068 | | $ 47,604 | | $ 40,267 |
A Total returns do not reflect charges attributable to your insurance company’s separate account. Inclusion of these charges would reduce the total returns shown.
B Total returns would have been lower had certain expenses not been reduced during the periods shown.
C Expense ratios reflect operating expenses of the class. Expenses before reductions do not reflect amounts reimbursed by the investment adviser or expense offset arrangements and do not represent the amount paid by the class during periods when
reimbursements or reductions occur. Expenses net of fee waivers reflect expenses after reimbursement by the investment adviser but prior to reductions from expense offset arrangements. Expenses net of all reductions represent the net expenses
paid by the class.
|
| Financial Highlights Investor Class | | |
| |
| Year ended December 31, | | 2005E |
| Selected Per Share Data | | |
| Net asset value, beginning of period | | $ 1.00 |
| Income from Investment Operations | | |
| Net investment income | | 016 |
| Distributions from net investment income | | (.016) |
| Net asset value, end of period | | $ 1.00 |
| Total ReturnB,C,D | | 1.58% |
| Ratios to Average Net AssetsF | | |
| Expenses before reductions | | 36%A |
| Expenses net of fee waivers, if any | | 36%A |
| Expenses net of all reductions | | 36%A |
| Net investment income | | 3.72%A |
| Supplemental Data | | |
| Net assets, end of period (000 omitted) | | $ 126,224 |
A Annualized
B Total returns for periods of less than one year are not annualized.
C Total returns do not reflect charges attributable to your insurance company’s separate account. Inclusion of these charges would reduce the total returns shown.
D Total returns would have been lower had certain expenses not been reduced during the periods shown.
E For the period July 21, 2005 (commencement of sale of shares) to December 31, 2005.
F Expense ratios reflect operating expenses of the class. Expenses before reductions do not reflect amounts reimbursed by the investment adviser or expense offset arrangements and do not represent the amount paid by the class during periods when
reimbursements or reductions occur. Expense ratios before reductions for start up periods may not be representative of longer term operating periods. Expenses net of fee waivers reflect expenses after reimbursement by the investment adviser but
prior to reductions from expense offset arrangements. Expenses net of all reductions represent the net expenses paid by the class.
|
See accompanying notes which are an integral part of the financial statements.
|
181 Annual Report
Notes to Financial Statements
For the period ended December 31, 2005
|
1. Significant Accounting Policies.
|
VIP High Income Portfolio and VIP Money Market Portfolio (the funds) are funds of Variable Insurance Products Fund. VIP Asset Manager Portfolio, VIP Asset Manager: Growth Portfolio and VIP Investment Grade Bond Portfolio (the funds) are funds of Variable Insurance Products Fund II. VIP Balanced Portfolio (the fund) is a fund of Variable Insurance Products Fund III. The Variable Insurance Products Fund, Variable Insurance Products Fund II, and Variable Insurance Products Fund III (the trusts) (referred to in this report as Fidelity Variable Insurance Products) are registered under the Investment Company Act of 1940, as amended (the 1940 Act), as open end management investment companies organized as Massachusetts business trusts. Each fund is authorized to issue an unlimited number of shares. Shares of each fund may only be purchased by insurance companies for the purpose of funding variable annuity or variable life insurance contracts. Each fund offers the following classes of shares: Initial Class shares, Service Class shares, Service Class 2 shares and Investor Class shares. VIP High Income Portfolio also offers Initial Class R, Service Class R and Service Class 2R shares. The funds commenced sale of Investor Class shares on July 21, 2005. All classes have equal rights and voting privileges, except for matters affecting a single class. Investment income, realized and unrealized capital gains and losses, the common expenses of the fund, and certain fund level expense reductions, if any, are allocated on a pro rata basis to each class based on the relative net assets of each class to the total net assets of the fund. Each class differs with respect to transfer agent and distribution and service plan fees incurred. Certain expense reductions also differ by class.
Certain funds may invest in affiliated money market central funds (Money Market Central Funds) and fixed income Central Investment Portfolios (CIPs), collectively referred to as Central Funds, which are open end investment companies available to investment companies and other accounts managed by Fidelity Management & Research Company (FMR) and its affiliates. The financial statements have been prepared in conformity with accounting principles generally accepted in the United States of America, which require management to make certain estimates and assumptions at the date of the financial statements. The following summarizes the significant accounting policies of the funds, which are also consistently followed by the Central Funds:
Security Valuation. Investments are valued and net asset value (NAV) per share is calculated (NAV calculation) as of the close of business of the New York Stock Exchange (NYSE), normally 4:00 p.m. Eastern time. Wherever possible, each fund uses independent pricing services approved by the Board of Trustees to value their investments.
Equity securities, including restricted securities, for which market quotations are readily available, are valued at the last reported sale price or official closing price as reported by an independent pricing service on the primary market or exchange on which they are traded. In the event there were no sales during the day or closing prices are not available, securities are valued at the last quoted bid price. Debt securities, including restricted securities, for which quotations are readily available, are valued by independent pricing services or by dealers who make markets in such securities. Pricing services consider yield or price of bonds of comparable quality, coupon, maturity and type as well as dealer supplied prices. Investments in open end mutual funds, including Central Funds, are valued at their closing net asset value each business day. Short term securities with remaining maturities of sixty days or less for which quotations are not readily available are valued at amortized cost, which approximates value.
When current market prices or quotations are not readily available or do not accurately reflect fair value, valuations may be determined in accordance with procedures adopted by the Board of Trustees. For example, when developments occur between the close of a market and the close of the NYSE that may materially affect the value of some or all of the securities, or when trading in a security is halted, those securities may be fair valued. Factors used in the determination of fair value may include monitoring news to identify significant market or security specific events such as changes in the value of U.S. securities markets, reviewing developments in foreign markets and evaluating the performance of ADRs, futures contracts and exchange-traded funds. Because each fund’s utilization of fair value pricing depends on market activity, the frequency with which fair value pricing is used can not be predicted and may be utilized to a significant extent. The value of securities used for NAV calculation under fair value pricing may differ from published prices for the same securities.
As permitted by compliance with certain conditions under Rule 2a 7 of the 1940 Act, securities are valued at amortized cost, which approximates value.
Foreign Currency. Certain funds may use foreign currency contracts to facilitate transactions in foreign denominated securities. Losses from these transactions may arise from changes in the value of the foreign currency or if the counterparties do not perform under the contracts’ terms.
Foreign denominated assets, including investment securities, and liabilities are translated into U.S. dollars at the exchange rate at period end. Pur chases and sales of investment securities, income and dividends received and expenses denominated in foreign currencies are translated into U.S. dollars at the exchange rate in effect on the transaction date.
The effects of exchange rate fluctuations on investments are included with the net realized and unrealized gain (loss) on investment securities. Other foreign currency transactions resulting in realized and unrealized gain (loss) are disclosed separately.
1. Significant Accounting Policies continued
|
Investment Transactions and Income. Security transactions, including the fund’s investment activity in the Central Funds, are accounted for as of trade date. Gains and losses on securities sold are determined on the basis of identified cost and may include proceeds received from litigation. Dividend income is recorded on the ex dividend date, except for certain dividends from foreign securities where the ex dividend date may have passed, which are recorded as soon as the funds are informed of the ex dividend date. Non cash dividends included in dividend income, if any, are recorded at the fair market value of the securities received. Distributions received on securities that represent a return of capital or capital gain are recorded as a reduction of cost of investments and/or as a realized gain. The funds estimate the components of distributions received that may be considered return of capital distributions or capital gain distributions. Interest income and distributions from the Central Funds, are accrued as earned. Interest income includes coupon interest and amortization of premium and accretion of discount on debt securities. Inflation indexed bonds are fixed income securities whose principal value is periodically adjusted according to the rate of inflation. Interest is accrued based on the principal value which is adjusted for inflation. Any increase in the principal amount of an inflation indexed bond is recorded as interest income, even though the principal is not received until maturity. Investment income is recorded net of foreign taxes withheld where recovery of such taxes is uncertain. Debt obligations may be placed on non accrual status and related interest income may be reduced by ceasing current accruals and writing off interest receivables when the collection of all or a portion of interest has become doubtful based on consistently applied procedures. A debt obligation is removed from non accrual status when the issuer resumes interest payments or when collectibility of interest is reasonably assured.
Expenses. Most expenses of each trust can be directly attributed to a fund. Expenses which cannot be directly attributed are apportioned among each fund in the trust.
Deferred Trustee Compensation. Under a Deferred Compensation Plan (the Plan) independent Trustees must defer receipt of a portion of, and may elect to defer receipt of an additional portion of, their annual compensation. Deferred amounts are treated as though equivalent dollar amounts had been invested in a cross section of other Fidelity funds, and are marked to market. Deferred amounts remain in the fund until distributed in accor dance with the Plan.
Income Tax Information and Distributions to Shareholders. Each year, each fund intends to qualify as a regulated investment company by distributing all of its taxable income and realized gains under Subchapter M of the Internal Revenue Code. As a result, no provision for income taxes is required in the accompanying financial statements. Foreign taxes are provided for based on each fund’s understanding of the tax rules and rates that exist in the foreign markets in which it invests.
For the VIP Money Market Portfolio, dividends are declared daily and paid monthly from net investment income and distributions from realized gains, if any, are recorded on the ex dividend date. For all other funds, distributions are recorded on the ex dividend date. Income dividends and capital gain distributions are declared separately for each class. Income and capital gain distributions are determined in accordance with income tax regulations, which may differ from generally accepted accounting principles.
Capital accounts within the financial statements are adjusted for permanent book tax differences. These adjustments have no impact on net assets or the results of operations. Temporary book tax differences will reverse in a subsequent period.
Book tax differences are primarily due to futures transactions, swap agreements, foreign currency transactions, passive foreign investment companies (PFIC), prior period premium and discount on debt securities, defaulted bonds, market discount, partnerships, partnerships including allocations from CIPs, deferred trustees compensation, financing transactions, capital loss carryforwards and losses deferred due to wash sales and excise tax regulations.
The tax basis components of distributable earnings and the federal tax cost as of period end were as follows for each fund:
| | |
| | | | | | | | | | | Net Unrealized |
| | | Cost for Federal | | Unrealized | | Unrealized | | Appreciation/ |
| | | Income Tax Purposes | | Appreciation | | Depreciation | | (Depreciation) |
| VIP Asset Manager | | $ | | 2,347,385,291 | | $ | | 225,925,241 | | $ | | (58,599,758) | | $ | | 167,325,483 |
| VIP Asset Manager: Growth | | 251,912,423 | | 31,621,177 | | | | (8,623,128) | | 22,998,049 |
| VIP Balanced | | 335,296,569 | | 31,475,639 | | | | (7,543,512) | | 23,932,127 |
| VIP High Income | | 1,479,399,609 | | 34,778,510 | | (25,027,937) | | 9,750,573 |
| VIP Investment Grade Bond | | 1,838,475,225 | | 14,946,859 | | (22,473,155) | | (7,526,296) |
| VIP Money Market | | 1,539,758,648 | | — | | | | — | | — |
| |
| | | | | | | Undistributed | | |
| | | | | Undistributed | | Long-term Capital | | Capital Loss |
| | | | | Ordinary Income | | Gain | | Carryforward |
| VIP Asset Manager | | | | $ | | 64,872,303 | | $ | | — | | $ | | (98,979,772) |
| VIP Asset Manager: Growth | | | | 5,285,178 | | | | — | | (58,627,384) |
| VIP Balanced | | | | 7,197,610 | | | | 11,747,332 | | — |
| VIP High Income | | | | 848,538 | | | | — | | (1,130,214,603) |
| VIP Investment Grade Bond | | | | 65,611,224 | | | | 3,230,122 | | — |
| VIP Money Market | | | | 55,429 | | | | — | | (389,008) |
183 Annual Report
| Notes to Financial Statements continued | | | | | | | | | | |
| |
| |
| |
| 1. Significant Accounting Policies continued | | | | | | | | | | |
| |
| Income Tax Information and Distributions to Shareholders continued | | | | | | | | |
| |
The tax character of distributions paid was as follows:
| | | | | | | | | | |
| December 31, 2005 | | | | | | | | | | |
| | | | | | | Long-term | | |
| | | | | Ordinary Income | | Capital Gains | | Total |
| VIP Asset Manager | | | | $ | | 73,474,247 | | $ | | — | | $ | | 73,474,247 |
| VIP Asset Manager: Growth | | | | 7,156,575 | | | | — | | 7,156,575 |
| VIP Balanced | | | | 8,958,254 | | | | — | | 8,958,254 |
| VIP High Income | | | | 242,303,630 | | | | — | | 242,303,630 |
| VIP Investment Grade Bond | | | | 69,463,875 | | 24,485,831 | | 93,949,706 |
| VIP Money Market | | | | 45,352,183 | | | | — | | 45,352,183 |
| |
| December 31, 2004 | | | | | | | | | | |
| | | | | | | Long-term | | |
| | | | | Ordinary Income | | Capital Gains | | Total |
| VIP Asset Manager | | | | $ | | 81,683,788 | | $ | | — | | $ | | 81,683,788 |
| VIP Asset Manager: Growth | | | | 7,897,225 | | | | — | | 7,897,225 |
| VIP Balanced | | | | 6,988,389 | | | | — | | 6,988,389 |
| VIP High Income | | | | 155,517,698 | | | | — | | 155,517,698 |
| VIP Investment Grade Bond | | | | 97,273,775 | | 17,608,424 | | 114,882,199 |
| VIP Money Market | | | | 19,778,361 | | | | — | | 19,778,361 |
Trading (Redemption) Fees. Initial Class R shares, Service Class R shares, and Service Class 2 R shares held less than 60 days are subject to a re demption fee equal to 1% of the proceeds of the redeemed shares. All redemption fees, including any estimated redemption fees paid by FMR, are retained by the fund and accounted for as an addition to paid in capital.
Repurchase Agreements. FMR has received an Exemptive Order from the Securities and Exchange Commission (the SEC) which permits certain funds and other affiliated entities of FMR to transfer uninvested cash balances into joint trading accounts which are then invested in repurchase agreements. Certain funds may also invest directly with institutions in repurchase agreements. Repurchase agreements are collateralized by government or non government securities. Collateral is held in segregated accounts with custodian banks and may be obtained in the event of a default of the counterparty. Each applicable fund monitors, on a daily basis, the value of the collateral to ensure it is at least equal to the principal amount of the repurchase agreement (including accrued interest). In the event of a default by the counterparty, realization of the collateral proceeds could be delayed, during which time the value of the collateral may decline.
Delayed Delivery Transactions and When Issued Securities. Certain funds may purchase or sell securities on a delayed delivery or when issued basis. Payment and delivery may take place after the customary settlement period for that security. The price of the underlying securities and the date when the securities will be delivered and paid for are fixed at the time the transaction is negotiated. During the time a delayed delivery sell is outstand ing, the contract is marked to market daily and equivalent deliverable securities are held for the transaction. The value of the securities purchased on a delayed delivery or when issued basis are identified as such in each applicable fund’s Schedule of Investments. Certain funds may receive compensation for interest forgone in the purchase of a delayed delivery or when issued security. With respect to purchase commitments, each applicable fund identifies securities as segregated in its records with a value at least equal to the amount of the commitment. The payables and receivables associated with the purchases and sales of delayed delivery securities having the same coupon, settlement date and broker are offset. Delayed delivery or when issued securities that have been purchased from and sold to different brokers are reflected as both payables and receivables in each applicable fund’s Statement of Assets and Liabilities under the caption “Delayed delivery.” Losses may arise due to changes in the value of the underlying securities or if the counterparty does not perform under the contract’s terms, or if the issuer does not issue the securities due to political, economic, or other factors.
Futures Contracts. Certain funds may use futures contracts to manage their exposure to the stock and bond markets and to fluctuations in interest rates. Buying futures tends to increase a fund’s exposure to the underlying instrument, while selling futures tends to decrease a fund’s exposure to the underlying instrument or hedge other fund investments. Futures contracts involve, to varying degrees, risk of loss in excess of any futures variation margin reflected in each applicable fund’s Statement of Assets and Liabilities. The underlying face amount at value of any open futures contracts at period end is shown in each applicable fund’s Schedule of Investments under the caption “Futures Contracts.” This amount reflects each contract’s exposure to the underlying instrument at period end. Losses may arise from changes in the value of the underlying instruments or if the counterparties do not perform under the contracts’ terms. Gains (losses) are realized upon the expiration or closing of the futures. Futures contracts are valued at the settlement price established each day by the board of trade or exchange on which they are traded.
2. Operating Policies continued
|
Restricted Securities. Certain funds may invest in securities that are subject to legal or contractual restrictions on resale. These securities generally may be resold in transactions exempt from registration or to the public if the securities are registered. Disposal of these securities may involve time consuming negotiations and expense, and prompt sale at an acceptable price may be difficult. Information regarding restricted securities is included at the end of each applicable fund’s Schedule of Investments.
Loans and Other Direct Debt Instruments. Certain funds may invest in loans and loan participations, trade claims or other receivables. These investments may include standby financing commitments, including revolving credit facilities, that obligate the fund to supply additional cash to the borrower on demand. Loan participations involve a risk of insolvency of the lending bank or other financial intermediary. A fund may be contractually obligated to receive approval from the agent bank and/or borrower prior to the sale of these investments.
Swap Agreements. Certain funds may invest in swaps for the purpose of managing their exposure to interest rate, credit or market risk.
Interest rate swaps are agreements to exchange cash flows periodically based on a notional principal amount, for example, the exchange of fixed rate interest payments for floating rate interest payments. Periodic payments received or made by each applicable fund are recorded in the accompanying Statement of Operations as realized gains or losses, respectively. The primary risk associated with interest rate swaps is that unfavorable changes in the fluctuation of interest rates could adversely impact a fund.
Total return swaps are agreements to exchange the return generated by one instrument or index for the return generated by another instrument, for example, the agreement to pay interest in exchange for a market linked return based on a notional amount. To the extent the total return of the index exceeds the offsetting interest obligation, a fund will receive a payment from the counterparty. To the extent it is less, a fund will make a payment to the counterparty. Periodic payments received or made by each applicable fund are recorded in the accompanying Statement of Operations as realized gains or losses, respectively.
Credit default swaps involve the exchange of a fixed rate premium for protection against the loss in value of an underlying debt instrument in the event of a defined credit event (such as payment default or bankruptcy). Under the terms of the swap, one party acts as a “guarantor” receiving a periodic payment that is a fixed percentage applied to a notional principal amount. In return the party agrees to purchase the notional amount of the underlying instrument, at par, if a credit event occurs during the term of the swap. Certain funds may enter into credit default swaps in which either it or its counterparty act as guarantors. By acting as the guarantor of a swap, a fund assumes the market and credit risk of the underlying instrument including liquidity and loss of value. Periodic payments and premiums received or made by each applicable fund are recorded in the accompanying Statement of Operations as realized gains or losses, respectively.
Swaps are marked to market daily based on dealer supplied valuations and changes in value are recorded as unrealized appreciation (depreciation). Gains or losses are realized upon early termination of the swap agreement. Collateral, in the form of cash or securities, may be required to be held in segregated accounts with a fund’s custodian in compliance with swap contracts. Risks may exceed amounts recognized on the Statement of Assets and Liabilities. These risks include changes in the returns of the underlying instruments, failure of the counterparties to perform under the contracts’ terms and the possible lack of liquidity with respect to the swap agreements. Details of swap agreements open at period end are included in each applicable fund’s Schedule of Investments under the caption “Swap Agreements”.
Mortgage Dollar Rolls. To earn additional income, certain funds may employ trading strategies which involve the sale and simultaneous agreement to repurchase similar securities (“mortgage dollar rolls”) or the purchase and simultaneous agreement to sell similar securities (“reverse mortgage dollar rolls”). The securities traded are mortgage securities and bear the same interest rate but may be collateralized by different pools of mortgages. During the period between the sale and repurchase in a mortgage dollar roll transaction, a fund will not be entitled to receive interest and principal payments on the securities sold but will invest the proceeds of the sale in other securities which may enhance the yield and total return. In addition, the difference between the sale price and the future purchase price is recorded as an adjustment to investment income. During the period between the purchase and subsequent sale in a reverse mortgage dollar roll transaction a fund is entitled to interest and principal payments on the securities purchased. The price differential between the purchase and sale is recorded as an adjustment to investment income. Losses may arise due to changes in the value of the securities or if the counterparty does not perform under the terms of the agreement. If the counterparty files for bankruptcy or becomes insolvent, a fund’s right to repurchase or sell securities may be limited.
185 Annual Report
| Notes to Financial Statements continued | | |
| |
| |
| |
| 3. Purchases and Sales of Investments. | | |
| |
Purchases and sales of securities, other than short term securities and U.S. government securities, are noted in the table below.
| | |
| | | Purchases ($) | | Sales ($) |
| VIP Asset Manager | | 676,185,279 | | 851,343,571 |
| VIP Asset Manager: Growth | | 86,514,726 | | 131,735,604 |
| VIP Balanced | | 325,865,211 | | 296,604,561 |
| VIP High Income | | 1,437,126,934 | | 1,749,050,943 |
| VIP Investment Grade Bond | | 322,167,850 | | 213,631,138 |
| |
| |
| 4. Fees and Other Transactions with Affiliates. | | |
Management Fee. FMR and its affiliates provide the funds with investment management related services for which the funds pay a monthly management fee.
For all funds except VIP Money Market, the management fee is the sum of an individual fund fee rate applied to the average net assets of each fund and a group fee rate. The group fee rates differ for equity and fixed income funds and are each based upon the average net assets of all the mutual funds advised by FMR. The group fee rates decrease as assets under management increase and increase as assets under management decrease. The annual individual fund fee rate is .45% of the fund’s average net assets for VIP High Income, .30% for VIP Asset Manager: Growth and VIP Investment Grade Bond, .25% for VIP Asset Manager, and .15% for VIP Balanced. Effective June 1, 2005, VIP Investment Grade Bond’s management contract was amended, reducing the individual fund fee rate to .20% of average net assets. The group fee rates averaged .27% for the equity funds and .12% for the fixed income funds during the period.
For VIP Money Market, the management fee is calculated on the basis of a group fee rate plus a total income based component. The group fee rate averaged .12% during the period. The total income based component is calculated according to a graduated schedule providing for different rates based on the fund’s gross annualized yield. The rate increases as the fund’s gross yield increases. During the period the income based portion of the management fee was $1,191,179 or an annual rate of .08% of the fund’s average net assets.
For the period each fund’s total annual management fee rate, expressed as a percentage of each fund’s average net assets, was as follows:
| VIP Asset Manager | | 52% |
| VIP Asset Manager: Growth | | 57% |
| VIP Balanced | | 42% |
| VIP High Income | | 57% |
| VIP Investment Grade Bond | | 36% |
| VIP Money Market | | 20% |
Distribution and Service Plan. In accordance with Rule 12b 1 of the 1940 Act, the funds have adopted separate 12b 1 Plans for each Service Class of shares. Each Service Class pays Fidelity Distributors Corporation (FDC), an affiliate of FMR, a service fee. For the period, the service fee is based on an annual rate of .10% of Service Class and Service Class R’s average net assets and .25% of Service Class 2 and Service Class 2 R’s average net assets.
For the period, each class paid FDC the following amounts, all of which were re allowed to insurance companies for the distribution of shares and providing shareholder support services:
| | | Service | | | | Service | | | | Service | | | | Service |
| | | Class | | | | Class 2 | | | | Class R | | | | Class 2R |
| VIP Asset Manager | | $ | | 30,813 | | | $ | 111,219 | | | $ | | | — | | | $ | — |
| VIP Asset Manager: Growth | | 5,936 | | | | 14,212 | | | | | | — | | | | — |
| VIP Balanced | | 19,214 | | | | 95,604 | | | | | | — | | | | — |
| VIP High Income | | 323,187 | | | | 221,170 | | | | | | 84 | | | | 202 |
| VIP Investment Grade Bond | | 67,359 | | | | 586,220 | | | | | | — | | | | — |
| VIP Money Market | | 17,449 | | | | 91,421 | | | | | | — | | | | — |
Transfer Agent Fees. Fidelity Investment Institutional Operations Company, Inc. (FIIOC), an affiliate of FMR, is the funds’ transfer, dividend disburs ing and shareholder servicing agent. FIIOC receives an asset based fee with respect to each class. FIIOC pays a portion of the expenses related to the typesetting, printing and mailing of shareholder reports, except proxy statements. Each class with the exception of the Investor Class pays a transfer agent fee, excluding out of pocket expenses, equal to an annual rate of ..07% of their month end net assets. The Investor Class of VIP Asset Manager, VIP Asset Manager: Growth and VIP Balanced pays a transfer agent fee equal to an annual rate of .18% of its month end assets. The Investor Class of VIP High Income and VIP Money Market pays a transfer agent fee equal to an annual rate of ..14% and .12%, of its month end net assets, respectively. The
| 4. Fees and Other Transactions with Affiliates continued |
Transfer Agent Fees continued | | |
Investor Class of VIP Investment Grade Bond pays a transfer agent fee equal to an annual rate of .10% of its average net assets. For the period, the total transfer agent fees paid by each class to FIIOC, including out of pocket expenses, were as follows:
| VIP Asset Manager | | | | |
| Initial Class | | | $ | 1,686,712 |
| Service Class | | | | 22,351 |
| Service Class 2 | | | | 36,615 |
| Investor Class | | | | 3,577 |
| | | | $ | 1,749,255 |
| VIP Asset Manager: Growth | | | | |
| Initial Class | | | $ | 189,160 |
| Service Class | | | | 4,048 |
| Service Class 2 | | | | 6,518 |
| Investor Class | | | | 799 |
| | | | $ | 200,525 |
| VIP Balanced | | | | |
| Initial Class | | | $ | 189,375 |
| Service Class | | | | 14,435 |
| Service Class 2 | | | | 28,595 |
| Investor Class | | | | 4,656 |
| | | | $ | 237,061 |
| VIP High Income | | | | |
| Initial Class | | | $ | 800,820 |
| Service Class | | | | 214,752 |
| Service Class 2 | | | | 64,849 |
| Initial Class R | | | | 54 |
| Service Class R | | | | 53 |
| Service Class 2R | | | | 52 |
| Investor Class | | | | 4,933 |
| | | | $ | 1,085,513 |
| VIP Investment Grade Bond | | | | |
| Initial Class | | | $ | 907,474 |
| Service Class | | | | 46,515 |
| Service Class 2 | | | | 164,062 |
| Investor Class | | | | 7,395 |
| | | | $ | 1,125,446 |
| VIP Money Market | | | | |
| Initial Class | | | $ | 966,012 |
| Service Class | | | | 13,142 |
| Service Class 2 | | | | 25,696 |
| Investor Class | | | | 34,375 |
| | | | $ | 1,039,225 |
Accounting and Security Lending Fees. Fidelity Service Company, Inc. (FSC), an affiliate of FMR, maintains each fund’s accounting records. The accounting fee is based on the level of average net assets for the month. Under a separate contract, FSC administers the security lending program. The security lending fee is based on the number and duration of lending transactions.
Affiliated Central Funds. Certain funds may invest in Money Market Central Funds which seek preservation of capital and current income and are managed by Fidelity Investments Money Management, Inc. (FIMM) an affiliate of FMR.
Certain funds may also invest in CIPs managed by FIMM or Fidelity Management & Research Company, Inc. (FMRC) each an affiliate of FMR. The Ultra Short Central Fund seeks to obtain a high level of current income consistent with preservation of capital by investing in U.S. dollar denominated money market and investment grade debt securities. The High Income Central Investment Portfolio 1 seeks a high level of income and may also seek capital appreciation by investing primarily in debt securities, preferred stocks, and convertible securities, with an emphasis on lower quality debt securities. The Floating Rate Central Investment Portfolio seeks a high level of income by normally investing in floating rate loans and other floating rate securities.
187 Annual Report
| Notes to Financial Statements continued | | |
| |
| |
| 4. Fees and Other Transactions with Affiliates continued |
Affiliated Central Funds continued | | |
The fund’s Schedule of Investments lists each applicable CIP as an investment of the fund but does not include the underlying holdings of each CIP. Based on their investment objectives, each CIP may invest or participate in various investment vehicles or strategies that are similar to those of the investing fund. In addition, each CIP may also participate in derivatives. These strategies are consistent with the investment objectives of the fund and may involve certain economic risks, including the risk that a counterparty to one or more of these transactions may be unable or unwilling to comply with the terms of the governing agreement. This may result in a decline in value of each CIP and the fund.
A complete unaudited list of holdings for each CIP, as of the fund’s report date, is available upon request or at advisor.fidelity.com, as applicable. The reports are located just after the fund’s financial statements and quarterly reports but are not part of the financial statements or quarterly reports. In addition, the CIP’s financial statements, which are not covered by each fund’s Report of Independent Registered Public Accounting Firm, are available on the EDGAR Database on the SEC’s web site, www.sec.gov, or upon request.
The Central Funds do not pay a management fee.
|
Brokerage Commissions. Certain funds placed a portion of their portfolio transactions with brokerage firms which are affiliates of the investment adviser. The commissions paid to these affiliated firms were as follows:
| | | Amount |
| VIP Asset Manager | | $ 12,053 |
| VIP Asset Manager: Growth | | 1,820 |
| VIP Balanced | | 8,950 |
| VIP High Income | | 1,086 |
Interfund Lending Program. Pursuant to an Exemptive Order issued by the SEC, the funds, along with other registered investment companies having management contracts with FMR, may participate in an interfund lending program. This program provides an alternative credit facility allowing the funds to borrow from, or lend money to, other participating affiliated funds. At period end, there were no interfund loans outstanding. Each applica ble fund’s activity in this program during the period for which loans were outstanding was as follows:
| | | | | | | Weighted | | Interest Earned | | | | |
| | | Borrower | | Average Daily | | Average | | (included in | | | | Interest |
| | | or Lender | | Loan Balance | | Interest Rate | | interest income) | | | | Expense |
| VIP High Income | | Borrower | | $ | | 29,538,600 | | 3.05% | | $ | | — | | | $ | 37,564 |
| VIP Money Market | | Lender | | 7,346,621 | | 3.03% | | 17,929 | | | | — |
| |
| |
| 5. Committed Line of Credit. | | | | | | | | | | | | |
Certain funds participate with other funds managed by FMR in a $4.2 billion credit facility (the “line of credit”) to be utilized for temporary or emergency purposes to fund shareholder redemptions or for other short term liquidity purposes. The participating funds have agreed to pay commitment fees on their pro rata portion of the line of credit. During the period, there were no borrowings on this line of credit.
Certain funds lend portfolio securities from time to time in order to earn additional income. On the settlement date of the loan, each applicable fund receives collateral (in the form of U.S. Treasury obligations, letters of credit and/or cash) against the loaned securities and maintains collateral in an amount not less than 100% of the market value of the loaned securities during the period of the loan. The market value of the loaned securities is determined at the close of business of the funds and any additional required collateral is delivered to the funds on the next business day. If the borrower defaults on its obligation to return the securities loaned because of insolvency or other reasons, a fund could experience delays and costs in recovering the securities loaned or in gaining access to the collateral. Any cash collateral received is invested in either cash equivalents or the Fidelity Securities Lending Cash Central Fund. The value of loaned securities and cash collateral at period end are disclosed on each applicable fund’s Statement of Assets and Liabilities. Security lending income represents the income earned on investing cash collateral, less fees and expenses associated with the loan, plus any premium payments that may be received on the loan of certain types of securities. Net income from lending portfolio securities during the period amounted to:
| VIP Asset Manager | | $ 75,927 |
| VIP Asset Manager: Growth | | 1,772 |
| VIP Balanced | | 7,896 |
| VIP Investment Grade Bond | | 39,377 |
Many of the brokers with whom FMR places trades on behalf of certain funds provided services to these funds in addition to trade execution. These services included payments of expenses on behalf of each applicable fund. In addition, through arrangements with each applicable fund’s custodian, credits realized as a result of uninvested cash balances were used to reduce the fund’s expenses. All of the applicable expense reductions are noted in the table below.
| | | | | | | | | Custody |
| | | Brokerage Service | | | | expense |
| | | Arrangement | | | | reduction |
| VIP Asset Manager | | $ | | 266,894 | | | $ | 1,696 |
| VIP Asset Manager: Growth | | | | 49,343 | | | | 180 |
| VIP Balanced | | | | 111,757 | | | | 831 |
| VIP High Income | | | | 16,257 | | | | 9,270 |
| VIP Investment Grade Bond | | | | — | | | | 10,113 |
| VIP Money Market | | | | — | | | | 3,425 |
| |
| |
| 8. Other. | | | | | | | | |
The funds’ organizational documents provide former and current trustees and officers with a limited indemnification against liabilities arising in connection with the performance of their duties to the funds. In the normal course of business, the funds may also enter into contracts that provide general indemnifications. The funds’ maximum exposure under these arrangements is unknown as this would be dependent on future claims that may be made against the funds. The risk of material loss from such claims is considered remote.
At the end of the period, FMR, or its affiliates and certain otherwise unaffiliated shareholders each were owners of record of more than 10% of the total outstanding shares of the following funds:
| | | | | Number of | | | | |
| | | | | Unaffiliated | | | | Unaffiliated |
| | | Affiliated % | | Shareholders | | | | Shareholders % |
| VIP Asset Manager | | 23% | | 1 | | | | 18% |
| VIP Asset Manager: Growth | | 69% | | — | | | | — |
| VIP Balanced | | 65% | | 1 | | | | 19% |
| VIP High Income | | 21% | | 2 | | | | 48% |
| VIP Investment Grade Bond | | 42% | | 1 | | | | 15% |
| VIP Money Market | | 62% | | 1 | | | | 13% |
| |
| |
| 9. Distributions to Shareholders. | | | | | | | | |
| |
Distributions to shareholders of each class were as follows:
| | | | | | | | |
| Years ended December 31, | | | | 2005 | | | | 2004 |
| VIP Asset Manager | | | | | | | | |
| From net investment income | | | | | | | | |
| Initial Class | | | | $ 70,750,221 | | | | $ 80,234,728 |
| Service Class | | | | 792,593 | | | | 869,573 |
| Service Class 2 | | | | 999,970 | | | | 579,487 |
| Total | | | | $ 72,542,784 | | | | $ 81,683,788 |
| From net realized gain | | | | | | | | |
| Initial Class | | | | $ 907,054 | | | | $ — |
| Service Class | | | | 10,711 | | | | — |
| Service Class 2 | | | | 13,698 | | | | — |
| Total | | | | $ 931,463 | | | | $ — |
| VIP Asset Manager: Growth | | | | | | | | |
| From net investment income | | | | | | | | |
| Initial Class | | | | $ 6,891,918 | | | | $ 7,600,835 |
| Service Class | | | | 146,131 | | | | 146,142 |
| Service Class 2 | | | | 118,526 | | | | 150,248 |
| Total | | | | $ 7,156,575 | | | | $ 7,897,225 |
189 Annual Report
| Notes to Financial Statements continued | | | | | | | | |
| |
| |
| |
9. Distributions to Shareholders - continued
| | | | | | | | |
| Years ended December 31, | | | | | | 2005 | | | | 2004 |
| VIP Balanced | | | | | | | | | | |
| From net investment income | | | | | | | | | | |
| Initial Class | | | | | | $ 7,331,284 | | | | $ 6,005,122 |
| Service Class | | | | | | 507,567 | | | | 429,413 |
| Service Class 2 | | | | | | 877,840 | | | | 553,854 |
| Total | | | | | | $ 8,716,691 | | | | $ 6,988,389 |
| From net realized gain | | | | | | | | | | |
| Initial Class | | | | | | $ 200,857 | | | | $ — |
| Service Class | | | | | | 14,502 | | | | — |
| Service Class 2 | | | | | | 26,204 | | | | — |
| Total | | | | | | $ 241,563 | | | | $ — |
| VIP High Income | | | | | | | | | | |
| From net investment income | | | | | | | | | | |
| Initial Class | | | | | | $ 178,515,690 | | | | $ 119,128,639 |
| Service Class | | | | | | 49,309,732 | | | | 30,447,599 |
| Service Class 2 | | | | | | 13,285,899 | | | | 5,941,460 |
| Initial Class R | | | | | | 12,124 | | | | — |
| Service Class R | | | | | | 12,013 | | | | — |
| Service Class 2R | | | | | | 11,933 | | | | — |
| Investor ClassA | | | | | | 1,156,239 | | | | — |
| Total | | | | | | $ 242,303,630 | | | | $ 155,517,698 |
| VIP Investment Grade Bond | | | | | | | | | | |
| From net investment income | | | | | | | | | | |
| Initial Class | | | | | | $ 49,548,838 | | | | $ 60,884,326 |
| Service Class | | | | | | 2,004,690 | | | | 1,005,257 |
| Service Class 2 | | | | | | 6,891,724 | | | | 4,862,925 |
| Total | | | | | | $ 58,445,252 | | | | $ 66,752,508 |
| From net realized gain | | | | | | | | | | |
| Initial Class | | | | | | $ 29,935,756 | | | | $ 43,793,989 |
| Service Class | | | | | | 1,223,916 | | | | 710,613 |
| Service Class 2 | | | | | | 4,344,782 | | | | 3,625,089 |
| Total | | | | | | $ 35,504,454 | | | | $ 48,129,691 |
| VIP Money Market | | | | | | | | | | |
| From net investment income | | | | | | | | | | |
| Initial Class | | | | | | $ 42,861,410 | | | | $ 19,434,556 |
| Service Class | | | | | | 503,413 | | | | 247,002 |
| Service Class 2 | | | | | | 1,060,557 | | | | 96,803 |
| Investor ClassA | | | | | | 926,803 | | | | — |
| Total | | | | | | $ 45,352,183 | | | | $ 19,778,361 |
A Distributions for Investor Class are for the period July 21,2005 (commencement of sale of shares) to December 31, 2005. | | | | | | | | |
| 10. Share Transactions. | | | | | | | | | | | | |
| |
| Transactions for each class of shares were as follows: | | | | | | | | | | | | |
| | | Shares | | | | Dollars |
| Years ended December 31, | | 2005 | | 2004 | | | | 2005 | | | | 2004 |
| VIP Asset Manager | | | | | | | | | | | | |
| Initial Class | | | | | | | | | | | | |
| Shares sold | | 2,915,947 | | 8,726,898 | | | $ | 42,234,659 | | | $ | 124,852,377 |
| Reinvestment of distributions | | 4,952,127 | | 5,552,576 | | | | 71,657,275 | | | | 80,234,728 |
| Shares redeemed | | (33,114,328) | | (37,314,309) | | | | (480,629,101) | | | | (532,488,555) |
| Net increase (decrease) | | (25,246,254) | | (23,034,835) | | | $ | (366,737,167) | | | $ | (327,401,450) |
| Service Class | | | | | | | | | | | | |
| Shares sold | | 242,272 | | 845,301 | | | $ | 3,487,071 | | | $ | 12,068,224 |
| Reinvestment of distributions | | 55,824 | | 60,513 | | | | 803,304 | | | | 869,573 |
| Shares redeemed | | (577,213) | | (893,122) | | | | (8,354,296) | | | | (12,617,698) |
| Net increase (decrease) | | (279,117) | | 12,692 | | | $ | (4,063,921) | | | $ | 320,099 |
| Service Class 2 | | | | | | | | | | | | |
| Shares sold | | 1,466,235 | | 1,250,787 | | | $ | 20,976,506 | | | $ | 17,624,320 |
| Reinvestment of distributions | | 70,935 | | 40,552 | | | | 1,013,668 | | | | 579,487 |
| Shares redeemed | | (566,476) | | (354,143) | | | | (8,095,836) | | | | (5,002,906) |
| Net increase (decrease) | | 970,694 | | 937,196 | | | $ | 13,894,338 | | | $ | 13,200,901 |
| Investor ClassA | | | | | | | | | | | | |
| Shares sold | | 630,233 | | — | | | $ | 9,272,918 | | | $ | — |
| Shares redeemed | | (9,837) | | — | | | | (144,609) | | | | — |
| Net increase (decrease) | | 620,396 | | — | | | $ | 9,128,309 | | | $ | — |
| VIP Asset Manager: Growth | | | | | | | | | | | | |
| Initial Class | | | | | | | | | | | | |
| Shares sold | | 400,393 | | 1,551,941 | | | $ | 4,987,117 | | | $ | 19,043,356 |
| Reinvestment of distributions | | 553,123 | | 611,000 | | | | 6,891,918 | | | | 7,600,835 |
| Shares redeemed | | (4,783,614) | | (5,399,771) | | | | (59,550,144) | | | | (65,636,699) |
| Net increase (decrease) | | (3,830,098) | | (3,236,830) | | | $ | (47,671,109) | | | $ | (38,992,508) |
| Service Class | | | | | | | | | | | | |
| Shares sold | | 79,697 | | 19,730 | | | $ | 986,639 | | | $ | 237,067 |
| Reinvestment of distributions | | 11,794 | | 11,814 | | | | 146,131 | | | | 146,142 |
| Shares redeemed | | (121,815) | | (112,237) | | | | (1,500,514) | | | | (1,359,267) |
| Net increase (decrease) | | (30,324) | | (80,693) | | | $ | (367,744) | | | $ | (976,058) |
| Service Class 2 | | | | | | | | | | | | |
| Shares sold | | 201,792 | | 208,638 | | | $ | 2,506,921 | | | $ | 2,533,515 |
| Reinvestment of distributions | | 9,613 | | 12,205 | | | | 118,526 | | | | 150,249 |
| Shares redeemed | | (261,528) | | (262,595) | | | | (3,239,888) | | | | (3,163,680) |
| Net increase (decrease) | | (50,123) | | (41,752) | | | $ | (614,441) | | | $ | (479,916) |
| Investor ClassA | | | | | | | | | | | | |
| Shares sold | | 159,021 | | — | | | $ | 2,003,653 | | | $ | — |
| Shares redeemed | | (56,392) | | — | | | | (726,883) | | | | — |
| Net increase (decrease) | | 102,629 | | — | | | $ | 1,276,770 | | | $ | — |
191 Annual Report
| Notes to Financial Statements continued | | | | | | | | | | | | |
| |
| |
| |
10. Share Transactions - continued
| | | | | | | | | | | | |
| | | | | Shares | | | | Dollars |
| Years ended December 31, | | | | 2005 | | 2004 | | | | 2005 | | | | 2004 |
| VIP Balanced | | | | | | | | | | | | | | |
| Initial Class | | | | | | | | | | | | | | |
| Shares sold | | | | 1,236,357 | | 2,035,766 | | | $ | 17,375,383 | | | $ | 28,145,848 |
| Reinvestment of distributions | | | | 539,938 | | 432,646 | | | | 7,532,140 | | | | 6,005,122 |
| Shares redeemed | | | | (3,374,047) | | (3,476,835) | | | | (47,380,600) | | | | (47,800,698) |
| Net increase (decrease) | | | | (1,597,752) | | (1,008,423) | | | $ | (22,473,077) | | | $ | (13,649,728) |
| Service Class | | | | | | | | | | | | | | |
| Shares sold | | | | 21,835 | | 95,487 | | | $ | 304,769 | | | $ | 1,311,596 |
| Reinvestment of distributions | | | | 37,586 | | 31,049 | | | | 522,069 | | | | 429,413 |
| Shares redeemed | | | | (309,945) | | (224,978) | | | | (4,318,560) | | | | (3,078,714) |
| Net increase (decrease) | | | | (250,524) | | (98,442) | | | $ | (3,491,722) | | | $ | (1,337,705) |
| Service Class 2 | | | | | | | | | | | | | | |
| Shares sold | | | | 692,036 | | 798,702 | | | $ | 9,651,143 | | | $ | 10,871,355 |
| Reinvestment of distributions | | | | 65,368 | | 40,193 | | | | 904,044 | | | | 553,854 |
| Shares redeemed | | | | (579,257) | | (377,301) | | | | (8,109,967) | | | | (5,127,412) |
| Net increase (decrease) | | | | 178,147 | | 461,594 | | | $ | 2,445,220 | | | $ | 6,297,797 |
| Investor ClassA | | | | | | | | | | | | | | |
| Shares sold | | | | 966,823 | | — | | | $ | 13,896,815 | | | $ | — |
| Shares redeemed | | | | (9,709) | | — | | | | (138,418) | | | | — |
| Net increase (decrease) | | | | 957,114 | | — | | | $ | 13,758,397 | | | $ | — |
| VIP High Income | | | | | | | | | | | | | | |
| Initial Class | | | | | | | | | | | | | | |
| Shares sold | | | | 37,931,608 | | 49,439,043 | | | $ | 248,546,554 | | | $ | 326,369,917 |
| Reinvestment of distributions | | | | 28,128,457 | | 18,412,464 | | | | 178,515,690 | | | | 119,128,639 |
| Shares redeemed | | | | (86,845,685) | | (101,334,787) | | | | (567,756,363) | | | | (672,513,946) |
| Net increase (decrease) | | | | (20,785,620) | | (33,483,280) | | | $ | (140,694,119) | | | $ | (227,015,390) |
| Service Class | | | | | | | | | | | | | | |
| Shares sold | | | | 29,061,863 | | 27,666,450 | | | $ | 188,149,058 | | | $ | 182,792,007 |
| Reinvestment of distributions | | | | 7,805,887 | | 4,720,558 | | | | 49,309,732 | | | | 30,447,599 |
| Shares redeemed | | | | (38,948,041) | | (38,719,734) | | | | (254,601,512) | | | | (255,556,875) |
| Net increase (decrease) | | | | (2,080,291) | | (6,332,726) | | | $ | (17,142,722) | | | $ | (42,317,269) |
| Service Class 2 | | | | | | | | | | | | | | |
| Shares sold | | | | 16,971,594 | | 11,342,466 | | | $ | 108,910,856 | | | $ | 74,778,966 |
| Reinvestment of distributions | | | | 2,124,657 | | 928,353 | | | | 13,285,899 | | | | 5,941,460 |
| Shares redeemed | | | | (18,474,037) | | (9,747,785) | | | | (119,201,649) | | | | (63,099,503) |
| Net increase (decrease) | | | | 622,214 | | 2,523,034 | | | $ | 2,995,106 | | | $ | 17,620,923 |
| Initial Class R | | | | | | | | | | | | | | |
| Shares sold | | | | — | | 11,592 | | | $ | — | | | $ | 75,000 |
| Reinvestment of distributions | | | | 1,917 | | — | | | | 12,124 | | | | — |
| Net increase (decrease) | | | | 1,917 | | 11,592 | | | $ | 12,124 | | | $ | 75,000 |
| Service Class R | | | | | | | | | | | | | | |
| Shares sold | | | | — | | 11,628 | | | $ | — | | | $ | 75,000 |
| Reinvestment of distributions | | | | 1,906 | | — | | | | 12,013 | | | | — |
| Net increase (decrease) | | | | 1,906 | | 11,628 | | | $ | 12,013 | | | $ | 75,000 |
| Service Class 2R | | | | | | | | | | | | | | |
| Shares sold | | | | — | | 11,719 | | | $ | — | | | $ | 75,000 |
| Reinvestment of distributions | | | | 1,910 | | — | | | | 11,933 | | | | — |
| Net increase (decrease) | | | | 1,910 | | 11,719 | | | $ | 11,933 | | | $ | 75,000 |
| Investor ClassA | | | | | | | | | | | | | | |
| Shares sold | | | | 2,735,811 | | — | | | $ | 17,864,904 | | | $ | — |
| Reinvestment of distributions | | | | 188,006 | | — | | | | 1,156,238 | | | | — |
| Shares redeemed | | | | (105,654) | | — | | | | (692,378) | | | | — |
| Net increase (decrease) | | | | 2,818,163 | | — | | | $ | 18,328,764 | | | $ | — |
| 10. Share Transactions - continued | | | | | | | | | | | | |
| | | Shares | | | | Dollars |
| Years ended December 31, | | 2005 | | 2004 | | | | 2005 | | | | 2004 |
| VIP Investment Grade Bond | | | | | | | | | | | | |
| Initial Class | | | | | | | | | | | | |
| Shares sold | | 9,751,566 | | 8,574,911 | | | $ | 123,954,380 | | | $ | 111,904,360 |
| Reinvestment of distributions | | 6,313,312 | | 8,127,198 | | | | 79,484,594 | | | | 104,678,315 |
| Shares redeemed | | (19,145,427) | | (24,926,667) | | | | (242,534,635) | | | | (325,781,316) |
| Net increase (decrease) | | (3,080,549) | | (8,224,558) | | | $ | (39,095,661) | | | $ | (109,198,641) |
| Service Class | | | | | | | | | | | | |
| Shares sold | | 3,811,638 | | 3,638,367 | | | $ | 48,166,490 | | | $ | 47,309,999 |
| Reinvestment of distributions | | 257,670 | | 133,843 | | | | 3,228,606 | | | | 1,715,870 |
| Shares redeemed | | (1,627,866) | | (1,314,273) | | | | (20,466,743) | | | | (17,025,100) |
| Net increase (decrease) | | 2,441,442 | | 2,457,937 | | | $ | 30,928,353 | | | $ | 32,000,769 |
| Service Class 2 | | | | | | | | | | | | |
| Shares sold | | 10,206,644 | | 8,102,610 | | | $ | 127,817,135 | | | $ | 104,259,091 |
| Reinvestment of distributions | | 903,256 | | 666,249 | | | | 11,236,506 | | | | 8,488,014 |
| Shares redeemed | | (2,644,156) | | (3,077,343) | | | | (33,109,195) | | | | (39,632,459) |
| Net increase (decrease) | | 8,465,744 | | 5,691,516 | | | $ | 105,944,446 | | | $ | 73,114,646 |
| Investor ClassA | | | | | | | | | | | | |
| Shares sold | | 3,400,484 | | — | | | $ | 43,007,802 | | | $ | — |
| Shares redeemed | | (31,674) | | — | | | | (399,566) | | | | — |
| Net increase (decrease) | | 3,368,810 | | — | | | $ | 42,608,236 | | | $ | — |
| Transactions for each class of shares at a $1.00 per share were as follows: | | | | | | | | | | | | |
| VIP Money Market | | | | | | | | | | | | |
| Initial Class | | | | | | | | | | | | |
| Shares sold | | | | | | | $ | 578,771,972 | | | $ | 830,419,484 |
| Reinvestment of distributions | | | | | | | | 42,689,819 | | | | 19,434,528 |
| Shares redeemed | | | | | | | | (666,171,512) | | (1,274,668,391) |
| Net increase (decrease) | | | | | | | $ | (44,709,721) | | | $ | (424,814,379) |
| Service Class | | | | | | | | | | | | |
| Shares sold | | | | | | | $ | 38,588,771 | | | $ | 47,818,461 |
| Reinvestment of distributions | | | | | | | | 501,078 | | | | 224,941 |
| Shares redeemed | | | | | | | | (32,005,992) | | | | (53,743,207) |
| Net increase (decrease) | | | | | | | $ | 7,083,857 | | | $ | (5,699,805) |
| Service Class 2 | | | | | | | | | | | | |
| Shares sold | | | | | | | $ | 53,115,392 | | | $ | 22,301,596 |
| Reinvestment of distributions | | | | | | | | 1,055,054 | | | | 96,802 |
| Shares redeemed | | | | | | | | (23,765,829) | | | | (4,566,058) |
| Net increase (decrease) | | | | | | | $ | 30,404,617 | | | $ | 17,832,340 |
| Investor ClassA | | | | | | | | | | | | |
| Shares sold | | | | | | | $ | 158,042,483 | | | $ | — |
| Reinvestment of distributions | | | | | | | | 912,610 | | | | — |
| Shares redeemed | | | | | | | | (32,730,593) | | | | — |
| Net increase (decrease) | | | | | | | $ | 126,224,500 | | | $ | — |
| |
| A Share transactions for Investor Class are for the period July 21, 2005 (commencement of sale of shares) to December 31, 2005. | | | | | | | | | | |
193 Annual Report
Report of Independent Registered Public Accounting Firm
To the Trustees of Variable Insurance Products Fund II and Shareholders of VIP Asset Manager Portfolio and VIP Asset Manager: Growth Portfolio:
We have audited the accompanying statements of assets and liabilities of VIP Asset Manager Portfolio and VIP Asset Manager: Growth Portfolio, (the Funds), funds of Variable Insurance Products II, including the schedules of investments, as of December 31, 2005 and the related statements of operations for the year then ended, the statements of changes in net assets for each of the two years in the period then ended, and the financial highlights for each of the five years in the period then ended. These financial statements and financial highlights are the responsibility of the Funds’ management. Our responsibility is to express an opinion on these financial statements and financial highlights based on our audits.
We conducted our audits in accordance with standards of the Public Company Accounting Oversight Board (United States). Those standards require that we plan and perform the audit to obtain reasonable assurance about whether the financial statements and financial highlights are free of material misstatement. The Funds are not required to have, nor were we engaged to perform, an audit of its internal control over financial reporting. Our audits included consideration of internal control over financial reporting as a basis for designing audit procedures that are appropriate in the circumstances, but not for the purpose of expressing an opinion on the effectiveness of the Fund’s internal control over financial reporting. Accordingly, we express no such opinion. An audit also includes examining, on a test basis, evidence supporting the amounts and disclosures in the financial statements, assessing the accounting principles used and significant estimates made by management, as well as evaluating the overall financial statement presentation. Our procedures included confirmation of securities owned as of December 31, 2005, by correspondence with the custodians and brokers; where replies were not received from brokers, we performed other auditing procedures. We believe that our audits provide a reasonable basis for our opinion.
In our opinion, the financial statements and financial highlights referred to above present fairly, in all material respects, the financial position of VIP Asset Manager Portfolio and VIP Asset Manager: Growth Portfolio as of December 31, 2005 the results of their operations for the year then ended, the changes in their net assets for each of the two years in the period then ended, and their financial highlights for each of the five years in the period then ended, in conformity with accounting principles generally accepted in the United States of America.
/s/ Deloitte & Touche LLP
DELOITTE & TOUCHE LLP
Boston, Massachusetts
February 17, 2006
|
Report of Independent Registered Public Accounting Firm
To the Trustees of Variable Insurance Products Fund II and Shareholders of VIP Investment Grade Bond Portfolio:
We have audited the accompanying statement of assets and liabilities of VIP Investment Grade Bond Portfolio (the Fund), a fund of Variable Insur ance Products Fund II, including the schedule of investments as of December 31, 2005, and the related statement of operations for the year then ended, the statement of changes in net assets for each of the two years in the period then ended, and the financial highlights for each of the five years in the period then ended. These financial statements and financial highlights are the responsibility of the Fund’s management. Our responsibility is to express an opinion on these financial statements and financial highlights based on our audits.
We conducted our audits in accordance with standards of the Public Company Accounting Oversight Board (United States). Those standards require that we plan and perform the audit to obtain reasonable assurance about whether the financial statements and financial highlights are free of material misstatement. The Fund is not required to have, nor were we engaged to perform, an audit of its internal control over financial reporting. Our audits included consideration of internal control over financial reporting as a basis for designing audit procedures that are appropriate in the circumstances, but not for the purpose of expressing an opinion on the effectiveness of the Fund’s internal control over financial reporting. Accordingly, we express no such opinion. An audit also includes examining, on a test basis, evidence supporting the amounts and disclosures in the financial statements, assessing the accounting principles used and significant estimates made by management, as well as evaluating the overall financial statement presentation. Our procedures included confirmation of securities owned as of December 31, 2005, by correspondence with the custodians and brokers; where replies were not received from brokers, we performed other auditing procedures. We believe that our audits provide a reasonable basis for our opinion.
In our opinion, the financial statements and financial highlights referred to above present fairly, in all material respects, the financial position of VIP Investment Grade Bond Portfolio as of December 31, 2005, the results of its operations for the year then ended, the changes in its net assets for each of the two years in the period then ended, and its financial highlights for each of the five years in the period then ended, in conformity with accounting principles generally accepted in the United States of America.
/s/ Deloitte & Touche LLP
DELOITTE & TOUCHE LLP
Boston, Massachusetts
February 16, 2006
|
195 Annual Report
Report of Independent Registered Public Accounting Firm
To the Trustees of Variable Insurance Products Fund and Shareholders of VIP High Income Portfolio:
In our opinion, the accompanying statement of assets and liabilities, including the schedule of investments, and the related statements of operations and of changes in net assets and the financial highlights present fairly, in all material respects, the financial position of VIP High Income Portfolio (a fund of Variable Insurance Products Fund) at December 31, 2005 and the results of its operations, the changes in its net assets and the financial highlights for the periods indicated, in conformity with accounting principles generally accepted in the United States of America. These financial statements and financial highlights (hereafter referred to as “financial statements”) are the responsibility of VIP High Income Portfolio’s management; our responsibility is to express an opinion on these financial statements based on our audits. We conducted our audits of these financial state ments in accordance with the standards of the Public Company Accounting Oversight Board (United States). Those standards require that we plan and perform the audit to obtain reasonable assurance about whether the financial statements are free of material misstatement. An audit includes examining, on a test basis, evidence supporting the amounts and disclosures in the financial statements, assessing the accounting principles used and significant estimates made by management, and evaluating the overall financial statement presentation. We believe that our audits, which included confirmation of securities at December 31, 2005 by correspondence with the custodian and brokers, provide a reasonable basis for our opinion.
/s/ PricewaterhouseCoopers LLP
PricewaterhouseCoopers LLP
Boston, Massachusetts
February 14, 2006
|
Report of Independent Registered Public Accounting Firm
To the Trustees of Variable Insurance Products Fund and the Shareholders of VIP Money Market Portfolio:
In our opinion, the accompanying statement of assets and liabilities, including the schedule of investments, and the related statements of operations and of changes in net assets and the financial highlights present fairly, in all material respects, the financial position of VIP Money Market Portfolio (a fund of Variable Insurance Products Fund) at December 31, 2005 and the results of its operations, the changes in its net assets and the financial highlights for the periods indicated, in conformity with accounting principles generally accepted in the United States of America. These financial statements and financial highlights (hereafter referred to as “financial statements”) are the responsibility of the VIP Money Market Portfolio’s management; our responsibility is to express an opinion on these financial statements based on our audits. We conducted our audits of these financial statements in accordance with the standards of the Public Company Accounting Oversight Board (United States). Those standards require that we plan and perform the audit to obtain reasonable assurance about whether the financial statements are free of material misstatement. An audit includes examining, on a test basis, evidence supporting the amounts and disclosures in the financial statements, assessing the accounting principles used and significant estimates made by management, and evaluating the overall financial statement presentation. We believe that our audits, which included confirmation of securities at December 31, 2005 by correspondence with the custodian and brokers, provide a reasonable basis for our opinion.
/s/ PricewaterhouseCoopers LLP
PricewaterhouseCoopers LLP
Boston, Massachusetts
February 9, 2006
|
197 Annual Report
Report of Independent Registered Public Accounting Firm
To the Trustees of Variable Insurance Products Fund III and Shareholders of VIP Balanced Portfolio:
We have audited the accompanying statement of assets and liabilities of VIP Balanced Portfolio (the Fund), a fund of Variable Insurance Products III, including the schedule of investments, as of December 31, 2005, and the related statement of operations for the year then ended, the statement of changes in net assets for each of the two years in the period then ended, and the financial highlights for each of the five years in the period then ended. These financial statements and financial highlights are the responsibility of the Fund’s management. Our responsibility is to express an opinion on these financial statements and financial highlights based on our audits.
We conducted our audits in accordance with standards of the Public Company Accounting Oversight Board (United States). Those standards require that we plan and perform the audit to obtain reasonable assurance about whether the financial statements and financial highlights are free of material misstatement. The Funds are not required to have, nor were we engaged to perform, an audit of its internal control over financial reporting. Our audits included consideration of internal control over financial reporting as a basis for designing audit procedures that are appropriate in the circumstances, but not for the purpose of expressing an opinion on the effectiveness of the Fund’s internal control over financial reporting. Accordingly, we express no such opinion. An audit also includes examining, on a test basis, evidence supporting the amounts and disclosures in the financial statements, assessing the accounting principles used and significant estimates made by management, as well as evaluating the overall financial statement presentation. Our procedures included confirmation of securities owned as of December 31, 2005 by correspondence with the custodians and brokers; where replies were not received from brokers, we performed other auditing procedures. We believe that our audits provide a reasonable basis for our opinion.
In our opinion, the financial statements and financial highlights referred to above present fairly, in all material respects, the financial positions of VIP Balanced Portfolio as of December 31, 2005 the results of its operations for the year then ended, the changes in its net assets for each of the two years in the period then ended, and its financial highlights for each of the five years in the period then ended, in conformity with accounting principles generally accepted in the United States of America.
/s/ Deloitte & Touche LLP
DELOITTE & TOUCHE LLP
Boston, Massachusetts
February 15, 2006
|
The Trustees, Member of the Advisory Board, and executive officers of the trusts and funds, as applicable, are listed below. The Board of Trustees governs the fund and is responsible for protecting the interests of shareholders. The Trustees are experienced executives who meet periodically throughout the year to oversee the fund’s activities, review contractual arrangements with companies that provide services to the fund, and review the fund’s performance. Except for William O. McCoy and Albert R. Gamper, Jr., each of the Trustees oversees 326 funds advised by FMR or an affiliate. Mr. McCoy oversees 328 funds advised by FMR or an affiliate. Mr. Gamper oversees 235 funds advised by FMR or an affiliate.
The Trustees hold office without limit in time except that (a) any Trustee may resign; (b) any Trustee may be removed by written instrument, signed by at least two thirds of the number of Trustees prior to such removal; (c) any Trustee who requests to be retired or who has become incapac itated by illness or injury may be retired by written instrument signed by a majority of the other Trustees; and (d) any Trustee may be removed at any special meeting of shareholders by a two thirds vote of the outstanding voting securities of the trust. Each Trustee who is not an interested person (as defined in the 1940 Act) (Independent Trustee), shall retire not later than the last day of the calendar year in which his or her 72nd birthday occurs. The Independent Trustees may waive this mandatory retirement age policy with respect to individual Trustees. The executive officers and Advisory Board Member hold office without limit in time, except that any officer and Advisory Board Member may resign or may be removed by a vote of a majority of the Trustees at any regular meeting or any special meeting of the Trustees. Except as indicated, each individual has held the office shown or other offices in the same company for the past five years.
The funds’ Statement of Additional Information (SAI) includes more information about the Trustees. To request a free copy, call Fidelity at 1-877-208-0098.
Interested Trustees*:
Correspondence intended for each Trustee who is an interested person may be sent to Fidelity Investments, 82 Devonshire Street, Boston, Massachusetts 02109.
| | Name, Age; Principal Occupation
Edward C. Johnson 3d (75)
|
Year of Election or Appointment: 1981, 1988, or 1994
Trustee of Variable Insurance Products Fund (1981), Variable Insurance Products Fund II (1988), and Variable Insurance Products Fund III (1994). Mr. Johnson is Chairman of the Board of Trustees. Mr. Johnson serves as Chief Executive Officer, Chairman, and a Director of FMR Corp.; a Director and Chairman of the Board and of the Executive Committee of FMR; Chairman and a Director of Fidelity Management & Research (Far East) Inc.; Chairman and a Director of Fidelity Investments Money Management, Inc.; and Chairman (2001 present) and a Director (2000 present) of FMR Co., Inc.
Year of Election or Appointment: 2005
Mr. Jonas is Senior Vice President of VIP Asset Manager (2005 present), VIP Asset Manager: Growth (2005 present), VIP Balanced (2005 present), VIP High Income (2005 present), VIP Investment Grade Bond Portfolio (2005 present), and VIP Money Market (2005 present). He also serves as Senior Vice President of other Fidelity funds (2005 present). Mr. Jonas is Executive Director of FMR (2005 present). Previously, Mr. Jonas served as President of Fidelity Enterprise Operations and Risk Services (2004 2005), Chief Administrative Officer (2002 2004), and Chief Financial Officer of FMR Co. (1998 2000). Mr. Jonas has been with Fidelity Investments since 1987 and has held various financial and management positions including Chief Financial Officer of FMR. In addition, he serves on the Boards of Boston Ballet (2003 present) and Simmons College (2003 present).
Year of Election or Appointment: 2003
Mr. Reynolds is a Director (2003 present) and Chief Operating Officer (2002 present) of FMR Corp. He also serves on the Board at Fidelity Investments Canada, Ltd. (2000 present). Previously, Mr. Reynolds served as President of Fidelity Investments Institutional Retirement Group (1996 2000).
* Trustees have been determined to be “Interested Trustees” by virtue of, among other things, their affiliation with the trusts or various entities under common control with FMR.
199 Annual Report
Trustees and Officers - continued
Independent Trustees:
|
Correspondence intended for each Independent Trustee (that is, the Trustees other than the Interested Trustees) may be sent to Fidelity Investments, P.O. Box 55235, Boston, Massachusetts 02205-5235.
| | Name, Age; Principal Occupation
Dennis J. Dirks (57)
|
Year of Election or Appointment: 2005
Prior to his retirement in May 2003, Mr. Dirks was Chief Operating Officer and a member of the Board of The Depository Trust & Clearing Corporation (DTCC) (1999 2003). He also served as President, Chief Operating Officer, and Board member of The De pository Trust Company (DTC) (1999 2003) and President and Board member of the National Securities Clearing Corporation (NSCC) (1999 2003). In addition, Mr. Dirks served as Chief Executive Officer and Board member of the Government Securities Clearing Corporation (2001 2003) and Chief Executive Officer and Board member of the Mortgage Backed Securities Clearing Corporation (2001 2003). Mr. Dirks also serves as a Trustee of Manhattan College (2005 present).
| | Albert R. Gamper, Jr. (63)
|
Year of Election or Appointment: 2006
Mr. Gamper also serves as a Trustee (2006 present) or Member of the Advisory Board (2005 present) of other investment compa nies advised by FMR. Prior to his retirement in December 2004, Mr. Gamper served as Chairman of the Board of CIT Group Inc. (commercial finance). During his tenure with CIT Group Inc. Mr. Gamper served in numerous senior management positions, includ ing Chairman (1987 1989; 1999 2001; 2002 2004), Chief Executive Officer (1987 2004), and President (1989 2002). He cur rently serves as a member of the Board of Directors of Public Service Enterprise Group (utilities, 2001 present), Chairman of the Board of Governors, Rutgers University (2004 present), and Chairman of the Board of Saint Barnabas Health Care System.
Year of Election or Appointment: 1997
Dr. Gates is Chairman of the Independent Trustees (2006 present). Dr. Gates is President of Texas A&M University (2002 present). He was Director of the Central Intelligence Agency (CIA) from 1991 to 1993. From 1989 to 1991, Dr. Gates served as Assistant to the President of the United States and Deputy National Security Advisor. Dr. Gates is a Director of NACCO Industries, Inc. (mining and manufacturing), Parker Drilling Co., Inc. (drilling and rental tools for the energy industry, 2001 present), and Brinker International (restaurant management, 2003 present). Previously, Dr. Gates served as a Director of LucasVarity PLC (automotive components and diesel engines), a Director of TRW Inc. (automotive, space, defense, and information technology), and Dean of the George Bush School of Government and Public Service at Texas A&M University (1999 2001). Dr. Gates also is a Trustee of the Forum for International Policy.
Year of Election or Appointment: 2004
Dr. Heilmeier is Chairman Emeritus of Telcordia Technologies (communication software and systems), where prior to his retirement, he served as company Chairman and Chief Executive Officer. He currently serves on the Boards of Directors of The Mitre Corpo ration (systems engineering and information technology support for the government), and HRL Laboratories (private research and development, 2004 present). He is Chairman of the General Motors Science & Technology Advisory Board and a Life Fellow of the Institute of Electrical and Electronics Engineers (IEEE) (2000 present). Dr. Heilmeier is a member of the Defense Science Board and the National Security Agency Advisory Board. He is also a member of the National Academy of Engineering, the American Academy of Arts and Sciences, and the Board of Overseers of the School of Engineering and Applied Science of the University of Pennsylvania. Previously, Dr. Heilmeier served as a Director of TRW Inc. (automotive, space, defense, and information technology, 1992 2002), Compaq (1994 2002), Automatic Data Processing, Inc. (ADP) (technology based business outsourcing, 1995 2002), INET Technologies Inc. (telecommunications network surveillance, 2001 2004), and Teletech Holdings (customer management ser vices). He is the recipient of the 2005 Kyoto Prize in Advanced Technology for his invention of the liquid display.
Year of Election or Appointment: 2001
Prior to Ms. Knowles’ retirement in June 2000, she served as Executive Vice President and Chief Financial Officer of Atlantic Rich field Company (ARCO) (diversified energy, 1996 2000). From 1993 to 1996, she was a Senior Vice President of ARCO and President of ARCO Transportation Company. She served as a Director of ARCO from 1996 to 1998. She currently serves as a Director of Phelps Dodge Corporation (copper mining and manufacturing) and McKesson Corporation (healthcare service, 2002 present). Ms. Knowles is a Trustee of the Brookings Institution and the Catalina Island Conservancy and also serves as a member of the Advisory Board for the School of Engineering of the University of Southern California.
| | Name, Age; Principal Occupation
Ned C. Lautenbach (61)
|
Year of Election or Appointment: 2000
Mr. Lautenbach has been a partner of Clayton, Dubilier & Rice, Inc. (private equity investment firm) since September 1998. Pre viously, Mr. Lautenbach was with the International Business Machines Corporation (IBM) from 1968 until his retirement in 1998. Mr. Lautenbach serves as a Director of Italtel Holding S.p.A. (telecommunications (Milan, Italy), 2004 present) and Eaton Corpora tion (diversified industrial) as well as the Philharmonic Center for the Arts in Naples, Florida. He also is a member of the Board of Trustees of Fairfield University (2005 present), as well as a member of the Council on Foreign Relations.
Year of Election or Appointment: 1997
Prior to his retirement in December 1994, Mr. McCoy was Vice Chairman of the Board of BellSouth Corporation (telecommunica tions) and President of BellSouth Enterprises. He is currently a Director of Liberty Corporation (holding company), Duke Realty Cor poration (real estate), and Progress Energy, Inc. (electric utility). He is also a partner of Franklin Street Partners (private investment management firm) and a member of the Research Triangle Foundation Board. In addition, Mr. McCoy served as the Interim Chan cellor (1999 2000) and a member of the Board of Visitors for the University of North Carolina at Chapel Hill and currently serves on the Board of Directors of the University of North Carolina Health Care System and the Board of Visitors of the Kenan Flagler Business School (University of North Carolina at Chapel Hill). He also served as Vice President of Finance for the University of North Carolina (16 school system).
Year of Election or Appointment: 2005
Ms. Small is a member (2000 present) and Chairperson (2002 present) of the Investment Committee, and a member (2002 present) of the Board of Trustees of Smith College. Previously, she served as Chief Investment Officer (1999 2000), Director of Global Equity Investments (1996 1999), and a member of the Board of Directors of Scudder, Stevens & Clark (1990 1997) and Scudder Kemper Investments (1997 1998). In addition, Ms. Small served as Co Chair (2000 2003) of the Annual Fund for the Fletcher School of Law and Diplomacy.
| | William S. Stavropoulos (66)
|
Year of Election or Appointment: 2001
Mr. Stavropoulos is Chairman of the Board (2000 present) and a Member of the Board of Directors of The Dow Chemical Company. Since joining The Dow Chemical Company in 1967, Mr. Stavropoulos served in numerous senior management posi tions, including President (1993 2000; 2002 2003), CEO (1995 2000; 2002 2004), and Chairman of the Executive Committee (2000 2004). Currently, he is a Director of NCR Corporation (data warehousing and technology solutions), BellSouth Corporation (telecommunications), Chemical Financial Corporation, Maersk Inc. (industrial conglomerate, 2002 present), and Metalmark Capi tal (private equity investment firm, 2005 present). He also serves as a member of the Board of Trustees of the American Enterprise Institute for Public Policy Research. In addition, Mr. Stavropoulos is a member of The Business Council, J.P. Morgan International Council and the University of Notre Dame Advisory Council for the College of Science.
Year of Election or Appointment: 2005
Prior to his retirement in 2001, Mr. Wolfe was Chairman and Chief Executive Officer of Hershey Foods Corporation (1993 2001). He currently serves as a member of the boards of Adelphia Communications Corporation (2003 present), Bausch & Lomb, Inc., and Revlon Inc. (2004 present).
Advisory Board Member and Executive Officers:
Correspondence intended for each executive officer and Mr. Lynch may be sent to Fidelity Investments, 82 Devonshire Street, Boston, Massachusetts 02109.
| | Name, Age; Principal Occupation
Peter S. Lynch (61)
|
Year of Election or Appointment: 2003
Member of the Advisory Board of Variable Insurance Products Fund, Variable Insurance Products Fund II, and Variable Insurance Products Fund III. Vice Chairman and a Director of FMR, and Vice Chairman (2001 present) and a Director (2000 present) of FMR Co., Inc. Previously, Mr. Lynch served as a Trustee of the Fidelity funds (1990 2003). In addition, he serves as a Trustee of Boston College, Massachusetts Eye & Ear Infirmary, Historic Deerfield, John F. Kennedy Library, and the Museum of Fine Arts of Boston.
201 Annual Report
Trustees and Officers - continued
|
| | Name, Age; Principal Occupation
Dwight D. Churchill (52)
|
Year of Election or Appointment: 2005
Vice President of VIP Balanced. Mr. Churchill also serves as Vice President of certain Equity Funds (2005 present) and certain High Income Funds (2005 present). Previously, he served as Head of Fidelity’s Fixed Income Division (2000 2005), Vice President of Fidelity’s Money Market Funds (2000 2005), Vice President of Fidelity’s Bond Funds, and Senior Vice President of FIMM (2000) and FMR. Mr. Churchill joined Fidelity in 1993 as Vice President and Group Leader of Taxable Fixed Income Investments.
Year of Election or Appointment: 2005
Vice President of VIP Asset Manager, VIP Asset Manager: Growth, VIP Balanced, VIP High Income, VIP Investment Grade Bond, and VIP Money Market. Mr. Donovan also serves as Vice President of Fidelity’s High Income Funds (2005 present), Fidelity’s Fixed Income Funds (2005 present), certain Asset Allocation Funds (2005 present), and certain Balanced Funds (2005 present). Mr. Donovan also serves as Executive Vice President of FMR (2005 present) and FMRC (2005 present). Previously, Mr. Donovan served as Vice President and Director of Fidelity’s International Equity Trading group (1998 2005).
Year of Election or Appointment: 2005
Vice President of VIP Asset Manager and VIP Asset Manager: Growth. Mr. Greer also serves as Vice President of the Fidelity Select Portfolios (2005 present), certain Asset Allocation Funds (2005 present), a Trustee of other investment companies advised by FMR (2003 present), and a member of the FMR senior management team (2005 present). Previously, Mr. Greer served as a Director and Managing Director of Strategic Advisers, Inc. (2002 2005), Executive Vice President (2000 2002), and Money Market Group Leader (1997 2002) of the Fidelity Investments Fixed Income Division. He also served as Vice President of Fidelity’s Money Market Funds (1997 2002), Senior Vice President of FMR (1997 2002), and Vice President of FIMM (1998 2002).
Year of Election or Appointment: 2005
Vice President of VIP Asset Manager, VIP Asset Manager: Growth, and VIP Money Market. Mr. Morrison also serves as Vice Presi dent of Fidelity’s Money Market Funds (2005 present) and certain Asset Allocation Funds (2002 present). Previously, he served as Vice President of Fidelity’s Bond Funds (2002 2005) and certain Balanced Funds (2002 2005). He served as Vice President (2002 2005) and Bond Group Leader (2002 2005) of Fidelity Investments Fixed Income Division. Mr. Morrison is also Vice Presi dent of FIMM (2002 present) and FMR (2002 present). Mr. Morrison joined Fidelity Investments in 1987 as a Corporate Bond Analyst in the Fixed Income Research Division.
Year of Election or Appointment: 2002
Vice President of VIP Asset Manager, VIP Asset Manager: Growth, VIP Balanced, VIP Investment Grade Bond, and VIP Money Market. Mr. Murphy also serves as Vice President of Fidelity’s Money Market Funds (2002 present), certain Asset Allocation Funds (2003 present), Fidelity’s Investment Grade Bond Funds (2005 present), and Fidelity’s Balanced Funds (2005 present). He serves as Senior Vice President (2000 present) and Head (2004 present) of the Fidelity Investments Fixed Income Division. Mr. Murphy is also a Senior Vice President of FIMM (2003 present) and a Vice President of FMR (2000 present). Previously, Mr. Murphy served as Money Market Group Leader (2002 2004), Bond Group Leader (2000 2002), and Vice President of Fidelity’s Taxable Bond Funds (2000 2002) and Fidelity’s Municipal Bond Funds (2001 2002). Mr. Murphy joined Fidelity Investments in 1989 as a portfolio manager in the Bond Group.
Year of Election or Appointment: 2005
Vice President of VIP Asset Manager, VIP Asset Manager: Growth, VIP Balanced, and VIP Investment Grade Bond. Mr. Silvia also serves as Vice President of Fidelity’s Bond Funds (2005 present) and Senior Vice President and Bond Group Leader of the Fidelity Investments Fixed Income Division (2005 present). Previously, Mr. Silvia served as Director of Fidelity’s Taxable Bond portfolio managers (2002 2004) and a portfolio manager in the Bond Group (1997 2004).
Year of Election or Appointment: 2003
Vice President of VIP High Income. Mr. Conti also serves as Vice President of other funds advised by FMR. Prior to assuming his current responsibilities, Mr. Conti worked as a research analyst and manager. Mr. Conti also serves as Vice President of FMR (2003) and FMR Co., Inc. (2003).
Name, Age; Principal Occupation
Richard C. Habermann (65)
|
Year of Election or Appointment: 2001
Vice President of VIP Asset Manager and VIP Asset Manager: Growth. Mr. Habermann also serves as Vice President of other funds advised by FMR. Prior to assuming his current responsibilities, Mr. Habermann worked as a portfolio manager, director of research for FMR Co., division head for international equities and director of international research, and chief investment officer for Fidelity International, Limited. Mr. Habermann also serves as Senior Vice President of FMR and FMR Co., Inc. (2001).
Year of Election or Appointment: 2003 or 2004
Vice President of VIP Asset Manager (2004), VIP Asset Manager: Growth (2004), and VIP Money Market (2003). Mr. Miller also serves as Vice President of other funds advised by FMR. Prior to assuming his current responsibilities, Mr. Miller worked as an ana lyst, bond trader and portfolio manager.
Year of Election or Appointment: 2001
Vice President of VIP Asset Manager, VIP Asset Manager: Growth, VIP Balanced, and VIP Investment Grade Bond. Mr. O’Neil also serves as Vice President of other funds advised by FMR. Prior to assuming his current responsibilities, Mr. O’Neil worked as a re search analyst and portfolio manager.
Year of Election or Appointment: 2005
Vice President of VIP Balanced. Mr. Rakers also manages other Fidelity funds. Since joining Fidelity Investments in 1993, Mr. Rakers has worked as a research analyst and manager.
Year of Election or Appointment: 1998
Secretary of VIP Asset Manager, VIP Asset Manager: Growth, VIP Balanced, VIP High Income, VIP Investment Grade Bond, and VIP Money Market. He also serves as Secretary of other Fidelity funds; Vice President, General Counsel, and Secretary of FMR Co., Inc. (2001 present) and FMR; Assistant Secretary of Fidelity Management & Research (U.K.) Inc. (2001 present), Fidelity Management & Research (Far East) Inc. (2001 present), and Fidelity Investments Money Management, Inc. (2001 present). Mr. Roiter is an Adjunct Member, Faculty of Law, at Boston College Law School (2003 present). Previously, Mr. Roiter served as Vice President and Secretary of Fidelity Distributors Corporation (FDC) (1998 2005).
Year of Election or Appointment: 2003
Assistant Secretary of VIP Asset Manager, VIP Asset Manager: Growth, VIP Balanced, VIP High Income, VIP Investment Grade Bond, and VIP Money Market. Mr. Fross also serves as Assistant Secretary of other Fidelity funds (2003 present), Vice President and Secretary of FDC (2005 present), and is an employee of FMR.
Year of Election or Appointment: 2004
President, Treasurer, and Anti Money Laundering (AML) officer of VIP Asset Manager, VIP Asset Manager: Growth, VIP Balanced, VIP High Income, VIP Investment Grade Bond, and VIP Money Market. Ms. Reynolds also serves as President, Treasurer, and AML officer of other Fidelity funds (2004) and is a Vice President (2003) and an employee (2002) of FMR. Before joining Fidelity Invest ments, Ms. Reynolds worked at PricewaterhouseCoopers LLP (PwC) (1980 2002), where she was most recently an audit partner with PwC’s investment management practice.
Year of Election or Appointment: 2005
Chief Financial Officer of VIP Asset Manager, VIP Asset Manager: Growth, VIP Balanced, VIP High Income, VIP Investment Grade Bond, and VIP Money Market. Mr. Murphy also serves as Chief Financial Officer of other Fidelity funds (2005 present). He also serves as Senior Vice President of Fidelity Pricing and Cash Management Services Group (FPCMS).
Kenneth A. Rathgeber (58)
|
Year of Election or Appointment: 2004
Chief Compliance Officer of VIP Asset Manager, VIP Asset Manager: Growth, VIP Balanced, VIP High Income, VIP Investment Grade Bond, and VIP Money Market. Mr. Rathgeber also serves as Chief Compliance Officer of other Fidelity funds (2004) and Executive Vice President of Risk Oversight for Fidelity Investments (2002). Previously, he served as Executive Vice President and Chief Operating Officer for Fidelity Investments Institutional Services Company, Inc. (1998 2002).
203 Annual Report
Trustees and Officers - continued
|
| | Name, Age; Principal Occupation
John R. Hebble (47)
|
Year of Election or Appointment: 2003
Deputy Treasurer of VIP Asset Manager, VIP Asset Manager: Growth, VIP Balanced, VIP High Income, VIP Investment Grade Bond, and VIP Money Market. Mr. Hebble also serves as Deputy Treasurer of other Fidelity funds (2003), and is an employee of FMR. Before joining Fidelity Investments, Mr. Hebble worked at Deutsche Asset Management where he served as Director of Fund Ac counting (2002 2003) and Assistant Treasurer of the Scudder Funds (1998 2003).
Year of Election or Appointment: 2005
Deputy Treasurer of VIP Asset Manager, VIP Asset Manager: Growth, VIP Balanced, VIP High Income, VIP Investment Grade Bond, and VIP Money Market. Mr. Mehrmann also serves as Deputy Treasurer of other Fidelity funds (2005 present) and is an employee of FMR. Previously, Mr. Mehrmann served as Vice President of Fidelity Investments Institutional Services Group (FIIS)/Fidelity Investments Institutional Operations Corporation, Inc. (FIIOC) Client Services (1998 2004).
| | Kimberley H. Monasterio (42)
|
Year of Election or Appointment: 2004
Deputy Treasurer of VIP Asset Manager, VIP Asset Manager: Growth, VIP Balanced, VIP High Income, VIP Investment Grade Bond, and VIP Money Market. Ms. Monasterio also serves as Deputy Treasurer of other Fidelity funds (2004) and is an employee of FMR (2004). Before joining Fidelity Investments, Ms. Monasterio served as Treasurer (2000 2004) and Chief Financial Officer (2002 2004) of the Franklin Templeton Funds and Senior Vice President of Franklin Templeton Services, LLC (2000 2004).
Year of Election or Appointment: 2005
Deputy Treasurer of VIP Asset Manager, VIP Asset Manager: Growth, VIP Balanced, VIP High Income, VIP Investment Grade Bond, and VIP Money Market. Mr. Robins also serves as Deputy Treasurer of other Fidelity funds (2005 present) and is an employee of FMR (2004 present). Before joining Fidelity Investments, Mr. Robins worked at KPMG LLP, where he was a partner in KPMG’s de partment of professional practice (2002 2004) and a Senior Manager (1999 2000). In addition, Mr. Robins served as Assistant Chief Accountant, United States Securities and Exchange Commission (2000 2002).
Year of Election or Appointment: 2005
Assistant Treasurer of VIP Asset Manager, VIP Asset Manager: Growth, VIP Balanced, VIP High Income, VIP Investment Grade Bond, and VIP Money Market. Mr. Byrnes also serves as Assistant Treasurer of other Fidelity funds (2005 present) and is an employee of FMR (2005 present). Previously, Mr. Byrnes served as Vice President of FPCMS (2003 2005). Before joining Fidelity Investments, Mr. Byrnes worked at Deutsche Asset Management where he served as Vice President of the Investment Operations Group (2000 2003).
Year of Election or Appointment: 1986
Assistant Treasurer of VIP Asset Manager, VIP Asset Manager: Growth, VIP Balanced, VIP High Income, VIP Investment Grade Bond, and VIP Money Market. Mr. Costello also serves as Assistant Treasurer of other Fidelity funds and is an employee of FMR.
Year of Election or Appointment: 2004
Assistant Treasurer of VIP Asset Manager, VIP Asset Manager: Growth, VIP Balanced, VIP High Income, VIP Investment Grade Bond, and VIP Money Market. Mr. Lydecker also serves as Assistant Treasurer of other Fidelity funds (2004) and is an employee of FMR.
Year of Election or Appointment: 2002
Assistant Treasurer of VIP Asset Manager, VIP Asset Manager: Growth, VIP Balanced, VIP High Income, VIP Investment Grade Bond, and VIP Money Market. Mr. Osterheld also serves as Assistant Treasurer of other Fidelity funds (2002) and is an employee of FMR.
Year of Election or Appointment: 2005
Assistant Treasurer of VIP Asset Manager, VIP Asset Manager: Growth, VIP Balanced, VIP High Income, VIP Investment Grade Bond, and VIP Money Market. Mr. Ryan also serves as Assistant Treasurer of other Fidelity funds (2005 present) and is an em ployee of FMR (2005 present). Previously, Mr. Ryan served as Vice President of Fund Reporting in FPCMS (1999 2005).
Name, Age; Principal Occupation
Salvatore Schiavone (40)
|
Year of Election or Appointment: 2005
Assistant Treasurer of VIP Asset Manager, VIP Asset Manager: Growth, VIP Balanced, VIP High Income, VIP Investment Grade Bond, and VIP Money Market. Mr. Schiavone also serves as Assistant Treasurer of other Fidelity funds (2005 present) and is an employee of FMR (2005 present). Before joining Fidelity Investments, Mr. Schiavone worked at Deutsche Asset Management, where he most recently served as Assistant Treasurer (2003 2005) of the Scudder Funds and Vice President and Head of Fund Reporting (1996 2003).
205 Annual Report
The Board of Trustees of each fund voted to pay to shareholders of record at the opening of business on record date, the following distributions per share derived from capital gains realized from sales of portfolio securities, and dividends derived from net investment income:
| Fund | | Pay Date | | Record Date | | Dividends | | Capital Gains |
| VIP Balanced | | | | | | | | |
| Initial Class | | 02/10/06 | | 02/10/06 | | $.306 | | $.500 |
| Service Class | | 02/10/06 | | 02/10/06 | | $.289 | | $.500 |
| Service Class 2 | | 02/10/06 | | 02/10/06 | | $.272 | | $.500 |
| Investor Class | | 02/10/06 | | 02/10/06 | | $.313 | | $.500 |
| VIP Investment Grade Bond | | | | | | | | |
| Initial Class | | 02/10/06 | | 02/10/06 | | $.501 | | $.030 |
| Service Class | | 02/10/06 | | 02/10/06 | | $.492 | | $.030 |
| Service Class 2 | | 02/10/06 | | 02/10/06 | | $.478 | | $.030 |
| Investor Class | | 02/10/06 | | 02/10/06 | | $.508 | | $.030 |
The funds hereby designate as capital gain dividend the amounts noted below for the taxable year ended December 31, 2005, or, if subsequently determined to be different, the net capital gain of such year.
| Fund | | |
| VIP Balanced | | $ 11,747,332 |
| VIP Investment Grade Bond | | $ 3,230,122 |
A percentage of the dividends distributed during the fiscal year for the following funds was derived from interest on U.S. Government securities which is generally exempt from state income tax:
| Fund | | |
| VIP Asset Manager | | 6.59% |
| VIP Balanced | | 6.70% |
| VIP Investment Grade Bond | | 6.53% |
A percentage of the dividends distributed during the fiscal year for the following funds qualifies for the dividends received deduction for corporate shareholders:
| Fund | | |
| VIP Asset Manager | | |
| Initial Class | | 41% |
| Service Class | | 43% |
| Service Class 2 | | 44% |
| VIP Asset Manager: Growth | | |
| Initial Class | | 65% |
| Service Class | | 69% |
| Service Class 2 | | 77% |
| VIP Balanced | | |
| Initial Class | | 44% |
| Service Class | | 46% |
| Service Class 2 | | 48% |
The funds will notify shareholders in January 2006 of amounts for use in preparing 2005 income tax returns.
Board Approval of Investment Advisory Contracts and Management Fees
VIP Asset Manager Portfolio
VIP Asset Manager: Growth Portfolio
VIP Balanced Portfolio
|
Each year, typically in July, the Board of Trustees, including the independent Trustees (together, the Board), votes on the renewal of the management contract and sub advisory agreements (together, the Advisory Contracts) for each fund. The Board, assisted by the advice of fund counsel and independent Trustees’ counsel, requests and considers a broad range of information throughout the year.
The Board meets regularly each month except August and takes into account throughout the year matters bearing on Advisory Contracts. The Board, acting directly and through its separate committees, considers at each of its meetings factors that are relevant to the annual renewal of each fund’s Advisory Contracts, including the services and support provided to each fund and its shareholders by Fidelity. At the time of the renewal, the Board had 11 standing committees, each composed of independent Trustees with varying backgrounds, to which the Board has assigned specific subject matter responsibilities in order to enhance effective decision making by the Board. Each committee has adopted a written charter outlining the structure and purposes of the committee. One such committee, the Equity Contract Committee, meets periodically during the first six months of each year and as necessary to consider matters specifically related to the annual renewal of Advisory Contracts. The committee requests and receives information on, and makes recommendations to the independent Trustees concerning, the approval and annual review of the Advisory Contracts.
At its July 2005 meeting, the Board of Trustees, including the independent Trustees, unanimously determined to renew the Advisory Contracts for each fund. In reaching its determination, the Board considered all factors it believed relevant, including (1) the nature, extent, and quality of the services to be provided to each fund and its shareholders by Fidelity (including the investment performance of each fund); (2) the competitiveness of the man agement fee and total expenses of each fund; (3) the total costs of the services to be provided by and the profits to be realized by the investment adviser and its affiliates from the relationship with each fund; (4) the extent to which economies of scale would be realized as each fund grows; and (5) whether fee levels reflect these economies of scale, if any, for the benefit of fund shareholders.
In determining whether to renew the Advisory Contracts for each fund, the Board ultimately reached a determination, with the assistance of fund counsel and independent Trustees’ counsel, that the renewal of the Advisory Contracts and the compensation to be received by Fidelity under the management contracts is consistent with Fidelity’s fiduciary duty under applicable law. In addition to evaluating the specific factors noted above, the Board, in reaching its determination, is aware that shareholders in each fund have a broad range of investment choices available to them, including a wide choice among mutual funds offered by competitors to Fidelity, and that each fund’s shareholders, with the opportunity to review and weigh the disclosure provided by the fund in its prospectus and other public disclosures, have chosen to invest in that fund, managed by Fidelity.
Nature, Extent, and Quality of Services Provided by Fidelity. The Board considered staffing within the investment adviser, FMR, and the sub advisers (together, the Investment Advisers), including the backgrounds of the funds’ portfolio managers and the funds’ investment objectives and disciplines. The independent Trustees also had discussions with senior management of Fidelity’s investment operations and investment groups. The Board considered the structure of the portfolio manager compensation program and whether this structure provides appropriate incentives.
Fidelity Resources Dedicated to Investment Management and Support Services. The Board reviewed the size, education, and experience of the Invest ment Advisers’ investment staff, their use of technology, and the Investment Advisers’ approach to recruiting, training, and retaining portfolio managers and other research, advisory, and management personnel. The Board considered Fidelity’s extensive global research capabilities that enable the Investment Advisers to aggregate data from various sources in an effort to produce positive investment results. The Board noted that Fidelity’s analysts have access to a variety of technological tools that enable them to perform both fundamental and quantitative analysis and to specialize in various disciplines. The Board also considered that Fidelity’s portfolio managers and analysts have access to daily portfolio attribution that allows for monitor ing of a fund’s portfolio, as well as an electronic communication system that provides immediate real time access to research concerning issuers and credit enhancers.
Shareholder and Administrative Services. The Board considered the nature, extent, quality, and cost of administrative, distribution, and shareholder services performed by the Investment Advisers and their affiliates under the Advisory Contracts and under separate agreements covering transfer agency, pricing and bookkeeping, and securities lending services for each fund. The Board also considered the nature and extent of the Investment Advisers’ supervision of third party service providers, principally custodians and subcustodians. The Board reviewed the allocation of fund brokerage, including allocations to brokers affiliated with the Investment Advisers, the use of brokerage commissions to pay fund expenses, and the use of “soft” commission dollars to pay for research services. The Board also considered that Fidelity voluntarily decided in 2004 to stop using “soft” commission dollars to pay for market data and, instead, to pay for that data out of its own resources. The Board also considered the resources devoted to, and the record of compliance with, each fund’s compliance policies and procedures.
The Board noted that the growth of fund assets across the complex allows Fidelity to reinvest in the development of services designed to enhance the value or convenience of the Fidelity funds as investment vehicles. These services include 24 hour access to account information and market informa tion through phone representatives and over the Internet, and investor education materials and asset allocation tools.
207 Annual Report
Board Approval of Investment Advisory Contracts and Management Fees - continued
Investment in a Large Fund Family. The Board considered the benefits to shareholders of investing in a Fidelity fund, including the benefits of investing in a fund that is part of a large family of funds offering a variety of investment disciplines and providing for a large variety of mutual fund investor services. The Board noted that, since the last Advisory Contract renewals in July 2004, Fidelity has taken a number of actions that benefited particular funds, including (i) voluntarily deciding in 2004 to stop using “soft” commission dollars to pay for market data and, instead, to pay for that data out of its own resources, (ii) contractually agreeing to impose management fee reductions and expense limitations on its five Spartan stock index funds and its stock index fund available through variable insurance products, (iii) contractually agreeing to eliminate the management fees on the Fidelity Freedom Funds and the Fidelity Advisor Freedom Funds, (iv) contractually agreeing to reduce the management fees on most of its investment grade taxable bond funds, and (v) contractually agreeing to impose expense limitations on its retail and Spartan investment grade taxable bond funds.
Investment Performance and Compliance. The Board considered whether each fund has operated within its investment objective, as well as its record of compliance with its investment restrictions. It also reviewed each fund’s absolute investment performance for each class, as well as each fund’s relative investment performance for each class measured against (i) a proprietary custom index, and (ii) a peer group of mutual funds deemed appropriate by the Board over multiple periods. For each fund, the following charts considered by the Board show, over the one , three , and five year periods ended December 31, 2004, the returns of Service Class and Initial Class of the fund, the returns of a proprietary custom index (“benchmark”), and a range of returns of a peer group of mutual funds identified by Lipper Inc. as having an investment objective similar to that of the fund. The returns of Service Class and Initial Class represent the performance of classes with high and low 12b 1 fees, respectively (not necessarily with the highest and lowest total expenses). (Unlike Service Class, Service Class 2, which has a higher 12b 1 fee than Service Class, did not have five years of performance as of December 31, 2004.) The box within each chart shows the 25th percentile return (bottom of box) and the 75th percentile return (top of box) of the Lipper peer group. Returns shown above the box are in the first quartile and returns shown below the box are in the fourth quartile. The percentage beaten numbers noted below each chart correspond to the percentile box and represent the percentage of funds in the Lipper peer group whose performance was equal to or lower than that of the class indicated. For each of VIP Asset Manager Portfolio and VIP Asset Manager Growth Portfolio, the proprietary custom index is an index developed by FMR that represents the fund’s three asset classes according to their respective weightings in the fund’s neutral mix. For VIP Balanced Portfolio, the proprietary custom index is an index developed by FMR that represents the fund’s general investment categories in both equity and bond securities.

The Board reviewed the fund’s relative investment performance against its Lipper peer group and stated that the performance of Initial Class of the fund was in the fourth quartile for the one year period and the third quartile for the three and five year periods. The Board also stated that the relative investment performance of the fund was lower than its benchmark over time. The Board considered that the variations in performance among the fund’s classes reflect the variations in class expenses, which result in lower performance for higher expense classes. The Board discussed with FMR actions to be taken by FMR to improve the fund’s disappointing performance.
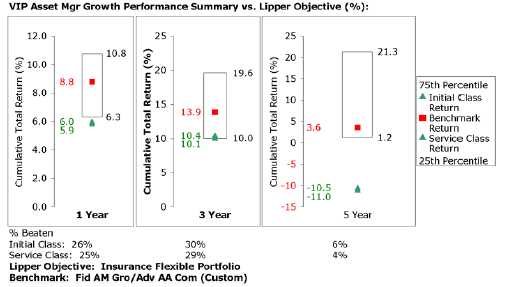
The Board reviewed the fund’s relative investment performance against its Lipper peer group and stated that the performance of Initial Class of the fund was in the third quartile for the one and three year periods and the fourth quartile for the five year period. The Board also stated that the relative investment performance of the fund was lower than its benchmark over time. The Board considered that the variations in performance among the fund’s classes reflect the variations in class expenses, which result in lower performance for higher expense classes. The Board discussed with FMR actions to be taken by FMR to improve the fund’s disappointing performance.
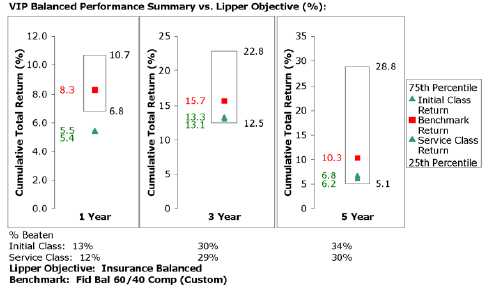
The Board reviewed the fund’s relative investment performance against its Lipper peer group and stated that the performance of Initial Class of the fund was in the fourth quartile for the one year period and the third quartile for the three and five year periods. The Board also stated that the relative investment performance of the fund was lower than its benchmark over time. The Board considered that the variations in performance among the fund’s classes reflect the variations in class expenses, which result in lower performance for higher expense classes. The Board discussed with FMR actions to be taken by FMR to improve the fund’s disappointing performance.
The Board has had thorough discussions with FMR throughout the year about the Board’s and FMR’s concerns about equity research, equity fund performance, and compliance with internal policies governing gifts and entertainment. FMR has taken steps that it believes will refocus and strengthen equity research and equity portfolio management and compliance. The Board noted with favor FMR’s recent reorganization of its senior management team and FMR’s plans to dedicate additional resources to investment research, and participated in the process that led to those changes.
Based on its review, and giving particular weight to the nature and quality of the resources dedicated by the Investment Advisers to maintain and improve relative performance, the Board concluded that the nature, extent, and quality of the services provided by Fidelity will benefit each fund’s
209 Annual Report
Board Approval of Investment Advisory Contracts and Management Fees - continued
shareholders, particularly in light of the Board’s view that each fund’s shareholders benefit from investing in a fund that is part of a large family of funds offering a variety of investment disciplines and services.
Competitiveness of Management Fee and Total Fund Expenses. The Board considered each fund’s management fee and total expenses compared to “mapped groups” of competitive funds and classes. Fidelity creates “mapped groups” by combining similar Lipper investment objective categories that have comparable management fee characteristics. Combining Lipper investment objective categories aids the Board’s management fee and total expense comparisons by broadening the competitive group used for comparison and by reducing the number of universes to which various Fidelity funds are compared.
The Board considered two proprietary management fee comparisons for the 12 month periods shown in the charts below. The group of Lipper funds used by the Board for management fee comparisons is referred to below as the “Total Mapped Group” and, for the reasons explained above, is broader than the Lipper peer group used by the Board for performance comparisons. The Total Mapped Group comparison focuses on a fund’s standing relative to the total universe of comparable funds available to investors, in terms of gross management fees before expense reimbursements or caps. “TMG %” represents the percentage of funds in the Total Mapped Group that had management fees that were lower than a fund’s. For example, a TMG % of 32% would mean that 68% of the funds in the Total Mapped Group had higher management fees than a fund. The “Asset Size Peer Group” (ASPG) compari son focuses on a fund’s standing relative to non Fidelity funds similar in size to the fund within the Total Mapped Group. The ASPG represents at least 15% of the funds in the Total Mapped Group with comparable asset size and management fee characteristics, subject to a minimum of 50 funds (or all funds in the Total Mapped Group if fewer than 50). Additional information, such as the ASPG quartile (“quadrant”) in which a fund’s management fee ranked, is also included in the charts and considered by the Board.

Annual Report 210
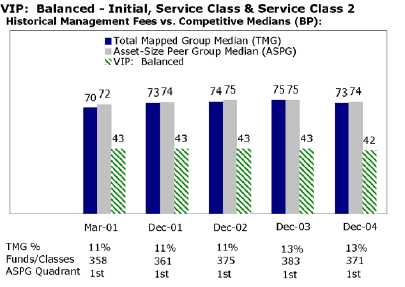
The Board noted that each fund’s management fee ranked below the median of its Total Mapped Group and below the median of its ASPG for 2004.
Based on its review, the Board concluded that each fund’s management fee was fair and reasonable in light of the services that the fund receives and the other factors considered.
In its review of the total expenses of each class of each fund, the Board considered the fund’s management fee as well as other fund or class expenses, as applicable, such as transfer agent fees, pricing and bookkeeping fees, fund paid 12b 1 fees, and custodial, legal, and audit fees. The Board also noted the effects of any waivers and reimbursements on fees and expenses. As part of its review, the Board also considered current and historical total expenses of each class of each fund compared to competitive fund median expenses. Each class of each fund is compared to those funds and classes in the Total Mapped Group (used by the Board for management fee comparisons) that have a similar sales load structure.
The Board noted that the total expenses of each of Initial Class and Service Class of VIP Asset Manager Portfolio ranked below its competitive median for 2004, and the total expenses of Service Class 2 ranked above its competitive median for 2004. The Board noted that the fund offers multiple classes, each of which has a different 12b 1 fee structure, and that the multiple structures are intended to offer a range of pricing options for the intermediary market. The Board also noted that the total expenses of the classes vary primarily by the level of their 12b 1 fees.
The Board noted that the total expenses of Initial Class of VIP Asset Manager: Growth Portfolio ranked below its competitive median for 2004, and the total expenses of each of Service Class and Service Class 2 ranked above its competitive median for 2004. The Board noted that the fund offers multiple classes, each of which has a different 12b 1 fee structure, and that the multiple structures are intended to offer a range of pricing options for the intermediary market. The Board also noted that the total expenses of the classes vary primarily by the level of their 12b 1 fees.
The Board noted that the total expenses of each class of VIP Balanced Portfolio ranked below its competitive median for 2004.
In its review of total expenses, the Board also considered Fidelity fee structures and other information on clients that FMR and its affiliates service in other competitive markets, such as other mutual funds advised or subadvised by FMR or its affiliates, pension plan clients, and other institutional clients.
Based on its review, the Board concluded that the total expenses for each class of each fund were reasonable, although in some cases above the median of the universe presented for comparison, in light of the services that the fund and its shareholders receive and the other factors considered.
Costs of the Services and Profitability. The Board considered the revenues earned and the expenses incurred by Fidelity in conducting the busi ness of developing, marketing, distributing, managing, administering and servicing each fund and its shareholders. The Board also considered the level of Fidelity’s profits in respect of all the Fidelity funds.
On an annual basis, FMR presents to the Board Fidelity’s profitability for each fund. Fidelity calculates the profitability for each fund, as well as aggre gate profitability for groups of Fidelity funds and all Fidelity funds, using a series of detailed revenue and cost allocation methodologies which originate with the audited books and records of Fidelity. The Audit Committee of the Board reviews any significant changes from the prior year’s methodologies.
PricewaterhouseCoopers LLP (PwC), independent registered accounting firm and auditor to Fidelity and certain Fidelity funds, has been engaged annually by the Board as part of the Board’s assessment of the results of Fidelity’s profitability analysis. PwC’s engagement includes the review and assessment of Fidelity’s methodologies used in determining the revenues and expenses attributable to Fidelity’s mutual fund business, and completion
211 Annual Report
Board Approval of Investment Advisory Contracts and Management Fees - continued
of agreed upon procedures surrounding the mathematical accuracy of fund profitability and its conformity to allocation methodologies. After consider ing PwC’s reports issued under the engagement and information provided by Fidelity, the Board believes that while other allocation methods may also be reasonable, Fidelity’s profitability methodologies are reasonable in all material respects.
The Board has also reviewed Fidelity’s non fund businesses and any fall out benefits related to the mutual fund business as well as cases where Fidelity’s affiliates may benefit from or be related to the funds’ business. In addition, a special committee of the Board reviewed services provided to Fidelity by its affiliates and determined that the fees that Fidelity paid for such services were reasonable.
The Board considered the costs of the services provided by and the profits realized by Fidelity in connection with the operation of each fund and determined that the amount of profit is a fair entrepreneurial profit for the management of each fund.
Economies of Scale. The Board considered whether there have been economies of scale in respect of the management of the Fidelity funds, whether the Fidelity funds (including each fund) have appropriately benefited from any such economies of scale, and whether there is potential for realization of any further economies of scale. The Board considered the extent to which each fund will benefit from economies of scale through increased services to the fund, through waivers or reimbursements, or through fee or expense reductions.
The Board recognized that each fund’s management contract incorporates a “group fee” structure, which provides for lower fee rates as total fund assets under FMR’s management increase, and for higher fee rates as total fund assets under FMR’s management decrease. The Board considered that the group fee is designed to deliver the benefits of economies of scale to fund shareholders when total fund assets increase, even if assets of any particu lar fund are unchanged or have declined, because some portion of Fidelity’s costs are attributable to services provided to all Fidelity funds, and all funds benefit if those costs can be allocated among more assets. The Board concluded that, given the group fee structure, fund shareholders will achieve a certain level of economies of scale as assets under FMR’s management increase at the fund complex level, regardless of whether Fidelity achieves any such economies of scale.
The Board further concluded that any potential economies of scale are being shared between fund shareholders and Fidelity in an appropriate manner.
Additional Information Requested by the Board. In order to develop fully the factual basis for consideration of the Advisory Contracts, the Board requested additional information regarding (i) equity fund transfer agency fees; (ii) Fidelity’s fund profitability methodology and the impact of various changes in the methodology over time; (iii) benefits to shareholders from economies of scale; (iv) composition and characteristics of various fund and industry data used in comparisons; and (v) compensation of portfolio managers and research analysts.
Based on its evaluation of all of the conclusions noted above, and after considering all material factors, the Board ultimately concluded that the exist ing advisory fee structures are fair and reasonable, and that each fund’s existing Advisory Contracts should be renewed.
213 Annual Report
Investment Adviser
Fidelity Management & Research Company
Boston, MA
Investment Sub Advisers
FMR Co., Inc.
Asset Manager: Growth, Balanced,
Asset Manager and High Income Portfolios
Fidelity Investments Money Management, Inc.
Asset Manager: Growth, Balanced,
Investment Grade Bond, Money Market, and
Asset Manager Portfolios
Fidelity Management & Research (U.K.) Inc.
Asset Manager: Growth, Balanced, Asset Manager
and High Income Portfolios
Fidelity Management & Research (Far East) Inc.
Asset Manager: Growth, Balanced, Asset Manager,
and High Income Portfolios
Fidelity Investments Japan Limited
Asset Manager: Growth, Balanced, Asset Manager,
and High Income Portfolios
Fidelity International Investment Advisors
Asset Manager: Growth, Balanced, Investment
Grade Bond, Money Market, Asset Manager, and
High Income Portfolios
Fidelity International Investment Advisors (U.K.) Limited
Asset Manager: Growth, Balanced, Investment Grade Bond,
Money Market, Asset Manager, and High Income Portfolios
General Distributor
Fidelity Distributors Corporation
Boston, MA
Transfer and Service Agents
Fidelity Investments Institutional Operations Company, Inc.
Boston, MA
Fidelity Service Company, Inc.
Boston, MA
Custodian
The Bank of New York, New York, NY
Investment Grade Bond, Money Market, and High Income Portfolios
JPMorgan Chase Bank, New York, NY
Asset Manager: Growth, Balanced, and Asset Manager Portfolios
|
VIPGRP2 ANN 0206
1.768593.104
|
Item 2. Code of Ethics
As of the end of the period, December 31, 2005, Variable Insurance Products Fund III (the trust) has adopted a code of ethics, as defined in Item 2 of Form N-CSR, that applies to its President and Treasurer and its Chief Financial Officer. A copy of the code of ethics is filed as an exhibit to this Form N-CSR.
Item 3. Audit Committee Financial Expert
The Board of Trustees of the trust has determined that Marie L. Knowles is an audit committee financial expert, as defined in Item 3 of Form N-CSR. Ms. Knowles is independent for purposes of Item 3 of Form N-CSR.
Item 4. Principal Accountant Fees and Services
(a) Audit Fees.
For the fiscal years ended December 31, 2005 and December 31, 2004, the aggregate Audit Fees billed by Deloitte & Touche LLP, the member firms of Deloitte Touche Tohmatsu, and their respective affiliates (collectively, "Deloitte Entities") for professional services rendered for the audits of the financial statements, or services that are normally provided in connection with statutory and regulatory filings or engagements for those fiscal years, for Aggressive Growth Portfolio, Balanced Portfolio, Dynamic Capital Appreciation Portfolio, Growth & Income Portfolio, Growth Opportunities Portfolio, and Value Strategies Portfolio (the funds) and for all funds in the Fidelity Group of Funds are shown in the table below.
Fund | 2005A | 2004A |
Aggressive Growth Portfolio | $30,000 | $26,000 |
Balanced Portfolio | $38,000 | $34,000 |
Dynamic Capital Appreciation Portfolio | $30,000 | $28,000 |
Growth & Income Portfolio | $35,000 | $31,000 |
Growth Opportunities Portfolio | $34,000 | $30,000 |
Value Strategies Portfolio | $30,000 | $27,000 |
All funds in the Fidelity Group of Funds audited by Deloitte Entities | $5,700,000 | $4,300,000 |
A | Aggregate amounts may reflect rounding. |
For the fiscal years ended December 31, 2005 and December 31, 2004, the aggregate Audit Fees billed by PricewaterhouseCoopers LLP (PwC) for professional services rendered for the audits of the financial statements, or services that are normally provided in connection with statutory and regulatory filings or engagements for those fiscal years, for Mid Cap Portfolio (the fund) and for all funds in the Fidelity Group of Funds are shown in the table below.
Fund | 2005A | 2004A |
Mid Cap Portfolio | $44,000 | $34,000 |
All funds in the Fidelity Group of Funds audited by PwC | $12,300,000 | $10,800,000 |
A | Aggregate amounts may reflect rounding. |
(b) Audit-Related Fees.
In each of the fiscal years ended December 31, 2005 and December 31, 2004, the aggregate Audit-Related Fees billed by Deloitte Entities for services rendered for assurance and related services to each fund that are reasonably related to the performance of the audit or review of the fund's financial statements, but not reported as Audit Fees, are shown in the table below.
Fund | 2005 A | 2004 A |
Aggressive Growth Portfolio | $0 | $0 |
Balanced Portfolio | $0 | $0 |
Dynamic Capital Appreciation Portfolio | $0 | $0 |
Growth & Income Portfolio | $0 | $0 |
Growth Opportunities Portfolio | $0 | $0 |
Value Strategies Portfolio | $0 | $0 |
A | Aggregate amounts may reflect rounding. |
In each of the fiscal years ended December 31, 2005 and December 31, 2004, the aggregate Audit-Related Fees billed by PwC for services rendered for assurance and related services to the fund that are reasonably related to the performance of the audit or review of the fund's financial statements, but not reported as Audit Fees, are shown in the table below.
Fund | 2005 A | 2004 A |
Mid Cap Portfolio | $0 | $0 |
A | Aggregate amounts may reflect rounding. |
In each of the fiscal years ended December 31, 2005 and December 31, 2004, the aggregate Audit-Related Fees that were billed by PwC and Deloitte Entities that were required to be approved by the Audit Committee for services rendered on behalf of Fidelity Management & Research Company (FMR) and entities controlling, controlled by, or under common control with FMR (not including any sub-adviser whose role is primarily portfolio management and is subcontracted with or overseen by another investment adviser) that provide ongoing services to the funds ("Fund Service Providers") for assurance and related services that relate directly to the operations and financial reporting of each fund that are reasonably related to the performance of the audit or review of the fund's financial statements, but not reported as Audit Fees, are shown in the table below.
Billed By | 2005 A | 2004 A |
PwC | $0 | $0 |
Deloitte Entities | $0 | $0 |
A | Aggregate amounts may reflect rounding. |
Fees included in the audit-related category comprise assurance and related services (e.g., due diligence services) that are traditionally performed by the independent registered public accounting firm. These audit-related services include due diligence related to mergers and acquisitions, accounting consultations and audits in connection with acquisitions, internal control reviews, attest services that are not required by statute or regulation and consultation concerning financial accounting and reporting standards.
(c) Tax Fees.
In each of the fiscal years ended December 31, 2005 and December 31, 2004, the aggregate Tax Fees billed by Deloitte Entities for professional services rendered for tax compliance, tax advice, and tax planning for each fund is shown in the table below.
Fund | 2005 A | 2004 A |
Aggressive Growth Portfolio | $3,900 | $3,900 |
Balanced Portfolio | $4,200 | $4,200 |
Dynamic Capital Appreciation Portfolio | $3,900 | $3,900 |
Growth & Income Portfolio | $4,200 | $4,200 |
Growth Opportunities Portfolio | $4,200 | $4,200 |
Value Strategies Portfolio | $3,600 | $3,600 |
A | Aggregate amounts may reflect rounding. |
In each of the fiscal years ended December 31, 2005 and December 31, 2004, the aggregate Tax Fees billed by PwC for professional services rendered for tax compliance, tax advice, and tax planning for the fund is shown in the table below.
Fund | 2005 A | 2004 A |
Mid Cap Portfolio | $2,200 | $2,100 |
A | Aggregate amounts may reflect rounding. |
In each of the fiscal years ended December 31, 2005 and December 31, 2004, the aggregate Tax Fees billed by PwC and Deloitte Entities that were required to be approved by the Audit Committee for professional services rendered on behalf of the Fund Service Providers for tax compliance, tax advice, and tax planning that relate directly to the operations and financial reporting of each fund is shown in the table below.
Billed By | 2005 A | 2004 A |
PwC | $0 | $0 |
Deloitte Entities | $0 | $0 |
A | Aggregate amounts may reflect rounding. |
Fees included in the Tax Fees category comprise all services performed by professional staff in the independent registered public accounting firm's tax division except those services related to the audit. Typically, this category would include fees for tax compliance, tax planning, and tax advice. Tax compliance, tax advice, and tax planning services include preparation of original and amended tax returns, claims for refund and tax payment-planning services, assistance with tax audits and appeals, tax advice related to mergers and acquisitions and requests for rulings or technical advice from taxing authorities.
(d) All Other Fees.
In each of the fiscal years ended December 31, 2005 and December 31, 2004, the aggregate Other Fees billed by Deloitte Entities for all other non-audit services rendered to the funds is shown in the table below.
Fund | 2005 A | 2004 A |
Aggressive Growth Portfolio | $0 | $0 |
Balanced Portfolio | $0 | $0 |
Dynamic Capital Appreciation Portfolio | $0 | $0 |
Growth & Income Portfolio | $0 | $0 |
Growth Opportunities Portfolio | $0 | $0 |
Value Strategies Portfolio | $0 | $0 |
A | Aggregate amounts may reflect rounding. |
In each of the fiscal years ended December 31, 2005 and December 31, 2004, the aggregate Other Fees billed by PwC for all other non-audit services rendered to the fund is shown in the table below.
Fund | 2005 A | 2004 A |
Mid Cap Portfolio | $5,100 | $3,600 |
A | Aggregate amounts may reflect rounding. |
In each of the fiscal years ended December 31, 2005 and December 31, 2004, the aggregate Other Fees billed by PwC and Deloitte Entities that were required to be approved by the Audit Committee for all other non-audit services rendered on behalf of the Fund Service Providers that relate directly to the operations and financial reporting of each fund is shown in the table below.
Billed By | 2005 A | 2004 A |
PwC | $190,000 | $490,000 |
Deloitte Entities | $160,000 | $850,000 |
A | Aggregate amounts may reflect rounding. |
Fees included in the All Other Fees category include services related to internal control reviews, strategy and other consulting, financial information systems design and implementation, consulting on other information systems, and other tax services unrelated to the fund.
(e) (1) | Audit Committee Pre-Approval Policies and Procedures: |
The trust's Audit Committee must pre-approve all audit and non-audit services provided by the independent registered public accounting firm relating to the operations or financial reporting of the funds. Prior to the commencement of any audit or non-audit services to a fund, the Audit Committee reviews the services to determine whether they are appropriate and permissible under applicable law.
The trust's Audit Committee has adopted policies and procedures to, among other purposes, provide a framework for the Committee's consideration of non-audit services by the audit firms that audit the Fidelity funds. The policies and procedures require that any non-audit service provided by a fund audit firm to a Fidelity Fund and any non-audit service provided by a fund auditor to a Fund Service Provider that relates directly to the operations and financial reporting of a Fidelity fund (Covered Service) are subject to approval by the Audit Committee before such service is provided. Non-audit services provided by a fund audit firm for a Fund Service Provider that do not relate directly to the operations and financial reporting of a Fidelity fund (Non-Covered Service) but that are expected to exceed $50,000 are also subject to pre-approval by the Audit Committee.
All Covered Services, as well as Non-Covered Services that are expected to exceed $50,000, must be approved in advance of provision of the service either: (i) by formal resolution of the Audit Committee, or (ii) by oral or written approval of the service by the Chair of the Audit Committee (or if the Chair is unavailable, such other member of the Audit Committee as may be designated by the Chair to act in the Chair's absence). The approval contemplated by (ii) above is permitted where the Treasurer determines that action on such an engagement is necessary before the next meeting of the Audit Committee. Neither pre-approval nor advance notice of Non-Covered Service engagements for which fees are not expected to exceed $50,000 is required; such engagements are to be reported to the Audit Committee monthly.
(e) (2) | Services approved pursuant to paragraph (c)(7)(i)(C) of Rule 2-01 of Regulation S-X: |
Audit-Related Fees:
There were no amounts that were approved by the Audit Committee pursuant to the de minimis exception for the fiscal years ended December 31, 2005 and December 31, 2004 on behalf of each fund.
There were no amounts that were required to be approved by the Audit Committee pursuant to the de minimis exception for the fiscal years ended December 31, 2005 and December 31, 2004 on behalf of the Fund Service Providers that relate directly to the operations and financial reporting of each fund.
Tax Fees:
There were no amounts that were approved by the Audit Committee pursuant to the de minimis exception for the fiscal years ended December 31, 2005 and December 31, 2004 on behalf of each fund.
There were no amounts that were required to be approved by the Audit Committee pursuant to the de minimis exception for the fiscal years ended December 31, 2005 and December 31, 2004 on behalf of the Fund Service Providers that relate directly to the operations and financial reporting of each fund.
All Other Fees:
There were no amounts that were approved by the Audit Committee pursuant to the de minimis exception for the fiscal years ended December 31, 2005 and December 31, 2004 on behalf of each fund.
There were no amounts that were required to be approved by the Audit Committee pursuant to the de minimis exception for the fiscal years ended December 31, 2005 and December 31, 2004 on behalf of the Fund Service Providers that relate directly to the operations and financial reporting of each fund.
(f) Not applicable.
(g) For the fiscal years ended December 31, 2005 and December 31, 2004, the aggregate fees billed by PwC of $3,550,000A and $2,650,000 A for non-audit services rendered on behalf of the funds, FMR (not including any sub-adviser whose role is primarily portfolio management and is subcontracted with or overseen by another investment adviser) and Fund Service Providers relating to Covered Services and Non-Covered Services are shown in the table below.
| 2005 A | 2004 A |
Covered Services | $200,000 | $500,000 |
Non-Covered Services | $3,350,000 | $2,150,000 |
A | Aggregate amounts may reflect rounding. |
For the fiscal years ended December 31, 2005 and December 31, 2004, the aggregate fees billed by Deloitte Entities of $600,000A and $1,400,000A for non-audit services rendered on behalf of the fund, FMR (not including any sub-adviser whose role is primarily portfolio management and is subcontracted with or overseen by another investment adviser) and Fund Service Providers relating to Covered Services and Non-Covered Services are shown in the table below.
| 2005 A | 2004 A |
Covered Services | $200,000 | $900,000 |
Non-Covered Services | $400,000 | $500,000 |
A | Aggregate amounts may reflect rounding. |
(h) The trust's Audit Committee has considered Non-Covered Services that were not pre-approved that were provided by PwC and Deloitte Entities to Fund Service Providers to be compatible with maintaining the independence of PwC and Deloitte Entities in their audit of the funds, taking into account representations from PwC and Deloitte Entities, in accordance with Independence Standards Board Standard No.1, regarding their independence from the funds and their related entities.
Item 5. Audit Committee of Listed Registrants
Not applicable.
Item 6. Schedule of Investments
Not applicable.
Item 7. Disclosure of Proxy Voting Policies and Procedures for Closed-End Management Investment Companies
Not applicable.
Item 8. Portfolio Managers of Closed-End Management Investment Companies
Not applicable.
Item 9. Purchase of Equity Securities by Closed-End Management Investment Company and Affiliated Purchasers
Not applicable.
Item 10. Submission of Matters to a Vote of Security Holders
There were no material changes to the procedures by which shareholders may recommend nominees to the trust's Board of Trustees.
Item 11. Controls and Procedures
(a)(i) The President and Treasurer and the Chief Financial Officer have concluded that the trust's disclosure controls and procedures (as defined in Rule 30a-3(c) under the Investment Company Act) provide reasonable assurances that material information relating to the trust is made known to them by the appropriate persons, based on their evaluation of these controls and procedures as of a date within 90 days of the filing date of this report.
(a)(ii) There was no change in the trust's internal control over financial reporting (as defined in Rule 30a-3(d) under the Investment Company Act) that occurred during the second fiscal quarter of the period covered by this report that has materially affected, or is reasonably likely to materially affect, the trust's internal control over financial reporting.
Item 12. Exhibits
(a) | (1) | Code of Ethics pursuant to Item 2 of Form N-CSR is filed and attached hereto as EX-99.CODE ETH. |
(a) | (2) | Certification pursuant to Rule 30a-2(a) under the Investment Company Act of 1940 (17 CFR 270.30a-2(a)) is filed and attached hereto as Exhibit 99.CERT. |
(a) | (3) | Not applicable. |
(b) | | Certification pursuant to Rule 30a-2(b) under the Investment Company Act of 1940 (17 CFR 270.30a-2(b)) is furnished and attached hereto as Exhibit 99.906CERT. |
SIGNATURES
Pursuant to the requirements of the Securities Exchange Act of 1934 and the Investment Company Act of 1940, the registrant has duly caused this report to be signed on its behalf by the undersigned, thereunto duly authorized.
Variable Insurance Products Fund III
By: | /s/Christine Reynolds |
| Christine Reynolds |
| President and Treasurer |
| |
Date: | February 22, 2006 |
Pursuant to the requirements of the Securities Exchange Act of 1934 and the Investment Company Act of 1940, this report has been signed below by the following persons on behalf of the registrant and in the capacities and on the dates indicated.
By: | /s/Christine Reynolds |
| Christine Reynolds |
| President and Treasurer |
| |
Date: | February 22, 2006 |
By: | /s/Paul M. Murphy |
| Paul M. Murphy |
| Chief Financial Officer |
| |
Date: | February 22, 2006 |