To view a fund's proxy voting guidelines and proxy voting record for the 12-month period ended June 30, visit www.fidelity.com/proxyvotingresults or visit the Securities and Exchange Commission's (SEC) web site at www.sec.gov. You may also call 1-877-208-0098 to request a free copy of the proxy voting guidelines.
Fidelity Variable Insurance Products are separate account options which are purchased through a variable insurance contract.
Standard & Poor's, S&P and S&P 500 are registered service marks of The McGraw-Hill Companies, Inc. and have been licensed for use by Fidelity Distributors Corporation.
Other third party marks appearing herein are the property of their respective owners.
All other marks appearing herein are registered or unregistered trademarks or service marks of FMR Corp. or an affiliated company.
This report and the financial statements contained herein are submitted for the general information of the shareholders of the fund. This report is not authorized for distribution to prospective investors in the fund unless preceded or accompanied by an effective prospectus.
A fund files its complete schedule of portfolio holdings with the SEC for the first and third quarters of each fiscal year on Form N-Q. Forms N-Q are available on the SEC's web site at http://www.sec.gov. A fund's Forms N-Q may be reviewed and copied at the SEC's Public Reference Room in Washington, DC. Information regarding the operation of the SEC's Public Reference Room may be obtained by calling 1-800-SEC-0330. For a complete list of a fund's portfolio holdings, view the most recent quarterly holdings report, semiannual report, or annual report on Fidelity's web site at http://www.advisor.fidelity.com.
NOT FDIC INSURED· MAY LOSE VALUE· NO BANK GUARANTEE
Neither the fund nor Fidelity Distributors Corporation is a bank.
Semiannual Report
VIP Aggressive Growth Portfolio
Performance: The Bottom Line
Average annual total return reflects the change in the value of an investment, assuming reinvestment of the class' dividend income and capital gains (the profits earned upon the sale of securities that have grown in value) and assuming a constant rate of performance each year. During periods of reimbursement by Fidelity, a fund's total return will be greater than it would be had the reimbursement not occurred. Performance numbers are net of all underlying fund operating expenses, but do not include any insurance charges imposed by your insurance company's separate account. If performance information included the effect of these additional charges, the total returns would have been lower. How a fund did yesterday is no guarantee of how it will do tomorrow.
Average Annual Total Returns
Periods ended December 31, 2006
Past 1 year
Past 5 years
Life of fund A
VIP Aggressive Growth - Initial Class
8.53%
4.45%
0.38%
VIP Aggressive Growth - Service Class C
8.42%
4.38%
0.38%
VIP Aggressive Growth - Service Class 2 D
8.29%
4.14%
0.09%
VIP Aggressive Growth - Investor Class B
8.44%
4.39%
0.33%
AFrom December 27, 2000.
BThe initial offering of Investor Class shares took place on July 21, 2005. Returns prior to July 21, 2005 are those of Initial Class. If Investor Class's transfer agent fee had been reflected, returns prior to July 21, 2005 would have been lower.
CPerformance for Service Class shares reflects an asset-based service fee (12b-1 fee).
DPerformance for Service Class 2 shares reflects an asset-based service fee (12b-1 fee).
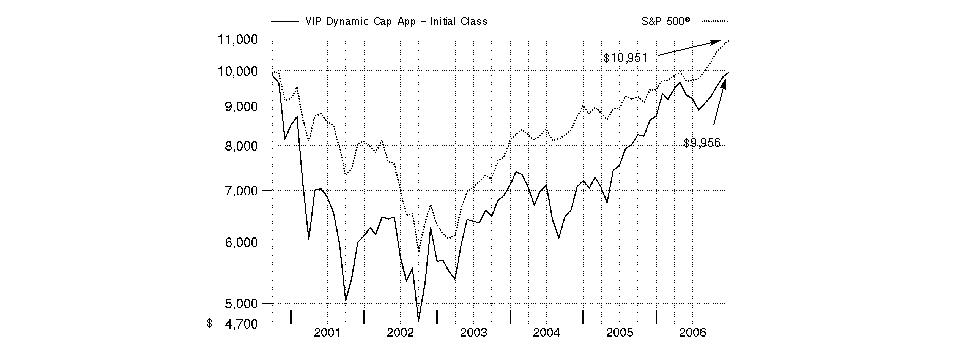
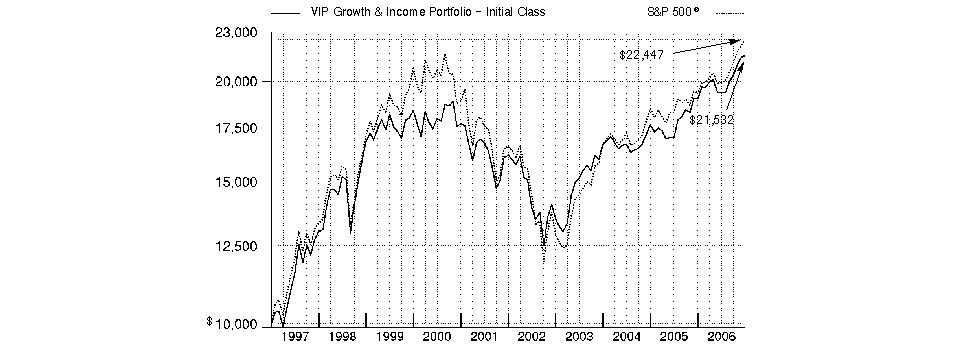
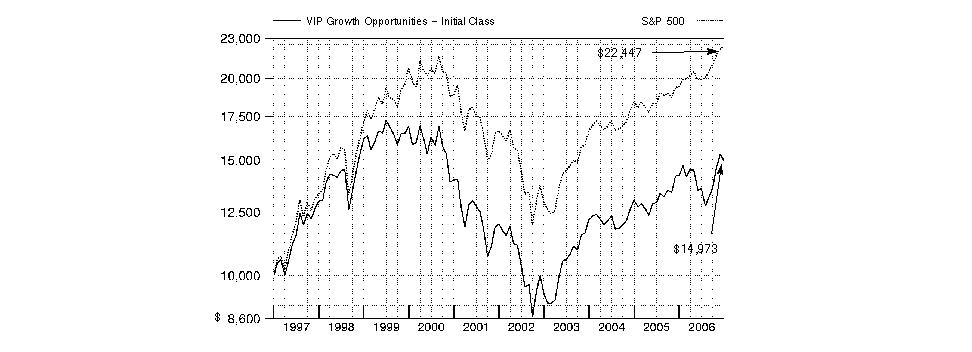
$10,000 Over Life of Fund
Let's say hypothetically that $10,000 was invested in VIP Aggressive Growth Portfolio - Initial Class on December 27, 2000, when the fund started. The chart shows how the value of your investment would have changed, and also shows how the Russell Midcap® Growth Index performed over the same period.
Annual Report
VIP Aggressive Growth Portfolio
Management's Discussion of Fund Performance
Comments from Steven Calhoun, Portfolio Manager of VIP Aggressive Growth Portfolio
U.S. stock markets registered their fourth consecutive year of positive returns in 2006. Among the highlights were the performances of the Dow Jones Industrial AverageSM - a gauge of 30 mega-cap, blue-chip stocks - and the small-cap-oriented Russell 2000® Index, both of which reached new highs. The efforts of the Federal Reserve Board to contain inflation levels also dominated the investment headlines. In all, the Fed hiked short-term interest rates four times, but held rates steady after its June 29 increase, finally pausing after 17 rate hikes over a two-year period. A slowing residential housing market and moderating oil prices - the latter of which hit a record closing high of $77 per barrel in July before falling sharply - also held economic growth in check. For the year overall, the Standard & Poor's 500SM Index was up 15.79%, the Dow advanced 19.05%, the Russell 2000 Index gained 18.37% and the NASDAQ Composite® Index rose 10.39%.
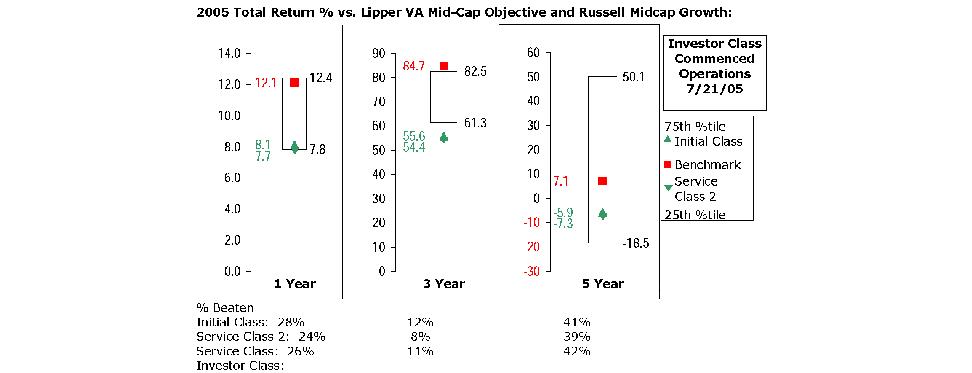
During the past year, the fund lagged the 10.66% return of the Russell Midcap® Growth Index. (For specific portfolio performance results, please refer to the performance section of this report.) Stock selection in technology and health care was detrimental. St. Jude Medical, a maker of ICDs (implantable cardiac defibrillators) and the fund's largest holding at period end, was its biggest detractor. Product recalls by rival Guidant dampened demand across the entire ICD market. Our results also were hurt by drug stock Telik, which I sold; Cyberonics, a leader in the market for neurostimulation devices; Merge Technologies, a manufacturer of digital X-ray equipment; and Comverse Technology, a maker of communications hardware and software. Conversely, some of the fund's plays in the diversified financials group performed well. Our positioning in materials - mainly agriculture-related stocks - also helped, as did favorable picks and an underweighting in energy, which - along with consumer discretionary - I trimmed. On the other hand, I added substantially to the fund's technology exposure, including some foreign stocks. Our top contributor was IntercontinentalExchange, an energy futures exchange, which benefited from increasing market share and a technological advantage over its primary rival. I sold the stock to lock in profits. Also helping was a fertilizer stock, Potash Corp. of Saskatchewan, along with Indiabulls Financial Services, an India-based banking and brokerage company. In technology, video game hardware and software provider Nintendo was a standout.
The views expressed above reflect those of the portfolio manager(s) only through the end of the period as stated on the cover of this report and do not necessarily represent the views of Fidelity or any other person in the Fidelity organization. Any such views are subject to change at any time based upon market or other conditions and Fidelity disclaims any responsibility to update such views. These views may not be relied on as investment advice and, because investment decisions for a Fidelity fund are based on numerous factors, may not be relied on as an indication of trading intent on behalf of any Fidelity fund.
Annual Report
VIP Aggressive Growth Portfolio
Shareholder Expense Example
As a shareholder of the Fund, you incur two types of costs: (1) transaction costs, and (2) ongoing costs, including management fees, distribution and/or service (12b-1) fees and other Fund expenses. This Example is intended to help you understand your ongoing costs (in dollars) of investing in the Fund and to compare these costs with the ongoing costs of investing in other mutual funds.
The Example is based on an investment of $1,000 invested at the beginning of the period and held for the entire period (July 1, 2006 to December 31, 2006).
Actual Expenses
The first line of the accompanying table for each class of the Fund provides information about actual account values and actual expenses. You may use the information in this line, together with the amount you invested, to estimate the expenses that you paid over the period. Simply divide your account value by $1,000.00 (for example, an $8,600 account value divided by $1,000.00 = 8.6), then multiply the result by the number in the first line for a class of the Fund under the heading entitled "Expenses Paid During Period" to estimate the expenses you paid on your account during this period. The estimate of expenses does not include any fees or other expenses of any variable annuity or variable life insurance product. If they were, the estimate of expenses you paid during the period would be higher, and your ending account value would be lower.
Hypothetical Example for Comparison Purposes
The second line of the accompanying table for each class of the Fund provides information about hypothetical account values and hypothetical expenses based on a Class' actual expense ratio and an assumed rate of return of 5% per year before expenses, which is not the Class' actual return. The hypothetical account values and expenses may not be used to estimate the actual ending account balance or expenses you paid for the period. You may use this information to compare the ongoing costs of investing in the Fund and other funds. To do so, compare this 5% hypothetical example with the 5% hypothetical examples that appear in the shareholder reports of the other funds. The estimate of expenses does not include any fees or other expenses of any variable annuity or variable life insurance product. If they were, the estimate of expenses you paid during the period would be higher, and your ending account value would be lower.
Please note that the expenses shown in the table are meant to highlight your ongoing costs only and do not reflect any transaction costs. Therefore, the second line of the table is useful in comparing ongoing costs only, and will not help you determine the relative total costs of owning different funds.
Beginning Account Value July 1, 2006
Ending Account Value December 31, 2006
Expenses Paid During Period* July 1, 2006 to December 31, 2006
Initial Class
Actual
$ 1,000.00
$ 1,117.30
$ 4.80
Hypothetical A
$ 1,000.00
$ 1,020.67
$ 4.58
Service Class
Actual
$ 1,000.00
$ 1,116.10
$ 5.33
Hypothetical A
$ 1,000.00
$ 1,020.16
$ 5.09
Service Class 2
Actual
$ 1,000.00
$ 1,115.30
$ 6.13
Hypothetical A
$ 1,000.00
$ 1,019.41
$ 5.85
Investor Class
Actual
$ 1,000.00
$ 1,116.40
$ 5.60
Hypothetical A
$ 1,000.00
$ 1,019.91
$ 5.35
A5% return per year before expenses
* Expenses are equal to each Class' annualized expense ratio (shown in the table below); multiplied by the average account value over the period, multiplied by 184/365 (to reflect the one-half year period).
Annualized Expense Ratio
Initial Class
.90%
Service Class
1.00%
Service Class 2
1.15%
Investor Class
1.05%
Annual Report
VIP Aggressive Growth Portfolio
Investment Changes
Top Ten Stocks as of December 31, 2006
% of fund's net assets
% of fund's net assets 6 months ago
St. Jude Medical, Inc.
5.1
3.3
Comverse Technology, Inc.
2.8
1.9
Nintendo Co. Ltd.
2.7
1.0
Marvell Technology Group Ltd.
2.5
0.9
Potash Corp. of Saskatchewan, Inc.
2.4
1.5
Juniper Networks, Inc.
2.3
0.0
ASML Holding NV (NY Shares)
2.1
1.9
PMC-Sierra, Inc.
2.1
1.0
NuVasive, Inc.
2.1
1.5
Monsanto Co.
2.0
1.6
26.1
Top Five Market Sectors as of December 31, 2006
% of fund's net assets
% of fund's net assets 6 months ago
Information Technology
36.4
25.9
Health Care
28.3
28.6
Industrials
8.4
11.5
Materials
7.4
5.5
Energy
5.7
10.5
Asset Allocation (% of fund's net assets)
As of December 31, 2006 *
As of June 30, 2006 **
Stocks 97.3%
Stocks 97.1%
Short-Term Investments and Net Other Assets 2.7%
Short-Term Investments and Net Other Assets 2.9%
* Foreign investments
20.7%
** Foreign investments
14.5%
Annual Report
VIP Aggressive Growth Portfolio
Investments December 31, 2006
Showing Percentage of Net Assets
Common Stocks - 97.3%
Shares
Value (Note 1)
CONSUMER DISCRETIONARY - 4.2%
Hotels, Restaurants & Leisure - 1.0%
Life Time Fitness, Inc. (a)
2,300
$ 111,573
Melco PBL Entertainment (Macau) Ltd. sponsored ADR
5,300
112,678
224,251
Internet & Catalog Retail - 0.5%
Coldwater Creek, Inc. (a)
4,778
117,157
Leisure Equipment & Products - 0.6%
Marvel Entertainment, Inc. (a)
4,700
126,477
Specialty Retail - 1.6%
Abercrombie & Fitch Co. Class A
5,000
348,150
Williams-Sonoma, Inc.
200
6,288
354,438
Textiles, Apparel & Luxury Goods - 0.5%
Iconix Brand Group, Inc. (a)
5,776
111,997
TOTAL CONSUMER DISCRETIONARY
934,320
CONSUMER STAPLES - 0.5%
Food Products - 0.5%
Bunge Ltd.
1,598
115,871
ENERGY - 5.7%
Energy Equipment & Services - 1.1%
FMC Technologies, Inc. (a)
3,800
234,194
Oil, Gas & Consumable Fuels - 4.6%
Chesapeake Energy Corp.
7,100
206,255
EOG Resources, Inc.
3,120
194,844
Quicksilver Resources, Inc. (a)
5,100
186,609
Range Resources Corp.
7,650
210,069
Ultra Petroleum Corp. (a)
4,505
215,114
1,012,891
TOTAL ENERGY
1,247,085
FINANCIALS - 3.6%
Capital Markets - 3.0%
AllianceBernstein Holding LP
1,700
136,680
Greenhill & Co., Inc.
2,200
162,360
Indiabulls Financial Services Ltd.
17,078
255,676
Jefferies Group, Inc.
4,000
107,280
661,996
Diversified Financial Services - 0.6%
Financial Technology (India) Ltd.
3,089
124,397
TOTAL FINANCIALS
786,393
HEALTH CARE - 28.3%
Biotechnology - 4.6%
Alnylam Pharmaceuticals, Inc. (a)
14,208
304,051
Amylin Pharmaceuticals, Inc. (a)
6,500
234,455
Shares
Value (Note 1)
Celgene Corp. (a)
4,680
$ 269,240
PDL BioPharma, Inc. (a)
10,600
213,484
1,021,230
Health Care Equipment & Supplies - 17.9%
ArthroCare Corp. (a)
2,700
107,784
Conceptus, Inc. (a)
5,600
119,224
Cyberonics, Inc. (a)
14,900
307,536
Haemonetics Corp. (a)
2,603
117,187
Hologic, Inc. (a)
4,622
218,528
Immucor, Inc. (a)
3,900
113,997
Intuitive Surgical, Inc. (a)
1,200
115,080
Kyphon, Inc. (a)
5,624
227,210
Mentor Corp.
2,400
117,288
NeuroMetrix, Inc. (a)
5,760
85,882
Northstar Neuroscience, Inc.
7,300
104,974
NuVasive, Inc. (a)
19,481
450,011
PolyMedica Corp.
2,922
118,078
Respironics, Inc. (a)
6,524
246,281
Sirona Dental Systems, Inc.
5,959
229,481
Somanetics Corp. (a)
5,700
130,131
St. Jude Medical, Inc. (a)
30,700
1,122,392
3,931,064
Health Care Technology - 1.5%
Eclipsys Corp. (a)
10,440
214,646
Merge Technologies, Inc. (a)
16,900
110,864
325,510
Life Sciences Tools & Services - 1.1%
Ventana Medical Systems, Inc. (a)
5,906
254,135
Pharmaceuticals - 3.2%
Allergan, Inc.
2,397
287,017
Sepracor, Inc. (a)
6,656
409,876
696,893
TOTAL HEALTH CARE
6,228,832
INDUSTRIALS - 8.4%
Air Freight & Logistics - 0.1%
Panalpina Welttransport Holding AG
180
24,542
Construction & Engineering - 3.2%
Infrasource Services, Inc. (a)
15,900
346,143
Quanta Services, Inc. (a)
18,300
359,961
706,104
Electrical Equipment - 1.5%
Energy Conversion Devices, Inc. (a)
564
19,165
Neo-Neon Holdings Ltd.
64,000
61,134
Suntech Power Holdings Co. Ltd. sponsored ADR
3,700
125,837
Suzlon Energy Ltd.
4,250
125,703
331,839
Industrial Conglomerates - 1.0%
McDermott International, Inc. (a)
4,550
231,413
Common Stocks - continued
Shares
Value (Note 1)
INDUSTRIALS - continued
Machinery - 2.0%
Deere & Co.
4,600
$ 437,322
Marine - 0.1%
Diana Shipping, Inc.
1,300
20,553
Road & Rail - 0.5%
Guangshen Railway Co. Ltd. (H Shares)
146,000
99,482
TOTAL INDUSTRIALS
1,851,255
INFORMATION TECHNOLOGY - 36.4%
Communications Equipment - 6.2%
Adtran, Inc.
10,720
243,344
Comverse Technology, Inc. (a)
29,334
619,241
Juniper Networks, Inc. (a)
26,900
509,486
1,372,071
Computers & Peripherals - 2.1%
Seagate Technology
8,800
233,200
Sun Microsystems, Inc. (a)
40,800
221,136
454,336
Internet Software & Services - 1.8%
Bankrate, Inc. (a)
3,982
151,117
ValueClick, Inc. (a)
10,100
238,663
389,780
IT Services - 3.2%
Cognizant Technology Solutions Corp. Class A (a)
3,100
239,196
Mastercard, Inc. Class A
2,300
226,527
Paychex, Inc.
5,800
229,332
695,055
Semiconductors & Semiconductor Equipment - 14.4%
Advanced Micro Devices, Inc. (a)
11,700
238,095
ARM Holdings PLC sponsored ADR
31,300
228,490
ASML Holding NV (NY Shares) (a)
18,800
463,044
Broadcom Corp. Class A (a)
13,221
427,171
Integrated Device Technology, Inc. (a)
14,500
224,460
Lam Research Corp. (a)
4,456
225,563
LSI Logic Corp. (a)
1,000
9,000
Marvell Technology Group Ltd. (a)
28,566
548,182
NVIDIA Corp. (a)
6,427
237,863
PMC-Sierra, Inc. (a)
68,836
461,890
Renewable Energy Corp. AS
6,050
110,618
3,174,376
Software - 8.7%
Electronic Arts, Inc. (a)
8,800
443,168
Hyperion Solutions Corp. (a)
5,761
207,050
Informatica Corp. (a)
16,600
202,686
Shares
Value (Note 1)
Intuit, Inc. (a)
7,631
$ 232,822
Nintendo Co. Ltd.
2,300
596,976
Wind River Systems, Inc. (a)
22,633
231,988
1,914,690
TOTAL INFORMATION TECHNOLOGY
8,000,308
MATERIALS - 7.4%
Chemicals - 7.4%
Agrium, Inc.
10,400
325,914
Monsanto Co.
8,526
447,871
Potash Corp. of Saskatchewan, Inc.
3,600
516,528
The Mosaic Co.
15,500
331,080
1,621,393
TELECOMMUNICATION SERVICES - 2.3%
Diversified Telecommunication Services - 2.3%
Level 3 Communications, Inc. (a)
50,700
283,920
Qwest Communications International, Inc. (a)
26,600
222,642
506,562
UTILITIES - 0.5%
Independent Power Producers & Energy Traders - 0.5%
Ormat Technologies, Inc.
2,995
110,276
TOTAL COMMON STOCKS
(Cost $19,271,858)
21,402,295
Money Market Funds - 0.2%
Fidelity Cash Central Fund, 5.37% (b) (Cost $49,811)
49,811
49,811
TOTAL INVESTMENT PORTFOLIO - 97.5%
(Cost $19,321,669)
21,452,106
NET OTHER ASSETS - 2.5%
556,296
NET ASSETS - 100%
$ 22,008,402
Legend
(a) Non-income producing
(b) Affiliated fund that is available only to investment companies and other accounts managed by Fidelity Investments. The rate quoted is the annualized seven-day yield of the fund at period end. A complete unaudited listing of the fund's holdings as of its most recent quarter end is available upon request.
Affiliated Central Funds
Information regarding fiscal year to date income earned by the Fund from investments in Fidelity Central Funds is as follows:
Fund
Income earned
Fidelity Cash Central Fund
$ 19,302
Other Information
Distribution of investments by country of issue, as a percentage of total net assets, is as follows:
United States of America
79.3%
Canada
4.9%
Bermuda
3.0%
Japan
2.7%
Cayman Islands
2.5%
India
2.3%
Netherlands
2.1%
Panama
1.0%
United Kingdom
1.0%
Others (individually less than 1%)
1.2%
100.0%
See accompanying notes which are an integral part of the financial statements.
Annual Report
VIP Aggressive Growth Portfolio
Financial Statements
Statement of Assets and Liabilities
December 31, 2006
Assets
Investment in securities, at value - See accompanying schedule:
Unaffiliated issuers (cost $19,271,858)
$ 21,402,295
Fidelity Central Funds (cost $49,811)
49,811
Total Investments (cost $19,321,669)
$ 21,452,106
Receivable for investments sold
773,209
Dividends receivable
3,451
Interest receivable
1,458
Prepaid expenses
96
Other receivables
358
Total assets
22,230,678
Liabilities
Payable for investments purchased
$ 144,997
Accrued management fee
13,174
Distribution fees payable
2,359
Other affiliated payables
2,357
Other payables and accrued expenses
59,389
Total liabilities
222,276
Net Assets
$ 22,008,402
Net Assets consist of:
Paid in capital
$ 20,094,865
Accumulated undistributed net realized gain (loss) on investments and foreign currency transactions
(201,228)
Net unrealized appreciation (depreciation) on investments and assets and liabilities in foreign currencies
2,114,765
Net Assets
$ 22,008,402
Statement of Assets and Liabilities - continued
December 31, 2006
Initial Class: Net Asset Value, offering price and redemption price per share ($6,434,221 ÷ 681,829 shares)
$ 9.44
Service Class: Net Asset Value, offering price and redemption price per share ($1,105,512 ÷ 117,018 shares)
$ 9.45
Service Class 2: Net Asset Value, offering price and redemption price per share ($10,692,210 ÷ 1,150,775 shares)
$ 9.29
Investor Class: Net Asset Value, offering price and redemption price per share ($3,776,459 ÷ 401,418 shares)
$ 9.41
See accompanying notes which are an integral part of the financial statements.
Annual Report
VIP Aggressive Growth Portfolio Financial Statements - continued
Statement of Operations
Year ended December 31, 2006
Investment Income
Dividends
$ 74,557
Special dividends
50,558
Interest
110
Income from Fidelity Central Funds
19,302
Total income
144,527
Expenses
Management fee
$ 125,204
Transfer agent fees
24,830
Distribution fees
26,238
Accounting fees and expenses
8,393
Custodian fees and expenses
29,855
Independent trustees' compensation
75
Audit
39,625
Legal
2,354
Reports to shareholders
16,099
Miscellaneous
1,746
Total expenses before reductions
274,419
Expense reductions
(62,908)
211,511
Net investment income (loss)
(66,984)
Realized and Unrealized Gain (Loss)
Net realized gain (loss) on:
Investment securities:
Unaffiliated issuers (net of foreign taxes of $5,199)
991,284
Foreign currency transactions
2,828
Total net realized gain (loss)
994,112
Change in net unrealized appreciation (depreciation) on:
Investment securities (net of increase in deferred foreign taxes of $15,392)
613,591
Assets and liabilities in foreign currencies
17
Total change in net unrealized appreciation (depreciation)
613,608
Net gain (loss)
1,607,720
Net increase (decrease) in net assets resulting from operations
$ 1,540,736
Statement of Changes in Net Assets
Year ended December 31, 2006
Year ended December 31, 2005
Increase (Decrease) in Net Assets
Operations
Net investment income (loss)
$ (66,984)
$ (55,168)
Net realized gain (loss)
994,112
1,621,548
Change in net unrealized appreciation (depreciation)
613,608
(357,434)
Net increase (decrease) in net assets resulting from operations
1,540,736
1,208,946
Distributions to shareholders from net realized gain
(1,077,928)
(540,605)
Share transactions - net increase (decrease)
2,626,357
7,047,654
Total increase (decrease) in net assets
3,089,165
7,715,995
Net Assets
Beginning of period
18,919,237
11,203,242
End of period (including undistributed net investment income of $0 and undistributed net investment income of $14,866, respectively)
$ 22,008,402
$ 18,919,237
See accompanying notes which are an integral part of the financial statements.
VIP Aggressive Growth Portfolio
Financial Highlights - Initial Class
Years ended December 31,
2006
2005
2004
2003
2002
Selected Per-Share Data
Net asset value, beginning of period
$ 9.15
$ 8.71
$ 7.90
$ 6.05
$ 8.22
Income from Investment Operations
Net investment income (loss) C
(.02) F
(.02) G
(.04)
(.04)
(.06)
Net realized and unrealized gain (loss)
.80
.73
.85
1.89
(2.11)
Total from investment operations
.78
.71
.81
1.85
(2.17)
Distributions from net realized gain
(.49)
(.27)
-
-
-
Net asset value, end of period
$ 9.44
$ 9.15
$ 8.71
$ 7.90
$ 6.05
Total Return A, B
8.53%
8.11%
10.25%
30.58%
(26.40)%
Ratios to Average Net Assets D, H
Expenses before reductions
1.21%
1.28%
1.64%
2.87%
2.51%
Expenses net of fee waivers, if any
.90%
.90%
1.00%
1.26%
1.50%
Expenses net of all reductions
.89%
.82%
.96%
1.20%
1.35%
Net investment income (loss)
(.18)% F
(.21)% G
(.53)%
(.62)%
(.85)%
Supplemental Data
Net assets, end of period (000 omitted)
$ 6,434
$ 6,168
$ 1,031
$ 907
$ 689
Portfolio turnover rate E
200%
242%
91%
150%
460%
ATotal returns do not reflect charges attributable to your insurance company's separate account. Inclusion of these charges would reduce the total returns shown.
BTotal returns would have been lower had certain expenses not been reduced during the periods shown.
CCalculated based on average shares outstanding during the period.
DFees and expenses of the underlying Fidelity Central Funds are not included in the Fund's expense ratio. The Fund indirectly bears its proportionate share of the expenses of any underlying Fidelity Central Funds.
EAmount does not include the portfolio activity of any underlying Fidelity Central Funds.
FInvestment income per share reflects a special dividend which amounted to $.02 per share. Excluding the special dividend, the ratio of net investment income (loss) to average net assets would have been (.43)%.
GInvestment income per share reflects a special dividend which amounted to $.01 per share. Excluding the special dividend, the ratio of net investment income (loss) to average net assets would have been (.28)%.
HExpense ratios reflect operating expenses of the class. Expenses before reductions do not reflect amounts reimbursed by the investment adviser or reductions from brokerage service arrangements or other expense offset arrangements and do not represent the amount paid by the class during periods when reimbursements or reductions occur. Expenses net of fee waivers reflect expenses after reimbursement by the investment adviser but prior to reductions from brokerage service arrangements or other expense offset arrangements. Expenses net of all reductions represent the net expenses paid by the class.
Financial Highlights - Service Class
Years ended December 31,
2006
2005
2004
2003
2002
Selected Per-Share Data
Net asset value, beginning of period
$ 9.16
$ 8.73
$ 7.92
$ 6.07
$ 8.25
Income from Investment Operations
Net investment income (loss) C
(.03) F
(.03) G
(.05)
(.05)
(.07)
Net realized and unrealized gain (loss)
.80
.73
.86
1.90
(2.11)
Total from investment operations
.77
.70
.81
1.85
(2.18)
Distributions from net realized gain
(.48)
(.27)
-
-
-
Net asset value, end of period
$ 9.45
$ 9.16
$ 8.73
$ 7.92
$ 6.07
Total Return A, B
8.42%
7.98%
10.23%
30.48%
(26.42)%
Ratios to Average Net Assets D, H
Expenses before reductions
1.27%
1.44%
1.74%
2.94%
2.56%
Expenses net of fee waivers, if any
1.00%
1.01%
1.10%
1.36%
1.60%
Expenses net of all reductions
.99%
.93%
1.07%
1.30%
1.45%
Net investment income (loss)
(.28)% F
(.32)% G
(.63)%
(.72)%
(.96)%
Supplemental Data
Net assets, end of period (000 omitted)
$ 1,106
$ 1,135
$ 1,059
$ 1,026
$ 779
Portfolio turnover rate E
200%
242%
91%
150%
460%
ATotal returns do not reflect charges attributable to your insurance company's separate account. Inclusion of these charges would reduce the total returns shown.
B Total returns would have been lower had certain expenses not been reduced during the periods shown.
C Calculated based on average shares outstanding during the period.
D Fees and expenses of the underlying Fidelity Central Funds are not included in the Fund's expense ratio. The Fund indirectly bears its proportionate share of the expenses of any underlying Fidelity Central Funds.
E Amount does not include the portfolio activity of any underlying Fidelity Central Funds.
F Investment income per share reflects a special dividend which amounted to $.02 per share. Excluding the special dividend, the ratio of net investment income (loss) to average net assets would have been (.53)%.
G Investment income per share reflects a special dividend which amounted to $.01 per share. Excluding the special dividend, the ratio of net investment income (loss) to average net assets would have been (.39)%.
H Expense ratios reflect operating expenses of the class. Expenses before reductions do not reflect amounts reimbursed by the investment adviser or reductions from brokerage service arrangements or other expense offset arrangements and do not represent the amount paid by the class during periods when reimbursements or reductions occur. Expenses net of fee waivers reflect expenses after reimbursement by the investment adviser but prior to reductions from brokerage service arrangements or other expense offset arrangements. Expenses net of all reductions represent the net expenses paid by the class.
See accompanying notes which are an integral part of the financial statements.
Annual Report
Financial Highlights - Service Class 2
Years ended December 31,
2006
2005
2004
2003
2002
Selected Per-Share Data
Net asset value, beginning of period
$ 9.01
$ 8.61
$ 7.83
$ 6.01
$ 8.20
Income from Investment Operations
Net investment income (loss) C
(.04) F
(.04) G
(.06)
(.06)
(.08)
Net realized and unrealized gain (loss)
.79
.71
.84
1.88
(2.11)
Total from investment operations
.75
.67
.78
1.82
(2.19)
Distributions from net realized gain
(.47)
(.27)
-
-
-
Net asset value, end of period
$ 9.29
$ 9.01
$ 8.61
$ 7.83
$ 6.01
Total Return A, B
8.29%
7.74%
9.96%
30.28%
(26.71)%
Ratios to Average Net Assets D, H
Expenses before reductions
1.44%
1.60%
1.92%
3.14%
2.74%
Expenses net of fee waivers, if any
1.15%
1.16%
1.25%
1.51%
1.75%
Expenses net of all reductions
1.14%
1.08%
1.21%
1.45%
1.60%
Net investment income (loss)
(.43)% F
(.47)% G
(.78)%
(.87)%
(1.11)%
Supplemental Data
Net assets, end of period (000 omitted)
$ 10,692
$ 10,222
$ 9,113
$ 6,873
$ 3,930
Portfolio turnover rate E
200%
242%
91%
150%
460%
A Total returns do not reflect charges attributable to your insurance company's separate account. Inclusion of these charges would reduce the total returns shown.
B Total returns would have been lower had certain expenses not been reduced during the periods shown.
C Calculated based on average shares outstanding during the period.
D Fees and expenses of the underlying Fidelity Central Funds are not included in the Fund's expense ratio. The Fund indirectly bears its proportionate share of the expenses of any underlying Fidelity Central Funds.
E Amount does not include the portfolio activity of any underlying Fidelity Central Funds.
F Investment income per share reflects a special dividend which amounted to $.02 per share. Excluding the special dividend, the ratio of net investment income (loss) to average net assets would have been (.68)%.
G Investment income per share reflects a special dividend which amounted to $.01 per share. Excluding the special dividend, the ratio of net investment income (loss) to average net assets would have been (.54)%.
H Expense ratios reflect operating expenses of the class. Expenses before reductions do not reflect amounts reimbursed by the investment adviser or reductions from brokerage service arrangements or other expense offset arrangements and do not represent the amount paid by the class during periods when reimbursements or reductions occur. Expenses net of fee waivers reflect expenses after reimbursement by the investment adviser but prior to reductions from brokerage service arrangements or other expense offset arrangements. Expenses net of all reductions represent the net expenses paid by the class.
Financial Highlights - Investor Class
Years ended December 31,
2006
2005 J
Selected Per-Share Data
Net asset value, beginning of period
$ 9.13
$ 8.95
Income from Investment Operations
Net investment income (loss) E
(.03) H
(.01) I
Net realized and unrealized gain (loss)
.80
.46
Total from investment operations
.77
.45
Distributions from net realized gain
(.49)
(.27)
Net asset value, end of period
$ 9.41
$ 9.13
Total Return B, C, D
8.44%
4.99%
Ratios to Average Net Assets F, K
Expenses before reductions
1.35%
1.25% A
Expenses net of fee waivers, if any
1.05%
1.05% A
Expenses net of all reductions
1.04%
.97% A
Net investment income (loss)
(.33)% H
(.36)% A, I
Supplemental Data
Net assets, end of period (000 omitted)
$ 3,776
$ 1,395
Portfolio turnover rate G
200%
242%
A Annualized
B Total returns for periods of less than one year are not annualized.
C Total returns do not reflect charges attributable to your insurance company's separate account. Inclusion of these charges would reduce the total returns shown.
D Total returns would have been lower had certain expenses not been reduced during the periods shown.
E Calculated based on average shares outstanding during the period.
F Fees and expenses of the underlying Fidelity Central Funds are not included in the Fund's expense ratio. The Fund indirectly bears its proportionate share of the expenses of any underlying Fidelity Central Funds.
G Amount does not include the portfolio activity of any underlying Fidelity Central Funds.
H Investment income per share reflects a special dividend which amounted to $.02 per share. Excluding the special dividend, the ratio of net investment income (loss) to average net assets would have been (.58)%.
IInvestment income per share reflects a special dividend which amounted to $.01 per share. Excluding the special dividend, the ratio of net investment income (loss) to average net assets would have been (.43)%.
JFor the period July 21, 2005 (commencement of sale of shares) to December 31, 2005.
KExpense ratios reflect operating expenses of the class. Expenses before reductions do not reflect amounts reimbursed by the investment adviser or reductions from brokerage service arrangements or other expense offset arrangements and do not represent the amount paid by the class during periods when reimbursements or reductions occur. Expense ratios before reductions for start-up periods may not be representative of longer-term operating periods. Expenses net of fee waivers reflect expenses after reimbursement by the investment adviser but prior to reductions from brokerage service arrangements or other expense offset arrangements. Expenses net of all reductions represent the net expenses paid by the class.
See accompanying notes which are an integral part of the financial statements.
VIP Aggressive Growth Portfolio
Notes to Financial Statements
For the period ended December 31, 2006
1. Significant Accounting Policies.
VIP Aggressive Growth Portfolio (the Fund) is a fund of Variable Insurance Products Fund III (the trust) and is authorized to issue an unlimited number of shares. The trust is registered under the Investment Company Act of 1940, as amended (the 1940 Act), as an open-end management investment company organized as a Massachusetts business trust. Shares of the Fund may only be purchased by insurance companies for the purpose of funding variable annuity or variable life insurance contracts. The Fund offers the following classes of shares: Initial Class shares, Service Class shares, Service Class 2 shares, and Investor Class shares. All classes have equal rights and voting privileges, except for matters affecting a single class. Investment income, realized and unrealized capital gains and losses, the common expenses of the Fund, and certain fund-level expense reductions, if any, are allocated on a pro rata basis to each class based on the relative net assets of each class to the total net assets of the Fund. Each class differs with respect to transfer agent and distribution and service plan fees incurred. Certain expense reductions also differ by class.
The Fund may invest in Fidelity Central Funds which are open-end investment companies available to investment companies and other accounts managed by Fidelity Management & Research Company (FMR) and its affiliates. The financial statements have been prepared in conformity with accounting principles generally accepted in the United States of America, which require management to make certain estimates and assumptions at the date of the financial statements. The following summarizes the significant accounting policies of the Fund, which are also consistently followed by the Fidelity Central Funds:
Security Valuation. Investments are valued and net asset value (NAV) per share is calculated (NAV calculation) as of the close of business of the New York Stock Exchange (NYSE), normally 4:00 p.m. Eastern time. Wherever possible, the Fund uses independent pricing services approved by the Board of Trustees to value its investments.
Equity securities, including restricted securities, for which market quotations are readily available, are valued at the last reported sale price or official closing price as reported by an independent pricing service on the primary market or exchange on which they are traded. In the event there were no sales during the day or closing prices are not available, securities are valued at the last quoted bid price. Investments in open-end mutual funds, including the Fidelity Central Funds, are valued at their closing net asset value each business day. Short-term securities with remaining maturities of sixty days or less for which quotations are not readily available are valued at amortized cost, which approximates value.
When current market prices or quotations are not readily available or do not accurately reflect fair value, valuations may be determined in accordance with procedures adopted by the Board of Trustees. For example, when developments occur between the close of a market and the close of the NYSE that may materially affect the value of some or all of the securities, or when trading in a security is halted, those securities may be fair valued. Factors used in the determination of fair value may include monitoring news to identify significant market or security specific events such as changes in the value of U.S. securities markets, reviewing developments in foreign markets and evaluating the performance of ADRs, futures contracts and exchange-traded funds. Because the Fund's utilization of fair value pricing depends on market activity, the frequency with which fair value pricing is used can not be predicted and may be utilized to a significant extent. The value of securities used for NAV calculation under fair value pricing may differ from published prices for the same securities.
Foreign Currency. The Fund uses foreign currency contracts to facilitate transactions in foreign-denominated securities. Losses from these transactions may arise from changes in the value of the foreign currency or if the counterparties do not perform under the contracts' terms.
Foreign-denominated assets, including investment securities, and liabilities are translated into U.S. dollars at the exchange rate at period end. Purchases and sales of investment securities, income and dividends received and expenses denominated in foreign currencies are translated into U.S. dollars at the exchange rate in effect on the transaction date.
The effects of exchange rate fluctuations on investments are included with the net realized and unrealized gain (loss) on investment securities. Other foreign currency transactions resulting in realized and unrealized gain (loss) are disclosed separately.
Investment Transactions and Income. Security transactions, including the Fund's investment activity in the Fidelity Central Funds, are accounted for as of trade date. Gains and losses on securities sold are determined on the basis of identified cost and may include proceeds received from litigation. Dividend income is recorded on the ex-dividend date, except for certain dividends from foreign securities where the ex-dividend date may have passed, which are recorded as soon as the Fund is informed of the ex-dividend date. Non-cash dividends included in dividend income, if any, are recorded at the fair market value of the securities received. Distributions received on securities that represent a return of capital or capital gain are recorded as a reduction of cost of investments and/or as a realized gain. The Fund estimates the components of distributions received that may be considered return of capital distributions or capital gain distributions. Large, non-recurring dividends recognized by the Fund are presented separately on the Statement of Operations as "Special Dividends" and the impact of these dividends is presented in the Financial Highlights. Interest income and income distributions from the Fidelity Central Funds are accrued as earned, with any income distributions receivable as of period end included in Interest Receivable on the Statement of Assets and Liabilities. Interest income includes coupon interest and amortization of premium and accretion of discount on debt securities. Investment income is recorded net of foreign taxes withheld where recovery of such taxes is uncertain.
Annual Report
Notes to Financial Statements - continued
1. Significant Accounting Policies - continued
Expenses. Most expenses of the trust can be directly attributed to a fund. Expenses which cannot be directly attributed are apportioned among each Fund in the trust. Expense estimates are accrued in the period to which they relate and adjustments are made when actual amounts are known.
Income Tax Information and Distributions to Shareholders. Each year, the Fund intends to qualify as a regulated investment company by distributing all of its taxable income and realized gains under Subchapter M of the Internal Revenue Code. As a result, no provision for income taxes is required in the accompanying financial statements. Foreign taxes are provided for based on the Fund's understanding of the tax rules and rates that exist in the foreign markets in which it invests.
Distributions are recorded on the ex-dividend date. Income dividends and capital gain distributions are declared separately for each class. Income and capital gain distributions are determined in accordance with income tax regulations, which may differ from generally accepted accounting principles.
Capital accounts within the financial statements are adjusted for permanent book-tax differences. These adjustments have no impact on net assets or the results of operations. Temporary book-tax differences will reverse in a subsequent period.
Book-tax differences are primarily due to foreign currency transactions, certain foreign taxes, net operating losses, and losses deferred due to wash sales.
The tax-basis components of distributable earnings and the federal tax cost as of period end were as follows:
Unrealized appreciation
$ 2,936,304
Unrealized depreciation
(1,159,749)
Net unrealized appreciation (depreciation)
1,776,555
Undistributed ordinary income
59,402
Undistributed long-term capital gain
77,581
Cost for federal income tax purposes
$ 19,675,551
The tax character of distributions paid was as follows:
December 31, 2006
December 31, 2005
Ordinary Income
$ 359,797
$ -
Long-term Capital Gains
718,131
540,605
Total
$ 1,077,928
$ 540,605
New Accounting Pronouncements. In July 2006, Financial Accounting Standards Board Interpretation No. 48, Accounting for Uncertainty in Income Taxes - an interpretation of FASB Statement 109 (FIN 48), was issued and is effective on the last business day of the semiannual reporting period for fiscal years beginning after December 15, 2006. FIN 48 sets forth a threshold for financial statement recognition, measurement and disclosure of a tax position taken or expected to be taken on a tax return. Management is currently evaluating the impact, if any, the adoption of FIN 48 will have on the Fund's net assets, results of operations and financial statement disclosures.
In addition, in September 2006, Statement of Financial Accounting Standards No. 157, Fair Value Measurements (SFAS 157), was issued and is effective for fiscal years beginning after November 15, 2007. SFAS 157 defines fair value, establishes a framework for measuring fair value and expands disclosures about fair value measurements. Management is currently evaluating the impact the adoption of SFAS 157 will have on the Fund's financial statement disclosures.
2. Operating Policies.
Repurchase Agreements. FMR has received an Exemptive Order from the Securities and Exchange Commission (the SEC) which permits the Fund and other affiliated entities of FMR to transfer uninvested cash balances into joint trading accounts which are then invested in repurchase agreements. The Fund may also invest directly with institutions in repurchase agreements. Repurchase agreements are collateralized by government or non-government securities. Upon settlement date, collateral is held in segregated accounts with custodian banks and may be obtained in the event of a default of the counterparty. The Fund monitors, on a daily basis, the value of the collateral to ensure it is at least equal to the principal amount of the repurchase agreement (including accrued interest). In the event of a default by the counterparty, realization of the collateral proceeds could be delayed, during which time the value of the collateral may decline.
3. Purchases and Sales of Investments.
Purchases and sales of securities, other than short-term securities, aggregated $41,575,007 and $40,136,896, respectively.
VIP Aggressive Growth Portfolio
4. Fees and Other Transactions with Affiliates.
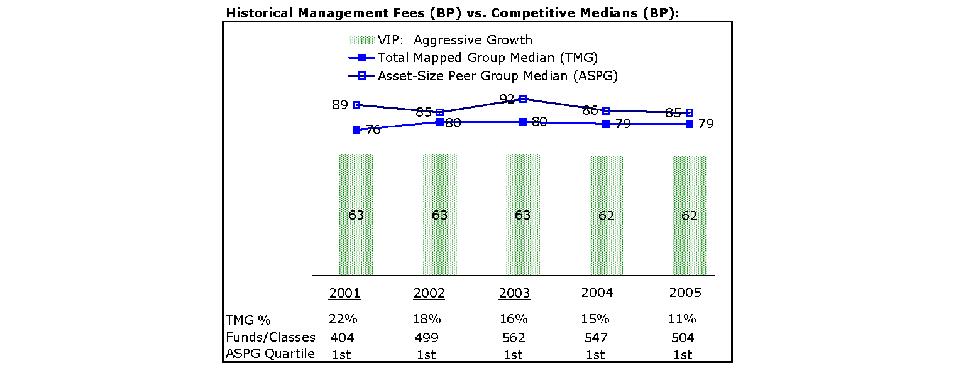
Management Fee. FMR and its affiliates provide the Fund with investment management related services for which the Fund pays a monthly management fee. The management fee is the sum of an individual fund fee rate that is based on an annual rate of .35% of the Fund's average net assets and a group fee rate that averaged .27% during the period. The group fee rate is based upon the average net assets of all the mutual funds advised by FMR. The group fee rate decreases as assets under management increase and increases as assets under management decrease. For the period, the total annual management fee rate was .62% of the Fund's average net assets.
Distribution and Service Plan. In accordance with Rule 12b-1 of the 1940 Act, the Fund has adopted separate 12b-1 Plans for each Service Class of shares. Each Service Class pays Fidelity Distributors Corporation (FDC), an affiliate of FMR, a service fee. For the period, the service fee is based on an annual rate of .10% of Service Class' average net assets and .25% of Service Class 2's average net assets.
For the period, each class paid FDC the following amounts, all of which were re-allowed to insurance companies for the distribution of shares and providing shareholder support services:
Service Class
$ 1,071
Service Class 2
25,167
$ 26,238
Transfer Agent Fees. Fidelity Investments Institutional Operations Company, Inc. (FIIOC), an affiliate of FMR, is the fund's transfer, dividend disbursing, and shareholder servicing agent. FIIOC receives an asset-based fee with respect to each class. Each class with the exception of Investor Class pays a transfer agent fee, excluding out of pocket expenses, equal to an annual rate of .07% of their month end net assets. Investor Class pays a monthly asset-based transfer agent fee of .18% of its month end net assets. The total transfer agent fees paid by each class to FIIOC, including out of pocket expenses, were as follows:
Initial Class
$ 7,155
Service Class
807
Service Class 2
9,269
Investor Class
7,599
$ 24,830
Accounting Fees. Fidelity Service Company, Inc. (FSC), an affiliate of FMR, maintains the Fund's accounting records. The fee is based on the level of average net assets for the month.
Investments in Fidelity Central Funds. The Fund may invest in Fidelity Central Funds. The Fund's Schedule of Investments lists each of the Fidelity Central Funds as an investment of the Fund but does not include the underlying holdings of each Fidelity Central Fund. As an Investing Fund, the Fund indirectly bears its proportionate share of the expenses of the underlying Fidelity Central Funds. A complete unaudited list of holdings for each Fidelity Central Fund is available upon request. In addition, the financial statements of the Fidelity Central Funds, which are not covered by the Fund's Report of Independent Registered Public Accounting Firm, are available on the EDGAR Database on the SEC's web site, www.sec.gov, or upon request.
The Money Market Central Funds seek preservation of capital and current income and are managed by Fidelity Investments Money Management, Inc. (FIMM), an affiliate of FMR.
Brokerage Commissions. The Fund placed a portion of its portfolio transactions with brokerage firms which are affiliates of the investment adviser. The commissions paid to these affiliated firms were $899 for the period.
5. Committed Line of Credit.
The Fund participates with other funds managed by FMR in a $4.2 billion credit facility (the "line of credit") to be utilized for temporary or emergency purposes to fund shareholder redemptions or for other short-term liquidity purposes. The Fund has agreed to pay commitment fees on its pro rata portion of the line of credit, which amounted to $53 and is reflected in Miscellaneous Expense on the Statement of Operations. During the period, there were no borrowings on this line of credit.
6. Expense Reductions.
FMR voluntarily agreed to reimburse each class to the extent annual operating expenses exceeded certain levels of average net assets as noted in the table below. Some expenses, for example interest expense, including commitment fees, are excluded from this reimbursement.
Annual Report
Notes to Financial Statements - continued
6. Expense Reductions - continued
The following classes were in reimbursement during the period:
Expense Limitations
Reimbursement from adviser
Initial Class
.90%
$ 19,413
Service Class
1.00%
2,938
Service Class 2
1.15%
29,348
Investor Class
1.05%
9,015
$ 60,714
Many of the brokers with whom FMR places trades on behalf of the Fund provided services to the Fund in addition to trade execution. These services included payments of certain expenses on behalf of the Fund totaling $1,895 for the period.
7. Other.
The Fund's organizational documents provide former and current trustees and officers with a limited indemnification against liabilities arising in connection with the performance of their duties to the Fund. In the normal course of business, the Fund may also enter into contracts that provide general indemnifications. The Fund's maximum exposure under these arrangements is unknown as this would be dependent on future claims that may be made against the Fund. The risk of material loss from such claims is considered remote.
At the end of the period, FMR or its affiliates were the owners of record of 67% of the total outstanding shares of the Fund and two otherwise unaffiliated shareholders were the owners of record of 32% of the total outstanding shares of the Fund.
The United States Securities and Exchange Commission ("SEC") is conducting an investigation of FMR (covering the years 2002 to 2004) arising from gifts, gratuities and business entertainment provided by certain brokers to certain individuals who were employed on FMR's domestic equity trading desk during that period. FMR is in discussions with the SEC staff regarding the possible resolution of the matter, but as of period-end no final resolution has been reached.
In December 2006, the Independent Trustees completed their own investigation of the matter with the assistance of independent counsel. The Independent Trustees and FMR agree that, despite the absence of proof that the Fidelity mutual funds experienced diminished execution quality as a result of the improper receipt of gifts and business entertainment, the conduct at issue was serious and is worthy of redress. Accordingly, the Independent Trustees have requested and FMR has agreed to pay $42 million to Fidelity mutual funds, plus interest to be determined at the time that payment is made. A method of allocating this payment among the funds has not yet been determined. The total payment to the Fund is not anticipated to have a material impact on the Fund's net assets. In addition, FMR reimbursed related legal expenses which are recorded in the accompanying Statement of Operations as an expense reduction.
8. Distributions to Shareholders.
Distributions to shareholders of each class were as follows:
Years ended December 31,
2006
2005 A
From net realized gain
Initial Class
$ 324,665
$ 171,838
Service Class
54,317
32,519
Service Class 2
514,729
297,197
Investor Class
184,217
39,051
Total
$ 1,077,928
$ 540,605
A Distributions for Investor Class are for the period July 21, 2005 (commencement of sale of shares) to December 31, 2005.
VIP Aggressive Growth Portfolio
9. Share Transactions.
Transactions for each class of shares were as follows:
Shares
Dollars
Years ended December 31,
Years ended December 31,
2006
2005 A
2006
2005 A
Initial Class
Shares sold
619,484
1,063,075
$ 5,811,098
$ 9,578,096
Reinvestment of distributions
34,261
18,537
324,665
171,838
Shares redeemed
(646,215)
(525,656)
(5,953,927)
(4,765,585)
Net increase (decrease)
7,530
555,956
$ 181,836
$ 4,984,349
Service Class
Shares sold
1,572
14,466
$ 13,506
$ 124,895
Reinvestment of distributions
5,726
3,504
54,317
32,519
Shares redeemed
(14,220)
(15,326)
(132,580)
(141,133)
Net increase (decrease)
(6,922)
2,644
$ (64,757)
$ 16,281
Service Class 2
Shares sold
170,381
237,617
$ 1,549,792
$ 2,014,380
Reinvestment of distributions
55,133
32,552
514,729
297,197
Shares redeemed
(208,785)
(194,170)
(1,917,166)
(1,674,066)
Net increase (decrease)
16,729
75,999
$ 147,355
$ 637,511
Investor Class
Shares sold
447,871
153,237
$ 4,215,413
$ 1,415,178
Reinvestment of distributions
19,497
4,222
184,217
39,051
Shares redeemed
(218,649)
(4,760)
(2,037,707)
(44,716)
Net increase (decrease)
248,719
152,699
$ 2,361,923
$ 1,409,513
A Share transactions for Investor Class are for the period July 21, 2005 (commencement of sale of shares) to December 31, 2005.
Annual Report
Report of Independent Registered Public Accounting Firm
To the Trustees of Variable Insurance Products Fund III and Shareholders of VIP Aggressive Growth Portfolio:
We have audited the accompanying statement of assets and liabilities of VIP Aggressive Growth Portfolio (the Fund), a fund of Variable Insurance Products Fund III, including the schedule of investments as of December 31, 2006, and the related statement of operations for the year then ended, the statement of changes in net assets for each of the two years in the period then ended, and the financial highlights for each of the five years in the period then ended. These financial statements and financial highlights are the responsibility of the Fund's management. Our responsibility is to express an opinion on these financial statements and financial highlights based on our audits.
We conducted our audits in accordance with standards of the Public Company Accounting Oversight Board (United States). Those standards require that we plan and perform the audit to obtain reasonable assurance about whether the financial statements and financial highlights are free of material misstatement. The Fund is not required to have, nor were we engaged to perform, an audit of its internal control over financial reporting. Our audits included consideration of internal control over financial reporting as a basis for designing audit procedures that are appropriate in the circumstances, but not for the purpose of expressing an opinion on the effectiveness of the Fund's internal control over financial reporting. Accordingly, we express no such opinion. An audit also includes examining, on a test basis, evidence supporting the amounts and disclosures in the financial statements, assessing the accounting principles used and significant estimates made by management, as well as evaluating the overall financial statement presentation. Our procedures included confirmation of securities owned as of December 31, 2006, by correspondence with the custodians and brokers; where replies were not received from brokers, we performed other auditing procedures. We believe that our audits provide a reasonable basis for our opinion.
In our opinion, the financial statements and financial highlights referred to above present fairly, in all material respects, the financial position of VIP Aggressive Growth Portfolio as of December 31, 2006, the results of its operations for the year then ended, the changes in its net assets for each of the two years in the period then ended, and its financial highlights for each of the five years in the period then ended, in conformity with accounting principles generally accepted in the United States of America.
/s/ Deloitte & Touche LLP
DELOITTE & TOUCHE LLP
Boston, Massachusetts
February 16, 2007
Annual Report
Trustees and Officers
The Trustees, Member of the Advisory Board, and executive officers of the trust and fund, as applicable, are listed below. The Board of Trustees governs the fund and is responsible for protecting the interests of shareholders. The Trustees are experienced executives who meet periodically throughout the year to oversee the fund's activities, review contractual arrangements with companies that provide services to the fund, and review the fund's performance. Each of the Trustees oversees 348 funds advised by FMR or an affiliate.
The Trustees hold office without limit in time except that (a) any Trustee may resign; (b) any Trustee may be removed by written instrument, signed by at least two-thirds of the number of Trustees prior to such removal; (c) any Trustee who requests to be retired or who has become incapacitated by illness or injury may be retired by written instrument signed by a majority of the other Trustees; and (d) any Trustee may be removed at any special meeting of shareholders by a two-thirds vote of the outstanding voting securities of the trust. Each Trustee who is not an interested person (as defined in the 1940 Act) (Independent Trustee), shall retire not later than the last day of the calendar year in which his or her 72nd birthday occurs. The Independent Trustees may waive this mandatory retirement age policy with respect to individual Trustees. The executive officers and Advisory Board Member hold office without limit in time, except that any officer and Advisory Board Member may resign or may be removed by a vote of a majority of the Trustees at any regular meeting or any special meeting of the Trustees. Except as indicated, each individual has held the office shown or other offices in the same company for the past five years.
The fund's Statement of Additional Information (SAI) includes more information about the Trustees. To request a free copy, call Fidelity at 1-877-208-0098.
Interested Trustees*:
Correspondence intended for each Trustee who is an interested person may be sent to Fidelity Investments, 82 Devonshire Street, Boston, Massachusetts 02109.
Name, Age; Principal Occupation
Edward C. Johnson 3d (76)
Year of Election or Appointment: 1994
Mr. Johnson is Chairman of the Board of Trustees. Mr. Johnson serves as President (2006-present), Chief Executive Officer, Chairman, and a Director of FMR Corp.; Chairman and a Director of FMR; Chairman and a Director of Fidelity Research & Analysis Company (FRAC); Chairman and a Director of Fidelity Investments Money Management, Inc.; and Chairman (2001-present) and a Director of FMR Co., Inc. In addition, Mr. Johnson serves as Chairman and Director of Fidelity International Limited (FIL).
Robert L. Reynolds (54)
Year of Election or Appointment: 2003
Mr. Reynolds is President and a Director of FMR (2005-present), Fidelity Investments Money Management, Inc. (2005-present), and FMR Co., Inc. (2005-present). Mr. Reynolds also serves as Vice Chairman (2006-present), a Director (2003-present), and Chief Operating Officer of FMR Corp. and a Director of Strategic Advisers, Inc. (2005-present). He also serves on the Board at Fidelity Investments Canada, Ltd.
* Trustees have been determined to be "Interested Trustees" by virtue of, among other things, their affiliation with the trust or various entities under common control with FMR.
Independent Trustees:
Correspondence intended for each Independent Trustee (that is, the Trustees other than the Interested Trustees) may be sent to Fidelity Investments, P.O. Box 55235, Boston, Massachusetts 02205-5235.
Name, Age; Principal Occupation
Dennis J. Dirks (58)
Year of Election or Appointment: 2005
Prior to his retirement in May 2003, Mr. Dirks was Chief Operating Officer and a member of the Board of The Depository Trust & Clearing Corporation (DTCC) (1999-2003). He also served as President, Chief Operating Officer, and Board member of The Depository Trust Company (DTC) (1999-2003) and President and Board member of the National Securities Clearing Corporation (NSCC) (1999-2003). In addition, Mr. Dirks served as Chief Executive Officer and Board member of the Government Securities Clearing Corporation (2001-2003) and Chief Executive Officer and Board member of the Mortgage-Backed Securities Clearing Corporation (2001-2003). Mr. Dirks also serves as a Trustee and a member of the Finance Committee of Manhattan College (2005-present) and a Trustee and a member of the Finance Committee of AHRC of Nassau County (2006-present).
Albert R. Gamper, Jr. (64)
Year of Election or Appointment: 2006
Prior to his retirement in December 2004, Mr. Gamper served as Chairman of the Board of CIT Group Inc. (commercial finance). During his tenure with CIT Group Inc. Mr. Gamper served in numerous senior management positions, including Chairman (1987-1989; 1999-2001; 2002-2004), Chief Executive Officer (1987-2004), and President (1989-2002). He currently serves as a member of the Board of Directors of Public Service Enterprise Group (utilities, 2001-present), Chairman of the Board of Governors, Rutgers University (2004-present), and Chairman of the Board of Saint Barnabas Health Care System.
George H. Heilmeier (70)
Year of Election or Appointment: 2004
Dr. Heilmeier is Chairman Emeritus of Telcordia Technologies (communication software and systems), where prior to his retirement, he served as company Chairman and Chief Executive Officer. He currently serves on the Boards of Directors of The Mitre Corporation (systems engineering and information technology support for the government), and HRL Laboratories (private research and development, 2004-present). He is Chairman of the General Motors Science & Technology Advisory Board and a Life Fellow of the Institute of Electrical and Electronics Engineers (IEEE). Dr. Heilmeier is a member of the Defense Science Board and the National Security Agency Advisory Board. He is also a member of the National Academy of Engineering, the American Academy of Arts and Sciences, and the Board of Overseers of the School of Engineering and Applied Science of the University of Pennsylvania. Previously, Dr. Heilmeier served as a Director of TRW Inc. (automotive, space, defense, and information technology, 1992-2002), Compaq (1994-2002), Automatic Data Processing, Inc. (ADP) (technology-based business outsourcing, 1995-2002), INET Technologies Inc. (telecommunications network surveillance, 2001-2004), and Teletech Holdings (customer management services). He is the recipient of the 2005 Kyoto Prize in Advanced Technology for his invention of the liquid crystal display, and a member of the Consumer Electronics Hall of Fame.
James H. Keyes (66)
Year of Election or Appointment: 2007
Prior to his retirement in 2003, Mr. Keyes was Chairman, President, and Chief Executive Officer of Johnson Controls, Inc. (automotive supplier, 1993-2003). He currently serves as a member of the boards of LSI Logic Corporation (semiconductor technologies), Navistar International Corporation (manufacture and sale of trucks, buses, and diesel engines, 2002-present), and Pitney Bowes, Inc. (integrated mail, messaging, and document management solutions).
Marie L. Knowles (60)
Year of Election or Appointment: 2001
Prior to Ms. Knowles' retirement in June 2000, she served as Executive Vice President and Chief Financial Officer of Atlantic Richfield Company (ARCO) (diversified energy, 1996-2000). From 1993 to 1996, she was a Senior Vice President of ARCO and President of ARCO Transportation Company. She served as a Director of ARCO from 1996 to 1998. She currently serves as a Director of Phelps Dodge Corporation (copper mining and manufacturing) and McKesson Corporation (healthcare service, 2002-present). Ms. Knowles is a Trustee of the Brookings Institution and the Catalina Island Conservancy and also serves as a member of the Advisory Board for the School of Engineering of the University of Southern California.
Ned C. Lautenbach (62)
Year of Election or Appointment: 2000
Mr. Lautenbach is Chairman of the Independent Trustees (2006-present). Mr. Lautenbach has been a partner of Clayton, Dubilier & Rice, Inc. (private equity investment firm) since September 1998. Previously, Mr. Lautenbach was with the International Business Machines Corporation (IBM) from 1968 until his retirement in 1998. Mr. Lautenbach serves as a Director of Sony Corporation (2006-present) and Eaton Corporation (diversified industrial) as well as the Philharmonic Center for the Arts in Naples, Florida. He also is a member of the Board of Trustees of Fairfield University (2005-present), as well as a member of the Council on Foreign Relations.
Cornelia M. Small (62)
Year of Election or Appointment: 2005
Ms. Small is a member (2000-present) and Chairperson (2002-present) of the Investment Committee, and a member (2002- present) of the Board of Trustees of Smith College. Previously, she served as Chief Investment Officer (1999-2000), Director of Global Equity Investments (1996-1999), and a member of the Board of Directors of Scudder, Stevens & Clark (1990-1997) and Scudder Kemper Investments (1997-1999). In addition, Ms. Small served as Co-Chair (2000-2003) of the Annual Fund for the Fletcher School of Law and Diplomacy.
William S. Stavropoulos (67)
Year of Election or Appointment: 2002
Mr. Stavropoulos is Chairman Emeritus of the Board of Directors of The Dow Chemical Company. Since joining The Dow Chemical Company in 1967, Mr. Stavropoulos served in numerous senior management positions, including President (1993-2000; 2002-2003), CEO (1995-2000; 2002-2004), and Chairman of the Executive Committee (2000-2004). Currently, he is a Director of NCR Corporation (data warehousing and technology solutions), BellSouth Corporation (telecommunications), Chemical Financial Corporation, Maersk Inc. (industrial conglomerate, 2002-present), and Metalmark Capital (private equity investment firm, 2005-present). He also serves as a member of the Board of Trustees of the American Enterprise Institute for Public Policy Research. In addition, Mr. Stavropoulos is a member of The Business Council, J.P. Morgan International Council and the University of Notre Dame Advisory Council for the College of Science.
Kenneth L. Wolfe (67)
Year of Election or Appointment: 2005
Prior to his retirement in 2001, Mr. Wolfe was Chairman and Chief Executive Officer of Hershey Foods Corporation (1993-2001). He currently serves as a member of the boards of Adelphia Communications Corporation (2003-present), Bausch & Lomb, Inc., and Revlon Inc. (2004-present).
Advisory Board Member and Executive Officers:
Correspondence intended for each executive officer and Mr. Lynch may be sent to Fidelity Investments, 82 Devonshire Street, Boston, Massachusetts 02109.
Name, Age; Principal Occupation
Peter S. Lynch (62)
Year of Election or Appointment: 2003
Member of the Advisory Board of Variable Insurance Products Fund III. Mr. Lynch is Vice Chairman and a Director of FMR, and Vice Chairman (2001-present) and a Director of FMR Co., Inc. Previously, Mr. Lynch served as a Trustee of the Fidelity funds (1990-2003). In addition, he serves as a Trustee of Boston College and as the Chairman of the Inner-City Scholarship Fund.
Kimberley H. Monasterio (43)
Year of Election or Appointment: 2007
President and Treasurer of VIP Aggressive Growth. Ms. Monasterio also serves as President and Treasurer of other Fidelity funds (2007-present) and is an employee of FMR (2004-present). Previously, Ms. Monasterio served as Deputy Treasurer of the Fidelity funds (2004-2006). Before joining Fidelity Investments, Ms. Monasterio served as Treasurer (2000-2004) and Chief Financial Officer (2002-2004) of the Franklin Templeton Funds and Senior Vice President of Franklin Templeton Services, LLC (2000-2004).
Dwight D. Churchill (53)
Year of Election or Appointment: 2005
Vice President of VIP Aggressive Growth. Mr. Churchill also serves as Vice President of certain Equity Funds (2005-present). Mr. Churchill is Executive Vice President of FMR (2005-present) and FMR Co., Inc. (2005-present). Previously, Mr. Churchill served as Senior Vice President of Fidelity Investments Money Management, Inc. (2005-2006), Head of Fidelity's Fixed-Income Division (2000-2005), Vice President of Fidelity's Money Market Funds (2000-2005), Vice President of Fidelity's Bond Funds, and Senior Vice President of FMR.
Bruce T. Herring (41)
Year of Election or Appointment: 2006
Vice President of VIP Aggressive Growth. Mr. Herring also serves as Vice President of certain Equity Funds (2006-present). Mr. Herring is Senior Vice President of FMR (2006-present) and Vice President of FMR Co., Inc. (2001-present). Previously, Mr. Herring served as a portfolio manager for Fidelity U.S. Equity Funds (2001-2005).
Steve Calhoun (35)
Year of Election or Appointment: 2005
Vice President of VIP Aggressive Growth. Mr. Calhoun also serves as Vice President of other funds advised by FMR. Prior to assuming his current responsibilities, Mr. Calhoun worked as a research analyst and manager. Mr. Calhoun also serves as Vice President of FMR and FMR Co., Inc. (2005).
Eric D. Roiter (58)
Year of Election or Appointment: 2000
Secretary of VIP Aggressive Growth. He also serves as Secretary of other Fidelity funds; Vice President, General Counsel, and Secretary of FMR Co., Inc. (2001-present) and FMR; Assistant Secretary of Fidelity Management & Research (U.K.) Inc. (2001-present), Fidelity Research & Analysis Company (2001-present), and Fidelity Investments Money Management, Inc. (2001-present). Mr. Roiter is an Adjunct Member, Faculty of Law, at Boston College Law School (2003-present). Previously, Mr. Roiter served as Vice President and Secretary of Fidelity Distributors Corporation (FDC) (1998-2005).
Stuart Fross (47)
Year of Election or Appointment: 2003
Assistant Secretary of VIP Aggressive Growth. Mr. Fross also serves as Assistant Secretary of other Fidelity funds (2003-present), Vice President and Secretary of FDC (2005-present), and is an employee of FMR.
R. Stephen Ganis (40)
Year of Election or Appointment: 2006
Anti-Money Laundering (AML) officer of VIP Aggressive Growth. Mr. Ganis also serves as AML officer of other Fidelity funds (2006-present) and FMR Corp. (2003-present). Before joining Fidelity Investments, Mr. Ganis practiced law at Goodwin Procter, LLP (2000-2002).
Joseph B. Hollis (58)
Year of Election or Appointment: 2006
Chief Financial Officer of VIP Aggressive Growth. Mr. Hollis also serves as Chief Financial Officer of other Fidelity funds. Mr. Hollis is President of Fidelity Pricing and Cash Management Services (FPCMS) (2005-present). Mr. Hollis also serves as President and Director of Fidelity Service Company, Inc. (2006-present). Previously, Mr. Hollis served as Senior Vice President of Cash Management Services (1999-2002) and Investment Management Operations (2002-2005).
Kenneth A. Rathgeber (59)
Year of Election or Appointment: 2004
Chief Compliance Officer of VIP Aggressive Growth. Mr. Rathgeber also serves as Chief Compliance Officer of other Fidelity funds (2004-present) and Executive Vice President of Risk Oversight for Fidelity Investments (2002-present). He is Chief Compliance Officer of FMR (2005-present), FMR Co., Inc. (2005-present), Fidelity Management & Research (U.K.) Inc. (2005-present), Fidelity Research & Analysis Company (2005-present), Fidelity Investments Money Management, Inc. (2005-present), and Strategic Advisers, Inc. (2005-present). Previously, Mr. Rathgeber served as Executive Vice President and Chief Operating Officer for Fidelity Investments Institutional Services Company, Inc. (1998-2002).
Bryan A. Mehrmann (45)
Year of Election or Appointment: 2005
Deputy Treasurer of VIP Aggressive Growth. Mr. Mehrmann also serves as Deputy Treasurer of other Fidelity funds (2005-present) and is an employee of FMR. Previously, Mr. Mehrmann served as Vice President of Fidelity Investments Institutional Services Group (FIIS)/Fidelity Investments Institutional Operations Corporation, Inc. (FIIOC) Client Services (1998-2004).
Kenneth B. Robins (37)
Year of Election or Appointment: 2005
Deputy Treasurer of VIP Aggressive Growth. Mr. Robins also serves as Deputy Treasurer of other Fidelity funds (2005-present) and is an employee of FMR (2004-present). Before joining Fidelity Investments, Mr. Robins worked at KPMG LLP, where he was a partner in KPMG's department of professional practice (2002-2004) and a Senior Manager (1999-2000). In addition, Mr. Robins served as Assistant Chief Accountant, United States Securities and Exchange Commission (2000-2002).
Robert G. Byrnes (40)
Year of Election or Appointment: 2005
Assistant Treasurer of VIP Aggressive Growth. Mr. Byrnes also serves as Assistant Treasurer of other Fidelity funds (2005-present) and is an employee of FMR (2005-present). Previously, Mr. Byrnes served as Vice President of FPCMS (2003-2005). Before joining Fidelity Investments, Mr. Byrnes worked at Deutsche Asset Management where he served as Vice President of the Investment Operations Group (2000-2003).
John H. Costello (60)
Year of Election or Appointment: 2000
Assistant Treasurer of VIP Aggressive Growth. Mr. Costello also serves as Assistant Treasurer of other Fidelity funds and is an employee of FMR.
Peter L. Lydecker (52)
Year of Election or Appointment: 2004
Assistant Treasurer of VIP Aggressive Growth. Mr. Lydecker also serves as Assistant Treasurer of other Fidelity funds (2004) and is an employee of FMR.
Mark Osterheld (51)
Year of Election or Appointment: 2002
Assistant Treasurer of VIP Aggressive Growth. Mr. Osterheld also serves as Assistant Treasurer of other Fidelity funds (2002) and is an employee of FMR.
Gary W. Ryan (48)
Year of Election or Appointment: 2005
Assistant Treasurer of VIP Aggressive Growth. Mr. Ryan also serves as Assistant Treasurer of other Fidelity funds (2005-present) and is an employee of FMR (2005-present). Previously, Mr. Ryan served as Vice President of Fund Reporting in FPCMS (1999-2005).
Salvatore Schiavone (41)
Year of Election or Appointment: 2005
Assistant Treasurer of VIP Aggressive Growth. Mr. Schiavone also serves as Assistant Treasurer of other Fidelity funds (2005-present) and is an employee of FMR (2005-present). Before joining Fidelity Investments, Mr. Schiavone worked at Deutsche Asset Management, where he most recently served as Assistant Treasurer (2003-2005) of the Scudder Funds and Vice President and Head of Fund Reporting (1996-2003).
Annual Report
Distributions
The Board of Trustees of VIP Aggressive Growth Portfolio voted to pay to shareholders of record at the opening of business on record date, the following distributions per share derived from capital gains realized from sales of portfolio securities:
Pay Date
Record Date
Capital Gains
Initial Class
02/09/07
02/09/07
$0.062
Service Class
02/09/07
02/09/07
$0.062
Service Class
02/09/07
02/09/07
$0.062
Investor Class
02/09/07
02/09/07
$0.062
The fund hereby designates as a capital gain dividend with respect to the taxable year ended December 31, 2006, $744,646, or, if subsequently determined to be different, the net capital gain of such year.
Initial Class, Service Class, Service Class 2 and Investor Class designate 24%, 26%, 28% and 24% of the dividends distributed during the fiscal year as qualifying for the dividends-received deduction for corporate shareholders.
The fund will notify shareholders in January 2007 of amounts for use in preparing 2006 income tax returns.
Annual Report
Proxy Voting Results
A special meeting of the fund's shareholders was held on November 15, 2006. The results of votes taken among shareholders on the proposal before them are reported below. Each vote reported represents one dollar of net asset value held on the record date for the meeting.
PROPOSAL 1
To elect a Board of Trustees. A
# of Votes
% of Votes
Dennis J. Dirks
Affirmative
8,022,573,906.52
96.057
Withheld
329,291,624.43
3.943
TOTAL
8,351,865,530.95
100.000
Albert R. Gamper, Jr.
Affirmative
8,017,939,119.36
96.002
Withheld
333,926,411.59
3.998
TOTAL
8,351,865,530.95
100.000
Robert M. Gates
Affirmative
8,011,581,068.50
95.926
Withheld
340,284,462.45
4.074
TOTAL
8,351,865,530.95
100.000
George H. Heilmeier
Affirmative
8,000,846,196.79
95.797
Withheld
351,019,334.16
4.203
TOTAL
8,351,865,530.95
100.000
Edward C. Johnson 3d
Affirmative
7,992,112,301.22
95.693
Withheld
359,753,229.73
4.307
TOTAL
8,351,865,530.95
100.000
Stephen P. Jonas
Affirmative
8,019,883,742.95
96.025
Withheld
331,981,788.00
3.975
TOTAL
8,351,865,530.95
100.000
James H. KeyesB
Affirmative
8,015,436,547.06
95.972
Withheld
336,428,983.89
4.028
TOTAL
8,351,865,530.95
100.000
Marie L. Knowles
Affirmative
8,015,361,874.49
95.971
Withheld
336,503,656.46
4.029
TOTAL
8,351,865,530.95
100.000
Ned C. Lautenbach
Affirmative
8,018,503,793.25
96.009
Withheld
333,361,737.70
3.991
TOTAL
8,351,865,530.95
100.000
# of Votes
% of Votes
William O. McCoy
Affirmative
8,000,170,571.19
95.789
Withheld
351,694,959.76
4.211
TOTAL
8,351,865,530.95
100.000
Robert L. Reynolds
Affirmative
8,020,815,676.67
96.036
Withheld
331,049,854.28
3.964
TOTAL
8,351,865,530.95
100.000
Cornelia M. Small
Affirmative
8.020,146,516.32
96.028
Withheld
331,719,014.63
3.972
TOTAL
8,351,865,530.95
100.000
William S. Stavropoulos
Affirmative
8,009,250,640.78
95.898
Withheld
342,614,890.17
4.102
TOTAL
8,351,865,530.95
100.000
Kenneth L. Wolfe
Affirmative
8,013,187,941.55
95.945
Withheld
338,677,589.40
4.055
TOTAL
8,351,865,530.95
100.000
ADenotes trust-wide proposal and voting results.
BEffective on or about January 1, 2007.
Annual Report
Board Approval of Investment Advisory Contracts and Management Fees
VIP Aggressive Growth Portfolio
Each year, typically in July, the Board of Trustees, including the Independent Trustees (together, the Board), votes on the renewal of the management contract and sub-advisory agreements (together, the Advisory Contracts) for the fund. The Board, assisted by the advice of fund counsel and Independent Trustees' counsel, requests and considers a broad range of information throughout the year.
The Board meets regularly each month except August and takes into account throughout the year matters bearing on Advisory Contracts. The Board, acting directly and through its separate committees, considers at each of its meetings factors that are relevant to the annual renewal of the fund's Advisory Contracts, including the services and support provided to the fund and its shareholders. At the time of the renewal, the Board had 12 standing committees, each composed of Independent Trustees with varying backgrounds, to which the Board has assigned specific subject matter responsibilities in order to enhance effective decision-making by the Board. Each committee has adopted a written charter outlining the structure and purposes of the committee. One such committee, the Equity Contract Committee, meets periodically as needed throughout the year to consider matters specifically related to the annual renewal of Advisory Contracts. The committee requests and receives information on, and makes recommendations to the Independent Trustees concerning, the approval and annual review of the Advisory Contracts.
At its July 2006 meeting, the Board of Trustees, including the Independent Trustees, unanimously determined to renew the Advisory Contracts for the fund. In reaching its determination, the Board considered all factors it believed relevant, including (i) the nature, extent, and quality of the services to be provided to the fund and its shareholders (including the investment performance of the fund); (ii) the competitiveness of the management fee and total expenses of the fund; (iii) the total costs of the services to be provided by and the profits to be realized by the investment adviser and its affiliates from the relationship with the fund; (iv) the extent to which economies of scale would be realized as the fund grows; and (v) whether fee levels reflect these economies of scale, if any, for the benefit of fund shareholders.
In determining whether to renew the Advisory Contracts for the fund, the Board ultimately reached a determination, with the assistance of fund counsel and Independent Trustees' counsel, that the renewal of the Advisory Contracts and the compensation to be received by Fidelity under the management contract is consistent with Fidelity's fiduciary duty under applicable law. In addition to evaluating the specific factors noted above, the Board, in reaching its determination, is aware that shareholders in the fund have a broad range of investment choices available to them, including a wide choice among mutual funds offered by competitors to Fidelity, and that the fund's shareholders, with the opportunity to review and weigh the disclosure provided by the fund in its prospectus and other public disclosures, have chosen to invest in this fund, managed by Fidelity.
Nature, Extent, and Quality of Services Provided. The Board considered staffing within the investment adviser, FMR, and the sub-advisers (together, the Investment Advisers), including the background of the fund's portfolio manager and the fund's investment objective and discipline. The Independent Trustees also had discussions with senior management of Fidelity's investment operations and investment groups. The Board considered the structure of the portfolio manager compensation program and whether this structure provides appropriate incentives.
Resources Dedicated to Investment Management and Support Services. The Board reviewed the size, education, and experience of the Investment Advisers' investment staff, their use of technology, and the Investment Advisers' approach to recruiting, training, and retaining portfolio managers and other research, advisory, and management personnel. The Board considered Fidelity's extensive global research capabilities that enable the Investment Advisers to aggregate data from various sources in an effort to produce positive investment results. The Board noted that Fidelity's analysts have access to a variety of technological tools that enable them to perform both fundamental and quantitative analysis and to specialize in various disciplines. The Board also considered that Fidelity's portfolio managers and analysts have access to daily portfolio attribution that allows for monitoring of a fund's portfolio, as well as an electronic communication system that provides immediate real-time access to research concerning issuers and credit enhancers.
Shareholder and Administrative Services. The Board considered (i) the nature, extent, quality, and cost of administrative, distribution, and shareholder services performed by the Investment Advisers and their affiliates under the Advisory Contracts and under separate agreements covering transfer agency, pricing and bookkeeping, and securities lending services for the fund; (ii) the nature and extent of the Investment Advisers' supervision of third party service providers, principally custodians and subcustodians; and (iii) the resources devoted to, and the record of compliance with, the fund's compliance policies and procedures. The Board reviewed the allocation of fund brokerage, including allocations to brokers affiliated with the Investment Advisers, the use of brokerage commissions to pay fund expenses, and the use of "soft" commission dollars to pay for research services. The Board also considered that Fidelity voluntarily pays for market data out of its own resources.
The Board noted that the growth of fund assets across the complex allows Fidelity to reinvest in the development of services designed to enhance the value or convenience of the Fidelity funds as investment vehicles. These services include 24-hour access to account information and market information through phone representatives and over the Internet, and investor education materials and asset allocation tools.
Investment in a Large Fund Family. The Board considered the benefits to shareholders of investing in a Fidelity fund, including the benefits of investing in a fund that is part of a large family of funds offering a variety of investment disciplines and providing for a large variety of mutual fund investor services. The Board noted that, since the last Advisory Contract renewals in July 2005, Fidelity has taken a number of actions that benefited particular funds, including (i) dedicating additional resources to investment research and to restructure the investment research teams; (ii) voluntarily entering into contractual arrangements with certain brokers pursuant to which Fidelity pays for research products and services separately out of its own resources, rather than bundling with fund commissions; (iii) launching the Fidelity Advantage Class of its five Spartan stock index funds and three Spartan bond index funds, which is a lower-fee class available to shareholders with higher account balances; (iv) contractually agreeing to impose expense limitations on Fidelity U.S. Bond Index Fund and reducing the fund's initial investment minimum; and (v) offering shareholders of each of the Fidelity Institutional Money Market Funds the privilege of exchanging shares of the fund for shares of other Fidelity funds.
Annual Report
Board Approval of Investment Advisory Contracts and Management Fees - continued
Investment Performance and Compliance. The Board considered whether the fund has operated within its investment objective, as well as its record of compliance with its investment restrictions. It also reviewed the fund's absolute investment performance for each class (except Investor Class), as well as the fund's relative investment performance for each class (except Investor Class) measured against (i) a broad-based securities market index, and (ii) a peer group of mutual funds deemed appropriate by the Board over multiple periods. The following charts considered by the Board show, over the one-, three-, and five-year periods ended December 31, 2005, the cumulative total returns of Service Class 2 and Initial Class of the fund, the cumulative total returns of a broad-based securities market index ("benchmark"), and a range of cumulative total returns of a peer group of mutual funds identified by Lipper Inc. as having an investment objective similar to that of the fund. The returns of Service Class 2 and Initial Class represent the performance of classes with the highest and lowest 12b-1 fees, respectively (not necessarily with the highest and lowest total expenses). (Investor Class of the fund, which has no 12b-1 fee, had less than one year of performance as of December 31, 2005.) The box within each chart shows the 25th percentile return (bottom of box) and the 75th percentile return (top of box) of the Lipper peer group. Returns shown above the box are in the first quartile and returns shown below the box are in the fourth quartile. The percentage beaten numbers noted below each chart correspond to the percentile box and represent the percentage of funds in the Lipper peer group whose performance was equal to or lower than that of the class indicated.
VIP Aggressive Growth Portfolio
The Board reviewed the fund's relative investment performance against its Lipper peer group and stated that the performance of Initial Class of the fund was in the third quartile for the one- and five-year periods and the fourth quartile for the three-year period. The Board also stated that the relative investment performance of the fund was lower than its benchmark for all the periods shown. The Board considered that the variations in performance among the fund's classes reflect the variations in class expenses, which result in lower performance for higher expense classes. The Board discussed with FMR actions to be taken by FMR to improve the fund's disappointing performance. The Board also reviewed the fund's relative investment performance against a peer group defined by Morningstar. The Board will continue to closely monitor the performance of the fund in the coming year.
The Board considered that FMR has taken steps to refocus and strengthen equity research, equity portfolio management, and compliance. The Board noted with favor FMR's reorganization of its senior management team in 2005 and FMR's dedication of additional resources to investment research, and participated in the process that led to those changes.
Based on its review, and giving particular weight to the nature and quality of the resources dedicated by the Investment Advisers to maintain and improve relative performance, the Board concluded that the nature, extent, and quality of the services provided to the fund will benefit the fund's shareholders, particularly in light of the Board's view that the fund's shareholders benefit from investing in a fund that is part of a large family of funds offering a variety of investment disciplines and services.
Competitiveness of Management Fee and Total Fund Expenses. The Board considered the fund's management fee and total expenses compared to "mapped groups" of competitive funds and classes. Fidelity creates "mapped groups" by combining similar Lipper investment objective categories that have comparable management fee characteristics. Combining Lipper investment objective categories aids the Board's management fee and total expense comparisons by broadening the competitive group used for comparison and by reducing the number of universes to which various Fidelity funds are compared.
VIP Aggressive Growth Portfolio
The Board considered two proprietary management fee comparisons for the 12-month periods shown in the chart below. The group of Lipper funds used by the Board for management fee comparisons is referred to below as the "Total Mapped Group" and, for the reasons explained above, is broader than the Lipper peer group used by the Board for performance comparisons. The Total Mapped Group comparison focuses on a fund's standing relative to the total universe of comparable funds available to investors, in terms of gross management fees before expense reimbursements or caps. "TMG %" represents the percentage of funds in the Total Mapped Group that had management fees that were lower than the fund's. For example, a TMG % of 11% means that 89% of the funds in the Total Mapped Group had higher management fees than the fund. The "Asset-Size Peer Group" (ASPG) comparison focuses on a fund's standing relative to non-Fidelity funds similar in size to the fund within the Total Mapped Group. The ASPG represents at least 15% of the funds in the Total Mapped Group with comparable asset size and management fee characteristics, subject to a minimum of 50 funds (or all funds in the Total Mapped Group if fewer than 50). Additional information, such as the ASPG quartile in which the fund's management fee ranked, is also included in the chart and considered by the Board.
VIP Aggressive Growth Portfolio
The Board noted that the fund's management fee ranked below the median of its Total Mapped Group and below the median of its ASPG for 2005.
Based on its review, the Board concluded that the fund's management fee was fair and reasonable in light of the services that the fund receives and the other factors considered.
In its review of each class's total expenses, the Board considered the fund's management fee as well as other fund or class expenses, as applicable, such as transfer agent fees, pricing and bookkeeping fees, fund-paid 12b-1 fees, and custodial, legal, and audit fees. The Board also noted the effects of any waivers and reimbursements on fees and expenses. As part of its review, the Board also considered current and historical total expenses of each class of the fund compared to competitive fund median expenses. Each class of the fund is compared to those funds and classes in the Total Mapped Group (used by the Board for management fee comparisons) that have a similar sales load structure.
The Board noted that the total expenses of Initial Class ranked below its competitive median for 2005, and the total expenses of each of Investor Class, Service Class, and Service Class 2 ranked above its competitive median for 2005. The Board noted that the fund offers multiple classes, each of which has a different 12b-1 fee structure, and that the multiple structures are intended to offer a range of pricing options for the intermediary market. The Board also noted that the total expenses of the classes vary primarily by the level of their 12b-1 fees, although differences in transfer agent fees may also cause expenses to vary from class to class. The Board considered that Investor Class was above median primarily due to its higher transfer agent fee.
In its review of total expenses, the Board also considered Fidelity fee structures and other information on clients that FMR and its affiliates service in other competitive markets, such as other mutual funds advised or subadvised by FMR or its affiliates, pension plan clients, and other institutional clients.
Based on its review, the Board concluded that the total expenses of each class of the fund were reasonable, although in some cases above the median of the universe presented for comparison, in light of the services that the fund and its shareholders receive and the other factors considered.
Annual Report
Board Approval of Investment Advisory Contracts and Management Fees - continued
Costs of the Services and Profitability. The Board considered the revenues earned and the expenses incurred by Fidelity in conducting the business of developing, marketing, distributing, managing, administering and servicing the fund and its shareholders. The Board also considered the level of Fidelity's profits in respect of all the Fidelity funds.
On an annual basis, FMR presents to the Board Fidelity's profitability for the fund. Fidelity calculates the profitability for each fund, as well as aggregate profitability for groups of Fidelity funds and all Fidelity funds, using a series of detailed revenue and cost allocation methodologies which originate with the audited books and records of Fidelity. The Audit Committee of the Board reviews any significant changes from the prior year's methodologies.
PricewaterhouseCoopers LLP (PwC), independent registered accounting firm and auditor to Fidelity and certain Fidelity funds, has been engaged annually by the Board as part of the Board's assessment of the results of Fidelity's profitability analysis. PwC's engagement includes the review and assessment of Fidelity's methodologies used in determining the revenues and expenses attributable to Fidelity's mutual fund business, and completion of agreed-upon procedures surrounding the mathematical accuracy of fund profitability and its conformity to allocation methodologies. After considering PwC's reports issued under the engagement and information provided by Fidelity, the Board believes that while other allocation methods may also be reasonable, Fidelity's profitability methodologies are reasonable in all material respects.
The Board has also reviewed Fidelity's non-fund businesses and any fall-out benefits related to the mutual fund business as well as cases where Fidelity's affiliates may benefit from or be related to the fund's business.
The Board considered the costs of the services provided by and the profits realized by Fidelity in connection with the operation of the fund and determined that the amount of profit is a fair entrepreneurial profit for the management of the fund.
Economies of Scale. The Board considered whether there have been economies of scale in respect of the management of the Fidelity funds, whether the Fidelity funds (including the fund) have appropriately benefited from any such economies of scale, and whether there is potential for realization of any further economies of scale. The Board considered the extent to which the fund will benefit from economies of scale through increased services to the fund, through waivers or reimbursements, or through fee or expense reductions.
The Board recognized that the fund's management contract incorporates a "group fee" structure, which provides for lower fee rates as total fund assets under FMR's management increase, and for higher fee rates as total fund assets under FMR's management decrease. The Board considered that the group fee is designed to deliver the benefits of economies of scale to fund shareholders when total fund assets increase, even if assets of any particular fund are unchanged or have declined, because some portion of Fidelity's costs are attributable to services provided to all Fidelity funds, and all funds benefit if those costs can be allocated among more assets. The Board concluded that, given the group fee structure, fund shareholders will achieve a certain level of economies of scale as assets under FMR's management increase at the fund complex level, regardless of whether Fidelity achieves any such economies of scale.
The Board further concluded that any potential economies of scale are being shared between fund shareholders and Fidelity in an appropriate manner.
Additional Information Requested by the Board. In order to develop fully the factual basis for consideration of the Advisory Contracts, the Board requested additional information on several topics, including (i) Fidelity's fund profitability methodology and profitability trends within certain funds; (ii) portfolio manager compensation; (iii) the extent to which any economies of scale exist and are shared between the funds and Fidelity; (iv) the total expenses of certain funds and classes relative to competitors, including the extent to which the expenses of certain funds have been or could be capped; (v) fund performance trends; and (vi) Fidelity's fee structures, including use of performance fees.
Based on its evaluation of all of the conclusions noted above, and after considering all material factors, the Board ultimately concluded that the advisory fee structures are fair and reasonable, and that the fund's Advisory Contracts should be renewed.
VIP Aggressive Growth Portfolio
Annual Report
Investment Adviser
Fidelity Management & Research Company Boston, MA
Investment Sub-Advisers
FMR Co., Inc.
Fidelity Management & Research (U.K.) Inc.
Fidelity Research & Analysis Company (formerly Fidelity Management & Research (Far East) Inc.)
Fidelity Investments Japan Limited
Fidelity International Investment Advisors
Fidelity International Investment Advisors (U.K.) Limited
General Distributor
Fidelity Distributors Corporation Boston, MA
Transfer and Service Agents
Fidelity Investments Institutional Operations Company, Inc. Boston, MA
To view a fund's proxy voting guidelines and proxy voting record for the 12-month period ended June 30, visit www.fidelity.com/proxyvotingresults or visit the Securities and Exchange Commission's (SEC) web site at www.sec.gov. You may also call 1-877-208-0098 to request a free copy of the proxy voting guidelines.
Fidelity Variable Insurance Products are separate account options which are purchased through a variable insurance contract.
Standard & Poor's, S&P and S&P 500 are registered service marks of The McGraw-Hill Companies, Inc. and have been licensed for use by Fidelity Distributors Corporation.
Other third party marks appearing herein are the property of their respective owners.
All other marks appearing herein are registered or unregistered trademarks or service marks of FMR Corp. or an affiliated company.
This report and the financial statements contained herein are submitted for the general information of the shareholders of the fund. This report is not authorized for distribution to prospective investors in the fund unless preceded or accompanied by an effective prospectus.
A fund files its complete schedule of portfolio holdings with the SEC for the first and third quarters of each fiscal year on Form N-Q. Forms N-Q are available on the SEC's web site at http://www.sec.gov. A fund's Forms N-Q may be reviewed and copied at the SEC's Public Reference Room in Washington, DC. Information regarding the operation of the SEC's Public Reference Room may be obtained by calling 1-800-SEC-0330. For a complete list of a fund's portfolio holdings, view the most recent quarterly holdings report, semiannual report, or annual report on Fidelity's web site at http://www.advisor.fidelity.com.
NOT FDIC INSURED· MAY LOSE VALUE· NO BANK GUARANTEE
Neither the fund nor Fidelity Distributors Corporation is a bank.
Semiannual Report
Note to Shareholders:
On June 23, 2006, Fidelity changed its investment approach for managing the investment-grade bond portion of Fidelity® VIP Balanced Portfolio. Rather than investing solely in individual investment-grade debt securities, the fund now invests nearly all of its assets in the investment-grade sector through its investment in a central fund. Central funds are mutual funds used by this fund and other Fidelity funds as an investment vehicle to gain pooled exposure to a particular market sector - in this case, investment-grade debt. Instead of multiple funds each investing in investment-grade debt securities individually, they can now take advantage of consolidating investments in a single, larger pool of investment-grade debt securities by investing directly in central funds. Shares of the central funds are offered only to other Fidelity mutual funds and accounts; investors cannot directly invest in them. It's important to point out that this change in investment structure does not impact the fund's investment objective or risk profile, only the mechanics of how we manage its investment-grade bond portfolio.
The new approach, though, does change the way this annual report presents the fund's holdings. The Investments section continues to list direct investments of the fund, including each central fund. However, the individual investment-grade debt securities and other investments - - such as swap agreements - held by the fund on June 23 were transferred to VIP Investment Grade Central Fund, so they are no longer directly held and thus not listed. Information on the underlying holdings of the fixed-income central funds is available at advisor.fidelity.com, and the financial statements are available upon request.
If you have any questions, please call Fidelity or the insurance company that issued your policy.
Annual Report
VIP Balanced Portfolio
Performance: The Bottom Line
Average annual total return reflects the change in the value of an investment, assuming reinvestment of the class' dividend income and capital gains (the profits earned upon the sale of securities that have grown in value) and assuming a constant rate of performance each year. During periods of reimbursement by Fidelity, a fund's total return will be greater than it would be had the reimbursement not occurred. Performance numbers are net of all underlying fund operating expenses, but do not include any insurance charges imposed by your insurance company's separate account. If performance information included the effect of these additional charges, the total returns would have been lower. How a fund did yesterday is no guarantee of how it will do tomorrow.
Average Annual Total Returns
Periods ended December 31, 2006
Past 1 year
Past 5 years
Past 10 years
VIP Balanced - Initial Class
11.78%
6.03%
6.61%
VIP Balanced - Service Class A
11.64%
5.92%
6.49%
VIP Balanced - Service Class 2 B
11.50%
5.75%
6.38%
VIP Balanced - Investor Class C
11.56%
5.97%
6.58%
A The initial offering of Service Class shares took place on November 3, 1997. Performance for Service Class shares reflects an asset-based service fee (12b-1 fee), and returns prior to November 3, 1997 are those of Initial Class and do not include the effects of Service Class' 12b-1 fee. Had Service Class shares' 12b-1 fee been reflected, returns prior to November 3, 1997 would have been lower.
B The initial offering of Service Class 2 shares took place on January 12, 2000. Performance for Service Class 2 shares reflects an asset-based service fee (12b-1 fee). Returns from November 3, 1997 through January 12, 2000 are those of Service Class which reflects a different 12b-1 fee. Service Class 2 returns prior to November 3, 1997 are those of Initial Class, and do not include the effects of a 12b-1 fee. Had Service Class 2's 12b-1 fee been reflected, returns prior to January 12, 2000 would have been lower.
C The initial offering of Investor Class shares took place on July 21, 2005. Returns prior to July 21, 2005 are those of Initial Class. If Investor Class's transfer agent fee had been reflected, returns prior to July 21, 2005 would have been lower.
$10,000 Over 10 Years
Let's say hypothetically that $10,000 was invested in VIP Balanced Portfolio - Initial Class on December 31, 1996. The chart shows how the value of your investment would have changed, and also shows how the Standard & Poor's 500SM Index (S&P 500®)performed over the same period.
Annual Report
VIP Balanced Portfolio
Management's Discussion of Fund Performance
Comments from Larry Rakers and Ford O'Neil, Co-Portfolio Managers of VIP Balanced Portfolio
U.S. stock markets registered their fourth consecutive year of positive returns in 2006. Among the highlights were the performances of the Dow Jones Industrial AverageSM - a gauge of 30 mega-cap, blue-chip stocks - and the small-cap-oriented Russell 2000® Index, both of which reached new highs. The efforts of the Federal Reserve Board to contain inflation levels also dominated the investment headlines. In all, the Fed hiked short-term interest rates four times, but held rates steady after its June 29 increase, finally pausing after 17 rate hikes over a two-year period. A slowing residential housing market and moderating oil prices - the latter of which hit a record closing high of $77 per barrel in July before falling sharply - also held economic growth in check. For the year overall, the Standard & Poor's 500SM Index was up 15.79%, the Dow advanced 19.05%, the Russell 2000 Index gained 18.37% and the NASDAQ Composite® Index rose 10.39%.
During the year, the fund did slightly better than the 11.12% return of the Fidelity Balanced 60/40 Composite Index. (For specific portfolio performance results, please refer to the performance section of this report.) The fund's equity and fixed-income holdings once again outperformed their respective components in the Fidelity Balanced Composite index, and we remained overweighted in stocks and underweighted in investment grade bonds, which helped performance. Versus the S&P 500®, which accounts for 60% of the Composite benchmark, stock selection was especially helpful in information technology and materials, while our picks in energy and financials held back the fund's gains. In the fixed-income subportfolio, our results versus the Lehman Brothers® Aggregate Bond Index, which makes up the other 40% of the Composite index, were helped by both the fund's investment-grade holdings and a small stake in high-yield bonds. The top two equity contributors were semiconductor stocks. A negligible position in poorly performing index component Intel and an overweighted stake in Freescale Semiconductor, which was acquired during the period, boosted our results. Other contributors included Canadian nickel miner Falconbridge, another takeover target, and video game maker Nintendo. On the negative side, not owning major index component Exxon Mobil held back our results because the stock beat the S&P 500. Drilling rig parts manufacturer National-Oilwell Varco further undermined the fund's performance, as did reinsurance provider Scottish Re Group. Among our investment-grade fixed-income holdings, security selection in the corporate sector - particularly within industrials - provided the biggest boost versus the Lehman Brothers index. Secondarily, sector selection had a positive impact, fueled by an emphasis on high-quality, higher-yielding securitized products such as asset-backed securities and collateralized mortgage obligations. Our yield-curve positioning aided performance as well. Conversely, a small stake in Treasury Inflation-Protected Securities - which performed poorly and are not included in the index - curbed the subportfolio's gains. As I mentioned six months ago, in late June I began using a new structure to manage the fund's investment-grade bond assets. This structure uses VIP Investment Grade Central Fund - a mutual fund shared by this and other VIP Portfolios - as a vehicle to invest in this particular sector of the bond market, rather than holding individual securities directly.
The views expressed above reflect those of the portfolio manager(s) only through the end of the period as stated on the cover of this report and do not necessarily represent the views of Fidelity or any other person in the Fidelity organization. Any such views are subject to change at any time based upon market or other conditions and Fidelity disclaims any responsibility to update such views. These views may not be relied on as investment advice and, because investment decisions for a Fidelity fund are based on numerous factors, may not be relied on as an indication of trading intent on behalf of any Fidelity fund.
Annual Report
VIP Balanced Portfolio
Shareholder Expense Example
As a shareholder of the Fund, you incur two types of costs: (1) transaction costs, and (2) ongoing costs, including management fees, distribution and/or service (12b-1) fees and other Fund expenses. This Example is intended to help you understand your ongoing costs (in dollars) of investing in the Fund and to compare these costs with the ongoing costs of investing in other mutual funds.
The Example is based on an investment of $1,000 invested at the beginning of the period and held for the entire period (July 1, 2006 to December 31, 2006).
Actual Expenses
The first line of the accompanying table for each class of the Fund provides information about actual account values and actual expenses. You may use the information in this line, together with the amount you invested, to estimate the expenses that you paid over the period. Simply divide your account value by $1,000.00 (for example, an $8,600 account value divided by $1,000.00 = 8.6), then multiply the result by the number in the first line for a class of the Fund under the heading entitled "Expenses Paid During Period" to estimate the expenses you paid on your account during this period. The estimate of expenses does not include any fees or other expenses of any variable annuity or variable life insurance product. If they were, the estimate of expenses you paid during the period would be higher, and your ending account value would be lower. In addition, the Fund, as a shareholder in the underlying Fidelity Central Funds, will indirectly bear its pro rata share of the fees and expenses incurred by the underlying Fidelity Central Funds. These fees and expenses are not included in the Fund's annualized expense ratio used to calculate the expense estimate in the table below.
Hypothetical Example for Comparison Purposes
The second line of the accompanying table for each class of the Fund provides information about hypothetical account values and hypothetical expenses based on a Class' actual expense ratio and an assumed rate of return of 5% per year before expenses, which is not the Class' actual return. The hypothetical account values and expenses may not be used to estimate the actual ending account balance or expenses you paid for the period. You may use this information to compare the ongoing costs of investing in the Fund and other funds. To do so, compare this 5% hypothetical example with the 5% hypothetical examples that appear in the shareholder reports of the other funds. The estimate of expenses does not include any fees or other expenses of any variable annuity or variable life insurance product. If they were, the estimate of expenses you paid during the period would be higher, and your ending account value would be lower. In addition, the Fund, as a shareholder in the underlying Fidelity Central Funds, will indirectly bear its pro rata share of the fees and expenses incurred by the underlying Fidelity Central Funds. These fees and expenses are not included in the Fund's annualized expense ratio used to calculate the expense estimate in the table below.
Please note that the expenses shown in the table are meant to highlight your ongoing costs only and do not reflect any transaction costs. Therefore, the second line of the table is useful in comparing ongoing costs only, and will not help you determine the relative total costs of owning different funds.
Beginning Account Value July 1, 2006
Ending Account Value December 31, 2006
Expenses Paid During Period* July 1, 2006 to December 31, 2006
Initial Class
Actual
$ 1,000.00
$ 1,083.90
$ 3.20
HypotheticalA
$ 1,000.00
$ 1,022.13
$ 3.11
Service Class
Actual
$ 1,000.00
$ 1,082.10
$ 3.78
HypotheticalA
$ 1,000.00
$ 1,021.58
$ 3.67
Service Class 2
Actual
$ 1,000.00
$ 1,081.90
$ 4.57
HypotheticalA
$ 1,000.00
$ 1,020.82
$ 4.43
Investor Class
Actual
$ 1,000.00
$ 1,082.60
$ 3.83
HypotheticalA
$ 1,000.00
$ 1,021.53
$ 3.72
A5% return per year before expenses
* Expenses are equal to each Class' annualized expense ratio (shown in the table below); multiplied by the average account value over the period, multiplied by 184/365 (to reflect the one-half year period). The fees and expenses of the underlying Fidelity Central Funds in which the Fund invests are not included in the Fund's annualized expense ratio.
Annualized Expense Ratio
Initial Class
.61%
Service Class
.72%
Service Class 2
.87%
Investor Class
.73%
Annual Report
VIP Balanced Portfolio
Investment Changes
Top Five Stocks as of December 31, 2006
% of fund's net assets
% of fund's net assets 6 months ago
National Oilwell Varco, Inc.
1.7
1.8
General Electric Co.
1.1
1.3
Altria Group, Inc.
1.1
1.0
JPMorgan Chase & Co.
1.1
1.0
Bank of America Corp.
1.0
1.0
6.0
Top Five Bond Issuers as of December 31, 2006
(with maturities greater than one year)
% of fund's net assets
% of fund's net assets 6 months ago
Fannie Mae
8.0
9.2
U.S. Treasury Obligations
4.6
6.3
Freddie Mac
2.0
1.4
Government National Mortgage Association
0.7
0.2
CS First Boston Mortgage Backed Securities Trust
0.3
0.2
15.6
Top Five Market Sectors as of December 31, 2006
% of fund's net assets
% of fund's net assets 6 months ago
Financials
17.5
15.5
Information Technology
9.3
9.9
Energy
8.4
8.7
Industrials
8.3
8.9
Consumer Discretionary
6.8
6.5
Asset Allocation (% of fund's net assets)
As of December 31, 2006*
As of June 30, 2006**
Stocks 64.1%
Stocks 65.3%
Bonds 32.6%
Bonds 30.4%
Short-Term Investments and Net Other Assets 3.3%
Short-Term Investments and Net Other Assets 4.3%
* Foreign investments
10.8%
** Foreign investments
10.8%
Percentages are adjusted for the effect of futures contracts and swaps, if applicable.
The information in the above tables is based on the combined investments of the fund and its pro-rata share of the investments of Fidelity's fixed-income central funds.
For an unaudited list of holdings for each fixed-income central fund, visit advisor.fidelity.com.
Annual Report
VIP Balanced Portfolio
Investments December 31, 2006
Showing Percentage of Net Assets
Common Stocks - 64.0%
Shares
Value (Note 1)
CONSUMER DISCRETIONARY - 6.0%
Auto Components - 0.1%
American Axle & Manufacturing Holdings, Inc.
2,800
$ 53,172
Gentex Corp.
17,500
272,300
325,472
Automobiles - 0.1%
Coachmen Industries, Inc.
13,100
144,100
DaimlerChrysler AG
1,700
104,397
Renault SA
1,100
132,152
380,649
Diversified Consumer Services - 0.2%
Apollo Group, Inc. Class A (a)
10,700
416,979
Carriage Services, Inc. Class A
12,700
64,643
Service Corp. International
35,900
367,975
Weight Watchers International, Inc.
1,200
63,036
912,633
Hotels, Restaurants & Leisure - 1.0%
Aristocrat Leisure Ltd.
5,300
66,523
Carnival Corp. unit
6,500
318,825
Gaylord Entertainment Co. (a)
6,000
305,580
Greek Organization of Football Prognostics SA
7,300
282,185
McDonald's Corp.
34,700
1,538,251
OSI Restaurant Partners, Inc.
8,800
344,960
Royal Caribbean Cruises Ltd.
10,300
426,214
Six Flags, Inc.
4,200
22,008
Vail Resorts, Inc. (a)
6,300
282,366
WMS Industries, Inc. (a)
14,000
488,040
Yum! Brands, Inc.
5,200
305,760
4,380,712
Household Durables - 0.8%
Champion Enterprises, Inc. (a)
11,300
105,768
Cyrela Brazil Realty SA
42,000
400,047
D.R. Horton, Inc.
8,100
214,569
Fortune Brands, Inc.
1,800
153,702
Furniture Brands International, Inc.
8,500
137,955
Interface, Inc. Class A (a)
20,125
286,178
La-Z-Boy, Inc. (e)
18,400
218,408
Leggett & Platt, Inc.
14,459
345,570
Sealy Corp., Inc.
6,900
101,775
Snap-On, Inc.
1,300
61,932
Sony Corp. sponsored ADR
10,900
466,847
Standard Pacific Corp.
7,100
190,209
The Stanley Works
6,500
326,885
Whirlpool Corp.
7,200
597,744
3,607,589
Shares
Value (Note 1)
Leisure Equipment & Products - 0.1%
Eastman Kodak Co.
12,400
$ 319,920
MarineMax, Inc. (a)
10,654
276,258
596,178
Media - 1.8%
Clear Channel Outdoor Holding, Inc. Class A (a)
14,242
397,494
DreamWorks Animation SKG, Inc. Class A (a)
9,000
265,410
EchoStar Communications Corp. Class A (a)
9,342
355,276
Grupo Televisa SA de CV (CPO) sponsored ADR
6,700
180,967
Lamar Advertising Co. Class A (a)
9,800
640,822
Liberty Global, Inc.:
Class A (a)
10,500
306,075
Class C (a)
900
25,200
Live Nation, Inc. (a)
55,020
1,232,448
McGraw-Hill Companies, Inc.
5,400
367,308
Naspers Ltd. Class N sponsored ADR
8,700
208,539
News Corp. Class A
9,000
193,320
NTL, Inc.
22,813
575,800
Omnicom Group, Inc.
2,800
292,712
R.H. Donnelley Corp.
4,600
288,558
Radio One, Inc. Class D (non-vtg.) (a)
9,900
66,726
Salem Communications Corp. Class A
3,091
36,937
Time Warner, Inc.
108,300
2,358,774
Viacom, Inc. Class B (non-vtg.) (a)
5,500
225,665
8,018,031
Multiline Retail - 0.7%
Family Dollar Stores, Inc.
20,800
610,064
Federated Department Stores, Inc.
14,700
560,511
Fred's, Inc. Class A
19,500
234,780
JCPenney Co., Inc.
5,000
386,800
Saks, Inc.
9,000
160,380
Sears Holdings Corp. (a)
3,400
570,962
Target Corp.
4,100
233,905
Tuesday Morning Corp.
15,986
248,582
3,005,984
Specialty Retail - 1.1%
Aeropostale, Inc. (a)
8,200
253,134
Best Buy Co., Inc.
3,950
194,301
DCM Japan Holdings Co. Ltd. (a)
25,200
259,303
Eddie Bauer Holdings, Inc. (a)
14,500
131,370
Gamestop Corp. Class B (a)
11,700
640,692
Hibbett Sporting Goods, Inc. (a)
6,200
189,286
Home Depot, Inc.
22,400
899,584
OfficeMax, Inc.
6,700
332,655
Pacific Sunwear of California, Inc. (a)
15,000
293,700
PETsMART, Inc.
13,300
383,838
RadioShack Corp.
17,800
298,684
Sally Beauty Holdings, Inc. (a)
10,520
82,056
Staples, Inc.
16,100
429,870
Common Stocks - continued
Shares
Value (Note 1)
CONSUMER DISCRETIONARY - continued
Specialty Retail - continued
TJX Companies, Inc.
9,400
$ 268,088
Williams-Sonoma, Inc.
2,200
69,168
4,725,729
Textiles, Apparel & Luxury Goods - 0.1%
Hanesbrands, Inc. (a)
1,300
30,706
NIKE, Inc. Class B
2,100
207,963
238,669
TOTAL CONSUMER DISCRETIONARY
26,191,646
CONSUMER STAPLES - 4.1%
Beverages - 0.2%
Anadolu Efes Biracilk Ve Malt Sanyii AS
3,000
92,723
Fomento Economico Mexicano SA de CV sponsored ADR
2,800
324,128
Pernod Ricard SA
200
45,943
Remy Cointreau SA
1,800
116,442
SABMiller PLC
13,800
317,579
896,815
Food & Staples Retailing - 0.9%
CVS Corp.
23,600
729,476
Kroger Co.
13,700
316,059
Rite Aid Corp.
58,800
319,872
Safeway, Inc.
16,500
570,240
Sysco Corp.
8,200
301,432
Wal-Mart de Mexico SA de CV Series V
54,100
238,163
Wal-Mart Stores, Inc.
27,400
1,265,332
Walgreen Co.
8,600
394,654
4,135,228
Food Products - 0.7%
Bunge Ltd.
5,000
362,550
Chiquita Brands International, Inc.
16,900
269,893
Corn Products International, Inc.
17,180
593,397
General Mills, Inc.
6,600
380,160
Global Bio-Chem Technology Group Co. Ltd.
290,000
97,682
Groupe Danone
100
15,156
Imperial Sugar Co.
300
7,263
Kellogg Co.
5,500
275,330
Koninklijke Numico NV
1,400
75,317
McCormick & Co., Inc. (non-vtg.)
1,700
65,552
Nestle SA (Reg.)
908
322,543
PAN Fish ASA (a)
15,000
13,713
Smithfield Foods, Inc. (a)
10,900
279,694
Tyson Foods, Inc. Class A
11,500
189,175
2,947,425
Household Products - 0.8%
Colgate-Palmolive Co.
10,800
704,592
Procter & Gamble Co.
47,240
3,036,115
3,740,707
Shares
Value (Note 1)
Personal Products - 0.4%
Alberto-Culver Co.
10,120
$ 217,074
Avon Products, Inc.
31,200
1,030,848
Playtex Products, Inc. (a)
22,700
326,653
1,574,575
Tobacco - 1.1%
Altria Group, Inc.
54,850
4,707,227
TOTAL CONSUMER STAPLES
18,001,977
ENERGY - 7.3%
Energy Equipment & Services - 4.5%
Baker Hughes, Inc.
11,400
851,124
BJ Services Co.
12,300
360,636
Cameron International Corp. (a)
12,600
668,430
Global Industries Ltd. (a)
11,000
143,440
GlobalSantaFe Corp.
7,000
411,460
Halliburton Co.
73,300
2,275,965
Input/Output, Inc. (a)
900
12,267
Nabors Industries Ltd. (a)
10,300
306,734
National Oilwell Varco, Inc. (a)
119,900
7,335,468
Noble Corp.
6,600
502,590
Pride International, Inc. (a)
109,300
3,280,093
Schlumberger Ltd. (NY Shares)
1,300
82,108
Smith International, Inc.
23,400
961,038
Superior Energy Services, Inc. (a)
6,300
205,884
Transocean, Inc. (a)
4,800
388,272
W-H Energy Services, Inc. (a)
5,600
272,664
Weatherford International Ltd. (a)
41,900
1,751,001
Willbros Group, Inc. (a)(e)
3,000
56,700
19,865,874
Oil, Gas & Consumable Fuels - 2.8%
Alpha Natural Resources, Inc. (a)
9,300
132,339
Aurora Oil & Gas Corp. (a)
96,913
311,091
Cabot Oil & Gas Corp.
5,500
333,575
Cameco Corp.
300
12,144
Chesapeake Energy Corp.
17,300
502,565
China Coal Energy Co. Ltd. (H Shares)
18,000
11,686
Ellora Energy, Inc. (a)(f)
30,267
363,204
EnCana Corp.
1,800
82,837
Energy Partners Ltd. (a)
8,400
205,128
EOG Resources, Inc.
7,200
449,640
Evergreen Energy, Inc. (a)(e)
16,500
164,175
Foundation Coal Holdings, Inc.
9,100
289,016
Goodrich Petroleum Corp.
5,200
188,136
Helix Energy Solutions Group, Inc. (a)
7,900
247,823
International Coal Group, Inc. (a)
16,700
91,015
Mariner Energy, Inc. (a)
3,100
60,760
Massey Energy Co.
9,400
218,362
Noble Energy, Inc.
3,200
157,024
OMI Corp.
9,600
203,232
Petroleum Development Corp. (a)
4,400
189,420
Petroplus Holdings AG
5,300
321,752
Common Stocks - continued
Shares
Value (Note 1)
ENERGY - continued
Oil, Gas & Consumable Fuels - continued
Plains Exploration & Production Co. (a)
8,400
$ 399,252
Quicksilver Resources, Inc. (a)
14,500
530,555
Range Resources Corp.
22,950
630,207
Southwestern Energy Co. (a)
15,200
532,760
SXR Uranium One, Inc. (a)
36,400
499,485
Teekay Offshore Partners LP (a)
700
18,452
Tesoro Corp.
1,900
124,963
Ultra Petroleum Corp. (a)
7,700
367,675
Valero Energy Corp.
84,197
4,307,519
Williams Companies, Inc.
10,000
261,200
12,206,992
TOTAL ENERGY
32,072,866
FINANCIALS - 14.3%
Capital Markets - 1.9%
American Capital Strategies Ltd.
10,200
471,852
Ameriprise Financial, Inc.
1,980
107,910
Bank of New York Co., Inc.
20,900
822,833
Charles Schwab Corp.
1,400
27,076
Cowen Group, Inc.
12,760
269,874
E*TRADE Financial Corp.
42,100
943,882
Franklin Resources, Inc.
1,600
176,272
Goldman Sachs Group, Inc.
2,400
478,440
Investors Financial Services Corp.
4,753
202,811
Lazard Ltd. Class A
14,800
700,632
Lehman Brothers Holdings, Inc.
5,000
390,600
Mellon Financial Corp.
5,200
219,180
Merrill Lynch & Co., Inc.
20,900
1,945,790
Northern Trust Corp.
5,600
339,864
State Street Corp.
7,500
505,800
TD Ameritrade Holding Corp.
800
12,944
Thomas Weisel Partners Group, Inc.
10,938
230,792
UBS AG (Reg.)
8,243
497,300
8,343,852
Commercial Banks - 2.5%
ABN-AMRO Holding NV sponsored ADR
11,000
352,550
Aozora Bank Ltd.
13,000
50,559
Banco Bilbao Vizcaya Argentaria SA sponsored ADR
23,300
560,598
Banco Nossa Caixa SA
13,900
319,964
Bank of Baroda
2,672
15,905
Barclays PLC
2,700
39,245
Boston Private Financial Holdings, Inc.
8,000
225,680
Colonial Bancgroup, Inc.
17,300
445,302
Erste Bank AG
400
30,681
Hanmi Financial Corp.
13,300
299,649
Industrial & Commercial Bank of China
198,000
122,950
Nara Bancorp, Inc.
8,700
182,004
National Australia Bank Ltd.
13,010
414,369
Shares
Value (Note 1)
PNC Financial Services Group, Inc.
13,200
$ 977,328
R&G Financial Corp. Class B
29,900
228,735
Societe Generale Series A
1,910
324,275
SVB Financial Group (a)
3,600
167,832
Synovus Financial Corp.
10,200
314,466
UCBH Holdings, Inc.
31,900
560,164
Uniao de Bancos Brasileiros SA (Unibanco) GDR
1,600
148,736
Unicredito Italiano Spa
39,100
342,756
UnionBanCal Corp.
500
30,625
Wachovia Corp.
43,627
2,484,558
Wells Fargo & Co.
56,100
1,994,916
Wilshire Bancorp, Inc.
14,500
275,065
Wintrust Financial Corp.
3,800
182,476
Zions Bancorp
400
32,976
11,124,364
Consumer Finance - 0.5%
Aiful Corp.
2,700
75,976
American Express Co.
9,700
588,499
Capital One Financial Corp. (e)
10,400
798,928
ORIX Corp.
990
286,480
SLM Corp.
7,900
385,283
2,135,166
Diversified Financial Services - 3.1%
Bank of America Corp.
83,605
4,463,671
Citigroup, Inc.
51,600
2,874,120
FirstRand Ltd.
52,100
165,090
JPMorgan Chase & Co.
96,000
4,636,800
Kotak Mahindra Bank Ltd. sponsored GDR (f)
10,283
92,886
Moody's Corp.
2,500
172,650
PICO Holdings, Inc. (a)
1,388
48,261
PICO Holdings, Inc. (a)(i)
40,108
1,394,555
13,848,033
Insurance - 3.1%
ACE Ltd.
20,300
1,229,571
AFLAC, Inc.
12,800
588,800
American International Group, Inc.
58,350
4,181,361
Aspen Insurance Holdings Ltd.
20,100
529,836
Axis Capital Holdings Ltd.
3,300
110,121
Endurance Specialty Holdings Ltd.
5,600
204,848
Fidelity National Financial, Inc. Class A
8,800
210,144
First Mercury Financial Corp.
900
21,168
Hartford Financial Services Group, Inc.
10,900
1,017,079
IPC Holdings Ltd.
6,200
194,990
MBIA, Inc.
2,200
160,732
MetLife, Inc.
12,800
755,328
Montpelier Re Holdings Ltd.
12,400
230,764
Navigators Group, Inc. (a)
3,500
168,630
PartnerRe Ltd.
6,800
483,004
Platinum Underwriters Holdings Ltd.
8,600
266,084
Prudential Financial, Inc.
5,900
506,574
PXRE Group Ltd.
19,800
91,278
Common Stocks - continued
Shares
Value (Note 1)
FINANCIALS - continued
Insurance - continued
Scottish Re Group Ltd.
52,300
$ 279,282
T&D Holdings, Inc.
6,850
452,831
The St. Paul Travelers Companies, Inc.
15,249
818,719
Universal American Financial Corp. (a)
16,400
305,696
USI Holdings Corp. (a)
13,700
210,432
XL Capital Ltd. Class A
5,700
410,514
13,427,786
Real Estate Investment Trusts - 1.7%
Alexandria Real Estate Equities, Inc.
1,900
190,760
Annaly Capital Management, Inc.
39,000
542,490
BioMed Realty Trust, Inc.
3,600
102,960
Brandywine Realty Trust (SBI)
1,800
59,850
CapitalSource, Inc.
10,800
294,948
CBL & Associates Properties, Inc.
4,200
182,070
CBRE Realty Finance, Inc.
5,500
86,405
Columbia Equity Trust, Inc.
4,600
87,906
Developers Diversified Realty Corp.
12,400
780,580
Douglas Emmett, Inc.
2,500
66,475
Duke Realty LP
9,500
388,550
Education Realty Trust, Inc.
4,406
65,077
Equity Lifestyle Properties, Inc.
900
48,987
Equity Office Properties Trust
18,700
900,779
Equity One, Inc.
6,300
167,958
Equity Residential (SBI)
3,400
172,550
General Growth Properties, Inc.
7,900
412,617
Health Care Property Investors, Inc.
2,400
88,368
Highwoods Properties, Inc. (SBI)
2,300
93,748
HomeBanc Mortgage Corp., Georgia
17,300
73,179
Host Hotels & Resorts, Inc.
14,277
350,500
Pennsylvania (REIT) (SBI)
3,600
141,768
Potlatch Corp.
1,600
70,112
Public Storage, Inc.
1,800
175,500
Ramco-Gershenson Properties Trust (SBI)
2,100
80,094
Spirit Finance Corp.
4,500
56,115
Tanger Factory Outlet Centers, Inc.
1,500
58,620
United Dominion Realty Trust, Inc. (SBI)
25,900
823,361
Ventas, Inc.
4,800
203,136
Vornado Realty Trust
4,500
546,750
7,312,213
Real Estate Management & Development - 0.1%
Mitsubishi Estate Co. Ltd.
8,000
206,972
Mitsui Fudosan Co. Ltd.
11,000
268,417
475,389
Thrifts & Mortgage Finance - 1.4%
Countrywide Financial Corp.
23,100
980,595
Doral Financial Corp.
4,200
12,054
Fannie Mae
27,500
1,633,225
Freddie Mac
23,900
1,622,810
Hudson City Bancorp, Inc.
41,700
578,796
Shares
Value (Note 1)
MGIC Investment Corp.
3,900
$ 243,906
NetBank, Inc.
73,700
341,968
NewAlliance Bancshares, Inc.
15,500
254,200
Radian Group, Inc.
5,100
274,941
W Holding Co., Inc.
36,500
217,540
6,160,035
TOTAL FINANCIALS
62,826,838
HEALTH CARE - 6.4%
Biotechnology - 0.9%
Amgen, Inc. (a)
10,700
730,917
Biogen Idec, Inc. (a)
6,300
309,897
Cephalon, Inc. (a)
12,300
866,043
DUSA Pharmaceuticals, Inc. (a)
19,800
85,140
Genentech, Inc. (a)
3,700
300,181
Gilead Sciences, Inc. (a)
4,300
279,199
MannKind Corp. (a)
11,800
194,582
MedImmune, Inc. (a)
12,900
417,573
OSI Pharmaceuticals, Inc. (a)
10,700
374,286
PDL BioPharma, Inc. (a)
6,200
124,868
Solexa, Inc. (a)
12,826
168,662
Vertex Pharmaceuticals, Inc. (a)
4,200
157,164
4,008,512
Health Care Equipment & Supplies - 1.2%
Advanced Medical Optics, Inc. (a)
9,100
320,320
Alcon, Inc.
3,880
433,668
American Medical Systems Holdings, Inc. (a)
6,300
116,676
ArthroCare Corp. (a)
4,231
168,902
Aspect Medical Systems, Inc. (a)
14,700
276,507
Baxter International, Inc.
27,300
1,266,447
Becton, Dickinson & Co.
3,900
273,585
C.R. Bard, Inc.
7,600
630,572
Cooper Companies, Inc.
13,300
591,850
Dade Behring Holdings, Inc.
4,230
168,396
Hologic, Inc. (a)
400
18,912
Inverness Medical Innovations, Inc. (a)
9,300
359,910
Inverness Medical Innovations, Inc. (a)(i)
6,471
250,428
Respironics, Inc. (a)
8,400
317,100
5,193,273
Health Care Providers & Services - 1.8%
Acibadem Saglik Hizmetleri AS
21,000
225,503
Brookdale Senior Living, Inc.
6,600
316,800
Cardinal Health, Inc.
3,800
244,834
Caremark Rx, Inc.
7,200
411,192
Community Health Systems, Inc. (a)
3,700
135,124
DaVita, Inc. (a)
5,000
284,400
Health Net, Inc. (a)
19,100
929,406
Humana, Inc. (a)
4,314
238,607
McKesson Corp.
6,600
334,620
Medco Health Solutions, Inc. (a)
12,400
662,656
Common Stocks - continued
Shares
Value (Note 1)
HEALTH CARE - continued
Health Care Providers & Services - continued
Omnicare, Inc.
12,900
$ 498,327
Sierra Health Services, Inc. (a)
8,400
302,736
Sunrise Senior Living, Inc. (a)
9,000
276,480
United Surgical Partners International, Inc. (a)
13,300
377,055
UnitedHealth Group, Inc.
49,000
2,632,770
7,870,510
Health Care Technology - 0.3%
Cerner Corp. (a)
7,400
336,700
Eclipsys Corp. (a)
7,600
156,256
Emdeon Corp. (a)
34,800
431,172
IMS Health, Inc.
9,700
266,556
1,190,684
Life Sciences Tools & Services - 0.3%
Affymetrix, Inc. (a)
9,172
211,506
Charles River Laboratories International, Inc. (a)
16,700
722,275
Pharmaceutical Product Development, Inc.
4,500
144,990
Thermo Fisher Scientific, Inc. (a)
1,400
63,406
Varian, Inc. (a)
4,900
219,471
1,361,648
Pharmaceuticals - 1.9%
Atherogenics, Inc. (a)
10,800
107,028
Barr Pharmaceuticals, Inc. (a)
8,300
415,996
Endo Pharmaceuticals Holdings, Inc. (a)
10,842
299,022
Johnson & Johnson
34,100
2,251,282
Merck & Co., Inc.
40,700
1,774,520
MGI Pharma, Inc. (a)
19,961
367,482
New River Pharmaceuticals, Inc. (a)
10,400
568,984
Novartis AG sponsored ADR
13,200
758,208
Schering-Plough Corp.
13,400
316,776
Teva Pharmaceutical Industries Ltd. sponsored ADR
18,100
562,548
Wyeth
22,000
1,120,240
8,542,086
TOTAL HEALTH CARE
28,166,713
INDUSTRIALS - 7.6%
Aerospace & Defense - 1.3%
DRS Technologies, Inc.
7,900
416,172
DynCorp International, Inc. Class A
14,300
226,941
General Dynamics Corp.
14,000
1,040,900
Hexcel Corp. (a)
42,178
734,319
Honeywell International, Inc.
23,600
1,067,664
KBR, Inc.
5,100
133,416
Precision Castparts Corp.
4,550
356,174
Raytheon Co.
10,600
559,680
Raytheon Co. warrants 6/16/11 (a)
200
3,584
Shares
Value (Note 1)
Rockwell Collins, Inc.
6,300
$ 398,727
Spirit AeroSystems Holdings, Inc. Class A
5,900
197,473
Stanley, Inc.
800
13,528
United Technologies Corp.
11,500
718,980
5,867,558
Air Freight & Logistics - 0.4%
EGL, Inc. (a)
10,200
303,756
FedEx Corp.
2,700
293,274
Forward Air Corp.
3,700
107,041
United Parcel Service, Inc. Class B
7,500
562,350
UTI Worldwide, Inc.
10,600
316,940
1,583,361
Airlines - 0.3%
AirTran Holdings, Inc. (a)
60,300
707,922
Frontier Airlines Holdings, Inc. (a)(e)
66,100
489,140
TAM SA (PN) sponsored ADR (ltd. vtg.)
8,100
243,081
1,440,143
Building Products - 0.1%
Goodman Global, Inc.
6,995
120,314
Masco Corp.
16,200
483,894
604,208
Commercial Services & Supplies - 0.8%
Administaff, Inc.
4,900
209,573
Allied Waste Industries, Inc.
17,000
208,930
CDI Corp.
5,257
130,899
Cintas Corp.
8,300
329,593
Clean Harbors, Inc. (a)
12,900
624,489
Comsys IT Partners, Inc. (a)
437
8,832
Covanta Holding Corp. (a)
19,300
425,372
Diamond Management & Technology Consultants, Inc.
19,667
244,657
Kforce, Inc. (a)
15,588
189,706
The Brink's Co.
10,700
683,944
Waste Management, Inc.
12,100
444,917
3,500,912
Construction & Engineering - 1.2%
Chicago Bridge & Iron Co. NV (NY Shares)
35,300
965,102
Fluor Corp.
25,200
2,057,580
Foster Wheeler Ltd. (a)
2,400
132,336
Hyundai Engineering & Construction Co. Ltd. (a)
4,853
297,442
Infrasource Services, Inc. (a)
900
19,593
Shaw Group, Inc. (a)
40,600
1,360,100
Washington Group International, Inc.
7,728
462,057
5,294,210
Electrical Equipment - 0.1%
ABB Ltd. sponsored ADR
13,600
244,528
Cooper Industries Ltd. Class A
2,000
180,860
GrafTech International Ltd. (a)
12,300
85,116
510,504
Common Stocks - continued
Shares
Value (Note 1)
INDUSTRIALS - continued
Industrial Conglomerates - 1.6%
General Electric Co.
128,200
$ 4,770,322
McDermott International, Inc. (a)
11,100
564,546
Smiths Group PLC
1,669
32,410
Tyco International Ltd.
47,100
1,431,840
6,799,118
Machinery - 0.5%
Atlas Copco AB (B Shares)
10,400
337,263
Briggs & Stratton Corp.
8,500
229,075
Danaher Corp.
3,600
260,784
Deere & Co.
6,600
627,462
Flowserve Corp. (a)
3,900
196,833
Gardner Denver, Inc. (a)
5,100
190,281
Oshkosh Truck Co.
4,400
213,048
2,054,746
Marine - 0.3%
Alexander & Baldwin, Inc.
21,427
950,073
American Commercial Lines, Inc. (a)
3,000
196,530
1,146,603
Road & Rail - 0.6%
Burlington Northern Santa Fe Corp.
11,600
856,196
Canadian National Railway Co.
2,900
124,531
CSX Corp.
14,200
488,906
Laidlaw International, Inc.
32,100
976,803
Norfolk Southern Corp.
3,200
160,928
Universal Truckload Services, Inc. (a)
5,460
129,675
YRC Worldwide, Inc. (a)
2,000
75,460
2,812,499
Trading Companies & Distributors - 0.3%
UAP Holding Corp.
16,600
417,988
WESCO International, Inc. (a)
16,000
940,960
1,358,948
Transportation Infrastructure - 0.1%
Grupo Aeroportuario del Pacifico SA de CV sponsored ADR
9,100
356,629
TOTAL INDUSTRIALS
33,329,439
INFORMATION TECHNOLOGY - 9.0%
Communications Equipment - 1.0%
Adtran, Inc.
4,900
111,230
Alcatel-Lucent SA sponsored ADR
21,062
299,502
Andrew Corp. (a)
23,100
236,313
Blue Coat Systems, Inc. (a)
10,200
244,290
Comverse Technology, Inc. (a)
2,700
56,997
Dycom Industries, Inc. (a)
32,500
686,400
Harris Corp.
15,400
706,244
Juniper Networks, Inc. (a)
6,200
117,428
MasTec, Inc. (a)
34,200
394,668
Motorola, Inc.
31,200
641,472
Nortel Networks Corp. (a)
12,150
325,945
Shares
Value (Note 1)
Powerwave Technologies, Inc. (a)
10,700
$ 69,015
QUALCOMM, Inc.
8,500
321,215
4,210,719
Computers & Peripherals - 1.3%
Electronics for Imaging, Inc. (a)
15,000
398,700
Hewlett-Packard Co.
27,200
1,120,368
Hutchinson Technology, Inc. (a)
5,500
129,635
Imation Corp.
3,800
176,434
Intermec, Inc. (a)
13,454
326,529
International Business Machines Corp.
1,800
174,870
NCR Corp. (a)
17,000
726,920
Seagate Technology
92,327
2,446,666
Sun Microsystems, Inc. (a)
61,900
335,498
5,835,620
Electronic Equipment & Instruments - 1.2%
Agilent Technologies, Inc. (a)
18,200
634,270
Amphenol Corp. Class A
12,100
751,168
Avnet, Inc. (a)
14,600
372,738
CPI International, Inc.
2,100
31,500
Flextronics International Ltd. (a)
92,000
1,056,160
FLIR Systems, Inc. (a)
8,459
269,250
Ingram Micro, Inc. Class A (a)
25,700
524,537
Jabil Circuit, Inc.
6,100
149,755
Molex, Inc.
8,400
265,692
Solectron Corp. (a)
206,000
663,320
Symbol Technologies, Inc.
11,500
171,810
Tektronix, Inc.
11,600
338,372
5,228,572
Internet Software & Services - 0.5%
aQuantive, Inc. (a)
4,000
98,640
Google, Inc. Class A (sub. vtg.) (a)
2,560
1,178,829
ValueClick, Inc. (a)
5,400
127,602
VeriSign, Inc. (a)
8,500
204,425
Yahoo!, Inc. (a)
29,500
753,430
2,362,926
IT Services - 0.3%
First Data Corp.
14,000
357,280
Paychex, Inc.
6,500
257,010
Satyam Computer Services Ltd. sponsored ADR
12,600
302,526
SI International, Inc. (a)
3,400
110,228
The Western Union Co.
12,600
282,492
Unisys Corp. (a)
9,800
76,832
1,386,368
Office Electronics - 0.2%
Xerox Corp. (a)
44,700
757,665
Semiconductors & Semiconductor Equipment - 3.0%
Agere Systems, Inc. (a)
12,100
231,957
Altera Corp. (a)
7,500
147,600
AMIS Holdings, Inc. (a)
28,000
295,960
Analog Devices, Inc.
17,300
568,651
Applied Micro Circuits Corp. (a)
42,700
152,012
Common Stocks - continued
Shares
Value (Note 1)
INFORMATION TECHNOLOGY - continued
Semiconductors & Semiconductor Equipment - continued
ASAT Holdings Ltd. warrants 7/24/11 (a)
48
$ 230
ASML Holding NV (NY Shares) (a)
25,900
637,917
Atmel Corp. (a)
34,500
208,725
ATMI, Inc. (a)
23,043
703,503
Axcelis Technologies, Inc. (a)
68,500
399,355
Credence Systems Corp. (a)
62,057
322,696
Cymer, Inc. (a)
7,900
347,205
Cypress Semiconductor Corp. (a)
35,000
590,450
DSP Group, Inc. (a)
11,600
251,720
Entegris, Inc. (a)
15,600
168,792
Exar Corp. (a)
4,500
58,500
Fairchild Semiconductor International, Inc. (a)
42,800
719,468
Hittite Microwave Corp. (a)
8,860
286,355
Integrated Device Technology, Inc. (a)
26,600
411,768
Intel Corp.
20,200
409,050
Intersil Corp. Class A
35,500
849,160
Linear Technology Corp.
7,700
233,464
LTX Corp. (a)
56,000
313,600
Maxim Integrated Products, Inc.
19,000
581,780
Microchip Technology, Inc.
15,900
519,930
Microsemi Corp. (a)
13,000
255,450
National Semiconductor Corp.
44,000
998,800
PMC-Sierra, Inc. (a)
20,200
135,542
Renewable Energy Corp. AS
5,800
106,047
Rudolph Technologies, Inc. (a)
23,076
367,370
Samsung Electronics Co. Ltd.
1,210
797,559
Spansion, Inc. Class A
24,000
356,640
Teradyne, Inc. (a)
15,500
231,880
Verigy Ltd.
3,654
64,859
Xilinx, Inc.
14,700
350,007
13,074,002
Software - 1.5%
Amdocs Ltd. (a)
5,400
209,250
BEA Systems, Inc. (a)
29,150
366,707
Cognos, Inc. (a)
11,900
505,274
Fair, Isaac & Co., Inc.
12,100
491,865
Hyperion Solutions Corp. (a)
10,600
380,964
Macrovision Corp. (a)
5,306
149,948
Microsoft Corp.
52,600
1,570,636
Nintendo Co. Ltd.
4,900
1,271,819
Opsware, Inc. (a)
26,031
229,593
Parametric Technology Corp. (a)
8,100
145,962
Quest Software, Inc. (a)
11,600
169,940
Symantec Corp. (a)
18,305
381,659
Shares
Value (Note 1)
Take-Two Interactive Software, Inc. (a)
33,176
$ 589,206
Wind River Systems, Inc. (a)
25,000
256,250
6,719,073
TOTAL INFORMATION TECHNOLOGY
39,574,945
MATERIALS - 4.0%
Chemicals - 1.3%
Air Products & Chemicals, Inc.
3,600
253,008
Arkema sponsored ADR (a)
5,800
296,670
Ashland, Inc.
11,700
809,406
Celanese Corp. Class A
31,200
807,456
Chemtura Corp.
70,900
682,767
Cytec Industries, Inc.
8,600
485,986
FMC Corp.
4,400
336,820
Israel Chemicals Ltd.
58,600
366,359
Monsanto Co.
17,400
914,022
The Mosaic Co.
44,400
948,384
5,900,878
Construction Materials - 0.1%
Texas Industries, Inc. (e)
7,000
449,610
Containers & Packaging - 0.2%
Owens-Illinois, Inc.
21,300
392,985
Smurfit-Stone Container Corp. (a)
25,802
272,469
665,454
Metals & Mining - 2.3%
Agnico-Eagle Mines Ltd.
400
16,497
Alcoa, Inc.
39,200
1,176,392
Allegheny Technologies, Inc.
10,800
979,344
Aquarius Platinum Ltd. (Australia)
7,100
156,821
Carpenter Technology Corp.
5,400
553,608
Compass Minerals International, Inc.
13,200
416,592
Goldcorp, Inc.
22,100
627,557
IPSCO, Inc.
2,900
272,223
Meridian Gold, Inc. (a)
34,300
953,987
Mittal Steel Co. NV Class A (NY Shares)
3,600
151,848
Oregon Steel Mills, Inc. (a)
8,797
549,021
Phelps Dodge Corp.
5,348
640,263
Reliance Steel & Aluminum Co.
7,700
303,226
Stillwater Mining Co. (a)
24,800
309,752
Sumitomo Metal Industries Ltd.
18,000
78,169
Teck Cominco Ltd. Class B (sub. vtg.)
6,400
482,470
Titanium Metals Corp.
89,618
2,644,627
10,312,397
Paper & Forest Products - 0.1%
Louisiana-Pacific Corp.
2,700
58,131
Weyerhaeuser Co.
4,800
339,120
397,251
TOTAL MATERIALS
17,725,590
Common Stocks - continued
Shares
Value (Note 1)
TELECOMMUNICATION SERVICES - 2.8%
Diversified Telecommunication Services - 2.4%
AT&T, Inc.
79,370
$ 2,837,478
BellSouth Corp.
76,400
3,599,204
Cogent Communications Group, Inc. (a)
8,900
144,358
Covad Communications Group, Inc. (a)
257,200
354,936
Telenor ASA sponsored ADR
4,300
242,649
Time Warner Telecom, Inc. Class A (sub. vtg.) (a)
1,800
35,874
Verizon Communications, Inc.
84,000
3,128,160
10,342,659
Wireless Telecommunication Services - 0.4%
America Movil SA de CV Series L sponsored ADR
6,300
284,886
American Tower Corp. Class A (a)
16,670
621,458
Crown Castle International Corp. (a)
10,900
352,070
DigitalGlobe, Inc. (a)(f)
163
408
NII Holdings, Inc. (a)
7,400
476,856
Vivo Participacoes SA (PN) sponsored ADR
52,000
213,200
1,948,878
TOTAL TELECOMMUNICATION SERVICES
12,291,537
UTILITIES - 2.5%
Electric Utilities - 0.9%
Ceske Energeticke Zavody AS
100
4,608
DPL, Inc.
10,600
294,468
E.ON AG
2,700
366,039
Edison International
8,700
395,676
Entergy Corp.
10,100
932,432
Exelon Corp.
8,956
554,287
FPL Group, Inc.
10,900
593,178
PPL Corp.
15,900
569,856
Reliant Energy, Inc. (a)
12,400
176,204
3,886,748
Gas Utilities - 0.1%
Equitable Resources, Inc.
9,300
388,275
Independent Power Producers & Energy Traders - 1.0%
AES Corp. (a)
88,200
1,943,928
Constellation Energy Group, Inc.
3,000
206,610
Mirant Corp. (a)
10,900
344,113
NRG Energy, Inc.
8,500
476,085
TXU Corp.
32,200
1,745,562
4,716,298
Multi-Utilities - 0.5%
CMS Energy Corp. (a)
37,300
622,910
Dominion Resources, Inc.
8,200
687,488
PG&E Corp.
6,200
293,446
Shares
Value (Note 1)
Public Service Enterprise Group, Inc.
7,200
$ 477,936
RWE AG
700
77,166
2,158,946
TOTAL UTILITIES
11,150,267
TOTAL COMMON STOCKS
(Cost $239,866,254)
281,331,818
Convertible Preferred Stocks - 0.1%
FINANCIALS - 0.1%
Insurance - 0.1%
Platinum Underwriters Holdings Ltd. Series A, 6.00%
Independent Power Producers & Energy Traders - 0.1%
AES Corp.:
8.75% 5/15/13 (f)
115,000
123,050
9.5% 6/1/09
59,000
63,130
Mirant North America LLC 7.375% 12/31/13
20,000
20,350
NRG Energy, Inc.:
7.25% 2/1/14
50,000
50,375
7.375% 2/1/16
65,000
65,244
7.375% 1/15/17
65,000
65,000
387,149
Multi-Utilities - 0.1%
CMS Energy Corp.:
8.5% 4/15/11
85,000
92,013
8.9% 7/15/08
125,000
130,313
222,326
TOTAL UTILITIES
741,551
TOTAL NONCONVERTIBLE BONDS
6,646,544
TOTAL CORPORATE BONDS
(Cost $7,145,328)
7,499,105
Fixed-Income Funds - 28.8%
Shares
Value (Note 1)
Fidelity VIP Investment Grade Central Fund (h) (Cost $126,821,710)
1,227,395
$ 126,409,386
Money Market Funds - 5.5%
Fidelity Cash Central Fund, 5.37% (b)
23,090,342
23,090,342
Fidelity Securities Lending Cash Central Fund, 5.38% (b)(c)
1,238,158
1,238,158
TOTAL MONEY MARKET FUNDS
(Cost $24,328,500)
24,328,500
TOTAL INVESTMENT PORTFOLIO - 100.1%
(Cost $398,493,034)
439,910,218
NET OTHER ASSETS - (0.1)%
(454,758)
NET ASSETS - 100%
$ 439,455,460
Legend
(a) Non-income producing
(b) Affiliated fund that is available only to investment companies and other accounts managed by Fidelity Investments. The rate quoted is the annualized seven-day yield of the fund at period end. A complete unaudited listing of the fund's holdings as of its most recent quarter end is available upon request.
(c) Investment made with cash collateral received from securities on loan.
(d) Non-income producing - Issuer is in default.
(e) Security or a portion of the security is on loan at period end.
(f) Security exempt from registration under Rule 144A of the Securities Act of 1933. These securities may be resold in transactions exempt from registration, normally to qualified institutional buyers. At the end of the period, the value of these securities amounted to $3,067,223 or 0.7% of net assets.
(g) The coupon rate shown on floating or adjustable rate securities represents the rate at period end.
(h) Affiliated fund that is available only to investment companies and other accounts managed by Fidelity Investments. A complete unaudited list of holdings for each Fidelity Central Fund, as of the Investing Fund's report date, is available upon request or at advisor.fidelity.com. The reports are located just after the Investing Fund's financial statements and quarterly reports but are not part of the financial statements or quarterly reports. In addition, each Fidelity Central Fund's financial statements, which are not covered by the investing fund's Report of Independent Registered Public Accounting Firm, are available on the EDGAR Database on the SEC's web site, www.sec.gov, or upon request.
(i) Restricted securities - Investment in securities not registered under the Securities Act of 1933 (excluding 144A issues). At the end of the period, the value of restricted securities (excluding 144A issues) amounted to $1,644,983 or 0.4% of net assets.
Additional information on each holding is as follows:
Security
Acquisition Date
Acquisition Cost
Inverness Medical Innovations, Inc.
2/8/06
$ 157,957
PICO Holdings, Inc.
5/5/06
$ 1,203,240
Affiliated Central Funds
Information regarding fiscal year to date income earned by the Fund from investments in Fidelity Central Funds is as follows:
Fund
Income earned
Fidelity Cash Central Fund
$ 698,795
Fidelity Securities Lending Cash Central Fund
19,845
Fidelity Ultra-Short Central Fund
382,950
Fidelity VIP Investment Grade Central Fund
3,306,363
Total
$ 4,407,953
Additional information regarding the Fund's fiscal year to date purchases and sales, including the ownership percentage, of the non Money Market Central Funds is as follows:
Fund
Value, beginning of period
Purchases
Sales Proceeds
Value, end of period
% ownership, end of period
Fidelity Ultra-Short Central Fund
$ 14,495,499
$ 5,000,462
$ 19,493,750
$ -
0.0%
Fidelity VIP Investment Grade Central Fund
-
123,202,628*
-
126,409,386
4.5%
Total
$ 14,495,499
$ 128,203,090
$ 19,493,750
$ 126,409,386
* $92,915,128 represents the value of shares received through in-kind contributions.
Other Information
The composition of credit quality ratings as a percentage of net assets is as follows (ratings are unaudited):
U.S.Government and U.S.Government Agency Obligations
15.7%
AAA,AA,A
7.8%
BBB
5.3%
BB
1.0%
B
0.6%
CCC,CC,C
0.1%
Not Rated
0.5%
Equities
64.1%
Short-Term Investments and Net Other Assets
4.9%
100.0%
We have used ratings from Moody's Investors Services, Inc. Where Moody's ratings are not available, we have used S&P ratings.
Distributions of investments by country of issue, as a percentage of total net assets, is as follows:
United States of America
89.2%
Cayman Islands
1.4%
Canada
1.3%
United Kingdom
1.1%
Others (individually less than 1%)
7.0%
100.0%
See accompanying notes which are an integral part of the financial statements.
VIP Balanced Portfolio
VIP Balanced Portfolio
Financial Statements
Statement of Assets and Liabilities
December 31, 2006
Assets
Investment in securities, at value (including securities loaned of $1,194,065) - See accompanying schedule:
Unaffiliated issuers (cost $247,342,824)
$ 289,172,332
Fidelity Central Funds (cost $151,150,210)
150,737,886
Total Investments (cost $398,493,034)
$ 439,910,218
Cash
36,988
Foreign currency held at value (cost $7,582)
7,578
Receivable for investments sold
1,174,027
Dividends receivable
193,462
Interest receivable
234,228
Distributions receivable from Fidelity Central Funds
797,420
Prepaid expenses
1,889
Other receivables
30,203
Total assets
442,386,013
Liabilities
Payable for investments purchased
$ 1,343,934
Payable for fund shares redeemed
21,813
Accrued management fee
150,789
Distribution fees payable
12,717
Other affiliated payables
51,706
Other payables and accrued expenses
111,436
Collateral on securities loaned, at value
1,238,158
Total liabilities
2,930,553
Net Assets
$ 439,455,460
Net Assets consist of:
Paid in capital
$ 372,402,554
Undistributed net investment income
8,419,486
Accumulated undistributed net realized gain (loss) on investments and foreign currency transactions
17,213,180
Net unrealized appreciation (depreciation) on investments and assets and liabilities in foreign currencies
41,420,240
Net Assets
$ 439,455,460
Statement of Assets and Liabilities - continued
December 31, 2006
Initial Class: Net Asset Value, offering price and redemption price per share ($281,593,823 ÷ 18,010,432 shares)
$ 15.64
Service Class: Net Asset Value, offering price and redemption price per share ($14,247,084 ÷ 915,992 shares)
$ 15.55
Service Class 2: Net Asset Value, offering price and redemption price per share ($56,138,755 ÷ 3,631,452 shares)
$ 15.46
Investor Class: Net Asset Value, offering price and redemption price per share ($87,475,798 ÷ 5,609,554 shares)
$ 15.59
See accompanying notes which are an integral part of the financial statements.
Annual Report
VIP Balanced Portfolio Financial Statements - continued
Statement of Operations
Year ended December 31, 2006
Investment Income
Dividends
$ 3,768,861
Interest
2,629,648
Income from Fidelity Central Funds
4,407,953
Total income
10,806,462
Expenses
Management fee
$ 1,611,736
Transfer agent fees
334,261
Distribution fees
127,635
Accounting and security lending fees
203,111
Custodian fees and expenses
169,434
Independent trustees' compensation
1,415
Audit
49,244
Legal
8,295
Miscellaneous
52,566
Total expenses before reductions
2,557,697
Expense reductions
(89,444)
2,468,253
Net investment income (loss)
8,338,209
Realized and Unrealized Gain (Loss)
Net realized gain (loss) on:
Investment securities:
Unaffiliated issuers (net of foreign taxes of $12,478)
17,669,837
Fidelity Central Funds
(6,583)
Foreign currency transactions
(11,300)
Swap agreements
(73,248)
Capital gain distributions from Fidelity Central Funds
122,739
Total net realized gain (loss)
17,701,445
Change in net unrealized appreciation (depreciation) on:
Investment securities (net of decrease in deferred foreign taxes of $5,622)
17,388,495
Assets and liabilities in foreign currencies
114
Swap agreements
(38,099)
Total change in net unrealized appreciation (depreciation)
17,350,510
Net gain (loss)
35,051,955
Net increase (decrease) in net assets resulting from operations
$ 43,390,164
Statement of Changes in Net Assets
Year ended December 31, 2006
Year ended December 31, 2005
Increase (Decrease) in Net Assets
Operations
Net investment income (loss)
$ 8,338,209
$ 7,312,973
Net realized gain (loss)
17,701,445
23,482,739
Change in net unrealized appreciation (depreciation)
17,350,510
(12,127,419)
Net increase (decrease) in net assets resulting from operations
43,390,164
18,668,293
Distributions to shareholders from net investment income
(7,200,897)
(8,716,691)
Distributions to shareholders from net realized gain
(11,938,214)
(241,563)
Total distributions
(19,139,111)
(8,958,254)
Share transactions - net increase (decrease)
65,831,764
(9,761,182)
Total increase (decrease) in net assets
90,082,817
(51,143)
Net Assets
Beginning of period
349,372,643
349,423,786
End of period (including undistributed net investment income of $8,419,486 and undistributed net investment income of $7,582,792, respectively)
$ 439,455,460
$ 349,372,643
See accompanying notes which are an integral part of the financial statements.
VIP Balanced Portfolio
Financial Highlights - Initial Class
Years ended December 31,
2006
2005
2004
2003
2002
Selected Per-Share Data
Net asset value, beginning of period
$ 14.78
$ 14.35
$ 13.88
$ 12.16
$ 13.72
Income from Investment Operations
Net investment income (loss) C
.33
.31
.36 F
.30
.36
Net realized and unrealized gain (loss)
1.34
.50
.39
1.78
(1.53)
Total from investment operations
1.67
.81
.75
2.08
(1.17)
Distributions from net investment income
(.31)
(.37)
(.28)
(.36)
(.39)
Distributions from net realized gain
(.50)
(.01)
-
-
-
Total distributions
(.81)
(.38)
(.28)
(.36)
(.39)
Net asset value, end of period
$ 15.64
$ 14.78
$ 14.35
$ 13.88
$ 12.16
Total Return A, B
11.78%
5.77%
5.47%
17.72%
(8.72)%
Ratios to Average Net Assets D, G
Expenses before reductions
.61%
.58%
.56%
.59%
.57%
Expenses net of fee waivers, if any
.61%
.58%
.56%
.59%
.57%
Expenses net of all reductions
.59%
.54%
.56%
.58%
.55%
Net investment income (loss)
2.20%
2.22%
2.60%
2.32%
2.84%
Supplemental Data
Net assets, end of period (000 omitted)
$ 281,594
$ 276,343
$ 291,176
$ 295,656
$ 235,064
Portfolio turnover rate E
55%
140%
74%
102%
134%
ATotal returns do not reflect charges attributable to your insurance company's separate account. Inclusion of these charges would reduce the total returns shown.
BTotal returns would have been lower had certain expenses not been reduced during the periods shown.
CCalculated based on average shares outstanding during the period.
DFees and expenses of the underlying Fidelity Central Funds are not included in the Fund's expense ratio. The Fund indirectly bears its proportionate share of the expenses of any underlying Fidelity Central Funds.
EAmount does not include the portfolio activity of any underlying Fidelity Central Funds.
FInvestment income per share reflects a special dividend which amounted to $.03 per share.
GExpense ratios reflect operating expenses of the class. Expenses before reductions do not reflect amounts reimbursed by the investment adviser or reductions from brokerage service arrangements or other expense offset arrangements and do not represent the amount paid by the class during periods when reimbursements or reductions occur. Expenses net of fee waivers reflect expenses after reimbursement by the investment adviser but prior to reductions from brokerage service arrangements or other expense offset arrangements. Expenses net of all reductions represent the net expenses paid by the class.
Financial Highlights - Service Class
Years ended December 31,
2006
2005
2004
2003
2002
Selected Per-Share Data
Net asset value, beginning of period
$ 14.70
$ 14.28
$ 13.81
$ 12.11
$ 13.66
Income from Investment Operations
Net investment income (loss) C
.31
.30
.34 F
.28
.34
Net realized and unrealized gain (loss)
1.33
.48
.40
1.77
(1.51)
Total from investment operations
1.64
.78
.74
2.05
(1.17)
Distributions from net investment income
(.29)
(.35)
(.27)
(.35)
(.38)
Distributions from net realized gain
(.50)
(.01)
-
-
-
Total distributions
(.79)
(.36)
(.27)
(.35)
(.38)
Net asset value, end of period
$ 15.55
$ 14.70
$ 14.28
$ 13.81
$ 12.11
Total Return A, B
11.64%
5.61%
5.42%
17.53%
(8.75)%
Ratios to Average Net Assets D, G
Expenses before reductions
.72%
.68%
.67%
.69%
.67%
Expenses net of fee waivers, if any
.72%
.68%
.67%
.69%
.67%
Expenses net of all reductions
.69%
.65%
.67%
.68%
.65%
Net investment income (loss)
2.09%
2.12%
2.50%
2.22%
2.74%
Supplemental Data
Net assets, end of period (000 omitted)
$ 14,247
$ 18,181
$ 21,228
$ 21,903
$ 20,019
Portfolio turnover rate E
55%
140%
74%
102%
134%
ATotal returns do not reflect charges attributable to your insurance company's separate account. Inclusion of these charges would reduce the total returns shown.
B Total returns would have been lower had certain expenses not been reduced during the periods shown.
C Calculated based on average shares outstanding during the period.
D Fees and expenses of the underlying Fidelity Central Funds are not included in the Fund's expense ratio. The Fund indirectly bears its proportionate share of the expenses of any underlying Fidelity Central Funds.
E Amount does not include the portfolio activity of any underlying Fidelity Central Funds.
F Investment income per share reflects a special dividend which amounted to $.03 per share.
G Expense ratios reflect operating expenses of the class. Expenses before reductions do not reflect amounts reimbursed by the investment adviser or reductions from brokerage service arrangements or other expense offset arrangements and do not represent the amount paid by the class during periods when reimbursements or reductions occur. Expenses net of fee waivers reflect expenses after reimbursement by the investment adviser but prior to reductions from brokerage service arrangements or other expense offset arrangements. Expenses net of all reductions represent the net expenses paid by the class.
See accompanying notes which are an integral part of the financial statements.
Annual Report
Financial Highlights - Service Class 2
Years ended December 31,
2006
2005
2004
2003
2002
Selected Per-Share Data
Net asset value, beginning of period
$ 14.62
$ 14.20
$ 13.75
$ 12.05
$ 13.61
Income from Investment Operations
Net investment income (loss) C
.28
.27
.32 F
.26
.32
Net realized and unrealized gain (loss)
1.33
.50
.38
1.77
(1.51)
Total from investment operations
1.61
.77
.70
2.03
(1.19)
Distributions from net investment income
(.27)
(.34)
(.25)
(.33)
(.37)
Distributions from net realized gain
(.50)
(.01)
-
-
-
Total distributions
(.77)
(.35)
(.25)
(.33)
(.37)
Net asset value, end of period
$ 15.46
$ 14.62
$ 14.20
$ 13.75
$ 12.05
Total Return A, B
11.50%
5.53%
5.15%
17.41%
(8.93)%
Ratios to Average Net Assets D, G
Expenses before reductions
.87%
.83%
.82%
.84%
.83%
Expenses net of fee waivers, if any
.87%
.83%
.82%
.84%
.83%
Expenses net of all reductions
.84%
.80%
.82%
.84%
.81%
Net investment income (loss)
1.94%
1.95%
2.35%
2.06%
2.58%
Supplemental Data
Net assets, end of period (000 omitted)
$ 56,139
$ 40,716
$ 37,020
$ 29,485
$ 18,577
Portfolio turnover rate E
55%
140%
74%
102%
134%
A Total returns do not reflect charges attributable to your insurance company's separate account. Inclusion of these charges would reduce the total returns shown.
B Total returns would have been lower had certain expenses not been reduced during the periods shown.
C Calculated based on average shares outstanding during the period.
D Fees and expenses of the underlying Fidelity Central Funds are not included in the Fund's expense ratio. The Fund indirectly bears its proportionate share of the expenses of any underlying Fidelity Central Funds.
E Amount does not include the portfolio activity of any underlying Fidelity Central Funds.
F Investment income per share reflects a special dividend which amounted to $.03 per share.
G Expense ratios reflect operating expenses of the class. Expenses before reductions do not reflect amounts reimbursed by the investment adviser or reductions from brokerage service arrangements or other expense offset arrangements and do not represent the amount paid by the class during periods when reimbursements or reductions occur. Expenses net of fee waivers reflect expenses after reimbursement by the investment adviser but prior to reductions from brokerage service arrangements or other expense offset arrangements. Expenses net of all reductions represent the net expenses paid by the class.
Financial Highlights - Investor Class
Years ended December 31,
2006
2005 H
Selected Per-Share Data
Net asset value, beginning of period
$ 14.77
$ 13.96
Income from Investment Operations
Net investment income (loss) E
.31
.11
Net realized and unrealized gain (loss)
1.32
.70
Total from investment operations
1.63
.81
Distributions from net investment income
(.31)
-
Distributions from net realized gain
(.50)
-
Total distributions
(.81)
-
Net asset value, end of period
$ 15.59
$ 14.77
Total Return B, C, D
11.56%
5.80%
Ratios to Average Net Assets F, I
Expenses before reductions
.73%
.76% A
Expenses net of fee waivers, if any
.73%
.76% A
Expenses net of all reductions
.71%
.73% A
Net investment income (loss)
2.07%
1.73% A
Supplemental Data
Net assets, end of period (000 omitted)
$ 87,476
$ 14,133
Portfolio turnover rate G
55%
140%
A Annualized
B Total returns for periods of less than one year are not annualized.
C Total returns do not reflect charges attributable to your insurance company's separate account. Inclusion of these charges would reduce the total returns shown.
D Total returns would have been lower had certain expenses not been reduced during the periods shown.
E Calculated based on average shares outstanding during the period.
F Fees and expenses of the underlying Fidelity Central Funds are not included in the Fund's expense ratio. The Fund indirectly bears its proportionate share of the expenses of any underlying Fidelity Central Funds.
G Amount does not include the portfolio activity of any underlying Fidelity Central Funds.
HFor the period July 21, 2005 (commencement of sale of shares) to December 31, 2005.
IExpense ratios reflect operating expenses of the class. Expenses before reductions do not reflect amounts reimbursed by the investment adviser or reductions from brokerage service arrangements or other expense offset arrangements and do not represent the amount paid by the class during periods when reimbursements or reductions occur. Expense ratios before reductions for start-up periods may not be representative of longer-erm operating periods. Expenses net of fee waivers reflect expenses after reimbursement by the investment adviser but prior to reductions from brokerage service arrangements or other expense offset arrangements. Expenses net of all reductions represent the net expenses paid by the class.
See accompanying notes which are an integral part of the financial statements.
VIP Balanced Portfolio
Notes to Financial Statements
For the period ended December 31, 2006
1. Significant Accounting Policies.
VIP Balanced Portfolio (the Fund) is a fund of Variable Insurance Products Fund III (the trust) (referred to in this report as VIP Balanced Portfolio) and is authorized to issue an unlimited number of shares. The trust is registered under the Investment Company Act of 1940, as amended (the 1940 Act), as an open-end management investment company organized as a Massachusetts business trust. Shares of the Fund may only be purchased by insurance companies for the purpose of funding variable annuity or variable life insurance contracts. The Fund offers the following classes of shares: Initial Class shares, Service Class shares, Service Class 2 shares, and Investor Class shares. All classes have equal rights and voting privileges, except for matters affecting a single class. Investment income, realized and unrealized capital gains and losses, the common expenses of the Fund, and certain fund-level expense reductions, if any, are allocated on a pro rata basis to each class based on the relative net assets of each class to the total net assets of the Fund. Each class differs with respect to transfer agent and distribution and service plan fees incurred. Certain expense reductions also differ by class.
The Fund may invest in Fidelity Central Funds which are open-end investment companies available to investment companies and other accounts managed by Fidelity Management & Research Company (FMR) and its affiliates. The financial statements have been prepared in conformity with accounting principles generally accepted in the United States of America, which require management to make certain estimates and assumptions at the date of the financial statements. The following summarizes the significant accounting policies of the Fund, which are also consistently followed by the Fidelity Central Funds:
Security Valuation. Investments are valued and net asset value (NAV) per share is calculated (NAV calculation) as of the close of business of the New York Stock Exchange (NYSE), normally 4:00 p.m. Eastern time. Wherever possible, the Fund uses independent pricing services approved by the Board of Trustees to value its investments.
Equity securities, including restricted securities, for which market quotations are readily available, are valued at the last reported sale price or official closing price as reported by an independent pricing service on the primary market or exchange on which they are traded. In the event there were no sales during the day or closing prices are not available, securities are valued at the last quoted bid price. Debt securities, including restricted securities, for which quotations are readily available, are valued by independent pricing services or by dealers who make markets in such securities. Pricing services consider yield or price of bonds of comparable quality, coupon, maturity and type as well as dealer supplied prices. Investments in open-end mutual funds, including the Fidelity Central Funds, are valued at their closing net asset value each business day. Short-term securities with remaining maturities of sixty days or less for which quotations are not readily available are valued at amortized cost, which approximates value.
When current market prices or quotations are not readily available or do not accurately reflect fair value, valuations may be determined in accordance with procedures adopted by the Board of Trustees. For example, when developments occur between the close of a market and the close of the NYSE that may materially affect the value of some or all of the securities, or when trading in a security is halted, those securities may be fair valued. Factors used in the determination of fair value may include monitoring news to identify significant market or security specific events such as changes in the value of U.S. securities markets, reviewing developments in foreign markets and evaluating the performance of ADRs, futures contracts and exchange-traded funds. Because the Fund's utilization of fair value pricing depends on market activity, the frequency with which fair value pricing is used can not be predicted and may be utilized to a significant extent. The value of securities used for NAV calculation under fair value pricing may differ from published prices for the same securities.
Foreign Currency. The Fund uses foreign currency contracts to facilitate transactions in foreign-denominated securities. Losses from these transactions may arise from changes in the value of the foreign currency or if the counterparties do not perform under the contracts' terms.
Foreign-denominated assets, including investment securities, and liabilities are translated into U.S. dollars at the exchange rate at period end. Purchases and sales of investment securities, income and dividends received and expenses denominated in foreign currencies are translated into U.S. dollars at the exchange rate in effect on the transaction date.
The effects of exchange rate fluctuations on investments are included with the net realized and unrealized gain (loss) on investment securities. Other foreign currency transactions resulting in realized and unrealized gain (loss) are disclosed separately.
Investment Transactions and Income. Security transactions, including the Fund's investment activity in the Fidelity Central Funds, are accounted for as of trade date. Gains and losses on securities sold are determined on the basis of identified cost and may include proceeds received from litigation. Dividend income is recorded on the ex-dividend date, except for certain dividends from foreign securities where the ex-dividend date may have passed, which are recorded as soon as the Fund is informed of the ex-dividend date. Non-cash dividends included in dividend income, if any, are recorded at the fair market value of the securities received. Distributions received on securities that represent a return of capital or capital gain are recorded as a reduction of cost of investments and/or as a realized gain. The Fund estimates the components of distributions received that may be considered return of capital distributions or capital gain distributions. Interest income and income and capital gain distributions from the Fidelity Central Funds are accrued as earned, with any distributions receivable as of period end included in Distributions receivable from Fidelity Central Funds on the Statement of Assets and Liabilities. Interest income includes coupon interest and amortization of premium and accretion of discount on debt securities. Investment income is recorded net of foreign taxes withheld where recovery of such taxes is uncertain. Debt obligations may be placed on non-accrual
Annual Report
Notes to Financial Statements - continued
1. Significant Accounting Policies - continued
Investment Transactions and Income - continued
status and related interest income may be reduced by ceasing current accruals and writing off interest receivables when the collection of all or a portion of interest has become doubtful based on consistently applied procedures. A debt obligation is removed from non-accrual status when the issuer resumes interest payments or when collectibility of interest is reasonably assured.
Expenses. Most expenses of the trust can be directly attributed to a fund. Expenses which cannot be directly attributed are apportioned among each Fund in the trust. Expense estimates are accrued in the period to which they relate and adjustments are made when actual amounts are known.
Income Tax Information and Distributions to Shareholders. Each year, the Fund intends to qualify as a regulated investment company by distributing all of its taxable income and realized gains under Subchapter M of the Internal Revenue Code. As a result, no provision for income taxes is required in the accompanying financial statements. Foreign taxes are provided for based on the Fund's understanding of the tax rules and rates that exist in the foreign markets in which it invests.
Distributions are recorded on the ex-dividend date. Income dividends and capital gain distributions are declared separately for each class. Income and capital gain distributions are determined in accordance with income tax regulations, which may differ from generally accepted accounting principles.
Capital accounts within the financial statements are adjusted for permanent book-tax differences. These adjustments have no impact on net assets or the results of operations. Temporary book-tax differences will reverse in a subsequent period.
Book-tax differences are primarily due to swap agreements, foreign currency transactions, market discount, partnerships, financing transactions, passive foreign investment companies (PFIC) and losses deferred due to wash sales.
The tax-basis components of distributable earnings and the federal tax cost as of period end were as follows:
Unrealized appreciation
$ 52,342,255
Unrealized depreciation
(7,581,313)
Net unrealized appreciation (depreciation)
44,760,942
Undistributed ordinary income
19,761,814
Undistributed long-term capital gain
6,131,355
Cost for federal income tax purposes
$ 395,149,276
The tax character of distributions paid was as follows:
December 31, 2006
December 31, 2005
Ordinary Income
$ 7,200,897
$ 8,958,254
Long-term Capital Gains
11,938,214
-
Total
$ 19,139,111
$ 8,958,254
New Accounting Pronouncements. In July 2006, Financial Accounting Standards Board Interpretation No. 48, Accounting for Uncertainty in Income Taxes - an interpretation of FASB Statement 109 (FIN 48), was issued and is effective on the last business day of the semiannual reporting period for fiscal years beginning after December 15, 2006. FIN 48 sets forth a threshold for financial statement recognition, measurement and disclosure of a tax position taken or expected to be taken on a tax return. Management is currently evaluating the impact, if any, the adoption of FIN 48 will have on the Fund's net assets, results of operations and financial statement disclosures.
In addition, in September 2006, Statement of Financial Accounting Standards No. 157, Fair Value Measurements (SFAS 157), was issued and is effective for fiscal years beginning after November 15, 2007. SFAS 157 defines fair value, establishes a framework for measuring fair value and expands disclosures about fair value measurements. Management is currently evaluating the impact the adoption of SFAS 157 will have on the Fund's financial statement disclosures.
2. Operating Policies.
Repurchase Agreements. FMR has received an Exemptive Order from the Securities and Exchange Commission (the SEC) which permits the Fund and other affiliated entities of FMR to transfer uninvested cash balances into joint trading accounts which are then invested in repurchase agreements. The Fund may also invest directly with institutions in repurchase agreements. Repurchase agreements are collateralized by government or non-government securities. Upon settlement date, collateral is held in segregated accounts with custodian banks and may be obtained in the event of a default of the counterparty. The Fund monitors, on a daily basis, the value of the collateral to ensure it is at least equal to the principal amount of the repurchase agreement (including accrued interest). In the event of a default by the counterparty, realization of the collateral proceeds could be delayed, during which time the value of the collateral may decline.
VIP Balanced Portfolio
2. Operating Policies - continued
Restricted Securities. The Fund may invest in securities that are subject to legal or contractual restrictions on resale. These securities generally may be resold in transactions exempt from registration or to the public if the securities are registered. Disposal of these securities may involve time-consuming negotiations and expense, and prompt sale at an acceptable price may be difficult. Information regarding restricted securities is included at the end of the Fund's Schedule of Investments.
Swap Agreements. The Fund may invest in swaps for the purpose of managing its exposure to interest rate, credit or market risk.
Interest rate swaps are agreements to exchange cash flows periodically based on a notional principal amount, for example, the exchange of fixed rate interest payments for floating rate interest payments. Periodic payments received or made by the Fund are recorded in the accompanying Statement of Operations as realized gains or losses, respectively. The primary risk associated with interest rate swaps is that unfavorable changes in the fluctuation of interest rates could adversely impact a fund.
Total return swaps are agreements to exchange the return generated by one instrument or index for the return generated by another instrument, for example, the agreement to pay interest in exchange for a market-linked return based on a notional amount. To the extent the total return of the index exceeds the offsetting interest obligation, a fund will receive a payment from the counterparty. To the extent it is less, a fund will make a payment to the counterparty. Periodic payments received or made by the Fund are recorded in the accompanying Statement of Operations as realized gains or losses, respectively.
Credit default swaps involve the exchange of a fixed rate premium for protection against the loss in value of an underlying debt instrument in the event of a defined credit event (such as payment default or bankruptcy). Under the terms of the swap, one party acts as a "guarantor" receiving a periodic payment that is a fixed percentage applied to a notional principal amount. In return the party agrees to purchase the notional amount of the underlying instrument, at par, if a credit event occurs during the term of the swap. The Fund may enter into credit default swaps in which either it or its counterparty act as guarantors. By acting as the guarantor of a swap, a fund assumes the market and credit risk of the underlying instrument including liquidity and loss of value. Periodic payments and premiums received or made by the Fund are recorded in the accompanying Statement of Operations as realized gains or losses, respectively.
Swaps are marked-to-market daily based on dealer-supplied valuations and changes in value are recorded as unrealized appreciation (depreciation). Gains or losses are realized upon early termination of the swap agreement. Collateral, in the form of cash or securities, may be required to be held in segregated accounts with a fund's custodian in compliance with swap contracts.
Mortgage Dollar Rolls. To earn additional income, the Fund may employ trading strategies which involve the sale and simultaneous agreement to repurchase similar securities ("mortgage dollar rolls") or the purchase and simultaneous agreement to sell similar securities ("reverse mortgage dollar rolls"). The securities traded are mortgage securities and bear the same interest rate but may be collateralized by different pools of mortgages. During the period between the sale and repurchase in a mortgage dollar roll transaction, a fund will not be entitled to receive interest and principal payments on the securities sold but will invest the proceeds of the sale in other securities which may enhance the yield and total return. In addition, the difference between the sale price and the future purchase price is recorded as an adjustment to investment income. During the period between the purchase and subsequent sale in a reverse mortgage dollar roll transaction a fund is entitled to interest and principal payments on the securities purchased. The price differential between the purchase and sale is recorded as an adjustment to investment income. Losses may arise due to changes in the value of the securities or if the counterparty does not perform under the terms of the agreement. If the counterparty files for bankruptcy or becomes insolvent, a fund's right to repurchase or sell securities may be limited.
3. Purchases and Sales of Investments.
Purchases and sales of securities (including non Money Market Central Funds), other than short-term securities, U.S. government securities, and in-kind transactions aggregated $210,295,165 and $178,316,993, respectively.
4. Fees and Other Transactions with Affiliates.
Management Fee. FMR and its affiliates provide the Fund with investment management related services for which the Fund pays a monthly management fee. The management fee is the sum of an individual fund fee rate that is based on an annual rate of .15% of the Fund's average net assets and a group fee rate that averaged .27% during the period. The group fee rate is based upon the average net assets of all the mutual funds advised by FMR. The group fee rate decreases as assets under management increase and increases as assets under management decrease. For the period, the total annual management fee rate was .42% of the Fund's average net assets.
Annual Report
Notes to Financial Statements - continued
4. Fees and Other Transactions with Affiliates - continued
Distribution and Service Plan. In accordance with Rule 12b-1 of the 1940 Act, the Fund has adopted separate 12b-1 Plans for each Service Class of shares. Each Service Class pays Fidelity Distributors Corporation (FDC), an affiliate of FMR, a service fee. For the period, the service fee is based on an annual rate of .10% of Service Class' average net assets and .25% of Service Class 2's average net assets.
For the period, each class paid FDC the following amounts, all of which were re-allowed to insurance companies for the distribution of shares and providing shareholder support services:
Service Class
$ 16,148
Service Class 2
111,487
$ 127,635
Transfer Agent Fees. Fidelity Investments Institutional Operations Company, Inc. (FIIOC), an affiliate of FMR, is the fund's transfer, dividend disbursing, and shareholder servicing agent. FIIOC receives an asset-based fee with respect to each class. Each class with the exception of Investor Class pays a transfer agent fee, excluding out of pocket expenses, equal to an annual rate of .07% of their month end net assets. Investor Class pays a monthly asset-based transfer agent fee of .18% of its month end net assets. The total transfer agent fees paid by each class to FIIOC, including out of pocket expenses, were as follows:
Initial Class
$ 190,266
Service Class
12,384
Service Class 2
33,457
Investor Class
98,154
$ 334,261
Accounting and Security Lending Fees. Fidelity Service Company, Inc. (FSC), an affiliate of FMR, maintains the Fund's accounting records. The accounting fee is based on the level of average net assets for the month. Under a separate contract, FSC administers the security lending program. The security lending fee is based on the number and duration of lending transactions.
Investments in Fidelity Central Funds. The Fund may invest in Fidelity Central Funds. The Fund's Schedule of Investments lists each of the Fidelity Central Funds as an investment of the Fund but does not include the underlying holdings of each Fidelity Central Fund. As an Investing Fund, the Fund indirectly bears its proportionate share of the expenses of the underlying Fidelity Central Funds. A complete unaudited list of holdings for each Fidelity Central Fund is available upon request or, for each non Money Market Central Fund, at advisor.fidelity.com. The reports are located just after the Fund's financial statements and quarterly reports but are not part of the financial statements or quarterly reports. In addition, the financial statements of the Fidelity Central Funds, which are not covered by the Fund's Report of Independent Registered Public Accounting Firm, are available on the EDGAR Database on the SEC's web site, www.sec.gov, or upon request.
Based on their investment objective, each Fidelity Central Fund may invest or participate in various investment vehicles or strategies that are similar to those of the Fund. These strategies are consistent with the investment objectives of the Fund and may involve certain economic risks which may cause a decline in value of each of the Fidelity Central Funds and thus a decline in the value of the Fund. The Money Market Central Funds seek preservation of capital and current income and are managed by Fidelity Investments Money Management, Inc. (FIMM), an affiliate of FMR. The following summarizes the Fund's investment in each Fidelity Fixed-Income Central Fund.
Central Fund
Investment Advisor
Investment Objective
Investment Practices
Fidelity Ultra-Short Central Fund
(FIMM)
Seeks to obtain a high level of current income consistent with preservation of capital by investing in U.S. dollar denominated money market and investment-grade debt securities.
Futures
Repurchase Agreements
Restricted Securities
Swap Agreements
VIP Investment Grade Central Fund
(FIMM)
Seeks a high level of current income by normally investing in investment-grade debt securities and repurchase agreements
Delayed Delivery & When Issued Securities
Mortgage Dollar Rolls
Repurchase Agreements
Restricted Securities
Swap Agreements
On June 23, 2006 the Fund completed a non-taxable exchange of securities with a value, including accrued interest, of $92,915,128 (which included $3,741,821 of unrealized depreciation) in exchange for 929,151 shares (each then valued at $100.00 per share) of the Fidelity VIP Investment Grade Central Fund, an affiliated entity. This is considered a non-taxable exchange for federal income tax purposes, with no gain or loss recognized by the Fund or its shareholders.
VIP Balanced Portfolio
4. Fees and Other Transactions with Affiliates - continued
Brokerage Commissions. The Fund placed a portion of its portfolio transactions with brokerage firms which are affiliates of the investment adviser. The commissions paid to these affiliated firms were $1,874 for the period.
5. Committed Line of Credit.
The Fund participates with other funds managed by FMR in a $4.2 billion credit facility (the "line of credit") to be utilized for temporary or emergency purposes to fund shareholder redemptions or for other short-term liquidity purposes. The Fund has agreed to pay commitment fees on its pro rata portion of the line of credit, which amounted to $1,014 and is reflected in Miscellaneous Expense on the Statement of Operations. During the period, there were no borrowings on this line of credit.
6. Security Lending.
The Fund lends portfolio securities from time to time in order to earn additional income. On the settlement date of the loan, the Fund receives collateral (in the form of U.S. Treasury obligations, letters of credit and/or cash) against the loaned securities and maintains collateral in an amount not less than 100% of the market value of the loaned securities during the period of the loan. The market value of the loaned securities is determined at the close of business of the Fund and any additional required collateral is delivered to the Fund on the next business day. If the borrower defaults on its obligation to return the securities loaned because of insolvency or other reasons, a fund could experience delays and costs in recovering the securities loaned or in gaining access to the collateral. Any cash collateral received is invested in the Fidelity Securities Lending Cash Central Fund. The value of loaned securities and cash collateral at period end are disclosed on the Fund's Statement of Assets and Liabilities. Security lending income represents the income earned on investing cash collateral, less fees and expenses associated with the loan, plus any premium payments that may be received on the loan of certain types of securities. Security lending income is presented in the Statement of Operations as a component of income from Fidelity Central Funds. Net income from lending portfolio securities during the period amounted to $19,845.
7. Expense Reductions.
Many of the brokers with whom FMR places trades on behalf of the Fund provided services to the Fund in addition to trade execution. These services included payments of certain expenses on behalf of the Fund totaling $83,690 for the period.
8. Other.
The Fund's organizational documents provide former and current trustees and officers with a limited indemnification against liabilities arising in connection with the performance of their duties to the Fund. In the normal course of business, the Fund may also enter into contracts that provide general indemnifications. The Fund's maximum exposure under these arrangements is unknown as this would be dependent on future claims that may be made against the Fund. The risk of material loss from such claims is considered remote.
At the end of the period, FMR or its affiliates were the owners of record of 71% of the total outstanding shares of the Fund and one otherwise unaffiliated shareholder was the owner of record of 12% of the total outstanding shares of the Fund.
The United States Securities and Exchange Commission ("SEC") is conducting an investigation of FMR (covering the years 2002 to 2004) arising from gifts, gratuities and business entertainment provided by certain brokers to certain individuals who were employed on FMR's domestic equity trading desk during that period. FMR is in discussions with the SEC staff regarding the possible resolution of the matter, but as of period-end no final resolution has been reached.
In December 2006, the Independent Trustees completed their own investigation of the matter with the assistance of independent counsel. The Independent Trustees and FMR agree that, despite the absence of proof that the Fidelity mutual funds experienced diminished execution quality as a result of the improper receipt of gifts and business entertainment, the conduct at issue was serious and is worthy of redress. Accordingly, the Independent Trustees have requested and FMR has agreed to pay $42 million to Fidelity mutual funds, plus interest to be determined at the time that payment is made. A method of allocating this payment among the funds has not yet been determined. The total payment to the Fund is not anticipated to have a material impact on the Fund's net assets. In addition, FMR has reimbursed related legal expenses which are recorded in the accompanying Statement of Operations as an expense reduction.
Annual Report
Notes to Financial Statements - continued
9. Distributions to Shareholders.
Distributions to shareholders of each class were as follows:
Years ended December 31,
2006
2005
From net investment income
Initial Class
$ 5,648,168
$ 7,331,284
Service Class
346,499
507,567
Service Class 2
759,239
877,840
Investor Class
446,991
-
Total
$ 7,200,897
$ 8,716,691
From net realized gain
Initial Class
$ 9,229,031
$ 200,857
Service Class
599,479
14,502
Service Class 2
1,395,661
26,204
Investor Class
714,043
-
Total
$ 11,938,214
$ 241,563
10. Share Transactions.
Transactions for each class of shares were as follows:
Shares
Dollars
Years ended December 31,
Years ended December 31,
2006
2005A
2006
2005A
Initial Class
Shares sold
1,241,550
1,236,357
$ 18,332,029
$ 17,375,383
Reinvestment of distributions
1,039,636
539,938
14,877,199
7,532,140
Shares redeemed
(2,970,279)
(3,374,047)
(43,945,090)
(47,380,600)
Net increase (decrease)
(689,093)
(1,597,752)
$ (10,735,862)
$ (22,473,077)
Service Class
Shares sold
12,787
21,835
$ 183,548
$ 304,769
Reinvestment of distributions
66,384
37,586
945,978
522,069
Shares redeemed
(399,681)
(309,945)
(5,859,260)
(4,318,560)
Net increase (decrease)
(320,510)
(250,524)
$ (4,729,734)
$ (3,491,722)
Service Class 2
Shares sold
3,031,190
692,036
$ 44,688,943
$ 9,651,143
Reinvestment of distributions
151,860
65,368
2,154,900
904,044
Shares redeemed
(2,335,926)
(579,257)
(34,243,751)
(8,109,967)
Net increase (decrease)
847,124
178,147
$ 12,600,092
$ 2,445,220
Investor Class
Shares sold
4,881,408
966,823
$ 72,088,001
$ 13,896,815
Reinvestment of distributions
81,248
-
1,161,034
-
Shares redeemed
(310,216)
(9,709)
(4,551,767)
(138,418)
Net increase (decrease)
4,652,440
957,114
$ 68,697,268
$ 13,758,397
A Share transactions for Investor Class are for the period July 21, 2005 (commencement of sale of shares) to December 31, 2005.
VIP Balanced Portfolio
Report of Independent Registered Public Accounting Firm
To the Trustees of Variable Insurance Products Fund III and Shareholders of VIP Balanced Portfolio:
We have audited the accompanying statement of assets and liabilities of VIP Balanced Portfolio (the Fund), a fund of Variable Insurance Products Fund III, including the schedule of investments as of December 31, 2006, and the related statement of operations for the year then ended, the statement of changes in net assets for each of the two years in the period then ended, and the financial highlights for each of the five years in the period then ended. These financial statements and financial highlights are the responsibility of the Fund's management. Our responsibility is to express an opinion on these financial statements and financial highlights based on our audits.
We conducted our audits in accordance with standards of the Public Company Accounting Oversight Board (United States). Those standards require that we plan and perform the audit to obtain reasonable assurance about whether the financial statements and financial highlights are free of material misstatement. The Fund is not required to have, nor were we engaged to perform, an audit of its internal control over financial reporting. Our audits included consideration of internal control over financial reporting as a basis for designing audit procedures that are appropriate in the circumstances, but not for the purpose of expressing an opinion on the effectiveness of the Fund's internal control over financial reporting. Accordingly, we express no such opinion. An audit also includes examining, on a test basis, evidence supporting the amounts and disclosures in the financial statements, assessing the accounting principles used and significant estimates made by management, as well as evaluating the overall financial statement presentation. Our procedures included confirmation of securities owned as of December 31, 2006, by correspondence with the custodians and brokers; where replies were not received from brokers, we performed other auditing procedures. We believe that our audits provide a reasonable basis for our opinion.
In our opinion, the financial statements and financial highlights referred to above present fairly, in all material respects, the financial position of VIP Balanced Portfolio as of December 31, 2006, the results of its operations for the year then ended, the changes in its net assets for each of the two years in the period then ended, and its financial highlights for each of the five years in the period then ended, in conformity with accounting principles generally accepted in the United States of America.
DELOITTE & TOUCHE LLP
Boston, Massachusetts
February 22, 2007
Annual Report
Trustees and Officers
The Trustees, Member of the Advisory Board, and executive officers of the trust and fund, as applicable, are listed below. The Board of Trustees governs the fund and is responsible for protecting the interests of shareholders. The Trustees are experienced executives who meet periodically throughout the year to oversee the fund's activities, review contractual arrangements with companies that provide services to the fund, and review the fund's performance. Each of the Trustees oversees 348 funds advised by FMR or an affiliate.
The Trustees hold office without limit in time except that (a) any Trustee may resign; (b) any Trustee may be removed by written instrument, signed by at least two-thirds of the number of Trustees prior to such removal; (c) any Trustee who requests to be retired or who has become incapacitated by illness or injury may be retired by written instrument signed by a majority of the other Trustees; and (d) any Trustee may be removed at any special meeting of shareholders by a two-thirds vote of the outstanding voting securities of the trust. Each Trustee who is not an interested person (as defined in the 1940 Act) (Independent Trustee), shall retire not later than the last day of the calendar year in which his or her 72nd birthday occurs. The Independent Trustees may waive this mandatory retirement age policy with respect to individual Trustees. The executive officers and Advisory Board Member hold office without limit in time, except that any officer and Advisory Board Member may resign or may be removed by a vote of a majority of the Trustees at any regular meeting or any special meeting of the Trustees. Except as indicated, each individual has held the office shown or other offices in the same company for the past five years.
The fund's Statement of Additional Information (SAI) includes more information about the Trustees. To request a free copy, call Fidelity at 1-877-208-0098.
Interested Trustees*:
Correspondence intended for each Trustee who is an interested person may be sent to Fidelity Investments, 82 Devonshire Street, Boston, Massachusetts 02109.
Name, Age; Principal Occupation
Edward C. Johnson 3d (76)
Year of Election or Appointment: 1994
Mr. Johnson is Chairman of the Board of Trustees. Mr. Johnson serves as President (2006-present), Chief Executive Officer, Chairman, and a Director of FMR Corp.; Chairman and a Director of FMR; Chairman and a Director of Fidelity Research & Analysis Company (FRAC); Chairman and a Director of Fidelity Investments Money Management, Inc.; and Chairman (2001-present) and a Director of FMR Co., Inc. In addition, Mr. Johnson serves as Chairman and Director of Fidelity International Limited (FIL).
Robert L. Reynolds (54)
Year of Election or Appointment: 2003
Mr. Reynolds is President and a Director of FMR (2005-present), Fidelity Investments Money Management, Inc. (2005-present), and FMR Co., Inc. (2005-present). Mr. Reynolds also serves as Vice Chairman (2006-present), a Director (2003-present), and Chief Operating Officer of FMR Corp. and a Director of Strategic Advisers, Inc. (2005-present). He also serves on the Board at Fidelity Investments Canada, Ltd.
* Trustees have been determined to be "Interested Trustees" by virtue of, among other things, their affiliation with the trust or various entities under common control with FMR.
Independent Trustees:
Correspondence intended for each Independent Trustee (that is, the Trustees other than the Interested Trustees) may be sent to Fidelity Investments, P.O. Box 55235, Boston, Massachusetts 02205-5235.
Name, Age; Principal Occupation
Dennis J. Dirks (58)
Year of Election or Appointment: 2005
Prior to his retirement in May 2003, Mr. Dirks was Chief Operating Officer and a member of the Board of The Depository Trust & Clearing Corporation (DTCC) (1999-2003). He also served as President, Chief Operating Officer, and Board member of The Depository Trust Company (DTC) (1999-2003) and President and Board member of the National Securities Clearing Corporation (NSCC) (1999-2003). In addition, Mr. Dirks served as Chief Executive Officer and Board member of the Government Securities Clearing Corporation (2001-2003) and Chief Executive Officer and Board member of the Mortgage-Backed Securities Clearing Corporation (2001-2003). Mr. Dirks also serves as a Trustee and a member of the Finance Committee of Manhattan College (2005-present) and a Trustee and a member of the Finance Committee of AHRC of Nassau County (2006-present).
Albert R. Gamper, Jr. (64)
Year of Election or Appointment: 2006
Prior to his retirement in December 2004, Mr. Gamper served as Chairman of the Board of CIT Group Inc. (commercial finance). During his tenure with CIT Group Inc. Mr. Gamper served in numerous senior management positions, including Chairman (1987-1989; 1999-2001; 2002-2004), Chief Executive Officer (1987-2004), and President (1989-2002). He currently serves as a member of the Board of Directors of Public Service Enterprise Group (utilities, 2001-present), Chairman of the Board of Governors, Rutgers University (2004-present), and Chairman of the Board of Saint Barnabas Health Care System.
George H. Heilmeier (70)
Year of Election or Appointment: 2004
Dr. Heilmeier is Chairman Emeritus of Telcordia Technologies (communication software and systems), where prior to his retirement, he served as company Chairman and Chief Executive Officer. He currently serves on the Boards of Directors of The Mitre Corporation (systems engineering and information technology support for the government), and HRL Laboratories (private research and development, 2004-present). He is Chairman of the General Motors Science & Technology Advisory Board and a Life Fellow of the Institute of Electrical and Electronics Engineers (IEEE). Dr. Heilmeier is a member of the Defense Science Board and the National Security Agency Advisory Board. He is also a member of the National Academy of Engineering, the American Academy of Arts and Sciences, and the Board of Overseers of the School of Engineering and Applied Science of the University of Pennsylvania. Previously, Dr. Heilmeier served as a Director of TRW Inc. (automotive, space, defense, and information technology, 1992-2002), Compaq (1994-2002), Automatic Data Processing, Inc. (ADP) (technology-based business outsourcing, 1995-2002), INET Technologies Inc. (telecommunications network surveillance, 2001-2004), and Teletech Holdings (customer management services). He is the recipient of the 2005 Kyoto Prize in Advanced Technology for his invention of the liquid crystal display, and a member of the Consumer Electronics Hall of Fame.
James H. Keyes (66)
Year of Election or Appointment: 2007
Prior to his retirement in 2003, Mr. Keyes was Chairman, President, and Chief Executive Officer of Johnson Controls, Inc. (automotive supplier, 1993-2003). He currently serves as a member of the boards of LSI Logic Corporation (semiconductor technologies), Navistar International Corporation (manufacture and sale of trucks, buses, and diesel engines, 2002-present), and Pitney Bowes, Inc. (integrated mail, messaging, and document management solutions).
Marie L. Knowles (60)
Year of Election or Appointment: 2001
Prior to Ms. Knowles' retirement in June 2000, she served as Executive Vice President and Chief Financial Officer of Atlantic Richfield Company (ARCO) (diversified energy, 1996-2000). From 1993 to 1996, she was a Senior Vice President of ARCO and President of ARCO Transportation Company. She served as a Director of ARCO from 1996 to 1998. She currently serves as a Director of Phelps Dodge Corporation (copper mining and manufacturing) and McKesson Corporation (healthcare service, 2002-present). Ms. Knowles is a Trustee of the Brookings Institution and the Catalina Island Conservancy and also serves as a member of the Advisory Board for the School of Engineering of the University of Southern California.
Ned C. Lautenbach (62)
Year of Election or Appointment: 2000
Mr. Lautenbach is Chairman of the Independent Trustees (2006-present). Mr. Lautenbach has been a partner of Clayton, Dubilier & Rice, Inc. (private equity investment firm) since September 1998. Previously, Mr. Lautenbach was with the International Business Machines Corporation (IBM) from 1968 until his retirement in 1998. Mr. Lautenbach serves as a Director of Sony Corporation (2006-present) and Eaton Corporation (diversified industrial) as well as the Philharmonic Center for the Arts in Naples, Florida. He also is a member of the Board of Trustees of Fairfield University (2005-present), as well as a member of the Council on Foreign Relations.
Cornelia M. Small (62)
Year of Election or Appointment: 2005
Ms. Small is a member (2000-present) and Chairperson (2002-present) of the Investment Committee, and a member (2002-present) of the Board of Trustees of Smith College. Previously, she served as Chief Investment Officer (1999-2000), Director of Global Equity Investments (1996-1999), and a member of the Board of Directors of Scudder, Stevens & Clark (1990-1997) and Scudder Kemper Investments (1997-1999). In addition, Ms. Small served as Co-Chair (2000-2003) of the Annual Fund for the Fletcher School of Law and Diplomacy.
William S. Stavropoulos (67)
Year of Election or Appointment: 2002
Mr. Stavropoulos is Chairman Emeritus of the Board of Directors of The Dow Chemical Company. Since joining The Dow Chemical Company in 1967, Mr. Stavropoulos served in numerous senior management positions, including President (1993-2000; 2002-2003), CEO (1995-2000; 2002-2004), and Chairman of the Executive Committee (2000-2004). Currently, he is a Director of NCR Corporation (data warehousing and technology solutions), BellSouth Corporation (telecommunications), Chemical Financial Corporation, Maersk Inc. (industrial conglomerate, 2002-present), and Metalmark Capital (private equity investment firm, 2005-present). He also serves as a member of the Board of Trustees of the American Enterprise Institute for Public Policy Research. In addition, Mr. Stavropoulos is a member of The Business Council, J.P. Morgan International Council and the University of Notre Dame Advisory Council for the College of Science.
Kenneth L. Wolfe (67)
Year of Election or Appointment: 2005
Prior to his retirement in 2001, Mr. Wolfe was Chairman and Chief Executive Officer of Hershey Foods Corporation (1993-2001). He currently serves as a member of the boards of Adelphia Communications Corporation (2003-present), Bausch & Lomb, Inc., and Revlon Inc. (2004-present).
Advisory Board Member and Executive Officers:
Correspondence intended for each executive officer and Mr. Lynch may be sent to Fidelity Investments, 82 Devonshire Street, Boston, Massachusetts 02109.
Name, Age; Principal Occupation
Peter S. Lynch (62)
Year of Election or Appointment: 2003
Member of the Advisory Board of Variable Insurance Products Fund III. Mr. Lynch is Vice Chairman and a Director of FMR, and Vice Chairman (2001-present) and a Director of FMR Co., Inc. Previously, Mr. Lynch served as a Trustee of the Fidelity funds (1990-2003). In addition, he serves as a Trustee of Boston College and as the Chairman of the Inner-City Scholarship Fund.
Kimberley H. Monasterio (43)
Year of Election or Appointment: 2007
President and Treasurer of VIP Balanced. Ms. Monasterio also serves as President and Treasurer of other Fidelity funds (2007-present) and is an employee of FMR (2004-present). Previously, Ms. Monasterio served as Deputy Treasurer of the Fidelity funds (2004-2006). Before joining Fidelity Investments, Ms. Monasterio served as Treasurer (2000-2004) and Chief Financial Officer (2002-2004) of the Franklin Templeton Funds and Senior Vice President of Franklin Templeton Services, LLC (2000-2004).
Dwight D. Churchill (53)
Year of Election or Appointment: 2005
Vice President of VIP Balanced. Mr. Churchill also serves as Vice President of certain Equity Funds (2005-present). Mr. Churchill is Executive Vice President of FMR (2005-present) and FMR Co., Inc. (2005-present). Previously, Mr. Churchill served as Senior Vice President of Fidelity Investments Money Management, Inc. (2005-2006), Head of Fidelity's Fixed-Income Division (2000-2005), Vice President of Fidelity's Money Market Funds (2000-2005), Vice President of Fidelity's Bond Funds, and Senior Vice President of FMR.
Boyce I. Greer (50)
Year of Election or Appointment: 2005
Vice President of VIP Balanced. Mr. Greer also serves as Vice President of certain Equity Funds (2005-present), certain Asset Allocation Funds (2005-present), Fixed-Income Funds (2006-present), and Money Market Funds (2006-present). Mr. Greer is also a Trustee of other investment companies advised by FMR (2003-present). He is an Executive Vice President of FMR (2005-present) and FMR Co., Inc. (2005-present), and Senior Vice President of Fidelity Investments Money Management, Inc. (2006-present). Previously, Mr. Greer served as a Director and Managing Director of Strategic Advisers, Inc. (2002-2005), and Executive Vice President (2000-2002) and Money Market Group Leader (1997-2002) of the Fidelity Investments Fixed Income Division. He also served as Vice President of Fidelity's Money Market Funds (1997-2002), Senior Vice President of FMR (1997-2002), and Vice President of FIMM (1998-2002).
Bruce T. Herring (41)
Year of Election or Appointment: 2006
Vice President of VIP Balanced. Mr. Herring also serves as Vice President of certain Equity Funds (2006-present). Mr. Herring is Senior Vice President of FMR (2006-present) and Vice President of FMR Co., Inc. (2001-present). Previously, Mr. Herring served as a portfolio manager for Fidelity U.S. Equity Funds (2001-2005).
David L. Murphy (58)
Year of Election or Appointment: 2005
Vice President of VIP Balanced. Mr. Murphy also serves as Vice President of Fidelity's Money Market Funds (2002-present), certain Asset Allocation Funds (2003-present), Fixed-Income Funds (2005-present), and Balanced Funds (2005-present). He serves as Senior Vice President (2000-present) and Head (2004-present) of the Fidelity Investments Fixed Income Division. Mr. Murphy is also a Senior Vice President of Fidelity Investments Money Management, Inc. (2003-present) and an Executive Vice President of FMR (2005-present). Previously, Mr. Murphy served as Money Market Group Leader (2002-2004), Bond Group Leader (2000-2002), and Vice President of Fidelity's Taxable Bond Funds (2000-2002) and Fidelity's Municipal Bond Funds (2001-2002).
Thomas J. Silvia (45)
Year of Election or Appointment: 2005
Vice President of VIP Balanced. Mr. Silvia also serves as Vice President of Fidelity's Fixed-Income Funds (2005-present), certain Balanced Funds (2005-present), certain Asset Allocation Funds (2005-present), and Senior Vice President and Bond Group Leader of the Fidelity Investments Fixed-Income Division (2005-present). Previously, Mr. Silvia served as Director of Fidelity's Taxable Bond portfolio managers (2002-2004) and a portfolio manager in the Bond Group (1997-2004).
Ford O'Neil (44)
Year of Election or Appointment: 2001
Vice President of VIP Balanced. Mr. O'Neil also serves as Vice President of other funds advised by FMR. Prior to assuming his current responsibilities, Mr. O'Neil worked as a research analyst and portfolio manager.
Lawrence Rakers (43)
Year of Election or Appointment: 2005
Vice President of VIP Balanced. Mr. Rakers also serves as Vice President of other funds advised by FMR. Prior to assuming his current responsibilities, Mr. Rakers worked as a research analyst and portfolio manager. Mr. Rakers also serves as Vice President of FMR and FMR Co., Inc. (2002).
Eric D. Roiter (58)
Year of Election or Appointment: 1998
Secretary of VIP Balanced. He also serves as Secretary of other Fidelity funds; Vice President, General Counsel, and Secretary of FMR Co., Inc. (2001-present) and FMR; Assistant Secretary of Fidelity Management & Research (U.K.) Inc. (2001-present), Fidelity Research & Analysis Company (2001-present), and Fidelity Investments Money Management, Inc. (2001-present). Mr. Roiter is an Adjunct Member, Faculty of Law, at Boston College Law School (2003-present). Previously, Mr. Roiter served as Vice President and Secretary of Fidelity Distributors Corporation (FDC) (1998-2005).
Stuart Fross (47)
Year of Election or Appointment: 2003
Assistant Secretary of VIP Balanced. Mr. Fross also serves as Assistant Secretary of other Fidelity funds (2003-present), Vice President and Secretary of FDC (2005-present), and is an employee of FMR.
R. Stephen Ganis (40)
Year of Election or Appointment: 2006
Anti-Money Laundering (AML) officer of VIP Balanced. Mr. Ganis also serves as AML officer of other Fidelity funds (2006-present) and FMR Corp. (2003-present). Before joining Fidelity Investments, Mr. Ganis practiced law at Goodwin Procter, LLP (2000-2002).
Joseph B. Hollis (58)
Year of Election or Appointment: 2006
Chief Financial Officer of VIP Balanced. Mr. Hollis also serves as Chief Financial Officer of other Fidelity funds. Mr. Hollis is President of Fidelity Pricing and Cash Management Services (FPCMS) (2005-present). Mr. Hollis also serves as President and Director of Fidelity Service Company, Inc. (2006-present). Previously, Mr. Hollis served as Senior Vice President of Cash Management Services (1999-2002) and Investment Management Operations (2002-2005).
Kenneth A. Rathgeber (59)
Year of Election or Appointment: 2004
Chief Compliance Officer of VIP Balanced. Mr. Rathgeber also serves as Chief Compliance Officer of other Fidelity funds (2004-present) and Executive Vice President of Risk Oversight for Fidelity Investments (2002-present). He is Chief Compliance Officer of FMR (2005-present), FMR Co., Inc. (2005-present), Fidelity Management & Research (U.K.) Inc. (2005-present), Fidelity Research & Analysis Company (2005-present), Fidelity Investments Money Management, Inc. (2005-present), and Strategic Advisers, Inc. (2005-present). Previously, Mr. Rathgeber served as Executive Vice President and Chief Operating Officer for Fidelity Investments Institutional Services Company, Inc. (1998-2002).
Bryan A. Mehrmann (45)
Year of Election or Appointment: 2005
Deputy Treasurer of VIP Balanced. Mr. Mehrmann also serves as Deputy Treasurer of other Fidelity funds (2005-present) and is an employee of FMR. Previously, Mr. Mehrmann served as Vice President of Fidelity Investments Institutional Services Group (FIIS)/Fidelity Investments Institutional Operations Corporation, Inc. (FIIOC) Client Services (1998-2004).
Kenneth B. Robins (37)
Year of Election or Appointment: 2005
Deputy Treasurer of VIP Balanced. Mr. Robins also serves as Deputy Treasurer of other Fidelity funds (2005-present) and is an employee of FMR (2004-present). Before joining Fidelity Investments, Mr. Robins worked at KPMG LLP, where he was a partner in KPMG's department of professional practice (2002-2004) and a Senior Manager (1999-2000). In addition, Mr. Robins served as Assistant Chief Accountant, United States Securities and Exchange Commission (2000-2002).
Robert G. Byrnes (40)
Year of Election or Appointment: 2005
Assistant Treasurer of VIP Balanced. Mr. Byrnes also serves as Assistant Treasurer of other Fidelity funds (2005-present) and is an employee of FMR (2005-present). Previously, Mr. Byrnes served as Vice President of FPCMS (2003-2005). Before joining Fidelity Investments, Mr. Byrnes worked at Deutsche Asset Management where he served as Vice President of the Investment Operations Group (2000-2003).
John H. Costello (60)
Year of Election or Appointment: 1995
Assistant Treasurer of VIP Balanced. Mr. Costello also serves as Assistant Treasurer of other Fidelity funds and is an employee of FMR.
Peter L. Lydecker (52)
Year of Election or Appointment: 2004
Assistant Treasurer of VIP Balanced. Mr. Lydecker also serves as Assistant Treasurer of other Fidelity funds (2004) and is an employee of FMR.
Mark Osterheld (51)
Year of Election or Appointment: 2002
Assistant Treasurer of VIP Balanced. Mr. Osterheld also serves as Assistant Treasurer of other Fidelity funds (2002) and is an employee of FMR.
Gary W. Ryan (48)
Year of Election or Appointment: 2005
Assistant Treasurer of VIP Balanced. Mr. Ryan also serves as Assistant Treasurer of other Fidelity funds (2005-present) and is an employee of FMR (2005-present). Previously, Mr. Ryan served as Vice President of Fund Reporting in FPCMS (1999-2005).
Salvatore Schiavone (41)
Year of Election or Appointment: 2005
Assistant Treasurer of VIP Balanced. Mr. Schiavone also serves as Assistant Treasurer of other Fidelity funds (2005-present) and is an employee of FMR (2005-present). Before joining Fidelity Investments, Mr. Schiavone worked at Deutsche Asset Management, where he most recently served as Assistant Treasurer (2003-2005) of the Scudder Funds and Vice President and Head of Fund Reporting (1996-2003).
Annual Report
Distributions
The Board of Trustees of VIP III Balanced Portfolio voted to pay to shareholders of record at the opening of business on record date, the following distributions per share derived from capital gains realized from sales of portfolio securities, and dividends derived from net investment income:
Pay Date
Record Date
Dividends
Capital Gains
Initial Class
02/09/07
02/09/07
$.294
$.62
Service Class
02/09/07
02/09/07
$.272
$.62
Service Class 2
02/09/07
02/09/07
$.267
$.62
Investor Class
02/09/07
02/09/07
$.289
$.62
The fund hereby designates as a capital gain dividend with respect to the taxable year ended December 31, 2006, $6,314,078, or, if subsequently determined to be different, the net capital gain of such year.
A total of 10.34% of the dividends distributed during the fiscal year was derived from interest on U.S. Government securities which is generally exempt from state income tax.
Initial Class designates 39%; Service Class designates 41%; Service Class 2 designates 44%; and Investor Class designates 38% of the dividends distributed in February 2006 as qualifying for the dividends-received deduction for corporate shareholders.
The fund will notify shareholders in January 2007 of amounts for use in preparing 2006 income tax returns.
Annual Report
Proxy Voting Results
A special meeting of the fund's shareholders was held on November 15, 2006. The results of votes taken among shareholders on the proposal before them are reported below. Each vote reported represents one dollar of net asset value held on the record date for the meeting.
PROPOSAL 1
To elect a Board of Trustees. A
# of Votes
% of Votes
Dennis J. Dirks
Affirmative
8,022,573,906.52
96.057
Withheld
329,291,624.43
3.943
TOTAL
8,351,865,530.95
100.000
Albert R. Gamper, Jr.
Affirmative
8,017,939,119.36
96.002
Withheld
333,926,411.59
3.998
TOTAL
8,351,865,530.95
100.000
Robert M. Gates
Affirmative
8,011,581,068.50
95.926
Withheld
340,284,462.45
4.074
TOTAL
8,351,865,530.95
100.000
George H. Heilmeier
Affirmative
8,000,846,196.79
95.797
Withheld
351,019,334.16
4.203
TOTAL
8,351,865,530.95
100.000
Edward C. Johnson 3d
Affirmative
7,992,112,301.22
95.693
Withheld
359,753,229.73
4.307
TOTAL
8,351,865,530.95
100.000
Stephen P. Jonas
Affirmative
8,019,883,742.95
96.025
Withheld
331,981,788.00
3.975
TOTAL
8,351,865,530.95
100.000
James H. KeyesB
Affirmative
8,015,436,547.06
95.972
Withheld
336,428,983.89
4.028
TOTAL
8,351,865,530.95
100.000
Marie L. Knowles
Affirmative
8,015,361,874.49
95.971
Withheld
336,503,656.46
4.029
TOTAL
8,351,865,530.95
100.000
Ned C. Lautenbach
Affirmative
8,018,503,793.25
96.009
Withheld
333,361,737.70
3.991
TOTAL
8,351,865,530.95
100.000
# of Votes
% of Votes
William O. McCoy
Affirmative
8,000,170,571.19
95.789
Withheld
351,694,959.76
4.211
TOTAL
8,351,865,530.95
100.000
Robert L. Reynolds
Affirmative
8,020,815,676.67
96.036
Withheld
331,049,854.28
3.964
TOTAL
8,351,865,530.95
100.000
Cornelia M. Small
Affirmative
8.020,146,516.32
96.028
Withheld
331,719,014.63
3.972
TOTAL
8,351,865,530.95
100.000
William S. Stavropoulos
Affirmative
8,009,250,640.78
95.898
Withheld
342,614,890.17
4.102
TOTAL
8,351,865,530.95
100.000
Kenneth L. Wolfe
Affirmative
8,013,187,941.55
95.945
Withheld
338,677,589.40
4.055
TOTAL
8,351,865,530.95
100.000
ADenotes trust-wide proposal and voting results.
BEffective on or about January 1, 2007.
Annual Report
Board Approval of Investment Advisory Contracts and Management Fees
VIP Balanced Portfolio
Each year, typically in July, the Board of Trustees, including the Independent Trustees (together, the Board), votes on the renewal of the management contract and sub-advisory agreements (together, the Advisory Contracts) for the fund. The Board, assisted by the advice of fund counsel and Independent Trustees' counsel, requests and considers a broad range of information throughout the year.
The Board meets regularly each month except August and takes into account throughout the year matters bearing on Advisory Contracts. The Board, acting directly and through its separate committees, considers at each of its meetings factors that are relevant to the annual renewal of the fund's Advisory Contracts, including the services and support provided to the fund and its shareholders. At the time of the renewal, the Board had 12 standing committees, each composed of Independent Trustees with varying backgrounds, to which the Board has assigned specific subject matter responsibilities in order to enhance effective decision-making by the Board. Each committee has adopted a written charter outlining the structure and purposes of the committee. One such committee, the Equity Contract Committee, meets periodically as needed throughout the year to consider matters specifically related to the annual renewal of Advisory Contracts. The committee requests and receives information on, and makes recommendations to the Independent Trustees concerning, the approval and annual review of the Advisory Contracts.
At its July 2006 meeting, the Board of Trustees, including the Independent Trustees, unanimously determined to renew the Advisory Contracts for the fund. In reaching its determination, the Board considered all factors it believed relevant, including (i) the nature, extent, and quality of the services to be provided to the fund and its shareholders (including the investment performance of the fund); (ii) the competitiveness of the management fee and total expenses of the fund; (iii) the total costs of the services to be provided by and the profits to be realized by the investment adviser and its affiliates from the relationship with the fund; (iv) the extent to which economies of scale would be realized as the fund grows; and (v) whether fee levels reflect these economies of scale, if any, for the benefit of fund shareholders.
In determining whether to renew the Advisory Contracts for the fund, the Board ultimately reached a determination, with the assistance of fund counsel and Independent Trustees' counsel, that the renewal of the Advisory Contracts and the compensation to be received by Fidelity under the management contract is consistent with Fidelity's fiduciary duty under applicable law. In addition to evaluating the specific factors noted above, the Board, in reaching its determination, is aware that shareholders in the fund have a broad range of investment choices available to them, including a wide choice among mutual funds offered by competitors to Fidelity, and that the fund's shareholders, with the opportunity to review and weigh the disclosure provided by the fund in its prospectus and other public disclosures, have chosen to invest in this fund, managed by Fidelity.
Nature, Extent, and Quality of Services Provided. The Board considered staffing within the investment adviser, FMR, and the sub-advisers (together, the Investment Advisers), including the backgrounds of the fund's portfolio managers and the fund's investment objective and discipline. The Independent Trustees also had discussions with senior management of Fidelity's investment operations and investment groups. The Board considered the structure of the portfolio manager compensation program and whether this structure provides appropriate incentives.
Resources Dedicated to Investment Management and Support Services. The Board reviewed the size, education, and experience of the Investment Advisers' investment staff, their use of technology, and the Investment Advisers' approach to recruiting, training, and retaining portfolio managers and other research, advisory, and management personnel. The Board considered Fidelity's extensive global research capabilities that enable the Investment Advisers to aggregate data from various sources in an effort to produce positive investment results. The Board noted that Fidelity's analysts have access to a variety of technological tools that enable them to perform both fundamental and quantitative analysis and to specialize in various disciplines. The Board also considered that Fidelity's portfolio managers and analysts have access to daily portfolio attribution that allows for monitoring of a fund's portfolio, as well as an electronic communication system that provides immediate real-time access to research concerning issuers and credit enhancers.
Shareholder and Administrative Services. The Board considered (i) the nature, extent, quality, and cost of administrative, distribution, and shareholder services performed by the Investment Advisers and their affiliates under the Advisory Contracts and under separate agreements covering transfer agency, pricing and bookkeeping, and securities lending services for the fund; (ii) the nature and extent of the Investment Advisers' supervision of third party service providers, principally custodians and subcustodians; and (iii) the resources devoted to, and the record of compliance with, the fund's compliance policies and procedures. The Board reviewed the allocation of fund brokerage, including allocations to brokers affiliated with the Investment Advisers, the use of brokerage commissions to pay fund expenses, and the use of "soft" commission dollars to pay for research services. The Board also considered that Fidelity voluntarily pays for market data out of its own resources.
The Board noted that the growth of fund assets across the complex allows Fidelity to reinvest in the development of services designed to enhance the value or convenience of the Fidelity funds as investment vehicles. These services include 24-hour access to account information and market information through phone representatives and over the Internet, and investor education materials and asset allocation tools.
Investment in a Large Fund Family. The Board considered the benefits to shareholders of investing in a Fidelity fund, including the benefits of investing in a fund that is part of a large family of funds offering a variety of investment disciplines and providing for a large variety of mutual fund investor services. The Board noted that, since the last Advisory Contract renewals in July 2005, Fidelity has taken a number of actions that benefited particular funds, including (i) dedicating additional resources to investment research and to restructure the investment research teams; (ii) voluntarily entering into contractual arrangements with certain brokers pursuant to which Fidelity pays for research products and services separately out of its own resources, rather than bundling with fund commissions; (iii) launching the Fidelity Advantage Class of its five Spartan stock index funds and three Spartan bond index funds, which is a lower-fee class available to shareholders with higher account balances; (iv) contractually agreeing to impose expense limitations on Fidelity U.S. Bond Index Fund and reducing the fund's initial investment minimum; and (v) offering shareholders of each of the Fidelity Institutional Money Market Funds the privilege of exchanging shares of the fund for shares of other Fidelity funds.
Annual Report
Board Approval of Investment Advisory Contracts and Management Fees - continued
Investment Performance and Compliance. The Board considered whether the fund has operated within its investment objective, as well as its record of compliance with its investment restrictions. It also reviewed the fund's absolute investment performance for each class (except Investor Class), as well as the fund's relative investment performance for each class (except Investor Class) measured against (i) a proprietary custom index, and (ii) a peer group of mutual funds deemed appropriate by the Board over multiple periods. The following charts considered by the Board show, over the one-, three-, and five-year periods ended December 31, 2005, the cumulative total returns of Service Class 2 and Initial Class of the fund, the cumulative total returns of a proprietary custom index ("benchmark"), and a range of cumulative total returns of a peer group of mutual funds identified by Lipper Inc. as having an investment objective similar to that of the fund. The returns of Service Class 2 and Initial Class represent the performance of classes with the highest and lowest 12b-1 fees, respectively (not necessarily with the highest and lowest total expenses). (Investor Class of the fund, which has no 12b-1 fee, had less than one year of performance as of December 31, 2005.) The box within each chart shows the 25th percentile return (bottom of box) and the 75th percentile return (top of box) of the Lipper peer group. Returns shown above the box are in the first quartile and returns shown below the box are in the fourth quartile. The percentage beaten numbers noted below each chart correspond to the percentile box and represent the percentage of funds in the Lipper peer group whose performance was equal to or lower than that of the class indicated. The fund's proprietary custom index is an index developed by FMR that represents the performance of the fund's general investment categories in both equity and bond securities.
VIP Balanced Portfolio
The Board reviewed the fund's relative investment performance against its Lipper peer group and stated that the performance of Initial Class of the fund was in the second quartile for the one- and five-year periods and the fourth quartile for the three-year period. The Board also stated that the relative investment performance of the fund was lower than its benchmark for the three- and five-year periods, although the cumulative total return of Initial Class of the fund compared favorably to its benchmark for the one-year period. The Board considered that the variations in performance among the fund's classes reflect the variations in class expenses, which result in lower performance for higher expense classes.
The Board considered that FMR has taken steps to refocus and strengthen equity research, equity portfolio management, and compliance. The Board noted with favor FMR's reorganization of its senior management team in 2005 and FMR's dedication of additional resources to investment research, and participated in the process that led to those changes.
Based on its review, and giving particular weight to the nature and quality of the resources dedicated by the Investment Advisers to maintain and improve relative performance, the Board concluded that the nature, extent, and quality of the services provided to the fund will benefit the fund's shareholders, particularly in light of the Board's view that the fund's shareholders benefit from investing in a fund that is part of a large family of funds offering a variety of investment disciplines and services.
Competitiveness of Management Fee and Total Fund Expenses. The Board considered the fund's management fee and total expenses compared to "mapped groups" of competitive funds and classes. Fidelity creates "mapped groups" by combining similar Lipper investment objective categories that have comparable management fee characteristics. Combining Lipper investment objective categories aids the Board's management fee and total expense comparisons by broadening the competitive group used for comparison and by reducing the number of universes to which various Fidelity funds are compared.
VIP Balanced Portfolio
The Board considered two proprietary management fee comparisons for the 12-month periods shown in the chart below. The group of Lipper funds used by the Board for management fee comparisons is referred to below as the "Total Mapped Group" and, for the reasons explained above, is broader than the Lipper peer group used by the Board for performance comparisons. The Total Mapped Group comparison focuses on a fund's standing relative to the total universe of comparable funds available to investors, in terms of gross management fees before expense reimbursements or caps. "TMG %" represents the percentage of funds in the Total Mapped Group that had management fees that were lower than the fund's. For example, a TMG % of 7% means that 93% of the funds in the Total Mapped Group had higher management fees than the fund. The "Asset-Size Peer Group" (ASPG) comparison focuses on a fund's standing relative to non-Fidelity funds similar in size to the fund within the Total Mapped Group. The ASPG represents at least 15% of the funds in the Total Mapped Group with comparable asset size and management fee characteristics, subject to a minimum of 50 funds (or all funds in the Total Mapped Group if fewer than 50). Additional information, such as the ASPG quartile in which the fund's management fee ranked, is also included in the chart and considered by the Board.
VIP Balanced Portfolio
The Board noted that the fund's management fee ranked below the median of its Total Mapped Group and below the median of its ASPG for 2005.
Based on its review, the Board concluded that the fund's management fee was fair and reasonable in light of the services that the fund receives and the other factors considered.
In its review of each class's total expenses, the Board considered the fund's management fee as well as other fund or class expenses, as applicable, such as transfer agent fees, pricing and bookkeeping fees, fund-paid 12b-1 fees, and custodial, legal, and audit fees. The Board also noted the effects of any waivers and reimbursements on fees and expenses. As part of its review, the Board also considered current and historical total expenses of each class of the fund compared to competitive fund median expenses. Each class of the fund is compared to those funds and classes in the Total Mapped Group (used by the Board for management fee comparisons) that have a similar sales load structure.
The Board noted that the total expenses of each class ranked below its competitive median for 2005.
In its review of total expenses, the Board also considered Fidelity fee structures and other information on clients that FMR and its affiliates service in other competitive markets, such as other mutual funds advised or subadvised by FMR or its affiliates, pension plan clients, and other institutional clients.
Based on its review, the Board concluded that the total expenses of each class of the fund were reasonable in light of the services that the fund and its shareholders receive and the other factors considered.
Costs of the Services and Profitability. The Board considered the revenues earned and the expenses incurred by Fidelity in conducting the business of developing, marketing, distributing, managing, administering and servicing the fund and its shareholders. The Board also considered the level of Fidelity's profits in respect of all the Fidelity funds.
Annual Report
Board Approval of Investment Advisory Contracts and Management Fees - continued
On an annual basis, FMR presents to the Board Fidelity's profitability for the fund. Fidelity calculates the profitability for each fund, as well as aggregate profitability for groups of Fidelity funds and all Fidelity funds, using a series of detailed revenue and cost allocation methodologies which originate with the audited books and records of Fidelity. The Audit Committee of the Board reviews any significant changes from the prior year's methodologies.
PricewaterhouseCoopers LLP (PwC), independent registered accounting firm and auditor to Fidelity and certain Fidelity funds, has been engaged annually by the Board as part of the Board's assessment of the results of Fidelity's profitability analysis. PwC's engagement includes the review and assessment of Fidelity's methodologies used in determining the revenues and expenses attributable to Fidelity's mutual fund business, and completion of agreed-upon procedures surrounding the mathematical accuracy of fund profitability and its conformity to allocation methodologies. After considering PwC's reports issued under the engagement and information provided by Fidelity, the Board believes that while other allocation methods may also be reasonable, Fidelity's profitability methodologies are reasonable in all material respects.
The Board has also reviewed Fidelity's non-fund businesses and any fall-out benefits related to the mutual fund business as well as cases where Fidelity's affiliates may benefit from or be related to the fund's business.
The Board considered the costs of the services provided by and the profits realized by Fidelity in connection with the operation of the fund and determined that the amount of profit is a fair entrepreneurial profit for the management of the fund.
Economies of Scale. The Board considered whether there have been economies of scale in respect of the management of the Fidelity funds, whether the Fidelity funds (including the fund) have appropriately benefited from any such economies of scale, and whether there is potential for realization of any further economies of scale. The Board considered the extent to which the fund will benefit from economies of scale through increased services to the fund, through waivers or reimbursements, or through fee or expense reductions.
The Board recognized that the fund's management contract incorporates a "group fee" structure, which provides for lower fee rates as total fund assets under FMR's management increase, and for higher fee rates as total fund assets under FMR's management decrease. The Board considered that the group fee is designed to deliver the benefits of economies of scale to fund shareholders when total fund assets increase, even if assets of any particular fund are unchanged or have declined, because some portion of Fidelity's costs are attributable to services provided to all Fidelity funds, and all funds benefit if those costs can be allocated among more assets. The Board concluded that, given the group fee structure, fund shareholders will achieve a certain level of economies of scale as assets under FMR's management increase at the fund complex level, regardless of whether Fidelity achieves any such economies of scale.
The Board further concluded that any potential economies of scale are being shared between fund shareholders and Fidelity in an appropriate manner.
Additional Information Requested by the Board. In order to develop fully the factual basis for consideration of the Advisory Contracts, the Board requested additional information on several topics, including (i) Fidelity's fund profitability methodology and profitability trends within certain funds; (ii) portfolio manager compensation; (iii) the extent to which any economies of scale exist and are shared between the funds and Fidelity; (iv) the total expenses of certain funds and classes relative to competitors, including the extent to which the expenses of certain funds have been or could be capped; (v) fund performance trends; and (vi) Fidelity's fee structures, including use of performance fees.
Based on its evaluation of all of the conclusions noted above, and after considering all material factors, the Board ultimately concluded that the advisory fee structures are fair and reasonable, and that the fund's Advisory Contracts should be renewed.
VIP Balanced Portfolio
Investment Adviser
Fidelity Management & Research Company Boston, MA
Investment Sub-Advisers
FMR Co., Inc.
Fidelity Investments Money Management, Inc.
Fidelity Management & Research (U.K.) Inc.
Fidelity Research & Analysis Company (formerly Fidelity Management & Research (Far East) Inc.)
Fidelity Investments Japan Limited
Fidelity International Investment Advisors
Fidelity International Investment Advisors (U.K.) Limited
General Distributor
Fidelity Distributors Corporation Boston, MA
Transfer and Service Agents
Fidelity Investments Institutional Operations Co., Inc. Boston, MA
Fidelity Service Company, Inc. Boston, MA
Custodian
JPMorgan Chase Bank New York, NY
VIPBAL-ANN-0207 1.540208.109
Fidelity® Variable Insurance Products: Dynamic Capital Appreciation Portfolio
To view a fund's proxy voting guidelines and proxy voting record for the 12-month period ended June 30, visit www.fidelity.com/proxyvotingresults or visit the Securities and Exchange Commission's (SEC) web site at www.sec.gov. You may also call 1-877-208-0098 to request a free copy of the proxy voting guidelines.
Fidelity Variable Insurance Products are separate account options which are purchased through a variable insurance contract.
Standard & Poor's, S&P and S&P 500 are registered service marks of The McGraw-Hill Companies, Inc. and have been licensed for use by Fidelity Distributors Corporation.
Other third party marks appearing herein are the property of their respective owners.
All other marks appearing herein are registered or unregistered trademarks or service marks of FMR Corp. or an affiliated company.
This report and the financial statements contained herein are submitted for the general information of the shareholders of the fund. This report is not authorized for distribution to prospective investors in the fund unless preceded or accompanied by an effective prospectus.
A fund files its complete schedule of portfolio holdings with the SEC for the first and third quarters of each fiscal year on Form N-Q. Forms N-Q are available on the SEC's web site at http://www.sec.gov. A fund's Forms N-Q may be reviewed and copied at the SEC's Public Reference Room in Washington, DC. Information regarding the operation of the SEC's Public Reference Room may be obtained by calling 1-800-SEC-0330. For a complete list of a fund's portfolio holdings, view the most recent quarterly holdings report, semiannual report, or annual report on Fidelity's web site at http://www.advisor.fidelity.com.
NOT FDIC INSURED· MAY LOSE VALUE· NO BANK GUARANTEE
Neither the fund nor Fidelity Distributors Corporation is a bank.
Semiannual Report
VIP Dynamic Capital Appreciation Portfolio
Performance: The Bottom Line
Average annual total return reflects the change in the value of an investment, assuming reinvestment of the class' dividend income and capital gains (the profits earned upon the sale of securities that have grown in value) and assuming a constant rate of performance each year. During periods of reimbursement by Fidelity, a fund's total return will be greater than it would be had the reimbursement not occurred. Performance numbers are net of all underlying fund operating expenses, but do not include any insurance charges imposed by your insurance company's separate account. If performance information included the effect of these additional charges, the total returns would have been lower. How a fund did yesterday is no guarantee of how it will do tomorrow.
Average Annual Total Returns
Periods ended December 31, 2006
Past 1 year
Past 5 years
Life of fund A
VIP Dynamic Capital Appreciation - Initial Class
13.97%
10.27%
-0.07%
VIP Dynamic Capital Appreciation - Service Class B
13.99%
10.16%
-0.18%
VIP Dynamic Capital Appreciation - Service Class 2 C
13.81%
9.94%
-0.33%
VIP Dynamic Capital Appreciation - Investor Class D
13.87%
10.25%
-0.08%
AFrom September 25, 2000.
B Performance for Service Class shares reflects an asset-based service fee (12b-1 fee).
C Performance for Service Class 2 shares reflects an asset-based service fee (12b-1 fee).
D The initial offering of Investor Class shares took place on July 21, 2005. Returns prior to July 21, 2005 are those of Initial Class. If Investor Class's transfer agent fee had been reflected, returns prior to July 21, 2005 would have been lower.
$10,000 Over Life of Fund
Let's say hypothetically that $10,000 was invested in VIP Dynamic Capital Appreciation Portfolio - Initial Class on September 25, 2000, when the fund started. The chart shows how the value of your investment would have changed, and also shows how the Standard & Poor's 500SM Index performed over the same period.
Annual Report
VIP Dynamic Capital Appreciation Portfolio
Management's Discussion of Fund Performance
Comments from Fergus Shiel, Portfolio Manager of VIP Dynamic Capital Appreciation Portfolio
U.S. stock markets registered their fourth consecutive year of positive returns in 2006. Among the highlights were the performances of the Dow Jones Industrial AverageSM - a gauge of 30 mega-cap, blue-chip stocks - and the small-cap-oriented Russell 2000® Index, both of which reached new highs. The efforts of the Federal Reserve Board to contain inflation levels also dominated the investment headlines. In all, the Fed hiked short-term interest rates four times, but held rates steady after its June 29 increase, finally pausing after 17 rate hikes over a two-year period. A slowing residential housing market and moderating oil prices - the latter of which hit a record closing high of $77 per barrel in July before falling sharply - also held economic growth in check. For the year overall, the Standard & Poor's 500SM Index was up 15.79%, the Dow advanced 19.05%, the Russell 2000 Index gained 18.37% and the NASDAQ Composite® Index rose 10.39%.
In 2006, the fund trailed the S&P 500®. (For specific portfolio performance results, please refer to the performance section of this report.) Some of the weaker performing stocks were in information technology, a sector I substantially reduced during the period. Versus the index, our results in technology suffered because of both unfavorable stock selection and an overweighting of the sector. Untimely picks in energy and health care also undermined performance. The fund was especially hurt by its positioning in stocks with market capitalizations of $50 billion and above - in other words, the very largest stocks. Not owning two major index components, energy giant Exxon Mobil and network equipment maker Cisco Systems, was counterproductive, as both stocks handily beat the S&P 500. Other detractors included personal computer chip maker Advanced Micro Devices, cellular handset maker Motorola and Career Education, a for-profit education company. I sold both Advanced Micro Devices and Career Education during the year. Conversely, stock selection in industrials and materials boosted performance. Allegheny Technologies, a maker of the titanium alloys used in commercial aircraft manufacturing, was a key contributor. A strong production cycle in the aerospace industry enabled the stock to post a triple-digit gain. Media stock Walt Disney, the fund's largest holding at period end, also helped, along with Switzerland-based ABB, a provider of power and automation equipment for utility and industrial customers, and teen clothing retailer American Eagle Outfitters. ABB was one of a number of foreign stocks I bought, which in part explains the large drop in the fund's cash position.
The views expressed above reflect those of the portfolio manager(s) only through the end of the period as stated on the cover of this report and do not necessarily represent the views of Fidelity or any other person in the Fidelity organization. Any such views are subject to change at any time based upon market or other conditions and Fidelity disclaims any responsibility to update such views. These views may not be relied on as investment advice and, because investment decisions for a Fidelity fund are based on numerous factors, may not be relied on as an indication of trading intent on behalf of any Fidelity fund.
Annual Report
VIP Dynamic Capital Appreciation Portfolio
Shareholder Expense Example
As a shareholder of the Fund, you incur two types of costs: (1) transaction costs, and (2) ongoing costs, including management fees, distribution and/or service (12b-1) fees and other Fund expenses. This Example is intended to help you understand your ongoing costs (in dollars) of investing in the Fund and to compare these costs with the ongoing costs of investing in other mutual funds.
The Example is based on an investment of $1,000 invested at the beginning of the period and held for the entire period (July 1, 2006 to December 31, 2006).
Actual Expenses
The first line of the accompanying table for each class of the Fund provides information about actual account values and actual expenses. You may use the information in this line, together with the amount you invested, to estimate the expenses that you paid over the period. Simply divide your account value by $1,000.00 (for example, an $8,600 account value divided by $1,000.00 = 8.6), then multiply the result by the number in the first line for a class of the Fund under the heading entitled "Expenses Paid During Period" to estimate the expenses you paid on your account during this period. The estimate of expenses does not include any fees or other expenses of any variable annuity or variable life insurance product. If they were, the estimate of expenses you paid during the period would be higher, and your ending account value would be lower.
Hypothetical Example for Comparison Purposes
The second line of the accompanying table for each class of the Fund provides information about hypothetical account values and hypothetical expenses based on a Class' actual expense ratio and an assumed rate of return of 5% per year before expenses, which is not the Class' actual return. The hypothetical account values and expenses may not be used to estimate the actual ending account balance or expenses you paid for the period. You may use this information to compare the ongoing costs of investing in the Fund and other funds. To do so, compare this 5% hypothetical example with the 5% hypothetical examples that appear in the shareholder reports of the other funds. The estimate of expenses does not include any fees or other expenses of any variable annuity or variable life insurance product. If they were, the estimate of expenses you paid during the period would be higher, and your ending account value would be lower.
Please note that the expenses shown in the table are meant to highlight your ongoing costs only and do not reflect any transaction costs. Therefore, the second line of the table is useful in comparing ongoing costs only, and will not help you determine the relative total costs of owning different funds.
Beginning Account Value July 1, 2006
Ending Account Value December 31, 2006
Expenses Paid During Period* July 1, 2006 to December 31, 2006
Initial Class
Actual
$ 1,000.00
$ 1,080.40
$ 3.99
Hypothetical A
$ 1,000.00
$ 1,021.37
$ 3.87
Service Class
Actual
$ 1,000.00
$ 1,081.20
$ 4.51
Hypothetical A
$ 1,000.00
$ 1,020.87
$ 4.38
Service Class 2
Actual
$ 1,000.00
$ 1,080.20
$ 5.45
Hypothetical A
$ 1,000.00
$ 1,019.96
$ 5.30
Investor Class
Actual
$ 1,000.00
$ 1,080.70
$ 4.67
Hypothetical A
$ 1,000.00
$ 1,020.72
$ 4.53
A5% return per year before expenses
* Expenses are equal to each Class' annualized expense ratio (shown in the table below); multiplied by the average account value over the period, multiplied by 184/365 (to reflect the one-half year period).
Annualized Expense Ratio
Initial Class
.76%
Service Class
.86%
Service Class 2
1.04%
Investor Class
.89%
Annual Report
VIP Dynamic Capital Appreciation Portfolio
Investment Changes
Top Ten Stocks as of December 31, 2006
% of fund's net assets
% of fund's net assets 6 months ago
The Walt Disney Co.
4.6
4.4
Monsanto Co.
3.3
1.2
Qwest Communications International, Inc.
3.2
2.2
Biogen Idec, Inc.
3.2
1.8
Morgan Stanley
3.1
0.2
General Electric Co.
3.0
1.4
Abercrombie & Fitch Co. Class A
2.6
1.8
Burlington Northern Santa Fe Corp.
2.5
1.4
Goldman Sachs Group, Inc.
2.4
0.0
Norfolk Southern Corp.
2.2
1.8
30.1
Top Five Market Sectors as of December 31, 2006
% of fund's net assets
% of fund's net assets 6 months ago
Industrials
21.5
20.6
Consumer Discretionary
19.2
18.6
Information Technology
14.6
11.8
Health Care
12.0
9.7
Financials
11.9
3.9
Asset Allocation (% of fund's net assets)
As of December 31, 2006 *
As of June 30, 2006 **
Stocks 99.0%
Stocks 93.9%
Short-Term Investments and Net Other Assets 1.0%
Short-Term Investments and Net Other Assets 6.1%
* Foreign investments
20.8%
** Foreign investments
9.1%
Annual Report
VIP Dynamic Capital Appreciation Portfolio
Investments December 31, 2006
Showing Percentage of Net Assets
Common Stocks - 99.0%
Shares
Value (Note 1)
CONSUMER DISCRETIONARY - 19.2%
Automobiles - 0.4%
Fiat Spa (a)
21,126
$ 403,520
Diversified Consumer Services - 0.2%
Corinthian Colleges, Inc. (a)
18,842
256,816
Hotels, Restaurants & Leisure - 2.6%
Accor SA
19,500
1,511,167
Ambassadors Group, Inc.
3,183
96,604
Las Vegas Sands Corp. (a)
6,200
554,776
Six Flags, Inc.
40,400
211,696
Wynn Resorts Ltd.
3,691
346,400
2,720,643
Household Durables - 2.0%
Whirlpool Corp.
25,494
2,116,512
Media - 6.6%
Dow Jones & Co., Inc.
26,800
1,018,400
EchoStar Communications Corp. Class A (a)
2,300
87,469
Mediacom Communications Corp. Class A (a)
18,776
150,959
Pearson PLC
36,700
554,545
The McClatchy Co. Class A
2,300
99,590
The Walt Disney Co.
142,900
4,897,184
Viacom, Inc. Class B (non-vtg.) (a)
6,100
250,283
7,058,430
Multiline Retail - 2.3%
Federated Department Stores, Inc.
8,000
305,040
Saks, Inc.
8,800
156,816
Sears Holdings Corp. (a)
4,633
778,020
Target Corp.
21,900
1,249,395
2,489,271
Specialty Retail - 4.2%
Abercrombie & Fitch Co. Class A
39,200
2,729,496
American Eagle Outfitters, Inc.
32,656
1,019,194
Gymboree Corp. (a)
13,700
522,792
Wet Seal, Inc. Class A (a)
26,400
176,088
4,447,570
Textiles, Apparel & Luxury Goods - 0.9%
Deckers Outdoor Corp. (a)
11,200
671,440
Wolverine World Wide, Inc.
9,000
256,680
928,120
TOTAL CONSUMER DISCRETIONARY
20,420,882
CONSUMER STAPLES - 2.0%
Food & Staples Retailing - 1.2%
Tesco PLC
33,200
263,022
Wal-Mart Stores, Inc.
17,496
807,965
Whole Foods Market, Inc.
4,700
220,571
1,291,558
Shares
Value (Note 1)
Tobacco - 0.8%
Reynolds American, Inc.
12,900
$ 844,563
TOTAL CONSUMER STAPLES
2,136,121
FINANCIALS - 11.9%
Capital Markets - 8.5%
E*TRADE Financial Corp.
28,300
634,486
Goldman Sachs Group, Inc.
12,800
2,551,680
Jefferies Group, Inc.
30,201
809,991
Man Group PLC
101,230
1,036,425
Morgan Stanley
40,700
3,314,201
UBS AG (NY Shares)
10,800
651,564
8,998,347
Commercial Banks - 0.8%
Barclays PLC Sponsored ADR
15,200
883,728
Consumer Finance - 1.9%
American Express Co.
33,500
2,032,445
Diversified Financial Services - 0.6%
Deutsche Boerse AG
3,300
607,406
Thrifts & Mortgage Finance - 0.1%
Clayton Holdings, Inc.
7,200
134,712
TOTAL FINANCIALS
12,656,638
HEALTH CARE - 12.0%
Biotechnology - 4.6%
Biogen Idec, Inc. (a)
68,655
3,377,139
Genentech, Inc. (a)
12,500
1,014,125
MedImmune, Inc. (a)
15,400
498,498
4,889,762
Health Care Equipment & Supplies - 0.5%
Baxter International, Inc.
11,100
514,929
Health Care Providers & Services - 1.5%
Brookdale Senior Living, Inc.
15,580
747,840
UnitedHealth Group, Inc.
3,400
182,682
VCA Antech, Inc. (a)
22,500
724,275
1,654,797
Pharmaceuticals - 5.4%
Elan Corp. PLC sponsored ADR (a)
113,745
1,677,739
Johnson & Johnson
28,800
1,901,376
Merck & Co., Inc.
46,299
2,018,636
Pfizer, Inc.
6,800
176,120
5,773,871
TOTAL HEALTH CARE
12,833,359
INDUSTRIALS - 21.5%
Aerospace & Defense - 0.7%
General Dynamics Corp.
2,700
200,745
Goodrich Corp.
7,200
327,960
Common Stocks - continued
Shares
Value (Note 1)
INDUSTRIALS - continued
Aerospace & Defense - continued
Hexcel Corp. (a)
6,700
$ 116,647
Teledyne Technologies, Inc. (a)
1,238
49,681
695,033
Airlines - 2.5%
AMR Corp. (a)
46,700
1,411,741
Ryanair Holdings PLC sponsored ADR (a)
14,200
1,157,300
US Airways Group, Inc. (a)
2,600
140,010
2,709,051
Building Products - 0.1%
Kingspan Group PLC (Ireland)
4,100
108,635
Commercial Services & Supplies - 1.1%
Fuel Tech, Inc. (a)
15,135
372,926
RPS Group PLC
12,200
64,515
Stericycle, Inc. (a)
9,392
709,096
1,146,537
Construction & Engineering - 0.3%
Foster Wheeler Ltd. (a)
5,100
281,214
Electrical Equipment - 4.2%
ABB Ltd. sponsored ADR
76,400
1,373,672
Alstom SA (a)
15,000
2,033,768
Rockwell Automation, Inc.
6,517
398,058
Schneider Electric SA
6,400
710,584
4,516,082
Industrial Conglomerates - 4.4%
General Electric Co.
85,400
3,177,734
McDermott International, Inc. (a)
29,150
1,482,569
4,660,303
Machinery - 3.1%
Deere & Co.
22,860
2,173,300
Flow International Corp. (a)
25,049
276,040
Flowserve Corp. (a)
8,700
439,089
Invensys PLC (a)
76,700
413,483
3,301,912
Road & Rail - 4.7%
Burlington Northern Santa Fe Corp.
35,750
2,638,708
Norfolk Southern Corp.
47,642
2,395,916
5,034,624
Trading Companies & Distributors - 0.4%
WESCO International, Inc. (a)
7,900
464,599
TOTAL INDUSTRIALS
22,917,990
INFORMATION TECHNOLOGY - 14.6%
Communications Equipment - 3.6%
Harris Corp.
2,900
132,994
Motorola, Inc.
92,200
1,895,632
Shares
Value (Note 1)
Research In Motion Ltd. (a)
12,700
$ 1,622,806
Sycamore Networks, Inc. (a)
54,100
203,416
3,854,848
Computers & Peripherals - 2.8%
Apple Computer, Inc. (a)
19,100
1,620,444
Dell, Inc. (a)
27,400
687,466
Diebold, Inc.
16,000
745,600
3,053,510
Electronic Equipment & Instruments - 0.3%
Daktronics, Inc.
5,987
220,621
Maxwell Technologies, Inc. (a)
5,550
77,423
298,044
Internet Software & Services - 4.9%
Akamai Technologies, Inc. (a)
16,000
849,920
DealerTrack Holdings, Inc.
20,842
613,172
Equinix, Inc. (a)
6,200
468,844
Google, Inc. Class A (sub. vtg.) (a)
4,100
1,887,968
RealNetworks, Inc. (a)
41,211
450,848
The Knot, Inc. (a)
4,260
111,782
ValueClick, Inc. (a)
18,900
446,607
VeriSign, Inc. (a)
15,300
367,965
5,197,106
Semiconductors & Semiconductor Equipment - 0.8%
Broadcom Corp. Class A (a)
26,094
843,097
Software - 2.2%
Activision, Inc. (a)
29,500
508,580
Autodesk, Inc. (a)
5,008
202,624
BEA Systems, Inc. (a)
15,400
193,732
Electronic Arts, Inc. (a)
23,700
1,193,532
Salesforce.com, Inc. (a)
6,800
247,860
2,346,328
TOTAL INFORMATION TECHNOLOGY
15,592,933
MATERIALS - 8.4%
Chemicals - 6.5%
Agrium, Inc.
11,400
357,252
Ecolab, Inc.
12,600
569,520
Monsanto Co.
65,700
3,451,221
Potash Corp. of Saskatchewan, Inc.
6,800
975,664
Rhodia SA
84,100
293,116
Syngenta AG sponsored ADR
25,900
961,926
The Mosaic Co.
16,600
354,576
6,963,275
Metals & Mining - 1.7%
Allegheny Technologies, Inc.
14,960
1,356,573
Titanium Metals Corp.
14,747
435,184
1,791,757
Common Stocks - continued
Shares
Value (Note 1)
MATERIALS - continued
Paper & Forest Products - 0.2%
Weyerhaeuser Co.
3,300
$ 233,145
TOTAL MATERIALS
8,988,177
TELECOMMUNICATION SERVICES - 8.5%
Diversified Telecommunication Services - 5.0%
Cbeyond, Inc. (a)
3,800
116,242
France Telecom SA
34,900
966,730
Level 3 Communications, Inc. (a)
139,700
782,320
Qwest Communications International, Inc. (a)
411,700
3,445,929
5,311,221
Wireless Telecommunication Services - 3.5%
American Tower Corp. Class A (a)
56,500
2,106,320
Centennial Communications Corp. Class A
42,618
306,423
China Mobile (Hong Kong) Ltd. sponsored ADR
19,400
838,468
Dobson Communications Corp. Class A
57,900
504,309
3,755,520
TOTAL TELECOMMUNICATION SERVICES
9,066,741
UTILITIES - 0.9%
Independent Power Producers & Energy Traders - 0.9%
EDF Energies Nouvelles SA
5,005
265,031
International Power PLC
92,200
689,358
954,389
TOTAL COMMON STOCKS
(Cost $89,602,408)
105,567,230
Money Market Funds - 0.0%
Shares
Value (Note 1)
Fidelity Cash Central Fund, 5.37% (b) (Cost $56,903)
56,903
$ 56,903
TOTAL INVESTMENT PORTFOLIO - 99.0%
(Cost $89,659,311)
105,624,133
NET OTHER ASSETS - 1.0%
1,019,676
NET ASSETS - 100%
$ 106,643,809
Legend
(a) Non-income producing
(b) Affiliated fund that is available only to investment companies and other accounts managed by Fidelity Investments. The rate quoted is the annualized seven-day yield of the fund at period end. A complete unaudited listing of the fund's holdings as of its most recent quarter end is available upon request.
Affiliated Central Funds
Information regarding fiscal year to date income earned by the Fund from investments in Fidelity Central Funds is as follows:
Fund
Income earned
Fidelity Cash Central Fund
$ 311,667
Fidelity Securities Lending Cash Central Fund
22,914
Total
$ 334,581
Distribution of investments by country of issue, as a percentage of total net assets, is as follows:
United States of America
79.2%
France
5.4%
United Kingdom
3.6%
Switzerland
2.8%
Ireland
2.8%
Canada
2.7%
Panama
1.4%
Others (individually less than 1%)
2.1%
100.0%
See accompanying notes which are an integral part of the financial statements.
Annual Report
VIP Dynamic Capital Appreciation Portfolio
Financial Statements
Statement of Assets and Liabilities
December 31, 2006
Assets
Investment in securities, at value - See accompanying schedule:
Unaffiliated issuers (cost $89,602,408)
$ 105,567,230
Fidelity Central Funds (cost $56,903)
56,903
Total Investments (cost $89,659,311)
$ 105,624,133
Receivable for investments sold
1,069,194
Receivable for fund shares sold
537
Dividends receivable
143,551
Interest receivable
3,540
Prepaid expenses
565
Other receivables
4,208
Total assets
106,845,728
Liabilities
Payable for investments purchased
$ 85,078
Payable for fund shares redeemed
287
Accrued management fee
50,349
Distribution fees payable
5,007
Other affiliated payables
11,710
Other payables and accrued expenses
49,488
Total liabilities
201,919
Net Assets
$ 106,643,809
Net Assets consist of:
Paid in capital
$ 89,535,132
Accumulated undistributed net realized gain (loss) on investments and foreign currency transactions
1,143,849
Net unrealized appreciation (depreciation) on investments and assets and liabilities in foreign currencies
15,964,828
Net Assets
$ 106,643,809
Statement of Assets and Liabilities - continued
December 31, 2006
Initial Class: Net Asset Value, offering price and redemption price per share ($59,549,233 ÷ 6,195,287 shares)
$ 9.61
Service Class: Net Asset Value, offering price and redemption price per share ($910,378 ÷ 95,256 shares)
$ 9.56
Service Class 2: Net Asset Value, offering price and redemption price per share ($23,720,025 ÷ 2,503,344 shares)
$ 9.48
Investor Class: Net Asset Value, offering price and redemption price per share ($22,464,173 ÷ 2,337,254 shares)
$ 9.61
See accompanying notes which are an integral part of the financial statements.
Annual Report
VIP Dynamic Capital Appreciation Portfolio Financial Statements - continued
Statement of Operations
Year ended December 31, 2006
Investment Income
Dividends
$ 995,886
Interest
21
Income from Fidelity Central Funds
334,581
Total income
1,330,488
Expenses
Management fee
$ 602,746
Transfer agent fees
102,035
Distribution fees
55,401
Accounting and security lending fees
46,422
Custodian fees and expenses
42,528
Independent trustees' compensation
387
Audit
43,447
Legal
2,984
Miscellaneous
18,319
Total expenses before reductions
914,269
Expense reductions
(12,108)
902,161
Net investment income (loss)
428,327
Realized and Unrealized Gain (Loss)
Net realized gain (loss) on:
Investment securities:
Unaffiliated issuers
4,962,767
Foreign currency transactions
2,116
Total net realized gain (loss)
4,964,883
Change in net unrealized appreciation (depreciation) on:
Investment securities
6,045,710
Assets and liabilities in foreign currencies
1
Total change in net unrealized appreciation (depreciation)
6,045,711
Net gain (loss)
11,010,594
Net increase (decrease) in net assets resulting from operations
$ 11,438,921
Statement of Changes in Net Assets
Year ended December 31, 2006
Year ended December 31, 2005
Increase (Decrease) in Net Assets
Operations
Net investment income (loss)
$ 428,327
$ 50,888
Net realized gain (loss)
4,964,883
2,863,677
Change in net unrealized appreciation (depreciation)
6,045,711
5,412,479
Net increase (decrease) in net assets resulting from operations
11,438,921
8,327,044
Distributions to shareholders from net investment income
(477,277)
-
Distributions to shareholders from net realized gain
(2,812,139)
-
Total distributions
(3,289,416)
-
Share transactions - net increase (decrease)
14,557,067
42,552,762
Total increase (decrease) in net assets
22,706,572
50,879,806
Net Assets
Beginning of period
83,937,237
33,057,431
End of period (including undistributed net investment income of $0 and undistributed net investment income of $42,097, respectively)
$ 106,643,809
$ 83,937,237
See accompanying notes which are an integral part of the financial statements.
VIP Dynamic Capital Appreciation Portfolio
Financial Highlights - Initial Class
Years ended December 31,
2006
2005
2004
2003
2002
Selected Per-Share Data
Net asset value, beginning of period
$ 8.71
$ 7.19
$ 7.09
$ 5.65
$ 6.10
Income from Investment Operations
Net investment income (loss) C
.04
.02 F
(.03) G
(.02)
.02
Net realized and unrealized gain (loss)
1.17
1.50
.13
1.46
(.46)
Total from investment operations
1.21
1.52
.10
1.44
(.44)
Distributions from net investment income
(.05)
-
-
-
(.01)
Distributions from net realized gain
(.26)
-
-
-
-
Total distributions
(.31)
-
-
-
(.01)
Net asset value, end of period
$ 9.61
$ 8.71
$ 7.19
$ 7.09
$ 5.65
Total Return A, B
13.97%
21.14%
1.41%
25.49%
(7.21)%
Ratios to Average Net Assets D, H
Expenses before reductions
.78%
.88%
.98%
1.83%
2.64%
Expenses net of fee waivers, if any
.78%
.85%
.98%
1.06%
1.50%
Expenses net of all reductions
.77%
.76%
.91%
.96%
1.38%
Net investment income (loss)
.48%
.21% F
(.48)% G
(.30)%
.32%
Supplemental Data
Net assets, end of period (000 omitted)
$ 59,549
$ 57,609
$ 19,486
$ 16,684
$ 719
Portfolio turnover rate E
161%
201%
226%
307%
349%
ATotal returns do not reflect charges attributable to your insurance company's separate account. Inclusion of these charges would reduce the total returns shown.
BTotal returns would have been lower had certain expenses not been reduced during the periods shown.
CCalculated based on average shares outstanding during the period.
DFees and expenses of the underlying Fidelity Central Funds are not included in the Fund's expense ratio. The Fund indirectly bears its proportionate share of the expenses of any underlying Fidelity Central Funds.
EAmount does not include the portfolio activity of any underlying Fidelity Central Funds.
FInvestment income per share reflects an in-kind dividend received in a corporate reorganization which amounted to $.01 per share. Excluding this dividend, the ratio of net investment income (loss) to average net assets would have been .07%.
GInvestment income per share reflects an in-kind dividend received in a corporate reorganization which amounted to $0.00 per share. Excluding this dividend, the ratio of net investment income (loss) to average net assets would have been (.52)%.
HExpense ratios reflect operating expenses of the class. Expenses before reductions do not reflect amounts reimbursed by the investment adviser or reductions from brokerage service arrangements or other expense offset arrangements and do not represent the amount paid by the class during periods when reimbursements or reductions occur. Expenses net of fee waivers reflect expenses after reimbursement by the investment adviser but prior to reductions from brokerage service arrangements or other expense offset arrangements. Expenses net of all reductions represent the net expenses paid by the class.
Financial Highlights - Service Class
Years ended December 31,
2006
2005
2004
2003
2002
Selected Per-Share Data
Net asset value, beginning of period
$ 8.65
$ 7.15
$ 7.06
$ 5.64
$ 6.09
Income from Investment Operations
Net investment income (loss) C
.04
.01 F
(.04) G
(.04)
.01
Net realized and unrealized gain (loss)
1.17
1.49
.13
1.46
(.45)
Total from investment operations
1.21
1.50
.09
1.42
(.44)
Distributions from net investment income
(.04)
-
-
-
(.01)
Distributions from net realized gain
(.26)
-
-
-
-
Total distributions
(.30)
-
-
-
(.01)
Net asset value, end of period
$ 9.56
$ 8.65
$ 7.15
$ 7.06
$ 5.64
Total Return A, B
13.99%
20.98%
1.27%
25.18%
(7.22)%
Ratios to Average Net Assets D, H
Expenses before reductions
.88%
.99%
1.07%
1.92%
2.61%
Expenses net of fee waivers, if any
.88%
.96%
1.07%
1.38%
1.60%
Expenses net of all reductions
.87%
.88%
1.00%
1.29%
1.48%
Net investment income (loss)
.38%
.11% F
(.57)% G
(.63)%
.22%
Supplemental Data
Net assets, end of period (000 omitted)
$ 910
$ 879
$ 644
$ 852
$ 773
Portfolio turnover rate E
161%
201%
226%
307%
349%
ATotal returns do not reflect charges attributable to your insurance company's separate account. Inclusion of these charges would reduce the total returns shown.
B Total returns would have been lower had certain expenses not been reduced during the periods shown.
C Calculated based on average shares outstanding during the period.
D Fees and expenses of the underlying Fidelity Central Funds are not included in the Fund's expense ratio. The Fund indirectly bears its proportionate share of the expenses of any underlying Fidelity Central Funds.
E Amount does not include the portfolio activity of any underlying Fidelity Central Funds.
F Investment income per share reflects an in-kind dividend received in a corporate reorganization which amounted to $.01 per share. Excluding this dividend, the ratio of net investment income (loss) to average net assets would have been (.03)%.
G Investment income per share reflects an in-kind dividend received in a corporate reorganization which amounted to $0.00 per share. Excluding this dividend, the ratio of net investment income (loss) to average net assets would have been (.61)%.
H Expense ratios reflect operating expenses of the class. Expenses before reductions do not reflect amounts reimbursed by the investment adviser or reductions from brokerage service arrangements or other expense offset arrangements and do not represent the amount paid by the class during periods when reimbursements or reductions occur. Expenses net of fee waivers reflect expenses after reimbursement by the investment adviser but prior to reductions from brokerage service arrangements or other expense offset arrangements. Expenses net of all reductions represent the net expenses paid by the class.
See accompanying notes which are an integral part of the financial statements.
Annual Report
Fund Name Financial Statements - continued
Financial Highlights - Service Class 2
Years ended December 31,
2006
2005
2004
2003
2002
Selected Per-Share Data
Net asset value, beginning of period
$ 8.58
$ 7.11
$ 7.02
$ 5.62
$ 6.09
Income from Investment Operations
Net investment income (loss) C
.02
- F, I
(.05) G
(.05)
- I
Net realized and unrealized gain (loss)
1.16
1.47
.14
1.45
(.46)
Total from investment operations
1.18
1.47
.09
1.40
(.46)
Distributions from net investment income
(.02)
-
-
-
(.01)
Distributions from net realized gain
(.26)
-
-
-
-
Total distributions
(.28)
-
-
-
(.01)
Net asset value, end of period
$ 9.48
$ 8.58
$ 7.11
$ 7.02
$ 5.62
Total Return A, B
13.81%
20.68%
1.28%
24.91%
(7.55)%
Ratios to Average Net Assets D, H
Expenses before reductions
1.05%
1.18%
1.26%
2.10%
2.79%
Expenses net of fee waivers, if any
1.05%
1.11%
1.25%
1.51%
1.75%
Expenses net of all reductions
1.04%
1.03%
1.17%
1.41%
1.63%
Net investment income (loss)
.21%
(.04)% F
(.74)% G
(.75)%
.07%
Supplemental Data
Net assets, end of period (000 omitted)
$ 23,720
$ 18,208
$ 12,928
$ 10,772
$ 6,209
Portfolio turnover rate E
161%
201%
226%
307%
349%
A Total returns do not reflect charges attributable to your insurance company's separate account. Inclusion of these charges would reduce the total returns shown.
B Total returns would have been lower had certain expenses not been reduced during the periods shown.
C Calculated based on average shares outstanding during the period.
D Fees and expenses of the underlying Fidelity Central Funds are not included in the Fund's expense ratio. The Fund indirectly bears its proportionate share of the expenses of any underlying Fidelity Central Funds.
E Amount does not include the portfolio activity of any underlying Fidelity Central Funds.
F Investment income per share reflects an in-kind dividend received in a corporate reorganization which amounted to $.01 per share. Excluding this dividend, the ratio of net investment income (loss) to average net assets would have been (.19)%.
G Investment income per share reflects an in-kind dividend received in a corporate reorganization which amounted to $0.00 per share. Excluding this dividend, the ratio of net investment income (loss) to average net assets would have been (.78)%.
H Expense ratios reflect operating expenses of the class. Expenses before reductions do not reflect amounts reimbursed by the investment adviser or reductions from brokerage service arrangements or other expense offset arrangements and do not represent the amount paid by the class during periods when reimbursements or reductions occur. Expenses net of fee waivers reflect expenses after reimbursement by the investment adviser but prior to reductions from brokerage service arrangements or other expense offset arrangements. Expenses net of all reductions represent the net expenses paid by the class.
IAmount represents less than $.01 per share.
Financial Highlights - Investor Class
Years ended December 31,
2006
2005 H
Selected Per-Share Data
Net asset value, beginning of period
$ 8.71
$ 7.89
Income from Investment Operations
Net investment income (loss) E
.03
- J
Net realized and unrealized gain (loss)
1.17
.82
Total from investment operations
1.20
.82
Distributions from net investment income
(.04)
-
Distributions from net realized gain
(.26)
-
Total distributions
(.30)
-
Net asset value, end of period
$ 9.61
$ 8.71
Total Return B, C, D
13.87%
10.39%
Ratios to Average Net Assets F, I
Expenses before reductions
.90%
1.04% A
Expenses net of fee waivers, if any
.90%
1.00% A
Expenses net of all reductions
.89%
.92% A
Net investment income (loss)
.36%
.02% A
Supplemental Data
Net assets, end of period (000 omitted)
$ 22,464
$ 7,241
Portfolio turnover rate G
161%
201%
A Annualized
B Total returns for periods of less than one year are not annualized.
C Total returns do not reflect charges attributable to your insurance company's separate account. Inclusion of these charges would reduce the total returns shown.
D Total returns would have been lower had certain expenses not been reduced during the periods shown.
E Calculated based on average shares outstanding during the period.
F Fees and expenses of the underlying Fidelity Central Funds are not included in the Fund's expense ratio. The Fund indirectly bears its proportionate share of the expenses of any underlying Fidelity Central Funds.
G Amount does not include the portfolio activity of any underlying Fidelity Central Funds.
H For the period July 21, 2005 (commencement of sale of shares) to December 31, 2005.
I Expense ratios reflect operating expenses of the class. Expenses before reductions do not reflect amounts reimbursed by the investment adviser or reductions from brokerage service arrangements or other expense offset arrangements and do not represent the amount paid by the class during periods when reimbursements or reductions occur. Expense ratios before reductions for start-up periods may not be representative of longer-term operating periods. Expenses net of fee waivers reflect expenses after reimbursement by the investment adviser but prior to reductions from brokerage service arrangements or other expense offset arrangements. Expenses net of all reductions represent the net expenses paid by the class.
J Amount represents less than $.01 per share.
See accompanying notes which are an integral part of the financial statements.
VIP Dynamic Capital Appreciation Portfolio
Notes to Financial Statements
For the period ended December 31, 2006
1. Significant Accounting Policies.
VIP Dynamic Capital Appreciation Portfolio (the Fund) is a fund of Variable Insurance Products Fund III (the trust) and is authorized to issue an unlimited number of shares. The trust is registered under the Investment Company Act of 1940, as amended (the 1940 Act), as an open-end management investment company organized as a Massachusetts business trust. Shares of the Fund may only be purchased by insurance companies for the purpose of funding variable annuity or variable life insurance contracts. The Fund offers the following classes of shares: Initial Class shares, Service Class shares, Service Class 2 shares, and Investor Class shares. All classes have equal rights and voting privileges, except for matters affecting a single class. Investment income, realized and unrealized capital gains and losses, the common expenses of the Fund, and certain fund-level expense reductions, if any, are allocated on a pro rata basis to each class based on the relative net assets of each class to the total net assets of the Fund. Each class differs with respect to transfer agent and distribution and service plan fees incurred. Certain expense reductions also differ by class.
The Fund may invest in Fidelity Central Funds which are open-end investment companies available to investment companies and other accounts managed by Fidelity Management & Research Company (FMR) and its affiliates. The financial statements have been prepared in conformity with accounting principles generally accepted in the United States of America, which require management to make certain estimates and assumptions at the date of the financial statements. The following summarizes the significant accounting policies of the Fund, which are also consistently followed by the Fidelity Central Funds:
Security Valuation. Investments are valued and net asset value (NAV) per share is calculated (NAV calculation) as of the close of business of the New York Stock Exchange (NYSE), normally 4:00 p.m. Eastern time. Wherever possible, the Fund uses independent pricing services approved by the Board of Trustees to value its investments.
Equity securities, including restricted securities, for which market quotations are readily available, are valued at the last reported sale price or official closing price as reported by an independent pricing service on the primary market or exchange on which they are traded. In the event there were no sales during the day or closing prices are not available, securities are valued at the last quoted bid price. Investments in open-end mutual funds, including the Fidelity Central Funds, are valued at their closing net asset value each business day. Short-term securities with remaining maturities of sixty days or less for which quotations are not readily available are valued at amortized cost, which approximates value.
When current market prices or quotations are not readily available or do not accurately reflect fair value, valuations may be determined in accordance with procedures adopted by the Board of Trustees. For example, when developments occur between the close of a market and the close of the NYSE that may materially affect the value of some or all of the securities, or when trading in a security is halted, those securities may be fair valued. Factors used in the determination of fair value may include monitoring news to identify significant market or security specific events such as changes in the value of U.S. securities markets, reviewing developments in foreign markets and evaluating the performance of ADRs, futures contracts and exchange-traded funds. Because the Fund's utilization of fair value pricing depends on market activity, the frequency with which fair value pricing is used can not be predicted and may be utilized to a significant extent. The value of securities used for NAV calculation under fair value pricing may differ from published prices for the same securities.
Foreign Currency. The Fund uses foreign currency contracts to facilitate transactions in foreign-denominated securities. Losses from these transactions may arise from changes in the value of the foreign currency or if the counterparties do not perform under the contracts' terms.
Foreign-denominated assets, including investment securities, and liabilities are translated into U.S. dollars at the exchange rate at period end. Purchases and sales of investment securities, income and dividends received and expenses denominated in foreign currencies are translated into U.S. dollars at the exchange rate in effect on the transaction date.
The effects of exchange rate fluctuations on investments are included with the net realized and unrealized gain (loss) on investment securities. Other foreign currency transactions resulting in realized and unrealized gain (loss) are disclosed separately.
Investment Transactions and Income. Security transactions, including the Fund's investment activity in the Fidelity Central Funds, are accounted for as of trade date. Gains and losses on securities sold are determined on the basis of identified cost and may include proceeds received from litigation. Dividend income is recorded on the ex-dividend date, except for certain dividends from foreign securities where the ex-dividend date may have passed, which are recorded as soon as the Fund is informed of the ex-dividend date. Non-cash dividends included in dividend income, if any, are recorded at the fair market value of the securities received. Distributions received on securities that represent a return of capital or capital gain are recorded as a reduction of cost of investments and/or as a realized gain. The Fund estimates the components of distributions received that may be considered return of capital distributions or capital gain distributions. Interest income and income distributions from the Fidelity Central Funds are accrued as earned, with any income distributions receivable as of period end included in Interest Receivable on the Statement of Assets and Liabilities. Interest income includes coupon interest and amortization of premium and accretion of discount on debt securities. Investment income is recorded net of foreign taxes withheld where recovery of such taxes is uncertain.
Annual Report
Notes to Financial Statements - continued
1. Significant Accounting Policies - continued
Expenses. Most expenses of the trust can be directly attributed to a fund. Expenses which cannot be directly attributed are apportioned among each Fund in the trust. Expense estimates are accrued in the period to which they relate and adjustments are made when actual amounts are known.
Income Tax Information and Distributions to Shareholders. Each year, the Fund intends to qualify as a regulated investment company by distributing all of its taxable income and realized gains under Subchapter M of the Internal Revenue Code. As a result, no provision for income taxes is required in the accompanying financial statements. Foreign taxes are provided for based on the Fund's understanding of the tax rules and rates that exist in the foreign markets in which it invests.
Distributions are recorded on the ex-dividend date. Income dividends and capital gain distributions are declared separately for each class. Income and capital gain distributions are determined in accordance with income tax regulations, which may differ from generally accepted accounting principles.
Capital accounts within the financial statements are adjusted for permanent book-tax differences. These adjustments have no impact on net assets or the results of operations. Temporary book-tax differences will reverse in a subsequent period.
Book-tax differences are primarily due to foreign currency transactions, capital loss carryforwards and losses deferred due to wash sales.
The tax-basis components of distributable earnings and the federal tax cost as of period end were as follows:
Unrealized appreciation
$ 16,619,243
Unrealized depreciation
(817,575)
Net unrealized appreciation (depreciation)
15,801,668
Undistributed ordinary income
596,505
Undistributed long-term capital gain
710,505
Cost for federal income tax purposes
$ 89,822,465
The tax character of distributions paid was as follows:
December 31, 2006
Ordinary Income
$ 477,277
Long-term Capital Gains
2,812,139
Total
$ 3,289,416
New Accounting Pronouncements. In July 2006, Financial Accounting Standards Board Interpretation No. 48, Accounting for Uncertainty in Income Taxes - an interpretation of FASB Statement 109 (FIN 48), was issued and is effective on the last business day of the semiannual reporting period for fiscal years beginning after December 15, 2006. FIN 48 sets forth a threshold for financial statement recognition, measurement and disclosure of a tax position taken or expected to be taken on a tax return. Management is currently evaluating the impact, if any, the adoption of FIN 48 will have on the Fund's net assets, results of operations and financial statement disclosures.
In addition, in September 2006, Statement of Financial Accounting Standards No. 157, Fair Value Measurements (SFAS 157), was issued and is effective for fiscal years beginning after November 15, 2007. SFAS 157 defines fair value, establishes a framework for measuring fair value and expands disclosures about fair value measurements. Management is currently evaluating the impact the adoption of SFAS 157 will have on the Fund's financial statement disclosures.
2. Operating Policies.
Repurchase Agreements. FMR has received an Exemptive Order from the Securities and Exchange Commission (the SEC) which permits the Fund and other affiliated entities of FMR to transfer uninvested cash balances into joint trading accounts which are then invested in repurchase agreements. The Fund may also invest directly with institutions in repurchase agreements. Repurchase agreements are collateralized by government or non-government securities. Upon settlement date, collateral is held in segregated accounts with custodian banks and may be obtained in the event of a default of the counterparty. The Fund monitors, on a daily basis, the value of the collateral to ensure it is at least equal to the principal amount of the repurchase agreement (including accrued interest). In the event of a default by the counterparty, realization of the collateral proceeds could be delayed, during which time the value of the collateral may decline.
VIP Dynamic Capital Appreciation Portfolio
3. Purchases and Sales of Investments.
Purchases and sales of securities, other than short-term securities, aggregated $179,735,210 and $161,697,791, respectively.
4. Fees and Other Transactions with Affiliates.
Management Fee. FMR and its affiliates provide the Fund with investment management related services for which the Fund pays a monthly management fee. The management fee is the sum of an individual fund fee rate that is based on an annual rate of .30% of the Fund's average net assets and a group fee rate that averaged .27% during the period. The group fee rate is based upon the average net assets of all the mutual funds advised by FMR. The group fee rate decreases as assets under management increase and increases as assets under management decrease. For the period, the total annual management fee rate was .56% of the Fund's average net assets.
Distribution and Service Plan. In accordance with Rule 12b-1 of the 1940 Act, the Fund has adopted separate 12b-1 Plans for each Service Class of shares. Each Service Class pays Fidelity Distributors Corporation (FDC), an affiliate of FMR, a service fee. For the period, the service fee is based on an annual rate of .10% of Service Class' average net assets and .25% of Service Class 2's average net assets.
For the period, each class paid FDC the following amounts, all of which were re-allowed to insurance companies for the distribution of shares and providing shareholder support services:
Service Class
$ 878
Service Class 2
54,523
$ 55,401
Transfer Agent Fees. Fidelity Investments Institutional Operations Company, Inc. (FIIOC), an affiliate of FMR, is the fund's transfer, dividend disbursing, and shareholder servicing agent. FIIOC receives an asset-based fee with respect to each class. Each class with the exception of Investor Class pays a transfer agent fee, excluding out of pocket expenses, equal to an annual rate of .07% of their month end net assets. Investor Class pays a monthly asset-based transfer agent fee of .18% of its month end net assets. The total transfer agent fees paid by each class to FIIOC, including out of pocket expenses, were as follows:
Initial Class
$ 46,061
Service Class
594
Service Class 2
19,997
Investor Class
35,383
$ 102,035
Accounting and Security Lending Fees. Fidelity Service Company, Inc. (FSC), an affiliate of FMR, maintains the Fund's accounting records. The accounting fee is based on the level of average net assets for the month. Under a separate contract, FSC administers the security lending program. The security lending fee is based on the number and duration of lending transactions.
Investments in Fidelity Central Funds. The Fund may invest in Fidelity Central Funds. The Fund's Schedule of Investments lists each of the Fidelity Central Funds as an investment of the Fund but does not include the underlying holdings of each Fidelity Central Fund. As an Investing Fund, the Fund indirectly bears its proportionate share of the expenses of the underlying Fidelity Central Funds. A complete unaudited list of holdings for each Fidelity Central Fund is available upon request. In addition, the financial statements of the Fidelity Central Funds, which are not covered by the Fund's Report of Independent Registered Public Accounting Firm, are available on the EDGAR Database on the SEC's web site, www.sec.gov, or upon request.
The Money Market Central Funds seek preservation of capital and current income and are managed by Fidelity Investments Money Management, Inc. (FIMM), an affiliate of FMR.
Brokerage Commissions. The Fund placed a portion of its portfolio transactions with brokerage firms which are affiliates of the investment adviser. The commissions paid to these affiliated firms were $926 for the period.
5. Committed Line of Credit.
The Fund participates with other funds managed by FMR in a $4.2 billion credit facility (the "line of credit") to be utilized for temporary or emergency purposes to fund shareholder redemptions or for other short-term liquidity purposes. The Fund has agreed to pay commitment fees on its pro rata portion of the line of credit, which amounted to $261 and is reflected in Miscellaneous Expense on the Statement of Operations. During the period, there were no borrowings on this line of credit.
Annual Report
Notes to Financial Statements - continued
6. Security Lending.
The Fund lends portfolio securities from time to time in order to earn additional income. On the settlement date of the loan, the Fund receives collateral (in the form of U.S. Treasury obligations, letters of credit and/or cash) against the loaned securities and maintains collateral in an amount not less than 100% of the market value of the loaned securities during the period of the loan. The market value of the loaned securities is determined at the close of business of the Fund and any additional required collateral is delivered to the Fund on the next business day. If the borrower defaults on its obligation to return the securities loaned because of insolvency or other reasons, a fund could experience delays and costs in recovering the securities loaned or in gaining access to the collateral. Any cash collateral received is invested in the Fidelity Securities Lending Cash Central Fund. At period end, there were no security loans outstanding. Security lending income represents the income earned on investing cash collateral, less fees and expenses associated with the loan, plus any premium payments that may be received on the loan of certain types of securities. Security lending income is presented in the Statement of Operations as a component of income from Fidelity Central Funds. Net income from lending portfolio securities during the period amounted to $22,914.
7. Expense Reductions.
Many of the brokers with whom FMR places trades on behalf of the Fund provided services to the Fund in addition to trade execution. These services included payments of certain expenses on behalf of the Fund totaling $10,629 for the period.
8. Other.
The Fund's organizational documents provide former and current trustees and officers with a limited indemnification against liabilities arising in connection with the performance of their duties to the Fund. In the normal course of business, the Fund may also enter into contracts that provide general indemnifications. The Fund's maximum exposure under these arrangements is unknown as this would be dependent on future claims that may be made against the Fund. The risk of material loss from such claims is considered remote.
At the end of the period, FMR or its affiliates were the owners of record of 77% of the total outstanding shares of the Fund.
The United States Securities and Exchange Commission ("SEC") is conducting an investigation of FMR (covering the years 2002 to 2004) arising from gifts, gratuities and business entertainment provided by certain brokers to certain individuals who were employed on FMR's domestic equity trading desk during that period. FMR is in discussions with the SEC staff regarding the possible resolution of the matter, but as of period-end no final resolution has been reached.
In December 2006, the Independent Trustees completed their own investigation of the matter with the assistance of independent counsel. The Independent Trustees and FMR agree that, despite the absence of proof that the Fidelity mutual funds experienced diminished execution quality as a result of the improper receipt of gifts and business entertainment, the conduct at issue was serious and is worthy of redress. Accordingly, the Independent Trustees have requested and FMR has agreed to pay $42 million to Fidelity mutual funds, plus interest to be determined at the time that payment is made. A method of allocating this payment among the funds has not yet been determined. The total payment to the Fund is not anticipated to have a material impact on the Fund's net assets. In addition, FMR reimbursed related legal expenses which are recorded in accompanying Statement of Operations as an expense reduction.
9. Distributions to Shareholders.
Distributions to shareholders of each class were as follows:
Years ended December 31,
2006
2005
From net investment income
Initial Class
$ 328,647
$ -
Service Class
3,418
-
Service Class 2
53,279
-
Investor Class
91,933
-
Total
$ 477,277
$ -
From net realized gain
Initial Class
$ 1,564,621
$ -
Service Class
24,015
-
Service Class 2
629,659
-
Investor Class
593,844
-
Total
$ 2,812,139
$ -
VIP Dynamic Capital Appreciation Portfolio
10. Share Transactions.
Transactions for each class of shares were as follows:
Shares
Dollars
Years ended December 31,
Years ended December 31,
2006
2005 A
2006
2005 A
Initial Class
Shares sold
2,831,511
5,315,043
$ 26,393,812
$ 43,123,464
Reinvestment of distributions
199,398
-
1,893,269
-
Shares redeemed
(3,451,889)
(1,408,625)
(31,710,043)
(10,370,197)
Net increase (decrease)
(420,980)
3,906,418
$ (3,422,962)
$ 32,753,267
Service Class
Shares sold
23,129
28,508
$ 212,077
$ 222,823
Reinvestment of distributions
2,903
-
27,433
-
Shares redeemed
(32,340)
(16,924)
(293,400)
(129,062)
Net increase (decrease)
(6,308)
11,584
$ (53,890)
$ 93,761
Service Class 2
Shares sold
1,371,579
836,551
$ 12,518,023
$ 6,641,312
Reinvestment of distributions
72,886
-
682,938
-
Shares redeemed
(1,062,736)
(533,808)
(9,658,688)
(3,950,252)
Net increase (decrease)
381,729
302,743
$ 3,542,273
$ 2,691,060
Investor Class
Shares sold
3,161,489
836,455
$ 29,326,508
$ 7,057,993
Reinvestment of distributions
72,152
-
685,776
-
Shares redeemed
(1,727,937)
(4,905)
(15,520,638)
(43,319)
Net increase (decrease)
1,505,704
831,550
$ 14,491,646
$ 7,014,674
A Share transactions for Investor Class are for the period July 21, 2005 (commencement of sale of shares) to December 31, 2005.
Annual Report
Report of Independent Registered Public Accounting Firm
To the Trustees of Variable Insurance Products Fund III and Shareholders of VIP Dynamic Capital Appreciation Portfolio:
We have audited the accompanying statement of assets and liabilities of VIP Dynamic Capital Appreciation Portfolio (the Fund), a fund of Variable Insurance Products Fund III, including the schedule of investments as of December 31, 2006, and the related statement of operations for the year then ended, the statement of changes in net assets for each of the two years in the period then ended, and the financial highlights for each of the five years in the period then ended. These financial statements and financial highlights are the responsibility of the Fund's management. Our responsibility is to express an opinion on these financial statements and financial highlights based on our audits.
We conducted our audits in accordance with standards of the Public Company Accounting Oversight Board (United States). Those standards require that we plan and perform the audit to obtain reasonable assurance about whether the financial statements and financial highlights are free of material misstatement. The Fund is not required to have, nor were we engaged to perform, an audit of its internal control over financial reporting. Our audits included consideration of internal control over financial reporting as a basis for designing audit procedures that are appropriate in the circumstances, but not for the purpose of expressing an opinion on the effectiveness of the Fund's internal control over financial reporting. Accordingly, we express no such opinion. An audit also includes examining, on a test basis, evidence supporting the amounts and disclosures in the financial statements, assessing the accounting principles used and significant estimates made by management, as well as evaluating the overall financial statement presentation. Our procedures included confirmation of securities owned as of December 31, 2006, by correspondence with the custodians and brokers; where replies were not received from brokers, we performed other auditing procedures. We believe that our audits provide a reasonable basis for our opinion.
In our opinion, the financial statements and financial highlights referred to above present fairly, in all material respects, the financial position of VIP Dynamic Capital Appreciation Portfolio as of December 31, 2006, the results of its operations for the year then ended, the changes in its net assets for each of the two years in the period then ended, and its financial highlights for each of the five years in the period then ended, in conformity with accounting principles generally accepted in the United States of America.
/s/ Deloitte & Touche LLP
DELOITTE & TOUCHE LLP
Boston, Massachusetts
February 13, 2007
Annual Report
Trustees and Officers
The Trustees, Member of the Advisory Board, and executive officers of the trust and fund, as applicable, are listed below. The Board of Trustees governs the fund and is responsible for protecting the interests of shareholders. The Trustees are experienced executives who meet periodically throughout the year to oversee the fund's activities, review contractual arrangements with companies that provide services to the fund, and review the fund's performance. Each of the Trustees oversees 348 funds advised by FMR or an affiliate.
The Trustees hold office without limit in time except that (a) any Trustee may resign; (b) any Trustee may be removed by written instrument, signed by at least two-thirds of the number of Trustees prior to such removal; (c) any Trustee who requests to be retired or who has become incapacitated by illness or injury may be retired by written instrument signed by a majority of the other Trustees; and (d) any Trustee may be removed at any special meeting of shareholders by a two-thirds vote of the outstanding voting securities of the trust. Each Trustee who is not an interested person (as defined in the 1940 Act) (Independent Trustee), shall retire not later than the last day of the calendar year in which his or her 72nd birthday occurs. The Independent Trustees may waive this mandatory retirement age policy with respect to individual Trustees. The executive officers and Advisory Board Member hold office without limit in time, except that any officer and Advisory Board Member may resign or may be removed by a vote of a majority of the Trustees at any regular meeting or any special meeting of the Trustees. Except as indicated, each individual has held the office shown or other offices in the same company for the past five years.
The fund's Statement of Additional Information (SAI) includes more information about the Trustees. To request a free copy, call Fidelity at 1-877-208-0098.
Interested Trustees*:
Correspondence intended for each Trustee who is an interested person may be sent to Fidelity Investments, 82 Devonshire Street, Boston, Massachusetts 02109.
Name, Age; Principal Occupation
Edward C. Johnson 3d (76)
Year of Election or Appointment: 1994
Mr. Johnson is Chairman of the Board of Trustees. Mr. Johnson serves as President (2006-present), Chief Executive Officer, Chairman, and a Director of FMR Corp.; Chairman and a Director of FMR; Chairman and a Director of Fidelity Research & Analysis Company (FRAC); Chairman and a Director of Fidelity Investments Money Management, Inc.; and Chairman (2001-present) and a Director of FMR Co., Inc. In addition, Mr. Johnson serves as Chairman and Director of Fidelity International Limited (FIL).
Robert L. Reynolds (54)
Year of Election or Appointment: 2003
Mr. Reynolds is President and a Director of FMR (2005-present), Fidelity Investments Money Management, Inc. (2005-present), and FMR Co., Inc. (2005-present). Mr. Reynolds also serves as Vice Chairman (2006-present), a Director (2003-present), and Chief Operating Officer of FMR Corp. and a Director of Strategic Advisers, Inc. (2005-present). He also serves on the Board at Fidelity Investments Canada, Ltd.
* Trustees have been determined to be "Interested Trustees" by virtue of, among other things, their affiliation with the trust or various entities under common control with FMR.
Independent Trustees:
Correspondence intended for each Independent Trustee (that is, the Trustees other than the Interested Trustees) may be sent to Fidelity Investments, P.O. Box 55235, Boston, Massachusetts 02205-5235.
Name, Age; Principal Occupation
Dennis J. Dirks (58)
Year of Election or Appointment: 2005
Prior to his retirement in May 2003, Mr. Dirks was Chief Operating Officer and a member of the Board of The Depository Trust & Clearing Corporation (DTCC) (1999-2003). He also served as President, Chief Operating Officer, and Board member of The Depository Trust Company (DTC) (1999-2003) and President and Board member of the National Securities Clearing Corporation (NSCC) (1999-2003). In addition, Mr. Dirks served as Chief Executive Officer and Board member of the Government Securities Clearing Corporation (2001-2003) and Chief Executive Officer and Board member of the Mortgage-Backed Securities Clearing Corporation (2001-2003). Mr. Dirks also serves as a Trustee and a member of the Finance Committee of Manhattan College (2005-present) and a Trustee and a member of the Finance Committee of AHRC of Nassau County (2006-present).
Albert R. Gamper, Jr. (64)
Year of Election or Appointment: 2006
Prior to his retirement in December 2004, Mr. Gamper served as Chairman of the Board of CIT Group Inc. (commercial finance). During his tenure with CIT Group Inc. Mr. Gamper served in numerous senior management positions, including Chairman (1987-1989; 1999-2001; 2002-2004), Chief Executive Officer (1987-2004), and President (1989-2002). He currently serves as a member of the Board of Directors of Public Service Enterprise Group (utilities, 2001-present), Chairman of the Board of Governors, Rutgers University (2004-present), and Chairman of the Board of Saint Barnabas Health Care System.
George H. Heilmeier (70)
Year of Election or Appointment: 2004
Dr. Heilmeier is Chairman Emeritus of Telcordia Technologies (communication software and systems), where prior to his retirement, he served as company Chairman and Chief Executive Officer. He currently serves on the Boards of Directors of The Mitre Corporation (systems engineering and information technology support for the government), and HRL Laboratories (private research and development, 2004-present). He is Chairman of the General Motors Science & Technology Advisory Board and a Life Fellow of the Institute of Electrical and Electronics Engineers (IEEE). Dr. Heilmeier is a member of the Defense Science Board and the National Security Agency Advisory Board. He is also a member of the National Academy of Engineering, the American Academy of Arts and Sciences, and the Board of Overseers of the School of Engineering and Applied Science of the University of Pennsylvania. Previously, Dr. Heilmeier served as a Director of TRW Inc. (automotive, space, defense, and information technology, 1992-2002), Compaq (1994-2002), Automatic Data Processing, Inc. (ADP) (technology-based business outsourcing, 1995-2002), INET Technologies Inc. (telecommunications network surveillance, 2001-2004), and Teletech Holdings (customer management services). He is the recipient of the 2005 Kyoto Prize in Advanced Technology for his invention of the liquid crystal display, and a member of the Consumer Electronics Hall of Fame.
James H. Keyes (66)
Year of Election or Appointment: 2007
Prior to his retirement in 2003, Mr. Keyes was Chairman, President, and Chief Executive Officer of Johnson Controls, Inc. (automotive supplier, 1993-2003). He currently serves as a member of the boards of LSI Logic Corporation (semiconductor technologies), Navistar International Corporation (manufacture and sale of trucks, buses, and diesel engines, 2002-present), and Pitney Bowes, Inc. (integrated mail, messaging, and document management solutions).
Marie L. Knowles (60)
Year of Election or Appointment: 2001
Prior to Ms. Knowles' retirement in June 2000, she served as Executive Vice President and Chief Financial Officer of Atlantic Richfield Company (ARCO) (diversified energy, 1996-2000). From 1993 to 1996, she was a Senior Vice President of ARCO and President of ARCO Transportation Company. She served as a Director of ARCO from 1996 to 1998. She currently serves as a Director of Phelps Dodge Corporation (copper mining and manufacturing) and McKesson Corporation (healthcare service, 2002-present). Ms. Knowles is a Trustee of the Brookings Institution and the Catalina Island Conservancy and also serves as a member of the Advisory Board for the School of Engineering of the University of Southern California.
Ned C. Lautenbach (62)
Year of Election or Appointment: 2000
Mr. Lautenbach is Chairman of the Independent Trustees (2006-present). Mr. Lautenbach has been a partner of Clayton, Dubilier & Rice, Inc. (private equity investment firm) since September 1998. Previously, Mr. Lautenbach was with the International Business Machines Corporation (IBM) from 1968 until his retirement in 1998. Mr. Lautenbach serves as a Director of Sony Corporation (2006-present) and Eaton Corporation (diversified industrial) as well as the Philharmonic Center for the Arts in Naples, Florida. He also is a member of the Board of Trustees of Fairfield University (2005-present), as well as a member of the Council on Foreign Relations.
Cornelia M. Small (62)
Year of Election or Appointment: 2005
Ms. Small is a member (2000-present) and Chairperson (2002-present) of the Investment Committee, and a member (2002- present) of the Board of Trustees of Smith College. Previously, she served as Chief Investment Officer (1999-2000), Director of Global Equity Investments (1996-1999), and a member of the Board of Directors of Scudder, Stevens & Clark (1990-1997) and Scudder Kemper Investments (1997-1999). In addition, Ms. Small served as Co-Chair (2000-2003) of the Annual Fund for the Fletcher School of Law and Diplomacy.
William S. Stavropoulos (67)
Year of Election or Appointment: 2002
Mr. Stavropoulos is Chairman Emeritus of the Board of Directors of The Dow Chemical Company. Since joining The Dow Chemical Company in 1967, Mr. Stavropoulos served in numerous senior management positions, including President (1993-2000; 2002-2003), CEO (1995-2000; 2002-2004), and Chairman of the Executive Committee (2000-2004). Currently, he is a Director of NCR Corporation (data warehousing and technology solutions), BellSouth Corporation (telecommunications), Chemical Financial Corporation, Maersk Inc. (industrial conglomerate, 2002-present), and Metalmark Capital (private equity investment firm, 2005-present). He also serves as a member of the Board of Trustees of the American Enterprise Institute for Public Policy Research. In addition, Mr. Stavropoulos is a member of The Business Council, J.P. Morgan International Council and the University of Notre Dame Advisory Council for the College of Science.
Kenneth L. Wolfe (67)
Year of Election or Appointment: 2005
Prior to his retirement in 2001, Mr. Wolfe was Chairman and Chief Executive Officer of Hershey Foods Corporation (1993-2001). He currently serves as a member of the boards of Adelphia Communications Corporation (2003-present), Bausch & Lomb, Inc., and Revlon Inc. (2004-present).
Advisory Board Member and Executive Officers:
Correspondence intended for each executive officer and Mr. Lynch may be sent to Fidelity Investments, 82 Devonshire Street, Boston, Massachusetts 02109.
Name, Age; Principal Occupation
Peter S. Lynch (62)
Year of Election or Appointment: 2003
Member of the Advisory Board of Variable Insurance products III. Mr. Lynch is Vice Chairman and a Director of FMR, and Vice Chairman (2001-present) and a Director of FMR Co., Inc. Previously, Mr. Lynch served as a Trustee of the Fidelity funds (1990-2003). In addition, he serves as a Trustee of Boston College and as the Chairman of the Inner-City Scholarship Fund.
Kimberley H. Monasterio (43)
Year of Election or Appointment: 2007
President and Treasurer of VIP Dynamic Capital Appreciation. Ms. Monasterio also serves as President and Treasurer of other Fidelity funds (2007-present) and is an employee of FMR (2004-present). Previously, Ms. Monasterio served as Deputy Treasurer of the Fidelity funds (2004-2006). Before joining Fidelity Investments, Ms. Monasterio served as Treasurer (2000-2004) and Chief Financial Officer (2002-2004) of the Franklin Templeton Funds and Senior Vice President of Franklin Templeton Services, LLC (2000-2004).
Philip L. Bullen (47)
Year of Election or Appointment: 2006
Vice President of VIP Dynamic Capital Appreciation. Mr. Bullen also serves as Vice President of certain Equity Funds (2006- present). Mr. Bullen is Senior Vice President of FMR (2001-present) and FMR Co., Inc. (2001-present). Previously, Mr. Bullen served as President and a Director of Fidelity Research & Analysis Company (2001-2005), President and a Director of Fidelity Management & Research (U.K.) Inc. (2002-2006), and a Director of Strategic Advisers, Inc. (2002-2005).
Dwight D. Churchill (53)
Year of Election or Appointment: 2005
Vice President of VIP Dynamic Capital Appreciation. Mr. Churchill also serves as Vice President of certain Equity Funds (2005-present). Mr. Churchill is Executive Vice President of FMR (2005-present) and FMR Co., Inc. (2005-present). Previously, Mr. Churchill served as Senior Vice President of Fidelity Investments Money Management, Inc. (2005-2006), Head of Fidelity's Fixed-Income Division (2000-2005), Vice President of Fidelity's Money Market Funds (2000-2005), Vice President of Fidelity's Bond Funds, and Senior Vice President of FMR.
J. Fergus Shiel (49)
Year of Election or Appointment: 2005
Vice President of VIP Dynamic Capital Appreciation. Mr. Shiel also serves as Vice President of other funds advised by FMR. Prior to assuming his current responsibilities, Mr. Shiel worked as a research analyst and portfolio manager until leaving the firm in May 2003 to run his own investment firm. Mr. Shiel returned to Fidelity Investments as a portfolio manager in September 2005. Mr. Shiel also serves as Vice President of FMR and FMR Co., Inc. (2006).
Eric D. Roiter (58)
Year of Election or Appointment: 2000
Secretary of VIP Dynamic Capital Appreciation. He also serves as Secretary of other Fidelity funds; Vice President, General Counsel, and Secretary of FMR Co., Inc. (2001-present) and FMR; Assistant Secretary of Fidelity Management & Research (U.K.) Inc. (2001-present), Fidelity Research & Analysis Company (2001-present), and Fidelity Investments Money Management, Inc. (2001-present). Mr. Roiter is an Adjunct Member, Faculty of Law, at Boston College Law School (2003-present). Previously, Mr. Roiter served as Vice President and Secretary of Fidelity Distributors Corporation (FDC) (1998-2005).
Stuart Fross (47)
Year of Election or Appointment: 2003
Assistant Secretary of VIP Dynamic Capital Appreciation. Mr. Fross also serves as Assistant Secretary of other Fidelity funds (2003-present), Vice President and Secretary of FDC (2005-present), and is an employee of FMR.
R. Stephen Ganis (40)
Year of Election or Appointment: 2006
Anti-Money Laundering (AML) officer of VIP Dynamic Capital Appreciation. Mr. Ganis also serves as AML officer of other Fidelity funds (2006-present) and FMR Corp. (2003-present). Before joining Fidelity Investments, Mr. Ganis practiced law at Goodwin Procter, LLP (2000-2002).
Joseph B. Hollis (58)
Year of Election or Appointment: 2006
Chief Financial Officer of VIP Dynamic Capital Appreciation. Mr. Hollis also serves as Chief Financial Officer of other Fidelity funds. Mr. Hollis is President of Fidelity Pricing and Cash Management Services (FPCMS) (2005-present). Mr. Hollis also serves as President and Director of Fidelity Service Company, Inc. (2006-present). Previously, Mr. Hollis served as Senior Vice President of Cash Management Services (1999-2002) and Investment Management Operations (2002-2005).
Kenneth A. Rathgeber (59)
Year of Election or Appointment: 2004
Chief Compliance Officer of VIP Dynamic Capital Appreciation. Mr. Rathgeber also serves as Chief Compliance Officer of other Fidelity funds (2004-present) and Executive Vice President of Risk Oversight for Fidelity Investments (2002-present). He is Chief Compliance Officer of FMR (2005-present), FMR Co., Inc. (2005-present), Fidelity Management & Research (U.K.) Inc. (2005-present), Fidelity Research & Analysis Company (2005-present), Fidelity Investments Money Management, Inc. (2005- present), and Strategic Advisers, Inc. (2005-present). Previously, Mr. Rathgeber served as Executive Vice President and Chief Operating Officer for Fidelity Investments Institutional Services Company, Inc. (1998-2002).
Bryan A. Mehrmann (45)
Year of Election or Appointment: 2005
Deputy Treasurer of VIP Dynamic Capital Appreciation. Mr. Mehrmann also serves as Deputy Treasurer of other Fidelity funds (2005-present) and is an employee of FMR. Previously, Mr. Mehrmann served as Vice President of Fidelity Investments Institutional Services Group (FIIS)/Fidelity Investments Institutional Operations Corporation, Inc. (FIIOC) Client Services (1998-2004).
Kenneth B. Robins (37)
Year of Election or Appointment: 2005
Deputy Treasurer of VIP Dynamic Capital Appreciation. Mr. Robins also serves as Deputy Treasurer of other Fidelity funds (2005-present) and is an employee of FMR (2004-present). Before joining Fidelity Investments, Mr. Robins worked at KPMG LLP, where he was a partner in KPMG's department of professional practice (2002-2004) and a Senior Manager (1999-2000). In addition, Mr. Robins served as Assistant Chief Accountant, United States Securities and Exchange Commission (2000-2002).
Robert G. Byrnes (40)
Year of Election or Appointment: 2005
Assistant Treasurer of VIP Dynamic Capital Appreciation. Mr. Byrnes also serves as Assistant Treasurer of other Fidelity funds (2005-present) and is an employee of FMR (2005-present). Previously, Mr. Byrnes served as Vice President of FPCMS (2003-2005). Before joining Fidelity Investments, Mr. Byrnes worked at Deutsche Asset Management where he served as Vice President of the Investment Operations Group (2000-2003).
John H. Costello (60)
Year of Election or Appointment: 2000
Assistant Treasurer of VIP Dynamic Capital Appreciation. Mr. Costello also serves as Assistant Treasurer of other Fidelity funds and is an employee of FMR.
Peter L. Lydecker (52)
Year of Election or Appointment: 2004
Assistant Treasurer of VIP Dynamic Capital Appreciation. Mr. Lydecker also serves as Assistant Treasurer of other Fidelity funds (2004) and is an employee of FMR.
Mark Osterheld (51)
Year of Election or Appointment: 2002
Assistant Treasurer of VIP Dynamic Capital Appreciation. Mr. Osterheld also serves as Assistant Treasurer of other Fidelity funds (2002) and is an employee of FMR.
Gary W. Ryan (48)
Year of Election or Appointment: 2005
Assistant Treasurer of VIP Dynamic Capital Appreciation. Mr. Ryan also serves as Assistant Treasurer of other Fidelity funds (2005-present) and is an employee of FMR (2005-present). Previously, Mr. Ryan served as Vice President of Fund Reporting in FPCMS (1999-2005).
Salvatore Schiavone (41)
Year of Election or Appointment: 2005
Assistant Treasurer of VIP Dynamic Capital Appreciation. Mr. Schiavone also serves as Assistant Treasurer of other Fidelity funds (2005-present) and is an employee of FMR (2005-present). Before joining Fidelity Investments, Mr. Schiavone worked at Deutsche Asset Management, where he most recently served as Assistant Treasurer (2003-2005) of the Scudder Funds and Vice President and Head of Fund Reporting (1996-2003).
Annual Report
Distributions
The Board of Trustees of VIP Dynamic Capital Appreciation Portfolio voted to pay to shareholders of record at the opening of business on record date, the following distributions per share derived from capital gains realized from sales of portfolio securities:
Pay Date
Record Date
Capital Gains
Initial Class
02/09/07
02/09/07
$.12
Service Class
02/09/07
02/09/07
$.12
Service Class 2
02/09/07
02/09/07
$.12
Investor Class
02/09/07
02/09/07
$.12
The fund hereby designates as a capital gain dividend with respect to the taxable year ended December 31, 2006, $3,522,644 or, if subsequently determined to be different, the net capital gain of such year.
Initial Class designates 35% and 100% and Investor Class designates 40% and 100% of the dividends distributed in February and December, respectively during the fiscal year as qualifying for the dividends received-deduction for corporate shareholders.
Service Class and Service Class 2 designate 100% of the dividends distributed during the fiscal year as qualifying for the dividends-received deduction for corporate shareholders.
The fund will notify shareholders in January 2007 of amounts for use in preparing 2006 income tax returns.
Annual Report
Proxy Voting Results
A special meeting of the fund's shareholders was held on November 15, 2006. The results of votes taken among shareholders on the proposal before them are reported below. Each vote reported represents one dollar of net asset value held on the record date for the meeting.
PROPOSAL 1
To elect a Board of Trustees. A
# of Votes
% of Votes
Dennis J. Dirks
Affirmative
8,022,573,906.52
96.057
Withheld
329,291,624.43
3.943
TOTAL
8,351,865,530.95
100.000
Albert R. Gamper, Jr.
Affirmative
8,017,939,119.36
96.002
Withheld
333,926,411.59
3.998
TOTAL
8,351,865,530.95
100.000
Robert M. Gates
Affirmative
8,011,581,068.50
95.926
Withheld
340,284,462.45
4.074
TOTAL
8,351,865,530.95
100.000
George H. Heilmeier
Affirmative
8,000,846,196.79
95.797
Withheld
351,019,334.16
4.203
TOTAL
8,351,865,530.95
100.000
Edward C. Johnson 3d
Affirmative
7,992,112,301.22
95.693
Withheld
359,753,229.73
4.307
TOTAL
8,351,865,530.95
100.000
Stephen P. Jonas
Affirmative
8,019,883,742.95
96.025
Withheld
331,981,788.00
3.975
TOTAL
8,351,865,530.95
100.000
James H. KeyesB
Affirmative
8,015,436,547.06
95.972
Withheld
336,428,983.89
4.028
TOTAL
8,351,865,530.95
100.000
Marie L. Knowles
Affirmative
8,015,361,874.49
95.971
Withheld
336,503,656.46
4.029
TOTAL
8,351,865,530.95
100.000
Ned C. Lautenbach
Affirmative
8,018,503,793.25
96.009
Withheld
333,361,737.70
3.991
TOTAL
8,351,865,530.95
100.000
# of Votes
% of Votes
William O. McCoy
Affirmative
8,000,170,571.19
95.789
Withheld
351,694,959.76
4.211
TOTAL
8,351,865,530.95
100.000
Robert L. Reynolds
Affirmative
8,020,815,676.67
96.036
Withheld
331,049,854.28
3.964
TOTAL
8,351,865,530.95
100.000
Cornelia M. Small
Affirmative
8.020,146,516.32
96.028
Withheld
331,719,014.63
3.972
TOTAL
8,351,865,530.95
100.000
William S. Stavropoulos
Affirmative
8,009,250,640.78
95.898
Withheld
342,614,890.17
4.102
TOTAL
8,351,865,530.95
100.000
Kenneth L. Wolfe
Affirmative
8,013,187,941.55
95.945
Withheld
338,677,589.40
4.055
TOTAL
8,351,865,530.95
100.000
ADenotes trust-wide proposal and voting results.
BEffective on or about January 1, 2007.
Annual Report
Board Approval of Investment Advisory Contracts and Management Fees
VIP Dynamic Capital Appreciation Portfolio
Each year, typically in July, the Board of Trustees, including the Independent Trustees (together, the Board), votes on the renewal of the management contract and sub-advisory agreements (together, the Advisory Contracts) for the fund. The Board, assisted by the advice of fund counsel and Independent Trustees' counsel, requests and considers a broad range of information throughout the year.
The Board meets regularly each month except August and takes into account throughout the year matters bearing on Advisory Contracts. The Board, acting directly and through its separate committees, considers at each of its meetings factors that are relevant to the annual renewal of the fund's Advisory Contracts, including the services and support provided to the fund and its shareholders. At the time of the renewal, the Board had 12 standing committees, each composed of Independent Trustees with varying backgrounds, to which the Board has assigned specific subject matter responsibilities in order to enhance effective decision-making by the Board. Each committee has adopted a written charter outlining the structure and purposes of the committee. One such committee, the Equity Contract Committee, meets periodically as needed throughout the year to consider matters specifically related to the annual renewal of Advisory Contracts. The committee requests and receives information on, and makes recommendations to the Independent Trustees concerning, the approval and annual review of the Advisory Contracts.
At its July 2006 meeting, the Board of Trustees, including the Independent Trustees, unanimously determined to renew the Advisory Contracts for the fund. In reaching its determination, the Board considered all factors it believed relevant, including (i) the nature, extent, and quality of the services to be provided to the fund and its shareholders (including the investment performance of the fund); (ii) the competitiveness of the management fee and total expenses of the fund; (iii) the total costs of the services to be provided by and the profits to be realized by the investment adviser and its affiliates from the relationship with the fund; (iv) the extent to which economies of scale would be realized as the fund grows; and (v) whether fee levels reflect these economies of scale, if any, for the benefit of fund shareholders.
In determining whether to renew the Advisory Contracts for the fund, the Board ultimately reached a determination, with the assistance of fund counsel and Independent Trustees' counsel, that the renewal of the Advisory Contracts and the compensation to be received by Fidelity under the management contract is consistent with Fidelity's fiduciary duty under applicable law. In addition to evaluating the specific factors noted above, the Board, in reaching its determination, is aware that shareholders in the fund have a broad range of investment choices available to them, including a wide choice among mutual funds offered by competitors to Fidelity, and that the fund's shareholders, with the opportunity to review and weigh the disclosure provided by the fund in its prospectus and other public disclosures, have chosen to invest in this fund, managed by Fidelity.
Nature, Extent, and Quality of Services Provided. The Board considered staffing within the investment adviser, FMR, and the sub-advisers (together, the Investment Advisers), including the background of the fund's portfolio manager and the fund's investment objective and discipline. The Independent Trustees also had discussions with senior management of Fidelity's investment operations and investment groups. The Board considered the structure of the portfolio manager compensation program and whether this structure provides appropriate incentives.
Resources Dedicated to Investment Management and Support Services. The Board reviewed the size, education, and experience of the Investment Advisers' investment staff, their use of technology, and the Investment Advisers' approach to recruiting, training, and retaining portfolio managers and other research, advisory, and management personnel. The Board considered Fidelity's extensive global research capabilities that enable the Investment Advisers to aggregate data from various sources in an effort to produce positive investment results. The Board noted that Fidelity's analysts have access to a variety of technological tools that enable them to perform both fundamental and quantitative analysis and to specialize in various disciplines. The Board also considered that Fidelity's portfolio managers and analysts have access to daily portfolio attribution that allows for monitoring of a fund's portfolio, as well as an electronic communication system that provides immediate real-time access to research concerning issuers and credit enhancers.
Shareholder and Administrative Services. The Board considered (i) the nature, extent, quality, and cost of administrative, distribution, and shareholder services performed by the Investment Advisers and their affiliates under the Advisory Contracts and under separate agreements covering transfer agency, pricing and bookkeeping, and securities lending services for the fund; (ii) the nature and extent of the Investment Advisers' supervision of third party service providers, principally custodians and subcustodians; and (iii) the resources devoted to, and the record of compliance with, the fund's compliance policies and procedures. The Board reviewed the allocation of fund brokerage, including allocations to brokers affiliated with the Investment Advisers, the use of brokerage commissions to pay fund expenses, and the use of "soft" commission dollars to pay for research services. The Board also considered that Fidelity voluntarily pays for market data out of its own resources.
The Board noted that the growth of fund assets across the complex allows Fidelity to reinvest in the development of services designed to enhance the value or convenience of the Fidelity funds as investment vehicles. These services include 24-hour access to account information and market information through phone representatives and over the Internet, and investor education materials and asset allocation tools.
Investment in a Large Fund Family. The Board considered the benefits to shareholders of investing in a Fidelity fund, including the benefits of investing in a fund that is part of a large family of funds offering a variety of investment disciplines and providing for a large variety of mutual fund investor services. The Board noted that, since the last Advisory Contract renewals in July 2005, Fidelity has taken a number of actions that benefited particular funds, including (i) dedicating additional resources to investment research and to restructure the investment research teams; (ii) voluntarily entering into contractual arrangements with certain brokers pursuant to which Fidelity pays for research products and services separately out of its own resources, rather than bundling with fund commissions; (iii) launching the Fidelity Advantage Class of its five Spartan stock index funds and three Spartan bond index funds, which is a lower-fee class available to shareholders with higher account balances; (iv) contractually agreeing to impose expense limitations on Fidelity U.S. Bond Index Fund and reducing the fund's initial investment minimum; and (v) offering shareholders of each of the Fidelity Institutional Money Market Funds the privilege of exchanging shares of the fund for shares of other Fidelity funds.
Annual Report
Board Approval of Investment Advisory Contracts and Management Fees - continued
Investment Performance and Compliance. The Board considered whether the fund has operated within its investment objective, as well as its record of compliance with its investment restrictions. It also reviewed the fund's absolute investment performance for each class (except Investor Class), as well as the fund's relative investment performance for each class (except Investor Class) measured against (i) a broad-based securities market index, and (ii) a peer group of mutual funds deemed appropriate by the Board over multiple periods. The following charts considered by the Board show, over the one-, three-, and five-year periods ended December 31, 2005, the cumulative total returns of Service Class 2 and Initial Class of the fund, the cumulative total returns of a broad-based securities market index ("benchmark"), and a range of cumulative total returns of a peer group of mutual funds identified by Lipper Inc. as having an investment objective similar to that of the fund. The returns of Service Class 2 and Initial Class represent the performance of classes with the highest and lowest 12b-1 fees, respectively (not necessarily with the highest and lowest total expenses). (Investor Class of the fund, which has no 12b-1 fee, had less than one year of performance as of December 31, 2005.) The box within each chart shows the 25th percentile return (bottom of box) and the 75th percentile return (top of box) of the Lipper peer group. Returns shown above the box are in the first quartile and returns shown below the box are in the fourth quartile. The percentage beaten numbers noted below each chart correspond to the percentile box and represent the percentage of funds in the Lipper peer group whose performance was equal to or lower than that of the class indicated.
VIP Dynamic Capital Appreciation Portfolio
The Board reviewed the fund's relative investment performance against its Lipper peer group and stated that the performance of Initial Class of the fund was in the first quartile for the one-year period, the third quartile for the three-year period, and the second quartile for the five-year period. The Board also stated that the relative investment performance of Initial Class of the fund compared favorably to its benchmark for the one- and three-year periods, although the fund's five-year cumulative total return was lower than its benchmark. The Board considered that the variations in performance among the fund's classes reflect the variations in class expenses, which result in lower performance for higher expense classes. The Board also reviewed the fund's relative investment performance against a customized peer group based on a combination of categories defined by Morningstar.
The Board considered that FMR has taken steps to refocus and strengthen equity research, equity portfolio management, and compliance. The Board noted with favor FMR's reorganization of its senior management team in 2005 and FMR's dedication of additional resources to investment research, and participated in the process that led to those changes.
Based on its review, and giving particular weight to the nature and quality of the resources dedicated by the Investment Advisers to maintain and improve relative performance, the Board concluded that the nature, extent, and quality of the services provided to the fund will benefit the fund's shareholders, particularly in light of the Board's view that the fund's shareholders benefit from investing in a fund that is part of a large family of funds offering a variety of investment disciplines and services.
Competitiveness of Management Fee and Total Fund Expenses. The Board considered the fund's management fee and total expenses compared to "mapped groups" of competitive funds and classes. Fidelity creates "mapped groups" by combining similar Lipper investment objective categories that have comparable management fee characteristics. Combining Lipper investment objective categories aids the Board's management fee and total expense comparisons by broadening the competitive group used for comparison and by reducing the number of universes to which various Fidelity funds are compared.
VIP Dynamic Capital Appreciation Portfolio
The Board considered two proprietary management fee comparisons for the 12-month periods shown in the chart below. The group of Lipper funds used by the Board for management fee comparisons is referred to below as the "Total Mapped Group" and, for the reasons explained above, is broader than the Lipper peer group used by the Board for performance comparisons. The Total Mapped Group comparison focuses on a fund's standing relative to the total universe of comparable funds available to investors, in terms of gross management fees before expense reimbursements or caps. "TMG %" represents the percentage of funds in the Total Mapped Group that had management fees that were lower than the fund's. For example, a TMG % of 6% means that 94% of the funds in the Total Mapped Group had higher management fees than the fund. The "Asset-Size Peer Group" (ASPG) comparison focuses on a fund's standing relative to non-Fidelity funds similar in size to the fund within the Total Mapped Group. The ASPG represents at least 15% of the funds in the Total Mapped Group with comparable asset size and management fee characteristics, subject to a minimum of 50 funds (or all funds in the Total Mapped Group if fewer than 50). Additional information, such as the ASPG quartile in which the fund's management fee ranked, is also included in the chart and considered by the Board.
VIP Dynamic Capital Appreciation Portfolio
The Board noted that the fund's management fee ranked below the median of its Total Mapped Group and below the median of its ASPG for 2005.
Based on its review, the Board concluded that the fund's management fee was fair and reasonable in light of the services that the fund receives and the other factors considered.
In its review of each class's total expenses, the Board considered the fund's management fee as well as other fund or class expenses, as applicable, such as transfer agent fees, pricing and bookkeeping fees, fund-paid 12b-1 fees, and custodial, legal, and audit fees. The Board also noted the effects of any waivers and reimbursements on fees and expenses. As part of its review, the Board also considered current and historical total expenses of each class of the fund compared to competitive fund median expenses. Each class of the fund is compared to those funds and classes in the Total Mapped Group (used by the Board for management fee comparisons) that have a similar sales load structure.
The Board noted that the total expenses of each of Initial Class and Service Class ranked below its competitive median for 2005, and the total expenses of each of Investor Class and Service Class 2 ranked above its competitive median for 2005. The Board noted that the fund offers multiple classes, each of which has a different 12b-1 fee structure, and that the multiple structures are intended to offer a range of pricing options for the intermediary market. The Board also noted that the total expenses of the classes vary primarily by the level of their 12b-1 fees, although differences in transfer agent fees may also cause expenses to vary from class to class. The Board considered that Investor Class was above median primarily due to its higher transfer agent fee.
In its review of total expenses, the Board also considered Fidelity fee structures and other information on clients that FMR and its affiliates service in other competitive markets, such as other mutual funds advised or subadvised by FMR or its affiliates, pension plan clients, and other institutional clients.
Annual Report
Board Approval of Investment Advisory Contracts and Management Fees - continued
Based on its review, the Board concluded that the total expenses of each class of the fund were reasonable, although in some cases above the median of the universe presented for comparison, in light of the services that the fund and its shareholders receive and the other factors considered.
Costs of the Services and Profitability. The Board considered the revenues earned and the expenses incurred by Fidelity in conducting the business of developing, marketing, distributing, managing, administering and servicing the fund and its shareholders. The Board also considered the level of Fidelity's profits in respect of all the Fidelity funds.
On an annual basis, FMR presents to the Board Fidelity's profitability for the fund. Fidelity calculates the profitability for each fund, as well as aggregate profitability for groups of Fidelity funds and all Fidelity funds, using a series of detailed revenue and cost allocation methodologies which originate with the audited books and records of Fidelity. The Audit Committee of the Board reviews any significant changes from the prior year's methodologies.
PricewaterhouseCoopers LLP (PwC), independent registered accounting firm and auditor to Fidelity and certain Fidelity funds, has been engaged annually by the Board as part of the Board's assessment of the results of Fidelity's profitability analysis. PwC's engagement includes the review and assessment of Fidelity's methodologies used in determining the revenues and expenses attributable to Fidelity's mutual fund business, and completion of agreed-upon procedures surrounding the mathematical accuracy of fund profitability and its conformity to allocation methodologies. After considering PwC's reports issued under the engagement and information provided by Fidelity, the Board believes that while other allocation methods may also be reasonable, Fidelity's profitability methodologies are reasonable in all material respects.
The Board has also reviewed Fidelity's non-fund businesses and any fall-out benefits related to the mutual fund business as well as cases where Fidelity's affiliates may benefit from or be related to the fund's business.
The Board considered the costs of the services provided by and the profits realized by Fidelity in connection with the operation of the fund and determined that the amount of profit is a fair entrepreneurial profit for the management of the fund.
Economies of Scale. The Board considered whether there have been economies of scale in respect of the management of the Fidelity funds, whether the Fidelity funds (including the fund) have appropriately benefited from any such economies of scale, and whether there is potential for realization of any further economies of scale. The Board considered the extent to which the fund will benefit from economies of scale through increased services to the fund, through waivers or reimbursements, or through fee or expense reductions.
The Board recognized that the fund's management contract incorporates a "group fee" structure, which provides for lower fee rates as total fund assets under FMR's management increase, and for higher fee rates as total fund assets under FMR's management decrease. The Board considered that the group fee is designed to deliver the benefits of economies of scale to fund shareholders when total fund assets increase, even if assets of any particular fund are unchanged or have declined, because some portion of Fidelity's costs are attributable to services provided to all Fidelity funds, and all funds benefit if those costs can be allocated among more assets. The Board concluded that, given the group fee structure, fund shareholders will achieve a certain level of economies of scale as assets under FMR's management increase at the fund complex level, regardless of whether Fidelity achieves any such economies of scale.
The Board further concluded that any potential economies of scale are being shared between fund shareholders and Fidelity in an appropriate manner.
Additional Information Requested by the Board. In order to develop fully the factual basis for consideration of the Advisory Contracts, the Board requested additional information on several topics, including (i) Fidelity's fund profitability methodology and profitability trends within certain funds; (ii) portfolio manager compensation; (iii) the extent to which any economies of scale exist and are shared between the funds and Fidelity; (iv) the total expenses of certain funds and classes relative to competitors, including the extent to which the expenses of certain funds have been or could be capped; (v) fund performance trends; and (vi) Fidelity's fee structures, including use of performance fees.
Based on its evaluation of all of the conclusions noted above, and after considering all material factors, the Board ultimately concluded that the advisory fee structures are fair and reasonable, and that the fund's Advisory Contracts should be renewed.
VIP Dynamic Capital Appreciation Portfolio
Annual Report
Investment Adviser
Fidelity Management & Research Company Boston, MA
Investment Sub-Advisers
FMR Co., Inc.
Fidelity Management & Research (U.K.) Inc.
Fidelity Research & Analysis Company (formerly Fidelity Management & Research (Far East) Inc.)
Fidelity Investments Japan Limited
Fidelity International Investment Advisors
Fidelity International Investment Advisors (U.K.) Limited
General Distributor
Fidelity Distributors Corporation Boston, MA
Transfer Agent
Fidelity Investments Institutional Operations Company, Inc. Boston, MA
To view a fund's proxy voting guidelines and proxy voting record for the 12-month period ended June 30, visit www.fidelity.com/proxyvotingresults or visit the Securities and Exchange Commission's (SEC) web site at www.sec.gov. You may also call 1-877-208-0098 to request a free copy of the proxy voting guidelines.
Fidelity Variable Insurance Products are separate account options which are purchased through a variable insurance contract.
Standard & Poor's, S&P and S&P 500 are registered service marks of The McGraw-Hill Companies, Inc. and have been licensed for use by Fidelity Distributors Corporation.
Other third party marks appearing herein are the property of their respective owners.
All other marks appearing herein are registered or unregistered trademarks or service marks of FMR Corp. or an affiliated company.
This report and the financial statements contained herein are submitted for the general information of the shareholders of the fund. This report is not authorized for distribution to prospective investors in the fund unless preceded or accompanied by an effective prospectus.
A fund files its complete schedule of portfolio holdings with the SEC for the first and third quarters of each fiscal year on Form N-Q. Forms N-Q are available on the SEC's web site at http://www.sec.gov. A fund's Forms N-Q may be reviewed and copied at the SEC's Public Reference Room in Washington, DC. Information regarding the operation of the SEC's Public Reference Room may be obtained by calling 1-800-SEC-0330. For a complete list of a fund's portfolio holdings, view the most recent quarterly holdings report, semiannual report, or annual report on Fidelity's web site at http://www.advisor.fidelity.com.
NOT FDIC INSURED· MAY LOSE VALUE· NO BANK GUARANTEE
Neither the fund nor Fidelity Distributors Corporation is a bank.
Portfolio
VIP Growth & Income Portfolio
Performance: The Bottom Line
Average annual total return reflects the change in the value of an investment, assuming reinvestment of the class' dividend income and capital gains (the profits earned upon the sale of securities that have grown in value) and assuming a constant rate of performance each year. During periods of reimbursement by Fidelity, a fund's total return will be greater than it would be had the reimbursement not occurred. Performance numbers are net of all underlying fund operating expenses, but do not include any insurance charges imposed by your insurance company's separate account. If performance information included the effect of these additional charges, the total returns would have been lower. How a fund did yesterday is no guarantee of how it will do tomorrow.
Average Annual Total Returns
Periods ended December 31, 2006
Past 1 year
Past 5 years
Past 10 years
VIP Growth & Income - Initial Class
13.18%
5.87%
7.97%
VIP Growth & Income - Service Class A
13.01%
5.76%
7.86%
VIP Growth & Income - Service Class 2 B
12.86%
5.60%
7.74%
VIP Growth & Income - Investor Class C
12.95%
5.82%
7.94%
A The initial offering of Service Class shares took place on November 3, 1997. Performance for Service Class shares reflects an asset based distribution fee (12b-1 fee), and returns prior to November 3, 1997 are those of Initial Class and do not include the effects of Service Class' 12b-1 fee. Had Service Class shares' 12b-1 fee been reflected, returns prior to November 3, 1997 would have been lower.
B The initial offering of Service Class 2 shares took place on January 12, 2000. Performance for Service Class 2 shares reflects an asset based distribution fee (12b-1 fee). Returns from November 3, 1997 to January 12, 2000 are those of Service Class which reflect a different 12b-1 fee. Service Class 2 returns prior to November 3, 1997 are those of the Initial Class and do not include the effects of a 12b-1 fee. Had Service Class 2's 12b-1 fee been reflected, returns prior to January 12, 2000 would have been lower.
C The initial offering of Investor Class shares took place on July 21, 2005. Returns prior to July 21, 2005 are those of Initial Class.If Investor Class's transfer agent fee had been reflected, returns prior to July 21, 2005 would have been lower.
$10,000 Life of Fund
Let's say hypothetically that $10,000 was invested in VIP Growth & Income Portfolio - Initial Class on December 31, 1996, when the fund started. The chart shows how the value of your investment would have changed, and also shows how the Standard & Poor's 500SM Index performed over the same period.
Annual Report
VIP Growth & Income Portfolio
Management's Discussion of Fund Performance
Comments from James Catudal, Portfolio Manager of VIP Growth & Income Portfolio
U.S. stock markets registered their fourth consecutive year of positive returns in 2006. Among the highlights were the performances of the Dow Jones Industrial AverageSM- a gauge of 30 mega-cap, blue-chip stocks - and the small-cap-oriented Russell 2000® Index, both of which reached new highs. The efforts of the Federal Reserve Board to contain inflation levels also dominated the investment headlines. In all, the Fed hiked short-term interest rates four times, but held rates steady after its June 29 increase, finally pausing after 17 rate hikes over a two-year period. A slowing residential housing market and moderating oil prices - the latter of which hit a record closing high of $77 per barrel in July before falling sharply - also held economic growth in check. For the year overall, the Standard & Poor's 500SM Index was up 15.79%, the Dow advanced 19.05%, the Russell 2000 Index gained 18.37% and the NASDAQ Composite® Index rose 10.39%.
For the 12 months ending December 31, 2006, VIP Growth & Income Portfolio trailed the S&P 500®. (For specific portfolio performance results, please refer to the performance section of this report.) The primary factors in the fund's underperformance relative to the index were weak stock selection in health care and unfavorable positioning within the financials sector. In health care, the fund favored lifescience/biotechnology stocks and services companies, including health maintenance organizations (HMOs), over the large pharmaceutical companies, which performed comparatively well. In financials, underweighting diversified financials detracted from results versus the index. These negative influences were partially offset by good stock selection in the information technology and industrials sectors. Among my health care holdings, HMO UnitedHealth Group was a particular disappointment. Its share price fell hard after a controversy over the backdating of stock options led to the resignation of the company's chief executive officer. Other health care investments that held back results included Affymetrix, PDL BioPharma and Invitrogen - stocks not represented in the S&P 500. The two top contributors were industrials companies McDermott International and Aviall. McDermott gained as its Babcock & Wilcox division emerged from bankruptcy protection after resolving asbestos liability issues and then started contributing to earnings. Aerospace parts distributor Aviall, which I subsequently sold, rose in price when it received a buyout proposal from Boeing. Another notable contributor was Canada's Research In Motion, which gained on the popularity of its BlackBerry messaging devices. None of these contributors were included in the benchmark.
The views expressed above reflect those of the portfolio manager(s) only through the end of the period as stated on the cover of this report and do not necessarily represent the views of Fidelity or any other person in the Fidelity organization. Any such views are subject to change at any time based upon market or other conditions and Fidelity disclaims any responsibility to update such views. These views may not be relied on as investment advice and, because investment decisions for a Fidelity fund are based on numerous factors, may not be relied on as an indication of trading intent on behalf of any Fidelity fund.
Annual Report
VIP Growth & Income Portfolio
Shareholder Expense Example
As a shareholder of the Fund, you incur two types of costs: (1) transaction costs, and (2) ongoing costs, including management fees, distribution and/or service (12b-1) fees and other Fund expenses. This Example is intended to help you understand your ongoing costs (in dollars) of investing in the Fund and to compare these costs with the ongoing costs of investing in other mutual funds.
The Example is based on an investment of $1,000 invested at the beginning of the period and held for the entire period (July 1, 2006 to December 31, 2006).
Actual Expenses
The first line of the accompanying table for each class of the Fund provides information about actual account values and actual expenses. You may use the information in this line, together with the amount you invested, to estimate the expenses that you paid over the period. Simply divide your account value by $1,000.00 (for example, an $8,600 account value divided by $1,000.00 = 8.6), then multiply the result by the number in the first line for a class of the Fund under the heading entitled "Expenses Paid During Period" to estimate the expenses you paid on your account during this period. The estimate of expenses does not include any fees or other expenses of any variable annuity or variable life insurance product. If they were, the estimate of expenses you paid during the period would be higher, and your ending account value would be lower.
Hypothetical Example for Comparison Purposes
The second line of the accompanying table for each class of the Fund provides information about hypothetical account values and hypothetical expenses based on a Class' actual expense ratio and an assumed rate of return of 5% per year before expenses, which is not the Class' actual return. The hypothetical account values and expenses may not be used to estimate the actual ending account balance or expenses you paid for the period. You may use this information to compare the ongoing costs of investing in the Fund and other funds. To do so, compare this 5% hypothetical example with the 5% hypothetical examples that appear in the shareholder reports of the other funds. The estimate of expenses does not include any fees or other expenses of any variable annuity or variable life insurance product. If they were, the estimate of expenses you paid during the period would be higher, and your ending account value would be lower.
Please note that the expenses shown in the table are meant to highlight your ongoing costs only and do not reflect any transaction costs. Therefore, the second line of the table is useful in comparing ongoing costs only, and will not help you determine the relative total costs of owning different funds.
Beginning Account Value July 1, 2006
Ending Account Value December 31, 2006
Expenses Paid During Period* July 1, 2006 to December 31, 2006
Initial Class
Actual
$ 1,000.00
$ 1,112.50
$ 3.25
HypotheticalA
$ 1,000.00
$ 1,022.13
$ 3.11
Service Class
Actual
$ 1,000.00
$ 1,112.60
$ 3.78
HypotheticalA
$ 1,000.00
$ 1,021.63
$ 3.62
Service Class 2
Actual
$ 1,000.00
$ 1,111.40
$ 4.58
HypotheticalA
$ 1,000.00
$ 1,020.87
$ 4.38
Investor Class
Actual
$ 1,000.00
$ 1,112.10
$ 3.89
HypotheticalA
$ 1,000.00
$ 1,021.53
$ 3.72
A5% return per year before expenses
*Expenses are equal to each Class' annualized expense ratio (shown in the table below); multiplied by the average account value over the period, multiplied by 184/365 (to reflect the one-half year period).
Annualized Expense Ratio
Initial Class
.61%
Service Class
.71%
Service Class 2
.86%
Investor Class
.73%
Annual Report
VIP Growth & Income Portfolio
Investment Changes
Top Ten Stocks as of December 31, 2006
% of fund's net assets
% of fund's net assets 6 months ago
General Electric Co.
5.0
4.9
American International Group, Inc.
4.1
3.4
Microsoft Corp.
3.5
3.0
Procter & Gamble Co.
2.5
1.3
Exxon Mobil Corp.
2.5
2.9
Cisco Systems, Inc.
1.9
1.5
Altria Group, Inc.
1.6
1.4
AT&T, Inc.
1.5
1.2
Bank of America Corp.
1.4
2.4
Google, Inc. Class A (sub. vtg.)
1.3
1.6
25.3
Top Five Market Sectors as of December 31, 2006
% of fund's net assets
% of fund's net assets 6 months ago
Financials
23.6
21.0
Information Technology
20.6
18.7
Health Care
13.5
14.0
Industrials
11.6
14.4
Energy
9.5
9.8
Asset Allocation (% of fund's net assets)
As of December 31, 2006 *
As of June 30, 2006 **
Stocks 97.9%
Stocks 97.8%
Short-Term Investments and Net Other Assets 2.1%
Short-Term Investments and Net Other Assets 2.2%
* Foreign investments
11.1%
** Foreign investments
9.8%
Annual Report
VIP Growth & Income Portfolio
Investments December 31, 2006
Showing Percentage of Net Assets
Common Stocks - 97.9%
Shares
Value (Note 1)
CONSUMER DISCRETIONARY - 6.6%
Hotels, Restaurants & Leisure - 0.6%
Jamba, Inc. (a)(d)
398,700
$ 4,014,909
Starbucks Corp. (a)
129,900
4,601,058
8,615,967
Household Durables - 0.8%
Koninklijke Philips Electronics NV (NY Shares)
119,200
4,479,536
Sony Corp. sponsored ADR
99,800
4,274,434
Whirlpool Corp.
42,200
3,503,444
12,257,414
Media - 1.8%
E.W. Scripps Co. Class A
57,900
2,891,526
News Corp. Class B
342,700
7,628,502
Time Warner, Inc.
800,600
17,437,068
27,957,096
Multiline Retail - 1.0%
Target Corp.
270,000
15,403,500
Specialty Retail - 2.1%
Best Buy Co., Inc.
104,600
5,145,274
Esprit Holdings Ltd.
318,500
3,556,269
Lowe's Companies, Inc.
126,800
3,949,820
PETsMART, Inc.
74,000
2,135,640
Staples, Inc.
336,302
8,979,263
Tiffany & Co., Inc.
70,100
2,750,724
TJX Companies, Inc.
195,500
5,575,660
32,092,650
Textiles, Apparel & Luxury Goods - 0.3%
Liz Claiborne, Inc.
87,000
3,781,020
TOTAL CONSUMER DISCRETIONARY
100,107,647
CONSUMER STAPLES - 7.1%
Beverages - 0.6%
Molson Coors Brewing Co. Class B
73,600
5,625,984
PepsiCo, Inc.
55,400
3,465,270
9,091,254
Food & Staples Retailing - 0.6%
CVS Corp.
139,500
4,311,945
Safeway, Inc.
152,600
5,273,856
9,585,801
Food Products - 0.9%
Nestle SA sponsored ADR
147,000
13,083,000
Household Products - 3.4%
Colgate-Palmolive Co.
202,500
13,211,100
Procter & Gamble Co.
583,100
37,475,837
50,686,937
Tobacco - 1.6%
Altria Group, Inc.
288,660
24,772,801
TOTAL CONSUMER STAPLES
107,219,793
Shares
Value (Note 1)
ENERGY - 9.5%
Energy Equipment & Services - 5.7%
Baker Hughes, Inc.
109,600
$ 8,182,736
Cameron International Corp. (a)
320,500
17,002,525
Diamond Offshore Drilling, Inc.
71,900
5,747,686
Halliburton Co.
643,617
19,984,308
Nabors Industries Ltd. (a)
190,100
5,661,178
Schlumberger Ltd. (NY Shares)
319,700
20,192,252
Smith International, Inc.
238,700
9,803,409
86,574,094
Oil, Gas & Consumable Fuels - 3.8%
Exxon Mobil Corp.
486,100
37,249,843
Peabody Energy Corp.
124,600
5,035,086
Petroplus Holdings AG
18,850
1,144,346
Plains Exploration & Production Co. (a)
139,100
6,611,423
Ultra Petroleum Corp. (a)
39,890
1,904,748
Valero Energy Corp.
121,900
6,236,404
58,181,850
TOTAL ENERGY
144,755,944
FINANCIALS - 23.6%
Capital Markets - 4.4%
Ameriprise Financial, Inc.
147,200
8,022,400
Charles Schwab Corp.
445,300
8,612,102
E*TRADE Financial Corp.
206,400
4,627,488
Franklin Resources, Inc.
63,800
7,028,846
Goldman Sachs Group, Inc.
41,700
8,312,895
Investors Financial Services Corp.
146,800
6,263,956
Lehman Brothers Holdings, Inc.
40,600
3,171,672
State Street Corp.
242,500
16,354,200
UBS AG (NY Shares)
76,600
4,621,278
67,014,837
Commercial Banks - 3.9%
Commerce Bancorp, Inc., New Jersey (d)
93,000
3,280,110
Mizuho Financial Group, Inc.
531
3,791,264
PNC Financial Services Group, Inc.
102,200
7,566,888
Standard Chartered PLC (United Kingdom)
306,657
8,960,998
Sumitomo Mitsui Financial Group, Inc.
372
3,812,180
U.S. Bancorp, Delaware
229,400
8,301,986
Wachovia Corp.
176,670
10,061,357
Wells Fargo & Co.
368,090
13,089,280
58,864,063
Consumer Finance - 0.7%
American Express Co.
154,700
9,385,649
Capital One Financial Corp. (d)
26,400
2,028,048
11,413,697
Common Stocks - continued
Shares
Value (Note 1)
FINANCIALS - continued
Diversified Financial Services - 2.4%
Bank of America Corp.
415,400
$ 22,178,206
Citigroup, Inc.
269,000
14,983,300
37,161,506
Insurance - 10.5%
ACE Ltd.
163,200
9,885,024
AFLAC, Inc.
119,100
5,478,600
American International Group, Inc.
879,305
63,010,996
Berkshire Hathaway, Inc. Class A (a)
123
13,528,770
Endurance Specialty Holdings Ltd.
59,300
2,169,194
Everest Re Group Ltd.
94,400
9,261,584
Fidelity National Financial, Inc. Class A
186,100
4,444,068
Hartford Financial Services Group, Inc.
135,500
12,643,505
Lincoln National Corp.
104,900
6,965,360
National Financial Partners Corp.
143,500
6,309,695
PartnerRe Ltd.
78,900
5,604,267
Prudential Financial, Inc.
142,900
12,269,394
W.R. Berkley Corp.
228,900
7,899,339
159,469,796
Real Estate Investment Trusts - 0.4%
Equity Residential (SBI)
56,000
2,842,000
Vornado Realty Trust
21,000
2,551,500
5,393,500
Real Estate Management & Development - 0.3%
Mitsui Fudosan Co. Ltd.
154,000
3,757,833
Move, Inc.
173,600
956,536
4,714,369
Thrifts & Mortgage Finance - 1.0%
Countrywide Financial Corp.
44,600
1,893,270
Hudson City Bancorp, Inc.
445,200
6,179,376
People's Bank, Connecticut
117,700
5,251,774
Washington Mutual, Inc.
34,800
1,583,052
14,907,472
TOTAL FINANCIALS
358,939,240
HEALTH CARE - 13.5%
Biotechnology - 2.7%
Amgen, Inc. (a)
98,410
6,722,387
Biogen Idec, Inc. (a)
165,000
8,116,350
Celgene Corp. (a)
66,500
3,825,745
Cephalon, Inc. (a)
53,800
3,788,058
Genentech, Inc. (a)
31,300
2,539,369
Gilead Sciences, Inc. (a)
117,700
7,642,261
MedImmune, Inc. (a)
172,000
5,567,640
PDL BioPharma, Inc. (a)
145,400
2,928,356
41,130,166
Health Care Equipment & Supplies - 2.7%
Alcon, Inc.
18,400
2,056,568
Baxter International, Inc.
230,800
10,706,812
Shares
Value (Note 1)
Becton, Dickinson & Co.
124,400
$ 8,726,660
C.R. Bard, Inc.
82,500
6,845,025
Cooper Companies, Inc.
95,368
4,243,876
DJO, Inc. (a)
142,900
6,118,978
St. Jude Medical, Inc. (a)
62,670
2,291,215
40,989,134
Health Care Providers & Services - 2.4%
Brookdale Senior Living, Inc.
39,000
1,872,000
Cardinal Health, Inc.
67,600
4,355,468
Health Net, Inc. (a)
141,800
6,899,988
Healthways, Inc. (a)
8,800
419,848
Henry Schein, Inc. (a)
149,500
7,322,510
I-trax, Inc. (a)
230,600
714,860
Medco Health Solutions, Inc. (a)
84,900
4,537,056
Sierra Health Services, Inc. (a)
92,500
3,333,700
UnitedHealth Group, Inc.
144,300
7,753,239
37,208,669
Health Care Technology - 0.2%
IMS Health, Inc.
99,100
2,723,268
Life Sciences Tools & Services - 0.9%
Affymetrix, Inc. (a)
70,100
1,616,506
Invitrogen Corp. (a)
142,000
8,035,780
Millipore Corp. (a)
62,300
4,149,180
13,801,466
Pharmaceuticals - 4.6%
Allergan, Inc.
46,100
5,520,014
Johnson & Johnson
284,700
18,795,894
Merck & Co., Inc.
302,500
13,189,000
Novartis AG sponsored ADR
110,900
6,370,096
Pfizer, Inc.
256,700
6,648,530
Roche Holding AG (participation certificate)
46,297
8,298,859
Wyeth
214,500
10,922,340
69,744,733
TOTAL HEALTH CARE
205,597,436
INDUSTRIALS - 11.6%
Aerospace & Defense - 2.5%
EDO Corp.
130,294
3,093,180
General Dynamics Corp.
77,400
5,754,690
Honeywell International, Inc.
232,600
10,522,824
KBR, Inc.
8,600
224,976
United Technologies Corp.
300,500
18,787,260
38,382,930
Air Freight & Logistics - 0.5%
FedEx Corp.
18,000
1,955,160
United Parcel Service, Inc. Class B
68,400
5,128,632
7,083,792
Common Stocks - continued
Shares
Value (Note 1)
INDUSTRIALS - continued
Airlines - 0.6%
AMR Corp. (a)
88,600
$ 2,678,378
UAL Corp. (a)
136,700
6,014,800
8,693,178
Electrical Equipment - 0.6%
Evergreen Solar, Inc. (a)
201,200
1,523,084
Suntech Power Holdings Co. Ltd. sponsored ADR
111,500
3,792,115
Vestas Wind Systems AS (a)
82,600
3,491,325
8,806,524
Industrial Conglomerates - 6.0%
General Electric Co.
2,039,500
75,889,793
McDermott International, Inc. (a)
309,250
15,728,455
91,618,248
Machinery - 0.6%
Danaher Corp.
52,500
3,803,100
Deere & Co.
55,600
5,285,892
9,088,992
Road & Rail - 0.8%
Laidlaw International, Inc.
189,500
5,766,485
Landstar System, Inc.
99,300
3,791,274
Norfolk Southern Corp.
61,800
3,107,922
12,665,681
TOTAL INDUSTRIALS
176,339,345
INFORMATION TECHNOLOGY - 20.6%
Communications Equipment - 4.8%
Adtran, Inc.
49,100
1,114,570
Alcatel-Lucent SA sponsored ADR
433,100
6,158,682
Cisco Systems, Inc. (a)
1,035,600
28,302,948
Comverse Technology, Inc. (a)
204,765
4,322,589
Corning, Inc. (a)
213,500
3,994,585
Harris Corp.
109,800
5,035,428
Juniper Networks, Inc. (a)
165,400
3,132,676
Motorola, Inc.
140,700
2,892,792
Nortel Networks Corp. (a)
137,530
3,689,484
QUALCOMM, Inc.
262,700
9,927,433
Research In Motion Ltd. (a)
33,600
4,293,408
72,864,595
Computers & Peripherals - 3.4%
Apple Computer, Inc. (a)
184,000
15,610,560
Dell, Inc. (a)
96,000
2,408,640
EMC Corp. (a)
478,800
6,320,160
Hewlett-Packard Co.
470,700
19,388,133
Network Appliance, Inc. (a)
115,200
4,525,056
Sun Microsystems, Inc. (a)
516,600
2,799,972
51,052,521
Shares
Value (Note 1)
Electronic Equipment & Instruments - 0.7%
Agilent Technologies, Inc. (a)
300,814
$ 10,483,368
Internet Software & Services - 1.6%
eBay, Inc. (a)
27,377
823,226
Google, Inc. Class A (sub. vtg.) (a)
44,300
20,399,264
Yahoo!, Inc. (a)
85,600
2,186,224
23,408,714
IT Services - 1.0%
First Data Corp.
231,000
5,895,120
Paychex, Inc.
162,100
6,409,434
The Western Union Co.
143,100
3,208,302
15,512,856
Semiconductors & Semiconductor Equipment - 3.9%
Analog Devices, Inc.
111,600
3,668,292
Applied Materials, Inc.
856,600
15,804,270
ARM Holdings PLC sponsored ADR
205,000
1,496,500
ASML Holding NV (NY Shares) (a)
62,200
1,531,986
Broadcom Corp. Class A (a)
91,900
2,969,289
Fairchild Semiconductor International, Inc. (a)
240,000
4,034,400
FormFactor, Inc. (a)
88,500
3,296,625
Intersil Corp. Class A
193,600
4,630,912
Lam Research Corp. (a)
4,900
248,038
Linear Technology Corp.
117,400
3,559,568
Microchip Technology, Inc.
133,700
4,371,990
National Semiconductor Corp.
296,300
6,726,010
Samsung Electronics Co. Ltd.
4,840
3,190,237
Verigy Ltd.
74,134
1,315,879
Xilinx, Inc.
126,800
3,019,108
59,863,104
Software - 5.2%
Adobe Systems, Inc. (a)
210,200
8,643,424
Cognos, Inc. (a)
122,200
5,188,612
Microsoft Corp.
1,776,500
53,046,290
Oracle Corp. (a)
371,000
6,358,940
Quest Software, Inc. (a)
219,100
3,209,815
Symantec Corp. (a)
154,000
3,210,900
79,657,981
TOTAL INFORMATION TECHNOLOGY
312,843,139
MATERIALS - 2.1%
Chemicals - 1.2%
Ashland, Inc.
34,500
2,386,710
Monsanto Co.
139,720
7,339,492
Praxair, Inc.
152,800
9,065,624
18,791,826
Containers & Packaging - 0.4%
Owens-Illinois, Inc.
155,400
2,867,130
Smurfit-Stone Container Corp. (a)
237,700
2,510,112
5,377,242
Common Stocks - continued
Shares
Value (Note 1)
MATERIALS - continued
Metals & Mining - 0.5%
Alcoa, Inc.
42,000
$ 1,260,420
Meridian Gold, Inc. (a)
120,260
3,344,796
Titanium Metals Corp.
115,460
3,407,225
8,012,441
TOTAL MATERIALS
32,181,509
TELECOMMUNICATION SERVICES - 2.7%
Diversified Telecommunication Services - 2.3%
AT&T, Inc.
622,600
22,257,950
Level 3 Communications, Inc. (a)
471,500
2,640,400
Qwest Communications International, Inc. (a)
440,800
3,689,496
Verizon Communications, Inc.
174,600
6,502,104
35,089,950
Wireless Telecommunication Services - 0.4%
American Tower Corp. Class A (a)
162,000
6,039,360
TOTAL TELECOMMUNICATION SERVICES
41,129,310
UTILITIES - 0.6%
Electric Utilities - 0.4%
Exelon Corp.
102,500
6,343,725
Independent Power Producers & Energy Traders - 0.2%
TXU Corp.
55,200
2,992,392
TOTAL UTILITIES
9,336,117
TOTAL COMMON STOCKS
(Cost $1,269,437,788)
1,488,449,480
Money Market Funds - 2.4%
Shares
Value (Note 1)
Fidelity Cash Central Fund, 5.37% (b)
32,099,297
$ 32,099,297
Fidelity Securities Lending Cash Central Fund, 5.38% (b)(c)
4,586,475
4,586,475
TOTAL MONEY MARKET FUNDS
(Cost $36,685,772)
36,685,772
TOTAL INVESTMENT PORTFOLIO - 100.3%
(Cost $1,306,123,560)
1,525,135,252
NET OTHER ASSETS - (0.3)%
(4,022,644)
NET ASSETS - 100%
$ 1,521,112,608
Legend
(a) Non-income producing
(b) Affiliated fund that is available only to investment companies and other accounts managed by Fidelity Investments. The rate quoted is the annualized seven-day yield of the fund at period end. A complete unaudited listing of the fund's holdings as of its most recent quarter end is available upon request.
(c) Investment made with cash collateral received from securities on loan.
(d) Security or a portion of the security is on loan at period end.
Affiliated Central Funds
Information regarding fiscal year to date income earned by the Fund from investments in Fidelity Central Funds is as follows:
Fund
Income earned
Fidelity Cash Central Fund
$ 2,669,172
Fidelity Securities Lending Cash Central Fund
169,348
Total
$ 2,838,520
Other Information
Distribution of investments by country of issue, as a percentage of total net assets, is as follows:
United States of America
88.9%
Switzerland
2.4%
Netherlands Antilles
1.3%
Canada
1.1%
Bermuda
1.1%
Panama
1.0%
Japan
1.0%
Cayman Islands
1.0%
Others (individually less than 1%)
2.2%
100.0%
See accompanying notes which are an integral part of the financial statements.
VIP Growth & Income Portfolio
VIP Growth & Income Portfolio
Financial Statements
Statement of Assets and Liabilities
December 31, 2006
Assets
Investment in securities, at value (including securities loaned of $4,483,091) - See accompanying schedule:
Unaffiliated issuers (cost $1,269,437,788)
$ 1,488,449,480
Fidelity Central Funds (cost $36,685,772)
36,685,772
Total Investments (cost $1,306,123,560)
$ 1,525,135,252
Cash
14,825
Receivable for fund shares sold
8,717
Dividends receivable
1,700,745
Interest receivable
125,351
Prepaid expenses
7,701
Other receivables
18,517
Total assets
1,527,011,108
Liabilities
Payable for fund shares redeemed
$ 129,657
Accrued management fee
590,479
Distribution fees payable
166,604
Other affiliated payables
129,529
Other payables and accrued expenses
295,756
Collateral on securities loaned, at value
4,586,475
Total liabilities
5,898,500
Net Assets
$ 1,521,112,608
Net Assets consist of:
Paid in capital
$ 1,233,430,989
Undistributed net investment income
13,489,068
Accumulated undistributed net realized gain (loss) on investments and foreign currency transactions
55,180,863
Net unrealized appreciation (depreciation) on investments and assets and liabilities in foreign currencies
219,011,688
Net Assets
$ 1,521,112,608
Statement of Assets and Liabilities - continued
December 31, 2006
Initial Class: Net Asset Value, offering price and redemption price per share ($465,375,056 ÷ 28,877,128 shares)
$ 16.12
Service Class: Net Asset Value, offering price and redemption price per share ($375,774,876 ÷ 23,477,986 shares)
$ 16.01
Service Class 2: Net Asset Value, offering price and redemption price per share ($645,359,588 ÷ 40,701,936 shares)
$ 15.86
Investor Class: Net Asset Value, offering price and redemption price per share ($34,603,088 ÷ 2,152,993 shares)
$ 16.07
See accompanying notes which are an integral part of the financial statements.
Annual Report
VIP Growth & Income Portfolio Financial Statements - continued
Statement of Operations
Year ended December 31, 2006
Investment Income
Dividends
$ 22,081,211
Interest
1,533
Income from Fidelity Central Funds (including $169,348 from security lending)
2,838,520
Total income
24,921,264
Expenses
Management fee
$ 7,369,711
Transfer agent fees
1,107,649
Distribution fees
1,935,332
Accounting and security lending fees
523,190
Custodian fees and expenses
51,481
Independent trustees' compensation
5,932
Audit
56,412
Legal
12,121
Interest
1,190
Miscellaneous
347,009
Total expenses before reductions
11,410,027
Expense reductions
(50,813)
11,359,214
Net investment income (loss)
13,562,050
Realized and Unrealized Gain (Loss)
Net realized gain (loss) on:
Investment securities:
Unaffiliated issuers
59,358,575
Foreign currency transactions
370
Total net realized gain (loss)
59,358,945
Change in net unrealized appreciation (depreciation) on:
Investment securities
120,807,373
Assets and liabilities in foreign currencies
(4)
Total change in net unrealized appreciation (depreciation)
120,807,369
Net gain (loss)
180,166,314
Net increase (decrease) in net assets resulting from operations
$ 193,728,364
Statement of Changes in Net Assets
Year ended December 31, 2006
Year ended December 31, 2005
Increase (Decrease) in Net Assets
Operations
Net investment income (loss)
$ 13,562,050
$ 13,322,605
Net realized gain (loss)
59,358,945
199,886,436
Change in net unrealized appreciation (depreciation)
120,807,369
(101,373,471)
Net increase (decrease) in net assets resulting from operations
193,728,364
111,835,570
Distributions to shareholders from net investment income
(13,053,684)
(22,706,700)
Distributions to shareholders from net realized gain
(41,055,466)
-
Total distributions
(54,109,150)
(22,706,700)
Share transactions - net increase (decrease)
(215,486,550)
(123,504,452)
Total increase (decrease) in net assets
(75,867,336)
(34,375,582)
Net Assets
Beginning of period
1,596,979,944
1,631,355,526
End of period (including undistributed net investment income of $13,489,068 and undistributed net investment income of $13,071,943, respectively)
$ 1,521,112,608
$ 1,596,979,944
See accompanying notes which are an integral part of the financial statements.
VIP Growth & Income Portfolio
Financial Highlights - Initial Class
Years ended December 31,
2006
2005
2004
2003
2002
Selected Per-Share Data
Net asset value, beginning of period
$ 14.75
$ 13.91
$ 13.26
$ 10.86
$ 13.19
Income from Investment Operations
Net investment income (loss) C
.15
.13
.21 F
.12
.15
Net realized and unrealized gain (loss)
1.74
.92
.56
2.42
(2.32)
Total from investment operations
1.89
1.05
.77
2.54
(2.17)
Distributions from net investment income
(.14)
(.21)
(.12)
(.14)
(.16)
Distributions from net realized gain
(.38)
-
-
-
-
Total distributions
(.52)
(.21)
(.12)
(.14)
(.16)
Net asset value, end of period
$ 16.12
$ 14.75
$ 13.91
$ 13.26
$ 10.86
Total ReturnA, B
13.18%
7.63%
5.80%
23.77%
(16.61)%
Ratios to Average Net AssetsD, G
Expenses before reductions
.60%
.59%
.60%
.59%
.59%
Expenses net of fee waivers, if any
.60%
.59%
.60%
.59%
.59%
Expenses net of all reductions
.59%
.54%
.60%
.59%
.58%
Net investment income (loss)
.98%
.97%
1.58%
1.02%
1.30%
Supplemental Data
Net assets, end of period (000 omitted)
$ 465,375
$ 606,102
$ 704,460
$ 785,494
$ 638,124
Portfolio turnover rate E
109%
206%
23%
25%
43%
ATotal returns do not reflect charges attributable to your insurance company's separate account. Inclusion of these charges would reduce the total returns shown.
BTotal returns would have been lower had certain expenses not been reduced during the periods shown.
CCalculated based on average shares outstanding during the period.
DFees and expenses of the underlying Fidelity Central Funds are not included in the Fund's expense ratio. The Fund indirectly bears its proportionate share of the expenses of any underlying Fidelity Central Funds.
EAmount does not include the portfolio activity of any underlying Fidelity Central Funds.
FInvestment income per share reflects a special dividend which amounted to $.05 per share.
GExpense ratios reflect operating expenses of the class. Expenses before reductions do not reflect amounts reimbursed by the investment adviser or reductions from brokerage service arrangements or other expense offset arrangements and do not represent the amount paid by the class during periods when reimbursements or reductions occur. Expenses net of fee waivers reflect expenses after reimbursement by the investment adviser but prior to reductions from brokerage service arrangements or other expense offset arrangements. Expenses net of all reductions represent the net expenses paid by the class.
Financial Highlights - Service Class
Years ended December 31,
2006
2005
2004
2003
2002
Selected Per-Share Data
Net asset value, beginning of period
$ 14.66
$ 13.83
$ 13.18
$ 10.80
$ 13.12
Income from Investment Operations
Net investment income (loss) C
.13
.12
.19 F
.11
.14
Net realized and unrealized gain (loss)
1.72
.91
.57
2.40
(2.31)
Total from investment operations
1.85
1.03
.76
2.51
(2.17)
Distributions from net investment income
(.12)
(.20)
(.11)
(.13)
(.15)
Distributions from net realized gain
(.38)
-
-
-
-
Total distributions
(.50)
(.20)
(.11)
(.13)
(.15)
Net asset value, end of period
$ 16.01
$ 14.66
$ 13.83
$ 13.18
$ 10.80
Total ReturnA, B
13.01%
7.53%
5.75%
23.60%
(16.69)%
Ratios to Average Net AssetsD, G
Expenses before reductions
.70%
.69%
.70%
.69%
.69%
Expenses net of fee waivers, if any
.70%
.69%
.70%
.69%
.69%
Expenses net of all reductions
.69%
.64%
.70%
.69%
.68%
Net investment income (loss)
.88%
.87%
1.48%
.92%
1.20%
Supplemental Data
Net assets, end of period (000 omitted)
$ 375,775
$ 384,527
$ 401,392
$ 357,585
$ 250,160
Portfolio turnover rate E
109%
206%
23%
25%
43%
ATotal returns do not reflect charges attributable to your insurance company's separate account. Inclusion of these charges would reduce the total returns shown.
B Total returns would have been lower had certain expenses not been reduced during the periods shown.
C Calculated based on average shares outstanding during the period.
D Fees and expenses of the underlying Fidelity Central Funds are not included in the Fund's expense ratio. The Fund indirectly bears its proportionate share of the expenses of any underlying Fidelity Central Funds.
E Amount does not include the portfolio activity of any underlying Fidelity Central Funds.
F Investment income per share reflects a special dividend which amounted to $.05 per share.
G Expense ratios reflect operating expenses of the class. Expenses before reductions do not reflect amounts reimbursed by the investment adviser or reductions from brokerage service arrangements or other expense offset arrangements and do not represent the amount paid by the class during periods when reimbursements or reductions occur. Expenses net of fee waivers reflect expenses after reimbursement by the investment adviser but prior to reductions from brokerage service arrangements or other expense offset arrangements. Expenses net of all reductions represent the net expenses paid by the class.
See accompanying notes which are an integral part of the financial statements.
Annual Report
Financial Highlights - Service Class 2
Years ended December 31,
2006
2005
2004
2003
2002
Selected Per-Share Data
Net asset value, beginning of period
$ 14.53
$ 13.71
$ 13.09
$ 10.73
$ 13.07
Income from Investment Operations
Net investment income (loss) C
.11
.10
.17 F
.09
.12
Net realized and unrealized gain (loss)
1.71
.90
.55
2.39
(2.30)
Total from investment operations
1.82
1.00
.72
2.48
(2.18)
Distributions from net investment income
(.11)
(.18)
(.10)
(.12)
(.16)
Distributions from net realized gain
(.38)
-
-
-
-
Total distributions
(.49)
(.18)
(.10)
(.12)
(.16)
Net asset value, end of period
$ 15.86
$ 14.53
$ 13.71
$ 13.09
$ 10.73
Total ReturnA, B
12.86%
7.40%
5.52%
23.44%
(16.84) %
Ratios to Average Net AssetsD, G
Expenses before reductions
.85%
.84%
.85%
.85%
.85%
Expenses net of fee waivers, if any
.85%
.84%
.85%
.85%
.85%
Expenses net of all reductions
.84%
.79%
.85%
.84%
.84%
Net investment income (loss)
.73%
.70%
1.33%
.76%
1.05%
Supplemental Data
Net assets, end of period (000 omitted)
$ 645,360
$ 596,787
$ 525,504
$ 341,989
$ 140,890
Portfolio turnover rate E
109%
206%
23%
25%
43%
A Total returns do not reflect charges attributable to your insurance company's separate account. Inclusion of these charges would reduce the total returns shown.
B Total returns would have been lower had certain expenses not been reduced during the periods shown.
C Calculated based on average shares outstanding during the period.
D Fees and expenses of the underlying Fidelity Central Funds are not included in the Fund's expense ratio. The Fund indirectly bears its proportionate share of the expenses of any underlying Fidelity Central Funds.
E Amount does not include the portfolio activity of any underlying Fidelity Central Funds.
F Investment income per share reflects a special dividend which amounted to $.05 per share.
G Expense ratios reflect operating expenses of the class. Expenses before reductions do not reflect amounts reimbursed by the investment adviser or reductions from brokerage service arrangements or other expense offset arrangements and do not represent the amount paid by the class during periods when reimbursements or reductions occur. Expenses net of fee waivers reflect expenses after reimbursement by the investment adviser but prior to reductions from brokerage service arrangements or other expense offset arrangements. Expenses net of all reductions represent the net expenses paid by the class.
Financial Highlights - Investor Class
Years ended December 31,
2006
2005H
Selected Per-Share Data
Net asset value, beginning of period
$ 14.74
$ 13.64
Income from Investment Operations
Net investment income (loss) E
.13
.03
Net realized and unrealized gain (loss)
1.72
1.07
Total from investment operations
1.85
1.10
Distributions from net investment income
(.14)
-
Distributions from net realized gain
(.38)
-
Total distributions
(.52)
-
Net asset value, end of period
$ 16.07
$ 14.74
Total ReturnB, C, D
12.95%
8.06%
Ratios to Average Net AssetsF, I
Expenses before reductions
.73%
.78% A
Expenses net of fee waivers, if any
.73%
.78% A
Expenses net of all reductions
.72%
.72% A
Net investment income (loss)
.85%
.49% A
Supplemental Data
Net assets, end of period (000 omitted)
$ 34,603
$ 9,564
Portfolio turnover rate G
109%
206%
A Annualized
B Total returns for periods of less than one year are not annualized.
C Total returns do not reflect charges attributable to your insurance company's separate account. Inclusion of these charges would reduce the total returns shown.
D Total returns would have been lower had certain expenses not been reduced during the periods shown.
E Calculated based on average shares outstanding during the period.
F Fees and expenses of the underlying Fidelity Central Funds are not included in the Fund's expense ratio. The Fund indirectly bears its proportionate share of the expenses of any underlying Fidelity Central Funds.
G Amount does not include the portfolio activity of any underlying Fidelity Central Funds.
HFor the period July 21, 2005 (commencement of sale of shares) to December 31, 2005.
IExpense ratios reflect operating expenses of the class. Expenses before reductions do not reflect amounts reimbursed by the investment adviser or reductions from brokerage service arrangements or other expense offset arrangements and do not represent the amount paid by the class during periods when reimbursements or reductions occur. Expense ratios before reductions for start-up periods may not be representative of longer-term operating periods. Expenses net of fee waivers reflect expenses after reimbursement by the investment adviser but prior to reductions from brokerage service arrangements or other expense offset arrangements. Expenses net of all reductions represent the net expenses paid by the class.
See accompanying notes which are an integral part of the financial statements.
VIP Growth & Income Portfolio
Notes to Financial Statements
For the period ended December 31, 2006
1. Significant Accounting Policies.
VIP Growth & Income Portfolio (the Fund) is a fund of Variable Insurance Products Fund III, (the trust) and is authorized to issue an unlimited number of shares. The trust is registered under the Investment Company Act of 1940, as amended (the 1940 Act), as an open-end management investment company organized as a Massachusetts business trust. Shares of the Fund may only be purchased by insurance companies for the purpose of funding variable annuity or variable life insurance contracts. The Fund offers the following classes of shares: Initial Class shares, Service Class shares, Service Class 2 shares and Investor Class shares. All classes have equal rights and voting privileges, except for matters affecting a single class. Investment income, realized and unrealized capital gains and losses, the common expenses of the Fund, and certain fund-level expense reductions, if any, are allocated on a pro rata basis to each class based on the relative net assets of each class to the total net assets of the Fund. Each class differs with respect to transfer agent and distribution and service plan fees incurred. Certain expense reductions also differ by class.
The Fund may invest in Fidelity Central Funds which are open-end investment companies available to investment companies and other accounts managed by Fidelity Management & Research Company (FMR) and its affiliates. The financial statements have been prepared in conformity with accounting principles generally accepted in the United States of America, which require management to make certain estimates and assumptions at the date of the financial statements. The following summarizes the significant accounting policies of the Fund, which are also consistently followed by the Fidelity Central Funds:
Security Valuation. Investments are valued and net asset value (NAV) per share is calculated (NAV calculation) as of the close of business of the New York Stock Exchange (NYSE), normally 4:00 p.m. Eastern time. Wherever possible, the Fund uses independent pricing services approved by the Board of Trustees to value its investments.
Equity securities, including restricted securities, for which market quotations are readily available, are valued at the last reported sale price or official closing price as reported by an independent pricing service on the primary market or exchange on which they are traded. In the event there were no sales during the day or closing prices are not available, securities are valued at the last quoted bid price. Investments in open-end mutual funds, including the Fidelity Central Funds, are valued at their closing net asset value each business day. Short-term securities with remaining maturities of sixty days or less for which quotations are not readily available are valued at amortized cost, which approximates value.
When current market prices or quotations are not readily available or do not accurately reflect fair value, valuations may be determined in accordance with procedures adopted by the Board of Trustees. For example, when developments occur between the close of a market and the close of the NYSE that may materially affect the value of some or all of the securities, or when trading in a security is halted, those securities may be fair valued. Factors used in the determination of fair value may include monitoring news to identify significant market or security specific events such as changes in the value of U.S. securities markets, reviewing developments in foreign markets and evaluating the performance of ADRs, futures contracts and exchange-traded funds. Because the Fund's utilization of fair value pricing depends on market activity, the frequency with which fair value pricing is used can not be predicted and may be utilized to a significant extent. The value of securities used for NAV calculation under fair value pricing may differ from published prices for the same securities.
Foreign Currency. The Fund uses foreign currency contracts to facilitate transactions in foreign-denominated securities. Losses from these transactions may arise from changes in the value of the foreign currency or if the counterparties do not perform under the contracts' terms.
Foreign-denominated assets, including investment securities, and liabilities are translated into U.S. dollars at the exchange rate at period end. Purchases and sales of investment securities, income and dividends received and expenses denominated in foreign currencies are translated into U.S. dollars at the exchange rate in effect on the transaction date.
The effects of exchange rate fluctuations on investments are included with the net realized and unrealized gain (loss) on investment securities. Other foreign currency transactions resulting in realized and unrealized gain (loss) are disclosed separately.
Investment Transactions and Income. Security transactions, including the Fund's investment activity in the Fidelity Central Funds, are accounted for as of trade date. Gains and losses on securities sold are determined on the basis of identified cost and may include proceeds received from litigation. Dividend income is recorded on the ex-dividend date, except for certain dividends from foreign securities where the ex-dividend date may have passed, which are recorded as soon as the Fund is informed of the ex-dividend date. Non-cash dividends included in dividend income, if any, are recorded at the fair market value of the securities received. Distributions received on securities that represent a return of capital or capital gain are recorded as a reduction of cost of investments and/or as a realized gain. The Fund estimates the components of distributions received that may be considered return of capital distributions or capital gain distributions. Interest income and income distributions from the Fidelity Central Funds are accrued as earned, with any income distributions receivable as of period end included in Interest Receivable on the Statement of Assets and Liabilities. Interest income includes coupon interest and amortization of premium and accretion of discount on debt securities. Investment income is recorded net of foreign taxes withheld where recovery of such taxes is uncertain.
Expenses. Most expenses of the trust can be directly attributed to a fund. Expenses which cannot be directly attributed are apportioned among each Fund in the trust. Expense estimates are accrued in the period to which they relate and adjustments are made when actual amounts are known.
Annual Report
Notes to Financial Statements - continued
1. Significant Accounting Policies - continued
Income Tax Information and Distributions to Shareholders. Each year, the Fund intends to qualify as a regulated investment company by distributing all of its taxable income and realized gains under Subchapter M of the Internal Revenue Code. As a result, no provision for income taxes is required in the accompanying financial statements. Foreign taxes are provided for based on the Fund's understanding of the tax rules and rates that exist in the foreign markets in which it invests.
Distributions are recorded on the ex-dividend date. Income dividends and capital gain distributions are declared separately for each class. Income and capital gain distributions are determined in accordance with income tax regulations, which may differ from generally accepted accounting principles.
Capital accounts within the financial statements are adjusted for permanent book-tax differences. These adjustments have no impact on net assets or the results of operations. Temporary book-tax differences will reverse in a subsequent period.
Book-tax differences are primarily due to foreign currency transactions, and losses deferred due to wash sales.
The tax-basis components of distributable earnings and the federal tax cost as of period end were as follows:
Unrealized appreciation
$ 228,551,813
Unrealized depreciation
(17,063,666)
Net unrealized appreciation (depreciation)
211,488,147
Undistributed ordinary income
55,993,140
Undistributed long-term capital gain
20,200,332
Cost for federal income tax purposes
$ 1,313,647,105
The tax character of distributions paid was as follows:
December 31, 2006
December 31, 2005
Ordinary Income
$ 13,053,684
$ 22,706,700
Long-term Capital Gains
41,055,466
-
Total
$ 54,109,150
$ 22,706,700
New Accounting Pronouncements. In July 2006, Financial Accounting Standards Board Interpretation No. 48, Accounting for Uncertainty in Income Taxes - an interpretation of FASB Statement 109 (FIN 48), was issued and is effective on the last business day of the semiannual reporting period for fiscal years beginning after December 15, 2006. FIN 48 sets forth a threshold for financial statement recognition, measurement and disclosure of a tax position taken or expected to be taken on a tax return. Management is currently evaluating the impact, if any, the adoption of FIN 48 will have on the Fund's net assets, results of operations and financial statement disclosures.
In addition, in September 2006, Statement of Financial Accounting Standards No. 157, Fair Value Measurements (SFAS 157), was issued and is effective for fiscal years beginning after November 15, 2007. SFAS 157 defines fair value, establishes a framework for measuring fair value and expands disclosures about fair value measurements. Management is currently evaluating the impact the adoption of SFAS 157 will have on the Fund's financial statement disclosures.
2. Operating Policies.
Repurchase Agreements. FMR has received an Exemptive Order from the Securities and Exchange Commission (the SEC) which permits the Fund and other affiliated entities of FMR to transfer uninvested cash balances into joint trading accounts which are then invested in repurchase agreements. The Fund may also invest directly with institutions in repurchase agreements. Repurchase agreements are collateralized by government or non-government securities. Upon settlement date, collateral is held in segregated accounts with custodian banks and may be obtained in the event of a default of the counterparty. The Fund monitors, on a daily basis, the value of the collateral to ensure it is at least equal to the principal amount of the repurchase agreement (including accrued interest). In the event of a default by the counterparty, realization of the collateral proceeds could be delayed, during which time the value of the collateral may decline.
3. Purchases and Sales of Investments.
Purchases and sales of securities, other than short-term securities, aggregated $1,675,606,277 and $1,900,139,450, respectively.
4. Fees and Other Transactions with Affiliates.
Management Fee. FMR and its affiliates provide the Fund with investment management related services for which the Fund pays a monthly management fee. The management fee is the sum of an individual fund fee rate that is based on an annual rate of .20% of the Fund's average net assets and a
VIP Growth & Income Portfolio
4. Fees and Other Transactions with Affiliates - continued
Management Fee - continued
group fee rate that averaged .27% during the period. The group fee rate is based upon the average net assets of all the mutual funds advised by FMR. The group fee rate decreases as assets under management increase and increases as assets under management decrease. For the period, the total annual management fee rate was .47% of the Fund's average net assets.
Distribution and Service Plan. In accordance with Rule 12b-1 of the 1940 Act, the Fund has adopted separate 12b-1 Plans for each Service Class of shares. Each Service Class pays Fidelity Distributors Corporation (FDC), an affiliate of FMR, a service fee. For the period, the service fee is based on an annual rate of .10% of Service Class' average net assets and .25% of Service Class 2's average net assets.
For the period, each class paid FDC the following amounts, all of which were re-allowed to insurance companies for the distribution of shares and providing shareholder support services:
Service Class
$ 377,709
Service Class 2
1,557,623
$ 1,935,332
Transfer Agent Fees. Fidelity Investments Institutional Operations Company, Inc. (FIIOC), an affiliate of FMR, is the fund's transfer, dividend disbursing, and shareholder servicing agent. FIIOC receives an asset-based fee with respect to each class. Each class with the exception of Investor Class pays a transfer agent fee, excluding out of pocket expenses, equal to an annual rate of .07% of their month end net assets. Investor Class pays a monthly asset-based transfer agent fee of .18% of its month end net assets. The total transfer agent fees paid by each class to FIIOC, including out of pocket expenses, were as follows:
Initial Class
$ 378,801
Service Class
253,131
Service Class 2
422,680
Investor Class
53,037
$ 1,107,649
Accounting and Security Lending Fees. Fidelity Service Company, Inc. (FSC), an affiliate of FMR, maintains the Fund's accounting records. The accounting fee is based on the level of average net assets for the month. Under a separate contract, FSC administers the security lending program. The security lending fee is based on the number and duration of lending transactions.
Investments in Fidelity Central Funds. The Fund may invest in Fidelity Central Funds. The Fund's Schedule of Investments lists each of the Fidelity Central Funds as an investment of the Fund but does not include the underlying holdings of each Fidelity Central Fund. As an Investing Fund, the Fund indirectly bears its proportionate share of the expenses of the underlying Fidelity Central Funds. A complete unaudited list of holdings for each Fidelity Central Fund is available upon request. In addition, the financial statements of the Fidelity Central Funds, which are not covered by the Fund's Report of Independent Registered Public Accounting Firm, are available on the EDGAR Database on the SEC's web site, www.sec.gov, or upon request.
The Money Market Central Funds seek preservation of capital and current income and are managed by Fidelity Investments Money Management, Inc. (FIMM), an affiliate of FMR.
Brokerage Commissions. The Fund placed a portion of its portfolio transactions with brokerage firms which are affiliates of the investment adviser. The commissions paid to these affiliated firms were $16,736 for the period.
Interfund Lending Program. Pursuant to an Exemptive Order issued by the SEC, the Fund, along with other registered investment companies having management contracts with FMR, may participate in an interfund lending program. This program provides an alternative credit facility allowing the funds to borrow from, or lend money to, other participating affiliated funds. At period end, there were no interfund loans outstanding. The Fund's activity in this program during the period for which loans were outstanding was as follows:
Borrower or Lender
Average Daily Loan Balance
Weighted Average Interest Rate
Interest Expense
Borrower
$ 7,970,000
5.38%
$ 1,190
Annual Report
Notes to Financial Statements - continued
5. Committed Line of Credit.
The Fund participates with other funds managed by FMR in a $4.2 billion credit facility (the "line of credit") to be utilized for temporary or emergency purposes to fund shareholder redemptions or for other short-term liquidity purposes. The Fund has agreed to pay commitment fees on its pro rata portion of the line of credit, which amounted to $4,415 and is reflected in Miscellaneous Expense on the Statement of Operations. During the period, there were no borrowings on this line of credit.
6. Security Lending.
The Fund lends portfolio securities from time to time in order to earn additional income. On the settlement date of the loan, the Fund receives collateral (in the form of U.S. Treasury obligations, letters of credit and/or cash) against the loaned securities and maintains collateral in an amount not less than 100% of the market value of the loaned securities during the period of the loan. The market value of the loaned securities is determined at the close of business of the Fund and any additional required collateral is delivered to the Fund on the next business day. If the borrower defaults on its obligation to return the securities loaned because of insolvency or other reasons, a fund could experience delays and costs in recovering the securities loaned or in gaining access to the collateral. Any cash collateral received is invested in the Fidelity Securities Lending Cash Central Fund. The value of loaned securities and cash collateral at period end are disclosed on the Fund's Statement of Assets and Liabilities. Security lending income represents the income earned on investing cash collateral, less fees and expenses associated with the loan, plus any premium payments that may be received on the loan of certain types of securities. Security lending income is presented in the Statement of Operations as a component of income from Fidelity Central Funds.
7. Expense Reductions.
Many of the brokers with whom FMR places trades on behalf of the Fund provided services to the Fund in addition to trade execution. These services included payments of certain expenses on behalf of the Fund totaling $43,938 for the period. In addition, through arrangements with the fund's custodian, credits realized as a result of uninvested cash balances were used to reduce the Fund's expenses. During the period, these credits reduced the Fund's custody expenses by $2,558.
8. Other.
The Fund's organizational documents provide former and current trustees and officers with a limited indemnification against liabilities arising in connection with the performance of their duties to the Fund. In the normal course of business, the Fund may also enter into contracts that provide general indemnifications. The Fund's maximum exposure under these arrangements is unknown as this would be dependent on future claims that may be made against the Fund. The risk of material loss from such claims is considered remote.
At the end of the period, FMR or its affiliates were the owners of record of 18% of the total outstanding shares of the Fund and one otherwise unaffiliated shareholder was the owner of record of 55% of the total outstanding shares of the Fund.
The United States Securities and Exchange Commission ("SEC") is conducting an investigation of FMR (covering the years 2002 to 2004) arising from gifts, gratuities and business entertainment provided by certain brokers to certain individuals who were employed on FMR's domestic equity trading desk during that period. FMR is in discussions with the SEC staff regarding the possible resolution of the matter, but as of period-end no final resolution has been reached.
In December 2006, the Independent Trustees completed their own investigation of the matter with the assistance of independent counsel. The Independent Trustees and FMR agree that, despite the absence of proof that the Fidelity mutual funds experienced diminished execution quality as a result of the improper receipt of gifts and business entertainment, the conduct at issue was serious and is worthy of redress. Accordingly, the Independent Trustees have requested and FMR has agreed to pay $42 million to Fidelity mutual funds, plus interest to be determined at the time that payment is made. A method of allocating this payment among the funds has not yet been determined. The total payment to the Fund is not anticipated to have a material impact on the Fund's net assets. In addition, FMR reimbursed related legal expenses which are recorded in the accompanying Statement of Operations as an expense reduction.
VIP Growth & Income Portfolio
9. Distributions to Shareholders.
Distributions to shareholders of each class were as follows:
Years ended December 31,
2006
2005
From net investment income
Initial Class
$ 5,438,318
$ 10,102,093
Service Class
3,160,972
5,620,334
Service Class 2
4,341,827
6,984,273
Investor Class
112,567
-
Total
$ 13,053,684
$ 22,706,700
From net realized gain
Initial Class
$ 15,195,299
$ -
Service Class
9,845,652
-
Service Class 2
15,713,278
-
Investor Class
301,237
-
Total
$ 41,055,466
$ -
10. Share Transactions.
Transactions for each class of shares were as follows:
Shares
Dollars
Years ended December 31,
2006
2005A
2006
2005A
Initial Class
Shares sold
3,091,942
2,834,273
$ 46,929,968
$ 39,200,777
Reinvestment of distributions
1,423,008
741,166
20,633,617
10,102,093
Shares redeemed
(16,719,037)
(13,127,442)
(256,307,119)
(181,187,562)
Net increase (decrease)
(12,204,087)
(9,552,003)
$ (188,743,534)
$ (131,884,692)
Service Class
Shares sold
259,166
434,637
$ 3,888,443
$ 5,919,559
Reinvestment of distributions
901,985
414,785
13,006,624
5,620,334
Shares redeemed
(3,919,600)
(3,644,857)
(58,435,844)
(50,018,197)
Net increase (decrease)
(2,758,449)
(2,795,435)
$ (41,540,777)
$ (38,478,304)
Service Class 2
Shares sold
3,068,878
4,647,860
$ 45,050,170
$ 63,603,372
Reinvestment of distributions
1,402,455
519,277
20,055,105
6,984,273
Shares redeemed
(4,846,451)
(2,412,711)
(71,974,464)
(33,058,649)
Net increase (decrease)
(375,118)
2,754,426
$ (6,869,189)
$ 37,528,996
Investor Class
Shares sold
2,783,579
662,399
$ 41,259,743
$ 9,527,602
Reinvestment of distributions
28,578
-
413,804
-
Shares redeemed
(1,307,986)
(13,577)
(20,006,597)
(198,054)
Net increase (decrease)
1,504,171
648,822
$ 21,666,950
$ 9,329,548
A Share transactions for Investor Class are for the period July 21, 2005 (commencement of sale of shares) to December 31, 2005.
Annual Report
Report of Independent Registered Public Accounting Firm
To the Trustees of Variable Insurance Products Fund III and Shareholders of VIP Growth & Income Portfolio:
We have audited the accompanying statement of assets and liabilities of VIP Growth & Income Portfolio (the Fund), a fund of Variable Insurance Products Fund III, including the schedule of investments as of December 31, 2006, and the related statement of operations for the year then ended, the statement of changes in net assets for each of the two years in the period then ended, and the financial highlights for each of the five years in the period then ended. These financial statements and financial highlights are the responsibility of the Fund's management. Our responsibility is to express an opinion on these financial statements and financial highlights based on our audits.
We conducted our audits in accordance with standards of the Public Company Accounting Oversight Board (United States). Those standards require that we plan and perform the audit to obtain reasonable assurance about whether the financial statements and financial highlights are free of material misstatement. The Fund is not required to have, nor were we engaged to perform, an audit of its internal control over financial reporting. Our audits included consideration of internal control over financial reporting as a basis for designing audit procedures that are appropriate in the circumstances, but not for the purpose of expressing an opinion on the effectiveness of the Fund's internal control over financial reporting. Accordingly, we express no such opinion. An audit also includes examining, on a test basis, evidence supporting the amounts and disclosures in the financial statements, assessing the accounting principles used and significant estimates made by management, as well as evaluating the overall financial statement presentation. Our procedures included confirmation of securities owned as of December 31, 2006, by correspondence with the custodians and brokers. We believe that our audits provide a reasonable basis for our opinion.
In our opinion, the financial statements and financial highlights referred to above present fairly, in all material respects, the financial position of VIP Growth & Income Portfolio as of December 31, 2006, the results of its operations for the year then ended, the changes in its net assets for each of the two years in the period then ended, and its financial highlights for each of the five years in the period then ended, in conformity with accounting principles generally accepted in the United States of America.
/s/ Deloitte & Touche LLP
DELOITTE & TOUCHE LLP
Boston, Massachusetts
February 13, 2007
Annual Report
Trustees and Officers
The Trustee, Member of the Advisory Board, and executive officers of the trust and fund, as applicable, are listed below. The Board of Trustees governs the fund and is responsible for protecting the interests of shareholders. The Trustees are experienced executives who meet periodically throughout the year to oversee the fund's activities, review contractual arrangements with companies that provide services to the fund, and review the fund's performance. Each of the Trustees oversees 348 funds advised by FMR or an affiliate.
The Trustees hold office without limit in time except that (a) any Trustee may resign; (b) any Trustee may be removed by written instrument, signed by at least two-thirds of the number of Trustees prior to such removal; (c) any Trustee who requests to be retired or who has become incapacitated by illness or injury may be retired by written instrument signed by a majority of the other Trustees; and (d) any Trustee may be removed at any special meeting of shareholders by a two-thirds vote of the outstanding voting securities of the trust. Each Trustee who is not an interested person (as defined in the 1940 Act) (Independent Trustee), shall retire not later than the last day of the calendar year in which his or her 72nd birthday occurs. The Independent Trustees may waive this mandatory retirement age policy with respect to individual Trustees. The executive officers and Advisory Board Member hold office without limit in time, except that any officer and Advisory Board Member may resign or may be removed by a vote of a majority of the Trustees at any regular meeting or any special meeting of the Trustees. Except as indicated, each individual has held the office shown or other offices in the same company for the past five years.
The fund's Statement of Additional Information (SAI) includes more information about the Trustees. To request a free copy, call Fidelity at 1-877-208-0098.
Interested Trustees*:
Correspondence intended for each Trustee who is an interested person may be sent to Fidelity Investments, 82 Devonshire Street, Boston, Massachusetts 02109.
Name, Age; Principal Occupation
Edward C. Johnson 3d (76)
Year of Election or Appointment: 1994
Mr. Johnson is Chairman of the Board of Trustees. Mr. Johnson serves as President (2006-present), Chief Executive Officer, Chairman, and a Director of FMR Corp.; Chairman and a Director of FMR; Chairman and a Director of Fidelity Research & Analysis Company (FRAC); Chairman and a Director of Fidelity Investments Money Management, Inc.; and Chairman (2001- present) and a Director of FMR Co., Inc. In addition, Mr. Johnson serves as Chairman and Director of Fidelity International Limited (FIL).
Robert L. Reynolds (54)
Year of Election or Appointment: 2003
Mr. Reynolds is President and a Director of FMR (2005-present), Fidelity Investments Money Management, Inc. (2005-present), and FMR Co., Inc. (2005-present). Mr. Reynolds also serves as Vice Chairman (2006-present), a Director (2003-present), and Chief Operating Officer of FMR Corp. and a Director of Strategic Advisers, Inc. (2005-present). He also serves on the Board at Fidelity Investments Canada, Ltd.
* Trustees have been determined to be "Interested Trustees" by virtue of, among other things, their affiliation with the trust or various entities under common control with FMR.
Independent Trustees:
Correspondence intended for each Independent Trustee (that is, the Trustees other than the Interested Trustees) may be sent to Fidelity Investments, P.O. Box 55235, Boston, Massachusetts 02205-5235.
Name, Age; Principal Occupation
Dennis J. Dirks (58)
Year of Election or Appointment: 2005
Prior to his retirement in May 2003, Mr. Dirks was Chief Operating Officer and a member of the Board of The Depository Trust & Clearing Corporation (DTCC) (1999-2003). He also served as President, Chief Operating Officer, and Board member of The Depository Trust Company (DTC) (1999-2003) and President and Board member of the National Securities Clearing Corporation (NSCC) (1999-2003). In addition, Mr. Dirks served as Chief Executive Officer and Board member of the Government Securities Clearing Corporation (2001-2003) and Chief Executive Officer and Board member of the Mortgage-Backed Securities Clearing Corporation (2001-2003). Mr. Dirks also serves as a Trustee and a member of the Finance Committee of Manhattan College (2005-present) and a Trustee and a member of the Finance Committee of AHRC of Nassau County (2006-present).
Albert R. Gamper, Jr. (64)
Year of Election or Appointment: 2006
Prior to his retirement in December 2004, Mr. Gamper served as Chairman of the Board of CIT Group Inc. (commercial finance). During his tenure with CIT Group Inc. Mr. Gamper served in numerous senior management positions, including Chairman (1987-1989; 1999-2001; 2002-2004), Chief Executive Officer (1987-2004), and President (1989-2002). He currently serves as a member of the Board of Directors of Public Service Enterprise Group (utilities, 2001-present), Chairman of the Board of Governors, Rutgers University (2004-present), and Chairman of the Board of Saint Barnabas Health Care System.
George H. Heilmeier (70)
Year of Election or Appointment: 2004
Dr. Heilmeier is Chairman Emeritus of Telcordia Technologies (communication software and systems), where prior to his retirement, he served as company Chairman and Chief Executive Officer. He currently serves on the Boards of Directors of The Mitre Corporation (systems engineering and information technology support for the government), and HRL Laboratories (private research and development, 2004-present). He is Chairman of the General Motors Science & Technology Advisory Board and a Life Fellow of the Institute of Electrical and Electronics Engineers (IEEE). Dr. Heilmeier is a member of the Defense Science Board and the National Security Agency Advisory Board. He is also a member of the National Academy of Engineering, the American Academy of Arts and Sciences, and the Board of Overseers of the School of Engineering and Applied Science of the University of Pennsylvania. Previously, Dr. Heilmeier served as a Director of TRW Inc. (automotive, space, defense, and information technology, 1992-2002), Compaq (1994-2002), Automatic Data Processing, Inc. (ADP) (technology-based business outsourcing, 1995-2002), INET Technologies Inc. (telecommunications network surveillance, 2001-2004), and Teletech Holdings (customer management services). He is the recipient of the 2005 Kyoto Prize in Advanced Technology for his invention of the liquid crystal display, and a member of the Consumer Electronics Hall of Fame.
James H. Keyes (66)
Year of Election or Appointment: 2007
Prior to his retirement in 2003, Mr. Keyes was Chairman, President, and Chief Executive Officer of Johnson Controls, Inc. (automotive supplier, 1993-2003). He currently serves as a member of the boards of LSI Logic Corporation (semiconductor technologies), Navistar International Corporation (manufacture and sale of trucks, buses, and diesel engines, 2002-present), and Pitney Bowes, Inc. (integrated mail, messaging, and document management solutions).
Marie L. Knowles (60)
Year of Election or Appointment: 2001
Prior to Ms. Knowles' retirement in June 2000, she served as Executive Vice President and Chief Financial Officer of Atlantic Richfield Company (ARCO) (diversified energy, 1996-2000). From 1993 to 1996, she was a Senior Vice President of ARCO and President of ARCO Transportation Company. She served as a Director of ARCO from 1996 to 1998. She currently serves as a Director of Phelps Dodge Corporation (copper mining and manufacturing) and McKesson Corporation (healthcare service, 2002-present). Ms. Knowles is a Trustee of the Brookings Institution and the Catalina Island Conservancy and also serves as a member of the Advisory Board for the School of Engineering of the University of Southern California.
Ned C. Lautenbach (62)
Year of Election or Appointment: 2000
Mr. Lautenbach is Chairman of the Independent Trustees (2006-present). Mr. Lautenbach has been a partner of Clayton, Dubilier & Rice, Inc. (private equity investment firm) since September 1998. Previously, Mr. Lautenbach was with the International Business Machines Corporation (IBM) from 1968 until his retirement in 1998. Mr. Lautenbach serves as a Director of Sony Corporation (2006-present) and Eaton Corporation (diversified industrial) as well as the Philharmonic Center for the Arts in Naples, Florida. He also is a member of the Board of Trustees of Fairfield University (2005-present), as well as a member of the Council on Foreign Relations.
Cornelia M. Small (62)
Year of Election or Appointment: 2005
Ms. Small is a member (2000-present) and Chairperson (2002-present) of the Investment Committee, and a member (2002- present) of the Board of Trustees of Smith College. Previously, she served as Chief Investment Officer (1999-2000), Director of Global Equity Investments (1996-1999), and a member of the Board of Directors of Scudder, Stevens & Clark (1990-1997) and Scudder Kemper Investments (1997-1999). In addition, Ms. Small served as Co-Chair (2000-2003) of the Annual Fund for the Fletcher School of Law and Diplomacy.
William S. Stavropoulos (67)
Year of Election or Appointment: 2002
Mr. Stavropoulos is Chairman Emeritus of the Board of Directors of The Dow Chemical Company. Since joining The Dow Chemical Company in 1967, Mr. Stavropoulos served in numerous senior management positions, including President (1993-2000; 2002-2003), CEO (1995-2000; 2002-2004), and Chairman of the Executive Committee (2000-2004). Currently, he is a Director of NCR Corporation (data warehousing and technology solutions), BellSouth Corporation (telecommunications), Chemical Financial Corporation, Maersk Inc. (industrial conglomerate, 2002-present), and Metalmark Capital (private equity investment firm, 2005-present). He also serves as a member of the Board of Trustees of the American Enterprise Institute for Public Policy Research. In addition, Mr. Stavropoulos is a member of The Business Council, J.P. Morgan International Council and the University of Notre Dame Advisory Council for the College of Science.
Kenneth L. Wolfe (67)
Year of Election or Appointment: 2005
Prior to his retirement in 2001, Mr. Wolfe was Chairman and Chief Executive Officer of Hershey Foods Corporation (1993-2001). He currently serves as a member of the boards of Adelphia Communications Corporation (2003-present), Bausch & Lomb, Inc., and Revlon Inc. (2004-present).
Advisory Board Member and Executive Officers:
Correspondence intended for each executive officer and Mr. Lynch may be sent to Fidelity Investments, 82 Devonshire Street, Boston, Massachusetts 02109.
Name, Age; Principal Occupation
Peter S. Lynch (62)
Year of Election or Appointment: 2003
Member of the Advisory Board of Variable Insurance Products Fund III. Mr. Lynch is Vice Chairman and a Director of FMR, and Vice Chairman (2001-present) and a Director of FMR Co., Inc. Previously, Mr. Lynch served as a Trustee of the Fidelity funds (1990-2003). In addition, he serves as a Trustee of Boston College and as the Chairman of the Inner-City Scholarship Fund.
Kimberley H. Monasterio (43)
Year of Election or Appointment: 2007
President and Treasurer of VIP Growth & Income. Ms. Monasterio also serves as President and Treasurer of other Fidelity funds (2007-present) and is an employee of FMR (2004-present). Previously, Ms. Monasterio served as Deputy Treasurer of the Fidelity funds (2004-2006). Before joining Fidelity Investments, Ms. Monasterio served as Treasurer (2000-2004) and Chief Financial Officer (2002-2004) of the Franklin Templeton Funds and Senior Vice President of Franklin Templeton Services, LLC (2000-2004).
Philip L. Bullen (47)
Year of Election or Appointment: 2006
Vice President of VIP Growth & Income. Mr. Bullen also serves as Vice President of certain Equity Funds (2006-present). Mr. Bullen is Senior Vice President of FMR (2001-present) and FMR Co., Inc. (2001-present). Previously, Mr. Bullen served as President and a Director of Fidelity Research & Analysis Company (2001-2005), President and a Director of Fidelity Management & Research (U.K.) Inc. (2002-2006), and a Director of Strategic Advisers, Inc. (2002-2005).
Dwight D. Churchill (53)
Year of Election or Appointment: 2005
Vice President of VIP Growth & Income. Mr. Churchill also serves as Vice President of certain Equity Funds (2005-present). Mr. Churchill is Executive Vice President of FMR (2005-present) and FMR Co., Inc. (2005-present). Previously, Mr. Churchill served as Senior Vice President of Fidelity Investments Money Management, Inc. (2005-2006), Head of Fidelity's Fixed-Income Division (2000-2005), Vice President of Fidelity's Money Market Funds (2000-2005), Vice President of Fidelity's Bond Funds, and Senior Vice President of FMR.
James F. Catudal (46)
Year of Election or Appointment: 2005
Vice President of VIP Growth & Income. Mr. Catudal also serves as Vice President of other funds advised by FMR. Prior to assuming his current responsibilities, Mr. Catudal worked as a research analyst and a manager. Mr. Catudal also serves as Vice President of FMR and FMR Co., Inc. (2002).
Eric D. Roiter (58)
Year of Election or Appointment: 1998
Secretary of VIP Growth & Income. He also serves as Secretary of other Fidelity funds; Vice President, General Counsel, and Secretary of FMR Co., Inc. (2001-present) and FMR; Assistant Secretary of Fidelity Management & Research (U.K.) Inc. (2001-present), Fidelity Research & Analysis Company (2001-present), and Fidelity Investments Money Management, Inc. (2001-present). Mr. Roiter is an Adjunct Member, Faculty of Law, at Boston College Law School (2003-present). Previously, Mr. Roiter served as Vice President and Secretary of Fidelity Distributors Corporation (FDC) (1998-2005).
Stuart Fross (47)
Year of Election or Appointment: 2003
Assistant Secretary of VIP Growth & Income. Mr. Fross also serves as Assistant Secretary of other Fidelity funds (2003-present), Vice President and Secretary of FDC (2005-present), and is an employee of FMR.
R. Stephen Ganis (40)
Year of Election or Appointment: 2006
Anti-Money Laundering (AML) officer of VIP Growth & Income. Mr. Ganis also serves as AML officer of other Fidelity funds (2006-present) and FMR Corp. (2003-present). Before joining Fidelity Investments, Mr. Ganis practiced law at Goodwin Procter, LLP (2000-2002).
Joseph B. Hollis (58)
Year of Election or Appointment: 2006
Chief Financial Officer of VIP Growth & Income. Mr. Hollis also serves as Chief Financial Officer of other Fidelity funds. Mr. Hollis is President of Fidelity Pricing and Cash Management Services (FPCMS) (2005-present). Mr. Hollis also serves as President and Director of Fidelity Service Company, Inc. (2006-present). Previously, Mr. Hollis served as Senior Vice President of Cash Management Services (1999-2002) and Investment Management Operations (2002-2005).
Kenneth A. Rathgeber (59)
Year of Election or Appointment: 2004
Chief Compliance Officer of VIP Growth & Income. Mr. Rathgeber also serves as Chief Compliance Officer of other Fidelity funds (2004-present) and Executive Vice President of Risk Oversight for Fidelity Investments (2002-present). He is Chief Compliance Officer of FMR (2005-present), FMR Co., Inc. (2005-present), Fidelity Management & Research (U.K.) Inc. (2005-present), Fidelity Research & Analysis Company (2005-present), Fidelity Investments Money Management, Inc. (2005-present), and Strategic Advisers, Inc. (2005-present). Previously, Mr. Rathgeber served as Executive Vice President and Chief Operating Officer for Fidelity Investments Institutional Services Company, Inc. (1998-2002).
Bryan A. Mehrmann (45)
Year of Election or Appointment: 2005
Deputy Treasurer of VIP Growth & Income. Mr. Mehrmann also serves as Deputy Treasurer of other Fidelity funds (2005-present) and is an employee of FMR. Previously, Mr. Mehrmann served as Vice President of Fidelity Investments Institutional Services Group (FIIS)/Fidelity Investments Institutional Operations Corporation, Inc. (FIIOC) Client Services (1998-2004).
Kenneth B. Robins (37)
Year of Election or Appointment: 2005
Deputy Treasurer of VIP Growth & Income. Mr. Robins also serves as Deputy Treasurer of other Fidelity funds (2005-present) and is an employee of FMR (2004-present). Before joining Fidelity Investments, Mr. Robins worked at KPMG LLP, where he was a partner in KPMG's department of professional practice (2002-2004) and a Senior Manager (1999-2000). In addition, Mr. Robins served as Assistant Chief Accountant, United States Securities and Exchange Commission (2000-2002).
Robert G. Byrnes (40)
Year of Election or Appointment: 2005
Assistant Treasurer of VIP Growth & Income. Mr. Byrnes also serves as Assistant Treasurer of other Fidelity funds (2005-present) and is an employee of FMR (2005-present). Previously, Mr. Byrnes served as Vice President of FPCMS (2003-2005). Before joining Fidelity Investments, Mr. Byrnes worked at Deutsche Asset Management where he served as Vice President of the Investment Operations Group (2000-2003).
John H. Costello (60)
Year of Election or Appointment: 1996
Assistant Treasurer of VIP Growth & Income. Mr. Costello also serves as Assistant Treasurer of other Fidelity funds and is an employee of FMR.
Peter L. Lydecker (52)
Year of Election or Appointment: 2004
Assistant Treasurer of VIP Growth & Income. Mr. Lydecker also serves as Assistant Treasurer of other Fidelity funds (2004) and is an employee of FMR.
Mark Osterheld (51)
Year of Election or Appointment: 2002
Assistant Treasurer of VIP Growth & Income. Mr. Osterheld also serves as Assistant Treasurer of other Fidelity funds (2002) and is an employee of FMR.
Gary W. Ryan (48)
Year of Election or Appointment: 2005
Assistant Treasurer of VIP Growth & Income. Mr. Ryan also serves as Assistant Treasurer of other Fidelity funds (2005-present) and is an employee of FMR (2005-present). Previously, Mr. Ryan served as Vice President of Fund Reporting in FPCMS (1999-2005).
Salvatore Schiavone (41)
Year of Election or Appointment: 2005
Assistant Treasurer of VIP Growth & Income. Mr. Schiavone also serves as Assistant Treasurer of other Fidelity funds (2005-present) and is an employee of FMR (2005-present). Before joining Fidelity Investments, Mr. Schiavone worked at Deutsche Asset Management, where he most recently served as Assistant Treasurer (2003-2005) of the Scudder Funds and Vice President and Head of Fund Reporting (1996-2003).
Annual Report
Distributions
The Board of Trustees of VIP Growth & Income Portfolio voted to pay to shareholders of record at the opening of business on record date, the following distributions per share derived from capital gains realized from sales of portfolio securities, and dividends derived from net investment income:
Fund
Pay Date
Record Date
Dividends
Capital Gains
Initial Class
02/09/07
02/09/07
$.163
$.671
Service Class
02/09/07
02/09/07
$.149
$.671
Service Class 2
02/09/07
02/09/07
$.127
$.671
Investor Class
02/09/07
02/09/07
$.153
$.671
The fund hereby designates as a capital gain dividend with respect to the taxable year ended December 31, 2006, $20,623,296, or, if subsequently determined to be different, the net capital gain of such year.
A percentage of the dividends distributed during the fiscal year for the following classes qualifies for the dividends-received deduction for corporate shareholders:
Initial Class
100%
Service Class 2
100%
Service Class
100%
Investor Class
100%
The fund will notify shareholders in January 2007 of amounts for use in preparing 2006 income tax returns.
Annual Report
Proxy Voting Results
A special meeting of the fund's shareholders was held on November 15, 2006. The results of votes taken among shareholders on the proposal before them are reported below. Each vote reported represents one dollar of net asset value held on the record date for the meeting.
PROPOSAL 1
To elect a Board of Trustees. A
# of Votes
% of Votes
Dennis J. Dirks
Affirmative
8,022,573,906.52
96.057
Withheld
329,291,624.43
3.943
TOTAL
8,351,865,530.95
100.000
Albert R. Gamper, Jr.
Affirmative
8,017,939,119.36
96.002
Withheld
333,926,411.59
3.998
TOTAL
8,351,865,530.95
100.000
Robert M. Gates
Affirmative
8,011,581,068.50
95.926
Withheld
340,284,462.45
4.074
TOTAL
8,351,865,530.95
100.000
George H. Heilmeier
Affirmative
8,000,846,196.79
95.797
Withheld
351,019,334.16
4.203
TOTAL
8,351,865,530.95
100.000
Edward C. Johnson 3d
Affirmative
7,992,112,301.22
95.693
Withheld
359,753,229.73
4.307
TOTAL
8,351,865,530.95
100.000
Stephen P. Jonas
Affirmative
8,019,883,742.95
96.025
Withheld
331,981,788.00
3.975
TOTAL
8,351,865,530.95
100.000
James H. KeyesB
Affirmative
8,015,436,547.06
95.972
Withheld
336,428,983.89
4.028
TOTAL
8,351,865,530.95
100.000
Marie L. Knowles
Affirmative
8,015,361,874.49
95.971
Withheld
336,503,656.46
4.029
TOTAL
8,351,865,530.95
100.000
Ned C. Lautenbach
Affirmative
8,018,503,793.25
96.009
Withheld
333,361,737.70
3.991
TOTAL
8,351,865,530.95
100.000
# of Votes
% of Votes
William O. McCoy
Affirmative
8,000,170,571.19
95.789
Withheld
351,694,959.76
4.211
TOTAL
8,351,865,530.95
100.000
Robert L. Reynolds
Affirmative
8,020,815,676.67
96.036
Withheld
331,049,854.28
3.964
TOTAL
8,351,865,530.95
100.000
Cornelia M. Small
Affirmative
8.020,146,516.32
96.028
Withheld
331,719,014.63
3.972
TOTAL
8,351,865,530.95
100.000
William S. Stavropoulos
Affirmative
8,009,250,640.78
95.898
Withheld
342,614,890.17
4.102
TOTAL
8,351,865,530.95
100.000
Kenneth L. Wolfe
Affirmative
8,013,187,941.55
95.945
Withheld
338,677,589.40
4.055
TOTAL
8,351,865,530.95
100.000
ADenotes trust-wide proposal and voting results.
BEffective on or about January 1, 2007.
Annual Report
Board Approval of Investment Advisory Contracts and Management Fees
VIP Growth & Income Portfolio
Each year, typically in July, the Board of Trustees, including the Independent Trustees (together, the Board), votes on the renewal of the management contract and sub-advisory agreements (together, the Advisory Contracts) for the fund. The Board, assisted by the advice of fund counsel and Independent Trustees' counsel, requests and considers a broad range of information throughout the year.
The Board meets regularly each month except August and takes into account throughout the year matters bearing on Advisory Contracts. The Board, acting directly and through its separate committees, considers at each of its meetings factors that are relevant to the annual renewal of the fund's Advisory Contracts, including the services and support provided to the fund and its shareholders. At the time of the renewal, the Board had 12 standing committees, each composed of Independent Trustees with varying backgrounds, to which the Board has assigned specific subject matter responsibilities in order to enhance effective decision-making by the Board. Each committee has adopted a written charter outlining the structure and purposes of the committee. One such committee, the Equity Contract Committee, meets periodically as needed throughout the year to consider matters specifically related to the annual renewal of Advisory Contracts. The committee requests and receives information on, and makes recommendations to the Independent Trustees concerning, the approval and annual review of the Advisory Contracts.
At its July 2006 meeting, the Board of Trustees, including the Independent Trustees, unanimously determined to renew the Advisory Contracts for the fund. In reaching its determination, the Board considered all factors it believed relevant, including (i) the nature, extent, and quality of the services to be provided to the fund and its shareholders (including the investment performance of the fund); (ii) the competitiveness of the management fee and total expenses of the fund; (iii) the total costs of the services to be provided by and the profits to be realized by the investment adviser and its affiliates from the relationship with the fund; (iv) the extent to which economies of scale would be realized as the fund grows; and (v) whether fee levels reflect these economies of scale, if any, for the benefit of fund shareholders.
In determining whether to renew the Advisory Contracts for the fund, the Board ultimately reached a determination, with the assistance of fund counsel and Independent Trustees' counsel, that the renewal of the Advisory Contracts and the compensation to be received by Fidelity under the management contract is consistent with Fidelity's fiduciary duty under applicable law. In addition to evaluating the specific factors noted above, the Board, in reaching its determination, is aware that shareholders in the fund have a broad range of investment choices available to them, including a wide choice among mutual funds offered by competitors to Fidelity, and that the fund's shareholders, with the opportunity to review and weigh the disclosure provided by the fund in its prospectus and other public disclosures, have chosen to invest in this fund, managed by Fidelity.
Nature, Extent, and Quality of Services Provided. The Board considered staffing within the investment adviser, FMR, and the sub-advisers (together, the Investment Advisers), including the background of the fund's portfolio manager and the fund's investment objective and discipline. The Independent Trustees also had discussions with senior management of Fidelity's investment operations and investment groups. The Board considered the structure of the portfolio manager compensation program and whether this structure provides appropriate incentives.
Resources Dedicated to Investment Management and Support Services. The Board reviewed the size, education, and experience of the Investment Advisers' investment staff, their use of technology, and the Investment Advisers' approach to recruiting, training, and retaining portfolio managers and other research, advisory, and management personnel. The Board considered Fidelity's extensive global research capabilities that enable the Investment Advisers to aggregate data from various sources in an effort to produce positive investment results. The Board noted that Fidelity's analysts have access to a variety of technological tools that enable them to perform both fundamental and quantitative analysis and to specialize in various disciplines. The Board also considered that Fidelity's portfolio managers and analysts have access to daily portfolio attribution that allows for monitoring of a fund's portfolio, as well as an electronic communication system that provides immediate real-time access to research concerning issuers and credit enhancers.
Shareholder and Administrative Services. The Board considered (i) the nature, extent, quality, and cost of administrative, distribution, and shareholder services performed by the Investment Advisers and their affiliates under the Advisory Contracts and under separate agreements covering transfer agency, pricing and bookkeeping, and securities lending services for the fund; (ii) the nature and extent of the Investment Advisers' supervision of third party service providers, principally custodians and subcustodians; and (iii) the resources devoted to, and the record of compliance with, the fund's compliance policies and procedures. The Board reviewed the allocation of fund brokerage, including allocations to brokers affiliated with the Investment Advisers, the use of brokerage commissions to pay fund expenses, and the use of "soft" commission dollars to pay for research services. The Board also considered that Fidelity voluntarily pays for market data out of its own resources.
The Board noted that the growth of fund assets across the complex allows Fidelity to reinvest in the development of services designed to enhance the value or convenience of the Fidelity funds as investment vehicles. These services include 24-hour access to account information and market information through phone representatives and over the Internet, and investor education materials and asset allocation tools.
Investment in a Large Fund Family. The Board considered the benefits to shareholders of investing in a Fidelity fund, including the benefits of investing in a fund that is part of a large family of funds offering a variety of investment disciplines and providing for a large variety of mutual fund investor services. The Board noted that, since the last Advisory Contract renewals in July 2005, Fidelity has taken a number of actions that benefited particular funds, including (i) dedicating additional resources to investment research and to restructure the investment research teams; (ii) voluntarily entering into contractual arrangements with certain brokers pursuant to which Fidelity pays for research products and services separately out of its own resources, rather than bundling with fund commissions; (iii) launching the Fidelity Advantage Class of its five Spartan stock index funds and three Spartan bond index funds, which is a lower-fee class available to shareholders with higher account balances; (iv) contractually agreeing to impose expense limitations on Fidelity U.S. Bond Index Fund and reducing the fund's initial investment minimum; and (v) offering shareholders of each of the Fidelity Institutional Money Market Funds the privilege of exchanging shares of the fund for shares of other Fidelity funds.
Annual Report
Board Approval of Investment Advisory Contracts and Management Fees - continued
Investment Performance and Compliance. The Board considered whether the fund has operated within its investment objective, as well as its record of compliance with its investment restrictions. It also reviewed the fund's absolute investment performance for each class (except Investor Class), as well as the fund's relative investment performance for each class (except Investor Class) measured against (i) a broad-based securities market index, and (ii) a peer group of mutual funds deemed appropriate by the Board over multiple periods. The following charts considered by the Board show, over the one-, three-, and five-year periods ended December 31, 2005, the cumulative total returns of Service Class 2 and Initial Class of the fund, the cumulative total returns of a broad-based securities market index ("benchmark"), and a range of cumulative total returns of a peer group of mutual funds identified by Lipper Inc. as having an investment objective similar to that of the fund. The returns of Service Class 2 and Initial Class represent the performance of classes with the highest and lowest 12b-1 fees, respectively (not necessarily with the highest and lowest total expenses). (Investor Class of the fund, which has no 12b-1 fee, had less than one year of performance as of December 31, 2005.) The box within each chart shows the 25th percentile return (bottom of box) and the 75th percentile return (top of box) of the Lipper peer group. Returns shown above the box are in the first quartile and returns shown below the box are in the fourth quartile. The percentage beaten numbers noted below each chart correspond to the percentile box and represent the percentage of funds in the Lipper peer group whose performance was equal to or lower than that of the class indicated.
VIP Growth & Income Portfolio
The Board reviewed the fund's relative investment performance against its Lipper peer group and stated that the performance of Initial Class of the fund was in the first quartile for the one-year period, the fourth quartile for the three-year period, and the third quartile for the five-year period. The Board also stated that the relative investment performance of Initial Class of the fund compared favorably to its benchmark for the one- and five-year periods, although the fund's three-year cumulative total return was lower than its benchmark. The Board considered that the variations in performance among the fund's classes reflect the variations in class expenses, which result in lower performance for higher expense classes. The Board also reviewed the fund's relative investment performance against a peer group defined by Morningstar.
The Board considered that FMR has taken steps to refocus and strengthen equity research, equity portfolio management, and compliance. The Board noted with favor FMR's reorganization of its senior management team in 2005 and FMR's dedication of additional resources to investment research, and participated in the process that led to those changes.
Based on its review, and giving particular weight to the nature and quality of the resources dedicated by the Investment Advisers to maintain and improve relative performance, the Board concluded that the nature, extent, and quality of the services provided to the fund will benefit the fund's shareholders, particularly in light of the Board's view that the fund's shareholders benefit from investing in a fund that is part of a large family of funds offering a variety of investment disciplines and services.
VIP Growth & Income Portfolio
Competitiveness of Management Fee and Total Fund Expenses. The Board considered the fund's management fee and total expenses compared to "mapped groups" of competitive funds and classes. Fidelity creates "mapped groups" by combining similar Lipper investment objective categories that have comparable management fee characteristics. Combining Lipper investment objective categories aids the Board's management fee and total expense comparisons by broadening the competitive group used for comparison and by reducing the number of universes to which various Fidelity funds are compared.
The Board considered two proprietary management fee comparisons for the 12-month periods shown in the chart below. The group of Lipper funds used by the Board for management fee comparisons is referred to below as the "Total Mapped Group" and, for the reasons explained above, is broader than the Lipper peer group used by the Board for performance comparisons. The Total Mapped Group comparison focuses on a fund's standing relative to the total universe of comparable funds available to investors, in terms of gross management fees before expense reimbursements or caps. "TMG %" represents the percentage of funds in the Total Mapped Group that had management fees that were lower than the fund's. For example, a TMG % of 10% means that 90% of the funds in the Total Mapped Group had higher management fees than the fund. The "Asset-Size Peer Group" (ASPG) comparison focuses on a fund's standing relative to non-Fidelity funds similar in size to the fund within the Total Mapped Group. The ASPG represents at least 15% of the funds in the Total Mapped Group with comparable asset size and management fee characteristics, subject to a minimum of 50 funds (or all funds in the Total Mapped Group if fewer than 50). Additional information, such as the ASPG quartile in which the fund's management fee ranked, is also included in the chart and considered by the Board.
VIP Growth & Income Portfolio
The Board noted that the fund's management fee ranked below the median of its Total Mapped Group and below the median of its ASPG for 2005.
Based on its review, the Board concluded that the fund's management fee was fair and reasonable in light of the services that the fund receives and the other factors considered.
In its review of each class's total expenses, the Board considered the fund's management fee as well as other fund or class expenses, as applicable, such as transfer agent fees, pricing and bookkeeping fees, fund-paid 12b-1 fees, and custodial, legal, and audit fees. The Board also noted the effects of any waivers and reimbursements on fees and expenses. As part of its review, the Board also considered current and historical total expenses of each class of the fund compared to competitive fund median expenses. Each class of the fund is compared to those funds and classes in the Total Mapped Group (used by the Board for management fee comparisons) that have a similar sales load structure.
The Board noted that the total expenses of each class ranked below its competitive median for 2005.
In its review of total expenses, the Board also considered Fidelity fee structures and other information on clients that FMR and its affiliates service in other competitive markets, such as other mutual funds advised or subadvised by FMR or its affiliates, pension plan clients, and other institutional clients.
Based on its review, the Board concluded that the total expenses of each class of the fund were reasonable in light of the services that the fund and its shareholders receive and the other factors considered.
Annual Report
Board Approval of Investment Advisory Contracts and Management Fees - continued
Costs of the Services and Profitability. The Board considered the revenues earned and the expenses incurred by Fidelity in conducting the business of developing, marketing, distributing, managing, administering and servicing the fund and its shareholders. The Board also considered the level of Fidelity's profits in respect of all the Fidelity funds.
On an annual basis, FMR presents to the Board Fidelity's profitability for the fund. Fidelity calculates the profitability for each fund, as well as aggregate profitability for groups of Fidelity funds and all Fidelity funds, using a series of detailed revenue and cost allocation methodologies which originate with the audited books and records of Fidelity. The Audit Committee of the Board reviews any significant changes from the prior year's methodologies.
PricewaterhouseCoopers LLP (PwC), independent registered accounting firm and auditor to Fidelity and certain Fidelity funds, has been engaged annually by the Board as part of the Board's assessment of the results of Fidelity's profitability analysis. PwC's engagement includes the review and assessment of Fidelity's methodologies used in determining the revenues and expenses attributable to Fidelity's mutual fund business, and completion of agreed-upon procedures surrounding the mathematical accuracy of fund profitability and its conformity to allocation methodologies. After considering PwC's reports issued under the engagement and information provided by Fidelity, the Board believes that while other allocation methods may also be reasonable, Fidelity's profitability methodologies are reasonable in all material respects.
The Board has also reviewed Fidelity's non-fund businesses and any fall-out benefits related to the mutual fund business as well as cases where Fidelity's affiliates may benefit from or be related to the fund's business.
The Board considered the costs of the services provided by and the profits realized by Fidelity in connection with the operation of the fund and determined that the amount of profit is a fair entrepreneurial profit for the management of the fund.
Economies of Scale. The Board considered whether there have been economies of scale in respect of the management of the Fidelity funds, whether the Fidelity funds (including the fund) have appropriately benefited from any such economies of scale, and whether there is potential for realization of any further economies of scale. The Board considered the extent to which the fund will benefit from economies of scale through increased services to the fund, through waivers or reimbursements, or through fee or expense reductions.
The Board recognized that the fund's management contract incorporates a "group fee" structure, which provides for lower fee rates as total fund assets under FMR's management increase, and for higher fee rates as total fund assets under FMR's management decrease. The Board considered that the group fee is designed to deliver the benefits of economies of scale to fund shareholders when total fund assets increase, even if assets of any particular fund are unchanged or have declined, because some portion of Fidelity's costs are attributable to services provided to all Fidelity funds, and all funds benefit if those costs can be allocated among more assets. The Board concluded that, given the group fee structure, fund shareholders will achieve a certain level of economies of scale as assets under FMR's management increase at the fund complex level, regardless of whether Fidelity achieves any such economies of scale.
The Board further concluded that any potential economies of scale are being shared between fund shareholders and Fidelity in an appropriate manner.
Additional Information Requested by the Board. In order to develop fully the factual basis for consideration of the Advisory Contracts, the Board requested additional information on several topics, including (i) Fidelity's fund profitability methodology and profitability trends within certain funds; (ii) portfolio manager compensation; (iii) the extent to which any economies of scale exist and are shared between the funds and Fidelity; (iv) the total expenses of certain funds and classes relative to competitors, including the extent to which the expenses of certain funds have been or could be capped; (v) fund performance trends; and (vi) Fidelity's fee structures, including use of performance fees.
Based on its evaluation of all of the conclusions noted above, and after considering all material factors, the Board ultimately concluded that the advisory fee structures are fair and reasonable, and that the fund's Advisory Contracts should be renewed.
VIP Growth & Income Portfolio
Investment Adviser
Fidelity Management & Research Company Boston, MA
Investment Sub-Advisers
FMR Co., Inc.
Fidelity Management & Research (U.K.) Inc.
Fidelity Research & Analysis Company (formerly Fidelity Management & Research (Far East) Inc.)
Fidelity Investments Japan Limited
Fidelity International Investment Advisors
Fidelity International Investment Advisors (U.K.) Limited
General Distributor
Fidelity Distributors Corporation Boston, MA
Transfer and Service Agents
Fidelity Investments Institutional Operations Company, Inc. Boston, MA
To view a fund's proxy voting guidelines and proxy voting record for the 12-month period ended June 30, visit www.fidelity.com/proxyvotingresults or visit the Securities and Exchange Commission's (SEC) web site at www.sec.gov. You may also call 1-877-208-0098 to request a free copy of the proxy voting guidelines.
Fidelity Variable Insurance Products are separate account options which are purchased through a variable insurance contract.
Standard & Poor's, S&P and S&P 500 are registered service marks of The McGraw-Hill Companies, Inc. and have been licensed for use by Fidelity Distributors Corporation.
Other third party marks appearing herein are the property of their respective owners.
All other marks appearing herein are registered or unregistered trademarks or service marks of FMR Corp. or an affiliated company.
This report and the financial statements contained herein are submitted for the general information of the shareholders of the fund. This report is not authorized for distribution to prospective investors in the fund unless preceded or accompanied by an effective prospectus.
A fund files its complete schedule of portfolio holdings with the SEC for the first and third quarters of each fiscal year on Form N-Q. Forms N-Q are available on the SEC's web site at http://www.sec.gov. A fund's Forms N-Q may be reviewed and copied at the SEC's Public Reference Room in Washington, DC. Information regarding the operation of the SEC's Public Reference Room may be obtained by calling 1-800-SEC-0330. For a complete list of a fund's portfolio holdings, view the most recent quarterly holdings report, semiannual report, or annual report on Fidelity's web site at http://www.advisor.fidelity.com.
NOT FDIC INSURED· MAY LOSE VALUE· NO BANK GUARANTEE
Neither the fund nor Fidelity Distributors Corporation is a bank.
Semiannual Report
VIP Growth Opportunities Portfolio
Performance: The Bottom Line
Average annual total return reflects the change in the value of an investment, assuming reinvestment of the class' dividend income and capital gains (the profits earned upon the sale of securities that have grown in value) and assuming a constant rate of performance each year. During periods of reimbursement by Fidelity, a fund's total return will be greater than it would be had the reimbursement not occurred. Performance numbers are net of all underlying fund operating expenses, but do not include any insurance charges imposed by your insurance company's separate account. If performance information included the effect of these additional charges, the total returns would have been lower. How a fund did yesterday is no guarantee of how it will do tomorrow.
Average Annual Total Returns
Periods ended December 31, 2006
Past 1 year
Past 5 years
Past 10 years
VIP Growth Opportunities - Initial Class
5.46%
4.55%
4.12%
VIP Growth Opportunities - Service Class A
5.30%
4.44%
4.03%
VIP Growth Opportunities - Service Class 2 B
5.12%
4.27%
3.91%
VIP Growth Opportunities - Investor Class C
5.26%
4.50%
4.09%
AThe initial offering of Service Class shares took place November 3, 1997. Performance for Service Class shares reflects an asset based service fee (12b-1 fee), and returns prior to November 3, 1997 are those of Initial Class and do not include the effects of Service Class 12b-1 fee. Had Service Class shares' 12b-1 fee been reflected, returns prior to November 3, 1997 would have been lower.
BThe initial offering of Service Class 2 shares took place January 12, 2000. Performance for Service Class 2 shares reflects an asset based service fee (12b-1 fee). Returns from November 3, 1997 to January 12, 2000 are those of Service Class which reflect a different 12b-1 fee. Service Class 2 returns prior to November 3, 1997 are those of Initial Class and do not include the effects of a 12b-1 fee. Had Service Class 2 shares' 12b-1 fee been reflected, returns prior to January 12, 2000 would have been lower.
CThe initial offering of Investor Class took place on July 21, 2005. Returns prior to July 21, 2005 are those of Initial Class. If Investor Class's transfer agent fee had been reflected, returns prior to July 21, 2005 would have been lower.
$10,000 Over 10 Years
Let's say hypothetically that $10,000 was invested in VIP Growth Opportunities Portfolio - Initial Class on December 31, 1996. The chart shows how the value of your investment would have changed, and also shows how the Standard & Poor's 500SM Index performed over the same period.
Annual Report
VIP Growth Opportunities Portfolio
Management's Discussion of Fund Performance
Comments from John Porter, Portfolio Manager of VIP Growth Opportunities Portfolio
U.S. stock markets registered their fourth consecutive year of positive returns in 2006. Among the highlights were the performances of the Dow Jones Industrial AverageSM - a gauge of 30 mega-cap, blue-chip stocks - and the small-cap-oriented Russell 2000® Index, both of which reached new highs. The efforts of the Federal Reserve Board to contain inflation levels also dominated the investment headlines. In all, the Fed hiked short-term interest rates four times, but held rates steady after its June 29 increase, finally pausing after 17 rate hikes over a two-year period. A slowing residential housing market and moderating oil prices - the latter of which hit a record closing high of $77 per barrel in July before falling sharply - also held economic growth in check. For the year overall, the Standard & Poor's 500SM Index was up 15.79%, the Dow advanced 19.05%, the Russell 2000 Index gained 18.37% and the NASDAQ Composite® Index rose 10.39%.
For the 12 months that ended December 31, 2006, the portfolio trailed the S&P 500®. The fund underperformed partly because the fund's core growth stock holdings generally lagged the more broadly based index. Within the weak technology sector, some of the fund's larger overweighted holdings performed poorly, including Internet investments Yahoo and eBay, both of which suffered from weak business fundamentals. The fund also had unfavorable results in consumer discretionary, most notably among retailing and consumer durables/apparel stocks. In retailing, out-of-index clothier Chico's was disappointing, while within consumer durables, significant investments in homebuilders KB Home and D.R. Horton struggled when the housing market slowed more quickly and severely than expected. Elsewhere, health insurer UnitedHealth Group hampered performance as well. On the other hand, the fund benefited from investments in casino operators Las Vegas Sands and Wynn Resorts, which benefited from new properties in Asia. Despite the fund's weak results in technology overall, Canada's Research In Motion, manufacturer of the BlackBerry wireless e-mail device, boosted performance relative to the index. Elsewhere, IntercontinentalExchange, the dominant electronic commodities trading exchange, also benefited performance, as did some good stock picks in materials. None of the contributors I've mentioned were included in the index. Some of the detractors above were sold prior to period end.
Note to shareholders: The Board of Trustees of VIP Growth Opportunities Portfolio has approved changes to the fund's investment policy and benchmark index. The fund's primary benchmark will change to the Russell 1000® Growth Index from the S&P 500, and the fund will adopt a growth-oriented investment strategy in place of its current growth and value mandate. The changes will become effective on February 1, 2007.
The views expressed above reflect those of the portfolio manager(s) only through the end of the period as stated on the cover of this report and do not necessarily represent the views of Fidelity or any other person in the Fidelity organization. Any such views are subject to change at any time based upon market or other conditions and Fidelity disclaims any responsibility to update such views. These views may not be relied on as investment advice and, because investment decisions for a Fidelity fund are based on numerous factors, may not be relied on as an indication of trading intent on behalf of any Fidelity fund.
Annual Report
VIP Growth Opportunities Portfolio
Shareholder Expense Example
As a shareholder of the Fund, you incur two types of costs: (1) transaction costs, and (2) ongoing costs, including management fees, distribution and/or service (12b-1) fees and other Fund expenses. This Example is intended to help you understand your ongoing costs (in dollars) of investing in the Fund and to compare these costs with the ongoing costs of investing in other mutual funds.
The Example is based on an investment of $1,000 invested at the beginning of the period and held for the entire period (July 1, 2006 to December 31, 2006).
Actual Expenses
The first line of the accompanying table for each class of the Fund provides information about actual account values and actual expenses. You may use the information in this line, together with the amount you invested, to estimate the expenses that you paid over the period. Simply divide your account value by $1,000.00 (for example, an $8,600 account value divided by $1,000.00 = 8.6), then multiply the result by the number in the first line for a class of the Fund under the heading entitled "Expenses Paid During Period" to estimate the expenses you paid on your account during this period. The estimate of expenses does not include any fees or other expenses of any variable annuity or variable life insurance product. If they were, the estimate of expenses you paid during the period would be higher, and your ending account value would be lower.
Hypothetical Example for Comparison Purposes
The second line of the accompanying table for each class of the Fund provides information about hypothetical account values and hypothetical expenses based on a Class' actual expense ratio and an assumed rate of return of 5% per year before expenses, which is not the Class' actual return. The hypothetical account values and expenses may not be used to estimate the actual ending account balance or expenses you paid for the period. You may use this information to compare the ongoing costs of investing in the Fund and other funds. To do so, compare this 5% hypothetical example with the 5% hypothetical examples that appear in the shareholder reports of the other funds. The estimate of expenses does not include any fees or other expenses of any variable annuity or variable life insurance product. If they were, the estimate of expenses you paid during the period would be higher, and your ending account value would be lower.
Please note that the expenses shown in the table are meant to highlight your ongoing costs only and do not reflect any transaction costs. Therefore, the second line of the table is useful in comparing ongoing costs only, and will not help you determine the relative total costs of owning different funds.
Beginning Account Value July 1, 2006
Ending Account Value December 31, 2006
Expenses Paid During Period* July 1, 2006 to December 31, 2006
Initial Class
Actual
$ 1,000.00
$ 1,101.90
$ 3.97
Hypothetical A
$ 1,000.00
$ 1,021.42
$ 3.82
Service Class
Actual
$ 1,000.00
$ 1,101.40
$ 4.45
Hypothetical A
$ 1,000.00
$ 1,020.97
$ 4.28
Service Class 2
Actual
$ 1,000.00
$ 1,100.10
$ 5.35
Hypothetical A
$ 1,000.00
$ 1,020.11
$ 5.14
Investor Class
Actual
$ 1,000.00
$ 1,100.90
$ 4.77
Hypothetical A
$ 1,000.00
$ 1,020.67
$ 4.58
A5% return per year before expenses
* Expenses are equal to each Class' annualized expense ratio (shown in the table below); multiplied by the average account value over the period, multiplied by 184/365 (to reflect the one-half year period).
Annualized Expense Ratio
Initial Class
.75%
Service Class
.84%
Service Class 2
1.01%
Investor Class
.90%
Annual Report
VIP Growth Opportunities Portfolio
Investment Changes
Top Ten Stocks as of December 31, 2006
% of fund's net assets
% of fund's net assets 6 months ago
Google, Inc. Class A (sub. vtg.)
12.5
12.7
eBay, Inc.
7.7
8.5
UnitedHealth Group, Inc.
5.8
5.2
Schlumberger Ltd. (NY Shares)
3.3
0.6
Apple Computer, Inc.
3.2
2.3
Research In Motion Ltd.
2.8
2.0
Valero Energy Corp.
2.6
0.3
QUALCOMM, Inc.
2.4
2.0
Cognizant Technology Solutions Corp. Class A
2.4
2.3
Las Vegas Sands Corp.
2.1
2.0
44.8
Top Five Market Sectors as of December 31, 2006
% of fund's net assets
% of fund's net assets 6 months ago
Information Technology
41.0
43.7
Energy
16.0
5.0
Health Care
14.2
17.1
Consumer Discretionary
11.0
12.9
Financials
8.4
10.2
Asset Allocation (% of fund's net assets)
As of December 31, 2006 *
As of June 30, 2006 **
Stocks 99.7%
Stocks 95.9%
Short-Term Investments and Net Other Assets 0.3%
Short-Term Investments and Net Other Assets 4.1%
* Foreign investments
15.8%
** Foreign investments
9.3%
Annual Report
VIP Growth Opportunities Portfolio
Investments December 31, 2006
Showing Percentage of Net Assets
Common Stocks - 99.7%
Shares
Value (Note 1)
CONSUMER DISCRETIONARY - 11.0%
Automobiles - 0.1%
Renault SA
2,400
$ 288,332
Hotels, Restaurants & Leisure - 3.9%
Las Vegas Sands Corp. (a)
129,100
11,551,868
Melco PBL Entertainment (Macau) Ltd. sponsored ADR
3,500
74,410
Penn National Gaming, Inc. (a)
16,203
674,369
Vail Resorts, Inc. (a)
8,000
358,560
Wynn Resorts Ltd. (d)
98,100
9,206,685
21,865,892
Household Durables - 0.2%
Whirlpool Corp.
12,100
1,004,542
Internet & Catalog Retail - 0.0%
Submarino SA
2,900
93,658
Media - 2.2%
Comcast Corp. Class A
24,100
1,020,153
News Corp. Class B
32,400
721,224
The Walt Disney Co.
180,700
6,192,589
Time Warner, Inc.
178,000
3,876,840
XM Satellite Radio Holdings, Inc. Class A (a)
16,000
231,200
12,042,006
Multiline Retail - 1.3%
Federated Department Stores, Inc.
40,200
1,532,826
Sears Holdings Corp. (a)
34,900
5,860,757
7,393,583
Specialty Retail - 2.6%
Best Buy Co., Inc.
36,400
1,790,516
Circuit City Stores, Inc.
106,700
2,025,166
Gamestop Corp. Class B (a)
21,600
1,182,816
J. Crew Group, Inc.
1,300
50,115
RadioShack Corp.
8,000
134,240
Staples, Inc.
113,500
3,030,450
Zumiez, Inc. (a)(d)
218,507
6,454,697
14,668,000
Textiles, Apparel & Luxury Goods - 0.7%
Coach, Inc. (a)
28,000
1,202,880
Heelys, Inc.
16,700
536,237
Under Armour, Inc. Class A (sub. vtg.) (a)(d)
45,100
2,275,295
4,014,412
TOTAL CONSUMER DISCRETIONARY
61,370,425
CONSUMER STAPLES - 0.1%
Food & Staples Retailing - 0.1%
Wal-Mart Stores, Inc.
8,100
374,058
ENERGY - 16.0%
Energy Equipment & Services - 9.3%
Baker Hughes, Inc.
41,900
3,128,254
Shares
Value (Note 1)
BJ Services Co.
4,000
$ 117,280
Diamond Offshore Drilling, Inc.
49,800
3,981,012
GlobalSantaFe Corp.
61,600
3,620,848
Grant Prideco, Inc. (a)
111,200
4,422,424
Halliburton Co.
104,800
3,254,040
National Oilwell Varco, Inc. (a)
69,900
4,276,482
Noble Corp.
35,600
2,710,940
Pride International, Inc. (a)
79,100
2,373,791
Schlumberger Ltd. (NY Shares)
295,700
18,676,412
Transocean, Inc. (a)
32,700
2,645,103
Weatherford International Ltd. (a)
71,600
2,992,164
52,198,750
Oil, Gas & Consumable Fuels - 6.7%
Anadarko Petroleum Corp.
8,100
352,512
Cabot Oil & Gas Corp.
7,800
473,070
Chesapeake Energy Corp.
15,600
453,180
Devon Energy Corp.
52,000
3,488,160
EOG Resources, Inc.
32,600
2,035,870
Exxon Mobil Corp.
17,500
1,341,025
Hess Corp.
20,300
1,006,271
Noble Energy, Inc.
15,700
770,399
Occidental Petroleum Corp.
8,100
395,523
Peabody Energy Corp.
79,801
3,224,758
Petroplus Holdings AG
7,110
431,634
Ultra Petroleum Corp. (a)
186,900
8,924,475
Valero Energy Corp.
288,600
14,764,776
37,661,653
TOTAL ENERGY
89,860,403
FINANCIALS - 8.4%
Capital Markets - 4.1%
Ashmore Group plc
851,600
4,315,694
E*TRADE Financial Corp.
121,000
2,712,820
Goldman Sachs Group, Inc.
4,300
857,205
Investors Financial Services Corp.
15,700
669,919
Lazard Ltd. Class A
50,200
2,376,468
Merrill Lynch & Co., Inc.
64,800
6,032,880
Morgan Stanley
55,300
4,503,079
TD Ameritrade Holding Corp.
110,310
1,784,816
23,252,881
Commercial Banks - 0.7%
ICICI Bank Ltd. sponsored ADR
52,800
2,203,872
Mizuho Financial Group, Inc.
38
271,315
Standard Chartered PLC (United Kingdom)
35,829
1,046,979
Sumitomo Mitsui Financial Group, Inc.
30
307,434
3,829,600
Consumer Finance - 0.1%
Capital One Financial Corp.
3,900
299,598
Diversified Financial Services - 3.3%
Chicago Mercantile Exchange Holdings, Inc. Class A
10,600
5,403,350
Common Stocks - continued
Shares
Value (Note 1)
FINANCIALS - continued
Diversified Financial Services - continued
Citigroup, Inc.
25,000
$ 1,392,500
IntercontinentalExchange, Inc. (a)
24,750
2,670,525
Moody's Corp.
115,200
7,955,712
NETeller PLC (a)
256,948
762,417
The NASDAQ Stock Market, Inc. (a)
14,636
450,642
18,635,146
Insurance - 0.1%
ACE Ltd.
11,930
722,600
Real Estate Management & Development - 0.1%
Shimao Property Holdings Ltd.
314,000
588,576
TOTAL FINANCIALS
47,328,401
HEALTH CARE - 14.2%
Biotechnology - 4.6%
Amgen, Inc. (a)
28,600
1,953,666
Celgene Corp. (a)
196,200
11,287,386
Genentech, Inc. (a)
94,000
7,626,220
Gilead Sciences, Inc. (a)
63,400
4,116,562
Vertex Pharmaceuticals, Inc. (a)
18,000
673,560
25,657,394
Health Care Equipment & Supplies - 0.4%
Alcon, Inc.
4,800
536,496
C.R. Bard, Inc.
8,200
680,354
Intuitive Surgical, Inc. (a)
4,000
383,600
Inverness Medical Innovations, Inc. (a)
17,600
681,120
2,281,570
Health Care Providers & Services - 6.3%
Brookdale Senior Living, Inc.
23,400
1,123,200
Humana, Inc. (a)
21,700
1,200,227
Nighthawk Radiology Holdings, Inc.
16,900
430,950
UnitedHealth Group, Inc.
612,105
32,888,402
35,642,779
Health Care Technology - 0.2%
Cerner Corp. (a)
20,100
914,550
Life Sciences Tools & Services - 0.1%
Exelixis, Inc. (a)
79,000
711,000
Pharmaceuticals - 2.6%
Allergan, Inc.
67,900
8,130,346
Merck & Co., Inc.
103,700
4,521,320
Sepracor, Inc. (a)
29,200
1,798,136
14,449,802
TOTAL HEALTH CARE
79,657,095
INDUSTRIALS - 2.4%
Airlines - 0.6%
AirTran Holdings, Inc. (a)
27,500
322,850
AMR Corp. (a)
25,400
767,842
Shares
Value (Note 1)
Republic Airways Holdings, Inc. (a)
23,332
$ 391,511
Ryanair Holdings PLC sponsored ADR (a)
6,300
513,450
US Airways Group, Inc. (a)
24,300
1,308,555
3,304,208
Construction & Engineering - 1.2%
Fluor Corp.
84,700
6,915,755
Electrical Equipment - 0.1%
ABB Ltd. sponsored ADR
42,600
765,948
Industrial Conglomerates - 0.2%
General Electric Co.
33,550
1,248,396
Machinery - 0.3%
Deere & Co.
12,100
1,150,347
Joy Global, Inc.
4,900
236,866
1,387,213
TOTAL INDUSTRIALS
13,621,520
INFORMATION TECHNOLOGY - 41.0%
Communications Equipment - 7.1%
Ciena Corp. (a)
56,800
1,573,928
Cisco Systems, Inc. (a)
130,300
3,561,099
F5 Networks, Inc. (a)
30,700
2,278,247
Juniper Networks, Inc. (a)
79,300
1,501,942
Motorola, Inc.
81,080
1,667,005
QUALCOMM, Inc.
364,500
13,774,455
Research In Motion Ltd. (a)
122,870
15,700,329
40,057,005
Computers & Peripherals - 3.9%
Apple Computer, Inc. (a)
211,700
17,960,628
Dell, Inc. (a)
16,200
406,458
Hewlett-Packard Co.
32,400
1,334,556
Network Appliance, Inc. (a)
36,700
1,441,576
Rackable Systems, Inc. (a)
15,600
483,132
21,626,350
Electronic Equipment & Instruments - 0.0%
Sunpower Corp. Class A (a)
500
18,585
Internet Software & Services - 20.4%
Akamai Technologies, Inc. (a)
8,000
424,960
eBay, Inc. (a)(d)
1,438,997
43,270,640
Google, Inc. Class A (sub. vtg.) (a)(d)
152,500
70,223,197
NHN Corp.
468
57,418
Yahoo! Japan Corp.
234
93,168
Yahoo!, Inc. (a)
14,400
367,776
114,437,159
IT Services - 5.6%
Cognizant Technology Solutions Corp. Class A (a)
170,200
13,132,632
First Data Corp.
96,200
2,455,024
Infosys Technologies Ltd. sponsored ADR
47,400
2,586,144
Paychex, Inc.
186,180
7,361,557
Satyam Computer Services Ltd. sponsored ADR
79,400
1,906,394
Common Stocks - continued
Shares
Value (Note 1)
INFORMATION TECHNOLOGY - continued
IT Services - continued
SRA International, Inc. Class A (a)
7,700
$ 205,898
The Western Union Co.
177,800
3,986,276
31,633,925
Semiconductors & Semiconductor Equipment - 2.3%
Broadcom Corp. Class A (a)
47,150
1,523,417
Intel Corp.
190,900
3,865,725
Linear Technology Corp.
19,300
585,176
Marvell Technology Group Ltd. (a)
299,600
5,749,324
Silicon On Insulator Technologies SA (SOITEC) (a)
31,100
1,106,519
12,830,161
Software - 1.7%
Activision, Inc. (a)
72,366
1,247,590
Autodesk, Inc. (a)
9,398
380,243
Electronic Arts, Inc. (a)
32,500
1,636,700
Nintendo Co. Ltd.
16,000
4,152,877
Opnet Technologies, Inc. (a)
15,500
223,975
Oracle Corp. (a)
60,800
1,042,112
Salesforce.com, Inc. (a)
17,800
648,810
9,332,307
TOTAL INFORMATION TECHNOLOGY
229,935,492
MATERIALS - 2.8%
Chemicals - 0.2%
Monsanto Co.
21,600
1,134,648
Metals & Mining - 2.6%
Allegheny Technologies, Inc.
11,700
1,060,956
Carpenter Technology Corp.
14,400
1,476,288
Central African Mining & Exploration Co. PLC (a)
7,800
8,593
Mittal Steel Co. NV Class A (NY Shares)
101,900
4,298,142
Newmont Mining Corp.
15,600
704,340
Phelps Dodge Corp.
47,200
5,650,784
Titanium Metals Corp.
44,000
1,298,440
14,497,543
TOTAL MATERIALS
15,632,191
TELECOMMUNICATION SERVICES - 3.8%
Diversified Telecommunication Services - 2.9%
AT&T, Inc.
232,600
8,315,450
BellSouth Corp.
164,000
7,726,040
16,041,490
Shares
Value (Note 1)
Wireless Telecommunication Services - 0.9%
America Movil SA de CV Series L sponsored ADR
40,600
$ 1,835,932
American Tower Corp. Class A (a)
31,900
1,189,232
Bharti Airtel Ltd. (a)
139,642
2,057,199
5,082,363
TOTAL TELECOMMUNICATION SERVICES
21,123,853
TOTAL COMMON STOCKS
(Cost $458,420,185)
558,903,438
Money Market Funds - 8.0%
Fidelity Cash Central Fund, 5.37% (b)
2,141,767
2,141,767
Fidelity Securities Lending Cash Central Fund, 5.38% (b)(c)
42,882,750
42,882,750
TOTAL MONEY MARKET FUNDS
(Cost $45,024,517)
45,024,517
TOTAL INVESTMENT PORTFOLIO - 107.7%
(Cost $503,444,702)
603,927,955
NET OTHER ASSETS - (7.7)%
(42,963,807)
NET ASSETS - 100%
$ 560,964,148
Legend
(a) Non-income producing
(b) Affiliated fund that is available only to investment companies and other accounts managed by Fidelity Investments. The rate quoted is the annualized seven-day yield of the fund at period end. A complete unaudited listing of the fund's holdings as of its most recent quarter end is available upon request.
(c) Investment made with cash collateral received from securities on loan.
(d) Security or a portion of the security is on loan at period end.
Affiliated Central Funds
Information regarding fiscal year to date income earned by the Fund from investments in Fidelity Central Funds is as follows:
Fund
Income earned
Fidelity Cash Central Fund
$ 367,660
Fidelity Securities Lending Cash Central Fund
257,827
Total
$ 625,487
Other Information
Distribution of investments by country of issue, as a percentage of total net assets, is as follows:
United States of America
84.2%
Canada
4.4%
Netherlands Antilles
3.3%
India
1.6%
Bermuda
1.4%
Cayman Islands
1.3%
United Kingdom
1.1%
Others (individually less than 1%)
2.7%
100.0%
Income Tax Information
At December 31, 2006, the fund had a capital loss carryforward of approximately $129,942,871 of which $14,327,994 and $115,614,877 will expire on December 31, 2009 and 2010, respectively.
See accompanying notes which are an integral part of the financial statements.
VIP Growth Opportunities Portfolio
VIP Growth Opportunities Portfolio
Financial Statements
Statement of Assets and Liabilities
December 31, 2006
Assets
Investment in securities, at value (including securities loaned of $41,691,762) - See accompanying schedule:
Unaffiliated issuers (cost $458,420,185)
$ 558,903,438
Fidelity Central Funds (cost $45,024,517)
45,024,517
Total Investments (cost $503,444,702)
$ 603,927,955
Foreign currency held at value (cost $1,674)
1,676
Receivable for investments sold
2,391,738
Receivable for fund shares sold
9,850
Dividends receivable
281,753
Interest receivable
14,442
Prepaid expenses
2,628
Other receivables
25,592
Total assets
606,655,634
Liabilities
Payable for investments purchased
$ 1,994,011
Payable for fund shares redeemed
192,459
Accrued management fee
269,091
Distribution fees payable
28,035
Other affiliated payables
51,451
Other payables and accrued expenses
273,689
Collateral on securities loaned, at value
42,882,750
Total liabilities
45,691,486
Net Assets
$ 560,964,148
Net Assets consist of:
Paid in capital
$ 593,553,025
Undistributed net investment income
18,047
Accumulated undistributed net realized gain (loss) on investments and foreign currency transactions
(132,988,359)
Net unrealized appreciation (depreciation) on investments and assets and liabilities in foreign currencies
100,381,435
Net Assets
$ 560,964,148
Statement of Assets and Liabilities - continued
December 31, 2006
Initial Class: Net Asset Value, offering price and redemption price per share ($310,736,348 ÷ 17,114,517 shares)
$ 18.16
Service Class: Net Asset Value, offering price and redemption price per share ($176,556,357 ÷ 9,734,024 shares)
$ 18.14
Service Class 2: Net Asset Value, offering price and redemption price per share ($60,689,528 ÷ 3,366,087 shares)
$ 18.03
Investor Class: Net Asset Value, offering price and redemption price per share ($12,981,915 ÷ 716,994 shares)
$ 18.11
See accompanying notes which are an integral part of the financial statements.
Annual Report
VIP Growth Opportunities Portfolio Financial Statements - continued
Statement of Operations
Year ended December 31, 2006
Investment Income
Dividends
$ 2,618,704
Special dividends
1,210,687
Interest
1,408
Income from Fidelity Central Funds (including $257,827 from security lending)
625,487
Total income
4,456,286
Expenses
Management fee
$ 3,275,689
Transfer agent fees
414,435
Distribution fees
320,152
Accounting and security lending fees
238,667
Custodian fees and expenses
41,566
Independent trustees' compensation
2,199
Audit
49,344
Legal
12,477
Miscellaneous
154,310
Total expenses before reductions
4,508,839
Expense reductions
(272,476)
4,236,363
Net investment income (loss)
219,923
Realized and Unrealized Gain (Loss)
Net realized gain (loss) on:
Investment securities:
Unaffiliated issuers
57,510,067
Foreign currency transactions
(12,540)
Futures contracts
284,191
Total net realized gain (loss)
57,781,718
Change in net unrealized appreciation (depreciation) on:
Investment securities (net of increase in deferred foreign taxes of $102,307)
(31,012,706)
Assets and liabilities in foreign currencies
546
Total change in net unrealized appreciation (depreciation)
(31,012,160)
Net gain (loss)
26,769,558
Net increase (decrease) in net assets resulting from operations
$ 26,989,481
Statement of Changes in Net Assets
Year ended December 31, 2006
Year ended December 31, 2005
Increase (Decrease) in Net Assets
Operations
Net investment income (loss)
$ 219,923
$ 4,000,392
Net realized gain (loss)
57,781,718
76,618,950
Change in net unrealized appreciation (depreciation)
(31,012,160)
(25,503,316)
Net increase (decrease) in net assets resulting from operations
26,989,481
55,116,026
Distributions to shareholders from net investment income
(4,129,406)
(6,184,820)
Share transactions - net increase (decrease)
(128,096,300)
(116,534,058)
Total increase (decrease) in net assets
(105,236,225)
(67,602,852)
Net Assets
Beginning of period
666,200,373
733,803,225
End of period (including undistributed net investment income of $18,047 and undistributed net investment income of $3,933,365, respectively)
$ 560,964,148
$ 666,200,373
See accompanying notes which are an integral part of the financial statements.
VIP Growth Opportunities Portfolio
Financial Highlights - Initial Class
Years ended December 31,
2006
2005
2004
2003
2002
Selected Per-Share Data
Net asset value, beginning of period
$ 17.34
$ 16.07
$ 15.07
$ 11.71
$ 15.13
Income from Investment Operations
Net investment income (loss) C
.02 F
.10
.14 G
.08
.09
Net realized and unrealized gain (loss)
.92
1.32
.94
3.38
(3.37)
Total from investment operations
.94
1.42
1.08
3.46
(3.28)
Distributions from net investment income
(.12)
(.15)
(.08)
(.10)
(.14)
Net asset value, end of period
$ 18.16
$ 17.34
$ 16.07
$ 15.07
$ 11.71
Total Return A, B
5.46%
8.89%
7.19%
29.87%
(21.84)%
Ratios to Average Net Assets D, H
Expenses before reductions
.72%
.70%
.72%
.72%
.70%
Expenses net of fee waivers, if any
.72%
.70%
.72%
.72%
.70%
Expenses net of all reductions
.67%
.65%
.70%
.70%
.66%
Net investment income (loss)
.10% F
.65%
.91%
.64%
.68%
Supplemental Data
Net assets, end of period (000 omitted)
$ 310,736
$ 400,644
$ 459,975
$ 490,710
$ 403,476
Portfolio turnover rate E
128%
123%
65%
62%
60%
ATotal returns do not reflect charges attributable to your insurance company's separate account. Inclusion of these charges would reduce the total returns shown.
BTotal returns would have been lower had certain expenses not been reduced during the periods shown.
CCalculated based on average shares outstanding during the period.
DFees and expenses of the underlying Fidelity Central Funds are not included in the Fund's expense ratio. The Fund indirectly bears its proportionate share of the expenses of any underlying Fidelity Central Funds.
EAmount does not include the portfolio activity of any underlying Fidelity Central Funds.
FInvestment income per share reflects special dividends which amounted to $.04 per share. Excluding the special dividend, the ratio of net investment income (loss) to average net assets would have been (.11)%.
GInvestment income per share reflects a special dividend which amounted to $.04 per share.
HExpense ratios reflect operating expenses of the class. Expenses before reductions do not reflect amounts reimbursed by the investment adviser or reductions from brokerage service arrangements or other expense offset arrangements and do not represent the amount paid by the class during periods when reimbursements or reductions occur. Expenses net of fee waivers reflect expenses after reimbursement by the investment adviser but prior to reductions from brokerage service arrangements or other expense offset arrangements. Expenses net of all reductions represent the net expenses paid by the class.
Financial Highlights - Service Class
Years ended December 31,
2006
2005
2004
2003
2002
Selected Per-Share Data
Net asset value, beginning of period
$ 17.33
$ 16.05
$ 15.06
$ 11.70
$ 15.11
Income from Investment Operations
Net investment income (loss) C
- F, I
.09
.12 G
.07
.08
Net realized and unrealized gain (loss)
.91
1.32
.94
3.37
(3.37)
Total from investment operations
.91
1.41
1.06
3.44
(3.29)
Distributions from net investment income
(.10)
(.13)
(.07)
(.08)
(.12)
Net asset value, end of period
$ 18.14
$ 17.33
$ 16.05
$ 15.06
$ 11.70
Total Return A, B
5.30%
8.86%
7.06%
29.66%
(21.92)%
Ratios to Average Net Assets D, H
Expenses before reductions
.82%
.80%
.82%
.82%
.80%
Expenses net of fee waivers, if any
.82%
.80%
.82%
.82%
.80%
Expenses net of all reductions
.78%
.75%
.80%
.80%
.77%
Net investment income (loss)
-% F, I
.54%
.81%
.54%
.58%
Supplemental Data
Net assets, end of period (000 omitted)
$ 176,556
$ 200,798
$ 212,890
$ 224,660
$ 188,318
Portfolio turnover rate E
128%
123%
65%
62%
60%
ATotal returns do not reflect charges attributable to your insurance company's separate account. Inclusion of these charges would reduce the total returns shown.
B Total returns would have been lower had certain expenses not been reduced during the periods shown.
C Calculated based on average shares outstanding during the period.
D Fees and expenses of the underlying Fidelity Central Funds are not included in the Fund's expense ratio. The Fund indirectly bears its proportionate share of the expenses of any underlying Fidelity Central Funds.
E Amount does not include the portfolio activity of any underlying Fidelity Central Funds.
F Investment income per share reflects special dividends which amounted to $.04 per share. Excluding the special dividend, the ratio of net investment income (loss) to average net assets would have been (.21)%.
G Investment income per share reflects a special dividend which amounted to $.04 per share.
H Expense ratios reflect operating expenses of the class. Expenses before reductions do not reflect amounts reimbursed by the investment adviser or reductions from brokerage service arrangements or other expense offset arrangements and do not represent the amount paid by the class during periods when reimbursements or reductions occur. Expenses net of fee waivers reflect expenses after reimbursement by the investment adviser but prior to reductions from brokerage service arrangements or other expense offset arrangements. Expenses net of all reductions represent the net expenses paid by the class.
I Amount represents less than $.01 per share.
See accompanying notes which are an integral part of the financial statements.
Annual Report
Financial Highlights - Service Class 2
Years ended December 31,
2006
2005
2004
2003
2002
Selected Per-Share Data
Net asset value, beginning of period
$ 17.23
$ 15.96
$ 14.98
$ 11.64
$ 15.04
Income from Investment Operations
Net investment income (loss) C
(.03) F
.06
.10 G
.05
.05
Net realized and unrealized gain (loss)
.91
1.32
.93
3.35
(3.34)
Total from investment operations
.88
1.38
1.03
3.40
(3.29)
Distributions from net investment income
(.08)
(.11)
(.05)
(.06)
(.11)
Net asset value, end of period
$ 18.03
$ 17.23
$ 15.96
$ 14.98
$ 11.64
Total Return A, B
5.12%
8.68%
6.89%
29.40%
(22.01)%
Ratios to Average Net Assets D, H
Expenses before reductions
.99%
.96%
.98%
.99%
.97%
Expenses net of fee waivers, if any
.99%
.96%
.98%
.99%
.97%
Expenses net of all reductions
.94%
.92%
.96%
.96%
.94%
Net investment income (loss)
(.17)% F
.38%
.65%
.37%
.41%
Supplemental Data
Net assets, end of period (000 omitted)
$ 60,690
$ 60,406
$ 60,938
$ 60,129
$ 41,486
Portfolio turnover rate E
128%
123%
65%
62%
60%
A Total returns do not reflect charges attributable to your insurance company's separate account. Inclusion of these charges would reduce the total returns shown.
B Total returns would have been lower had certain expenses not been reduced during the periods shown.
C Calculated based on average shares outstanding during the period.
D Fees and expenses of the underlying Fidelity Central Funds are not included in the Fund's expense ratio. The Fund indirectly bears its proportionate share of the expenses of any underlying Fidelity Central Funds.
E Amount does not include the portfolio activity of any underlying Fidelity Central Funds.
F Investment income per share reflects special dividends which amounted to $.04 per share. Excluding the special dividend, the ratio of net investment income (loss) to average net assets would have been (.38)%.
G Investment income per share reflects a special dividend which amounted to $.04 per share.
H Expense ratios reflect operating expenses of the class. Expenses before reductions do not reflect amounts reimbursed by the investment adviser or reductions from brokerage service arrangements or other expense offset arrangements and do not represent the amount paid by the class during periods when reimbursements or reductions occur. Expenses net of fee waivers reflect expenses after reimbursement by the investment adviser but prior to reductions from brokerage service arrangements or other expense offset arrangements. Expenses net of all reductions represent the net expenses paid by the class.
Financial Highlights - Investor Class
Years ended December 31,
2006
2005 I
Selected Per-Share Data
Net asset value, beginning of period
$ 17.33
$ 16.20
Income from Investment Operations
Net investment income (loss) E
(.01) H
.02
Net realized and unrealized gain (loss)
.91
1.11
Total from investment operations
.90
1.13
Distributions from net investment income
(.12)
-
Net asset value, end of period
$ 18.11
$ 17.33
Total Return B, C, D
5.26%
6.98%
Ratios to Average Net Assets F, J
Expenses before reductions
.88%
.87% A
Expenses net of fee waivers, if any
.88%
.87% A
Expenses net of all reductions
.83%
.83% A
Net investment income (loss)
(.06)% H
.33% A
Supplemental Data
Net assets, end of period (000 omitted)
$ 12,982
$ 4,353
Portfolio turnover rate G
128%
123%
A Annualized
B Total returns for periods of less than one year are not annualized.
C Total returns do not reflect charges attributable to your insurance company's separate account. Inclusion of these charges would reduce the total returns shown.
D Total returns would have been lower had certain expenses not been reduced during the periods shown.
E Calculated based on average shares outstanding during the period.
F Fees and expenses of the underlying Fidelity Central Funds are not included in the Fund's expense ratio. The Fund indirectly bears its proportionate share of the expenses of any underlying Fidelity Central Funds.
G Amount does not include the portfolio activity of any underlying Fidelity Central Funds.
H Investment income per share reflects special dividends which amounted to $.04 per share. Excluding the special dividend, the ratio of net investment income (loss) to average net assets would have been (.27)%.
IFor the period July 21, 2005 (commencement of sale of shares) to December 31, 2005.
JExpense ratios reflect operating expenses of the class. Expenses before reductions do not reflect amounts reimbursed by the investment adviser or reductions from brokerage service arrangements or other expense offset arrangements and do not represent the amount paid by the class during periods when reimbursements or reductions occur. Expense ratios before reductions for start-up periods may not be representative of longer-term operating periods. Expenses net of fee waivers reflect expenses after reimbursement by the investment adviser but prior to reductions from brokerage service arrangements or other expense offset arrangements. Expenses net of all reductions represent the net expenses paid by the class.
See accompanying notes which are an integral part of the financial statements.
VIP Growth Opportunities Portfolio
Notes to Financial Statements
For the period ended December 31, 2006
1. Significant Accounting Policies.
VIP Growth Opportunities Portfolio (the Fund) is a fund of Variable Insurance Products Fund III, (the trust) and is authorized to issue an unlimited number of shares. The trust is registered under the Investment Company Act of 1940, as amended (the 1940 Act), as an open-end management investment company organized as a Massachusetts business trust. Shares of the Fund may only be purchased by insurance companies for the purpose of funding variable annuity or variable life insurance contracts. The Fund offers the following classes of shares: Initial Class shares, Service Class shares, Service Class 2 shares, and Investor Class shares. All classes have equal rights and voting privileges, except for matters affecting a single class. Investment income, realized and unrealized capital gains and losses, the common expenses of the Fund, and certain fund-level expense reductions, if any, are allocated on a pro rata basis to each class based on the relative net assets of each class to the total net assets of the Fund. Each class differs with respect to transfer agent and distribution and service plan fees incurred. Certain expense reductions also differ by class.
The Fund may invest in Fidelity Central Funds which are open-end investment companies available to investment companies and other accounts managed by Fidelity Management & Research Company (FMR) and its affiliates. The financial statements have been prepared in conformity with accounting principles generally accepted in the United States of America, which require management to make certain estimates and assumptions at the date of the financial statements. The following summarizes the significant accounting policies of the Fund, which are also consistently followed by the Fidelity Central Funds:
Security Valuation. Investments are valued and net asset value (NAV) per share is calculated (NAV calculation) as of the close of business of the New York Stock Exchange (NYSE), normally 4:00 p.m. Eastern time. Wherever possible, the Fund uses independent pricing services approved by the Board of Trustees to value its investments.
Equity securities, including restricted securities, for which market quotations are readily available, are valued at the last reported sale price or official closing price as reported by an independent pricing service on the primary market or exchange on which they are traded. In the event there were no sales during the day or closing prices are not available, securities are valued at the last quoted bid price. Investments in open-end mutual funds, including the Fidelity Central Funds are valued at their closing net asset value each business day. Short-term securities with remaining maturities of sixty days or less for which quotations are not readily available are valued at amortized cost, which approximates value.
When current market prices or quotations are not readily available or do not accurately reflect fair value, valuations may be determined in accordance with procedures adopted by the Board of Trustees. For example, when developments occur between the close of a market and the close of the NYSE that may materially affect the value of some or all of the securities, or when trading in a security is halted, those securities may be fair valued. Factors used in the determination of fair value may include monitoring news to identify significant market or security specific events such as changes in the value of U.S. securities markets, reviewing developments in foreign markets and evaluating the performance of ADRs, futures contracts and exchange-traded funds. Because the Fund's utilization of fair value pricing depends on market activity, the frequency with which fair value pricing is used can not be predicted and may be utilized to a significant extent. The value of securities used for NAV calculation under fair value pricing may differ from published prices for the same securities.
Foreign Currency. The Fund uses foreign currency contracts to facilitate transactions in foreign-denominated securities. Losses from these transactions may arise from changes in the value of the foreign currency or if the counterparties do not perform under the contracts' terms.
Foreign-denominated assets, including investment securities, and liabilities are translated into U.S. dollars at the exchange rate at period end. Purchases and sales of investment securities, income and dividends received and expenses denominated in foreign currencies are translated into U.S. dollars at the exchange rate in effect on the transaction date.
The effects of exchange rate fluctuations on investments are included with the net realized and unrealized gain (loss) on investment securities. Other foreign currency transactions resulting in realized and unrealized gain (loss) are disclosed separately.
Investment Transactions and Income. Security transactions, including the Fund's investment activity in the Fidelity Central Funds, are accounted for as of trade date. Gains and losses on securities sold are determined on the basis of identified cost and may include proceeds received from litigation. Dividend income is recorded on the ex-dividend date, except for certain dividends from foreign securities where the ex-dividend date may have passed, which are recorded as soon as the Fund is informed of the ex-dividend date. Non-cash dividends included in dividend income, if any, are recorded at the fair market value of the securities received. Distributions received on securities that represent a return of capital or capital gain are recorded as a reduction of cost of investments and/or as a realized gain. The Fund estimates the components of distributions received that may be considered return of capital distributions or capital gain distributions. Large, non-recurring dividends recognized by the Funds are presented separately on the Statement of Operations as "Special Dividends" and the impact of these dividends is presented in the Financial Highlights. Interest income and income distributions from the Fidelity Central Funds is accrued as earned, with any income distributions receivable as of period end included in Interest Receivable on the Statement of Assets and Liabilities. Interest income includes coupon interest and amortization of premium and accretion of discount on debt securities. Investment income is recorded net of foreign taxes withheld where recovery of such taxes is uncertain.
Annual Report
Notes to Financial Statements - continued
1. Significant Accounting Policies - continued
Expenses. Most expenses of the trust can be directly attributed to a fund. Expenses which cannot be directly attributed are apportioned among each Fund in the trust. Expense estimates are accrued in the period to which they relate and adjustments are made when actual amounts are known.
Income Tax Information and Distributions to Shareholders. Each year, the Fund intends to qualify as a regulated investment company by distributing all of its taxable income and realized gains under Subchapter M of the Internal Revenue Code. As a result, no provision for income taxes is required in the accompanying financial statements. Foreign taxes are provided for based on the Fund's understanding of the tax rules and rates that exist in the foreign markets in which it invests.
Distributions are recorded on the ex-dividend date. Income dividends and capital gain distributions are declared separately for each class. Income and capital gain distributions are determined in accordance with income tax regulations, which may differ from generally accepted accounting principles. In addition, the Fund will claim a portion of the payment made to redeeming shareholders as a distribution for income tax purposes.
Capital accounts within the financial statements are adjusted for permanent book-tax differences. These adjustments have no impact on net assets or the results of operations. Temporary book-tax differences will reverse in a subsequent period.
Book-tax differences are primarily due to futures transactions, foreign currency transactions, partnerships, deferred trustees compensation and losses deferred due to wash sales.
The tax-basis components of distributable earnings and the federal tax cost as of period end were as follows:
Unrealized appreciation
$ 114,975,436
Unrealized depreciation
(17,621,210)
Net unrealized appreciation (depreciation)
97,354,226
Capital loss carryforward
(129,942,871)
Cost for federal income tax purposes
$ 506,573,729
The tax character of distributions paid was as follows:
December 31, 2006
December 31, 2005
Ordinary Income
$ 4,129,406
$ 6,184,820
New Accounting Pronouncements. In July 2006, Financial Accounting Standards Board Interpretation No. 48, Accounting for Uncertainty in Income Taxes - an interpretation of FASB Statement 109 (FIN 48), was issued and is effective on the last business day of the semiannual reporting period for fiscal years beginning after December 15, 2006. FIN 48 sets forth a threshold for financial statement recognition, measurement and disclosure of a tax position taken or expected to be taken on a tax return. Management is currently evaluating the impact, if any, the adoption of FIN 48 will have on the Fund's net assets, results of operations and financial statement disclosures.
In addition, in September 2006, Statement of Financial Accounting Standards No. 157, Fair Value Measurements (SFAS 157), was issued and is effective for fiscal years beginning after November 15, 2007. SFAS 157 defines fair value, establishes a framework for measuring fair value and expands disclosures about fair value measurements. Management is currently evaluating the impact the adoption of SFAS 157 will have on the Fund's financial statement disclosures.
2. Operating Policies.
Repurchase Agreements. FMR has received an Exemptive Order from the Securities and Exchange Commission (the SEC) which permits the Fund and other affiliated entities of FMR to transfer uninvested cash balances into joint trading accounts which are then invested in repurchase agreements. The Fund may also invest directly with institutions in repurchase agreements. Repurchase agreements are collateralized by government or non-government securities. Upon settlement date, collateral is held in segregated accounts with custodian banks and may be obtained in the event of a default of the counterparty. The Fund monitors, on a daily basis, the value of the collateral to ensure it is at least equal to the principal amount of the repurchase agreement (including accrued interest). In the event of a default by the counterparty, realization of the collateral proceeds could be delayed, during which time the value of the collateral may decline.
Futures Contracts. The Fund may use futures contracts to manage its exposure to the stock market and to fluctuations in interest rates. Buying futures tends to increase a fund's exposure to the underlying instrument, while selling futures tends to decrease a fund's exposure to the underlying instrument or hedge other fund investments. Upon entering into a futures contract, a fund is required to deposit with a clearing broker, no later than the following business day, an amount ("initial margin") equal to a certain percentage of the face value of the contract. The initial margin may be in the
VIP Growth Opportunities Portfolio
2. Operating Policies - continued
Futures Contracts - continued
form of cash or securities and is transferred to a segregated account on settlement date. Subsequent payments ("variation margin") are made or received by a fund depending on the daily fluctuations in the value of the futures contract and are accounted for as unrealized gains or losses. Realized gains (losses) are recorded upon the expiration or closing of the futures contract. Securities deposited to meet margin requirements are identified in the Schedule of Investments. Losses may arise from changes in the value of the underlying instruments or if the counterparties do not perform under the contract's terms. Futures contracts are valued at the settlement price established each day by the board of trade or exchange on which they are traded.
3. Purchases and Sales of Investments.
Purchases and sales of securities, other than short-term securities and U.S. government securities, aggregated $739,542,262 and $868,509,525, respectively.
4. Fees and Other Transactions with Affiliates.
Management Fee. FMR and its affiliates provide the Fund with investment management related services for which the Fund pays a monthly management fee. The management fee is the sum of an individual fund fee rate that is based on an annual rate of .30% of the Fund's average net assets and a group fee rate that averaged .27% during the period. The group fee rate is based upon the average net assets of all the mutual funds advised by FMR. The group fee rate decreases as assets under management increase and increases as assets under management decrease. For the period, the total annual management fee rate was .57% of the Fund's average net assets.
Distribution and Service Plan. In accordance with Rule 12b-1 of the 1940 Act, the Fund has adopted separate 12b-1 Plans for each Service Class of shares. Each Service Class pays Fidelity Distributors Corporation (FDC), an affiliate of FMR, a service fee. For the period, the service fee is based on an annual rate of .10% of Service Class' average net assets and .25% of Service Class 2's average net assets.
For the period, each class paid FDC the following amounts, all of which were re-allowed to insurance companies for the distribution of shares and providing shareholder support services:
Service Class
$ 178,075
Service Class 2
142,077
$ 320,152
Transfer Agent Fees. Fidelity Investments Institutional Operations Company, Inc. (FIIOC), an affiliate of FMR, is the fund's transfer, dividend disbursing, and shareholder servicing agent. FIIOC receives an asset-based fee with respect to each class. Each class with the exception of Investor Class pays a transfer agent fee, excluding out of pocket expenses, equal to an annual rate of .07% of their month end net assets. Investor Class pays a monthly asset-based transfer agent fee of .18% of its month end net assets. The total transfer agent fees paid by each class to FIIOC, including out of pocket expenses, were as follows:
Initial Class
$ 232,758
Service Class
122,751
Service Class 2
46,612
Investor Class
12,314
$ 414,435
Accounting and Security Lending Fees. Fidelity Service Company, Inc. (FSC), an affiliate of FMR, maintains the Fund's accounting records. The accounting fee is based on the level of average net assets for the month. Under a separate contract, FSC administers the security lending program. The security lending fee is based on the number and duration of lending transactions.
Investments in Fidelity Central Funds. The Fund may invest in Fidelity Central Funds. The Fund's Schedule of Investments lists each of the Fidelity Central Funds as an investment of the Fund but does not include the underlying holdings of each Fidelity Central Fund. As an Investing Fund, the Fund indirectly bears its proportionate share of the expenses of the underlying Fidelity Central Funds. A complete unaudited list of holdings for each Fidelity Central Fund is available upon request. In addition, the financial statements of the Fidelity Central Funds, which are not covered by the Fund's Report of Independent Registered Public Accounting Firm, are available on the EDGAR Database on the SEC's web site, www.sec.gov, or upon request.
The Money Market Central Funds seek preservation of capital and current income and are managed by Fidelity Investments Money Management, Inc. (FIMM), an affiliate of FMR.
Annual Report
Notes to Financial Statements - continued
4. Fees and Other Transactions with Affiliates - continued
Brokerage Commissions. The Fund placed a portion of its portfolio transactions with brokerage firms which are affiliates of the investment adviser. The commissions paid to these affiliated firms were $4,117 for the period.
5. Committed Line of Credit.
The Fund participates with other funds managed by FMR in a $4.2 billion credit facility (the "line of credit") to be utilized for temporary or emergency purposes to fund shareholder redemptions or for other short-term liquidity purposes. The Fund has agreed to pay commitment fees on its pro rata portion of the line of credit, which amounted to $1,695 and is reflected in Miscellaneous Expense on the Statement of Operations. During the period, there were no borrowings on this line of credit.
6. Security Lending.
The Fund lends portfolio securities from time to time in order to earn additional income. On the settlement date of the loan, the Fund receives collateral (in the form of U.S. Treasury obligations, letters of credit and/or cash) against the loaned securities and maintains collateral in an amount not less than 100% of the market value of the loaned securities during the period of the loan. The market value of the loaned securities is determined at the close of business of the Fund and any additional required collateral is delivered to the Fund on the next business day. If the borrower defaults on its obligation to return the securities loaned because of insolvency or other reasons, a fund could experience delays and costs in recovering the securities loaned or in gaining access to the collateral. Any cash collateral received is invested in the Fidelity Securities Lending Cash Central Fund. The value of loaned securities and cash collateral at period end are disclosed on the Fund's Statement of Assets and Liabilities. Security lending income represents the income earned on investing cash collateral, less fees and expenses associated with the loan, plus any premium payments that may be received on the loan of certain types of securities. Security lending income is presented in the Statement of Operations as a component of income from Fidelity Central Funds.
7. Expense Reductions.
Many of the brokers with whom FMR places trades on behalf of the Fund provided services to the Fund in addition to trade execution. These services included payments of certain expenses on behalf of the Fund totaling $263,340 for the period.
8. Other.
The Fund's organizational documents provide former and current trustees and officers with a limited indemnification against liabilities arising in connection with the performance of their duties to the Fund. In the normal course of business, the Fund may also enter into contracts that provide general indemnifications. The Fund's maximum exposure under these arrangements is unknown as this would be dependent on future claims that may be made against the Fund. The risk of material loss from such claims is considered remote.
At the end of the period, FMR or its affiliates were the owners of record of 22% of the total outstanding shares of the Fund and one otherwise unaffiliated shareholders was the owner of record of 38% of the total outstanding shares of the Fund.
The United States Securities and Exchange Commission ("SEC") is conducting an investigation of FMR (covering the years 2002 to 2004) arising from gifts, gratuities and business entertainment provided by certain brokers to certain individuals who were employed on FMR's domestic equity trading desk during that period. FMR is in discussions with the SEC staff regarding the possible resolution of the matter, but as of period-end no final resolution has been reached.
In December 2006, the Independent Trustees completed their own investigation of the matter with the assistance of independent counsel. The Independent Trustees and FMR agree that, despite the absence of proof that the Fidelity mutual funds experienced diminished execution quality as a result of the improper receipt of gifts and business entertainment, the conduct at issue was serious and is worthy of redress. Accordingly, the Independent Trustees have requested and FMR has agreed to pay $42 million to Fidelity mutual funds, plus interest to be determined at the time that payment is made. A method of allocating this payment among the funds has not yet been determined. The total payment to the Fund is not anticipated to have a material impact on the Fund's net assets. In addition, FMR reimbursed related legal expenses which are recorded in the accompanying Statement of Operations as an expense reduction.
VIP Growth Opportunities Portfolio
9. Distributions to Shareholders.
Distributions to shareholders of each class were as follows:
Years ended December 31,
2006
2005 A
From net investment income
Initial Class
$ 2,655,348
$ 4,113,187
Service Class
1,170,776
1,676,409
Service Class 2
271,802
395,224
Investor Class
31,480
-
Total
$ 4,129,406
$ 6,184,820
A Distributions for Investor Class are for the period July 21, 2005 (commencement of sale of shares) to December 31, 2005.
10. Share Transactions.
Transactions for each class of shares were as follows:
Shares
Dollars
Years ended December 31,
Years ended December 31,
2006
2005 A
2006
2005 A
Initial Class
Shares sold
654,594
2,043,068
$ 11,331,216
$ 32,630,211
Reinvestment of distributions
156,105
259,671
2,655,348
4,113,187
Shares redeemed
(6,799,134)
(7,829,217)
(115,931,080)
(126,275,246)
Net increase (decrease)
(5,988,435)
(5,526,478)
$ (101,944,516)
$ (89,531,848)
Service Class
Shares sold
1,992,061
1,133,176
$ 33,948,381
$ 18,609,478
Reinvestment of distributions
68,829
105,834
1,170,776
1,676,409
Shares redeemed
(3,916,648)
(2,911,194)
(67,617,641)
(46,797,036)
Net increase (decrease)
(1,855,758)
(1,672,184)
$ (32,498,484)
$ (26,511,149)
Service Class 2
Shares sold
1,070,091
586,782
$ 18,451,710
$ 9,623,165
Reinvestment of distributions
16,054
25,062
271,802
395,224
Shares redeemed
(1,226,886)
(922,792)
(20,797,202)
(14,688,498)
Net increase (decrease)
(140,741)
(310,948)
$ (2,073,690)
$ (4,670,109)
Investor Class
Shares sold
621,035
260,971
$ 11,059,561
$ 4,346,383
Reinvestment of distributions
1,853
-
31,480
-
Shares redeemed
(157,118)
(9,747)
(2,670,651)
(167,335)
Net increase (decrease)
465,770
251,224
$ 8,420,390
$ 4,179,048
A Share transactions for Investor Class are for the period July 21, 2005 (commencement of sale of shares) to December 31, 2005.
Annual Report
Report of Independent Registered Public Accounting Firm
To the Trustees of Variable Insurance Products Fund III and Shareholders of VIP Growth Opportunities Portfolio:
We have audited the accompanying statement of assets and liabilities of VIP Growth Opportunities Portfolio (the Fund), a fund of Variable Insurance Products Fund III, including the schedule of investments as of December 31, 2006, and the related statement of operations for the year then ended, the statement of changes in net assets for each of the two years in the period then ended, and the financial highlights for each of the five years in the period then ended. These financial statements and financial highlights are the responsibility of the Fund's management. Our responsibility is to express an opinion on these financial statements and financial highlights based on our audits.
We conducted our audits in accordance with standards of the Public Company Accounting Oversight Board (United States). Those standards require that we plan and perform the audit to obtain reasonable assurance about whether the financial statements and financial highlights are free of material misstatement. The Fund is not required to have, nor were we engaged to perform, an audit of its internal control over financial reporting. Our audits included consideration of internal control over financial reporting as a basis for designing audit procedures that are appropriate in the circumstances, but not for the purpose of expressing an opinion on the effectiveness of the Fund's internal control over financial reporting. Accordingly, we express no such opinion. An audit also includes examining, on a test basis, evidence supporting the amounts and disclosures in the financial statements, assessing the accounting principles used and significant estimates made by management, as well as evaluating the overall financial statement presentation. Our procedures included confirmation of securities owned as of December 31, 2006, by correspondence with the custodians and brokers; where replies were not received from brokers, we performed other auditing procedures. We believe that our audits provide a reasonable basis for our opinion.
In our opinion, the financial statements and financial highlights referred to above present fairly, in all material respects, the financial position of VIP Growth Opportunities Portfolio as of December 31, 2006, the results of its operations for the year then ended, the changes in its net assets for each of the two years in the period then ended, and its financial highlights for each of the five years in the period then ended, in conformity with accounting principles generally accepted in the United States of America.
/s/ Deloitte & Touche LLP
DELOITTE & TOUCHE LLP
Boston, Massachusetts
February 13, 2007
Annual Report
Trustees and Officers
The Trustees, Member of the Advisory Board, and executive officers of the trust and fund, as applicable, are listed below. The Board of Trustees governs the fund and is responsible for protecting the interests of shareholders. The Trustees are experienced executives who meet periodically throughout the year to oversee the fund's activities, review contractual arrangements with companies that provide services to the fund, and review the fund's performance. Each of the Trustees oversees 348 funds advised by FMR or an affiliate.
The Trustees hold office without limit in time except that (a) any Trustee may resign; (b) any Trustee may be removed by written instrument, signed by at least two-thirds of the number of Trustees prior to such removal; (c) any Trustee who requests to be retired or who has become incapacitated by illness or injury may be retired by written instrument signed by a majority of the other Trustees; and (d) any Trustee may be removed at any special meeting of shareholders by a two-thirds vote of the outstanding voting securities of the trust. Each Trustee who is not an interested person (as defined in the 1940 Act) (Independent Trustee), shall retire not later than the last day of the calendar year in which his or her 72nd birthday occurs. The Independent Trustees may waive this mandatory retirement age policy with respect to individual Trustees. The executive officers and Advisory Board Member hold office without limit in time, except that any officer and Advisory Board Member may resign or may be removed by a vote of a majority of the Trustees at any regular meeting or any special meeting of the Trustees. Except as indicated, each individual has held the office shown or other offices in the same company for the past five years.
The fund's Statement of Additional Information (SAI) includes more information about the Trustees. To request a free copy, call Fidelity at 1-877-208-0098.
Interested Trustees*:
Correspondence intended for each Trustee who is an interested person may be sent to Fidelity Investments, 82 Devonshire Street, Boston, Massachusetts 02109.
Name, Age; Principal Occupation
Edward C. Johnson 3d (76)
Year of Election or Appointment: 1994
Mr. Johnson is Chairman of the Board of Trustees. Mr. Johnson serves as President (2006-present), Chief Executive Officer, Chairman, and a Director of FMR Corp.; Chairman and a Director of FMR; Chairman and a Director of Fidelity Research & Analysis Company (FRAC); Chairman and a Director of Fidelity Investments Money Management, Inc.; and Chairman (2001-present) and a Director of FMR Co., Inc. In addition, Mr. Johnson serves as Chairman and Director of Fidelity International Limited (FIL).
Robert L. Reynolds (54)
Year of Election or Appointment: 2003
Mr. Reynolds is President and a Director of FMR (2005-present), Fidelity Investments Money Management, Inc. (2005-present), and FMR Co., Inc. (2005-present). Mr. Reynolds also serves as Vice Chairman (2006-present), a Director (2003-present), and Chief Operating Officer of FMR Corp. and a Director of Strategic Advisers, Inc. (2005-present). He also serves on the Board at Fidelity Investments Canada, Ltd.
* Trustees have been determined to be "Interested Trustees" by virtue of, among other things, their affiliation with the trust or various entities under common control with FMR.
Independent Trustees:
Correspondence intended for each Independent Trustee (that is, the Trustees other than the Interested Trustees) may be sent to Fidelity Investments, P.O. Box 55235, Boston, Massachusetts 02205-5235.
Name, Age; Principal Occupation
Dennis J. Dirks (58)
Year of Election or Appointment: 2005
Prior to his retirement in May 2003, Mr. Dirks was Chief Operating Officer and a member of the Board of The Depository Trust & Clearing Corporation (DTCC) (1999-2003). He also served as President, Chief Operating Officer, and Board member of The Depository Trust Company (DTC) (1999-2003) and President and Board member of the National Securities Clearing Corporation (NSCC) (1999-2003). In addition, Mr. Dirks served as Chief Executive Officer and Board member of the Government Securities Clearing Corporation (2001-2003) and Chief Executive Officer and Board member of the Mortgage-Backed Securities Clearing Corporation (2001-2003). Mr. Dirks also serves as a Trustee and a member of the Finance Committee of Manhattan College (2005-present) and a Trustee and a member of the Finance Committee of AHRC of Nassau County (2006-present).
Albert R. Gamper, Jr. (64)
Year of Election or Appointment: 2006
Prior to his retirement in December 2004, Mr. Gamper served as Chairman of the Board of CIT Group Inc. (commercial finance). During his tenure with CIT Group Inc. Mr. Gamper served in numerous senior management positions, including Chairman (1987-1989; 1999-2001; 2002-2004), Chief Executive Officer (1987-2004), and President (1989-2002). He currently serves as a member of the Board of Directors of Public Service Enterprise Group (utilities, 2001-present), Chairman of the Board of Governors, Rutgers University (2004-present), and Chairman of the Board of Saint Barnabas Health Care System.
George H. Heilmeier (70)
Year of Election or Appointment: 2004
Dr. Heilmeier is Chairman Emeritus of Telcordia Technologies (communication software and systems), where prior to his retirement, he served as company Chairman and Chief Executive Officer. He currently serves on the Boards of Directors of The Mitre Corporation (systems engineering and information technology support for the government), and HRL Laboratories (private research and development, 2004-present). He is Chairman of the General Motors Science & Technology Advisory Board and a Life Fellow of the Institute of Electrical and Electronics Engineers (IEEE). Dr. Heilmeier is a member of the Defense Science Board and the National Security Agency Advisory Board. He is also a member of the National Academy of Engineering, the American Academy of Arts and Sciences, and the Board of Overseers of the School of Engineering and Applied Science of the University of Pennsylvania. Previously, Dr. Heilmeier served as a Director of TRW Inc. (automotive, space, defense, and information technology, 1992-2002), Compaq (1994-2002), Automatic Data Processing, Inc. (ADP) (technology-based business outsourcing, 1995-2002), INET Technologies Inc. (telecommunications network surveillance, 2001-2004), and Teletech Holdings (customer management services). He is the recipient of the 2005 Kyoto Prize in Advanced Technology for his invention of the liquid crystal display, and a member of the Consumer Electronics Hall of Fame.
James H. Keyes (66)
Year of Election or Appointment: 2007
Prior to his retirement in 2003, Mr. Keyes was Chairman, President, and Chief Executive Officer of Johnson Controls, Inc. (automotive supplier, 1993-2003). He currently serves as a member of the boards of LSI Logic Corporation (semiconductor technologies), Navistar International Corporation (manufacture and sale of trucks, buses, and diesel engines, 2002-present), and Pitney Bowes, Inc. (integrated mail, messaging, and document management solutions).
Marie L. Knowles (60)
Year of Election or Appointment: 2001
Prior to Ms. Knowles' retirement in June 2000, she served as Executive Vice President and Chief Financial Officer of Atlantic Richfield Company (ARCO) (diversified energy, 1996-2000). From 1993 to 1996, she was a Senior Vice President of ARCO and President of ARCO Transportation Company. She served as a Director of ARCO from 1996 to 1998. She currently serves as a Director of Phelps Dodge Corporation (copper mining and manufacturing) and McKesson Corporation (healthcare service, 2002-present). Ms. Knowles is a Trustee of the Brookings Institution and the Catalina Island Conservancy and also serves as a member of the Advisory Board for the School of Engineering of the University of Southern California.
Ned C. Lautenbach (62)
Year of Election or Appointment: 2000
Mr. Lautenbach is Chairman of the Independent Trustees (2006-present). Mr. Lautenbach has been a partner of Clayton, Dubilier & Rice, Inc. (private equity investment firm) since September 1998. Previously, Mr. Lautenbach was with the International Business Machines Corporation (IBM) from 1968 until his retirement in 1998. Mr. Lautenbach serves as a Director of Sony Corporation (2006-present) and Eaton Corporation (diversified industrial) as well as the Philharmonic Center for the Arts in Naples, Florida. He also is a member of the Board of Trustees of Fairfield University (2005-present), as well as a member of the Council on Foreign Relations.
Cornelia M. Small (62)
Year of Election or Appointment: 2005
Ms. Small is a member (2000-present) and Chairperson (2002-present) of the Investment Committee, and a member (2002-present) of the Board of Trustees of Smith College. Previously, she served as Chief Investment Officer (1999-2000), Director of Global Equity Investments (1996-1999), and a member of the Board of Directors of Scudder, Stevens & Clark (1990-1997) and Scudder Kemper Investments (1997-1999). In addition, Ms. Small served as Co-Chair (2000-2003) of the Annual Fund for the Fletcher School of Law and Diplomacy.
William S. Stavropoulos (67)
Year of Election or Appointment: 2002
Mr. Stavropoulos is Chairman Emeritus of the Board of Directors of The Dow Chemical Company. Since joining The Dow Chemical Company in 1967, Mr. Stavropoulos served in numerous senior management positions, including President (1993-2000; 2002- 2003), CEO (1995-2000; 2002-2004), and Chairman of the Executive Committee (2000-2004). Currently, he is a Director of NCR Corporation (data warehousing and technology solutions), BellSouth Corporation (telecommunications), Chemical Financial Corporation, Maersk Inc. (industrial conglomerate, 2002-present), and Metalmark Capital (private equity investment firm, 2005- present). He also serves as a member of the Board of Trustees of the American Enterprise Institute for Public Policy Research. In addition, Mr. Stavropoulos is a member of The Business Council, J.P. Morgan International Council and the University of Notre Dame Advisory Council for the College of Science.
Kenneth L. Wolfe (67)
Year of Election or Appointment: 2005
Prior to his retirement in 2001, Mr. Wolfe was Chairman and Chief Executive Officer of Hershey Foods Corporation (1993-2001). He currently serves as a member of the boards of Adelphia Communications Corporation (2003-present), Bausch & Lomb, Inc., and Revlon Inc. (2004-present).
Advisory Board Member and Executive Officers:
Correspondence intended for each executive officer and Mr. Lynch may be sent to Fidelity Investments, 82 Devonshire Street, Boston, Massachusetts 02109.
Name, Age; Principal Occupation
Peter S. Lynch (62)
Year of Election or Appointment: 2003
Member of the Advisory Board of Variable Insurance Products Fund III. Mr. Lynch is Vice Chairman and a Director of FMR, and Vice Chairman (2001-present) and a Director of FMR Co., Inc. Previously, Mr. Lynch served as a Trustee of the Fidelity funds (1990-2003). In addition, he serves as a Trustee of Boston College and as the Chairman of the Inner-City Scholarship Fund.
Kimberley H. Monasterio (43)
Year of Election or Appointment: 2007
President and Treasurer of VIP Growth Opportunities. Ms. Monasterio also serves as President and Treasurer of other Fidelity funds (2007-present) and is an employee of FMR (2004-present). Previously, Ms. Monasterio served as Deputy Treasurer of the Fidelity funds (2004-2006). Before joining Fidelity Investments, Ms. Monasterio served as Treasurer (2000-2004) and Chief Financial Officer (2002-2004) of the Franklin Templeton Funds and Senior Vice President of Franklin Templeton Services, LLC (2000-2004).
Dwight D. Churchill (53)
Year of Election or Appointment: 2005
Vice President of VIP Growth Opportunities. Mr. Churchill also serves as Vice President of certain Equity Funds (2005-present). Mr. Churchill is Executive Vice President of FMR (2005-present) and FMR Co., Inc. (2005-present). Previously, Mr. Churchill served as Senior Vice President of Fidelity Investments Money Management, Inc. (2005-2006), Head of Fidelity's Fixed-Income Division (2000-2005), Vice President of Fidelity's Money Market Funds (2000-2005), Vice President of Fidelity's Bond Funds, and Senior Vice President of FMR.
Bruce T. Herring (41)
Year of Election or Appointment: 2006
Vice President of VIP Growth Opportunities. Mr. Herring also serves as Vice President of certain Equity Funds (2006-present). Mr. Herring is Senior Vice President of FMR (2006-present) and Vice President of FMR Co., Inc. (2001-present). Previously, Mr. Herring served as a portfolio manager for Fidelity U.S. Equity Funds (2001-2005).
Eric D. Roiter (58)
Year of Election or Appointment: 1998
Secretary of VIP Growth Opportunities. He also serves as Secretary of other Fidelity funds; Vice President, General Counsel, and Secretary of FMR Co., Inc. (2001-present) and FMR; Assistant Secretary of Fidelity Management & Research (U.K.) Inc. (2001-present), Fidelity Research & Analysis Company (2001-present), and Fidelity Investments Money Management, Inc. (2001-present). Mr. Roiter is an Adjunct Member, Faculty of Law, at Boston College Law School (2003-present). Previously, Mr. Roiter served as Vice President and Secretary of Fidelity Distributors Corporation (FDC) (1998-2005).
Stuart Fross (47)
Year of Election or Appointment: 2003
Assistant Secretary of VIP Growth Opportunities. Mr. Fross also serves as Assistant Secretary of other Fidelity funds (2003-present), Vice President and Secretary of FDC (2005-present), and is an employee of FMR.
R. Stephen Ganis (40)
Year of Election or Appointment: 2006
Anti-Money Laundering (AML) officer of VIP Growth Opportunities. Mr. Ganis also serves as AML officer of other Fidelity funds (2006-present) and FMR Corp. (2003-present). Before joining Fidelity Investments, Mr. Ganis practiced law at Goodwin Procter, LLP (2000-2002).
Joseph B. Hollis (58)
Year of Election or Appointment: 2006
Chief Financial Officer of VIP Growth Opportunities. Mr. Hollis also serves as Chief Financial Officer of other Fidelity funds. Mr. Hollis is President of Fidelity Pricing and Cash Management Services (FPCMS) (2005-present). Mr. Hollis also serves as President and Director of Fidelity Service Company, Inc. (2006-present). Previously, Mr. Hollis served as Senior Vice President of Cash Management Services (1999-2002) and Investment Management Operations (2002-2005).
Kenneth A. Rathgeber (59)
Year of Election or Appointment: 2004
Chief Compliance Officer of VIP Growth Opportunities. Mr. Rathgeber also serves as Chief Compliance Officer of other Fidelity funds (2004-present) and Executive Vice President of Risk Oversight for Fidelity Investments (2002-present). He is Chief Compliance Officer of FMR (2005-present), FMR Co., Inc. (2005-present), Fidelity Management & Research (U.K.) Inc. (2005-present), Fidelity Research & Analysis Company (2005-present), Fidelity Investments Money Management, Inc. (2005-present), and Strategic Advisers, Inc. (2005-present). Previously, Mr. Rathgeber served as Executive Vice President and Chief Operating Officer for Fidelity Investments Institutional Services Company, Inc. (1998-2002).
Bryan A. Mehrmann (45)
Year of Election or Appointment: 2005
Deputy Treasurer of VIP Growth Opportunities. Mr. Mehrmann also serves as Deputy Treasurer of other Fidelity funds (2005-present) and is an employee of FMR. Previously, Mr. Mehrmann served as Vice President of Fidelity Investments Institutional Services Group (FIIS)/Fidelity Investments Institutional Operations Corporation, Inc. (FIIOC) Client Services (1998-2004).
Kenneth B. Robins (37)
Year of Election or Appointment: 2005
Deputy Treasurer of VIP Growth Opportunities. Mr. Robins also serves as Deputy Treasurer of other Fidelity funds (2005-present) and is an employee of FMR (2004-present). Before joining Fidelity Investments, Mr. Robins worked at KPMG LLP, where he was a partner in KPMG's department of professional practice (2002-2004) and a Senior Manager (1999-2000). In addition, Mr. Robins served as Assistant Chief Accountant, United States Securities and Exchange Commission (2000-2002).
Robert G. Byrnes (40)
Year of Election or Appointment: 2005
Assistant Treasurer of VIP Growth Opportunities. Mr. Byrnes also serves as Assistant Treasurer of other Fidelity funds (2005- present) and is an employee of FMR (2005-present). Previously, Mr. Byrnes served as Vice President of FPCMS (2003-2005). Before joining Fidelity Investments, Mr. Byrnes worked at Deutsche Asset Management where he served as Vice President of the Investment Operations Group (2000-2003).
John H. Costello (60)
Year of Election or Appointment: 1995
Assistant Treasurer of VIP Growth Opportunities. Mr. Costello also serves as Assistant Treasurer of other Fidelity funds and is an employee of FMR.
Peter L. Lydecker (52)
Year of Election or Appointment: 2004
Assistant Treasurer of VIP Growth Opportunities. Mr. Lydecker also serves as Assistant Treasurer of other Fidelity funds (2004) and is an employee of FMR.
Mark Osterheld (51)
Year of Election or Appointment: 2002
Assistant Treasurer of VIP Growth Opportunities. Mr. Osterheld also serves as Assistant Treasurer of other Fidelity funds (2002) and is an employee of FMR.
Gary W. Ryan (48)
Year of Election or Appointment: 2005
Assistant Treasurer of VIP Growth Opportunities. Mr. Ryan also serves as Assistant Treasurer of other Fidelity funds (2005-present) and is an employee of FMR (2005-present). Previously, Mr. Ryan served as Vice President of Fund Reporting in FPCMS (1999-2005).
Salvatore Schiavone (41)
Year of Election or Appointment: 2005
Assistant Treasurer of VIP Growth Opportunities. Mr. Schiavone also serves as Assistant Treasurer of other Fidelity funds (2005- present) and is an employee of FMR (2005-present). Before joining Fidelity Investments, Mr. Schiavone worked at Deutsche Asset Management, where he most recently served as Assistant Treasurer (2003-2005) of the Scudder Funds and Vice President and Head of Fund Reporting (1996-2003).
Annual Report
Distributions
Initial Class, Investor Class, Service Class, and Service Class 2 designate 100% of the dividends distributed during the fiscal year as qualifying for the dividends-received deduction for corporate shareholders.
The fund will notify shareholders in January 2007 of amounts for use in preparing 2006 income tax returns.
Annual Report
Proxy Voting Results
A special meeting of the fund's shareholders was held on November 15, 2006. The results of votes taken among shareholders on the proposal before them are reported below. Each vote reported represents one dollar of net asset value held on the record date for the meeting.
PROPOSAL 1
To elect a Board of Trustees. A
# of Votes
% of Votes
Dennis J. Dirks
Affirmative
8,022,573,906.52
96.057
Withheld
329,291,624.43
3.943
TOTAL
8,351,865,530.95
100.000
Albert R. Gamper, Jr.
Affirmative
8,017,939,119.36
96.002
Withheld
333,926,411.59
3.998
TOTAL
8,351,865,530.95
100.000
Robert M. Gates
Affirmative
8,011,581,068.50
95.926
Withheld
340,284,462.45
4.074
TOTAL
8,351,865,530.95
100.000
George H. Heilmeier
Affirmative
8,000,846,196.79
95.797
Withheld
351,019,334.16
4.203
TOTAL
8,351,865,530.95
100.000
Edward C. Johnson 3d
Affirmative
7,992,112,301.22
95.693
Withheld
359,753,229.73
4.307
TOTAL
8,351,865,530.95
100.000
Stephen P. Jonas
Affirmative
8,019,883,742.95
96.025
Withheld
331,981,788.00
3.975
TOTAL
8,351,865,530.95
100.000
James H. KeyesB
Affirmative
8,015,436,547.06
95.972
Withheld
336,428,983.89
4.028
TOTAL
8,351,865,530.95
100.000
Marie L. Knowles
Affirmative
8,015,361,874.49
95.971
Withheld
336,503,656.46
4.029
TOTAL
8,351,865,530.95
100.000
Ned C. Lautenbach
Affirmative
8,018,503,793.25
96.009
Withheld
333,361,737.70
3.991
TOTAL
8,351,865,530.95
100.000
# of Votes
% of Votes
William O. McCoy
Affirmative
8,000,170,571.19
95.789
Withheld
351,694,959.76
4.211
TOTAL
8,351,865,530.95
100.000
Robert L. Reynolds
Affirmative
8,020,815,676.67
96.036
Withheld
331,049,854.28
3.964
TOTAL
8,351,865,530.95
100.000
Cornelia M. Small
Affirmative
8.020,146,516.32
96.028
Withheld
331,719,014.63
3.972
TOTAL
8,351,865,530.95
100.000
William S. Stavropoulos
Affirmative
8,009,250,640.78
95.898
Withheld
342,614,890.17
4.102
TOTAL
8,351,865,530.95
100.000
Kenneth L. Wolfe
Affirmative
8,013,187,941.55
95.945
Withheld
338,677,589.40
4.055
TOTAL
8,351,865,530.95
100.000
ADenotes trust-wide proposal and voting results.
BEffective on or about January 1, 2007.
Annual Report
Board Approval of Investment Advisory Contracts and Management Fees
VIP Growth Opportunities Portfolio
Each year, typically in July, the Board of Trustees, including the Independent Trustees (together, the Board), votes on the renewal of the management contract and sub-advisory agreements (together, the Advisory Contracts) for the fund. The Board, assisted by the advice of fund counsel and Independent Trustees' counsel, requests and considers a broad range of information throughout the year.
The Board meets regularly each month except August and takes into account throughout the year matters bearing on Advisory Contracts. The Board, acting directly and through its separate committees, considers at each of its meetings factors that are relevant to the annual renewal of the fund's Advisory Contracts, including the services and support provided to the fund and its shareholders. At the time of the renewal, the Board had 12 standing committees, each composed of Independent Trustees with varying backgrounds, to which the Board has assigned specific subject matter responsibilities in order to enhance effective decision-making by the Board. Each committee has adopted a written charter outlining the structure and purposes of the committee. One such committee, the Equity Contract Committee, meets periodically as needed throughout the year to consider matters specifically related to the annual renewal of Advisory Contracts. The committee requests and receives information on, and makes recommendations to the Independent Trustees concerning, the approval and annual review of the Advisory Contracts.
At its July 2006 meeting, the Board of Trustees, including the Independent Trustees, unanimously determined to renew the Advisory Contracts for the fund. In reaching its determination, the Board considered all factors it believed relevant, including (i) the nature, extent, and quality of the services to be provided to the fund and its shareholders (including the investment performance of the fund); (ii) the competitiveness of the management fee and total expenses of the fund; (iii) the total costs of the services to be provided by and the profits to be realized by the investment adviser and its affiliates from the relationship with the fund; (iv) the extent to which economies of scale would be realized as the fund grows; and (v) whether fee levels reflect these economies of scale, if any, for the benefit of fund shareholders.
In determining whether to renew the Advisory Contracts for the fund, the Board ultimately reached a determination, with the assistance of fund counsel and Independent Trustees' counsel, that the renewal of the Advisory Contracts and the compensation to be received by Fidelity under the management contract is consistent with Fidelity's fiduciary duty under applicable law. In addition to evaluating the specific factors noted above, the Board, in reaching its determination, is aware that shareholders in the fund have a broad range of investment choices available to them, including a wide choice among mutual funds offered by competitors to Fidelity, and that the fund's shareholders, with the opportunity to review and weigh the disclosure provided by the fund in its prospectus and other public disclosures, have chosen to invest in this fund, managed by Fidelity.
Nature, Extent, and Quality of Services Provided. The Board considered staffing within the investment adviser, FMR, and the sub-advisers (together, the Investment Advisers), including the background of the fund's portfolio manager and the fund's investment objective and discipline. The Independent Trustees also had discussions with senior management of Fidelity's investment operations and investment groups. The Board considered the structure of the portfolio manager compensation program and whether this structure provides appropriate incentives.
Resources Dedicated to Investment Management and Support Services. The Board reviewed the size, education, and experience of the Investment Advisers' investment staff, their use of technology, and the Investment Advisers' approach to recruiting, training, and retaining portfolio managers and other research, advisory, and management personnel. The Board considered Fidelity's extensive global research capabilities that enable the Investment Advisers to aggregate data from various sources in an effort to produce positive investment results. The Board noted that Fidelity's analysts have access to a variety of technological tools that enable them to perform both fundamental and quantitative analysis and to specialize in various disciplines. The Board also considered that Fidelity's portfolio managers and analysts have access to daily portfolio attribution that allows for monitoring of a fund's portfolio, as well as an electronic communication system that provides immediate real-time access to research concerning issuers and credit enhancers.
Shareholder and Administrative Services. The Board considered (i) the nature, extent, quality, and cost of administrative, distribution, and shareholder services performed by the Investment Advisers and their affiliates under the Advisory Contracts and under separate agreements covering transfer agency, pricing and bookkeeping, and securities lending services for the fund; (ii) the nature and extent of the Investment Advisers' supervision of third party service providers, principally custodians and subcustodians; and (iii) the resources devoted to, and the record of compliance with, the fund's compliance policies and procedures. The Board reviewed the allocation of fund brokerage, including allocations to brokers affiliated with the Investment Advisers, the use of brokerage commissions to pay fund expenses, and the use of "soft" commission dollars to pay for research services. The Board also considered that Fidelity voluntarily pays for market data out of its own resources.
The Board noted that the growth of fund assets across the complex allows Fidelity to reinvest in the development of services designed to enhance the value or convenience of the Fidelity funds as investment vehicles. These services include 24-hour access to account information and market information through phone representatives and over the Internet, and investor education materials and asset allocation tools.
Investment in a Large Fund Family. The Board considered the benefits to shareholders of investing in a Fidelity fund, including the benefits of investing in a fund that is part of a large family of funds offering a variety of investment disciplines and providing for a large variety of mutual fund investor services. The Board noted that, since the last Advisory Contract renewals in July 2005, Fidelity has taken a number of actions that benefited particular funds, including (i) dedicating additional resources to investment research and to restructure the investment research teams; (ii) voluntarily entering into contractual arrangements with certain brokers pursuant to which Fidelity pays for research products and services separately out of its own resources, rather than bundling with fund commissions; (iii) launching the Fidelity Advantage Class of its five Spartan stock index funds and three Spartan bond index funds, which is a lower-fee class available to shareholders with higher account balances; (iv) contractually agreeing to impose expense limitations on Fidelity U.S. Bond Index Fund and reducing the fund's initial investment minimum; and (v) offering shareholders of each of the Fidelity Institutional Money Market Funds the privilege of exchanging shares of the fund for shares of other Fidelity funds.
Annual Report
Board Approval of Investment Advisory Contracts and Management Fees - continued
Investment Performance and Compliance. The Board considered whether the fund has operated within its investment objective, as well as its record of compliance with its investment restrictions. It also reviewed the fund's absolute investment performance for each class (except Investor Class), as well as the fund's relative investment performance for each class (except Investor Class) measured against (i) a broad-based securities market index, and (ii) a peer group of mutual funds deemed appropriate by the Board over multiple periods. The following charts considered by the Board show, over the one-, three-, and five-year periods ended December 31, 2005, the cumulative total returns of Service Class 2 and Initial Class of the fund, the cumulative total returns of a broad-based securities market index ("benchmark"), and a range of cumulative total returns of a peer group of mutual funds identified by Lipper Inc. as having an investment objective similar to that of the fund. The returns of Service Class 2 and Initial Class represent the performance of classes with the highest and lowest 12b-1 fees, respectively (not necessarily with the highest and lowest total expenses). (Investor Class of the fund, which has no 12b-1 fee, had less than one year of performance as of December 31, 2005.) The box within each chart shows the 25th percentile return (bottom of box) and the 75th percentile return (top of box) of the Lipper peer group. Returns shown above the box are in the first quartile and returns shown below the box are in the fourth quartile. The percentage beaten numbers noted below each chart correspond to the percentile box and represent the percentage of funds in the Lipper peer group whose performance was equal to or lower than that of the class indicated.
VIP Growth Opportunities Portfolio
The Board reviewed the fund's relative investment performance against its Lipper peer group and stated that the performance of Initial Class of the fund was in the second quartile for the one- and five-year periods and the third quartile for the three-year period. The Board also stated that the relative investment performance of Initial Class of the fund compared favorably to its benchmark for the one- and three-year periods, although the fund's five-year cumulative total return was lower than its benchmark. The Board considered that the variations in performance among the fund's classes reflect the variations in class expenses, which result in lower performance for higher expense classes. The Board also reviewed the fund's relative investment performance against a customized peer group based on a combination of categories defined by Morningstar.
The Board considered that FMR has taken steps to refocus and strengthen equity research, equity portfolio management, and compliance. The Board noted with favor FMR's reorganization of its senior management team in 2005 and FMR's dedication of additional resources to investment research, and participated in the process that led to those changes.
Based on its review, and giving particular weight to the nature and quality of the resources dedicated by the Investment Advisers to maintain and improve relative performance, the Board concluded that the nature, extent, and quality of the services provided to the fund will benefit the fund's shareholders, particularly in light of the Board's view that the fund's shareholders benefit from investing in a fund that is part of a large family of funds offering a variety of investment disciplines and services.
Competitiveness of Management Fee and Total Fund Expenses. The Board considered the fund's management fee and total expenses compared to "mapped groups" of competitive funds and classes. Fidelity creates "mapped groups" by combining similar Lipper investment objective categories that have comparable management fee characteristics. Combining Lipper investment objective categories aids the Board's management fee and total expense comparisons by broadening the competitive group used for comparison and by reducing the number of universes to which various Fidelity funds are compared.
VIP Growth Opportunities Portfolio
The Board considered two proprietary management fee comparisons for the 12-month periods shown in the chart below. The group of Lipper funds used by the Board for management fee comparisons is referred to below as the "Total Mapped Group" and, for the reasons explained above, is broader than the Lipper peer group used by the Board for performance comparisons. The Total Mapped Group comparison focuses on a fund's standing relative to the total universe of comparable funds available to investors, in terms of gross management fees before expense reimbursements or caps. "TMG %" represents the percentage of funds in the Total Mapped Group that had management fees that were lower than the fund's. For example, a TMG % of 6% means that 94% of the funds in the Total Mapped Group had higher management fees than the fund. The "Asset-Size Peer Group" (ASPG) comparison focuses on a fund's standing relative to non-Fidelity funds similar in size to the fund within the Total Mapped Group. The ASPG represents at least 15% of the funds in the Total Mapped Group with comparable asset size and management fee characteristics, subject to a minimum of 50 funds (or all funds in the Total Mapped Group if fewer than 50). Additional information, such as the ASPG quartile in which the fund's management fee ranked, is also included in the chart and considered by the Board.
VIP Growth Opportunities Portfolio
The Board noted that the fund's management fee ranked below the median of its Total Mapped Group and below the median of its ASPG for 2005.
Based on its review, the Board concluded that the fund's management fee was fair and reasonable in light of the services that the fund receives and the other factors considered.
In its review of each class's total expenses, the Board considered the fund's management fee as well as other fund or class expenses, as applicable, such as transfer agent fees, pricing and bookkeeping fees, fund-paid 12b-1 fees, and custodial, legal, and audit fees. The Board also noted the effects of any waivers and reimbursements on fees and expenses. As part of its review, the Board also considered current and historical total expenses of each class of the fund compared to competitive fund median expenses. Each class of the fund is compared to those funds and classes in the Total Mapped Group (used by the Board for management fee comparisons) that have a similar sales load structure.
The Board noted that the total expenses of each class ranked below its competitive median for 2005.
In its review of total expenses, the Board also considered Fidelity fee structures and other information on clients that FMR and its affiliates service in other competitive markets, such as other mutual funds advised or subadvised by FMR or its affiliates, pension plan clients, and other institutional clients.
Based on its review, the Board concluded that the total expenses of each class of the fund were reasonable in light of the services that the fund and its shareholders receive and the other factors considered.
Costs of the Services and Profitability. The Board considered the revenues earned and the expenses incurred by Fidelity in conducting the business of developing, marketing, distributing, managing, administering and servicing the fund and its shareholders. The Board also considered the level of Fidelity's profits in respect of all the Fidelity funds.
Annual Report
Board Approval of Investment Advisory Contracts and Management Fees - continued
On an annual basis, FMR presents to the Board Fidelity's profitability for the fund. Fidelity calculates the profitability for each fund, as well as aggregate profitability for groups of Fidelity funds and all Fidelity funds, using a series of detailed revenue and cost allocation methodologies which originate with the audited books and records of Fidelity. The Audit Committee of the Board reviews any significant changes from the prior year's methodologies.
PricewaterhouseCoopers LLP (PwC), independent registered accounting firm and auditor to Fidelity and certain Fidelity funds, has been engaged annually by the Board as part of the Board's assessment of the results of Fidelity's profitability analysis. PwC's engagement includes the review and assessment of Fidelity's methodologies used in determining the revenues and expenses attributable to Fidelity's mutual fund business, and completion of agreed-upon procedures surrounding the mathematical accuracy of fund profitability and its conformity to allocation methodologies. After considering PwC's reports issued under the engagement and information provided by Fidelity, the Board believes that while other allocation methods may also be reasonable, Fidelity's profitability methodologies are reasonable in all material respects.
The Board has also reviewed Fidelity's non-fund businesses and any fall-out benefits related to the mutual fund business as well as cases where Fidelity's affiliates may benefit from or be related to the fund's business.
The Board considered the costs of the services provided by and the profits realized by Fidelity in connection with the operation of the fund and determined that the amount of profit is a fair entrepreneurial profit for the management of the fund.
Economies of Scale. The Board considered whether there have been economies of scale in respect of the management of the Fidelity funds, whether the Fidelity funds (including the fund) have appropriately benefited from any such economies of scale, and whether there is potential for realization of any further economies of scale. The Board considered the extent to which the fund will benefit from economies of scale through increased services to the fund, through waivers or reimbursements, or through fee or expense reductions.
The Board recognized that the fund's management contract incorporates a "group fee" structure, which provides for lower fee rates as total fund assets under FMR's management increase, and for higher fee rates as total fund assets under FMR's management decrease. The Board considered that the group fee is designed to deliver the benefits of economies of scale to fund shareholders when total fund assets increase, even if assets of any particular fund are unchanged or have declined, because some portion of Fidelity's costs are attributable to services provided to all Fidelity funds, and all funds benefit if those costs can be allocated among more assets. The Board concluded that, given the group fee structure, fund shareholders will achieve a certain level of economies of scale as assets under FMR's management increase at the fund complex level, regardless of whether Fidelity achieves any such economies of scale.
The Board further concluded that any potential economies of scale are being shared between fund shareholders and Fidelity in an appropriate manner.
Additional Information Requested by the Board. In order to develop fully the factual basis for consideration of the Advisory Contracts, the Board requested additional information on several topics, including (i) Fidelity's fund profitability methodology and profitability trends within certain funds; (ii) portfolio manager compensation; (iii) the extent to which any economies of scale exist and are shared between the funds and Fidelity; (iv) the total expenses of certain funds and classes relative to competitors, including the extent to which the expenses of certain funds have been or could be capped; (v) fund performance trends; and (vi) Fidelity's fee structures, including use of performance fees.
Based on its evaluation of all of the conclusions noted above, and after considering all material factors, the Board ultimately concluded that the advisory fee structures are fair and reasonable, and that the fund's Advisory Contracts should be renewed.
VIP Growth Opportunities Portfolio
Investment Adviser
Fidelity Management & Research Company Boston, MA
Investment Sub-Advisers
FMR Co., Inc.
Fidelity Management & Research (U.K.) Inc.
Fidelity Research & Analysis Company (formerly Fidelity Management & Research (Far East) Inc.)
Fidelity Investments Japan Limited
Fidelity International Investment Advisors
Fidelity International Investment Advisors (U.K.) Limited
General Distributor
Fidelity Distributors Corporation Boston, MA
Transfer and Service Agents
Fidelity Investments Institutional Operations Company, Inc. Boston, MA
To view a fund's proxy voting guidelines and proxy voting record for the 12-month period ended June 30, visit www.fidelity.com/proxyvotingresults or visit the Securities and Exchange Commission's (SEC) web site at www.sec.gov. You may also call 1-877-208-0098 to request a free copy of the proxy voting guidelines.
Fidelity Variable Insurance Products are separate account options which are purchased through a variable insurance contract.
Standard & Poor's, S&P and S&P 500 are registered service marks of The McGraw-Hill Companies, Inc. and have been licensed for use by Fidelity Distributors Corporation.
Other third party marks appearing herein are the property of their respective owners.
All other marks appearing herein are registered or unregistered trademarks or service marks of FMR Corp. or an affiliated company.
This report and the financial statements contained herein are submitted for the general information of the shareholders of the fund. This report is not authorized for distribution to prospective investors in the fund unless preceded or accompanied by an effective prospectus.
A fund files its complete schedule of portfolio holdings with the SEC for the first and third quarters of each fiscal year on Form N-Q. Forms N-Q are available on the SEC's web site at http://www.sec.gov. A fund's Forms N-Q may be reviewed and copied at the SEC's Public Reference Room in Washington, DC. Information regarding the operation of the SEC's Public Reference Room may be obtained by calling 1-800-SEC-0330. For a complete list of a fund's portfolio holdings, view the most recent quarterly holdings report, semiannual report, or annual report on Fidelity's web site at http://www.advisor.fidelity.com.
NOT FDIC INSURED· MAY LOSE VALUE· NO BANK GUARANTEE
Neither the fund nor Fidelity Distributors Corporation is a bank.
Portfolio
VIP Mid Cap Portfolio
Performance: The Bottom Line
Average annual total return reflects the change in the value of an investment, assuming reinvestment of the class' dividend income and capital gains (the profits earned upon the sale of securities that have grown in value) and assuming a constant rate of performance each year. During periods of reimbursement by Fidelity, a fund's total return will be greater than it would be had the reimbursement not occurred. Performance numbers are net of all underlying fund operating expenses, but do not include any insurance charges imposed by your insurance company's separate account. If performance information included the effect of these additional charges, the total returns would have been lower. How a fund did yesterday is no guarantee of how it will do tomorrow.
Average Annual Total Returns
Periods ended December 31, 2006
Past 1 year
Past 5 years
Life of fund A
VIP Mid Cap - Initial Class
12.70%
15.80%
19.40%
VIP Mid Cap - Service Class B
12.59%
15.69%
19.28%
VIP Mid Cap - Service Class 2 C
12.40%
15.52%
19.12%
VIP Mid Cap - Investor Class D
12.59%
15.76%
19.37%
AFrom December 28, 1998.
BPerformance for Service Class shares reflects an asset based distribution fee (12b-1).
CThe initial offering of Service Class 2 shares took place January 12, 2000. Performance for Service Class 2 shares reflects an asset based distribution fee (12b-1 fee). Returns from December 28, 1998 to January 12, 2000 are those of Service Class which reflect a different 12b-1 fee. Had Service Class 2's 12b-1 fee been reflected, returns prior to January 12, 2000 would have been lower.
DThe initial offering of Investor Class shares took place on July 21, 2005. Returns prior to July 21, 2005 are those of Initial Class. If Investor Class's transfer agent fee had been reflected, returns prior to July 21, 2005 would have been lower.
$10,000 Over Life of Fund
Let's say hypothetically that $10,000 was invested in VIP Mid Cap Portfolio - Initial Class on December 28, 1998, when the fund started. The chart shows how the value of your investment would have changed, and also shows how the S&P® MidCap 400 Index performed the same period.
Annual Report
VIP Mid Cap Portfolio
Management's Discussion of Fund Performance
Comments from Thomas Allen, Portfolio Manager of VIP Mid Cap Portfolio
U.S. stock markets registered their fourth consecutive year of positive returns in 2006. Among the highlights were the performances of the Dow Jones Industrial AverageSM - a gauge of 30 mega-cap, blue-chip stocks - and the small-cap-oriented Russell 2000® Index, both of which reached new highs. The efforts of the Federal Reserve Board to contain inflation levels also dominated the investment headlines. In all, the Fed hiked short-term interest rates four times, but held rates steady after its June 29 increase, finally pausing after 17 rate hikes over a two-year period. A slowing residential housing market and moderating oil prices - the latter of which hit a record closing high of $77 per barrel in July before falling sharply - also held economic growth in check. For the year overall, the Standard & Poor's 500SM Index was up 15.79%, the Dow advanced 19.05%, the Russell 2000 Index gained 18.37% and the NASDAQ Composite® Index rose 10.39%.
During the year, the fund beat the 10.32% return of the Standard & Poor's® MidCap 400 Index. (For specific portfolio performance results, please refer to the performance section of this report.) I built up a larger-than-normal cash position by the end of June but put much of this capital to work as market conditions improved in the period's second half. Strong stock picking in consumer discretionary, industrials, consumer staples, materials and financials aided performance versus the index, along with overweighting the capital goods industry and the telecommunication services sector. Farm equipment maker AGCO turned in a strong performance, benefiting from robust global demand for farm commodities. Also aiding performance was Netherlands-based Core Laboratories, a provider of reservoir maintenance and management services for energy producers, along with Chinese personal products maker Hengan International Group, biotechnology instrument maker Thermo Fisher Scientific and Canada-based gold producer Agnico-Eagle Mines. Having virtually no exposure to poorly performing clothing retailer Chico's FAS was helpful as well. Conversely, overweighting the energy sector hurt relative performance, as did underweighting information technology, utilities and financials. The biggest detractor was Newmont Mining, a gold mining stock that suffered from various operational problems during the period. A trio of oil and gas drillers - Parker Drilling, Global Industries and Noble Corp. - further detracted from the fund's results. Additionally, underweighting the high-flying stock of Indian information technology outsourcing company Cognizant Technology Solutions was a mistake, despite its rich valuation.
The views expressed above reflect those of the portfolio manager(s) only through the end of the period as stated on the cover of this report and do not necessarily represent the views of Fidelity or any other person in the Fidelity organization. Any such views are subject to change at any time based upon market or other conditions and Fidelity disclaims any responsibility to update such views. These views may not be relied on as investment advice and, because investment decisions for a Fidelity fund are based on numerous factors, may not be relied on as an indication of trading intent on behalf of any Fidelity fund.
Annual Report
VIP Mid Cap Portfolio
Shareholder Expense Example
As a shareholder of the Fund, you incur two types of costs: (1) transaction costs, and (2) ongoing costs, including management fees, distribution and/or service (12b-1) fees and other Fund expenses. This Example is intended to help you understand your ongoing costs (in dollars) of investing in the Fund and to compare these costs with the ongoing costs of investing in other mutual funds.
The Example is based on an investment of $1,000 invested at the beginning of the period and held for the entire period (July 1, 2006 to December 31, 2006).
Actual Expenses
The first line of the accompanying table for each class of the Fund provides information about actual account values and actual expenses. You may use the information in this line, together with the amount you invested, to estimate the expenses that you paid over the period. Simply divide your account value by $1,000.00 (for example, an $8,600 account value divided by $1,000.00 = 8.6), then multiply the result by the number in the first line for a class of the Fund under the heading entitled "Expenses Paid During Period" to estimate the expenses you paid on your account during this period. The estimate of expenses does not include any fees or other expenses of any variable annuity or variable life insurance product. If they were, the estimate of expenses you paid during the period would be higher, and your ending account value would be lower.
Hypothetical Example for Comparison Purposes
The second line of the accompanying table for each class of the Fund provides information about hypothetical account values and hypothetical expenses based on a Class' actual expense ratio and an assumed rate of return of 5% per year before expenses, which is not the Class' actual return. The hypothetical account values and expenses may not be used to estimate the actual ending account balance or expenses you paid for the period. You may use this information to compare the ongoing costs of investing in the Fund and other funds. To do so, compare this 5% hypothetical example with the 5% hypothetical examples that appear in the shareholder reports of the other funds. The estimate of expenses does not include any fees or other expenses of any variable annuity or variable life insurance product. If they were, the estimate of expenses you paid during the period would be higher, and your ending account value would be lower.
Please note that the expenses shown in the table are meant to highlight your ongoing costs only and do not reflect any transaction costs. Therefore, the second line of the table is useful in comparing ongoing costs only, and will not help you determine the relative total costs of owning different funds.
Beginning Account Value July 1, 2006
Ending Account Value December 31, 2006
Expenses Paid During Period* July 1, 2006 to December 31, 2006
Initial Class
Actual
$ 1,000.00
$ 1,055.60
$ 3.58
HypotheticalA
$ 1,000.00
$ 1,021.73
$ 3.52
Service Class
Actual
$ 1,000.00
$ 1,054.90
$ 4.09
HypotheticalA
$ 1,000.00
$ 1,021.22
$ 4.02
Service Class 2
Actual
$ 1,000.00
$ 1,054.20
$ 4.87
HypotheticalA
$ 1,000.00
$ 1,020.47
$ 4.79
Investor Class
Actual
$ 1,000.00
$ 1,055.00
$ 4.20
HypotheticalA
$ 1,000.00
$ 1,021.12
$ 4.13
A5% return per year before expenses
*Expenses are equal to each Class' annualized expense ratio (shown in the table below); multiplied by the average account value over the period, multiplied by 184/365 (to reflect the one-half year period).
Aracruz Celulose SA (PN-B) sponsored ADR (non-vtg.)
100
6,124
Cathay Forest Products Corp. (a)
40,100
19,603
Glatfelter
100
1,550
International Forest Products Ltd. (Interfor) Class A (sub. vtg.) (a)
9,100
56,114
Lee & Man Paper Manufacturing Ltd. (d)
10,646,000
26,141,779
Pope Resources, Inc. LP
100
3,432
Shandong Chenming Paper Holdings Ltd. (B Shares)
100
57
Sino-Forest Corp. (a)
1,034,400
6,946,271
Votorantim Celulose e Papel SA sponsored ADR (non-vtg.)
450,800
8,840,188
42,015,118
TOTAL MATERIALS
870,941,148
TELECOMMUNICATION SERVICES - 2.5%
Diversified Telecommunication Services - 2.3%
Cogent Communications Group, Inc. (a)
100
1,622
Level 3 Communications, Inc. (a)
8,390,300
46,985,680
Pipex Communications PLC (a)
100
25
PT Indosat Tbk sponsored ADR
100
3,855
PT Telkomunikasi Indonesia Tbk sponsored ADR
100
4,560
Qwest Communications International, Inc. (a)
782,900
6,552,873
Verizon Communications, Inc.
3,019,004
112,427,709
165,976,324
Wireless Telecommunication Services - 0.2%
America Movil SA de CV Series L sponsored ADR
106,500
4,815,930
American Tower Corp. Class A (a)
100
3,728
MTN Group Ltd.
498,100
6,064,506
NII Holdings, Inc. (a)
36
2,320
Philippine Long Distance Telephone Co.
100
5,199
Telemig Celular Participacoes SA sponsored ADR
100
3,825
USA Mobility, Inc.
281,852
6,305,029
Vivo Participacoes SA (PN) sponsored ADR
587,000
2,406,700
19,607,237
TOTAL TELECOMMUNICATION SERVICES
185,583,561
UTILITIES - 1.6%
Electric Utilities - 0.0%
Areva T&D India Ltd.
100
2,372
Common Stocks - continued
Shares
Value (Note 1)
UTILITIES - continued
Electric Utilities - continued
Hawaiian Electric Industries, Inc.
100
$ 2,715
Korea Electric Power Corp. sponsored ADR
100
2,271
7,358
Gas Utilities - 0.7%
AGL Resources, Inc.
847,400
32,972,334
China Gas Holdings Ltd.
2,000
399
Xinao Gas Holdings Ltd.
12,576,000
14,227,890
47,200,623
Independent Power Producers & Energy Traders - 0.9%
AES Corp. (a)
2,543,900
56,067,556
Black Hills Corp.
184,806
6,826,734
International Power PLC sponsored ADR
100
7,581
Malakoff BHD
375,200
1,074,127
NTPC Ltd.
59,000
182,557
Ormat Technologies, Inc.
100
3,682
64,162,237
Multi-Utilities - 0.0%
Sechilienne-Sidec
30,557
1,685,865
Veolia Environnement sponsored ADR
100
7,526
1,693,391
Water Utilities - 0.0%
Eastern Water Resources Development & Management PCL (For.Reg.)
100
16
Guangdong Investment Ltd.
2,000
903
Puncak Niaga Holding BHD
100
87
1,006
TOTAL UTILITIES
113,064,615
TOTAL COMMON STOCKS
(Cost $5,955,047,670)
7,225,477,167
Nonconvertible Preferred Stocks - 0.0%
Shares
Value (Note 1)
CONSUMER DISCRETIONARY - 0.0%
Household Durables - 0.0%
Fedders Corp. Series A, 8.60% (a)
5
$ 27
TOTAL NONCONVERTIBLE PREFERRED STOCKS
(Cost $119)
27
Money Market Funds - 2.3%
Fidelity Cash Central Fund, 5.37% (b)
51,631,369
51,631,369
Fidelity Securities Lending Cash Central Fund, 5.38% (b)(c)
120,041,289
120,041,289
TOTAL MONEY MARKET FUNDS
(Cost $171,672,658)
171,672,658
TOTAL INVESTMENT PORTFOLIO - 101.2%
(Cost $6,126,720,447)
7,397,149,852
NET OTHER ASSETS - (1.2)%
(88,138,934)
NET ASSETS - 100%
$ 7,309,010,918
Legend
(a) Non-income producing
(b) Affiliated fund that is available only to investment companies and other accounts managed by Fidelity Investments. The rate quoted is the annualized seven-day yield of the fund at period end. A complete unaudited listing of the fund's holdings as of its most recent quarter end is available upon request.
(c) Investment made with cash collateral received from securities on loan.
(d) Security or a portion of the security is on loan at period end.
(e) Affiliated company
(f) Security exempt from registration under Rule 144A of the Securities Act of 1933. These securities may be resold in transactions exempt from registration, normally to qualified institutional buyers. At the end of the period, the value of these securities amounted to $1,141,928 or 0.0% of net assets.
Affiliated Central Funds
Information regarding fiscal year to date income earned by the Fund from investments in Fidelity Central Funds is as follows:
Fund
Income earned
Fidelity Cash Central Fund
$ 25,934,483
Fidelity Securities Lending Cash Central Fund
1,837,476
Total
$ 27,771,959
Other Affiliated Issuers
An affiliated company is a company in which the fund has ownership of at least 5% of the voting securities. Fiscal year to date transactions with companies which are or were affiliates are as follows:
Affiliates
Value, beginning of period
Purchases
Sales Proceeds
Dividend Income
Value, end of period
AGCO Corp.
$ 60,190,525
$ 112,520,726
$ 63,195,093
$ -
$ 178,583,287
Core Laboratories NV
34,897,976
18,376,112
-
-
102,829,500
Eclipsys Corp.
47,063,766
3,920,926
59,813,005
-
-
Harvard Bioscience, Inc.
11,107,409
-
4,260,150
-
-
IMPCO Technologies, Inc.
9,268,848
-
4,105,721
-
-
Internap Network Services Corp.
-
37,846,752
-
-
44,130,594
Open Solutions, Inc.
25,264,922
25,120,958
64,600,336
-
-
Parker Drilling Co.
59,364,645
40,213,226
41,425,376
-
-
ResCare, Inc.
28,261,042
7,118,620
16,984,070
-
-
Stratagene Corp.
14,472,128
-
8,526,404
-
-
Strategic Diagnostics, Inc.
5,392,660
30,264
4,409,478
-
-
Symbion, Inc.
-
30,023,512
7,986,891
-
-
Total
$ 295,283,921
$ 275,171,096
$ 275,306,524
$ -
$ 325,543,381
Other Information
Distribution of investments by country of issue, as a percentage of total net assets, is as follows:
United States of America
71.7%
Canada
6.1%
Cayman Islands
4.6%
Japan
4.2%
Netherlands
2.8%
United Kingdom
1.1%
Bermuda
1.1%
India
1.0%
Hong Kong
1.0%
Others (individually less than 1%)
6.4%
100.0%
See accompanying notes which are an integral part of the financial statements.
Annual Report
VIP Mid Cap Portfolio
Financial Statements
Statement of Assets and Liabilities
December 31, 2006
Assets
Investment in securities, at value (including securities loaned of $115,737,464) - See accompanying schedule:
Unaffiliated issuers (cost $5,758,291,216)
$ 6,899,933,813
Fidelity Central Funds (cost $171,672,658)
171,672,658
Other affiliated issuers (cost $196,756,573)
325,543,381
Total Investments (cost $6,126,720,447)
$ 7,397,149,852
Cash
188
Foreign currency held at value (cost $1,589,333)
1,595,299
Receivable for investments sold
54,780,387
Receivable for fund shares sold
665,052
Dividends receivable
4,678,305
Interest receivable
2,019,579
Prepaid expenses
33,784
Other receivables
469,523
Total assets
7,461,391,969
Liabilities
Payable for investments purchased
$ 25,035,210
Payable for fund shares redeemed
937,910
Accrued management fee
3,458,275
Distribution fees payable
1,077,211
Other affiliated payables
523,893
Other payables and accrued expenses
1,307,263
Collateral on securities loaned, at value
120,041,289
Total liabilities
152,381,051
Net Assets
$ 7,309,010,918
Net Assets consist of:
Paid in capital
$ 5,336,265,843
Undistributed net investment income
27,410,326
Accumulated undistributed net realized gain (loss) on investments and foreign currency transactions
675,522,445
Net unrealized appreciation (depreciation) on investments and assets and liabilities in foreign currencies
1,269,812,304
Net Assets
$ 7,309,010,918
Statement of Assets and Liabilities - continued
December 31, 2006
Initial Class: Net Asset Value, offering price and redemption price per share ($1,352,385,147 ÷ 38,893,178 shares)
$ 34.77
Service Class: Net Asset Value, offering price and redemption price per share ($1,091,396,235 ÷ 31,551,223 shares)
$ 34.59
Service Class 2: Net Asset Value, offering price and redemption price per share ($4,701,583,325 ÷ 137,257,572 shares)
$ 34.25
Investor Class: Net Asset Value, offering price and redemption price per share ($163,646,211 ÷ 4,717,884 shares)
$ 34.69
See accompanying notes which are an integral part of the financial statements.
Annual Report
Fund Name Financial Statements - continued
Statement of Operations
Year ended December 31, 2006
Investment Income
Dividends
$ 56,462,379
Interest
43,513
Income from Fidelity Central Funds (including $1,837,476 from security lending)
27,771,959
Total income
84,277,851
Expenses
Management fee
$ 38,457,884
Transfer agent fees
4,729,431
Distribution fees
11,671,761
Accounting and security lending fees
1,248,607
Custodian fees and expenses
1,015,526
Independent trustees' compensation
24,795
Registration fees
26,819
Audit
94,638
Legal
123,058
Miscellaneous
860,772
Total expenses before reductions
58,253,291
Expense reductions
(1,341,410)
56,911,881
Net investment income (loss)
27,365,970
Realized and Unrealized Gain (Loss)
Net realized gain (loss) on:
Investment securities:
Unaffiliated issuers (net of foreign taxes of $1,498,285)
659,167,953
Other affiliated issuers
29,663,729
Foreign currency transactions
230,231
Total net realized gain (loss)
689,061,913
Change in net unrealized appreciation (depreciation) on:
Investment securities (net of decrease in deferred foreign taxes of $2,036,942)
41,087,086
Assets and liabilities in foreign currencies
(1,273)
Total change in net unrealized appreciation (depreciation)
41,085,813
Net gain (loss)
730,147,726
Net increase (decrease) in net assets resulting from operations
$ 757,513,696
Statement of Changes in Net Assets
Year ended December 31, 2006
Year ended December 31, 2005
Increase (Decrease) in Net Assets
Operations
Net investment income (loss)
$ 27,365,970
$ 16,088,209
Net realized gain (loss)
689,061,913
739,133,164
Change in net unrealized appreciation (depreciation)
41,085,813
79,632,320
Net increase (decrease) in net assets resulting from operations
757,513,696
834,853,693
Distributions to shareholders from net investment income
(14,545,563)
-
Distributions to shareholders from net realized gain
(746,524,101)
(69,737,263)
Total distributions
(761,069,664)
(69,737,263)
Share transactions - net increase (decrease)
1,451,992,833
1,095,215,324
Total increase (decrease) in net assets
1,448,436,865
1,860,331,754
Net Assets
Beginning of period
5,860,574,053
4,000,242,299
End of period (including undistributed net investment income of $27,410,326 and undistributed net investment income of $15,998,697, respectively)
$ 7,309,010,918
$ 5,860,574,053
See accompanying notes which are an integral part of the financial statements.
VIP Mid Cap Portfolio
Financial Highlights - Initial Class
Years ended December 31,
2006
2005
2004
2003I
2002
Selected Per-Share Data
Net asset value, beginning of period
$ 35.11
$ 30.18
$ 24.16
$ 17.51
$ 19.60
Income from Investment Operations
Net investment income (loss) C
.19
.16 F
.01
- H
.09
Net realized and unrealized gain (loss)
3.93
5.28
6.01
6.73
(2.00)
Total from investment operations
4.12
5.44
6.02
6.73
(1.91)
Distributions from net investment income
(.13)
-
-
(.08)
(.18)
Distributions from net realized gain
(4.33)
(.51)
-
-
-
Total distributions
(4.46)
(.51)
-
(.08)
(.18)
Net asset value, end of period
$ 34.77
$ 35.11
$ 30.18
$ 24.16
$ 17.51
Total Return A, B
12.70%
18.30%
24.92%
38.64%
(9.82)%
Ratios to Average Net Assets D, G
Expenses before reductions
.68%
.69%
.71%
.70%
.70%
Expenses net of fee waivers, if any
.68%
.69%
.71%
.70%
.70%
Expenses net of all reductions
.66%
.64%
.68%
.68%
.63%
Net investment income (loss)
.58%
.50% F
.03%
-%
.51%
Supplemental Data
Net assets, end of period (000 omitted)
$ 1,352,385
$ 1,276,302
$ 979,533
$ 678,480
$ 499,557
Portfolio turnover rate E
149%
107%
55%
51%
135%
ATotal returns do not reflect charges attributable to your insurance company's separate account. Inclusion of these charges would reduce the total returns shown.
BTotal returns would have been lower had certain expenses not been reduced during the periods shown.
CCalculated based on average shares outstanding during the period.
DFees and expenses of the underlying Fidelity Central Funds are not included in the Fund's expense ratio. The Fund indirectly bears its proportionate share of the expenses of any underlying Fidelity Central Funds.
EAmount does not include the portfolio activity of any underlying Fidelity Central Funds.
FInvestment income per share reflects a special dividend which amounted to $.04 per share. Excluding the special dividend, the ratio of net investment income (loss) to average net assets would have been .36%.
GExpense ratios reflect operating expenses of the class. Expenses before reductions do not reflect amounts reimbursed by the investment adviser or reductions from brokerage service arrangements or other expense offset arrangements and do not represent the amount paid by the class during periods when reimbursements or reductions occur. Expenses net of fee waivers reflect expenses after reimbursement by the investment adviser but prior to reductions from brokerage service arrangements or other expense offset arrangements. Expenses net of all reductions represent the net expenses paid by the class.
HAmount represents less than $.01 per share.
I As the result of a correction made in the classification of distributions received on securities representing realized gains for the year ended December 31, 2003, amounts previously reported have been reclassified. The impact of this correction was a decrease in net investment loss of $0.01 per share and a corresponding decrease in net realized and unrealized gain (loss). The ratio of net investment loss to average net assets decreased from (0.04)% to 0.00%. The reclassification had no impact on total net assets or total return of the class.
Financial Highlights - Service Class
Years ended December 31,
2006
2005
2004
2003H
2002
Selected Per-Share Data
Net asset value, beginning of period
$ 34.95
$ 30.07
$ 24.10
$ 17.46
$ 19.54
Income from Investment Operations
Net investment income (loss) C
.16
.12 F
(.02)
(.02)
.08
Net realized and unrealized gain (loss)
3.91
5.27
5.99
6.72
(2.00)
Total from investment operations
4.07
5.39
5.97
6.70
(1.92)
Distributions from net investment income
(.10)
-
-
(.06)
(.16)
Distributions from net realized gain
(4.33)
(.51)
-
-
-
Total distributions
(4.43)
(.51)
-
(.06)
(.16)
Net asset value, end of period
$ 34.59
$ 34.95
$ 30.07
$ 24.10
$ 17.46
Total Return A, B
12.59%
18.20%
24.77%
38.52%
(9.90)%
Ratios to Average Net Assets D, G
Expenses before reductions
.78%
.79%
.81%
.80%
.80%
Expenses net of fee waivers, if any
.78%
.79%
.81%
.80%
.80%
Expenses net of all reductions
.76%
.74%
.78%
.78%
.73%
Net investment income (loss)
.48%
.40% F
(.07)%
(.10)%
.41%
Supplemental Data
Net assets, end of period (000 omitted)
$ 1,091,396
$ 990,561
$ 819,412
$ 580,179
$ 378,264
Portfolio turnover rate E
149%
107%
55%
51%
135%
A Total returns do not reflect charges attributable to your insurance company's separate account. Inclusion of these charges would reduce the total returns shown.
B Total returns would have been lower had certain expenses not been reduced during the periods shown.
C Calculated based on average shares outstanding during the period.
D Fees and expenses of the underlying Fidelity Central Funds are not included in the Fund's expense ratio. The Fund indirectly bears its proportionate share of the expenses of any underlying Fidelity Central Funds.
E Amount does not include the portfolio activity of any underlying Fidelity Central Funds.
F Investment income per share reflects a special dividend which amounted to $.04 per share. Excluding the special dividend, the ratio of net investment income (loss) to average net assets would have been .26%.
G Expense ratios reflect operating expenses of the class. Expenses before reductions do not reflect amounts reimbursed by the investment adviser or reductions from brokerage service arrangements or other expense offset arrangements and do not represent the amount paid by the class during periods when reimbursements or reductions occur. Expenses net of fee waivers reflect expenses after reimbursement by the investment adviser but prior to reductions from brokerage service arrangements or other expense offset arrangements. Expenses net of all reductions represent the net expenses paid by the class.
H As the result of a correction made in the classification of distributions received on securities representing realized gains for the year ended December 31, 2003, amounts previously reported have been reclassified. The impact of this correction was a decrease in net investment loss of $0.01 per share and a corresponding decrease in net realized and unrealized gain (loss). The ratio of net investment loss to average net assets decreased from (0.14)% to (0.10)%. The reclassification had no impact on total net assets or total return of the class.
See accompanying notes which are an integral part of the financial statements.
Annual Report
Fund Name Financial Statements - continued
Financial Highlights - Service Class 2
Years ended December 31,
2006
2005
2004
2003H
2002
Selected Per-Share Data
Net asset value, beginning of period
$ 34.67
$ 29.88
$ 23.98
$ 17.39
$ 19.49
Income from Investment Operations
Net investment income (loss) C
.11
.08 F
(.06)
(.05)
.05
Net realized and unrealized gain (loss)
3.87
5.22
5.96
6.69
(1.99)
Total from investment operations
3.98
5.30
5.90
6.64
(1.94)
Distributions from net investment income
(.07)
-
-
(.05)
(.16)
Distributions from net realized gain
(4.33)
(.51)
-
-
-
Total distributions
(4.40)
(.51)
-
(.05)
(.16)
Net asset value, end of period
$ 34.25
$ 34.67
$ 29.88
$ 23.98
$ 17.39
Total Return A, B
12.40%
18.02%
24.60%
38.31%
(10.02)%
Ratios to Average Net Assets D, G
Expenses before reductions
.93%
.94%
.96%
.95%
.95%
Expenses net of fee waivers, if any
.93%
.94%
.96%
.95%
.95%
Expenses net of all reductions
.91%
.89%
.93%
.93%
.88%
Net investment income (loss)
.33%
.26% F
(.22)%
(.25)%
.25%
Supplemental Data
Net assets, end of period (000 omitted)
$ 4,701,583
$ 3,542,952
$ 2,201,298
$ 1,177,574
$ 520,933
Portfolio turnover rate E
149%
107%
55%
51%
135%
A Total returns do not reflect charges attributable to your insurance company's separate account. Inclusion of these charges would reduce the total returns shown.
B Total returns would have been lower had certain expenses not been reduced during the periods shown.
C Calculated based on average shares outstanding during the period.
D Fees and expenses of the underlying Fidelity Central Funds are not included in the Fund's expense ratio. The Fund indirectly bears its proportionate share of the expenses of any underlying Fidelity Central Funds.
E Amount does not include the portfolio activity of any underlying Fidelity Central Funds.
F Investment income per share reflects a special dividend which amounted to $.05 per share. Excluding the special dividend, the ratio of net investment income (loss) to average net assets would have been .11%.
G Expense ratios reflect operating expenses of the class. Expenses before reductions do not reflect amounts reimbursed by the investment adviser or reductions from brokerage service arrangements or other expense offset arrangements and do not represent the amount paid by the class during periods when reimbursements or reductions occur. Expenses net of fee waivers reflect expenses after reimbursement by the investment adviser but prior to reductions from brokerage service arrangements or other expense offset arrangements. Expenses net of all reductions represent the net expenses paid by the class.
H As the result of a correction made in the classification of distributions received on securities representing realized gains for the year ended December 31, 2003, amounts previously reported have been reclassified. The impact of this correction was a decrease in net investment loss of $0.01 per share and a corresponding decrease in net realized and unrealized gain (loss). The ratio of net investment loss to average net assets decreased from (0.29)% to (0.25)%. The reclassification had no impact on total net assets or total return of the class.
Financial Highlights - Investor Class
Years ended December 31,
2006
2005I
Selected Per-Share Data
Net asset value, beginning of period
$ 35.08
$ 31.81
Income from Investment Operations
Net investment income (loss) E
.15
.07 H
Net realized and unrealized gain (loss)
3.93
3.20
Total from investment operations
4.08
3.27
Distributions from net investment income
(.14)
-
Distributions from net realized gain
(4.33)
-
Total distributions
(4.47)
-
Net asset value, end of period
$ 34.69
$ 35.08
Total ReturnB, C, D
12.59%
10.28%
Ratios to Average Net AssetsF, J
Expenses before reductions
.80%
.86% A
Expenses net of fee waivers, if any
.80%
.86% A
Expenses net of all reductions
.78%
.80% A
Net investment income (loss)
.45%
.45% A, H
Supplemental Data
Net assets, end of period (000 omitted)
$ 163,646
$ 50,760
Portfolio turnover rate G
149%
107%
A Annualized
B Total returns for periods of less than one year are not annualized.
C Total returns do not reflect charges attributable to your insurance company's separate account. Inclusion of these charges would reduce the total returns shown.
D Total returns would have been lower had certain expenses not been reduced during the periods shown.
E Calculated based on average shares outstanding during the period.
F Fees and expenses of the underlying Fidelity Central Funds are not included in the Fund's expense ratio. The Fund indirectly bears its proportionate share of the expenses of any underlying Fidelity Central Funds.
G Amount does not include the portfolio activity of any underlying Fidelity Central Funds.
H Investment income per share reflects a special dividend which amounted to $.04 per share. Excluding the special dividend, the ratio of net investment income (loss) to average net assets would have been .17%.
IFor the period July 21, 2005 (commencement of sale of shares) to December 31, 2005.
JExpense ratios reflect operating expenses of the class. Expenses before reductions do not reflect amounts reimbursed by the investment adviser or reductions from brokerage service arrangements or other expense offset arrangements and do not represent the amount paid by the class during periods when reimbursements or reductions occur. Expense ratios before reductions for start-up periods may not be representative of longer-term operating periods. Expenses net of fee waivers reflect expenses after reimbursement by the investment adviser but prior to reductions from brokerage service arrangements or other expense offset arrangements. Expenses net of all reductions represent the net expenses paid by the class.
See accompanying notes which are an integral part of the financial statements.
VIP Mid Cap Portfolio
Notes to Financial Statements
For the period ended December 31, 2006
1. Significant Accounting Policies.
VIP Mid Cap Portfolio (the Fund) is a fund of Variable Insurance Products Fund III(the trust) and is authorized to issue an unlimited number of shares. The trust is registered under the Investment Company Act of 1940, as amended (the 1940 Act), as an open-end management investment company organized as a Massachusetts business trust. Shares of the Fund may only be purchased by insurance companies for the purpose of funding variable annuity or variable life insurance contracts. The Fund offers the following classes of shares: Initial Class shares, Service Class shares, Service Class 2 shares and Investor Class shares. All classes have equal rights and voting privileges, except for matters affecting a single class. Investment income, realized and unrealized capital gains and losses, the common expenses of the Fund, and certain fund-level expense reductions, if any, are allocated on a pro rata basis to each class based on the relative net assets of each class to the total net assets of the Fund. Each class differs with respect to transfer agent and distribution and service plan fees incurred. Certain expense reductions also differ by class.
The Fund's investments in emerging markets can be subject to social, economic, regulatory, and political uncertainties and can be extremely volatile. The Fund may invest in Fidelity Central Funds which are open-end investment companies available to investment companies and other accounts managed by Fidelity Management & Research Company (FMR) and its affiliates. The financial statements have been prepared in conformity with accounting principles generally accepted in the United States of America, which require management to make certain estimates and assumptions at the date of the financial statements. The following summarizes the significant accounting policies of the Fund, which are also consistently followed by the Fidelity Central Funds:
Security Valuation. Investments are valued and net asset value (NAV) per share is calculated (NAV calculation) as of the close of business of the New York Stock Exchange (NYSE), normally 4:00 p.m. Eastern time. Wherever possible, the Fund uses independent pricing services approved by the Board of Trustees to value its investments.
Equity securities, including restricted securities, for which market quotations are readily available, are valued at the last reported sale price or official closing price as reported by an independent pricing service on the primary market or exchange on which they are traded. In the event there were no sales during the day or closing prices are not available, securities are valued at the last quoted bid price. Investments in open-end mutual funds, including the Fidelity Central Funds, are valued at their closing net asset value each business day. Short-term securities with remaining maturities of sixty days or less for which quotations are not readily available are valued at amortized cost, which approximates value.
When current market prices or quotations are not readily available or do not accurately reflect fair value, valuations may be determined in accordance with procedures adopted by the Board of Trustees. For example, when developments occur between the close of a market and the close of the NYSE that may materially affect the value of some or all of the securities, or when trading in a security is halted, those securities may be fair valued. Factors used in the determination of fair value may include monitoring news to identify significant market or security specific events such as changes in the value of U.S. securities markets, reviewing developments in foreign markets and evaluating the performance of ADRs, futures contracts and exchange-traded funds. Because the Fund's utilization of fair value pricing depends on market activity, the frequency with which fair value pricing is used can not be predicted and may be utilized to a significant extent. The value of securities used for NAV calculation under fair value pricing may differ from published prices for the same securities.
Foreign Currency. The Fund uses foreign currency contracts to facilitate transactions in foreign-denominated securities. Losses from these transactions may arise from changes in the value of the foreign currency or if the counterparties do not perform under the contracts' terms.
Foreign-denominated assets, including investment securities, and liabilities are translated into U.S. dollars at the exchange rate at period end. Purchases and sales of investment securities, income and dividends received and expenses denominated in foreign currencies are translated into U.S. dollars at the exchange rate in effect on the transaction date.
The effects of exchange rate fluctuations on investments are included with the net realized and unrealized gain (loss) on investment securities. Other foreign currency transactions resulting in realized and unrealized gain (loss) are disclosed separately.
Investment Transactions and Income. Security transactions, including the Fund's investment activity in the Fidelity Central Funds, are accounted for as of trade date. Gains and losses on securities sold are determined on the basis of identified cost and may include proceeds received from litigation. Dividend income is recorded on the ex-dividend date, except for certain dividends from foreign securities where the ex-dividend date may have passed, which are recorded as soon as the Fund is informed of the ex-dividend date. Non-cash dividends included in dividend income, if any, are recorded at the fair market value of the securities received. Distributions received on securities that represent a return of capital or capital gain are recorded as a reduction of cost of investments and/or as a realized gain. The Fund estimates the components of distributions received that may be considered return of capital distributions or capital gain distributions. Interest income and income distributions from the Fidelity Central Funds are accrued as earned, with any income distributions receivable as of period end included in Interest Receivable on the Statement of Assets and Liabilities. Interest income includes coupon interest and amortization of premium and accretion of discount on debt securities. Investment income is recorded net of foreign taxes withheld where recovery of such taxes is uncertain.
Annual Report
Notes to Financial Statements - continued
1. Significant Accounting Policies - continued
Expenses. Most expenses of the trust can be directly attributed to a fund. Expenses which cannot be directly attributed are apportioned among each Fund in the trust. Expense estimates are accrued in the period to which they relate and adjustments are made when actual amounts are known.
Income Tax Information and Distributions to Shareholders. Each year, the Fund intends to qualify as a regulated investment company by distributing all of its taxable income and realized gains under Subchapter M of the Internal Revenue Code. As a result, no provision for income taxes is required in the accompanying financial statements. Foreign taxes are provided for based on the Fund's understanding of the tax rules and rates that exist in the foreign markets in which it invests.
Distributions are recorded on the ex-dividend date. Income dividends and capital gain distributions are declared separately for each class. Income and capital gain distributions are determined in accordance with income tax regulations, which may differ from generally accepted accounting principles.
Capital accounts within the financial statements are adjusted for permanent book-tax differences. These adjustments have no impact on net assets or the results of operations. Temporary book-tax differences will reverse in a subsequent period.
Book-tax differences are primarily due to foreign currency transactions, passive foreign investment companies (PFIC), certain foreign taxes, partnerships and losses deferred due to wash sales.
The tax-basis components of distributable earnings and the federal tax cost as of period end were as follows:
Unrealized appreciation
$ 1,389,711,194
Unrealized depreciation
(141,440,104)
Net unrealized appreciation (depreciation)
1,248,271,090
Undistributed ordinary income
32,265,135
Undistributed long-term capital gain
692,208,848
Cost for federal income tax purposes
$ 6,148,878,762
The tax character of distributions paid was as follows:
December 31, 2006
December 31, 2005
Ordinary Income
$ 82,411,391
$ -
Long-term Capital Gains
678,658,273
69,737,263
Total
$ 761,069,664
$ 69,737,263
New Accounting Pronouncements. In July 2006, Financial Accounting Standards Board Interpretation No. 48, Accounting for Uncertainty in Income Taxes - an interpretation of FASB Statement 109 (FIN 48), was issued and is effective on the last business day of the semiannual reporting period for fiscal years beginning after December 15, 2006. FIN 48 sets forth a threshold for financial statement recognition, measurement and disclosure of a tax position taken or expected to be taken on a tax return. Management is currently evaluating the impact, if any, the adoption of FIN 48 will have on the Fund's net assets, results of operations and financial statement disclosures.
In addition, in September 2006, Statement of Financial Accounting Standards No. 157, Fair Value Measurements (SFAS 157), was issued and is effective for fiscal years beginning after November 15, 2007. SFAS 157 defines fair value, establishes a framework for measuring fair value and expands disclosures about fair value measurements. Management is currently evaluating the impact the adoption of SFAS 157 will have on the Fund's financial statement disclosures.
2. Operating Policies.
Repurchase Agreements. FMR has received an Exemptive Order from the Securities and Exchange Commission (the SEC) which permits the Fund and other affiliated entities of FMR to transfer uninvested cash balances into joint trading accounts which are then invested in repurchase agreements. The Fund may also invest directly with institutions in repurchase agreements. Repurchase agreements are collateralized by government or non-government securities. Upon settlement date, collateral is held in segregated accounts with custodian banks and may be obtained in the event of a default of the counterparty. The Fund monitors, on a daily basis, the value of the collateral to ensure it is at least equal to the principal amount of the repurchase agreement (including accrued interest). In the event of a default by the counterparty, realization of the collateral proceeds could be delayed, during which time the value of the collateral may decline.
Restricted Securities. The Fund may invest in securities that are subject to legal or contractual restrictions on resale. These securities generally may be resold in transactions exempt from registration or to the public if the securities are registered. Disposal of these securities may involve time-consuming negotiations and expense, and prompt sale at an acceptable price may be difficult. Information regarding restricted securities is included at the end of the Fund's Schedule of Investments.
VIP Mid Cap Portfolio
3. Purchases and Sales of Investments.
Purchases and sales of securities, other than short-term securities, aggregated $10,421,370,454 and $9,435,736,545, respectively.
4. Fees and Other Transactions with Affiliates.
Management Fee. FMR and its affiliates provide the Fund with investment management related services for which the Fund pays a monthly management fee. The management fee is the sum of an individual fund fee rate that is based on an annual rate of .30% of the Fund's average net assets and a group fee rate that averaged .27% during the period. The group fee rate is based upon the average net assets of all the mutual funds advised by FMR. The group fee rate decreases as assets under management increase and increases as assets under management decrease. For the period, the total annual management fee rate was .57% of the Fund's average net assets.
Distribution and Service Plan. In accordance with Rule 12b-1 of the 1940 Act, the Fund has adopted separate 12b-1 Plans for each Service Class of shares. Each Service Class pays Fidelity Distributors Corporation (FDC), an affiliate of FMR, a service fee. For the period, the service fee is based on an annual rate of .10% of Service Class' average net assets and .25% of Service Class 2's average net assets.
For the period, each class paid FDC the following amounts, all of which were re-allowed to insurance companies for the distribution of shares and providing shareholder support services:
Service Class
$ 1,061,196
Service Class 2
10,610,565
$ 11,671,761
Transfer Agent Fees. Fidelity Investments Institutional Operations Company, Inc. (FIIOC), an affiliate of FMR, is the fund's transfer, dividend disbursing, and shareholder servicing agent. FIIOC receives an asset-based fee with respect to each class. Each class with the exception of Investor Class pays a transfer agent fee, excluding out of pocket expenses, equal to an annual rate of .07% of their month end net assets. Investor Class pays a monthly asset-based transfer agent fee of .18% of its month end net assets. The total transfer agent fees paid by each class to FIIOC, including out of pocket expenses, were as follows:
Initial Class
$ 930,743
Service Class
712,185
Service Class 2
2,865,959
Investor Class
220,544
$ 4,729,431
Accounting and Security Lending Fees. Fidelity Service Company, Inc. (FSC), an affiliate of FMR, maintains the Fund's accounting records. The accounting fee is based on the level of average net assets for the month. Under a separate contract, FSC administers the security lending program. The security lending fee is based on the number and duration of lending transactions.
Investments in Fidelity Central Funds. The Fund may invest in Fidelity Central Funds. The Fund's Schedule of Investments lists each of the Fidelity Central Funds as an investment of the Fund but does not include the underlying holdings of each Fidelity Central Fund. As an Investing Fund, the Fund indirectly bears its proportionate share of the expenses of the underlying Fidelity Central Funds. A complete unaudited list of holdings for each Fidelity Central Fund is available upon request. In addition, the financial statements of the Fidelity Central Funds, which are not covered by the Fund's Report of Independent Registered Public Accounting Firm, are available on the EDGAR Database on the SEC's web site, www.sec.gov, or upon request.
The Money Market Central Funds seek preservation of capital and current income and are managed by Fidelity Investments Money Management, Inc. (FIMM), an affiliate of FMR.
Brokerage Commissions. The Fund placed a portion of its portfolio transactions with brokerage firms which are affiliates of the investment adviser. The commissions paid to these affiliated firms were $187,360 for the period.
5. Committed Line of Credit.
The Fund participates with other funds managed by FMR in a $4.2 billion credit facility (the "line of credit") to be utilized for temporary or emergency purposes to fund shareholder redemptions or for other short-term liquidity purposes. The Fund has agreed to pay commitment fees on its pro rata portion of the line of credit, which amounted to $17,579 and is reflected in Miscellaneous Expense on the Statement of Operations. During the period, there were no borrowings on this line of credit.
Annual Report
Notes to Financial Statements - continued
6. Security Lending.
The Fund lends portfolio securities from time to time in order to earn additional income. On the settlement date of the loan, the Fund receives collateral (in the form of U.S. Treasury obligations, letters of credit and/or cash) against the loaned securities and maintains collateral in an amount not less than 100% of the market value of the loaned securities during the period of the loan. The market value of the loaned securities is determined at the close of business of the Fund and any additional required collateral is delivered to the Fund on the next business day. If the borrower defaults on its obligation to return the securities loaned because of insolvency or other reasons, a fund could experience delays and costs in recovering the securities loaned or in gaining access to the collateral. Any cash collateral received is invested in the Fidelity Securities Lending Cash Central Fund. The value of loaned securities and cash collateral at period end are disclosed on the Fund's Statement of Assets and Liabilities. Security lending income represents the income earned on investing cash collateral, less fees and expenses associated with the loan, plus any premium payments that may be received on the loan of certain types of securities. Security lending income is presented in the Statement of Operations as a component of income from Fidelity Central Funds.
7. Expense Reductions.
Many of the brokers with whom FMR places trades on behalf of the Fund provided services to the Fund in addition to trade execution. These services included payments of certain expenses on behalf of the Fund totaling $1,214,338 for the period. In addition, through arrangements with the fund's custodian, credits realized as a result of uninvested cash balances were used to reduce the Fund's expenses. During the period, these credits reduced the Fund's custody expenses by $27,789.
8. Other.
The Fund's organizational documents provide former and current trustees and officers with a limited indemnification against liabilities arising in connection with the performance of their duties to the Fund. In the normal course of business, the Fund may also enter into contracts that provide general indemnifications. The Fund's maximum exposure under these arrangements is unknown as this would be dependent on future claims that may be made against the Fund. The risk of material loss from such claims is considered remote.
At the end of the period, FMR or its affiliates were the owners of record of 14% of the total outstanding shares of the Fund and one otherwise unaffiliated shareholder was the owner of record of 30% of the total outstanding shares of the Fund.
The United States Securities and Exchange Commission ("SEC") is conducting an investigation of FMR (covering the years 2002 to 2004) arising from gifts, gratuities and business entertainment provided by certain brokers to certain individuals who were employed on FMR's domestic equity trading desk during that period. FMR is in discussions with the SEC staff regarding the possible resolution of the matter, but as of period-end no final resolution has been reached.
In December 2006, the Independent Trustees completed their own investigation of the matter with the assistance of independent counsel. The Independent Trustees and FMR agree that, despite the absence of proof that the Fidelity mutual funds experienced diminished execution quality as a result of the improper receipt of gifts and business entertainment, the conduct at issue was serious and is worthy of redress. Accordingly, the Independent Trustees have requested and FMR has agreed to pay $42 million to Fidelity mutual funds, plus interest to be determined at the time that payment is made. A method of allocating this payment among the funds has not yet been determined. The total payment to the Fund is not anticipated to have a material impact on the Fund's net assets. In addition, FMR reimbursed related legal expenses which are recorded in the accompanying Statement of Operations as an expense reduction.
VIP Mid Cap Portfolio
9. Distributions to Shareholders.
Distributions to shareholders of each class were as follows:
Years ended December 31,
2006
2005
From net investment income
Initial Class
$ 4,750,962
$ -
Service Class
2,713,194
-
Service Class 2
6,828,025
-
Investor Class
253,382
-
Total
$ 14,545,563
$ -
From net realized gain
Initial Class
$ 160,864,588
$ 16,950,069
Service Class
122,489,425
13,863,435
Service Class 2
455,271,711
38,923,759
Investor Class
7,898,377
-
Total
$ 746,524,101
$ 69,737,263
10. Share Transactions.
Transactions for each class of shares were as follows:
Shares
Dollars
Years ended December 31,
2006
2005 A
2006
2005 A
Initial Class
Shares sold
7,331,123
8,278,806
$ 248,761,453
$ 262,377,760
Reinvestment of distributions
5,122,659
562,378
165,615,550
16,950,069
Shares redeemed
(9,913,376)
(4,945,419)
(328,496,358)
(156,829,367)
Net increase (decrease)
2,540,406
3,895,765
$ 85,880,645
$ 122,498,462
Service Class
Shares sold
3,284,402
2,901,802
$ 109,868,879
$ 90,813,964
Reinvestment of distributions
3,889,488
461,807
125,202,620
13,863,435
Shares redeemed
(3,965,782)
(2,267,171)
(132,567,032)
(70,846,869)
Net increase (decrease)
3,208,108
1,096,438
$ 102,504,467
$ 33,830,530
Service Class 2
Shares sold
35,248,708
32,986,707
$ 1,172,363,016
$ 1,030,668,046
Reinvestment of distributions
14,476,809
1,305,290
462,099,736
38,923,759
Shares redeemed
(14,670,648)
(5,764,389)
(480,746,935)
(179,268,926)
Net increase (decrease)
35,054,869
28,527,608
$ 1,153,715,817
$ 890,322,879
Investor Class
Shares sold
3,254,309
1,448,928
$ 109,672,374
$ 48,632,982
Reinvestment of distributions
252,531
-
8,151,693
-
Shares redeemed
(235,856)
(2,028)
(7,932,163)
(69,529)
Net increase (decrease)
3,270,984
1,446,900
$ 109,891,904
$ 48,563,453
A Share transactions for Investor Class are for the period July 21, 2005 (commencement of sale of shares) to December 31, 2005.
Annual Report
Report of Independent Registered Public Accounting Firm
To the Trustees of Variable Insurance Products Fund III and the Shareholders of VIP Mid Cap Portfolio:
In our opinion, the accompanying statement of assets and liabilities, including the schedule of investments, and the related statements of operations and of changes in net assets and the financial highlights present fairly, in all material respects, the financial position of VIP Mid Cap Portfolio (a fund of Variable Insurance Products Fund III) at December 31, 2006, the results of its operations for the year then ended, the changes in its net assets for each of the two years in the period then ended and the financial highlights for each of the periods indicated, in conformity with accounting principles generally accepted in the United States of America. These financial statements and financial highlights (hereafter referred to as "financial statements") are the responsibility of the VIP Mid Cap Portfolio's management; our responsibility is to express an opinion on these financial statements based on our audits. We conducted our audits of these financial statements in accordance with the standards of the Public Company Accounting Oversight Board (United States). Those standards require that we plan and perform the audit to obtain reasonable assurance about whether the financial statements are free of material misstatement. An audit includes examining, on a test basis, evidence supporting the amounts and disclosures in the financial statements, assessing the accounting principles used and significant estimates made by management, and evaluating the overall financial statement presentation. We believe that our audits, which included confirmation of securities at December 31, 2006 by correspondence with the custodian and brokers, provide a reasonable basis for our opinion.
/s/ PricewaterhouseCoopers LLP
PricewaterhouseCoopers LLP
Boston, Massachusetts
February 12, 2007
Annual Report
Trustees and Officers
The Trustees, Member of the Advisory Board, and executive officers of the trust and fund, as applicable, are listed below. The Board of Trustees governs the fund and is responsible for protecting the interests of shareholders. The Trustees are experienced executives who meet periodically throughout the year to oversee the fund's activities, review contractual arrangements with companies that provide services to the fund, and review the fund's performance. Each of the Trustees oversees 348 funds advised by FMR or an affiliate.
The Trustees hold office without limit in time except that (a) any Trustee may resign; (b) any Trustee may be removed by written instrument, signed by at least two-thirds of the number of Trustees prior to such removal; (c) any Trustee who requests to be retired or who has become incapacitated by illness or injury may be retired by written instrument signed by a majority of the other Trustees; and (d) any Trustee may be removed at any special meeting of shareholders by a two-thirds vote of the outstanding voting securities of the trust. Each Trustee who is not an interested person (as defined in the 1940 Act) (Independent Trustee), shall retire not later than the last day of the calendar year in which his or her 72nd birthday occurs. The Independent Trustees may waive this mandatory retirement age policy with respect to individual Trustees. The executive officers and Advisory Board Member hold office without limit in time, except that any officer and Advisory Board Member may resign or may be removed by a vote of a majority of the Trustees at any regular meeting or any special meeting of the Trustees. Except as indicated, each individual has held the office shown or other offices in the same company for the past five years.
The fund's statement of additional information (SAI) includes more information about the Trustees. To request a free copy, call Fidelity at 1-877-208-0098.
Interested Trustees*:
Correspondence intended for each Trustee who is an interested person may be sent to Fidelity Investments, 82 Devonshire Street, Boston, Massachusetts 02109.
Name, Age; Principal Occupation
Edward C. Johnson 3d (76)
Year of Election or Appointment: 1986
Mr. Johnson is Chairman of the Board of Trustees. Mr. Johnson serves as President (2006-present), Chief Executive Officer, Chairman, and a Director of FMR Corp.; Chairman and a Director of FMR; Chairman and a Director of Fidelity Research & Analysis Company (FRAC); Chairman and a Director of Fidelity Investments Money Management, Inc.; and Chairman (2001-present) and a Director of FMR Co., Inc. In addition, Mr. Johnson serves as Chairman and Director of Fidelity International Limited (FIL).
Robert L. Reynolds (54)
Year of Election or Appointment: 2003
Mr. Reynolds is President and a Director of FMR (2005-present), Fidelity Investments Money Management, Inc. (2005-present), and FMR Co., Inc. (2005-present). Mr. Reynolds also serves as Vice Chairman (2006-present), a Director (2003-present), and Chief Operating Officer of FMR Corp. and a Director of Strategic Advisers, Inc. (2005-present). He also serves on the Board at Fidelity Investments Canada, Ltd.
* Trustees have been determined to be "Interested Trustees" by virtue of, among other things, their affiliation with the trust or various entities under common control with FMR.
Independent Trustees:
Correspondence intended for each Independent Trustee (that is, the Trustees other than the Interested Trustees) may be sent to Fidelity Investments, P.O. Box 55235, Boston, Massachusetts 02205-5235.
Name, Age; Principal Occupation
Dennis J. Dirks (58)
Year of Election or Appointment: 2005
Prior to his retirement in May 2003, Mr. Dirks was Chief Operating Officer and a member of the Board of The Depository Trust & Clearing Corporation (DTCC) (1999-2003). He also served as President, Chief Operating Officer, and Board member of The Depository Trust Company (DTC) (1999-2003) and President and Board member of the National Securities Clearing Corporation (NSCC) (1999-2003). In addition, Mr. Dirks served as Chief Executive Officer and Board member of the Government Securities Clearing Corporation (2001-2003) and Chief Executive Officer and Board member of the Mortgage-Backed Securities Clearing Corporation (2001-2003). Mr. Dirks also serves as a Trustee and a member of the Finance Committee of Manhattan College (2005-present) and a Trustee and a member of the Finance Committee of AHRC of Nassau County (2006-present).
Albert R. Gamper, Jr. (64)
Year of Election or Appointment: 2006
Prior to his retirement in December 2004, Mr. Gamper served as Chairman of the Board of CIT Group Inc. (commercial finance). During his tenure with CIT Group Inc. Mr. Gamper served in numerous senior management positions, including Chairman (1987-1989; 1999-2001; 2002-2004), Chief Executive Officer (1987-2004), and President (1989-2002). He currently serves as a member of the Board of Directors of Public Service Enterprise Group (utilities, 2001-present), Chairman of the Board of Governors, Rutgers University (2004-present), and Chairman of the Board of Saint Barnabas Health Care System.
George H. Heilmeier (70)
Year of Election or Appointment: 2004
Dr. Heilmeier is Chairman Emeritus of Telcordia Technologies (communication software and systems), where prior to his retirement, he served as company Chairman and Chief Executive Officer. He currently serves on the Boards of Directors of The Mitre Corporation (systems engineering and information technology support for the government), and HRL Laboratories (private research and development, 2004-present). He is Chairman of the General Motors Science & Technology Advisory Board and a Life Fellow of the Institute of Electrical and Electronics Engineers (IEEE). Dr. Heilmeier is a member of the Defense Science Board and the National Security Agency Advisory Board. He is also a member of the National Academy of Engineering, the American Academy of Arts and Sciences, and the Board of Overseers of the School of Engineering and Applied Science of the University of Pennsylvania. Previously, Dr. Heilmeier served as a Director of TRW Inc. (automotive, space, defense, and information technology, 1992-2002), Compaq (1994-2002), Automatic Data Processing, Inc. (ADP) (technology-based business outsourcing, 1995-2002), INET Technologies Inc. (telecommunications network surveillance, 2001-2004), and Teletech Holdings (customer management services). He is the recipient of the 2005 Kyoto Prize in Advanced Technology for his invention of the liquid crystal display, and a member of the Consumer Electronics Hall of Fame.
James H. Keyes (66)
Year of Election or Appointment: 2007
Prior to his retirement in 2003, Mr. Keyes was Chairman, President, and Chief Executive Officer of Johnson Controls, Inc. (automotive supplier, 1993-2003). He currently serves as a member of the boards of LSI Logic Corporation (semiconductor technologies), Navistar International Corporation (manufacture and sale of trucks, buses, and diesel engines, 2002-present), and Pitney Bowes, Inc. (integrated mail, messaging, and document management solutions).
Marie L. Knowles (60)
Year of Election or Appointment: 2001
Prior to Ms. Knowles' retirement in June 2000, she served as Executive Vice President and Chief Financial Officer of Atlantic Richfield Company (ARCO) (diversified energy, 1996-2000). From 1993 to 1996, she was a Senior Vice President of ARCO and President of ARCO Transportation Company. She served as a Director of ARCO from 1996 to 1998. She currently serves as a Director of Phelps Dodge Corporation (copper mining and manufacturing) and McKesson Corporation (healthcare service, 2002-present). Ms. Knowles is a Trustee of the Brookings Institution and the Catalina Island Conservancy and also serves as a member of the Advisory Board for the School of Engineering of the University of Southern California.
Ned C. Lautenbach (62)
Year of Election or Appointment: 2000
Mr. Lautenbach is Chairman of the Independent Trustees (2006-present). Mr. Lautenbach has been a partner of Clayton, Dubilier & Rice, Inc. (private equity investment firm) since September 1998. Previously, Mr. Lautenbach was with the International Business Machines Corporation (IBM) from 1968 until his retirement in 1998. Mr. Lautenbach serves as a Director of Sony Corporation (2006-present) and Eaton Corporation (diversified industrial) as well as the Philharmonic Center for the Arts in Naples, Florida. He also is a member of the Board of Trustees of Fairfield University (2005-present), as well as a member of the Council on Foreign Relations.
Cornelia M. Small (62)
Year of Election or Appointment: 2005
Ms. Small is a member (2000-present) and Chairperson (2002-present) of the Investment Committee, and a member (2002-present) of the Board of Trustees of Smith College. Previously, she served as Chief Investment Officer (1999-2000), Director of Global Equity Investments (1996-1999), and a member of the Board of Directors of Scudder, Stevens & Clark (1990-1997) and Scudder Kemper Investments (1997-1999). In addition, Ms. Small served as Co-Chair (2000-2003) of the Annual Fund for the Fletcher School of Law and Diplomacy.
William S. Stavropoulos (67)
Year of Election or Appointment: 2001
Mr. Stavropoulos is Chairman Emeritus of the Board of Directors of The Dow Chemical Company. Since joining The Dow Chemical Company in 1967, Mr. Stavropoulos served in numerous senior management positions, including President (1993-2000; 2002-2003), CEO (1995-2000; 2002-2004), and Chairman of the Executive Committee (2000-2004). Currently, he is a Director of NCR Corporation (data warehousing and technology solutions), BellSouth Corporation (telecommunications), Chemical Financial Corporation, Maersk Inc. (industrial conglomerate, 2002-present), and Metalmark Capital (private equity investment firm, 2005-present). He also serves as a member of the Board of Trustees of the American Enterprise Institute for Public Policy Research. In addition, Mr. Stavropoulos is a member of The Business Council, J.P. Morgan International Council and the University of Notre Dame Advisory Council for the College of Science.
Kenneth L. Wolfe (67)
Year of Election or Appointment: 2005
Prior to his retirement in 2001, Mr. Wolfe was Chairman and Chief Executive Officer of Hershey Foods Corporation (1993-2001). He currently serves as a member of the boards of Adelphia Communications Corporation (2003-present), Bausch & Lomb, Inc., and Revlon Inc. (2004-present).
Advisory Board Member and Executive Officers:
Correspondence intended for each executive officer and Mr. Lynch may be sent to Fidelity Investments, 82 Devonshire Street, Boston, Massachusetts 02109.
Name, Age; Principal Occupation
Peter S. Lynch (62)
Year of Election or Appointment: 2003
Member of the Advisory Board of Variable Insurance Products III. Mr. Lynch is Vice Chairman and a Director of FMR, and Vice Chairman (2001-present) and a Director of FMR Co., Inc. Previously, Mr. Lynch served as a Trustee of the Fidelity funds (1990-2003). In addition, he serves as a Trustee of Boston College and as the Chairman of the Inner-City Scholarship Fund.
Kimberley H. Monasterio (43)
Year of Election or Appointment: 2007
President and Treasurer of VIP Mid Cap. Ms. Monasterio also serves as President and Treasurer of other Fidelity funds (2007-present) and is an employee of FMR (2004-present). Previously, Ms. Monasterio served as Deputy Treasurer of the Fidelity funds (2004-2006). Before joining Fidelity Investments, Ms. Monasterio served as Treasurer (2000-2004) and Chief Financial Officer (2002-2004) of the Franklin Templeton Funds and Senior Vice President of Franklin Templeton Services, LLC (2000-2004).
Dwight D. Churchill (53)
Year of Election or Appointment: 2005
Vice President of VIP Mid Cap. Mr. Churchill also serves as Vice President of certain Equity Funds (2005-present). Mr. Churchill is Executive Vice President of FMR (2005-present) and FMR Co., Inc. (2005-present). Previously, Mr. Churchill served as Senior Vice President of Fidelity Investments Money Management, Inc. (2005-2006), Head of Fidelity's Fixed-Income Division (2000-2005), Vice President of Fidelity's Money Market Funds (2000-2005), Vice President of Fidelity's Bond Funds, and Senior Vice President of FMR.
Bruce T. Herring (41)
Year of Election or Appointment: 2006
Vice President of VIP Mid Cap. Mr. Herring also serves as Vice President of certain Equity Funds (2006-present). Mr. Herring is Senior Vice President of FMR (2006-present) and Vice President of FMR Co., Inc. (2001-present). Previously, Mr. Herring served as a portfolio manager for Fidelity U.S. Equity Funds (2001-2005).
Thomas J. Allen (46)
Year of Election or Appointment: 2001
Vice President of VIP Mid Cap. Mr. Allen also serves as Vice President of another fund advised by FMR. Prior to assuming his current responsibilities, Mr. Allen worked as a research analyst and portfolio manager. Mr. Allen also serves as Vice President of FMR and FMR Co., Inc. (2002).
Eric D. Roiter (58)
Year of Election or Appointment: 1998
Secretary of VIP Mid Cap. He also serves as Secretary of other Fidelity funds; Vice President, General Counsel, and Secretary of FMR Co., Inc. (2001-present) and FMR; Assistant Secretary of Fidelity Management & Research (U.K.) Inc. (2001-present), Fidelity Research & Analysis Company (2001-present), and Fidelity Investments Money Management, Inc. (2001-present). Mr. Roiter is an Adjunct Member, Faculty of Law, at Boston College Law School (2003-present). Previously, Mr. Roiter served as Vice President and Secretary of Fidelity Distributors Corporation (FDC) (1998-2005).
Stuart Fross (47)
Year of Election or Appointment: 2003
Assistant Secretary of VIP Mid Cap. Mr. Fross also serves as Assistant Secretary of other Fidelity funds (2003-present), Vice President and Secretary of FDC (2005-present), and is an employee of FMR.
R. Stephen Ganis (40)
Year of Election or Appointment: 2006
Anti-Money Laundering (AML) officer of VIP Mid Cap. Mr. Ganis also serves as AML officer of other Fidelity funds (2006-present) and FMR Corp. (2003-present). Before joining Fidelity Investments, Mr. Ganis practiced law at Goodwin Procter, LLP (2000-2002).
Joseph B. Hollis (58)
Year of Election or Appointment: 2006
Chief Financial Officer of VIP Mid Cap. Mr. Hollis also serves as Chief Financial Officer of other Fidelity funds. Mr. Hollis is President of Fidelity Pricing and Cash Management Services (FPCMS) (2005-present). Mr. Hollis also serves as President and Director of Fidelity Service Company, Inc. (2006-present). Previously, Mr. Hollis served as Senior Vice President of Cash Management Services (1999-2002) and Investment Management Operations (2002-2005).
Kenneth A. Rathgeber (59)
Year of Election or Appointment: 2004
Chief Compliance Officer of VIP Mid Cap. Mr. Rathgeber also serves as Chief Compliance Officer of other Fidelity funds (2004-present) and Executive Vice President of Risk Oversight for Fidelity Investments (2002-present). He is Chief Compliance Officer of FMR (2005-present), FMR Co., Inc. (2005-present), Fidelity Management & Research (U.K.) Inc. (2005-present), Fidelity Research & Analysis Company (2005-present), Fidelity Investments Money Management, Inc. (2005-present), and Strategic Advisers, Inc. (2005-present). Previously, Mr. Rathgeber served as Executive Vice President and Chief Operating Officer for Fidelity Investments Institutional Services Company, Inc. (1998-2002).
Bryan A. Mehrmann (45)
Year of Election or Appointment: 2005
Deputy Treasurer of VIP Mid Cap. Mr. Mehrmann also serves as Deputy Treasurer of other Fidelity funds (2005-present) and is an employee of FMR. Previously, Mr. Mehrmann served as Vice President of Fidelity Investments Institutional Services Group (FIIS)/Fidelity Investments Institutional Operations Corporation, Inc. (FIIOC) Client Services (1998-2004).
Kenneth B. Robins (37)
Year of Election or Appointment: 2005
Deputy Treasurer of VIP Mid Cap. Mr. Robins also serves as Deputy Treasurer of other Fidelity funds (2005-present) and is an employee of FMR (2004-present). Before joining Fidelity Investments, Mr. Robins worked at KPMG LLP, where he was a partner in KPMG's department of professional practice (2002-2004) and a Senior Manager (1999-2000). In addition, Mr. Robins served as Assistant Chief Accountant, United States Securities and Exchange Commission (2000-2002).
Robert G. Byrnes (40)
Year of Election or Appointment: 2005
Assistant Treasurer of VIP Mid Cap. Mr. Byrnes also serves as Assistant Treasurer of other Fidelity funds (2005-present) and is an employee of FMR (2005-present). Previously, Mr. Byrnes served as Vice President of FPCMS (2003-2005). Before joining Fidelity Investments, Mr. Byrnes worked at Deutsche Asset Management where he served as Vice President of the Investment Operations Group (2000-2003).
John H. Costello (60)
Year of Election or Appointment: 1998
Assistant Treasurer of VIP Mid Cap. Mr. Costello also serves as Assistant Treasurer of other Fidelity funds and is an employee of FMR.
Peter L. Lydecker (52)
Year of Election or Appointment: 2004
Assistant Treasurer of VIP Mid Cap. Mr. Lydecker also serves as Assistant Treasurer of other Fidelity funds (2004) and is an employee of FMR.
Mark Osterheld (51)
Year of Election or Appointment: 2002
Assistant Treasurer of VIP Mid Cap. Mr. Osterheld also serves as Assistant Treasurer of other Fidelity funds (2002) and is an employee of FMR.
Gary W. Ryan (48)
Year of Election or Appointment: 2005
Assistant Treasurer of VIP Mid Cap. Mr. Ryan also serves as Assistant Treasurer of other Fidelity funds (2005-present) and is an employee of FMR (2005-present). Previously, Mr. Ryan served as Vice President of Fund Reporting in FPCMS (1999-2005).
Salvatore Schiavone (41)
Year of Election or Appointment: 2005
Assistant Treasurer of VIP Mid Cap. Mr. Schiavone also serves as Assistant Treasurer of other Fidelity funds (2005-present) and is an employee of FMR (2005-present). Before joining Fidelity Investments, Mr. Schiavone worked at Deutsche Asset Management, where he most recently served as Assistant Treasurer (2003-2005) of the Scudder Funds and Vice President and Head of Fund Reporting (1996-2003).
Annual Report
Distributions
The Board of Trustees of VIP Mid Cap Portfolio voted to pay to shareholders of record at the opening of business on record date, the following distributions per share derived from capital gains realized from sales of portfolio securities, and dividends derived from net investment income:
Pay Date
Record Date
Dividends
Capital Gains
Initial Class
02/09/07
02/09/07
$0.171
$3.291
Service Class
02/09/07
02/09/07
$0.139
$3.291
Service Class 2
02/09/07
02/09/07
$0.097
$3.291
Investor Class
02/09/07
02/09/07
$0.150
$3.291
The fund hereby designates as a capital gain dividend with respect to the taxable year ended December 31, 2006, $680,706,289, or, if subsequently determined to be different, the net capital gain of such year.
Initial Class designates 19%, Service Class designates 20%, Service Class 2 designates 21%, and Investor Class designates 18% of the dividends distributed in February 2006 as qualifying for the dividends-received deduction for corporate shareholders.
The fund will notify shareholders in January 2007 of amounts for use in preparing 2006 income tax returns.
Annual Report
Proxy Voting Results
A special meeting of the fund's shareholders was held on November 15, 2006. The results of votes taken among shareholders on the proposal before them are reported below. Each vote reported represents one dollar of net asset value held on the record date for the meeting.
PROPOSAL 1
To elect a Board of Trustees. A
# of Votes
% of Votes
Dennis J. Dirks
Affirmative
8,022,573,906.52
96.057
Withheld
329,291,624.43
3.943
TOTAL
8,351,865,530.95
100.000
Albert R. Gamper, Jr.
Affirmative
8,017,939,119.36
96.002
Withheld
333,926,411.59
3.998
TOTAL
8,351,865,530.95
100.000
Robert M. Gates
Affirmative
8,011,581,068.50
95.926
Withheld
340,284,462.45
4.074
TOTAL
8,351,865,530.95
100.000
George H. Heilmeier
Affirmative
8,000,846,196.79
95.797
Withheld
351,019,334.16
4.203
TOTAL
8,351,865,530.95
100.000
Edward C. Johnson 3d
Affirmative
7,992,112,301.22
95.693
Withheld
359,753,229.73
4.307
TOTAL
8,351,865,530.95
100.000
Stephen P. Jonas
Affirmative
8,019,883,742.95
96.025
Withheld
331,981,788.00
3.975
TOTAL
8,351,865,530.95
100.000
James H. KeyesB
Affirmative
8,015,436,547.06
95.972
Withheld
336,428,983.89
4.028
TOTAL
8,351,865,530.95
100.000
Marie L. Knowles
Affirmative
8,015,361,874.49
95.971
Withheld
336,503,656.46
4.029
TOTAL
8,351,865,530.95
100.000
Ned C. Lautenbach
Affirmative
8,018,503,793.25
96.009
Withheld
333,361,737.70
3.991
TOTAL
8,351,865,530.95
100.000
# of Votes
% of Votes
William O. McCoy
Affirmative
8,000,170,571.19
95.789
Withheld
351,694,959.76
4.211
TOTAL
8,351,865,530.95
100.000
Robert L. Reynolds
Affirmative
8,020,815,676.67
96.036
Withheld
331,049,854.28
3.964
TOTAL
8,351,865,530.95
100.000
Cornelia M. Small
Affirmative
8.020,146,516.32
96.028
Withheld
331,719,014.63
3.972
TOTAL
8,351,865,530.95
100.000
William S. Stavropoulos
Affirmative
8,009,250,640.78
95.898
Withheld
342,614,890.17
4.102
TOTAL
8,351,865,530.95
100.000
Kenneth L. Wolfe
Affirmative
8,013,187,941.55
95.945
Withheld
338,677,589.40
4.055
TOTAL
8,351,865,530.95
100.000
ADenotes trust-wide proposal and voting results.
BEffective on or about January 1, 2007.
Annual Report
Board Approval of Investment Advisory Contracts and Management Fees
VIP Mid Cap Portfolio
Each year, typically in July, the Board of Trustees, including the Independent Trustees (together, the Board), votes on the renewal of the management contract and sub-advisory agreements (together, the Advisory Contracts) for the fund. The Board, assisted by the advice of fund counsel and Independent Trustees' counsel, requests and considers a broad range of information throughout the year.
The Board meets regularly each month except August and takes into account throughout the year matters bearing on Advisory Contracts. The Board, acting directly and through its separate committees, considers at each of its meetings factors that are relevant to the annual renewal of the fund's Advisory Contracts, including the services and support provided to the fund and its shareholders. At the time of the renewal, the Board had 12 standing committees, each composed of Independent Trustees with varying backgrounds, to which the Board has assigned specific subject matter responsibilities in order to enhance effective decision-making by the Board. Each committee has adopted a written charter outlining the structure and purposes of the committee. One such committee, the Equity Contract Committee, meets periodically as needed throughout the year to consider matters specifically related to the annual renewal of Advisory Contracts. The committee requests and receives information on, and makes recommendations to the Independent Trustees concerning, the approval and annual review of the Advisory Contracts.
At its July 2006 meeting, the Board of Trustees, including the Independent Trustees, unanimously determined to renew the Advisory Contracts for the fund. In reaching its determination, the Board considered all factors it believed relevant, including (i) the nature, extent, and quality of the services to be provided to the fund and its shareholders (including the investment performance of the fund); (ii) the competitiveness of the management fee and total expenses of the fund; (iii) the total costs of the services to be provided by and the profits to be realized by the investment adviser and its affiliates from the relationship with the fund; (iv) the extent to which economies of scale would be realized as the fund grows; and (v) whether fee levels reflect these economies of scale, if any, for the benefit of fund shareholders.
In determining whether to renew the Advisory Contracts for the fund, the Board ultimately reached a determination, with the assistance of fund counsel and Independent Trustees' counsel, that the renewal of the Advisory Contracts and the compensation to be received by Fidelity under the management contract is consistent with Fidelity's fiduciary duty under applicable law. In addition to evaluating the specific factors noted above, the Board, in reaching its determination, is aware that shareholders in the fund have a broad range of investment choices available to them, including a wide choice among mutual funds offered by competitors to Fidelity, and that the fund's shareholders, with the opportunity to review and weigh the disclosure provided by the fund in its prospectus and other public disclosures, have chosen to invest in this fund, managed by Fidelity.
Nature, Extent, and Quality of Services Provided. The Board considered staffing within the investment adviser, FMR, and the sub-advisers (together, the Investment Advisers), including the background of the fund's portfolio manager and the fund's investment objective and discipline. The Independent Trustees also had discussions with senior management of Fidelity's investment operations and investment groups. The Board considered the structure of the portfolio manager compensation program and whether this structure provides appropriate incentives.
Resources Dedicated to Investment Management and Support Services. The Board reviewed the size, education, and experience of the Investment Advisers' investment staff, their use of technology, and the Investment Advisers' approach to recruiting, training, and retaining portfolio managers and other research, advisory, and management personnel. The Board considered Fidelity's extensive global research capabilities that enable the Investment Advisers to aggregate data from various sources in an effort to produce positive investment results. The Board noted that Fidelity's analysts have access to a variety of technological tools that enable them to perform both fundamental and quantitative analysis and to specialize in various disciplines. The Board also considered that Fidelity's portfolio managers and analysts have access to daily portfolio attribution that allows for monitoring of a fund's portfolio, as well as an electronic communication system that provides immediate real-time access to research concerning issuers and credit enhancers.
Shareholder and Administrative Services. The Board considered (i) the nature, extent, quality, and cost of administrative, distribution, and shareholder services performed by the Investment Advisers and their affiliates under the Advisory Contracts and under separate agreements covering transfer agency, pricing and bookkeeping, and securities lending services for the fund; (ii) the nature and extent of the Investment Advisers' supervision of third party service providers, principally custodians and subcustodians; and (iii) the resources devoted to, and the record of compliance with, the fund's compliance policies and procedures. The Board reviewed the allocation of fund brokerage, including allocations to brokers affiliated with the Investment Advisers, the use of brokerage commissions to pay fund expenses, and the use of "soft" commission dollars to pay for research services. The Board also considered that Fidelity voluntarily pays for market data out of its own resources.
The Board noted that the growth of fund assets across the complex allows Fidelity to reinvest in the development of services designed to enhance the value or convenience of the Fidelity funds as investment vehicles. These services include 24-hour access to account information and market information through phone representatives and over the Internet, and investor education materials and asset allocation tools.
Investment in a Large Fund Family. The Board considered the benefits to shareholders of investing in a Fidelity fund, including the benefits of investing in a fund that is part of a large family of funds offering a variety of investment disciplines and providing for a large variety of mutual fund investor services. The Board noted that, since the last Advisory Contract renewals in July 2005, Fidelity has taken a number of actions that benefited particular funds, including (i) dedicating additional resources to investment research and to restructure the investment research teams; (ii) voluntarily entering into contractual arrangements with certain brokers pursuant to which Fidelity pays for research products and services separately out of its own resources, rather than bundling with fund commissions; (iii) launching the Fidelity Advantage Class of its five Spartan stock index funds and three Spartan bond index funds, which is a lower-fee class available to shareholders with higher account balances; (iv) contractually agreeing to impose expense limitations on Fidelity U.S. Bond Index Fund and reducing the fund's initial investment minimum; and (v) offering shareholders of each of the Fidelity Institutional Money Market Funds the privilege of exchanging shares of the fund for shares of other Fidelity funds.
Annual Report
Board Approval of Investment Advisory Contracts and Management Fees - continued
Investment Performance and Compliance. The Board considered whether the fund has operated within its investment objective, as well as its record of compliance with its investment restrictions. It also reviewed the fund's absolute investment performance for each class (except Investor Class), as well as the fund's relative investment performance for each class (except Investor Class) measured against (i) a broad-based securities market index, and (ii) a peer group of mutual funds deemed appropriate by the Board over multiple periods. The following charts considered by the Board show, over the one-, three-, and five-year periods ended December 31, 2005, the cumulative total returns of Service Class 2 and Initial Class of the fund, the cumulative total returns of a broad-based securities market index ("benchmark"), and a range of cumulative total returns of a peer group of mutual funds identified by Lipper Inc. as having an investment objective similar to that of the fund. The returns of Service Class 2 and Initial Class represent the performance of classes with the highest and lowest 12b-1 fees, respectively (not necessarily with the highest and lowest total expenses). (Investor Class of the fund, which has no 12b-1 fee, had less than one year of performance as of December 31, 2005.) The box within each chart shows the 25th percentile return (bottom of box) and the 75th percentile return (top of box) of the Lipper peer group. Returns shown above the box are in the first quartile and returns shown below the box are in the fourth quartile. The percentage beaten numbers noted below each chart correspond to the percentile box and represent the percentage of funds in the Lipper peer group whose performance was equal to or lower than that of the class indicated.
VIP Mid Cap Portfolio
The Board reviewed the fund's relative investment performance against its Lipper peer group and stated that the performance of Initial Class of the fund was in the first quartile for all the periods shown. The Board also stated that the relative investment performance of Initial Class of the fund compared favorably to its benchmark for all the periods shown. The Board considered that the variations in performance among the fund's classes reflect the variations in class expenses, which result in lower performance for higher expense classes. The Board also reviewed the fund's relative investment performance against a peer group defined by Morningstar.
The Board considered that FMR has taken steps to refocus and strengthen equity research, equity portfolio management, and compliance. The Board noted with favor FMR's reorganization of its senior management team in 2005 and FMR's dedication of additional resources to investment research, and participated in the process that led to those changes.
Based on its review, and giving particular weight to the nature and quality of the resources dedicated by the Investment Advisers to maintain and improve relative performance, the Board concluded that the nature, extent, and quality of the services provided to the fund will benefit the fund's shareholders, particularly in light of the Board's view that the fund's shareholders benefit from investing in a fund that is part of a large family of funds offering a variety of investment disciplines and services.
Competitiveness of Management Fee and Total Fund Expenses. The Board considered the fund's management fee and total expenses compared to "mapped groups" of competitive funds and classes. Fidelity creates "mapped groups" by combining similar Lipper investment objective categories that have comparable management fee characteristics. Combining Lipper investment objective categories aids the Board's management fee and total expense comparisons by broadening the competitive group used for comparison and by reducing the number of universes to which various Fidelity funds are compared.
VIP Mid Cap Portfolio
The Board considered two proprietary management fee comparisons for the 12-month periods shown in the chart below. The group of Lipper funds used by the Board for management fee comparisons is referred to below as the "Total Mapped Group" and, for the reasons explained above, is broader than the Lipper peer group used by the Board for performance comparisons. The Total Mapped Group comparison focuses on a fund's standing relative to the total universe of comparable funds available to investors, in terms of gross management fees before expense reimbursements or caps. "TMG %" represents the percentage of funds in the Total Mapped Group that had management fees that were lower than the fund's. For example, a TMG % of 6% means that 94% of the funds in the Total Mapped Group had higher management fees than the fund. The "Asset-Size Peer Group" (ASPG) comparison focuses on a fund's standing relative to non-Fidelity funds similar in size to the fund within the Total Mapped Group. The ASPG represents at least 15% of the funds in the Total Mapped Group with comparable asset size and management fee characteristics, subject to a minimum of 50 funds (or all funds in the Total Mapped Group if fewer than 50). Additional information, such as the ASPG quartile in which the fund's management fee ranked, is also included in the chart and considered by the Board.
VIP Mid Cap Portfolio
The Board noted that the fund's management fee ranked below the median of its Total Mapped Group and below the median of its ASPG for 2005.
Based on its review, the Board concluded that the fund's management fee was fair and reasonable in light of the services that the fund receives and the other factors considered.
In its review of each class's total expenses, the Board considered the fund's management fee as well as other fund or class expenses, as applicable, such as transfer agent fees, pricing and bookkeeping fees, fund-paid 12b-1 fees, and custodial, legal, and audit fees. The Board also noted the effects of any waivers and reimbursements on fees and expenses. As part of its review, the Board also considered current and historical total expenses of each class of the fund compared to competitive fund median expenses. Each class of the fund is compared to those funds and classes in the Total Mapped Group (used by the Board for management fee comparisons) that have a similar sales load structure.
The Board noted that the total expenses of each class ranked below its competitive median for 2005.
In its review of total expenses, the Board also considered Fidelity fee structures and other information on clients that FMR and its affiliates service in other competitive markets, such as other mutual funds advised or subadvised by FMR or its affiliates, pension plan clients, and other institutional clients.
Based on its review, the Board concluded that the total expenses of each class of the fund were reasonable in light of the services that the fund and its shareholders receive and the other factors considered.
Costs of the Services and Profitability. The Board considered the revenues earned and the expenses incurred by Fidelity in conducting the business of developing, marketing, distributing, managing, administering and servicing the fund and its shareholders. The Board also considered the level of Fidelity's profits in respect of all the Fidelity funds.
Annual Report
Board Approval of Investment Advisory Contracts and Management Fees - continued
On an annual basis, FMR presents to the Board Fidelity's profitability for the fund. Fidelity calculates the profitability for each fund, as well as aggregate profitability for groups of Fidelity funds and all Fidelity funds, using a series of detailed revenue and cost allocation methodologies which originate with the audited books and records of Fidelity. The Audit Committee of the Board reviews any significant changes from the prior year's methodologies.
PricewaterhouseCoopers LLP (PwC), independent registered accounting firm and auditor to Fidelity and certain Fidelity funds, has been engaged annually by the Board as part of the Board's assessment of the results of Fidelity's profitability analysis. PwC's engagement includes the review and assessment of Fidelity's methodologies used in determining the revenues and expenses attributable to Fidelity's mutual fund business, and completion of agreed-upon procedures surrounding the mathematical accuracy of fund profitability and its conformity to allocation methodologies. After considering PwC's reports issued under the engagement and information provided by Fidelity, the Board believes that while other allocation methods may also be reasonable, Fidelity's profitability methodologies are reasonable in all material respects.
The Board has also reviewed Fidelity's non-fund businesses and any fall-out benefits related to the mutual fund business as well as cases where Fidelity's affiliates may benefit from or be related to the fund's business.
The Board considered the costs of the services provided by and the profits realized by Fidelity in connection with the operation of the fund and determined that the amount of profit is a fair entrepreneurial profit for the management of the fund.
Economies of Scale. The Board considered whether there have been economies of scale in respect of the management of the Fidelity funds, whether the Fidelity funds (including the fund) have appropriately benefited from any such economies of scale, and whether there is potential for realization of any further economies of scale. The Board considered the extent to which the fund will benefit from economies of scale through increased services to the fund, through waivers or reimbursements, or through fee or expense reductions.
The Board recognized that the fund's management contract incorporates a "group fee" structure, which provides for lower fee rates as total fund assets under FMR's management increase, and for higher fee rates as total fund assets under FMR's management decrease. The Board considered that the group fee is designed to deliver the benefits of economies of scale to fund shareholders when total fund assets increase, even if assets of any particular fund are unchanged or have declined, because some portion of Fidelity's costs are attributable to services provided to all Fidelity funds, and all funds benefit if those costs can be allocated among more assets. The Board concluded that, given the group fee structure, fund shareholders will achieve a certain level of economies of scale as assets under FMR's management increase at the fund complex level, regardless of whether Fidelity achieves any such economies of scale.
The Board further concluded that any potential economies of scale are being shared between fund shareholders and Fidelity in an appropriate manner.
Additional Information Requested by the Board. In order to develop fully the factual basis for consideration of the Advisory Contracts, the Board requested additional information on several topics, including (i) Fidelity's fund profitability methodology and profitability trends within certain funds; (ii) portfolio manager compensation; (iii) the extent to which any economies of scale exist and are shared between the funds and Fidelity; (iv) the total expenses of certain funds and classes relative to competitors, including the extent to which the expenses of certain funds have been or could be capped; (v) fund performance trends; and (vi) Fidelity's fee structures, including use of performance fees.
Based on its evaluation of all of the conclusions noted above, and after considering all material factors, the Board ultimately concluded that the advisory fee structures are fair and reasonable, and that the fund's Advisory Contracts should be renewed.
VIP Mid Cap Portfolio
Annual Report
VIP Mid Cap Portfolio
Annual Report
Investment Adviser
Fidelity Management & Research Company Boston, MA
Investment Sub-Advisers
FMR Co., Inc.
Fidelity Management & Research (U.K.) Inc.
Fidelity Research & Analysis Company (formerly Fidelity Management & Research (Far East) Inc.)
Fidelity Investments Japan Limited
Fidelity International Investment Advisors
Fidelity International Investment Advisors (U.K.) Limited
General Distributor
Fidelity Distributors Corporation Boston, MA
Transfer and Service Agents
Fidelity Investments Institutional Operations Company, Inc. Boston, MA
Fidelity Service Company, Inc. Boston, MA
Custodian
Brown Brothers Harriman & Co. Boston, MA
VIPMID-ANN-0207 1.735273.107
Fidelity® Variable Insurance Products: Value Strategies Portfolio
To view a fund's proxy voting guidelines and proxy voting record for the 12-month period ended June 30, visit www.fidelity.com/proxyvotingresults or visit the Securities and Exchange Commission's (SEC) web site at www.sec.gov. You may also call 1-877-208-0098 to request a free copy of the proxy voting guidelines.
Fidelity Variable Insurance Products are separate account options which are purchased through a variable insurance contract.
Standard & Poor's, S&P and S&P 500 are registered service marks of The McGraw-Hill Companies, Inc. and have been licensed for use by Fidelity Distributors Corporation.
Other third party marks appearing herein are the property of their respective owners.
All other marks appearing herein are registered or unregistered trademarks or service marks of FMR Corp. or an affiliated company.
This report and the financial statements contained herein are submitted for the general information of the shareholders of the fund. This report is not authorized for distribution to prospective investors in the fund unless preceded or accompanied by an effective prospectus.
A fund files its complete schedule of portfolio holdings with the SEC for the first and third quarters of each fiscal year on Form N-Q. Forms N-Q are available on the SEC's web site at http://www.sec.gov. A fund's Forms N-Q may be reviewed and copied at the SEC's Public Reference Room in Washington, DC. Information regarding the operation of the SEC's Public Reference Room may be obtained by calling 1-800-SEC-0330. For a complete list of a fund's portfolio holdings, view the most recent quarterly holdings report, semiannual report, or annual report on Fidelity's web site at http://www.advisor.fidelity.com.
NOT FDIC INSURED· MAY LOSE VALUE· NO BANK GUARANTEE
Neither the fund nor Fidelity Distributors Corporation is a bank.
Semiannual Report
VIP Value Strategies Portfolio
Performance: The Bottom Line
Average annual total return reflects the change in the value of an investment, assuming reinvestment of the class' dividend income and capital gains (the profits earned upon the sale of securities that have grown in value) and assuming a constant rate of performance each year. During periods of reimbursement by Fidelity, a fund's total return will be greater than it would be had the reimbursement not occurred. Performance numbers are net of all underlying fund operating expenses, but do not include any insurance charges imposed by your insurance company's separate account. If performance information included the effect of these additional charges, the total returns would have been lower. How a fund did yesterday is no guarantee of how it will do tomorrow.
Average Annual Total Returns
Periods ended December 31, 2006
Past 1 year
Life of fund A
VIP Value Strategies - Initial Class
16.33%
11.56%
VIP Value Strategies - Service Class B
16.20%
11.44%
VIP Value Strategies - Service Class 2 C
16.09%
11.44%
VIP Value Strategies - Investor Class D
16.18%
11.51%
AFrom February 20, 2002.
B Performance for Service Class shares reflects an asset-based service fee (12b-1 fee).
C Performance for Service Class 2 shares reflects an asset-based service fee (12b-1 fee).
D The initial offering of Investor Class shares took place on July 21, 2005. Returns prior to July 21, 2005 are those of Initial Class.If Investor Class's transfer agent fee had been reflected, returns prior to July 21, 2005 would have been lower.
$10,000 Over Life of Fund
Let's say hypothetically that $10,000 was invested in VIP Value Strategies Portfolio - Initial Class on February 20, 2002, when the fund started. The chart shows how the value of your investment would have changed, and also shows how the Russell Midcap® Value Index performed over the same period.
Annual Report
VIP Value Strategies Portfolio
Management's Discussion of Fund Performance
Comments from Matthew Friedman, Portfolio Manager of VIP Value Strategies Portfolio
U.S. stock markets registered their fourth consecutive year of positive returns in 2006. Among the highlights were the performances of the Dow Jones Industrial AverageSM - a gauge of 30 mega-cap, blue-chip stocks - and the small-cap-oriented Russell 2000® Index, both of which reached new highs. The efforts of the Federal Reserve Board to contain inflation levels also dominated the investment headlines. In all, the Fed hiked short-term interest rates four times, but held rates steady after its June 29 increase, finally pausing after 17 rate hikes over a two-year period. A slowing residential housing market and moderating oil prices - the latter of which hit a record closing high of $77 per barrel in July before falling sharply - also held economic growth in check. For the year overall, the Standard & Poor's 500SM Index was up 15.79%, the Dow advanced 19.05%, the Russell 2000 Index gained 18.37% and the NASDAQ Composite® Index rose 10.39%.
For the 12 months that ended December 31, 2006, the portfolio underperformed the Russell Midcap® Value Index's return of 20.22%. (For specific portfolio performance results, please refer to the performance section of this report.) The fund underperformed the Russell benchmark in part because it was underweighted in real estate investment trusts (REITs), one of the top performing areas of the index. Also, the fund had little-to-no exposure to several strong performing index components, including steelmaker Nucor, ethanol producer Archer-Daniels-Midland and oil driller Kerr-McGee. Some poor performing stocks the fund overweighted also hampered relative performance, such as glass container manufacturer Owens-Illinois and an alternative energy play in coal producer CONSOL Energy. Investments in non-index cruise lines Carnival and Royal Caribbean detracted as well. Overweighting health care, along with some weak stock picks there, also held back performance. On the flip side, a number of the portfolio's top holdings - spread among various sectors - were not found in the index. Within technology, semiconductor maker Trident Microsystems performed well. In capital goods, technology-related high-speed cable manufacturer Belden helped as well, while in energy, drilling equipment producer FMC Technologies boosted performance. Elsewhere, BellSouth helped when AT&T announced it would acquire the company, while retailer OfficeMax, an index component, benefited from a corporate restructuring. Utilities performed very well in the second half of the period, including the fund's investment in out-of-index FPL Group. Some of the stocks I've mentioned were sold from the fund before period end.
The views expressed above reflect those of the portfolio manager(s) only through the end of the period as stated on the cover of this report and do not necessarily represent the views of Fidelity or any other person in the Fidelity organization. Any such views are subject to change at any time based upon market or other conditions and Fidelity disclaims any responsibility to update such views. These views may not be relied on as investment advice and, because investment decisions for a Fidelity fund are based on numerous factors, may not be relied on as an indication of trading intent on behalf of any Fidelity fund.
Annual Report
VIP Value Strategies Portfolio
Shareholder Expense Example
As a shareholder of the Fund, you incur two types of costs: (1) transaction costs, and (2) ongoing costs, including management fees, distribution and/or service (12b-1) fees and other Fund expenses. This Example is intended to help you understand your ongoing costs (in dollars) of investing in the Fund and to compare these costs with the ongoing costs of investing in other mutual funds.
The Example is based on an investment of $1,000 invested at the beginning of the period and held for the entire period (July 1, 2006 to December 31, 2006).
Actual Expenses
The first line of the accompanying table for each class of the Fund provides information about actual account values and actual expenses. You may use the information in this line, together with the amount you invested, to estimate the expenses that you paid over the period. Simply divide your account value by $1,000.00 (for example, an $8,600 account value divided by $1,000.00 = 8.6), then multiply the result by the number in the first line for a class of the Fund under the heading entitled "Expenses Paid During Period" to estimate the expenses you paid on your account during this period. The estimate of expenses does not include any fees or other expenses of any variable annuity or variable life insurance product. If they were, the estimate of expenses you paid during the period would be higher, and your ending account value would be lower.
Hypothetical Example for Comparison Purposes
The second line of the accompanying table for each class of the Fund provides information about hypothetical account values and hypothetical expenses based on a Class' actual expense ratio and an assumed rate of return of 5% per year before expenses, which is not the Class' actual return. The hypothetical account values and expenses may not be used to estimate the actual ending account balance or expenses you paid for the period. You may use this information to compare the ongoing costs of investing in the Fund and other funds. To do so, compare this 5% hypothetical example with the 5% hypothetical examples that appear in the shareholder reports of the other funds. The estimate of expenses does not include any fees or other expenses of any variable annuity or variable life insurance product. If they were, the estimate of expenses you paid during the period would be higher, and your ending account value would be lower.
Please note that the expenses shown in the table are meant to highlight your ongoing costs only and do not reflect any transaction costs. Therefore, the second line of the table is useful in comparing ongoing costs only, and will not help you determine the relative total costs of owning different funds.
Beginning Account Value July 1, 2006
Ending Account Value December 31, 2006
Expenses Paid During Period* July 1, 2006 to December 31, 2006
Initial Class
Actual
$ 1,000.00
$ 1,120.60
$ 3.96
Hypothetical A
$ 1,000.00
$ 1,021.48
$ 3.77
Service Class
Actual
$ 1,000.00
$ 1,120.20
$ 4.49
Hypothetical A
$ 1,000.00
$ 1,020.97
$ 4.28
Service Class 2
Actual
$ 1,000.00
$ 1,120.40
$ 5.29
Hypothetical A
$ 1,000.00
$ 1,020.21
$ 5.04
Investor Class
Actual
$ 1,000.00
$ 1,120.10
$ 4.60
Hypothetical A
$ 1,000.00
$ 1,020.87
$ 4.38
A5% return per year before expenses
* Expenses are equal to each Class' annualized expense ratio (shown in the table below); multiplied by the average account value over the period, multiplied by 184/365 (to reflect the one-half year period).
Annualized Expense Ratio
Initial Class
.74%
Service Class
.84%
Service Class 2
.99%
Investor Class
.86%
Annual Report
VIP Value Strategies Portfolio
Investment Changes
Top Ten Stocks as of December 31, 2006
% of fund's net assets
% of fund's net assets 6 months ago
Entergy Corp.
1.6
0.4
Vornado Realty Trust
1.5
0.3
General Growth Properties, Inc.
1.4
0.5
Edison International
1.4
0.4
Equity Residential (SBI)
1.3
0.3
FPL Group, Inc.
1.2
0.3
BellSouth Corp.
1.1
0.5
Sierra Pacific Resources
1.1
0.0
Altria Group, Inc.
1.1
0.5
AES Corp.
1.0
0.2
12.7
Top Five Market Sectors as of December 31, 2006
% of fund's net assets
% of fund's net assets 6 months ago
Financials
24.4
13.2
Information Technology
16.6
21.6
Consumer Discretionary
13.3
17.9
Utilities
12.7
3.7
Health Care
7.4
11.9
Asset Allocation (% of fund's net assets)
As of December 31, 2006 *
As of June 30, 2006 **
Stocks 98.3%
Stocks 96.7%
Short-Term Investments and Net Other Assets 1.7%
Short-Term Investments and Net Other Assets 3.3%
* Foreign investments
14.9%
** Foreign investments
11.7%
Annual Report
VIP Value Strategies Portfolio
Investments December 31, 2006
Showing Percentage of Net Assets
Common Stocks - 98.3%
Shares
Value (Note 1)
CONSUMER DISCRETIONARY - 13.3%
Auto Components - 0.5%
Amerigon, Inc. (a)
46,700
$ 451,122
Gentex Corp.
124,600
1,938,776
2,389,898
Automobiles - 0.1%
Renault SA
4,200
504,580
Diversified Consumer Services - 0.5%
Apollo Group, Inc. Class A (a)
57,920
2,257,142
Hotels, Restaurants & Leisure - 1.7%
Domino's Pizza, Inc.
74,800
2,094,400
International Game Technology
25,100
1,159,620
McCormick & Schmick's Seafood Restaurants (a)
25,800
620,232
Rare Hospitality International, Inc. (a)
1,400
46,102
Vail Resorts, Inc. (a)
29,400
1,317,708
WMS Industries, Inc. (a)
68,200
2,377,452
7,615,514
Household Durables - 2.9%
Bassett Furniture Industries, Inc.
13,227
216,129
Ethan Allen Interiors, Inc.
60,500
2,184,655
M.D.C. Holdings, Inc.
33,200
1,894,060
Newell Rubbermaid, Inc.
69,000
1,997,550
Snap-On, Inc.
23,700
1,129,068
The Stanley Works
42,700
2,147,383
Whirlpool Corp.
39,500
3,279,290
12,848,135
Leisure Equipment & Products - 0.4%
Eastman Kodak Co. (d)
79,000
2,038,200
Media - 3.7%
Clear Channel Outdoor Holding, Inc. Class A (a)
69,000
1,925,790
Comcast Corp. Class A
26,300
1,113,279
DreamWorks Animation SKG, Inc. Class A (a)
30,600
902,394
Getty Images, Inc. (a)
25,900
1,109,038
Liberty Global, Inc. Class A (a)
67,151
1,957,452
Liberty Media Holding Corp. - Capital Series A (a)
11,900
1,165,962
Live Nation, Inc. (a)
70,139
1,571,114
McGraw-Hill Companies, Inc.
32,900
2,237,858
Naspers Ltd. Class N sponsored ADR
20,500
491,385
News Corp. Class B
52,900
1,177,554
R.H. Donnelley Corp.
49,200
3,086,316
16,738,142
Multiline Retail - 1.1%
Federated Department Stores, Inc.
26,800
1,021,884
Saks, Inc.
80,700
1,438,074
Sears Holdings Corp. (a)
12,700
2,132,711
Tuesday Morning Corp.
23,300
362,315
4,954,984
Shares
Value (Note 1)
Specialty Retail - 1.9%
Home Depot, Inc.
58,600
$ 2,353,376
Lithia Motors, Inc. Class A (sub. vtg.)
7,900
227,204
OfficeMax, Inc.
37,200
1,846,980
PETsMART, Inc.
61,700
1,780,662
RadioShack Corp.
70,900
1,189,702
Select Comfort Corp. (a)(d)
65,800
1,144,262
8,542,186
Textiles, Apparel & Luxury Goods - 0.5%
Carter's, Inc. (a)
82,400
2,101,200
TOTAL CONSUMER DISCRETIONARY
59,989,981
CONSUMER STAPLES - 3.7%
Beverages - 0.3%
SABMiller PLC
49,600
1,141,443
Food & Staples Retailing - 0.8%
Rite Aid Corp. (d)
469,500
2,554,080
Sysco Corp.
33,700
1,238,812
3,792,892
Food Products - 1.2%
Bunge Ltd.
9,700
703,347
Chiquita Brands International, Inc. (d)
44,400
709,068
Nestle SA sponsored ADR
26,800
2,385,200
PAN Fish ASA (a)
1,310,000
1,197,604
Tyson Foods, Inc. Class A
31,500
518,175
5,513,394
Household Products - 0.2%
Central Garden & Pet Co. Class A (a)
17,100
827,982
Tobacco - 1.2%
Altria Group, Inc.
57,000
4,891,740
British American Tobacco PLC sponsored ADR
7,800
441,948
5,333,688
TOTAL CONSUMER STAPLES
16,609,399
ENERGY - 6.3%
Energy Equipment & Services - 2.4%
National Oilwell Varco, Inc. (a)
71,300
4,362,134
Noble Corp.
13,700
1,043,255
Smith International, Inc.
85,300
3,503,271
Transocean, Inc. (a)
22,600
1,828,114
10,736,774
Oil, Gas & Consumable Fuels - 3.9%
Aurora Oil & Gas Corp. (a)
239,759
769,626
Cabot Oil & Gas Corp.
32,341
1,961,482
CONSOL Energy, Inc.
40,200
1,291,626
Energy Partners Ltd. (a)
18,300
446,886
Massey Energy Co.
41,400
961,722
Noble Energy, Inc.
28,900
1,418,123
Peabody Energy Corp.
36,300
1,466,883
Common Stocks - continued
Shares
Value (Note 1)
ENERGY - continued
Oil, Gas & Consumable Fuels - continued
Penn West Energy Trust
35,400
$ 1,079,913
Tesoro Corp.
16,000
1,052,320
Ultra Petroleum Corp. (a)
79,800
3,810,450
Uramin, Inc. (a)
49,900
140,734
Valero Energy Corp.
60,500
3,095,180
17,494,945
TOTAL ENERGY
28,231,719
FINANCIALS - 24.4%
Capital Markets - 2.1%
Investors Financial Services Corp.
45,700
1,950,019
KKR Private Equity Investors, LP
55,300
1,216,600
State Street Corp.
27,100
1,827,624
UBS AG (Reg.)
71,184
4,294,531
9,288,774
Commercial Banks - 4.3%
Barclays PLC
3,200
46,512
Boston Private Financial Holdings, Inc.
23,800
671,398
Cathay General Bancorp
46,900
1,618,519
Center Financial Corp., California
23,319
558,956
East West Bancorp, Inc.
38,396
1,359,986
Erste Bank AG
12,600
966,466
Kookmin Bank
14,530
1,170,212
PNC Financial Services Group, Inc.
28,800
2,132,352
SVB Financial Group (a)
11,500
536,130
UCBH Holdings, Inc.
125,200
2,198,512
Uniao de Bancos Brasileiros SA (Unibanco) GDR
26,100
2,426,256
Wachovia Corp.
58,700
3,342,965
Wells Fargo & Co.
53,600
1,906,016
Wintrust Financial Corp.
11,000
528,220
19,462,500
Consumer Finance - 0.7%
Capital One Financial Corp.
39,200
3,011,344
Insurance - 5.9%
Allied World Assurance Co. Holdings Ltd.
38,800
1,692,844
Axis Capital Holdings Ltd.
75,800
2,529,446
Endurance Specialty Holdings Ltd.
80,600
2,948,348
Everest Re Group Ltd.
22,300
2,187,853
First Mercury Financial Corp.
43,000
1,011,360
Genworth Financial, Inc. Class A (non-vtg.)
66,600
2,278,386
Hartford Financial Services Group, Inc.
19,800
1,847,538
IPC Holdings Ltd.
41,700
1,311,465
MetLife, Inc.
29,900
1,764,399
Montpelier Re Holdings Ltd.
47,500
883,975
National Financial Partners Corp.
24,200
1,064,074
Navigators Group, Inc. (a)
25,760
1,241,117
Prudential Financial, Inc.
44,700
3,837,942
Shares
Value (Note 1)
The Chubb Corp.
25,000
$ 1,322,750
United America Indemnity Ltd. Class A (a)
27,702
701,692
26,623,189
Real Estate Investment Trusts - 7.9%
Alexandria Real Estate Equities, Inc.
32,099
3,222,740
Annaly Capital Management, Inc.
198,000
2,754,180
Developers Diversified Realty Corp.
57,300
3,607,035
Duke Realty LP
81,500
3,333,350
Equity Residential (SBI)
113,200
5,744,900
General Growth Properties, Inc.
123,000
6,424,290
Health Care Property Investors, Inc.
59,100
2,176,062
United Dominion Realty Trust, Inc. (SBI)
57,600
1,831,104
Vornado Realty Trust
54,600
6,633,900
35,727,561
Real Estate Management & Development - 0.6%
Mitsubishi Estate Co. Ltd.
63,000
1,629,903
The St. Joe Co. (d)
18,900
1,012,473
2,642,376
Thrifts & Mortgage Finance - 2.9%
Countrywide Financial Corp.
56,500
2,398,425
Fannie Mae
62,800
3,729,692
Fremont General Corp.
40,700
659,747
Hudson City Bancorp, Inc.
279,000
3,872,520
NetBank, Inc.
60,311
279,843
Washington Mutual, Inc.
50,200
2,283,598
13,223,825
TOTAL FINANCIALS
109,979,569
HEALTH CARE - 7.4%
Biotechnology - 0.2%
Theravance, Inc. (a)
35,180
1,086,710
Health Care Equipment & Supplies - 1.4%
Advanced Medical Optics, Inc. (a)
38,600
1,358,720
Alcon, Inc.
10,320
1,153,466
ArthroCare Corp. (a)
26,120
1,042,710
Cooper Companies, Inc.
20,905
930,273
Inverness Medical Innovations, Inc. (a)
11,000
425,700
Respironics, Inc. (a)
31,000
1,170,250
6,081,119
Health Care Providers & Services - 4.0%
Brookdale Senior Living, Inc.
42,989
2,063,472
Capital Senior Living Corp. (a)
42,600
453,264
Community Health Systems, Inc. (a)
53,400
1,950,168
DaVita, Inc. (a)
49,500
2,815,560
Emeritus Corp. (a)
43,703
1,086,020
Health Net, Inc. (a)
37,500
1,824,750
McKesson Corp.
50,400
2,555,280
Medco Health Solutions, Inc. (a)
14,120
754,573
Omnicare, Inc.
48,900
1,889,007
Common Stocks - continued
Shares
Value (Note 1)
HEALTH CARE - continued
Health Care Providers & Services - continued
Sierra Health Services, Inc. (a)
34,000
$ 1,225,360
United Surgical Partners International, Inc. (a)
53,500
1,516,725
18,134,179
Health Care Technology - 0.5%
IMS Health, Inc.
77,800
2,137,944
Pharmaceuticals - 1.3%
Barr Pharmaceuticals, Inc. (a)
41,283
2,069,104
Endo Pharmaceuticals Holdings, Inc. (a)
75,600
2,085,048
MGI Pharma, Inc. (a)
43,300
797,153
Par Pharmaceutical Companies, Inc. (a)
49,900
1,116,263
6,067,568
TOTAL HEALTH CARE
33,507,520
INDUSTRIALS - 7.1%
Aerospace & Defense - 0.5%
General Dynamics Corp.
30,000
2,230,500
Air Freight & Logistics - 0.2%
C.H. Robinson Worldwide, Inc.
20,200
825,978
Airlines - 0.7%
AirTran Holdings, Inc. (a)(d)
169,045
1,984,588
TAM SA (PN) sponsored ADR (ltd. vtg.)
45,800
1,374,458
3,359,046
Commercial Services & Supplies - 1.1%
CDI Corp.
11,705
291,455
Cintas Corp.
47,400
1,882,254
Fuel Tech, Inc. (a)
10,900
268,576
The Brink's Co.
39,000
2,492,880
4,935,165
Construction & Engineering - 1.4%
Chicago Bridge & Iron Co. NV (NY Shares)
42,200
1,153,748
Infrasource Services, Inc. (a)
60,400
1,314,908
Quanta Services, Inc. (a)
74,400
1,463,448
Shaw Group, Inc. (a)
38,100
1,276,350
Washington Group International, Inc.
18,700
1,118,073
6,326,527
Electrical Equipment - 0.2%
Vestas Wind Systems AS (a)
20,600
870,718
Industrial Conglomerates - 0.5%
Tyco International Ltd.
75,800
2,304,320
Machinery - 1.0%
Deere & Co.
24,300
2,310,201
Hanjin Heavy Industries & Construction Co. Ltd.
33,100
1,078,420
Valmont Industries, Inc.
18,600
1,032,114
4,420,735
Shares
Value (Note 1)
Road & Rail - 1.3%
AMERCO (a)
7,700
$ 669,977
Burlington Northern Santa Fe Corp.
12,400
915,244
Con-way, Inc.
24,200
1,065,768
Laidlaw International, Inc.
76,000
2,312,680
Landstar System, Inc.
23,500
897,230
5,860,899
Trading Companies & Distributors - 0.2%
UAP Holding Corp.
35,900
903,962
TOTAL INDUSTRIALS
32,037,850
INFORMATION TECHNOLOGY - 16.6%
Communications Equipment - 2.9%
Adtran, Inc.
50,191
1,139,336
Comverse Technology, Inc. (a)
60,900
1,285,599
Dycom Industries, Inc. (a)
80,300
1,695,936
Harris Corp.
52,600
2,412,236
Juniper Networks, Inc. (a)
128,000
2,424,320
Nokia Corp. sponsored ADR
71,600
1,454,912
Nortel Networks Corp. (a)
49,200
1,319,877
Powerwave Technologies, Inc. (a)
174,800
1,127,460
12,859,676
Computers & Peripherals - 2.1%
Electronics for Imaging, Inc. (a)
88,500
2,352,330
Hewlett-Packard Co.
48,300
1,989,477
Intermec, Inc. (a)
14,509
352,133
NCR Corp. (a)
90,000
3,848,400
Seagate Technology
43,500
1,152,750
9,695,090
Electronic Equipment & Instruments - 2.2%
Agilent Technologies, Inc. (a)
59,700
2,080,545
Arrow Electronics, Inc. (a)
61,700
1,946,635
Avnet, Inc. (a)
139,600
3,563,988
Flextronics International Ltd. (a)
101,400
1,164,072
Tektronix, Inc.
37,500
1,093,875
9,849,115
Internet Software & Services - 0.8%
Yahoo!, Inc. (a)
141,000
3,601,140
IT Services - 0.9%
First Data Corp.
91,100
2,324,872
MoneyGram International, Inc.
50,500
1,583,680
Unisys Corp. (a)
18,800
147,392
4,055,944
Office Electronics - 0.8%
Xerox Corp. (a)
205,200
3,478,140
Semiconductors & Semiconductor Equipment - 3.1%
Applied Materials, Inc.
126,600
2,335,770
ASML Holding NV (NY Shares) (a)
90,300
2,224,089
Atmel Corp. (a)
365,200
2,209,460
Integrated Device Technology, Inc. (a)
71,415
1,105,504
Intersil Corp. Class A
64,800
1,550,016
Common Stocks - continued
Shares
Value (Note 1)
INFORMATION TECHNOLOGY - continued
Semiconductors & Semiconductor Equipment - continued
Marvell Technology Group Ltd. (a)
67,300
$ 1,291,487
National Semiconductor Corp.
44,900
1,019,230
Skyworks Solutions, Inc. (a)
144,383
1,022,232
Spansion, Inc. Class A
77,700
1,154,622
13,912,410
Software - 3.8%
Ansys, Inc. (a)
24,600
1,069,854
Cognos, Inc. (a)
48,600
2,063,556
Fair, Isaac & Co., Inc.
49,400
2,008,110
Hyperion Solutions Corp. (a)
40,600
1,459,164
Nintendo Co. Ltd.
10,200
2,647,459
Quest Software, Inc. (a)
155,800
2,282,470
Symantec Corp. (a)
106,000
2,210,100
Ubisoft Entertainment SA (a)
101,860
3,438,540
17,179,253
TOTAL INFORMATION TECHNOLOGY
74,630,768
MATERIALS - 5.0%
Chemicals - 3.4%
Agrium, Inc.
79,100
2,478,828
Arkema sponsored ADR (a)
20,200
1,033,230
Celanese Corp. Class A
152,730
3,952,652
Chemtura Corp.
339,544
3,269,809
Cytec Industries, Inc.
16,400
926,764
Georgia Gulf Corp.
41,020
792,096
Minerals Technologies, Inc.
21,398
1,257,988
OMNOVA Solutions, Inc. (a)
68,170
312,219
Rohm & Haas Co.
24,600
1,257,552
15,281,138
Containers & Packaging - 0.3%
Smurfit-Stone Container Corp. (a)
107,600
1,136,256
Metals & Mining - 1.3%
Compass Minerals International, Inc.
45,616
1,439,641
Reliance Steel & Aluminum Co.
61,000
2,402,180
Titanium Metals Corp.
73,779
2,177,218
6,019,039
TOTAL MATERIALS
22,436,433
TELECOMMUNICATION SERVICES - 1.8%
Diversified Telecommunication Services - 1.5%
BellSouth Corp.
105,000
4,946,550
Verizon Communications, Inc.
52,300
1,947,652
6,894,202
Shares
Value (Note 1)
Wireless Telecommunication Services - 0.3%
Sprint Nextel Corp.
59,300
$ 1,120,177
Vivo Participacoes SA (PN) sponsored ADR
14,600
59,860
1,180,037
TOTAL TELECOMMUNICATION SERVICES
8,074,239
UTILITIES - 12.7%
Electric Utilities - 7.4%
DPL, Inc.
78,250
2,173,785
E.ON AG
8,700
1,179,459
Edison International
135,300
6,153,444
Entergy Corp.
76,600
7,071,711
FPL Group, Inc.
101,800
5,539,956
Northeast Utilities
68,700
1,934,592
PPL Corp.
114,300
4,096,512
Sierra Pacific Resources (a)
293,786
4,944,418
33,093,877
Gas Utilities - 0.7%
Equitable Resources, Inc.
72,500
3,026,875
Independent Power Producers & Energy Traders - 2.6%
AES Corp. (a)
210,400
4,637,216
Constellation Energy Group, Inc.
47,700
3,285,099
NRG Energy, Inc.
55,500
3,108,555
TXU Corp.
12,400
672,204
11,703,074
Multi-Utilities - 2.0%
CMS Energy Corp. (a)
207,000
3,456,900
Duke Energy Corp.
34,900
1,159,029
Public Service Enterprise Group, Inc.
31,100
2,064,418
RWE AG
9,900
1,091,343
Sempra Energy
24,600
1,378,584
9,150,274
TOTAL UTILITIES
56,974,100
TOTAL COMMON STOCKS
(Cost $406,268,579)
442,471,578
Money Market Funds - 2.9%
Shares
Value (Note 1)
Fidelity Cash Central Fund, 5.37% (b)
5,006,295
$ 5,006,295
Fidelity Securities Lending Cash Central Fund, 5.38% (b)(c)
7,773,425
7,773,425
TOTAL MONEY MARKET FUNDS
(Cost $12,779,720)
12,779,720
TOTAL INVESTMENT PORTFOLIO - 101.2%
(Cost $419,048,299)
455,251,298
NET OTHER ASSETS - (1.2)%
(5,220,388)
NET ASSETS - 100%
$ 450,030,910
Legend
(a) Non-income producing
(b) Affiliated fund that is available only to investment companies and other accounts managed by Fidelity Investments. The rate quoted is the annualized seven-day yield of the fund at period end. A complete unaudited listing of the fund's holdings as of its most recent quarter end is available upon request.
(c) Investment made with cash collateral received from securities on loan.
(d) Security or a portion of the security is on loan at period end.
Affiliated Central Funds
Information regarding fiscal year to date income earned by the Fund from investments in Fidelity Central Funds is as follows:
Fund
Income earned
Fidelity Cash Central Fund
$ 533,453
Fidelity Securities Lending Cash Central Fund
56,526
Total
$ 589,979
Other Information
Distribution of investments by country of issue, as a percentage of total net assets, is as follows:
United States of America
85.1%
Bermuda
3.0%
Canada
2.5%
Switzerland
1.8%
France
1.1%
Japan
1.0%
Others (individually less than 1%)
5.5%
100.0%
See accompanying notes which are an integral part of the financial statements.
Annual Report
VIP Value Strategies Portfolio
Financial Statements
Statement of Assets and Liabilities
December 31, 2006
Assets
Investment in securities, at value (including securities loaned of $7,484,877) - See accompanying schedule:
Unaffiliated issuers (cost $406,268,579)
$ 442,471,578
Fidelity Central Funds (cost $12,779,720)
12,779,720
Total Investments (cost $419,048,299)
$ 455,251,298
Cash
21,100
Receivable for investments sold
4,567,541
Receivable for fund shares sold
28,785
Dividends receivable
541,106
Interest receivable
6,405
Prepaid expenses
1,993
Other receivables
18,647
Total assets
460,436,875
Liabilities
Payable for investments purchased
$ 2,220,280
Payable for fund shares redeemed
1
Accrued management fee
211,730
Distribution fees payable
50,605
Other affiliated payables
43,978
Other payables and accrued expenses
105,946
Collateral on securities loaned, at value
7,773,425
Total liabilities
10,405,965
Net Assets
$ 450,030,910
Net Assets consist of:
Paid in capital
$ 361,377,314
Undistributed net investment income
2,135,437
Accumulated undistributed net realized gain (loss) on investments and foreign currency transactions
50,315,415
Net unrealized appreciation (depreciation) on investments and assets and liabilities in foreign currencies
36,202,744
Net Assets
$ 450,030,910
Statement of Assets and Liabilities - continued
December 31, 2006
Initial Class: Net Asset Value, offering price and redemption price per share ($130,035,442 ÷ 9,651,462 shares)
$ 13.47
Service Class: Net Asset Value, offering price and redemption price per share ($66,109,307 ÷ 4,924,492 shares)
$ 13.42
Service Class 2: Net Asset Value, offering price and redemption price per share ($215,401,248 ÷ 15,972,179 shares)
$ 13.49
Investor Class: Net Asset Value, offering price and redemption price per share ($38,484,913 ÷ 2,865,601 shares)
$ 13.43
See accompanying notes which are an integral part of the financial statements.
Annual Report
VIP Value Strategies Portfolio Financial Statements - continued
Statement of Operations
Year ended December 31, 2006
Investment Income
Dividends
$ 5,291,102
Interest
1,808
Income from Fidelity Central Funds
589,979
Total income
5,882,889
Expenses
Management fee
$ 2,369,855
Transfer agent fees
318,841
Distribution fees
556,607
Accounting and security lending fees
174,416
Custodian fees and expenses
76,547
Independent trustees' compensation
1,554
Registration fees
599
Audit
41,225
Legal
9,199
Miscellaneous
88,808
Total expenses before reductions
3,637,651
Expense reductions
(38,425)
3,599,226
Net investment income (loss)
2,283,663
Realized and Unrealized Gain (Loss)
Net realized gain (loss) on:
Investment securities:
Unaffiliated issuers
51,004,345
Foreign currency transactions
(16,524)
Total net realized gain (loss)
50,987,821
Change in net unrealized appreciation (depreciation) on:
Investment securities
9,828,105
Assets and liabilities in foreign currencies
(66)
Total change in net unrealized appreciation (depreciation)
9,828,039
Net gain (loss)
60,815,860
Net increase (decrease) in net assets resulting from operations
$ 63,099,523
Statement of Changes in Net Assets
Year ended December 31, 2006
Year ended December 31, 2005
Increase (Decrease) in Net Assets
Operations
Net investment income (loss)
$ 2,283,663
$ 1,878,330
Net realized gain (loss)
50,987,821
72,839,947
Change in net unrealized appreciation (depreciation)
9,828,039
(69,115,639)
Net increase (decrease) in net assets resulting from operations
63,099,523
5,602,638
Distributions to shareholders from net investment income
(1,956,144)
-
Distributions to shareholders from net realized gain
(71,173,533)
(16,781,184)
Total distributions
(73,129,677)
(16,781,184)
Share transactions - net increase (decrease)
40,473,942
(104,368,329)
Total increase (decrease) in net assets
30,443,788
(115,546,875)
Net Assets
Beginning of period
419,587,122
535,133,997
End of period (including undistributed net investment income of $2,135,437 and undistributed net investment income of $1,933,663, respectively)
$ 450,030,910
$ 419,587,122
See accompanying notes which are an integral part of the financial statements.
VIP Value Strategies Portfolio
Financial Highlights - Initial Class
Years ended December 31,
2006
2005
2004
2003
2002 H
Selected Per-Share Data
Net asset value, beginning of period
$ 14.01
$ 14.13
$ 12.41
$ 7.91
$ 10.00
Income from Investment Operations
Net investment income (loss) E
.09
.07
.01
- J
.01
Net realized and unrealized gain (loss)
1.89
.28
1.74
4.58
(2.10)
Total from investment operations
1.98
.35
1.75
4.58
(2.09)
Distributions from net investment income
(.08)
-
-
-
-
Distributions from net realized gain
(2.44)
(.47)
(.03)
(.08)
-
Total distributions
(2.52)
(.47)
(.03)
(.08)
-
Net asset value, end of period
$ 13.47
$ 14.01
$ 14.13
$ 12.41
$ 7.91
Total Return B, C, D
16.33%
2.66%
14.13%
57.91%
(20.90)%
Ratios to Average Net Assets F, I
Expenses before reductions
.73%
.72%
.71%
.76%
1.43% A
Expenses net of fee waivers, if any
.73%
.72%
.71%
.76%
1.00% A
Expenses net of all reductions
.72%
.66%
.70%
.73%
.95% A
Net investment income (loss)
.69%
.54%
.10%
.02%
.13% A
Supplemental Data
Net assets, end of period (000 omitted)
$ 130,035
$ 144,685
$ 229,764
$ 161,705
$ 1,191
Portfolio turnover rate G
183%
109%
41%
47%
65% A
AAnnualized
BTotal returns for periods of less than one year are not annualized.
CTotal returns do not reflect charges attributable to your insurance company's separate account. Inclusion of these charges would reduce the total returns shown.
DTotal returns would have been lower had certain expenses not been reduced during the periods shown.
ECalculated based on average shares outstanding during the period.
FFees and expenses of the underlying Fidelity Central Funds are not included in the Fund's expense ratio. The Fund indirectly bears its proportionate share of the expenses of any underlying Fidelity Central Funds.
GAmount does not include the portfolio activity of any underlying Fidelity Central Funds.
HFor the period February 20, 2002 (commencement of operations) to December 31, 2002.
IExpense ratios reflect operating expenses of the class. Expenses before reductions do not reflect amounts reimbursed by the investment adviser or reductions from brokerage service arrangements or other expense offset arrangements and do not represent the amount paid by the class during periods when reimbursements or reductions occur. Expenses net of fee waivers reflect expenses after reimbursement by the investment adviser but prior to reductions from brokerage service arrangements or other expense offset arrangements. Expenses net of all reductions represent the net expenses paid by the class.
JAmount represents less than $.01 per share.
Financial Highlights - Service Class
Years ended December 31,
2006
2005
2004
2003
2002 H
Selected Per-Share Data
Net asset value, beginning of period
$ 13.97
$ 14.09
$ 12.39
$ 7.90
$ 10.00
Income from Investment Operations
Net investment income (loss) E
.07
.06
- J
(.01)
- J
Net realized and unrealized gain (loss)
1.89
.27
1.73
4.58
(2.10)
Total from investment operations
1.96
.33
1.73
4.57
(2.10)
Distributions from net investment income
(.07)
-
-
-
-
Distributions from net realized gain
(2.44)
(.45)
(.03)
(.08)
-
Total distributions
(2.51)
(.45)
(.03)
(.08)
-
Net asset value, end of period
$ 13.42
$ 13.97
$ 14.09
$ 12.39
$ 7.90
Total Return B, C, D
16.20%
2.55%
13.99%
57.79%
(21.00)%
Ratios to Average Net Assets F, I
Expenses before reductions
.83%
.82%
.81%
.84%
1.52% A
Expenses net of fee waivers, if any
.83%
.82%
.81%
.84%
1.10% A
Expenses net of all reductions
.82%
.76%
.80%
.81%
1.05% A
Net investment income (loss)
.59%
.44%
-%
(.06)%
.03% A
Supplemental Data
Net assets, end of period (000 omitted)
$ 66,109
$ 74,698
$ 98,542
$ 83,146
$ 9,774
Portfolio turnover rate G
183%
109%
41%
47%
65% A
AAnnualized
B Total returns for periods of less than one year are not annualized.
C Total returns do not reflect charges attributable to your insurance company's separate account. Inclusion of these charges would reduce the total returns shown.
D Total returns would have been lower had certain expenses not been reduced during the periods shown.
E Calculated based on average shares outstanding during the period.
F Fees and expenses of the underlying Fidelity Central Funds are not included in the Fund's expense ratio. The Fund indirectly bears its proportionate share of the expenses of any underlying Fidelity Central Funds.
G Amount does not include the portfolio activity of any underlying Fidelity Central Funds.
H For the period February 20, 2002 (commencement of operations) to December 31, 2002.
I Expense ratios reflect operating expenses of the class. Expenses before reductions do not reflect amounts reimbursed by the investment adviser or reductions from brokerage service arrangements or other expense offset arrangements and do not represent the amount paid by the class during periods when reimbursements or reductions occur. Expenses net of fee waivers reflect expenses after reimbursement by the investment adviser but prior to reductions from brokerage service arrangements or other expense offset arrangements. Expenses net of all reductions represent the net expenses paid by the class.
J Amount represents less than $.01 per share.
See accompanying notes which are an integral part of the financial statements.
Annual Report
Fund Name Financial Statements - continued
Financial Highlights - Service Class 2
Years ended December 31,
2006
2005
2004
2003
2002 H
Selected Per-Share Data
Net asset value, beginning of period
$ 14.02
$ 14.14
$ 12.45
$ 7.95
$ 10.00
Income from Investment Operations
Net investment income (loss) E
.05
.04
(.02)
(.02)
(.01)
Net realized and unrealized gain (loss)
1.91
.28
1.74
4.58
(2.04)
Total from investment operations
1.96
.32
1.72
4.56
(2.05)
Distributions from net investment income
(.05)
-
-
-
-
Distributions from net realized gain
(2.44)
(.44)
(.03)
(.06)
-
Total distributions
(2.49)
(.44)
(.03)
(.06)
-
Net asset value, end of period
$ 13.49
$ 14.02
$ 14.14
$ 12.45
$ 7.95
Total Return B, C, D
16.09%
2.43%
13.84%
57.36%
(20.50)%
Ratios to Average Net Assets F, I
Expenses before reductions
.98%
.97%
.97%
.99%
1.68% A
Expenses net of fee waivers, if any
.98%
.97%
.97%
.99%
1.25% A
Expenses net of all reductions
.97%
.91%
.95%
.96%
1.21% A
Net investment income (loss)
.43%
.29%
(.15)%
(.21)%
(.12)% A
Supplemental Data
Net assets, end of period (000 omitted)
$ 215,401
$ 191,845
$ 206,828
$ 166,160
$ 43,505
Portfolio turnover rate G
183%
109%
41%
47%
65% A
A Annualized
B Total returns for periods of less than one year are not annualized.
C Total returns do not reflect charges attributable to your insurance company's separate account. Inclusion of these charges would reduce the total returns shown.
D Total returns would have been lower had certain expenses not been reduced during the periods shown.
E Calculated based on average shares outstanding during the period.
F Fees and expenses of the underlying Fidelity Central Funds are not included in the Fund's expense ratio. The Fund indirectly bears its proportionate share of the expenses of any underlying Fidelity Central Funds.
G Amount does not include the portfolio activity of any underlying Fidelity Central Funds.
H For the period February 20, 2002 (commencement of operations) to December 31, 2002.
I Expense ratios reflect operating expenses of the class. Expenses before reductions do not reflect amounts reimbursed by the investment adviser or reductions from brokerage service arrangements or other expense offset arrangements and do not represent the amount paid by the class during periods when reimbursements or reductions occur. Expenses net of fee waivers reflect expenses after reimbursement by the investment adviser but prior to reductions from brokerage service arrangements or other expense offset arrangements. Expenses net of all reductions represent the net expenses paid by the class.
Financial Highlights - Investor Class
Years ended December 31,
2006
2005 H
Selected Per-Share Data
Net asset value, beginning of period
$ 14.00
$ 13.59
Income from Investment Operations
Net investment income (loss) E
.07
.02
Net realized and unrealized gain (loss)
1.89
.39
Total from investment operations
1.96
.41
Distributions from net investment income
(.09)
-
Distributions from net realized gain
(2.44)
-
Total distributions
(2.53)
-
Net asset value, end of period
$ 13.43
$ 14.00
Total Return B, C, D
16.18%
3.02%
Ratios to Average Net Assets F, I
Expenses before reductions
.86%
.93% A
Expenses net of fee waivers, if any
.86%
.93% A
Expenses net of all reductions
.85%
.87% A
Net investment income (loss)
.55%
.35% A
Supplemental Data
Net assets, end of period (000 omitted)
$ 38,485
$ 8,360
Portfolio turnover rate G
183%
109%
A Annualized
B Total returns for periods of less than one year are not annualized.
C Total returns do not reflect charges attributable to your insurance company's separate account. Inclusion of these charges would reduce the total returns shown.
D Total returns would have been lower had certain expenses not been reduced during the periods shown.
E Calculated based on average shares outstanding during the period.
F Fees and expenses of the underlying Fidelity Central Funds are not included in the Fund's expense ratio. The Fund indirectly bears its proportionate share of the expenses of any underlying Fidelity Central Funds.
G Amount does not include the portfolio activity of any underlying Fidelity Central Funds.
H For the period July 21, 2005 (commencement of sale of shares) to December 31, 2005.
I Expense ratios reflect operating expenses of the class. Expenses before reductions do not reflect amounts reimbursed by the investment adviser or reductions from brokerage service arrangements or other expense offset arrangements and do not represent the amount paid by the class during periods when reimbursements or reductions occur. Expense ratios before reductions for start-up periods may not be representative of longer-term operating periods. Expenses net of fee waivers reflect expenses after reimbursement by the investment adviser but prior to reductions from brokerage service arrangements or other expense offset arrangements. Expenses net of all reductions represent the net expenses paid by the class.
See accompanying notes which are an integral part of the financial statements.
VIP Value Strategies Portfolio
Notes to Financial Statements
For the period ended December 31, 2006
1. Significant Accounting Policies.
VIP Value Strategies Portfolio (the Fund) is a fund of Variable Insurance Products Fund III, (the trust) and is authorized to issue an unlimited number of shares. The trust is registered under the Investment Company Act of 1940, as amended (the 1940 Act), as an open-end management investment company organized as a Massachusetts business trust. Shares of the Fund may only be purchased by insurance companies for the purpose of funding variable annuity or variable life insurance contracts. The Fund offers the following classes of shares: Initial Class shares, Service Class shares, Service Class 2 shares, and Investor Class shares. All classes have equal rights and voting privileges, except for matters affecting a single class. Investment income, realized and unrealized capital gains and losses, the common expenses of the Fund, and certain fund-level expense reductions, if any, are allocated on a pro rata basis to each class based on the relative net assets of each class to the total net assets of the Fund. Each class differs with respect to transfer agent and distribution and service plan fees incurred. Certain expense reductions also differ by class.
The Fund may invest in Fidelity Central Funds which are open-end investment companies available to investment companies and other accounts managed by Fidelity Management & Research Company (FMR) and its affiliates. The financial statements have been prepared in conformity with accounting principles generally accepted in the United States of America, which require management to make certain estimates and assumptions at the date of the financial statements. The following summarizes the significant accounting policies of the Fund, which are also consistently followed by the Fidelity Central Funds:
Security Valuation. Investments are valued and net asset value (NAV) per share is calculated (NAV calculation) as of the close of business of the New York Stock Exchange (NYSE), normally 4:00 p.m. Eastern time. Wherever possible, the Fund uses independent pricing services approved by the Board of Trustees to value its investments.
Equity securities, including restricted securities, for which market quotations are readily available, are valued at the last reported sale price or official closing price as reported by an independent pricing service on the primary market or exchange on which they are traded. In the event there were no sales during the day or closing prices are not available, securities are valued at the last quoted bid price. Investments in open-end mutual funds, including the Fidelity Central Funds, are valued at their closing net asset value each business day. Short-term securities with remaining maturities of sixty days or less for which quotations are not readily available are valued at amortized cost, which approximates value.
When current market prices or quotations are not readily available or do not accurately reflect fair value, valuations may be determined in accordance with procedures adopted by the Board of Trustees. For example, when developments occur between the close of a market and the close of the NYSE that may materially affect the value of some or all of the securities, or when trading in a security is halted, those securities may be fair valued. Factors used in the determination of fair value may include monitoring news to identify significant market or security specific events such as changes in the value of U.S. securities markets, reviewing developments in foreign markets and evaluating the performance of ADRs, futures contracts and exchange-traded funds. Because the Fund's utilization of fair value pricing depends on market activity, the frequency with which fair value pricing is used can not be predicted and may be utilized to a significant extent. The value of securities used for NAV calculation under fair value pricing may differ from published prices for the same securities.
Foreign Currency. The Fund uses foreign currency contracts to facilitate transactions in foreign-denominated securities. Losses from these transactions may arise from changes in the value of the foreign currency or if the counterparties do not perform under the contracts' terms.
Foreign-denominated assets, including investment securities, and liabilities are translated into U.S. dollars at the exchange rate at period end. Purchases and sales of investment securities, income and dividends received and expenses denominated in foreign currencies are translated into U.S. dollars at the exchange rate in effect on the transaction date.
The effects of exchange rate fluctuations on investments are included with the net realized and unrealized gain (loss) on investment securities. Other foreign currency transactions resulting in realized and unrealized gain (loss) are disclosed separately.
Investment Transactions and Income. Security transactions, including the Fund's investment activity in the Fidelity Central Funds, are accounted for as of trade date. Gains and losses on securities sold are determined on the basis of identified cost and may include proceeds received from litigation. Dividend income is recorded on the ex-dividend date, except for certain dividends from foreign securities where the ex-dividend date may have passed, which are recorded as soon as the Fund is informed of the ex-dividend date. Non-cash dividends included in dividend income, if any, are recorded at the fair market value of the securities received. Distributions received on securities that represent a return of capital or capital gain are recorded as a reduction of cost of investments and/or as a realized gain. The Fund estimates the components of distributions received that may be considered return of capital distributions or capital gain distributions. Interest income and income distributions from the Fidelity Central Funds are accrued as earned, with any income distributions receivable as of period end included in Interest Receivable on the Statement of Assets and Liabilities. Interest income includes coupon interest and amortization of premium and accretion of discount on debt securities. Investment income is recorded net of foreign taxes withheld where recovery of such taxes is uncertain.
Annual Report
Notes to Financial Statements - continued
1. Significant Accounting Policies - continued
Expenses. Most expenses of the trust can be directly attributed to a fund. Expenses which cannot be directly attributed are apportioned among each Fund in the trust. Expense estimates are accrued in the period to which they relate and adjustments are made when actual amounts are known.
Income Tax Information and Distributions to Shareholders. Each year, the Fund intends to qualify as a regulated investment company by distributing all of its taxable income and realized gains under Subchapter M of the Internal Revenue Code. As a result, no provision for income taxes is required in the accompanying financial statements. Foreign taxes are provided for based on the Fund's understanding of the tax rules and rates that exist in the foreign markets in which it invests.
Distributions are recorded on the ex-dividend date. Income dividends and capital gain distributions are declared separately for each class. Income and capital gain distributions are determined in accordance with income tax regulations, which may differ from generally accepted accounting principles.
Capital accounts within the financial statements are adjusted for permanent book-tax differences. These adjustments have no impact on net assets or the results of operations. Temporary book-tax differences will reverse in a subsequent period.
Book-tax differences are primarily due to foreign currency transactions, passive foreign investment companies (PFIC), partnerships, and losses deferred due to wash sales.
The tax-basis components of distributable earnings and the federal tax cost as of period end were as follows:
Unrealized appreciation
$ 42,942,153
Unrealized depreciation
(7,595,142)
Net unrealized appreciation (depreciation)
35,347,011
Undistributed ordinary income
37,692,746
Undistributed long-term capital gain
15,613,843
Cost for federal income tax purposes
$ 419,904,287
The tax character of distributions paid was as follows:
December 31, 2006
December 31, 2005
Ordinary Income
$ 10,415,294
$ 1,132,407
Long-term Capital Gains
62,714,383
15,648,777
Total
$ 73,129,677
$ 16,781,184
New Accounting Pronouncements. In July 2006, Financial Accounting Standards Board Interpretation No. 48, Accounting for Uncertainty in Income Taxes - an interpretation of FASB Statement 109 (FIN 48), was issued and is effective on the last business day of the semiannual reporting period for fiscal years beginning after December 15, 2006. FIN 48 sets forth a threshold for financial statement recognition, measurement and disclosure of a tax position taken or expected to be taken on a tax return. Management is currently evaluating the impact, if any, the adoption of FIN 48 will have on the Fund's net assets, results of operations and financial statement disclosures.
In addition, in September 2006, Statement of Financial Accounting Standards No. 157, Fair Value Measurements (SFAS 157), was issued and is effective for fiscal years beginning after November 15, 2007. SFAS 157 defines fair value, establishes a framework for measuring fair value and expands disclosures about fair value measurements. Management is currently evaluating the impact the adoption of SFAS 157 will have on the Fund's financial statement disclosures.
2. Operating Policies.
Repurchase Agreements. FMR has received an Exemptive Order from the Securities and Exchange Commission (the SEC) which permits the Fund and other affiliated entities of FMR to transfer uninvested cash balances into joint trading accounts which are then invested in repurchase agreements. The Fund may also invest directly with institutions in repurchase agreements. Repurchase agreements are collateralized by government or non-government securities. Upon settlement date, collateral is held in segregated accounts with custodian banks and may be obtained in the event of a default of the counterparty. The Fund monitors, on a daily basis, the value of the collateral to ensure it is at least equal to the principal amount of the repurchase agreement (including accrued interest). In the event of a default by the counterparty, realization of the collateral proceeds could be delayed, during which time the value of the collateral may decline.
3. Purchases and Sales of Investments.
Purchases and sales of securities, other than short-term securities, aggregated $753,542,362 and $771,152,842, respectively.
VIP Value Strategies Portfolio
4. Fees and Other Transactions with Affiliates.
Management Fee. FMR and its affiliates provide the Fund with investment management related services for which the Fund pays a monthly management fee. The management fee is the sum of an individual fund fee rate that is based on an annual rate of .30% of the Fund's average net assets and a group fee rate that averaged .27% during the period. The group fee rate is based upon the average net assets of all the mutual funds advised by FMR. The group fee rate decreases as assets under management increase and increases as assets under management decrease. For the period, the total annual management fee rate was .57% of the Fund's average net assets.
Distribution and Service Plan. In accordance with Rule 12b-1 of the 1940 Act, the Fund has adopted separate 12b-1 Plans for each Service Class of shares. Each Service Class pays Fidelity Distributors Corporation (FDC), an affiliate of FMR, a service fee. For the period, the service fee is based on an annual rate of .10% of Service Class' average net assets and .25% of Service Class 2's average net assets.
For the period, each class paid FDC the following amounts, all of which were re-allowed to insurance companies for the distribution of shares and providing shareholder support services:
Service Class
$ 69,021
Service Class 2
487,586
$ 556,607
Transfer Agent Fees. Fidelity Investments Institutional Operations Company, Inc. (FIIOC), an affiliate of FMR, is the fund's transfer, dividend disbursing, and shareholder servicing agent. FIIOC receives an asset-based fee with respect to each class. Each class with the exception of Investor Class pays a transfer agent fee, excluding out of pocket expenses, equal to an annual rate of .07% of their month end net assets. Investor Class pays a monthly asset-based transfer agent fee of .18% of its month end net assets. The total transfer agent fees paid by each class to FIIOC, including out of pocket expenses, were as follows:
Initial Class
$ 91,003
Service Class
45,610
Service Class 2
136,091
Investor Class
46,137
$ 318,841
Accounting and Security Lending Fees. Fidelity Service Company, Inc. (FSC), an affiliate of FMR, maintains the Fund's accounting records. The accounting fee is based on the level of average net assets for the month. Under a separate contract, FSC administers the security lending program. The security lending fee is based on the number and duration of lending transactions.
Investments in Fidelity Central Funds. The Fund may invest in Fidelity Central Funds. The Fund's Schedule of Investments lists each of the Fidelity Central Funds as an investment of the Fund but does not include the underlying holdings of each Fidelity Central Fund. As an Investing Fund, the Fund indirectly bears its proportionate share of the expenses of the underlying Fidelity Central Funds. A complete unaudited list of holdings for each Fidelity Central Fund is available upon request. In addition, the financial statements of the Fidelity Central Funds, which are not covered by the Fund's Report of Independent Registered Public Accounting Firm, are available on the EDGAR Database on the SEC's web site, www.sec.gov, or upon request.
The Money Market Central Funds seek preservation of capital and current income and are managed by Fidelity Investments Money Management, Inc. (FIMM), an affiliate of FMR.
Brokerage Commissions. The Fund placed a portion of its portfolio transactions with brokerage firms which are affiliates of the investment adviser. The commissions paid to these affiliated firms were $5,505 for the period.
5. Committed Line of Credit.
The Fund participates with other funds managed by FMR in a $4.2 billion credit facility (the "line of credit") to be utilized for temporary or emergency purposes to fund shareholder redemptions or for other short-term liquidity purposes. The Fund has agreed to pay commitment fees on its pro rata portion of the line of credit, which amounted to $1,151 and is reflected in Miscellaneous Expense on the Statement of Operations. During the period, there were no borrowings on this line of credit.
Annual Report
Notes to Financial Statements - continued
6. Security Lending.
The Fund lends portfolio securities from time to time in order to earn additional income. On the settlement date of the loan, the Fund receives collateral (in the form of U.S. Treasury obligations, letters of credit and/or cash) against the loaned securities and maintains collateral in an amount not less than 100% of the market value of the loaned securities during the period of the loan. The market value of the loaned securities is determined at the close of business of the Fund and any additional required collateral is delivered to the Fund on the next business day. If the borrower defaults on its obligation to return the securities loaned because of insolvency or other reasons, a fund could experience delays and costs in recovering the securities loaned or in gaining access to the collateral. Any cash collateral received is invested in the Fidelity Securities Lending Cash Central Fund. The value of loaned securities and cash collateral at period end are disclosed on the Fund's Statement of Assets and Liabilities. Security lending income represents the income earned on investing cash collateral, less fees and expenses associated with the loan, plus any premium payments that may be received on the loan of certain types of securities. Security lending income is presented in the Statement of Operations as a component of income from Fidelity Central Funds. Net income from lending portfolio securities during the period amounted to $56,526.
7. Expense Reductions.
Many of the brokers with whom FMR places trades on behalf of the Fund provided services to the Fund in addition to trade execution. These services included payments of certain expenses on behalf of the Fund totaling $32,016 for the period.
8. Other.
The Fund's organizational documents provide former and current trustees and officers with a limited indemnification against liabilities arising in connection with the performance of their duties to the Fund. In the normal course of business, the Fund may also enter into contracts that provide general indemnifications. The Fund's maximum exposure under these arrangements is unknown as this would be dependent on future claims that may be made against the Fund. The risk of material loss from such claims is considered remote.
At the end of the period, FMR or its affiliates were the owners of record of 37% of the total outstanding shares of the Fund and two otherwise unaffiliated shareholders were the owners of record of 53% of the total outstanding shares of the Fund.
The United States Securities and Exchange Commission ("SEC") is conducting an investigation of FMR (covering the years 2002 to 2004) arising from gifts, gratuities and business entertainment provided by certain brokers to certain individuals who were employed on FMR's domestic equity trading desk during that period. FMR is in discussions with the SEC staff regarding the possible resolution of the matter, but as of period-end no final resolution has been reached.
In December 2006, the Independent Trustees completed their own investigation of the matter with the assistance of independent counsel. The Independent Trustees and FMR agree that, despite the absence of proof that the Fidelity mutual funds experienced diminished execution quality as a result of the improper receipt of gifts and business entertainment, the conduct at issue was serious and is worthy of redress. Accordingly, the Independent Trustees have requested and FMR has agreed to pay $42 million to Fidelity mutual funds, plus interest to be determined at the time that payment is made. A method of allocating this payment among the funds has not yet been determined. The total payment to the Fund is not anticipated to have a material impact on the Fund's net assets. In addition, FMR reimbursed related legal expenses which are recorded in the accompanying Statement of Operations as an expense reduction.
9. Distributions to Shareholders.
Distributions to shareholders of each class were as follows:
Years ended December 31,
2006
2005 A
From net investment income
Initial Class
$ 813,427
$ -
Service Class
391,977
-
Service Class 2
682,518
-
Investor Class
68,222
-
Total
$ 1,956,144
$ -
From net realized gain
Initial Class
$ 23,628,140
$ 7,370,772
Service Class
13,101,692
2,939,666
Service Class 2
32,653,795
6,470,746
Investor Class
1,789,906
-
Total
$ 71,173,533
$ 16,781,184
A Distributions for Investor Class are for the period July 21, 2005 (commencement of sale of shares) to December 31, 2005.
VIP Value Strategies Portfolio
10. Share Transactions.
Transactions for each class of shares were as follows:
Shares
Dollars
Years ended December 31,
Years ended December 31,
2006
2005 A
2006
2005 A
Initial Class
Shares sold
768,613
941,313
$ 9,680,014
$ 12,576,015
Reinvestment of distributions
2,033,408
561,369
24,441,567
7,370,772
Shares redeemed
(3,476,952)
(7,437,088)
(44,367,027)
(99,160,238)
Net increase (decrease)
(674,931)
(5,934,406)
$ (10,245,446)
$ (79,213,451)
Service Class
Shares sold
1,227,107
1,858,986
$ 15,949,117
$ 24,697,179
Reinvestment of distributions
1,125,410
224,402
13,493,668
2,939,666
Shares redeemed
(2,774,871)
(3,731,194)
(34,817,912)
(49,009,601)
Net increase (decrease)
(422,354)
(1,647,806)
$ (5,375,127)
$ (21,372,756)
Service Class 2
Shares sold
3,047,418
2,865,534
$ 38,944,361
$ 38,335,617
Reinvestment of distributions
2,764,205
491,325
33,336,312
6,470,746
Shares redeemed
(3,522,945)
(4,298,816)
(44,576,283)
(56,604,579)
Net increase (decrease)
2,288,678
(941,957)
$ 27,704,390
$ (11,798,216)
Investor Class
Shares sold
2,388,330
620,546
$ 30,047,755
$ 8,330,815
Reinvestment of distributions
154,844
-
1,858,127
-
Shares redeemed
(274,783)
(23,336)
(3,515,757)
(314,721)
Net increase (decrease)
2,268,391
597,210
$ 28,390,125
$ 8,016,094
A Share transactions for Investor Class are for the period July 21, 2005 (commencement of sale of shares) to December 31, 2005.
Annual Report
Report of Independent Registered Public Accounting Firm
To the Trustees of Variable Insurance Products Fund III and Shareholders of VIP Value Strategies Portfolio:
We have audited the accompanying statement of assets and liabilities of VIP Value Strategies Portfolio (the Fund), a fund of Variable Insurance Products Fund III, including the schedule of investments as of December 31, 2006, and the related statement of operations for the year then ended, the statement of changes in net assets for each of the two years in the period then ended, and the financial highlights for each of the five years in the period then ended. These financial statements and financial highlights are the responsibility of the Fund's management. Our responsibility is to express an opinion on these financial statements and financial highlights based on our audits.
We conducted our audits in accordance with standards of the Public Company Accounting Oversight Board (United States). Those standards require that we plan and perform the audit to obtain reasonable assurance about whether the financial statements and financial highlights are free of material misstatement. The Fund is not required to have, nor were we engaged to perform, an audit of its internal control over financial reporting. Our audits included consideration of internal control over financial reporting as a basis for designing audit procedures that are appropriate in the circumstances, but not for the purpose of expressing an opinion on the effectiveness of the Fund's internal control over financial reporting. Accordingly, we express no such opinion. An audit also includes examining, on a test basis, evidence supporting the amounts and disclosures in the financial statements, assessing the accounting principles used and significant estimates made by management, as well as evaluating the overall financial statement presentation. Our procedures included confirmation of securities owned as of December 31, 2006, by correspondence with the custodians and brokers; where replies were not received from brokers, we performed other auditing procedures. We believe that our audits provide a reasonable basis for our opinion.
In our opinion, the financial statements and financial highlights referred to above present fairly, in all material respects, the financial position of VIP Value Strategies Portfolio as of December 31, 2006, the results of its operations for the year then ended, the changes in its net assets for each of the two years in the period then ended, and its financial highlights for each of the five years in the period then ended, in conformity with accounting principles generally accepted in the United States of America.
/s/ Deloitte & Touche LLP
DELOITTE & TOUCHE LLP
Boston, Massachusetts
February 13, 2007
Annual Report
Trustees and Officers
The Trustees, Member of the Advisory Board, and executive officers of the trust and fund, as applicable, are listed below. The Board of Trustees governs the fund and is responsible for protecting the interests of shareholders. The Trustees are experienced executives who meet periodically throughout the year to oversee the fund's activities, review contractual arrangements with companies that provide services to the fund, and review the fund's performance. Each of the Trustees oversees 348 funds advised by FMR or an affiliate.
The Trustees hold office without limit in time except that (a) any Trustee may resign; (b) any Trustee may be removed by written instrument, signed by at least two-thirds of the number of Trustees prior to such removal; (c) any Trustee who requests to be retired or who has become incapacitated by illness or injury may be retired by written instrument signed by a majority of the other Trustees; and (d) any Trustee may be removed at any special meeting of shareholders by a two-thirds vote of the outstanding voting securities of the trust. Each Trustee who is not an interested person (as defined in the 1940 Act) (Independent Trustee), shall retire not later than the last day of the calendar year in which his or her 72nd birthday occurs. The Independent Trustees may waive this mandatory retirement age policy with respect to individual Trustees. The executive officers and Advisory Board Member hold office without limit in time, except that any officer and Advisory Board Member may resign or may be removed by a vote of a majority of the Trustees at any regular meeting or any special meeting of the Trustees. Except as indicated, each individual has held the office shown or other offices in the same company for the past five years.
The fund's Statement of Additional Information (SAI) includes more information about the Trustees. To request a free copy, call Fidelity at 1-877-208-0098.
Interested Trustees*:
Correspondence intended for each Trustee who is an interested person may be sent to Fidelity Investments, 82 Devonshire Street, Boston, Massachusetts 02109.
Name, Age; Principal Occupation
Edward C. Johnson 3d (76)
Year of Election or Appointment: 1994
Mr. Johnson is Chairman of the Board of Trustees. Mr. Johnson serves as President (2006-present), Chief Executive Officer, Chairman, and a Director of FMR Corp.; Chairman and a Director of FMR; Chairman and a Director of Fidelity Research & Analysis Company (FRAC); Chairman and a Director of Fidelity Investments Money Management, Inc.; and Chairman (2001-present) and a Director of FMR Co., Inc. In addition, Mr. Johnson serves as Chairman and Director of Fidelity International Limited (FIL).
Robert L. Reynolds (54)
Year of Election or Appointment: 2003
Mr. Reynolds is President and a Director of FMR (2005-present), Fidelity Investments Money Management, Inc. (2005-present), and FMR Co., Inc. (2005-present). Mr. Reynolds also serves as Vice Chairman (2006-present), a Director (2003-present), and Chief Operating Officer of FMR Corp. and a Director of Strategic Advisers, Inc. (2005-present). He also serves on the Board at Fidelity Investments Canada, Ltd.
* Trustees have been determined to be "Interested Trustees" by virtue of, among other things, their affiliation with the trust or various entities under common control with FMR.
Independent Trustees:
Correspondence intended for each Independent Trustee (that is, the Trustees other than the Interested Trustees) may be sent to Fidelity Investments, P.O. Box 55235, Boston, Massachusetts 02205-5235.
Name, Age; Principal Occupation
Dennis J. Dirks (58)
Year of Election or Appointment: 2005
Prior to his retirement in May 2003, Mr. Dirks was Chief Operating Officer and a member of the Board of The Depository Trust & Clearing Corporation (DTCC) (1999-2003). He also served as President, Chief Operating Officer, and Board member of The Depository Trust Company (DTC) (1999-2003) and President and Board member of the National Securities Clearing Corporation (NSCC) (1999-2003). In addition, Mr. Dirks served as Chief Executive Officer and Board member of the Government Securities Clearing Corporation (2001-2003) and Chief Executive Officer and Board member of the Mortgage-Backed Securities Clearing Corporation (2001-2003). Mr. Dirks also serves as a Trustee and a member of the Finance Committee of Manhattan College (2005-present) and a Trustee and a member of the Finance Committee of AHRC of Nassau County (2006-present).
Albert R. Gamper, Jr. (64)
Year of Election or Appointment: 2006
Prior to his retirement in December 2004, Mr. Gamper served as Chairman of the Board of CIT Group Inc. (commercial finance). During his tenure with CIT Group Inc. Mr. Gamper served in numerous senior management positions, including Chairman (1987-1989; 1999-2001; 2002-2004), Chief Executive Officer (1987-2004), and President (1989-2002). He currently serves as a member of the Board of Directors of Public Service Enterprise Group (utilities, 2001-present), Chairman of the Board of Governors, Rutgers University (2004-present), and Chairman of the Board of Saint Barnabas Health Care System.
George H. Heilmeier (70)
Year of Election or Appointment: 2004
Dr. Heilmeier is Chairman Emeritus of Telcordia Technologies (communication software and systems), where prior to his retirement, he served as company Chairman and Chief Executive Officer. He currently serves on the Boards of Directors of The Mitre Corporation (systems engineering and information technology support for the government), and HRL Laboratories (private research and development, 2004-present). He is Chairman of the General Motors Science & Technology Advisory Board and a Life Fellow of the Institute of Electrical and Electronics Engineers (IEEE). Dr. Heilmeier is a member of the Defense Science Board and the National Security Agency Advisory Board. He is also a member of the National Academy of Engineering, the American Academy of Arts and Sciences, and the Board of Overseers of the School of Engineering and Applied Science of the University of Pennsylvania. Previously, Dr. Heilmeier served as a Director of TRW Inc. (automotive, space, defense, and information technology, 1992-2002), Compaq (1994-2002), Automatic Data Processing, Inc. (ADP) (technology-based business outsourcing, 1995-2002), INET Technologies Inc. (telecommunications network surveillance, 2001-2004), and Teletech Holdings (customer management services). He is the recipient of the 2005 Kyoto Prize in Advanced Technology for his invention of the liquid crystal display, and a member of the Consumer Electronics Hall of Fame.
James H. Keyes (66)
Year of Election or Appointment: 2007
Prior to his retirement in 2003, Mr. Keyes was Chairman, President, and Chief Executive Officer of Johnson Controls, Inc. (automotive supplier, 1993-2003). He currently serves as a member of the boards of LSI Logic Corporation (semiconductor technologies), Navistar International Corporation (manufacture and sale of trucks, buses, and diesel engines, 2002-present), and Pitney Bowes, Inc. (integrated mail, messaging, and document management solutions).
Marie L. Knowles (60)
Year of Election or Appointment: 2001
Prior to Ms. Knowles' retirement in June 2000, she served as Executive Vice President and Chief Financial Officer of Atlantic Richfield Company (ARCO) (diversified energy, 1996-2000). From 1993 to 1996, she was a Senior Vice President of ARCO and President of ARCO Transportation Company. She served as a Director of ARCO from 1996 to 1998. She currently serves as a Director of Phelps Dodge Corporation (copper mining and manufacturing) and McKesson Corporation (healthcare service, 2002-present). Ms. Knowles is a Trustee of the Brookings Institution and the Catalina Island Conservancy and also serves as a member of the Advisory Board for the School of Engineering of the University of Southern California.
Ned C. Lautenbach (62)
Year of Election or Appointment: 2000
Mr. Lautenbach is Chairman of the Independent Trustees (2006-present). Mr. Lautenbach has been a partner of Clayton, Dubilier & Rice, Inc. (private equity investment firm) since September 1998. Previously, Mr. Lautenbach was with the International Business Machines Corporation (IBM) from 1968 until his retirement in 1998. Mr. Lautenbach serves as a Director of Sony Corporation (2006-present) and Eaton Corporation (diversified industrial) as well as the Philharmonic Center for the Arts in Naples, Florida. He also is a member of the Board of Trustees of Fairfield University (2005-present), as well as a member of the Council on Foreign Relations.
Cornelia M. Small (62)
Year of Election or Appointment: 2005
Ms. Small is a member (2000-present) and Chairperson (2002-present) of the Investment Committee, and a member (2002- present) of the Board of Trustees of Smith College. Previously, she served as Chief Investment Officer (1999-2000), Director of Global Equity Investments (1996-1999), and a member of the Board of Directors of Scudder, Stevens & Clark (1990-1997) and Scudder Kemper Investments (1997-1999). In addition, Ms. Small served as Co-Chair (2000-2003) of the Annual Fund for the Fletcher School of Law and Diplomacy.
William S. Stavropoulos (67)
Year of Election or Appointment: 2002
Mr. Stavropoulos is Chairman Emeritus of the Board of Directors of The Dow Chemical Company. Since joining The Dow Chemical Company in 1967, Mr. Stavropoulos served in numerous senior management positions, including President (1993-2000; 2002-2003), CEO (1995-2000; 2002-2004), and Chairman of the Executive Committee (2000-2004). Currently, he is a Director of NCR Corporation (data warehousing and technology solutions), BellSouth Corporation (telecommunications), Chemical Financial Corporation, Maersk Inc. (industrial conglomerate, 2002-present), and Metalmark Capital (private equity investment firm, 2005-present). He also serves as a member of the Board of Trustees of the American Enterprise Institute for Public Policy Research. In addition, Mr. Stavropoulos is a member of The Business Council, J.P. Morgan International Council and the University of Notre Dame Advisory Council for the College of Science.
Kenneth L. Wolfe (67)
Year of Election or Appointment: 2005
Prior to his retirement in 2001, Mr. Wolfe was Chairman and Chief Executive Officer of Hershey Foods Corporation (1993-2001). He currently serves as a member of the boards of Adelphia Communications Corporation (2003-present), Bausch & Lomb, Inc., and Revlon Inc. (2004-present).
Advisory Board Member and Executive Officers:
Correspondence intended for each executive officer and Mr. Lynch may be sent to Fidelity Investments, 82 Devonshire Street, Boston, Massachusetts 02109.
Name, Age; Principal Occupation
Peter S. Lynch (62)
Year of Election or Appointment: 2003
Member of the Advisory Board of Variable Insurance Products Fund III. Mr. Lynch is Vice Chairman and a Director of FMR, and Vice Chairman (2001-present) and a Director of FMR Co., Inc. Previously, Mr. Lynch served as a Trustee of the Fidelity funds (1990-2003). In addition, he serves as a Trustee of Boston College and as the Chairman of the Inner-City Scholarship Fund.
Kimberley H. Monasterio (43)
Year of Election or Appointment: 2007
President and Treasurer of VIP Value Strategies. Ms. Monasterio also serves as President and Treasurer of other Fidelity funds (2007-present) and is an employee of FMR (2004-present). Previously, Ms. Monasterio served as Deputy Treasurer of the Fidelity funds (2004-2006). Before joining Fidelity Investments, Ms. Monasterio served as Treasurer (2000-2004) and Chief Financial Officer (2002-2004) of the Franklin Templeton Funds and Senior Vice President of Franklin Templeton Services, LLC (2000-2004). Deputy Treasurer of. Ms. Monasterio also serves as Deputy Treasurer of other Fidelity funds (2004) and is an employee of FMR (2004). Before joining Fidelity Investments, Ms. Monasterio served as Treasurer (2000-2004) and Chief Financial Officer (2002-2004) of the Franklin Templeton Funds and Senior Vice President of Franklin Templeton Services, LLC (2000-2004).
Dwight D. Churchill (53)
Year of Election or Appointment: 2005
Vice President of VIP Value Strategies. Mr. Churchill also serves as Vice President of certain Equity Funds (2005-present). Mr. Churchill is Executive Vice President of FMR (2005-present) and FMR Co., Inc. (2005-present). Previously, Mr. Churchill served as Senior Vice President of Fidelity Investments Money Management, Inc. (2005-2006), Head of Fidelity's Fixed-Income Division (2000-2005), Vice President of Fidelity's Money Market Funds (2000-2005), Vice President of Fidelity's Bond Funds, and Senior Vice President of FMR.
Bruce T. Herring (41)
Year of Election or Appointment: 2006
Vice President of VIP Value Strategies. Mr. Herring also serves as Vice President of certain Equity Funds (2006-present). Mr. Herring is Senior Vice President of FMR (2006-present) and Vice President of FMR Co., Inc. (2001-present). Previously, Mr. Herring served as a portfolio manager for Fidelity U.S. Equity Funds (2001-2005).
Eric M. Wetlaufer (44)
Year of Election or Appointment: 2006
Vice President of VIP Value Strategies. Mr. Wetlaufer also serves as Vice President of certain International Equity Funds (2006- present). Mr. Wetlaufer is Senior Vice President of FMR (2006-present) and FMR Co., Inc. (2006-present), and President and Director of Fidelity Management & Research (U.K.) Inc. (2006-present) and Fidelity Research & Analysis Company (2006-present). Before joining Fidelity Investments in 2005, Mr. Wetlaufer was a partner in Oxhead Capital Management (2004-2005). Previously, Mr. Wetlaufer served as a Chief Investment Officer of Putnam Investments (1997-2003).
Matthew Friedman (35)
Year of Election or Appointment: 2006
Vice President of VIP Value Strategies. Mr. Friedman also serves as Vice President to other funds advised by FMR. Prior to assuming his current responsibilities, Mr. Friedman worked as a research analyst and portfolio manager. Prior to joining Fidelity, Mr. Friedman was an investment banking analyst for Lehman Brothers in New York. Mr. Friedman also serves as a Vice President of FMR and FMR Co., Inc. (2006).
Eric D. Roiter (58)
Year of Election or Appointment: 2002
Secretary of VIP Value Strategies. He also serves as Secretary of other Fidelity funds; Vice President, General Counsel, and Secretary of FMR Co., Inc. (2001-present) and FMR; Assistant Secretary of Fidelity Management & Research (U.K.) Inc. (2001-present), Fidelity Research & Analysis Company (2001-present), and Fidelity Investments Money Management, Inc. (2001-present). Mr. Roiter is an Adjunct Member, Faculty of Law, at Boston College Law School (2003-present). Previously, Mr. Roiter served as Vice President and Secretary of Fidelity Distributors Corporation (FDC) (1998-2005).
Stuart Fross (47)
Year of Election or Appointment: 2003
Assistant Secretary of VIP Value Strategies. Mr. Fross also serves as Assistant Secretary of other Fidelity funds (2003-present), Vice President and Secretary of FDC (2005-present), and is an employee of FMR.
R. Stephen Ganis (40)
Year of Election or Appointment: 2006
Anti-Money Laundering (AML) officer of VIP Value Strategies. Mr. Ganis also serves as AML officer of other Fidelity funds (2006-present) and FMR Corp. (2003-present). Before joining Fidelity Investments, Mr. Ganis practiced law at Goodwin Procter, LLP (2000-2002).
Joseph B. Hollis (58)
Year of Election or Appointment: 2006
Chief Financial Officer of VIP Value Strategies. Mr. Hollis also serves as Chief Financial Officer of other Fidelity funds. Mr. Hollis is President of Fidelity Pricing and Cash Management Services (FPCMS) (2005-present). Mr. Hollis also serves as President and Director of Fidelity Service Company, Inc. (2006-present). Previously, Mr. Hollis served as Senior Vice President of Cash Management Services (1999-2002) and Investment Management Operations (2002-2005).
Kenneth A. Rathgeber (59)
Year of Election or Appointment: 2004
Chief Compliance Officer of VIP Value Strategies. Mr. Rathgeber also serves as Chief Compliance Officer of other Fidelity funds (2004-present) and Executive Vice President of Risk Oversight for Fidelity Investments (2002-present). He is Chief Compliance Officer of FMR (2005-present), FMR Co., Inc. (2005-present), Fidelity Management & Research (U.K.) Inc. (2005-present), Fidelity Research & Analysis Company (2005-present), Fidelity Investments Money Management, Inc. (2005-present), and Strategic Advisers, Inc. (2005-present). Previously, Mr. Rathgeber served as Executive Vice President and Chief Operating Officer for Fidelity Investments Institutional Services Company, Inc. (1998-2002).
Bryan A. Mehrmann (45)
Year of Election or Appointment: 2005
Deputy Treasurer of VIP Value Strategies. Mr. Mehrmann also serves as Deputy Treasurer of other Fidelity funds (2005-present) and is an employee of FMR. Previously, Mr. Mehrmann served as Vice President of Fidelity Investments Institutional Services Group (FIIS)/Fidelity Investments Institutional Operations Corporation, Inc. (FIIOC) Client Services (1998-2004).
Kenneth B. Robins (37)
Year of Election or Appointment: 2005
Deputy Treasurer of VIP Value Strategies. Mr. Robins also serves as Deputy Treasurer of other Fidelity funds (2005-present) and is an employee of FMR (2004-present). Before joining Fidelity Investments, Mr. Robins worked at KPMG LLP, where he was a partner in KPMG's department of professional practice (2002-2004) and a Senior Manager (1999-2000). In addition, Mr. Robins served as Assistant Chief Accountant, United States Securities and Exchange Commission (2000-2002).
Robert G. Byrnes (40)
Year of Election or Appointment: 2005
Assistant Treasurer of VIP Value Strategies. Mr. Byrnes also serves as Assistant Treasurer of other Fidelity funds (2005-present) and is an employee of FMR (2005-present). Previously, Mr. Byrnes served as Vice President of FPCMS (2003-2005). Before joining Fidelity Investments, Mr. Byrnes worked at Deutsche Asset Management where he served as Vice President of the Investment Operations Group (2000-2003).
John H. Costello (60)
Year of Election or Appointment: 2002
Assistant Treasurer of VIP Value Strategies. Mr. Costello also serves as Assistant Treasurer of other Fidelity funds and is an employee of FMR.
Peter L. Lydecker (52)
Year of Election or Appointment: 2004
Assistant Treasurer of VIP Value Strategies. Mr. Lydecker also serves as Assistant Treasurer of other Fidelity funds (2004) and is an employee of FMR.
Mark Osterheld (51)
Year of Election or Appointment: 2002
Assistant Treasurer of VIP Value Strategies. Mr. Osterheld also serves as Assistant Treasurer of other Fidelity funds (2002) and is an employee of FMR.
Gary W. Ryan (48)
Year of Election or Appointment: 2005
Assistant Treasurer of VIP Value Strategies. Mr. Ryan also serves as Assistant Treasurer of other Fidelity funds (2005-present) and is an employee of FMR (2005-present). Previously, Mr. Ryan served as Vice President of Fund Reporting in FPCMS (1999-2005).
Salvatore Schiavone (41)
Year of Election or Appointment: 2005
Assistant Treasurer of VIP Value Strategies. Mr. Schiavone also serves as Assistant Treasurer of other Fidelity funds (2005-present) and is an employee of FMR (2005-present). Before joining Fidelity Investments, Mr. Schiavone worked at Deutsche Asset Management, where he most recently served as Assistant Treasurer (2003-2005) of the Scudder Funds and Vice President and Head of Fund Reporting (1996-2003).
Annual Report
Distributions
The Board of Trustees of VIP III Value Strategies Portfolio voted to pay to shareholders of record at the opening of business on record date, the following distributions per share derived from capital gains realized from sales of portfolio securities, and dividends derived from net investment income:
Pay Date
Record Date
Dividends
Capital Gains
Initial Class
02/09/07
02/09/07
$.079
$1.52
Service Class
02/09/07
02/09/07
$.066
$1.52
Service Class 2
02/09/07
02/09/07
$.049
$1.52
Investor Class
02/09/07
02/09/07
$.075
$1.52
The fund hereby designates as a capital gain dividend with respect to the taxable year ended December 31, 2006, $15,613,845 or, if subsequently determined to be different, the net capital gain of such year.
Investor Class designates 34%, Initial Class designates 35%, Service Class designates 36%, and Service Class 2 designates 39% of the dividends distributed during the fiscal year as qualifying for the dividends-received deduction for corporate shareholders.
The fund will notify shareholders in January 2007 of amounts for use in preparing 2006 income tax returns.
Annual Report
Proxy Voting Results
A special meeting of the fund's shareholders was held on November 15, 2006. The results of votes taken among shareholders on the proposal before them are reported below. Each vote reported represents one dollar of net asset value held on the record date for the meeting.
PROPOSAL 1
To elect a Board of Trustees. A
# of Votes
% of Votes
Dennis J. Dirks
Affirmative
8,022,573,906.52
96.057
Withheld
329,291,624.43
3.943
TOTAL
8,351,865,530.95
100.000
Albert R. Gamper, Jr.
Affirmative
8,017,939,119.36
96.002
Withheld
333,926,411.59
3.998
TOTAL
8,351,865,530.95
100.000
Robert M. Gates
Affirmative
8,011,581,068.50
95.926
Withheld
340,284,462.45
4.074
TOTAL
8,351,865,530.95
100.000
George H. Heilmeier
Affirmative
8,000,846,196.79
95.797
Withheld
351,019,334.16
4.203
TOTAL
8,351,865,530.95
100.000
Edward C. Johnson 3d
Affirmative
7,992,112,301.22
95.693
Withheld
359,753,229.73
4.307
TOTAL
8,351,865,530.95
100.000
Stephen P. Jonas
Affirmative
8,019,883,742.95
96.025
Withheld
331,981,788.00
3.975
TOTAL
8,351,865,530.95
100.000
James H. KeyesB
Affirmative
8,015,436,547.06
95.972
Withheld
336,428,983.89
4.028
TOTAL
8,351,865,530.95
100.000
Marie L. Knowles
Affirmative
8,015,361,874.49
95.971
Withheld
336,503,656.46
4.029
TOTAL
8,351,865,530.95
100.000
Ned C. Lautenbach
Affirmative
8,018,503,793.25
96.009
Withheld
333,361,737.70
3.991
TOTAL
8,351,865,530.95
100.000
# of Votes
% of Votes
William O. McCoy
Affirmative
8,000,170,571.19
95.789
Withheld
351,694,959.76
4.211
TOTAL
8,351,865,530.95
100.000
Robert L. Reynolds
Affirmative
8,020,815,676.67
96.036
Withheld
331,049,854.28
3.964
TOTAL
8,351,865,530.95
100.000
Cornelia M. Small
Affirmative
8.020,146,516.32
96.028
Withheld
331,719,014.63
3.972
TOTAL
8,351,865,530.95
100.000
William S. Stavropoulos
Affirmative
8,009,250,640.78
95.898
Withheld
342,614,890.17
4.102
TOTAL
8,351,865,530.95
100.000
Kenneth L. Wolfe
Affirmative
8,013,187,941.55
95.945
Withheld
338,677,589.40
4.055
TOTAL
8,351,865,530.95
100.000
ADenotes trust-wide proposal and voting results.
BEffective on or about January 1, 2007.
Annual Report
Board Approval of Investment Advisory Contracts and Management Fees
VIP Value Strategies Portfolio
Each year, typically in July, the Board of Trustees, including the Independent Trustees (together, the Board), votes on the renewal of the management contract and sub-advisory agreements (together, the Advisory Contracts) for the fund. The Board, assisted by the advice of fund counsel and Independent Trustees' counsel, requests and considers a broad range of information throughout the year.
The Board meets regularly each month except August and takes into account throughout the year matters bearing on Advisory Contracts. The Board, acting directly and through its separate committees, considers at each of its meetings factors that are relevant to the annual renewal of the fund's Advisory Contracts, including the services and support provided to the fund and its shareholders. At the time of the renewal, the Board had 12 standing committees, each composed of Independent Trustees with varying backgrounds, to which the Board has assigned specific subject matter responsibilities in order to enhance effective decision-making by the Board. Each committee has adopted a written charter outlining the structure and purposes of the committee. One such committee, the Equity Contract Committee, meets periodically as needed throughout the year to consider matters specifically related to the annual renewal of Advisory Contracts. The committee requests and receives information on, and makes recommendations to the Independent Trustees concerning, the approval and annual review of the Advisory Contracts.
At its July 2006 meeting, the Board of Trustees, including the Independent Trustees, unanimously determined to renew the Advisory Contracts for the fund. In reaching its determination, the Board considered all factors it believed relevant, including (i) the nature, extent, and quality of the services to be provided to the fund and its shareholders (including the investment performance of the fund); (ii) the competitiveness of the management fee and total expenses of the fund; (iii) the total costs of the services to be provided by and the profits to be realized by the investment adviser and its affiliates from the relationship with the fund; (iv) the extent to which economies of scale would be realized as the fund grows; and (v) whether fee levels reflect these economies of scale, if any, for the benefit of fund shareholders.
In determining whether to renew the Advisory Contracts for the fund, the Board ultimately reached a determination, with the assistance of fund counsel and Independent Trustees' counsel, that the renewal of the Advisory Contracts and the compensation to be received by Fidelity under the management contract is consistent with Fidelity's fiduciary duty under applicable law. In addition to evaluating the specific factors noted above, the Board, in reaching its determination, is aware that shareholders in the fund have a broad range of investment choices available to them, including a wide choice among mutual funds offered by competitors to Fidelity, and that the fund's shareholders, with the opportunity to review and weigh the disclosure provided by the fund in its prospectus and other public disclosures, have chosen to invest in this fund, managed by Fidelity.
Nature, Extent, and Quality of Services Provided. The Board considered staffing within the investment adviser, FMR, and the sub-advisers (together, the Investment Advisers), including the background of the fund's portfolio manager and the fund's investment objective and discipline. The Independent Trustees also had discussions with senior management of Fidelity's investment operations and investment groups. The Board considered the structure of the portfolio manager compensation program and whether this structure provides appropriate incentives.
Resources Dedicated to Investment Management and Support Services. The Board reviewed the size, education, and experience of the Investment Advisers' investment staff, their use of technology, and the Investment Advisers' approach to recruiting, training, and retaining portfolio managers and other research, advisory, and management personnel. The Board considered Fidelity's extensive global research capabilities that enable the Investment Advisers to aggregate data from various sources in an effort to produce positive investment results. The Board noted that Fidelity's analysts have access to a variety of technological tools that enable them to perform both fundamental and quantitative analysis and to specialize in various disciplines. The Board also considered that Fidelity's portfolio managers and analysts have access to daily portfolio attribution that allows for monitoring of a fund's portfolio, as well as an electronic communication system that provides immediate real-time access to research concerning issuers and credit enhancers.
Shareholder and Administrative Services. The Board considered (i) the nature, extent, quality, and cost of administrative, distribution, and shareholder services performed by the Investment Advisers and their affiliates under the Advisory Contracts and under separate agreements covering transfer agency, pricing and bookkeeping, and securities lending services for the fund; (ii) the nature and extent of the Investment Advisers' supervision of third party service providers, principally custodians and subcustodians; and (iii) the resources devoted to, and the record of compliance with, the fund's compliance policies and procedures. The Board reviewed the allocation of fund brokerage, including allocations to brokers affiliated with the Investment Advisers, the use of brokerage commissions to pay fund expenses, and the use of "soft" commission dollars to pay for research services. The Board also considered that Fidelity voluntarily pays for market data out of its own resources.
The Board noted that the growth of fund assets across the complex allows Fidelity to reinvest in the development of services designed to enhance the value or convenience of the Fidelity funds as investment vehicles. These services include 24-hour access to account information and market information through phone representatives and over the Internet, and investor education materials and asset allocation tools.
Investment in a Large Fund Family. The Board considered the benefits to shareholders of investing in a Fidelity fund, including the benefits of investing in a fund that is part of a large family of funds offering a variety of investment disciplines and providing for a large variety of mutual fund investor services. The Board noted that, since the last Advisory Contract renewals in July 2005, Fidelity has taken a number of actions that benefited particular funds, including (i) dedicating additional resources to investment research and to restructure the investment research teams; (ii) voluntarily entering into contractual arrangements with certain brokers pursuant to which Fidelity pays for research products and services separately out of its own resources, rather than bundling with fund commissions; (iii) launching the Fidelity Advantage Class of its five Spartan stock index funds and three Spartan bond index funds, which is a lower-fee class available to shareholders with higher account balances; (iv) contractually agreeing to impose expense limitations on Fidelity U.S. Bond Index Fund and reducing the fund's initial investment minimum; and (v) offering shareholders of each of the Fidelity Institutional Money Market Funds the privilege of exchanging shares of the fund for shares of other Fidelity funds.
Annual Report
Board Approval of Investment Advisory Contracts and Management Fees - continued
Investment Performance and Compliance. The Board considered whether the fund has operated within its investment objective, as well as its record of compliance with its investment restrictions. It also reviewed the fund's absolute investment performance for each class (except Investor Class), as well as the fund's relative investment performance for each class (except Investor Class) measured against (i) a broad-based securities market index, and (ii) a peer group of mutual funds deemed appropriate by the Board over multiple periods. Because the fund had been in existence less than five calendar years, the following charts considered by the Board show, over the one- and three-year periods ended December 31, 2005, the cumulative total returns of Service Class 2 and Initial Class of the fund, the cumulative total returns of a broad-based securities market index ("benchmark"), and a range of cumulative total returns of a peer group of mutual funds identified by Lipper Inc. as having an investment objective similar to that of the fund. The returns of Service Class 2 and Initial Class represent the performance of classes with the highest and lowest 12b-1 fees, respectively (not necessarily with the highest and lowest total expenses). (Investor Class of the fund, which has no 12b-1 fee, had less than one year of performance as of December 31, 2005.) The box within each chart shows the 25th percentile return (bottom of box) and the 75th percentile return (top of box) of the Lipper peer group. Returns shown above the box are in the first quartile and returns shown below the box are in the fourth quartile. The percentage beaten numbers noted below each chart correspond to the percentile box and represent the percentage of funds in the Lipper peer group whose performance was equal to or lower than that of the class indicated.
VIP Value Strategies Portfolio
The Board reviewed the fund's relative investment performance against its Lipper peer group and stated that the performance of Initial Class of the fund was in the fourth quartile for the one-year period and the first quartile for the three-year period. The Board also stated that the relative investment performance of the fund was lower than its benchmark for all the periods shown. The Board considered that the variations in performance among the fund's classes reflect the variations in class expenses, which result in lower performance for higher expense classes. The Board also reviewed the fund's relative investment performance against a peer group defined by Morningstar.
The Board considered that FMR has taken steps to refocus and strengthen equity research, equity portfolio management, and compliance. The Board noted with favor FMR's reorganization of its senior management team in 2005 and FMR's dedication of additional resources to investment research, and participated in the process that led to those changes.
Based on its review, and giving particular weight to the nature and quality of the resources dedicated by the Investment Advisers to maintain and improve relative performance, the Board concluded that the nature, extent, and quality of the services provided to the fund will benefit the fund's shareholders, particularly in light of the Board's view that the fund's shareholders benefit from investing in a fund that is part of a large family of funds offering a variety of investment disciplines and services.
Competitiveness of Management Fee and Total Fund Expenses. The Board considered the fund's management fee and total expenses compared to "mapped groups" of competitive funds and classes. Fidelity creates "mapped groups" by combining similar Lipper investment objective categories that have comparable management fee characteristics. Combining Lipper investment objective categories aids the Board's management fee and total expense comparisons by broadening the competitive group used for comparison and by reducing the number of universes to which various Fidelity funds are compared.
VIP Value Strategies Portfolio
The Board considered two proprietary management fee comparisons for the 12-month (or shorter) periods shown in the chart below. The group of Lipper funds used by the Board for management fee comparisons is referred to below as the "Total Mapped Group" and, for the reasons explained above, is broader than the Lipper peer group used by the Board for performance comparisons. The Total Mapped Group comparison focuses on a fund's standing relative to the total universe of comparable funds available to investors, in terms of gross management fees before expense reimbursements or caps. "TMG %" represents the percentage of funds in the Total Mapped Group that had management fees that were lower than the fund's. For example, a TMG % of 6% means that 94% of the funds in the Total Mapped Group had higher management fees than the fund. The "Asset-Size Peer Group" (ASPG) comparison focuses on a fund's standing relative to non-Fidelity funds similar in size to the fund within the Total Mapped Group. The ASPG represents at least 15% of the funds in the Total Mapped Group with comparable asset size and management fee characteristics, subject to a minimum of 50 funds (or all funds in the Total Mapped Group if fewer than 50). Additional information, such as the ASPG quartile in which the fund's management fee ranked, is also included in the chart and considered by the Board.
VIP Value Strategies Portfolio
The Board noted that the fund's management fee ranked below the median of its Total Mapped Group and below the median of its ASPG for 2005.
Based on its review, the Board concluded that the fund's management fee was fair and reasonable in light of the services that the fund receives and the other factors considered.
In its review of each class's total expenses, the Board considered the fund's management fee as well as other fund or class expenses, as applicable, such as transfer agent fees, pricing and bookkeeping fees, fund-paid 12b-1 fees, and custodial, legal, and audit fees. The Board also noted the effects of any waivers and reimbursements on fees and expenses. As part of its review, the Board also considered current and historical total expenses of each class of the fund compared to competitive fund median expenses. Each class of the fund is compared to those funds and classes in the Total Mapped Group (used by the Board for management fee comparisons) that have a similar sales load structure.
The Board noted that the total expenses of each class ranked below its competitive median for 2005.
In its review of total expenses, the Board also considered Fidelity fee structures and other information on clients that FMR and its affiliates service in other competitive markets, such as other mutual funds advised or subadvised by FMR or its affiliates, pension plan clients, and other institutional clients.
Based on its review, the Board concluded that the total expenses of each class of the fund were reasonable in light of the services that the fund and its shareholders receive and the other factors considered.
Costs of the Services and Profitability. The Board considered the revenues earned and the expenses incurred by Fidelity in conducting the business of developing, marketing, distributing, managing, administering and servicing the fund and its shareholders. The Board also considered the level of Fidelity's profits in respect of all the Fidelity funds.
Annual Report
Board Approval of Investment Advisory Contracts and Management Fees - continued
On an annual basis, FMR presents to the Board Fidelity's profitability for the fund. Fidelity calculates the profitability for each fund, as well as aggregate profitability for groups of Fidelity funds and all Fidelity funds, using a series of detailed revenue and cost allocation methodologies which originate with the audited books and records of Fidelity. The Audit Committee of the Board reviews any significant changes from the prior year's methodologies.
PricewaterhouseCoopers LLP (PwC), independent registered accounting firm and auditor to Fidelity and certain Fidelity funds, has been engaged annually by the Board as part of the Board's assessment of the results of Fidelity's profitability analysis. PwC's engagement includes the review and assessment of Fidelity's methodologies used in determining the revenues and expenses attributable to Fidelity's mutual fund business, and completion of agreed-upon procedures surrounding the mathematical accuracy of fund profitability and its conformity to allocation methodologies. After considering PwC's reports issued under the engagement and information provided by Fidelity, the Board believes that while other allocation methods may also be reasonable, Fidelity's profitability methodologies are reasonable in all material respects.
The Board has also reviewed Fidelity's non-fund businesses and any fall-out benefits related to the mutual fund business as well as cases where Fidelity's affiliates may benefit from or be related to the fund's business.
The Board considered the costs of the services provided by and the profits realized by Fidelity in connection with the operation of the fund and determined that the amount of profit is a fair entrepreneurial profit for the management of the fund.
Economies of Scale. The Board considered whether there have been economies of scale in respect of the management of the Fidelity funds, whether the Fidelity funds (including the fund) have appropriately benefited from any such economies of scale, and whether there is potential for realization of any further economies of scale. The Board considered the extent to which the fund will benefit from economies of scale through increased services to the fund, through waivers or reimbursements, or through fee or expense reductions.
The Board recognized that the fund's management contract incorporates a "group fee" structure, which provides for lower fee rates as total fund assets under FMR's management increase, and for higher fee rates as total fund assets under FMR's management decrease. The Board considered that the group fee is designed to deliver the benefits of economies of scale to fund shareholders when total fund assets increase, even if assets of any particular fund are unchanged or have declined, because some portion of Fidelity's costs are attributable to services provided to all Fidelity funds, and all funds benefit if those costs can be allocated among more assets. The Board concluded that, given the group fee structure, fund shareholders will achieve a certain level of economies of scale as assets under FMR's management increase at the fund complex level, regardless of whether Fidelity achieves any such economies of scale.
The Board further concluded that any potential economies of scale are being shared between fund shareholders and Fidelity in an appropriate manner.
Additional Information Requested by the Board. In order to develop fully the factual basis for consideration of the Advisory Contracts, the Board requested additional information on several topics, including (i) Fidelity's fund profitability methodology and profitability trends within certain funds; (ii) portfolio manager compensation; (iii) the extent to which any economies of scale exist and are shared between the funds and Fidelity; (iv) the total expenses of certain funds and classes relative to competitors, including the extent to which the expenses of certain funds have been or could be capped; (v) fund performance trends; and (vi) Fidelity's fee structures, including use of performance fees.
Based on its evaluation of all of the conclusions noted above, and after considering all material factors, the Board ultimately concluded that the advisory fee structures are fair and reasonable, and that the fund's Advisory Contracts should be renewed.
VIP Value Strategies Portfolio
Annual Report
VIP Value Strategies Portfolio
Annual Report
Investment Adviser
Fidelity Management & Research Company Boston, MA
Investment Sub-Advisers
FMR Co., Inc.
Fidelity Management & Research (U.K.) Inc.
Fidelity Research & Analysis Company (formerly Fidelity Management & Research (Far East) Inc.)
Fidelity Investments Japan Limited
Fidelity International Investment Advisors
Fidelity International Investment Advisors (U.K.) Limited
General Distributor
Fidelity Distributors Corporation Boston, MA
Transfer and Service Agents
Fidelity Investments Institutional Operations Company, Inc. Boston, MA
Fidelity Service Company, Inc. Boston, MA
Custodian
Mellon Bank, N.A. Pittsburgh, PA
VIPVS-ANN-0207 1.781994.104
Item 2. Code of Ethics
As of the end of the period, December 31, 2006, Variable Insurance Products Fund III (the trust) has adopted a code of ethics, as defined in Item 2 of Form N-CSR, that applies to its President and Treasurer and its Chief Financial Officer. A copy of the code of ethics is filed as an exhibit to this Form N-CSR.
Item 3. Audit Committee Financial Expert
The Board of Trustees of the trust has determined that Marie L. Knowles is an audit committee financial expert, as defined in Item 3 of Form N-CSR. Ms. Knowles is independent for purposes of Item 3 of Form N-CSR.
Item 4. Principal Accountant Fees and Services
(a) Audit Fees.
For the fiscal years ended December 31, 2006 and December 31, 2005, the aggregate Audit Fees billed by Deloitte & Touche LLP, the member firms of Deloitte Touche Tohmatsu, and their respective affiliates (collectively, "Deloitte Entities") for professional services rendered for the audits of the financial statements, or services that are normally provided in connection with statutory and regulatory filings or engagements for those fiscal years, for Aggressive Growth Portfolio, Balanced Portfolio, Dynamic Capital Appreciation Portfolio, Growth & Income Portfolio, Growth Opportunities Portfolio, and Value Strategies Portfolio (the funds) and for all funds in the Fidelity Group of Funds are shown in the table below.
Fund
2006A
2005A
Aggressive Growth Portfolio
$27,000
$30,000
Balanced Portfolio
$37,000
$38,000
Dynamic Capital Appreciation Portfolio
$33,000
$30,000
Growth & Income Portfolio
$41,000
$35,000
Growth Opportunities Portfolio
$37,000
$34,000
Value Strategies Portfolio
$30,000
$30,000
All funds in the Fidelity Group of Funds audited by Deloitte Entities
$6,700,000
$5,700,000
A
Aggregate amounts may reflect rounding.
For the fiscal years ended December 31, 2006 and December 31, 2005, the aggregate Audit Fees billed by PricewaterhouseCoopers LLP (PwC) for professional services rendered for the audits of the financial statements, or services that are normally provided in connection with statutory and regulatory filings or engagements for those fiscal years, for Mid Cap Portfolio (the fund) and for all funds in the Fidelity Group of Funds are shown in the table below.
Fund
2006A
2005A
Mid Cap Portfolio
$60,000
$44,000
All funds in the Fidelity Group of Funds audited by PwC
$13,900,000
$12,300,000
A
Aggregate amounts may reflect rounding.
(b) Audit-Related Fees.
In each of the fiscal years ended December 31, 2006 and December 31, 2005, the aggregate Audit-Related Fees billed by Deloitte Entities for services rendered for assurance and related services to each fund that are reasonably related to the performance of the audit or review of the fund's financial statements, but not reported as Audit Fees, are shown in the table below.
Fund
2006 A
2005A
Aggressive Growth Portfolio
$0
$0
Balanced Portfolio
$0
$0
Dynamic Capital Appreciation Portfolio
$0
$0
Growth & Income Portfolio
$0
$0
Growth Opportunities Portfolio
$0
$0
Value Strategies Portfolio
$0
$0
A
Aggregate amounts may reflect rounding.
In each of the fiscal years ended December 31, 2006 and December 31, 2005, the aggregate Audit-Related Fees billed by PwC for services rendered for assurance and related services to the fund that are reasonably related to the performance of the audit or review of the fund's financial statements, but not reported as Audit Fees, are shown in the table below.
Fund
2006 A
2005 A
Mid Cap Portfolio
$0
$0
A
Aggregate amounts may reflect rounding.
In each of the fiscal years ended December 31, 2006 and December 31, 2005, the aggregate Audit-Related Fees that were billed by PwC and Deloitte Entities that were required to be approved by the Audit Committee for services rendered on behalf of Fidelity Management & Research Company (FMR) and entities controlling, controlled by, or under common control with FMR (not including any sub-adviser whose role is primarily portfolio management and is subcontracted with or overseen by another investment adviser) that provide ongoing services to the funds ("Fund Service Providers") for assurance and related services that relate directly to the operations and financial reporting of each fund that are reasonably related to the performance of the audit or review of the fund's financial statements, but not reported as Audit Fees, are shown in the table below.
Billed By
2006A
2005 A
PwC
$0
$0
Deloitte Entities
$0
$0
A
Aggregate amounts may reflect rounding.
Fees included in the audit-related category comprise assurance and related services (e.g., due diligence services) that are traditionally performed by the independent registered public accounting firm. These audit-related services include due diligence related to mergers and acquisitions, accounting consultations and audits in connection with acquisitions, internal control reviews, attest services that are not required by statute or regulation and consultation concerning financial accounting and reporting standards.
(c) Tax Fees.
In each of the fiscal years ended December 31, 2006 and December 31, 2005, the aggregate Tax Fees billed by Deloitte Entities for professional services rendered for tax compliance, tax advice, and tax planning for each fund is shown in the table below.
Fund
2006 A
2005 A
Aggressive Growth Portfolio
$4,600
$3,900
Balanced Portfolio
$4,600
$4,200
Dynamic Capital Appreciation Portfolio
$4,500
$3,900
Growth & Income Portfolio
$4,600
$4,200
Growth Opportunities Portfolio
$4,600
$4,200
Value Strategies Portfolio
$4,500
$3,600
A
Aggregate amounts may reflect rounding.
In each of the fiscal years ended December 31, 2006 and December 31, 2005, the aggregate Tax Fees billed by PwC for professional services rendered for tax compliance, tax advice, and tax planning for the fund is shown in the table below.
Fund
2006 A
2005 A
Mid Cap Portfolio
$2,400
$2,200
A
Aggregate amounts may reflect rounding.
In each of the fiscal years ended December 31, 2006 and December 31, 2005, the aggregate Tax Fees billed by PwC and Deloitte Entities that were required to be approved by the Audit Committee for professional services rendered on behalf of the Fund Service Providers for tax compliance, tax advice, and tax planning that relate directly to the operations and financial reporting of each fund is shown in the table below.
Billed By
2006 A
2005 A
PwC
$0
$0
Deloitte Entities
$0
$0
A
Aggregate amounts may reflect rounding.
Fees included in the Tax Fees category comprise all services performed by professional staff in the independent registered public accounting firm's tax division except those services related to the audit. Typically, this category would include fees for tax compliance, tax planning, and tax advice. Tax compliance, tax advice, and tax planning services include preparation of original and amended tax returns, claims for refund and tax payment-planning services, assistance with tax audits and appeals, tax advice related to mergers and acquisitions and requests for rulings or technical advice from taxing authorities.
(d) All Other Fees.
In each of the fiscal years ended December 31, 2006 and December 31, 2005, the aggregate Other Fees billed by Deloitte Entities for all other non-audit services rendered to the funds is shown in the table below.
Fund
2006 A
2005 A
Aggressive Growth Portfolio
$0
$0
Balanced Portfolio
$0
$0
Dynamic Capital Appreciation Portfolio
$0
$0
Growth & Income Portfolio
$0
$0
Growth Opportunities Portfolio
$0
$0
Value Strategies Portfolio
$0
$0
A
Aggregate amounts may reflect rounding.
In each of the fiscal years ended December 31, 2006 and December 31, 2005, the aggregate Other Fees billed by PwC for all other non-audit services rendered to the fund is shown in the table below.
Fund
2006 A
2005 A
Mid Cap Portfolio
$5,800
$5,100
A
Aggregate amounts may reflect rounding.
In each of the fiscal years ended December 31, 2006 and December 31, 2005, the aggregate Other Fees billed by PwC and Deloitte Entities that were required to be approved by the Audit Committee for all other non-audit services rendered on behalf of the Fund Service Providers that relate directly to the operations and financial reporting of each fund is shown in the table below.
Billed By
2006 A
2005 A
PwC
$125,000
$190,000
Deloitte Entities
$180,000
$160,000
A
Aggregate amounts may reflect rounding.
Fees included in the All Other Fees category include services related to internal control reviews, strategy and other consulting, financial information systems design and implementation, consulting on other information systems, and other tax services unrelated to the fund.
(e) (1)
Audit Committee Pre-Approval Policies and Procedures:
The trust's Audit Committee must pre-approve all audit and non-audit services provided by the independent registered public accounting firm relating to the operations or financial reporting of the funds. Prior to the commencement of any audit or non-audit services to a fund, the Audit Committee reviews the services to determine whether they are appropriate and permissible under applicable law.
The trust's Audit Committee has adopted policies and procedures to, among other purposes, provide a framework for the Committee's consideration of non-audit services by the audit firms that audit the Fidelity funds. The policies and procedures require that any non-audit service provided by a fund audit firm to a Fidelity Fund and any non-audit service provided by a fund auditor to a Fund Service Provider that relates directly to the operations and financial reporting of a Fidelity fund (Covered Service) are subject to approval by the Audit Committee before such service is provided. Non-audit services provided by a fund audit firm for a Fund Service Provider that do not relate directly to the operations and financial reporting of a Fidelity fund (Non-Covered Service) but that are expected to exceed $50,000 are also subject to pre-approval by the Audit Committee.
All Covered Services, as well as Non-Covered Services that are expected to exceed $50,000, must be approved in advance of provision of the service either: (i) by formal resolution of the Audit Committee, or (ii) by oral or written approval of the service by the Chair of the Audit Committee (or if the Chair is unavailable, such other member of the Audit Committee as may be designated by the Chair to act in the Chair's absence). The approval contemplated by (ii) above is permitted where the Treasurer determines that action on such an engagement is necessary before the next meeting of the Audit Committee. Neither pre-approval nor advance notice of Non-Covered Service engagements for which fees are not expected to exceed $50,000 is required; such engagements are to be reported to the Audit Committee monthly.
(e) (2)
Services approved pursuant to paragraph (c)(7)(i)(C) of Rule 2-01 of Regulation S-X:
Audit-Related Fees:
There were no amounts that were approved by the Audit Committee pursuant to the de minimis exception for the fiscal years ended December 31, 2006 and December 31, 2005 on behalf of each fund.
There were no amounts that were required to be approved by the Audit Committee pursuant to the de minimis exception for the fiscal years ended December 31, 2006 and December 31, 2005 on behalf of the Fund Service Providers that relate directly to the operations and financial reporting of each fund.
Tax Fees:
There were no amounts that were approved by the Audit Committee pursuant to the de minimis exception for the fiscal years ended December 31, 2006 and December 31, 2005 on behalf of each fund.
There were no amounts that were required to be approved by the Audit Committee pursuant to the de minimis exception for the fiscal years ended December 31, 2006 and December 31, 2005 on behalf of the Fund Service Providers that relate directly to the operations and financial reporting of each fund.
All Other Fees:
There were no amounts that were approved by the Audit Committee pursuant to the de minimis exception for the fiscal years ended December 31, 2006 and December 31, 2005 on behalf of each fund.
There were no amounts that were required to be approved by the Audit Committee pursuant to the de minimis exception for the fiscal years ended December 31, 2006 and December 31, 2005 on behalf of the Fund Service Providers that relate directly to the operations and financial reporting of each fund.
(f)Not applicable.
(g) For the fiscal years ended December 31, 2006 and December 31, 2005, the aggregate fees billed by Deloitte Entities of $745,000A and $450,000A,B for non-audit services rendered on behalf of the fund, FMR (not including any sub-adviser whose role is primarily portfolio management and is subcontracted with or overseen by another investment adviser) and Fund Service Providers relating to Covered Services and Non-Covered Services are shown in the table below.
2006 A
2005 A
Covered Services
$210,000
$200,000
Non-Covered Services
$535,000
$250,000 B
A
Aggregate amounts may reflect rounding.
B
Reflects current period presentation.
For the fiscal years ended December 31, 2006 and December 31, 2005, the aggregate fees billed by PwC of $1,325,000A and $1,290,000 A,B for non-audit services rendered on behalf of the funds, FMR (not including any sub-adviser whose role is primarily portfolio management and is subcontracted with or overseen by another investment adviser) and Fund Service Providers relating to Covered Services and Non-Covered Services are shown in the table below.
2006 A
2005 A
Covered Services
$135,000
$200,000
Non-Covered Services
$1,190,000
$1,090,000B
A
Aggregate amounts may reflect rounding.
B
Reflects current period presentation.
(h) The trust's Audit Committee has considered Non-Covered Services that were not pre-approved that were provided by PwC and Deloitte Entities to Fund Service Providers to be compatible with maintaining the independence of PwC and Deloitte Entities in their audit of the funds, taking into account representations from PwC and Deloitte Entities, in accordance with Independence Standards Board Standard No.1, regarding their independence from the funds and their related entities.
Item 5. Audit Committee of Listed Registrants
Not applicable.
Item 6. Schedule of Investments
Not applicable.
Item 7. Disclosure of Proxy Voting Policies and Procedures for Closed-End Management Investment Companies
Not applicable.
Item 8. Portfolio Managers of Closed-End Management Investment Companies
Not applicable.
Item 9. Purchase of Equity Securities by Closed-End Management Investment Company and Affiliated Purchasers
Not applicable.
Item 10. Submission of Matters to a Vote of Security Holders
There were no material changes to the procedures by which shareholders may recommend nominees to the trust's Board of Trustees.
Item 11. Controls and Procedures
(a)(i) The President and Treasurer and the Chief Financial Officer have concluded that the trust's disclosure controls and procedures (as defined in Rule 30a-3(c) under the Investment Company Act) provide reasonable assurances that material information relating to the trust is made known to them by the appropriate persons, based on their evaluation of these controls and procedures as of a date within 90 days of the filing date of this report.
(a)(ii) There was no change in the trust's internal control over financial reporting (as defined in Rule 30a-3(d) under the Investment Company Act) that occurred during the second fiscal quarter of the period covered by this report that has materially affected, or is reasonably likely to materially affect, the trust's internal control over financial reporting.
Item 12. Exhibits
(a)
(1)
Code of Ethics pursuant to Item 2 of Form N-CSR is filed and attached hereto as EX-99.CODE ETH.
(a)
(2)
Certification pursuant to Rule 30a-2(a) under the Investment Company Act of 1940 (17 CFR 270.30a-2(a)) is filed and attached hereto as Exhibit 99.CERT.
(a)
(3)
Not applicable.
(b)
Certification pursuant to Rule 30a-2(b) under the Investment Company Act of 1940 (17 CFR 270.30a-2(b)) is furnished and attached hereto as Exhibit 99.906CERT.
SIGNATURES
Pursuant to the requirements of the Securities Exchange Act of 1934 and the Investment Company Act of 1940, the registrant has duly caused this report to be signed on its behalf by the undersigned, thereunto duly authorized.
Variable Insurance Products Fund III
By:
/s/Kimberley Monasterio
Kimberley Monasterio
President and Treasurer
Date:
February 26, 2007
Pursuant to the requirements of the Securities Exchange Act of 1934 and the Investment Company Act of 1940, this report has been signed below by the following persons on behalf of the registrant and in the capacities and on the dates indicated.
By:
/s/Kimberley Monasterio
Kimberley Monasterio
President and Treasurer
Date:
February 26, 2007
By:
/s/Joseph B. Hollis
Joseph B. Hollis
Chief Financial Officer
Date:
February 26, 2007
We use cookies on this site to provide a more responsive and personalized service. Continuing to browse, clicking I Agree, or closing this banner indicates agreement. See our Cookie Policy for more information.