UNITED STATES
SECURITIES AND EXCHANGE COMMISSION
Washington, D.C. 20549
FORM N-CSR
CERTIFIED SHAREHOLDER REPORT OF REGISTERED
MANAGEMENT INVESTMENT COMPANIES
Investment Company Act file number 811-7205
Variable Insurance Products Fund III
(Exact name of registrant as specified in charter)
82 Devonshire St., Boston, Massachusetts 02109
(Address of principal executive offices) (Zip code)
Eric D. Roiter, Secretary
82 Devonshire St.
Boston, Massachusetts 02109
(Name and address of agent for service)
Registrant's telephone number, including area code: 617-563-7000
Date of fiscal year end: | December 31 |
| |
Date of reporting period: | December 31, 2004 |
Item 1. Reports to Stockholders
Fidelity® Variable Insurance Products:
Aggressive Growth Portfolio
Annual Report
December 31, 2004
(2_fidelity_logos) Registered_Trademark)
Contents
Performance | 3 | How the fund has done over time. |
Management's Discussion | 4 | The manager's review of fund performance, strategy and outlook. |
Shareholder Expense Example | 5 | An example of shareholder expenses. |
Investment Summary | 6 | A summary of the fund's investments at period end. |
Investments | 7 | A complete list of the fund's investments with their
market values. |
Financial Statements | 12 | Statements of assets and liabilities, operations, and
changes in net assets, as well as financial highlights. |
Notes | 16 | Notes to the financial statements. |
Report of Independent Registered Public Accounting Firm | 19 | |
Trustees and Officers | 20 | |
Proxy Voting Results | 25 | |
| | |
To view a fund's proxy voting guidelines and proxy voting record for the 12-month period ended June 30, visit www.fidelity.com/proxyvotingresults or visit the Securities and Exchange Commission's (SEC) web site at www.sec.gov. You may also call 1-800-544-5429 to request a free copy of the proxy voting guidelines.
Fidelity Variable Insurance Products are separate account options which are purchased through a variable insurance contract.
Standard & Poor's, S&P and S&P 500 are registered service marks of The McGraw-Hill Companies, Inc. and have been licensed for use by Fidelity Distributors Corporation.
Other third party marks appearing herein are the property of their respective owners.
All other marks appearing herein are registered or unregistered trademarks or service marks of FMR Corp. or an affiliated company.
(Recycle graphic) This report is printed on recycled paper using soy-based inks.
This report and the financial statements contained herein are submitted for the general information of the shareholders of the fund. This report is not authorized for distribution to prospective investors in the fund unless preceded or accompanied by an effective prospectus.
A fund files its complete schedule of portfolio holdings with the SEC for the first and third quarters of each fiscal year on Form N-Q. Forms N-Q are available on the SEC's web site at http://www.sec.gov. A fund's Forms N-Q may be reviewed and copied at the SEC's Public Reference Room in Washington, DC. Information regarding the operation of the SEC's Public Reference Room may be obtained by calling 1-800-SEC-0330. For a complete list of a fund's portfolio holdings, view the most recent quarterly holdings report, semiannual report, or annual report on Fidelity's web site at http://www.advisor.fidelity.com.
NOT FDIC INSURED · MAY LOSE VALUE · NO BANK GUARANTEE
Neither the fund nor Fidelity Distributors Corporation is a bank.
Aggressive Growth Portfolio
Fidelity Variable Insurance Products: Aggressive Growth Portfolio
Performance: The Bottom Line
Average annual total return reflects the change in the value of an investment, assuming reinvestment of the class' dividend income and capital gains (the profits earned upon the sale of securities that have grown in value) and assuming a constant rate of performance each year. During periods of reimbursement by Fidelity, a fund's total return will be greater than it would be had the reimbursement not occurred. Performance numbers are net of all underlying fund operating expenses, but do not include any insurance charges imposed by your insurance company's separate account. If performance information included the effect of these additional charges, the total returns would have been lower. How a fund did yesterday is no guarantee of how it will do tomorrow.
Average Annual Total Returns
Periods ended December 31, 2004 | | Past 1
year | Life of
fund A |
Fidelity® VIP: Aggressive Growth - Initial Class | | 10.25% | -3.36% |
Fidelity VIP: Aggressive Growth - Service ClassB | | 10.23% | -3.30% |
Fidelity VIP: Aggressive Growth - Service Class 2C | | 9.96% | -3.64% |
A From December 27, 2000.
B Performance for Service Class shares reflects an asset-based service fee (12b-1 fee).
C Performance for Service Class 2 shares reflects an asset-based service fee (12b-1 fee).
$10,000 Over Life of Fund
Let's say hypothetically that $10,000 was invested in Fidelity® Variable Insurance Products: Aggressive Growth Portfolio - Initial Class on December 27, 2000, when the fund started. The chart shows how the value of your investment would have changed, and also shows how the Russell Midcap® Growth Index performed over the same period.
Annual Report
Fidelity Variable Insurance Products: Aggressive Growth Portfolio
Comments from Rajiv Kaul, Portfolio Manager of Fidelity® Variable Insurance Products: Aggressive Growth Portfolio
The year ending December 31, 2004, generally was positive for equity investors, as many stock market benchmarks produced double-digit gains. Broad-based themes included the continued dominance of small-cap stocks, which outperformed large-caps for the sixth consecutive year. The small-cap Russell 2000® Index was up 18.33% in 2004, while the larger-cap Standard & Poor's 500SM Index rose 10.88%. Value stocks ended the year well ahead of growth stocks: The Russell 3000® Value Index advanced 16.94%, compared to 6.93% for the Russell 3000 Growth Index. Energy and basic materials stocks led the market upward. Energy stocks were boosted by record-high oil prices, while strong demand from China helped support commodity prices. The health care sector was among the market's weakest performers. Technology also fell off the pace, though it was helped by a rally late in the year. The tech-heavy NASDAQ Composite® Index returned 9.15%, thanks primarily to a 14.87% jump in the fourth quarter. Elsewhere, the Dow Jones Industrial AverageSM gained 5.37% for the year.
For the 12 months ending December 31, 2004, the fund trailed both the 15.48% return of the Russell Midcap® Growth Index and the 15.30% return of the LipperSM Variable Annuity Mid-Cap Funds Average. My picks in the semiconductor and telecommunication services groups held back performance. In semiconductors, Microchip Technology detracted from the fund's return, as it suffered from slack demand in the chip market. Millennium Pharmaceuticals was the fund's largest detractor in absolute terms and compared with the index. The stock experienced downside volatility even as the company continued to narrow its losses. Conversely, stock selection in the software and services area was helpful to the fund's relative performance, and my picks in the pharmaceuticals and biotechnology group also were a positive overall. Irish drug stock Elan was by far the fund's best performer - both in absolute terms and compared with the index. The stock was boosted by the Food and Drug Administration's approval of Tysabri - formerly known as Antegren - the company's drug for relapsing forms of multiple sclerosis. Internet portal Yahoo! also turned in a strong performance, as online advertising continued to grow.
The views expressed in this statement reflect those of the portfolio manager only through the end of the period of the report as stated on the cover and do not necessarily represent the views of Fidelity or any other person in the Fidelity organization. Any such views are subject to change at any time based upon market or other conditions and Fidelity disclaims any responsibility to update such views. These views may not be relied on as investment advice and, because investment decisions for a Fidelity fund are based on numerous factors, may not be relied on as an indication of trading intent on behalf of any Fidelity fund.
Aggressive Growth Portfolio
Fidelity Variable Insurance Products: Aggressive Growth Portfolio
As a shareholder of the Fund, you incur two types of costs: (1) transaction costs, and (2) ongoing costs, including management fees, distribution and/or service (12b-1) fees and other Fund expenses. This Example is intended to help you understand your ongoing costs (in dollars) of investing in the Fund and to compare these costs with the ongoing costs of investing in other mutual funds.
The Example is based on an investment of $1,000 invested at the beginning of the period and held for the entire period (July 1, 2004 to December 31, 2004).
Actual Expenses
The first line of the table below for each class of the Fund provides information about actual account values and actual expenses. You may use the information in this line, together with the amount you invested, to estimate the expenses that you paid over the period. Simply divide your account value by $1,000.00 (for example, an $8,600 account value divided by $1,000.00 = 8.6), then multiply the result by the number in the first line for a class of the Fund under the heading entitled "Expenses Paid During Period" to estimate the expenses you paid on your account during this period. The estimate of expenses does not include any fees or other expenses of any variable annuity or variable life insurance product. If they were, the estimate of expenses you paid during the period would be higher, and your ending account value would be lower.
Hypothetical Example for Comparison Purposes
The second line of the table below for each class of the Fund provides information about hypothetical account values and hypothetical expenses based on a Class' actual expense ratio and an assumed rate of return of 5% per year before expenses, which is not the Class' actual return. The hypothetical account values and expenses may not be used to estimate the actual ending account balance or expenses you paid for the period. You may use this information to compare the ongoing costs of investing in the Fund and other funds. To do so, compare this 5% hypothetical example with the 5% hypothetical examples that appear in the shareholder reports of the other funds. The estimate of expenses does not include any fees or other expenses of any variable annuity or variable life insurance product. If they were, the estimate of expenses you paid during the period would be higher, and your ending account value would be lower.
Please note that the expenses shown in the table are meant to highlight your ongoing costs only and do not reflect any transaction costs. Therefore, the second line of the table is useful in comparing ongoing costs only, and will not help you determine the relative total costs of owning different funds.
| Beginning
Account Value
July 1, 2004 | Ending
Account Value
December 31, 2004 | Expenses Paid
During Period*
July 1, 2004
to December 31, 2004 |
Initial Class | | | |
Actual | $ 1,000.00 | $ 1,027.10 | $ 5.10** |
HypotheticalA | $ 1,000.00 | $ 1,020.11 | $ 5.08** |
Service Class | | | |
Actual | $ 1,000.00 | $ 1,025.90 | $ 5.60** |
HypotheticalA | $ 1,000.00 | $ 1,019.61 | $ 5.58** |
Service Class 2 | | | |
Actual | $ 1,000.00 | $ 1,026.20 | $ 6.37** |
HypotheticalA | $ 1,000.00 | $ 1,018.85 | $ 6.34** |
A 5% return per year before expenses
* Expenses are equal to each Class' annualized expense ratio (shown in the table below); multiplied by the average account value over the period, multiplied by 184/366 (to reflect the one-half year period).
| Annualized
Expense Ratio |
Initial Class | 1.00%** |
Service Class | 1.10%** |
Service Class 2 | 1.25%** |
** If changes to voluntary expense limitations effective February 1, 2005 had been in effect during the period, the annualized expense ratio and the expenses paid in the actual and hypothetical examples above would have been as follows:
| Annualized
Expense Ratio | Expenses Paid |
Initial Class | .90% | |
Actual | | $ 4.59 |
HypotheticalA | | $ 4.57 |
Service Class | 1.00% | |
Actual | | $ 5.09 |
HypotheticalA | | $ 5.08 |
Service Class 2 | 1.15% | |
Actual | | $ 5.86 |
HypotheticalA | | $ 5.84 |
A 5% return per year before expenses
Annual Report
Fidelity Variable Insurance Products: Aggressive Growth Portfolio
Top Five Stocks as of December 31, 2004 |
| % of fund's net assets |
Genentech, Inc. | 3.5 |
Biogen Idec, Inc. | 3.4 |
Elan Corp. PLC sponsored ADR | 2.8 |
Juniper Networks, Inc. | 2.1 |
Biomet, Inc. | 1.9 |
| 13.7 |
Top Five Market Sectors as of December 31, 2004 |
| % of fund's net assets |
Health Care | 30.9 |
Information Technology | 26.1 |
Consumer Discretionary | 14.3 |
Industrials | 7.6 |
Energy | 4.7 |
Asset Allocation as of December 31, 2004 |
% of fund's net assets * |
 | Stocks | 92.5% | |
 | Short-Term Investments and Net Other Assets | 7.5% | |

* Foreign investments 5.6% | |
Aggressive Growth Portfolio
Fidelity Variable Insurance Products: Aggressive Growth Portfolio
Showing Percentage of Net Assets
Common Stocks - 92.5% |
| Shares | | Value (Note 1) |
CONSUMER DISCRETIONARY - 14.3% |
Auto Components - 0.1% |
Gentex Corp. | 200 | | $ 7,404 |
Johnson Controls, Inc. | 100 | | 6,344 |
| | 13,748 |
Hotels, Restaurants & Leisure - 4.1% |
Brinker International, Inc. (a) | 980 | | 34,369 |
California Pizza Kitchen, Inc. (a) | 730 | | 16,790 |
Harrah's Entertainment, Inc. | 280 | | 18,729 |
Hilton Hotels Corp. | 1,600 | | 36,384 |
Krispy Kreme Doughnuts, Inc. (a) | 500 | | 6,300 |
Mandalay Resort Group | 260 | | 18,312 |
Marriott International, Inc. Class A | 570 | | 35,899 |
Outback Steakhouse, Inc. | 470 | | 21,517 |
Penn National Gaming, Inc. (a) | 591 | | 35,785 |
Starbucks Corp. (a) | 540 | | 33,674 |
Station Casinos, Inc. | 500 | | 27,340 |
Sunterra Corp. (a) | 300 | | 4,212 |
The Cheesecake Factory, Inc. (a) | 645 | | 20,943 |
Wendy's International, Inc. | 1,100 | | 43,186 |
Yum! Brands, Inc. | 2,240 | | 105,683 |
| | 459,123 |
Household Durables - 2.0% |
Black & Decker Corp. | 560 | | 49,465 |
Fortune Brands, Inc. | 900 | | 69,462 |
Garmin Ltd. | 400 | | 24,336 |
Harman International Industries, Inc. | 460 | | 58,420 |
Mohawk Industries, Inc. (a) | 240 | | 21,900 |
| | 223,583 |
Internet & Catalog Retail - 0.6% |
eBay, Inc. (a) | 600 | | 69,768 |
eDiets.com, Inc. (a) | 100 | | 445 |
| | 70,213 |
Leisure Equipment & Products - 0.6% |
Brunswick Corp. | 900 | | 44,550 |
Polaris Industries, Inc. | 300 | | 20,406 |
| | 64,956 |
Media - 2.1% |
E.W. Scripps Co. Class A | 1,040 | | 50,211 |
Entercom Communications Corp.
Class A (a) | 220 | | 7,896 |
Getty Images, Inc. (a) | 470 | | 32,360 |
Lamar Advertising Co. Class A (a) | 300 | | 12,834 |
NTL, Inc. (a) | 440 | | 32,102 |
Pixar (a) | 400 | | 34,244 |
Playboy Enterprises, Inc. Class B (non-vtg.) (a) | 100 | | 1,229 |
Radio One, Inc. Class D (non-vtg.) (a) | 300 | | 4,836 |
The New York Times Co. Class A | 300 | | 12,240 |
|
| Shares | | Value (Note 1) |
Westwood One, Inc. (a) | 350 | | $ 9,426 |
XM Satellite Radio Holdings, Inc.
Class A (a) | 1,100 | | 41,382 |
| | 238,760 |
Multiline Retail - 0.9% |
Big Lots, Inc. (a) | 860 | | 10,432 |
Dollar General Corp. | 600 | | 12,462 |
Dollar Tree Stores, Inc. (a) | 830 | | 23,804 |
Family Dollar Stores, Inc. | 650 | | 20,300 |
Nordstrom, Inc. | 600 | | 28,038 |
| | 95,036 |
Specialty Retail - 3.1% |
Abercrombie & Fitch Co. Class A | 600 | | 28,170 |
AutoZone, Inc. (a) | 190 | | 17,349 |
Bed Bath & Beyond, Inc. (a) | 800 | | 31,864 |
Chico's FAS, Inc. (a) | 1,200 | | 54,636 |
Circuit City Stores, Inc. | 400 | | 6,256 |
Foot Locker, Inc. | 300 | | 8,079 |
Hot Topic, Inc. (a) | 140 | | 2,407 |
Kirkland's, Inc. (a) | 300 | | 3,687 |
PETsMART, Inc. | 1,590 | | 56,493 |
Pier 1 Imports, Inc. | 300 | | 5,910 |
RadioShack Corp. | 300 | | 9,864 |
Ross Stores, Inc. | 2,560 | | 73,907 |
Weight Watchers International, Inc. (a) | 700 | | 28,749 |
Williams-Sonoma, Inc. (a) | 580 | | 20,323 |
| | 347,694 |
Textiles, Apparel & Luxury Goods - 0.8% |
Coach, Inc. (a) | 1,490 | | 84,036 |
NIKE, Inc. Class B | 70 | | 6,348 |
| | 90,384 |
TOTAL CONSUMER DISCRETIONARY | | 1,603,497 |
CONSUMER STAPLES - 1.7% |
Food & Staples Retailing - 0.3% |
Whole Foods Market, Inc. | 350 | | 33,373 |
Food Products - 1.1% |
Bunge Ltd. | 200 | | 11,402 |
Del Monte Foods Co. (a) | 3,100 | | 34,162 |
Hershey Foods Corp. | 1,000 | | 55,540 |
McCormick & Co., Inc. (non-vtg.) | 500 | | 19,300 |
Smithfield Foods, Inc. (a) | 200 | | 5,918 |
| | 126,322 |
Personal Products - 0.3% |
Estee Lauder Companies, Inc. Class A | 800 | | 36,616 |
TOTAL CONSUMER STAPLES | | 196,311 |
ENERGY - 4.7% |
Energy Equipment & Services - 3.5% |
Baker Hughes, Inc. | 2,800 | | 119,476 |
Common Stocks - continued |
| Shares | | Value (Note 1) |
ENERGY - continued |
Energy Equipment & Services - continued |
BJ Services Co. | 30 | | $ 1,396 |
Cooper Cameron Corp. (a) | 920 | | 49,505 |
ENSCO International, Inc. | 520 | | 16,505 |
Halliburton Co. | 200 | | 7,848 |
Nabors Industries Ltd. (a) | 290 | | 14,874 |
Noble Corp. (a) | 560 | | 27,854 |
Patterson-UTI Energy, Inc. | 1,580 | | 30,731 |
Smith International, Inc. (a) | 920 | | 50,057 |
Weatherford International Ltd. (a) | 1,330 | | 68,229 |
| | 386,475 |
Oil & Gas - 1.2% |
Ashland, Inc. | 200 | | 11,676 |
EOG Resources, Inc. | 360 | | 25,690 |
Pioneer Natural Resources Co. | 1,310 | | 45,981 |
Teekay Shipping Corp. | 900 | | 37,899 |
XTO Energy, Inc. | 500 | | 17,690 |
| | 138,936 |
TOTAL ENERGY | | 525,411 |
FINANCIALS - 3.5% |
Capital Markets - 2.2% |
Ameritrade Holding Corp. (a) | 1,800 | | 25,596 |
Deutsche Bank AG (NY Shares) | 100 | | 8,901 |
E*TRADE Financial Corp. (a) | 2,200 | | 32,890 |
Eaton Vance Corp. (non-vtg.) | 770 | | 40,156 |
Federated Investors, Inc. Class B (non-vtg.) | 470 | | 14,288 |
Investors Financial Services Corp. | 100 | | 4,998 |
Legg Mason, Inc. | 750 | | 54,945 |
SEI Investments Co. | 500 | | 20,965 |
T. Rowe Price Group, Inc. | 360 | | 22,392 |
Waddell & Reed Financial, Inc. Class A | 730 | | 17,440 |
| | 242,571 |
Commercial Banks - 0.4% |
North Fork Bancorp, Inc., New York | 540 | | 15,579 |
Synovus Financial Corp. | 830 | | 23,721 |
UnionBanCal Corp. | 100 | | 6,448 |
| | 45,748 |
Real Estate - 0.0% |
Catellus Development Corp. | 12 | | 367 |
Thrifts & Mortgage Finance - 0.9% |
Countrywide Financial Corp. | 200 | | 7,402 |
MGIC Investment Corp. | 400 | | 27,564 |
New York Community Bancorp, Inc. | 1,220 | | 25,095 |
Radian Group, Inc. | 800 | | 42,592 |
The PMI Group, Inc. | 100 | | 4,175 |
| | 106,828 |
TOTAL FINANCIALS | | 395,514 |
|
| Shares | | Value (Note 1) |
HEALTH CARE - 30.9% |
Biotechnology - 13.6% |
Alkermes, Inc. (a) | 200 | | $ 2,818 |
Amylin Pharmaceuticals, Inc. (a) | 800 | | 18,688 |
Biogen Idec, Inc. (a) | 5,800 | | 386,338 |
Celgene Corp. (a) | 1,640 | | 43,509 |
Cephalon, Inc. (a) | 400 | | 20,352 |
Charles River Laboratories International, Inc. (a) | 400 | | 18,404 |
Dendreon Corp. (a) | 2,800 | | 30,184 |
DOV Pharmaceutical, Inc. (a) | 1,800 | | 32,490 |
Dyax Corp. (a) | 900 | | 6,498 |
Enzon Pharmaceuticals, Inc. (a) | 600 | | 8,232 |
Genentech, Inc. (a) | 7,260 | | 395,228 |
Genzyme Corp. - General Division (a) | 70 | | 4,065 |
Harvard Bioscience, Inc. (a) | 600 | | 2,778 |
ICOS Corp. (a) | 100 | | 2,828 |
ImClone Systems, Inc. (a) | 2,000 | | 92,160 |
Invitrogen Corp. (a) | 200 | | 13,426 |
Medarex, Inc. (a) | 3,900 | | 42,042 |
MedImmune, Inc. (a) | 2,100 | | 56,931 |
Millennium Pharmaceuticals, Inc. (a) | 10,000 | | 121,200 |
Neurocrine Biosciences, Inc. (a) | 50 | | 2,465 |
ONYX Pharmaceuticals, Inc. (a) | 400 | | 12,956 |
Oscient Pharmaceuticals Corp. (a) | 1,946 | | 7,103 |
OSI Pharmaceuticals, Inc. (a) | 200 | | 14,970 |
Pharmion Corp. (a) | 2,100 | | 88,641 |
Protein Design Labs, Inc. (a) | 4,800 | | 99,168 |
Trimeris, Inc. (a) | 300 | | 4,251 |
| | 1,527,725 |
Health Care Equipment & Supplies - 5.8% |
Advanced Medical Optics, Inc. (a) | 400 | | 16,456 |
Baxter International, Inc. | 2,700 | | 93,258 |
Beckman Coulter, Inc. | 500 | | 33,495 |
Biomet, Inc. | 4,820 | | 209,140 |
C.R. Bard, Inc. | 1,200 | | 76,776 |
Cooper Companies, Inc. | 200 | | 14,118 |
Cytyc Corp. (a) | 900 | | 24,813 |
DENTSPLY International, Inc. | 375 | | 21,075 |
Edwards Lifesciences Corp. (a) | 900 | | 37,134 |
Inverness Medical Innovations, Inc. (a) | 300 | | 7,530 |
ResMed, Inc. (a) | 700 | | 35,770 |
Waters Corp. (a) | 600 | | 28,074 |
Zimmer Holdings, Inc. (a) | 680 | | 54,482 |
| | 652,121 |
Health Care Providers & Services - 4.7% |
AmerisourceBergen Corp. | 210 | | 12,323 |
Andrx Corp. (a) | 400 | | 8,732 |
Cerner Corp. (a) | 300 | | 15,951 |
Covance, Inc. (a) | 800 | | 31,000 |
Coventry Health Care, Inc. (a) | 525 | | 27,867 |
DaVita, Inc. (a) | 150 | | 5,930 |
Common Stocks - continued |
| Shares | | Value (Note 1) |
HEALTH CARE - continued |
Health Care Providers & Services - continued |
Health Management Associates, Inc. Class A | 1,200 | | $ 27,264 |
Henry Schein, Inc. (a) | 400 | | 27,856 |
Humana, Inc. (a) | 400 | | 11,876 |
Laboratory Corp. of America Holdings (a) | 380 | | 18,932 |
Lincare Holdings, Inc. (a) | 1,980 | | 84,447 |
McKesson Corp. | 300 | | 9,438 |
Medco Health Solutions, Inc. (a) | 19 | | 790 |
Omnicare, Inc. | 200 | | 6,924 |
PacifiCare Health Systems, Inc. (a) | 100 | | 5,652 |
Patterson Companies, Inc. (a) | 520 | | 22,563 |
Pharmaceutical Product Development, Inc. (a) | 500 | | 20,645 |
Quest Diagnostics, Inc. | 280 | | 26,754 |
Renal Care Group, Inc. (a) | 550 | | 19,795 |
Triad Hospitals, Inc. (a) | 160 | | 5,954 |
UnitedHealth Group, Inc. | 1,010 | | 88,910 |
Universal Health Services, Inc. Class B | 200 | | 8,900 |
WellChoice, Inc. (a) | 200 | | 10,680 |
WellPoint, Inc. (a) | 200 | | 23,000 |
| | 522,183 |
Pharmaceuticals - 6.8% |
Barr Pharmaceuticals, Inc. (a) | 525 | | 23,909 |
Elan Corp. PLC sponsored ADR (a) | 11,400 | | 310,650 |
Endo Pharmaceuticals Holdings, Inc. (a) | 900 | | 18,918 |
Eon Labs, Inc. (a) | 200 | | 5,400 |
Guilford Pharmaceuticals, Inc. (a) | 2,400 | | 11,880 |
Impax Laboratories, Inc. (a) | 2,900 | | 46,052 |
IVAX Corp. (a) | 700 | | 11,074 |
MGI Pharma, Inc. (a) | 3,200 | | 89,632 |
NitroMed, Inc. (a) | 1,872 | | 49,889 |
Schering-Plough Corp. | 2,000 | | 41,760 |
Sepracor, Inc. (a) | 2,500 | | 148,425 |
Watson Pharmaceuticals, Inc. (a) | 200 | | 6,562 |
| | 764,151 |
TOTAL HEALTH CARE | | 3,466,180 |
INDUSTRIALS - 7.6% |
Aerospace & Defense - 1.4% |
EADS NV | 1,200 | | 34,820 |
EDO Corp. | 700 | | 22,225 |
KVH Industries, Inc. (a) | 100 | | 980 |
Lockheed Martin Corp. | 500 | | 27,775 |
Precision Castparts Corp. | 400 | | 26,272 |
Rockwell Collins, Inc. | 1,100 | | 43,384 |
| | 155,456 |
|
| Shares | | Value (Note 1) |
Air Freight & Logistics - 0.2% |
Expeditors International of Washington, Inc. | 200 | | $ 11,176 |
Ryder System, Inc. | 100 | | 4,777 |
| | 15,953 |
Airlines - 0.3% |
Southwest Airlines Co. | 2,000 | | 32,560 |
Building Products - 0.7% |
American Standard Companies, Inc. (a) | 1,760 | | 72,723 |
Trex Co., Inc. (a) | 100 | | 5,244 |
| | 77,967 |
Commercial Services & Supplies - 2.2% |
Career Education Corp. (a) | 500 | | 20,000 |
ChoicePoint, Inc. (a) | 200 | | 9,198 |
Cintas Corp. | 870 | | 38,158 |
Corinthian Colleges, Inc. (a) | 200 | | 3,769 |
Education Management Corp. (a) | 420 | | 13,864 |
Equifax, Inc. | 570 | | 16,017 |
H&R Block, Inc. | 640 | | 31,360 |
Herman Miller, Inc. | 560 | | 15,473 |
HNI Corp. | 300 | | 12,915 |
Manpower, Inc. | 70 | | 3,381 |
Monster Worldwide, Inc. (a) | 400 | | 13,456 |
Pitney Bowes, Inc. | 860 | | 39,801 |
Robert Half International, Inc. | 1,100 | | 32,373 |
| | 249,765 |
Construction & Engineering - 0.4% |
Dycom Industries, Inc. (a) | 500 | | 15,260 |
Granite Construction, Inc. | 430 | | 11,438 |
Jacobs Engineering Group, Inc. (a) | 400 | | 19,116 |
MasTec, Inc. (a) | 200 | | 2,022 |
| | 47,836 |
Electrical Equipment - 0.2% |
AMETEK, Inc. | 100 | | 3,567 |
Rockwell Automation, Inc. | 300 | | 14,865 |
| | 18,432 |
Industrial Conglomerates - 0.4% |
Tyco International Ltd. | 1,220 | | 43,603 |
Machinery - 0.8% |
AGCO Corp. (a) | 540 | | 11,821 |
Astec Industries, Inc. (a) | 800 | | 13,768 |
Dover Corp. | 600 | | 25,164 |
ITT Industries, Inc. | 460 | | 38,847 |
SPX Corp. | 100 | | 4,006 |
| | 93,606 |
Road & Rail - 0.6% |
Burlington Northern Santa Fe Corp. | 300 | | 14,193 |
CSX Corp. | 300 | | 12,024 |
Laidlaw International, Inc. (a) | 300 | | 6,420 |
Common Stocks - continued |
| Shares | | Value (Note 1) |
INDUSTRIALS - continued |
Road & Rail - continued |
Norfolk Southern Corp. | 700 | | $ 25,333 |
Union Pacific Corp. | 100 | | 6,725 |
| | 64,695 |
Trading Companies & Distributors - 0.4% |
Fastenal Co. | 640 | | 39,398 |
MSC Industrial Direct Co., Inc. Class A | 200 | | 7,196 |
| | 46,594 |
TOTAL INDUSTRIALS | | 846,467 |
INFORMATION TECHNOLOGY - 26.1% |
Communications Equipment - 5.3% |
Andrew Corp. (a) | 500 | | 6,815 |
Arris Group, Inc. (a) | 100 | | 704 |
AudioCodes Ltd. (a) | 2,030 | | 33,718 |
Avocent Corp. (a) | 280 | | 11,346 |
Carrier Access Corp. (a) | 300 | | 3,204 |
CIENA Corp. (a) | 2,500 | | 8,350 |
Corning, Inc. (a) | 3,300 | | 38,841 |
Enterasys Networks, Inc. (a) | 2,420 | | 4,356 |
Extreme Networks, Inc. (a) | 400 | | 2,620 |
Finisar Corp. (a) | 14,400 | | 32,832 |
InterDigital Communication Corp. (a) | 300 | | 6,630 |
JDS Uniphase Corp. (a) | 2,400 | | 7,608 |
Juniper Networks, Inc. (a) | 8,800 | | 239,272 |
Motorola, Inc. | 300 | | 5,160 |
Nokia Corp. sponsored ADR | 1,400 | | 21,938 |
Polycom, Inc. (a) | 280 | | 6,530 |
Powerwave Technologies, Inc. (a) | 1,000 | | 8,480 |
QUALCOMM, Inc. | 2,900 | | 122,960 |
Sycamore Networks, Inc. (a) | 900 | | 3,654 |
Tellabs, Inc. (a) | 2,951 | | 25,349 |
| | 590,367 |
Computers & Peripherals - 2.4% |
Apple Computer, Inc. (a) | 800 | | 51,520 |
Diebold, Inc. | 1,060 | | 59,074 |
Emulex Corp. (a) | 2,800 | | 47,152 |
Hutchinson Technology, Inc. (a) | 100 | | 3,457 |
Lexmark International, Inc. Class A (a) | 940 | | 79,900 |
Maxtor Corp. (a) | 900 | | 4,770 |
Novatel Wireless, Inc. | 200 | | 3,876 |
QLogic Corp. (a) | 100 | | 3,673 |
Seagate Technology | 350 | | 6,045 |
Western Digital Corp. (a) | 800 | | 8,672 |
| | 268,139 |
Electronic Equipment & Instruments - 1.0% |
Arrow Electronics, Inc. (a) | 400 | | 9,720 |
CDW Corp. | 350 | | 23,223 |
Celestica, Inc. (sub. vtg.) (a) | 200 | | 2,817 |
|
| Shares | | Value (Note 1) |
Ingram Micro, Inc. Class A (a) | 200 | | $ 4,160 |
KEMET Corp. (a) | 700 | | 6,265 |
Sanmina-SCI Corp. (a) | 1,000 | | 8,470 |
Solectron Corp. (a) | 5,300 | | 28,249 |
Symbol Technologies, Inc. | 1,900 | | 32,870 |
| | 115,774 |
Internet Software & Services - 1.9% |
Ask Jeeves, Inc. (a) | 300 | | 8,025 |
Google, Inc. Class A | 200 | | 38,620 |
Interwoven, Inc. (a) | 600 | | 6,528 |
Retek, Inc. (a) | 534 | | 3,284 |
VeriSign, Inc. (a) | 1,600 | | 53,632 |
Vignette Corp. (a) | 4,670 | | 6,491 |
Yahoo!, Inc. (a) | 2,600 | | 97,968 |
| | 214,548 |
IT Services - 1.9% |
BearingPoint, Inc. (a) | 400 | | 3,212 |
Computer Sciences Corp. (a) | 100 | | 5,637 |
DST Systems, Inc. (a) | 400 | | 20,848 |
Fiserv, Inc. (a) | 790 | | 31,750 |
Infosys Technologies Ltd. sponsored ADR | 1,100 | | 76,241 |
Iron Mountain, Inc. (a) | 400 | | 12,196 |
SunGard Data Systems, Inc. (a) | 1,850 | | 52,411 |
The BISYS Group, Inc. (a) | 400 | | 6,580 |
| | 208,875 |
Office Electronics - 1.2% |
Xerox Corp. (a) | 500 | | 8,505 |
Zebra Technologies Corp. Class A (a) | 2,343 | | 131,864 |
| | 140,369 |
Semiconductors & Semiconductor Equipment - 8.3% |
Agere Systems, Inc.: | | | |
Class A (a) | 4,831 | | 6,618 |
Class B (a) | 4,000 | | 5,400 |
Altera Corp. (a) | 2,800 | | 57,960 |
Brooks Automation, Inc. (a) | 1,100 | | 18,942 |
Conexant Systems, Inc. (a) | 4,490 | | 8,935 |
Cree, Inc. (a) | 300 | | 12,024 |
Freescale Semiconductor, Inc. Class B | 633 | | 11,622 |
Integrated Circuit Systems, Inc. (a) | 1,600 | | 33,472 |
Integrated Device Technology, Inc. (a) | 1,800 | | 20,808 |
Intel Corp. | 5,200 | | 121,628 |
Intersil Corp. Class A | 2,600 | | 43,524 |
KLA-Tencor Corp. (a) | 80 | | 3,726 |
Lam Research Corp. (a) | 1,200 | | 34,692 |
Linear Technology Corp. | 1,000 | | 38,760 |
Maxim Integrated Products, Inc. | 1,500 | | 63,585 |
Microchip Technology, Inc. | 6,150 | | 163,959 |
Micron Technology, Inc. (a) | 840 | | 10,374 |
Novellus Systems, Inc. (a) | 900 | | 25,101 |
NVIDIA Corp. (a) | 5,063 | | 119,284 |
Photronics, Inc. (a) | 1,900 | | 31,350 |
PMC-Sierra, Inc. (a) | 7,016 | | 78,930 |
Common Stocks - continued |
| Shares | | Value (Note 1) |
INFORMATION TECHNOLOGY - continued |
Semiconductors & Semiconductor Equipment - continued |
Rambus, Inc. (a) | 300 | | $ 6,900 |
Silicon Laboratories, Inc. (a) | 80 | | 2,825 |
Taiwan Semiconductor Manufacturing Co. Ltd. sponsored ADR | 36 | | 306 |
Varian Semiconductor Equipment Associates, Inc. (a) | 300 | | 11,055 |
| | 931,780 |
Software - 4.1% |
Adobe Systems, Inc. | 1,550 | | 97,247 |
BEA Systems, Inc. (a) | 2,300 | | 20,378 |
BMC Software, Inc. (a) | 460 | | 8,556 |
Citrix Systems, Inc. (a) | 1,150 | | 28,210 |
Cognos, Inc. (a) | 200 | | 8,803 |
E.piphany, Inc. (a) | 731 | | 3,531 |
FileNET Corp. (a) | 490 | | 12,622 |
Jack Henry & Associates, Inc. | 440 | | 8,760 |
Macrovision Corp. (a) | 200 | | 5,144 |
Manhattan Associates, Inc. (a) | 100 | | 2,388 |
Mercury Interactive Corp. (a) | 1,614 | | 73,518 |
Parametric Technology Corp. (a) | 3,204 | | 18,872 |
Siebel Systems, Inc. (a) | 4,710 | | 49,455 |
TIBCO Software, Inc. (a) | 400 | | 5,336 |
VERITAS Software Corp. (a) | 3,900 | | 111,345 |
| | 454,165 |
TOTAL INFORMATION TECHNOLOGY | | 2,924,017 |
MATERIALS - 2.9% |
Chemicals - 1.1% |
Dow Chemical Co. | 400 | | 19,804 |
Ferro Corp. | 700 | | 16,233 |
Great Lakes Chemical Corp. | 400 | | 11,396 |
International Flavors & Fragrances, Inc. | 300 | | 12,852 |
Monsanto Co. | 500 | | 27,775 |
Praxair, Inc. | 700 | | 30,905 |
| | 118,965 |
Construction Materials - 0.1% |
Vulcan Materials Co. | 200 | | 10,922 |
Containers & Packaging - 0.7% |
Owens-Illinois, Inc. (a) | 860 | | 19,479 |
Pactiv Corp. (a) | 400 | | 10,116 |
Sealed Air Corp. (a) | 830 | | 44,214 |
| | 73,809 |
Metals & Mining - 1.0% |
Freeport-McMoRan Copper & Gold, Inc. Class B | 790 | | 30,202 |
Massey Energy Co. | 770 | | 26,912 |
Metal Management, Inc. | 400 | | 10,748 |
|
| Shares | | Value (Note 1) |
Nucor Corp. | 200 | | $ 10,468 |
Phelps Dodge Corp. | 400 | | 39,568 |
| | 117,898 |
TOTAL MATERIALS | | 321,594 |
TELECOMMUNICATION SERVICES - 0.8% |
Diversified Telecommunication Services - 0.3% |
Philippine Long Distance Telephone Co. sponsored ADR (a) | 200 | | 4,986 |
Sprint Corp. | 900 | | 22,365 |
XO Communications, Inc. (a) | 400 | | 1,216 |
| | 28,567 |
Wireless Telecommunication Services - 0.5% |
Alamosa Holdings, Inc. (a) | 500 | | 6,235 |
America Movil SA de CV sponsored ADR | 100 | | 5,235 |
InPhonic, Inc. | 700 | | 19,236 |
NII Holdings, Inc. (a) | 100 | | 4,745 |
USA Mobility, Inc. (a) | 300 | | 10,593 |
Wireless Facilities, Inc. (a) | 1,500 | | 14,160 |
| | 60,204 |
TOTAL TELECOMMUNICATION SERVICES | | 88,771 |
TOTAL COMMON STOCKS (Cost $8,509,171) | 10,367,762 |
Money Market Funds - 6.9% |
| | | |
Fidelity Cash Central Fund, 2.24% (b)
(Cost $766,725) | 766,725 | | 766,725 |
TOTAL INVESTMENT PORTFOLIO - 99.4% (Cost $9,275,896) | 11,134,487 |
NET OTHER ASSETS - 0.6% | | 68,755 |
NET ASSETS - 100% | $ 11,203,242 |
Legend |
(a) Non-income producing |
(b) Affiliated fund that is available only to investment companies and other accounts managed by Fidelity Investments. The rate quoted is the annualized seven-day yield of the fund at period end. A complete listing of the fund's holdings as of its most recent fiscal year end is available upon request. |
Income Tax Information |
At December 31, 2004, the fund had a capital loss carryforward of approximately $1,069,000 all of which will expire on December 31, 2010. |
See accompanying notes which are an integral part of the financial statements.
Annual Report
Fidelity Variable Insurance Products: Aggressive Growth Portfolio
Statement of Assets and Liabilities
| | |
Assets | | |
Investment in securities, at value (cost $9,275,896) - See accompanying schedule | | $ 11,134,487 |
Cash | | 11,799 |
Receivable for investments sold | | 89,323 |
Dividends receivable | | 3,535 |
Interest receivable | | 1,148 |
Prepaid expenses | | 39 |
Receivable from investment adviser for expense reductions | | 11,069 |
Other receivables | | 1,032 |
Total assets | | 11,252,432 |
| | |
Liabilities | | |
Payable for fund shares redeemed | $ 130 | |
Accrued management fee | 5,700 | |
Distribution fees payable | 1,944 | |
Other affiliated payables | 4,477 | |
Other payables and accrued expenses | 36,939 | |
Total liabilities | | 49,190 |
| | |
Net Assets | | $ 11,203,242 |
Net Assets consist of: | | |
Paid in capital | | $ 10,428,275 |
Undistributed net investment income | | 13,755 |
Accumulated undistributed net realized gain (loss) on investments and foreign currency transactions | | (1,097,379) |
Net unrealized appreciation (depreciation) on investments | | 1,858,591 |
Net Assets | | $ 11,203,242 |
Initial Class:
Net Asset Value, offering price and redemption price per share ($1,031,013 ÷ 118,343 shares) | | $ 8.71 |
| | |
Service Class:
Net Asset Value, offering price and redemption price per share ($1,059,361 ÷ 121,296 shares) | | $ 8.73 |
| | |
Service Class 2:
Net Asset Value, offering price and redemption price per share ($9,112,868 ÷ 1,058,047 shares) | | $ 8.61 |
Statement of Operations
Year ended December 31, 2004 |
| | |
Investment Income | | |
Dividends | | $ 38,497 |
Interest | | 4,502 |
Total income | | 42,999 |
| | |
Expenses | | |
Management fee | $ 61,803 | |
Transfer agent fees | 10,916 | |
Distribution fees | 20,814 | |
Accounting fees and expenses | 33,001 | |
Non-interested trustees' compensation | 1,165 | |
Custodian fees and expenses | 16,072 | |
Audit | 26,085 | |
Legal | 30 | |
Miscellaneous | 15,489 | |
Total expenses before reductions | 185,375 | |
Expense reductions | (69,135) | 116,240 |
Net investment income (loss) | | (73,241) |
Realized and Unrealized Gain (Loss) Net realized gain (loss) on: | | |
Investment securities | 588,356 | |
Foreign currency transactions | (88) | |
Total net realized gain (loss) | | 588,268 |
Change in net unrealized appreciation (depreciation) on: Investment securities | 478,031 | |
Assets and liabilities in foreign currencies | 13 | |
Total change in net unrealized appreciation (depreciation) | | 478,044 |
Net gain (loss) | | 1,066,312 |
Net increase (decrease) in net assets resulting from operations | | $ 993,071 |
See accompanying notes which are an integral part of the financial statements.
Agressive Growth Portfolio
Financial Statements - continued
Statement of Changes in Net Assets
| Year ended
December 31,
2004 | Year ended
December 31,
2003 |
Increase (Decrease) in Net Assets | | |
Operations | | |
Net investment income (loss) | $ (73,241) | $ (55,766) |
Net realized gain (loss) | 588,268 | 515,336 |
Change in net unrealized appreciation (depreciation) | 478,044 | 1,391,657 |
Net increase (decrease) in net assets resulting from operations | 993,071 | 1,851,227 |
Share transactions - net increase (decrease) | 1,403,379 | 1,557,602 |
Total increase (decrease) in net assets | 2,396,450 | 3,408,829 |
| | |
Net Assets | | |
Beginning of period | 8,806,792 | 5,397,963 |
End of period (including undistributed net investment income of $13,755 and undistributed net investment income of $14,866, respectively) | $ 11,203,242 | $ 8,806,792 |
Other Information: | | | |
Share Transactions | Year ended December 31, 2004 |
| Initial Class | Service Class | Service Class 2 |
Shares Sold | 20,196 | 5,688 | 349,350 |
Reinvested | - | - | - |
Redeemed | (16,791) | (13,886) | (169,649) |
Net increase (decrease) | 3,405 | (8,198) | 179,701 |
| | | |
Dollars Sold | $ 163,969 | $ 46,408 | $ 2,799,000 |
Reinvested | - | - | - |
Redeemed | (137,010) | (112,605) | (1,356,383) |
Net increase (decrease) | $ 26,959 | $ (66,197) | $ 1,442,617 |
| | | |
Share Transactions | Year ended December 31, 2003 |
| Initial Class | Service Class | Service Class 2 |
Shares Sold | 11,342 | 4,373 | 340,232 |
Reinvested | - | - | - |
Redeemed | (10,321) | (3,096) | (116,001) |
Net increase (decrease) | 1,021 | 1,277 | 224,231 |
| | | |
Dollars Sold | $ 73,891 | $ 29,803 | $ 2,324,950 |
Reinvested | - | - | - |
Redeemed | (66,540) | (19,968) | (784,534) |
Net increase (decrease) | $ 7,351 | $ 9,835 | $ 1,540,416 |
| | | |
See accompanying notes which are an integral part of the financial statements.
Annual Report
Financial Highlights - Initial Class
Years ended December 31, | 2004 | 2003 | 2002 | 2001 | 2000F |
Selected Per-Share Data | | | | | |
Net asset value, beginning of period | $ 7.90 | $ 6.05 | $ 8.22 | $ 10.02 | $ 10.00 |
Income from Investment Operations | | | | | |
Net investment income (loss)E | (.04) | (.04) | (.06) | .03H | -I |
Net realized and unrealized gain (loss) | .85 | 1.89 | (2.11) | (1.82)H | .02 |
Total from investment operations | .81 | 1.85 | (2.17) | (1.79) | .02 |
Distributions from net investment income | - | - | - | (.01) | - |
Net asset value, end of period | $ 8.71 | $ 7.90 | $ 6.05 | $ 8.22 | $ 10.02 |
Total ReturnB,C,D | 10.25% | 30.58% | (26.40)% | (17.89)% | .20% |
Ratios to Average Net AssetsG | | | | | |
Expenses before expense reductions | 1.64% | 2.87% | 2.51% | 3.00% | 146.41%A |
Expenses net of voluntary waivers, if any | 1.00% | 1.26% | 1.50% | 1.50% | 1.50%A |
Expenses net of all reductions | .96% | 1.20% | 1.35% | 1.45% | 1.50%A |
Net investment income (loss) | (.53)% | (.62)% | (.85)% | .34%H | 5.50%A |
Supplemental Data | | | | | |
Net assets, end of period (000 omitted) | $ 1,031 | $ 907 | $ 689 | $ 864 | $ 301 |
Portfolio turnover rate | 91% | 150% | 460% | 526% | 26%A |
A Annualized
B Total returns for periods of less than one year are not annualized.
C Total returns do not reflect charges attributable to your insurance company's separate account. Inclusion of these charges would reduce the total returns shown.
D Total returns would have been lower had certain expenses not been reduced during the periods shown.
E Calculated based on average shares outstanding during the period.
F For the period December 27, 2000 (commencement of operations) to December 31, 2000.
G Expense ratios reflect operating expenses of the class. Expenses before reductions do not reflect amounts reimbursed by the investment adviser or reductions from brokerage service arrangements or other expense offset arrangements and do not represent the amount paid by the class during periods when reimbursements or reductions occur. Expense ratios before reductions for start-up periods may not be representative of longer-term operating periods. Expenses net of any voluntary waivers reflect expenses after reimbursement by the investment adviser but prior to reductions from brokerage service arrangements or other expense offset arrangements. Expenses net of all reductions represent the net expenses paid by the class.
H Effective January 1, 2001, the fund adopted the provisions of the AICPA Audit and Accounting Guide for Investment Companies and began amortizing premium and discount on all debt securities. Per-share data and ratios for periods prior to adoption have not been restated to reflect this change.
I Amount represents less than $.01 per share.
Financial Highlights - Service Class
Years ended December 31, | 2004 | 2003 | 2002 | 2001 | 2000F |
Selected Per-Share Data | | | | | |
Net asset value, beginning of period | $ 7.92 | $ 6.07 | $ 8.25 | $ 10.02 | $ 10.00 |
Income from Investment Operations | | | | | |
Net investment income (loss)E | (.05) | (.05) | (.07) | .02H | -I |
Net realized and unrealized gain (loss) | .86 | 1.90 | (2.11) | (1.78)H | .02 |
Total from investment operations | .81 | 1.85 | (2.18) | (1.76) | .02 |
Distributions from net investment income | - | - | - | (.01) | - |
Net asset value, end of period | $ 8.73 | $ 7.92 | $ 6.07 | $ 8.25 | $ 10.02 |
Total ReturnB,C,D | 10.23% | 30.48% | (26.42)% | (17.59)% | .20% |
Ratios to Average Net AssetsG | | | | | |
Expenses before expense reductions | 1.74% | 2.94% | 2.56% | 3.09% | 146.53%A |
Expenses net of voluntary waivers, if any | 1.10% | 1.36% | 1.60% | 1.60% | 1.60%A |
Expenses net of all reductions | 1.07% | 1.30% | 1.45% | 1.55% | 1.60%A |
Net investment income (loss) | (.63)% | (.72)% | (.96)% | .24%H | 5.37%A |
Supplemental Data | | | | | |
Net assets, end of period (000 omitted) | $ 1,059 | $ 1,026 | $ 779 | $ 1,152 | $ 301 |
Portfolio turnover rate | 91% | 150% | 460% | 526% | 26%A |
A Annualized
B Total returns for periods of less than one year are not annualized.
C Total returns do not reflect charges attributable to your insurance company's separate account. Inclusion of these charges would reduce the total returns shown.
D Total returns would have been lower had certain expenses not been reduced during the periods shown.
E Calculated based on average shares outstanding during the period.
F For the period December 27, 2000 (commencement of operations) to December 31, 2000.
G Expense ratios reflect operating expenses of the class. Expenses before reductions do not reflect amounts reimbursed by the investment adviser or reductions from brokerage service arrangements or other expense offset arrangements and do not represent the amount paid by the class during periods when reimbursements or reductions occur. Expense ratios before reductions for start-up periods may not be representative of longer-term operating periods. Expenses net of any voluntary waivers reflect expenses after reimbursement by the investment adviser but prior to reductions from brokerage service arrangements or other expense offset arrangements. Expenses net of all reductions represent the net expenses paid by the class.
H Effective January 1, 2001, the fund adopted the provisions of the AICPA Audit and Accounting Guide for Investment Companies and began amortizing premium and discount on all debt securities. Per-share data and ratios for periods prior to adoption have not been restated to reflect this change.
I Amount represents less than $.01 per share.
See accompanying notes which are an integral part of the financial statements.
Aggressive Growth Portfolio
Financial Highlights - Service Class 2
Years ended December 31, | 2004 | 2003 | 2002 | 2001 | 2000F |
Selected Per-Share Data | | | | | |
Net asset value, beginning of period | $ 7.83 | $ 6.01 | $ 8.20 | $ 10.02 | $ 10.00 |
Income from Investment Operations | | | | | |
Net investment income (loss)E | (.06) | (.06) | (.08) | .01H | -I |
Net realized and unrealized gain (loss) | .84 | 1.88 | (2.11) | (1.82)H | .02 |
Total from investment operations | .78 | 1.82 | (2.19) | (1.81) | .02 |
Distributions from net investment income | - | - | - | (.01) | - |
Net asset value, end of period | $ 8.61 | $ 7.83 | $ 6.01 | $ 8.20 | $ 10.02 |
Total ReturnB,C,D | 9.96% | 30.28% | (26.71)% | (18.08)% | .20% |
Ratios to Average Net AssetsG | | | | | |
Expenses before expense reductions | 1.92% | 3.14% | 2.74% | 3.23% | 146.63%A |
Expenses net of voluntary waivers, if any | 1.25% | 1.51% | 1.75% | 1.75% | 1.75%A |
Expenses net of all reductions | 1.21% | 1.45% | 1.60% | 1.70% | 1.75%A |
Net investment income (loss) | (.78)% | (.87)% | (1.11)% | .09%H | 5.24%A |
Supplemental Data | | | | | |
Net assets, end of period (000 omitted) | $ 9,113 | $ 6,873 | $ 3,930 | $ 4,500 | $ 401 |
Portfolio turnover rate | 91% | 150% | 460% | 526% | 26%A |
A Annualized
B Total returns for periods of less than one year are not annualized.
C Total returns do not reflect charges attributable to your insurance company's separate account. Inclusion of these charges would reduce the total returns shown.
D Total returns would have been lower had certain expenses not been reduced during the periods shown.
E Calculated based on average shares outstanding during the period.
F For the period December 27, 2000 (commencement of operations) to December 31, 2000.
G Expense ratios reflect operating expenses of the class. Expenses before reductions do not reflect amounts reimbursed by the investment adviser or reductions from brokerage service arrangements or other expense offset arrangements and do not represent the amount paid by the class during periods when reimbursements or reductions occur. Expense ratios before reductions for start-up periods may not be representative of longer-term operating periods. Expenses net of any voluntary waivers reflect expenses after reimbursement by the investment adviser but prior to reductions from brokerage service arrangements or other expense offset arrangements. Expenses net of all reductions represent the net expenses paid by the class.
H Effective January 1, 2001, the fund adopted the provisions of the AICPA Audit and Accounting Guide for Investment Companies and began amortizing premium and discount on all debt securities. Per-share data and ratios for periods prior to adoption have not been restated to reflect this change.
I Amount represents less than $.01 per share.
See accompanying notes which are an integral part of the financial statements.
Annual Report
For the period ended December 31, 2004
1. Significant Accounting Policies.
Aggressive Growth Portfolio (the fund) is a fund of Variable Insurance Products Fund III (the trust) (referred to in this report as Fidelity Variable Insurance Products: Aggressive Growth Portfolio) and is authorized to issue an unlimited number of shares. The trust is registered under the Investment Company Act of 1940, as amended (the 1940 Act), as an open-end management investment company organized as a Massachusetts business trust. Shares of the fund may only be purchased by insurance companies for the purpose of funding variable annuity or variable life insurance contracts. The fund offers the following classes of shares: Initial Class shares, Service Class shares and Service Class 2 shares. All classes have equal rights and voting privileges, except for matters affecting a single class. Investment income, realized and unrealized capital gains and losses, the common expenses of the fund, and certain fund-level expense reductions, if any, are allocated on a pro rata basis to each class based on the relative net assets of each class to the total net assets of the fund. Each class differs with respect to distribution and service plan fees incurred. Certain expense reductions also differ by class.
The financial statements have been prepared in conformity with accounting principles generally accepted in the United States of America, which require management to make certain estimates and assumptions at the date of the financial statements. The following summarizes the significant accounting policies of the fund:
Security Valuation. Net asset value per share (NAV calculation) is calculated as of the close of business of the New York Stock Exchange, normally 4:00 p.m. Eastern time. Equity securities, including restricted securities, for which market quotations are available are valued at the last sale price or official closing price (closing bid price or last evaluated quote if no sale has occurred) on the primary market or exchange on which they trade. If prices are not readily available or do not accurately reflect fair value for a security, or if a security's value has been materially affected by events occurring after the close of the exchange or market on which the security is principally traded, that security may be valued by another method that the Board of Trustees believes accurately reflects fair value. A security's valuation may differ depending on the method used for determining value. Price movements in futures contracts and ADRs, market and trading trends, the bid/ask quotes of brokers and off-exchange institutional trading may be reviewed in the course of making a good faith determination of a security's fair value. Short-term securities with remaining maturities of sixty days or less for which quotations are not readily available are valued on the basis of amortized cost. Investments in open-end investment companies are valued at their net asset value each business day.
Foreign Currency. The fund uses foreign currency contracts to facilitate transactions in foreign-denominated securities. Losses from these transactions may arise from changes in the value of the foreign currency or if the counterparties do not perform under the contracts' terms.
Foreign-denominated assets, including investment securities, and liabilities are translated into U.S. dollars at the exchange rate at period end. Purchases and sales of investment securities, income and dividends received and expenses denominated in foreign currencies are translated into U.S. dollars at the exchange rate in effect on the transaction date.
The effects of exchange rate fluctuations on investments are included with the net realized and unrealized gain (loss) on investment securities. Other foreign currency transactions resulting in realized and unrealized gain (loss) are disclosed separately.
Investment Transactions and Income. Security transactions are accounted for as of trade date. Gains and losses on securities sold are determined on the basis of identified cost and may include proceeds received from litigation. Dividend income is recorded on the ex-dividend date, except for certain dividends from foreign securities where the ex-dividend date may have passed, which are recorded as soon as the fund is informed of the ex-dividend date. Non-cash dividends included in dividend income, if any, are recorded at the fair market value of the securities received. Distributions received on securities that represent a return of capital or capital gain are recorded as a reduction of cost of investments and/or as a realized gain. The fund estimates the components of distributions received that may be considered return of capital distributions or capital gain distributions. Interest income is accrued as earned. Interest income includes coupon interest and amortization of premium and accretion of discount on debt securities. Investment income is recorded net of foreign taxes withheld where recovery of such taxes is uncertain.
Expenses. Most expenses of the trust can be directly attributed to a fund. Expenses which cannot be directly attributed are apportioned among the funds in the trust.
Income Tax Information and Distributions to Shareholders. Each year, the fund intends to qualify as a regulated investment company by distributing all of its taxable income and realized gains under Subchapter M of the Internal Revenue Code. As a result, no provision for income taxes is required in the accompanying financial statements. Foreign taxes are provided for based on the fund's understanding of the tax rules and rates that exist in the foreign markets in which it invests.
Distributions are recorded on the ex-dividend date. Income dividends and capital gain distributions are declared separately for each class. Income and capital gain distributions are determined in accordance with income tax regulations, which may differ from generally accepted accounting principles.
Capital accounts within the financial statements are adjusted for permanent book-tax differences. These adjustments have no impact on net assets or the results of operations. Temporary book-tax differences will reverse in a subsequent period.
Aggressive Growth Portfolio
Notes to Financial Statements - continued
1. Significant Accounting Policies - continued
Income Tax Information and Distributions to Shareholders - continued
Book-tax differences are primarily due to foreign currency transactions, net operating losses, capital loss carryforwards and losses deferred due to wash sales.
The tax-basis components of distributable earnings and the federal tax cost as of period end were as follows:
Unrealized appreciation | $ 2,277,803 | |
Unrealized depreciation | (432,231) | |
Net unrealized appreciation (depreciation) | 1,845,572 | |
Capital loss carryforward | (1,069,488) | |
| | |
Cost for federal income tax purposes | $ 9,288,915 | |
2. Operating Policies.
Repurchase Agreements. Fidelity Management & Research Company (FMR) has received an Exemptive Order from the Securities and Exchange Commission (the SEC) which permits the fund and other affiliated entities of FMR to transfer uninvested cash balances into joint trading accounts. These accounts are then invested in repurchase agreements that are collateralized by U.S. Treasury or Government obligations. The fund may also invest directly with institutions, in repurchase agreements that are collateralized by commercial paper obligations and corporate obligations. Collateral is held in segregated accounts with custodian banks and may be obtained in the event of a default of the counterparty. Collateral is marked-to-market daily and maintained at a value at least equal to the principal amount of the repurchase agreement (including accrued interest).
3. Purchases and Sales of Investments.
Purchases and sales of securities, other than short-term securities and U.S. government securities, aggregated $9,567,947 and $8,799,870, respectively.
4. Fees and Other Transactions with Affiliates.
Management Fee. FMR and its affiliates provide the fund with investment management related services for which the fund pays a monthly management fee. The management fee is the sum of an individual fund fee rate that is based on an annual rate of .35% of the fund's average net assets and a group fee rate that averaged .28% during the period. The group fee rate is based upon the average net assets of all the mutual funds advised by FMR. The group fee rate decreases as assets under management increase and increases as assets under management decrease. For the period, the total annual management fee rate was .62% of the fund's average net assets.
Distribution and Service Plan. In accordance with Rule 12b-1 of the 1940 Act, the fund has adopted separate 12b-1 Plans for each Service Class of shares. Each Service Class pays Fidelity Distributors Corporation (FDC), an affiliate of FMR, a service fee. For the period, the service fee is based on an annual rate of .10% of Service Class' average net assets and .25% of Service Class 2's average net assets.
For the period, each class paid FDC the following amounts, all of which were re-allowed to insurance companies for the distribution of shares and providing shareholder support services:
Service Class | $ 1,011 | |
Service Class 2 | 19,803 | |
| $ 20,814 | |
Transfer Agent Fees. Fidelity Investments Institutional Operations Company, Inc. (FIIOC), an affiliate of FMR, is the fund's transfer, dividend disbursing, and shareholder servicing agent. FIIOC receives an asset-based fee with respect to each account. FIIOC pays a portion of the expenses related to the typesetting, printing and mailing of shareholder reports, except proxy statements. Each class pays a transfer agent fee, excluding out of pocket expenses, equal to an annual rate of .07% of their month end net assets. For the period, the total transfer agent fees paid by each class to FIIOC, including out of pocket expenses, were as follows:
Initial Class | $ 795 | |
Service Class | 839 | |
Service Class 2 | 9,282 | |
| $ 10,916 | |
Accounting Fees. Fidelity Service Company, Inc. (FSC), an affiliate of FMR, maintains the fund's accounting records. The fee is based on the level of average net assets for the month.
Annual Report
4. Fees and Other Transactions with Affiliates - continued
Central Funds. The fund may invest in affiliated Central Funds managed by Fidelity Investments Money Management, Inc. (FIMM), an affiliate of FMR. The Central Funds are open-end investment companies available only to investment companies and other accounts managed by FMR and its affiliates. The Central Funds seek preservation of capital and current income and do not pay a management fee. Income distributions earned by the fund are recorded as income in the accompanying financial statements and totaled $4,417 for the period.
Brokerage Commissions. The fund placed a portion of its portfolio transactions with brokerage firms which are affiliates of the investment adviser. The commissions paid to these affiliated firms were $990 for the period.
5. Committed Line of Credit.
The fund participates with other funds managed by FMR in a $4.2 billion credit facility (the "line of credit") to be utilized for temporary or emergency purposes to fund shareholder redemptions or for other short-term liquidity purposes. The fund has agreed to pay commitment fees on its pro rata portion of the line of credit. During the period, there were no borrowings on this line of credit.
6. Expense Reductions.
FMR voluntarily agreed to reimburse each class to the extent annual operating expenses exceeded certain levels of average net assets as noted in the table below. Some expenses, for example interest expense, are excluded from this reimbursement. Effective February 1, 2005 the expense limitations will be changed to 0.90%, 1.00% and 1.15%, for Initial Class, Service Class and Service Class 2, respectively.
| Expense
Limitations | Reimbursement
from adviser |
| | |
Initial Class | 1.00% | $ 6,096 |
Service Class | 1.10% | 6,383 |
Service Class 2 | 1.25% | 53,108 |
| | $ 65,587 |
Many of the brokers with whom FMR places trades on behalf of the fund provided services to the fund in addition to trade execution. These services included payments of certain expenses on behalf of the fund totaling $3,548 for the period.
7. Other Information.
At the end of the period, FMR or its affiliates were the owners of record of 44% of the total outstanding shares of the fund and two otherwise unaffiliated shareholders were the owners of record of 52% of the total outstanding shares of the fund.
Aggressive Growth Portfolio
To the Trustees of Variable Insurance Products Fund III and Shareholders of Aggressive Growth Portfolio:
We have audited the accompanying statement of assets and liabilities of Aggressive Growth Portfolio (the Fund), a fund of Variable Insurance Products Fund III, including the portfolio of investments, as of December 31, 2004, and the related statement of operations for the year then ended, the statement of changes in net assets for each of the two years in the period then ended, and the financial highlights for each of the five years in the period then ended. These financial statements and financial highlights are the responsibility of the Fund's management. Our responsibility is to express an opinion on these financial statements and financial highlights based on our audits.
We conducted our audits in accordance with standards of the Public Company Accounting Oversight Board (United States). Those standards require that we plan and perform the audit to obtain reasonable assurance about whether the financial statements and financial highlights are free of material misstatement. An audit includes consideration of internal control over financial reporting as a basis for designing audit procedures that are appropriate in the circumstances, but not for the purpose of expressing an opinion on the effectiveness of the Fund's internal control over financial reporting. Accordingly, we express no such opinion. An audit also includes examining, on a test basis, evidence supporting the amounts and disclosures in the financial statements, assessing the accounting principles used and significant estimates made by management, as well as evaluating the overall financial statement presentation. Our procedures included confirmation of securities owned as of December 31, 2004, by correspondence with the custodians and brokers; where replies were not received from brokers, we performed other auditing procedures. We believe that our audits provide a reasonable basis for our opinion.
In our opinion, the financial statements and financial highlights referred to above present fairly, in all material respects, the financial position of Aggressive Growth Portfolio as of December 31, 2004, the results of its operations for the year then ended, the changes in its net assets for each of the two years in the period then ended, and its financial highlights for each of the five years in the period then ended, in conformity with accounting principles generally accepted in the United States of America.
/s/DELOITTE & TOUCHE LLP
DELOITTE & TOUCHE LLP
Boston, Massachusetts
February 18, 2005
Annual Report
The Trustees, Member of the Advisory Board, and executive officers of the trust and fund, as applicable, are listed below. The Board of Trustees governs the fund and is responsible for protecting the interests of shareholders. The Trustees are experienced executives who meet periodically throughout the year to oversee the fund's activities, review contractual arrangements with companies that provide services to the fund, and review the fund's performance. Except for William O. McCoy, Dennis J. Dirks, and Kenneth L. Wolfe, each of the Trustees oversees 301 funds advised by FMR or an affiliate. Mr. McCoy oversees 303 funds advised by FMR or an affiliate. Mr. Dirks and Mr. Wolfe oversee 233 funds advised by FMR or an affiliate.
The Trustees hold office without limit in time except that (a) any Trustee may resign; (b) any Trustee may be removed by written instrument, signed by at least two-thirds of the number of Trustees prior to such removal; (c) any Trustee who requests to be retired or who has become incapacitated by illness or injury may be retired by written instrument signed by a majority of the other Trustees; and (d) any Trustee may be removed at any special meeting of shareholders by a two-thirds vote of the outstanding voting securities of the trust. In any event, each non-interested Trustee shall retire not later than the last day of the calendar year in which his or her 72nd birthday occurs. The executive officers and Advisory Board Members hold office without limit in time, except that any officer and Advisory Board Member may resign or may be removed by a vote of a majority of the Trustees at any regular meeting or any special meeting of the Trustees. Except as indicated, each individual has held the office shown or other offices in the same company for the past five years.
The fund's Statement of Additional Information (SAI) includes more information about the Trustees. To request a free copy, call Fidelity at 1-800-544-5429.
Interested Trustees*:
Correspondence intended for each Trustee who is an "interested person" (as defined in the 1940 Act) may be sent to Fidelity Investments, 82 Devonshire Street, Boston, Massachusetts 02109.
Name, Age; Principal Occupation |
Edward C. Johnson 3d (74)** |
| Year of Election or Appointment: 1994 Mr. Johnson is Chairman of the Board of Trustees. Mr. Johnson serves as Chief Executive Officer, Chairman, and a Director of FMR Corp.; a Director and Chairman of the Board and of the Executive Committee of FMR; Chairman and a Director of Fidelity Management & Research (Far East) Inc.; Chairman (1998) and a Director of Fidelity Investments Money Management, Inc.; and Chairman (2001) and a Director (2000) of FMR Co., Inc. |
Abigail P. Johnson (43)** |
| Year of Election or Appointment: 2001 Senior Vice President of VIP Aggressive Growth (2001). Ms. Johnson also serves as Senior Vice President of other Fidelity funds (2001). She is President and a Director of FMR (2001), Fidelity Investments Money Management, Inc. (2001), FMR Co., Inc. (2001), and a Director of FMR Corp. Previously, Ms. Johnson managed a number of Fidelity funds. |
Laura B. Cronin (50) |
| Year of Election or Appointment: 2003 Ms. Cronin is an Executive Vice President (2002) and Chief Financial Officer (2002) of FMR Corp. and is a member of the Fidelity Management Committee (2003). Previously, Ms. Cronin served as Vice President of Finance of FMR (1997-1999), and Chief Financial Officer of FMR (1999-2001), Fidelity Personal Investments (2001), and Fidelity Brokerage Company (2001-2002). |
Robert L. Reynolds (52) |
| Year of Election or Appointment: 2003 Mr. Reynolds is a Director (2003) and Chief Operating Officer (2002) of FMR Corp. and is the head of the Fidelity Management Committee (2003). He also serves on the Board at Fidelity Investments Canada, Ltd. (2000). Previously, Mr. Reynolds served as President of Fidelity Investments Institutional Retirement Group (1996-2000). |
* Trustees have been determined to be "Interested Trustees" by virtue of, among other things, their affiliation with the trust or various entities under common control with FMR.
** Edward C. Johnson 3d, Trustee, is Abigail P. Johnson's father.
Aggressive Growth Portfolio
Trustees and Officers - continued
Non-Interested Trustees:
Correspondence intended for each non-interested Trustee (that is, the Trustees other than the Interested Trustees) may be sent to Fidelity Investments, P.O. Box 55235, Boston, Massachusetts 02205-5235.
Name, Age; Principal Occupation |
Dennis J. Dirks (56) |
| Year of Election or Appointment: 2005 Mr. Dirks also serves as a Trustee (2005) or Member of the Advisory Board (2004) of other investment companies advised by FMR. Prior to his retirement in May 2003, Mr. Dirks was Chief Operating Officer and a member of the Board of The Depository Trust & Clearing Corporation (DTCC) (1999-2003). He also served as President, Chief Operating Officer, and Board member of The Depository Trust Company (DTC) (1999-2003) and President and Board member of the National Securities Clearing Corporation (NSCC) (1999-2003). In addition, Mr. Dirks served as Chief Executive Officer and Board member of the Government Securities Clearing Corporation (2001-2003) and Chief Executive Officer and Board member of the Mortgage-Backed Securities Clearing Corporation (2001-2003). |
Robert M. Gates (61) |
| Year of Election or Appointment: 1997 Dr. Gates is Vice Chairman of the non-interested Trustees (2005). Dr. Gates is President of Texas A&M University (2002). He was Director of the Central Intelligence Agency (CIA) from 1991 to 1993. From 1989 to 1991, Dr. Gates served as Assistant to the President of the United States and Deputy National Security Advisor. Dr. Gates is a Director of NACCO Industries, Inc. (mining and manufacturing), Parker Drilling Co., Inc. (drilling and rental tools for the energy industry, 2001), and Brinker International (restaurant management, 2003). He also serves as a member of the Advisory Board of VoteHere.net (secure internet voting, 2001). Previously, Dr. Gates served as a Director of LucasVarity PLC (automotive components and diesel engines), a Director of TRW Inc. (automotive, space, defense, and information technology), and Dean of the George Bush School of Government and Public Service at Texas A&M University (1999-2001). Dr. Gates also is a Trustee of the Forum for International Policy. |
George H. Heilmeier (68) |
| Year of Election or Appointment: 2004 Dr. Heilmeier is Chairman Emeritus of Telcordia Technologies (communication software and systems), where prior to his retirement, he served as company Chairman and Chief Executive Officer. He currently serves on the Boards of Directors of The Mitre Corporation (systems engineering and information technology support for the government), INET Technologies Inc. (telecommunications network surveillance, 2001), Teletech Holdings (customer management services), and HRL Laboratories (private research and development, 2004). He is Chairman of the General Motors Technology Advisory Committee and a Life Fellow of the Institute of Electrical and Electronics Engineers (IEEE) (2000). Dr. Heilmeier is a member of the Defense Science Board and the National Security Agency Advisory Board. He is also a member of the National Academy of Engineering, the American Academy of Arts and Sciences, and the Board of Overseers of the School of Engineering and Applied Science of the University of Pennsylvania. Previously, Dr. Heilmeier served as a Director of TRW Inc. (automotive, space, defense, and information technology, 1992-2002), Compaq (1994-2002), and Automatic Data Processing, Inc. (ADP) (technology-based business outsourcing, 1995-2002). |
Marie L. Knowles (58) |
| Year of Election or Appointment: 2001 Prior to Ms. Knowles' retirement in June 2000, she served as Executive Vice President and Chief Financial Officer of Atlantic Richfield Company (ARCO) (diversified energy, 1996-2000). From 1993 to 1996, she was a Senior Vice President of ARCO and President of ARCO Transportation Company. She served as a Director of ARCO from 1996 to 1998. She currently serves as a Director of Phelps Dodge Corporation (copper mining and manufacturing) and McKesson Corporation (healthcare service, 2002). Ms. Knowles is a Trustee of the Brookings Institution and the Catalina Island Conservancy and also serves as a member of the Advisory Board for the School of Engineering of the University of Southern California. |
Ned C. Lautenbach (60) |
| Year of Election or Appointment: 2000
Mr. Lautenbach has been a partner of Clayton, Dubilier & Rice, Inc. (private equity investment firm) since September 1998. Previously, Mr. Lautenbach was with the International Business Machines Corporation (IBM) from 1968 until his retirement in 1998. He was most recently Senior Vice President and Group Executive of Worldwide Sales and Services. From 1993 to 1995, he was Chairman of IBM World Trade Corporation, and from 1994 to 1998 was a member of IBM's Corporate Executive Committee. Mr. Lautenbach serves as Co-Chairman and a Director of Covansys, Inc. (global provider of business and technology solutions, 2000). In addition, he is a Director of Italtel Holding S.p.A. (telecommunications (Milan, Italy), 2004) and Eaton Corporation (diversified industrial) as well as the Philharmonic Center for the Arts in Naples, Florida (1999). He also is a member of the Council on Foreign Relations. |
Marvin L. Mann (71) |
| Year of Election or Appointment: 1994 Mr. Mann is Chairman of the non-interested Trustees (2001). He is Chairman Emeritus of Lexmark International, Inc. (computer peripherals), where he served as CEO until April 1998, retired as Chairman May 1999, and remains a member of the Board. Prior to 1991, he held the positions of Vice President of International Business Machines Corporation (IBM) and President and General Manager of various IBM divisions and subsidiaries. He is a member of the Executive Committee of the Independent Director's Council of the Investment Company Institute. In addition, Mr. Mann is a member of the President's Cabinet at the University of Alabama and the Board of Visitors of the Culverhouse College of Commerce and Business Administration at the University of Alabama. |
William O. McCoy (71) |
| Year of Election or Appointment: 1997 Prior to his retirement in December 1994, Mr. McCoy was Vice Chairman of the Board of BellSouth Corporation (telecommunications) and President of BellSouth Enterprises. He is currently a Director of Liberty Corporation (holding company), Duke Realty Corporation (real estate), and Progress Energy, Inc. (electric utility). He is also a partner of Franklin Street Partners (private investment management firm) and a member of the Research Triangle Foundation Board. In addition, Mr. McCoy served as the Interim Chancellor (1999-2000) and a member of the Board of Visitors (1994-1998) for the University of North Carolina at Chapel Hill and currently serves on the Board of Directors of the University of North Carolina Health Care System and the Board of Visitors of the Kenan-Flagler Business School (University of North Carolina at Chapel Hill). He also served as Vice President of Finance for the University of North Carolina (16-school system, 1995-1998). |
Cornelia M. Small (60) |
| Year of Election or Appointment: 2005 Ms. Small is a member (2000) and Chairperson (2002) of the Investment Committee, and a member (2002) of the Board of Trustees of Smith College. Previously, she served as Chief Investment Officer (1999-2000), Director of Global Equity Investments (1996-1999), and a member of the Board of Directors of Scudder, Stevens & Clark (1990-1997) and Scudder Kemper Investments (1997-1998). In addition, Ms. Small served as Co-Chair (2000-2003) of the Annual Fund for the Fletcher School of Law and Diplomacy. |
William S. Stavropoulos (65) |
| Year of Election or Appointment: 2002 Mr. Stavropoulos is Chairman of the Board (2000), CEO (2002), a position he previously held from 1995-2000, Chairman of the Executive Committee (2000), and a Member of the Board of Directors of The Dow Chemical Company. Since joining The Dow Chemical Company in 1967, Mr. Stavropoulos served in numerous senior management positions, including President (1993-2000; 2002-2003). Currently, he is a Director of NCR Corporation (data warehousing and technology solutions), BellSouth Corporation (telecommunications), Chemical Financial Corporation, and Maersk Inc. (industrial conglomerate, 2002). He also serves as a member of the Board of Trustees of the American Enterprise Institute for Public Policy Research. In addition, Mr. Stavropoulos is a member of The Business Council, J.P. Morgan International Council and the University of Notre Dame Advisory Council for the College of Science. |
Kenneth L. Wolfe (65) |
| Year of Election or Appointment: 2005 Mr. Wolfe also serves as a Trustee (2005) or Member of the Advisory Board (2004) of other investment companies advised by FMR. Prior to his retirement in 2001, Mr. Wolfe was Chairman and Chief Executive Officer of Hershey Foods Corporation (1993-2001). He currently serves as a member of the boards of Adelphia Communications Corporation (2003), Bausch & Lomb, Inc., and Revlon Inc. (2004). |
Aggressive Growth Portfolio
Trustees and Officers - continued
Advisory Board Member and Executive Officers:
Correspondence intended for each executive officer and Mr. Lynch may be sent to Fidelity Investments, 82 Devonshire Street, Boston, Massachusetts 02109.
Name, Age; Principal Occupation |
Peter S. Lynch (61) |
| Year of Election or Appointment: 2003 Member of the Advisory Board of Variable Insurance Products Fund III. Vice Chairman and a Director of FMR, and Vice Chairman (2001) and a Director (2000) of FMR Co., Inc. Previously, Mr. Lynch served as a Trustee of the Fidelity funds (1990-2003). Prior to May 31, 1990, he was a Director of FMR and Executive Vice President of FMR (a position he held until March 31, 1991), Vice President of Fidelity® Magellan® Fund and FMR Growth Group Leader, and Managing Director of FMR Corp. Mr. Lynch was also Vice President of Fidelity Investments Corporate Services. In addition, he serves as a Trustee of Boston College, Massachusetts Eye & Ear Infirmary, Historic Deerfield, John F. Kennedy Library, and the Museum of Fine Arts of Boston. |
John B. McDowell (46) |
| Year of Election or Appointment: 2002 Vice President of VIP Aggressive Growth. Mr. McDowell also serves as Vice President of certain Equity Funds (2002). He is Senior Vice President of FMR (1999), FMR Co., Inc. (2001), and Fidelity Management Trust Company (FMTC). Since joining Fidelity Investments in 1985, Mr. McDowell has worked as a research analyst and manager. |
Rajiv Kaul (33) |
| Year of Election or Appointment: 2003 Vice President of VIP Aggressive Growth. Mr. Kaul serves as Vice President of other funds advised by FMR. Prior to assuming his current responsibilities, Mr. Kaul managed a variety of Fidelity funds. Mr. Kaul also serves as Vice President of FMR (2003) and FMR Co., Inc. (2003). |
Eric D. Roiter (56) |
| Year of Election or Appointment: 2000 Secretary of VIP Aggressive Growth. He also serves as Secretary of other Fidelity funds; Vice President, General Counsel, and Secretary of FMR Co., Inc. (2001-present) and FMR; Vice President and Secretary of FDC; Assistant Secretary of Fidelity Management & Research (U.K.) Inc. (2001-present), Fidelity Management & Research (Far East) Inc. (2001-present); and Fidelity Investments Money Management, Inc. (2001-present). Mr. Roiter is an Adjunct Member, Faculty of Law, at Boston College Law School (2003-present). |
Stuart Fross (45) |
| Year of Election or Appointment: 2003 Assistant Secretary of VIP Aggressive Growth. Mr. Fross also serves as Assistant Secretary of other Fidelity funds (2003) and is an employee of FMR. |
Christine Reynolds (46) |
| Year of Election or Appointment: 2004 President, Treasurer, and Anti-Money Laundering (AML) officer of VIP Aggressive Growth. Ms. Reynolds also serves as President, Treasurer, and AML officer of other Fidelity funds (2004) and is a Vice President (2003) and an employee (2002) of FMR. Before joining Fidelity Investments, Ms. Reynolds worked at PricewaterhouseCoopers LLP (PwC) (1980-2002), where she was most recently an audit partner with PwC's investment management practice. |
Timothy F. Hayes (54) |
| Year of Election or Appointment: 2002 Chief Financial Officer of VIP Aggressive Growth. Mr. Hayes also serves as Chief Financial Officer of other Fidelity funds (2002). Recently he was appointed President of Fidelity Service Company (2003) where he also serves as a Director. Mr. Hayes also serves as President of Fidelity Investments Operations Group (FIOG, 2002), which includes Fidelity Pricing and Cash Management Services Group (FPCMS), where he was appointed President in 1998. Previously, Mr. Hayes served as Chief Financial Officer of Fidelity Investments Corporate Systems and Service Group (1998) and Fidelity Systems Company (1997-1998). |
Kenneth A. Rathgeber (57) |
| Year of Election or Appointment: 2004 Chief Compliance Officer of VIP Aggressive Growth. Mr. Rathgeber also serves as Chief Compliance Officer of other Fidelity funds (2004) and Executive Vice President of Risk Oversight for Fidelity Investments (2002). Previously, he served as Executive Vice President and Chief Operating Officer for Fidelity Investments Institutional Services Company, Inc. (1998-2002). |
John R. Hebble (46) |
| Year of Election or Appointment: 2003 Deputy Treasurer of VIP Aggressive Growth. Mr. Hebble also serves as Deputy Treasurer of other Fidelity funds (2003), and is an employee of FMR. Before joining Fidelity Investments, Mr. Hebble worked at Deutsche Asset Management where he served as Director of Fund Accounting (2002-2003) and Assistant Treasurer of the Scudder Funds (1998-2003). |
Kimberley H. Monasterio (41) |
| Year of Election or Appointment: 2004 Deputy Treasurer of VIP Aggressive Growth. Ms. Monasterio also serves as Deputy Treasurer of other Fidelity funds (2004) and is an employee of FMR (2004). Before joining Fidelity Investments, Ms. Monasterio served as Treasurer (2000-2004) and Chief Financial Officer (2002-2004) of the Franklin Templeton Funds and Senior Vice President of Franklin Templeton Services, LLC (2000-2004). |
John H. Costello (58) |
| Year of Election or Appointment: 2000 Assistant Treasurer of VIP Aggressive Growth. Mr. Costello also serves as Assistant Treasurer of other Fidelity funds and is an employee of FMR. |
Peter L. Lydecker (50) |
| Year of Election or Appointment: 2004 Assistant Treasurer of VIP Aggressive Growth. Mr. Lydecker also serves as Assistant Treasurer of other Fidelity funds (2004) and is an employee of FMR. |
Mark Osterheld (49) |
| Year of Election or Appointment: 2002 Assistant Treasurer of VIP Aggressive Growth. Mr. Osterheld also serves as Assistant Treasurer of other Fidelity funds (2002) and is an employee of FMR. |
Kenneth B. Robins (35) |
| Year of Election or Appointment: 2004 Assistant Treasurer of VIP Aggressive Growth. Mr. Robins also serves as Assistant Treasurer of other Fidelity funds (2004) and is an employee of FMR (2004). Before joining Fidelity Investments, Mr. Robins worked at KPMG LLP, where he was a partner in KPMG's department of professional practice (2002-2004) and a Senior Manager (1999-2000). In addition, Mr. Robins served as Assistant Chief Accountant, United States Securities and Exchange Commission (2000-2002). |
Annual Report
A special meeting of the fund's shareholders was held on December 14, 2004. The results of votes taken among shareholders on proposals before them are reported below. Each vote reported represents one dollar of net asset value held on the record date for the meeting.
PROPOSAL 1 |
To amend the Declaration of Trust to allow the Board of Trustees, if permitted by applicable law, to authorize fund mergers without shareholder approval. A |
| # of
Votes | % of
Votes |
Affirmative | 4,465,365,699.61 | 80.317 |
Against | 820,718,849.73 | 14.762 |
Abstain | 273,620,539.56 | 4.921 |
TOTAL | 5,559,705,088.90 | 100.000 |
PROPOSAL 2 |
To elect a Board of Trustees. A |
| # of
Votes | % of
Votes |
J. Michael Cook |
Affirmative | 5,275,527,318.06 | 94.889 |
Withheld | 284,177,770.84 | 5.111 |
TOTAL | 5,559,705,088.90 | 100.000 |
Ralph F. Cox |
Affirmative | 5,260,941,793.66 | 94.626 |
Withheld | 298,763,295.24 | 5.374 |
TOTAL | 5,559,705,088.90 | 100.000 |
Laura B. Cronin |
Affirmative | 5,275,571,233.79 | 94.889 |
Withheld | 284,133,855.11 | 5.111 |
TOTAL | 5,559,705,088.90 | 100.000 |
Dennis J. Dirks B |
Affirmative | 5,277,234,059.51 | 94.919 |
Withheld | 282,471,029.39 | 5.081 |
TOTAL | 5,559,705,088.90 | 100.000 |
Robert M. Gates |
Affirmative | 5,271,693,384.06 | 94.820 |
Withheld | 288,011,704.84 | 5.180 |
TOTAL | 5,559,705,088.90 | 100.000 |
George H. Heilmeier |
Affirmative | 5,276,712,546.15 | 94.910 |
Withheld | 282,992,542.75 | 5.090 |
TOTAL | 5,559,705,088.90 | 100.000 |
Abigail P. Johnson |
Affirmative | 5,265,412,678.20 | 94.707 |
Withheld | 294,292,410.70 | 5.293 |
TOTAL | 5,559,705,088.90 | 100.000 |
Edward C. Johnson 3d |
Affirmative | 5,252,813,997.03 | 94.480 |
Withheld | 306,891,091.87 | 5.520 |
TOTAL | 5,559,705,088.90 | 100.000 |
Donald J. Kirk |
Affirmative | 5,268,337,458.03 | 94.759 |
Withheld | 291,367,630.87 | 5.241 |
TOTAL | 5,559,705,088.90 | 100.000 |
| # of
Votes | % of
Votes |
Marie L. Knowles |
Affirmative | 5,278,993,264.93 | 94.951 |
Withheld | 280,711,823.97 | 5.049 |
TOTAL | 5,559,705,088.90 | 100.000 |
Ned C. Lautenbach |
Affirmative | 5,280,591,428.18 | 94.980 |
Withheld | 279,113,660.72 | 5.020 |
TOTAL | 5,559,705,088.90 | 100.000 |
Marvin L. Mann |
Affirmative | 5,266,769,335.50 | 94.731 |
Withheld | 292,935,753.40 | 5.269 |
TOTAL | 5,559,705,088.90 | 100.000 |
William O. McCoy |
Affirmative | 5,270,804,685.62 | 94.804 |
Withheld | 288,900,403.28 | 5.196 |
TOTAL | 5,559,705,088.90 | 100.000 |
Robert L. Reynolds |
Affirmative | 5,279,190,479.65 | 94.955 |
Withheld | 280,514,609.25 | 5.045 |
TOTAL | 5,559,705,088.90 | 100.000 |
Cornelia M. Small B |
Affirmative | 5,276,074,654.01 | 94.898 |
Withheld | 283,630,434.89 | 5.102 |
TOTAL | 5,559,705,088.90 | 100.000 |
William S. Stavropoulos |
Affirmative | 5,278,183,775.21 | 94.936 |
Withheld | 281,521,313.69 | 5.064 |
TOTAL | 5,559,705,088.90 | 100.000 |
A Denotes trust-wide proposals and voting results. B Effective January 1, 2005. |
Annual Report
Aggressive Growth Portfolio
Annual Report
Investment Adviser
Fidelity Management & Research Company
Boston, MA
Investment Sub-Advisers
FMR Co., Inc.
Fidelity Management & Research (U.K.) Inc.
Fidelity Management & Research (Far East) Inc.
Fidelity Investments Japan Limited
Fidelity International Investment Advisors
Fidelity International Investment Advisors (U.K.) Limited
General Distributor
Fidelity Distributors Corporation
Boston, MA
Transfer and Shareholder Servicing Agent
Fidelity Investments Institutional Operations Company, Inc.
Boston, MA
Custodian
JPMorgan Chase Bank
New York, NY
VIPAG-ANN-0205
1.751800.104
Fidelity® Variable Insurance Products:
Balanced Portfolio
Annual Report
December 31, 2004
(2_fidelity_logos)(Registered_Trademark)
Contents
Performance | 3 | How the fund has done over time. |
Management's Discussion | 4 | The manager's review of fund performance, strategy and outlook. |
Shareholder Expense Example | 5 | An example of shareholder expenses. |
Investment Summary | 6 | A summary of the fund's investments at period end. |
Investments | 7 | A complete list of the fund's investments with their
market values. |
Financial Statements | 21 | Statements of assets and liabilities, operations, and
changes in net assets, as well as financial highlights. |
Notes | 25 | Notes to the financial statements. |
Report of Independent Registered Public Accounting Firm | 29 | |
Trustees and Officers | 30 | |
Distributions | 35 | |
Proxy Voting Results | 36 | |
| | |
To view a fund's proxy voting guidelines and proxy voting record for the 12-month period ended June 30, visit www.fidelity.com/proxyvotingresults or visit the Securities and Exchange Commission's (SEC) web site at www.sec.gov. You may also call 1-800-544-5429 to request a free copy of the proxy voting guidelines.
Fidelity Variable Insurance Products are separate account options which are purchased through a variable insurance contract.
Standard & Poor's, S&P and S&P 500 are registered service marks of The McGraw-Hill Companies, Inc. and have been licensed for use by Fidelity Distributors Corporation.
Other third party marks appearing herein are the property of their respective owners.
All other marks appearing herein are registered or unregistered trademarks or service marks of FMR Corp. or an affiliated company.
(Recycle graphic) This report is printed on recycled paper using soy-based inks.
This report and the financial statements contained herein are submitted for the general information of the shareholders of the fund. This report is not authorized for distribution to prospective investors in the fund unless preceded or accompanied by an effective prospectus.
A fund files its complete schedule of portfolio holdings with the SEC for the first and third quarters of each fiscal year on Form N-Q. Forms N-Q are available on the SEC's web site at http://www.sec.gov. A fund's Forms N-Q may be reviewed and copied at the SEC's Public Reference Room in Washington, DC. Information regarding the operation of the SEC's Public Reference Room may be obtained by calling 1-800-SEC-0330. For a complete list of a fund's portfolio holdings, view the most recent quarterly holdings report, semiannual report, or annual report on Fidelity's web site at http://www.advisor.fidelity.com.
NOT FDIC INSURED · MAY LOSE VALUE · NO BANK GUARANTEE
Neither the fund nor Fidelity Distributors Corporation is a bank.
Balanced Portfolio
Fidelity Variable Insurance Products: Balanced Portfolio
Performance: The Bottom Line
Average annual total return reflects the change in the value of an investment, assuming reinvestment of the class' dividend income and capital gains (the profits earned upon the sale of securities that have grown in value) and assuming a constant rate of performance each year. During periods of reimbursement by Fidelity, a fund's total return will be greater than it would be had the reimbursement not occurred. Performance numbers are net of all underlying fund operating expenses, but do not include any insurance charges imposed by your insurance company's separate account. If performance information included the effect of these additional charges, the total returns would have been lower. How a fund did yesterday is no guarantee of how it will do tomorrow.
Average Annual Total Returns
Periods ended December 31, 2004 | Past 1
year | Past 5
years | Life of fund A |
Fidelity ® VIP: Balanced - Initial Class | 5.47% | 1.32% | 7.23% |
Fidelity VIP: Balanced - Service Class B | 5.42% | 1.22% | 7.14% |
Fidelity VIP: Balanced - Service Class 2 C | 5.15% | 1.05% | 7.05% |
A From January 3, 1995.
B The initial offering of Service Class shares took place on November 3, 1997. Performance for Service Class shares reflects an asset-based service fee (12b-1 fee), and returns prior to November 3, 1997 are those of Initial Class and do not include the effects of Service Class' 12b-1 fee. Had Service Class shares' 12b-1 fee been reflected, returns prior to November 3, 1997 would have been lower.
C The initial offering of Service Class 2 shares took place on January 12, 2000. Performance for Service Class 2 shares reflects an asset-based service fee (12b-1 fee). Returns from November 3, 1997 through January 12, 2000 are those of Service Class which reflects a different 12b-1 fee. Service Class 2 returns prior to November 3, 1997 are those of Initial Class, and do not include the effects of a 12b-1 fee. Had Service Class 2's 12b-1 fee been reflected, returns prior to January 12, 2000 would have been lower.
$10,000 Over Life of Fund
Let's say hypothetically that $10,000 was invested in Fidelity® Variable Insurance Products: Balanced Portfolio - Initial Class on January 3, 1995, when the fund started. The chart shows how the value of your investment would have changed, and also shows how the S&P 500® Index performed over the same period.
Annual Report
Fidelity Variable Insurance Products: Balanced Portfolio
Comments from Louis Salemy, Lead Portfolio Manager of Fidelity® Variable Insurance Products: Balanced Portfolio
Equity and fixed-income benchmarks finished the year ending December 31, 2004, with positive returns. In the equity markets, small-cap stocks outperformed large-caps for the sixth consecutive year, as the Russell 2000® Index was up 18.33% compared to 10.88% for the larger-cap Standard & Poor's 500SM Index. Meanwhile, value stocks topped growth stocks: The Russell 3000® Value Index advanced 16.94%, compared to 6.93% for the Russell 3000 Growth Index. Elsewhere, the tech-heavy NASDAQ Composite® Index returned 9.15%, thanks primarily to a 14.87% jump in the fourth quarter, and the Dow Jones Industrial AverageSM gained 5.37%. Despite five increases in short-term interest rates, the Lehman Brothers® Aggregate Bond Index rose 4.34% in 2004. While that's roughly half of the benchmark's historical average annual return, it's better than many analysts expected as 2004 began, given concerns about the potentially high levels of economic growth and subsequent inflation at the start of the year. However, the economic expansion was more moderate than anticipated, and the Fed reassured investors that rate tightening would be undertaken at a "measured pace."
For the 12 months ending December 31, 2004, the fund lagged the 8.30% return of the Fidelity Balanced 60/40 Composite Index and the 8.55% gain of the LipperSM Variable Annuity Balanced Funds Average. Unrewarding stock picking and a significant overweighting in the media industry caused the fund to underperform the index, whereas the fixed-income subportfolio helped reduce the degree of underperformance - largely on the strength of some out-of-index investments in the outperforming high-yield sector. EchoStar Communications, a detractor on the equity side, was the victim of fears about increasing competition from rival satellite TV providers and from the cable industry. Meanwhile, brokerage holdings Morgan Stanley and Merrill Lynch both were sidetracked by investors' concerns about the impact of rising interest rates on future business. On the other hand, my decision to underweight both information technology and health care helped relative performance. In the consumer staples sector, razor manufacturer Gillette was a significant contributor both in absolute terms and compared with the index. Verizon Communications also aided performance, boosted by a regulatory change that enabled the company to charge higher rates for leasing its network to competitors.
The views expressed in this statement reflect those of the portfolio manager only through the end of the period of the report as stated on the cover and do not necessarily represent the views of Fidelity or any other person in the Fidelity organization. Any such views are subject to change at any time based upon market or other conditions and Fidelity disclaims any responsibility to update such views. These views may not be relied on as investment advice and, because investment decisions for a Fidelity fund are based on numerous factors, may not be relied on as an indication of trading intent on behalf of any Fidelity fund.
Balanced Portfolio
Fidelity Variable Insurance Products: Balanced Portfolio
As a shareholder of the Fund, you incur two types of costs: (1) transaction costs, and (2) ongoing costs, including management fees, distribution and/or service (12b-1) fees and other Fund expenses. This Example is intended to help you understand your ongoing costs (in dollars) of investing in the Fund and to compare these costs with the ongoing costs of investing in other mutual funds.
The Example is based on an investment of $1,000 invested at the beginning of the period and held for the entire period (July 1, 2004 to December 31, 2004).
Actual Expenses
The first line of the table below for each class of the Fund provides information about actual account values and actual expenses. You may use the information in this line, together with the amount you invested, to estimate the expenses that you paid over the period. Simply divide your account value by $1,000.00 (for example, an $8,600 account value divided by $1,000.00 = 8.6), then multiply the result by the number in the first line for a class of the Fund under the heading entitled "Expenses Paid During Period" to estimate the expenses you paid on your account during this period. The estimate of expenses does not include any fees or other expenses of any variable annuity or variable life insurance product. If they were, the estimate of expenses you paid during the period would be higher, and your ending account value would be lower.
Hypothetical Example for Comparison Purposes
The second line of the table below for each class of the Fund provides information about hypothetical account values and hypothetical expenses based on a Class' actual expense ratio and an assumed rate of return of 5% per year before expenses, which is not the Class' actual return. The hypothetical account values and expenses may not be used to estimate the actual ending account balance or expenses you paid for the period. You may use this information to compare the ongoing costs of investing in the Fund and other funds. To do so, compare this 5% hypothetical example with the 5% hypothetical examples that appear in the shareholder reports of the other funds. The estimate of expenses does not include any fees or other expenses of any variable annuity or variable life insurance product. If they were, the estimate of expenses you paid during the period would be higher, and your ending account value would be lower.
Please note that the expenses shown in the table are meant to highlight your ongoing costs only and do not reflect any transaction costs. Therefore, the second line of the table is useful in comparing ongoing costs only, and will not help you determine the relative total costs of owning different funds.
| Beginning
Account Value
July 1, 2004 | Ending
Account Value
December 31, 2004 | Expenses Paid
During Period*
July 1, 2004
to December 31, 2004 |
Initial Class | | | |
Actual | $ 1,000.00 | $ 1,055.10 | $ 2.94 |
Hypothetical A | $ 1,000.00 | $ 1,022.27 | $ 2.90 |
Service Class | | | |
Actual | $ 1,000.00 | $ 1,054.70 | $ 3.51 |
Hypothetical A | $ 1,000.00 | $ 1,021.72 | $ 3.46 |
Service Class 2 | | | |
Actual | $ 1,000.00 | $ 1,052.60 | $ 4.28 |
Hypothetical A | $ 1,000.00 | $ 1,020.96 | $ 4.22 |
A 5% return per year before expenses
* Expenses are equal to each Class' annualized expense ratio (shown in the table below); multiplied by the average account value over the period, multiplied by 184/366 (to reflect the one-half year period).
| Annualized
Expense Ratio |
Initial Class | .57% |
Service Class | .68% |
Service Class 2 | .83% |
Annual Report
Fidelity Variable Insurance Products: Balanced Portfolio
Top Five Stocks as of December 31, 2004 |
| % of fund's net assets |
EchoStar Communications Corp. Class A | 5.1 |
Omnicom Group, Inc. | 4.6 |
BellSouth Corp. | 3.4 |
Morgan Stanley | 3.2 |
Wells Fargo & Co. | 3.2 |
| 19.5 |
Top Five Market Sectors as of December 31, 2004 |
| % of fund's net assets |
Financials | 16.7 |
Consumer Discretionary | 15.8 |
Telecommunication Services | 9.0 |
Consumer Staples | 8.7 |
Information Technology | 4.1 |
Asset Allocation as of December 31, 2004 |
% of fund's net assets* |
 | Stocks | 55.9% | |
 | Bonds | 36.3% | |
 | Short-Term
Investments and
Net Other Assets | 7.7% | |
 | Other Investments | 0.1% | |
* Foreign investments | 5.0% | |
Percentages are adjusted for the effect of futures contracts and swaps, if applicable. |

Balanced Portfolio
Fidelity Variable Insurance Products: Balanced Portfolio
Showing Percentage of Net Assets
Common Stocks - 55.9% |
| Shares | | Value
(Note 1) |
CONSUMER DISCRETIONARY - 14.1% |
Hotels, Restaurants & Leisure - 0.4% |
Carnival Corp. unit | 21,100 | | $ 1,215,993 |
Media - 11.7% |
E.W. Scripps Co. Class A | 89,600 | | 4,325,888 |
EchoStar Communications Corp. Class A | 532,979 | | 17,716,209 |
News Corp. Class B (e) | 143,000 | | 2,745,600 |
Omnicom Group, Inc. | 190,200 | | 16,037,664 |
| | 40,825,361 |
Multiline Retail - 1.6% |
Kohl's Corp. (a) | 111,900 | | 5,502,123 |
Textiles, Apparel & Luxury Goods - 0.4% |
Liz Claiborne, Inc. | 29,000 | | 1,224,090 |
Reebok International Ltd. | 7,400 | | 325,600 |
| | 1,549,690 |
TOTAL CONSUMER DISCRETIONARY | | 49,093,167 |
CONSUMER STAPLES - 8.4% |
Beverages - 0.5% |
The Coca-Cola Co. | 44,200 | | 1,840,046 |
Food & Staples Retailing - 3.9% |
Costco Wholesale Corp. | 63,500 | | 3,074,035 |
Wal-Mart Stores, Inc. | 142,800 | | 7,542,696 |
Walgreen Co. | 75,100 | | 2,881,587 |
| | 13,498,318 |
Food Products - 0.3% |
McCormick & Co., Inc. (non-vtg.) | 30,200 | | 1,165,720 |
Household Products - 1.6% |
Colgate-Palmolive Co. | 29,800 | | 1,524,568 |
Kimberly-Clark Corp. | 59,900 | | 3,942,019 |
| | 5,466,587 |
Personal Products - 1.3% |
Gillette Co. | 101,500 | | 4,545,170 |
Tobacco - 0.8% |
Altria Group, Inc. | 48,650 | | 2,972,515 |
TOTAL CONSUMER STAPLES | | 29,488,356 |
ENERGY - 2.8% |
Oil & Gas - 2.8% |
BP PLC sponsored ADR | 49,200 | | 2,873,280 |
Exxon Mobil Corp. | 133,232 | | 6,829,472 |
| | 9,702,752 |
FINANCIALS - 14.0% |
Capital Markets - 7.4% |
Goldman Sachs Group, Inc. | 58,000 | | 6,034,320 |
|
| Shares | | Value
(Note 1) |
Merrill Lynch & Co., Inc. | 144,900 | | $ 8,660,673 |
Morgan Stanley | 205,100 | | 11,387,152 |
| | 26,082,145 |
Commercial Banks - 3.2% |
Wells Fargo & Co. | 178,200 | | 11,075,130 |
Consumer Finance - 0.6% |
American Express Co. | 35,600 | | 2,006,772 |
Insurance - 2.8% |
Allstate Corp. | 44,000 | | 2,275,680 |
American International Group, Inc. | 70,450 | | 4,626,452 |
PartnerRe Ltd. | 19,200 | | 1,189,248 |
St. Paul Travelers Companies, Inc. | 45,249 | | 1,677,380 |
| | 9,768,760 |
TOTAL FINANCIALS | | 48,932,807 |
HEALTH CARE - 1.0% |
Health Care Equipment & Supplies - 0.5% |
Alcon, Inc. | 20,800 | | 1,676,480 |
Pharmaceuticals - 0.5% |
Pfizer, Inc. | 66,900 | | 1,798,941 |
TOTAL HEALTH CARE | | 3,475,421 |
INDUSTRIALS - 2.8% |
Aerospace & Defense - 0.7% |
Lockheed Martin Corp. | 19,500 | | 1,083,225 |
Northrop Grumman Corp. | 27,800 | | 1,511,208 |
| | 2,594,433 |
Airlines - 0.3% |
Continental Airlines, Inc. Class B (a) | 75,200 | | 1,018,208 |
Industrial Conglomerates - 1.4% |
General Electric Co. | 131,800 | | 4,810,700 |
Road & Rail - 0.4% |
Union Pacific Corp. | 19,900 | | 1,338,275 |
TOTAL INDUSTRIALS | | 9,761,616 |
INFORMATION TECHNOLOGY - 3.6% |
Communications Equipment - 0.9% |
Cisco Systems, Inc. (a) | 162,500 | | 3,136,250 |
Lucent Technologies, Inc. warrants 12/10/07 (a) | 13,353 | | 21,098 |
| | 3,157,348 |
Computers & Peripherals - 0.4% |
Diebold, Inc. | 25,500 | | 1,421,115 |
IT Services - 0.4% |
Paychex, Inc. | 39,600 | | 1,349,568 |
Common Stocks - continued |
| Shares | | Value
(Note 1) |
INFORMATION TECHNOLOGY - continued |
Software - 1.9% |
Computer Associates International, Inc. | 119 | | $ 3,696 |
Microsoft Corp. | 253,700 | | 6,776,327 |
| | 6,780,023 |
TOTAL INFORMATION TECHNOLOGY | | 12,708,054 |
MATERIALS - 1.5% |
Containers & Packaging - 1.5% |
Packaging Corp. of America | 25,900 | | 609,945 |
Smurfit-Stone Container Corp. (a) | 256,623 | | 4,793,718 |
| | 5,403,663 |
TELECOMMUNICATION SERVICES - 7.4% |
Diversified Telecommunication Services - 7.4% |
BellSouth Corp. | 424,500 | | 11,796,855 |
SBC Communications, Inc. | 138,870 | | 3,578,680 |
Telewest Global, Inc. (a) | 5,008 | | 88,041 |
Verizon Communications, Inc. | 260,000 | | 10,532,600 |
| | 25,996,176 |
Wireless Telecommunication Services - 0.0% |
DigitalGlobe, Inc. (f) | 163 | | 163 |
TOTAL TELECOMMUNICATION SERVICES | | 25,996,339 |
UTILITIES - 0.3% |
Electric Utilities - 0.3% |
Entergy Corp. | 13,200 | | 892,188 |
TOTAL COMMON STOCKS (Cost $162,312,978) | 195,454,363 |
Nonconvertible Preferred Stocks - 0.0% |
| | | |
CONSUMER DISCRETIONARY - 0.0% |
Media - 0.0% |
PRIMEDIA, Inc. Series D, 10.00% | 80 | | 8,040 |
TOTAL NONCONVERTIBLE
PREFERRED STOCKS (Cost $7,680) | 8,040 |
Corporate Bonds - 11.8% |
| Principal
Amount | | |
Convertible Bonds - 0.1% |
INFORMATION TECHNOLOGY - 0.1% |
Electronic Equipment & Instruments - 0.1% |
Celestica, Inc. liquid yield option note 0% 8/1/20 | | $ 410,000 | | 227,550 |
|
| Principal
Amount | | Value
(Note 1) |
TELECOMMUNICATION SERVICES - 0.0% |
Wireless Telecommunication Services - 0.0% |
Nextel Communications, Inc. 5.25% 1/15/10 | | $ 150,000 | | $ 153,000 |
TOTAL CONVERTIBLE BONDS | | 380,550 |
Nonconvertible Bonds - 11.7% |
CONSUMER DISCRETIONARY - 1.7% |
Auto Components - 0.1% |
DaimlerChrysler NA Holding Corp. 7.2% 9/1/09 | | 150,000 | | 166,952 |
Dana Corp. 6.5% 3/1/09 | | 30,000 | | 31,650 |
Delco Remy International, Inc. 9.375% 4/15/12 | | 95,000 | | 98,325 |
Stoneridge, Inc. 11.5% 5/1/12 | | 15,000 | | 17,175 |
Tenneco Automotive, Inc. 8.625% 11/15/14 (f) | | 40,000 | | 41,500 |
Visteon Corp.: | | | | |
7% 3/10/14 | | 55,000 | | 52,388 |
8.25% 8/1/10 | | 45,000 | | 47,250 |
| | 455,240 |
Automobiles - 0.2% |
Ford Motor Co.: | | | | |
6.625% 10/1/28 | | 40,000 | | 37,310 |
7.45% 7/16/31 | | 200,000 | | 201,148 |
General Motors Corp.: | | | | |
8.25% 7/15/23 | | 415,000 | | 432,294 |
8.375% 7/15/33 | | 120,000 | | 124,330 |
| | 795,082 |
Hotels, Restaurants & Leisure - 0.3% |
Argosy Gaming Co. 7% 1/15/14 | | 40,000 | | 44,400 |
Carrols Corp. 9% 1/15/13 (f) | | 55,000 | | 56,925 |
Friendly Ice Cream Corp. 8.375% 6/15/12 | | 15,000 | | 14,700 |
Gaylord Entertainment Co. 8% 11/15/13 | | 40,000 | | 43,200 |
Host Marriott LP 7.125% 11/1/13 | | 35,000 | | 37,275 |
Landry's Seafood Restaurants, Inc. 7.5% 12/15/14 (f) | | 105,000 | | 104,606 |
Mandalay Resort Group 6.5% 7/31/09 | | 95,000 | | 99,750 |
MGM MIRAGE: | | | | |
5.875% 2/27/14 | | 90,000 | | 89,100 |
9.75% 6/1/07 | | 15,000 | | 16,725 |
Mohegan Tribal Gaming Authority 6.375% 7/15/09 | | 80,000 | | 82,700 |
Morton's Restaurant Group, Inc. 7.5% 7/1/10 | | 30,000 | | 29,250 |
NCL Corp. Ltd. 10.625% 7/15/14 (f) | | 25,000 | | 24,750 |
Penn National Gaming, Inc. 6.875% 12/1/11 | | 90,000 | | 93,600 |
Corporate Bonds - continued |
| Principal
Amount | | Value
(Note 1) |
Nonconvertible Bonds - continued |
CONSUMER DISCRETIONARY - continued |
Hotels, Restaurants & Leisure - continued |
Six Flags, Inc. 9.625% 6/1/14 | | $ 90,000 | | $ 91,125 |
Station Casinos, Inc. 6% 4/1/12 | | 60,000 | | 61,800 |
Vail Resorts, Inc. 6.75% 2/15/14 | | 40,000 | | 40,650 |
Virgin River Casino Corp./RBG LLC/B&BB, Inc. 9% 1/15/12 (f) | | 20,000 | | 20,800 |
Wynn Las Vegas LLC/ Wynn Las Vegas Capital Corp. 6.625% 12/1/14 (f) | | 130,000 | | 128,863 |
| | 1,080,219 |
Household Durables - 0.1% |
Levitz Home Furnishings, Inc. 12% 11/1/11 (f) | | 60,000 | | 61,200 |
Standard Pacific Corp. 7.75% 3/15/13 | | 150,000 | | 161,063 |
WCI Communities, Inc. 7.875% 10/1/13 | | 40,000 | | 42,100 |
| | 264,363 |
Leisure Equipment & Products - 0.0% |
K2, Inc. 7.375% 7/1/14 (f) | | 30,000 | | 32,550 |
True Temper Sports, Inc. 8.375% 9/15/11 | | 20,000 | | 18,600 |
| | 51,150 |
Media - 0.8% |
Advanstar Communications, Inc. 10.75% 8/15/10 | | 40,000 | | 45,100 |
AMC Entertainment, Inc. 9.875% 2/1/12 | | 35,000 | | 37,800 |
AOL Time Warner, Inc. 7.625% 4/15/31 | | 100,000 | | 120,976 |
Cablevision Systems Corp.: | | | | |
6.6688% 4/1/09 (f)(h) | | 90,000 | | 95,625 |
8% 4/15/12 (f) | | 130,000 | | 138,288 |
CanWest Media, Inc. 8% 9/15/12 (f) | | 30,000 | | 32,025 |
CBD Media LLC/ CBD Finance, Inc. 8.625% 6/1/11 | | 20,000 | | 21,100 |
Charter Communications Operating LLC/Charter Communications Operating Capital Corp. 8% 4/30/12 (f) | | 80,000 | | 83,400 |
Corus Entertainment, Inc. 8.75% 3/1/12 | | 240,000 | | 263,100 |
Cox Communications, Inc. 7.125% 10/1/12 | | 100,000 | | 112,086 |
CSC Holdings, Inc.: | | | | |
7.625% 4/1/11 | | 170,000 | | 183,600 |
7.625% 7/15/18 | | 20,000 | | 21,200 |
Dex Media, Inc.: | | | | |
0% 11/15/13 (d) | | 45,000 | | 35,100 |
8% 11/15/13 | | 110,000 | | 118,800 |
|
| Principal
Amount | | Value
(Note 1) |
Houghton Mifflin Co. 9.875% 2/1/13 | | $ 85,000 | | $ 92,863 |
Kabel Deutschland GmbH 10.625% 7/1/14 (f) | | 40,000 | | 46,000 |
LBI Media Holdings, Inc. 0% 10/15/13 (d) | | 90,000 | | 66,150 |
LBI Media, Inc. 10.125% 7/15/12 | | 160,000 | | 178,400 |
Liberty Media Corp. 8.25% 2/1/30 | | 100,000 | | 113,706 |
Loews Cineplex Entertainment Corp. 9% 8/1/14 (f) | | 80,000 | | 86,800 |
News America, Inc. 6.2% 12/15/34 (f) | | 250,000 | | 253,379 |
Nexstar Broadcasting, Inc. 7% 1/15/14 | | 60,000 | | 59,400 |
PanAmSat Corp. 9% 8/15/14 (f) | | 40,000 | | 44,600 |
PEI Holdings, Inc. 11% 3/15/10 | | 27,000 | | 31,455 |
PRIMEDIA, Inc. 7.625% 4/1/08 | | 235,000 | | 237,350 |
Rogers Cable, Inc. 6.75% 3/15/15 (f) | | 120,000 | | 121,950 |
Time Warner, Inc. 6.625% 5/15/29 | | 105,000 | | 113,139 |
Videotron Ltee 6.875% 1/15/14 (f) | | 110,000 | | 114,400 |
| | 2,867,792 |
Multiline Retail - 0.1% |
Dillard's, Inc. 6.69% 8/1/07 | | 125,000 | | 128,750 |
Specialty Retail - 0.1% |
Asbury Automotive Group, Inc.: | | | | |
8% 3/15/14 | | 145,000 | | 143,550 |
9% 6/15/12 | | 45,000 | | 47,363 |
Blockbuster, Inc. 9% 9/1/12 (f) | | 60,000 | | 60,000 |
Sonic Automotive, Inc. 8.625% 8/15/13 | | 90,000 | | 96,300 |
| | 347,213 |
TOTAL CONSUMER DISCRETIONARY | | 5,989,809 |
CONSUMER STAPLES - 0.3% |
Food & Staples Retailing - 0.2% |
Ahold Finance USA, Inc.: | | | | |
6.875% 5/1/29 | | 50,000 | | 48,750 |
8.25% 7/15/10 | | 120,000 | | 136,800 |
Jean Coutu Group, Inc.: | | | | |
7.625% 8/1/12 (f) | | 30,000 | | 31,725 |
8.5% 8/1/14 (f) | | 70,000 | | 71,750 |
NeighborCare, Inc. 6.875% 11/15/13 | | 75,000 | | 79,125 |
Rite Aid Corp.: | | | | |
6% 12/15/05 (f) | | 35,000 | | 35,350 |
8.125% 5/1/10 | | 60,000 | | 63,300 |
9.5% 2/15/11 | | 60,000 | | 66,000 |
Stater Brothers Holdings, Inc. 5.99% 6/15/10 (h) | | 60,000 | | 61,650 |
| | 594,450 |
Corporate Bonds - continued |
| Principal
Amount | | Value
(Note 1) |
Nonconvertible Bonds - continued |
CONSUMER STAPLES - continued |
Food Products - 0.1% |
Del Monte Corp. 9.25% 5/15/11 | | $ 145,000 | | $ 159,500 |
Doane Pet Care Co. 10.75% 3/1/10 | | 45,000 | | 48,150 |
Hines Nurseries, Inc. 10.25% 10/1/11 | | 20,000 | | 21,850 |
Reddy Ice Group, Inc. 8.875% 8/1/11 | | 20,000 | | 21,600 |
Smithfield Foods, Inc. 7% 8/1/11 (f) | | 140,000 | | 149,450 |
United Agriculture Products, Inc. 8.25% 12/15/11 (f) | | 27,000 | | 28,958 |
| | 429,508 |
Personal Products - 0.0% |
Jafra Cosmetics International, Inc./Distribuidora Comercial Jafra SA de CV 10.75% 5/15/11 | | 40,000 | | 45,200 |
Tobacco - 0.0% |
Altria Group, Inc. 7% 11/4/13 | | 110,000 | | 119,190 |
TOTAL CONSUMER STAPLES | | 1,188,348 |
ENERGY - 1.2% |
Energy Equipment & Services - 0.2% |
Grant Prideco, Inc. 9% 12/15/09 | | 20,000 | | 22,425 |
Hanover Compressor Co.: | | | | |
8.625% 12/15/10 | | 30,000 | | 32,700 |
9% 6/1/14 | | 30,000 | | 33,300 |
Hornbeck Offshore Services, Inc. 6.125% 12/1/14 (f) | | 85,000 | | 84,575 |
Petronas Capital Ltd. 7% 5/22/12 (f) | | 395,000 | | 452,484 |
Pride International, Inc. 7.375% 7/15/14 | | 40,000 | | 43,600 |
Seabulk International, Inc. 9.5% 8/15/13 | | 80,000 | | 84,800 |
| | 753,884 |
Oil & Gas - 1.0% |
Amerada Hess Corp.: | | | | |
6.65% 8/15/11 | | 25,000 | | 27,492 |
7.125% 3/15/33 | | 75,000 | | 82,467 |
7.375% 10/1/09 | | 60,000 | | 67,035 |
Belden & Blake Corp. 8.75% 7/15/12 (f) | | 20,000 | | 20,450 |
Chesapeake Energy Corp.: | | | | |
7.5% 9/15/13 | | 70,000 | | 76,213 |
7.5% 6/15/14 | | 40,000 | | 43,600 |
El Paso Corp.: | | | | |
7% 5/15/11 | | 90,000 | | 90,450 |
7.875% 6/15/12 | | 120,000 | | 124,800 |
|
| Principal
Amount | | Value
(Note 1) |
El Paso Energy Corp.: | | | | |
6.95% 12/15/07 | | $ 55,000 | | $ 57,338 |
7.375% 12/15/12 | | 30,000 | | 30,113 |
El Paso Production Holding Co. 7.75% 6/1/13 | | 180,000 | | 187,650 |
Empresa Nacional de Petroleo 6.75% 11/15/12 (f) | | 120,000 | | 133,445 |
EnCana Holdings Finance Corp. 5.8% 5/1/14 | | 80,000 | | 85,287 |
Enterprise Products Operating LP: | | | | |
4.625% 10/15/09 (f) | | 45,000 | | 44,929 |
5.6% 10/15/14 (f) | | 30,000 | | 30,266 |
General Maritime Corp. 10% 3/15/13 | | 120,000 | | 138,000 |
Kinder Morgan Energy Partners LP 7.125% 3/15/12 | | 70,000 | | 80,026 |
Overseas Shipholding Group, Inc. 8.25% 3/15/13 | | 110,000 | | 122,375 |
Pemex Project Funding Master Trust: | | | | |
6.125% 8/15/08 | | 400,000 | | 424,000 |
7.875% 2/1/09 (h) | | 180,000 | | 202,230 |
Plains Exploration & Production Co.: | | | | |
7.125% 6/15/14 | | 40,000 | | 43,800 |
8.75% 7/1/12 | | 60,000 | | 67,125 |
Range Resources Corp. 7.375% 7/15/13 | | 110,000 | | 117,700 |
Ship Finance International Ltd. 8.5% 12/15/13 | | 360,000 | | 370,800 |
Stone Energy Corp. 6.75% 12/15/14 (f) | | 20,000 | | 19,800 |
Teekay Shipping Corp. 8.875% 7/15/11 | | 100,000 | | 116,000 |
The Coastal Corp.: | | | | |
6.5% 5/15/06 | | 15,000 | | 15,506 |
6.5% 6/1/08 | | 75,000 | | 75,375 |
7.5% 8/15/06 | | 90,000 | | 94,950 |
7.625% 9/1/08 | | 10,000 | | 10,388 |
7.75% 6/15/10 | | 35,000 | | 36,575 |
Venoco, Inc. 8.75% 12/15/11 (f) | | 60,000 | | 61,800 |
Williams Companies, Inc.: | | | | |
7.125% 9/1/11 | | 125,000 | | 136,563 |
7.5% 1/15/31 | | 10,000 | | 10,350 |
7.625% 7/15/19 | | 105,000 | | 114,450 |
8.75% 3/15/32 | | 25,000 | | 28,750 |
| | 3,388,098 |
TOTAL ENERGY | | 4,141,982 |
FINANCIALS - 2.7% |
Capital Markets - 0.7% |
BCP Caylux Holdings Luxembourg SCA 9.625% 6/15/14 (f) | | 150,000 | | 168,000 |
Equinox Holdings Ltd. 9% 12/15/09 | | 20,000 | | 21,200 |
Corporate Bonds - continued |
| Principal
Amount | | Value
(Note 1) |
Nonconvertible Bonds - continued |
FINANCIALS - continued |
Capital Markets - continued |
Goldman Sachs Group, Inc.: | | | | |
5.25% 10/15/13 | | $ 500,000 | | $ 511,550 |
6.6% 1/15/12 | | 410,000 | | 457,576 |
Merrill Lynch & Co., Inc.: | | | | |
4.125% 1/15/09 | | 700,000 | | 703,855 |
5% 1/15/15 | | 25,000 | | 24,902 |
Morgan Stanley: | | | | |
3.875% 1/15/09 | | 500,000 | | 497,221 |
4.75% 4/1/14 | | 75,000 | | 73,081 |
6.6% 4/1/12 | | 160,000 | | 178,451 |
| | 2,635,836 |
Commercial Banks - 0.3% |
Bank of America Corp.: | | | | |
6.25% 4/15/12 | | 125,000 | | 138,051 |
7.4% 1/15/11 | | 155,000 | | 179,549 |
Fleet Financial Group, Inc. 7.125% 4/15/06 | | 140,000 | | 146,523 |
Korea Development Bank 3.875% 3/2/09 | | 250,000 | | 246,759 |
PNC Funding Corp. 5.75% 8/1/06 | | 155,000 | | 160,742 |
Wachovia Corp. 4.875% 2/15/14 | | 90,000 | | 89,701 |
Wells Fargo & Co. 4.2% 1/15/10 | | 45,000 | | 45,183 |
| | 1,006,508 |
Consumer Finance - 0.4% |
Capital One Bank 5% 6/15/09 | | 250,000 | | 257,427 |
Ford Motor Credit Co. 7% 10/1/13 | | 275,000 | | 291,536 |
General Motors Acceptance Corp. 6.875% 9/15/11 | | 115,000 | | 117,851 |
Household Finance Corp. 4.125% 11/16/09 | | 300,000 | | 298,387 |
Household International, Inc. 8.875% 2/15/08 | | 150,000 | | 158,787 |
MBNA Corp.: | | | | |
6.25% 1/17/07 | | 120,000 | | 126,268 |
7.5% 3/15/12 | | 175,000 | | 202,177 |
| | 1,452,433 |
Diversified Financial Services - 0.7% |
Alliance Capital Management LP 5.625% 8/15/06 | | 150,000 | | 155,022 |
BRL Universal Equipment 2001 A LP/BRL Universal Equipment Corp. 8.875% 2/15/08 | | 120,000 | | 127,200 |
Charter Communications Holdings LLC/Charter Communications Holdings Capital Corp.: | | | | |
0% 5/15/11 (d) | | 116,000 | | 85,260 |
9.625% 11/15/09 | | 170,000 | | 148,750 |
|
| Principal
Amount | | Value
(Note 1) |
CMS Energy X-TRAS pass thru trust certificates 7% 1/15/05 | | $ 75,000 | | $ 75,000 |
Couche Tard U.S. LP /Couche Tard Financing Corp. 7.5% 12/15/13 | | 70,000 | | 75,950 |
Dex Media West LLC/Dex Media West Finance Co. 9.875% 8/15/13 | | 39,000 | | 44,850 |
Gerdau AmeriSteel Corp./GUSAP Partners 10.375% 7/15/11 | | 130,000 | | 152,750 |
Hutchison Whampoa International 03/13 Ltd. 6.5% 2/13/13 (f) | | 55,000 | | 59,273 |
Hutchison Whampoa International 03/33 Ltd.: | | | | |
6.25% 1/24/14 (f) | | 120,000 | | 126,372 |
7.45% 11/24/33 (f) | | 85,000 | | 94,213 |
J.P. Morgan Chase & Co. 6.75% 2/1/11 | | 635,000 | | 713,363 |
National Beef Packing Co. LLC/National Beef Finance Corp. 10.5% 8/1/11 | | 105,000 | | 108,675 |
Refco Finance Holdings LLC/Refco Finance, Inc. 9% 8/1/12 (f) | | 100,000 | | 109,000 |
U.S. West Capital Funding, Inc. 6.375% 7/15/08 | | 45,000 | | 44,438 |
UGS Corp. 10% 6/1/12 (f) | | 35,000 | | 39,725 |
Universal City Development Partners Ltd./UCDP Finance, Inc. 11.75% 4/1/10 | | 80,000 | | 94,700 |
Universal City Florida Holding Co. I/II 7.2% 5/1/10 (f)(h) | | 40,000 | | 41,500 |
| | 2,296,041 |
Insurance - 0.1% |
Principal Life Global Funding I 6.25% 2/15/12 (f) | | 85,000 | | 92,915 |
Provident Companies, Inc.: | | | | |
7% 7/15/18 | | 10,000 | | 9,650 |
7.25% 3/15/28 | | 15,000 | | 14,194 |
UnumProvident Corp.: | | | | |
6.75% 12/15/28 | | 65,000 | | 57,525 |
7.625% 3/1/11 | | 55,000 | | 57,613 |
| | 231,897 |
Real Estate - 0.3% |
BRE Properties, Inc. 5.95% 3/15/07 | | 250,000 | | 260,509 |
EOP Operating LP: | | | | |
4.65% 10/1/10 | | 200,000 | | 200,914 |
7% 7/15/11 | | 200,000 | | 225,549 |
Senior Housing Properties Trust: | | | | |
7.875% 4/15/15 | | 40,000 | | 44,000 |
8.625% 1/15/12 | | 80,000 | | 91,400 |
Simon Property Group LP 5.625% 8/15/14 (f) | | 200,000 | | 207,122 |
| | 1,029,494 |
Corporate Bonds - continued |
| Principal
Amount | | Value
(Note 1) |
Nonconvertible Bonds - continued |
FINANCIALS - continued |
Thrifts & Mortgage Finance - 0.2% |
Countrywide Home Loans, Inc. 4% 3/22/11 | | $ 250,000 | | $ 243,065 |
Independence Community Bank Corp. 3.75% 4/1/14 (h) | | 95,000 | | 91,573 |
Washington Mutual, Inc.: | | | | |
4.375% 1/15/08 | | 90,000 | | 91,403 |
4.625% 4/1/14 | | 200,000 | | 191,211 |
| | 617,252 |
TOTAL FINANCIALS | | 9,269,461 |
HEALTH CARE - 0.4% |
Health Care Providers & Services - 0.3% |
AmeriPath, Inc. 10.5% 4/1/13 | | 105,000 | | 111,563 |
Community Health Systems, Inc. 6.5% 12/15/12 (f) | | 60,000 | | 60,450 |
HCA, Inc. 6.375% 1/15/15 | | 70,000 | | 70,150 |
IASIS Healthcare LLC/IASIS Capital Corp. 8.75% 6/15/14 | | 130,000 | | 141,869 |
National Nephrology Associates, Inc. 9% 11/1/11 (f) | | 30,000 | | 34,725 |
Psychiatric Solutions, Inc. 10.625% 6/15/13 | | 45,000 | | 52,088 |
Rotech Healthcare, Inc. 9.5% 4/1/12 | | 75,000 | | 82,125 |
Tenet Healthcare Corp.: | | | | |
6.375% 12/1/11 | | 65,000 | | 59,800 |
7.375% 2/1/13 | | 150,000 | | 146,250 |
9.875% 7/1/14 (f) | | 70,000 | | 76,125 |
U.S. Oncology, Inc.: | | | | |
9% 8/15/12 (f) | | 170,000 | | 187,850 |
10.75% 8/15/14 (f) | | 50,000 | | 57,250 |
| | 1,080,245 |
Pharmaceuticals - 0.1% |
Elan Finance PLC/Elan Finance Corp. 7.75% 11/15/11 (f) | | 160,000 | | 171,200 |
TOTAL HEALTH CARE | | 1,251,445 |
INDUSTRIALS - 0.8% |
Aerospace & Defense - 0.1% |
BE Aerospace, Inc.: | | | | |
8% 3/1/08 | | 65,000 | | 65,000 |
8.875% 5/1/11 | | 25,000 | | 26,125 |
Bombardier, Inc. 6.3% 5/1/14 (f) | | 200,000 | | 173,500 |
Raytheon Co. 8.3% 3/1/10 | | 150,000 | | 177,749 |
| | 442,374 |
|
| Principal
Amount | | Value
(Note 1) |
Airlines - 0.3% |
American Airlines, Inc. pass thru trust certificates: | | | | |
6.817% 5/23/11 | | $ 115,000 | | $ 108,100 |
7.377% 5/23/19 | | 95,503 | | 66,852 |
7.379% 5/23/16 | | 67,347 | | 47,143 |
7.8% 4/1/08 | | 50,000 | | 46,500 |
8.608% 10/1/12 | | 75,000 | | 70,125 |
10.18% 1/2/13 | | 45,000 | | 35,100 |
Continental Airlines, Inc. pass thru trust certificates: | | | | |
6.9% 7/2/18 | | 18,985 | | 15,947 |
7.568% 12/1/06 | | 20,000 | | 16,200 |
8.312% 10/2/12 | | 20,167 | | 15,529 |
8.321% 11/1/06 | | 10,000 | | 9,700 |
Delta Air Lines, Inc. 9.5% 11/18/08 (f) | | 19,000 | | 17,813 |
Delta Air Lines, Inc. pass thru trust certificates: | | | | |
7.299% 9/18/06 | | 1,000 | | 800 |
7.57% 11/18/10 | | 45,000 | | 44,388 |
7.779% 1/2/12 | | 354,807 | | 230,625 |
7.92% 5/18/12 | | 75,000 | | 57,750 |
Northwest Airlines, Inc. 7.875% 3/15/08 | | 255,000 | | 206,550 |
Northwest Airlines, Inc. pass thru trust certificates: | | | | |
7.068% 7/2/17 | | 24,306 | | 21,876 |
7.626% 4/1/10 | | 72,130 | | 59,868 |
7.67% 1/2/15 | | 21,263 | | 18,552 |
| | 1,089,418 |
Building Products - 0.1% |
Building Materials Corp. of America 7.75% 8/1/14 (f) | | 80,000 | | 80,000 |
Mueller Group, Inc. 6.91% 11/1/11 (h) | | 80,000 | | 82,800 |
Nortek, Inc. 8.5% 9/1/14 (f) | | 90,000 | | 94,050 |
| | 256,850 |
Commercial Services & Supplies - 0.1% |
Allied Waste North America, Inc.: | | | | |
5.75% 2/15/11 | | 40,000 | | 37,600 |
6.375% 4/15/11 | | 40,000 | | 38,000 |
7.625% 1/1/06 | | 30,000 | | 30,975 |
| | 106,575 |
Machinery - 0.2% |
Cummins, Inc. 9.5% 12/1/10 (h) | | 50,000 | | 56,500 |
Dresser-Rand Group, Inc. 7.375% 11/1/14 (f) | | 40,000 | | 40,700 |
Invensys PLC 9.875% 3/15/11 (f) | | 180,000 | | 194,400 |
Park-Ohio Industries, Inc. 8.375% 11/15/14 (f) | | 40,000 | | 39,900 |
Corporate Bonds - continued |
| Principal
Amount | | Value
(Note 1) |
Nonconvertible Bonds - continued |
INDUSTRIALS - continued |
Machinery - continued |
Terex Corp.: | | | | |
7.375% 1/15/14 | | $ 20,000 | | $ 21,300 |
9.25% 7/15/11 | | 195,000 | | 218,888 |
| | 571,688 |
Marine - 0.0% |
H-Lines Finance Holding Corp. 0% 4/1/13 (d)(f) | | 30,000 | | 21,825 |
OMI Corp. 7.625% 12/1/13 | | 45,000 | | 48,150 |
| | 69,975 |
Road & Rail - 0.0% |
TFM SA de CV yankee: | | | | |
10.25% 6/15/07 | | 20,000 | | 21,400 |
11.75% 6/15/09 | | 60,000 | | 60,900 |
| | 82,300 |
TOTAL INDUSTRIALS | | 2,619,180 |
INFORMATION TECHNOLOGY - 0.4% |
Communications Equipment - 0.1% |
L-3 Communications Corp. 6.125% 1/15/14 | | 70,000 | | 72,100 |
Lucent Technologies, Inc.: | | | | |
6.45% 3/15/29 | | 70,000 | | 63,700 |
6.5% 1/15/28 | | 30,000 | | 27,000 |
Nortel Networks Corp. 6.125% 2/15/06 | | 80,000 | | 81,700 |
| | 244,500 |
Electronic Equipment & Instruments - 0.1% |
Celestica, Inc. 7.875% 7/1/11 | | 200,000 | | 214,000 |
Flextronics International Ltd. 6.5% 5/15/13 | | 20,000 | | 20,400 |
Sanmina-SCI Corp. 10.375% 1/15/10 | | 85,000 | | 97,325 |
Solectron Corp. 7.375% 3/1/06 | | 115,000 | | 118,594 |
| | 450,319 |
IT Services - 0.0% |
Iron Mountain, Inc. 6.625% 1/1/16 | | 50,000 | | 46,750 |
Office Electronics - 0.0% |
Xerox Corp.: | | | | |
7.125% 6/15/10 | | 60,000 | | 64,800 |
7.625% 6/15/13 | | 70,000 | | 77,000 |
| | 141,800 |
Semiconductors & Semiconductor Equipment - 0.2% |
Freescale Semiconductor, Inc.: | | | | |
4.82% 7/15/09 (h) | | 70,000 | | 73,150 |
6.875% 7/15/11 | | 80,000 | | 85,800 |
|
| Principal
Amount | | Value
(Note 1) |
7.125% 7/15/14 | | $ 80,000 | | $ 86,800 |
MagnaChip Semiconductor SA/MagnaChip Semiconductor Finance Co.: | | | | |
5.78% 12/15/11 (f)(h) | | 30,000 | | 30,788 |
6.875% 12/15/11 (f) | | 40,000 | | 41,200 |
8% 12/15/14 (f) | | 20,000 | | 20,850 |
Semiconductor Note Participation Trust 0% 8/4/11 (f) | | 105,000 | | 157,500 |
Viasystems, Inc. 10.5% 1/15/11 | | 80,000 | | 78,400 |
| | 574,488 |
TOTAL INFORMATION TECHNOLOGY | | 1,457,857 |
MATERIALS - 1.1% |
Chemicals - 0.3% |
America Rock Salt Co. LLC 9.5% 3/15/14 | | 50,000 | | 52,250 |
Berry Plastics Corp. 10.75% 7/15/12 | | 60,000 | | 68,550 |
Equistar Chemicals LP/Equistar Funding Corp. 10.625% 5/1/11 | | 110,000 | | 127,050 |
Huntsman Advanced Materials LLC 11% 7/15/10 (f) | | 40,000 | | 47,000 |
Huntsman ICI Holdings LLC 0% 12/31/09 | | 55,000 | | 31,075 |
Huntsman International LLC 9.875% 3/1/09 | | 60,000 | | 65,700 |
JohnsonDiversey Holdings, Inc. 0% 5/15/13 (d) | | 45,000 | | 38,925 |
Lubrizol Corp.: | | | | |
4.625% 10/1/09 | | 80,000 | | 79,877 |
5.5% 10/1/14 | | 35,000 | | 35,206 |
6.5% 10/1/34 | | 65,000 | | 66,200 |
Lyondell Chemical Co.: | | | | |
9.5% 12/15/08 | | 25,000 | | 27,250 |
9.625% 5/1/07 | | 30,000 | | 32,925 |
Methanex Corp. yankee 7.75% 8/15/05 | | 155,000 | | 158,875 |
Millennium America, Inc. 9.25% 6/15/08 | | 70,000 | | 79,100 |
Nalco Co. 7.75% 11/15/11 | | 50,000 | | 53,875 |
PolyOne Corp.: | | | | |
8.875% 5/1/12 | | 45,000 | | 49,050 |
10.625% 5/15/10 | | 25,000 | | 28,125 |
The Scotts Co. 6.625% 11/15/13 | | 50,000 | | 52,750 |
| | 1,093,783 |
Construction Materials - 0.1% |
RMCC Acquisition Co. 9.5% 11/1/12 (f) | | 180,000 | | 177,300 |
Texas Industries, Inc. 10.25% 6/15/11 | | 140,000 | | 165,200 |
U.S. Concrete, Inc. 8.375% 4/1/14 | | 50,000 | | 53,750 |
| | 396,250 |
Corporate Bonds - continued |
| Principal
Amount | | Value
(Note 1) |
Nonconvertible Bonds - continued |
MATERIALS - continued |
Containers & Packaging - 0.3% |
Anchor Glass Container Corp. 11% 2/15/13 | | $ 60,000 | | $ 65,100 |
BWAY Corp. 10% 10/15/10 | | 40,000 | | 42,600 |
Cellu Tissue Holdings, Inc. 9.75% 3/15/10 | | 60,000 | | 62,400 |
Crown European Holdings SA 10.875% 3/1/13 | | 80,000 | | 94,600 |
Jefferson Smurfit Corp. U.S. 7.5% 6/1/13 | | 130,000 | | 139,100 |
Owens-Brockway Glass Container, Inc.: | | | | |
6.75% 12/1/14 (f) | | 50,000 | | 51,000 |
7.75% 5/15/11 | | 50,000 | | 54,250 |
8.75% 11/15/12 | | 25,000 | | 28,063 |
8.875% 2/15/09 | | 95,000 | | 103,075 |
Owens-Illinois, Inc.: | | | | |
7.35% 5/15/08 | | 295,000 | | 311,225 |
7.8% 5/15/18 | | 45,000 | | 46,575 |
Sealed Air Corp. 5.625% 7/15/13 (f) | | 30,000 | | 31,036 |
| | 1,029,024 |
Metals & Mining - 0.2% |
Allegheny Technologies, Inc. 8.375% 12/15/11 | | 45,000 | | 49,950 |
California Steel Industries, Inc. 6.125% 3/15/14 | | 60,000 | | 59,550 |
Compass Minerals International, Inc. 0% 12/15/12 (d) | | 80,000 | | 68,400 |
CSN Islands VIII Corp. 9.75% 12/16/13 (f) | | 100,000 | | 107,000 |
Foundation Pennsylvania Coal Co. 7.25% 8/1/14 (f) | | 50,000 | | 52,875 |
IMCO Recycling Escrow, Inc. 9% 11/15/14 (f) | | 55,000 | | 56,925 |
International Steel Group, Inc. 6.5% 4/15/14 | | 85,000 | | 91,800 |
Ispat Inland ULC 9.75% 4/1/14 | | 45,000 | | 55,575 |
Massey Energy Co. 6.625% 11/15/10 | | 40,000 | | 41,600 |
Wise Metals Group LLC/Alloys Finance 10.25% 5/15/12 | | 160,000 | | 160,000 |
| | 743,675 |
Paper & Forest Products - 0.2% |
Boise Cascade LLC/Boise Cascade Finance Corp. 7.125% 10/15/14 (f) | | 30,000 | | 31,500 |
Georgia-Pacific Corp.: | | | | |
7.5% 5/15/06 | | 120,000 | | 125,700 |
8% 1/15/24 | | 80,000 | | 92,700 |
8.125% 5/15/11 | | 120,000 | | 138,000 |
|
| Principal
Amount | | Value
(Note 1) |
International Paper Co.: | | | | |
4.25% 1/15/09 | | $ 35,000 | | $ 35,128 |
5.5% 1/15/14 | | 95,000 | | 98,136 |
Norske Skog Canada Ltd. 8.625% 6/15/11 | | 150,000 | | 160,500 |
| | 681,664 |
TOTAL MATERIALS | | 3,944,396 |
TELECOMMUNICATION SERVICES - 1.5% |
Diversified Telecommunication Services - 1.1% |
AT&T Broadband Corp. 8.375% 3/15/13 | | 100,000 | | 123,310 |
Bellsouth Capital Funding Corp. 7.875% 2/15/30 | | 115,000 | | 143,237 |
BellSouth Corp. 5.2% 9/15/14 | | 100,000 | | 101,922 |
British Telecommunications PLC 8.875% 12/15/30 | | 200,000 | | 267,804 |
Deutsche Telekom International Finance BV 8.75% 6/15/30 | | 250,000 | | 330,115 |
France Telecom SA: | | | | |
8.5% 3/1/11 | | 105,000 | | 125,255 |
9.5% 3/1/31 | | 200,000 | | 271,118 |
Koninklijke KPN NV yankee 8% 10/1/10 | | 200,000 | | 236,068 |
New Skies Satellites BV 7.4375% 11/1/11 (f)(h) | | 90,000 | | 94,500 |
NTL Cable PLC 8.75% 4/15/14 (f) | | 45,000 | | 50,625 |
Primus Telecommunications Group, Inc. 8% 1/15/14 | | 60,000 | | 52,800 |
Qwest Capital Funding, Inc.: | | | | |
7% 8/3/09 | | 60,000 | | 59,400 |
7.75% 8/15/06 | | 270,000 | | 284,175 |
Qwest Communications International, Inc.: | | | | |
7.25% 2/15/11 (f) | | 20,000 | | 20,400 |
7.5% 2/15/14 (f) | | 120,000 | | 121,200 |
Qwest Corp. 9.125% 3/15/12 (f) | | 85,000 | | 98,175 |
Qwest Services Corp. 14% 12/15/10 (f)(h) | | 75,000 | | 90,000 |
SBC Communications, Inc.: | | | | |
6.15% 9/15/34 | | 150,000 | | 154,482 |
6.45% 6/15/34 | | 100,000 | | 107,137 |
Sprint Capital Corp. 6.875% 11/15/28 | | 145,000 | | 158,744 |
Telecom Italia Capital: | | | | |
4.95% 9/30/14 (f) | | 95,000 | | 93,075 |
5.25% 11/15/13 | | 250,000 | | 252,684 |
Telefonica Europe BV 7.75% 9/15/10 | | 105,000 | | 123,132 |
Verizon Global Funding Corp.: | | | | |
7.25% 12/1/10 | | 240,000 | | 274,965 |
7.75% 12/1/30 | | 200,000 | | 248,665 |
| | 3,882,988 |
Corporate Bonds - continued |
| Principal
Amount | | Value
(Note 1) |
Nonconvertible Bonds - continued |
TELECOMMUNICATION SERVICES - continued |
Wireless Telecommunication Services - 0.4% |
America Movil SA de CV: | | | | |
4.125% 3/1/09 | | $ 100,000 | | $ 98,514 |
5.5% 3/1/14 | | 90,000 | | 88,911 |
American Tower Corp. 9.375% 2/1/09 | | 28,000 | | 29,400 |
AT&T Wireless Services, Inc. 7.875% 3/1/11 | | 55,000 | | 64,824 |
Centennial Communications Corp./Centennial Cellular Operating Co. LLC/Centennial Puerto Rico Operations Corp. 8.125% 2/1/14 (h) | | 80,000 | | 82,400 |
Crown Castle International Corp.: | | | | |
Series B, 7.5% 12/1/13 | | 80,000 | | 85,800 |
10.75% 8/1/11 | | 15,000 | | 16,350 |
DirecTV Holdings LLC/DirecTV Financing, Inc. 8.375% 3/15/13 | | 50,000 | | 56,000 |
Inmarsat Finance PLC 7.625% 6/30/12 | | 50,000 | | 52,000 |
Intelsat Ltd.: | | | | |
6.5% 11/1/13 | | 55,000 | | 49,775 |
7.625% 4/15/12 | | 15,000 | | 14,775 |
Millicom International Cellular SA 10% 12/1/13 (f) | | 80,000 | | 83,600 |
Nextel Communications, Inc. 7.375% 8/1/15 | | 160,000 | | 176,800 |
Nextel Partners, Inc. 8.125% 7/1/11 | | 80,000 | | 88,800 |
Rogers Communications, Inc.: | | | | |
5.525% 12/15/10 (f)(h) | | 50,000 | | 52,375 |
6.375% 3/1/14 | | 115,000 | | 113,850 |
7.25% 12/15/12 (f) | | 30,000 | | 31,800 |
7.5% 3/15/15 (f) | | 70,000 | | 73,675 |
8% 12/15/12 (f) | | 40,000 | | 42,200 |
9.625% 5/1/11 | | 40,000 | | 46,600 |
Western Wireless Corp. 9.25% 7/15/13 | | 100,000 | | 109,000 |
| | 1,457,449 |
TOTAL TELECOMMUNICATION SERVICES | | 5,340,437 |
UTILITIES - 1.6% |
Electric Utilities - 0.6% |
Allegheny Energy Supply Co. LLC 8.25% 4/15/12 (f) | | 170,000 | | 191,463 |
Cleveland Electric Illuminating Co. 5.65% 12/15/13 | | 145,000 | | 150,381 |
Duke Capital LLC: | | | | |
4.37% 3/1/09 | | 400,000 | | 402,602 |
6.75% 2/15/32 | | 210,000 | | 228,524 |
Exelon Corp. 6.75% 5/1/11 | | 200,000 | | 223,725 |
|
| Principal
Amount | | Value
(Note 1) |
FirstEnergy Corp. 6.45% 11/15/11 | | $ 25,000 | | $ 27,162 |
Illinois Power Co. 7.5% 6/15/09 | | 155,000 | | 174,820 |
Nevada Power Co.: | | | | |
5.875% 1/15/15 (f) | | 30,000 | | 30,075 |
10.875% 10/15/09 | | 65,000 | | 75,075 |
Niagara Mohawk Power Corp. 8.875% 5/15/07 | | 75,000 | | 83,300 |
Progress Energy, Inc. 7.1% 3/1/11 | | 270,000 | | 303,546 |
Sierra Pacific Power Co. 6.25% 4/15/12 | | 30,000 | | 31,275 |
TECO Energy, Inc.: | | | | |
6.125% 5/1/07 | | 55,000 | | 56,925 |
10.5% 12/1/07 | | 105,000 | | 121,538 |
Texas Genco LLC/Texas Genco Financing Corp. 6.875% 12/15/14 (f) | | 60,000 | | 62,400 |
| | 2,162,811 |
Gas Utilities - 0.2% |
Consolidated Natural Gas Co. 6.85% 4/15/11 | | 70,000 | | 78,997 |
Dynegy Holdings, Inc. 10.125% 7/15/13 (f) | | 50,000 | | 57,000 |
NiSource Finance Corp. 7.875% 11/15/10 | | 230,000 | | 270,383 |
Sonat, Inc.: | | | | |
6.625% 2/1/08 | | 65,000 | | 65,813 |
6.75% 10/1/07 | | 70,000 | | 73,500 |
7.625% 7/15/11 | | 20,000 | | 20,625 |
Southern Natural Gas Co. 8.875% 3/15/10 | | 40,000 | | 44,750 |
Texas Eastern Transmission Corp. 7.3% 12/1/10 | | 185,000 | | 212,519 |
Transcontinental Gas Pipe Line Corp. 6.125% 1/15/05 | | 20,000 | | 20,100 |
| | 843,687 |
Multi-Utilities & Unregulated Power - 0.8% |
AES Corp.: | | | | |
8.5% 11/1/07 | | 19,000 | | 19,310 |
8.75% 6/15/08 | | 30,000 | | 32,700 |
8.75% 5/15/13 (f) | | 170,000 | | 192,525 |
8.875% 2/15/11 | | 54,000 | | 61,695 |
9% 5/15/15 (f) | | 90,000 | | 102,938 |
9.375% 9/15/10 | | 16,000 | | 18,500 |
9.5% 6/1/09 | | 144,000 | | 163,620 |
Calpine Corp.: | | | | |
7.82% 7/15/07 (f)(h) | | 79,000 | | 71,890 |
8.5% 7/15/10 (f) | | 20,000 | | 17,100 |
CMS Energy Corp.: | | | | |
7.75% 8/1/10 | | 125,000 | | 136,719 |
8.5% 4/15/11 | | 85,000 | | 96,581 |
8.9% 7/15/08 | | 125,000 | | 137,969 |
9.875% 10/15/07 | | 105,000 | | 117,075 |
Corporate Bonds - continued |
| Principal
Amount | | Value
(Note 1) |
Nonconvertible Bonds - continued |
UTILITIES - continued |
Multi-Utilities & Unregulated Power - continued |
Constellation Energy Group, Inc. 7% 4/1/12 | | $ 350,000 | | $ 398,948 |
Dominion Resources, Inc.: | | | | |
6.25% 6/30/12 | | 685,000 | | 747,875 |
8.125% 6/15/10 | | 60,000 | | 70,622 |
NRG Energy, Inc. 8% 12/15/13 (f) | | 120,000 | | 130,950 |
Reliant Energy, Inc.: | | | | |
6.75% 12/15/14 | | 70,000 | | 70,000 |
9.25% 7/15/10 | | 30,000 | | 33,600 |
9.5% 7/15/13 | | 10,000 | | 11,375 |
| | 2,631,992 |
TOTAL UTILITIES | | 5,638,490 |
TOTAL NONCONVERTIBLE BONDS | | 40,841,405 |
TOTAL CORPORATE BONDS (Cost $38,686,197) | 41,221,955 |
U.S. Government and Government
Agency Obligations - 10.0% |
|
U.S. Government Agency Obligations - 2.3% |
Fannie Mae: | | | | |
2.5% 6/15/06 | | 410,000 | | 406,381 |
3.25% 8/15/08 | | 550,000 | | 542,751 |
3.25% 2/15/09 | | 1,216,000 | | 1,192,355 |
5.5% 3/15/11 | | 380,000 | | 407,493 |
6% 5/15/11 | | 2,015,000 | | 2,216,897 |
6.25% 2/1/11 | | 280,000 | | 306,968 |
Freddie Mac: | | | | |
3.625% 9/15/08 | | 318,000 | | 318,109 |
4% 6/12/13 | | 1,575,000 | | 1,504,262 |
6.625% 9/15/09 | | 475,000 | | 531,212 |
6.75% 3/15/31 | | 404,000 | | 491,010 |
TOTAL U.S. GOVERNMENT AGENCY OBLIGATIONS | | 7,917,438 |
U.S. Treasury Inflation Protected Obligations - 1.2% |
U.S. Treasury Inflation-Indexed Bonds 2.375% 1/15/25 | | 1,012,580 | | 1,082,788 |
|
| Principal
Amount | | Value
(Note 1) |
U.S. Treasury Inflation-Indexed Notes: | | | | |
0.875% 4/15/10 | | $ 1,007,510 | | $ 997,710 |
2% 1/15/14 | | 2,065,960 | | 2,138,269 |
TOTAL U.S. TREASURY INFLATION
PROTECTED OBLIGATIONS | | 4,218,767 |
U.S. Treasury Obligations - 6.5% |
U.S. Treasury Bonds 6.25% 5/15/30 | | 275,000 | | 328,786 |
U.S. Treasury Notes: | | | | |
1.625% 2/28/06 | | 15,370,000 | | 15,161,660 |
3.125% 5/15/07 | | 200,000 | | 199,898 |
3.125% 4/15/09 | | 800,000 | | 787,875 |
4.75% 5/15/14 | | 2,105,000 | | 2,193,639 |
6.5% 2/15/10 | | 1,220,000 | | 1,381,221 |
7% 7/15/06 | | 2,600,000 | | 2,756,608 |
TOTAL U.S. TREASURY OBLIGATIONS | | 22,809,687 |
TOTAL U.S. GOVERNMENT AND GOVERNMENT AGENCY OBLIGATIONS (Cost $34,957,848) | 34,945,892 |
U.S. Government Agency -
Mortgage Securities - 8.9% |
|
Fannie Mae - 8.4% |
3.836% 6/1/33 (h) | | 17,022 | | 17,035 |
3.941% 10/1/34 (h) | | 24,543 | | 24,719 |
4.021% 12/1/34 (h) | | 25,000 | | 25,148 |
4.037% 12/1/34 (h) | | 24,825 | | 25,031 |
4.048% 1/1/35 (h) | | 25,000 | | 25,182 |
4.072% 12/1/34 (h) | | 25,000 | | 25,195 |
4.105% 1/1/35 (h) | | 50,000 | | 49,809 |
4.17% 11/1/34 (h) | | 24,998 | | 25,134 |
4.324% 12/1/34 (h) | | 24,999 | | 25,405 |
4.5% 1/1/20 (g) | | 2,000,000 | | 1,991,875 |
4.5% 1/1/20 (g) | | 50,000 | | 49,797 |
4.5% 7/1/33 to 10/1/33 | | 3,893,403 | | 3,769,926 |
4.549% 8/1/34 (h) | | 46,664 | | 47,760 |
5% 11/1/17 to 8/1/18 | | 4,374,587 | | 4,448,907 |
5% 1/1/35 (g) | | 3,000,000 | | 2,973,750 |
5% 1/1/35 (g) | | 1,275,000 | | 1,263,844 |
5.5% 2/1/11 to 6/1/29 | | 1,368,049 | | 1,412,583 |
5.5% 1/1/35 (g) | | 3,935,130 | | 3,990,468 |
5.5% 1/1/35 (g) | | 4,000,000 | | 4,056,250 |
6% 4/1/09 to 1/1/29 | | 1,557,236 | | 1,631,715 |
6% 1/1/35 (g) | | 299,817 | | 309,748 |
6.5% 5/1/11 to 7/1/32 | | 2,374,873 | | 2,500,094 |
6.5% 1/1/20 (g) | | 54,792 | | 58,080 |
U.S. Government Agency -
Mortgage Securities - continued |
| Principal
Amount | | Value
(Note 1) |
Fannie Mae - continued |
7% 12/1/24 to 2/1/28 | | $ 131,621 | | $ 140,237 |
7.5% 10/1/26 to 8/1/28 | | 440,456 | | 472,564 |
TOTAL FANNIE MAE | | 29,360,256 |
Freddie Mac - 0.0% |
4.985% 8/1/33 (h) | | 25,000 | | 25,678 |
7.5% 1/1/27 | | 32,697 | | 35,120 |
TOTAL FREDDIE MAC | | 60,798 |
Government National Mortgage Association - 0.5% |
6.5% 10/15/27 to 9/15/32 | | 844,073 | | 890,137 |
7% 1/15/28 to 7/15/32 | | 495,343 | | 526,572 |
7.5% 6/15/27 to 3/15/28 | | 138,250 | | 148,713 |
TOTAL GOVERNMENT NATIONAL
MORTGAGE ASSOCIATION | | 1,565,422 |
TOTAL U.S. GOVERNMENT AGENCY - MORTGAGE SECURITIES (Cost $30,788,615) | 30,986,476 |
Asset-Backed Securities - 0.9% |
|
ACE Securities Corp. Series 2004-HE1: | | | | |
Class M1, 2.9175% 2/25/34 (h) | | 50,000 | | 50,008 |
Class M2, 3.5175% 2/25/34 (h) | | 50,000 | | 50,018 |
American Express Credit Account Master Trust Series 2001-6 Class B, 2.7525% 12/15/08 (h) | | 200,000 | | 200,600 |
Ameriquest Mortgage Securities, Inc. Series 2004-R2: | | | | |
Class M1, 2.8475% 4/25/34 (h) | | 25,000 | | 25,000 |
Class M2, 2.8975% 4/25/34 (h) | | 25,000 | | 25,000 |
Amortizing Residential Collateral Trust Series 2003-BC1 Class M2, 3.5175% 1/25/32 (h) | | 45,000 | | 45,186 |
Argent Securities, Inc. Series 2004-W5 Class M1, 3.0175% 4/25/34 (h) | | 75,000 | | 75,100 |
Capital One Multi-Asset Execution Trust: | | | | |
Series 2003-B4 Class B4, 3.2025% 7/15/11 (h) | | 105,000 | | 106,913 |
Series 2004-6 Class B, 4.15% 7/16/12 | | 125,000 | | 124,866 |
Chase Manhattan Auto Owner Trust Series 2001-A Class A4, 5.07% 2/15/08 | | 239,196 | | 240,194 |
Citibank Credit Card Issuance Trust Series 2002-C1 Class C1, 3.2% 2/9/09 (h) | | 250,000 | | 253,336 |
|
| Principal
Amount | | Value
(Note 1) |
Countrywide Home Loans, Inc.: | | | | |
Series 2004-2 Class M1, 2.9175% 5/25/34 (h) | | $ 100,000 | | $ 100,002 |
Series 2004-3 Class M1, 2.9175% 6/25/34 (h) | | 25,000 | | 25,026 |
Series 2004-4: | | | | |
Class A, 2.7875% 8/25/34 (h) | | 80,984 | | 80,956 |
Class M1, 2.8975% 7/25/34 (h) | | 75,000 | | 75,158 |
Class M2, 2.9475% 6/25/34 (h) | | 80,000 | | 80,191 |
Discover Card Master Trust I: | | | | |
Series 2001-6 Class A, 5.75% 12/15/08 | | 600,000 | | 621,227 |
Series 2003-4 Class B1, 2.7325% 5/16/11 (h) | | 155,000 | | 155,826 |
Fremont Home Loan Trust Series 2004-A: | | | | |
Class M1, 2.9675% 1/25/34 (h) | | 75,000 | | 75,001 |
Class M2, 3.5675% 1/25/34 (h) | | 100,000 | | 100,002 |
Home Equity Asset Trust Series 2002-4 Class M2, 4.4675% 3/25/33 (h) | | 25,000 | | 25,371 |
MBNA Credit Card Master Note Trust Series 2001-A1 Class A1, 5.75% 10/15/08 | | 200,000 | | 206,739 |
Meritage Mortgage Loan Trust Series 2004-1: | | | | |
Class M1, 2.9175% 7/25/34 (h) | | 50,000 | | 50,001 |
Class M3, 3.3675% 7/25/34 (h) | | 25,000 | | 25,000 |
Morgan Stanley ABS Capital I, Inc.: | | | | |
Series 2003-HE1 Class M2, 4.3175% 5/25/33 (h) | | 25,000 | | 25,349 |
Series 2003-NC5 Class M2, 4.4175% 4/25/33 (h) | | 50,000 | | 50,924 |
Morgan Stanley Dean Witter Capital I Trust Series 2003-NC1 Class M1, 3.4675% 11/25/32 (h) | | 45,000 | | 45,478 |
Sears Credit Account Master Trust II Series 2000-2 Class A, 6.75% 9/16/09 | | 365,000 | | 374,114 |
Structured Asset Securities Corp. Series 2004-GEL1 Class A, 2.7775% 2/25/34 (h) | | 31,853 | | 31,854 |
TOTAL ASSET-BACKED SECURITIES (Cost $3,298,664) | 3,344,440 |
Collateralized Mortgage Obligations - 0.4% |
| Principal
Amount | | Value
(Note 1) |
Private Sponsor - 0.0% |
CS First Boston Mortgage Securities Corp. floater Series 2004-AR3 Class 6A2, 2.7875% 4/25/34 (h) | | $ 68,523 | | $ 68,624 |
Master Alternative Loan Trust Series 2004-3 Class 3A1, 6% 4/25/34 | | 22,382 | | 22,913 |
Residential Asset Mortgage Products, Inc. sequential pay Series 2004-SL2 Class A1, 6.5% 10/25/16 | | 38,090 | | 39,125 |
TOTAL PRIVATE SPONSOR | | 130,662 |
U.S. Government Agency - 0.4% |
Fannie Mae guaranteed REMIC pass thru certificates planned amortization class Series 2004-81 Class KD: | | | | |
4.5% 4/25/17 | | 380,000 | | 382,294 |
4.5% 7/25/18 | | 170,000 | | 168,639 |
Freddie Mac Multi-class participation certificates guaranteed planned amortization class: | | | | |
Series 2677 Class LD, 4.5% 3/15/17 | | 560,000 | | 559,802 |
Series 2885 Class PC, 4.5% 3/15/18 | | 165,000 | | 165,958 |
TOTAL U.S. GOVERNMENT AGENCY | | 1,276,693 |
TOTAL COLLATERALIZED
MORTGAGE OBLIGATIONS (Cost $1,411,824) | 1,407,355 |
Commercial Mortgage Securities - 1.2% |
|
Bayview Commercial Asset Trust floater: | | | | |
Series 2004-1 Class A, 2.7775% 4/25/34 (f)(h) | | 92,980 | | 92,697 |
Series 2004-3 Class A1, 2.7675% 1/25/35 (f)(h) | | 149,743 | | 149,743 |
COMM: | | | | |
floater: | | | | |
Series 2002-FL7 Class D, 2.9725% 11/15/14 (f)(h) | | 45,000 | | 45,121 |
Series 2003-FL9 Class B, 2.9025% 11/15/15 (f)(h) | | 85,741 | | 85,997 |
Series 2004-LBN2 Class X2, 1.2743% 3/10/39 (f)(h)(i) | | 314,195 | | 13,398 |
CS First Boston Mortgage Securities Corp.: | | | | |
sequential pay: | | | | |
Series 1999-C1 Class A2, 7.29% 9/15/41 | | 250,000 | | 280,656 |
|
| Principal
Amount | | Value
(Note 1) |
Series 2000-C1 Class A2, 7.545% 4/15/62 | | $ 500,000 | | $ 570,857 |
Series 2004-C1 Class A3, 4.321% 1/15/37 | | 95,000 | | 94,428 |
Series 1997-C2 Class D, 7.27% 1/17/35 | | 150,000 | | 165,774 |
Series 2004-C1 Class ASP, 1.0446% 1/15/37 (f)(h)(i) | | 1,540,000 | | 61,591 |
DLJ Commercial Mortgage Corp. sequential pay Series 2000-CF1 Class A1B, 7.62% 6/10/33 | | 500,000 | | 573,195 |
Fannie Mae sequential pay Series 1999-10 Class MZ, 6.5% 9/17/38 | | 248,127 | | 262,803 |
GS Mortgage Securities Corp. II: | | | | |
sequential pay: | | | | |
Series 2001-LIBA Class A2, 6.615% 2/14/16 (f) | | 105,000 | | 115,643 |
Series 2003-C1 Class A2A, 3.59% 1/10/40 | | 125,000 | | 124,418 |
Series 1998-GLII Class E, 7.1905% 4/13/31 (h) | | 120,000 | | 125,956 |
J.P. Morgan Commercial Mortgage Finance Corp. sequential pay Series 2000-C9 Class A2, 7.77% 10/15/32 | | 225,000 | | 257,901 |
Leafs CMBS I Ltd./Leafs CMBS I Corp. Series 2002-1A: | | | | |
Class B, 4.13% 11/20/37 (f) | | 110,000 | | 105,076 |
Class C, 4.13% 11/20/37 (f) | | 110,000 | | 100,375 |
Merrill Lynch Mortgage Trust sequential pay Series 2004-KEY2 Class A2, 4.166% 8/12/39 | | 215,000 | | 214,202 |
Morgan Stanley Capital I, Inc. sequential pay Series 2004-HQ3 Class A2, 4.05% 1/13/41 | | 105,000 | | 104,217 |
Thirteen Affiliates of General Growth Properties, Inc. sequential pay Series 1 Class A2, 6.602% 11/15/07 (f) | | 500,000 | | 532,438 |
Wachovia Bank Commercial Mortgage Trust sequential pay Series 2003-C6 Class A2, 4.498% 8/15/35 | | 165,000 | | 167,348 |
TOTAL COMMERCIAL MORTGAGE SECURITIES (Cost $4,038,439) | 4,243,834 |
Foreign Government and Government
Agency Obligations - 0.4% |
|
Chilean Republic: | | | | |
5.625% 7/23/07 | | 150,000 | | 157,031 |
7.125% 1/11/12 | | 190,000 | | 218,144 |
Korean Republic 4.875% 9/22/14 | | 100,000 | | 98,911 |
State of Israel 4.625% 6/15/13 | | 30,000 | | 28,669 |
United Mexican States: | | | | |
5.875% 1/15/14 | | 90,000 | | 92,205 |
Foreign Government and Government
Agency Obligations - continued |
| Principal
Amount | | Value
(Note 1) |
United Mexican States: - continued | | | | |
6.375% 1/16/13 | | $ 300,000 | | $ 319,500 |
6.75% 9/27/34 | | 150,000 | | 148,125 |
7.5% 4/8/33 | | 175,000 | | 189,000 |
TOTAL FOREIGN GOVERNMENT AND GOVERNMENT AGENCY OBLIGATIONS (Cost $1,201,314) | 1,251,585 |
Floating Rate Loans - 0.1% |
|
TELECOMMUNICATION SERVICES - 0.1% |
Diversified Telecommunication Services - 0.1% |
Qwest Corp. Tranche A, term loan 7.39% 6/30/07 (h) | | 190,000 | | 198,075 |
UTILITIES - 0.0% |
Multi-Utilities & Unregulated Power - 0.0% |
AES Corp. term loan 5.22% 8/10/11 (h) | | 85,714 | | 86,893 |
TOTAL FLOATING RATE LOANS (Cost $276,110) | 284,968 |
Money Market Funds - 15.2% |
| Shares | | |
Fidelity Cash Central Fund, 2.24% (b) | 50,175,503 | | 50,175,503 |
Fidelity Securities Lending Cash Central Fund, 2.23% (b)(c) | 2,822,275 | | 2,822,275 |
TOTAL MONEY MARKET FUNDS (Cost $52,997,778) | 52,997,778 |
Cash Equivalents - 0.0% |
| Maturity
Amount | | |
Investments in repurchase agreements (Collateralized by U.S. Treasury Obligations, in a joint trading account at 1.52%, dated 12/31/04 due 1/3/05)
(Cost $42,000) | $ 42,005 | | $ 42,000 |
TOTAL INVESTMENT PORTFOLIO - 104.8% (Cost $330,019,447) | | 366,188,686 |
NET OTHER ASSETS - (4.8)% | | (16,764,900) |
NET ASSETS - 100% | $ 349,423,786 |
Swap Agreements |
| Expiration
Date | | Notional
Amount | | Value |
Interest Rate Swap |
Receive quarterly a fixed rate equal to 3.524% and pay quarterly a floating rate based on 3-month LIBOR with Morgan Stanley, Inc. | May 2007 | | $ 2,800,000 | | $ 4,197 |
TOTAL INTEREST RATE SWAP | 2,800,000 | | 4,197 |
Total Return Swap |
Receive monthly a return equal to Lehman Brothers for CMBS U.S. Aggregate Index and pay monthly a floating rate based on 1-month LIBOR with Deutsche Bank | June 2005 | | 570,000 | | 3,247 |
Receive monthly a return equal to Lehman Brothers for CMBS U.S. Aggregate Index and pay monthly a floating rate based on 1-month LIBOR with Goldman Sachs | March 2005 | | 1,430,000 | | 7,555 |
Receive monthly a return equal to Lehman Brothers for CMBS AAA 8.5+ Index and pay monthly a floating rate based on 1-month LIBOR minus 40 basis points with Lehman Brothers, Inc. | April 2005 | | 500,000 | | 5,171 |
Receive monthly a return equal to Lehman Brothers for CMBS U.S. Aggregate Index and pay monthly a floating rate based on 1-month LIBOR minus 10 basis points with Lehman Brothers, Inc. | May 2005 | | 2,500,000 | | 13,044 |
Receive quarterly a return equal to Banc of America Securities LLC AAA 10Yr Commercial Mortgage-Backed Securities Daily Index and pay quarterly a floating rate based on 3-month LIBOR minus 72 basis points with Bank of America | Jan. 2005 | | 500,000 | | (1,735) |
Swap Agreements - continued |
| Expiration
Date | | Notional
Amount | | Value |
Total Return Swap - continued |
Receive quarterly a return equal to that of Banc of America Securities LLC AAA 10Yr Commercial Mortgage Backed Securities Daily Index and pay quarterly a floating rate based on 3-month LIBOR minus 30 basis points with Bank of America | May 2005 | | $ 500,000 | | $ (556) |
Receive quarterly a return equal to that of Lehman Brothers Commercial Mortgage-Backed Securities AAA Daily Index and pay quarterly a floating rate based on 3-month LIBOR minus 8 basis points with Bank of America | April 2005 | | 490,000 | | (3,013) |
TOTAL TOTAL RETURN SWAP | 6,490,000 | | 23,713 |
| | $ 9,290,000 | | $ 27,910 |
Legend |
(a) Non-income producing |
(b) Affiliated fund that is available only to investment companies and other accounts managed by Fidelity Investments. The rate quoted is the annualized seven-day yield of the fund at period end. A complete listing of the fund's holdings as of its most recent fiscal year end is available upon request. |
(c) Includes investment made with cash collateral received from securities on loan. |
(d) Debt obligation initially issued in zero coupon form which converts to coupon form at a specified rate and date. The rate shown is the rate at period end. |
(e) Security or a portion of the security is on loan at period end. |
(f) Security exempt from registration under Rule 144A of the Securities Act of 1933. These securities may be resold in transactions exempt from registration, normally to qualified institutional buyers. At the period end, the value of these securities amounted to $8,715,733 or 2.5% of net assets. |
(g) Security or a portion of the security purchased on a delayed delivery or when-issued basis. |
(h) The coupon rate shown on floating or adjustable rate securities represents the rate at period end. |
(i) Security represents right to receive monthly interest payments on an underlying pool of mortgages. Principal shown is the par amount of the mortgage pool. |
Other Information |
The composition of credit quality ratings as a percentage of net assets is as follows (ratings are unaudited): |
U.S.Government and U.S.Government Agency Obligations | 19.4% |
AAA,AA,A | 4.2% |
BBB | 3.8% |
BB | 1.8% |
B | 3.8% |
CCC,CC,C | 0.5% |
Not Rated | 0.2% |
Equities | 55.9% |
Short-Term Investments and Net Other Assets | 10.4% |
| 100.0% |
We have used ratings from Moody's® Investors Services, Inc.
Where Moody's ratings are not available, we have used S&P® ratings. |
Income Tax Information |
At December 31, 2004, the fund had a capital loss carryforward of approximately $11,446,000 of which $1,788,000 and $9,658,000 will expire on December 31, 2009 and 2010, respectively. |
See accompanying notes which are an integral part of the financial statements.
Balanced Portfolio
Fidelity Variable Insurance Products: Balanced Portfolio
Statement of Assets and Liabilities
| | |
Assets | | |
Investment in securities, at value (including securities loaned of $2,743,680 and repurchase agreements of $42,000) (cost $330,019,447) - See accompanying schedule | | $ 366,188,686 |
Cash | | 806 |
Receivable for fund shares sold | | 68,544 |
Dividends receivable | | 176,836 |
Interest receivable | | 1,293,331 |
Swap agreements, at value | | 27,910 |
Prepaid expenses | | 1,322 |
Other receivables | | 13,937 |
Total assets | | 367,771,372 |
| | |
Liabilities | | |
Payable for investments purchased
Regular delivery | $ 317,217 | |
Delayed delivery | 14,753,084 | |
Payable for fund shares redeemed | 219,642 | |
Accrued management fee | 123,028 | |
Distribution fees payable | 9,420 | |
Other affiliated payables | 31,431 | |
Other payables and accrued expenses | 71,489 | |
Collateral on securities loaned, at value | 2,822,275 | |
Total liabilities | | 18,347,586 |
| | |
Net Assets | | $ 349,423,786 |
Net Assets consist of: | | |
Paid in capital | | $ 316,130,162 |
Undistributed net investment income | | 9,092,580 |
Accumulated undistributed net realized gain (loss) on investments and foreign currency transactions | | (11,996,105) |
Net unrealized appreciation (depreciation) on investments | | 36,197,149 |
Net Assets | | $ 349,423,786 |
| | |
Initial Class:
Net Asset Value, offering price
and redemption price per
share ($291,175,630 ÷ 20,297,277 shares) | | $ 14.35 |
| | |
Service Class:
Net Asset Value, offering price
and redemption price per
share ($21,227,681 ÷ 1,487,026 shares) | | $ 14.28 |
| | |
Service Class 2:
Net Asset Value, offering price
and redemption price per
share ($37,020,475 ÷ 2,606,181 shares) | | $ 14.20 |
Statement of Operations
Year ended December 31, 2004 |
| | |
Investment Income | | |
Dividends | | $ 3,518,465 |
Special Dividends | | 761,100 |
Interest | | 6,666,531 |
Security lending | | 3,282 |
Total income | | 10,949,378 |
| | |
Expenses | | |
Management fee | $ 1,470,347 | |
Transfer agent fees | 238,939 | |
Distribution fees | 103,770 | |
Accounting and security lending fees | 144,610 | |
Non-interested trustees' compensation | 1,905 | |
Custodian fees and expenses | 21,654 | |
Audit | 46,946 | |
Legal | 894 | |
Miscellaneous | 30,857 | |
Total expenses before reductions | 2,059,922 | |
Expense reductions | (13,464) | 2,046,458 |
Net investment income (loss) | | 8,902,920 |
Realized and Unrealized Gain (Loss) Net realized gain (loss) on: | | |
Investment securities | 8,330,480 | |
Foreign currency transactions | (1,576) | |
Swap agreements | 251,460 | |
Total net realized gain (loss) | | 8,580,364 |
Change in net unrealized appreciation (depreciation) on: Investment securities | 592,685 | |
Swap agreements | (18,253) | |
Delayed delivery commitments | (464) | |
Total change in net unrealized appreciation (depreciation) | | 573,968 |
Net gain (loss) | | 9,154,332 |
Net increase (decrease) in net assets resulting from operations | | $ 18,057,252 |
See accompanying notes which are an integral part of the financial statements.
Annual Report
Fidelity Variable Insurance Products: Balanced Portfolio
Financial Statements - continued
Statement of Changes in Net Assets
| Year ended
December 31,
2004 | Year ended
December 31,
2003 |
Increase (Decrease) in Net Assets | | |
Operations | | |
Net investment income (loss) | $ 8,902,920 | $ 6,987,022 |
Net realized gain (loss) | 8,580,364 | 3,062,346 |
Change in net unrealized appreciation (depreciation) | 573,968 | 38,999,107 |
Net increase (decrease) in net assets resulting from operations | 18,057,252 | 49,048,475 |
Distributions to shareholders from net investment income | (6,988,389) | (7,974,845) |
Share transactions - net increase (decrease) | (8,689,636) | 32,311,069 |
Total increase (decrease) in net assets | 2,379,227 | 73,384,699 |
| | |
Net Assets | | |
Beginning of period | 347,044,559 | 273,659,860 |
End of period (including undistributed net investment income of $9,092,580 and undistributed net investment income of $7,087,612, respectively) | $ 349,423,786 | $ 347,044,559 |
Other Information: | | | |
Share Transactions | Year ended December 31, 2004 |
| Initial Class | Service Class | Service Class 2 |
Shares Sold | 2,035,766 | 95,487 | 798,702 |
Reinvested | 432,646 | 31,049 | 40,193 |
Redeemed | (3,476,835) | (224,978) | (377,301) |
Net increase (decrease) | (1,008,423) | (98,442) | 461,594 |
| | | |
Dollars Sold | $ 28,145,848 | $ 1,311,596 | $ 10,871,355 |
Reinvested | 6,005,122 | 429,413 | 553,854 |
Redeemed | (47,800,698) | (3,078,714) | (5,127,412) |
Net increase (decrease) | $ (13,649,728) | $ (1,337,705) | $ 6,297,797 |
| | | |
Share Transactions | Year ended December 31, 2003 |
| Initial Class | Service Class | Service Class 2 |
Shares Sold | 4,747,709 | 87,816 | 932,305 |
Reinvested | 599,512 | 50,167 | 45,486 |
Redeemed | (3,372,673) | (205,767) | (374,801) |
Net increase (decrease) | 1,974,548 | (67,784) | 602,990 |
| | | |
Dollars Sold | $ 61,609,403 | $ 1,115,888 | $ 11,910,142 |
Reinvested | 6,882,396 | 573,909 | 518,540 |
Redeemed | (42,908,423) | (2,600,420) | (4,790,366) |
Net increase (decrease) | $ 25,583,376 | $ (910,623) | $ 7,638,316 |
| | | |
Distributions | Year ended December 31, 2004 |
| Initial Class | Service Class | Service Class 2 |
From net investment income | $ 6,005,122 | $ 429,413 | $ 553,854 |
| Year ended December 31, 2003 |
| Initial Class | Service Class | Service Class 2 |
From net investment income | $ 6,882,396 | $ 573,909 | $ 518,540 |
See accompanying notes which are an integral part of the financial statements.
Balanced Portfolio
Financial Highlights - Initial Class
Years ended December 31, | 2004 | 2003 | 2002 | 2001 | 2000 |
Selected Per-Share Data | | | | | |
Net asset value, beginning of period | $ 13.88 | $ 12.16 | $ 13.72 | $ 14.45 | $ 16.00 |
Income from Investment Operations | | | | | |
Net investment income (loss) C | .36 D | .30 | .36 | .42 | .48 |
Net realized and unrealized gain (loss) | .39 | 1.78 | (1.53) | (.63) | (1.15) |
Total from investment operations | .75 | 2.08 | (1.17) | (.21) | (.67) |
Distributions from net investment income | (.28) | (.36) | (.39) | (.52) | (.48) |
Distributions from net realized gain | - | - | - | - | (.35) |
Distributions in excess of net realized gain | - | - | - | - | (.05) |
Total distributions | (.28) | (.36) | (.39) | (.52) | (.88) |
Net asset value, end of period | $ 14.35 | $ 13.88 | $ 12.16 | $ 13.72 | $ 14.45 |
Total Return A, B | 5.47% | 17.72% | (8.72)% | (1.58)% | (4.30)% |
Ratios to Average Net Assets E | | | | | |
Expenses before expense reductions | .56% | .59% | .57% | .57% | .58% |
Expenses net of voluntary waivers, if any | .56% | .59% | .57% | .57% | .58% |
Expenses net of all reductions | .56% | .58% | .55% | .55% | .56% |
Net investment income (loss) | 2.60% | 2.32% | 2.84% | 3.11% | 3.18% |
Supplemental Data | | | | | |
Net assets, end of period (000 omitted) | $ 291,176 | $ 295,656 | $ 235,064 | $ 264,608 | $ 250,802 |
Portfolio turnover rate | 74% | 102% | 134% | 126% | 126% |
A Total returns do not reflect charges attributable to your insurance company's separate account. Inclusion of these charges would reduce the total returns shown.
B Total returns would have been lower had certain expenses not been reduced during the periods shown.
C Calculated based on average shares outstanding during the period.
D Investment income per share reflects a special dividend which amounted to $.03 per share.
E Expense ratios reflect operating expenses of the class. Expenses before reductions do not reflect amounts reimbursed by the investment adviser or reductions from brokerage service arrangements or other expense offset arrangements and do not represent the amount paid by the class during periods when reimbursements or reductions occur. Expenses net of any voluntary waivers reflect expenses after reimbursement by the investment adviser but prior to reductions from brokerage service arrangements or other expense offset arrangements. Expenses net of all reductions represent the net expenses paid by the class.
Financial Highlights - Service Class
Years ended December 31, | 2004 | 2003 | 2002 | 2001 | 2000 |
Selected Per-Share Data | | | | | |
Net asset value, beginning of period | $ 13.81 | $ 12.11 | $ 13.66 | $ 14.39 | $ 15.94 |
Income from Investment Operations | | | | | |
Net investment income (loss) C | .34 D | .28 | .34 | .41 | .46 |
Net realized and unrealized gain (loss) | .40 | 1.77 | (1.51) | (.64) | (1.14) |
Total from investment operations | .74 | 2.05 | (1.17) | (.23) | (.68) |
Distributions from net investment income | (.27) | (.35) | (.38) | (.50) | (.47) |
Distributions from net realized gain | - | - | - | - | (.35) |
Distributions in excess of net realized gain | - | - | - | - | (.05) |
Total distributions | (.27) | (.35) | (.38) | (.50) | (.87) |
Net asset value, end of period | $ 14.28 | $ 13.81 | $ 12.11 | $ 13.66 | $ 14.39 |
Total ReturnA, B | 5.42% | 17.53% | (8.75)% | (1.72)% | (4.38)% |
Ratios to Average Net Assets E | | | | | |
Expenses before expense reductions | .67% | .69% | .67% | .67% | .68% |
Expenses net of voluntary waivers, if any | .67% | .69% | .67% | .67% | .68% |
Expenses net of all reductions | .67% | .68% | .65% | .65% | .66% |
Net investment income (loss) | 2.50% | 2.22% | 2.74% | 3.01% | 3.08% |
Supplemental Data | | | | | |
Net assets, end of period (000 omitted) | $ 21,228 | $ 21,903 | $ 20,019 | $ 25,455 | $ 27,563 |
Portfolio turnover rate | 74% | 102% | 134% | 126% | 126% |
A Total returns do not reflect charges attributable to your insurance company's separate account. Inclusion of these charges would reduce the total returns shown.
B Total returns would have been lower had certain expenses not been reduced during the periods shown.
C Calculated based on average shares outstanding during the period.
D Investment income per share reflects a special dividend which amounted to $.03 per share.
E Expense ratios reflect operating expenses of the class. Expenses before reductions do not reflect amounts reimbursed by the investment adviser or reductions from brokerage service arrangements or other expense offset arrangements and do not represent the amount paid by the class during periods when reimbursements or reductions occur. Expenses net of any voluntary waivers reflect expenses after reimbursement by the investment adviser but prior to reductions from brokerage service arrangements or other expense offset arrangements. Expenses net of all reductions represent the net expenses paid by the class.
See accompanying notes which are an integral part of the financial statements.
Annual Report
Financial Highlights - Service Class 2
Years ended December 31, | 2004 | 2003 | 2002 | 2001 | 2000 G |
Selected Per-Share Data | | | | | |
Net asset value, beginning of period | $ 13.75 | $ 12.05 | $ 13.61 | $ 14.37 | $ 15.59 |
Income from Investment Operations | | | | | |
Net investment income (loss) E | .32 F | .26 | .32 | .38 | .40 |
Net realized and unrealized gain (loss) | .38 | 1.77 | (1.51) | (.63) | (.75) |
Total from investment operations | .70 | 2.03 | (1.19) | (.25) | (.35) |
Distributions from net investment income | (.25) | (.33) | (.37) | (.51) | (.47) |
Distributions from net realized gain | - | - | - | - | (.35) |
Distributions in excess of net realized gain | - | - | - | - | (.05) |
Total distributions | (.25) | (.33) | (.37) | (.51) | (.87) |
Net asset value, end of period | $ 14.20 | $ 13.75 | $ 12.05 | $ 13.61 | $ 14.37 |
Total Return B, C, D | 5.15% | 17.41% | (8.93)% | (1.87)% | (2.37)% |
Ratios to Average Net Assets H | | | | | |
Expenses before expense reductions | .82% | .84% | .83% | .83% | .85% A |
Expenses net of voluntary waivers, if any | .82% | .84% | .83% | .83% | .85% A |
Expenses net of all reductions | .82% | .84% | .81% | .81% | .83% A |
Net investment income (loss) | 2.35% | 2.06% | 2.58% | 2.85% | 2.91% A |
Supplemental Data | | | | | |
Net assets, end of period (000 omitted) | $ 37,020 | $ 29,485 | $ 18,577 | $ 16,798 | $ 4,797 |
Portfolio turnover rate | 74% | 102% | 134% | 126% | 126% |
A Annualized
B Total returns for periods of less than one year are not annualized.
C Total returns do not reflect charges attributable to your insurance company's separate account. Inclusion of these charges would reduce the total returns shown.
D Total returns would have been lower had certain expenses not been reduced during the periods shown.
E Calculated based on average shares outstanding during the period.
F Investment income per share reflects a special dividend which amounted to $.03 per share.
G For the period January 12, 2000 (commencement of sale of shares) to December 31, 2000.
H Expense ratios reflect operating expenses of the class. Expenses before reductions do not reflect amounts reimbursed by the investment adviser or reductions from brokerage service arrangements or other expense offset arrangements and do not represent the amount paid by the class during periods when reimbursements or reductions occur. Expense ratios before reductions for start-up periods may not be representative of longer-term operating periods. Expenses net of any voluntary waivers reflect expenses after reimbursement by the investment adviser but prior to reductions from brokerage service arrangements or other expense offset arrangements. Expenses net of all reductions represent the net expenses paid by the class.
See accompanying notes which are an integral part of the financial statements.
Balanced Portfolio
For the period ended December 31, 2004
1. Significant Accounting Policies.
Balanced Portfolio (the fund) is a fund of Variable Insurance Products Fund III (the trust) (referred to in this report as Fidelity Variable Insurance Products: Balanced Portfolio) and is authorized to issue an unlimited number of shares. The trust is registered under the Investment Company Act of 1940, as amended (the 1940 Act), as an open-end management investment company organized as a Massachusetts business trust. Shares of the fund may only be purchased by insurance companies for the purpose of funding variable annuity or variable life insurance contracts. The fund offers the following classes of shares: Initial Class shares, Service Class shares and Service Class 2 shares. All classes have equal rights and voting privileges, except for matters affecting a single class. Investment income, realized and unrealized capital gains and losses, the common expenses of the fund, and certain fund-level expense reductions, if any, are allocated on a pro rata basis to each class based on the relative net assets of each class to the total net assets of the fund. Each class differs with respect to distribution and service plan fees incurred. Certain expense reductions also differ by class.
The financial statements have been prepared in conformity with accounting principles generally accepted in the United States of America, which require management to make certain estimates and assumptions at the date of the financial statements. The following summarizes the significant accounting policies of the fund:
Security Valuation. Net asset value per share (NAV calculation) is calculated as of the close of business of the New York Stock Exchange, normally 4:00 p.m. Eastern time. Equity securities, including restricted securities, for which market quotations are available are valued at the last sale price or official closing price (closing bid price or last evaluated quote if no sale has occurred) on the primary market or exchange on which they trade. Debt securities, including restricted securities, for which quotations are readily available are valued at their most recent bid prices (sales prices if the principal market is an exchange) in the principal market in which such securities are normally traded, as determined by recognized dealers in such securities, or securities are valued on the basis of information provided by a pricing service. Pricing services use valuation matrices that incorporate both dealer-supplied valuations and valuation models. If prices are not readily available or do not accurately reflect fair value for a security, or if a security's value has been materially affected by events occurring after the close of the exchange or market on which the security is principally traded, that security may be valued by another method that the Board of Trustees believes accurately reflects fair value. A security's valuation may differ depending on the method used for determining value. Price movements in futures contracts and ADRs, market and trading trends, the bid/ask quotes of brokers and off-exchange institutional trading may be reviewed in the course of making a good faith determination of a security's fair value. Short-term securities with remaining maturities of sixty days or less for which quotations are not readily available are valued on the basis of amortized cost. Investments in open-end investment companies are valued at their net asset value each business day.
Foreign Currency. The fund uses foreign currency contracts to facilitate transactions in foreign-denominated securities. Losses from these transactions may arise from changes in the value of the foreign currency or if the counterparties do not perform under the contracts' terms.
Foreign-denominated assets, including investment securities, and liabilities are translated into U.S. dollars at the exchange rate at period end. Purchases and sales of investment securities, income and dividends received and expenses denominated in foreign currencies are translated into U.S. dollars at the exchange rate in effect on the transaction date.
The effects of exchange rate fluctuations on investments are included with the net realized and unrealized gain (loss) on investment securities. Other foreign currency transactions resulting in realized and unrealized gain (loss) are disclosed separately.
Investment Transactions and Income. Security transactions are accounted for as of trade date. Gains and losses on securities sold are determined on the basis of identified cost and may include proceeds received from litigation. Dividend income is recorded on the ex-dividend date, except for certain dividends from foreign securities where the ex-dividend date may have passed, which are recorded as soon as the fund is informed of the ex-dividend date. Non-cash dividends included in dividend income, if any, are recorded at the fair market value of the securities received. Distributions received on securities that represent a return of capital or capital gain are recorded as a reduction of cost of investments and/or as a realized gain. The fund estimates the components of distributions received that may be considered return of capital distributions or capital gain distributions. Large, non-recurring dividends recognized by the fund are presented separately on the Statement of Operations as "Special Dividends" and the impact of these dividends to net investment income per share is presented in the Financial Highlights. Interest income is accrued as earned. Interest income includes coupon interest and amortization of premium and accretion of discount on debt securities. Investment income is recorded net of foreign taxes withheld where recovery of such taxes is uncertain.
Expenses. Most expenses of the trust can be directly attributed to a fund. Expenses which cannot be directly attributed are apportioned among the funds in the trust.
Deferred Trustee Compensation. Under a Deferred Compensation Plan (the Plan) non-interested Trustees must defer receipt of a portion of, and may elect to defer receipt of an additional portion of, their annual compensation. Deferred amounts are treated as though equivalent dollar amounts had been invested in a cross-section of other Fidelity funds, and are marked-to-market. Deferred amounts remain in the fund until distributed in accordance with the Plan.
Annual Report
Notes to Financial Statements - continued
1. Significant Accounting Policies - continued
Income Tax Information and Distributions to Shareholders. Each year, the fund intends to qualify as a regulated investment company by distributing all of its taxable income and realized gains under Subchapter M of the Internal Revenue Code. As a result, no provision for income taxes is required in the accompanying financial statements. Foreign taxes are provided for based on the fund's understanding of the tax rules and rates that exist in the foreign markets in which it invests.
Distributions are recorded on the ex-dividend date. Income dividends and capital gain distributions are declared separately for each class. Income and capital gain distributions are determined in accordance with income tax regulations, which may differ from generally accepted accounting principles.
Capital accounts within the financial statements are adjusted for permanent book-tax differences. These adjustments have no impact on net assets or the results of operations. Temporary book-tax differences will reverse in a subsequent period.
Book-tax differences are primarily due to foreign currency transactions, market discount, non-taxable dividends, financing transactions, capital loss carryforwards and losses deferred due to wash sales.
The tax-basis components of distributable earnings and the federal tax cost as of period end were as follows:
Unrealized appreciation | $ 41,868,386 | |
Unrealized depreciation | (6,030,299) | |
Net unrealized appreciation (depreciation) | 35,838,087 | |
Undistributed ordinary income | 8,901,487 | |
Capital loss carryforward | (11,446,067) | |
| | |
Cost for federal income tax purposes | $ 330,350,599 | |
The tax character of distributions paid was as follows:
| December 31, 2004 | December 31, 2003 |
Ordinary Income | $ 6,988,389 | $ 7,974,845 |
2. Operating Policies.
Repurchase Agreements. Fidelity Management & Research Company (FMR) has received an Exemptive Order from the Securities and Exchange Commission (the SEC) which permits the fund and other affiliated entities of FMR to transfer uninvested cash balances into joint trading accounts. These accounts are then invested in repurchase agreements that are collateralized by U.S. Treasury or Government obligations. The fund may also invest directly with institutions, in repurchase agreements that are collateralized by commercial paper obligations and corporate obligations. Collateral is held in segregated accounts with custodian banks and may be obtained in the event of a default of the counterparty. Collateral is marked-to-market daily and maintained at a value at least equal to the principal amount of the repurchase agreement (including accrued interest).
Delayed Delivery Transactions and When-Issued Securities. The fund may purchase or sell securities on a delayed delivery or when-issued basis. Payment and delivery may take place after the customary settlement period for that security. The price of the underlying securities and the date when the securities will be delivered and paid for are fixed at the time the transaction is negotiated. During the time a delayed delivery sell is outstanding, the contract is marked-to-market daily and equivalent deliverable securities are held for the transaction. The value of the securities purchased on a delayed delivery or when-issued basis are identified as such in the fund's Schedule of Investments. The fund may receive compensation for interest forgone in the purchase of a delayed delivery or when-issued security. With respect to purchase commitments, the fund identifies securities as segregated in its records with a value at least equal to the amount of the commitment. Losses may arise due to changes in the value of the underlying securities or if the counterparty does not perform under the contract's terms, or if the issuer does not issue the securities due to political, economic, or other factors.
Restricted Securities. The fund may invest in securities that are subject to legal or contractual restrictions on resale. These securities generally may be resold in transactions exempt from registration or to the public if the securities are registered. Disposal of these securities may involve time-consuming negotiations and expense, and prompt sale at an acceptable price may be difficult. Information regarding restricted securities is included at the end of the fund's Schedule of Investments.
Loans and Other Direct Debt Instruments. The fund may invest in loans and loan participations, trade claims or other receivables. These investments may include standby financing commitments, including revolving credit facilities, that obligate the fund to supply additional cash to the borrower on demand. Loan participations involve a risk of insolvency of the lending bank or other financial intermediary. The fund may be contractually obligated to receive approval from the agent bank and/or borrower prior to the sale of these investments.
Balanced Portfolio
2. Operating Policies - continued
Swap Agreements. The fund may invest in swaps for the purpose of managing its exposure to interest rate, credit or market risk.
Interest rate swaps are agreements to exchange cash flows periodically based on a notional principal amount, for example, the exchange of fixed rate interest payments for floating rate interest payments. Periodic payments received or made by the fund are recorded in the accompanying Statement of Operations as realized gains or losses, respectively. The primary risk associated with interest rate swaps is that unfavorable changes in the fluctuation of interest rates could adversely impact the fund.
Total return swaps are agreements to exchange the return generated by one instrument for the return generated by another instrument, for example, the agreement to pay interest in exchange for a market-linked return based on a notional amount. To the extent the total return of the index exceeds the offsetting interest obligation, the fund will receive a payment from the counterparty. To the extent it is less, the fund will make a payment to the counterparty. Periodic payments received or made by the fund are recorded in the accompanying Statement of Operations as realized gains or losses, respectively.
Credit default swaps involve the exchange of a fixed rate premium for protection against the loss in value of an underlying debt instrument in the event of a defined credit event (such as payment default or bankruptcy). Under the terms of the swap, one party acts as a "guarantor" receiving a periodic payment that is a fixed percentage applied to a notional principal amount. In return the party agrees to purchase the notional amount of the underlying instrument, at par, if a credit event occurs during the term of the swap. The fund may enter into credit default swaps in which the fund or its counterparty act as guarantors. By acting as the guarantor of a swap, the fund assumes the market and credit risk of the underlying instrument including liquidity and loss of value. Periodic payments and premiums received or made by the fund are recorded in the accompanying Statement of Operations as realized gains or losses, respectively.
Swaps are marked-to-market daily based on dealer-supplied valuations and changes in value are recorded as unrealized appreciation (depreciation). Gains or losses are realized upon early termination of the swap agreement. Collateral, in the form of cash or securities, may be required to be held in segregated accounts with the fund's custodian in compliance with swap contracts. Risks may exceed amounts recognized on the Statement of Assets and Liabilities. These risks include changes in the returns of the underlying instruments, failure of the counterparties to perform under the contracts' terms and the possible lack of liquidity with respect to the swap agreements. Details of swap agreements open at period end are included in the fund's Schedule of Investments under the caption "Swap Agreements."
Mortgage Dollar Rolls. To earn additional income, the fund may employ trading strategies which involve the sale and simultaneous agreement to repurchase similar securities ("mortgage dollar rolls") or the purchase and simultaneous agreement to sell similar securities ("reverse mortgage dollar rolls"). The securities traded are mortgage securities and bear the same interest rate but may be collateralized by different pools of mortgages. During the period between the sale and repurchase in a mortgage dollar roll transaction, a fund will not be entitled to receive interest and principal payments on the securities sold but will invest the proceeds of the sale in other securities which may enhance the yield and total return. In addition, the difference between the sale price and the future purchase price is recorded as an adjustment to investment income. During the period between the purchase and subsequent sale in a reverse mortgage dollar roll transaction a fund is entitled to interest and principal payments on the securities purchased. The price differential between the purchase and sale is recorded as an adjustment to investment income. Losses may arise due to changes in the value of the securities or if the counterparty does not perform under the terms of the agreement. If the counterparty files for bankruptcy or becomes insolvent, the fund's right to repurchase or sell securities may be limited.
3. Purchases and Sales of Investments.
Purchases and sales of securities, other than short-term securities and U.S. government securities, aggregated $65,426,083 and $83,095,686, respectively.
4. Fees and Other Transactions with Affiliates.
Management Fee. FMR and its affiliates provide the fund with investment management related services for which the fund pays a monthly management fee. The management fee is the sum of an individual fund fee rate that is based on an annual rate of .15% of the fund's average net assets and a group fee rate that averaged .28% during the period. The group fee rate is based upon the average net assets of all the mutual funds advised by FMR. The group fee rate decreases as assets under management increase and increases as assets under management decrease. For the period, the total annual management fee rate was .42% of the fund's average net assets.
Distribution and Service Plan. In accordance with Rule 12b-1 of the 1940 Act, the fund has adopted separate 12b-1 Plans for each Service Class of shares. Each Service Class pays Fidelity Distributors Corporation (FDC), an affiliate of FMR, a service fee. For the period, the service fee is based on an annual rate of .10% of Service Class' average net assets and .25% of Service Class 2's average net assets.
For the period, each class paid FDC the following amounts, all of which were re-allowed to insurance companies for the distribution of shares and providing shareholder support services:
Service Class | $ 21,241 | |
Service Class 2 | 82,529 | |
| $ 103,770 | |
Annual Report
Notes to Financial Statements - continued
4. Fees and Other Transactions with Affiliates - continued
Transfer Agent Fees. Fidelity Investments Institutional Operations Company, Inc. (FIIOC), an affiliate of FMR, is the fund's transfer, dividend disbursing, and shareholder servicing agent. FIIOC receives an asset-based fee with respect to each account. FIIOC pays a portion of the expenses related to the typesetting, printing and mailing of shareholder reports, except proxy statements. Each class pays a transfer agent fee, excluding out of pocket expenses, equal to an annual rate of .07% of their month end net assets. For the period, the total transfer agent fees paid by each class to FIIOC, including out of pocket expenses, were as follows:
Initial Class | $ 198,193 | |
Service Class | 15,788 | |
Service Class 2 | 24,958 | |
| $ 238,939 | |
Accounting and Security Lending Fees. Fidelity Service Company, Inc. (FSC), an affiliate of FMR, maintains the fund's accounting records. The accounting fee is based on the level of average net assets for the month. Under a separate contract, FSC administers the security lending program. The security lending fee is based on the number and duration of lending transactions.
Central Funds. The fund may invest in affiliated Central Funds managed by Fidelity Investments Money Management, Inc. (FIMM), an affiliate of FMR. The Central Funds are open-end investment companies available only to investment companies and other accounts managed by FMR and its affiliates. The Central Funds seek preservation of capital and current income and do not pay a management fee. Income distributions earned by the fund are recorded as income in the accompanying financial statements and totaled $664,370 for the period.
Brokerage Commissions. The fund placed a portion of its portfolio transactions with brokerage firms which are affiliates of the investment adviser. The commissions paid to these affiliated firms were $4,134 for the period.
5. Committed Line of Credit.
The fund participates with other funds managed by FMR in a $4.2 billion credit facility (the "line of credit") to be utilized for temporary or emergency purposes to fund shareholder redemptions or for other short-term liquidity purposes. The fund has agreed to pay commitment fees on its pro rata portion of the line of credit. During the period, there were no borrowings on this line of credit.
6. Security Lending.
The fund lends portfolio securities from time to time in order to earn additional income. The fund receives collateral (in the form of U.S. Treasury obligations, letters of credit and/or cash) against the loaned securities and maintains collateral in an amount not less than 100% of the market value of the loaned securities during the period of the loan. The market value of the loaned securities is determined at the close of business of the fund and any additional required collateral is delivered to the fund on the next business day. If the borrower defaults on its obligation to return the securities loaned because of insolvency or other reasons, a fund could experience delays and costs in recovering the securities loaned or in gaining access to the collateral. Cash collateral is invested in cash equivalents. The value of loaned securities and cash collateral at period end are disclosed on the fund's Statement of Assets and Liabilities.
7. Expense Reductions.
Many of the brokers with whom FMR places trades on behalf of the fund provided services to the fund in addition to trade execution. These services included payments of certain expenses on behalf of the fund totaling $13,097 for the period. In addition, through arrangements with the fund's custodian, credits realized as a result of uninvested cash balances were used to reduce the fund's expenses. During the period, these credits reduced the fund's custody expenses by $367.
8. Other Information.
At the end of the period, FMR or its affiliates were the owners of record of 62% of the total outstanding shares of the fund and one otherwise unaffiliated shareholder was the owner of record of 22% of the total outstanding shares of the fund.
Balanced Portfolio
To the Trustees of Variable Insurance Products Fund III and Shareholders of Balanced Portfolio:
We have audited the accompanying statement of assets and liabilities of Balanced Portfolio (the Fund), a fund of Variable Insurance Products Fund III, including the portfolio of investments, as of December 31, 2004, and the related statement of operations for the year then ended, the statement of changes in net assets for each of the two years in the period then ended, and the financial highlights for each of the five years in the period then ended. These financial statements and financial highlights are the responsibility of the Fund's management. Our responsibility is to express an opinion on these financial statements and financial highlights based on our audits.
We conducted our audits in accordance with standards of the Public Company Accounting Oversight Board (United States). Those standards require that we plan and perform the audit to obtain reasonable assurance about whether the financial statements and financial highlights are free of material misstatement. An audit includes consideration of internal control over financial reporting as a basis for designing audit procedures that are appropriate in the circumstances, but not for the purpose of expressing an opinion on the effectiveness of the Fund's internal control over financial reporting. Accordingly, we express no such opinion. An audit also includes examining, on a test basis, evidence supporting the amounts and disclosures in the financial statements, assessing the accounting principles used and significant estimates made by management, as well as evaluating the overall financial statement presentation. Our procedures included confirmation of securities owned as of December 31, 2004, by correspondence with the custodians and brokers; where replies were not received from brokers, we performed other auditing procedures. We believe that our audits provide a reasonable basis for our opinion.
In our opinion, the financial statements and financial highlights referred to above present fairly, in all material respects, the financial position of Balanced Portfolio as of December 31, 2004, the results of its operations for the year then ended, the changes in its net assets for each of the two years in the period then ended, and its financial highlights for each of the five years in the period then ended, in conformity with accounting principles generally accepted in the United States of America.
/s/DELOITTE & TOUCHE LLP
DELOITTE & TOUCHE LLP
Boston, Massachusetts
February 18, 2005
Annual Report
The Trustees, Member of the Advisory Board, and executive officers of the trust and fund, as applicable, are listed below. The Board of Trustees governs the fund and is responsible for protecting the interests of shareholders. The Trustees are experienced executives who meet periodically throughout the year to oversee the fund's activities, review contractual arrangements with companies that provide services to the fund, and review the fund's performance. Except for William O. McCoy, Dennis J. Dirks, and Kenneth L. Wolfe, each of the Trustees oversees 301 funds advised by FMR or an affiliate. Mr. McCoy oversees 303 funds advised by FMR or an affiliate. Mr. Dirks and Mr. Wolfe oversee 233 funds advised by FMR or an affiliate.
The Trustees hold office without limit in time except that (a) any Trustee may resign; (b) any Trustee may be removed by written instrument, signed by at least two-thirds of the number of Trustees prior to such removal; (c) any Trustee who requests to be retired or who has become incapacitated by illness or injury may be retired by written instrument signed by a majority of the other Trustees; and (d) any Trustee may be removed at any special meeting of shareholders by a two-thirds vote of the outstanding voting securities of the trust. In any event, each non-interested Trustee shall retire not later than the last day of the calendar year in which his or her 72nd birthday occurs. The executive officers and Advisory Board Member hold office without limit in time, except that any officer and Advisory Board Member may resign or may be removed by a vote of a majority of the Trustees at any regular meeting or any special meeting of the Trustees. Except as indicated, each individual has held the office shown or other offices in the same company for the past five years.
The fund's Statement of Additional Information (SAI) includes more information about the Trustees. To request a free copy, call Fidelity at 1-800-544-5429.
Interested Trustees*:
Correspondence intended for each Trustee who is an "interested person" (as defined in the 1940 Act) may be sent to Fidelity Investments, 82 Devonshire Street, Boston, Massachusetts 02109.
Name, Age; Principal Occupation |
Edward C. Johnson 3d (74)** |
| Year of Election or Appointment: 1994 Mr. Johnson is Chairman of the Board of Trustees. Mr. Johnson serves as Chief Executive Officer, Chairman, and a Director of FMR Corp.; a Director and Chairman of the Board and of the Executive Committee of FMR; Chairman and a Director of Fidelity Management & Research (Far East) Inc.; Chairman (1998) and a Director of Fidelity Investments Money Management, Inc.; and Chairman (2001) and a Director (2000) of FMR Co., Inc. |
Abigail P. Johnson (43)** |
| Year of Election or Appointment: 2001 Senior Vice President of VIP Balanced (2001). Ms. Johnson also serves as Senior Vice President of other Fidelity funds (2001). She is President and a Director of FMR (2001), Fidelity Investments Money Management, Inc. (2001), FMR Co., Inc. (2001), and a Director of FMR Corp. Previously, Ms. Johnson managed a number of Fidelity funds. |
Laura B. Cronin (50) |
| Year of Election or Appointment: 2003 Ms. Cronin is an Executive Vice President (2002) and Chief Financial Officer (2002) of FMR Corp. and is a member of the Fidelity Management Committee (2003). Previously, Ms. Cronin served as Vice President of Finance of FMR (1997-1999), and Chief Financial Officer of FMR (1999-2001), Fidelity Personal Investments (2001), and Fidelity Brokerage Company (2001-2002). |
Robert L. Reynolds (52) |
| Year of Election or Appointment: 2003 Mr. Reynolds is a Director (2003) and Chief Operating Officer (2002) of FMR Corp. and is the head of the Fidelity Management Committee (2003). He also serves on the Board at Fidelity Investments Canada, Ltd. (2000). Previously, Mr. Reynolds served as President of Fidelity Investments Institutional Retirement Group (1996-2000). |
* Trustees have been determined to be "Interested Trustees" by virtue of, among other things, their affiliation with the trust or various entities under common control with FMR.
** Edward C. Johnson 3d, Trustee, is Abigail P. Johnson's father.
Balanced Portfolio
Trustees and Officers - continued
Non-Interested Trustees:
Correspondence intended for each non-interested Trustee (that is, the Trustees other than the Interested Trustees) may be sent to Fidelity Investments, P.O. Box 55235, Boston, Massachusetts 02205-5235.
Name, Age; Principal Occupation |
Dennis J. Dirks (56) |
| Year of Election or Appointment: 2005 Mr. Dirks also serves as a Trustee (2005) or Member of the Advisory Board (2004) of other investment companies advised by FMR. Prior to his retirement in May 2003, Mr. Dirks was Chief Operating Officer and a member of the Board of The Depository Trust & Clearing Corporation (DTCC) (1999-2003). He also served as President, Chief Operating Officer, and Board member of The Depository Trust Company (DTC) (1999-2003) and President and Board member of the National Securities Clearing Corporation (NSCC) (1999-2003). In addition, Mr. Dirks served as Chief Executive Officer and Board member of the Government Securities Clearing Corporation (2001-2003) and Chief Executive Officer and Board member of the Mortgage-Backed Securities Clearing Corporation (2001-2003). |
Robert M. Gates (61) |
| Year of Election or Appointment: 1997 Dr. Gates is Vice Chairman of the non-interested Trustees (2005). Dr. Gates is President of Texas A&M University (2002). He was Director of the Central Intelligence Agency (CIA) from 1991 to 1993. From 1989 to 1991, Dr. Gates served as Assistant to the President of the United States and Deputy National Security Advisor. Dr. Gates is a Director of NACCO Industries, Inc. (mining and manufacturing), Parker Drilling Co., Inc. (drilling and rental tools for the energy industry, 2001), and Brinker International (restaurant management, 2003). He also serves as a member of the Advisory Board of VoteHere.net (secure internet voting, 2001). Previously, Dr. Gates served as a Director of LucasVarity PLC (automotive components and diesel engines), a Director of TRW Inc. (automotive, space, defense, and information technology), and Dean of the George Bush School of Government and Public Service at Texas A&M University (1999-2001). Dr. Gates also is a Trustee of the Forum for International Policy. |
George H. Heilmeier (68) |
| Year of Election or Appointment: 2004 Dr. Heilmeier is Chairman Emeritus of Telcordia Technologies (communication software and systems), where prior to his retirement, he served as company Chairman and Chief Executive Officer. He currently serves on the Boards of Directors of The Mitre Corporation (systems engineering and information technology support for the government), INET Technologies Inc. (telecommunications network surveillance, 2001), Teletech Holdings (customer management services), and HRL Laboratories (private research and development, 2004). He is Chairman of the General Motors Technology Advisory Committee and a Life Fellow of the Institute of Electrical and Electronics Engineers (IEEE) (2000). Dr. Heilmeier is a member of the Defense Science Board and the National Security Agency Advisory Board. He is also a member of the National Academy of Engineering, the American Academy of Arts and Sciences, and the Board of Overseers of the School of Engineering and Applied Science of the University of Pennsylvania. Previously, Dr. Heilmeier served as a Director of TRW Inc. (automotive, space, defense, and information technology, 1992-2002), Compaq (1994-2002), and Automatic Data Processing, Inc. (ADP) (technology-based business outsourcing, 1995-2002). |
Marie L. Knowles (58) |
| Year of Election or Appointment: 2001 Prior to Ms. Knowles' retirement in June 2000, she served as Executive Vice President and Chief Financial Officer of Atlantic Richfield Company (ARCO) (diversified energy, 1996-2000). From 1993 to 1996, she was a Senior Vice President of ARCO and President of ARCO Transportation Company. She served as a Director of ARCO from 1996 to 1998. She currently serves as a Director of Phelps Dodge Corporation (copper mining and manufacturing) and McKesson Corporation (healthcare service, 2002). Ms. Knowles is a Trustee of the Brookings Institution and the Catalina Island Conservancy and also serves as a member of the Advisory Board for the School of Engineering of the University of Southern California. |
Ned C. Lautenbach (60) |
| Year of Election or Appointment: 2000 Mr. Lautenbach has been a partner of Clayton, Dubilier & Rice, Inc. (private equity investment firm) since September 1998. Previously, Mr. Lautenbach was with the International Business Machines Corporation (IBM) from 1968 until his retirement in 1998. He was most recently Senior Vice President and Group Executive of Worldwide Sales and Services. From 1993 to 1995, he was Chairman of IBM World Trade Corporation, and from 1994 to 1998 was a member of IBM's Corporate Executive Committee. Mr. Lautenbach serves as Co-Chairman and a Director of Covansys, Inc. (global provider of business and technology solutions, 2000). In addition, he is a Director of Italtel Holding S.p.A. (telecommunications (Milan, Italy), 2004) and Eaton Corporation (diversified industrial) as well as the Philharmonic Center for the Arts in Naples, Florida (1999). He also is a member of the Council on Foreign Relations. |
Marvin L. Mann (71) |
| Year of Election or Appointment: 1994 Mr. Mann is Chairman of the non-interested Trustees (2001). He is Chairman Emeritus of Lexmark International, Inc. (computer peripherals), where he served as CEO until April 1998, retired as Chairman May 1999, and remains a member of the Board. Prior to 1991, he held the positions of Vice President of International Business Machines Corporation (IBM) and President and General Manager of various IBM divisions and subsidiaries. He is a member of the Executive Committee of the Independent Director's Council of the Investment Company Institute. In addition, Mr. Mann is a member of the President's Cabinet at the University of Alabama and the Board of Visitors of the Culverhouse College of Commerce and Business Administration at the University of Alabama. |
William O. McCoy (71) |
| Year of Election or Appointment: 1997 Prior to his retirement in December 1994, Mr. McCoy was Vice Chairman of the Board of BellSouth Corporation (telecommunications) and President of BellSouth Enterprises. He is currently a Director of Liberty Corporation (holding company), Duke Realty Corporation (real estate), and Progress Energy, Inc. (electric utility). He is also a partner of Franklin Street Partners (private investment management firm) and a member of the Research Triangle Foundation Board. In addition, Mr. McCoy served as the Interim Chancellor (1999-2000) and a member of the Board of Visitors (1994-1998) for the University of North Carolina at Chapel Hill and currently serves on the Board of Directors of the University of North Carolina Health Care System and the Board of Visitors of the Kenan-Flagler Business School (University of North Carolina at Chapel Hill). He also served as Vice President of Finance for the University of North Carolina (16-school system, 1995-1998). |
Cornelia M. Small (60) |
| Year of Election or Appointment: 2005 Ms. Small is a member (2000) and Chairperson (2002) of the Investment Committee, and a member (2002) of the Board of Trustees of Smith College. Previously, she served as Chief Investment Officer (1999-2000), Director of Global Equity Investments (1996-1999), and a member of the Board of Directors of Scudder, Stevens & Clark (1990-1997) and Scudder Kemper Investments (1997-1998). In addition, Ms. Small served as Co-Chair (2000-2003) of the Annual Fund for the Fletcher School of Law and Diplomacy. |
William S. Stavropoulos (65) |
| Year of Election or Appointment: 2002 Mr. Stavropoulos is Chairman of the Board (2000), CEO (2002), a position he previously held from 1995-2000, Chairman of the Executive Committee (2000), and a Member of the Board of Directors of The Dow Chemical Company. Since joining The Dow Chemical Company in 1967, Mr. Stavropoulos served in numerous senior management positions, including President (1993-2000; 2002-2003). Currently, he is a Director of NCR Corporation (data warehousing and technology solutions), BellSouth Corporation (telecommunications), Chemical Financial Corporation, and Maersk Inc. (industrial conglomerate, 2002). He also serves as a member of the Board of Trustees of the American Enterprise Institute for Public Policy Research. In addition, Mr. Stavropoulos is a member of The Business Council, J.P. Morgan International Council and the University of Notre Dame Advisory Council for the College of Science. |
Kenneth L. Wolfe (65) |
| Year of Election or Appointment: 2005 Mr. Wolfe also serves as a Trustee (2005) or Member of the Advisory Board (2004) of other investment companies advised by FMR. Prior to his retirement in 2001, Mr. Wolfe was Chairman and Chief Executive Officer of Hershey Foods Corporation (1993-2001). He currently serves as a member of the boards of Adelphia Communications Corporation (2003), Bausch & Lomb, Inc., and Revlon Inc. (2004). |
Balanced Portfolio
Trustees and Officers - continued
Advisory Board Member and Executive Officers:
Correspondence intended for each executive officer and Mr. Lynch may be sent to Fidelity Investments, 82 Devonshire Street, Boston, Massachusetts 02109.
Name, Age; Principal Occupation |
Peter S. Lynch (61) |
| Year of Election or Appointment: 2003 Member of the Advisory Board of Variable Insurance Products Fund III. Vice Chairman and a Director of FMR, and Vice Chairman (2001) and a Director (2000) of FMR Co., Inc. Previously, Mr. Lynch served as a Trustee of the Fidelity funds (1990-2003). Prior to May 31, 1990, he was a Director of FMR and Executive Vice President of FMR (a position he held until March 31, 1991), Vice President of Fidelity® Magellan® Fund and FMR Growth Group Leader, and Managing Director of FMR Corp. Mr. Lynch was also Vice President of Fidelity Investments Corporate Services. In addition, he serves as a Trustee of Boston College, Massachusetts Eye & Ear Infirmary, Historic Deerfield, John F. Kennedy Library, and the Museum of Fine Arts of Boston. |
Bart A. Grenier (45) |
| Year of Election or Appointment: 2001 Vice President of VIP Balanced. Mr. Grenier also serves as Vice President of certain Equity Funds (2001), a position he previously held from 1999 to 2000, and Vice President of certain High Income Funds (2002). He is Senior Vice President of FMR (1999) and FMR Co., Inc. (2001), and President and Director of Strategic Advisers, Inc. (2002). He also heads Fidelity's Asset Allocation Group (2000), Fidelity's Growth and Income Group (2001), Fidelity's Value Group (2001), and Fidelity's High Income Division (2001). Previously, Mr. Grenier served as President of Fidelity Ventures (2000), Vice President of certain High Income Funds (1997-2000), High Income Division Head (1997-2000), Group Leader of the Income-Growth and Asset Allocation-Income Groups (1996-2000), and Assistant Equity Division Head (1997-2000). |
Charles S. Morrison (44) |
| Year of Election or Appointment: 2002 Vice President of VIP Balanced. Mr. Morrison also serves as Vice President of Fidelity's Bond Funds (2002), and Vice President of certain Asset Allocation and Balanced Funds (2002). He serves as Vice President (2002) and Bond Group Leader (2002) of Fidelity Investments Fixed Income Division. Mr. Morrison is also Vice President of FIMM (2002) and FMR (2002). Mr. Morrison joined Fidelity in 1987 as a Corporate Bond Analyst in the Fixed Income Research Division. |
Matthew J. Conti (38) |
| Year of Election or Appointment: 2002 Vice President of VIP Balanced. Mr. Conti also serves as Vice President of other funds advised by FMR. Prior to assuming his current responsibilities, Mr. Conti managed a variety of Fidelity funds. Mr. Conti also serves as Vice President of FMR (2003) and FMR Co., Inc. (2003). |
Ford E. O'Neil (42) |
| Year of Election or Appointment: 2001 Vice President of VIP Balanced. Mr. O'Neil also serves as Vice President of other funds advised by FMR. Prior to assuming his current responsibilities, Mr. O'Neil managed a variety of Fidelity funds. |
Louis Salemy (43) |
| Year of Election or Appointment: 2002 Vice President of VIP Balanced. Mr. Salemy also serves as Vice President of other funds advised by FMR. Prior to assuming his current responsibilities, Mr. Salemy managed a variety of Fidelity funds. Mr. Salemy also serves as Vice President of FMR (2000) and FMR Co., Inc. (2001). |
Eric D. Roiter (56) |
| Year of Election or Appointment: 1998 Secretary of VIP Balanced. He also serves as Secretary of other Fidelity funds; Vice President, General Counsel, and Secretary of FMR Co., Inc. (2001-present) and FMR; Vice President and Secretary of FDC; Assistant Secretary of Fidelity Management & Research (U.K.) Inc. (2001-present), Fidelity Management & Research (Far East) Inc. (2001-present), and Fidelity Investments Money Management, Inc. (2001-present). Mr. Roiter is an Adjunct Member, Faculty of Law, at Boston College Law School (2003-present). |
Stuart Fross (45) |
| Year of Election or Appointment: 2003 Assistant Secretary of VIP Balanced. Mr. Fross also serves as Assistant Secretary of other Fidelity funds (2003) and is an employee of FMR. |
Christine Reynolds (46) |
| Year of Election or Appointment: 2004 President, Treasurer, and Anti-Money Laundering (AML) officer of VIP Balanced. Ms. Reynolds also serves as President, Treasurer, and AML officer of other Fidelity funds (2004) and is a Vice President (2003) and an employee (2002) of FMR. Before joining Fidelity Investments, Ms. Reynolds worked at PricewaterhouseCoopers LLP (PwC) (1980-2002), where she was most recently an audit partner with PwC's investment management practice. |
Timothy F. Hayes (54) |
| Year of Election or Appointment: 2002 Chief Financial Officer of VIP Balanced. Mr. Hayes also serves as Chief Financial Officer of other Fidelity funds (2002). Recently he was appointed President of Fidelity Service Company (2003) where he also serves as a Director. Mr. Hayes also serves as President of Fidelity Investments Operations Group (FIOG, 2002), which includes Fidelity Pricing and Cash Management Services Group (FPCMS), where he was appointed President in 1998. Previously, Mr. Hayes served as Chief Financial Officer of Fidelity Investments Corporate Systems and Service Group (1998) and Fidelity Systems Company (1997-1998). |
Kenneth A. Rathgeber (57) |
| Year of Election or Appointment: 2004 Chief Compliance Officer of VIP Balanced. Mr. Rathgeber also serves as Chief Compliance Officer of other Fidelity funds (2004) and Executive Vice President of Risk Oversight for Fidelity Investments (2002). Previously, he served as Executive Vice President and Chief Operating Officer for Fidelity Investments Institutional Services Company, Inc. (1998-2002). |
John R. Hebble (46) |
| Year of Election or Appointment: 2003 Deputy Treasurer of VIP Balanced. Mr. Hebble also serves as Deputy Treasurer of other Fidelity funds (2003), and is an employee of FMR. Before joining Fidelity Investments, Mr. Hebble worked at Deutsche Asset Management where he served as Director of Fund Accounting (2002-2003) and Assistant Treasurer of the Scudder Funds (1998-2003). |
Kimberley H. Monasterio (41) |
| Year of Election or Appointment: 2004 Deputy Treasurer of VIP Balanced. Ms. Monasterio also serves as Deputy Treasurer of other Fidelity funds (2004) and is an employee of FMR (2004). Before joining Fidelity Investments, Ms. Monasterio served as Treasurer (2000-2004) and Chief Financial Officer (2002-2004) of the Franklin Templeton Funds and Senior Vice President of Franklin Templeton Services, LLC (2000-2004). |
John H. Costello (58) |
| Year of Election or Appointment: 1995 Assistant Treasurer of VIP Balanced. Mr. Costello also serves as Assistant Treasurer of other Fidelity funds and is an employee of FMR. |
Peter L. Lydecker (50) |
| Year of Election or Appointment: 2004 Assistant Treasurer of VIP Balanced. Mr. Lydecker also serves as Assistant Treasurer of other Fidelity funds (2004) and is an employee of FMR. |
Mark Osterheld (49) |
| Year of Election or Appointment: 2002 Assistant Treasurer of VIP Balanced. Mr. Osterheld also serves as Assistant Treasurer of other Fidelity funds (2002) and is an employee of FMR. |
Kenneth B. Robins (35) |
| Year of Election or Appointment: 2004 Assistant Treasurer of VIP Balanced. Mr. Robins also serves as Assistant Treasurer of other Fidelity funds (2004) and is an employee of FMR (2004). Before joining Fidelity Investments, Mr. Robins worked at KPMG LLP, where he was a partner in KPMG's department of professional practice (2002-2004) and a Senior Manager (1999-2000). In addition, Mr. Robins served as Assistant Chief Accountant, United States Securities and Exchange Commission (2000-2002). |
Balanced Portfolio
The Board of Trustees of Variable Insurance Products III: Balanced Portfolio voted to pay to shareholders of record at the opening of business on record date, the following distributions per share derived from capital gains realized from sales of portfolio securities, and dividends derived from net investment income:
Fund | Pay Date | Record Date | Dividends | Capital Gains |
Initial Class | 2/11/05 | 2/11/05 | $.365 | $.01 |
Service Class | 2/11/05 | 2/11/05 | $.350 | $.01 |
Service Class 2 | 2/11/05 | 2/11/05 | $.335 | $.01 |
A total of 7.64% of the dividends distributed during the fiscal year was derived from interest on U.S. Government securities which is generally exempt from state income tax.
A percentage of the dividends distributed during the fiscal year for the following classes qualifies for the dividends-received deduction for corporate shareholders:
Initial Class | 36% |
Service Class | 37% |
Service Class 2 | 40% |
The fund will notify shareholders in January 2005 of amounts for use in preparing 2004 income tax returns.
Annual Report
A special meeting of the fund's shareholders was held on December 14, 2004. The results of votes taken among shareholders on proposals before them are reported below. Each vote reported represents one dollar of net asset value held on the record date for the meeting.
PROPOSAL 1 |
To amend the Declaration of Trust to allow the Board of Trustees, if permitted by applicable law, to authorize fund mergers without shareholder approval. A |
| # of
Votes | % of
Votes |
Affirmative | 4,465,365,699.61 | 80.317 |
Against | 820,718,849.73 | 14.762 |
Abstain | 273,620,539.56 | 4.921 |
TOTAL | 5,559,705,088.90 | 100.000 |
PROPOSAL 2 |
To elect a Board of Trustees. A |
| # of
Votes | % of
Votes |
J. Michael Cook |
Affirmative | 5,275,527,318.06 | 94.889 |
Withheld | 284,177,770.84 | 5.111 |
TOTAL | 5,559,705,088.90 | 100.000 |
Ralph F. Cox |
Affirmative | 5,260,941,793.66 | 94.626 |
Withheld | 298,763,295.24 | 5.374 |
TOTAL | 5,559,705,088.90 | 100.000 |
Laura B. Cronin |
Affirmative | 5,275,571,233.79 | 94.889 |
Withheld | 284,133,855.11 | 5.111 |
TOTAL | 5,559,705,088.90 | 100.000 |
Dennis J. Dirks B |
Affirmative | 5,277,234,059.51 | 94.919 |
Withheld | 282,471,029.39 | 5.081 |
TOTAL | 5,559,705,088.90 | 100.000 |
Robert M. Gates |
Affirmative | 5,271,693,384.06 | 94.820 |
Withheld | 288,011,704.84 | 5.180 |
TOTAL | 5,559,705,088.90 | 100.000 |
George H. Heilmeier |
Affirmative | 5,276,712,546.15 | 94.910 |
Withheld | 282,992,542.75 | 5.090 |
TOTAL | 5,559,705,088.90 | 100.000 |
Abigail P. Johnson |
Affirmative | 5,265,412,678.20 | 94.707 |
Withheld | 294,292,410.70 | 5.293 |
TOTAL | 5,559,705,088.90 | 100.000 |
Edward C. Johnson 3d |
Affirmative | 5,252,813,997.03 | 94.480 |
Withheld | 306,891,091.87 | 5.520 |
TOTAL | 5,559,705,088.90 | 100.000 |
Donald J. Kirk |
Affirmative | 5,268,337,458.03 | 94.759 |
Withheld | 291,367,630.87 | 5.241 |
TOTAL | 5,559,705,088.90 | 100.000 |
| # of
Votes | % of
Votes |
Marie L. Knowles |
Affirmative | 5,278,993,264.93 | 94.951 |
Withheld | 280,711,823.97 | 5.049 |
TOTAL | 5,559,705,088.90 | 100.000 |
Ned C. Lautenbach |
Affirmative | 5,280,591,428.18 | 94.980 |
Withheld | 279,113,660.72 | 5.020 |
TOTAL | 5,559,705,088.90 | 100.000 |
Marvin L. Mann |
Affirmative | 5,266,769,335.50 | 94.731 |
Withheld | 292,935,753.40 | 5.269 |
TOTAL | 5,559,705,088.90 | 100.000 |
William O. McCoy |
Affirmative | 5,270,804,685.62 | 94.804 |
Withheld | 288,900,403.28 | 5.196 |
TOTAL | 5,559,705,088.90 | 100.000 |
Robert L. Reynolds |
Affirmative | 5,279,190,479.65 | 94.955 |
Withheld | 280,514,609.25 | 5.045 |
TOTAL | 5,559,705,088.90 | 100.000 |
Cornelia M. Small B |
Affirmative | 5,276,074,654.01 | 94.898 |
Withheld | 283,630,434.89 | 5.102 |
TOTAL | 5,559,705,088.90 | 100.000 |
William S. Stavropoulos |
Affirmative | 5,278,183,775.21 | 94.936 |
Withheld | 281,521,313.69 | 5.064 |
TOTAL | 5,559,705,088.90 | 100.000 |
A Denotes trust-wide proposals and voting results. B Effective January 1, 2005. |
Balanced Portfolio
Annual Report
Investment Adviser
Fidelity Management & Research Company
Boston, MA
Investment Sub-Advisers
FMR Co., Inc.
Fidelity Investments Money Management, Inc.
Fidelity Management & Research (U.K.) Inc.
Fidelity Management & Research (Far East) Inc.
Fidelity Investments Japan Limited
Fidelity International Investment Advisors
Fidelity International Investment Advisors (U.K.) Limited
General Distributor
Fidelity Distributors Corporation
Boston, MA
Transfer and Shareholder Servicing Agent
Fidelity Investments Institutional Operations Co., Inc.
Boston, MA
Custodian
JPMorgan Chase Bank
New York, NY
VIPBAL-ANN-0205
1.540208.107
Fidelity® Variable Insurance Products:
Dynamic Capital Appreciation Portfolio
Annual Report
December 31, 2004
(2_fidelity_logos)(Registered_Trademark)
Contents
Performance | 3 | How the fund has done over time. |
Management's Discussion | 4 | The manager's review of fund performance, strategy and outlook. |
Shareholder Expense Example | 5 | An example of shareholder expenses. |
Investment Summary | 7 | A summary of the fund's investments at period end. |
Investments | 8 | A complete list of the fund's investments with their
market values. |
Financial Statements | 11 | Statements of assets and liabilities, operations, and
changes in net assets, as well as financial highlights. |
Notes | 15 | Notes to the financial statements. |
Report of Independent Registered Public Accounting Firm | 18 | |
Trustees and Officers | 19 | |
Proxy Voting Results | 24 | |
| | |
To view a fund's proxy voting guidelines and proxy voting record for the 12-month period ended June 30, visit www.fidelity.com/proxyvotingresults or visit the Securities and Exchange Commission's (SEC) web site at www.sec.gov. You may also call 1-800-544-5429 to request a free copy of the proxy voting guidelines.
Fidelity Variable Insurance Products are separate account options which are purchased through a variable insurance contract.
Standard & Poor's, S&P and S&P 500 are registered service marks of The McGraw-Hill Companies, Inc. and have been licensed for use by Fidelity Distributors Corporation.
Other third party marks appearing herein are the property of their respective owners.
All other marks appearing herein are registered or unregistered trademarks or service marks of FMR Corp. or an affiliated company.
(Recycle graphic) This report is printed on recycled paper using soy-based inks.
This report and the financial statements contained herein are submitted for the general information of the shareholders of the fund. This report is not authorized for distribution to prospective investors in the fund unless preceded or accompanied by an effective prospectus.
A fund files its complete schedule of portfolio holdings with the SEC for the first and third quarters of each fiscal year on Form N-Q. Forms N-Q are available on the SEC's web site at http://www.sec.gov. A fund's Forms N-Q may be reviewed and copied at the SEC's Public Reference Room in Washington, DC. Information regarding the operation of the SEC's Public Reference Room may be obtained by calling 1-800-SEC-0330. For a complete list of a fund's portfolio holdings, view the most recent quarterly holdings report, semiannual report, or annual report on Fidelity's web site at http://www.advisor.fidelity.com.
NOT FDIC INSURED · MAY LOSE VALUE · NO BANK GUARANTEE
Neither the fund nor Fidelity Distributors Corporation is a bank.
Dynamic Capital Appreciation Portfolio
Fidelity Variable Insurance Products: Dynamic Capital Appreciation Portfolio
Performance: The Bottom Line
Average annual total return reflects the change in the value of an investment, assuming reinvestment of the class' dividend income and capital gains (the profits earned upon the sale of securities that have grown in value) and assuming a constant rate of performance each year. During periods of reimbursement by Fidelity, a fund's total return will be greater than it would be had the reimbursement not occurred. Performance numbers are net of all underlying fund operating expenses, but do not include any insurance charges imposed by your insurance company's separate account. If performance information included the effect of these additional charges, the total returns would have been lower. How a fund did yesterday is no guarantee of how it will do tomorrow.
Average Annual Total Returns
Periods ended December 31, 2004 | | Past 1
year | Life of fund A |
Fidelity ® VIP: Dynamic Capital Appreciation - Initial Class | | 1.41% | -7.37% |
Fidelity VIP: Dynamic Capital Appreciation - Service Class B | | 1.27% | -7.49% |
Fidelity VIP: Dynamic Capital Appreciation - Service Class 2 C | | 1.28% | -7.62% |
A From September 25, 2000.
B Performance for Service Class shares reflects an asset-based service fee (12b-1 fee).
C Performance for Service Class 2 shares reflects an asset-based service fee (12b-1 fee).
$10,000 Over Life of Fund
Let's say hypothetically that $10,000 was invested in Fidelity® Variable Insurance Products: Dynamic Capital Appreciation Portfolio - Initial Class on September 25, 2000, when the fund started. The chart shows how the value of your investment would have changed, and also shows how the Standard & Poor's 500SM Index performed over the same period.

Annual Report
Fidelity Variable Insurance Products: Dynamic Capital Appreciation Portfolio
Comments from John Porter, Portfolio Manager of Fidelity® Variable Insurance Products: Dynamic Capital Appreciation Portfolio
The year ending December 31, 2004, generally was positive for equity investors, as many stock market benchmarks produced double-digit gains. Broad-based themes included the continued dominance of small-cap stocks, which outperformed large-caps for the sixth consecutive year. The small-cap Russell 2000® Index was up 18.33% in 2004, while the larger-cap Standard & Poor's 500SM Index rose 10.88%. Value stocks ended the year well ahead of growth stocks: The Russell 3000® Value Index advanced 16.94%, compared to 6.93% for the Russell 3000 Growth Index. Energy and basic materials stocks led the market upward. Energy stocks were boosted by record-high oil prices, while strong demand from China helped support commodity prices. The health care sector was among the market's weakest performers. Technology also fell off the pace, though it was helped by a rally late in the year. The tech-heavy NASDAQ Composite® Index returned 9.15%, thanks primarily to a 14.87% jump in the fourth quarter. Elsewhere, the Dow Jones Industrial AverageSM gained 5.37% for the year.
For the 12 months ending December 31, 2004, the fund significantly lagged the S&P 500® index and the LipperSM Variable Annuity Capital Appreciation Funds Average, which returned 9.88%. When the period began, the fund was positioned fairly aggressively, with an emphasis on some of the market's fast-growing but volatile companies, such as those in the technology sector. Unfortunately, corporate spending on technology did not materialize nearly to the extent I expected, which hurt the fund badly until the final few months of the period. Two of the largest holdings in the fund during the year, Internet access provider United Online and DVD rental company Netflix, were big detractors, falling sharply as a result of new competitive threats. On the positive side, the fund's substantial overweighting in the energy sector significantly helped performance, as the entire group benefited from rising oil prices. The fund's top individual contributor relative to the index during the period was UnitedHealth Group, an operator of health care plans and services. UnitedHealth successfully executed on its business plan during the past year. Lyondell Chemical also helped performance as cyclical demand for its ethylene byproducts increased.
The views expressed in this statement reflect those of the portfolio manager only through the end of the period of the report as stated on the cover and do not necessarily represent the views of Fidelity or any other person in the Fidelity organization. Any such views are subject to change at any time based upon market or other conditions and Fidelity disclaims any responsibility to update such views. These views may not be relied on as investment advice and, because investment decisions for a Fidelity fund are based on numerous factors, may not be relied on as an indication of trading intent on behalf of any Fidelity fund.
Dynamic Capital Appreciation Portfolio
Fidelity Variable Insurance Products: Dynamic Capital Appreciation Portfolio
As a shareholder of the Fund, you incur two types of costs: (1) transaction costs, and (2) ongoing costs, including management fees, distribution and/or service (12b-1) fees and other Fund expenses. This Example is intended to help you understand your ongoing costs (in dollars) of investing in the Fund and to compare these costs with the ongoing costs of investing in other mutual funds.
The Example is based on an investment of $1,000 invested at the beginning of the period and held for the entire period (July 1, 2004 to December 31, 2004).
Actual Expenses
The first line of the table below for each class of the Fund provides information about actual account values and actual expenses. You may use the information in this line, together with the amount you invested, to estimate the expenses that you paid over the period. Simply divide your account value by $1,000.00 (for example, an $8,600 account value divided by $1,000.00 = 8.6), then multiply the result by the number in the first line for a class of the Fund under the heading entitled "Expenses Paid During Period" to estimate the expenses you paid on your account during this period. The estimate of expenses does not include any fees or other expenses of any variable annuity or variable life insurance product. If they were, the estimate of expenses you paid during the period would be higher, and your ending account value would be lower.
Hypothetical Example for Comparison Purposes
The second line of the table below for each class of the Fund provides information about hypothetical account values and hypothetical expenses based on a Class' actual expense ratio and an assumed rate of return of 5% per year before expenses, which is not the Class' actual return. The hypothetical account values and expenses may not be used to estimate the actual ending account balance or expenses you paid for the period. You may use this information to compare the ongoing costs of investing in the Fund and other funds. To do so, compare this 5% hypothetical example with the 5% hypothetical examples that appear in the shareholder reports of the other funds. The estimate of expenses does not include any fees or other expenses of any variable annuity or variable life insurance product. If they were, the estimate of expenses you paid during the period would be higher, and your ending account value would be lower.
Please note that the expenses shown in the table are meant to highlight your ongoing costs only and do not reflect any transaction costs. Therefore, the second line of the table is useful in comparing ongoing costs only, and will not help you determine the relative total costs of owning different funds.
| Beginning
Account Value
July 1, 2004 | Ending
Account Value
December 31, 2004 | Expenses Paid
During Period*
July 1, 2004
to December 31, 2004 |
Initial Class | | | |
Actual | $ 1,000.00 | $ 1,014.10 | $ 5.06** |
HypotheticalA | $ 1,000.00 | $ 1,020.11 | $ 5.08** |
Service Class | | | |
Actual | $ 1,000.00 | $ 1,014.20 | $ 5.57** |
HypotheticalA | $ 1,000.00 | $ 1,019.61 | $ 5.58** |
Service Class 2 | | | |
Actual | $ 1,000.00 | $ 1,014.30 | $ 6.33** |
HypotheticalA | $ 1,000.00 | $ 1,018.85 | $ 6.34** |
A 5% return per year before expenses
* Expenses are equal to each Class' annualized expense ratio (shown in the table below); multiplied by the average account value over the period, multiplied by 184/366 (to reflect the one-half year period).
Annual Report
| Annualized
Expense Ratio |
Initial Class | 1.00%** |
Service Class | 1.10%** |
Service Class 2 | 1.25%** |
** If fees effective January 1, 2005 and changes to voluntary expense limitations effective February 1, 2005 had been in effect during the period, the annualized expense ratio and the expenses paid in the actual and hypothetical examples above would have been as follows:
| Annualized
Expense Ratio | Expenses Paid |
Initial Class | .85% | |
Actual | | $ 4.30 |
HypotheticalA | | $ 4.32 |
Service Class | .95% | |
Actual | | $ 4.81 |
HypotheticalA | | $ 4.82 |
Service Class 2 | 1.10% | |
Actual | | $ 5.57 |
HypotheticalA | | $ 5.58 |
A 5% return per year before expenses
Dynamic Capital Appreciation Portfolio
Fidelity Variable Insurance Products: Dynamic Capital Appreciation Portfolio
Top Five Stocks as of December 31, 2004 |
| % of fund's net assets |
UnitedHealth Group, Inc. | 6.2 |
NTL, Inc. | 3.9 |
Intel Corp. | 3.2 |
United Online, Inc. | 3.0 |
Halliburton Co. | 2.5 |
| 18.8 |
Top Five Market Sectors as of December 31, 2004 |
| % of fund's net assets |
Information Technology | 36.1 |
Energy | 20.4 |
Consumer Discretionary | 12.6 |
Health Care | 10.6 |
Industrials | 5.0 |
Asset Allocation as of December 31, 2004 |
% of fund's net assets * |
 | Stocks | 96.8% | |
 | Short-Term
Investments and
Net Other Assets | 3.2% | |

* Foreign investments 15.9% |
Annual Report
Fidelity Variable Insurance Products: Dynamic Capital Appreciation Portfolio
Showing Percentage of Net Assets
Common Stocks - 96.8% |
| Shares | | Value (Note 1) |
CONSUMER DISCRETIONARY - 12.6% |
Hotels, Restaurants & Leisure - 0.2% |
Royal Caribbean Cruises Ltd. | 1,300 | | $ 70,772 |
Household Durables - 1.8% |
Harman International Industries, Inc. | 4,200 | | 533,400 |
Toll Brothers, Inc. (a) | 900 | | 61,749 |
| | 595,149 |
Internet & Catalog Retail - 1.7% |
Blue Nile, Inc. | 7,000 | | 193,340 |
GSI Commerce, Inc. (a) | 2,700 | | 48,006 |
IAC/InterActiveCorp (a) | 8,180 | | 225,932 |
Netflix, Inc. (a) | 7,500 | | 92,475 |
| | 559,753 |
Media - 7.5% |
EchoStar Communications Corp. Class A | 3,390 | | 112,684 |
Fox Entertainment Group, Inc. Class A (a) | 2,900 | | 90,654 |
News Corp.: | | | |
Class A | 1,354 | | 25,266 |
Class B | 20,900 | | 401,280 |
NTL, Inc. (a) | 17,559 | | 1,281,105 |
Spanish Broadcasting System, Inc.
Class A (a) | 3,700 | | 39,072 |
TiVo, Inc. (a) | 6,400 | | 37,568 |
Univision Communications, Inc. Class A (a) | 3,300 | | 96,591 |
Walt Disney Co. | 12,400 | | 344,720 |
XM Satellite Radio Holdings, Inc.
Class A (a) | 900 | | 33,858 |
| | 2,462,798 |
Multiline Retail - 0.2% |
Kmart Holding Corp. (a) | 600 | | 59,370 |
Specialty Retail - 1.2% |
Chico's FAS, Inc. (a) | 8,700 | | 396,111 |
TOTAL CONSUMER DISCRETIONARY | | 4,143,953 |
CONSUMER STAPLES - 0.3% |
Food Products - 0.0% |
Bunge Ltd. | 300 | | 17,103 |
Personal Products - 0.3% |
Avon Products, Inc. | 2,200 | | 85,140 |
TOTAL CONSUMER STAPLES | | 102,243 |
ENERGY - 20.4% |
Energy Equipment & Services - 14.9% |
BJ Services Co. | 7,520 | | 349,981 |
China Oilfield Services Ltd. (H Shares) | 174,000 | | 53,166 |
ENSCO International, Inc. | 14,360 | | 455,786 |
Grant Prideco, Inc. (a) | 25,480 | | 510,874 |
Grey Wolf, Inc. (a) | 16,000 | | 84,320 |
Halliburton Co. | 21,300 | | 835,812 |
|
| Shares | | Value (Note 1) |
National-Oilwell, Inc. (a) | 6,520 | | $ 230,091 |
Noble Corp. (a) | 2,400 | | 119,376 |
Pride International, Inc. (a) | 35,890 | | 737,181 |
Rowan Companies, Inc. (a) | 21,060 | | 545,454 |
Schlumberger Ltd. (NY Shares) | 300 | | 20,085 |
Smith International, Inc. (a) | 930 | | 50,601 |
Transocean, Inc. (a) | 1,300 | | 55,107 |
Varco International, Inc. (a) | 13,050 | | 380,408 |
Veritas DGC, Inc. (a) | 5,400 | | 121,014 |
Weatherford International Ltd. (a) | 7,510 | | 385,263 |
| | 4,934,519 |
Oil & Gas - 5.5% |
Arlington Tankers Ltd. | 100 | | 2,295 |
Frontline Ltd. (c) | 2,500 | | 111,052 |
Frontline Ltd. (NY Shares) | 5,000 | | 221,800 |
OMI Corp. | 10,400 | | 175,240 |
Ship Finance International Ltd. | 333 | | 6,833 |
Teekay Shipping Corp. | 15,400 | | 648,494 |
Top Tankers, Inc. | 23,500 | | 381,875 |
Tsakos Energy Navigation Ltd. | 4,500 | | 161,055 |
Valero Energy Corp. | 2,200 | | 99,880 |
| | 1,808,524 |
TOTAL ENERGY | | 6,743,043 |
FINANCIALS - 4.6% |
Capital Markets - 4.6% |
Ameritrade Holding Corp. (a) | 28,830 | | 409,963 |
Calamos Asset Management, Inc. Class A | 5,300 | | 143,100 |
E*TRADE Financial Corp. (a) | 6,700 | | 100,165 |
Goldman Sachs Group, Inc. | 1,600 | | 166,464 |
Janus Capital Group, Inc. | 2,900 | | 48,749 |
Merrill Lynch & Co., Inc. | 5,300 | | 316,781 |
Morgan Stanley | 5,900 | | 327,568 |
| | 1,512,790 |
Insurance - 0.0% |
Scottish Re Group Ltd. | 200 | | 5,180 |
TOTAL FINANCIALS | | 1,517,970 |
HEALTH CARE - 10.6% |
Biotechnology - 2.5% |
Axonyx, Inc. (a) | 17,900 | | 110,980 |
Celgene Corp. (a) | 3,200 | | 84,896 |
Genentech, Inc. (a) | 5,100 | | 277,644 |
ImClone Systems, Inc. (a) | 5,500 | | 253,440 |
Millennium Pharmaceuticals, Inc. (a) | 4,000 | | 48,480 |
OSI Pharmaceuticals, Inc. (a) | 600 | | 44,910 |
Rigel Pharmaceuticals, Inc. (a) | 531 | | 12,967 |
| | 833,317 |
Health Care Equipment & Supplies - 0.6% |
Aspect Medical Systems, Inc. (a) | 2,800 | | 68,488 |
Common Stocks - continued |
| Shares | | Value (Note 1) |
HEALTH CARE - continued |
Health Care Equipment & Supplies - continued |
Cholestech Corp. (a) | 100 | | $ 814 |
Cytyc Corp. (a) | 1,700 | | 46,869 |
Kyphon, Inc. (a) | 800 | | 20,608 |
Medtronic, Inc. | 900 | | 44,703 |
| | 181,482 |
Health Care Providers & Services - 6.4% |
UnitedHealth Group, Inc. | 23,530 | | 2,071,342 |
WebMD Corp. (a) | 6,900 | | 56,304 |
| | 2,127,646 |
Pharmaceuticals - 1.1% |
Atherogenics, Inc. (a) | 1,000 | | 23,560 |
Elan Corp. PLC sponsored ADR (a) | 2,600 | | 70,850 |
Pfizer, Inc. | 3,600 | | 96,804 |
Wyeth | 3,900 | | 166,101 |
| | 357,315 |
TOTAL HEALTH CARE | | 3,499,760 |
INDUSTRIALS - 5.0% |
Aerospace & Defense - 0.6% |
Lockheed Martin Corp. | 3,400 | | 188,870 |
Airlines - 0.7% |
AirTran Holdings, Inc. (a) | 17,900 | | 191,530 |
Delta Air Lines, Inc. (a) | 6,100 | | 45,628 |
| | 237,158 |
Commercial Services & Supplies - 3.2% |
51Job, Inc. ADR | 100 | | 5,197 |
Career Education Corp. (a) | 15,800 | | 632,000 |
Monster Worldwide, Inc. (a) | 11,600 | | 390,224 |
Robert Half International, Inc. | 1,300 | | 38,259 |
| | 1,065,680 |
Road & Rail - 0.5% |
Guangshen Railway Co. Ltd.
sponsored ADR | 4,300 | | 88,021 |
Norfolk Southern Corp. | 2,100 | | 75,999 |
| | 164,020 |
TOTAL INDUSTRIALS | | 1,655,728 |
INFORMATION TECHNOLOGY - 36.1% |
Communications Equipment - 4.4% |
Adtran, Inc. | 2,300 | | 44,022 |
Alcatel SA sponsored ADR (a) | 10,800 | | 168,804 |
Alvarion Ltd. (a) | 4,300 | | 57,104 |
Harmonic, Inc. (a) | 2,200 | | 18,348 |
Juniper Networks, Inc. (a) | 8,500 | | 231,115 |
Motorola, Inc. | 5,400 | | 92,880 |
QUALCOMM, Inc. | 2,100 | | 89,040 |
Research In Motion Ltd. (a) | 7,500 | | 617,375 |
|
| Shares | | Value (Note 1) |
Sycamore Networks, Inc. (a) | 12,300 | | $ 49,938 |
Telefonaktiebolaget LM Ericsson ADR (a) | 3,100 | | 97,619 |
| | 1,466,245 |
Computers & Peripherals - 4.0% |
Acer, Inc. | 55,000 | | 90,830 |
Apple Computer, Inc. (a) | 4,000 | | 257,600 |
Dell, Inc. (a) | 7,800 | | 328,692 |
Hewlett-Packard Co. | 5,900 | | 123,723 |
Hutchinson Technology, Inc. (a) | 1,300 | | 44,941 |
Maxtor Corp. (a) | 3,200 | | 16,960 |
Quanta Computer, Inc. | 52,000 | | 93,237 |
Seagate Technology | 15,200 | | 262,504 |
Storage Technology Corp. (a) | 400 | | 12,644 |
Western Digital Corp. (a) | 8,500 | | 92,140 |
| | 1,323,271 |
Electronic Equipment & Instruments - 0.7% |
Flextronics International Ltd. (a) | 12,410 | | 171,506 |
National Instruments Corp. | 1,900 | | 51,775 |
| | 223,281 |
Internet Software & Services - 9.9% |
Akamai Technologies, Inc. (a) | 5,400 | | 70,362 |
Ask Jeeves, Inc. (a) | 2,200 | | 58,850 |
China Finance Online Co. Ltd. ADR | 5,400 | | 59,508 |
FindWhat.com (a) | 2,200 | | 39,006 |
Google, Inc. Class A | 3,755 | | 725,091 |
j2 Global Communications, Inc. (a) | 7,500 | | 258,750 |
NetRatings, Inc. (a) | 17,000 | | 325,890 |
United Online, Inc. (a) | 86,130 | | 993,079 |
VeriSign, Inc. (a) | 2,700 | | 90,504 |
Yahoo! Japan Corp. (a) | 92 | | 441,902 |
Yahoo!, Inc. (a) | 6,000 | | 226,080 |
| | 3,289,022 |
IT Services - 2.6% |
Affiliated Computer Services, Inc.
Class A (a) | 11,790 | | 709,640 |
Cognizant Technology Solutions Corp. Class A (a) | 3,300 | | 139,689 |
| | 849,329 |
Semiconductors & Semiconductor Equipment - 11.5% |
Analog Devices, Inc. | 7,000 | | 258,440 |
Applied Materials, Inc. (a) | 10,300 | | 176,130 |
Applied Micro Circuits Corp. (a) | 12,000 | | 50,520 |
ASML Holding NV (NY Shares) (a) | 10,320 | | 164,191 |
Atmel Corp. (a) | 9,000 | | 35,280 |
Cree, Inc. (a) | 1,600 | | 64,128 |
Fairchild Semiconductor International, Inc. (a) | 500 | | 8,130 |
Freescale Semiconductor, Inc. Class B | 3,887 | | 71,365 |
Integrated Circuit Systems, Inc. (a) | 8,600 | | 179,912 |
Intel Corp. | 44,580 | | 1,042,726 |
KLA-Tencor Corp. (a) | 4,600 | | 214,268 |
Lam Research Corp. (a) | 5,000 | | 144,550 |
Common Stocks - continued |
| Shares | | Value (Note 1) |
INFORMATION TECHNOLOGY - continued |
Semiconductors & Semiconductor Equipment - continued |
Linear Technology Corp. | 2,100 | | $ 81,396 |
National Semiconductor Corp. | 9,900 | | 177,705 |
NVIDIA Corp. (a) | 4,900 | | 115,444 |
Portalplayer, Inc. | 10,450 | | 257,906 |
RF Micro Devices, Inc. (a) | 6,700 | | 45,828 |
Sigmatel, Inc. (a) | 2,100 | | 74,613 |
Skyworks Solutions, Inc. (a) | 4,100 | | 38,663 |
Teradyne, Inc. (a) | 31,500 | | 537,705 |
Texas Instruments, Inc. | 2,500 | | 61,550 |
| | 3,800,450 |
Software - 3.0% |
Computer Associates International, Inc. | 11 | | 342 |
Microsoft Corp. | 1,800 | | 48,078 |
Oracle Corp. (a) | 4,400 | | 60,368 |
RSA Security, Inc. (a) | 1,700 | | 34,102 |
Siebel Systems, Inc. (a) | 16,000 | | 168,000 |
Symantec Corp. (a) | 10,400 | | 267,904 |
Take-Two Interactive Software, Inc. (a) | 6,000 | | 208,740 |
VERITAS Software Corp. (a) | 6,800 | | 194,140 |
| | 981,674 |
TOTAL INFORMATION TECHNOLOGY | | 11,933,272 |
MATERIALS - 4.9% |
Chemicals - 3.4% |
Lyondell Chemical Co. | 21,080 | | 609,634 |
Monsanto Co. | 4,500 | | 249,975 |
Mosaic Co. (a) | 8,600 | | 140,352 |
NOVA Chemicals Corp. | 2,900 | | 137,025 |
| | 1,136,986 |
Construction Materials - 0.2% |
Florida Rock Industries, Inc. | 800 | | 47,624 |
Metals & Mining - 1.3% |
Apex Silver Mines Ltd. (a) | 17,500 | | 300,650 |
Pan American Silver Corp. (a) | 7,900 | | 126,598 |
| | 427,248 |
TOTAL MATERIALS | | 1,611,858 |
TELECOMMUNICATION SERVICES - 2.3% |
Diversified Telecommunication Services - 0.4% |
Qwest Communications International, Inc. (a) | 2,300 | | 10,212 |
Sprint Corp. | 4,500 | | 111,825 |
| | 122,037 |
Wireless Telecommunication Services - 1.9% |
American Tower Corp. Class A (a) | 6,800 | | 125,120 |
|
| Shares | | Value (Note 1) |
Hutchison Telecommunications International Ltd. ADR | 12,700 | | $ 172,085 |
Nextel Communications, Inc. Class A (a) | 2,640 | | 79,200 |
Telesystem International Wireless, Inc. (a) | 8,100 | | 90,788 |
Western Wireless Corp. Class A (a) | 6,200 | | 181,660 |
| | 648,853 |
TOTAL TELECOMMUNICATION SERVICES | | 770,890 |
TOTAL COMMON STOCKS (Cost $27,473,125) | 31,978,717 |
Money Market Funds - 3.4% |
| | | |
Fidelity Cash Central Fund, 2.24% (b)
(Cost $1,128,509) | 1,128,509 | | 1,128,509 |
TOTAL INVESTMENT PORTFOLIO - 100.2% (Cost $28,601,634) | 33,107,226 |
NET OTHER ASSETS - (0.2)% | (49,795) |
NET ASSETS - 100% | $ 33,057,431 |
Legend |
(a) Non-income producing |
(b) Affiliated fund that is available only to investment companies and other accounts managed by Fidelity Investments. The rate quoted is the annualized seven-day yield of the fund at period end. A complete listing of the fund's holdings as of its most recent fiscal year end is available upon request. |
(c) Security exempt from registration under Rule 144A of the Securities Act of 1933. These securities may be resold in transactions exempt from registration, normally to qualified institutional buyers. At the period end, the value of these securities amounted to $111,052 or 0.3% of net assets. |
Distribution of investments by country of issue, as a percentage of total net assets, is as follows: |
United States of America | 84.1% |
Marshall Islands | 3.7% |
Canada | 3.0% |
Cayman Islands | 2.6% |
Bermuda | 1.5% |
Japan | 1.3% |
Others (individually less than 1%) | 3.8% |
| 100.0% |
Income Tax Information |
At December 31, 2004, the fund had a capital loss carryforward of approximately $3,581,000 of which $1,013,000, $280,000 and $2,288,000 will expire on December 31, 2009, 2010 and 2012, respectively. |
See accompanying notes which are an integral part of the financial statements.
Dynamic Capital Appreciation Portfolio
Fidelity Variable Insurance Products: Dynamic Capital Appreciation Portfolio
Statement of Assets and Liabilities
| | |
Assets | | |
Investment in securities, at value (cost $28,601,634) - See accompanying schedule | | $ 33,107,226 |
Cash | | 20,576 |
Foreign currency held at value (cost $10,855) | | 11,387 |
Receivable for investments sold | | 204,603 |
Receivable for fund shares sold | | 2,519 |
Dividends receivable | | 15,067 |
Interest receivable | | 2,216 |
Prepaid expenses | | 131 |
Receivable from investment adviser for expense reductions | | 971 |
Other receivables | | 5,593 |
Total assets | | 33,370,289 |
| | |
Liabilities | | |
Payable for investments purchased | $ 178,849 | |
Payable for fund shares redeemed | 66,277 | |
Accrued management fee | 15,682 | |
Distribution fees payable | 2,702 | |
Other affiliated payables | 4,572 | |
Other payables and accrued expenses | 44,776 | |
Total liabilities | | 312,858 |
| | |
Net Assets | | $ 33,057,431 |
Net Assets consist of: | | |
Paid in capital | | $ 32,430,805 |
Accumulated net investment loss | | (17,559) |
Accumulated undistributed net realized gain (loss) on investments and foreign currency transactions | | (3,862,453) |
Net unrealized appreciation (depreciation) on investments and assets and liabilities in foreign currencies | | 4,506,638 |
Net Assets | | $ 33,057,431 |
Initial Class:
Net Asset Value, offering price and redemption price per share ($19,485,940 ÷ 2,709,849 shares) | | $ 7.19 |
| | |
Service Class:
Net Asset Value, offering price and redemption price per share ($643,804 ÷ 89,980 shares) | | $ 7.15 |
| | |
Service Class 2:
Net Asset Value, offering price and redemption price per share ($12,927,687 ÷ 1,818,872 shares) | | $ 7.11 |
Statement of Operations
Year ended December 31, 2004 |
| | |
Investment Income | | |
Dividends | | $ 113,803 |
Interest | | 16,885 |
Security lending | | 12,216 |
Total income | | 142,904 |
| | |
Expenses | | |
Management fee | $ 193,526 | |
Transfer agent fees | 29,514 | |
Distribution fees | 29,527 | |
Accounting and security lending fees | 33,926 | |
Non-interested trustees' compensation | 180 | |
Custodian fees and expenses | 17,247 | |
Audit | 39,939 | |
Legal | 79 | |
Report to shareholders | 18,816 | |
Miscellaneous | 280 | |
Total expenses before reductions | 363,034 | |
Expense reductions | (27,405) | 335,629 |
Net investment income (loss) | | (192,725) |
Realized and Unrealized Gain (Loss) Net realized gain (loss) on: | | |
Investment securities | (2,443,609) | |
Foreign currency transactions | 3,216 | |
Total net realized gain (loss) | | (2,440,393) |
Change in net unrealized appreciation (depreciation) on: Investment securities | 2,035,794 | |
Assets and liabilities in foreign currencies | 662 | |
Total change in net unrealized appreciation (depreciation) | | 2,036,456 |
Net gain (loss) | | (403,937) |
Net increase (decrease) in net assets resulting from operations | | $ (596,662) |
See accompanying notes which are an integral part of the financial statements.
Annual Report
Fidelity Variable Insurance Products: Dynamic Capital Appreciation Portfolio
Financial Statements - continued
Statement of Changes in Net Assets
| Year ended
December 31,
2004 | Year ended
December 31,
2003 |
Increase (Decrease) in Net Assets | | |
Operations | | |
Net investment income (loss) | $ (192,725) | $ (74,777) |
Net realized gain (loss) | (2,440,393) | 645,172 |
Change in net unrealized appreciation (depreciation) | 2,036,456 | 2,393,233 |
Net increase (decrease) in net assets resulting from operations | (596,662) | 2,963,628 |
Share transactions - net increase (decrease) | 5,346,069 | 17,643,469 |
Total increase (decrease) in net assets | 4,749,407 | 20,607,097 |
| | |
Net Assets | | |
Beginning of period | 28,308,024 | 7,700,927 |
End of period (including accumulated net investment loss of $17,559 and accumulated net investment loss of $19,223, respectively) | $ 33,057,431 | $ 28,308,024 |
Other Information: | | | |
Share Transactions | Year ended December 31, 2004 |
| Initial Class | Service Class | Service Class 2 |
Shares Sold | 2,414,426 | 8,530 | 663,391 |
Redeemed | (2,058,955) | (39,255) | (378,225) |
Net increase (decrease) | 355,471 | (30,725) | 285,166 |
| | | |
Dollars Sold | $ 17,426,612 | $ 58,255 | $ 4,511,425 |
Redeemed | (13,839,795) | (268,348) | (2,542,080) |
Net increase (decrease) | $ 3,586,817 | $ (210,093) | $ 1,969,345 |
| | | |
Share Transactions | Year ended December 31, 2003 |
| Initial Class | Service Class | Service Class 2 |
Shares Sold | 2,499,801 | 13,223 | 958,232 |
Redeemed | (272,552) | (29,607) | (528,986) |
Net increase (decrease) | 2,227,249 | (16,384) | 429,246 |
| | | |
Dollars Sold | $ 16,849,324 | $ 79,816 | $ 5,979,794 |
Redeemed | (1,809,908) | (180,396) | (3,275,161) |
Net increase (decrease) | $ 15,039,416 | $ (100,580) | $ 2,704,633 |
| | | |
See accompanying notes which are an integral part of the financial statements.
Dynamic Capital Appreciation Portfolio
Financial Highlights - Initial Class
Years ended December 31, | 2004 | 2003 | 2002 | 2001 | 2000 G |
Selected Per-Share Data | | | | | |
Net asset value, beginning of period | $ 7.09 | $ 5.65 | $ 6.10 | $ 8.52 | $ 10.00 |
Income from Investment Operations | | | | | |
Net investment income (loss)E | (.03) | (.02) | .02 | -I | .01 |
Net realized and unrealized gain (loss) | .13F | 1.46 | (.46) | (2.41) | (1.49) |
Total from investment operations | .10 | 1.44 | (.44) | (2.41) | (1.48) |
Distributions from net investment income | - | - | (.01) | (.01) | - |
Net asset value, end of period | $ 7.19 | $ 7.09 | $ 5.65 | $ 6.10 | $ 8.52 |
Total ReturnB,C,D | 1.41% | 25.49% | (7.21)% | (28.32)% | (14.80)% |
Ratios to Average Net AssetsH | | | | | |
Expenses before expense reductions | .98% | 1.83% | 2.64% | 3.59% | 10.18%A |
Expenses net of voluntary waivers, if any | .98% | 1.06% | 1.50% | 1.50% | 1.50%A |
Expenses net of all reductions | .91% | .96% | 1.38% | 1.43% | 1.50%A |
Net investment income (loss) | (.48)% | (.30)% | .32% | .02% | .47%A |
Supplemental Data | | | | | |
Net assets, end of period (000 omitted) | $ 19,486 | $ 16,684 | $ 719 | $ 390 | $ 256 |
Portfolio turnover rate | 226% | 307% | 349% | 432% | 295%A |
A Annualized
B Total returns for periods of less than one year are not annualized.
C Total returns do not reflect charges attributable to your insurance company's separate account. Inclusion of these charges would reduce the total returns shown.
D Total returns would have been lower had certain expenses not been reduced during the periods shown.
E Calculated based on average shares outstanding during the period.
F The amount shown for a share outstanding does not correspond with the aggregate net gain (loss) on investments for the period due to the timing of sales and repurchases of shares in relation to fluctuating market values of the investments of the fund.
G For the period September 25, 2000 (commencement of operations) to December 31, 2000.
H Expense ratios reflect operating expenses of the class. Expenses before reductions do not reflect amounts reimbursed by the investment adviser or reductions from brokerage service arrangements or other expense offset arrangements and do not represent the amount paid by the class during periods when reimbursements or reductions occur. Expense ratios before reductions for start-up periods may not be representative of longer-term operating periods. Expenses net of any voluntary waivers reflect expenses after reimbursement by the investment adviser but prior to reductions from brokerage service arrangements or other expense offset arrangements. Expenses net of all reductions represent the net expenses paid by the class.
I Amount represents less than $.01 per share.
Financial Highlights - Service Class
Years ended December 31, | 2004 | 2003 | 2002 | 2001 | 2000 G |
Selected Per-Share Data | | | | | |
Net asset value, beginning of period | $ 7.06 | $ 5.64 | $ 6.09 | $ 8.52 | $ 10.00 |
Income from Investment Operations | | | | | |
Net investment income (loss)E | (.04) | (.04) | .01 | (.01) | .01 |
Net realized and unrealized gain (loss) | .13F | 1.46 | (.45) | (2.41) | (1.49) |
Total from investment operations | .09 | 1.42 | (.44) | (2.42) | (1.48) |
Distributions from net investment income | - | - | (.01) | (.01) | - |
Net asset value, end of period | $ 7.15 | $ 7.06 | $ 5.64 | $ 6.09 | $ 8.52 |
Total ReturnB,C,D | 1.27% | 25.18% | (7.22)% | (28.44)% | (14.80)% |
Ratios to Average Net AssetsH | | | | | |
Expenses before expense reductions | 1.07% | 1.92% | 2.61% | 3.63% | 10.30%A |
Expenses net of voluntary waivers, if any | 1.07% | 1.38% | 1.60% | 1.60% | 1.60%A |
Expenses net of all reductions | 1.00% | 1.29% | 1.48% | 1.53% | 1.60%A |
Net investment income (loss) | (.57)% | (.63)% | .22% | (.08)% | .36%A |
Supplemental Data | | | | | |
Net assets, end of period (000 omitted) | $ 644 | $ 852 | $ 773 | $ 915 | $ 802 |
Portfolio turnover rate | 226% | 307% | 349% | 432% | 295%A |
A Annualized
B Total returns for periods of less than one year are not annualized.
C Total returns do not reflect charges attributable to your insurance company's separate account. Inclusion of these charges would reduce the total returns shown.
D Total returns would have been lower had certain expenses not been reduced during the periods shown.
E Calculated based on average shares outstanding during the period.
F The amount shown for a share outstanding does not correspond with the aggregate net gain (loss) on investments for the period due to the timing of sales and repurchases of shares in relation to fluctuating market values of the investments of the fund.
G For the period September 25, 2000 (commencement of operations) to December 31, 2000.
H Expense ratios reflect operating expenses of the class. Expenses before reductions do not reflect amounts reimbursed by the investment adviser or reductions from brokerage service arrangements or other expense offset arrangements and do not represent the amount paid by the class during periods when reimbursements or reductions occur. Expense ratios before reductions for start-up periods may not be representative of longer-term operating periods. Expenses net of any voluntary waivers reflect expenses after reimbursement by the investment adviser but prior to reductions from brokerage service arrangements or other expense offset arrangements. Expenses net of all reductions represent the net expenses paid by the class.
See accompanying notes which are an integral part of the financial statements.
Annual Report
Financial Highlights - Service Class 2
Years ended December 31, | 2004 | 2003 | 2002 | 2001 | 2000 G |
Selected Per-Share Data | | | | | |
Net asset value, beginning of period | $ 7.02 | $ 5.62 | $ 6.09 | $ 8.52 | $ 10.00 |
Income from Investment Operations | | | | | |
Net investment income (loss)E | (.05) | (.05) | -I | (.01) | -I |
Net realized and unrealized gain (loss) | .14F | 1.45 | (.46) | (2.41) | (1.48) |
Total from investment operations | .09 | 1.40 | (.46) | (2.42) | (1.48) |
Distributions from net investment income | - | - | (.01) | (.01) | - |
Net asset value, end of period | $ 7.11 | $ 7.02 | $ 5.62 | $ 6.09 | $ 8.52 |
Total ReturnB,C,D | 1.28% | 24.91% | (7.55)% | (28.44)% | (14.80)% |
Ratios to Average Net AssetsH | | | | | |
Expenses before expense reductions | 1.26% | 2.10% | 2.79% | 3.77% | 10.49%A |
Expenses net of voluntary waivers, if any | 1.25% | 1.51% | 1.75% | 1.75% | 1.75%A |
Expenses net of all reductions | 1.17% | 1.41% | 1.63% | 1.68% | 1.75%A |
Net investment income (loss) | (.74)% | (.75)% | .07% | (.23)% | .21%A |
Supplemental Data | | | | | |
Net assets, end of period (000 omitted) | $ 12,928 | $ 10,772 | $ 6,209 | $ 3,972 | $ 1,549 |
Portfolio turnover rate | 226% | 307% | 349% | 432% | 295%A |
A Annualized
B Total returns for periods of less than one year are not annualized.
C Total returns do not reflect charges attributable to your insurance company's separate account. Inclusion of these charges would reduce the total returns shown.
D Total returns would have been lower had certain expenses not been reduced during the periods shown.
E Calculated based on average shares outstanding during the period.
F The amount shown for a share outstanding does not correspond with the aggregate net gain (loss) on investments for the period due to the timing of sales and repurchases of shares in relation to fluctuating market values of the investments of the fund.
G For the period September 25, 2000 (commencement of operations) to December 31, 2000.
H Expense ratios reflect operating expenses of the class. Expenses before reductions do not reflect amounts reimbursed by the investment adviser or reductions from brokerage service arrangements or other expense offset arrangements and do not represent the amount paid by the class during periods when reimbursements or reductions occur. Expense ratios before reductions for start-up periods may not be representative of longer-term operating periods. Expenses net of any voluntary waivers reflect expenses after reimbursement by the investment adviser but prior to reductions from brokerage service arrangements or other expense offset arrangements. Expenses net of all reductions represent the net expenses paid by the class.
I Amount represents less than $.01 per share.
See accompanying notes which are an integral part of the financial statements.
Dynamic Capital Appreciation Portfolio
For the period ended December 31, 2004
1. Significant Accounting Policies.
Dynamic Capital Appreciation Portfolio (the fund) is a fund of Variable Insurance Products Fund III (the trust) (referred to in this report as Fidelity Variable Insurance Products: Dynamic Capital Appreciation Portfolio) and is authorized to issue an unlimited number of shares. The trust is registered under the Investment Company Act of 1940, as amended (the 1940 Act), as an open-end management investment company organized as a Massachusetts business trust. Shares of the fund may only be purchased by insurance companies for the purpose of funding variable annuity or variable life insurance contracts. The fund offers the following classes of shares: Initial Class shares, Service Class shares and Service Class 2 shares. All classes have equal rights and voting privileges, except for matters affecting a single class. Investment income, realized and unrealized capital gains and losses, the common expenses of the fund, and certain fund-level expense reductions, if any, are allocated on a pro rata basis to each class based on the relative net assets of each class to the total net assets of the fund. Each class differs with respect to distribution and service plan fees incurred. Certain expense reductions also differ by class.
The financial statements have been prepared in conformity with accounting principles generally accepted in the United States of America, which require management to make certain estimates and assumptions at the date of the financial statements. The following summarizes the significant accounting policies of the fund:
Security Valuation. Net asset value per share (NAV calculation) is calculated as of the close of business of the New York Stock Exchange, normally 4:00 p.m. Eastern time. Equity securities, including restricted securities, for which market quotations are available are valued at the last sale price or official closing price (closing bid price or last evaluated quote if no sale has occurred) on the primary market or exchange on which they trade. If prices are not readily available or do not accurately reflect fair value for a security, or if a security's value has been materially affected by events occurring after the close of the exchange or market on which the security is principally traded, that security may be valued by another method that the Board of Trustees believes accurately reflects fair value. A security's valuation may differ depending on the method used for determining value. Price movements in futures contracts and ADRs, market and trading trends, the bid/ask quotes of brokers and off-exchange institutional trading may be reviewed in the course of making a good faith determination of a security's fair value. Short-term securities with remaining maturities of sixty days or less for which quotations are not readily available are valued on the basis of amortized cost. Investments in open-end investment companies are valued at their net asset value each business day.
Foreign Currency. The fund uses foreign currency contracts to facilitate transactions in foreign-denominated securities. Losses from these transactions may arise from changes in the value of the foreign currency or if the counterparties do not perform under the contracts' terms.
Foreign-denominated assets, including investment securities, and liabilities are translated into U.S. dollars at the exchange rate at period end. Purchases and sales of investment securities, income and dividends received and expenses denominated in foreign currencies are translated into U.S. dollars at the exchange rate in effect on the transaction date.
The effects of exchange rate fluctuations on investments are included with the net realized and unrealized gain (loss) on investment securities. Other foreign currency transactions resulting in realized and unrealized gain (loss) are disclosed separately.
Investment Transactions and Income. Security transactions are accounted for as of trade date. Gains and losses on securities sold are determined on the basis of identified cost and may include proceeds received from litigation. Dividend income is recorded on the ex-dividend date, except for certain dividends from foreign securities where the ex-dividend date may have passed, which are recorded as soon as the fund is informed of the ex-dividend date. Non-cash dividends included in dividend income, if any, are recorded at the fair market value of the securities received. Distributions received on securities that represent a return of capital or capital gain are recorded as a reduction of cost of investments and/or as a realized gain. The fund estimates the components of distributions received that may be considered return of capital distributions or capital gain distributions. Interest income is accrued as earned. Interest income includes coupon interest and amortization of premium and accretion of discount on debt securities. Investment income is recorded net of foreign taxes withheld where recovery of such taxes is uncertain.
Expenses. Most expenses of the trust can be directly attributed to a fund. Expenses which cannot be directly attributed are apportioned among the funds in the trust.
Income Tax Information and Distributions to Shareholders. Each year, the fund intends to qualify as a regulated investment company by distributing all of its taxable income and realized gains under Subchapter M of the Internal Revenue Code. As a result, no provision for income taxes is required in the accompanying financial statements. Foreign taxes are provided for based on the fund's understanding of the tax rules and rates that exist in the foreign markets in which it invests.
Distributions are recorded on the ex-dividend date. Income dividends and capital gain distributions are declared separately for each class. Income and capital gain distributions are determined in accordance with income tax regulations, which may differ from generally accepted accounting principles.
Capital accounts within the financial statements are adjusted for permanent book-tax differences. These adjustments have no impact on net assets or the results of operations. Temporary book-tax differences will reverse in a subsequent period.
Annual Report
Notes to Financial Statements - continued
1. Significant Accounting Policies - continued
Income Tax Information and Distributions to Shareholders - continued
Book-tax differences are primarily due to passive foreign investment companies (PFIC), net operating losses, foreign currency, capital loss carryforwards and losses deferred due to wash sales.
The tax-basis components of distributable earnings and the federal tax cost as of period end were as follows:
Unrealized appreciation | $ 5,502,286 | |
Unrealized depreciation | (1,291,921) | |
Net unrealized appreciation (depreciation) | 4,210,365 | |
Capital loss carryforward | (3,581,366) | |
| | |
Cost for federal income tax purposes | $ 28,896,861 | |
2. Operating Policies.
Repurchase Agreements. Fidelity Management & Research Company (FMR) has received an Exemptive Order from the Securities and Exchange Commission (the SEC) which permits the fund and other affiliated entities of FMR to transfer uninvested cash balances into joint trading accounts. These accounts are then invested in repurchase agreements that are collateralized by U.S. Treasury or Government obligations. The fund may also invest directly with institutions, in repurchase agreements that are collateralized by commercial paper obligations and corporate obligations. Collateral is held in segregated accounts with custodian banks and may be obtained in the event of a default of the counterparty. Collateral is marked-to-market daily and maintained at a value at least equal to the principal amount of the repurchase agreement (including accrued interest).
Restricted Securities. The fund may invest in securities that are subject to legal or contractual restrictions on resale. These securities generally may be resold in transactions exempt from registration or to the public if the securities are registered. Disposal of these securities may involve time-consuming negotiations and expense, and prompt sale at an acceptable price may be difficult. Information regarding restricted securities is included at the end of the fund's Schedule of Investments.
3. Purchases and Sales of Investments.
Purchases and sales of securities, other than short-term securities and U.S. government securities, aggregated $77,832,075 and $72,731,849, respectively.
4. Fees and Other Transactions with Affiliates.
Management Fee. FMR and its affiliates provide the fund with investment management related services for which the fund pays a monthly management fee. The management fee is the sum of an individual fund fee rate that is based on an annual rate of .30% of the fund's average net assets and a group fee rate that averaged .28% during the period. The group fee rate is based upon the average net assets of all the mutual funds advised by FMR. The group fee rate decreases as assets under management increase and increases as assets under management decrease. For the period, the total annual management fee rate was .58% of the fund's average net assets.
Distribution and Service Plan. In accordance with Rule 12b-1 of the 1940 Act, the fund has adopted separate 12b-1 Plans for each Service Class of shares. Each Service Class pays Fidelity Distributors Corporation (FDC), an affiliate of FMR, a service fee. For the period, the service fee is based on an annual rate of .10% of Service Class' average net assets and .25% of Service Class 2's average net assets.
For the period, each class paid FDC the following amounts, all of which were re-allowed to insurance companies for the distribution of shares and providing shareholder support services:
Service Class | $ 687 | |
Service Class 2 | 28,840 | |
| $ 29,527 | |
Dynamic Capital Appreciation Portfolio
4. Fees and Other Transactions with Affiliates - continued
Transfer Agent Fees. Fidelity Investments Institutional Operations Company, Inc. (FIIOC), an affiliate of FMR, is the fund's transfer, dividend disbursing, and shareholder servicing agent. FIIOC receives an asset-based fee with respect to each account. FIIOC pays a portion of the expenses related to the typesetting, printing and mailing of shareholder reports, except proxy statements. Each class pays a transfer agent fee, excluding out of pocket expenses, equal to an annual rate of .07% of their month end net assets. For the period, the total transfer agent fees paid by each class to FIIOC, including out of pocket expenses, were as follows:
Initial Class | $ 16,620 | |
Service Class | 472 | |
Service Class 2 | 12,422 | |
| $ 29,514 | |
Accounting and Security Lending Fees. Fidelity Service Company, Inc. (FSC), an affiliate of FMR, maintains the fund's accounting records. The accounting fee is based on the level of average net assets for the month. Under a separate contract, FSC administers the security lending program. The security lending fee is based on the number and duration of lending transactions.
Central Funds. The fund may invest in affiliated Central Funds managed by Fidelity Investments Money Management, Inc. (FIMM), an affiliate of FMR. The Central Funds are open-end investment companies available only to investment companies and other accounts managed by FMR and its affiliates. The Central Funds seek preservation of capital and current income and do not pay a management fee. Income distributions earned by the fund are recorded as income in the accompanying financial statements and totaled $20,081 for the period.
Brokerage Commissions. The fund placed a portion of its portfolio transactions with brokerage firms which are affiliates of the investment adviser. The commissions paid to these affiliated firms were $9,576 for the period.
5. Committed Line of Credit.
The fund participates with other funds managed by FMR in a $4.2 billion credit facility (the "line of credit") to be utilized for temporary or emergency purposes to fund shareholder redemptions or for other short-term liquidity purposes. The fund has agreed to pay commitment fees on its pro rata portion of the line of credit. During the period, there were no borrowings on this line of credit.
6. Security Lending.
The fund lends portfolio securities from time to time in order to earn additional income. The fund receives collateral (in the form of U.S. Treasury obligations, letters of credit and/or cash) against the loaned securities and maintains collateral in an amount not less than 100% of the market value of the loaned securities during the period of the loan. The market value of the loaned securities is determined at the close of business of the fund and any additional required collateral is delivered to the fund on the next business day. If the borrower defaults on its obligation to return the securities loaned because of insolvency or other reasons, a fund could experience delays and costs in recovering the securities loaned or in gaining access to the collateral. Cash collateral is invested in cash equivalents. At period end there were no security loans outstanding.
7. Expense Reductions.
FMR voluntarily agreed to reimburse each class to the extent annual operating expenses exceeded certain levels of average net assets as noted in the table below. Some expenses, for example interest expense, are excluded from this reimbursement. Effective February 1, 2005, the expense limitations will be changed to 1.10% for Service Class 2.
| Expense
Limitations | Reimbursement
from adviser |
Service Class 2 | 1.25% | $ 1,819 |
Many of the brokers with whom FMR places trades on behalf of the fund provided services to the fund in addition to trade execution. These services included payments of certain expenses on behalf of the fund totaling $25,508 for the period. In addition, through arrangements with the fund's custodian, credits realized as a result of uninvested cash balances were used to reduce the fund's expenses. During the period, these credits reduced the fund's custody expenses by $78.
8. Other Information.
At the end of the period, FMR or its affiliates were the owners of record of 54% of the total outstanding shares of the fund and two otherwise unaffiliated shareholders were the owners of record of 27% of the total outstanding shares of the fund.
Annual Report
To the Trustees of Variable Insurance Products Fund III and Shareholders of Dynamic Capital Appreciation Portfolio:
We have audited the accompanying statement of assets and liabilities of Dynamic Capital Appreciation Portfolio (the Fund), a fund of Variable Insurance Products Fund III, including the portfolio of investments, as of December 31, 2004, and the related statement of operations for the year then ended, the statement of changes in net assets for each of the two years in the period then ended, and the financial highlights for each of the five years in the period then ended. These financial statements and financial highlights are the responsibility of the Fund's management. Our responsibility is to express an opinion on these financial statements and financial highlights based on our audits.
We conducted our audits in accordance with standards of the Public Company Accounting Oversight Board (United States). Those standards require that we plan and perform the audit to obtain reasonable assurance about whether the financial statements and financial highlights are free of material misstatement. An audit includes consideration of internal control over financial reporting as a basis for designing audit procedures that are appropriate in the circumstances, but not for the purpose of expressing an opinion on the effectiveness of the Fund's internal control over financial reporting. Accordingly, we express no such opinion. An audit also includes examining, on a test basis, evidence supporting the amounts and disclosures in the financial statements, assessing the accounting principles used and significant estimates made by management, as well as evaluating the overall financial statement presentation. Our procedures included confirmation of securities owned as of December 31, 2004, by correspondence with the custodians and brokers; where replies were not received from brokers, we performed other auditing procedures. We believe that our audits provide a reasonable basis for our opinion.
In our opinion, the financial statements and financial highlights referred to above present fairly, in all material respects, the financial position of Dynamic Capital Appreciation Portfolio as of December 31, 2004, the results of its operations for the year then ended, the changes in its net assets for each of the two years in the period then ended, and its financial highlights for each of the five years in the period then ended, in conformity with accounting principles generally accepted in the United States of America.
/s/ DELOITTE & TOUCHE LLP
DELOITTE & TOUCHE LLP
Boston, Massachusetts
February 18, 2005
Dynamic Capital Appreciation Portfolio
The Trustees, Member of the Advisory Board, and executive officers of the trust and fund, as applicable, are listed below. The Board of Trustees governs the fund and is responsible for protecting the interests of shareholders. The Trustees are experienced executives who meet periodically throughout the year to oversee the fund's activities, review contractual arrangements with companies that provide services to the fund, and review the fund's performance. Except for William O. McCoy, Dennis J. Dirks, and Kenneth L. Wolfe, each of the Trustees oversees 301 funds advised by FMR or an affiliate. Mr. McCoy oversees 303 funds advised by FMR or an affiliate. Mr. Dirks and Mr. Wolfe oversee 223 funds advised by FMR or an affiliate.
The Trustees hold office without limit in time except that (a) any Trustee may resign; (b) any Trustee may be removed by written instrument, signed by at least two-thirds of the number of Trustees prior to such removal; (c) any Trustee who requests to be retired or who has become incapacitated by illness or injury may be retired by written instrument signed by a majority of the other Trustees; and (d) any Trustee may be removed at any special meeting of shareholders by a two-thirds vote of the outstanding voting securities of the trust. In any event, each non-interested Trustee shall retire not later than the last day of the calendar year in which his or her 72nd birthday occurs. The executive officers and Advisory Board Member hold office without limit in time, except that any officer and Advisory Board Member may resign or may be removed by a vote of a majority of the Trustees at any regular meeting or any special meeting of the Trustees. Except as indicated, each individual has held the office shown or other offices in the same company for the past five years.
The fund's Statement of Additional Information (SAI) includes more information about the Trustees. To request a free copy, call Fidelity at 1-800-544-5429.
Interested Trustees*:
Correspondence intended for each Trustee who is an "interested person" (as defined in the 1940 Act) may be sent to Fidelity Investments, 82 Devonshire Street, Boston, Massachusetts 02109.
Name, Age; Principal Occupation |
Edward C. Johnson 3d (74)** |
| Year of Election or Appointment: 1994 Mr. Johnson is Chairman of the Board of Trustees. Mr. Johnson serves as Chief Executive Officer, Chairman, and a Director of FMR Corp.; a Director and Chairman of the Board and of the Executive Committee of FMR; Chairman and a Director of Fidelity Management & Research (Far East) Inc.; Chairman (1998) and a Director of Fidelity Investments Money Management, Inc.; and Chairman (2001) and a Director (2000) of FMR Co., Inc. |
Abigail P. Johnson (43)** |
| Year of Election or Appointment: 2001 Senior Vice President of VIP Dynamic Capital Appreciation (2001). Ms. Johnson also serves as Senior Vice President of other Fidelity funds (2001). She is President and a Director of FMR (2001), Fidelity Investments Money Management, Inc. (2001), FMR Co., Inc. (2001), and a Director of FMR Corp. Previously, Ms. Johnson managed a number of Fidelity funds. |
Laura B. Cronin (50) |
| Year of Election or Appointment: 2003 Ms. Cronin is an Executive Vice President (2002) and Chief Financial Officer (2002) of FMR Corp. and is a member of the Fidelity Management Committee (2003). Previously, Ms. Cronin served as Vice President of Finance of FMR (1997-1999), and Chief Financial Officer of FMR (1999-2001), Fidelity Personal Investments (2001), and Fidelity Brokerage Company (2001-2002). |
Robert L. Reynolds (52) |
| Year of Election or Appointment: 2003 Mr. Reynolds is a Director (2003) and Chief Operating Officer (2002) of FMR Corp. and is the head of the Fidelity Management Committee (2003). He also serves on the Board at Fidelity Investments Canada, Ltd. (2000). Previously, Mr. Reynolds served as President of Fidelity Investments Institutional Retirement Group (1996-2000). |
* Trustees have been determined to be "Interested Trustees" by virtue of, among other things, their affiliation with the trust or various entities under common control with FMR.
** Edward C. Johnson 3d, Trustee, is Abigail P. Johnson's father.
Annual Report
Trustees and Officers - continued
Non-Interested Trustees:
Correspondence intended for each non-interested Trustee (that is, the Trustees other than the Interested Trustees) may be sent to Fidelity Investments, P.O. Box 55235, Boston, Massachusetts 02205-5235.
Name, Age; Principal Occupation |
Dennis J. Dirks (56) |
| Year of Election or Appointment: 2005 Mr. Dirks also serves as a Trustee (2005) or Member of the Advisory Board (2004) of other investment companies advised by FMR. Prior to his retirement in May 2003, Mr. Dirks was Chief Operating Officer and a member of the Board of The Depository Trust & Clearing Corporation (DTCC) (1999-2003). He also served as President, Chief Operating Officer, and Board member of The Depository Trust Company (DTC) (1999-2003) and President and Board member of the National Securities Clearing Corporation (NSCC) (1999-2003). In addition, Mr. Dirks served as Chief Executive Officer and Board member of the Government Securities Clearing Corporation (2001-2003) and Chief Executive Officer and Board member of the Mortgage-Backed Securities Clearing Corporation (2001-2003). |
Robert M. Gates (61) |
| Year of Election or Appointment: 1997 Dr. Gates is Vice Chairman of the non-interested Trustees (2005). Dr. Gates is President of Texas A&M University (2002). He was Director of the Central Intelligence Agency (CIA) from 1991 to 1993. From 1989 to 1991, Dr. Gates served as Assistant to the President of the United States and Deputy National Security Advisor. Dr. Gates is a Director of NACCO Industries, Inc. (mining and manufacturing), Parker Drilling Co., Inc. (drilling and rental tools for the energy industry, 2001), and Brinker International (restaurant management, 2003). He also serves as a member of the Advisory Board of VoteHere.net (secure internet voting, 2001). Previously, Dr. Gates served as a Director of LucasVarity PLC (automotive components and diesel engines), a Director of TRW Inc. (automotive, space, defense, and information technology), and Dean of the George Bush School of Government and Public Service at Texas A&M University (1999-2001). Dr. Gates also is a Trustee of the Forum for International Policy. |
George H. Heilmeier (68) |
| Year of Election or Appointment: 2004 Dr. Heilmeier is Chairman Emeritus of Telcordia Technologies (communication software and systems), where prior to his retirement, he served as company Chairman and Chief Executive Officer. He currently serves on the Boards of Directors of The Mitre Corporation (systems engineering and information technology support for the government), INET Technologies Inc. (telecommunications network surveillance, 2001), Teletech Holdings (customer management services), and HRL Laboratories (private research and development, 2004). He is Chairman of the General Motors Technology Advisory Committee and a Life Fellow of the Institute of Electrical and Electronics Engineers (IEEE) (2000). Dr. Heilmeier is a member of the Defense Science Board and the National Security Agency Advisory Board. He is also a member of the National Academy of Engineering, the American Academy of Arts and Sciences, and the Board of Overseers of the School of Engineering and Applied Science of the University of Pennsylvania. Previously, Dr. Heilmeier served as a Director of TRW Inc. (automotive, space, defense, and information technology, 1992-2002), Compaq (1994-2002), and Automatic Data Processing, Inc. (ADP) (technology-based business outsourcing, 1995-2002). |
Marie L. Knowles (58) |
| Year of Election or Appointment: 2001 Prior to Ms. Knowles' retirement in June 2000, she served as Executive Vice President and Chief Financial Officer of Atlantic Richfield Company (ARCO) (diversified energy, 1996-2000). From 1993 to 1996, she was a Senior Vice President of ARCO and President of ARCO Transportation Company. She served as a Director of ARCO from 1996 to 1998. She currently serves as a Director of Phelps Dodge Corporation (copper mining and manufacturing) and McKesson Corporation (healthcare service, 2002). Ms. Knowles is a Trustee of the Brookings Institution and the Catalina Island Conservancy and also serves as a member of the Advisory Board for the School of Engineering of the University of Southern California. |
Ned C. Lautenbach (60) |
| Year of Election or Appointment: 2000 Mr. Lautenbach has been a partner of Clayton, Dubilier & Rice, Inc. (private equity investment firm) since September 1998. Previously, Mr. Lautenbach was with the International Business Machines Corporation (IBM) from 1968 until his retirement in 1998. He was most recently Senior Vice President and Group Executive of Worldwide Sales and Services. From 1993 to 1995, he was Chairman of IBM World Trade Corporation, and from 1994 to 1998 was a member of IBM's Corporate Executive Committee. Mr. Lautenbach serves as Co-Chairman and a Director of Covansys, Inc. (global provider of business and technology solutions, 2000). In addition, he is a Director of Italtel Holding S.p.A. (telecommunications (Milan, Italy), 2004) and Eaton Corporation (diversified industrial) as well as the Philharmonic Center for the Arts in Naples, Florida (1999). He also is a member of the Council on Foreign Relations. |
Marvin L. Mann (71) |
| Year of Election or Appointment: 1994 Mr. Mann is Chairman of the non-interested Trustees (2001). He is Chairman Emeritus of Lexmark International, Inc. (computer peripherals), where he served as CEO until April 1998, retired as Chairman May 1999, and remains a member of the Board. Prior to 1991, he held the positions of Vice President of International Business Machines Corporation (IBM) and President and General Manager of various IBM divisions and subsidiaries. He is a member of the Executive Committee of the Independent Director's Council of the Investment Company Institute. In addition, Mr. Mann is a member of the President's Cabinet at the University of Alabama and the Board of Visitors of the Culverhouse College of Commerce and Business Administration at the University of Alabama. |
William O. McCoy (71) |
| Year of Election or Appointment: 1997 Prior to his retirement in December 1994, Mr. McCoy was Vice Chairman of the Board of BellSouth Corporation (telecommunications) and President of BellSouth Enterprises. He is currently a Director of Liberty Corporation (holding company), Duke Realty Corporation (real estate), and Progress Energy, Inc. (electric utility). He is also a partner of Franklin Street Partners (private investment management firm) and a member of the Research Triangle Foundation Board. In addition, Mr. McCoy served as the Interim Chancellor (1999-2000) and a member of the Board of Visitors (1994-1998) for the University of North Carolina at Chapel Hill and currently serves on the Board of Directors of the University of North Carolina Health Care System and the Board of Visitors of the Kenan-Flagler Business School (University of North Carolina at Chapel Hill). He also served as Vice President of Finance for the University of North Carolina (16-school system, 1995-1998). |
Cornelia M. Small (60) |
| Year of Election or Appointment: 2005 Ms. Small is a member (2000) and Chairperson (2002) of the Investment Committee, and a member (2002) of the Board of Trustees of Smith College. Previously, she served as Chief Investment Officer (1999-2000), Director of Global Equity Investments (1996-1999), and a member of the Board of Directors of Scudder, Stevens & Clark (1990-1997) and Scudder Kemper Investments (1997-1998). In addition, Ms. Small served as Co-Chair (2000-2003) of the Annual Fund for the Fletcher School of Law and Diplomacy. |
William S. Stavropoulos (65) |
| Year of Election or Appointment: 2002 Mr. Stavropoulos is Chairman of the Board (2000), CEO (2002), a position he previously held from 1995-2000, Chairman of the Executive Committee (2000), and a Member of the Board of Directors of The Dow Chemical Company. Since joining The Dow Chemical Company in 1967, Mr. Stavropoulos served in numerous senior management positions, including President (1993-2000; 2002-2003). Currently, he is a Director of NCR Corporation (data warehousing and technology solutions), BellSouth Corporation (telecommunications), Chemical Financial Corporation, and Maersk Inc. (industrial conglomerate, 2002). He also serves as a member of the Board of Trustees of the American Enterprise Institute for Public Policy Research. In addition, Mr. Stavropoulos is a member of The Business Council, J.P. Morgan International Council and the University of Notre Dame Advisory Council for the College of Science. |
Kenneth L. Wolfe (65) |
| Year of Election or Appointment: 2005 Mr. Wolfe also serves as a Trustee (2005) or Member of the Advisory Board (2004) of other investment companies advised by FMR. Prior to his retirement in 2001, Mr. Wolfe was Chairman and Chief Executive Officer of Hershey Foods Corporation (1993-2001). He currently serves as a member of the boards of Adelphia Communications Corporation (2003), Bausch & Lomb, Inc., and Revlon Inc. (2004). |
Advisory Board Member and Executive Officers:
Correspondence intended for each executive officer and Mr. Lynch may be sent to Fidelity Investments, 82 Devonshire Street, Boston, Massachusetts 02109.
Name, Age; Principal Occupation |
Peter S. Lynch (61) |
| Year of Election or Appointment: 2003 Member of the Advisory Board of Variable Insurance Products III. Vice Chairman and a Director of FMR, and Vice Chairman (2001) and a Director (2000) of FMR Co., Inc. Previously, Mr. Lynch served as a Trustee of the Fidelity funds (1990-2003). Prior to May 31, 1990, he was a Director of FMR and Executive Vice President of FMR (a position he held until March 31, 1991), Vice President of Fidelity® Magellan® Fund and FMR Growth Group Leader, and Managing Director of FMR Corp. Mr. Lynch was also Vice President of Fidelity Investments Corporate Services. In addition, he serves as a Trustee of Boston College, Massachusetts Eye & Ear Infirmary, Historic Deerfield, John F. Kennedy Library, and the Museum of Fine Arts of Boston. |
John B. McDowell (46) |
| Year of Election or Appointment: 2002 Vice President of VIP Dynamic Capital Appreciation. Mr. McDowell also serves as Vice President of certain Equity Funds (2002). He is Senior Vice President of FMR (1999), FMR Co., Inc. (2001), and Fidelity Management Trust Company (FMTC). Since joining Fidelity Investments in 1985, Mr. McDowell has worked as a research analyst and manager. |
John R. Porter (37) |
| Year of Election or Appointment: 2004 Vice President of VIP Dynamic Capital Appreciation. Mr. Porter also serves as Vice President of another fund advised by FMR. Prior to assuming his current responsibilities, Mr. Porter managed a variety of Fidelity funds. Mr. Porter also serves as Vice President of FMR (2004) and FMR Co., Inc. (2004). |
Eric D. Roiter (56) |
| Year of Election or Appointment: 1998 Secretary of VIP Dynamic Capital Appreciation. He also serves as Secretary of other Fidelity funds; Vice President, General Counsel, and Secretary of FMR Co., Inc. (2001-present) and FMR; Vice President and Secretary of FDC; Assistant Secretary of Fidelity Management & Research (U.K.) Inc. (2001-present), Fidelity Management & Research (Far East) Inc. (2001-present), of Fidelity Investments Money Management, Inc. (2001-present). Mr. Roiter is an Adjunct Member, Faculty of Law, at Boston College Law School (2003-present). |
Stuart Fross (45) |
| Year of Election or Appointment: 2003 Assistant Secretary of VIP Dynamic Capital Appreciation. Mr. Fross also serves as Assistant Secretary of other Fidelity funds (2003) and is an employee of FMR. |
Christine Reynolds (46) |
| Year of Election or Appointment: 2004 President, Treasurer, and Anti-Money Laundering (AML) officer of VIP Dynamic Capital Appreciation. Ms. Reynolds also serves as President, Treasurer, and AML officer of other Fidelity funds (2004) and is a Vice President (2003) and an employee (2002) of FMR. Before joining Fidelity Investments, Ms. Reynolds worked at PricewaterhouseCoopers LLP (PwC) (1980-2002), where she was most recently an audit partner with PwC's investment management practice. |
Timothy F. Hayes (54) |
| Year of Election or Appointment: 2002 Chief Financial Officer of VIP Dynamic Capital Appreciation. Mr. Hayes also serves as Chief Financial Officer of other Fidelity funds (2002). Recently he was appointed President of Fidelity Service Company (2003) where he also serves as a Director. Mr. Hayes also serves as President of Fidelity Investments Operations Group (FIOG, 2002), which includes Fidelity Pricing and Cash Management Services Group (FPCMS), where he was appointed President in 1998. Previously, Mr. Hayes served as Chief Financial Officer of Fidelity Investments Corporate Systems and Service Group (1998) and Fidelity Systems Company (1997-1998). |
Kenneth A. Rathgeber (57) |
| Year of Election or Appointment: 2004 Chief Compliance Officer of VIP Dynamic Capital Appreciation. Mr. Rathgeber also serves as Chief Compliance Officer of other Fidelity funds (2004) and Executive Vice President of Risk Oversight for Fidelity Investments (2002). Previously, he served as Executive Vice President and Chief Operating Officer for Fidelity Investments Institutional Services Company, Inc. (1998-2002). |
John R. Hebble (46) |
| Year of Election or Appointment: 2003 Deputy Treasurer of VIP Dynamic Capital Appreciation. Mr. Hebble also serves as Deputy Treasurer of other Fidelity funds (2003), and is an employee of FMR. Before joining Fidelity Investments, Mr. Hebble worked at Deutsche Asset Management where he served as Director of Fund Accounting (2002-2003) and Assistant Treasurer of the Scudder Funds (1998-2003). |
Kimberley H. Monasterio (41) |
| Year of Election or Appointment: 2004 Deputy Treasurer of VIP Dynamic Capital Appreciation. Ms. Monasterio also serves as Deputy Treasurer of other Fidelity funds (2004) and is an employee of FMR (2004). Before joining Fidelity Investments, Ms. Monasterio served as Treasurer (2000-2004) and Chief Financial Officer (2002-2004) of the Franklin Templeton Funds and Senior Vice President of Franklin Templeton Services, LLC (2000-2004). |
John H. Costello (58) |
| Year of Election or Appointment: 2000 Assistant Treasurer of VIP Dynamic Capital Appreciation. Mr. Costello also serves as Assistant Treasurer of other Fidelity funds and is an employee of FMR. |
Peter L. Lydecker (50) |
| Year of Election or Appointment: 2004 Assistant Treasurer of VIP Dynamic Capital Appreciation. Mr. Lydecker also serves as Assistant Treasurer of other Fidelity funds (2004) and is an employee of FMR. |
Mark Osterheld (49) |
| Year of Election or Appointment: 2002 Assistant Treasurer of VIP Dynamic Capital Appreciation. Mr. Osterheld also serves as Assistant Treasurer of other Fidelity funds (2002) and is an employee of FMR. |
Kenneth B. Robins (35) |
| Year of Election or Appointment: 2004 Assistant Treasurer of VIP Dynamic Capital Appreciation. Mr. Robins also serves as Assistant Treasurer of other Fidelity funds (2004) and is an employee of FMR (2004). Before joining Fidelity Investments, Mr. Robins worked at KPMG LLP, where he was a partner in KPMG's department of professional practice (2002-2004) and a Senior Manager (1999-2000). In addition, Mr. Robins served as Assistant Chief Accountant, United States Securities and Exchange Commission (2000-2002). |
Annual Report
A special meeting of the Variable Insurance Products Fund III shareholders was held on December 14, 2004. The results of votes taken among shareholders on proposals before them are reported below. Each vote reported represents one dollar of net asset value held on the record date for the meeting.
PROPOSAL 1 |
To amend the Declaration of Trust to allow the Board of Trustees, if permitted by applicable law, to authorize fund mergers without shareholder approval. A |
| # of
Votes | % of
Votes |
Affirmative | 4,465,365,699.61 | 80.317 |
Against | 820,718,849.73 | 14.762 |
Abstain | 273,620,539.56 | 4.921 |
TOTAL | 5,559,705,088.90 | 100.000 |
PROPOSAL 2 |
To elect a Board of Trustees. A |
| # of
Votes | % of
Votes |
J. Michael Cook |
Affirmative | 5,275,527,318.06 | 94.889 |
Withheld | 284,177,770.84 | 5.111 |
TOTAL | 5,559,705,088.90 | 100.000 |
Ralph F. Cox |
Affirmative | 5,260,941,793.66 | 94.626 |
Withheld | 298,763,295.24 | 5.374 |
TOTAL | 5,559,705,088.90 | 100.000 |
Laura B. Cronin |
Affirmative | 5,275,571,233.79 | 94.889 |
Withheld | 284,133,855.11 | 5.111 |
TOTAL | 5,559,705,088.90 | 100.000 |
Dennis J. Dirks B |
Affirmative | 5,277,234,059.51 | 94.919 |
Withheld | 282,471,029.39 | 5.081 |
TOTAL | 5,559,705,088.90 | 100.000 |
Robert M. Gates |
Affirmative | 5,271,693,384.06 | 94.820 |
Withheld | 288,011,704.84 | 5.180 |
TOTAL | 5,559,705,088.90 | 100.000 |
George H. Heilmeier |
Affirmative | 5,276,712,546.15 | 94.910 |
Withheld | 282,992,542.75 | 5.090 |
TOTAL | 5,559,705,088.90 | 100.000 |
Abigail P. Johnson |
Affirmative | 5,265,412,678.20 | 94.707 |
Withheld | 294,292,410.70 | 5.293 |
TOTAL | 5,559,705,088.90 | 100.000 |
Edward C. Johnson 3d |
Affirmative | 5,252,813,997.03 | 94.480 |
Withheld | 306,891,091.87 | 5.520 |
TOTAL | 5,559,705,088.90 | 100.000 |
| # of
Votes | % of
Votes |
Donald J. Kirk |
Affirmative | 5,268,337,458.03 | 94.759 |
Withheld | 291,367,630.87 | 5.241 |
TOTAL | 5,559,705,088.90 | 100.000 |
Marie L. Knowles |
Affirmative | 5,278,993,264.93 | 94.951 |
Withheld | 280,711,823.97 | 5.049 |
TOTAL | 5,559,705,088.90 | 100.000 |
Ned C. Lautenbach |
Affirmative | 5,280,591,428.18 | 94.980 |
Withheld | 279,113,660.72 | 5.020 |
TOTAL | 5,559,705,088.90 | 100.000 |
Marvin L. Mann |
Affirmative | 5,266,769,335.50 | 94.731 |
Withheld | 292,935,753.40 | 5.269 |
TOTAL | 5,559,705,088.90 | 100.000 |
William O. McCoy |
Affirmative | 5,270,804,685.62 | 94.804 |
Withheld | 288,900,403.28 | 5.196 |
TOTAL | 5,559,705,088.90 | 100.000 |
Robert L. Reynolds |
Affirmative | 5,279,190,479.65 | 94.955 |
Withheld | 280,514,609.25 | 5.045 |
TOTAL | 5,559,705,088.90 | 100.000 |
Cornelia M. Small B |
Affirmative | 5,276,074,654.01 | 94.898 |
Withheld | 283,630,434.89 | 5.102 |
TOTAL | 5,559,705,088.90 | 100.000 |
William S. Stavropoulos |
Affirmative | 5,278,183,775.21 | 94.936 |
Withheld | 281,521,313.69 | 5.064 |
TOTAL | 5,559,705,088.90 | 100.000 |
A Denotes trust-wide proposals and voting results. B Effective January 1, 2005. |
Dynamic Capital Appreciation Portfolio
Annual Report
Dynamic Capital Appreciation Portfolio
Annual Report
Investment Adviser
Fidelity Management & Research Company
Boston, MA
Investment Sub-Advisers
FMR Co., Inc.
Fidelity Management & Research (U.K.) Inc.
Fidelity Management & Research (Far East) Inc.
Fidelity Investments Japan Limited
Fidelity International Investment Advisors
Fidelity International Investment Advisors (U.K.) Limited
General Distributor
Fidelity Distributors Corporation
Boston, MA
Transfer and Shareholder Servicing Agent
Fidelity Investments Institutional Operations Company, Inc.
Boston, MA
Custodian
State Street Bank and Trust Company
Quincy, MA
VIPDCA-ANN-0205
1.751799.104
Fidelity® Variable Insurance Products:
Growth & Income Portfolio
Annual Report
December 31, 2004
(2_fidelity_logos)(Registered_Trademark)
Contents
Performance | 3 | How the fund has done over time. |
Management's Discussion | 4 | The manager's review of fund performance, strategy and outlook. |
Shareholder Expense Example | 5 | An example of shareholder expenses. |
Investment Summary | 6 | A summary of the fund's investments at period end. |
Investments | 7 | A complete list of the fund's investments with their
market values. |
Financial Statements | 9 | Statements of assets and liabilities, operations, and
changes in net assets, as well as financial highlights. |
Notes | 13 | Notes to the financial statements. |
Report of Independent Registered Public Accounting Firm | 16 | |
Trustees and Officers | 17 | |
Distributions | 22 | |
Proxy Voting Results | 23 | |
| | |
To view a fund's proxy voting guidelines and proxy voting record for the 12-month period ended June 30, visit www.fidelity.com/proxyvotingresults or visit the Securities and Exchange Commission's (SEC) web site at www.sec.gov. You may also call 1-800-544-5429 to request a free copy of the proxy voting guidelines.
Fidelity Variable Insurance Products are separate account options which are purchased through a variable insurance contract.
Standard & Poor's, S&P and S&P 500 are registered service marks of The McGraw-Hill Companies, Inc. and have been licensed for use by Fidelity Distributors Corporation.
Other third party marks appearing herein are the property of their respective owners.
All other marks appearing herein are registered or unregistered trademarks or service marks of FMR Corp. or an affiliated company.
(Recycle graphic) This report is printed on recycled paper using soy-based inks.
This report and the financial statements contained herein are submitted for the general information of the shareholders of the fund. This report is not authorized for distribution to prospective investors in the fund unless preceded or accompanied by an effective prospectus.
A fund files its complete schedule of portfolio holdings with the SEC for the first and third quarters of each fiscal year on Form N-Q. Forms N-Q are available on the SEC's web site at http://www.sec.gov. A fund's Forms N-Q may be reviewed and copied at the SEC's Public Reference Room in Washington, DC. Information regarding the operation of the SEC's Public Reference Room may be obtained by calling 1-800-SEC-0330. For a complete list of a fund's portfolio holdings, view the most recent quarterly holdings report, semiannual report, or annual report on Fidelity's web site at http://www.advisor.fidelity.com.
NOT FDIC INSURED · MAY LOSE VALUE · NO BANK GUARANTEE
Neither the fund nor Fidelity Distributors Corporation is a bank.
Growth & Income Portfolio
Fidelity Variable Insurance Products: Growth & Income Portfolio
Performance: The Bottom Line
Average annual total return reflects the change in the value of an investment, assuming reinvestment of the class' dividend income and capital gains (the profits earned upon the sale of securities that have grown in value) and assuming a constant rate of performance each year. The $10,000 table and the fund's returns do not reflect the deduction of taxes that a shareholder would pay on fund distributions or the redemption of fund shares. During periods of reimbursement by Fidelity, a fund's total return will be greater than it would be had the reimbursement not occurred. Performance numbers are net of all underlying fund operating expenses, but do not include any insurance charges imposed by your insurance company's separate account. If performance information included the effect of these additional charges, the total returns would have been lower. How a fund did yesterday is no guarantee of how it will do tomorrow.
Average Annual Total Returns
Periods ended December 31, 2004 | Past 1
year | Past 5
years | Life of fund A |
Fidelity® VIP: Growth & Income - Initial Class | 5.80% | -0.80% | 7.24% |
Fidelity VIP: Growth & Income - Service Class B | 5.75% | -0.90% | 7.13% |
Fidelity VIP: Growth & Income - Service Class 2 C | 5.52% | -1.06% | 7.02% |
A From December 31, 1996.
B The initial offering of Service Class shares took place on November 3, 1997. Performance for Service Class shares reflects an asset based distribution fee (12b-1 fee), and returns prior to November 3, 1997 are those of Initial Class and do not include the effects of Service Class' 12b-1 fee. Had Service Class shares' 12b-1 fee been reflected, returns prior to November 3, 1997 would have been lower.
C The initial offering of Service Class 2 shares took place on January 12, 2000. Performance for Service Class 2 shares reflects an asset based distribution fee (12b-1 fee). Returns from November 3, 1997 to January 12, 2000 are those of Service Class which reflect a different 12b-1 fee. Service Class 2 returns prior to November 3, 1997 are those of the Initial Class and do not include the effects of a 12b-1 fee. Had Service Class 2's 12b-1 fee been reflected, returns prior to January 12, 2000 would have been lower.
$10,000 Over Life of Fund
Let's say hypothetically that $10,000 was invested in Fidelity® Variable Insurance Products: Growth & Income Portfolio - Initial Class on December 31, 1996, when the fund started. The chart shows how the value of your investment would have changed, and also shows how the Standard & Poor's 500SM Index performed over the same period.

Annual Report
Fidelity Variable Insurance Products: Growth & Income Portfolio
Management's Discussion of Fund Performance
Comments from Louis Salemy, Portfolio Manager of Fidelity® Variable Insurance Products: Growth & Income Portfolio
The year ending December 31, 2004, generally was positive for equity investors, as many stock market benchmarks produced double-digit gains. Broad-based themes included the continued dominance of small-cap stocks, which outperformed large-caps for the sixth consecutive year. The small-cap Russell 2000® Index was up 18.33% in 2004, while the larger-cap Standard & Poor's 500SM Index rose 10.88%. Value stocks ended the year well ahead of growth stocks: The Russell 3000® Value Index advanced 16.94%, compared to 6.93% for the Russell 3000 Growth Index. Energy and basic materials stocks led the market upward. Energy stocks were boosted by record-high oil prices, while strong demand from China helped support commodity prices. The health care sector was among the market's weakest performers. Technology also fell off the pace, though it was helped by a rally late in the year. The tech-heavy NASDAQ Composite® Index returned 9.15%, thanks primarily to a 14.87% jump in the fourth quarter. Elsewhere, the Dow Jones Industrial AverageSM gained 5.37% for the year.
For the 12 months ending December 31, 2004, the fund's return was slightly more than half of the 10.88% return posted by the S&P 500®. The fund also finished well behind the LipperSM Variable Annuity Growth & Income Funds Average, which returned 11.14%. A significant overweighting in the media industry hurt performance versus the index. One media detractor, EchoStar Communications, was the victim of fears about competition from rival satellite TV providers and from the cable industry. Diversified financials was another weak group for the fund compared with the index. For example, top-10 holdings Morgan Stanley and Merrill Lynch both were sidetracked by investors' concerns about the impact of rising interest rates on future business. On the other hand, my decision to underweight both information technology and health care helped relative performance. In consumer staples, razor manufacturer Gillette was a significant contributor both in absolute terms and compared with the index. The introduction of a number of popular products helped the stock. Verizon Communications also aided performance, boosted by a regulatory change that enabled the company to charge higher rates for leasing its network to competitors.
The views expressed in this statement reflect those of the portfolio manager only through the end of the period of the report as stated on the cover and do not necessarily represent the views of Fidelity or any other person in the Fidelity organization. Any such views are subject to change at any time based upon market or other conditions and Fidelity disclaims any responsibility to update such views. These views may not be relied on as investment advice and, because investment decisions for a Fidelity fund are based on numerous factors, may not be relied on as an indication of trading intent on behalf of any Fidelity fund.
Growth & Income Portfolio
Fidelity Variable Insurance Products: Growth & Income Portfolio
Shareholder Expense Example
As a shareholder of the Fund, you incur two types of costs: (1) transaction costs, and (2) ongoing costs, including management fees, distribution and/or service (12b-1) fees and other Fund expenses. This Example is intended to help you understand your ongoing costs (in dollars) of investing in the Fund and to compare these costs with the ongoing costs of investing in other mutual funds.
The Example is based on an investment of $1,000 invested at the beginning of the period and held for the entire period (July 1, 2004 to December 31, 2004).
Actual Expenses
The first line of the table below for each class of the Fund provides information about actual account values and actual expenses. You may use the information in this line, together with the amount you invested, to estimate the expenses that you paid over the period. Simply divide your account value by $1,000.00 (for example, an $8,600 account value divided by $1,000.00 = 8.6), then multiply the result by the number in the first line for a class of the Fund under the heading entitled "Expenses Paid During Period" to estimate the expenses you paid on your account during this period. The estimate of expenses does not include any fees or other expenses of any variable annuity or variable life insurance product. If they were, the estimate of expenses you paid during the period would be higher, and your ending account value would be lower.
Hypothetical Example for Comparison Purposes
The second line of the table below for each class of the Fund provides information about hypothetical account values and hypothetical expenses based on a Class' actual expense ratio and an assumed rate of return of 5% per year before expenses, which is not the Class' actual return. The hypothetical account values and expenses may not be used to estimate the actual ending account balance or expenses you paid for the period. You may use this information to compare the ongoing costs of investing in the Fund and other funds. To do so, compare this 5% hypothetical example with the 5% hypothetical examples that appear in the shareholder reports of the other funds. The estimate of expenses does not include any fees or other expenses of any variable annuity or variable life insurance product. If they were, the estimate of expenses you paid during the period would be higher, and your ending account value would be lower.
Please note that the expenses shown in the table are meant to highlight your ongoing costs only and do not reflect any transaction costs. Therefore, the second line of the table is useful in comparing ongoing costs only, and will not help you determine the relative total costs of owning different funds.
| Beginning
Account Value
July 1, 2004 | Ending
Account Value
December 31, 2004 | Expenses Paid
During Period*
July 1, 2004
to December 31, 2004 |
Initial Class | | | |
Actual | $ 1,000.00 | $ 1,058.60 | $ 3.21 |
HypotheticalA | $ 1,000.00 | $ 1,022.02 | $ 3.15 |
Service Class | | | |
Actual | $ 1,000.00 | $ 1,059.00 | $ 3.73 |
HypotheticalA | $ 1,000.00 | $ 1,021.52 | $ 3.66 |
Service Class 2 | | | |
Actual | $ 1,000.00 | $ 1,057.90 | $ 4.50 |
HypotheticalA | $ 1,000.00 | $ 1,020.76 | $ 4.42 |
A 5% return per year before expenses
* Expenses are equal to each Class' annualized expense ratio (shown in the table below); multiplied by the average account value over the
period, multiplied by 184/366 (to reflect the one-half year period).
| Annualized
Expense Ratio |
Initial Class | .62% |
Service Class | .72% |
Service Class 2 | .87% |
Annual Report
Fidelity Variable Insurance Products: Growth & Income Portfolio
Investment Summary
Top Five Stocks as of December 31, 2004 |
| % of fund's
net assets |
EchoStar Communications Corp. Class A | 8.1 |
Omnicom Group, Inc. | 7.4 |
BellSouth Corp. | 5.4 |
Morgan Stanley | 5.2 |
Wells Fargo & Co. | 4.9 |
| 31.0 |
Top Five Market Sectors as of December 31, 2004 |
| % of fund's
net assets |
Consumer Discretionary | 22.7 |
Financials | 22.5 |
Consumer Staples | 14.0 |
Telecommunication Services | 12.0 |
Information Technology | 5.9 |
Asset Allocation as of December 31, 2004 |
% of fund's net assets* |
 | Stocks | 90.5% | |
 | Short-Term
Investments and
Net Other Assets | 9.5% | |

Growth & Income Portfolio
Fidelity Variable Insurance Products: Growth & Income Portfolio
Investments December 31, 2004
Showing Percentage of Net Assets
Common Stocks - 90.5% |
| Shares | | Value (Note 1) |
CONSUMER DISCRETIONARY - 22.7% |
Hotels, Restaurants & Leisure - 0.5% |
Carnival Corp. unit | 152,200 | | $ 8,771,286 |
Media - 18.9% |
E.W. Scripps Co. Class A | 696,300 | | 33,617,364 |
EchoStar Communications Corp. Class A | 3,995,800 | | 132,820,391 |
News Corp. Class B (d) | 1,111,400 | | 21,338,880 |
Omnicom Group, Inc. | 1,426,200 | | 120,257,184 |
| | 308,033,819 |
Multiline Retail - 2.6% |
Kohl's Corp. (a) | 869,800 | | 42,768,066 |
Textiles, Apparel & Luxury Goods - 0.7% |
Liz Claiborne, Inc. | 205,800 | | 8,686,818 |
Reebok International Ltd. | 57,800 | | 2,543,200 |
| | 11,230,018 |
TOTAL CONSUMER DISCRETIONARY | | 370,803,189 |
CONSUMER STAPLES - 14.0% |
Beverages - 0.9% |
The Coca-Cola Co. | 333,900 | | 13,900,257 |
Food & Staples Retailing - 6.4% |
Costco Wholesale Corp. | 493,700 | | 23,900,017 |
Wal-Mart Stores, Inc. | 1,110,000 | | 58,630,200 |
Walgreen Co. | 584,100 | | 22,411,917 |
| | 104,942,134 |
Food Products - 0.5% |
McCormick & Co., Inc. (non-vtg.) | 224,100 | | 8,650,260 |
Household Products - 2.6% |
Colgate-Palmolive Co. | 224,900 | | 11,505,884 |
Kimberly-Clark Corp. | 465,900 | | 30,660,879 |
| | 42,166,763 |
Personal Products - 2.2% |
Gillette Co. | 806,400 | | 36,110,592 |
Tobacco - 1.4% |
Altria Group, Inc. | 377,960 | | 23,093,356 |
TOTAL CONSUMER STAPLES | | 228,863,362 |
ENERGY - 4.6% |
Oil & Gas - 4.6% |
BP PLC sponsored ADR | 382,200 | | 22,320,480 |
Exxon Mobil Corp. | 1,035,756 | | 53,092,853 |
| | 75,413,333 |
FINANCIALS - 22.5% |
Capital Markets - 12.2% |
Goldman Sachs Group, Inc. | 451,000 | | 46,922,040 |
Merrill Lynch & Co., Inc. | 1,126,200 | | 67,312,974 |
Morgan Stanley | 1,526,000 | | 84,723,520 |
| | 198,958,534 |
|
| Shares | | Value (Note 1) |
Commercial Banks - 4.9% |
Wells Fargo & Co. | 1,287,700 | | $ 80,030,555 |
Consumer Finance - 0.9% |
American Express Co. | 269,700 | | 15,202,989 |
Insurance - 4.5% |
Allstate Corp. | 335,300 | | 17,341,716 |
American International Group, Inc. | 547,605 | | 35,961,220 |
PartnerRe Ltd. | 111,600 | | 6,912,504 |
St. Paul Travelers Companies, Inc. | 338,239 | | 12,538,520 |
| | 72,753,960 |
TOTAL FINANCIALS | | 366,946,038 |
HEALTH CARE - 1.5% |
Health Care Equipment & Supplies - 0.6% |
Advanced Medical Optics, Inc. (a) | 1 | | 41 |
Alcon, Inc. | 126,600 | | 10,203,960 |
| | 10,204,001 |
Pharmaceuticals - 0.9% |
Pfizer, Inc. | 504,900 | | 13,576,761 |
TOTAL HEALTH CARE | | 23,780,762 |
INDUSTRIALS - 4.3% |
Aerospace & Defense - 0.9% |
Lockheed Martin Corp. | 115,500 | | 6,416,025 |
Northrop Grumman Corp. | 169,300 | | 9,203,148 |
| | 15,619,173 |
Airlines - 0.5% |
Continental Airlines, Inc. Class B (a)(d) | 589,900 | | 7,987,246 |
Industrial Conglomerates - 2.3% |
General Electric Co. | 1,024,700 | | 37,401,550 |
Road & Rail - 0.6% |
Union Pacific Corp. | 136,200 | | 9,159,450 |
TOTAL INDUSTRIALS | | 70,167,419 |
INFORMATION TECHNOLOGY - 5.9% |
Communications Equipment - 1.5% |
Cisco Systems, Inc. (a) | 1,282,200 | | 24,746,460 |
Foundry Networks, Inc. (a) | 300 | | 3,948 |
Lucent Technologies, Inc. warrants 12/10/07 (a) | 7,882 | | 12,454 |
| | 24,762,862 |
Computers & Peripherals - 0.7% |
Diebold, Inc. | 192,200 | | 10,711,306 |
IT Services - 0.5% |
Paychex, Inc. | 241,819 | | 8,241,192 |
Software - 3.2% |
Microsoft Corp. | 1,972,300 | | 52,680,133 |
TOTAL INFORMATION TECHNOLOGY | | 96,395,493 |
Common Stocks - continued |
| Shares | | Value (Note 1) |
MATERIALS - 2.6% |
Containers & Packaging - 2.6% |
Ball Corp. | 12 | | $ 528 |
Packaging Corp. of America | 186,400 | | 4,389,720 |
Smurfit-Stone Container Corp. (a) | 2,014,600 | | 37,632,728 |
| | 42,022,976 |
TELECOMMUNICATION SERVICES - 12.0% |
Diversified Telecommunication Services - 12.0% |
BellSouth Corp. | 3,183,000 | | 88,455,570 |
SBC Communications, Inc. | 1,079,230 | | 27,811,757 |
Verizon Communications, Inc. | 1,949,500 | | 78,974,245 |
| | 195,241,572 |
UTILITIES - 0.4% |
Electric Utilities - 0.4% |
Entergy Corp. | 103,300 | | 6,982,047 |
TOTAL COMMON STOCKS (Cost $1,277,038,401) | 1,476,616,191 |
Money Market Funds - 10.7% |
| | | |
Fidelity Cash Central Fund, 2.24% (b) | 161,471,258 | | 161,471,258 |
Fidelity Securities Lending Cash Central Fund, 2.23% (b)(c) | 12,948,350 | | 12,948,350 |
TOTAL MONEY MARKET FUNDS (Cost $174,419,608) | 174,419,608 |
TOTAL INVESTMENT PORTFOLIO - 101.2% (Cost $1,451,458,009) | 1,651,035,799 |
NET OTHER ASSETS - (1.2)% | (19,680,273) |
NET ASSETS - 100% | $ 1,631,355,526 |
Legend |
(a) Non-income producing |
(b) Affiliated fund that is available only to investment companies and other accounts managed by Fidelity Investments. The rate quoted is the annualized seven-day yield of the fund at period end. A complete listing of the fund's holdings as of its most recent fiscal year end is available upon request. |
(c) Includes investment made with cash collateral received from securities on loan. |
(d) Security or a portion of the security is on loan at period end. |
Income Tax Information |
At December 31, 2004, the fund had a capital loss carryforward of approximately $160,503,000 of which $43,339,000, $107,381,000 and $9,783,000 will expire on December 31, 2009, 2010 and 2011, respectively. |
See accompanying notes which are an integral part of the financial statements.
Growth & Income Portfolio
Fidelity Variable Insurance Products: Growth & Income Portfolio
Financial Statements
Statement of Assets and Liabilities
| | |
Assets | | |
Investment in securities, at value (including securities loaned of $12,563,366) (cost $1,451,458,009) - See accompanying schedule | | $ 1,651,035,799 |
Receivable for fund shares sold | | 272,381 |
Dividends receivable | | 1,342,776 |
Interest receivable | | 290,188 |
Prepaid expenses | | 5,942 |
Other receivables | | 28,890 |
Total assets | | 1,652,975,976 |
| | |
Liabilities | | |
Payable for investments purchased | $ 6,520,610 | |
Payable for fund shares redeemed | 964,642 | |
Accrued management fee | 640,386 | |
Distribution fees payable | 141,068 | |
Other affiliated payables | 134,368 | |
Other payables and accrued expenses | 271,026 | |
Collateral on securities loaned, at value | 12,948,350 | |
Total liabilities | | 21,620,450 |
| | |
Net Assets | | $ 1,631,355,526 |
Net Assets consist of: | | |
Paid in capital | | $ 1,572,421,991 |
Undistributed net investment income | | 22,467,135 |
Accumulated undistributed net realized gain (loss) on investments and foreign currency transactions | | (163,111,390) |
Net unrealized appreciation (depreciation) on investments | | 199,577,790 |
Net Assets | | $ 1,631,355,526 |
| | |
Initial Class:
Net Asset Value, offering price and redemption price per share ($704,460,084 ÷ 50,633,218 shares) | | $ 13.91 |
| | |
Service Class:
Net Asset Value, offering price and redemption price per share ($401,391,858 ÷ 29,031,870 shares) | | $ 13.83 |
| | |
Service Class 2:
Net Asset Value, offering price and redemption price per share ($525,503,584 ÷ 38,322,628 shares) | | $ 13.71 |
Statement of Operations
Year ended December 31, 2004 |
| | |
Investment Income | | |
Dividends | | $ 25,677,482 |
Special Dividends | | 5,800,800 |
Interest | | 2,003,713 |
Security lending | | 101,220 |
Total income | | 33,583,215 |
| | |
Expenses | | |
Management fee | $ 7,335,808 | |
Transfer agent fees | 1,038,668 | |
Distribution fees | 1,462,923 | |
Accounting and security lending fees | 513,242 | |
Non-interested trustees' compensation | 8,453 | |
Custodian fees and expenses | 21,660 | |
Audit | 48,079 | |
Legal | 4,658 | |
Miscellaneous | 360,754 | |
Total expenses before reductions | 10,794,245 | |
Expense reductions | (105,306) | 10,688,939 |
Net investment income (loss) | | 22,894,276 |
Realized and Unrealized Gain (Loss) Net realized gain (loss) on: | | |
Investment securities | 6,143,736 | |
Foreign currency transactions | (11,098) | |
Total net realized gain (loss) | | 6,132,638 |
Change in net unrealized appreciation (depreciation) on investment securities | | 59,376,943 |
Net gain (loss) | | 65,509,581 |
Net increase (decrease) in net assets resulting from operations | | $ 88,403,857 |
See accompanying notes which are an integral part of the financial statements.
Annual Report
Fidelity Variable Insurance Products: Growth & Income Portfolio
Financial Statements - continued
Statement of Changes in Net Assets
| Year ended
December 31,
2004 | Year ended
December 31,
2003 |
Increase (Decrease) in Net Assets | | |
Operations | | |
Net investment income (loss) | $ 22,894,276 | $ 11,563,948 |
Net realized gain (loss) | 6,132,638 | (8,957,165) |
Change in net unrealized appreciation (depreciation) | 59,376,943 | 256,023,394 |
Net increase (decrease) in net assets resulting from operations | 88,403,857 | 258,630,177 |
Distributions to shareholders from net investment income | (12,447,351) | (12,772,749) |
Share transactions - net increase (decrease) | 70,330,734 | 210,037,372 |
Total increase (decrease) in net assets | 146,287,240 | 455,894,800 |
| | |
Net Assets | | |
Beginning of period | 1,485,068,286 | 1,029,173,486 |
End of period (including undistributed net investment income of $22,467,135 and undistributed net investment income of $12,027,562, respectively) | $ 1,631,355,526 | $ 1,485,068,286 |
Other Information: | | | |
| Year ended December 31, 2004 |
Share Transactions | Initial Class | Service Class | Service Class 2 |
Shares Sold | 2,753,905 | 2,759,500 | 13,125,821 |
Reinvested | 498,736 | 216,142 | 212,315 |
Redeemed | (11,869,073) | (1,077,681) | (1,149,269) |
Net increase (decrease) | (8,616,432) | 1,897,961 | 12,188,867 |
| | | |
Dollars Sold | $ 36,538,808 | $ 36,240,477 | $ 171,074,614 |
Reinvested | 6,722,963 | 2,898,471 | 2,825,917 |
Redeemed | (156,807,050) | (14,210,796) | (14,952,670) |
Net increase (decrease) | $ (113,545,279) | $ 24,928,152 | $ 158,947,861 |
| | | |
| Year ended December 31, 2003 |
Share Transactions | Initial Class | Service Class | Service Class 2 |
Shares Sold | 8,588,135 | 4,730,597 | 14,305,974 |
Reinvested | 791,445 | 298,276 | 164,516 |
Redeemed | (8,881,933) | (1,062,769) | (1,468,648) |
Net increase (decrease) | 497,647 | 3,966,104 | 13,001,842 |
| | | |
Dollars Sold | $ 102,662,499 | $ 56,731,473 | $ 170,921,383 |
Reinvested | 8,080,656 | 3,030,479 | 1,661,614 |
Redeemed | (103,784,385) | (12,033,144) | (17,233,203) |
Net increase (decrease) | $ 6,958,770 | $ 47,728,808 | $ 155,349,794 |
| | | |
Distributions | Year ended December 31, 2004 |
| Initial Class | Service Class | Service Class 2 |
From net investment income | $ 6,722,963 | $ 2,898,471 | $ 2,825,917 |
| | | |
| Year ended December 31, 2003 |
| Initial Class | Service Class | Service Class 2 |
From net investment income | $ 8,080,656 | $ 3,030,479 | $ 1,661,614 |
See accompanying notes which are an integral part of the financial statements.
Growth & Income Portfolio
Financial Highlights - Initial Class
Years ended December 31, | 2004 | 2003 | 2002 | 2001 | 2000 |
Selected Per-Share Data | | | | | |
Net asset value, beginning of period | $ 13.26 | $ 10.86 | $ 13.19 | $ 15.26 | $ 17.30 |
Income from Investment Operations | | | | | |
Net investment income (loss)C | .21D | .12 | .15 | .18 | .20 |
Net realized and unrealized gain (loss) | .56 | 2.42 | (2.32) | (1.45) | (.81) |
Total from investment operations | .77 | 2.54 | (2.17) | (1.27) | (.61) |
Distributions from net investment income | (.12) | (.14) | (.16) | (.19) | (.19) |
Distributions from net realized gain | - | - | - | (.61) | (1.24) |
Total distributions | (.12) | (.14) | (.16) | (.80) | (1.43) |
Net asset value, end of period | $ 13.91 | $ 13.26 | $ 10.86 | $ 13.19 | $ 15.26 |
Total ReturnA,B | 5.80% | 23.77% | (16.61)% | (8.75)% | (3.62)% |
Ratios to Average Net AssetsE | | | | | |
Expenses before expense reductions | .60% | .59% | .59% | .58% | .58% |
Expenses net of voluntary waivers, if any | .60% | .59% | .59% | .58% | .58% |
Expenses net of all reductions | .60% | .59% | .58% | .56% | .57% |
Net investment income (loss) | 1.58% | 1.02% | 1.30% | 1.34% | 1.26% |
Supplemental Data | | | | | |
Net assets, end of period (000 omitted) | $ 704,460 | $ 785,494 | $ 638,124 | $ 893,359 | $ 1,011,393 |
Portfolio turnover rate | 23% | 25% | 43% | 58% | 72% |
A Total returns do not reflect charges attributable to your insurance company's separate account. Inclusion of these charges would reduce the total returns shown.
B Total returns would have been lower had certain expenses not been reduced during the periods shown.
C Calculated based on average shares outstanding during the period.
D Investment income per share reflects a special dividend which amounted to $.05 per share.
E Expense ratios reflect operating expenses of the class. Expenses before reductions do not reflect amounts reimbursed by the investment adviser or reductions from brokerage service arrangements or other expense offset arrangements and do not represent the amount paid by the class during periods when reimbursements or reductions occur. Expenses net of any voluntary waivers reflect expenses after reimbursement by the investment adviser but prior to reductions from brokerage service arrangements or other expense offset arrangements. Expenses net of all reductions represent the net expenses paid by the class.
Financial Highlights - Service Class
Years ended December 31, | 2004 | 2003 | 2002 | 2001 | 2000 |
Selected Per-Share Data | | | | | |
Net asset value, beginning of period | $ 13.18 | $ 10.80 | $ 13.12 | $ 15.19 | $ 17.24 |
Income from Investment Operations | | | | | |
Net investment income (loss)C | .19D | .11 | .14 | .16 | .18 |
Net realized and unrealized gain (loss) | .57 | 2.40 | (2.31) | (1.44) | (.80) |
Total from investment operations | .76 | 2.51 | (2.17) | (1.28) | (.62) |
Distributions from net investment income | (.11) | (.13) | (.15) | (.18) | (.19) |
Distributions from net realized gain | - | - | - | (.61) | (1.24) |
Total distributions | (.11) | (.13) | (.15) | (.79) | (1.43) |
Net asset value, end of period | $ 13.83 | $ 13.18 | $ 10.80 | $ 13.12 | $ 15.19 |
Total ReturnA,B | 5.75% | 23.60% | (16.69)% | (8.85)% | (3.69)% |
Ratios to Average Net AssetsE | | | | | |
Expenses before expense reductions | .70% | .69% | .69% | .68% | .69% |
Expenses net of voluntary waivers, if any | .70% | .69% | .69% | .68% | .69% |
Expenses net of all reductions | .70% | .69% | .68% | .66% | .68% |
Net investment income (loss) | 1.48% | .92% | 1.20% | 1.24% | 1.16% |
Supplemental Data | | | | | |
Net assets, end of period (000 omitted) | $ 401,392 | $ 357,585 | $ 250,160 | $ 281,194 | $ 212,994 |
Portfolio turnover rate | 23% | 25% | 43% | 58% | 72% |
A Total returns do not reflect charges attributable to your insurance company's separate account. Inclusion of these charges would reduce the total returns shown.
B Total returns would have been lower had certain expenses not been reduced during the periods shown.
C Calculated based on average shares outstanding during the period.
D Investment income per share reflects a special dividend which amounted to $.05 per share.
E Expense ratios reflect operating expenses of the class. Expenses before reductions do not reflect amounts reimbursed by the investment adviser or reductions from brokerage service arrangements or other expense offset arrangements and do not represent the amount paid by the class during periods when reimbursements or reductions occur. Expenses net of any voluntary waivers reflect expenses after reimbursement by the investment adviser but prior to reductions from brokerage service arrangements or other expense offset arrangements. Expenses net of all reductions represent the net expenses paid by the class.
See accompanying notes which are an integral part of the financial statements.
Annual Report
Fidelity Variable Insurance Products: Growth & Income Portfolio
Financial Statements - continued
Financial Highlights - Service Class 2
Years ended December 31, | 2004 | 2003 | 2002 | 2001 | 2000G |
Selected Per-Share Data | | | | | |
Net asset value, beginning of period | $ 13.09 | $ 10.73 | $ 13.07 | $ 15.17 | $ 16.94 |
Income from Investment Operations | | | | | |
Net investment income (loss)E | .17F | .09 | .12 | .14 | .15 |
Net realized and unrealized gain (loss) | .55 | 2.39 | (2.30) | (1.44) | (.49) |
Total from investment operations | .72 | 2.48 | (2.18) | (1.30) | (.34) |
Distributions from net investment income | (.10) | (.12) | (.16) | (.19) | (.19) |
Distributions from net realized gain | - | - | - | (.61) | (1.24) |
Total distributions | (.10) | (.12) | (.16) | (.80) | (1.43) |
Net asset value, end of period | $ 13.71 | $ 13.09 | $ 10.73 | $ 13.07 | $ 15.17 |
Total ReturnB,C,D | 5.52% | 23.44% | (16.84)% | (9.01)% | (2.11)% |
Ratios to Average Net AssetsH | | | | | |
Expenses before expense reductions | .85% | .85% | .85% | .84% | .85%A |
Expenses net of voluntary waivers, if any | .85% | .85% | .85% | .84% | .85%A |
Expenses net of all reductions | .85% | .84% | .84% | .82% | .84%A |
Net investment income (loss) | 1.33% | .76% | 1.05% | 1.08% | 1.00%A |
Supplemental Data | | | | | |
Net assets, end of period (000 omitted) | $ 525,504 | $ 341,989 | $ 140,890 | $ 76,237 | $ 13,025 |
Portfolio turnover rate | 23% | 25% | 43% | 58% | 72% |
A Annualized
B Total returns for periods of less than one year are not annualized.
C Total returns do not reflect charges attributable to your insurance company's separate account. Inclusion of these charges would reduce the total returns shown.
D Total returns would have been lower had certain expenses not been reduced during the periods shown.
E Calculated based on average shares outstanding during the period.
F Investment income per share reflects a special dividend which amounted to $.05 per share.
G For the period January 12, 2000 (commencement of operations) to December 31, 2000.
H Expense ratios reflect operating expenses of the class. Expenses before reductions do not reflect amounts reimbursed by the investment adviser or reductions from brokerage service arrangements or other expense offset arrangements and do not represent the amount paid by the class during periods when reimbursements or reductions occur. Expense ratios before reductions for start-up periods may not be representative of longer-term operating periods. Expenses net of any voluntary waivers reflect expenses after reimbursement by the investment adviser but prior to reductions from brokerage service arrangements or other expense offset arrangements. Expenses net of all reductions represent the net expenses paid by the class.
See accompanying notes which are an integral part of the financial statements.
Growth & Income Portfolio
For the period ended December 31, 2004
1. Significant Accounting Policies.
Growth & Income Portfolio (the fund) is a fund of Variable Insurance Products Fund III, (the trust) (referred to in this report as Fidelity Variable Insurance Products: Growth & Income Portfolio) and is authorized to issue an unlimited number of shares. The trust is registered under the Investment Company Act of 1940, as amended (the 1940 Act), as an open-end management investment company organized as a Massachusetts business trust. Shares of the fund may only be purchased by insurance companies for the purpose of funding variable annuity or variable life insurance contracts. The fund offers the following classes of shares: Initial Class shares, Service Class shares and Service Class 2. All classes have equal rights and voting privileges, except for matters affecting a single class. Investment income, realized and unrealized capital gains and losses, the common expenses of the fund, and certain fund-level expense reductions, if any, are allocated on a pro rata basis to each class based on the relative net assets of each class to the total net assets of the fund. Each class differs with respect to distribution and service plan fees incurred. Certain expense reductions also differ by class.
The financial statements have been prepared in conformity with accounting principles generally accepted in the United States of America, which require management to make certain estimates and assumptions at the date of the financial statements. The following summarizes the significant accounting policies of the fund:
Security Valuation. Net asset value per share (NAV calculation) is calculated as of the close of business of the New York Stock Exchange, normally 4:00 p.m. Eastern time. Equity securities, including restricted securities, for which market quotations are available are valued at the last sale price or official closing price (closing bid price or last evaluated quote if no sale has occurred) on the primary market or exchange on which they trade. If prices are not readily available or do not accurately reflect fair value for a security, or if a security's value has been materially affected by events occurring after the close of the exchange or market on which the security is principally traded, that security may be valued by another method that the Board of Trustees believes accurately reflects fair value. A security's valuation may differ depending on the method used for determining value. Price movements in futures contracts and ADRs, market and trading trends, the bid/ask quotes of brokers and off-exchange institutional trading may be reviewed in the course of making a good faith determination of a security's fair value. Short-term securities with remaining maturities of sixty days or less for which quotations are not readily available are valued on the basis of amortized cost. Investments in open-end investment companies are valued at their net asset value each business day.
Foreign Currency. The fund uses foreign currency contracts to facilitate transactions in foreign-denominated securities. Losses from these transactions may arise from changes in the value of the foreign currency or if the counterparties do not perform under the contracts' terms.
Foreign-denominated assets, including investment securities, and liabilities are translated into U.S. dollars at the exchange rate at period end. Purchases and sales of investment securities, income and dividends received and expenses denominated in foreign currencies are translated into U.S. dollars at the exchange rate in effect on the transaction date.
The effects of exchange rate fluctuations on investments are included with the net realized and unrealized gain (loss) on investment securities. Other foreign currency transactions resulting in realized and unrealized gain (loss) are disclosed separately.
Investment Transactions and Income. Security transactions are accounted for as of trade date. Gains and losses on securities sold are determined on the basis of identified cost and may include proceeds received from litigation. Dividend income is recorded on the ex-dividend date, except for certain dividends from foreign securities where the ex-dividend date may have passed, which are recorded as soon as the fund is informed of the ex-dividend date. Non-cash dividends included in dividend income, if any, are recorded at the fair market value of the securities received. Distributions received on securities that represent a return of capital or capital gain are recorded as a reduction of cost of investments and/or as a realized gain. The fund estimates the components of distributions received that may be considered return of capital distributions or capital gain distributions. Large, non-recurring dividends recognized by the fund are presented separately on the Statement of Operations as "Special Dividends" and the impact of these dividends to net investment income per share is presented in the Financial Highlights. Interest income is accrued as earned. Interest income includes coupon interest and amortization of premium and accretion of discount on debt securities. Investment income is recorded net of foreign taxes withheld where recovery of such taxes is uncertain.
Expenses. Most expenses of the trust can be directly attributed to a fund. Expenses which cannot be directly attributed are apportioned among the funds in the trust.
Income Tax Information and Distributions to Shareholders. Each year, the fund intends to qualify as a regulated investment company by distributing all of its taxable income and realized gains under Subchapter M of the Internal Revenue Code. As a result, no provision for income taxes is required in the accompanying financial statements. Foreign taxes are provided for based on the fund's understanding of the tax rules and rates that exist in the foreign markets in which it invests.
Distributions are recorded on the ex-dividend date. Income dividends and capital gain distributions are declared separately for each class. Income and capital gain distributions are determined in accordance with income tax regulations, which may differ from generally accepted accounting principles.
Annual Report
Notes to Financial Statements - continued
1. Significant Accounting Policies - continued
Income Tax Information and Distributions to Shareholders - continued
Capital accounts within the financial statements are adjusted for permanent book-tax differences. These adjustments have no impact on net assets or the results of operations. Temporary book-tax differences will reverse in a subsequent period.
Book-tax differences are primarily due to foreign currency transactions, capital loss carryforwards and losses deferred due to wash sales.
The tax-basis components of distributable earnings and the federal tax cost as of period end were as follows:
Unrealized appreciation | $ 251,148,239 | |
Unrealized depreciation | (54,167,320) | |
Net unrealized appreciation (depreciation) | 196,980,919 | |
Undistributed ordinary income | 22,456,038 | |
Capital loss carryforward | (160,503,421) | |
| | |
Cost for federal income tax purposes | $ 1,454,054,880 | |
The tax character of distributions paid was as follows:
| December 31, 2004 | December 31, 2003 |
Ordinary Income | $ 12,447,351 | $ 12,772,749 |
2. Operating Policies.
Repurchase Agreements. Fidelity Management & Research Company (FMR) has received an Exemptive Order from the Securities and Exchange Commission (the SEC) which permits the fund and other affiliated entities of FMR to transfer uninvested cash balances into joint trading accounts. These accounts are then invested in repurchase agreements that are collateralized by U.S. Treasury or Government obligations. The fund may also invest directly with institutions, in repurchase agreements that are collateralized by commercial paper obligations and corporate obligations. Collateral is held in segregated accounts with custodian banks and may be obtained in the event of a default of the counterparty. Collateral is marked-to-market daily and maintained at a value at least equal to the principal amount of the repurchase agreement (including accrued interest).
3. Purchases and Sales of Investments.
Purchases and sales of securities, other than short-term securities and U.S. government securities, aggregated $420,135,989 and $322,208,324, respectively.
4. Fees and Other Transactions with Affiliates.
Management Fee. FMR and its affiliates provide the fund with investment management related services for which the fund pays a monthly management fee. The management fee is the sum of an individual fund fee rate that is based on an annual rate of .20% of the fund's average net assets and a group fee rate that averaged .28% during the period. The group fee rate is based upon the average net assets of all the mutual funds advised by FMR. The group fee rate decreases as assets under management increase and increases as assets under management decrease. For the period, the total annual management fee rate was .47% of the fund's average net assets.
Distribution and Service Plan. In accordance with Rule 12b-1 of the 1940 Act, the fund has adopted separate 12b-1 Plans for each Service Class of shares. Each Service Class pays Fidelity Distributors Corporation (FDC), an affiliate of FMR, a service fee. For the period, the service fee is based on an annual rate of .10% of Service Class' average net assets and .25% of Service Class 2's average net assets.
For the period, each class paid FDC the following amounts, all of which were re-allowed to insurance companies for the distribution of shares and providing shareholder support services:
Service Class | $ 377,024 | |
Service Class 2 | 1,085,899 | |
| $ 1,462,923 | |
Growth & Income Portfolio
4. Fees and Other Transactions with Affiliates - continued
Transfer Agent Fees. Fidelity Investments Institutional Operations Company, Inc. (FIIOC), an affiliate of FMR, is the fund's transfer, dividend disbursing, and shareholder servicing agent. FIIOC receives an asset-based fee with respect to each account. FIIOC pays a portion of the expenses related to the typesetting, printing and mailing of shareholder reports, except proxy statements. Each class pays a transfer agent fee, excluding out of pocket expenses, equal to an annual rate of .07% of their month end net assets. For the period, the total transfer agent fees paid by each class to FIIOC, including out of pocket expenses, were as follows:
Initial Class | $ 489,424 | |
Service Class | 252,242 | |
Service Class 2 | 297,002 | |
| $ 1,038,668 | |
Accounting and Security Lending Fees. Fidelity Service Company, Inc. (FSC), an affiliate of FMR, maintains the fund's accounting records. The accounting fee is based on the level of average net assets for the month. Under a separate contract, FSC administers the security lending program. The security lending fee is based on the number and duration of lending transactions.
Central Funds. The fund may invest in affiliated Central Funds managed by Fidelity Investments Money Management, Inc. (FIMM), an affiliate of FMR. The Central Funds are open-end investment companies available only to investment companies and other accounts managed by FMR and its affiliates. The Central Funds seek preservation of capital and current income and do not pay a management fee. Income distributions earned by the fund are recorded as income in the accompanying financial statements and totaled $2,003,509 for the period.
Brokerage Commissions. The fund placed a portion of its portfolio transactions with brokerage firms which are affiliates of the investment adviser. The commissions paid to these affiliated firms were $28,868 for the period.
5. Committed Line of Credit.
The fund participates with other funds managed by FMR in a $4.2 billion credit facility (the "line of credit") to be utilized for temporary or emergency purposes to fund shareholder redemptions or for other short-term liquidity purposes. The fund has agreed to pay commitment fees on its pro rata portion of the line of credit. During the period, there were no borrowings on this line of credit.
6. Security Lending.
The fund lends portfolio securities from time to time in order to earn additional income. The fund receives collateral (in the form of U.S. Treasury obligations, letters of credit and/or cash) against the loaned securities and maintains collateral in an amount not less than 100% of the market value of the loaned securities during the period of the loan. The market value of the loaned securities is determined at the close of business of the fund and any additional required collateral is delivered to the fund on the next business day. If the borrower defaults on its obligation to return the securities loaned because of insolvency or other reasons, a fund could experience delays and costs in recovering the securities loaned or in gaining access to the collateral. Cash collateral is invested in cash equivalents. The value of loaned securities and cash collateral at period end are disclosed on the fund's Statement of Assets and Liabilities.
7. Expense Reductions.
Many of the brokers with whom FMR places trades on behalf of the fund provided services to the fund in addition to trade execution. These services included payments of certain expenses on behalf of the fund totaling $105,306 for the period.
8. Other Information.
At the end of the period, FMR or its affiliates were the owners of record of 20% of the total outstanding shares of the fund and one unaffiliated shareholder was the owner of record of 48% of the total outstanding shares of the fund.
Annual Report
To the Trustees of Variable Insurance Products Fund III and Shareholders of Growth & Income Portfolio:
We have audited the accompanying statement of assets and liabilities of Growth & Income Portfolio (the Fund), a fund of Variable Insurance Products Fund III, including the portfolio of investments, as of December 31, 2004, and the related statement of operations for the year then ended, the statement of changes in net assets for each of the two years in the period then ended, and the financial highlights for each of the five years in the period then ended. These financial statements and financial highlights are the responsibility of the Fund's management. Our responsibility is to express an opinion on these financial statements and financial highlights based on our audits.
We conducted our audits in accordance with standards of the Public Company Accounting Oversight Board (United States). Those standards require that we plan and perform the audit to obtain reasonable assurance about whether the financial statements and financial highlights are free of material misstatement. An audit includes consideration of internal control over financial reporting as a basis for designing audit procedures that are appropriate in the circumstances, but not for the purpose of expressing an opinion on the effectiveness of the Fund's internal control over financial reporting. Accordingly, we express no such opinion. An audit also includes examining, on a test basis, evidence supporting the amounts and disclosures in the financial statements, assessing the accounting principles used and significant estimates made by management, as well as evaluating the overall financial statement presentation. Our procedures included confirmation of securities owned as of December 31, 2004, by correspondence with the custodians and brokers; where replies were not received from brokers, we performed other auditing procedures. We believe that our audits provide a reasonable basis for our opinion.
In our opinion, the financial statements and financial highlights referred to above present fairly, in all material respects, the financial position of Growth & Income Portfolio as of December 31, 2004, the results of its operations for the year then ended, the changes in its net assets for each of the two years in the period then ended, and its financial highlights for each of the five years in the period then ended, in conformity with accounting principles generally accepted in the United States of America.
/s/DELOITTE & TOUCHE LLP
DELOITTE & TOUCHE LLP
Boston, Massachusetts
February 18, 2005
Growth & Income Portfolio
The Trustees, Member of the Advisory Board, and executive officers of the trust and fund, as applicable, are listed below. The Board of Trustees governs the fund and is responsible for protecting the interests of shareholders. The Trustees are experienced executives who meet periodically throughout the year to oversee the fund's activities, review contractual arrangements with companies that provide services to the fund, and review the fund's performance. Except for William O. McCoy, Dennis J. Dirks, and Kenneth L. Wolfe, each of the Trustees oversees 301 funds advised by FMR or an affiliate. Mr. McCoy oversees 303 funds advised by FMR or an affiliate. Mr. Dirks and Mr. Wolfe oversee 233 advised funds by FMR or an affiliate.
The Trustees hold office without limit in time except that (a) any Trustee may resign; (b) any Trustee may be removed by written instrument, signed by at least two-thirds of the number of Trustees prior to such removal; (c) any Trustee who requests to be retired or who has become incapacitated by illness or injury may be retired by written instrument signed by a majority of the other Trustees; and (d) any Trustee may be removed at any special meeting of shareholders by a two-thirds vote of the outstanding voting securities of the trust. In any event, each non-interested Trustee shall retire not later than the last day of the calendar year in which his or her 72nd birthday occurs. The executive officers and Advisory Board Member hold office without limit in time, except that any officer and Advisory Board Member may resign or may be removed by a vote of a majority of the Trustees at any regular meeting or any special meeting of the Trustees. Except as indicated, each individual has held the office shown or other offices in the same company for the past five years.
The fund's Statement of Additional Information (SAI) includes more information about the Trustees. To request a free copy, call Fidelity at 1-800-544-5429.
Interested Trustees*:
Correspondence intended for each Trustee who is an "interested person" (as defined in the 1940 Act) may be sent to Fidelity Investments, 82 Devonshire Street, Boston, Massachusetts 02109.
Name, Age; Principal Occupation |
Edward C. Johnson 3d (74)** |
| Year of Election or Appointment: 1994 Mr. Johnson is Chairman of the Board of Trustees. Mr. Johnson serves as Chief Executive Officer, Chairman, and a Director of FMR Corp.; a Director and Chairman of the Board and of the Executive Committee of FMR; Chairman and a Director of Fidelity Management & Research (Far East) Inc.; Chairman (1998) and a Director of Fidelity Investments Money Management, Inc.; and Chairman (2001) and a Director (2000) of FMR Co., Inc. |
Abigail P. Johnson (43)** |
| Year of Election or Appointment: 2001 Senior Vice President of VIP Growth & Income (2001). Ms. Johnson also serves as Senior Vice President of other Fidelity funds (2001). She is President and a Director of FMR (2001), Fidelity Investments Money Management, Inc. (2001), FMR Co., Inc. (2001), and a Director of FMR Corp. Previously, Ms. Johnson managed a number of Fidelity funds. |
Laura B. Cronin (50) |
| Year of Election or Appointment: 2003 Ms. Cronin is an Executive Vice President (2002) and Chief Financial Officer (2002) of FMR Corp. and is a member of the Fidelity Management Committee (2003). Previously, Ms. Cronin served as Vice President of Finance of FMR (1997-1999), and Chief Financial Officer of FMR (1999-2001), Fidelity Personal Investments (2001), and Fidelity Brokerage Company (2001-2002). |
Robert L. Reynolds (52) |
| Year of Election or Appointment: 2003 Mr. Reynolds is a Director (2003) and Chief Operating Officer (2002) of FMR Corp. and is the head of the Fidelity Management Committee (2003). He also serves on the Board at Fidelity Investments Canada, Ltd. (2000). Previously, Mr. Reynolds served as President of Fidelity Investments Institutional Retirement Group (1996-2000). |
* Trustees have been determined to be "Interested Trustees" by virtue of, among other things, their affiliation with the trust or various entities under common control with FMR.
** Edward C. Johnson 3d, Trustee, is Abigail P. Johnson's father.
Annual Report
Non-Interested Trustees:
Correspondence intended for each non-interested Trustee (that is, the Trustees other than the Interested Trustees) may be sent to Fidelity Investments, P.O. Box 55235, Boston, Massachusetts 02205-5235.
Name, Age; Principal Occupation |
Dennis J. Dirks (56) |
| Year of Election or Appointment: 2005 Mr. Dirks also serves as a Trustee (2005) or Member of the Advisory Board (2004) of other investment companies advised by FMR. Prior to his retirement in May 2003, Mr. Dirks was Chief Operating Officer and a member of the Board of The Depository Trust & Clearing Corporation (DTCC) (1999-2003). He also served as President, Chief Operating Officer, and Board member of The Depository Trust Company (DTC) (1999-2003) and President and Board member of the National Securities Clearing Corporation (NSCC) (1999-2003). In addition, Mr. Dirks served as Chief Executive Officer and Board member of the Government Securities Clearing Corporation (2001-2003) and Chief Executive Officer and Board member of the Mortgage-Backed Securities Clearing Corporation (2001-2003). |
Robert M. Gates (61) |
| Year of Election or Appointment: 1997 Dr. Gates is Vice Chairman of the non-interested Trustees (2005). Dr. Gates is President of Texas A&M University (2002). He was Director of the Central Intelligence Agency (CIA) from 1991 to 1993. From 1989 to 1991, Dr. Gates served as Assistant to the President of the United States and Deputy National Security Advisor. Dr. Gates is a Director of NACCO Industries, Inc. (mining and manufacturing), Parker Drilling Co., Inc. (drilling and rental tools for the energy industry, 2001), and Brinker International (restaurant management, 2003). He also serves as a member of the Advisory Board of VoteHere.net (secure Internet voting, 2001). Previously, Dr. Gates served as a Director of LucasVarity PLC (automotive components and diesel engines), a Director of TRW Inc. (automotive, space, defense, and information technology), and Dean of the George Bush School of Government and Public Service at Texas A&M University (1999-2001). Dr. Gates also is a Trustee of the Forum for International Policy. |
George H. Heilmeier (68) |
| Year of Election or Appointment: 2004 Dr. Heilmeier is Chairman Emeritus of Telcordia Technologies (communication software and systems), where prior to his retirement, he served as company Chairman and Chief Executive Officer. He currently serves on the Boards of Directors of The Mitre Corporation (systems engineering and information technology support for the government), INET Technologies Inc. (telecommunications network surveillance, 2001), Teletech Holdings (customer management services), and HRL Laboratories (private research and development, 2004). He is Chairman of the General Motors Technology Advisory Committee and a Life Fellow of the Institute of Electrical and Electronics Engineers (IEEE) (2000). Dr. Heilmeier is a member of the Defense Science Board and the National Security Agency Advisory Board. He is also a member of the National Academy of Engineering, the American Academy of Arts and Sciences, and the Board of Overseers of the School of Engineering and Applied Science of the University of Pennsylvania. Previously, Dr. Heilmeier served as a Director of TRW Inc. (automotive, space, defense, and information technology, 1992-2002), Compaq (1994-2002), and Automatic Data Processing, Inc. (ADP) (technology-based business outsourcing, 1995-2002). |
Marie L. Knowles (58) |
| Year of Election or Appointment: 2001 Prior to Ms. Knowles' retirement in June 2000, she served as Executive Vice President and Chief Financial Officer of Atlantic Richfield Company (ARCO) (diversified energy, 1996-2000). From 1993 to 1996, she was a Senior Vice President of ARCO and President of ARCO Transportation Company. She served as a Director of ARCO from 1996 to 1998. She currently serves as a Director of Phelps Dodge Corporation (copper mining and manufacturing) and McKesson Corporation (healthcare service, 2002). Ms. Knowles is a Trustee of the Brookings Institution and the Catalina Island Conservancy and also serves as a member of the Advisory Board for the School of Engineering of the University of Southern California. |
Ned C. Lautenbach (60) |
| Year of Election or Appointment: 2000 Mr. Lautenbach has been a partner of Clayton, Dubilier & Rice, Inc. (private equity investment firm) since September 1998. Previously, Mr. Lautenbach was with the International Business Machines Corporation (IBM) from 1968 until his retirement in 1998. He was most recently Senior Vice President and Group Executive of Worldwide Sales and Services. From 1993 to 1995, he was Chairman of IBM World Trade Corporation, and from 1994 to 1998 was a member of IBM's Corporate Executive Committee. Mr. Lautenbach serves as Co-Chairman and a Director of Covansys, Inc. (global provider of business and technology solutions, 2000). In addition, he is a Director of Italtel Holding S.p.A. (telecommunications (Milan, Italy), 2004) and Eaton Corporation (diversified industrial) as well as the Philharmonic Center for the Arts in Naples, Florida (1999). He also is a member of the Council on Foreign Relations. |
Marvin L. Mann (71) |
| Year of Election or Appointment: 1994 Mr. Mann is Chairman of the non-interested Trustees (2001). He is Chairman Emeritus of Lexmark International, Inc. (computer peripherals), where he served as CEO until April 1998, retired as Chairman May 1999, and remains a member of the Board. Prior to 1991, he held the positions of Vice President of International Business Machines Corporation (IBM) and President and General Manager of various IBM divisions and subsidiaries. He is a member of the Executive Committee of the Independent Director's Council of the Investment Company Institute. In addition, Mr. Mann is a member of the President's Cabinet at the University of Alabama and the Board of Visitors of the Culverhouse College of Commerce and Business Administration at the University of Alabama. |
William O. McCoy (71) |
| Year of Election or Appointment: 1997 Prior to his retirement in December 1994, Mr. McCoy was Vice Chairman of the Board of BellSouth Corporation (telecommunications) and President of BellSouth Enterprises. He is currently a Director of Liberty Corporation (holding company), Duke Realty Corporation (real estate), and Progress Energy, Inc. (electric utility). He is also a partner of Franklin Street Partners (private investment management firm) and a member of the Research Triangle Foundation Board. In addition, Mr. McCoy served as the Interim Chancellor (1999-2000) and a member of the Board of Visitors (1994-1998) for the University of North Carolina at Chapel Hill and currently serves on the Board of Directors of the University of North Carolina Health Care System and the Board of Visitors of the Kenan-Flagler Business School (University of North Carolina at Chapel Hill). He also served as Vice President of Finance for the University of North Carolina (16-school system, 1995-1998). |
Cornelia M. Small (60) |
| Year of Election or Appointment: 2005 Ms. Small is a member (2000) and Chairperson (2002) of the Investment Committee, and a member (2002) of the Board of Trustees of Smith College. Previously, she served as Chief Investment Officer (1999-2000), Director of Global Equity Investments (1996-1999), and a member of the Board of Directors of Scudder, Stevens & Clark (1990-1997) and Scudder Kemper Investments (1997-1998). In addition, Ms. Small served as Co-Chair (2000-2003) of the Annual Fund for the Fletcher School of Law and Diplomacy. |
William S. Stavropoulos (65) |
| Year of Election or Appointment: 2002 Mr. Stavropoulos is Chairman of the Board (2000), CEO (2002), a position he previously held from 1995-2000, Chairman of the Executive Committee (2000), and a Member of the Board of Directors of The Dow Chemical Company. Since joining The Dow Chemical Company in 1967, Mr. Stavropoulos served in numerous senior management positions, including President (1993-2000; 2002-2003). Currently, he is a Director of NCR Corporation (data warehousing and technology solutions), BellSouth Corporation (telecommunications), Chemical Financial Corporation, and Maersk Inc. (industrial conglomerate, 2002). He also serves as a member of the Board of Trustees of the American Enterprise Institute for Public Policy Research. In addition, Mr. Stavropoulos is a member of The Business Council, J.P. Morgan International Council and the University of Notre Dame Advisory Council for the College of Science. |
Kenneth L. Wolfe (65) |
| Year of Election or Appointment: 2005 Mr. Wolfe also serves as a Trustee (2005) or Member of the Advisory Board (2004) of other investment companies advised by FMR. Prior to his retirement in 2001, Mr. Wolfe was Chairman and Chief Executive Officer of Hershey Foods Corporation (1993-2001). He currently serves as a member of the boards of Adelphia Communications Corporation (2003), Bausch & Lomb, Inc., and Revlon Inc. (2004). |
Annual Report
Advisory Board Member and Executive Officers:
Correspondence intended for each executive officer and Mr. Lynch may be sent to Fidelity Investments, 82 Devonshire Street, Boston, Massachusetts 02109.
Name, Age; Principal Occupation |
Peter S. Lynch (61) |
| Year of Election or Appointment: 2003 Member of the Advisory Board of Variable Insurance Products III. Vice Chairman and a Director of FMR, and Vice Chairman (2001) and a Director (2000) of FMR Co., Inc. Previously, Mr. Lynch served as a Trustee of the Fidelity funds (1990-2003). Prior to May 31, 1990, he was a Director of FMR and Executive Vice President of FMR (a position he held until March 31, 1991), Vice President of Fidelity® Magellan® Fund and FMR Growth Group Leader, and Managing Director of FMR Corp. Mr. Lynch was also Vice President of Fidelity Investments Corporate Services. In addition, he serves as a Trustee of Boston College, Massachusetts Eye & Ear Infirmary, Historic Deerfield, John F. Kennedy Library, and the Museum of Fine Arts of Boston. |
Bart A. Grenier (45) |
| Year of Election or Appointment: 2001 Vice President of VIP Growth & Income. Mr. Grenier also serves as Vice President of certain Equity Funds (2001), a position he previously held from 1999 to 2000, and Vice President of certain High Income Funds (2002). He is Senior Vice President of FMR (1999) and FMR Co., Inc. (2001), and President and Director of Strategic Advisers, Inc. (2002). He also heads Fidelity's Asset Allocation Group (2000), Fidelity's Growth and Income Group (2001), Fidelity's Value Group (2001), and Fidelity's High Income Division (2001). Previously, Mr. Grenier served as President of Fidelity Ventures (2000), Vice President of certain High Income Funds (1997-2000), High Income Division Head (1997-2000), Group Leader of the Income-Growth and Asset Allocation-Income Groups (1996-2000), and Assistant Equity Division Head (1997-2000). |
Louis Salemy (43) |
| Year of Election or Appointment: 2000 Vice President of VIP Growth & Income and other funds advised by FMR. Prior to assuming his current responsibilities, Mr. Salemy managed a variety of Fidelity funds. |
Eric D. Roiter (56) |
| Year of Election or Appointment: 1998 Secretary of VIP Growth & Income. He also serves as Secretary of other Fidelity funds; Vice President, General Counsel, and Secretary of FMR Co., Inc. (2001-present) and FMR; Vice President and Secretary of FDC; Assistant Secretary of Fidelity Management & Research (U.K.) Inc. (2001-present), Fidelity Management & Research (Far East) Inc. (2001-present), and Fidelity Investments Money Management, Inc. (2001-present). Mr. Roiter is an Adjunct Member, Faculty of Law, at Boston College Law School (2003-present). |
Stuart Fross (45) |
| Year of Election or Appointment: 2003 Assistant Secretary of VIP Growth & Income. Mr. Fross also serves as Assistant Secretary of other Fidelity funds (2003) and is an employee of FMR. |
Christine Reynolds (46) |
| Year of Election or Appointment: 2004 President, Treasurer, and Anti-Money Laundering (AML) officer of VIP Growth & Income. Ms. Reynolds also serves as President, Treasurer, and AML officer of other Fidelity funds (2004) and is a Vice President (2003) and an employee (2002) of FMR. Before joining Fidelity Investments, Ms. Reynolds worked at PricewaterhouseCoopers LLP (PwC) (1980-2002), where she was most recently an audit partner with PwC's investment management practice. |
Timothy F. Hayes (54) |
| Year of Election or Appointment: 2002 Chief Financial Officer of VIP Growth & Income. Mr. Hayes also serves as Chief Financial Officer of other Fidelity funds (2002). Recently he was appointed President of Fidelity Service Company (2003) where he also serves as a Director. Mr. Hayes also serves as President of Fidelity Investments Operations Group (FIOG, 2002), which includes Fidelity Pricing and Cash Management Services Group (FPCMS), where he was appointed President in 1998. Previously, Mr. Hayes served as Chief Financial Officer of Fidelity Investments Corporate Systems and Service Group (1998) and Fidelity Systems Company (1997-1998). |
Kenneth A. Rathgeber (57) |
| Year of Election or Appointment: 2004 Chief Compliance Officer of VIP Growth & Income. Mr. Rathgeber also serves as Chief Compliance Officer of other Fidelity funds (2004) and Executive Vice President of Risk Oversight for Fidelity Investments (2002). Previously, he served as Executive Vice President and Chief Operating Officer for Fidelity Investments Institutional Services Company, Inc. (1998-2002). |
John R. Hebble (46) |
| Year of Election or Appointment: 2003 Deputy Treasurer of VIP Growth & Income. Mr. Hebble also serves as Deputy Treasurer of other Fidelity funds (2003), and is an employee of FMR. Before joining Fidelity Investments, Mr. Hebble worked at Deutsche Asset Management where he served as Director of Fund Accounting (2002-2003) and Assistant Treasurer of the Scudder Funds (1998-2003). |
Kimberley H. Monasterio (41) |
| Year of Election or Appointment: 2004 Deputy Treasurer of VIP Growth & Income. Ms. Monasterio also serves as Deputy Treasurer of other Fidelity funds (2004) and is an employee of FMR (2004). Before joining Fidelity Investments, Ms. Monasterio served as Treasurer (2000-2004) and Chief Financial Officer (2002-2004) of the Franklin Templeton Funds and Senior Vice President of Franklin Templeton Services, LLC (2000-2004). |
John H. Costello (58) |
| Year of Election or Appointment: 1996 Assistant Treasurer of VIP Growth & Income. Mr. Costello also serves as Assistant Treasurer of other Fidelity funds and is an employee of FMR. |
Peter L. Lydecker (50) |
| Year of Election or Appointment: 2004 Assistant Treasurer of VIP Growth & Income. Mr. Lydecker also serves as Assistant Treasurer of other Fidelity funds (2004) and is an employee of FMR. |
Mark Osterheld (49) |
| Year of Election or Appointment: 2002 Assistant Treasurer of VIP Growth & Income. Mr. Osterheld also serves as Assistant Treasurer of other Fidelity funds (2002) and is an employee of FMR. |
Kenneth B. Robins (35) |
| Year of Election or Appointment: 2004 Assistant Treasurer of VIP Growth & Income. Mr. Robins also serves as Assistant Treasurer of other Fidelity funds (2004) and is an employee of FMR (2004). Before joining Fidelity Investments, Mr. Robins worked at KPMG LLP, where he was a partner in KPMG's department of professional practice (2002-2004) and a Senior Manager (1999-2000). In addition, Mr. Robins served as Assistant Chief Accountant, United States Securities and Exchange Commission (2000-2002). |
Annual Report
A percentage of the dividends distributed during the fiscal year for the following classes qualifies for the dividends-received deduction for corporate shareholders:
Initial Class | 100% | |
Service Class | 100% | |
Service Class 2 | 100% | |
The fund will notify shareholders in January 2005 of amounts for use in preparing 2004 income tax returns.
Growth & Income Portfolio
A special meeting of the fund's shareholders was held on December 14, 2004. The results of votes taken among shareholders on proposals before them are reported below. Each vote reported represents one dollar of net asset value held on the record date for the meeting.
PROPOSAL 1 |
To amend the Declaration of Trust to allow the Board of Trustees, if permitted by applicable law, to authorize fund mergers without shareholder approval. A |
| # of
Votes | % of
Votes |
Affirmative | 4,465,365,699.61 | 80.317 |
Against | 820,718,849.73 | 14.762 |
Abstain | 273,620,539.56 | 4.921 |
TOTAL | 5,559,705,088.90 | 100.000 |
PROPOSAL 2 |
To elect a Board of Trustees. A |
| # of
Votes | % of
Votes |
J. Michael Cook |
Affirmative | 5,275,527,318.06 | 94.889 |
Withheld | 284,177,770.84 | 5.111 |
TOTAL | 5,559,705,088.90 | 100.000 |
Ralph F. Cox |
Affirmative | 5,260,941,793.66 | 94.626 |
Withheld | 298,763,295.24 | 5.374 |
TOTAL | 5,559,705,088.90 | 100.000 |
Laura B. Cronin |
Affirmative | 5,275,571,233.79 | 94.889 |
Withheld | 284,133,855.11 | 5.111 |
TOTAL | 5,559,705,088.90 | 100.000 |
Dennis J. Dirks B |
Affirmative | 5,277,234,059.51 | 94.919 |
Withheld | 282,471,029.39 | 5.081 |
TOTAL | 5,559,705,088.90 | 100.000 |
Robert M. Gates |
Affirmative | 5,271,693,384.06 | 94.820 |
Withheld | 288,011,704.84 | 5.180 |
TOTAL | 5,559,705,088.90 | 100.000 |
George H. Heilmeier |
Affirmative | 5,276,712,546.15 | 94.910 |
Withheld | 282,992,542.75 | 5.090 |
TOTAL | 5,559,705,088.90 | 100.000 |
Abigail P. Johnson |
Affirmative | 5,265,412,678.20 | 94.707 |
Withheld | 294,292,410.70 | 5.293 |
TOTAL | 5,559,705,088.90 | 100.000 |
Edward C. Johnson 3d |
Affirmative | 5,252,813,997.03 | 94.480 |
Withheld | 306,891,091.87 | 5.520 |
TOTAL | 5,559,705,088.90 | 100.000 |
Donald J. Kirk |
Affirmative | 5,268,337,458.03 | 94.759 |
Withheld | 291,367,630.87 | 5.241 |
TOTAL | 5,559,705,088.90 | 100.000 |
| # of
Votes | % of
Votes |
Marie L. Knowles |
Affirmative | 5,278,993,264.93 | 94.951 |
Withheld | 280,711,823.97 | 5.049 |
TOTAL | 5,559,705,088.90 | 100.000 |
Ned C. Lautenbach |
Affirmative | 5,280,591,428.18 | 94.980 |
Withheld | 279,113,660.72 | 5.020 |
TOTAL | 5,559,705,088.90 | 100.000 |
Marvin L. Mann |
Affirmative | 5,266,769,335.50 | 94.731 |
Withheld | 292,935,753.40 | 5.269 |
TOTAL | 5,559,705,088.90 | 100.000 |
William O. McCoy |
Affirmative | 5,270,804,685.62 | 94.804 |
Withheld | 288,900,403.28 | 5.196 |
TOTAL | 5,559,705,088.90 | 100.000 |
Robert L. Reynolds |
Affirmative | 5,279,190,479.65 | 94.955 |
Withheld | 280,514,609.25 | 5.045 |
TOTAL | 5,559,705,088.90 | 100.000 |
Cornelia M. Small B |
Affirmative | 5,276,074,654.01 | 94.898 |
Withheld | 283,630,434.89 | 5.102 |
TOTAL | 5,559,705,088.90 | 100.000 |
William S. Stavropoulos |
Affirmative | 5,278,183,775.21 | 94.936 |
Withheld | 281,521,313.69 | 5.064 |
TOTAL | 5,559,705,088.90 | 100.000 |
A Denotes trust-wide proposals and voting results. B Effective January 1, 2005. |
Annual Report
Investment Adviser
Fidelity Management & Research Company
Boston, MA
Investment Sub-Advisers
FMR Co., Inc.
Fidelity Management & Research (U.K.) Inc.
Fidelity Management & Research (Far East) Inc.
Fidelity Investments Japan Limited
Fidelity International Investment Advisors
Fidelity International Investment Advisors (U.K.) Limited
General Distributor
Fidelity Distributors Corporation
Boston, MA
Transfer and Shareholder Servicing Agent
Fidelity Investments Institutional Operations Company, Inc.
Boston, MA
Custodian
JPMorgan Chase Bank
New York, NY
VIPGI-ANN-0205
1.540026.107
Fidelity® Variable Insurance Products:
Growth Opportunities Portfolio
Annual Report
December 31, 2004
(2_fidelity_logos)(Registered_Trademark)
Contents
Performance | 3 | How the fund has done over time. |
Management's Discussion | 4 | The manager's review of fund performance, strategy and outlook. |
Shareholder Expense Example | 5 | An example of shareholder expenses. |
Investment Summary | 6 | A summary of the fund's investments at period end. |
Investments | 7 | A complete list of the fund's investments with their
market values. |
Financial Statements | 10 | Statements of assets and liabilities, operations, and
changes in net assets, as well as financial highlights. |
Notes | 14 | Notes to the financial statements. |
Report of Independent Registered Public Accounting Firm | 18 | |
Trustees and Officers | 19 | |
Distributions | 24 | |
Proxy Voting Results | 25 | |
| | |
To view a fund's proxy voting guidelines and proxy voting record for the 12-month period ended June 30, visit www.fidelity.com/proxyvotingresults or visit the Securities and Exchange Commission's (SEC) web site at www.sec.gov. You may also call 1-800-544-5429 to request a free copy of the proxy voting guidelines.
Fidelity Variable Insurance Products are separate account options which are purchased through a variable insurance contract.
Standard & Poor's, S&P and S&P 500 are registered service marks of The McGraw-Hill Companies, Inc. and have been licensed for use by Fidelity Distributors Corporation.
Other third party marks appearing herein are the property of their respective owners.
All other marks appearing herein are registered or unregistered trademarks or service marks of FMR Corp. or an affiliated company.
(Recycle graphic) This report is printed on recycled paper using soy-based inks.
This report and the financial statements contained herein are submitted for the general information of the shareholders of the fund. This report is not authorized for distribution to prospective investors in the fund unless preceded or accompanied by an effective prospectus.
A fund files its complete schedule of portfolio holdings with the SEC for the first and third quarters of each fiscal year on Form N-Q. Forms N-Q are available on the SEC's web site at http://www.sec.gov. A fund's Forms N-Q may be reviewed and copied at the SEC's Public Reference Room in Washington, DC. Information regarding the operation of the SEC's Public Reference Room may be obtained by calling 1-800-SEC-0330. For a complete list of a fund's portfolio holdings, view the most recent quarterly holdings report, semiannual report, or annual report on Fidelity's web site at http://www.advisor.fidelity.com.
NOT FDIC INSURED · MAY LOSE VALUE · NO BANK GUARANTEE
Neither the fund nor Fidelity Distributors Corporation is a bank.
Growth Opportunities Portfolio
Fidelity Variable Insurance Products: Growth Opportunities Portfolio
Performance: The Bottom Line
Average annual total return reflects the change in the value of an investment, assuming reinvestment of the class' dividend income and capital gains (the profits earned upon the sale of securities that have grown in value) and assuming a constant rate of performance each year. During periods of reimbursement by Fidelity, a fund's total return will be greater than it would be had the reimbursement not occurred. Performance numbers are net of all underlying fund operating expenses, but do not include any insurance charges imposed by your insurance company's separate account. If performance information included the effect of these additional charges, the total returns would have been lower. How a fund did yesterday is no guarantee of how it will do tomorrow.
Average Annual Total Returns
Periods ended December 31, 2004 | Past 1
year | Past 5
years | Life of
fund A |
Fidelity ® VIP: Growth Opportunities - Initial Class | 7.19% | -5.04% | 7.41% |
Fidelity VIP: Growth Opportunities - Service Class B | 7.06% | -5.14% | 7.33% |
Fidelity VIP: Growth Opportunities - Service Class 2 C | 6.89% | -5.30% | 7.25% |
A From January 3, 1995
B The initial offering of Service Class shares took place November 3, 1997. Performance for Service Class shares reflects an asset based service fee (12b-1 fee), and returns prior to November 3, 1997 are those of Initial Class and do not include the effects of Service Class 12b-1 fee. Had Service Class shares' 12b-1 fee been reflected, returns prior to November 3, 1997 would have been lower.
C The initial offering of Service Class 2 shares took place January 12, 2000. Performance for Service Class 2 shares reflects an asset based service fee (12b-1 fee). Returns from November 3, 1997 to January 12, 2000 are those of Service Class which reflect a different 12b-1 fee. Service Class 2 returns prior to November 3, 1997 are those of Initial Class and do not include the effects of a 12b-1 fee. Had Service Class 2 shares' 12b-1 fee been reflected, returns prior to January 12, 2000 would have been lower.
$10,000 Over Life of Fund
Let's say hypothetically that $10,000 was invested in Fidelity® Variable Insurance Products: Growth Opportunities Portfolio - Initial Class on January 3, 1995, when the fund started. The chart shows how the value of your investment would have changed, and also shows how the S&P 500® Index performed over the same period.

Annual Report
Fidelity Variable Insurance Products: Growth Opportunities
Comments from Bettina Doulton, Portfolio Manager of Fidelity® Variable Insurance Products: Growth Opportunities Portfolio
The year ending December 31, 2004, generally was positive for equity investors, as many stock market benchmarks produced double-digit gains. Broad-based themes included the continued dominance of small-cap stocks, which outperformed large-caps for the sixth consecutive year. The small-cap Russell 2000® Index was up 18.33% in 2004, while the larger-cap Standard & Poor's 500SM Index rose 10.88%. Value stocks ended the year well ahead of growth stocks: The Russell 3000® Value Index advanced 16.94%, compared to 6.93% for the Russell 3000 Growth Index. Energy and basic materials stocks led the market upward. Energy stocks were boosted by record-high oil prices, while strong demand from China helped support commodity prices. The health care sector was among the market's weakest performers. Technology also fell off the pace, though it was helped by a rally late in the year. The tech-heavy NASDAQ Composite® Index returned 9.15%, thanks primarily to a 14.87% jump in the fourth quarter. Elsewhere, the Dow Jones Industrial AverageSM gained 5.37% for the year.
For the year ending December 31, 2004, the fund underperformed both the S&P 500® and the LipperSM Variable Annuity Growth Funds Average, which returned 10.36%. Compared to the S&P 500, the fund's overweighting in weak-performing media and semiconductor stocks hurt performance. Traditional media plays such as Viacom and Spanish-language broadcasting company Univision were detractors, along with tech names National Semiconductor and Analog Devices. Underweighting strong-performing energy stocks also proved to be a disappointment. Energy companies Schlumberger, BP and Baker Hughes were among the fund's top relative and absolute performers, but underweighting such names as Exxon Mobil, ChevronTexaco and ConocoPhillips largely offset those gains. Another negative was the fund's large-cap bias in a period that favored smaller-cap stocks. On the positive side, good stock selection in consumer staples and health care boosted returns, led by personal product makers such as Gillette, eye-care company Alcon and health care services provider UnitedHealth Group.
The views expressed in this statement reflect those of the portfolio manager only through the end of the period of the report as stated on the cover and do not necessarily represent the views of Fidelity or any other person in the Fidelity organization. Any such views are subject to change at any time based upon market or other conditions and Fidelity disclaims any responsibility to update such views. These views may not be relied on as investment advice and, because investment decisions for a Fidelity fund are based on numerous factors, may not be relied on as an indication of trading intent on behalf of any Fidelity fund.
Growth Opportunities Portfolio
Fidelity Variable Insurance Products: Growth Opportunities Portfolio
As a shareholder of the Fund, you incur two types of costs: (1) transaction costs, and (2) ongoing costs, including management fees, distribution and/or service (12b-1) fees and other Fund expenses. This Example is intended to help you understand your ongoing costs (in dollars) of investing in the Fund and to compare these costs with the ongoing costs of investing in other mutual funds.
The Example is based on an investment of $1,000 invested at the beginning of the period and held for the entire period (July 1, 2004 to December 31, 2004).
Actual Expenses
The first line of the table below for each class of the Fund provides information about actual account values and actual expenses. You may use the information in this line, together with the amount you invested, to estimate the expenses that you paid over the period. Simply divide your account value by $1,000.00 (for example, an $8,600 account value divided by $1,000.00 = 8.6), then multiply the result by the number in the first line for a class of the Fund under the heading entitled "Expenses Paid During Period" to estimate the expenses you paid on your account during this period. The estimate of expenses does not include any fees or other expenses of any variable annuity or variable life insurance product. If they were, the estimate of expenses you paid during the period would be higher, and your ending account value would be lower.
Hypothetical Example for Comparison Purposes
The second line of the table below for each class of the Fund provides information about hypothetical account values and hypothetical expenses based on a Class' actual expense ratio and an assumed rate of return of 5% per year before expenses, which is not the Class' actual return. The hypothetical account values and expenses may not be used to estimate the actual ending account balance or expenses you paid for the period. You may use this information to compare the ongoing costs of investing in the Fund and other funds. To do so, compare this 5% hypothetical example with the 5% hypothetical examples that appear in the shareholder reports of the other funds. The estimate of expenses does not include any fees or other expenses of any variable annuity or variable life insurance product. If they were, the estimate of expenses you paid during the period would be higher, and your ending account value would be lower.
Please note that the expenses shown in the table are meant to highlight your ongoing costs only and do not reflect any transaction costs. Therefore, the second line of the table is useful in comparing ongoing costs only, and will not help you determine the relative total costs of owning different funds.
| Beginning
Account Value
July 1, 2004 | Ending
Account Value
December 31, 2004 | Expenses Paid
During Period*
July 1, 2004
to December 31, 2004 |
Initial Class | | | |
Actual | $ 1,000.00 | $ 1,056.50 | $ 3.83 |
HypotheticalA | $ 1,000.00 | $ 1,021.42 | $ 3.76 |
Service Class | | | |
Actual | $ 1,000.00 | $ 1,055.90 | $ 4.34 |
HypotheticalA | $ 1,000.00 | $ 1,020.91 | $ 4.27 |
Service Class 2 | | | |
Actual | $ 1,000.00 | $ 1,054.90 | $ 5.17 |
HypotheticalA | $ 1,000.00 | $ 1,020.11 | $ 5.08 |
A 5% return per year before expenses
* Expenses are equal to each Class' annualized expense ratio (shown in the table below); multiplied by the average account value over the period, multiplied by 184/366 (to reflect the one-half year period).
| Annualized
Expense Ratio |
Initial Class | .74% |
Service Class | .84% |
Service Class 2 | 1.00% |
Annual Report
Fidelity Variable Insurance Products: Growth Opportunities Portfolio
Top Five Stocks as of December 31, 2004 |
| % of fund's net assets |
General Electric Co. | 3.8 |
Bank of America Corp. | 2.9 |
Microsoft Corp. | 2.5 |
Exxon Mobil Corp. | 2.3 |
American Express Co. | 2.2 |
| 13.7 |
Top Five Market Sectors as of December 31, 2004 |
| % of fund's net assets |
Information Technology | 21.4 |
Consumer Discretionary | 17.3 |
Financials | 16.2 |
Industrials | 12.4 |
Health Care | 9.9 |
Asset Allocation as of December 31, 2004 |
% of fund's net assets* |
 | Stocks | 95.0% | |
 | Short-Term Investments and Net Other Assets | 5.0% | |
* Foreign investments | 4.7% | |

Growth Opportunities Portfolio
Fidelity Variable Insurance Products: Growth Opportunities Portfolio
Showing Percentage of Net Assets
Common Stocks - 94.7% |
| Shares | | Value (Note 1) |
CONSUMER DISCRETIONARY - 17.3% |
Automobiles - 0.2% |
Harley-Davidson, Inc. | 30,400 | | $ 1,846,800 |
Hotels, Restaurants & Leisure - 1.8% |
Carnival Corp. unit | 39,000 | | 2,247,570 |
Hilton Hotels Corp. | 210,170 | | 4,779,266 |
Royal Caribbean Cruises Ltd. | 23,500 | | 1,279,340 |
Starwood Hotels & Resorts Worldwide, Inc. unit | 85,200 | | 4,975,680 |
| | 13,281,856 |
Internet & Catalog Retail - 0.7% |
eBay, Inc. (a) | 43,400 | | 5,046,552 |
Leisure Equipment & Products - 0.3% |
Brunswick Corp. | 40,900 | | 2,024,550 |
Media - 9.8% |
Clear Channel Communications, Inc. | 42,600 | | 1,426,674 |
DreamWorks Animation SKG, Inc.
Class A | 26,000 | | 975,260 |
Fox Entertainment Group, Inc.
Class A (a) | 245,300 | | 7,668,078 |
Grupo Televisa SA de CV
sponsored ADR | 38,000 | | 2,299,000 |
Lamar Advertising Co. Class A (a) | 45,600 | | 1,950,768 |
Martha Stewart Living Omnimedia, Inc. Class A (a)(d) | 88,500 | | 2,568,270 |
McGraw-Hill Companies, Inc. | 68,000 | | 6,224,720 |
Meredith Corp. | 41,800 | | 2,265,560 |
News Corp. Class B (d) | 547,700 | | 10,515,840 |
Omnicom Group, Inc. | 105,400 | | 8,887,328 |
Time Warner, Inc. (a) | 212,300 | | 4,127,112 |
Univision Communications, Inc.
Class A (a) | 230,700 | | 6,752,589 |
Viacom, Inc. Class B (non-vtg.) | 204,420 | | 7,438,844 |
Walt Disney Co. | 256,700 | | 7,136,260 |
XM Satellite Radio Holdings, Inc.
Class A (a) | 49,400 | | 1,858,428 |
| | 72,094,731 |
Multiline Retail - 1.1% |
Kmart Holding Corp. (a)(d) | 12,700 | | 1,256,665 |
Kohl's Corp. (a) | 49,400 | | 2,428,998 |
Nordstrom, Inc. | 95,000 | | 4,439,350 |
| | 8,125,013 |
Specialty Retail - 2.3% |
Best Buy Co., Inc. | 32,500 | | 1,931,150 |
Home Depot, Inc. | 210,600 | | 9,001,044 |
Lowe's Companies, Inc. | 6,800 | | 391,612 |
Staples, Inc. | 157,097 | | 5,295,740 |
| | 16,619,546 |
Textiles, Apparel & Luxury Goods - 1.1% |
Coach, Inc. (a) | 24,800 | | 1,398,720 |
NIKE, Inc. Class B | 23,900 | | 2,167,491 |
|
| Shares | | Value (Note 1) |
Polo Ralph Lauren Corp. Class A | 91,100 | | $ 3,880,860 |
Warnaco Group, Inc. (a) | 44,200 | | 954,720 |
| | 8,401,791 |
TOTAL CONSUMER DISCRETIONARY | | 127,440,839 |
CONSUMER STAPLES - 7.0% |
Beverages - 0.6% |
PepsiCo, Inc. | 80,600 | | 4,207,320 |
Food & Staples Retailing - 2.0% |
CVS Corp. | 71,600 | | 3,227,012 |
Wal-Mart Stores, Inc. | 217,700 | | 11,498,914 |
| | 14,725,926 |
Food Products - 1.4% |
Archer-Daniels-Midland Co. | 144,000 | | 3,212,640 |
Bunge Ltd. | 77,200 | | 4,401,172 |
Hershey Foods Corp. | 45,000 | | 2,499,300 |
| | 10,113,112 |
Household Products - 0.2% |
Procter & Gamble Co. | 21,640 | | 1,191,931 |
Personal Products - 1.9% |
Gillette Co. | 319,370 | | 14,301,389 |
Tobacco - 0.9% |
Altria Group, Inc. | 110,420 | | 6,746,662 |
TOTAL CONSUMER STAPLES | | 51,286,340 |
ENERGY - 6.3% |
Energy Equipment & Services - 3.1% |
Baker Hughes, Inc. | 65,700 | | 2,803,419 |
Halliburton Co. | 149,000 | | 5,846,760 |
Schlumberger Ltd. (NY Shares) | 210,600 | | 14,099,670 |
| | 22,749,849 |
Oil & Gas - 3.2% |
BP PLC sponsored ADR | 109,490 | | 6,394,216 |
Exxon Mobil Corp. | 329,700 | | 16,900,422 |
| | 23,294,638 |
TOTAL ENERGY | | 46,044,487 |
FINANCIALS - 15.9% |
Capital Markets - 5.7% |
Charles Schwab Corp. | 62,000 | | 741,520 |
E*TRADE Financial Corp. (a) | 322,500 | | 4,821,375 |
Goldman Sachs Group, Inc. | 111,600 | | 11,610,864 |
Lehman Brothers Holdings, Inc. | 48,200 | | 4,216,536 |
Merrill Lynch & Co., Inc. | 224,400 | | 13,412,388 |
Morgan Stanley | 123,900 | | 6,878,928 |
| | 41,681,611 |
Common Stocks - continued |
| Shares | | Value (Note 1) |
FINANCIALS - continued |
Commercial Banks - 3.8% |
Bank of America Corp. | 457,600 | | $ 21,502,624 |
Wells Fargo & Co. | 105,500 | | 6,556,825 |
| | 28,059,449 |
Consumer Finance - 2.7% |
American Express Co. | 283,600 | | 15,986,532 |
SLM Corp. | 67,900 | | 3,625,181 |
| | 19,611,713 |
Diversified Financial Services - 1.6% |
Citigroup, Inc. | 247,207 | | 11,910,433 |
Insurance - 2.1% |
American International Group, Inc. | 237,262 | | 15,580,996 |
TOTAL FINANCIALS | | 116,844,202 |
HEALTH CARE - 9.9% |
Biotechnology - 1.1% |
Genentech, Inc. (a) | 74,900 | | 4,077,556 |
Genzyme Corp. - General Division (a) | 36,000 | | 2,090,520 |
OSI Pharmaceuticals, Inc. (a) | 22,000 | | 1,646,700 |
| | 7,814,776 |
Health Care Equipment & Supplies - 2.9% |
Alcon, Inc. | 41,100 | | 3,312,660 |
Becton, Dickinson & Co. | 74,700 | | 4,242,960 |
Boston Scientific Corp. (a) | 35,700 | | 1,269,135 |
C.R. Bard, Inc. | 47,600 | | 3,045,448 |
Dade Behring Holdings, Inc. (a) | 47,500 | | 2,660,000 |
Medtronic, Inc. | 71,300 | | 3,541,471 |
St. Jude Medical, Inc. (a) | 85,660 | | 3,591,724 |
| | 21,663,398 |
Health Care Providers & Services - 1.6% |
UnitedHealth Group, Inc. | 130,300 | | 11,470,309 |
Pharmaceuticals - 4.3% |
Abbott Laboratories | 44,430 | | 2,072,660 |
Johnson & Johnson | 151,200 | | 9,589,104 |
Pfizer, Inc. | 368,193 | | 9,900,710 |
Schering-Plough Corp. | 76,000 | | 1,586,880 |
Wyeth | 198,500 | | 8,454,115 |
| | 31,603,469 |
TOTAL HEALTH CARE | | 72,551,952 |
INDUSTRIALS - 12.4% |
Aerospace & Defense - 2.3% |
Honeywell International, Inc. | 212,900 | | 7,538,789 |
Lockheed Martin Corp. | 19,100 | | 1,061,005 |
Northrop Grumman Corp. | 39,000 | | 2,120,040 |
The Boeing Co. | 114,100 | | 5,906,957 |
| | 16,626,791 |
|
| Shares | | Value (Note 1) |
Air Freight & Logistics - 2.6% |
FedEx Corp. | 121,800 | | $ 11,996,082 |
United Parcel Service, Inc. Class B | 83,500 | | 7,135,910 |
| | 19,131,992 |
Airlines - 0.4% |
Southwest Airlines Co. | 170,150 | | 2,770,042 |
Commercial Services & Supplies - 0.2% |
Monster Worldwide, Inc. (a) | 41,200 | | 1,385,968 |
Construction & Engineering - 0.4% |
Fluor Corp. | 59,500 | | 3,243,345 |
Industrial Conglomerates - 5.7% |
3M Co. | 59,700 | | 4,899,579 |
General Electric Co. | 769,450 | | 28,084,923 |
Tyco International Ltd. | 242,900 | | 8,681,246 |
| | 41,665,748 |
Machinery - 0.8% |
Caterpillar, Inc. | 26,000 | | 2,535,260 |
Deere & Co. | 47,600 | | 3,541,440 |
| | 6,076,700 |
TOTAL INDUSTRIALS | | 90,900,586 |
INFORMATION TECHNOLOGY - 21.4% |
Communications Equipment - 6.2% |
Avaya, Inc. (a) | 83,400 | | 1,434,480 |
Cisco Systems, Inc. (a) | 514,060 | | 9,921,358 |
Extreme Networks, Inc. (a) | 6,900 | | 45,195 |
Juniper Networks, Inc. (a) | 510,000 | | 13,866,900 |
Motorola, Inc. | 405,800 | | 6,979,760 |
QUALCOMM, Inc. | 308,800 | | 13,093,120 |
| | 45,340,813 |
Computers & Peripherals - 4.2% |
Dell, Inc. (a) | 207,200 | | 8,731,408 |
Diebold, Inc. | 89,100 | | 4,965,543 |
EMC Corp. (a) | 190,700 | | 2,835,709 |
Network Appliance, Inc. (a) | 421,800 | | 14,012,196 |
| | 30,544,856 |
Electronic Equipment & Instruments - 0.3% |
CDW Corp. | 27,300 | | 1,811,355 |
Internet Software & Services - 1.0% |
Yahoo!, Inc. (a) | 201,500 | | 7,592,520 |
IT Services - 0.3% |
Affiliated Computer Services, Inc.
Class A (a) | 31,700 | | 1,908,023 |
Office Electronics - 0.4% |
Xerox Corp. (a) | 192,200 | | 3,269,322 |
Semiconductors & Semiconductor Equipment - 4.5% |
Advanced Micro Devices, Inc. (a) | 69,700 | | 1,534,794 |
Altera Corp. (a) | 63,400 | | 1,312,380 |
Analog Devices, Inc. | 112,100 | | 4,138,732 |
Freescale Semiconductor, Inc. Class B | 96,286 | | 1,767,811 |
Common Stocks - continued |
| Shares | | Value (Note 1) |
INFORMATION TECHNOLOGY - continued |
Semiconductors & Semiconductor Equipment - continued |
Intel Corp. | 400,110 | | $ 9,358,573 |
KLA-Tencor Corp. (a) | 16,300 | | 759,254 |
Marvell Technology Group Ltd. (a) | 32,100 | | 1,138,587 |
National Semiconductor Corp. | 321,600 | | 5,772,720 |
Texas Instruments, Inc. | 303,500 | | 7,472,170 |
Xilinx, Inc. | 3,300 | | 97,845 |
| | 33,352,866 |
Software - 4.5% |
Microsoft Corp. | 684,120 | | 18,272,845 |
Oracle Corp. (a) | 201,700 | | 2,767,324 |
Red Hat, Inc. (a) | 197,699 | | 2,639,282 |
Symantec Corp. (a) | 211,466 | | 5,447,364 |
VERITAS Software Corp. (a) | 136,600 | | 3,899,930 |
| | 33,026,745 |
TOTAL INFORMATION TECHNOLOGY | | 156,846,500 |
MATERIALS - 2.6% |
Chemicals - 2.6% |
Dow Chemical Co. | 142,100 | | 7,035,371 |
Monsanto Co. | 103,500 | | 5,749,425 |
Praxair, Inc. | 143,300 | | 6,326,695 |
| | 19,111,491 |
TELECOMMUNICATION SERVICES - 1.9% |
Diversified Telecommunication Services - 1.8% |
SBC Communications, Inc. | 231,060 | | 5,954,416 |
Verizon Communications, Inc. | 173,800 | | 7,040,638 |
| | 12,995,054 |
Wireless Telecommunication Services - 0.1% |
SpectraSite, Inc. (a) | 18,200 | | 1,053,780 |
TOTAL TELECOMMUNICATION SERVICES | | 14,048,834 |
TOTAL COMMON STOCKS (Cost $538,285,820) | 695,075,231 |
Convertible Preferred Stocks - 0.3% |
| | | |
FINANCIALS - 0.3% |
Thrifts & Mortgage Finance - 0.3% |
Fannie Mae 5.375% | 20 | | 2,107,500 |
TOTAL CONVERTIBLE PREFERRED STOCKS (Cost $2,000,000) | 2,107,500 |
Money Market Funds - 5.2% |
| Shares | | Value (Note 1) |
Fidelity Cash Central Fund, 2.24% (b) | 30,774,121 | | $ 30,774,121 |
Fidelity Securities Lending Cash Central Fund, 2.23% (b)(c) | 7,454,150 | | 7,454,150 |
TOTAL MONEY MARKET FUNDS (Cost $38,228,271) | 38,228,271 |
TOTAL INVESTMENT
PORTFOLIO - 100.2% (Cost $578,514,091) | | 735,411,002 |
NET OTHER ASSETS - (0.2)% | | (1,607,777) |
NET ASSETS - 100% | $ 733,803,225 |
Legend |
(a) Non-income producing |
(b) Affiliated fund that is available only to investment companies and other accounts managed by Fidelity Investments. The rate quoted is the annualized seven-day yield of the fund at period end. A complete listing of the fund's holdings as of its most recent fiscal year end is available upon request. |
(c) Includes investment made with cash collateral received from securities on loan. |
(d) Security or a portion of the security is on loan at period end. |
Income Tax Information |
At December 31, 2004, the fund had a capital loss carryforward of approximately $265,682,000 of which $189,000, $149,878,000 and $115,615,000 will expire on December 31, 2008, 2009 and 2010, respectively. |
See accompanying notes which are an integral part of the financial statements.
Annual Report
Fidelity Variable Insurance Products: Growth Opportunities Portfolio
Statement of Assets and Liabilities
Assets | | |
Investment in securities, at value (including securities loaned of $7,237,330) (cost $578,514,091) - See accompanying schedule | | $ 735,411,002 |
Cash | | 3,055 |
Receivable for investments sold | | 11,249,546 |
Receivable for fund shares sold | | 135,855 |
Dividends receivable | | 703,580 |
Interest receivable | | 65,698 |
Prepaid expenses | | 2,788 |
Other receivables | | 106,538 |
Total assets | | 747,678,062 |
| | |
Liabilities | | |
Payable for investments purchased | $ 5,156,285 | |
Payable for fund shares redeemed | 636,421 | |
Accrued management fee | 347,845 | |
Distribution fees payable | 30,301 | |
Other affiliated payables | 63,647 | |
Other payables and accrued expenses | 186,188 | |
Collateral on securities loaned, at value | 7,454,150 | |
Total liabilities | | 13,874,837 |
| | |
Net Assets | | $ 733,803,225 |
Net Assets consist of: | | |
Paid in capital | | $ 838,195,433 |
Undistributed net investment income | | 6,108,550 |
Accumulated undistributed net realized gain (loss) on investments and foreign currency transactions | | (267,397,669) |
Net unrealized appreciation (depreciation) on investments | | 156,896,911 |
Net Assets | | $ 733,803,225 |
| | |
Initial Class:
Net Asset Value, offering price and redemption price
per share ($459,975,294 ÷ 28,629,430 shares) | | $ 16.07 |
| | |
Service Class:
Net Asset Value, offering price and redemption price
per share ($212,890,231 ÷ 13,261,966 shares) | | $ 16.05 |
| | |
Service Class 2:
Net Asset Value, offering price and redemption price
per share ($60,937,700 ÷ 3,817,776 shares) | | $ 15.96 |
Statement of Operations
Year ended December 31, 2004 |
Investment Income | | |
Dividends | | $ 9,314,024 |
Special Dividends | | 2,052,360 |
Interest | | 376,235 |
Security lending | | 80,267 |
Total income | | 11,822,886 |
| | |
Expenses | | |
Management fee | $ 4,230,844 | |
Transfer agent fees | 507,306 | |
Distribution fees | 361,674 | |
Accounting and security lending fees | 275,838 | |
Non-interested trustees' compensation | 4,060 | |
Custodian fees and expenses | 23,270 | |
Audit | 42,178 | |
Legal | 2,383 | |
Miscellaneous | 199,827 | |
Total expenses before reductions | 5,647,380 | |
Expense reductions | (139,491) | 5,507,889 |
Net investment income (loss) | | 6,314,997 |
Realized and Unrealized Gain (Loss) Net realized gain (loss) on: | | |
Investment securities | 13,616,926 | |
Foreign currency transactions | 7,633 | |
Futures contracts | 1,324,924 | |
Total net realized gain (loss) | | 14,949,483 |
Change in net unrealized appreciation (depreciation) on: Investment securities | 27,611,661 | |
Assets and liabilities in foreign currencies | (9,841) | |
Futures contracts | (853,313) | |
Total change in net unrealized appreciation (depreciation) | | 26,748,507 |
Net gain (loss) | | 41,697,990 |
Net increase (decrease) in net assets resulting from operations | | $ 48,012,987 |
See accompanying notes which are an integral part of the financial statements.
Growth Opportunities Portfolio
Fidelity Variable Insurance Products: Growth Opportunities Portfolio
Financial Statements - continued
Statement of Changes in Net Assets
| Year ended
December 31,
2004 | Year ended
December 31,
2003 |
Increase (Decrease) in Net Assets | | |
Operations | | |
Net investment income (loss) | $ 6,314,997 | $ 3,979,285 |
Net realized gain (loss) | 14,949,483 | 18,204,829 |
Change in net unrealized appreciation (depreciation) | 26,748,507 | 154,484,695 |
Net increase (decrease) in net assets resulting from operations | 48,012,987 | 176,668,809 |
Distributions to shareholders from net investment income | (3,865,122) | (4,842,328) |
Share transactions - net increase (decrease) | (85,843,295) | (29,607,058) |
Total increase (decrease) in net assets | (41,695,430) | 142,219,423 |
| | |
Net Assets | | |
Beginning of period | 775,498,655 | 633,279,232 |
End of period (including undistributed net investment income of $6,108,550 and undistributed net investment income of $3,663,993, respectively) | $ 733,803,225 | $ 775,498,655 |
Other Information: | | | |
Share Transactions | Year ended December 31, 2004 |
| Initial Class | Service Class | Service Class 2 |
Shares Sold | 2,729,868 | 870,070 | 885,612 |
Reinvested | 170,805 | 67,879 | 13,011 |
Redeemed | (6,832,162) | (2,590,797) | (1,093,977) |
Net increase (decrease) | (3,931,489) | (1,652,848) | (195,354) |
| | | |
Dollars Sold | $ 41,720,058 | $ 13,156,606 | $ 13,251,573 |
Reinvested | 2,623,558 | 1,042,625 | 198,939 |
Redeemed | (102,539,187) | (38,992,902) | (16,304,565) |
Net increase (decrease) | $ (58,195,571) | $ (24,793,671) | $ (2,854,053) |
| | | |
Share Transactions | Year ended December 31, 2003 |
| Initial Class | Service Class | Service Class 2 |
Shares Sold | 4,861,113 | 1,609,284 | 1,388,002 |
Reinvested | 309,123 | 114,933 | 19,452 |
Redeemed | (7,052,265) | (2,906,117) | (959,886) |
Net increase (decrease) | (1,882,029) | (1,181,900) | 447,568 |
| | | |
Dollars Sold | $ 63,883,410 | $ 21,117,379 | $ 18,018,110 |
Reinvested | 3,375,625 | 1,255,069 | 211,634 |
Redeemed | (88,846,190) | (36,517,831) | (12,104,264) |
Net increase (decrease) | $ (21,587,155) | $ (14,145,383) | $ 6,125,480 |
| | | |
Distributions | Year ended December 31, 2004 |
| Initial Class | Service Class | Service Class 2 |
From net investment income | $ 2,623,558 | $ 1,042,625 | $ 198,939 |
From net realized gain | - | - | - |
Total | $ 2,623,558 | $ 1,042,625 | $ 198,939 |
| Year ended December 31, 2003 |
| Initial Class | Service Class | Service Class 2 |
From net investment income | $ 3,375,625 | $ 1,255,069 | $ 211,634 |
From net realized gain | - | - | - |
Total | $ 3,375,625 | $ 1,255,069 | $ 211,634 |
See accompanying notes which are an integral part of the financial statements.
Annual Report
Financial Highlights - Initial Class
Years ended December 31, | 2004 | 2003 | 2002 | 2001 | 2000 |
Selected Per-Share Data | | | | | |
Net asset value, beginning of period | $ 15.07 | $ 11.71 | $ 15.13 | $ 17.74 | $ 23.15 |
Income from Investment Operations | | | | | |
Net investment income (loss) C | .14 D | .08 | .09 | .12 | .06 |
Net realized and unrealized gain (loss) | .94 | 3.38 | (3.37) | (2.67) | (3.77) |
Total from investment operations | 1.08 | 3.46 | (3.28) | (2.55) | (3.71) |
Distributions from net investment income | (.08) | (.10) | (.14) | (.06) | (.29) |
Distributions from net realized gain | - | - | - | - | (1.41) |
Total distributions | (.08) | (.10) | (.14) | (.06) | (1.70) |
Net asset value, end of period | $ 16.07 | $ 15.07 | $ 11.71 | $ 15.13 | $ 17.74 |
Total Return A, B | 7.19% | 29.87% | (21.84)% | (14.42)% | (17.07)% |
Ratios to Average Net Assets E | | | | | |
Expenses before expense reductions | .72% | .72% | .70% | .69% | .68% |
Expenses net of voluntary waivers, if any | .72% | .72% | .70% | .69% | .68% |
Expenses net of all reductions | .70% | .70% | .66% | .67% | .66% |
Net investment income (loss) | .91% | .64% | .68% | .79% | .31% |
Supplemental Data | | | | | |
Net assets, end of period (000 omitted) | $ 459,975 | $ 490,710 | $ 403,476 | $ 652,493 | $ 951,875 |
Portfolio turnover rate | 65% | 62% | 60% | 89% | 117% |
A Total returns do not reflect charges attributable to your insurance company's separate account. Inclusion of these charges would reduce the total returns shown.
B Total returns would have been lower had certain expenses not been reduced during the periods shown.
C Calculated based on average shares outstanding during the period.
D Investment income per share reflects a special dividend which amounted to $.04 per share.
E Expense ratios reflect operating expenses of the class. Expenses before reductions do not reflect amounts reimbursed by the investment adviser or reductions from brokerage service arrangements or other expense offset arrangements and do not represent the amount paid by the class during periods when reimbursements or reductions occur. Expenses net of any voluntary waivers reflect expenses after reimbursement by the investment adviser but prior to reductions from brokerage service arrangements or other expense offset arrangements. Expenses net of all reductions represent the net expenses paid by the class.
Financial Highlights - Service Class
Years ended December 31, | 2004 | 2003 | 2002 | 2001 | 2000 |
Selected Per-Share Data | | | | | |
Net asset value, beginning of period | $ 15.06 | $ 11.70 | $ 15.11 | $ 17.71 | $ 23.12 |
Income from Investment Operations | | | | | |
Net investment income (loss) C | .12 D | .07 | .08 | .11 | .04 |
Net realized and unrealized gain (loss) | .94 | 3.37 | (3.37) | (2.67) | (3.76) |
Total from investment operations | 1.06 | 3.44 | (3.29) | (2.56) | (3.72) |
Distributions from net investment income | (.07) | (.08) | (.12) | (.04) | (.28) |
Distributions from net realized gain | - | - | - | - | (1.41) |
Total distributions | (.07) | (.08) | (.12) | (.04) | (1.69) |
Net asset value, end of period | $ 16.05 | $ 15.06 | $ 11.70 | $ 15.11 | $ 17.71 |
Total Return A, B | 7.06% | 29.66% | (21.92)% | (14.49)% | (17.13)% |
Ratios to Average Net Assets E | | | | | |
Expenses before expense reductions | .82% | .82% | .80% | .79% | .79% |
Expenses net of voluntary waivers, if any | .82% | .82% | .80% | .79% | .79% |
Expenses net of all reductions | .80% | .80% | .77% | .77% | .76% |
Net investment income (loss) | .81% | .54% | .58% | .69% | .21% |
Supplemental Data | | | | | |
Net assets, end of period (000 omitted) | $ 212,890 | $ 224,660 | $ 188,318 | $ 278,446 | $ 345,960 |
Portfolio turnover rate | 65% | 62% | 60% | 89% | 117% |
A Total returns do not reflect charges attributable to your insurance company's separate account. Inclusion of these charges would reduce the total returns shown.
B Total returns would have been lower had certain expenses not been reduced during the periods shown.
C Calculated based on average shares outstanding during the period.
D Investment income per share reflects a special dividend which amounted to $.04 per share.
E Expense ratios reflect operating expenses of the class. Expenses before reductions do not reflect amounts reimbursed by the investment adviser or reductions from brokerage service arrangements or other expense offset arrangements and do not represent the amount paid by the class during periods when reimbursements or reductions occur. Expenses net of any voluntary waivers reflect expenses after reimbursement by the investment adviser but prior to reductions from brokerage service arrangements or other expense offset arrangements. Expenses net of all reductions represent the net expenses paid by the class.
See accompanying notes which are an integral part of the financial statements.
Growth Opportunities Portfolio
Financial Highlights - Service Class 2
Years ended December 31, | 2004 | 2003 | 2002 | 2001 | 2000 G |
Selected Per-Share Data | | | | | |
Net asset value, beginning of period | $ 14.98 | $ 11.64 | $ 15.04 | $ 17.68 | $ 22.70 |
Income from Investment Operations | | | | | |
Net investment income (loss) E | .10 F | .05 | .05 | .08 | .01 |
Net realized and unrealized gain (loss) | .93 | 3.35 | (3.34) | (2.66) | (3.34) |
Total from investment operations | 1.03 | 3.40 | (3.29) | (2.58) | (3.33) |
Distributions from net investment income | (.05) | (.06) | (.11) | (.06) | (.28) |
Distributions from net realized gain | - | - | - | - | (1.41) |
Total distributions | (.05) | (.06) | (.11) | (.06) | (1.69) |
Net asset value, end of period | $ 15.96 | $ 14.98 | $ 11.64 | $ 15.04 | $ 17.68 |
Total Return B, C, D | 6.89% | 29.40% | (22.01)% | (14.64)% | (15.74)% |
Ratios to Average Net Assets H | | | | | |
Expenses before expense reductions | .98% | .99% | .97% | .95% | .95% A |
Expenses net of voluntary waivers, if any | .98% | .99% | .97% | .95% | .95% A |
Expenses net of all reductions | .96% | .96% | .94% | .93% | .93% A |
Net investment income (loss) | .65% | .37% | .41% | .53% | .04% A |
Supplemental Data | | | | | |
Net assets, end of period (000 omitted) | $ 60,938 | $ 60,129 | $ 41,486 | $ 44,643 | $ 25,827 |
Portfolio turnover rate | 65% | 62% | 60% | 89% | 117% |
A Annualized
B Total returns for periods of less than one year are not annualized.
C Total returns do not reflect charges attributable to your insurance company's separate account. Inclusion of these charges would reduce the total returns shown.
D Total returns would have been lower had certain expenses not been reduced during the periods shown.
E Calculated based on average shares outstanding during the period.
F Investment income per share reflects a special dividend which amounted to $.04 per share.
G For the period January 12, 2000 (commencement of sale of shares) to December 31, 2000.
H Expense ratios reflect operating expenses of the class. Expenses before reductions do not reflect amounts reimbursed by the investment adviser or reductions from brokerage service arrangements or other expense offset arrangements and do not represent the amount paid by the class during periods when reimbursements or reductions occur. Expense ratios before reductions for start-up periods may not be representative of longer-term operating periods. Expenses net of any voluntary waivers reflect expenses after reimbursement by the investment adviser but prior to reductions from brokerage service arrangements or other expense offset arrangements. Expenses net of all reductions represent the net expenses paid by the class.
See accompanying notes which are an integral part of the financial statements.
Annual Report
For the period ended December 31, 2004
1. Significant Accounting Policies.
Growth Opportunities Portfolio (the fund) is a fund of Variable Insurance Products Fund III (the trust) (referred to in this report as Fidelity Variable Insurance Products: Growth Opportunities Portfolio) and is authorized to issue an unlimited number of shares. The trust is registered under the Investment Company Act of 1940, as amended (the 1940 Act), as an open-end management investment company organized as a Massachusetts business trust. Shares of the fund may only be purchased by insurance companies for the purpose of funding variable annuity or variable life insurance contracts. The fund offers the following classes of shares: Initial Class shares, Service Class shares and Service Class 2 shares. All classes have equal rights and voting privileges, except for matters affecting a single class. Investment income, realized and unrealized capital gains and losses, the common expenses of the fund, and certain fund-level expense reductions, if any, are allocated on a pro rata basis to each class based on the relative net assets of each class to the total net assets of the fund. Each class differs with respect to distribution and service plan fees incurred. Certain expense reductions also differ by class.
The financial statements have been prepared in conformity with accounting principles generally accepted in the United States of America, which require management to make certain estimates and assumptions at the date of the financial statements. The following summarizes the significant accounting policies of the fund:
Security Valuation. Net asset value per share (NAV calculation) is calculated as of the close of business of the New York Stock Exchange, normally 4:00 p.m. Eastern time. Equity securities, including restricted securities, for which market quotations are available are valued at the last sale price or official closing price (closing bid price or last evaluated quote if no sale has occurred) on the primary market or exchange on which they trade. If prices are not readily available or do not accurately reflect fair value for a security, or if a security's value has been materially affected by events occurring after the close of the exchange or market on which the security is principally traded, that security may be valued by another method that the Board of Trustees believes accurately reflects fair value. A security's valuation may differ depending on the method used for determining value. Price movements in futures contracts and ADRs, market and trading trends, the bid/ask quotes of brokers and off-exchange institutional trading may be reviewed in the course of making a good faith determination of a security's fair value. Short-term securities with remaining maturities of sixty days or less for which quotations are not readily available are valued on the basis of amortized cost. Investments in open-end investment companies are valued at their net asset value each business day.
Foreign Currency. The fund uses foreign currency contracts to facilitate transactions in foreign-denominated securities. Losses from these transactions may arise from changes in the value of the foreign currency or if the counterparties do not perform under the contracts' terms.
Foreign-denominated assets, including investment securities, and liabilities are translated into U.S. dollars at the exchange rate at period end. Purchases and sales of investment securities, income and dividends received and expenses denominated in foreign currencies are translated into U.S. dollars at the exchange rate in effect on the transaction date.
The effects of exchange rate fluctuations on investments are included with the net realized and unrealized gain (loss) on investment securities. Other foreign currency transactions resulting in realized and unrealized gain (loss) are disclosed separately.
Investment Transactions and Income. Security transactions are accounted for as of trade date. Gains and losses on securities sold are determined on the basis of identified cost and may include proceeds received from litigation. Dividend income is recorded on the ex-dividend date, except for certain dividends from foreign securities where the ex-dividend date may have passed, which are recorded as soon as the fund is informed of the ex-dividend date. Non-cash dividends included in dividend income, if any, are recorded at the fair market value of the securities received. Distributions received on securities that represent a return of capital or capital gain are recorded as a reduction of cost of investments and/or as a realized gain. The fund estimates the components of distributions received that may be considered return of capital distributions or capital gain distributions. Large, non-recurring dividends recognized by the fund are presented separately on the Statement of Operations as "Special Dividends" and the impact of these dividends to net investment income per share is presented in the Financial Highlights. Interest income is accrued as earned. Interest income includes coupon interest and amortization of premium and accretion of discount on debt securities. Investment income is recorded net of foreign taxes withheld where recovery of such taxes is uncertain.
Expenses. Most expenses of the trust can be directly attributed to a fund. Expenses which cannot be directly attributed are apportioned among the funds in the trust.
Income Tax Information and Distributions to Shareholders. Each year, the fund intends to qualify as a regulated investment company by distributing all of its taxable income and realized gains under Subchapter M of the Internal Revenue Code. As a result, no provision for income taxes is required in the accompanying financial statements. Foreign taxes are provided for based on the fund's understanding of the tax rules and rates that exist in the foreign markets in which it invests.
Distributions are recorded on the ex-dividend date. Income dividends and capital gain distributions are declared separately for each class. Income and capital gain distributions are determined in accordance with income tax regulations, which may differ from generally accepted accounting principles.
Growth Opportunities Portfolio
Notes to Financial Statements - continued
1. Significant Accounting Policies - continued
Income Tax Information and Distributions to Shareholders - continued
Capital accounts within the financial statements are adjusted for permanent book-tax differences. These adjustments have no impact on net assets or the results of operations. Temporary book-tax differences will reverse in a subsequent period.
Book-tax differences are primarily due to futures transactions, foreign currency transactions, capital loss carryforwards, and losses deferred due to wash sales.
The tax-basis components of distributable earnings and the federal tax cost as of period end were as follows:
Unrealized appreciation | $ 165,058,633 | |
Unrealized depreciation | (9,887,045) | |
Net unrealized appreciation (depreciation) | 155,171,588 | |
Undistributed ordinary income | 6,118,258 | |
Capital loss carryforward | (265,681,565) | |
| | |
Cost for federal income tax purposes | $ 580,239,414 | |
The tax character of distributions paid was as follows:
| December 31, 2004 | December 31, 2003 |
Ordinary Income | $ 3,865,122 | $ 4,842,328 |
2. Operating Policies.
Repurchase Agreements. Fidelity Management & Research Company (FMR) has received an Exemptive Order from the Securities and Exchange Commission (the SEC) which permits the fund and other affiliated entities of FMR to transfer uninvested cash balances into joint trading accounts. These accounts are then invested in repurchase agreements that are collateralized by U.S. Treasury or Government obligations. The fund may also invest directly with institutions, in repurchase agreements that are collateralized by commercial paper obligations and corporate obligations. Collateral is held in segregated accounts with custodian banks and may be obtained in the event of a default of the counterparty. Collateral is marked-to-market daily and maintained at a value at least equal to the principal amount of the repurchase agreement (including accrued interest).
Futures Contracts. The fund may use futures contracts to manage its exposure to the stock market. Buying futures tends to increase the fund's exposure to the underlying instrument, while selling futures tends to decrease the fund's exposure to the underlying instrument or hedge other fund investments. Losses may arise from changes in the value of the underlying instruments or if the counter-parties do not perform under the contracts' terms. Gains (losses) are realized upon the expiration or closing of the futures contracts. Futures contracts are valued at the settlement price established each day by the board of trade or exchange on which they are traded.
3. Purchases and Sales of Investments.
Purchases and sales of securities, other than short-term securities and U.S. government securities, aggregated $462,835,321 and $533,581,152, respectively.
4. Fees and Other Transactions with Affiliates.
Management Fee. FMR and its affiliates provide the fund with investment management related services for which the fund pays a monthly management fee. The management fee is the sum of an individual fund fee rate that is based on an annual rate of .30% of the fund's average net assets and a group fee rate that averaged .28% during the period. The group fee rate is based upon the average net assets of all the mutual funds advised by FMR. The group fee rate decreases as assets under management increase and increases as assets under management decrease. For the period, the total annual management fee rate was .58% of the fund's average net assets.
Distribution and Service Plan. In accordance with Rule 12b-1 of the 1940 Act, the fund has adopted separate 12b-1 Plans for each Service Class of shares. Each Service Class pays Fidelity Distributors Corporation (FDC), an affiliate of FMR, a service fee. For the period, the service fee is based on an annual rate of .10% of Service Class' average net assets and .25% of Service Class 2's average net assets.
Annual Report
4. Fees and Other Transactions with Affiliates - continued
Distribution and Service Plan - continued
For the period, each class paid FDC the following amounts, all of which were re-allowed to insurance companies for the distribution of shares and providing shareholder support services:
Service Class | $ 215,230 | |
Service Class 2 | 146,444 | |
| $ 361,674 | |
Transfer Agent Fees. Fidelity Investments Institutional Operations Company, Inc. (FIIOC), an affiliate of FMR, is the fund's transfer, dividend disbursing, and shareholder servicing agent. FIIOC receives an asset-based fee with respect to each account. FIIOC pays a portion of the expenses related to the typesetting, printing and mailing of shareholder reports, except proxy statements. Each class pays a transfer agent fee, excluding out of pocket expenses, equal to an annual rate of .07% of their month end net assets. For the period, the total transfer agent fees paid by each class to FIIOC, including out of pocket expenses, were as follows:
Initial Class | $ 312,303 | |
Service Class | 147,098 | |
Service Class 2 | 47,905 | |
| $ 507,306 | |
Accounting and Security Lending Fees. Fidelity Service Company, Inc. (FSC), an affiliate of FMR, maintains the fund's accounting records. The accounting fee is based on the level of average net assets for the month. Under a separate contract, FSC administers the security lending program. The security lending fee is based on the number and duration of lending transactions.
Central Funds. The fund may invest in affiliated Central Funds managed by Fidelity Investments Money Management, Inc. (FIMM), an affiliate of FMR. The Central Funds are open-end investment companies available only to investment companies and other accounts managed by FMR and its affiliates. The Central Funds seek preservation of capital and current income and do not pay a management fee. Income distributions earned by the fund are recorded as income in the accompanying financial statements and totaled $367,174 for the period.
Brokerage Commissions. The fund placed a portion of its portfolio transactions with brokerage firms which are affiliates of the investment adviser. The commissions paid to these affiliated firms were $24,963 for the period.
5. Committed Line of Credit.
The fund participates with other funds managed by FMR in a $4.2 billion credit facility (the "line of credit") to be utilized for temporary or emergency purposes to fund shareholder redemptions or for other short-term liquidity purposes. The fund has agreed to pay commitment fees on its pro rata portion of the line of credit. During the period, there were no borrowings on this line of credit.
6. Security Lending.
The fund lends portfolio securities from time to time in order to earn additional income. The fund receives collateral (in the form of U.S. Treasury obligations, letters of credit and/or cash) against the loaned securities and maintains collateral in an amount not less than 100% of the market value of the loaned securities during the period of the loan. The market value of the loaned securities is determined at the close of business of the fund and any additional required collateral is delivered to the fund on the next business day. If the borrower defaults on its obligation to return the securities loaned because of insolvency or other reasons, a fund could experience delays and costs in recovering the securities loaned or in gaining access to the collateral. Cash collateral is invested in cash equivalents. The value of loaned securities and cash collateral at period end are disclosed on the fund's Statement of Assets and Liabilities.
7. Expense Reductions.
Many of the brokers with whom FMR places trades on behalf of the fund provided services to the fund in addition to trade execution. These services included payments of certain expenses on behalf of the fund totaling $139,311 for the period. In addition, through arrangements with the fund's custodian, credits realized as a result of uninvested cash balances were used to reduce the fund's expenses. During the period, these credits reduced the fund's custody expenses by $180.
Growth Opportunities Portfolio
Notes to Financial Statements - continued
8. Other Information.
At the end of the period, FMR or its affiliates were the owners of record of 22% of the total outstanding shares of the fund and one otherwise unaffiliated shareholder was the owner of record of 44% of the total outstanding shares of the fund.
Annual Report
To the Trustees of Variable Insurance Products Fund III and Shareholders of Growth Opportunities Portfolio:
We have audited the accompanying statement of assets and liabilities of Growth Opportunities Portfolio (the Fund), a fund of Variable Insurance Products Fund III, including the portfolio of investments, as of December 31, 2004, and the related statement of operations for the year then ended, the statement of changes in net assets for each of the two years in the period then ended, and the financial highlights for each of the five years in the period then ended. These financial statements and financial highlights are the responsibility of the Fund's management. Our responsibility is to express an opinion on these financial statements and financial highlights based on our audits.
We conducted our audits in accordance with standards of the Public Company Accounting Oversight Board (United States). Those standards require that we plan and perform the audit to obtain reasonable assurance about whether the financial statements and financial highlights are free of material misstatement. An audit includes consideration of internal control over financial reporting as a basis for designing audit procedures that are appropriate in the circumstances, but not for the purpose of expressing an opinion on the effectiveness of the Fund's internal control over financial reporting. Accordingly, we express no such opinion. An audit also includes examining, on a test basis, evidence supporting the amounts and disclosures in the financial statements, assessing the accounting principles used and significant estimates made by management, as well as evaluating the overall financial statement presentation. Our procedures included confirmation of securities owned as of December 31, 2004, by correspondence with the custodians and brokers; where replies were not received from brokers, we performed other auditing procedures. We believe that our audits provide a reasonable basis for our opinion.
In our opinion, the financial statements and financial highlights referred to above present fairly, in all material respects, the financial position of Growth Opportunities Portfolio as of December 31, 2004, the results of its operations for the year then ended, the changes in its net assets for each of the two years in the period then ended, and its financial highlights for each of the five years in the period then ended, in conformity with accounting principles generally accepted in the United States of America.
/s/ DELOITTE & TOUCHE LLP
DELOITTE & TOUCHE LLP
Boston, Massachusetts
February 14, 2005
Growth Opportunities Portfolio
The Trustees, Member of the Advisory Board, and executive officers of the trust and fund, as applicable, are listed below. The Board of Trustees governs the fund and is responsible for protecting the interests of shareholders. The Trustees are experienced executives who meet periodically throughout the year to oversee the fund's activities, review contractual arrangements with companies that provide services to the fund, and review the fund's performance. Except for William O. McCoy, Dennis J. Dirks, and Kenneth L. Wolfe, each of the Trustees oversees 301 funds advised by FMR or an affiliate. Mr. McCoy oversees 303 funds advised by FMR or an affiliate. Mr. Dirks and Mr. Wolfe oversee 223 funds advised by FMR or an affiliate.
The Trustees hold office without limit in time except that (a) any Trustee may resign; (b) any Trustee may be removed by written instrument, signed by at least two-thirds of the number of Trustees prior to such removal; (c) any Trustee who requests to be retired or who has become incapacitated by illness or injury may be retired by written instrument signed by a majority of the other Trustees; and (d) any Trustee may be removed at any special meeting of shareholders by a two-thirds vote of the outstanding voting securities of the trust. In any event, each non-interested Trustee shall retire not later than the last day of the calendar year in which his or her 72nd birthday occurs. The executive officers and Advisory Board Member hold office without limit in time, except that any officer and Advisory Board Member may resign or may be removed by a vote of a majority of the Trustees at any regular meeting or any special meeting of the Trustees. Except as indicated, each individual has held the office shown or other offices in the same company for the past five years.
The fund's Statement of Additional Information (SAI) includes more information about the Trustees. To request a free copy, call Fidelity at 1-800-544-5429.
Interested Trustees*:
Correspondence intended for each Trustee who is an "interested person" (as defined in the 1940 Act) may be sent to Fidelity Investments, 82 Devonshire Street, Boston, Massachusetts 02109.
Name, Age; Principal Occupation |
Edward C. Johnson 3d (74)** |
| Year of Election or Appointment: 1994 Mr. Johnson is Chairman of the Board of Trustees. Mr. Johnson serves as Chief Executive Officer, Chairman, and a Director of FMR Corp.; a Director and Chairman of the Board and of the Executive Committee of FMR; Chairman and a Director of Fidelity Management & Research (Far East) Inc.; Chairman (1998) and a Director of Fidelity Investments Money Management, Inc.; and Chairman (2001) and a Director (2000) of FMR Co., Inc. |
Abigail P. Johnson (43)** |
| Year of Election or Appointment: 2001 Senior Vice President of VIP Growth Opportunities Portfolio (2001). Ms. Johnson also serves as Senior Vice President of other Fidelity funds (2001). She is President and a Director of FMR (2001), Fidelity Investments Money Management, Inc. (2001), FMR Co., Inc. (2001), and a Director of FMR Corp. Previously, Ms. Johnson managed a number of Fidelity funds. |
Laura B. Cronin (50) |
| Year of Election or Appointment: 2003 Ms. Cronin is an Executive Vice President (2002) and Chief Financial Officer (2002) of FMR Corp. and is a member of the Fidelity Management Committee (2003). Previously, Ms. Cronin served as Vice President of Finance of FMR (1997-1999), and Chief Financial Officer of FMR (1999-2001), Fidelity Personal Investments (2001), and Fidelity Brokerage Company (2001-2002). |
Robert L. Reynolds (52) |
| Year of Election or Appointment: 2003 Mr. Reynolds is a Director (2003) and Chief Operating Officer (2002) of FMR Corp. and is the head of the Fidelity Management Committee (2003). He also serves on the Board at Fidelity Investments Canada, Ltd. (2000). Previously, Mr. Reynolds served as President of Fidelity Investments Institutional Retirement Group (1996-2000). |
* Trustees have been determined to be "Interested Trustees" by virtue of, among other things, their affiliation with the trust or various entities under common control with FMR.
** Edward C. Johnson 3d, Trustee, is Abigail P. Johnson's father.
Annual Report
Trustees and Officers - continued
Non-Interested Trustees:
Correspondence intended for each non-interested Trustee (that is, the Trustees other than the Interested Trustees) may be sent to Fidelity Investments, P.O. Box 55235, Boston, Massachusetts 02205-5235.
Name, Age; Principal Occupation |
Dennis J. Dirks (56) |
| Year of Election or Appointment: 2005 Mr. Dirks also serves as a Trustee (2005) or Member of the Advisory Board (2004) of other investment companies advised by FMR. Prior to his retirement in May 2003, Mr. Dirks was Chief Operating Officer and a member of the Board of The Depository Trust & Clearing Corporation (DTCC) (1999-2003). He also served as President, Chief Operating Officer, and Board member of The Depository Trust Company (DTC) (1999-2003) and President and Board member of the National Securities Clearing Corporation (NSCC) (1999-2003). In addition, Mr. Dirks served as Chief Executive Officer and Board member of the Government Securities Clearing Corporation (2001-2003) and Chief Executive Officer and Board member of the Mortgage-Backed Securities Clearing Corporation (2001-2003). |
Robert M. Gates (61) |
| Year of Election or Appointment: 1997 Dr. Gates is Vice Chairman of the non-interested Trustees (2005). Dr. Gates is President of Texas A&M University (2002). He was Director of the Central Intelligence Agency (CIA) from 1991 to 1993. From 1989 to 1991, Dr. Gates served as Assistant to the President of the United States and Deputy National Security Advisor. Dr. Gates is a Director of NACCO Industries, Inc. (mining and manufacturing), Parker Drilling Co., Inc. (drilling and rental tools for the energy industry, 2001), and Brinker International (restaurant management, 2003). He also serves as a member of the Advisory Board of VoteHere.net (secure internet voting, 2001). Previously, Dr. Gates served as a Director of LucasVarity PLC (automotive components and diesel engines), a Director of TRW Inc. (automotive, space, defense, and information technology), and Dean of the George Bush School of Government and Public Service at Texas A&M University (1999-2001). Dr. Gates also is a Trustee of the Forum for International Policy. |
George H. Heilmeier (68) |
| Year of Election or Appointment: 2004 Dr. Heilmeier is Chairman Emeritus of Telcordia Technologies (communication software and systems), where prior to his retirement, he served as company Chairman and Chief Executive Officer. He currently serves on the Boards of Directors of The Mitre Corporation (systems engineering and information technology support for the government), INET Technologies Inc. (telecommunications network surveillance, 2001), Teletech Holdings (customer management services), and HRL Laboratories (private research and development, 2004). He is Chairman of the General Motors Technology Advisory Committee and a Life Fellow of the Institute of Electrical and Electronics Engineers (IEEE) (2000). Dr. Heilmeier is a member of the Defense Science Board and the National Security Agency Advisory Board. He is also a member of the National Academy of Engineering, the American Academy of Arts and Sciences, and the Board of Overseers of the School of Engineering and Applied Science of the University of Pennsylvania. Previously, Dr. Heilmeier served as a Director of TRW Inc. (automotive, space, defense, and information technology, 1992-2002), Compaq (1994-2002), and Automatic Data Processing, Inc. (ADP) (technology-based business outsourcing, 1995-2002). |
Marie L. Knowles (58) |
| Year of Election or Appointment: 2001 Prior to Ms. Knowles' retirement in June 2000, she served as Executive Vice President and Chief Financial Officer of Atlantic Richfield Company (ARCO) (diversified energy, 1996-2000). From 1993 to 1996, she was a Senior Vice President of ARCO and President of ARCO Transportation Company. She served as a Director of ARCO from 1996 to 1998. She currently serves as a Director of Phelps Dodge Corporation (copper mining and manufacturing) and McKesson Corporation (healthcare service, 2002). Ms. Knowles is a Trustee of the Brookings Institution and the Catalina Island Conservancy and also serves as a member of the Advisory Board for the School of Engineering of the University of Southern California. |
Ned C. Lautenbach (60) |
| Year of Election or Appointment: 2000 Mr. Lautenbach has been a partner of Clayton, Dubilier & Rice, Inc. (private equity investment firm) since September 1998. Previously, Mr. Lautenbach was with the International Business Machines Corporation (IBM) from 1968 until his retirement in 1998. He was most recently Senior Vice President and Group Executive of Worldwide Sales and Services. From 1993 to 1995, he was Chairman of IBM World Trade Corporation, and from 1994 to 1998 was a member of IBM's Corporate Executive Committee. Mr. Lautenbach serves as Co-Chairman and a Director of Covansys, Inc. (global provider of business and technology solutions, 2000). In addition, he is a Director of Italtel Holding S.p.A. (telecommunications (Milan, Italy), 2004) and Eaton Corporation (diversified industrial) as well as the Philharmonic Center for the Arts in Naples, Florida (1999). He also is a member of the Council on Foreign Relations. |
Marvin L. Mann (71) |
| Year of Election or Appointment: 1993 Mr. Mann is Chairman of the non-interested Trustees (2001). He is Chairman Emeritus of Lexmark International, Inc. (computer peripherals), where he served as CEO until April 1998, retired as Chairman May 1999, and remains a member of the Board. Prior to 1991, he held the positions of Vice President of International Business Machines Corporation (IBM) and President and General Manager of various IBM divisions and subsidiaries. He is a member of the Executive Committee of the Independent Director's Council of the Investment Company Institute. In addition, Mr. Mann is a member of the President's Cabinet at the University of Alabama and the Board of Visitors of the Culverhouse College of Commerce and Business Administration at the University of Alabama. |
William O. McCoy (71) |
| Year of Election or Appointment: 1997 Prior to his retirement in December 1994, Mr. McCoy was Vice Chairman of the Board of BellSouth Corporation (telecommunications) and President of BellSouth Enterprises. He is currently a Director of Liberty Corporation (holding company), Duke Realty Corporation (real estate), and Progress Energy, Inc. (electric utility). He is also a partner of Franklin Street Partners (private investment management firm) and a member of the Research Triangle Foundation Board. In addition, Mr. McCoy served as the Interim Chancellor (1999-2000) and a member of the Board of Visitors (1994-1998) for the University of North Carolina at Chapel Hill and currently serves on the Board of Directors of the University of North Carolina Health Care System and the Board of Visitors of the Kenan-Flagler Business School (University of North Carolina at Chapel Hill). He also served as Vice President of Finance for the University of North Carolina (16-school system, 1995-1998). |
Cornelia M. Small (60) |
| Year of Election or Appointment: 2005 Ms. Small is a member (2000) and Chairperson (2002) of the Investment Committee, and a member (2002) of the Board of Trustees of Smith College. Previously, she served as Chief Investment Officer (1999-2000), Director of Global Equity Investments (1996-1999), and a member of the Board of Directors of Scudder, Stevens & Clark (1990-1997) and Scudder Kemper Investments (1997-1998). In addition, Ms. Small served as Co-Chair (2000-2003) of the Annual Fund for the Fletcher School of Law and Diplomacy. |
William S. Stavropoulos (65) |
| Year of Election or Appointment: 2001 Mr. Stavropoulos is Chairman of the Board (2000), CEO (2002), a position he previously held from 1995-2000, Chairman of the Executive Committee (2000), and a Member of the Board of Directors of The Dow Chemical Company. Since joining The Dow Chemical Company in 1967, Mr. Stavropoulos served in numerous senior management positions, including President (1993-2000; 2002-2003). Currently, he is a Director of NCR Corporation (data warehousing and technology solutions), BellSouth Corporation (telecommunications), Chemical Financial Corporation, and Maersk Inc. (industrial conglomerate, 2002). He also serves as a member of the Board of Trustees of the American Enterprise Institute for Public Policy Research. In addition, Mr. Stavropoulos is a member of The Business Council, J.P. Morgan International Council and the University of Notre Dame Advisory Council for the College of Science. |
Kenneth L. Wolfe (65) |
| Year of Election or Appointment: 2005 Mr. Wolfe also serves as a Trustee (2005) or Member of the Advisory Board (2004) of other investment companies advised by FMR. Prior to his retirement in 2001, Mr. Wolfe was Chairman and Chief Executive Officer of Hershey Foods Corporation (1993-2001). He currently serves as a member of the boards of Adelphia Communications Corporation (2003), Bausch & Lomb, Inc., and Revlon Inc. (2004).] |
Annual Report
Trustees and Officers - continued
Advisory Board Member and Executive Officers:
Correspondence intended for each executive officer and Mr. Lynch may be sent to Fidelity Investments, 82 Devonshire Street, Boston, Massachusetts 02109.
Name, Age; Principal Occupation |
Peter S. Lynch (61) |
| Year of Election or Appointment: 2003 Member of the Advisory Board of Variable Insurance Products Fund III. Vice Chairman and a Director of FMR, and Vice Chairman (2001) and a Director (2000) of FMR Co., Inc. Previously, Mr. Lynch served as a Trustee of the Fidelity funds (1990-2003). Prior to May 31, 1990, he was a Director of FMR and Executive Vice President of FMR (a position he held until March 31, 1991), Vice President of Fidelity® Magellan® Fund and FMR Growth Group Leader, and Managing Director of FMR Corp. Mr. Lynch was also Vice President of Fidelity Investments Corporate Services. In addition, he serves as a Trustee of Boston College, Massachusetts Eye & Ear Infirmary, Historic Deerfield, John F. Kennedy Library, and the Museum of Fine Arts of Boston. |
John B. McDowell (46) |
| Year of Election or Appointment: 2002 Vice President of VIP Growth Opportunities Portfolio (2001). Mr. McDowell also serves as Vice President of certain Equity Funds (2002). He is Senior Vice President of FMR (1999), FMR Co., Inc. (2001), and Fidelity Management Trust Company (FMTC). Since joining Fidelity Investments in 1985, Mr. McDowell has worked as a research analyst and manager. |
Bettina Doulton (40) |
| Year of Election or Appointment: 2000 Vice President of VIP Growth Opportunities. Ms. Doulton also serves as Vice President of another fund advised by FMR. Prior to assuming her current responsibilities, Ms. Doulton managed a variety of Fidelity funds. |
Eric D. Roiter (56) |
| Year of Election or Appointment: 1998 Secretary of VIP Growth Opportunities. He also serves as Secretary of other Fidelity funds; Vice President, General Counsel, and Secretary of FMR Co., Inc. (2001-present) and FMR; Vice President and Secretary of FDC; Assistant Secretary of Fidelity Management & Research (U.K.) Inc. (2001-present), Fidelity Management & Research (Far East) Inc. (2001-present), and Fidelity Investments Money Management, Inc. (2001-present). Mr. Roiter is an Adjunct Member, Faculty of Law, at Boston College Law School (2003-present). |
Stuart Fross (45) |
| Year of Election or Appointment: 2003 Assistant Secretary of VIP Growth Opportunities. Mr. Fross also serves as Assistant Secretary of other Fidelity funds (2003) and is an employee of FMR. |
Christine Reynolds (46) |
| Year of Election or Appointment: 2004 President, Treasurer, and Anti-Money Laundering (AML) officer of VIP Growth Opportunities. Ms. Reynolds also serves as President, Treasurer, and AML officer of other Fidelity funds (2004) and is a Vice President (2003) and an employee (2002) of FMR. Before joining Fidelity Investments, Ms. Reynolds worked at PricewaterhouseCoopers LLP (PwC) (1980-2002), where she was most recently an audit partner with PwC's investment management practice. |
Timothy F. Hayes (54) |
| Year of Election or Appointment: 2002 Chief Financial Officer of VIP Growth Opportunities. Mr. Hayes also serves as Chief Financial Officer of other Fidelity funds (2002). Recently he was appointed President of Fidelity Service Company (2003) where he also serves as a Director. Mr. Hayes also serves as President of Fidelity Investments Operations Group (FIOG, 2002), which includes Fidelity Pricing and Cash Management Services Group (FPCMS), where he was appointed President in 1998. Previously, Mr. Hayes served as Chief Financial Officer of Fidelity Investments Corporate Systems and Service Group (1998) and Fidelity Systems Company (1997-1998). |
Kenneth A. Rathgeber (57) |
| Year of Election or Appointment: 2004 Chief Compliance Officer of VIP Growth Opportunities. Mr. Rathgeber also serves as Chief Compliance Officer of other Fidelity funds (2004) and Executive Vice President of Risk Oversight for Fidelity Investments (2002). Previously, he served as Executive Vice President and Chief Operating Officer for Fidelity Investments Institutional Services Company, Inc. (1998-2002). |
John R. Hebble (46) |
| Year of Election or Appointment: 2003 Deputy Treasurer of VIP Growth Opportunities. Mr. Hebble also serves as Deputy Treasurer of other Fidelity funds (2003), and is an employee of FMR. Before joining Fidelity Investments, Mr. Hebble worked at Deutsche Asset Management where he served as Director of Fund Accounting (2002-2003) and Assistant Treasurer of the Scudder Funds (1998-2003). |
Kimberley H. Monasterio (41) |
| Year of Election or Appointment: 2004 Deputy Treasurer of VIP Growth Opportunities. Ms. Monasterio also serves as Deputy Treasurer of other Fidelity funds (2004) and is an employee of FMR (2004). Before joining Fidelity Investments, Ms. Monasterio served as Treasurer (2000-2004) and Chief Financial Officer (2002-2004) of the Franklin Templeton Funds and Senior Vice President of Franklin Templeton Services, LLC (2000-2004). |
John H. Costello (58) |
| Year of Election or Appointment: 1986 Assistant Treasurer of VIP Growth Opportunities. Mr. Costello also serves as Assistant Treasurer of other Fidelity funds and is an employee of FMR. |
Peter L. Lydecker (50) |
| Year of Election or Appointment: 2004 Assistant Treasurer of VIP Growth Opportunities. Mr. Lydecker also serves as Assistant Treasurer of other Fidelity funds (2004) and is an employee of FMR. |
Mark Osterheld (49) |
| Year of Election or Appointment: 2002 Assistant Treasurer of VIP Growth Opportunities. Mr. Osterheld also serves as Assistant Treasurer of other Fidelity funds (2002) and is an employee of FMR. |
Kenneth B. Robins (35) |
| Year of Election or Appointment: 2004 Assistant Treasurer of VIP Growth Opportunities. Mr. Robins also serves as Assistant Treasurer of other Fidelity funds (2004) and is an employee of FMR (2004). Before joining Fidelity Investments, Mr. Robins worked at KPMG LLP, where he was a partner in KPMG's department of professional practice (2002-2004) and a Senior Manager (1999-2000). In addition, Mr. Robins served as Assistant Chief Accountant, United States Securities and Exchange Commission (2000-2002). |
Annual Report
A percentage of the dividends distributed during the fiscal year for the following classes qualifies for the dividends-received deduction for corporate shareholders:
Initial Class | 100% |
Service Class | 100% |
Service Class 2 | 100% |
The fund will notify shareholders in January 2005 of amounts for use in preparing 2004 income tax returns.
Growth Opportunities Portfolio
A special meeting of the fund's shareholders was held on December 14, 2004. The results of votes taken among shareholders on proposals before them are reported below. Each vote reported represents one dollar of net asset value held on the record date for the meeting.
PROPOSAL 1 |
To amend the Declaration of Trust to allow the Board of Trustees, if permitted by applicable law, to authorize fund mergers without shareholder approval. A |
| # of
Votes | % of
Votes |
Affirmative | 4,465,365,699.61 | 80.317 |
Against | 820,718,849.73 | 14.762 |
Abstain | 273,620,539.56 | 4.921 |
TOTAL | 5,559,705,088.90 | 100.000 |
PROPOSAL 2 |
To elect a Board of Trustees. A |
| # of
Votes | % of
Votes |
J. Michael Cook |
Affirmative | 5,275,527,318.06 | 94.889 |
Withheld | 284,177,770.84 | 5.111 |
TOTAL | 5,559,705,088.90 | 100.000 |
Ralph F. Cox |
Affirmative | 5,260,941,793.66 | 94.626 |
Withheld | 298,763,295.24 | 5.374 |
TOTAL | 5,559,705,088.90 | 100.000 |
Laura B. Cronin |
Affirmative | 5,275,571,233.79 | 94.889 |
Withheld | 284,133,855.11 | 5.111 |
TOTAL | 5,559,705,088.90 | 100.000 |
Dennis J. Dirks B |
Affirmative | 5,277,234,059.51 | 94.919 |
Withheld | 282,471,029.39 | 5.081 |
TOTAL | 5,559,705,088.90 | 100.000 |
Robert M. Gates |
Affirmative | 5,271,693,384.06 | 94.820 |
Withheld | 288,011,704.84 | 5.180 |
TOTAL | 5,559,705,088.90 | 100.000 |
George H. Heilmeier |
Affirmative | 5,276,712,546.15 | 94.910 |
Withheld | 282,992,542.75 | 5.090 |
TOTAL | 5,559,705,088.90 | 100.000 |
Abigail P. Johnson |
Affirmative | 5,265,412,678.20 | 94.707 |
Withheld | 294,292,410.70 | 5.293 |
TOTAL | 5,559,705,088.90 | 100.000 |
Edward C. Johnson 3d |
Affirmative | 5,252,813,997.03 | 94.480 |
Withheld | 306,891,091.87 | 5.520 |
TOTAL | 5,559,705,088.90 | 100.000 |
Donald J. Kirk |
Affirmative | 5,268,337,458.03 | 94.759 |
Withheld | 291,367,630.87 | 5.241 |
TOTAL | 5,559,705,088.90 | 100.000 |
| # of
Votes | % of
Votes |
Marie L. Knowles |
Affirmative | 5,278,993,264.93 | 94.951 |
Withheld | 280,711,823.97 | 5.049 |
TOTAL | 5,559,705,088.90 | 100.000 |
Ned C. Lautenbach |
Affirmative | 5,280,591,428.18 | 94.980 |
Withheld | 279,113,660.72 | 5.020 |
TOTAL | 5,559,705,088.90 | 100.000 |
Marvin L. Mann |
Affirmative | 5,266,769,335.50 | 94.731 |
Withheld | 292,935,753.40 | 5.269 |
TOTAL | 5,559,705,088.90 | 100.000 |
William O. McCoy |
Affirmative | 5,270,804,685.62 | 94.804 |
Withheld | 288,900,403.28 | 5.196 |
TOTAL | 5,559,705,088.90 | 100.000 |
Robert L. Reynolds |
Affirmative | 5,279,190,479.65 | 94.955 |
Withheld | 280,514,609.25 | 5.045 |
TOTAL | 5,559,705,088.90 | 100.000 |
Cornelia M. Small B |
Affirmative | 5,276,074,654.01 | 94.898 |
Withheld | 283,630,434.89 | 5.102 |
TOTAL | 5,559,705,088.90 | 100.000 |
William S. Stavropoulos |
Affirmative | 5,278,183,775.21 | 94.936 |
Withheld | 281,521,313.69 | 5.064 |
TOTAL | 5,559,705,088.90 | 100.000 |
A Denotes trust-wide proposals and voting results. B Effective January 1, 2005. |
Growth Opportunities Portfolio
Annual Report
Investment Adviser
Fidelity Management & Research Company
Boston, MA
Investment Sub-Advisers
FMR Co., Inc.
Fidelity Management & Research (U.K.) Inc.
Fidelity Management & Research (Far East) Inc.
Fidelity Investments Japan Limited
Fidelity International Investment Advisors
Fidelity International Investment Advisors (U.K.) Limited
General Distributor
Fidelity Distributors Corporation
Boston, MA
Transfer and Shareholder Servicing Agent
Fidelity Investments Institutional Operations Company, Inc.
Boston, MA
Custodian
Mellon Bank, N.A.
Pittsburgh, PA
VIPGRO-ANN-0205
1.540209.107
Fidelity® Variable Insurance Products:
Mid Cap Portfolio
Annual Report
December 31, 2004
(2_fidelity_logos) (Registered_Trademark)
Contents
Performance | 3 | How the fund has done over time. |
Management's Discussion | 4 | The manager's review of fund performance, strategy and outlook. |
Shareholder Expense Example | 5 | An example of shareholder expenses. |
Investment Summary | 6 | A summary of the fund's investments at period end. |
Investments | 7 | A complete list of the fund's investments with their
market values. |
Financial Statements | 19 | Statements of assets and liabilities, operations, and
changes in net assets, as well as financial highlights. |
Notes | 23 | Notes to the financial statements. |
Report of Independent Registered Public Accounting Firm | 27 | |
Trustees and Officers | 28 | |
Distributions | 33 | |
Proxy Voting Results | 34 | |
To view a fund's proxy voting guidelines and proxy voting record for the 12-month period ended June 30, visit www.fidelity.com/proxyvotingresults or visit the Securities and Exchange Commission's (SEC) web site at www.sec.gov. You may also call 1-800-544-5429 to request a free copy of the proxy voting guidelines.
Fidelity Variable Insurance Products are separate account options which are purchased through a variable insurance contract.
Standard & Poor's, S&P and S&P 500 are registered service marks of The McGraw-Hill Companies, Inc. and have been licensed for use by Fidelity Distributors Corporation.
Other third party marks appearing herein are the property of their respective owners.
All other marks appearing herein are registered or unregistered trademarks or service marks of FMR Corp. or an affiliated company.
(Recycle graphic) This report is printed on recycled paper using soy-based inks.
This report and the financial statements contained herein are submitted for the general information of the shareholders of the fund. This report is not authorized for distribution to prospective investors in the fund unless preceded or accompanied by an effective prospectus.
A fund files its complete schedule of portfolio holdings with the SEC for the first and third quarters of each fiscal year on Form N-Q. Forms N-Q are available on the SEC's web site at http://www.sec.gov. A fund's Forms N-Q may be reviewed and copied at the SEC's Public Reference Room in Washington, DC. Information regarding the operation of the SEC's Public Reference Room may be obtained by calling 1-800-SEC-0330. For a complete list of a fund's portfolio holdings, view the most recent quarterly holdings report, semiannual report, or annual report on Fidelity's web site at http://www.advisor.fidelity.com.
NOT FDIC INSURED · MAY LOSE VALUE · NO BANK GUARANTEE
Neither the fund nor Fidelity Distributors Corporation is a bank.
Mid Cap Portfolio
Fidelity Variable Insurance Products: Mid Cap Portfolio
Performance: The Bottom Line
Average annual total return reflects the change in the value of an investment, assuming reinvestment of the class' dividend income and capital gains (the profits earned upon the sale of securities that have grown in value) and assuming a constant rate of performance each year. During periods of reimbursement by Fidelity, a fund's total return will be greater than it would be had the reimbursement not occurred. Performance numbers are net of all underlying fund operating expenses, but do not include any insurance charges imposed by your insurance company's separate account. If performance information included the effect of these additional charges, the total returns would have been lower. How a fund did yesterday is no guarantee of how it will do tomorrow.
Average Annual Total Returns
Periods ended December 31, 2004 | Past 1
year | Past 5
years | Life of fund A |
Fidelity ® VIP: Mid Cap Portfolio - Initial Class | 24.92% | 15.11% | 20.74% |
Fidelity VIP: Mid Cap Portfolio - Service Class B | 24.77% | 14.98% | 20.61% |
Fidelity VIP: Mid Cap Portfolio - Service Class 2 C | 24.60% | 14.81% | 20.46% |
A From December 28, 1998.
B Performance for Service Class shares reflects an asset based distribution fee (12b-1).
C The initial offering of Service Class 2 shares took place January 12, 2000. Performance for Service Class 2 shares reflects an asset based distribution fee (12b-1 fee). Returns from December 28, 1998 to January 12, 2000 are those of Service Class which reflect a different 12b-1 fee. Had Service Class 2's 12b-1 fee been reflected, returns prior to January 12, 2000 would have been lower.
$10,000 Over Life of Fund
Let's say hypothetically that $10,000 was invested in Fidelity® Variable Insurance Products: Mid Cap Portfolio - Initial Class on December 28, 1998, when the fund started. The chart shows how the value of your investment would have changed, and also shows how the S&P® MidCap 400 Index performed the same period.
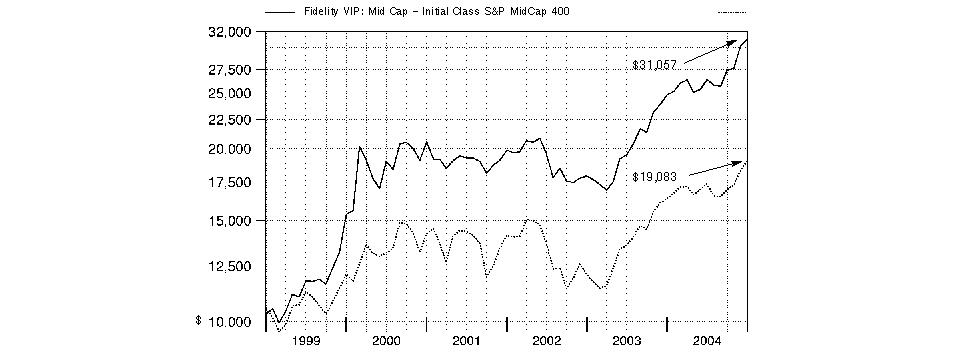
Annual Report
Fidelity Variable Insurance Products: Mid Cap Portfolio
Management's Discussion of Fund Performance
Comments from Thomas Allen, Portfolio Manager of Fidelity® Variable Insurance Products: Mid Cap Portfolio
The year ending December 31, 2004, generally was positive for equity investors, as many stock market benchmarks produced double-digit gains. Broad-based themes included the continued dominance of small-cap stocks, which outperformed large-caps for the sixth consecutive year. The small-cap Russell 2000® Index was up 18.33% in 2004, while the larger-cap Standard & Poor's 500SM Index rose 10.88%. Value stocks ended the year well ahead of growth stocks: The Russell 3000® Value Index advanced 16.94%, compared to 6.93% for the Russell 3000 Growth Index. Energy and basic materials stocks led the market upward. Energy stocks were boosted by record-high oil prices, while strong demand from China helped support commodity prices. The health care sector was among the market's weakest performers. Technology also fell off the pace, though it was helped by a rally late in the year. The tech-heavy NASDAQ Composite® Index returned 9.15%, thanks primarily to a 14.87% jump in the fourth quarter. Elsewhere, the Dow Jones Industrial AverageSM gained 5.37% for the year.
For the 12-month period that ended December 31, 2004, the fund solidly outperformed both the Standard & Poor's® MidCap 400 Index, which gained 16.48%, and the LipperSM Variable Annuity Mid-Cap Funds Average, which rose 15.30%. Rising oil prices helped boost many energy stocks during the period, and the fund was fortunate to own some of those that rose more than others, including Southwestern Energy and PetroKazakhstan, based in the former Soviet Union. Favorable stock selection in health care equipment and services companies, such as pharmacy benefits manager Caremark Rx, also helped the fund beat its index, as did an underweighting in the weak semiconductor group. The fund's overweighting in materials turned out to be a double-edged sword: Steel stocks worked very well, driven by tight supply, increasing demand from emerging markets and a moderately weaker U.S. dollar, while our gold-related holdings performed poorly, including such names as Newmont Mining, Buenaventura Mining and Harmony Gold.
The views expressed in this statement reflect those of the portfolio manager only through the end of the period of the report as stated on the cover and do not necessarily represent the views of Fidelity or any other person in the Fidelity organization. Any such views are subject to change at any time based upon market or other conditions and Fidelity disclaims any responsibility to update such views. These views may not be relied on as investment advice and, because investment decisions for a Fidelity fund are based on numerous factors, may not be relied on as an indication of trading intent on behalf of any Fidelity fund.
Annual Report
Fidelity Variable Insurance Products: Mid Cap Portfolio
Shareholder Expense Example
As a shareholder of the Fund, you incur two types of costs: (1) transaction costs, and (2) ongoing costs, including management fees, distribution and/or service (12b-1) fees and other Fund expenses. This Example is intended to help you understand your ongoing costs (in dollars) of investing in the Fund and to compare these costs with the ongoing costs of investing in other mutual funds.
The Example is based on an investment of $1,000 invested at the beginning of the period and held for the entire period (July 1, 2004 to December 31, 2004).
Actual Expenses
The first line of the table below for each class of the Fund provides information about actual account values and actual expenses. You may use the information in this line, together with the amount you invested, to estimate the expenses that you paid over the period. Simply divide your account value by $1,000.00 (for example, an $8,600 account value divided by $1,000.00 = 8.6), then multiply the result by the number in the first line for a class of the Fund under the heading entitled "Expenses Paid During Period" to estimate the expenses you paid on your account during this period. The estimate of expenses does not include any fees or other expenses of any variable annuity or variable life insurance product. If they were, the estimate of expenses you paid during the period would be higher, and your ending account value would be lower.
Hypothetical Example for Comparison Purposes
The second line of the table below for each class of the Fund provides information about hypothetical account values and hypothetical expenses based on a Class' actual expense ratio and an assumed rate of return of 5% per year before expenses, which is not the Class' actual return. The hypothetical account values and expenses may not be used to estimate the actual ending account balance or expenses you paid for the period. You may use this information to compare the ongoing costs of investing in the Fund and other funds. To do so, compare this 5% hypothetical example with the 5% hypothetical examples that appear in the shareholder reports of the other funds. The estimate of expenses does not include any fees or other expenses of any variable annuity or variable life insurance product. If they were, the estimate of expenses you paid during the period would be higher, and your ending account value would be lower.
Please note that the expenses shown in the table are meant to highlight your ongoing costs only and do not reflect any transaction costs. Therefore, the second line of the table is useful in comparing ongoing costs only, and will not help you determine the relative total costs of owning different funds.
| Beginning
Account Value
July 1, 2004 | Ending
Account Value
December 31, 2004 | Expenses Paid
During Period*
July 1, 2004
to December 31, 2004 |
Initial Class | | | |
Actual | $ 1,000.00 | $ 1,176.60 | $ 3.94 |
HypotheticalA | $ 1,000.00 | $ 1,021.52 | $ 3.66 |
Service Class | | | |
Actual | $ 1,000.00 | $ 1,175.50 | $ 4.48 |
HypotheticalA | $ 1,000.00 | $ 1,021.01 | $ 4.17 |
Service Class 2 | | | |
Actual | $ 1,000.00 | $ 1,175.00 | $ 5.30 |
HypotheticalA | $ 1,000.00 | $ 1,020.26 | $ 4.93 |
A 5% return per year before expenses
* Expenses are equal to each Class' annualized expense ratio (shown in the table below); multiplied by the average account value over the period, multiplied by 184/366 (to reflect the one-half year period).
| Annualized
Expense Ratio |
Initial Class | .72% |
Service Class | .82% |
Service Class 2 | .97% |
Annual Report
Fidelity Variable Insurance Products Fund: Mid Cap Portfolio
Investment Summary
Top Five Stocks as of December 31, 2004 |
| % of fund's
net assets |
Newmont Mining Corp. | 2.5 |
Nucor Corp. | 2.4 |
Invitrogen Corp. | 2.4 |
Steel Dynamics, Inc. | 1.6 |
Charles River Laboratories International, Inc. | 1.6 |
| 10.5 |
Top Five Market Sectors as of December 31, 2004 |
| % of fund's
net assets |
Materials | 18.4 |
Health Care | 15.9 |
Energy | 13.5 |
Industrials | 11.2 |
Consumer Discretionary | 11.0 |
Asset Allocation as of December 31, 2004 |
% of fund's net assets * |
 | Stocks | 96.7% | |
 | Short-Term
Investments and
Net Other Assets | 3.3% | |
* Foreign investments 27.3% | |

Annual Report
Fidelity Variable Insurance Products Fund: Mid Cap Portfolio
Investments December 31, 2004
Showing Percentage of Net Assets
Common Stocks - 96.7% |
| Shares | | Value (Note 1) |
CONSUMER DISCRETIONARY - 11.0% |
Auto Components - 1.7% |
Amerigon, Inc. (a) | 100 | | $ 374 |
Autoliv, Inc. | 144,100 | | 6,960,030 |
Bharat Forge Ltd. | 55,244 | | 1,373,947 |
BorgWarner, Inc. | 146,100 | | 7,914,237 |
China Yuchai International Ltd. (a) | 100 | | 1,328 |
Continental AG | 100 | | 6,339 |
Gentex Corp. | 532,100 | | 19,698,342 |
IMPCO Technologies, Inc. (a)(e) | 1,506,400 | | 11,373,320 |
Johnson Controls, Inc. | 200 | | 12,688 |
LKQ Corp. (a) | 315,337 | | 6,328,814 |
Nokian Tyres Ltd. | 96,700 | | 14,665,743 |
Starcraft Corp. (a) | 105 | | 1,469 |
| | 68,336,631 |
Automobiles - 0.1% |
Bajaj Auto Ltd. | 35,300 | | 923,268 |
Denway Motors Ltd. | 4,000 | | 1,428 |
Fiat Spa sponsord ADR (a) | 100 | | 798 |
Harley-Davidson, Inc. | 100 | | 6,075 |
Hero Honda Motors Ltd. | 221,071 | | 2,925,549 |
Mahindra & Mahindra Ltd. | 100 | | 1,261 |
Maruti Udyog Ltd. | 100 | | 1,068 |
Tata Motors Ltd. | 100 | | 1,168 |
Thor Industries, Inc. | 200 | | 7,410 |
| | 3,868,025 |
Distributors - 0.0% |
Educational Development Corp. | 100 | | 1,044 |
Li & Fung Ltd. | 2,000 | | 3,371 |
| | 4,415 |
Hotels, Restaurants & Leisure - 3.1% |
Accor SA | 100 | | 4,369 |
AFC Enterprises, Inc. (a) | 100 | | 2,365 |
Applebee's International, Inc. | 150 | | 3,968 |
BJ's Restaurants, Inc. (a) | 100 | | 1,400 |
Buffalo Wild Wings, Inc. (a) | 208,000 | | 7,240,480 |
Jack in the Box, Inc. (a) | 23,600 | | 870,132 |
Jurys Doyle Hotel Group PLC (Ireland) | 100 | | 1,671 |
Krispy Kreme Doughnuts, Inc. (a) | 100 | | 1,260 |
Kuoni Reisen Holding AG Class B (Reg.) | 100 | | 43,881 |
Outback Steakhouse, Inc. | 773,700 | | 35,419,986 |
P.F. Chang's China Bistro, Inc. (a) | 100 | | 5,635 |
Red Robin Gourmet Burgers, Inc. (a) | 198,000 | | 10,587,060 |
Royal Caribbean Cruises Ltd. | 511,000 | | 27,818,840 |
Sonic Corp. (a) | 1,372,825 | | 41,871,163 |
Total Entertainment Restaurant Corp. (a) | 100 | | 1,192 |
| | 123,873,402 |
Household Durables - 1.3% |
Alba PLC | 581,101 | | 7,137,036 |
Arcelik AS (a) | 100 | | 1 |
Fedders Corp. | 100 | | 362 |
Garmin Ltd. | 51 | | 3,103 |
|
| Shares | | Value (Note 1) |
George Wimpey PLC | 100 | | $ 776 |
Harman International Industries, Inc. | 118,400 | | 15,036,800 |
Hovnanian Enterprises, Inc. Class A (a) | 200 | | 9,904 |
LG Electronics, Inc. | 167,270 | | 10,357,427 |
Makita Corp. sponsored ADR | 100 | | 1,775 |
Rational AG | 39,471 | | 3,665,649 |
Sekisui House Ltd. | 877,000 | | 10,222,962 |
Skyworth Digital Holdings Ltd. | 2,052 | | 306 |
Toll Brothers, Inc. (a) | 105,000 | | 7,204,050 |
William Lyon Homes, Inc. (a) | 100 | | 7,024 |
| | 53,647,175 |
Internet & Catalog Retail - 0.2% |
1-800-FLOWERS.com, Inc. Class A (a) | 200 | | 1,682 |
Alloy, Inc. (a) | 100 | | 807 |
Audible, Inc. (a) | 100 | | 2,605 |
GSI Commerce, Inc. (a) | 100 | | 1,778 |
Overstock.com, Inc. (a) | 100 | | 6,900 |
Provide Commerce, Inc. | 65,200 | | 2,422,180 |
Rakuten, Inc. (d) | 301 | | 343,815 |
Rakuten, Inc. New (a)(d) | 2,709 | | 3,094,338 |
ValueVision Media, Inc. Class A (a) | 100 | | 1,391 |
| | 5,875,496 |
Leisure Equipment & Products - 0.1% |
Arctic Cat, Inc. | 100 | | 2,652 |
Asia Optical Co., Inc. | 28,718 | | 159,896 |
Jumbo SA | 295,690 | | 2,302,419 |
Mega Bloks, Inc. (a) | 100 | | 1,588 |
Oakley, Inc. | 100 | | 1,275 |
Polaris Industries, Inc. | 200 | | 13,604 |
SCP Pool Corp. | 225 | | 7,178 |
SHIMANO, Inc. | 100 | | 2,856 |
| | 2,491,468 |
Media - 0.6% |
Astral Media, Inc. Class A (non-vtg.) | 365,800 | | 9,931,470 |
Chum Ltd. Class B (non-vtg.) | 200 | | 4,958 |
Clear Media Ltd. (a) | 243,000 | | 226,656 |
Cumulus Media, Inc. Class A (a) | 100 | | 1,508 |
E.W. Scripps Co. Class A | 100 | | 4,828 |
Fox Entertainment Group, Inc. Class A (a) | 100 | | 3,126 |
Gemstar-TV Guide International, Inc. (a) | 100 | | 592 |
Getty Images, Inc. (a) | 100 | | 6,885 |
Grupo Televisa SA de CV sponsored ADR | 100 | | 6,050 |
Harris Interactive, Inc. (a) | 100 | | 790 |
Impresa SGPS (a) | 100 | | 787 |
Insignia Systems, Inc. (a) | 100 | | 218 |
JC Decaux SA (a) | 100 | | 2,914 |
Modern Times Group AB (MTG) (B Shares) (a) | 100 | | 2,724 |
Padmalaya Telefilms Ltd. (a) | 100 | | 122 |
Saga Communications, Inc. Class A (a) | 100 | | 1,685 |
Salem Communications Corp. Class A (a) | 48,300 | | 1,205,085 |
SBS Broadcasting SA (a) | 100 | | 4,023 |
Scholastic Corp. (a) | 100 | | 3,696 |
Common Stocks - continued |
| Shares | | Value (Note 1) |
CONSUMER DISCRETIONARY - continued |
Media - continued |
SKY Perfect Communications, Inc. | 5,512 | | $ 5,973,172 |
Sogecable SA (a) | 100 | | 4,430 |
Spanish Broadcasting System, Inc. Class A (a) | 100 | | 1,056 |
TiVo, Inc. (a) | 100 | | 587 |
Trader Classified Media NV (A Shares) | 100 | | 1,384 |
Zee Telefilms Ltd. | 1,820,140 | | 7,219,538 |
| | 24,608,284 |
Multiline Retail - 0.1% |
99 Cents Only Stores (a) | 100 | | 1,616 |
Dollar General Corp. | 100 | | 2,077 |
Dollar Tree Stores, Inc. (a) | 100 | | 2,868 |
Don Quijote Co. Ltd. (d) | 113,100 | | 5,774,802 |
Family Dollar Stores, Inc. | 100 | | 3,123 |
| | 5,784,486 |
Specialty Retail - 2.7% |
Abercrombie & Fitch Co. Class A | 100 | | 4,695 |
AC Moore Arts & Crafts, Inc. (a) | 705,100 | | 20,313,931 |
Advance Auto Parts, Inc. (a) | 200 | | 8,736 |
Aeropostale, Inc. (a) | 100 | | 2,943 |
Best Buy Co., Inc. | 200 | | 11,884 |
CarMax, Inc. (a) | 622,400 | | 19,325,520 |
Chico's FAS, Inc. (a) | 100 | | 4,553 |
Cost Plus, Inc. (a) | 142,700 | | 4,584,951 |
Esprit Holdings Ltd. | 500 | | 3,023 |
French Connection Group PLC | 100 | | 471 |
Genesco, Inc. (a) | 100 | | 3,114 |
Guitar Center, Inc. (a) | 100 | | 5,269 |
Hot Topic, Inc. (a) | 323,883 | | 5,567,549 |
KOMERI Co. Ltd. (d) | 672,100 | | 18,306,737 |
Michaels Stores, Inc. | 200 | | 5,994 |
Nitori Co. Ltd. (d) | 233,050 | | 15,221,171 |
O'Reilly Automotive, Inc. (a) | 100 | | 4,505 |
Pacific Sunwear of California, Inc. (a) | 305,000 | | 6,789,300 |
Pantaloon Retail India Ltd. | 100 | | 1,689 |
Peacock Group PLC | 1,271,844 | | 6,638,792 |
PETsMART, Inc. | 24,000 | | 852,720 |
Pier 1 Imports, Inc. | 100 | | 1,970 |
RONA, Inc. (a) | 100,000 | | 3,400,000 |
Ross Stores, Inc. | 43,900 | | 1,267,393 |
Sa Sa International Holdings Ltd. | 2,000 | | 1,074 |
Select Comfort Corp. (a) | 100 | | 1,794 |
Sharper Image Corp. (a) | 100 | | 1,885 |
Shimamura Co. Ltd. | 100 | | 7,303 |
TBC Corp. New (a) | 100 | | 2,780 |
The Bombay Company, Inc. (a) | 100 | | 553 |
Tiffany & Co., Inc. | 57,100 | | 1,825,487 |
Tractor Supply Co. (a) | 100 | | 3,721 |
|
| Shares | | Value (Note 1) |
Urban Outfitters, Inc. (a) | 400 | | $ 17,760 |
Williams-Sonoma, Inc. (a) | 54,700 | | 1,916,688 |
| | 106,105,955 |
Textiles, Apparel & Luxury Goods - 1.1% |
Columbia Sportswear Co. (a) | 579,600 | | 34,549,956 |
Compagnie Financiere Richemont unit | 100 | | 3,322 |
Folli Follie SA | 42,980 | | 1,259,378 |
Gildan Activewear, Inc. Class A (sub. vtg.) (a) | 100 | | 3,399 |
K-Swiss, Inc. Class A | 200 | | 5,824 |
Kenneth Cole Productions, Inc. Class A (sub. vtg.) | 100 | | 3,086 |
NIKE, Inc. Class B | 100 | | 9,069 |
Polo Ralph Lauren Corp. Class A | 100 | | 4,260 |
Quiksilver, Inc. (a) | 200 | | 5,958 |
Ted Baker PLC | 945,208 | | 8,761,144 |
The Swatch Group AG (Bearer) | 100 | | 14,647 |
Timberland Co. Class A (a) | 100 | | 6,267 |
Weyco Group, Inc. | 100 | | 4,429 |
Wolverine World Wide, Inc. | 100 | | 3,142 |
| | 44,633,881 |
TOTAL CONSUMER DISCRETIONARY | | 439,229,218 |
CONSUMER STAPLES - 7.4% |
Beverages - 0.0% |
Boston Beer Co., Inc. Class A (a) | 100 | | 2,127 |
Companhia de Bebidas das Americas (AmBev) sponsored ADR | 100 | | 2,833 |
Fomento Economico Mexicano SA de CV sponsored ADR | 100 | | 5,261 |
Grupo Modelo SA de CV Series C | 100 | | 275 |
Hansen Natural Corp. (a) | 100 | | 3,641 |
Jones Soda Co. (a) | 95,700 | | 330,165 |
MGP Ingredients, Inc. | 200 | | 1,728 |
Pernod-Ricard | 100 | | 15,288 |
Tsingtao Brewery Co. Ltd. (H Shares) | 1,000 | | 1,010 |
| | 362,328 |
Food & Staples Retailing - 0.4% |
Central European Distribution Corp. (a) | 150 | | 4,431 |
Massmart Holdings Ltd. | 847,869 | | 6,778,342 |
Plant Co. Ltd. | 120,300 | | 1,820,414 |
Shinsegae Co. Ltd. | 1,390 | | 382,008 |
Whole Foods Market, Inc. | 74,600 | | 7,113,110 |
| | 16,098,305 |
Food Products - 6.3% |
Archer-Daniels-Midland Co. | 2,678,000 | | 59,746,180 |
Barry Callebaut AG | 23,513 | | 5,839,817 |
Bunge Ltd. | 638,200 | | 36,383,782 |
Corn Products International, Inc. | 713,400 | | 38,209,704 |
Fresh Del Monte Produce, Inc. | 100 | | 2,961 |
Glanbia PLC | 784,887 | | 2,981,268 |
Green Mountain Coffee Roasters, Inc. (a) | 47,993 | | 1,204,624 |
Common Stocks - continued |
| Shares | | Value (Note 1) |
CONSUMER STAPLES - continued |
Food Products - continued |
Hershey Foods Corp. | 504,300 | | $ 28,008,822 |
Hormel Foods Corp. | 100 | | 3,135 |
IAWS Group PLC (Ireland) | 25,450 | | 421,195 |
Lindt & Spruengli AG | 400 | | 5,844,925 |
Lindt & Spruengli AG (participation certificate) | 2,770 | | 3,933,354 |
McCormick & Co., Inc. (non-vtg.) | 496,000 | | 19,145,600 |
Peet's Coffee & Tea, Inc. (a) | 100 | | 2,647 |
People's Food Holdings Ltd. | 10,068,165 | | 9,253,261 |
PT Indofood Sukses Makmur Tbk | 56,655,500 | | 4,889,370 |
Smithfield Foods, Inc. (a) | 1,230,200 | | 36,401,618 |
SunOpta, Inc. (a) | 39,000 | | 279,825 |
Wimm-Bill-Dann Foods OJSC ADR (a) | 65,400 | | 935,874 |
Wm. Wrigley Jr. Co. | 100 | | 6,919 |
| | 253,494,881 |
Household Products - 0.1% |
Central Garden & Pet Co. Class A (a) | 100 | | 4,174 |
Godrej Consumer Products Ltd. | 178,876 | | 1,237,657 |
Hindustan Lever Ltd. | 104,300 | | 345,818 |
Kao Corp. | 1,000 | | 25,578 |
Reckitt Benckiser PLC | 300 | | 9,062 |
| | 1,622,289 |
Personal Products - 0.6% |
Alberto-Culver Co. | 150 | | 7,286 |
Estee Lauder Companies, Inc. Class A | 63,300 | | 2,897,241 |
Hengan International Group Co. Ltd. | 12,932,600 | | 8,485,521 |
Kose Corp. | 100 | | 4,393 |
Natura Cosmeticos SA | 166,500 | | 4,858,340 |
Shiseido Co. Ltd. ADR | 459,900 | | 6,645,555 |
USANA Health Sciences, Inc. (a) | 200 | | 6,840 |
| | 22,905,176 |
TOTAL CONSUMER STAPLES | | 294,482,979 |
ENERGY - 13.5% |
Energy Equipment & Services - 9.7% |
BJ Services Co. | 648,610 | | 30,186,309 |
Cal Dive International, Inc. (a) | 467,400 | | 19,046,550 |
Carbo Ceramics, Inc. | 100 | | 6,900 |
Compagnie Generale de Geophysique SA (a) | 100 | | 6,884 |
Cooper Cameron Corp. (a) | 317,000 | | 17,057,770 |
Core Laboratories NV (a) | 230,700 | | 5,386,845 |
FMC Technologies, Inc. (a) | 307,500 | | 9,901,500 |
Global Industries Ltd. (a) | 1,530,489 | | 12,687,754 |
GlobalSantaFe Corp. | 692,450 | | 22,927,020 |
Gulf Island Fabrication, Inc. | 211,200 | | 4,610,496 |
Helmerich & Payne, Inc. | 195,600 | | 6,658,224 |
Hydril Co. (a) | 100 | | 4,551 |
Input/Output, Inc. (a) | 1,327,000 | | 11,730,680 |
Nabors Industries Ltd. (a) | 688,800 | | 35,328,552 |
|
| Shares | | Value (Note 1) |
National-Oilwell, Inc. (a) | 235,300 | | $ 8,303,737 |
Noble Corp. (a) | 345,300 | | 17,175,222 |
NS Group, Inc. (a) | 100 | | 2,780 |
Oceaneering International, Inc. (a) | 360,086 | | 13,438,410 |
Parker Drilling Co. (a) | 1,996,800 | | 7,847,424 |
Pason Systems, Inc. | 756,300 | | 23,319,250 |
Patterson-UTI Energy, Inc. | 204,300 | | 3,973,635 |
Pioneer Drilling Co. (a) | 1,190,100 | | 12,008,109 |
Precision Drilling Corp. (a) | 153,300 | | 9,647,680 |
Pride International, Inc. (a) | 565,700 | | 11,619,478 |
Rowan Companies, Inc. (a) | 345,600 | | 8,951,040 |
Smith International, Inc. (a) | 251,090 | | 13,661,807 |
Superior Energy Services, Inc. (a) | 316,900 | | 4,883,429 |
Transocean, Inc. (a) | 524,800 | | 22,246,272 |
Unit Corp. (a) | 356,000 | | 13,602,760 |
Varco International, Inc. (a) | 1,153,848 | | 33,634,655 |
Veritas DGC, Inc. (a) | 100 | | 2,241 |
Weatherford International Ltd. (a) | 139,800 | | 7,171,740 |
| | 387,029,704 |
Oil & Gas - 3.8% |
Ashland, Inc. | 25,900 | | 1,512,042 |
Caltex Australia Ltd. | 1,004,943 | | 8,538,864 |
China Petroleum & Chemical Corp. sponsored ADR | 100 | | 4,099 |
Comstock Resources, Inc. (a) | 93,100 | | 2,052,855 |
Golar LNG Ltd. (a) | 515,700 | | 7,501,323 |
Golar LNG Ltd. (Nasdaq) (a) | 21,393 | | 318,542 |
JKX Oil & Gas | 91 | | 202 |
Niko Resources Ltd. | 138,000 | | 5,804,050 |
PetroChina Co. Ltd. sponsored ADR | 100 | | 5,369 |
PetroKazakhstan, Inc. Class A | 594,600 | | 22,064,615 |
Petroleo Brasileiro SA Petrobras sponsored: | | | |
ADR | 100 | | 3,978 |
ADR (non-vtg.) | 100 | | 3,621 |
Premcor, Inc. | 293,300 | | 12,368,461 |
Southwestern Energy Co. (a) | 780,200 | | 39,548,338 |
Surgutneftegaz JSC sponsored ADR | 100 | | 3,740 |
Talisman Energy, Inc. | 194,500 | | 5,243,396 |
Tesoro Petroleum Corp. (a) | 465,900 | | 14,843,574 |
Valero Energy Corp. | 718,500 | | 32,619,900 |
World Fuel Services Corp. | 31,500 | | 1,568,700 |
XTO Energy, Inc. | 125 | | 4,423 |
| | 154,010,092 |
TOTAL ENERGY | | 541,039,796 |
FINANCIALS - 8.3% |
Capital Markets - 0.5% |
BlackRock, Inc. Class A | 100 | | 7,726 |
Deutsche Bank AG (NY Shares) | 13,000 | | 1,157,130 |
E*TRADE Financial Corp. (a) | 100 | | 1,495 |
Eaton Vance Corp. (non-vtg.) | 100 | | 5,215 |
Common Stocks - continued |
| Shares | | Value (Note 1) |
FINANCIALS - continued |
Capital Markets - continued |
Federated Investors, Inc. Class B (non-vtg.) | 100 | | $ 3,040 |
International Assets Holding Corp. (a) | 100 | | 757 |
Investors Financial Services Corp. | 49,700 | | 2,484,006 |
Kotak Mahindra Bank Ltd. | 439,734 | | 2,912,920 |
Matsui Securities Co. Ltd. | 208,800 | | 7,277,321 |
Mitsubishi Securities Co. Ltd. | 511,700 | | 5,605,071 |
Nuveen Investments, Inc. Class A | 100 | | 3,947 |
T. Rowe Price Group, Inc. | 200 | | 12,440 |
| | 19,471,068 |
Commercial Banks - 3.4% |
Banco Itau Holding Financeira SA: | | | |
(PN) | 900 | | 134,864 |
sponsored ADR (non-vtg.) | 33,900 | | 2,548,263 |
Bank Austria Creditanstalt AG | 201,075 | | 18,139,091 |
Bank of Baroda | 1,220,572 | | 6,874,431 |
Bank of Fukuoka Ltd. (d) | 2,110,000 | | 13,904,618 |
Bank of India | 6,393,456 | | 13,939,951 |
Bank of Yokohama Ltd. | 2,431,000 | | 15,331,700 |
BOK Financial Corp. (a) | 103 | | 5,022 |
Boston Private Financial Holdings, Inc. | 106,100 | | 2,988,837 |
Canara Bank | 401,535 | | 1,973,788 |
Capitalia Spa | 9,229,479 | | 42,205,762 |
Cathay General Bancorp | 20 | | 750 |
Center Financial Corp., California | 20,600 | | 412,412 |
Commerce Bancorp, Inc., New Jersey | 68,400 | | 4,404,960 |
CVB Financial Corp. | 110 | | 2,922 |
East West Bancorp, Inc. | 200 | | 8,392 |
First Horizon National Corp. | 100 | | 4,311 |
Fulton Financial Corp. | 11 | | 256 |
HDFC Bank Ltd. sponsored ADR | 18,100 | | 821,016 |
Hiroshima Bank Ltd. | 389,000 | | 2,058,362 |
ICICI Bank Ltd. sponsored ADR | 5,000 | | 100,750 |
Irwin Financial Corp. | 100 | | 2,839 |
Lakeland Financial Corp. | 100 | | 3,970 |
M&T Bank Corp. | 100 | | 10,784 |
OTP Bank Rt. | 100 | | 3,082 |
Popular, Inc. | 200 | | 5,766 |
PrivateBancorp, Inc. | 200 | | 6,446 |
State Bancorp, Inc., New York | 5 | | 138 |
State Bank of India | 448,533 | | 7,333,644 |
Sumitomo Trust & Banking Co. Ltd. | 1,000 | | 7,234 |
SunTrust Banks, Inc. | 49 | | 3,620 |
TCF Financial Corp. | 200 | | 6,428 |
Texas Regional Bancshares, Inc. Class A | 150 | | 4,902 |
UCBH Holdings, Inc. | 100 | | 4,582 |
UnionBanCal Corp. | 100 | | 6,448 |
Valley National Bancorp | 105 | | 2,903 |
|
| Shares | | Value (Note 1) |
Westcorp | 100 | | $ 4,593 |
Wintrust Financial Corp. | 48,000 | | 2,734,080 |
| | 136,001,917 |
Consumer Finance - 0.0% |
American Express Co. | 100 | | 5,637 |
Capital One Financial Corp. | 100 | | 8,421 |
First Cash Financial Services, Inc. (a) | 150 | | 4,007 |
STB Leasing Co. Ltd. | 100 | | 1,874 |
| | 19,939 |
Diversified Financial Services - 0.4% |
eSpeed, Inc. Class A (a) | 100 | | 1,237 |
Moody's Corp. | 54,100 | | 4,698,585 |
Power Financial Corp. | 100 | | 2,666 |
Principal Financial Group, Inc. | 100 | | 4,094 |
TSX Group, Inc. | 244,800 | | 10,952,760 |
| | 15,659,342 |
Insurance - 2.7% |
ACE Ltd. | 100 | | 4,275 |
AFLAC, Inc. | 2,800 | | 111,552 |
Arthur J. Gallagher & Co. | 100 | | 3,250 |
Assurant, Inc. | 1,232,500 | | 37,652,875 |
Brown & Brown, Inc. | 38,000 | | 1,654,900 |
Erie Indemnity Co. Class A | 100 | | 5,257 |
Genworth Financial, Inc. Class A | 100 | | 2,700 |
Hilb Rogal & Hobbs Co. | 200 | | 7,248 |
Horace Mann Educators Corp. | 100 | | 1,908 |
MBIA, Inc. | 54,600 | | 3,455,088 |
Mercury General Corp. | 28,100 | | 1,683,752 |
Ohio Casualty Corp. (a) | 122,800 | | 2,850,188 |
Old Republic International Corp. | 150 | | 3,795 |
Progressive Corp. | 67,100 | | 5,692,764 |
Reinsurance Group of America, Inc. | 486,100 | | 23,551,545 |
Scottish Re Group Ltd. | 8,100 | | 209,790 |
StanCorp Financial Group, Inc. | 100 | | 8,250 |
Triad Guaranty, Inc. (a) | 100 | | 6,048 |
UnumProvident Corp. | 100 | | 1,794 |
USI Holdings Corp. (a) | 187,500 | | 2,169,375 |
W.R. Berkley Corp. | 618,575 | | 29,178,183 |
Zenith National Insurance Corp. | 300 | | 14,952 |
| | 108,269,489 |
Real Estate - 1.0% |
CBL & Associates Properties, Inc. | 17,300 | | 1,320,855 |
Corporate Office Properties Trust (SBI) | 147,100 | | 4,317,385 |
Equity Lifestyle Properties, Inc. | 100 | | 3,575 |
Equity Residential (SBI) | 100 | | 3,618 |
General Growth Properties, Inc. | 167,100 | | 6,042,336 |
Kimco Realty Corp. | 226,000 | | 13,105,740 |
Pan Pacific Retail Properties, Inc. | 114,400 | | 7,172,880 |
Plum Creek Timber Co., Inc. | 141,300 | | 5,431,572 |
United Dominion Realty Trust, Inc. (SBI) | 29,200 | | 724,160 |
Weingarten Realty Investors (SBI) | 100 | | 4,010 |
| | 38,126,131 |
Common Stocks - continued |
| Shares | | Value (Note 1) |
FINANCIALS - continued |
Thrifts & Mortgage Finance - 0.3% |
Doral Financial Corp. | 147,800 | | $ 7,279,150 |
Golden West Financial Corp., Delaware | 79,940 | | 4,909,915 |
MGIC Investment Corp. | 100 | | 6,891 |
Radian Group, Inc. | 100 | | 5,324 |
Sterling Financial Corp., Washington (a) | 110 | | 4,319 |
W Holding Co., Inc. | 156 | | 3,579 |
Washington Federal, Inc. | 110 | | 2,919 |
| | 12,212,097 |
TOTAL FINANCIALS | | 329,759,983 |
HEALTH CARE - 15.9% |
Biotechnology - 6.5% |
Affymetrix, Inc. (a) | 190,600 | | 6,966,430 |
Albany Molecular Research, Inc. (a) | 100 | | 1,114 |
Alnylam Pharmaceuticals, Inc. | 100 | | 738 |
Applera Corp. - Celera Genomics Group (a) | 100 | | 1,375 |
Bachem Holding AG (B Shares) | 100 | | 5,744 |
Celgene Corp. (a) | 200 | | 5,306 |
Charles River Laboratories International, Inc. (a) | 1,389,204 | | 63,917,276 |
Ciphergen Biosystems, Inc. (a) | 100 | | 430 |
CSL Ltd. | 19,483 | | 445,872 |
CytRx Corp. (a) | 100 | | 141 |
deCODE genetics, Inc. (a) | 100 | | 781 |
Dendreon Corp. (a) | 100 | | 1,078 |
Digene Corp. (a) | 100 | | 2,615 |
Exact Sciences Corp. (a) | 100 | | 382 |
Exelixis, Inc. (a) | 100 | | 950 |
Gen-Probe, Inc. (a) | 31,900 | | 1,442,199 |
Genencor International, Inc. (a) | 100 | | 1,640 |
Genentech, Inc. (a) | 24,800 | | 1,350,112 |
Global Bio-Chem Technology Group Co. Ltd. | 9,232,000 | | 6,057,431 |
Harvard Bioscience, Inc. (a)(e) | 3,023,047 | | 13,996,708 |
ImmunoGen, Inc. (a) | 139,700 | | 1,234,948 |
Invitrogen Corp. (a) | 1,435,200 | | 96,344,976 |
Lexicon Genetics, Inc. (a) | 100 | | 776 |
Luminex Corp. (a) | 100 | | 888 |
Martek Biosciences (a) | 106,100 | | 5,432,320 |
Myriad Genetics, Inc. (a) | 100 | | 2,251 |
Neogen Corp. (a) | 49,663 | | 1,124,873 |
Northfield Laboratories, Inc. (a) | 100 | | 2,255 |
ONYX Pharmaceuticals, Inc. (a) | 100 | | 3,239 |
QIAGEN NV (a) | 4,857,800 | | 53,192,910 |
Renovis, Inc. | 100 | | 1,438 |
Sangamo Biosciences, Inc. (a) | 100 | | 600 |
Seattle Genetics, Inc. (a) | 100 | | 653 |
Serologicals Corp. (a) | 100 | | 2,212 |
Sirna Therapeutics, Inc. (a) | 100 | | 316 |
|
| Shares | | Value (Note 1) |
Stratagene Corp. (a) | 849,600 | | $ 6,584,400 |
Strategic Diagnostics, Inc. (a) | 792,300 | | 2,773,050 |
Tanox, Inc. (a) | 100 | | 1,520 |
Telik, Inc. (a) | 100 | | 1,914 |
| | 260,903,861 |
Health Care Equipment & Supplies - 2.3% |
Advanced Medical Optics, Inc. (a) | 100 | | 4,114 |
Arthrocare Corp. (a) | 100 | | 3,206 |
Bio-Rad Laboratories, Inc. Class A (a) | 100 | | 5,737 |
BioLase Technology, Inc. | 100 | | 1,087 |
Bruker BioSciences Corp. (a) | 163 | | 657 |
Cardiodynamics International Corp. (a) | 100 | | 517 |
Chromavision Medical Systems, Inc. (a) | 100 | | 216 |
Cooper Companies, Inc. | 100 | | 7,059 |
Cyberonics, Inc. (a) | 200 | | 4,144 |
Cytyc Corp. (a) | 100 | | 2,757 |
Diagnostic Products Corp. | 100 | | 5,505 |
Edwards Lifesciences Corp. (a) | 307,700 | | 12,695,702 |
Epix Pharmaceuticals, Inc. (a) | 122,400 | | 2,192,184 |
IDEXX Laboratories, Inc. (a) | 100 | | 5,459 |
Illumina, Inc. (a) | 356,400 | | 3,378,672 |
INAMED Corp. (a) | 150 | | 9,488 |
Integra LifeSciences Holdings Corp. (a) | 64,700 | | 2,389,371 |
Intuitive Surgical, Inc. (a) | 47,800 | | 1,912,956 |
Kinetic Concepts, Inc. | 20,300 | | 1,548,890 |
Matthews International Corp. Class A | 100 | | 3,680 |
Meridian Bioscience, Inc. | 135,350 | | 2,353,737 |
Merit Medical Systems, Inc. (a) | 133 | | 2,037 |
Millipore Corp. (a) | 255,900 | | 12,746,379 |
Mine Safety Appliances Co. | 300 | | 15,210 |
Molecular Devices Corp. (a) | 74,580 | | 1,499,058 |
Ocular Sciences, Inc. (a) | 46,300 | | 2,269,163 |
Orthologic Corp. (a) | 100,600 | | 628,750 |
Osteotech, Inc. (a) | 100 | | 550 |
PolyMedica Corp. | 200 | | 7,458 |
Possis Medical, Inc. (a) | 100 | | 1,348 |
Sonic Innovations, Inc. (a) | 151,300 | | 630,921 |
SonoSight, Inc. (a) | 100 | | 3,395 |
Synovis Life Technologies, Inc. (a) | 100 | | 1,081 |
Synthes, Inc. | 100 | | 11,190 |
Thermo Electron Corp. (a) | 265,200 | | 8,006,388 |
Thoratec Corp. (a) | 100 | | 1,042 |
Varian, Inc. (a) | 100 | | 4,101 |
Ventana Medical Systems, Inc. (a) | 19,200 | | 1,228,608 |
Waters Corp. (a) | 851,120 | | 39,823,905 |
Wilson Greatbatch Technologies, Inc. (a) | 800 | | 17,936 |
Young Innovations, Inc. | 100 | | 3,373 |
Zimmer Holdings, Inc. (a) | 100 | | 8,012 |
Zoll Medical Corp. (a) | 100 | | 3,440 |
| | 93,438,483 |
Health Care Providers & Services - 5.6% |
Advisory Board Co. (a) | 100 | | 3,688 |
Aetna, Inc. | 216,200 | | 26,970,950 |
Common Stocks - continued |
| Shares | | Value (Note 1) |
HEALTH CARE - continued |
Health Care Providers & Services - continued |
AMERIGROUP Corp. (a) | 100 | | $ 7,566 |
Andrx Corp. (a) | 100 | | 2,183 |
Caremark Rx, Inc. (a) | 1,133,806 | | 44,705,971 |
Centene Corp. (a) | 100 | | 2,835 |
Cerner Corp. (a)(d) | 67,717 | | 3,600,513 |
Community Health Systems, Inc. (a) | 275,200 | | 7,672,576 |
Covance, Inc. (a) | 631,900 | | 24,486,125 |
Coventry Health Care, Inc. (a) | 50 | | 2,654 |
Dynacq Healthcare, Inc. (a)(d) | 100 | | 480 |
Eclipsys Corp. (a) | 100 | | 2,043 |
Evotec OAI AG (a) | 100 | | 357 |
Gambro AB (A Shares) | 100 | | 1,426 |
Health Management Associates, Inc. Class A | 100 | | 2,272 |
HealthExtras, Inc. (a) | 203,200 | | 3,312,160 |
Humana, Inc. (a) | 255,300 | | 7,579,857 |
ICON PLC sponsored ADR (a) | 335,326 | | 12,960,350 |
IDX Systems Corp. (a) | 100 | | 3,446 |
IMS Health, Inc. | 1,303,600 | | 30,256,556 |
iSoft Group PLC | 35 | | 232 |
Lifeline Systems, Inc. (a) | 155,900 | | 4,015,984 |
Merge Technologies, Inc. (a) | 100 | | 2,225 |
Molina Healthcare, Inc. (a) | 150,857 | | 6,996,748 |
NDCHealth Corp. | 100 | | 1,859 |
OCA, Inc. (a) | 100 | | 635 |
Odyssey Healthcare, Inc. (a) | 200 | | 2,736 |
Omnicare, Inc. | 138,650 | | 4,800,063 |
PAREXEL International Corp. (a) | 411,300 | | 8,349,390 |
Pediatrix Medical Group, Inc. (a) | 100 | | 6,405 |
Pharmaceutical Product Development, Inc. (a) | 438,700 | | 18,113,923 |
ProxyMed, Inc. (a) | 181,142 | | 1,778,814 |
Quest Diagnostics, Inc. | 200 | | 19,110 |
Renal Care Group, Inc. (a) | 150 | | 5,399 |
ResCare, Inc. (a) | 1,188,803 | | 18,093,582 |
TriZetto Group, Inc. (a) | 100 | | 950 |
VCA Antech, Inc. (a) | 80,900 | | 1,585,640 |
WebMD Corp. (a) | 100 | | 816 |
WellPoint, Inc. (a) | 200 | | 23,000 |
| | 225,371,519 |
Pharmaceuticals - 1.5% |
Able Laboratories, Inc. (a) | 100 | | 2,275 |
Allergan, Inc. | 100 | | 8,107 |
American Pharmaceutical Partners, Inc. (a) | 150 | | 5,612 |
Bentley Pharmaceuticals, Inc. (a) | 9,200 | | 98,900 |
Caraco Pharmaceutical Laboratories Ltd. (a) | 100 | | 955 |
Cipla Ltd. | 50,500 | | 371,073 |
Connetics Corp. (a) | 416,700 | | 10,121,643 |
Dr. Reddy's Laboratories Ltd. ADR | 186,900 | | 3,706,227 |
|
| Shares | | Value (Note 1) |
Endo Pharmaceuticals Holdings, Inc. (a) | 200 | | $ 4,204 |
Hi-Tech Pharmacal Co., Inc. (a) | 100 | | 1,844 |
Impax Laboratories, Inc. (a) | 100 | | 1,588 |
KV Pharmaceutical Co. Class A (a) | 150 | | 3,308 |
Merck KGaA | 293,321 | | 20,141,931 |
Nektar Therapeutics (a) | 100 | | 2,024 |
Ranbaxy Laboratories Ltd. sponsored GDR | 270,300 | | 7,868,433 |
Roche Holding AG: | | | |
ADR (a) | 10,600 | | 1,217,728 |
(participation certificate) | 60,543 | | 6,917,986 |
Salix Pharmaceuticals Ltd. (a) | 150 | | 2,639 |
Schering-Plough Corp. | 344,000 | | 7,182,720 |
SuperGen, Inc. (a) | 100 | | 705 |
Warner Chilcott PLC ADR | 100 | | 6,531 |
| | 57,666,433 |
TOTAL HEALTH CARE | | 637,380,296 |
INDUSTRIALS - 11.2% |
Aerospace & Defense - 1.3% |
Ceradyne, Inc. (a) | 150 | | 8,582 |
Cubic Corp. | 100 | | 2,517 |
DRS Technologies, Inc. (a) | 230,000 | | 9,823,300 |
EDO Corp. | 180,400 | | 5,727,700 |
Embraer - Empresa Brasileira de Aeronautica SA sponsored ADR | 100 | | 3,344 |
General Dynamics Corp. | 100 | | 10,460 |
L-3 Communications Holdings, Inc. | 478,800 | | 35,067,312 |
Rockwell Collins, Inc. | 100 | | 3,944 |
| | 50,647,159 |
Air Freight & Logistics - 0.4% |
Business Post Group PLC | 100 | | 1,195 |
C.H. Robinson Worldwide, Inc. | 44,950 | | 2,495,624 |
CNF, Inc. | 100 | | 5,010 |
Dynamex, Inc. (a) | 80 | | 1,482 |
Expeditors International of Washington, Inc. | 33,700 | | 1,883,156 |
Forward Air Corp. (a) | 100 | | 4,470 |
Hub Group, Inc. Class A (a) | 193,420 | | 10,100,392 |
| | 14,491,329 |
Airlines - 0.0% |
Southwest Airlines Co. | 100 | | 1,628 |
Building Products - 0.2% |
American Woodmark Corp. | 200 | | 8,736 |
Quixote Corp. | 100 | | 2,033 |
Simpson Manufacturing Co. Ltd. | 78,800 | | 2,750,120 |
Trex Co., Inc. (a) | 69,800 | | 3,660,312 |
Wienerberger AG | 100 | | 4,768 |
| | 6,425,969 |
Commercial Services & Supplies - 2.8% |
Apollo Group, Inc. Class A (a) | 311 | | 25,101 |
Benesse Corp. | 100 | | 3,505 |
Common Stocks - continued |
| Shares | | Value (Note 1) |
INDUSTRIALS - continued |
Commercial Services & Supplies - continued |
Bennett Environmental, Inc. (a) | 167,100 | | $ 593,205 |
Bright Horizons Family Solutions, Inc. (a) | 613,097 | | 39,704,162 |
Bunzl PLC | 101 | | 842 |
Career Education Corp. (a) | 100 | | 4,000 |
ChoicePoint, Inc. (a) | 350,500 | | 16,119,495 |
Coinstar, Inc. (a) | 100 | | 2,683 |
Concorde Career Colleges, Inc. (a) | 100 | | 2,030 |
Corporate Executive Board Co. | 100 | | 6,694 |
CoStar Group, Inc. (a) | 100 | | 4,618 |
Dun & Bradstreet Corp. (a) | 100 | | 5,965 |
Education Management Corp. (a) | 47,300 | | 1,561,373 |
Fullcast Co. Ltd. (d) | 5,184 | | 14,828,781 |
Gevity HR, Inc. | 100 | | 2,056 |
GFK AG | 20 | | 777 |
Intertek Group PLC | 100 | | 1,353 |
Ionics, Inc. (a)(d) | 666,900 | | 28,903,446 |
ITE Group PLC | 100 | | 166 |
ITT Educational Services, Inc. (a) | 100 | | 4,755 |
Labor Ready, Inc. (a) | 100 | | 1,692 |
National Research Corp. (a) | 100 | | 1,615 |
PICO Holdings, Inc. (a) | 100 | | 2,077 |
Princeton Review, Inc. (a) | 609,587 | | 3,748,960 |
Ritchie Brothers Auctioneers, Inc. | 200 | | 6,612 |
Robert Half International, Inc. | 100 | | 2,943 |
Societe Generale de Surveillance Holding SA (SGS) (Reg.) | 91 | | 63,611 |
Stericycle, Inc. (a) | 100 | | 4,595 |
Tele Atlas NV (a) | 100 | | 1,205 |
Tetra Tech, Inc. (a) | 74 | | 1,239 |
The Brink's Co. | 54,600 | | 2,157,792 |
Universal Technical Institute, Inc. | 85,900 | | 3,274,508 |
| | 111,041,856 |
Construction & Engineering - 1.6% |
Arcadis NV | 9,700 | | 180,272 |
Arcadis NV | 6,600 | | 121,559 |
Chicago Bridge & Iron Co. NV (NY Shares) | 302,800 | | 12,112,000 |
Dycom Industries, Inc. (a) | 591,900 | | 18,064,788 |
EMCOR Group, Inc. (a) | 100 | | 4,518 |
Fluor Corp. | 301,500 | | 16,434,765 |
Foster Wheeler Ltd. (a) | 294,331 | | 4,671,033 |
Jacobs Engineering Group, Inc. (a) | 288,800 | | 13,801,752 |
| | 65,390,687 |
Electrical Equipment - 0.5% |
AstroPower, Inc. (a) | 100 | | 1 |
Baldor Electric Co. | 80,900 | | 2,227,177 |
BYD Co. Ltd. (H Shares) | 174,500 | | 462,472 |
Crompton Greaves Ltd. | 144,396 | | 995,414 |
Fujikura Ltd. | 1,000 | | 4,608 |
II-VI, Inc. (a) | 100 | | 4,249 |
|
| Shares | | Value (Note 1) |
Rockwell Automation, Inc. | 306,900 | | $ 15,206,895 |
Roper Industries, Inc. | 38,700 | | 2,351,799 |
| | 21,252,615 |
Industrial Conglomerates - 0.1% |
Teleflex, Inc. | 77,700 | | 4,035,738 |
Machinery - 3.6% |
AGCO Corp. (a) | 2,106,400 | | 46,109,096 |
CNH Global NV | 512,000 | | 9,917,440 |
CUNO, Inc. (a) | 117,600 | | 6,985,440 |
Donaldson Co., Inc. | 200 | | 6,516 |
Dover Corp. | 14,600 | | 612,324 |
Flowserve Corp. (a) | 962,700 | | 26,512,758 |
Gardner Denver, Inc. (a) | 64,400 | | 2,337,076 |
Graco, Inc. | 668,700 | | 24,975,945 |
Harsco Corp. | 177,200 | | 9,877,128 |
Heidelberger Druckmaschinen AG (a) | 124,900 | | 4,235,827 |
Illinois Tool Works, Inc. | 100 | | 9,268 |
Koyo Seiko Co. Ltd. | 1,000 | | 14,078 |
Middleby Corp. | 100 | | 5,072 |
PACCAR, Inc. | 150 | | 12,072 |
Toshiba Machine Co. Ltd. | 1,000 | | 4,383 |
Trinity Industries, Inc. | 4,900 | | 166,992 |
Wabash National Corp. (a) | 100 | | 2,693 |
Wabtec Corp. | 198,700 | | 4,236,284 |
Watts Water Technologies, Inc. Class A | 105,800 | | 3,410,992 |
Zenon Environmental, Inc. (a) | 345,300 | | 6,747,738 |
| | 146,179,122 |
Marine - 0.1% |
Alexander & Baldwin, Inc. | 90,349 | | 3,832,605 |
Road & Rail - 0.4% |
Burlington Northern Santa Fe Corp. | 207,700 | | 9,826,287 |
Guangshen Railway Co. Ltd. sponsored ADR | 100 | | 2,047 |
Heartland Express, Inc. | 150 | | 3,371 |
Knight Transportation, Inc. | 150 | | 3,720 |
Landstar System, Inc. (a) | 22,100 | | 1,627,444 |
Norfolk Southern Corp. | 124,900 | | 4,520,131 |
Old Dominion Freight Lines, Inc. (a) | 150 | | 5,220 |
| | 15,988,220 |
Trading Companies & Distributors - 0.2% |
Fastenal Co. | 200 | | 12,312 |
MSC Industrial Direct Co., Inc. Class A | 267,300 | | 9,617,454 |
Richelieu Hardware Ltd. | 100 | | 1,831 |
| | 9,631,597 |
Transportation Infrastructure - 0.0% |
Sea Containers Ltd. Class B | 7,900 | | 153,260 |
TOTAL INDUSTRIALS | | 449,071,785 |
INFORMATION TECHNOLOGY - 9.1% |
Communications Equipment - 0.8% |
Arris Group, Inc. (a) | 100 | | 704 |
Common Stocks - continued |
| Shares | | Value (Note 1) |
INFORMATION TECHNOLOGY - continued |
Communications Equipment - continued |
Avaya, Inc. (a) | 2,900 | | $ 49,880 |
Black Box Corp. | 100 | | 4,802 |
Comtech Telecommunications Corp. (a) | 100 | | 3,761 |
NETGEAR, Inc. (a)(d) | 548,100 | | 9,969,939 |
Option NV (a) | 90 | | 3,229 |
Plantronics, Inc. | 139,900 | | 5,801,653 |
Polycom, Inc. (a) | 200 | | 4,664 |
Research In Motion Ltd. (a) | 53,200 | | 4,379,247 |
SafeNet, Inc. (a) | 86,601 | | 3,181,721 |
Tandberg ASA | 681,000 | | 8,446,555 |
| | 31,846,155 |
Computers & Peripherals - 0.0% |
Applied Films Corp. (a) | 100 | | 2,156 |
Compal Electronics, Inc. | 1,072 | | 1,069 |
Gemplus International SA ADR (a) | 100 | | 466 |
iCAD, Inc. (a) | 100 | | 447 |
Intergraph Corp. (a) | 100 | | 2,693 |
M-Systems Flash Disk Pioneers Ltd. (a) | 900 | | 17,748 |
Moser-Baer India Ltd. | 200 | | 1,083 |
Network Appliance, Inc. (a) | 100 | | 3,322 |
Overland Storage, Inc. (a) | 100 | | 1,669 |
Psion PLC | 100 | | 103 |
Stratasys, Inc. (a) | 150 | | 5,034 |
Synaptics, Inc. (a) | 100 | | 3,058 |
| | 38,848 |
Electronic Equipment & Instruments - 3.2% |
Brightpoint, Inc. (a) | 150 | | 2,931 |
CDW Corp. | 173,492 | | 11,511,194 |
CellStar Corp. (a) | 100 | | 445 |
Cogent, Inc. | 200 | | 6,600 |
Cognex Corp. | 100 | | 2,790 |
Dionex Corp. (a) | 108,200 | | 6,131,694 |
Elec & Eltek International Co. Ltd. | 1,613,000 | | 4,580,920 |
Excel Technology, Inc. (a) | 100 | | 2,600 |
Fargo Electronics, Inc. (a) | 100 | | 1,499 |
FLIR Systems, Inc. (a) | 89,245 | | 5,692,939 |
Global Imaging Systems, Inc. (a) | 100 | | 3,950 |
Hon Hai Precision Industries Co. Ltd. | 8,750,800 | | 40,464,536 |
I. D. Systems Inc. (a) | 100 | | 1,866 |
Iteris, Inc. (a) | 100 | | 345 |
Itron, Inc. (a) | 100 | | 2,391 |
Keyence Corp. | 19,700 | | 4,415,816 |
Landauer, Inc. | 100 | | 4,570 |
Measurement Specialties, Inc. (a) | 100 | | 2,546 |
Metrologic Instruments, Inc. (a) | 200 | | 4,250 |
Mettler-Toledo International, Inc. (a) | 259,800 | | 13,330,338 |
MTS Systems Corp. | 100 | | 3,381 |
National Instruments Corp. | 100 | | 2,725 |
Robotic Vision Systems, Inc. (a) | 100 | | 77 |
|
| Shares | | Value (Note 1) |
ScanSource, Inc. (a) | 100 | | $ 6,216 |
Symbol Technologies, Inc. | 2,551,600 | | 44,142,680 |
Universal Display Corp. (a) | 100 | | 900 |
Yageo Corp. sponsored GDR (a) | 100 | | 170 |
| | 130,320,369 |
Internet Software & Services - 1.0% |
Akamai Technologies, Inc. (a) | 100 | | 1,303 |
aQuantive, Inc. (a) | 218,811 | | 1,956,170 |
Ask Jeeves, Inc. (a) | 100 | | 2,675 |
Bankrate, Inc. (a) | 100 | | 1,385 |
Blue Coat Systems, Inc. (a) | 100 | | 1,861 |
Digital Impact, Inc. (a) | 100 | | 142 |
Digital River, Inc. (a) | 101,802 | | 4,235,981 |
DoubleClick, Inc. (a) | 100 | | 778 |
EarthLink, Inc. (a) | 100 | | 1,152 |
FindWhat.com (a) | 100 | | 1,773 |
Homestore, Inc. (a) | 100 | | 303 |
InfoSpace, Inc. (a) | 100 | | 4,755 |
iPass, Inc. (a) | 100 | | 740 |
iVillage, Inc. (a) | 100 | | 618 |
LookSmart Ltd. (a) | 100 | | 219 |
Neoforma, Inc. (a) | 100 | | 769 |
Net2Phone, Inc. (a) | 100 | | 340 |
Netease.com, Inc. sponsored ADR (a) | 100 | | 5,283 |
NIC, Inc. (a) | 10 | | 51 |
Open Text Corp. (a) | 100 | | 2,008 |
RealNetworks, Inc. (a) | 1,440,109 | | 9,533,522 |
Sina Corp. (a) | 100 | | 3,206 |
Sohu.com, Inc. (a)(d) | 39,000 | | 690,690 |
SonicWALL, Inc. (a) | 100 | | 632 |
ValueClick, Inc. (a) | 100 | | 1,333 |
VeriSign, Inc. (a) | 686,300 | | 23,004,776 |
WebEx Communications, Inc. (a) | 100 | | 2,378 |
Websense, Inc. (a) | 27,400 | | 1,389,728 |
| | 40,844,571 |
IT Services - 1.1% |
Affiliated Computer Services, Inc. Class A (a) | 623,900 | | 37,552,541 |
Alliance Data Systems Corp. (a) | 100 | | 4,748 |
Anteon International Corp. (a) | 100 | | 4,186 |
DST Systems, Inc. (a) | 600 | | 31,272 |
Global Payments, Inc. | 100 | | 5,854 |
Hewitt Associates, Inc. Class A (a) | 100 | | 3,201 |
iGate Corp. (a) | 100 | | 405 |
Infocrossing, Inc. (a) | 100 | | 1,693 |
Infosys Technologies Ltd. sponsored ADR | 200 | | 13,862 |
infoUSA, Inc. (a) | 100 | | 1,119 |
Lionbridge Technologies, Inc. (a) | 874,300 | | 5,875,296 |
Maximus, Inc. (a) | 100 | | 3,112 |
Satyam Computer Services Ltd. | 100 | | 949 |
StarTek, Inc. | 100 | | 2,845 |
SunGard Data Systems, Inc. (a) | 200 | | 5,666 |
Syntel, Inc. | 100 | | 1,754 |
Common Stocks - continued |
| Shares | | Value (Note 1) |
INFORMATION TECHNOLOGY - continued |
IT Services - continued |
The BISYS Group, Inc. (a) | 100 | | $ 1,645 |
TietoEnator Oyj | 100 | | 3,174 |
Total System Services, Inc. | 100 | | 2,430 |
Tyler Technologies, Inc. (a) | 100 | | 836 |
| | 43,516,588 |
Office Electronics - 0.3% |
Neopost SA | 2,200 | | 170,708 |
Zebra Technologies Corp. Class A (a) | 218,125 | | 12,276,075 |
| | 12,446,783 |
Semiconductors & Semiconductor Equipment - 1.3% |
Agere Systems, Inc. Class A (a) | 100 | | 137 |
Analog Devices, Inc. | 49,700 | | 1,834,924 |
ARM Holdings PLC sponsored ADR | 100 | | 617 |
ASM Pacific Technology Ltd. | 500 | | 1,801 |
Cabot Microelectronics Corp. (a) | 289,900 | | 11,610,495 |
Cree, Inc. (a) | 46,100 | | 1,847,688 |
Hi/fn, Inc. (a) | 8 | | 74 |
International Rectifier Corp. (a) | 15,700 | | 699,749 |
KLA-Tencor Corp. (a) | 31,500 | | 1,467,270 |
Linear Technology Corp. | 100 | | 3,876 |
Marvell Technology Group Ltd. (a) | 200 | | 7,094 |
NVIDIA Corp. (a) | 917,300 | | 21,611,588 |
Omnivision Technologies, Inc. (a) | 400 | | 7,340 |
Pixelworks, Inc. (a) | 100 | | 1,134 |
PLX Technology, Inc. (a) | 100 | | 1,040 |
Silicon Image, Inc. (a) | 100 | | 1,646 |
Skyworks Solutions, Inc. (a) | 389,700 | | 3,674,871 |
Varian Semiconductor Equipment Associates, Inc. (a) | 206,900 | | 7,624,265 |
Zoran Corp. (a) | 100 | | 1,158 |
| | 50,396,767 |
Software - 1.4% |
Adobe Systems, Inc. | 75,300 | | 4,724,322 |
Altiris, Inc. (a) | 100 | | 3,543 |
Bottomline Technologies, Inc. (a) | 11 | | 159 |
Cadence Design Systems, Inc. (a) | 100 | | 1,381 |
CCC Information Services Group, Inc. (a) | 100 | | 2,221 |
Citrix Systems, Inc. (a) | 100 | | 2,453 |
DATATRAK International, Inc. (a) | 100 | | 1,113 |
Digimarc Corp. (a) | 100 | | 932 |
Electronic Arts, Inc. (a) | 100 | | 6,168 |
FactSet Research Systems, Inc. | 100 | | 5,844 |
FileNET Corp. (a) | 100 | | 2,576 |
Hyperion Solutions Corp. (a) | 100 | | 4,662 |
Informatica Corp. (a) | 100 | | 812 |
Intuit, Inc. (a) | 132,800 | | 5,844,528 |
JAMDAT Mobile, Inc. | 100 | | 2,065 |
Macromedia, Inc. (a) | 100 | | 3,112 |
Macrovision Corp. (a) | 389,944 | | 10,029,360 |
Manhattan Associates, Inc. (a) | 100 | | 2,388 |
|
| Shares | | Value (Note 1) |
MRO Software, Inc. (a) | 100 | | $ 1,302 |
Napster, Inc. (a) | 100 | | 940 |
NAVTEQ Corp. | 100 | | 4,636 |
NDS Group PLC sponsored ADR (a) | 100 | | 3,408 |
Open Solutions, Inc. (a) | 437,209 | | 11,349,946 |
Plato Learning, Inc. (a) | 100 | | 745 |
Quality Systems, Inc. (a) | 100 | | 5,980 |
Renaissance Learning, Inc. | 70 | | 1,299 |
RSA Security, Inc. (a) | 100,687 | | 2,019,781 |
Salesforce.com, Inc. | 60,000 | | 1,016,400 |
ScanSoft, Inc. (a) | 100 | | 419 |
SERENA Software, Inc. (a) | 100 | | 2,164 |
Symantec Corp. (a) | 100 | | 2,576 |
Synopsys, Inc. (a) | 325,800 | | 6,392,196 |
TALX Corp. | 83,200 | | 2,145,728 |
Temenos Group AG (a) | 100 | | 922 |
THQ, Inc. (a) | 313,900 | | 7,200,866 |
TIBCO Software, Inc. (a) | 100 | | 1,334 |
Vastera, Inc. (a) | 667,400 | | 1,755,262 |
Visual Networks, Inc. (a) | 767,308 | | 2,670,232 |
WatchGuard Technologies, Inc. (a) | 10 | | 44 |
| | 55,213,819 |
TOTAL INFORMATION TECHNOLOGY | | 364,623,900 |
MATERIALS - 18.4% |
Chemicals - 1.9% |
American Vanguard Corp. | 150 | | 5,517 |
Asian Paints India Ltd. | 45,800 | | 338,920 |
Balchem Corp. | 100 | | 3,469 |
Cambrex Corp. | 100 | | 2,710 |
Ecolab, Inc. (d) | 509,300 | | 17,891,709 |
Headwaters, Inc. (a) | 100 | | 2,850 |
K&S AG | 59,500 | | 3,155,946 |
Lonza Group AG | 10 | | 562 |
Minerals Technologies, Inc. | 34,200 | | 2,281,140 |
Monsanto Co. | 178,300 | | 9,904,565 |
Mosaic Co. (a) | 117,900 | | 1,924,128 |
Nitto Denko Corp. | 181,200 | | 9,941,853 |
NOVA Chemicals Corp. | 251,500 | | 11,883,375 |
Novozymes AS Series B | 100 | | 5,071 |
Olin Corp. | 104,900 | | 2,309,898 |
Potash Corp. of Saskatchewan | 100 | | 8,313 |
Praxair, Inc. | 47,000 | | 2,075,050 |
Quaker Chemical Corp. | 100 | | 2,484 |
Sasa Dupont Sabanci Polyester Sanayi AS (a) | 1,000 | | 1 |
Sinopec Beijing Yanhua Petrochemical Co. Ltd. sponsored ADR | 100 | | 2,337 |
Sinopec Shanghai Petrochemical Co. Ltd.: | | | |
(H Shares) | 2,000 | | 746 |
Common Stocks - continued |
| Shares | | Value (Note 1) |
MATERIALS - continued |
Chemicals - continued |
Sinopec Shanghai Petrochemical Co. Ltd.: - continued | | | |
sponsored ADR (d) | 125,400 | | $ 4,677,420 |
Tosoh Corp. | 1,859,500 | | 8,368,930 |
| | 74,786,994 |
Construction Materials - 0.0% |
Cemex SA de CV sponsored ADR | 104 | | 3,788 |
Florida Rock Industries, Inc. | 150 | | 8,930 |
Vulcan Materials Co. | 13,000 | | 709,930 |
| | 722,648 |
Containers & Packaging - 0.4% |
Essel Propack Ltd. | 13,700 | | 84,069 |
Packaging Corp. of America | 565,300 | | 13,312,815 |
Silgan Holdings, Inc. | 40,500 | | 2,468,880 |
| | 15,865,764 |
Metals & Mining - 15.8% |
Agnico-Eagle Mines Ltd. | 1,180,230 | | 16,247,833 |
Agnico-Eagle Mines Ltd. warrants 11/14/07 (a) | 23,350 | | 64,446 |
Aleris International, Inc. (a) | 100 | | 1,692 |
Arch Coal, Inc. | 365,400 | | 12,986,316 |
Barrick Gold Corp. | 100 | | 2,417 |
BHP Billiton Ltd. sponsored ADR | 15,500 | | 372,310 |
BlueScope Steel Ltd. | 1,037,200 | | 6,694,919 |
Brush Engineered Materials, Inc. (a) | 100 | | 1,850 |
Compania de Minas Buenaventura SA sponsored ADR | 1,105,300 | | 25,311,370 |
CONSOL Energy, Inc. | 763,900 | | 31,358,095 |
Dofasco, Inc. | 100 | | 3,783 |
Falconbridge Ltd. | 225,900 | | 5,854,575 |
FNX Mining Co., Inc. (a) | 164,300 | | 709,228 |
Freeport-McMoRan Copper & Gold, Inc. Class B | 1,273,800 | | 48,697,374 |
Gibraltar Industries, Inc. | 106,400 | | 2,513,168 |
Glamis Gold Ltd. (a) | 129,400 | | 2,217,053 |
Goldcorp, Inc. | 50,000 | | 752,500 |
Golden Star Resources Ltd. (a) | 250,000 | | 1,004,167 |
Harmony Gold Mining Co. Ltd. | 1,049,100 | | 9,725,158 |
High River Gold Mines Ltd. (a) | 1,989,600 | | 3,034,140 |
Inco Ltd. (a) | 100 | | 3,667 |
Inmet Mining Corp. (a) | 712,800 | | 12,794,760 |
International Steel Group, Inc. | 2,500 | | 101,400 |
IPSCO, Inc. | 1,165,900 | | 55,681,441 |
Ivanhoe Mines Ltd. (a) | 90,500 | | 652,354 |
Kinross Gold Corp. (a) | 4,204,866 | | 29,609,265 |
Massey Energy Co. | 289,794 | | 10,128,300 |
Meridian Gold, Inc. (a) | 100 | | 1,895 |
Newmont Mining Corp. | 2,267,580 | | 100,703,207 |
Nippon Steel Corp. | 3,401,000 | | 8,333,994 |
|
| Shares | | Value (Note 1) |
Noranda, Inc. | 100 | | $ 1,755 |
Nucor Corp. (d) | 1,866,700 | | 97,703,078 |
Peabody Energy Corp. | 233,400 | | 18,884,394 |
Phelps Dodge Corp. | 89,200 | | 8,823,664 |
Placer Dome, Inc. | 100 | | 1,882 |
POSCO sponsored ADR | 100 | | 4,453 |
Ryerson Tull, Inc. | 100 | | 1,575 |
Schnitzer Steel Industries, Inc. Class A | 150 | | 5,090 |
Steel Dynamics, Inc. | 1,728,994 | | 65,494,293 |
Teck Cominco Ltd. Class B (sub. vtg.) (d) | 1,118,800 | | 34,421,747 |
United States Steel Corp. | 354,300 | | 18,157,875 |
Usinas Siderurgicas de Minas Gerais SA (Usiminas) (PN-A) | 203,000 | | 4,115,030 |
Worthington Industries, Inc. | 3,200 | | 62,656 |
Xstrata PLC | 100 | | 1,789 |
| | 633,241,958 |
Paper & Forest Products - 0.3% |
International Forest Products (Interfor) Class A (a) | 9,100 | | 52,325 |
Lee & Man Paper Manufacturing Ltd. | 6,792,000 | | 5,548,734 |
MAXXAM, Inc. (a) | 100 | | 3,260 |
Sino-Forest Corp. (a) | 2,545,700 | | 7,276,459 |
Votorantim Celulose e Papel SA sponsored ADR (non-vtg.) | 250 | | 4,050 |
| | 12,884,828 |
TOTAL MATERIALS | | 737,502,192 |
TELECOMMUNICATION SERVICES - 1.9% |
Diversified Telecommunication Services - 0.8% |
Covad Communications Group, Inc. (a) | 2,491,761 | | 5,357,286 |
General Communications, Inc. Class A (a) | 100 | | 1,104 |
Golden Telecom, Inc. | 100 | | 2,642 |
Hungarian Telephone & Cable Corp. (a) | 100 | | 1,440 |
Philippine Long Distance Telephone Co. (a) | 100 | | 2,421 |
Philippine Long Distance Telephone Co. sponsored ADR (a)(d) | 425,600 | | 10,610,208 |
PT Indosat Tbk sponsored ADR | 100 | | 3,118 |
PT Telkomunikasi Indonesia Tbk sponsored ADR | 722,300 | | 15,182,746 |
| | 31,160,965 |
Wireless Telecommunication Services - 1.1% |
America Movil SA de CV sponsored ADR | 224,300 | | 11,742,105 |
Boston Communications Group, Inc. (a) | 100 | | 924 |
MTN Group Ltd. | 2,253,716 | | 17,305,369 |
Nextel Communications, Inc. Class A (a) | 100 | | 3,000 |
Nextel Partners, Inc. Class A (a) | 100 | | 1,954 |
NII Holdings, Inc. (a) | 349,008 | | 16,560,430 |
Telemig Celular Participacoes SA ADR | 100 | | 2,823 |
| | 45,616,605 |
TOTAL TELECOMMUNICATION SERVICES | | 76,777,570 |
Common Stocks - continued |
| Shares | | Value (Note 1) |
UTILITIES - 0.0% |
Electric Utilities - 0.0% |
FPL Group, Inc. | 100 | | $ 7,475 |
PPL Corp. | 100 | | 5,328 |
| | 12,803 |
Multi-Utilities & Unregulated Power - 0.0% |
Public Service Enterprise Group, Inc. | 100 | | 5,177 |
TOTAL UTILITIES | | 17,980 |
TOTAL COMMON STOCKS (Cost $2,720,027,228) | 3,869,885,699 |
Nonconvertible Preferred Stocks - 0.0% |
| | | |
CONSUMER DISCRETIONARY - 0.0% |
Automobiles - 0.0% |
Porsche AG (non-vtg.) | 100 | | 63,690 |
Household Durables - 0.0% |
Fedders Corp. Series A, 8.60% | 5 | | 120 |
TOTAL NONCONVERTIBLE PREFERRED STOCKS (Cost $58,459) | 63,810 |
Money Market Funds - 4.0% |
| | | |
Fidelity Cash Central Fund, 2.24% (b) | 99,587,186 | | 99,587,186 |
Fidelity Securities Lending Cash Central Fund, 2.23% (b)(c) | 59,013,966 | | 59,013,966 |
TOTAL MONEY MARKET FUNDS (Cost $158,601,152) | 158,601,152 |
TOTAL INVESTMENT
PORTFOLIO - 100.7% (Cost $2,878,686,839) | 4,028,550,661 |
NET OTHER ASSETS - (0.7)% | (28,308,362) |
NET ASSETS - 100% | $ 4,000,242,299 |
Legend |
(a) Non-income producing |
(b) Affiliated fund that is available only to investment companies and other accounts managed by Fidelity Investments. The rate quoted is the annualized seven-day yield of the fund at period end. A complete listing of the fund's holdings as of its most recent fiscal year end is available upon request. |
(c) Includes investment made with cash collateral received from securities on loan. |
(d) Security or a portion of the security is on loan at period end. |
(e) Affiliated company |
Other Information |
Distribution of investments by country of issue, as a percentage of total net assets, is as follows: |
United States of America | 72.7% |
Canada | 7.1% |
Japan | 3.9% |
Netherlands | 1.9% |
India | 1.5% |
Bermuda | 1.2% |
Cayman Islands | 1.1% |
Italy | 1.1% |
Taiwan | 1.0% |
Others (individually less than 1%) | 8.5% |
| 100.0% |
An affiliated company is a company in which the fund has ownership of at least 5% of the voting securities. Companies which are affiliates of the fund at period-end are noted in the fund's Schedule of Investments. Transactions during the period with companies which are or were affiliates are as follows: |
Affiliates | Value, beginning of period |
Purchases
|
Sales
Proceeds
|
Dividend
Income
| Value,
end of
period |
Bright Horizons Family Solutions, Inc. | $ 28,782,600 | $ - | $ 4,594,980 | $ - | $ - |
Foster Wheeler Ltd. | - | 3,915,209 | - | - | - |
Harvard Bioscience, Inc. | 24,939,580 | 1,612,609 | 1,104,712 | - | 13,996,708 |
IMPCO Technologies, Inc. | 1,771,032 | 8,777,717 | 791,283 | - | 11,373,320 |
Total | $ 55,493,212 | $ 14,305,535 | $ 6,490,975 | $ - | $ 25,370,028 |
Income Tax Information |
The fund hereby designates as capital gain dividends: For dividends with respect to the taxable year ended December 31, 2004, $68,763,000 or, if different, the net capital gain of such year. |
See accompanying notes which are an integral part of the financial statements.
Mid Cap Portfolio
Fidelity Variable Insurance Products Fund: Mid Cap Portfolio
Financial Statements
Statement of Assets and Liabilities
December 31, 2004 |
| | |
Assets | | |
Investment in securities, at value (including securities loaned of $57,253,994) (cost $2,878,686,839) - See accompanying schedule | | $ 4,028,550,661 |
Cash | | 118,202 |
Foreign currency held at value (cost $9,142,039) | | 9,609,981 |
Receivable for investments sold | | 41,707,554 |
Receivable for fund shares sold | | 2,072,663 |
Dividends receivable | | 2,016,209 |
Interest receivable | | 213,204 |
Prepaid expenses | | 11,603 |
Other receivables | | 214,767 |
Total assets | | 4,084,514,844 |
| | |
Liabilities | | |
Payable for investments purchased | $ 19,788,804 | |
Payable for fund shares redeemed | 1,032,969 | |
Accrued management fee | 1,840,389 | |
Distribution fees payable | 506,394 | |
Other affiliated payables | 310,760 | |
Other payables and accrued expenses | 1,779,263 | |
Collateral on securities loaned, at value | 59,013,966 | |
Total liabilities | | 84,272,545 |
| | |
Net Assets | | $ 4,000,242,299 |
Net Assets consist of: | | |
Paid in capital | | $ 2,787,744,560 |
Undistributed net investment income | | 68,191 |
Accumulated undistributed net realized gain (loss) on investments and foreign currency transactions | | 63,335,377 |
Net unrealized appreciation (depreciation) on investments and assets and liabilities in foreign currencies | | 1,149,094,171 |
Net Assets | | $ 4,000,242,299 |
| | |
Initial Class: Net Asset Value, offering price and redemption price per share ($979,532,916 ÷ 32,457,007 shares) | | $ 30.18 |
| | |
Service Class: Net Asset Value, offering price and redemption price per share ($819,411,575 ÷ 27,246,677 shares) | | $ 30.07 |
| | |
Service Class 2: Net Asset Value, offering price and redemption price per share ($2,201,297,808 ÷ 73,675,095 shares) | | $ 29.88 |
Statement of Operations
Year ended December 31, 2004 |
| | |
Investment Income | | |
Dividends | | $ 19,986,604 |
Interest | | 811,862 |
Security lending | | 749,362 |
Total income | | 21,547,828 |
| | |
Expenses | | |
Management fee | $ 17,263,105 | |
Transfer agent fees | 2,044,982 | |
Distribution fees | 4,605,289 | |
Accounting and security lending fees | 941,481 | |
Non-interested trustees' compensation | 15,949 | |
Custodian fees and expenses | 426,013 | |
Audit | 52,412 | |
Legal | 6,596 | |
Interest | 709 | |
Miscellaneous | 576,544 | |
Total expenses before reductions | 25,933,080 | |
Expense reductions | (742,557) | 25,190,523 |
Net investment income (loss) | | (3,642,695) |
Realized and Unrealized Gain (Loss) Net realized gain (loss) on: | | |
Investment securities (Including realized gain of $2,737,245 from affiliated issuers) | 195,588,243 | |
Foreign currency transactions | (153,730) | |
Total net realized gain (loss) | | 195,434,513 |
Change in net unrealized appreciation (depreciation) on: Investment securities (net of increase in deferred foreign taxes of $918,145) | 535,771,834 | |
Assets and liabilities in foreign currencies | 481,551 | |
Total change in net unrealized appreciation (depreciation) | | 536,253,385 |
Net gain (loss) | | 731,687,898 |
Net increase (decrease) in net assets resulting from operations | | $ 728,045,203 |
See accompanying notes which are an integral part of the financial statements.
Annual Report
Fidelity Variable Insurance Products Fund: Mid Cap Portfolio
Financial Statements - continued
Statement of Changes in Net Assets
| Year ended
December 31, 2004 | Year ended
December 31, 2003 A |
Increase (Decrease) in Net Assets | | |
Operations | | |
Net investment income (loss) | $ (3,642,695) | $ (2,294,177) |
Net realized gain (loss) | 195,434,513 | 29,542,718 |
Change in net unrealized appreciation (depreciation) | 536,253,385 | 575,223,419 |
Net increase (decrease) in net assets resulting from operations | 728,045,203 | 602,471,960 |
Distributions to shareholders from net investment income | - | (5,082,393) |
Share transactions - net increase (decrease) | 835,964,194 | 440,089,337 |
Total increase (decrease) in net assets | 1,564,009,397 | 1,037,478,904 |
| | |
Net Assets | | |
Beginning of period | 2,436,232,902 | 1,398,753,998 |
End of period (including undistributed net investment income of $68,191 and undistributed net investment income of $76,412, respectively) | $ 4,000,242,299 | $ 2,436,232,902 |
Other Information: | | | |
Share Transactions | Year ended December 31, 2004 |
| Initial Class | Service Class | Service Class 2 |
Shares Sold | 7,712,308 | 4,751,291 | 29,867,543 |
Reinvested | - | - | - |
Redeemed | (3,341,075) | (1,581,671) | (5,307,215) |
Net increase (decrease) | 4,371,233 | 3,169,620 | 24,560,328 |
| | | |
Dollars Sold | $ 203,215,754 | $ 122,478,823 | $ 766,867,153 |
Reinvested | - | - | - |
Redeemed | (83,674,683) | (40,224,756) | (132,698,097) |
Net increase (decrease) | $ 119,541,071 | $ 82,254,067 | $ 634,169,056 |
| | | |
Share Transactions | Year ended December 31, 2003 |
| Initial Class | Service Class | Service Class 2 |
Shares Sold | 4,434,612 | 4,691,539 | 24,537,608 |
Reinvested | 131,528 | 76,717 | 95,288 |
Redeemed | (5,011,471) | (2,353,097) | (5,472,778) |
Net increase (decrease) | (445,331) | 2,415,159 | 19,160,118 |
| | | |
Dollars Sold | $ 95,795,053 | $ 94,175,028 | $ 482,784,357 |
Reinvested | 2,207,036 | 1,285,007 | 1,590,350 |
Redeemed | (89,867,137) | (43,168,976) | (104,711,381) |
Net increase (decrease) | $ 8,134,952 | $ 52,291,059 | $ 379,663,326 |
| | | |
Distributions | Year ended December 31, 2003 |
| Initial Class | Service Class | Service Class 2 |
From net investment income | $ 2,207,036 | $ 1,285,007 | $ 1,590,350 |
A Certain amounts have been reclassified. See Note 1 of Notes to Financial Statements.
See accompanying notes which are an integral part of the financial statements.
Mid Cap Portfolio
Financial Highlights - Initial Class
Years ended December 31, | 2004 | 2003F | 2002 | 2001 | 2000 |
Selected Per-Share Data | | | | | |
Net asset value, beginning of period | $ 24.16 | $ 17.51 | $ 19.60 | $ 20.26 | $ 15.25 |
Income from Investment Operations | | | | | |
Net investment income (loss)C | .01 | -E | .09 | .20 | .19 |
Net realized and unrealized gain (loss) | 6.01 | 6.73 | (2.00) | (.86) | 4.95 |
Total from investment operations | 6.02 | 6.73 | (1.91) | (.66) | 5.14 |
Distributions from net investment income | - | (.08) | (.18) | - | (.08) |
Distributions in excess of net realized gain | - | - | - | - | (.05) |
Total distributions | - | (.08) | (.18) | - | (.13) |
Net asset value, end of period | $ 30.18 | $ 24.16 | $ 17.51 | $ 19.60 | $ 20.26 |
Total ReturnA, B | 24.92% | 38.64% | (9.82)% | (3.26)% | 33.78% |
Ratios to Average Net AssetsD | | | | | |
Expenses before expense reductions | .71% | .70% | .70% | .69% | .74% |
Expenses net of voluntary waivers, if any | .71% | .70% | .70% | .69% | .74% |
Expenses net of all reductions | .68% | .68% | .63% | .62% | .69% |
Net investment income (loss) | .03% | -% | .51% | 1.06% | 1.01% |
Supplemental Data | | | | | |
Net assets, end of period (000 omitted) | $ 979,533 | $ 678,480 | $ 499,557 | $ 574,934 | $ 589,026 |
Portfolio turnover rate | 55% | 51% | 135% | 144% | 245% |
A Total returns do not reflect charges attributable to your insurance company's separate account. Inclusion of these charges would reduce the total returns shown.
B Total returns would have been lower had certain expenses not been reduced during the periods shown.
C Calculated based on average shares outstanding during the period.
D Expense ratios reflect operating expenses of the class. Expenses before reductions do not reflect amounts reimbursed by the investment adviser or reductions from brokerage service arrangements or other expense offset arrangements and do not represent the amount paid by the class during periods when reimbursements or reductions occur. Expenses net of any voluntary waivers reflect expenses after reimbursement by the investment adviser but prior to reductions from brokerage service arrangements or other expense offset arrangements. Expenses net of all reductions represent the net expenses paid by the class.
E Amount represents less than $.01 per share.
F As the result of a correction made in the classification of distributions received on securities representing realized gains for the year ended December 31, 2003, amounts previously reported have been reclassified. The impact of this correction was a decrease in net investment loss of $0.01 per share and a corresponding decrease in net realized and unrealized gain (loss). The ratio of net investment loss to average net assets decreased from (0.04)% to 0.00%. The reclassification had no impact on total net assets or total return of the class.
Financial Highlights - Service Class
Years ended December 31, | 2004 | 2003E | 2002 | 2001 | 2000 |
Selected Per-Share Data | | | | | |
Net asset value, beginning of period | $ 24.10 | $ 17.46 | $ 19.54 | $ 20.22 | $ 15.24 |
Income from Investment Operations | | | | | |
Net investment income (loss)C | (.02) | (.02) | .08 | .18 | .17 |
Net realized and unrealized gain (loss) | 5.99 | 6.72 | (2.00) | (.86) | 4.93 |
Total from investment operations | 5.97 | 6.70 | (1.92) | (.68) | 5.10 |
Distributions from net investment income | - | (.06) | (.16) | - | (.07) |
Distributions in excess of net realized gain | - | - | - | - | (.05) |
Total distributions | - | (.06) | (.16) | - | (.12) |
Net asset value, end of period | $ 30.07 | $ 24.10 | $ 17.46 | $ 19.54 | $ 20.22 |
Total ReturnA, B | 24.77% | 38.52% | (9.90)% | (3.36)% | 33.54% |
Ratios to Average Net AssetsD | | | | | |
Expenses before expense reductions | .81% | .80% | .80% | .79% | .84% |
Expenses net of voluntary waivers, if any | .81% | .80% | .80% | .79% | .84% |
Expenses net of all reductions | .78% | .78% | .73% | .72% | .79% |
Net investment income (loss) | (.07)% | (.10)% | .41% | .96% | .92% |
Supplemental Data | | | | | |
Net assets, end of period (000 omitted) | $ 819,412 | $ 580,179 | $ 378,264 | $ 366,665 | $ 282,941 |
Portfolio turnover rate | 55% | 51% | 135% | 144% | 245% |
A Total returns do not reflect charges attributable to your insurance company's separate account. Inclusion of these charges would reduce the total returns shown.
B Total returns would have been lower had certain expenses not been reduced during the periods shown.
C Calculated based on average shares outstanding during the period.
D Expense ratios reflect operating expenses of the class. Expenses before reductions do not reflect amounts reimbursed by the investment adviser or reductions from brokerage service arrangements or other expense offset arrangements and do not represent the amount paid by the class during periods when reimbursements or reductions occur. Expenses net of any voluntary waivers reflect expenses after reimbursement by the investment adviser but prior to reductions from brokerage service arrangements or other expense offset arrangements. Expenses net of all reductions represent the net expenses paid by the class.
E As the result of a correction made in the classification of distributions received on securities representing realized gains for the year ended December 31, 2003, amounts previously reported have been reclassified. The impact of this correction was a decrease in net investment loss of $0.01 per share and a corresponding decrease in net realized and unrealized gain (loss). The ratio of net investment loss to average net assets decreased from (0.14)% to (0.10)%. The reclassification had no impact on total net assets or total return of the class.
See accompanying notes which are an integral part of the financial statements.
Annual Report
Fidelity Variable Insurance Products Fund: Mid Cap Portfolio
Financial Statements - continued
Financial Highlights - Service Class 2
Years ended December 31, | 2004 | 2003 F | 2002 | 2001 | 2000D |
Selected Per-Share Data | | | | | |
Net asset value, beginning of period | $ 23.98 | $ 17.39 | $ 19.49 | $ 20.20 | $ 14.82 |
Income from Investment Operations | | | | | |
Net investment income (loss)C | (.06) | (.05) | .05 | .15 | .14 |
Net realized and unrealized gain (loss) | 5.96 | 6.69 | (1.99) | (.86) | 5.35 |
Total from investment operations | 5.90 | 6.64 | (1.94) | (.71) | 5.49 |
Distributions from net investment income | - | (.05) | (.16) | - | (.06) |
Distributions in excess of net realized gain | - | - | - | - | (.05) |
Total distributions | - | (.05) | (.16) | - | (.11) |
Net asset value, end of period | $ 29.88 | $ 23.98 | $ 17.39 | $ 19.49 | $ 20.20 |
Total ReturnA, B | 24.60% | 38.31% | (10.02)% | (3.51)% | 37.12% |
Ratios to Average Net AssetsE | | | | | |
Expenses before expense reductions | .96% | .95% | .95% | .94% | .99% A |
Expenses net of voluntary waivers, if any | .96% | .95% | .95% | .94% | .99% A |
Expenses net of all reductions | .93% | .93% | .88% | .88% | .94% A |
Net investment income (loss) | (.22)% | (.25)% | .25% | .81% | .76% A |
Supplemental Data | | | | | |
Net assets, end of period (000 omitted) | $ 2,201,298 | $ 1,177,574 | $ 520,933 | $ 210,356 | $ 73,039 |
Portfolio turnover rate | 55% | 51% | 135% | 144% | 245% |
A Total returns do not reflect charges attributable to your insurance company's separate account. Inclusion of these charges would reduce the total returns shown.
B Total returns would have been lower had certain expenses not been reduced during the periods shown.
C Calculated based on average shares outstanding during the period.
D For the period January 12, 2000 (commencement of operations) to December 31, 2000.
E Expense ratios reflect operating expenses of the class. Expenses before reductions do not reflect amounts reimbursed by the investment adviser or reductions from brokerage service arrangements or other expense offset arrangements and do not represent the amount paid by the class during periods when reimbursements or reductions occur. Expense ratios before reductions for start-up periods may not be representative of longer-term operating periods. Expenses net of any voluntary waivers reflect expenses after reimbursement by the investment adviser but prior to reductions from brokerage service arrangements or other expense offset arrangements. Expenses net of all reductions represent the net expenses paid by the class.
F As the result of a correction made in the classification of distributions received on securities representing realized gains for the year ended December 31, 2003, amounts previously reported have been reclassified. The impact of this correction was a decrease in net investment loss of $0.01 per share and a corresponding decrease in net realized and unrealized gain (loss). The ratio of net investment loss to average net assets decreased from (0.29)% to (0.25)%. The reclassification had no impact on total net assets or total return of the class.
See accompanying notes which are an integral part of the financial statements.
Mid Cap Portfolio
Notes to Financial Statements
For the period ended December 31, 2004
1. Significant Accounting Policies.
Mid Cap Portfolio (the fund) is a fund of Variable Insurance Products Fund III (the trust) (referred to in this report as Fidelity Variable Insurance Products: Mid Cap Portfolio) and is authorized to issue an unlimited number of shares. The trust is registered under the Investment Company Act of 1940, as amended (the 1940 Act), as an open-end management investment company organized as a Massachusetts business trust. Shares of the fund may only be purchased by insurance companies for the purpose of funding variable annuity or variable life insurance contracts. The fund offers the following classes of shares: Initial Class shares, Service Class shares and Service Class 2 shares. All classes have equal rights and voting privileges, except for matters affecting a single class. Investment income, realized and unrealized capital gains and losses, the common expenses of the fund, and certain fund-level expense reductions, if any, are allocated on a pro rata basis to each class based on the relative net assets of each class to the total net assets of the fund. Each class differs with respect to distribution and service plan fees incurred. Certain expense reductions also differ by class.
The financial statements have been prepared in conformity with accounting principles generally accepted in the United States of America, which require management to make certain estimates and assumptions at the date of the financial statements. The following summarizes the significant accounting policies of the fund:
Security Valuation. Net asset value per share (NAV calculation) is calculated as of the close of business of the New York Stock Exchange, normally 4:00 p.m. Eastern time. Equity securities, including restricted securities, for which market quotations are available are valued at the last sale price or official closing price (closing bid price or last evaluated quote if no sale has occurred) on the primary market or exchange on which they trade. If prices are not readily available or do not accurately reflect fair value for a security, or if a security's value has been materially affected by events occurring after the close of the exchange or market on which the security is principally traded, that security may be valued by another method that the Board of Trustees believes accurately reflects fair value. A security's valuation may differ depending on the method used for determining value. Price movements in futures contracts and ADRs, market and trading trends, the bid/ask quotes of brokers and off-exchange institutional trading may be reviewed in the course of making a good faith determination of a security's fair value. Short-term securities with remaining maturities of sixty days or less for which quotations are not readily available are valued on the basis of amortized cost. Investments in open-end investment companies are valued at their net asset value each business day.
Foreign Currency. The fund uses foreign currency contracts to facilitate transactions in foreign-denominated securities. Losses from these transactions may arise from changes in the value of the foreign currency or if the counterparties do not perform under the contracts' terms.
Foreign-denominated assets, including investment securities, and liabilities are translated into U.S. dollars at the exchange rate at period end. Purchases and sales of investment securities, income and dividends received and expenses denominated in foreign currencies are translated into U.S. dollars at the exchange rate in effect on the transaction date.
The effects of exchange rate fluctuations on investments are included with the net realized and unrealized gain (loss) on investment securities. Other foreign currency transactions resulting in realized and unrealized gain (loss) are disclosed separately.
Investment Transactions and Income. Security transactions are accounted for as of trade date. Gains and losses on securities sold are determined on the basis of identified cost and may include proceeds received from litigation. Dividend income is recorded on the ex-dividend date, except for certain dividends from foreign securities where the ex-dividend date may have passed, which are recorded as soon as the fund is informed of the ex-dividend date. Non-cash dividends included in dividend income, if any, are recorded at the fair market value of the securities received. Distributions received on securities that represent a return of capital or capital gain are recorded as a reduction of cost of investments and/or as a realized gain. The fund estimates the components of distributions received that may be considered return of capital distributions or capital gain distributions. Interest income is accrued as earned. Interest income includes coupon interest and amortization of premium and accretion of discount on debt securities. Investment income is recorded net of foreign taxes withheld where recovery of such taxes is uncertain.
Reclassification of Financial Information. As the result of a correction made in the classification of distributions received on securities representing realized gains for the year ended December 31, 2003, amounts previously reported have been reclassified. Net investment loss for the fund decreased by $669,090, with a corresponding decrease to net realized gain. The reclassification has no impact on total net assets or total return of the fund.
Expenses. Most expenses of the trust can be directly attributed to a fund. Expenses which cannot be directly attributed are apportioned among the funds in the trust.
Income Tax Information and Distributions to Shareholders. Each year, the fund intends to qualify as a regulated investment company by distributing all of its taxable income and realized gains under Subchapter M of the Internal Revenue Code. As a result, no provision for income taxes is required in the accompanying financial statements. Foreign taxes are provided for based on the fund's understanding of the tax rules and rates that exist in the foreign markets in which it invests. Distributions are recorded on the ex-dividend date.
Annual Report
Notes to Financial Statements - continued
1. Significant Accounting Policies - continued
Income Tax Information and Distributions to Shareholders - continued
Income dividends and capital gain distributions are declared separately for each class. Income and capital gain distributions are determined in accordance with income tax regulations, which may differ from generally accepted accounting principles. Capital accounts within the financial statements are adjusted for permanent book-tax differences. These adjustments have no impact on net assets or the results of operations. Temporary book-tax differences will reverse in a subsequent period.
Book-tax differences are primarily due to foreign currency transactions, passive foreign investment companies (PFIC), partnerships, net operating losses, capital loss carryforwards and losses deferred due to wash sales.
The tax-basis components of distributable earnings and the federal tax cost as of period end were as follows:
Unrealized appreciation | $ 1,164,223,599 | |
Unrealized depreciation | (20,489,077) | |
Net unrealized appreciation (depreciation) | 1,143,734,522 | |
Undistributed long-term capital gain | 68,763,219 | |
| | |
Cost for federal income tax purposes | $ 2,884,816,139 | |
The tax character of distributions paid was as follows:
| December 31, 2004 | December 31, 2003 |
Ordinary Income | $ - | $ 5,082,393 |
2. Operating Policies.
Repurchase Agreements. Fidelity Management & Research Company (FMR) has received an Exemptive Order from the Securities and Exchange Commission (the SEC) which permits the fund and other affiliated entities of FMR to transfer uninvested cash balances into joint trading accounts. These accounts are then invested in repurchase agreements that are collateralized by U.S. Treasury or Government obligations. The fund may also invest directly with institutions, in repurchase agreements that are collateralized by commercial paper obligations and corporate obligations. Collateral is held in segregated accounts with custodian banks and may be obtained in the event of a default of the counterparty. Collateral is marked-to-market daily and maintained at a value at least equal to the principal amount of the repurchase agreement (including accrued interest).
3. Purchases and Sales of Investments.
Purchases and sales of securities, other than short-term securities and U.S. government securities, aggregated $2,400,817,321 and $1,622,172,637, respectively.
4. Fees and Other Transactions with Affiliates.
Management Fee. FMR and its affiliates provide the fund with investment management related services for which the fund pays a monthly management fee. The management fee is the sum of an individual fund fee rate that is based on an annual rate of .30% of the fund's average net assets and a group fee rate that averaged .28% during the period. The group fee rate is based upon the average net assets of all the mutual funds advised by FMR. The group fee rate decreases as assets under management increase and increases as assets under management decrease. For the period, the total annual management fee rate was .57% of the fund's average net assets.
Distribution and Service Plan. In accordance with Rule 12b-1 of the 1940 Act, the fund has adopted separate 12b-1 Plans for each Service Class of shares. Each Service Class pays Fidelity Distributors Corporation (FDC), an affiliate of FMR, a service fee. For the period, the service fee is based on an annual rate of .10% of Service Class' average net assets and .25% of Service Class 2's average net assets.
For the period, each class paid FDC the following amounts, all of which were re-allowed to insurance companies for the distribution of shares and providing shareholder support services:
Service Class | $ 665,057 | |
Service Class 2 | 3,940,232 | |
| $ 4,605,289 | |
Mid Cap Portfolio
4. Fees and Other Transactions with Affiliates - continued
Transfer Agent Fees. Fidelity Investments Institutional Operations Company, Inc. (FIIOC), an affiliate of FMR, is the fund's transfer, dividend disbursing, and shareholder servicing agent. FIIOC receives an asset-based fee with respect to each account. FIIOC pays a portion of the expenses related to the typesetting, printing and mailing of shareholder reports, except proxy statements. Each class pays a transfer agent fee, excluding out of pocket expenses, equal to an annual rate of .07% of their month end net assets. For the period, the total transfer agent fees paid by each class to FIIOC, including out of pocket expenses, were as follows:
Initial Class | $ 517,432 | |
Service Class | 449,572 | |
Service Class 2 | 1,077,978 | |
| $ 2,044,982 | |
Accounting and Security Lending Fees. Fidelity Service Company, Inc. (FSC), an affiliate of FMR, maintains the fund's accounting records. The accounting fee is based on the level of average net assets for the month. Under a separate contract, FSC administers the security lending program. The security lending fee is based on the number and duration of lending transactions.
Central Funds. The fund may invest in affiliated Central Funds managed by Fidelity Investments Money Management, Inc. (FIMM), an affiliate of FMR. The Central Funds are open-end investment companies available only to investment companies and other accounts managed by FMR and its affiliates. The Central Funds seek preservation of capital and current income and do not pay a management fee. Income distributions earned by the fund are recorded as income in the accompanying financial statements and totaled $803,656 for the period.
Brokerage Commissions. The fund placed a portion of its portfolio transactions with brokerage firms which are affiliates of the investment adviser. The commissions paid to these affiliated firms were $171,170 for the period.
Interfund Lending Program. Pursuant to an Exemptive Order issued by the SEC, the fund, along with other registered investment companies having management contracts with FMR, may participate in an interfund lending program. This program provides an alternative credit facility allowing the funds to borrow from, or lend money to, other participating funds. The fund's activity in this program during the period was as follows:
Borrower or Lender | Average Daily
Loan Balance | Weighted Average Interest Rate | Interest Earned
(included in
interest income) | Interest Expense |
Borrower | $ 11,369,500 | 1.12% | - | $ 709 |
5. Committed Line of Credit.
The fund participates with other funds managed by FMR in a $4.2 billion credit facility (the "line of credit") to be utilized for temporary or emergency purposes to fund shareholder redemptions or for other short-term liquidity purposes. The fund has agreed to pay commitment fees on its pro rata portion of the line of credit. During the period, there were no borrowings on this line of credit.
6. Security Lending.
The fund lends portfolio securities from time to time in order to earn additional income. The fund receives collateral (in the form of U.S. Treasury obligations, letters of credit and/or cash) against the loaned securities and maintains collateral in an amount not less than 100% of the market value of the loaned securities during the period of the loan. The market value of the loaned securities is determined at the close of business of the fund and any additional required collateral is delivered to the fund on the next business day. If the borrower defaults on its obligation to return the securities loaned because of insolvency or other reasons, a fund could experience delays and costs in recovering the securities loaned or in gaining access to the collateral. Cash collateral is invested in cash equivalents. The value of loaned securities and cash collateral at period end are disclosed on the fund's Statement of Assets and Liabilities.
7. Expense Reductions.
Many of the brokers with whom FMR places trades on behalf of the fund provided services to the fund in addition to trade execution. These services included payments of certain expenses on behalf of the fund totaling $739,274 for the period. In addition, through arrangements with the fund's custodian, credits realized as a result of uninvested cash balances were used to reduce the fund's expenses. During the period, these credits reduced the fund's custody expenses by $3,283.
Annual Report
Notes to Financial Statements - continued
8. Other Information
At the end of the period, FMR or its affiliates were the owners of record of 19% of the total outstanding shares of the fund and two otherwise unaffiliated shareholders were the owners of record of 42% of the total outstanding shares of the fund.
Mid Cap Portfolio
Report of Independent Registered Public Accounting Firm
To the Trustees of Variable Insurance Products Fund III and the Shareholders of Mid Cap Portfolio:
In our opinion, the accompanying statement of assets and liabilities, including the schedule of investments, and the related statements of operations and of changes in net assets and the financial highlights present fairly, in all material respects, the financial position of Mid Cap Portfolio (a fund of Variable Insurance Products Fund III) at December 31, 2004 and the results of its operations, the changes in its net assets and the financial highlights for the periods indicated, in conformity with accounting principles generally accepted in the United States of America. These financial statements and financial highlights (hereafter referred to as "financial statements") are the responsibility of the Mid Cap Portfolio's management; our responsibility is to express an opinion on these financial statements based on our audits. We conducted our audits of these financial statements in accordance with the standards of the Public Company Accounting Oversight Board (United States). Those standards require that we plan and perform the audit to obtain reasonable assurance about whether the financial statements are free of material misstatement. An audit includes examining, on a test basis, evidence supporting the amounts and disclosures in the financial statements, assessing the accounting principles used and significant estimates made by management, and evaluating the overall financial statement presentation. We believe that our audits, which included confirmation of securities at December 31, 2004 by correspondence with the custodian and brokers, provide a reasonable basis for our opinion.
/s/PricewaterhouseCoopers LLP
PricewaterhouseCoopers LLP
Boston, Massachusetts
February 10, 2005
Annual Report
Trustees and Officers
The Trustees, Member of the Advisory Board, and executive officers of the trust and fund, as applicable, are listed below. The Board of Trustees governs the fund and is responsible for protecting the interests of shareholders. The Trustees are experienced executives who meet periodically throughout the year to oversee the fund's activities, review contractual arrangements with companies that provide services to the fund, and review the fund's performance. Except for William O. McCoy, Dennis J. Dirks, and Kenneth L. Wolfe, each of the Trustees oversees 301 funds advised by FMR or an affiliate. Mr. McCoy oversees 303 funds advised by FMR or an affiliate. Mr. Dirks and Mr. Wolfe oversee 233 funds advised by FMR or an affiliate.
The Trustees hold office without limit in time except that (a) any Trustee may resign; (b) any Trustee may be removed by written instrument, signed by at least two-thirds of the number of Trustees prior to such removal; (c) any Trustee who requests to be retired or who has become incapacitated by illness or injury may be retired by written instrument signed by a majority of the other Trustees; and (d) any Trustee may be removed at any special meeting of shareholders by a two-thirds vote of the outstanding voting securities of the trust. In any event, each non-interested Trustee shall retire not later than the last day of the calendar year in which his or her 72nd birthday occurs. The executive officers and Advisory Board Member hold office without limit in time, except that any officer and Advisory Board Member may resign or may be removed by a vote of a majority of the Trustees at any regular meeting or any special meeting of the Trustees. Except as indicated, each individual has held the office shown or other offices in the same company for the past five years.
The fund's Statement of Additional Information (SAI) includes more information about the Trustees. To request a free copy, call Fidelity at 1-800-544-5429.
Interested Trustees*:
Correspondence intended for each Trustee who is an "interested person" (as defined in the 1940 Act) may be sent to Fidelity Investments, 82 Devonshire Street, Boston, Massachusetts 02109.
Name, Age; Principal Occupation |
Edward C. Johnson 3d (74)** |
| Year of Election or Appointment: 1994 Mr. Johnson is Chairman of the Board of Trustees. Mr. Johnson serves as Chief Executive Officer, Chairman, and a Director of FMR Corp.; a Director and Chairman of the Board and of the Executive Committee of FMR; Chairman and a Director of Fidelity Management & Research (Far East) Inc.; Chairman (1998) and a Director of Fidelity Investments Money Management, Inc.; and Chairman (2001) and a Director (2000) of FMR Co., Inc. |
Abigail P. Johnson (43)** |
| Year of Election or Appointment: 2001 Senior Vice President of VIP Mid Cap (2001). Ms. Johnson also serves as Senior Vice President of other Fidelity funds (2001). She is President and a Director of FMR (2001), Fidelity Investments Money Management, Inc. (2001), FMR Co., Inc. (2001), and a Director of FMR Corp. Previously, Ms. Johnson managed a number of Fidelity funds. |
Laura B. Cronin (50) |
| Year of Election or Appointment: 2003 Ms. Cronin is an Executive Vice President (2002) and Chief Financial Officer (2002) of FMR Corp. and is a member of the Fidelity Management Committee (2003). Previously, Ms. Cronin served as Vice President of Finance of FMR (1997-1999), and Chief Financial Officer of FMR (1999-2001), Fidelity Personal Investments (2001), and Fidelity Brokerage Company (2001-2002). |
Robert L. Reynolds (52) |
| Year of Election or Appointment: 2003 Mr. Reynolds is a Director (2003) and Chief Operating Officer (2002) of FMR Corp. and is the head of the Fidelity Management Committee (2003). He also serves on the Board at Fidelity Investments Canada, Ltd. (2000). Previously, Mr. Reynolds served as President of Fidelity Investments Institutional Retirement Group (1996-2000). |
* Trustees have been determined to be "Interested Trustees" by virtue of, among other things, their affiliation with the trust or various entities under common control with FMR.
** Edward C. Johnson 3d, Trustee, is Abigail P. Johnson's father.
Annual Report
Trustees and Officers - continued
Non-Interested Trustees:
Correspondence intended for each non-interested Trustee (that is, the Trustees other than the Interested Trustees) may be sent to Fidelity Investments, P.O. Box 55235, Boston, Massachusetts 02205-5235.
Name, Age; Principal Occupation |
Dennis J. Dirks (56) |
| Year of Election or Appointment: 2005 Mr. Dirks also serves as a Trustee (2005) or Member of the Advisory Board (2004) of other investment companies advised by FMR. Prior to his retirement in May 2003, Mr. Dirks was Chief Operating Officer and a member of the Board of The Depository Trust & Clearing Corporation (DTCC) (1999-2003). He also served as President, Chief Operating Officer, and Board member of The Depository Trust Company (DTC) (1999-2003) and President and Board member of the National Securities Clearing Corporation (NSCC) (1999-2003). In addition, Mr. Dirks served as Chief Executive Officer and Board member of the Government Securities Clearing Corporation (2001-2003) and Chief Executive Officer and Board member of the Mortgage-Backed Securities Clearing Corporation (2001-2003). |
Robert M. Gates (61) |
| Year of Election or Appointment: 1997 Dr. Gates is Vice Chairman of the non-interested Trustees (2005). Dr. Gates is President of Texas A&M University (2002). He was Director of the Central Intelligence Agency (CIA) from 1991 to 1993. From 1989 to 1991, Dr. Gates served as Assistant to the President of the United States and Deputy National Security Advisor. Dr. Gates is a Director of NACCO Industries, Inc. (mining and manufacturing), Parker Drilling Co., Inc. (drilling and rental tools for the energy industry, 2001), and Brinker International (restaurant management, 2003). He also serves as a member of the Advisory Board of VoteHere.net (secure Internet voting, 2001). Previously, Dr. Gates served as a Director of LucasVarity PLC (automotive components and diesel engines), a Director of TRW Inc. (automotive, space, defense, and information technology), and Dean of the George Bush School of Government and Public Service at Texas A&M University (1999-2001). Dr. Gates also is a Trustee of the Forum for International Policy. |
George H. Heilmeier (68) |
| Year of Election or Appointment: 2004 Dr. Heilmeier is Chairman Emeritus of Telcordia Technologies (communication software and systems), where prior to his retirement, he served as company Chairman and Chief Executive Officer. He currently serves on the Boards of Directors of The Mitre Corporation (systems engineering and information technology support for the government), INET Technologies Inc. (telecommunications network surveillance, 2001), Teletech Holdings (customer management services), and HRL Laboratories (private research and development, 2004). He is Chairman of the General Motors Technology Advisory Committee and a Life Fellow of the Institute of Electrical and Electronics Engineers (IEEE) (2000). Dr. Heilmeier is a member of the Defense Science Board and the National Security Agency Advisory Board. He is also a member of the National Academy of Engineering, the American Academy of Arts and Sciences, and the Board of Overseers of the School of Engineering and Applied Science of the University of Pennsylvania. Previously, Dr. Heilmeier served as a Director of TRW Inc. (automotive, space, defense, and information technology, 1992-2002), Compaq (1994-2002), and Automatic Data Processing, Inc. (ADP) (technology-based business outsourcing, 1995-2002). |
Marie L. Knowles (58) |
| Year of Election or Appointment: 2001 Prior to Ms. Knowles' retirement in June 2000, she served as Executive Vice President and Chief Financial Officer of Atlantic Richfield Company (ARCO) (diversified energy, 1996-2000). From 1993 to 1996, she was a Senior Vice President of ARCO and President of ARCO Transportation Company. She served as a Director of ARCO from 1996 to 1998. She currently serves as a Director of Phelps Dodge Corporation (copper mining and manufacturing) and McKesson Corporation (healthcare service, 2002). Ms. Knowles is a Trustee of the Brookings Institution and the Catalina Island Conservancy and also serves as a member of the Advisory Board for the School of Engineering of the University of Southern California. |
Ned C. Lautenbach (60) |
| Year of Election or Appointment: 2000 Mr. Lautenbach has been a partner of Clayton, Dubilier & Rice, Inc. (private equity investment firm) since September 1998. Previously, Mr. Lautenbach was with the International Business Machines Corporation (IBM) from 1968 until his retirement in 1998. He was most recently Senior Vice President and Group Executive of Worldwide Sales and Services. From 1993 to 1995, he was Chairman of IBM World Trade Corporation, and from 1994 to 1998 was a member of IBM's Corporate Executive Committee. Mr. Lautenbach serves as Co-Chairman and a Director of Covansys, Inc. (global provider of business and technology solutions, 2000). In addition, he is a Director of Italtel Holding S.p.A. (telecommunications (Milan, Italy), 2004) and Eaton Corporation (diversified industrial) as well as the Philharmonic Center for the Arts in Naples, Florida (1999). He also is a member of the Council on Foreign Relations. |
Marvin L. Mann (71) |
| Year of Election or Appointment: 1994 Mr. Mann is Chairman of the non-interested Trustees (2001). He is Chairman Emeritus of Lexmark International, Inc. (computer peripherals), where he served as CEO until April 1998, retired as Chairman May 1999, and remains a member of the Board. Prior to 1991, he held the positions of Vice President of International Business Machines Corporation (IBM) and President and General Manager of various IBM divisions and subsidiaries. He is a member of the Executive Committee of the Independent Director's Council of the Investment Company Institute. In addition, Mr. Mann is a member of the President's Cabinet at the University of Alabama and the Board of Visitors of the Culverhouse College of Commerce and Business Administration at the University of Alabama. |
William O. McCoy (71) |
| Year of Election or Appointment: 1997 Prior to his retirement in December 1994, Mr. McCoy was Vice Chairman of the Board of BellSouth Corporation (telecommunications) and President of BellSouth Enterprises. He is currently a Director of Liberty Corporation (holding company), Duke Realty Corporation (real estate), and Progress Energy, Inc. (electric utility). He is also a partner of Franklin Street Partners (private investment management firm) and a member of the Research Triangle Foundation Board. In addition, Mr. McCoy served as the Interim Chancellor (1999-2000) and a member of the Board of Visitors (1994-1998) for the University of North Carolina at Chapel Hill and currently serves on the Board of Directors of the University of North Carolina Health Care System and the Board of Visitors of the Kenan-Flagler Business School (University of North Carolina at Chapel Hill). He also served as Vice President of Finance for the University of North Carolina (16-school system, 1995-1998). |
Cornelia M. Small (60) |
| Year of Election or Appointment: 2005 Ms. Small is a member (2000) and Chairperson (2002) of the Investment Committee, and a member (2002) of the Board of Trustees of Smith College. Previously, she served as Chief Investment Officer (1999-2000), Director of Global Equity Investments (1996-1999), and a member of the Board of Directors of Scudder, Stevens & Clark (1990-1997) and Scudder Kemper Investments (1997-1998). In addition, Ms. Small served as Co-Chair (2000-2003) of the Annual Fund for the Fletcher School of Law and Diplomacy. |
William S. Stavropoulos (65) |
| Year of Election or Appointment: 2002 Mr. Stavropoulos is Chairman of the Board (2000), CEO (2002), a position he previously held from 1995-2000, Chairman of the Executive Committee (2000), and a Member of the Board of Directors of The Dow Chemical Company. Since joining The Dow Chemical Company in 1967, Mr. Stavropoulos served in numerous senior management positions, including President (1993-2000; 2002-2003). Currently, he is a Director of NCR Corporation (data warehousing and technology solutions), BellSouth Corporation (telecommunications), Chemical Financial Corporation, and Maersk Inc. (industrial conglomerate, 2002). He also serves as a member of the Board of Trustees of the American Enterprise Institute for Public Policy Research. In addition, Mr. Stavropoulos is a member of The Business Council, J.P. Morgan International Council and the University of Notre Dame Advisory Council for the College of Science. |
Kenneth L. Wolfe (65) |
| Year of Election or Appointment: 2005 Mr. Wolfe also serves as a Trustee (2005) or Member of the Advisory Board (2004) of other investment companies advised by FMR. Prior to his retirement in 2001, Mr. Wolfe was Chairman and Chief Executive Officer of Hershey Foods Corporation (1993-2001). He currently serves as a member of the boards of Adelphia Communications Corporation (2003), Bausch & Lomb, Inc., and Revlon Inc. (2004). |
Annual Report
Trustees and Officers - continued
Advisory Board Member and Executive Officers:
Correspondence intended for each executive officer and Mr. Lynch may be sent to Fidelity Investments, 82 Devonshire Street, Boston, Massachusetts 02109.
Name, Age; Principal Occupation |
Peter S. Lynch (61) |
| Year of Election or Appointment: 2003 Member of the Advisory Board of Variable Insurance Products Fund III. Vice Chairman and a Director of FMR, and Vice Chairman (2001) and a Director (2000) of FMR Co., Inc. Previously, Mr. Lynch served as a Trustee of the Fidelity funds (1990-2003). Prior to May 31, 1990, he was a Director of FMR and Executive Vice President of FMR (a position he held until March 31, 1991), Vice President of Fidelity® Magellan® Fund and FMR Growth Group Leader, and Managing Director of FMR Corp. Mr. Lynch was also Vice President of Fidelity Investments Corporate Services. In addition, he serves as a Trustee of Boston College, Massachusetts Eye & Ear Infirmary, Historic Deerfield, John F. Kennedy Library, and the Museum of Fine Arts of Boston. |
John B. McDowell (46) |
| Year of Election or Appointment: 2002 Vice President of VIP Mid Cap. Mr. McDowell also serves as Vice President of certain Equity Funds (2002). He is Senior Vice President of FMR (1999), FMR Co., Inc. (2001), and Fidelity Management Trust Company (FMTC). Since joining Fidelity Investments in 1985, Mr. McDowell has worked as a research analyst and manager. |
Thomas J. Allen (44) |
| Year of Election or Appointment: 2003 Vice President of VIP Mid Cap. Mr. Allen also serves as Vice President of other funds advised by FMR. Prior to assuming his current responsibilities, Mr. Allen managed a variety of Fidelity funds. |
Eric D. Roiter (56) |
| Year of Election or Appointment: 1998 Secretary of VIP Mid Cap. He also serves as Secretary of other Fidelity funds; Vice President, General Counsel, and Secretary of FMR Co., Inc. (2001-present) and FMR; Vice President and Secretary of FDC; Assistant Secretary of Fidelity Management & Research (U.K.) Inc. (2001-present), Fidelity Management & Research (Far East) Inc. (2001-present), and Fidelity Investments Money Management, Inc. (2001-present). Mr. Roiter is an Adjunct Member, Faculty of Law, at Boston College Law School (2003-present). |
Stuart Fross (45) |
| Year of Election or Appointment: 2003 Assistant Secretary of VIP Mid Cap. Mr. Fross also serves as Assistant Secretary of other Fidelity funds (2003) and is an employee of FMR. |
Christine Reynolds (46) |
| Year of Election or Appointment: 2004 President, Treasurer, and Anti-Money Laundering (AML) officer of VIP Mid Cap. Ms. Reynolds also serves as President, Treasurer, and AML officer of other Fidelity funds (2004) and is a Vice President (2003) and an employee (2002) of FMR. Before joining Fidelity Investments, Ms. Reynolds worked at PricewaterhouseCoopers LLP (PwC) (1980-2002), where she was most recently an audit partner with PwC's investment management practice. |
Timothy F. Hayes (54) |
| Year of Election or Appointment: 2002 Chief Financial Officer of VIP Mid Cap. Mr. Hayes also serves as Chief Financial Officer of other Fidelity funds (2002). Recently he was appointed President of Fidelity Service Company (2003) where he also serves as a Director. Mr. Hayes also serves as President of Fidelity Investments Operations Group (FIOG, 2002), which includes Fidelity Pricing and Cash Management Services Group (FPCMS), where he was appointed President in 1998. Previously, Mr. Hayes served as Chief Financial Officer of Fidelity Investments Corporate Systems and Service Group (1998) and Fidelity Systems Company (1997-1998). |
Kenneth A. Rathgeber (57) |
| Year of Election or Appointment: 2004 Chief Compliance Officer of VIP Mid Cap. Mr. Rathgeber also serves as Chief Compliance Officer of other Fidelity funds (2004) and Executive Vice President of Risk Oversight for Fidelity Investments (2002). Previously, he served as Executive Vice President and Chief Operating Officer for Fidelity Investments Institutional Services Company, Inc. (1998-2002). |
John R. Hebble (46) |
| Year of Election or Appointment: 2003 Deputy Treasurer of VIP Mid Cap. Mr. Hebble also serves as Deputy Treasurer of other Fidelity funds (2003), and is an employee of FMR. Before joining Fidelity Investments, Mr. Hebble worked at Deutsche Asset Management where he served as Director of Fund Accounting (2002-2003) and Assistant Treasurer of the Scudder Funds (1998-2003). |
Kimberley H. Monasterio (41) |
| Year of Election or Appointment: 2004 Deputy Treasurer of VIP Mid Cap. Ms. Monasterio also serves as Deputy Treasurer of other Fidelity funds (2004) and is an employee of FMR (2004). Before joining Fidelity Investments, Ms. Monasterio served as Treasurer (2000-2004) and Chief Financial Officer (2002-2004) of the Franklin Templeton Funds and Senior Vice President of Franklin Templeton Services, LLC (2000-2004). |
John H. Costello (58) |
| Year of Election or Appointment: 1998 Assistant Treasurer of VIP Mid Cap. Mr. Costello also serves as Assistant Treasurer of other Fidelity funds and is an employee of FMR. |
Peter L. Lydecker (50) |
| Year of Election or Appointment: 2004 Assistant Treasurer of VIP Mid Cap. Mr. Lydecker also serves as Assistant Treasurer of other Fidelity funds (2004) and is an employee of FMR. |
Mark Osterheld (49) |
| Year of Election or Appointment: 2002 Assistant Treasurer of VIP Mid Cap. Mr. Osterheld also serves as Assistant Treasurer of other Fidelity funds (2002) and is an employee of FMR. |
Kenneth B. Robins (35) |
| Year of Election or Appointment: 2004 Assistant Treasurer of VIP Mid Cap. Mr. Robins also serves as Assistant Treasurer of other Fidelity funds (2004) and is an employee of FMR (2004). Before joining Fidelity Investments, Mr. Robins worked at KPMG LLP, where he was a partner in KPMG's department of professional practice (2002-2004) and a Senior Manager (1999-2000). In addition, Mr. Robins served as Assistant Chief Accountant, United States Securities and Exchange Commission (2000-2002). |
Annual Report
Distributions
The Board of Trustees of VIP III: Mid Cap Portfolio voted to pay to shareholders of record at the opening of business on record date, the following distributions per share derived from capital gains realized from sales of portfolio securities.
Fund | Pay Date | Record Date | Capital Gains |
Initial Class | 2/11/05 | 2/11/05 | $.51 |
Service Class | 2/11/05 | 2/11/05 | $.51 |
Service Class 2 | 2/11/05 | 2/11/05 | $.51 |
Annual Report
Proxy Voting Results
A special meeting of the fund's shareholders was held on December 14, 2004. The results of votes taken among shareholders on proposals before them are reported below. Each vote reported represents one dollar of net asset value held on the record date for the meeting.
PROPOSAL 1 |
To amend the Declaration of Trust to allow the Board of Trustees, if permitted by applicable law, to authorize fund mergers without shareholder approval. A |
| # of
Votes | % of
Votes |
Affirmative | 4,465,365,699.61 | 80.317 |
Against | 820,718,849.73 | 14.762 |
Abstain | 273,620,539.56 | 4.921 |
TOTAL | 5,559,705,088.90 | 100.000 |
PROPOSAL 2 |
To elect a Board of Trustees. A |
| # of
Votes | % of
Votes |
J. Michael Cook |
Affirmative | 5,275,527,318.06 | 94.889 |
Withheld | 284,177,770.84 | 5.111 |
TOTAL | 5,559,705,088.90 | 100.000 |
Ralph F. Cox |
Affirmative | 5,260,941,793.66 | 94.626 |
Withheld | 298,763,295.24 | 5.374 |
TOTAL | 5,559,705,088.90 | 100.000 |
Laura B. Cronin |
Affirmative | 5,275,571,233.79 | 94.889 |
Withheld | 284,133,855.11 | 5.111 |
TOTAL | 5,559,705,088.90 | 100.000 |
Dennis J. Dirks B |
Affirmative | 5,277,234,059.51 | 94.919 |
Withheld | 282,471,029.39 | 5.081 |
TOTAL | 5,559,705,088.90 | 100.000 |
Robert M. Gates |
Affirmative | 5,271,693,384.06 | 94.820 |
Withheld | 288,011,704.84 | 5.180 |
TOTAL | 5,559,705,088.90 | 100.000 |
George H. Heilmeier |
Affirmative | 5,276,712,546.15 | 94.910 |
Withheld | 282,992,542.75 | 5.090 |
TOTAL | 5,559,705,088.90 | 100.000 |
Abigail P. Johnson |
Affirmative | 5,265,412,678.20 | 94.707 |
Withheld | 294,292,410.70 | 5.293 |
TOTAL | 5,559,705,088.90 | 100.000 |
Edward C. Johnson 3d |
Affirmative | 5,252,813,997.03 | 94.480 |
Withheld | 306,891,091.87 | 5.520 |
TOTAL | 5,559,705,088.90 | 100.000 |
Donald J. Kirk |
Affirmative | 5,268,337,458.03 | 94.759 |
Withheld | 291,367,630.87 | 5.241 |
TOTAL | 5,559,705,088.90 | 100.000 |
| # of
Votes | % of
Votes |
Marie L. Knowles |
Affirmative | 5,278,993,264.93 | 94.951 |
Withheld | 280,711,823.97 | 5.049 |
TOTAL | 5,559,705,088.90 | 100.000 |
Ned C. Lautenbach |
Affirmative | 5,280,591,428.18 | 94.980 |
Withheld | 279,113,660.72 | 5.020 |
TOTAL | 5,559,705,088.90 | 100.000 |
Marvin L. Mann |
Affirmative | 5,266,769,335.50 | 94.731 |
Withheld | 292,935,753.40 | 5.269 |
TOTAL | 5,559,705,088.90 | 100.000 |
William O. McCoy |
Affirmative | 5,270,804,685.62 | 94.804 |
Withheld | 288,900,403.28 | 5.196 |
TOTAL | 5,559,705,088.90 | 100.000 |
Robert L. Reynolds |
Affirmative | 5,279,190,479.65 | 94.955 |
Withheld | 280,514,609.25 | 5.045 |
TOTAL | 5,559,705,088.90 | 100.000 |
Cornelia M. Small B |
Affirmative | 5,276,074,654.01 | 94.898 |
Withheld | 283,630,434.89 | 5.102 |
TOTAL | 5,559,705,088.90 | 100.000 |
William S. Stavropoulos |
Affirmative | 5,278,183,775.21 | 94.936 |
Withheld | 281,521,313.69 | 5.064 |
TOTAL | 5,559,705,088.90 | 100.000 |
A Denotes trust-wide proposals and voting results. B Effective January 1, 2005. |
Annual Report
Annual Report
Investment Adviser
Fidelity Management & Research Company
Boston, MA
Investment Sub-Advisers
FMR Co., Inc.
Fidelity Management & Research (U.K.) Inc.
Fidelity Management & Research (Far East) Inc.
Fidelity Investments Japan Limited
Fidelity International Investment Advisors
Fidelity International Investment Advisors (U.K.) Limited
General Distributor
Fidelity Distributors Corporation
Boston, MA
Transfer and Shareholder Servicing Agent
Fidelity Investments Institutional Operations Company, Inc.
Boston, MA
Custodian
Brown Brothers Harriman & Co.
Boston, MA
VIPMID-ANN-0205
1.735273.105
Fidelity® Variable Insurance Products:
Value Strategies Portfolio
Annual Report
December 31, 2004
(2_fidelity_logos)(Registered_Trademark)
Contents
Performance | 3 | How the fund has done over time. |
Management's Discussion | 4 | The manager's review of fund performance, strategy and outlook. |
Shareholder Expense Example | 5 | An example of shareholder expenses. |
Investment Summary | 6 | A summary of the fund's investments at period end. |
Investments | 7 | A complete list of the fund's investments with their
market values. |
Financial Statements | 11 | Statements of assets and liabilities, operations, and
changes in net assets, as well as financial highlights. |
Notes | 15 | Notes to the financial statements. |
Report of Independent Registered Public Accounting Firm | 18 | |
Trustees and Officers | 19 | |
Distributions | 24 | |
Proxy Voting Results | 25 | |
| | |
To view a fund's proxy voting guidelines and proxy voting record for the 12-month period ended June 30, visit www.fidelity.com/proxyvotingresults or visit the Securities and Exchange Commission's (SEC) web site at www.sec.gov. You may also call 1-800-544-5429 to request a free copy of the proxy voting guidelines.
Fidelity Variable Insurance Products are separate account options which are purchased through a variable insurance contract.
Standard & Poor's, S&P and S&P 500 are registered service marks of The McGraw-Hill Companies, Inc. and have been licensed for use by Fidelity Distributors Corporation.
Other third party marks appearing herein are the property of their respective owners.
All other marks appearing herein are registered or unregistered trademarks or service marks of FMR Corp. or an affiliated company.
(Recycle graphic) This report is printed on recycled paper using soy-based inks.
This report and the financial statements contained herein are submitted for the general information of the shareholders of the fund. This report is not authorized for distribution to prospective investors in the fund unless preceded or accompanied by an effective prospectus.
A fund files its complete schedule of portfolio holdings with the SEC for the first and third quarters of each fiscal year on Form N-Q. Forms N-Q are available on the SEC's web site at http://www.sec.gov. A fund's Forms N-Q may be reviewed and copied at the SEC's Public Reference Room in Washington, DC. Information regarding the operation of the SEC's Public Reference Room may be obtained by calling 1-800-SEC-0330. For a complete list of a fund's portfolio holdings, view the most recent quarterly holdings report, semiannual report, or annual report on Fidelity's web site at http://www.advisor.fidelity.com.
NOT FDIC INSURED · MAY LOSE VALUE · NO BANK GUARANTEE
Neither the fund nor Fidelity Distributors Corporation is a bank.
Value Strategies Portfolio
Fidelity Variable Insurance Products: Value Strategies Portfolio
Performance: The Bottom Line
Average annual total return reflects the change in the value of an investment, assuming reinvestment of the class' dividend income and capital gains (the profits earned upon the sale of securities that have grown in value) and assuming a constant rate of performance each year. During periods of reimbursement by Fidelity, a fund's total return will be greater than it would be had the reimbursement not occurred. Performance numbers are net of all underlying fund operating expenses, but do not include any insurance charges imposed by your insurance company's separate account. If performance information included the effect of these additional charges, the total returns would have been lower. How a fund did yesterday is no guarantee of how it will do tomorrow.
Average Annual Total Returns
Periods ended December 31, 2004 | | Past 1
year | Life of fund A |
Fidelity® VIP: Value Strategies - Initial Class | | 14.13% | 13.18% |
Fidelity VIP: Value Strategies - Service Class B | | 13.99% | 13.05% |
Fidelity VIP: Value Strategies - Service Class 2 C | | 13.84% | 13.14% |
A From February 20, 2002.
B Performance for Service Class shares reflects an asset-based service fee (12b-1 fee).
C Performance for Service Class 2 shares reflects an asset-based service fee (12b-1 fee).
$10,000 Over Life of Fund
Let's say hypothetically that $10,000 was invested in Fidelity® Variable Insurance Products: Value Strategies Portfolio - Initial Class on February 20, 2002, when the fund started. The chart shows how the value of your investment would have changed, and also shows how the Russell Midcap® Value Index performed over the same period.
Annual Report
Fidelity Variable Insurance Products: Value Strategies Portfolio
Comments from Harris Leviton, Portfolio Manager of Fidelity® Variable Insurance Products: Value Strategies Portfolio
The year ending December 31, 2004, generally was positive for equity investors, as many stock market benchmarks produced double-digit gains. Broad-based themes included the continued dominance of small-cap stocks, which outperformed large-caps for the sixth consecutive year. The small-cap Russell 2000® Index was up 18.33% in 2004, while the larger-cap Standard & Poor's 500SM Index rose 10.88%. Value stocks ended the year well ahead of growth stocks: The Russell 3000® Value Index advanced 16.94%, compared to 6.93% for the Russell 3000 Growth Index. Energy and basic materials stocks led the market upward. Energy stocks were boosted by record-high oil prices, while strong demand from China helped support commodity prices. The health care sector was among the market's weakest performers. Technology also fell off the pace, though it was helped by a rally late in the year. The tech-heavy NASDAQ Composite® Index returned 9.15%, thanks primarily to a 14.87% jump in the fourth quarter. Elsewhere, the Dow Jones Industrial AverageSM gained 5.37% for the year.
For the one-year period ending December 31, 2004, Value Strategies Portfolio significantly underperformed the Russell Midcap® Value Index, which rose 23.71%, and also trailed the LipperSM Variable Annuity Mid-Cap Funds Average, which advanced 15.30%. The fund's overweighting in the technology sector - one of the market's poorest-performing areas - was the primary reason for its performance shortfall relative to the Russell index. Individual detractors from the tech sector included communications equipment vendor Terayon Communication Systems, semiconductor manufacturers Atmel and Applied Micro Circuits, and software providers Vignette and i2 Technologies. Having no investments in the energy sector also held back the fund's relative results, as this was the market's top-performing major category. On the positive side of the ledger, despite the sector's overall weakness, there were some strong contributors in technology, such as handheld communication device maker palmOne and emerging-communications software provider Ulticom. In the consumer discretionary sector, investments in clothing retailer American Eagle Outfitters, which I later sold from the portfolio to lock in a profit, and riverboat casino operator Ameristar Casinos appreciated nicely.
The views expressed in this statement reflect those of the portfolio manager only through the end of the period of the report as stated on the cover and do not necessarily represent the views of Fidelity or any other person in the Fidelity organization. Any such views are subject to change at any time based upon market or other conditions and Fidelity disclaims any responsibility to update such views. These views may not be relied on as investment advice and, because investment decisions for a Fidelity fund are based on numerous factors, may not be relied on as an indication of trading intent on behalf of any Fidelity fund.
Value Strategies Portfolio
Fidelity Variable Insurance Products: Value Strategies Portfolio
As a shareholder of the Fund, you incur two types of costs: (1) transaction costs, and (2) ongoing costs, including management fees, distribution and/or service (12b-1) fees and other Fund expenses. This Example is intended to help you understand your ongoing costs (in dollars) of investing in the Fund and to compare these costs with the ongoing costs of investing in other mutual funds.
The Example is based on an investment of $1,000 invested at the beginning of the period and held for the entire period (July 1, 2004 to December 31, 2004).
Actual Expenses
The first line of the table below for each class of the Fund provides information about actual account values and actual expenses. You may use the information in this line, together with the amount you invested, to estimate the expenses that you paid over the period. Simply divide your account value by $1,000.00 (for example, an $8,600 account value divided by $1,000.00 = 8.6), then multiply the result by the number in the first line for a class of the Fund under the heading entitled "Expenses Paid During Period" to estimate the expenses you paid on your account during this period. The estimate of expenses does not include any fees or other expenses of any variable annuity or variable life insurance product. If they were, the estimate of expenses you paid during the period would be higher, and your ending account value would be lower.
Hypothetical Example for Comparison Purposes
The second line of the table below for each class of the Fund provides information about hypothetical account values and hypothetical expenses based on a Class' actual expense ratio and an assumed rate of return of 5% per year before expenses, which is not the Class' actual return. The hypothetical account values and expenses may not be used to estimate the actual ending account balance or expenses you paid for the period. You may use this information to compare the ongoing costs of investing in the Fund and other funds. To do so, compare this 5% hypothetical example with the 5% hypothetical examples that appear in the shareholder reports of the other funds. The estimate of expenses does not include any fees or other expenses of any variable annuity or variable life insurance product. If they were, the estimate of expenses you paid during the period would be higher, and your ending account value would be lower.
Please note that the expenses shown in the table are meant to highlight your ongoing costs only and do not reflect any transaction costs. Therefore, the second line of the table is useful in comparing ongoing costs only, and will not help you determine the relative total costs of owning different funds.
| Beginning
Account Value
July 1, 2004 | Ending
Account Value
December 31, 2004 | Expenses Paid
During Period*
July 1, 2004
to December 31, 2004 |
Initial Class | | | |
Actual | $ 1,000.00 | $ 1,079.40 | $ 3.82 |
HypotheticalA | $ 1,000.00 | $ 1,021.47 | $ 3.71 |
Service Class | | | |
Actual | $ 1,000.00 | $ 1,079.70 | $ 4.34 |
HypotheticalA | $ 1,000.00 | $ 1,020.96 | $ 4.22 |
Service Class 2 | | | |
Actual | $ 1,000.00 | $ 1,078.60 | $ 5.12 |
HypotheticalA | $ 1,000.00 | $ 1,020.21 | $ 4.98 |
A 5% return per year before expenses
* Expenses are equal to each Class' annualized expense ratio (shown in the table below); multiplied by the average account value over the period, multiplied by 184/366 (to reflect the one-half year period).
| Annualized
Expense Ratio |
Initial Class | .73% |
Service Class | .83% |
Service Class 2 | .98% |
Annual Report
Fidelity Variable Insurance Products: Value Strategies Portfolio
Top Five Stocks as of December 31, 2004 |
| % of fund's net assets |
Take-Two Interactive Software, Inc. | 4.2 |
WMS Industries, Inc. | 3.5 |
Beazer Homes USA, Inc. | 3.5 |
THQ, Inc. | 3.1 |
Advanced Micro Devices, Inc. | 3.0 |
| 17.3 |
Top Five Market Sectors as of December 31, 2004 |
| % of fund's net assets |
Information Technology | 40.7 |
Consumer Discretionary | 25.8 |
Industrials | 12.5 |
Financials | 11.5 |
Materials | 5.1 |
Asset Allocation as of December 31, 2004 |
% of fund's net assets * |
 | Stocks | 97.8% | |
 | Bonds | 0.4% | |
 | Short-Term Investments and Net Other Assets | 1.8% | |

* Foreign investments 12.2% | |
Value Strategies Portfolio
Fidelity Variable Insurance Products: Value Strategies Portfolio
Showing Percentage of Net Assets
Common Stocks - 97.8% |
| Shares | | Value (Note 1) |
CONSUMER DISCRETIONARY - 25.5% |
Auto Components - 2.1% |
American Axle & Manufacturing Holdings, Inc. | 183,900 | | $ 5,638,374 |
ArvinMeritor, Inc. | 32,400 | | 724,788 |
Dura Automotive Systems, Inc. Class A (sub. vtg.) (a) | 35,100 | | 380,133 |
Lear Corp. | 26,000 | | 1,586,260 |
TRW Automotive Holdings Corp. | 136,000 | | 2,815,200 |
| | 11,144,755 |
Automobiles - 2.1% |
Ford Motor Co. | 236,700 | | 3,465,288 |
Nissan Motor Co. Ltd. | 726,900 | | 7,905,561 |
| | 11,370,849 |
Hotels, Restaurants & Leisure - 7.7% |
AFC Enterprises, Inc. (a)(c) | 178,800 | | 4,228,620 |
Ameristar Casinos, Inc. | 60,900 | | 2,625,399 |
Domino's Pizza, Inc. | 212,200 | | 3,777,160 |
Isle of Capri Casinos, Inc. (a) | 11,700 | | 300,105 |
Jack in the Box, Inc. (a) | 311,700 | | 11,492,379 |
Mikohn Gaming Corp. (a) | 15,800 | | 161,476 |
WMS Industries, Inc. (a)(c) | 557,600 | | 18,701,904 |
| | 41,287,043 |
Household Durables - 9.0% |
Beazer Homes USA, Inc. (c) | 127,493 | | 18,640,752 |
Centex Corp. | 47,300 | | 2,818,134 |
D.R. Horton, Inc. | 161,875 | | 6,525,181 |
Lennar Corp.: | | | |
Class A | 157,300 | | 8,915,764 |
Class B | 15,440 | | 806,122 |
Levitt Corp. Class A | 19,700 | | 602,229 |
M/I Homes, Inc. | 1,800 | | 99,198 |
Maytag Corp. | 276,200 | | 5,827,820 |
Whirlpool Corp. | 55,400 | | 3,834,234 |
| | 48,069,434 |
Media - 1.4% |
Carmike Cinemas, Inc. | 202,100 | | 7,376,650 |
Specialty Retail - 1.2% |
Big Dog Holdings, Inc. (a) | 4,300 | | 28,294 |
Borders Group, Inc. | 182,000 | | 4,622,800 |
Rush Enterprises, Inc. Class A (a) | 87,600 | | 1,421,748 |
| | 6,072,842 |
Textiles, Apparel & Luxury Goods - 2.0% |
Jones Apparel Group, Inc. | 296,300 | | 10,835,691 |
TOTAL CONSUMER DISCRETIONARY | | 136,157,264 |
CONSUMER STAPLES - 0.2% |
Food & Staples Retailing - 0.2% |
Koninklijke Ahold NV sponsored ADR | 144,500 | | 1,122,765 |
|
| Shares | | Value (Note 1) |
FINANCIALS - 11.5% |
Commercial Banks - 0.0% |
First State Financial Corp., Florida | 2,100 | | $ 27,342 |
Insurance - 10.3% |
ACE Ltd. | 302,900 | | 12,948,975 |
AMBAC Financial Group, Inc. | 24,400 | | 2,003,972 |
American Equity Investment Life Holding Co. | 350,800 | | 3,778,116 |
Assurant, Inc. | 9,200 | | 281,060 |
Axis Capital Holdings Ltd. | 116,700 | | 3,192,912 |
Endurance Specialty Holdings Ltd. | 167,400 | | 5,725,080 |
Everest Re Group Ltd. | 14,100 | | 1,262,796 |
Infinity Property & Casualty Corp. | 38,100 | | 1,341,120 |
MetLife, Inc. | 174,400 | | 7,064,944 |
Montpelier Re Holdings Ltd. | 49,800 | | 1,914,810 |
Safety Insurance Group, Inc. | 51,200 | | 1,594,880 |
Scottish Re Group Ltd. | 12,100 | | 313,390 |
St. Paul Travelers Companies, Inc. | 108,500 | | 4,022,095 |
United National Group Ltd. Class A | 92,100 | | 1,714,902 |
W.R. Berkley Corp. | 169,600 | | 8,000,032 |
| | 55,159,084 |
Real Estate - 0.0% |
ZipRealty, Inc. | 700 | | 12,509 |
Thrifts & Mortgage Finance - 1.2% |
Sovereign Bancorp, Inc. | 275,800 | | 6,219,290 |
TOTAL FINANCIALS | | 61,418,225 |
HEALTH CARE - 1.3% |
Health Care Equipment & Supplies - 0.2% |
Foxhollow Technologies, Inc. | 400 | | 9,836 |
Sola International, Inc. (a) | 38,600 | | 1,063,044 |
| | 1,072,880 |
Health Care Providers & Services - 0.8% |
HealthSouth Corp. (a) | 363,400 | | 2,282,152 |
Pediatrix Medical Group, Inc. (a) | 28,400 | | 1,819,020 |
| | 4,101,172 |
Pharmaceuticals - 0.3% |
Pain Therapeutics, Inc. (a) | 248,500 | | 1,791,685 |
TOTAL HEALTH CARE | | 6,965,737 |
INDUSTRIALS - 12.5% |
Airlines - 1.7% |
AMR Corp. (a)(c) | 500,900 | | 5,484,855 |
Delta Air Lines, Inc. (a) | 284,700 | | 2,129,556 |
Southwest Airlines Co. | 94,500 | | 1,538,460 |
| | 9,152,871 |
Building Products - 1.6% |
NCI Building Systems, Inc. (a) | 13,300 | | 498,750 |
York International Corp. | 233,100 | | 8,051,274 |
| | 8,550,024 |
Common Stocks - continued |
| Shares | | Value (Note 1) |
INDUSTRIALS - continued |
Commercial Services & Supplies - 3.5% |
Central Parking Corp. | 179,000 | | $ 2,711,850 |
Hudson Highland Group, Inc. (a) | 23,767 | | 684,490 |
Kforce, Inc. (a) | 104,490 | | 1,159,839 |
Knoll, Inc. | 16,300 | | 285,250 |
Monster Worldwide, Inc. (a) | 304,400 | | 10,240,016 |
Vedior NV (Certificaten Van Aandelen) | 213,558 | | 3,473,528 |
| | 18,554,973 |
Construction & Engineering - 0.5% |
Granite Construction, Inc. | 96,100 | | 2,556,260 |
Electrical Equipment - 0.5% |
Color Kinetics, Inc. | 168,300 | | 2,958,714 |
TB Wood's Corp. | 1,000 | | 6,260 |
| | 2,964,974 |
Machinery - 4.0% |
Columbus McKinnon Corp. (NY Shares) (a) | 44,000 | | 381,480 |
EnPro Industries, Inc. (a) | 40 | | 1,183 |
Navistar International Corp. (a) | 203,600 | | 8,954,328 |
SPX Corp. | 149,300 | | 5,980,958 |
Timken Co. | 242,300 | | 6,304,646 |
| | 21,622,595 |
Trading Companies & Distributors - 0.1% |
Interline Brands, Inc. | 38,100 | | 670,179 |
Transportation Infrastructure - 0.6% |
Macquarie Infrastructure Co. Trust | 103,700 | | 3,043,595 |
TOTAL INDUSTRIALS | | 67,115,471 |
INFORMATION TECHNOLOGY - 40.6% |
Communications Equipment - 5.7% |
ADC Telecommunications, Inc. (a) | 1,509,300 | | 4,044,924 |
AudioCodes Ltd. (a) | 191,400 | | 3,179,154 |
Belden CDT, Inc. | 160,600 | | 3,725,920 |
Enterasys Networks, Inc. (a) | 628,900 | | 1,132,020 |
Marconi Corp. PLC (a) | 235,825 | | 2,545,650 |
Netopia, Inc. (a) | 99,000 | | 321,750 |
NMS Communications Corp. (a) | 458,900 | | 2,895,659 |
Performance Technologies, Inc. (a) | 335,600 | | 3,121,080 |
Powerwave Technologies, Inc. (a) | 197,300 | | 1,673,104 |
Telefonaktiebolaget LM Ericsson ADR (a) | 134,280 | | 4,228,477 |
Terayon Communication Systems, Inc. (a) | 1,357,300 | | 3,678,283 |
| | 30,546,021 |
Computers & Peripherals - 5.1% |
EMC Corp. (a) | 911,670 | | 13,556,533 |
palmOne, Inc. (a)(c) | 428,100 | | 13,506,555 |
| | 27,063,088 |
Electronic Equipment & Instruments - 0.6% |
AVX Corp. | 121,900 | | 1,535,940 |
|
| Shares | | Value (Note 1) |
Cherokee International Corp. | 29,500 | | $ 283,495 |
RadiSys Corp. (a) | 23,600 | | 461,380 |
Richardson Electronics Ltd. | 83,200 | | 882,752 |
| | 3,163,567 |
Internet Software & Services - 6.4% |
Ariba, Inc. (a) | 161,745 | | 2,684,967 |
Art Technology Group, Inc. (a) | 470,500 | | 705,750 |
Google, Inc. Class A | 20,600 | | 3,977,860 |
Housevalues, Inc. | 1,000 | | 15,020 |
Interwoven, Inc. (a) | 535,875 | | 5,830,320 |
Keynote Systems, Inc. (a) | 203,700 | | 2,835,504 |
PlanetOut, Inc. | 60,900 | | 828,240 |
Plumtree Software, Inc. (a) | 322,900 | | 1,459,508 |
Retek, Inc. (a) | 509,839 | | 3,135,510 |
Selectica, Inc. (a) | 489,500 | | 1,752,410 |
SonicWALL, Inc. (a) | 613,200 | | 3,875,424 |
Vignette Corp. (a) | 5,201,071 | | 7,229,489 |
| | 34,330,002 |
Semiconductors & Semiconductor Equipment - 10.1% |
Advanced Micro Devices, Inc. (a) | 724,400 | | 15,951,288 |
Agere Systems, Inc. Class A (a) | 763,400 | | 1,045,858 |
Applied Micro Circuits Corp. (a) | 674,300 | | 2,838,803 |
ASM International NV (Nasdaq) (a) | 78,700 | | 1,291,467 |
ASML Holding NV (NY Shares) (a) | 186,700 | | 2,970,397 |
Atmel Corp. (a) | 847,700 | | 3,322,984 |
Conexant Systems, Inc. (a) | 676,712 | | 1,346,657 |
Freescale Semiconductor, Inc. Class A | 97,200 | | 1,732,104 |
Hi/fn, Inc. (a) | 284,000 | | 2,618,480 |
Integrated Device Technology, Inc. (a) | 208,700 | | 2,412,572 |
Mattson Technology, Inc. (a) | 169,700 | | 1,910,822 |
Mindspeed Technologies, Inc. (a) | 39,733 | | 110,458 |
MIPS Technologies, Inc. (a) | 285,100 | | 2,808,235 |
Omnivision Technologies, Inc. (a)(c) | 152,200 | | 2,792,870 |
ON Semiconductor Corp. (a) | 292,600 | | 1,328,404 |
Pericom Semiconductor Corp. (a) | 161,623 | | 1,524,105 |
Samsung Electronics Co. Ltd. | 4,850 | | 2,110,631 |
Taiwan Semiconductor Manufacturing Co. Ltd. sponsored ADR | 573,549 | | 4,869,431 |
Transwitch Corp. (a) | 705,000 | | 1,085,700 |
| | 54,071,266 |
Software - 12.7% |
Activision, Inc. (a) | 71,525 | | 1,443,375 |
Actuate Corp. (a) | 978,000 | | 2,493,900 |
Aspen Technology, Inc. (a) | 344,600 | | 2,139,966 |
BindView Development Corp. (a) | 361,200 | | 1,571,220 |
Concord Communications, Inc. (a) | 99,000 | | 1,096,920 |
i2 Technologies, Inc. (a) | 4,778,600 | | 3,297,234 |
MapInfo Corp. (a) | 319,846 | | 3,831,755 |
PalmSource, Inc. (a)(c) | 42,900 | | 546,546 |
RADWARE Ltd. (a) | 55,600 | | 1,452,828 |
Siebel Systems, Inc. (a) | 295,600 | | 3,103,800 |
Synopsys, Inc. (a) | 75,800 | | 1,487,196 |
Take-Two Interactive Software, Inc. (a) | 652,300 | | 22,693,516 |
Common Stocks - continued |
| Shares | | Value (Note 1) |
INFORMATION TECHNOLOGY - continued |
Software - continued |
THQ, Inc. (a) | 719,561 | | $ 16,506,729 |
Ulticom, Inc. (a) | 406,900 | | 6,522,607 |
| | 68,187,592 |
TOTAL INFORMATION TECHNOLOGY | | 217,361,536 |
MATERIALS - 5.1% |
Chemicals - 2.0% |
Eastman Chemical Co. | 158,600 | | 9,155,978 |
FMC Corp. (a) | 11,100 | | 536,130 |
Lyondell Chemical Co. | 40,090 | | 1,159,403 |
| | 10,851,511 |
Construction Materials - 2.2% |
Eagle Materials, Inc. | 12,754 | | 1,101,308 |
Eagle Materials, Inc. Class B | 3,546 | | 298,928 |
Texas Industries, Inc. | 96,800 | | 6,038,384 |
U.S. Concrete, Inc. (a) | 568,700 | | 4,361,929 |
| | 11,800,549 |
Containers & Packaging - 0.3% |
Anchor Glass Container Corp. | 75,700 | | 508,704 |
Owens-Illinois, Inc. (a) | 50,200 | | 1,137,030 |
| | 1,645,734 |
Metals & Mining - 0.6% |
POSCO sponsored ADR | 24,800 | | 1,104,344 |
Steel Dynamics, Inc. | 47,300 | | 1,791,724 |
| | 2,896,068 |
TOTAL MATERIALS | | 27,193,862 |
TELECOMMUNICATION SERVICES - 1.1% |
Diversified Telecommunication Services - 0.9% |
Covad Communications Group, Inc. (a) | 100 | | 215 |
Iowa Telecommunication Services, Inc. | 214,100 | | 4,618,137 |
| | 4,618,352 |
Wireless Telecommunication Services - 0.2% |
Telesystem International Wireless, Inc. (a) | 120,900 | | 1,355,087 |
TOTAL TELECOMMUNICATION SERVICES | | 5,973,439 |
TOTAL COMMON STOCKS (Cost $428,517,699) | 523,308,299 |
Convertible Bonds - 0.4% |
| Principal Amount | | |
CONSUMER DISCRETIONARY - 0.3% |
Hotels, Restaurants & Leisure - 0.3% |
WMS Industries, Inc. 2.75% 7/15/10 (d) | | $ 780,000 | | 1,431,300 |
|
| Principal Amount | | Value (Note 1) |
INDUSTRIALS - 0.0% |
Aerospace & Defense - 0.0% |
SPACEHAB, Inc. 8% 10/15/07 | | $ 10,000 | | $ 7,500 |
INFORMATION TECHNOLOGY - 0.1% |
Communications Equipment - 0.1% |
Terayon Communication Systems, Inc. 5% 8/1/07 | | 720,000 | | 666,000 |
Electronic Equipment & Instruments - 0.0% |
Richardson Electronics Ltd. 8.25% 6/15/06 | | 8,000 | | 7,920 |
TOTAL INFORMATION TECHNOLOGY | | 673,920 |
TOTAL CONVERTIBLE BONDS (Cost $1,413,202) | 2,112,720 |
Money Market Funds - 7.7% |
| Shares | | |
Fidelity Cash Central Fund, 2.24% (b) | 10,790,706 | | 10,790,706 |
Fidelity Securities Lending Cash Central Fund, 2.23% (b)(e) | 30,585,800 | | 30,585,800 |
TOTAL MONEY MARKET FUNDS (Cost $41,376,506) | 41,376,506 |
TOTAL INVESTMENT PORTFOLIO - 105.9% (Cost $471,307,407) | 566,797,525 |
NET OTHER ASSETS - (5.9)% | (31,663,528) |
NET ASSETS - 100% | $ 535,133,997 |
Legend |
(a) Non-income producing |
(b) Affiliated fund that is available only to investment companies and other accounts managed by Fidelity Investments. The rate quoted is the annualized seven-day yield of the fund at period end. A complete listing of the fund's holdings as of its most recent fiscal year end is available upon request. |
(c) Security or a portion of the security is on loan at period end. |
(d) Security exempt from registration under Rule 144A of the Securities Act of 1933. These securities may be resold in transactions exempt from registration, normally to qualified institutional buyers. At the period end, the value of these securities amounted to $1,431,300 or 0.3% of net assets. |
(e) Includes investment made with cash collateral received from securities on loan. |
Distribution of investments by country of issue, as a percentage of total net assets, is as follows: |
United States of America | 87.8% |
Bermuda | 4.7% |
Netherlands | 1.7% |
Japan | 1.5% |
Others (individually less than 1%) | 4.3% |
| 100.0% |
Income Tax Information |
The fund hereby designates as capital gain dividends: For dividends with respect to the taxable year ended December 31, 2004, $15,488,000 or, if different, the net capital gain of such year, and for dividends with respect to the taxable year ended December 31, 2003, $617,000 or, if different, the excess of (a) the net capital gain of such year, over (b) amounts previously designated as capital gain dividends with respect to such year. |
See accompanying notes which are an integral part of the financial statements.
Value Strategies Portfolio
Fidelity Variable Insurance Products: Value Strategies Portfolio
Statement of Assets and Liabilities
| | |
Assets | | |
Investment in securities, at value (including securities loaned of $29,841,957) (cost $471,307,407) - See accompanying schedule | | $ 566,797,525 |
Receivable for investments sold | | 1,652,500 |
Receivable for fund shares sold | | 149,778 |
Dividends receivable | | 356,037 |
Interest receivable | | 46,274 |
Prepaid expenses | | 1,987 |
Other receivables | | 39,203 |
Total assets | | 569,043,304 |
| | |
Liabilities | | |
Payable for investments purchased | $ 2,700,880 | |
Payable for fund shares redeemed | 197,106 | |
Accrued management fee | 250,514 | |
Distribution fees payable | 50,287 | |
Other affiliated payables | 47,228 | |
Other payables and accrued expenses | 77,492 | |
Collateral on securities loaned, at value | 30,585,800 | |
Total liabilities | | 33,909,307 |
| | |
Net Assets | | $ 535,133,997 |
Net Assets consist of: | | |
Paid in capital | | $ 425,256,495 |
Undistributed net investment income | | 120,127 |
Accumulated undistributed net realized gain (loss) on investments and foreign currency transactions | | 14,267,031 |
Net unrealized appreciation (depreciation) on investments and assets and liabilities in foreign currencies | | 95,490,344 |
Net Assets | | $ 535,133,997 |
Initial Class:
Net Asset Value, offering price and redemption price per share ($229,763,969 ÷ 16,260,799 shares) | | $ 14.13 |
| | |
Service Class:
Net Asset Value, offering price and redemption price per share ($98,542,251 ÷ 6,994,652 shares) | | $ 14.09 |
| | |
Service Class 2:
Net Asset Value, offering price and redemption price per share ($206,827,777 ÷ 14,625,458 shares) | | $ 14.14 |
Statement of Operations
Year ended December 31, 2004 |
| | |
Investment Income | | |
Dividends | | $ 3,418,815 |
Interest | | 424,850 |
Security lending | | 173,472 |
Total income | | 4,017,137 |
| | |
Expenses | | |
Management fee | $ 2,896,308 | |
Transfer agent fees | 339,663 | |
Distribution fees | 549,352 | |
Accounting and security lending fees | 210,825 | |
Non-interested trustees' compensation | 2,669 | |
Custodian fees and expenses | 25,775 | |
Audit | 45,909 | |
Legal | 1,064 | |
Interest | 2,207 | |
Miscellaneous | 74,598 | |
Total expenses before reductions | 4,148,370 | |
Expense reductions | (69,175) | 4,079,195 |
Net investment income (loss) | | (62,058) |
Realized and Unrealized Gain (Loss) Net realized gain (loss) on: | | |
Investment securities | 16,942,098 | |
Foreign currency transactions | (29,938) | |
Total net realized gain (loss) | | 16,912,160 |
Change in net unrealized appreciation (depreciation) on: Investment securities | 34,802,171 | |
Assets and liabilities in foreign currencies | 1,890 | |
Total change in net unrealized appreciation (depreciation) | | 34,804,061 |
Net gain (loss) | | 51,716,221 |
Net increase (decrease) in net assets resulting from operations | | $ 51,654,163 |
See accompanying notes which are an integral part of the financial statements.
Annual Report
Fidelity Variable Insurance Products: Value Strategies Portfolio
Financial Statements - continued
Statement of Changes in Net Assets
| Year ended
December 31,
2004 | Year ended
December 31,
2003 |
Increase (Decrease) in Net Assets | | |
Operations | | |
Net investment income (loss) | $ (62,058) | $ (223,044) |
Net realized gain (loss) | 16,912,160 | 1,632,173 |
Change in net unrealized appreciation (depreciation) | 34,804,061 | 63,505,021 |
Net increase (decrease) in net assets resulting from operations | 51,654,163 | 64,914,150 |
Distributions to shareholders from net realized gain | (1,244,891) | (2,216,760) |
Share transactions - net increase (decrease) | 73,713,633 | 293,844,002 |
Total increase (decrease) in net assets | 124,122,905 | 356,541,392 |
| | |
Net Assets | | |
Beginning of period | 411,011,092 | 54,469,700 |
End of period (including undistributed net investment income of $120,127 and undistributed net investment income of $128,153, respectively) | $ 535,133,997 | $ 411,011,092 |
Other Information: | | | |
Share Transactions | Year ended December 31, 2004 |
| Initial Class | Service Class | Service Class 2 |
Shares Sold | 8,638,945 | 6,485,433 | 5,436,667 |
Reinvested | 41,752 | 19,320 | 32,756 |
Redeemed | (5,449,797) | (6,222,992) | (4,188,055) |
Net increase (decrease) | 3,230,900 | 281,761 | 1,281,368 |
| | | |
Dollars Sold | $ 114,457,333 | $ 84,977,022 | $ 70,002,702 |
Reinvested | 553,633 | 255,600 | 435,658 |
Redeemed | (66,862,947) | (77,150,508) | (52,954,860) |
Net increase (decrease) | $ 48,148,019 | $ 8,082,114 | $ 17,483,500 |
| | | |
Share Transactions | Year ended December 31, 2003 |
| Initial Class | Service Class | Service Class 2 |
Shares Sold | 13,024,673 | 15,243,169 | 10,088,331 |
Reinvested | 76,091 | 40,651 | 62,471 |
Redeemed | (221,515) | (9,807,881) | (2,282,005) |
Net increase (decrease) | 12,879,249 | 5,475,939 | 7,868,797 |
| | | |
Dollars Sold | $ 159,105,532 | $ 160,018,555 | $ 101,065,362 |
Reinvested | 940,484 | 501,633 | 774,643 |
Redeemed | (2,714,031) | (102,413,068) | (23,435,108) |
Net increase (decrease) | $ 157,331,985 | $ 58,107,120 | $ 78,404,897 |
| | | |
Distributions | Year ended December 31, 2004 |
| Initial Class | Service Class | Service Class 2 |
From net realized gain | $ 553,633 | $ 255,600 | $ 435,658 |
| | | |
| Year ended December 31, 2003 |
| Initial Class | Service Class | Service Class 2 |
From net realized gain | $ 940,484 | $ 501,633 | $ 774,643 |
See accompanying notes which are an integral part of the financial statements.
Value Strategies Portfolio
Financial Highlights - Initial Class
Years ended December 31, | 2004 | 2003 | 2002F |
Selected Per-Share Data | | | |
Net asset value, beginning of period | $ 12.41 | $ 7.91 | $ 10.00 |
Income from Investment Operations | | | |
Net investment income (loss)E | .01 | -H | .01 |
Net realized and unrealized gain (loss) | 1.74 | 4.58 | (2.10) |
Total from investment operations | 1.75 | 4.58 | (2.09) |
Distributions from net realized gain | (.03) | (.08) | - |
Net asset value, end of period | $ 14.13 | $ 12.41 | $ 7.91 |
Total ReturnB,C,D | 14.13% | 57.91% | (20.90)% |
Ratios to Average Net AssetsG | | | |
Expenses before expense reductions | .71% | .76% | 1.43%A |
Expenses net of voluntary waivers, if any | .71% | .76% | 1.00%A |
Expenses net of all reductions | .70% | .73% | .95%A |
Net investment income (loss) | .10% | .02% | .13%A |
Supplemental Data | | | |
Net assets, end of period (000 omitted) | $ 229,764 | $ 161,705 | $ 1,191 |
Portfolio turnover rate | 41% | 47% | 65%A |
A Annualized
B Total returns for periods of less than one year are not annualized.
C Total returns do not reflect charges attributable to your insurance company's separate account. Inclusion of these charges would reduce the total returns shown.
D Total returns would have been lower had certain expenses not been reduced during the periods shown.
E Calculated based on average shares outstanding during the period.
F For the period February 20, 2002 (commencement of operations) to December 31, 2002.
G Expense ratios reflect operating expenses of the class. Expenses before reductions do not reflect amounts reimbursed by the investment adviser or reductions from brokerage service arrangements or other expense offset arrangements and do not represent the amount paid by the class during periods when reimbursements or reductions occur. Expense ratios before reductions for start-up periods may not be representative of longer-term operating periods. Expenses net of any voluntary waivers reflect expenses after reimbursement by the investment adviser but prior to reductions from brokerage service arrangements or other expense offset arrangements. Expenses net of all reductions represent the net expenses paid by the class.
H Amount represents less than $.01 per share.
Financial Highlights - Service Class
Years ended December 31, | 2004 | 2003 | 2002F |
Selected Per-Share Data | | | |
Net asset value, beginning of period | $ 12.39 | $ 7.90 | $ 10.00 |
Income from Investment Operations | | | |
Net investment income (loss)E | -H | (.01) | -H |
Net realized and unrealized gain (loss) | 1.73 | 4.58 | (2.10) |
Total from investment operations | 1.73 | 4.57 | (2.10) |
Distributions from net realized gain | (.03) | (.08) | - |
Net asset value, end of period | $ 14.09 | $ 12.39 | $ 7.90 |
Total ReturnB,C,D | 13.99% | 57.79% | (21.00)% |
Ratios to Average Net AssetsG | | | |
Expenses before expense reductions | .81% | .84% | 1.52%A |
Expenses net of voluntary waivers, if any | .81% | .84% | 1.10%A |
Expenses net of all reductions | .80% | .81% | 1.05%A |
Net investment income (loss) | -% | (.06)% | .03%A |
Supplemental Data | | | |
Net assets, end of period (000 omitted) | $ 98,542 | $ 83,146 | $ 9,774 |
Portfolio turnover rate | 41% | 47% | 65%A |
A Annualized
B Total returns for periods of less than one year are not annualized.
C Total returns do not reflect charges attributable to your insurance company's separate account. Inclusion of these charges would reduce the total returns shown.
D Total returns would have been lower had certain expenses not been reduced during the periods shown.
E Calculated based on average shares outstanding during the period.
F For the period February 20, 2002 (commencement of operations) to December 31, 2002.
G Expense ratios reflect operating expenses of the class. Expenses before reductions do not reflect amounts reimbursed by the investment adviser or reductions from brokerage service arrangements or other expense offset arrangements and do not represent the amount paid by the class during periods when reimbursements or reductions occur. Expense ratios before reductions for start-up periods may not be representative of longer-term operating periods. Expenses net of any voluntary waivers reflect expenses after reimbursement by the investment adviser but prior to reductions from brokerage service arrangements or other expense offset arrangements. Expenses net of all reductions represent the net expenses paid by the class.
H Amount represents less than $.01 per share.
See accompanying notes which are an integral part of the financial statements.
Annual Report
Financial Highlights - Service Class 2
Years ended December 31, | 2004 | 2003 | 2002F |
Selected Per-Share Data | | | |
Net asset value, beginning of period | $ 12.45 | $ 7.95 | $ 10.00 |
Income from Investment Operations | | | |
Net investment income (loss)E | (.02) | (.02) | (.01) |
Net realized and unrealized gain (loss) | 1.74 | 4.58 | (2.04) |
Total from investment operations | 1.72 | 4.56 | (2.05) |
Distributions from net realized gain | (.03) | (.06) | - |
Net asset value, end of period | $ 14.14 | $ 12.45 | $ 7.95 |
Total ReturnB,C,D | 13.84% | 57.36% | (20.50)% |
Ratios to Average Net AssetsG | | | |
Expenses before expense reductions | .97% | .99% | 1.68%A |
Expenses net of voluntary waivers, if any | .97% | .99% | 1.25%A |
Expenses net of all reductions | .95% | .96% | 1.21%A |
Net investment income (loss) | (.15)% | (.21) % | (.12)%A |
Supplemental Data | | | |
Net assets, end of period (000 omitted) | $ 206,828 | $ 166,160 | $ 43,505 |
Portfolio turnover rate | 41% | 47% | 65%A |
A Annualized
B Total returns for periods of less than one year are not annualized.
C Total returns do not reflect charges attributable to your insurance company's separate account. Inclusion of these charges would reduce the total returns shown.
D Total returns would have been lower had certain expenses not been reduced during the periods shown.
E Calculated based on average shares outstanding during the period.
F For the period February 20, 2002 (commencement of operations) to December 31, 2002.
G Expense ratios reflect operating expenses of the class. Expenses before reductions do not reflect amounts reimbursed by the investment adviser or reductions from brokerage service arrangements or other expense offset arrangements and do not represent the amount paid by the class during periods when reimbursements or reductions occur. Expense ratios before reductions for start-up periods may not be representative of longer-term operating periods. Expenses net of any voluntary waivers reflect expenses after reimbursement by the investment adviser but prior to reductions from brokerage service arrangements or other expense offset arrangements. Expenses net of all reductions represent the net expenses paid by the class.
See accompanying notes which are an integral part of the financial statements.
Value Strategies Portfolio
For the period ended December 31, 2004
1. Significant Accounting Policies.
Value Strategies Portfolio (the fund) is a fund of Variable Insurance Products Fund III (the trust) (referred to in this report as Fidelity Variable Insurance Products: Value Strategies Portfolio) and is authorized to issue an unlimited number of shares. The trust is registered under the Investment Company Act of 1940, as amended (the 1940 Act), as an open-end management investment company organized as a Massachusetts business trust. Shares of the fund may only be purchased by insurance companies for the purpose of funding variable annuity or variable life insurance contracts. The fund offers the following classes of shares: Initial Class shares, Service Class shares and Service Class 2 shares. All classes have equal rights and voting privileges, except for matters affecting a single class. Investment income, realized and unrealized capital gains and losses, the common expenses of the fund, and certain fund-level expense reductions, if any, are allocated on a pro rata basis to each class based on the relative net assets of each class to the total net assets of the fund. Each class differs with respect to distribution and service plan fees incurred. Certain expense reductions also differ by class.
The financial statements have been prepared in conformity with accounting principles generally accepted in the United States of America, which require management to make certain estimates and assumptions at the date of the financial statements. The following summarizes the significant accounting policies of the fund:
Security Valuation. Net asset value per share (NAV calculation) is calculated as of the close of business of the New York Stock Exchange, normally 4:00 p.m. Eastern time. Equity securities, including restricted securities, for which market quotations are available are valued at the last sale price or official closing price (closing bid price or last evaluated quote if no sale has occurred) on the primary market or exchange on which they trade. Debt securities, including restricted securities, for which quotations are readily available are valued at their most recent bid prices (sales prices if the principal market is an exchange) in the principal market in which such securities are normally traded, as determined by recognized dealers in such securities, or securities are valued on the basis of information provided by a pricing service. Pricing services use valuation matrices that incorporate both dealer-supplied valuations and valuation models. If prices are not readily available or do not accurately reflect fair value for a security, or if a security's value has been materially affected by events occurring after the close of the exchange or market on which the security is principally traded, that security may be valued by another method that the Board of Trustees believes accurately reflects fair value. A security's valuation may differ depending on the method used for determining value. Price movements in futures contracts and ADRs, market and trading trends, the bid/ask quotes of brokers and off-exchange institutional trading may be reviewed in the course of making a good faith determination of a security's fair value. Short-term securities with remaining maturities of sixty days or less for which quotations are not readily available are valued on the basis of amortized cost. Investments in open-end investment companies are valued at their net asset value each business day.
Foreign Currency. The fund uses foreign currency contracts to facilitate transactions in foreign-denominated securities. Losses from these transactions may arise from changes in the value of the foreign currency or if the counterparties do not perform under the contracts' terms.
Foreign-denominated assets, including investment securities, and liabilities are translated into U.S. dollars at the exchange rate at period end. Purchases and sales of investment securities, income and dividends received and expenses denominated in foreign currencies are translated into U.S. dollars at the exchange rate in effect on the transaction date.
The effects of exchange rate fluctuations on investments are included with the net realized and unrealized gain (loss) on investment securities. Other foreign currency transactions resulting in realized and unrealized gain (loss) are disclosed separately.
Investment Transactions and Income. Security transactions are accounted for as of trade date. Gains and losses on securities sold are determined on the basis of identified cost. Dividend income is recorded on the ex-dividend date, except for certain dividends from foreign securities where the ex-dividend date may have passed, which are recorded as soon as the fund is informed of the ex-dividend date. Non-cash dividends included in dividend income, if any, are recorded at the fair market value of the securities received. Interest income is accrued as earned. Interest income includes coupon interest and amortization of premium and accretion of discount on debt securities. Investment income is recorded net of foreign taxes withheld where recovery of such taxes is uncertain.
Expenses. Most expenses of the trust can be directly attributed to a fund. Expenses which cannot be directly attributed are apportioned among the funds in the trust.
Income Tax Information and Distributions to Shareholders. Each year, the fund intends to qualify as a regulated investment company by distributing all of its taxable income and realized gains under Subchapter M of the Internal Revenue Code. As a result, no provision for income taxes is required in the accompanying financial statements. Foreign taxes are provided for based on the fund's understanding of the tax rules and rates that exist in the foreign markets in which it invests.
Distributions are recorded on the ex-dividend date. Income dividends and capital gain distributions are declared separately for each class. Income and capital gain distributions are determined in accordance with income tax regulations, which may differ from generally accepted accounting principles.
Capital accounts within the financial statements are adjusted for permanent book-tax differences. These adjustments have no impact on net assets or the results of operations. Temporary book-tax differences will reverse in a subsequent period.
Annual Report
Notes to Financial Statements - continued
1. Significant Accounting Policies - continued
Income Tax Information and Distributions to Shareholders - continued
Book-tax differences are primarily due to foreign currency transactions, market discount and losses deferred due to wash sales.
The tax-basis components of distributable earnings and the federal tax cost as of period end were as follows:
Unrealized appreciation | $ 123,288,203 | |
Unrealized depreciation | (29,955,219) | |
Net unrealized appreciation (depreciation) | 93,332,984 | |
Undistributed ordinary income | 1,081,251 | |
Undistributed long-term capital gain | 15,463,266 | |
| | |
Cost for federal income tax purposes | $ 473,464,541 | |
The tax character of distributions paid was as follows:
| December 31, 2004 | December 31, 2003 |
Ordinary Income | $ 602,366 | $ 2,059,984 |
Long-term Capital Gains | 642,525 | 156,776 |
Total | $ 1,244,891 | $ 2,216,760 |
2. Operating Policies.
Repurchase Agreements. Fidelity Management & Research Company (FMR) has received an Exemptive Order from the Securities and Exchange Commission (the SEC) which permits the fund and other affiliated entities of FMR to transfer uninvested cash balances into joint trading accounts. These accounts are then invested in repurchase agreements that are collateralized by U.S. Treasury or Government obligations. The fund may also invest directly with institutions, in repurchase agreements that are collateralized by commercial paper obligations and corporate obligations. Collateral is held in segregated accounts with custodian banks and may be obtained in the event of a default of the counterparty. Collateral is marked-to-market daily and maintained at a value at least equal to the principal amount of the repurchase agreement (including accrued interest).
Restricted Securities. The fund may invest in securities that are subject to legal or contractual restrictions on resale. These securities generally may be resold in transactions exempt from registration or to the public if the securities are registered. Disposal of these securities may involve time-consuming negotiations and expense, and prompt sale at an acceptable price may be difficult. Information regarding restricted securities is included at the end of the fund's Schedule of Investments.
3. Purchases and Sales of Investments.
Purchases and sales of securities, other than short-term securities and U.S. government securities, aggregated $273,197,012 and $200,441,900, respectively.
4. Fees and Other Transactions with Affiliates.
Management Fee. FMR and its affiliates provide the fund with investment management related services for which the fund pays a monthly management fee. The management fee is the sum of an individual fund fee rate that is based on an annual rate of .30% of the fund's average net assets and a group fee rate that averaged .28% during the period. The group fee rate is based upon the average net assets of all the mutual funds advised by FMR. The group fee rate decreases as assets under management increase and increases as assets under management decrease. For the period, the total annual management fee rate was .57% of the fund's average net assets.
Distribution and Service Plan. In accordance with Rule 12b-1 of the 1940 Act, the fund has adopted separate 12b-1 Plans for each Service Class of shares. Each Service Class pays Fidelity Distributors Corporation (FDC), an affiliate of FMR, a service fee. For the period, the service fee is based on an annual rate of .10% of Service Class' average net assets and .25% of Service Class 2's average net assets.
For the period, each class paid FDC the following amounts, all of which were re-allowed to insurance companies for the distribution of shares and providing shareholder support services:
Service Class | $ 97,950 | |
Service Class 2 | 451,402 | |
| $ 549,352 | |
Value Strategies Portfolio
4. Fees and Other Transactions with Affiliates - continued
Transfer Agent Fees. Fidelity Investments Institutional Operations Company, Inc. (FIIOC), an affiliate of FMR, is the fund's transfer, dividend disbursing, and shareholder servicing agent. FIIOC receives an asset-based fee with respect to each account. FIIOC pays a portion of the expenses related to the typesetting, printing and mailing of shareholder reports, except proxy statements. Each class pays a transfer agent fee, excluding out of pocket expenses, equal to an annual rate of .07% of their month end net assets. For the period, the total transfer agent fees paid by each class to FIIOC, including out of pocket expenses, were as follows:
Initial Class | $ 151,925 | |
Service Class | 64,766 | |
Service Class 2 | 122,972 | |
| $ 339,663 | |
Accounting and Security Lending Fees. Fidelity Service Company, Inc. (FSC), an affiliate of FMR, maintains the fund's accounting records. The accounting fee is based on the level of average net assets for the month. Under a separate contract, FSC administers the security lending program. The security lending fee is based on the number and duration of lending transactions.
Central Funds. The fund may invest in affiliated Central Funds managed by Fidelity Investments Money Management, Inc. (FIMM), an affiliate of FMR. The Central Funds are open-end investment companies available only to investment companies and other accounts managed by FMR and its affiliates. The Central Funds seek preservation of capital and current income and do not pay a management fee. Income distributions earned by the fund are recorded as income in the accompanying financial statements and totaled $117,376 for the period.
Brokerage Commissions. The fund placed a portion of its portfolio transactions with brokerage firms which are affiliates of the investment adviser. The commissions paid to these affiliated firms were $54,255 for the period.
Interfund Lending Program. Pursuant to an Exemptive Order issued by the SEC, the fund, along with other registered investment companies having management contracts with FMR, may participate in an interfund lending program. This program provides an alternative credit facility allowing the funds to borrow from, or lend money to, other participating funds. At period end, there were no interfund loans outstanding. The fund's activity in this program during the period was as follows:
Borrower or Lender | Average Daily
Loan Balance | Weighted Average Interest Rate | Interest Earned
(included in
interest income) | Interest Expense |
Borrower | $ 4,200,077 | 1.46% | - | $ 2,207 |
5. Committed Line of Credit.
The fund participates with other funds managed by FMR in a $4.2 billion credit facility (the "line of credit") to be utilized for temporary or emergency purposes to fund shareholder redemptions or for other short-term liquidity purposes. The fund has agreed to pay commitment fees on its pro rata portion of the line of credit. During the period, there were no borrowings on this line of credit.
6. Security Lending.
The fund lends portfolio securities from time to time in order to earn additional income. The fund receives collateral (in the form of U.S. Treasury obligations, letters of credit and/or cash) against the loaned securities and maintains collateral in an amount not less than 100% of the market value of the loaned securities during the period of the loan. The market value of the loaned securities is determined at the close of business of the fund and any additional required collateral is delivered to the fund on the next business day. If the borrower defaults on its obligation to return the securities loaned because of insolvency or other reasons, a fund could experience delays and costs in recovering the securities loaned or in gaining access to the collateral. Cash collateral is invested in cash equivalents. The value of loaned securities and cash collateral at period end are disclosed on the fund's Statement of Assets and Liabilities.
7. Expense Reductions.
Many of the brokers with whom FMR places trades on behalf of the fund provided services to the fund in addition to trade execution. These services included payments of certain expenses on behalf of the fund totaling $69,175 for the period.
8. Other Information.
At the end of the period, FMR or its affiliates were the owners of record of 43% of the total outstanding shares of the fund and two otherwise unaffiliated shareholders were the owners of record of 53% of the total outstanding shares of the fund.
Annual Report
To the Trustees of Variable Insurance Products Fund III and Shareholders of Value Strategies Portfolio:
We have audited the accompanying statement of assets and liabilities of Value Strategies Portfolio (the Fund), a fund of Variable Insurance Products Fund III, including the portfolio of investments, as of December 31, 2004, and the related statement of operations for the year then ended, the statement of changes in net assets for each of the two years in the period then ended, and the financial highlights for each of the three years in the period then ended and for the period February 20, 2002 (commencement of operations) to December 31, 2004. These financial statements and financial highlights are the responsibility of the Fund's management. Our responsibility is to express an opinion on these financial statements and financial highlights based on our audits.
We conducted our audits in accordance with standards of the Public Company Accounting Oversight Board (United States). Those standards require that we plan and perform the audit to obtain reasonable assurance about whether the financial statements and financial highlights are free of material misstatement. An audit includes consideration of internal control over financial reporting as a basis for designing audit procedures that are appropriate in the circumstances, but not for the purpose of expressing an opinion on the effectiveness of the Fund's internal control over financial reporting. Accordingly, we express no such opinion. An audit also includes examining, on a test basis, evidence supporting the amounts and disclosures in the financial statements, assessing the accounting principles used and significant estimates made by management, as well as evaluating the overall financial statement presentation. Our procedures included confirmation of securities owned as of December 31, 2004, by correspondence with the custodians and brokers; where replies were not received from brokers, we performed other auditing procedures. We believe that our audits provide a reasonable basis for our opinion.
In our opinion, the financial statements and financial highlights referred to above present fairly, in all material respects, the financial position of Value Strategies Portfolio as of December 31, 2004, the results of its operations for the year then ended, the changes in its net assets for each of the two years in the period then ended, and its financial highlights for each of the three years in the period then ended, in conformity with accounting principles generally accepted in the United States of America.
/s/ DELOITTE & TOUCHE LLP
DELOITTE & TOUCHE LLP
Boston, Massachusetts
February 14, 2005
Value Strategies Portfolio
The Trustees, Member of the Advisory Board, and executive officers of the trust and fund, as applicable, are listed below. The Board of Trustees governs the fund and is responsible for protecting the interests of shareholders. The Trustees are experienced executives who meet periodically throughout the year to oversee the fund's activities, review contractual arrangements with companies that provide services to the fund, and review the fund's performance. Except for William O. McCoy, Dennis J. Dirks, and Kenneth L. Wolfe each of the Trustees oversees 301 funds advised by FMR or an affiliate. Mr. McCoy oversees 303 funds advised by FMR or an affiliate. Mr. Dirks and Mr. Wolfe oversee 233 funds advised by FMR or an affiliate.
The Trustees hold office without limit in time except that (a) any Trustee may resign; (b) any Trustee may be removed by written instrument, signed by at least two-thirds of the number of Trustees prior to such removal; (c) any Trustee who requests to be retired or who has become incapacitated by illness or injury may be retired by written instrument signed by a majority of the other Trustees; and (d) any Trustee may be removed at any special meeting of shareholders by a two-thirds vote of the outstanding voting securities of the trust. In any event, each non-interested Trustee shall retire not later than the last day of the calendar year in which his or her 72nd birthday occurs. The executive officers and Advisory Board Member hold office without limit in time, except that any officer and Advisory Board Member may resign or may be removed by a vote of a majority of the Trustees at any regular meeting or any special meeting of the Trustees. Except as indicated, each individual has held the office shown or other offices in the same company for the past five years.
The fund's Statement of Additional Information (SAI) include more information about the Trustees. To request a free copy, call Fidelity at 1-800-544-5429.
Interested Trustees*:
Correspondence intended for each Trustee who is an "interested person" (as defined in the 1940 Act) may be sent to Fidelity Investments, 82 Devonshire Street, Boston, Massachusetts 02109.
Name, Age; Principal Occupation |
Edward C. Johnson 3d (74)** |
| Year of Election or Appointment: 1994 Mr. Johnson is Chairman of the Board of Trustees. Mr. Johnson serves as Chief Executive Officer, Chairman, and a Director of FMR Corp.; a Director and Chairman of the Board and of the Executive Committee of FMR; Chairman and a Director of Fidelity Management & Research (Far East) Inc.; Chairman (1998) and a Director of Fidelity Investments Money Management, Inc.; and Chairman (2001) and a Director (2000) of FMR Co., Inc. |
Abigail P. Johnson (43)** |
| Year of Election or Appointment: 2001 Senior Vice President of VIP Value Strategies (2002). Ms. Johnson also serves as Senior Vice President of other Fidelity funds (2001). She is President and a Director of FMR (2001), Fidelity Investments Money Management, Inc. (2001), FMR Co., Inc. (2001), and a Director of FMR Corp. Previously, Ms. Johnson managed a number of Fidelity funds. |
Laura B. Cronin (50) |
| Year of Election or Appointment: 2003 Ms. Cronin is an Executive Vice President (2002) and Chief Financial Officer (2002) of FMR Corp. and is a member of the Fidelity Management Committee (2003). Previously, Ms. Cronin served as Vice President of Finance of FMR (1997-1999), and Chief Financial Officer of FMR (1999-2001), Fidelity Personal Investments (2001), and Fidelity Brokerage Company (2001-2002). |
Robert L. Reynolds (52) |
| Year of Election or Appointment: 2003 Mr. Reynolds is a Director (2003) and Chief Operating Officer (2002) of FMR Corp. and is the head of the Fidelity Management Committee (2003). He also serves on the Board at Fidelity Investments Canada, Ltd. (2000). Previously, Mr. Reynolds served as President of Fidelity Investments Institutional Retirement Group (1996-2000). |
* Trustees have been determined to be "Interested Trustees" by virtue of, among other things, their affiliation with the trust or various entities under common control with FMR.
** Edward C. Johnson 3d, Trustee, is Abigail P. Johnson's father.
Annual Report
Trustees and Officers - continued
Non-Interested Trustees:
Correspondence intended for each non-interested Trustee (that is, the Trustees other than the Interested Trustees) may be sent to Fidelity Investments, P.O. Box 55235, Boston, Massachusetts 02205-5235.
Name, Age; Principal Occupation |
Dennis J. Dirks (56) |
| Year of Election or Appointment: 2005 Mr. Dirks also serves as a Trustee (2005) or Member of the Advisory Board (2004) of other investment companies advised by FMR. Prior to his retirement in May 2003, Mr. Dirks was Chief Operating Officer and a member of the Board of The Depository Trust & Clearing Corporation (DTCC) (1999-2003). He also served as President, Chief Operating Officer, and Board member of The Depository Trust Company (DTC) (1999-2003) and President and Board member of the National Securities Clearing Corporation (NSCC) (1999-2003). In addition, Mr. Dirks served as Chief Executive Officer and Board member of the Government Securities Clearing Corporation (2001-2003) and Chief Executive Officer and Board member of the Mortgage-Backed Securities Clearing Corporation (2001-2003). |
Robert M. Gates (61) |
| Year of Election or Appointment: 1997 Dr. Gates is Vice Chairman of the non-interested Trustees (2005). Dr. Gates is President of Texas A&M University (2002). He was Director of the Central Intelligence Agency (CIA) from 1991 to 1993. From 1989 to 1991, Dr. Gates served as Assistant to the President of the United States and Deputy National Security Advisor. Dr. Gates is a Director of NACCO Industries, Inc. (mining and manufacturing), Parker Drilling Co., Inc. (drilling and rental tools for the energy industry, 2001), and Brinker International (restaurant management, 2003). He also serves as a member of the Advisory Board of VoteHere.net (secure internet voting, 2001). Previously, Dr. Gates served as a Director of LucasVarity PLC (automotive components and diesel engines), a Director of TRW Inc. (automotive, space, defense, and information technology), and Dean of the George Bush School of Government and Public Service at Texas A&M University (1999-2001). Dr. Gates also is a Trustee of the Forum for International Policy. |
George H. Heilmeier (68) |
| Year of Election or Appointment: 2004 Dr. Heilmeier is Chairman Emeritus of Telcordia Technologies (communication software and systems), where prior to his retirement, he served as company Chairman and Chief Executive Officer. He currently serves on the Boards of Directors of The Mitre Corporation (systems engineering and information technology support for the government), INET Technologies Inc. (telecommunications network surveillance, 2001), Teletech Holdings (customer management services), and HRL Laboratories (private research and development, 2004). He is Chairman of the General Motors Technology Advisory Committee and a Life Fellow of the Institute of Electrical and Electronics Engineers (IEEE) (2000). Dr. Heilmeier is a member of the Defense Science Board and the National Security Agency Advisory Board. He is also a member of the National Academy of Engineering, the American Academy of Arts and Sciences, and the Board of Overseers of the School of Engineering and Applied Science of the University of Pennsylvania. Previously, Dr. Heilmeier served as a Director of TRW Inc. (automotive, space, defense, and information technology, 1992-2002), Compaq (1994-2002), and Automatic Data Processing, Inc. (ADP) (technology-based business outsourcing, 1995-2002). |
Marie L. Knowles (58) |
| Year of Election or Appointment: 2001 Prior to Ms. Knowles' retirement in June 2000, she served as Executive Vice President and Chief Financial Officer of Atlantic Richfield Company (ARCO) (diversified energy, 1996-2000). From 1993 to 1996, she was a Senior Vice President of ARCO and President of ARCO Transportation Company. She served as a Director of ARCO from 1996 to 1998. She currently serves as a Director of Phelps Dodge Corporation (copper mining and manufacturing) and McKesson Corporation (healthcare service, 2002). Ms. Knowles is a Trustee of the Brookings Institution and the Catalina Island Conservancy and also serves as a member of the Advisory Board for the School of Engineering of the University of Southern California. |
Ned C. Lautenbach (60) |
| Year of Election or Appointment: 2000 Mr. Lautenbach has been a partner of Clayton, Dubilier & Rice, Inc. (private equity investment firm) since September 1998. Previously, Mr. Lautenbach was with the International Business Machines Corporation (IBM) from 1968 until his retirement in 1998. He was most recently Senior Vice President and Group Executive of Worldwide Sales and Services. From 1993 to 1995, he was Chairman of IBM World Trade Corporation, and from 1994 to 1998 was a member of IBM's Corporate Executive Committee. Mr. Lautenbach serves as Co-Chairman and a Director of Covansys, Inc. (global provider of business and technology solutions, 2000). In addition, he is a Director of Italtel Holding S.p.A. (telecommunications (Milan, Italy), 2004) and Eaton Corporation (diversified industrial) as well as the Philharmonic Center for the Arts in Naples, Florida (1999). He also is a member of the Council on Foreign Relations. |
Marvin L. Mann (71) |
| Year of Election or Appointment: 1994 Mr. Mann is Chairman of the non-interested Trustees (2001). He is Chairman Emeritus of Lexmark International, Inc. (computer peripherals), where he served as CEO until April 1998, retired as Chairman May 1999, and remains a member of the Board. Prior to 1991, he held the positions of Vice President of International Business Machines Corporation (IBM) and President and General Manager of various IBM divisions and subsidiaries. He is a member of the Executive Committee of the Independent Director's Council of the Investment Company Institute. In addition, Mr. Mann is a member of the President's Cabinet at the University of Alabama and the Board of Visitors of the Culverhouse College of Commerce and Business Administration at the University of Alabama. |
William O. McCoy (71) |
| Year of Election or Appointment: 1997 Prior to his retirement in December 1994, Mr. McCoy was Vice Chairman of the Board of BellSouth Corporation (telecommunications) and President of BellSouth Enterprises. He is currently a Director of Liberty Corporation (holding company), Duke Realty Corporation (real estate), and Progress Energy, Inc. (electric utility). He is also a partner of Franklin Street Partners (private investment management firm) and a member of the Research Triangle Foundation Board. In addition, Mr. McCoy served as the Interim Chancellor (1999-2000) and a member of the Board of Visitors (1994-1998) for the University of North Carolina at Chapel Hill and currently serves on the Board of Directors of the University of North Carolina Health Care System and the Board of Visitors of the Kenan-Flagler Business School (University of North Carolina at Chapel Hill). He also served as Vice President of Finance for the University of North Carolina (16-school system, 1995-1998). |
Cornelia M. Small (60) |
| Year of Election or Appointment: 2005 Ms. Small is a member (2000) and Chairperson (2002) of the Investment Committee, and a member (2002) of the Board of Trustees of Smith College. Previously, she served as Chief Investment Officer (1999-2000), Director of Global Equity Investments (1996-1999), and a member of the Board of Directors of Scudder, Stevens & Clark (1990-1997) and Scudder Kemper Investments (1997-1998). In addition, Ms. Small served as Co-Chair (2000-2003) of the Annual Fund for the Fletcher School of Law and Diplomacy. |
William S. Stavropoulos (65) |
| Year of Election or Appointment: 2002 Mr. Stavropoulos is Chairman of the Board (2000), CEO (2002), a position he previously held from 1995-2000, Chairman of the Executive Committee (2000), and a Member of the Board of Directors of The Dow Chemical Company. Since joining The Dow Chemical Company in 1967, Mr. Stavropoulos served in numerous senior management positions, including President (1993-2000; 2002-2003). Currently, he is a Director of NCR Corporation (data warehousing and technology solutions), BellSouth Corporation (telecommunications), Chemical Financial Corporation, and Maersk Inc. (industrial conglomerate, 2002). He also serves as a member of the Board of Trustees of the American Enterprise Institute for Public Policy Research. In addition, Mr. Stavropoulos is a member of The Business Council, J.P. Morgan International Council and the University of Notre Dame Advisory Council for the College of Science. |
Kenneth L. Wolfe (65) |
| Year of Election or Appointment: 2005 Mr. Wolfe also serves as a Trustee (2005) or Member of the Advisory Board (2004) of other investment companies advised by FMR. Prior to his retirement in 2001, Mr. Wolfe was Chairman and Chief Executive Officer of Hershey Foods Corporation (1993-2001). He currently serves as a member of the boards of Adelphia Communications Corporation (2003), Bausch & Lomb, Inc., and Revlon Inc. (2004). |
Annual Report
Trustees and Officers - continued
Advisory Board Member and Executive Officers:
Correspondence intended for each executive officer and Mr. Lynch may be sent to Fidelity Investments, 82 Devonshire Street, Boston, Massachusetts 02109.
Name, Age; Principal Occupation |
Peter S. Lynch (61) |
| Year of Election or Appointment: 2003 Member of the Advisory Board of Variable Insurance Products Fund III. Vice Chairman and a Director of FMR, and Vice Chairman (2001) and a Director (2000) of FMR Co., Inc. Previously, Mr. Lynch served as a Trustee of the Fidelity funds (1990-2003). Prior to May 31, 1990, he was a Director of FMR and Executive Vice President of FMR (a position he held until March 31, 1991), Vice President of Fidelity® Magellan® Fund and FMR Growth Group Leader, and Managing Director of FMR Corp. Mr. Lynch was also Vice President of Fidelity Investments Corporate Services. In addition, he serves as a Trustee of Boston College, Massachusetts Eye & Ear Infirmary, Historic Deerfield, John F. Kennedy Library, and the Museum of Fine Arts of Boston. |
John B. McDowell (46) |
| Year of Election or Appointment: 2002 Vice President of VIP Value Strategies. Mr. McDowell also serves as Vice President of certain Equity Funds (2002). He is Senior Vice President of FMR (1999), FMR Co., Inc. (2001), and Fidelity Management Trust Company (FMTC). Since joining Fidelity Investments in 1985, Mr. McDowell has worked as a research analyst and manager. |
Harris B. Leviton (43) |
| Year of Election or Appointment: 2002 Vice President of VIP Value Strategies. Mr. Leviton also serves as Vice President of another fund advised by FMR. Prior to assuming his current responsibilities, Mr. Leviton managed a variety of Fidelity funds. Mr. Leviton also serves as Vice President of FMR and FMR Co., Inc (2001). |
Eric D. Roiter (56) |
| Year of Election or Appointment: 2002 Secretary of VIP Value Strategies. He also serves as Secretary of other Fidelity funds; Vice President, General Counsel, and Secretary of FMR Co., Inc. (2001-present) and FMR; Vice President and Secretary of FDC; Assistant Secretary of Fidelity Management & Research (U.K.) Inc. (2001-present), Fidelity Management & Research (Far East) Inc. (2001-present), and Fidelity Investments Money Management, Inc. (2001-present). Mr. Roiter is an Adjunct Member, Faculty of Law, at Boston College Law School (2003-present). |
Stuart Fross (45) |
| Year of Election or Appointment: 2003 Assistant Secretary of VIP Value Strategies. Mr. Fross also serves as Assistant Secretary of other Fidelity funds (2003) and is an employee of FMR. |
Christine Reynolds (46) |
| Year of Election or Appointment: 2004 President, Treasurer, and Anti-Money Laundering (AML) officer of VIP Value Strategies. Ms. Reynolds also serves as President, Treasurer, and AML officer of other Fidelity funds (2004) and is a Vice President (2003) and an employee (2002) of FMR. Before joining Fidelity Investments, Ms. Reynolds worked at PricewaterhouseCoopers LLP (PwC) (1980-2002), where she was most recently an audit partner with PwC's investment management practice. |
Timothy F. Hayes (54) |
| Year of Election or Appointment: 2002 Chief Financial Officer of VIP Value Strategies. Mr. Hayes also serves as Chief Financial Officer of other Fidelity funds (2002). Recently he was appointed President of Fidelity Service Company (2003) where he also serves as a Director. Mr. Hayes also serves as President of Fidelity Investments Operations Group (FIOG, 2002), which includes Fidelity Pricing and Cash Management Services Group (FPCMS), where he was appointed President in 1998. Previously, Mr. Hayes served as Chief Financial Officer of Fidelity Investments Corporate Systems and Service Group (1998) and Fidelity Systems Company (1997-1998). |
Kenneth A. Rathgeber (57) |
| Year of Election or Appointment: 2004 Chief Compliance Officer of VIP Value Strategies. Mr. Rathgeber also serves as Chief Compliance Officer of other Fidelity funds (2004) and Executive Vice President of Risk Oversight for Fidelity Investments (2002). Previously, he served as Executive Vice President and Chief Operating Officer for Fidelity Investments Institutional Services Company, Inc. (1998-2002). |
John R. Hebble (46) |
| Year of Election or Appointment: 2003 Deputy Treasurer of VIP Value Strategies. Mr. Hebble also serves as Deputy Treasurer of other Fidelity funds (2003), and is an employee of FMR. Before joining Fidelity Investments, Mr. Hebble worked at Deutsche Asset Management where he served as Director of Fund Accounting (2002-2003) and Assistant Treasurer of the Scudder Funds (1998-2003). |
Kimberley H. Monasterio (41) |
| Year of Election or Appointment: 2004 Deputy Treasurer of VIP Value Strategies. Ms. Monasterio also serves as Deputy Treasurer of other Fidelity funds (2004) and is an employee of FMR (2004). Before joining Fidelity Investments, Ms. Monasterio served as Treasurer (2000-2004) and Chief Financial Officer (2002-2004) of the Franklin Templeton Funds and Senior Vice President of Franklin Templeton Services, LLC (2000-2004). |
John H. Costello (58) |
| Year of Election or Appointment: 2002 Assistant Treasurer of VIP Value Strategies. Mr. Costello also serves as Assistant Treasurer of other Fidelity funds and is an employee of FMR. |
Peter L. Lydecker (50) |
| Year of Election or Appointment: 2004 Assistant Treasurer of VIP Value Strategies. Mr. Lydecker also serves as Assistant Treasurer of other Fidelity funds (2004) and is an employee of FMR. |
Mark Osterheld (49) |
| Year of Election or Appointment: 2002 Assistant Treasurer of VIP Value Strategies. Mr. Osterheld also serves as Assistant Treasurer of other Fidelity funds (2002) and is an employee of FMR. |
Kenneth B. Robins (35) |
| Year of Election or Appointment: 2004 Assistant Treasurer of VIP Value Strategies. Mr. Robins also serves as Assistant Treasurer of other Fidelity funds (2004) and is an employee of FMR (2004). Before joining Fidelity Investments, Mr. Robins worked at KPMG LLP, where he was a partner in KPMG's department of professional practice (2002-2004) and a Senior Manager (1999-2000). In addition, Mr. Robins served as Assistant Chief Accountant, United States Securities and Exchange Commission (2000-2002). |
Annual Report
The Board of Trustees of Value Strategies Portfolio voted to pay to shareholders of record at the opening of business on record date, the following distributions per share derived from capital gains realized from sales of portfolio securities:
Fund | Pay Date | Record Date | Capital Gains |
Initial Class | 2/11/05 | 2/11/05 | $0.465 |
Service Class | 2/11/05 | 2/11/05 | $0.45 |
Service Class 2 | 2/11/05 | 2/11/05 | $0.435 |
The fund will notify shareholders in January 2005 of amounts for use in preparing 2004 income tax returns.
Value Strategies Portfolio
A special meeting of the fund's shareholders was held on December 14, 2004. The results of votes taken among shareholders on proposals before them are reported below. Each vote reported represents one dollar of net asset value held on the record date for the meeting.
PROPOSAL 1 |
To amend the Declaration of Trust to allow the Board of Trustees, if permitted by applicable law, to authorize fund mergers without shareholder approval. A |
| # of
Votes | % of
Votes |
Affirmative | 4,465,365,699.61 | 80.317 |
Against | 820,718,849.73 | 14.762 |
Abstain | 273,620,539.56 | 4.921 |
TOTAL | 5,559,705,088.90 | 100.000 |
PROPOSAL 2 |
To elect a Board of Trustees. A |
| # of
Votes | % of
Votes |
J. Michael Cook |
Affirmative | 5,275,527,318.06 | 94.889 |
Withheld | 284,177,770.84 | 5.111 |
TOTAL | 5,559,705,088.90 | 100.000 |
Ralph F. Cox |
Affirmative | 5,260,941,793.66 | 94.626 |
Withheld | 298,763,295.24 | 5.374 |
TOTAL | 5,559,705,088.90 | 100.000 |
Laura B. Cronin |
Affirmative | 5,275,571,233.79 | 94.889 |
Withheld | 284,133,855.11 | 5.111 |
TOTAL | 5,559,705,088.90 | 100.000 |
Dennis J. Dirks B |
Affirmative | 5,277,234,059.51 | 94.919 |
Withheld | 282,471,029.39 | 5.081 |
TOTAL | 5,559,705,088.90 | 100.000 |
Robert M. Gates |
Affirmative | 5,271,693,384.06 | 94.820 |
Withheld | 288,011,704.84 | 5.180 |
TOTAL | 5,559,705,088.90 | 100.000 |
George H. Heilmeier |
Affirmative | 5,276,712,546.15 | 94.910 |
Withheld | 282,992,542.75 | 5.090 |
TOTAL | 5,559,705,088.90 | 100.000 |
Abigail P. Johnson |
Affirmative | 5,265,412,678.20 | 94.707 |
Withheld | 294,292,410.70 | 5.293 |
TOTAL | 5,559,705,088.90 | 100.000 |
Edward C. Johnson 3d |
Affirmative | 5,252,813,997.03 | 94.480 |
Withheld | 306,891,091.87 | 5.520 |
TOTAL | 5,559,705,088.90 | 100.000 |
Donald J. Kirk |
Affirmative | 5,268,337,458.03 | 94.759 |
Withheld | 291,367,630.87 | 5.241 |
TOTAL | 5,559,705,088.90 | 100.000 |
| # of
Votes | % of
Votes |
Marie L. Knowles |
Affirmative | 5,278,993,264.93 | 94.951 |
Withheld | 280,711,823.97 | 5.049 |
TOTAL | 5,559,705,088.90 | 100.000 |
Ned C. Lautenbach |
Affirmative | 5,280,591,428.18 | 94.980 |
Withheld | 279,113,660.72 | 5.020 |
TOTAL | 5,559,705,088.90 | 100.000 |
Marvin L. Mann |
Affirmative | 5,266,769,335.50 | 94.731 |
Withheld | 292,935,753.40 | 5.269 |
TOTAL | 5,559,705,088.90 | 100.000 |
William O. McCoy |
Affirmative | 5,270,804,685.62 | 94.804 |
Withheld | 288,900,403.28 | 5.196 |
TOTAL | 5,559,705,088.90 | 100.000 |
Robert L. Reynolds |
Affirmative | 5,279,190,479.65 | 94.955 |
Withheld | 280,514,609.25 | 5.045 |
TOTAL | 5,559,705,088.90 | 100.000 |
Cornelia M. Small B |
Affirmative | 5,276,074,654.01 | 94.898 |
Withheld | 283,630,434.89 | 5.102 |
TOTAL | 5,559,705,088.90 | 100.000 |
William S. Stavropoulos |
Affirmative | 5,278,183,775.21 | 94.936 |
Withheld | 281,521,313.69 | 5.064 |
TOTAL | 5,559,705,088.90 | 100.000 |
A Denotes trust-wide proposals and voting results. B Effective January 1, 2005. |
Value Strategies Portfolio
Annual Report
Investment Adviser
Fidelity Management & Research Company
Boston, MA
Investment Sub-Advisers
FMR Co., Inc.
Fidelity Management & Research (U.K.) Inc.
Fidelity Management & Research (Far East) Inc.
Fidelity Investments Japan Limited
Fidelity International Investment Advisors
Fidelity International Investment Advisors
(U.K.) Limited
General Distributor
Fidelity Distributors Corporation
Boston, MA
Transfer and Shareholder Servicing Agent
Fidelity Investments Institutional Operations Company, Inc.
Boston, MA
Custodian
Mellon Bank, N.A.
Pittsburgh, PA
VIPVS-ANN-0205
1.781994.102
Item 2. Code of Ethics
As of the end of the period, December 31, 2004, Variable Insurance Products Fund III (the trust) has adopted a code of ethics, as defined in Item 2 of Form N-CSR, that applies to its President and Treasurer and its Chief Financial Officer. A copy of the code of ethics is filed as an exhibit to this Form N-CSR.
Item 3. Audit Committee Financial Expert
The Board of Trustees of the trust has determined that Marie L. Knowles is an audit committee financial expert, as defined in Item 3 of Form N-CSR. Ms. Knowles is independent for purposes of Item 3 of Form N-CSR.
Item 4. Principal Accountant Fees and Services
(a) Audit Fees.
For the fiscal years ended December 31, 2004 and December 31, 2003, the aggregate Audit Fees billed by Deloitte & Touche LLP, the member firms of Deloitte Touche Tohmatsu, and their respective affiliates (collectively, "Deloitte Entities") for professional services rendered for the audits of the financial statements, or services that are normally provided in connection with statutory and regulatory filings or engagements for those fiscal years, for Aggressive Growth Portfolio, Balanced Portfolio, Dynamic Capital Appreciation Portfolio, Growth & Income Portfolio, Growth Opportunities Portfolio, and Value Strategies Portfolio (the funds) and for all funds in the Fidelity Group of Funds are shown in the table below.
Fund | 2004A | 2003A |
Aggressive Growth Portfolio | $26,000 | $36,000 |
Balanced Portfolio | $34,000 | $46,000 |
Dynamic Capital Appreciation Portfolio | $28,000 | $24,000 |
Growth & Income Portfolio | $31,000 | $28,000 |
Growth Opportunities Portfolio | $30,000 | $27,000 |
Value Strategies Portfolio | $27,000 | $23,000 |
All funds in the Fidelity Group of Funds audited by Deloitte Entities | $4,300,000 | $4,300,000 |
A | Aggregate amounts may reflect rounding. |
For the fiscal years ended December 31, 2004 and December 31, 2003, the aggregate Audit Fees billed by PricewaterhouseCoopers LLP (PwC) for professional services rendered for the audits of the financial statements, or services that are normally provided in connection with statutory and regulatory filings or engagements for those fiscal years, for Mid Cap Portfolio (the fund) and for all funds in the Fidelity Group of Funds are shown in the table below.
Fund | 2004A | 2003A |
Mid Cap Portfolio | $34,000 | $26,000 |
All funds in the Fidelity Group of Funds audited by PwC | $10,800,000 | $10,600,000 |
A | Aggregate amounts may reflect rounding. |
(b) Audit-Related Fees.
In each of the fiscal years ended December 31, 2004 and December 31, 2003, the aggregate Audit-Related Fees billed by Deloitte Entities for services rendered for assurance and related services to each fund that are reasonably related to the performance of the audit or review of the fund's financial statements, but not reported as Audit Fees, are shown in the table below.
Fund | 2004A | 2003 A, B |
Aggressive Growth Portfolio | $0 | $0 |
Balanced Portfolio | $0 | $0 |
Dynamic Capital Appreciation Portfolio | $0 | $0 |
Growth & Income Portfolio | $0 | $0 |
Growth Opportunities Portfolio | $0 | $0 |
Value Strategies Portfolio | $0 | $0 |
A | Aggregate amounts may reflect rounding. |
B | Includes amounts related to non-audit services prior to May 6, 2003 that would have been subject to pre-approval if the SEC rules relating to the pre-approval of non-audit services had been in effect at that time. |
In each of the fiscal years ended December 31, 2004 and December 31, 2003, the aggregate Audit-Related Fees billed by PwC for services rendered for assurance and related services to the fund that are reasonably related to the performance of the audit or review of the fund's financial statements, but not reported as Audit Fees, are shown in the table below.
Fund | 2004A | 2003 A, B |
Mid Cap Portfolio | $0 | $0 |
A | Aggregate amounts may reflect rounding. |
B | Includes amounts related to non-audit services prior to May 6, 2003 that would have been subject to pre-approval if the SEC rules relating to the pre-approval of non-audit services had been in effect at that time. |
In each of the fiscal years ended December 31, 2004 and December 31, 2003, the aggregate Audit-Related Fees that were billed by PwC and Deloitte Entities that were required to be approved by the Audit Committee for services rendered on behalf of Fidelity Management & Research Company (FMR) and entities controlling, controlled by, or under common control with FMR (not including any sub-adviser whose role is primarily portfolio management and is subcontracted with or overseen by another investment adviser) that provide ongoing services to the funds ("Fund Service Providers") for assurance and related services that relate directly to the operations and financial reporting of each fund that are reasonably related to the performance of the audit or review of the fund's financial statements, but not reported as Audit Fees, are shown in the table below.
Billed By | 2004 A | 2003A, B |
PwC | $0 | $50,000 |
Deloitte Entities | $0 | $0 |
A | Aggregate amounts may reflect rounding. |
B | Includes amounts related to non-audit services prior to May 6, 2003 that would have been subject to pre-approval if the SEC rules relating to the pre-approval of non-audit services had been in effect at that time. |
Fees included in the audit-related category comprise assurance and related services (e.g., due diligence services) that are traditionally performed by the independent registered public accounting firm. These audit-related services include due diligence related to mergers and acquisitions, accounting consultations and audits in connection with acquisitions, internal control reviews, attest services that are not required by statute or regulation and consultation concerning financial accounting and reporting standards.
(c) Tax Fees.
In each of the fiscal years ended December 31, 2004 and December 31, 2003, the aggregate Tax Fees billed by Deloitte Entities for professional services rendered for tax compliance, tax advice, and tax planning for each fund is shown in the table below.
Fund | 2004A | 2003A, B |
Aggressive Growth Portfolio | $3,900 | $3,800 |
Balanced Portfolio | $4,200 | $4,000 |
Dynamic Capital Appreciation Portfolio | $3,900 | $3,800 |
Growth & Income Portfolio | $4,200 | $4,000 |
Growth Opportunities Portfolio | $4,200 | $4,000 |
Value Strategies Portfolio | $3,600 | $3,500 |
A | Aggregate amounts may reflect rounding. |
B | Includes amounts related to non-audit services prior to May 6, 2003 that would have been subject to pre-approval if the SEC rules relating to the pre-approval of non-audit services had been in effect at that time. |
In each of the fiscal years ended December 31, 2004 and December 31, 2003, the aggregate Tax Fees billed by PwC for professional services rendered for tax compliance, tax advice, and tax planning for the fund is shown in the table below.
Fund | 2004A | 2003A, B |
Mid Cap Portfolio | $2,100 | $1,900 |
A | Aggregate amounts may reflect rounding. |
B | Includes amounts related to non-audit services prior to May 6, 2003 that would have been subject to pre-approval if the SEC rules relating to the pre-approval of non-audit services had been in effect at that time. |
In each of the fiscal years ended December 31, 2004 and December 31, 2003, the aggregate Tax Fees billed by PwC and Deloitte Entities that were required to be approved by the Audit Committee for professional services rendered on behalf of the Fund Service Providers for tax compliance, tax advice, and tax planning that relate directly to the operations and financial reporting of each fund is shown in the table below.
Billed By | 2004A | 2003A, B |
PwC | $0 | $0 |
Deloitte Entities | $0 | $0 |
A | Aggregate amounts may reflect rounding. |
B | Includes amounts related to non-audit services prior to May 6, 2003 that would have been subject to pre-approval if the SEC rules relating to the pre-approval of non-audit services had been in effect at that time. |
Fees included in the Tax Fees category comprise all services performed by professional staff in the independent registered public accounting firm's tax division except those services related to the audit. Typically, this category would include fees for tax compliance, tax planning, and tax advice. Tax compliance, tax advice, and tax planning services include preparation of original and amended tax returns, claims for refund and tax payment-planning services, assistance with tax audits and appeals, tax advice related to mergers and acquisitions and requests for rulings or technical advice from taxing authorities.
(d) All Other Fees.
In each of the fiscal years ended December 31, 2004 and December 31, 2003, the aggregate Other Fees billed by Deloitte Entities for all other non-audit services rendered to the funds is shown in the table below.
Fund | 2004A | 2003A, B |
Aggressive Growth Portfolio | $0 | $0 |
Balanced Portfolio | $0 | $0 |
Dynamic Capital Appreciation Portfolio | $0 | $0 |
Growth & Income Portfolio | $0 | $0 |
Growth Opportunities Portfolio | $0 | $0 |
Value Strategies Portfolio | $0 | $0 |
A | Aggregate amounts may reflect rounding. |
B | Includes amounts related to non-audit services prior to May 6, 2003 that would have been subject to pre-approval if the SEC rules relating to the pre-approval of non-audit services had been in effect at that time. |
In each of the fiscal years ended December 31, 2004 and December 31, 2003, the aggregate Other Fees billed by PwC for all other non-audit services rendered to the fund is shown in the table below.
Fund | 2004A | 2003A, B |
Mid Cap Portfolio | $3,600 | $2,500 |
A | Aggregate amounts may reflect rounding. |
B | Includes amounts related to non-audit services prior to May 6, 2003 that would have been subject to pre-approval if the SEC rules relating to the pre-approval of non-audit services had been in effect at that time. |
In each of the fiscal years ended December 31, 2004 and December 31, 2003, the aggregate Other Fees billed by PwC and Deloitte Entities that were required to be approved by the Audit Committee for all other non-audit services rendered on behalf of the Fund Service Providers that relate directly to the operations and financial reporting of each fund is shown in the table below.
Billed By | 2004A | 2003A, B |
PwC | $490,000 | $190,000 |
Deloitte Entities | $850,000 | $150,000 |
A | Aggregate amounts may reflect rounding. |
B | Includes amounts related to non-audit services prior to May 6, 2003 that would have been subject to pre-approval if the SEC rules relating to the pre-approval of non-audit services had been in effect at that time. |
Fees included in the All Other Fees category include services related to internal control reviews, strategy and other consulting, financial information systems design and implementation, consulting on other information systems, and other tax services unrelated to the fund.
(e) (1) | Audit Committee Pre-Approval Policies and Procedures: |
The trust's Audit Committee must pre-approve all audit and non-audit services provided by the independent registered public accounting firm relating to the operations or financial reporting of the funds. Prior to the commencement of any audit or non-audit services to a fund, the Audit Committee reviews the services to determine whether they are appropriate and permissible under applicable law.
The trust's Audit Committee has adopted policies and procedures to, among other purposes, provide a framework for the Committee's consideration of non-audit services by the audit firms that audit the Fidelity funds. The policies and procedures require that any non-audit service provided by a fund audit firm to a Fidelity Fund and any non-audit service provided by a fund auditor to a Fund Service Provider that relates directly to the operations and financial reporting of a Fidelity fund (Covered Service) are subject to approval by the Audit Committee before such service is provided. Non-audit services provided by a fund audit firm for a Fund Service Provider that do not relate directly to the operations and financial reporting of a Fidelity fund (Non-Covered Service) but that are expected to exceed $50,000 are also subject to pre-approval by the Audit Committee.
All Covered Services, as well as Non-Covered Services that are expected to exceed $50,000, must be approved in advance of provision of the service either: (i) by formal resolution of the Audit Committee, or (ii) by oral or written approval of the service by the Chair of the Audit Committee (or if the Chair is unavailable, such other member of the Audit Committee as may be designated by the Chair to act in the Chair's absence). The approval contemplated by (ii) above is permitted where the Treasurer determines that action on such an engagement is necessary before the next meeting of the Audit Committee. Neither pre-approval nor advance notice of Non-Covered Service engagements for which fees are not expected to exceed $50,000 is required; such engagements are to be reported to the Audit Committee monthly.
(e) (2) | Services approved pursuant to paragraph (c)(7)(i)(C) of Rule 2-01 of Regulation S-X: |
Audit-Related Fees:
There were no amounts, including amounts related to non-audit services prior to May 6, 2003 that would have been subject to pre-approval if the SEC rules relating to the pre-approval of non-audit services had been in effect at that time, that were approved by the Audit Committee pursuant to the de minimis exception for the fiscal years ended December 31, 2004 and December 31, 2003 on behalf of each fund.
There were no amounts, including amounts related to non-audit services prior to May 6, 2003 that would have been subject to pre-approval if the SEC rules relating to the pre-approval of non-audit services had been in effect at that time, that were required to be approved by the Audit Committee pursuant to the de minimis exception for the fiscal years ended December 31, 2004 and December 31, 2003 on behalf of the Fund Service Providers that relate directly to the operations and financial reporting of each fund.
Tax Fees:
There were no amounts, including amounts related to non-audit services prior to May 6, 2003 that would have been subject to pre-approval if the SEC rules relating to the pre-approval of non-audit services had been in effect at that time, that were approved by the Audit Committee pursuant to the de minimis exception for the fiscal years ended December 31, 2004 and December 31, 2003 on behalf of each fund.
There were no amounts, including amounts related to non-audit services prior to May 6, 2003 that would have been subject to pre-approval if the SEC rules relating to the pre-approval of non-audit services had been in effect at that time, that were required to be approved by the Audit Committee pursuant to the de minimis exception for the fiscal years ended December 31, 2004 and December 31, 2003 on behalf of the Fund Service Providers that relate directly to the operations and financial reporting of each fund.
All Other Fees:
There were no amounts, including amounts related to non-audit services prior to May 6, 2003 that would have been subject to pre-approval if the SEC rules relating to the pre-approval of non-audit services had been in effect at that time, that were approved by the Audit Committee pursuant to the de minimis exception for the fiscal years ended December 31, 2004 and December 31, 2003 on behalf of each fund.
There were no amounts, including amounts related to non-audit services prior to May 6, 2003 that would have been subject to pre-approval if the SEC rules relating to the pre-approval of non-audit services had been in effect at that time, that were required to be approved by the Audit Committee pursuant to the de minimis exception for the fiscal years ended December 31, 2004 and December 31, 2003 on behalf of the Fund Service Providers that relate directly to the operations and financial reporting of each fund.
(f) According to Deloitte Entities for the fiscal year ended December 31, 2004, the percentage of hours spent on the audit of each fund's financial statements for the most recent fiscal year that were attributed to work performed by persons who are not full-time, permanent employees of Deloitte Entities is as follows:
Fund | 2004 |
Aggressive Growth Portfolio | 0% |
Balanced Portfolio | 0% |
Dynamic Capital Appreciation Portfolio | 0% |
Growth & Income Portfolio | 0% |
Growth Opportunities Portfolio | 0% |
Value Strategies Portfolio | 0% |
According to PwC for the fiscal year ended December 31, 2004, the percentage of hours spent on the audit of the fund's financial statements for the most recent fiscal year that were attributed to work performed by persons who are not full-time, permanent employees of PwC is as follows:
Fund | 2004 |
Mid Cap Portfolio | 0% |
(g) For the fiscal years ended December 31, 2004 and December 31, 2003, the aggregate fees billed by PwC of $2,650,000A and $1,900,000A,B for non-audit services rendered on behalf of the funds, FMR (not including any sub-adviser whose role is primarily portfolio management and is subcontracted with or overseen by another investment adviser) and Fund Service Providers relating to Covered Services and Non-Covered Services are shown in the table below.
| 2004A | 2003A,B |
Covered Services | $500,000 | $250,000 |
Non-Covered Services | $2,150,000 | $1,650,000 |
A | Aggregate amounts may reflect rounding. |
B | Includes amounts related to non-audit services prior to May 6, 2003 that would have been subject to pre-approval if the SEC rules relating to the pre-approval of non-audit services had been in effect at that time. |
For the fiscal years ended December 31, 2004 and December 31, 2003, the aggregate fees billed by Deloitte Entities of $1,400,000A and $1,400,000A, B for non-audit services rendered on behalf of the fund, FMR (not including any sub-adviser whose role is primarily portfolio management and is subcontracted with or overseen by another investment adviser) and Fund Service Providers relating to Covered Services and Non-Covered Services are shown in the table below.
| 2004A | 2003A, B |
Covered Services | $900,000 | $200,000 |
Non-Covered Services | $500,000 | $1,200,000 |
A | Aggregate amounts may reflect rounding. |
B | Includes amounts related to non-audit services prior to May 6, 2003 that would have been subject to pre-approval if the SEC rules relating to the pre-approval of non-audit services had been in effect at that time. |
(h) The trust's Audit Committee has considered Non-Covered Services that were not pre-approved that were provided by PwC and Deloitte Entities to Fund Service Providers to be compatible with maintaining the independence of PwC and Deloitte Entities in their audit of the funds, taking into account representations from PwC and Deloitte Entities, in accordance with Independence Standards Board Standard No.1, regarding their independence from the funds and their related entities.
Item 5. Audit Committee of Listed Registrants
Not applicable.
Item 6. Schedule of Investments
Not applicable.
Item 7. Disclosure of Proxy Voting Policies and Procedures for Closed-End Management Investment Companies
Not applicable.
Item 8. Portfolio Managers of Closed-End Management Investment Companies
Not applicable.
Item 9. Purchase of Equity Securities by Closed-End Management Investment Company and Affiliated Purchasers
Not applicable.
Item 10. Submission of Matters to a Vote of Security Holders
There were no material changes to the procedures by which shareholders may recommend nominees to the trust's Board of Trustees.
Item 11. Controls and Procedures
(a)(i) The President and Treasurer and the Chief Financial Officer have concluded that the trust's disclosure controls and procedures (as defined in Rule 30a-3(c) under the Investment Company Act) provide reasonable assurances that material information relating to the trust is made known to them by the appropriate persons, based on their evaluation of these controls and procedures as of a date within 90 days of the filing date of this report.
(a)(ii) There was no change in the trust's internal control over financial reporting (as defined in Rule 30a-3(d) under the Investment Company Act) that occurred during the second fiscal quarter of the period covered by this report that has materially affected, or is reasonably likely to materially affect, the trust's internal control over financial reporting.
Item 12. Exhibits
(a) | (1) | Code of Ethics pursuant to Item 2 of Form N-CSR is filed and attached hereto as EX-99.CODE ETH. |
(a) | (2) | Certification pursuant to Rule 30a-2(a) under the Investment Company Act of 1940 (17 CFR 270.30a-2(a)) is filed and attached hereto as Exhibit 99.CERT. |
(a) | (3) | Not applicable. |
(b) | | Certification pursuant to Rule 30a-2(b) under the Investment Company Act of 1940 (17 CFR 270.30a-2(b)) is furnished and attached hereto as Exhibit 99.906CERT. |
SIGNATURES
Pursuant to the requirements of the Securities Exchange Act of 1934 and the Investment Company Act of 1940, the registrant has duly caused this report to be signed on its behalf by the undersigned, thereunto duly authorized.
Variable Insurance Products Fund III
By: | /s/Christine Reynolds |
| Christine Reynolds |
| President and Treasurer |
| |
Date: | February 22, 2005 |
Pursuant to the requirements of the Securities Exchange Act of 1934 and the Investment Company Act of 1940, this report has been signed below by the following persons on behalf of the registrant and in the capacities and on the dates indicated.
By: | /s/Christine Reynolds |
| Christine Reynolds |
| President and Treasurer |
| |
Date: | February 22, 2005 |
By: | /s/Timothy F. Hayes |
| Timothy F. Hayes |
| Chief Financial Officer |
| |
Date: | February 22, 2005 |