UNITED STATES
SECURITIES AND EXCHANGE COMMISSION
Washington, D.C. 20549
FORM N-CSR
CERTIFIED SHAREHOLDER REPORT OF REGISTERED
MANAGEMENT INVESTMENT COMPANIES
Investment Company Act file number 811-07205
Variable Insurance Products Fund III
(Exact name of registrant as specified in charter)
245 Summer St., Boston, MA 02210
(Address of principal executive offices) (Zip code)
Margaret Carey, Secretary
245 Summer St.
Boston, Massachusetts 02210
(Name and address of agent for service)
Registrant's telephone number, including area code:
617-563-7000
| |
Date of fiscal year end: | December 31 |
|
|
Date of reporting period: | June 30, 2023 |
Item 1.
Reports to Stockholders
Fidelity® Variable Insurance Products:
VIP Growth & Income Portfolio
Semi-Annual Report
June 30, 2023
Contents
To view a fund's proxy voting guidelines and proxy voting record for the 12-month period ended June 30, visit http://www.fidelity.com/proxyvotingresults or visit the Securities and Exchange Commission's (SEC) web site at http://www.sec.gov.
You may also call 1-877-208-0098 to request a free copy of the proxy voting guidelines.
Fidelity® Variable Insurance Products are separate account options which are purchased through a variable insurance contract.
Standard & Poor's, S&P and S&P 500 are registered service marks of The McGraw-Hill Companies, Inc. and have been licensed for use by Fidelity Distributors Corporation.
Other third-party marks appearing herein are the property of their respective owners.
All other marks appearing herein are registered or unregistered trademarks or service marks of FMR LLC or an affiliated company. © 2023 FMR LLC. All rights reserved.
This report and the financial statements contained herein are submitted for the general information of the shareholders of the Fund. This report is not authorized for distribution to prospective investors in the Fund unless preceded or accompanied by an effective prospectus.
A fund files its complete schedule of portfolio holdings with the SEC for the first and third quarters of each fiscal year on Form N-PORT. Forms N-PORT are available on the SEC's web site at http://www.sec.gov. A fund's Forms N-PORT may be reviewed and copied at the SEC's Public Reference Room in Washington, DC. Information regarding the operation of the SEC's Public Reference Room may be obtained by calling 1-800-SEC-0330.
For a complete list of a fund's portfolio holdings, view the most recent holdings listing, semiannual report, or annual report on Fidelity's web site at http://www.fidelity.com, http://www.institutional.fidelity.com, or http://www.401k.com, as applicable.
NOT FDIC INSURED •MAY LOSE VALUE •NO BANK GUARANTEE
Neither the Fund nor Fidelity Distributors Corporation is a bank.
Top Holdings (% of Fund's net assets) |
| |
| Microsoft Corp. | 7.9 | |
| Exxon Mobil Corp. | 7.2 | |
| Wells Fargo & Co. | 5.5 | |
| General Electric Co. | 4.5 | |
| Apple, Inc.* | 3.6 | |
| Bank of America Corp. | 2.4 | |
| Comcast Corp. Class A | 2.0 | |
| Visa, Inc. Class A | 2.0 | |
| UnitedHealth Group, Inc. | 1.9 | |
| Hess Corp. | 1.6 | |
| | 38.6 | |
| |
* Security or a portion of the security is pledged as collateral for options written.
| Market Sectors (% of Fund's net assets) |
| |
| Information Technology | 18.6 | |
| Financials | 17.8 | |
| Industrials | 17.4 | |
| Health Care | 13.3 | |
| Energy | 10.7 | |
| Consumer Staples | 5.8 | |
| Communication Services | 4.8 | |
| Consumer Discretionary | 3.4 | |
| Materials | 3.1 | |
| Utilities | 1.6 | |
| Real Estate | 1.3 | |
| |
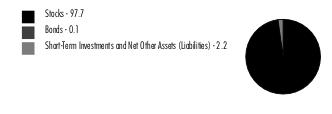
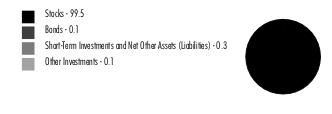
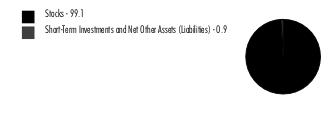
Asset Allocation (% of Fund's net assets) |
|
|
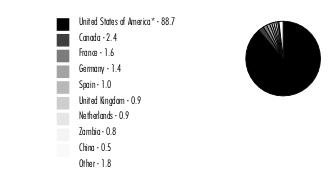
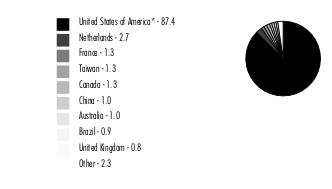
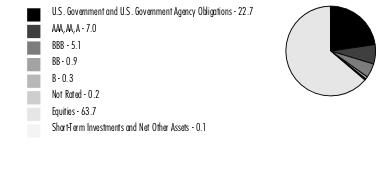
Geographic Diversification (% of Fund's net assets) |
|
* Includes Short-Term investments and Net Other Assets (Liabilities). Percentages are adjusted for the effect of derivatives, if applicable. |
| |
Showing Percentage of Net Assets
| Common Stocks - 97.7% |
| | | Shares | Value ($) |
| COMMUNICATION SERVICES - 4.7% | | | |
| Diversified Telecommunication Services - 0.7% | | | |
| Cellnex Telecom SA (a) | | 177,600 | 7,168,555 |
| Elisa Corp. (A Shares) | | 29,400 | 1,570,058 |
| Verizon Communications, Inc. | | 185,480 | 6,898,001 |
| | | | 15,636,614 |
| Entertainment - 1.3% | | | |
| Activision Blizzard, Inc. | | 33,600 | 2,832,480 |
| The Walt Disney Co. (b) | | 114,700 | 10,240,416 |
| Universal Music Group NV | | 470,500 | 10,447,885 |
| Warner Music Group Corp. Class A | | 110,400 | 2,880,336 |
| | | | 26,401,117 |
| Media - 2.7% | | | |
| Comcast Corp. Class A | | 997,062 | 41,427,926 |
| Interpublic Group of Companies, Inc. (c) | | 383,500 | 14,795,430 |
| | | | 56,223,356 |
TOTAL COMMUNICATION SERVICES | | | 98,261,087 |
| CONSUMER DISCRETIONARY - 3.4% | | | |
| Automobile Components - 0.4% | | | |
| BorgWarner, Inc. | | 153,180 | 7,492,034 |
| Hotels, Restaurants & Leisure - 1.6% | | | |
| Amadeus IT Holding SA Class A | | 145,700 | 11,081,452 |
| Churchill Downs, Inc. | | 55,600 | 7,737,852 |
| Domino's Pizza, Inc. | | 13,100 | 4,414,569 |
| Marriott International, Inc. Class A | | 28,800 | 5,290,272 |
| Starbucks Corp. | | 43,500 | 4,309,110 |
| | | | 32,833,255 |
| Household Durables - 0.2% | | | |
| Sony Group Corp. sponsored ADR | | 31,400 | 2,827,256 |
| Whirlpool Corp. | | 8,100 | 1,205,199 |
| | | | 4,032,455 |
| Specialty Retail - 0.9% | | | |
| Lowe's Companies, Inc. | | 83,517 | 18,849,787 |
| TJX Companies, Inc. | | 6,200 | 525,698 |
| Williams-Sonoma, Inc. | | 2,900 | 362,906 |
| | | | 19,738,391 |
| Textiles, Apparel & Luxury Goods - 0.3% | | | |
| NIKE, Inc. Class B | | 24,900 | 2,748,213 |
| Puma AG | | 39,602 | 2,386,423 |
| Tapestry, Inc. | | 900 | 38,520 |
| Wolverine World Wide, Inc. | | 47,700 | 700,713 |
| | | | 5,873,869 |
TOTAL CONSUMER DISCRETIONARY | | | 69,970,004 |
| CONSUMER STAPLES - 5.8% | | | |
| Beverages - 2.4% | | | |
| Diageo PLC sponsored ADR (d) | | 55,600 | 9,645,488 |
| Keurig Dr. Pepper, Inc. | | 417,100 | 13,042,717 |
| Pernod Ricard SA | | 16,000 | 3,533,742 |
| Remy Cointreau SA | | 9,428 | 1,511,797 |
| The Coca-Cola Co. | | 351,053 | 21,140,412 |
| | | | 48,874,156 |
| Consumer Staples Distribution & Retail - 1.4% | | | |
| Alimentation Couche-Tard, Inc. Class A (multi-vtg.) | | 11,500 | 589,692 |
| Sysco Corp. | | 180,200 | 13,370,840 |
| Target Corp. | | 41,900 | 5,526,610 |
| Walmart, Inc. | | 66,700 | 10,483,906 |
| | | | 29,971,048 |
| Household Products - 0.2% | | | |
| Colgate-Palmolive Co. | | 16,100 | 1,240,344 |
| Kimberly-Clark Corp. | | 3,200 | 441,792 |
| Procter & Gamble Co. | | 20,200 | 3,065,148 |
| | | | 4,747,284 |
| Personal Care Products - 0.8% | | | |
| Estee Lauder Companies, Inc. Class A | | 19,400 | 3,809,772 |
| Haleon PLC ADR | | 945,794 | 7,925,754 |
| Kenvue, Inc. | | 195,500 | 5,165,110 |
| | | | 16,900,636 |
| Tobacco - 1.0% | | | |
| Altria Group, Inc. | | 401,785 | 18,200,861 |
| Philip Morris International, Inc. | | 28,500 | 2,782,170 |
| | | | 20,983,031 |
TOTAL CONSUMER STAPLES | | | 121,476,155 |
| ENERGY - 10.7% | | | |
| Energy Equipment & Services - 0.0% | | | |
| Baker Hughes Co. Class A | | 15,100 | 477,311 |
| Oil, Gas & Consumable Fuels - 10.7% | | | |
| Canadian Natural Resources Ltd. | | 48,200 | 2,709,897 |
| Cenovus Energy, Inc. (Canada) | | 820,404 | 13,934,018 |
| Energy Transfer LP | | 97,600 | 1,239,520 |
| Enterprise Products Partners LP | | 48,600 | 1,280,610 |
| Exxon Mobil Corp. | | 1,395,600 | 149,678,100 |
| Hess Corp. | | 249,500 | 33,919,525 |
| Imperial Oil Ltd. | | 278,400 | 14,244,161 |
| Kosmos Energy Ltd. (b) | | 838,630 | 5,023,394 |
| | | | 222,029,225 |
TOTAL ENERGY | | | 222,506,536 |
| FINANCIALS - 17.8% | | | |
| Banks - 11.2% | | | |
| Bank of America Corp. | | 1,711,712 | 49,109,017 |
| JPMorgan Chase & Co. | | 143,532 | 20,875,294 |
| M&T Bank Corp. | | 45,500 | 5,631,080 |
| PNC Financial Services Group, Inc. | | 146,472 | 18,448,148 |
| Truist Financial Corp. | | 395,304 | 11,997,476 |
| U.S. Bancorp | | 325,998 | 10,770,974 |
| Wells Fargo & Co. | | 2,694,379 | 114,996,096 |
| | | | 231,828,085 |
| Capital Markets - 2.3% | | | |
| Brookfield Asset Management Ltd. Class A | | 18,973 | 619,089 |
| Brookfield Corp. Class A | | 81,145 | 2,730,529 |
| Charles Schwab Corp. | | 7,000 | 396,760 |
| CME Group, Inc. | | 1,100 | 203,819 |
| Intercontinental Exchange, Inc. | | 3,200 | 361,856 |
| KKR & Co. LP | | 138,493 | 7,755,608 |
| Morgan Stanley | | 82,283 | 7,026,968 |
| Northern Trust Corp. | | 217,845 | 16,151,028 |
| Raymond James Financial, Inc. | | 96,550 | 10,018,994 |
| S&P Global, Inc. | | 300 | 120,267 |
| State Street Corp. | | 22,279 | 1,630,377 |
| | | | 47,015,295 |
| Financial Services - 3.3% | | | |
| Edenred SA | | 156,600 | 10,481,897 |
| Essent Group Ltd. | | 52,100 | 2,438,280 |
| Fidelity National Information Services, Inc. | | 120,000 | 6,564,000 |
| Global Payments, Inc. | | 31,100 | 3,063,972 |
| MasterCard, Inc. Class A | | 15,200 | 5,978,160 |
| Visa, Inc. Class A | | 172,276 | 40,912,104 |
| | | | 69,438,413 |
| Insurance - 1.0% | | | |
| American Financial Group, Inc. | | 10,500 | 1,246,875 |
| Arthur J. Gallagher & Co. | | 7,700 | 1,690,689 |
| Brookfield Asset Management Reinsurance Partners Ltd. | | 548 | 18,555 |
| Chubb Ltd. | | 28,400 | 5,468,704 |
| Marsh & McLennan Companies, Inc. | | 40,542 | 7,625,139 |
| Old Republic International Corp. | | 55,000 | 1,384,350 |
| The Travelers Companies, Inc. | | 18,600 | 3,230,076 |
| | | | 20,664,388 |
TOTAL FINANCIALS | | | 368,946,181 |
| HEALTH CARE - 13.3% | | | |
| Health Care Equipment & Supplies - 2.4% | | | |
| Abbott Laboratories | | 19,300 | 2,104,086 |
| Becton, Dickinson & Co. | | 33,515 | 8,848,295 |
| Boston Scientific Corp. (b) | | 372,463 | 20,146,524 |
| GE Healthcare Holding LLC | | 137,277 | 11,152,383 |
| Koninklijke Philips Electronics NV (depository receipt) (NY Reg.) (d) | | 245,419 | 5,323,138 |
| Sonova Holding AG | | 6,040 | 1,607,428 |
| | | | 49,181,854 |
| Health Care Providers & Services - 5.8% | | | |
| Cardinal Health, Inc. (c) | | 141,900 | 13,419,483 |
| Cigna Group | | 91,190 | 25,587,914 |
| CVS Health Corp. | | 186,264 | 12,876,430 |
| Humana, Inc. | | 9,300 | 4,158,309 |
| McKesson Corp. (c) | | 58,388 | 24,949,776 |
| UnitedHealth Group, Inc. | | 79,700 | 38,307,008 |
| | | | 119,298,920 |
| Life Sciences Tools & Services - 0.5% | | | |
| Danaher Corp. | | 46,700 | 11,208,000 |
| Pharmaceuticals - 4.6% | | | |
| Bristol-Myers Squibb Co. | | 499,100 | 31,917,445 |
| Eli Lilly & Co. | | 32,800 | 15,382,544 |
| GSK PLC sponsored ADR | | 404,235 | 14,406,935 |
| Johnson & Johnson | | 154,459 | 25,566,054 |
| Sanofi SA sponsored ADR | | 51,200 | 2,759,680 |
| UCB SA | | 62,300 | 5,520,119 |
| Viatris, Inc. | | 22,500 | 224,550 |
| Zoetis, Inc. Class A | | 3,500 | 602,735 |
| | | | 96,380,062 |
TOTAL HEALTH CARE | | | 276,068,836 |
| INDUSTRIALS - 17.4% | | | |
| Aerospace & Defense - 3.6% | | | |
| Airbus Group NV | | 91,000 | 13,156,939 |
| General Dynamics Corp. | | 34,700 | 7,465,705 |
| Huntington Ingalls Industries, Inc. | | 26,800 | 6,099,680 |
| MTU Aero Engines AG | | 13,000 | 3,367,661 |
| Raytheon Technologies Corp. | | 46,587 | 4,563,663 |
| Safran SA | | 33,100 | 5,187,092 |
| Textron, Inc. | | 30,400 | 2,055,952 |
| The Boeing Co. (b) | | 159,310 | 33,639,900 |
| | | | 75,536,592 |
| Air Freight & Logistics - 1.8% | | | |
| DSV A/S | | 12,300 | 2,583,117 |
| Expeditors International of Washington, Inc. | | 2,095 | 253,767 |
| FedEx Corp. | | 28,000 | 6,941,200 |
| United Parcel Service, Inc. Class B | | 157,172 | 28,173,081 |
| | | | 37,951,165 |
| Building Products - 0.5% | | | |
| A.O. Smith Corp. | | 43,600 | 3,173,208 |
| Johnson Controls International PLC | | 99,000 | 6,745,860 |
| | | | 9,919,068 |
| Commercial Services & Supplies - 0.7% | | | |
| GFL Environmental, Inc. | | 352,900 | 13,703,096 |
| RB Global, Inc. | | 4,000 | 240,045 |
| | | | 13,943,141 |
| Electrical Equipment - 1.2% | | | |
| Acuity Brands, Inc. | | 35,500 | 5,789,340 |
| AMETEK, Inc. | | 7,300 | 1,181,724 |
| Hubbell, Inc. Class B | | 31,079 | 10,304,553 |
| Regal Rexnord Corp. | | 35,200 | 5,417,280 |
| Rockwell Automation, Inc. | | 5,100 | 1,680,195 |
| | | | 24,373,092 |
| Ground Transportation - 0.5% | | | |
| Knight-Swift Transportation Holdings, Inc. Class A | | 181,738 | 10,097,363 |
| Industrial Conglomerates - 4.6% | | | |
| 3M Co. | | 23,700 | 2,372,133 |
| General Electric Co. (c) | | 846,031 | 92,936,505 |
| | | | 95,308,638 |
| Machinery - 2.2% | | | |
| Allison Transmission Holdings, Inc. | | 91,300 | 5,154,798 |
| Caterpillar, Inc. | | 9,800 | 2,411,290 |
| Cummins, Inc. | | 14,000 | 3,432,240 |
| Donaldson Co., Inc. | | 155,200 | 9,701,552 |
| Epiroc AB (A Shares) | | 8,400 | 159,112 |
| Flowserve Corp. | | 85,300 | 3,168,895 |
| Fortive Corp. | | 70,400 | 5,263,808 |
| Kardex AG | | 1,700 | 380,817 |
| Nordson Corp. | | 34,600 | 8,587,028 |
| Otis Worldwide Corp. | | 22,643 | 2,015,453 |
| Stanley Black & Decker, Inc. (d) | | 24,700 | 2,314,637 |
| Westinghouse Air Brake Tech Co. | | 30,221 | 3,314,337 |
| | | | 45,903,967 |
| Passenger Airlines - 0.0% | | | |
| Copa Holdings SA Class A | | 7,200 | 796,176 |
| Professional Services - 0.9% | | | |
| Equifax, Inc. | | 21,300 | 5,011,890 |
| Genpact Ltd. | | 147,700 | 5,549,089 |
| Paycom Software, Inc. | | 3,500 | 1,124,340 |
| RELX PLC (London Stock Exchange) | | 220,320 | 7,350,035 |
| Robert Half International, Inc. | | 2,600 | 195,572 |
| TransUnion Holding Co., Inc. | | 5,500 | 430,815 |
| | | | 19,661,741 |
| Trading Companies & Distributors - 1.2% | | | |
| Brenntag SE | | 19,000 | 1,480,322 |
| Fastenal Co. | | 32,300 | 1,905,377 |
| MSC Industrial Direct Co., Inc. Class A | | 4,400 | 419,232 |
| Watsco, Inc. (d) | | 49,092 | 18,727,125 |
| WESCO International, Inc. | | 11,600 | 2,077,096 |
| | | | 24,609,152 |
| Transportation Infrastructure - 0.2% | | | |
| Aena SME SA (a) | | 19,700 | 3,181,503 |
TOTAL INDUSTRIALS | | | 361,281,598 |
| INFORMATION TECHNOLOGY - 18.6% | | | |
| Electronic Equipment, Instruments & Components - 0.2% | | | |
| CDW Corp. | | 27,700 | 5,082,950 |
| IT Services - 0.5% | | | |
| Amdocs Ltd. | | 33,200 | 3,281,820 |
| IBM Corp. | | 45,100 | 6,034,831 |
| Unisys Corp. (b) | | 12,538 | 49,901 |
| | | | 9,366,552 |
| Semiconductors & Semiconductor Equipment - 4.3% | | | |
| Analog Devices, Inc. | | 40,900 | 7,967,729 |
| Applied Materials, Inc. | | 45,000 | 6,504,300 |
| BE Semiconductor Industries NV | | 16,700 | 1,809,548 |
| Broadcom, Inc. | | 1,600 | 1,387,888 |
| Lam Research Corp. | | 10,000 | 6,428,600 |
| Marvell Technology, Inc. | | 289,400 | 17,300,332 |
| Microchip Technology, Inc. | | 5,900 | 528,581 |
| NVIDIA Corp. | | 29,500 | 12,479,090 |
| NXP Semiconductors NV | | 52,000 | 10,643,360 |
| Qualcomm, Inc. (c) | | 136,461 | 16,244,317 |
| Taiwan Semiconductor Manufacturing Co. Ltd. sponsored ADR | | 61,300 | 6,186,396 |
| Teradyne, Inc. | | 19,800 | 2,204,334 |
| | | | 89,684,475 |
| Software - 9.8% | | | |
| Intuit, Inc. | | 33,100 | 15,166,089 |
| Microsoft Corp. | | 484,918 | 165,133,979 |
| Open Text Corp. | | 42,600 | 1,771,851 |
| Sage Group PLC | | 91,600 | 1,075,838 |
| SAP SE sponsored ADR (d) | | 144,800 | 19,810,088 |
| | | | 202,957,845 |
| Technology Hardware, Storage & Peripherals - 3.8% | | | |
| Apple, Inc. (c) | | 387,112 | 75,088,115 |
| FUJIFILM Holdings Corp. | | 16,300 | 971,206 |
| Samsung Electronics Co. Ltd. | | 41,980 | 2,311,697 |
| | | | 78,371,018 |
TOTAL INFORMATION TECHNOLOGY | | | 385,462,840 |
| MATERIALS - 3.1% | | | |
| Chemicals - 0.9% | | | |
| DuPont de Nemours, Inc. | | 151,000 | 10,787,440 |
| International Flavors & Fragrances, Inc. | | 8,900 | 708,351 |
| LyondellBasell Industries NV Class A | | 41,500 | 3,810,945 |
| PPG Industries, Inc. | | 14,400 | 2,135,520 |
| Sherwin-Williams Co. | | 3,600 | 955,872 |
| | | | 18,398,128 |
| Metals & Mining - 2.2% | | | |
| First Quantum Minerals Ltd. | | 695,700 | 16,458,379 |
| Freeport-McMoRan, Inc. | | 492,300 | 19,692,000 |
| Glencore PLC | | 1,619,900 | 9,184,648 |
| | | | 45,335,027 |
| Paper & Forest Products - 0.0% | | | |
| Louisiana-Pacific Corp. | | 7,100 | 532,358 |
TOTAL MATERIALS | | | 64,265,513 |
| REAL ESTATE - 1.3% | | | |
| Equity Real Estate Investment Trusts (REITs) - 1.3% | | | |
| American Tower Corp. | | 53,100 | 10,298,214 |
| Crown Castle International Corp. | | 44,300 | 5,047,542 |
| Equinix, Inc. | | 200 | 156,788 |
| Public Storage | | 700 | 204,316 |
| Simon Property Group, Inc. | | 101,800 | 11,755,864 |
| | | | 27,462,724 |
| UTILITIES - 1.6% | | | |
| Electric Utilities - 1.5% | | | |
| Constellation Energy Corp. | | 12,333 | 1,129,086 |
| Duke Energy Corp. | | 30,000 | 2,692,200 |
| Entergy Corp. | | 32,900 | 3,203,473 |
| Exelon Corp. | | 37,000 | 1,507,380 |
| PG&E Corp. (b) | | 226,200 | 3,908,736 |
| Southern Co. | | 267,400 | 18,784,850 |
| | | | 31,225,725 |
| Multi-Utilities - 0.1% | | | |
| Sempra Energy | | 17,900 | 2,606,061 |
TOTAL UTILITIES | | | 33,831,786 |
| TOTAL COMMON STOCKS (Cost $1,257,330,007) | | | 2,029,533,260 |
| | | | |
| Convertible Bonds - 0.1% |
| | | Principal Amount (e) | Value ($) |
| COMMUNICATION SERVICES - 0.1% | | | |
| Interactive Media & Services - 0.1% | | | |
Snap, Inc. 0.125% 3/1/28 (Cost $1,629,216) | | 2,241,000 | 1,587,749 |
| | | | |
| Money Market Funds - 4.7% |
| | | Shares | Value ($) |
| Fidelity Cash Central Fund 5.14% (f) | | 49,404,941 | 49,414,822 |
| Fidelity Securities Lending Cash Central Fund 5.14% (f)(g) | | 49,659,427 | 49,664,393 |
| TOTAL MONEY MARKET FUNDS (Cost $99,079,215) | | | 99,079,215 |
| | | | |
| TOTAL INVESTMENT IN SECURITIES - 102.5% (Cost $1,358,038,438) | 2,130,200,224 |
NET OTHER ASSETS (LIABILITIES) - (2.5)% | (52,666,242) |
| NET ASSETS - 100.0% | 2,077,533,982 |
| | |
| Written Options |
| | Counterparty | Number of Contracts | Notional Amount ($) | Exercise Price ($) | Expiration Date | Value ($) |
| Call Options | | | | | | |
| Apple, Inc. | Chicago Board Options Exchange | 389 | 7,545,433 | 195.00 | 08/18/23 | (214,923) |
| Cardinal Health, Inc. | Chicago Board Options Exchange | 207 | 1,957,599 | 90.00 | 07/21/23 | (104,535) |
| Cardinal Health, Inc. | Chicago Board Options Exchange | 140 | 1,323,980 | 100.00 | 09/15/23 | (23,450) |
| General Electric Co. | Chicago Board Options Exchange | 422 | 4,635,670 | 115.00 | 07/21/23 | (24,054) |
| General Electric Co. | Chicago Board Options Exchange | 422 | 4,635,670 | 110.00 | 07/21/23 | (94,528) |
| Interpublic Group of Companies, Inc. | Chicago Board Options Exchange | 781 | 3,013,098 | 42.00 | 07/21/23 | (5,858) |
| McKesson Corp. | Chicago Board Options Exchange | 123 | 5,255,913 | 430.00 | 08/18/23 | (159,285) |
| Qualcomm, Inc. | Chicago Board Options Exchange | 281 | 3,345,024 | 125.00 | 08/18/23 | (95,540) |
| | | | | | | |
| TOTAL WRITTEN OPTIONS | | | | | | (722,173) |
Legend
| (a) | Security exempt from registration under Rule 144A of the Securities Act of 1933. These securities may be resold in transactions exempt from registration, normally to qualified institutional buyers. At the end of the period, the value of these securities amounted to $10,350,058 or 0.5% of net assets. |
| (c) | Security or a portion of the security is pledged as collateral for options written. At period end, the value of securities pledged amounted to $31,712,387. |
| (d) | Security or a portion of the security is on loan at period end. |
| (e) | Amount is stated in United States dollars unless otherwise noted. |
| (f) | Affiliated fund that is generally available only to investment companies and other accounts managed by Fidelity Investments. The rate quoted is the annualized seven-day yield of the fund at period end. A complete unaudited listing of the fund's holdings as of its most recent quarter end is available upon request. In addition, each Fidelity Central Fund's financial statements are available on the SEC's website or upon request. |
| (g) | Investment made with cash collateral received from securities on loan. |
Affiliated Central Funds
Fiscal year to date information regarding the Fund's investments in Fidelity Central Funds, including the ownership percentage, is presented below.
| Affiliate | Value, beginning of period ($) | Purchases ($) | Sales Proceeds ($) | Dividend Income ($) | Realized Gain (loss) ($) | Change in Unrealized appreciation (depreciation) ($) | Value, end of period ($) | % ownership, end of period |
| Fidelity Cash Central Fund 5.14% | 88,164,599 | 91,488,725 | 130,238,502 | 1,676,720 | - | - | 49,414,822 | 0.1% |
| Fidelity Securities Lending Cash Central Fund 5.14% | 29,338,136 | 169,746,500 | 149,420,243 | 64,236 | - | - | 49,664,393 | 0.2% |
| Total | 117,502,735 | 261,235,225 | 279,658,745 | 1,740,956 | - | - | 99,079,215 | |
| | | | | | | | | |
Amounts in the dividend income column in the above table include any capital gain distributions from underlying funds, which are presented in the corresponding line item in the Statement of Operations, if applicable.
Amounts in the dividend income column for Fidelity Securities Lending Cash Central Fund represents the income earned on investing cash collateral, less rebates paid to borrowers and any lending agent fees associated with the loan, plus any premium payments received for lending certain types of securities.
Amounts included in the purchases and sales proceeds columns may include in-kind transactions, if applicable.
Investment Valuation
The following is a summary of the inputs used, as of June 30, 2023, involving the Fund's assets and liabilities carried at fair value. The inputs or methodology used for valuing securities may not be an indication of the risk associated with investing in those securities. For more information on valuation inputs, and their aggregation into the levels used below, please refer to the Investment Valuation section in the accompanying Notes to Financial Statements.
| Valuation Inputs at Reporting Date: |
| Description | Total ($) | Level 1 ($) | Level 2 ($) | Level 3 ($) |
Investments in Securities: | | | | |
|
| Equities: | | | | |
Communication Services | 98,261,087 | 98,261,087 | - | - |
Consumer Discretionary | 69,970,004 | 67,583,581 | 2,386,423 | - |
Consumer Staples | 121,476,155 | 121,476,155 | - | - |
Energy | 222,506,536 | 222,506,536 | - | - |
Financials | 368,946,181 | 368,946,181 | - | - |
Health Care | 276,068,836 | 276,068,836 | - | - |
Industrials | 361,281,598 | 335,428,420 | 25,853,178 | - |
Information Technology | 385,462,840 | 382,179,937 | 3,282,903 | - |
Materials | 64,265,513 | 55,080,865 | 9,184,648 | - |
Real Estate | 27,462,724 | 27,462,724 | - | - |
Utilities | 33,831,786 | 33,831,786 | - | - |
|
| Corporate Bonds | 1,587,749 | - | 1,587,749 | - |
|
| Money Market Funds | 99,079,215 | 99,079,215 | - | - |
| Total Investments in Securities: | 2,130,200,224 | 2,087,905,323 | 42,294,901 | - |
Derivative Instruments: | | | | |
|
| Liabilities | | | | |
Written Options | (722,173) | (722,173) | - | - |
| Total Liabilities | (722,173) | (722,173) | - | - |
| Total Derivative Instruments: | (722,173) | (722,173) | - | - |
Value of Derivative Instruments
The following table is a summary of the Fund's value of derivative instruments by primary risk exposure as of June 30, 2023. For additional information on derivative instruments, please refer to the Derivative Instruments section in the accompanying Notes to Financial Statements.
Primary Risk Exposure / Derivative Type | Value |
| Asset ($) | Liability ($) |
| Equity Risk | | |
Written Options (a) | 0 | (722,173) |
| Total Equity Risk | 0 | (722,173) |
| Total Value of Derivatives | 0 | (722,173) |
(a)Gross value is presented in the Statement of Assets and Liabilities in the written options, at value line-item.
| Statement of Assets and Liabilities |
| | | | June 30, 2023 (Unaudited) |
| | | | | |
| Assets | | | | |
| Investment in securities, at value (including securities loaned of $49,420,165) - See accompanying schedule: | | | | |
Unaffiliated issuers (cost $1,258,959,223) | $ | 2,031,121,009 | | |
Fidelity Central Funds (cost $99,079,215) | | 99,079,215 | | |
| | | | | |
| | | | | |
| Total Investment in Securities (cost $1,358,038,438) | | | $ | 2,130,200,224 |
| Cash | | | | 12,041 |
| Foreign currency held at value (cost $99,504) | | | | 99,504 |
| Receivable for investments sold | | | | 3,814,774 |
| Receivable for fund shares sold | | | | 352,619 |
| Dividends receivable | | | | 2,202,608 |
| Interest receivable | | | | 934 |
| Distributions receivable from Fidelity Central Funds | | | | 242,980 |
| Other receivables | | | | 124 |
Total assets | | | | 2,136,925,808 |
| Liabilities | | | | |
| Payable for investments purchased | $ | 5,963 | | |
| Payable for fund shares redeemed | | 7,816,766 | | |
| Accrued management fee | | 722,093 | | |
| Distribution and service plan fees payable | | 244,656 | | |
| Written options, at value (premium received $487,264) | | 722,173 | | |
| Other affiliated payables | | 178,699 | | |
| Other payables and accrued expenses | | 37,593 | | |
| Collateral on securities loaned | | 49,663,883 | | |
| Total Liabilities | | | | 59,391,826 |
| Net Assets | | | $ | 2,077,533,982 |
| Net Assets consist of: | | | | |
| Paid in capital | | | $ | 1,265,118,124 |
| Total accumulated earnings (loss) | | | | 812,415,858 |
| Net Assets | | | $ | 2,077,533,982 |
| | | | | |
| Net Asset Value and Maximum Offering Price | | | | |
| Initial Class : | | | | |
Net Asset Value , offering price and redemption price per share ($388,022,662 ÷ 14,610,983 shares) | | | $ | 26.56 |
| Service Class : | | | | |
Net Asset Value , offering price and redemption price per share ($124,193,040 ÷ 4,735,702 shares) | | | $ | 26.22 |
| Service Class 2 : | | | | |
Net Asset Value , offering price and redemption price per share ($1,149,766,880 ÷ 44,777,897 shares) | | | $ | 25.68 |
| Investor Class : | | | | |
Net Asset Value , offering price and redemption price per share ($415,551,400 ÷ 15,743,661 shares) | | | $ | 26.39 |
| Statement of Operations |
| | | | Six months ended June 30, 2023 (Unaudited) |
| Investment Income | | | | |
| Dividends | | | $ | 21,189,608 |
| Interest | | | | 55,204 |
| Income from Fidelity Central Funds (including $64,236 from security lending) | | | | 1,740,956 |
| Total Income | | | | 22,985,768 |
| Expenses | | | | |
| Management fee | $ | 4,249,818 | | |
| Transfer agent fees | | 782,461 | | |
| Distribution and service plan fees | | 1,432,961 | | |
| Accounting fees | | 268,388 | | |
| Custodian fees and expenses | | 38,160 | | |
| Independent trustees' fees and expenses | | 6,417 | | |
| Audit | | 35,696 | | |
| Legal | | 6,498 | | |
| Miscellaneous | | 5,393 | | |
| Total expenses before reductions | | 6,825,792 | | |
| Expense reductions | | (45,245) | | |
| Total expenses after reductions | | | | 6,780,547 |
| Net Investment income (loss) | | | | 16,205,221 |
| Realized and Unrealized Gain (Loss) | | | | |
| Net realized gain (loss) on: | | | | |
| Investment Securities: | | | | |
| Unaffiliated issuers | | 27,922,669 | | |
| Foreign currency transactions | | 3,621 | | |
| Written options | | 943,791 | | |
| Total net realized gain (loss) | | | | 28,870,081 |
| Change in net unrealized appreciation (depreciation) on: | | | | |
| Investment Securities: | | | | |
| Unaffiliated issuers | | 161,887,952 | | |
| Assets and liabilities in foreign currencies | | 8,424 | | |
| Written options | | (333,215) | | |
| Total change in net unrealized appreciation (depreciation) | | | | 161,563,161 |
| Net gain (loss) | | | | 190,433,242 |
| Net increase (decrease) in net assets resulting from operations | | | $ | 206,638,463 |
| Statement of Changes in Net Assets |
| |
| | Six months ended June 30, 2023 (Unaudited) | | Year ended December 31, 2022 |
| Increase (Decrease) in Net Assets | | | | |
| Operations | | | | |
| Net investment income (loss) | $ | 16,205,221 | $ | 29,609,689 |
| Net realized gain (loss) | | 28,870,081 | | 45,076,923 |
| Change in net unrealized appreciation (depreciation) | | 161,563,161 | | (181,348,781) |
| Net increase (decrease) in net assets resulting from operations | | 206,638,463 | | (106,662,169) |
| Distributions to shareholders | | (7,264,024) | | (70,058,469) |
| | | | | |
| Share transactions - net increase (decrease) | | (55,094,736) | | 28,157,702 |
| Total increase (decrease) in net assets | | 144,279,703 | | (148,562,936) |
| | | | | |
| Net Assets | | | | |
| Beginning of period | | 1,933,254,279 | | 2,081,817,215 |
| End of period | $ | 2,077,533,982 | $ | 1,933,254,279 |
| | | | | |
| | | | | |
| VIP Growth & Income Portfolio Initial Class |
| |
| | Six months ended (Unaudited) June 30, 2023 | | Years ended December 31, 2022 | | 2021 | | 2020 | | 2019 | | 2018 |
Selected Per-Share Data | | | | | | | | | | | | |
| Net asset value, beginning of period | $ | 24.02 | $ | 26.22 | $ | 22.36 | $ | 22.17 | $ | 19.38 | $ | 22.71 |
| Income from Investment Operations | | | | | | | | | | | | |
Net investment income (loss) A,B | | .23 | | .42 | | .55 C | | .42 | | .46 | | .46 |
| Net realized and unrealized gain (loss) | | 2.40 | | (1.70) | | 5.07 | | 1.23 | | 4.91 | | (2.42) |
| Total from investment operations | | 2.63 | | (1.28) | | 5.62 | | 1.65 | | 5.37 | | (1.96) |
| Distributions from net investment income | | - D | | (.42) | | (.62) | | (.42) | | (.77) E | | (.08) |
| Distributions from net realized gain | | (.09) | | (.50) | | (1.14) | | (1.03) | | (1.81) E | | (1.29) |
| Total distributions | | (.09) | | (.92) | | (1.76) | | (1.46) F | | (2.58) | | (1.37) |
| Net asset value, end of period | $ | 26.56 | $ | 24.02 | $ | 26.22 | $ | 22.36 | $ | 22.17 | $ | 19.38 |
Total Return G,H,I | | 10.96% | | (4.95)% | | 25.95% | | 7.85% | | 30.05% | | (8.98)% |
Ratios to Average Net Assets B,J,K | | | | | | | | | | | | |
| Expenses before reductions | | .52% L | | .52% | | .52% | | .54% | | .54% | | .55% |
| Expenses net of fee waivers, if any | | .52% L | | .52% | | .52% | | .54% | | .54% | | .54% |
| Expenses net of all reductions | | .52% L | | .52% | | .52% | | .53% | | .54% | | .54% |
| Net investment income (loss) | | 1.78% L | | 1.68% | | 2.18% C | | 2.18% | | 2.27% | | 2.08% |
| Supplemental Data | | | | | | | | | | | | |
| Net assets, end of period (000 omitted) | $ | 388,023 | $ | 367,028 | $ | 439,309 | $ | 377,942 | $ | 358,103 | $ | 361,868 |
Portfolio turnover rate M | | 15% L | | 10% | | 15% | | 26% | | 34% | | 41% |
A Calculated based on average shares outstanding during the period.
B Net investment income (loss) is affected by the timing of the declaration of dividends by any underlying mutual funds or exchange-traded funds (ETFs). Net investment income (loss) of any mutual funds or ETFs is not included in the Fund's net investment income (loss) ratio.
C Net investment income per share reflects one or more large, non-recurring dividend(s) which amounted to $.16 per share. Excluding such non-recurring dividend(s), the ratio of net investment income (loss) to average net assets would have been 1.55%.
D Amount represents less than $.005 per share.
E The amount shown reflects reclassifications related to book to tax differences that were made in the year shown.
F Total distributions per share do not sum due to rounding.
G Total returns for periods of less than one year are not annualized.
H Total returns do not reflect charges attributable to your insurance company's separate account. Inclusion of these charges would reduce the total returns shown.
I Total returns would have been lower if certain expenses had not been reduced during the applicable periods shown.
J Fees and expenses of any underlying mutual funds or exchange-traded funds (ETFs) are not included in the Fund's expense ratio. The Fund indirectly bears its proportionate share of these expenses. For additional expense information related to investments in Fidelity Central Funds, please refer to the "Investments in Fidelity Central Funds" note found in the Notes to Financial Statements section of the most recent Annual or Semi-Annual report.
K Expense ratios reflect operating expenses of the class. Expenses before reductions do not reflect amounts reimbursed, waived, or reduced through arrangements with the investment adviser, brokerage services, or other offset arrangements, if applicable, and do not represent the amount paid by the class during periods when reimbursements, waivers or reductions occur.
L Annualized.
M Amount does not include the portfolio activity of any underlying mutual funds or exchange-traded funds (ETFs).
| VIP Growth & Income Portfolio Service Class |
| |
| | Six months ended (Unaudited) June 30, 2023 | | Years ended December 31, 2022 | | 2021 | | 2020 | | 2019 | | 2018 |
Selected Per-Share Data | | | | | | | | | | | | |
| Net asset value, beginning of period | $ | 23.73 | $ | 25.91 | $ | 22.12 | $ | 21.95 | $ | 19.21 | $ | 22.52 |
| Income from Investment Operations | | | | | | | | | | | | |
Net investment income (loss) A,B | | .21 | | .39 | | .52 C | | .40 | | .44 | | .43 |
| Net realized and unrealized gain (loss) | | 2.37 | | (1.67) | | 5.00 | | 1.21 | | 4.87 | | (2.39) |
| Total from investment operations | | 2.58 | | (1.28) | | 5.52 | | 1.61 | | 5.31 | | (1.96) |
| Distributions from net investment income | | - D | | (.40) | | (.59) | | (.40) | | (.75) E | | (.06) |
| Distributions from net realized gain | | (.09) | | (.50) | | (1.14) | | (1.03) | | (1.81) E | | (1.29) |
| Total distributions | | (.09) | | (.90) | | (1.73) | | (1.44) F | | (2.57) F | | (1.35) |
| Net asset value, end of period | $ | 26.22 | $ | 23.73 | $ | 25.91 | $ | 22.12 | $ | 21.95 | $ | 19.21 |
Total Return G,H,I | | 10.88% | | (5.02)% | | 25.76% | | 7.74% | | 29.94% | | (9.07)% |
Ratios to Average Net Assets B,J,K | | | | | | | | | | | | |
| Expenses before reductions | | .62% L | | .62% | | .62% | | .64% | | .64% | | .65% |
| Expenses net of fee waivers, if any | | .62% L | | .62% | | .62% | | .64% | | .64% | | .64% |
| Expenses net of all reductions | | .62% L | | .62% | | .62% | | .63% | | .64% | | .64% |
| Net investment income (loss) | | 1.68% L | | 1.58% | | 2.08% C | | 2.08% | | 2.17% | | 1.98% |
| Supplemental Data | | | | | | | | | | | | |
| Net assets, end of period (000 omitted) | $ | 124,193 | $ | 116,688 | $ | 128,601 | $ | 115,376 | $ | 118,198 | $ | 101,089 |
Portfolio turnover rate M | | 15% L | | 10% | | 15% | | 26% | | 34% | | 41% |
A Calculated based on average shares outstanding during the period.
B Net investment income (loss) is affected by the timing of the declaration of dividends by any underlying mutual funds or exchange-traded funds (ETFs). Net investment income (loss) of any mutual funds or ETFs is not included in the Fund's net investment income (loss) ratio.
C Net investment income per share reflects one or more large, non-recurring dividend(s) which amounted to $.16 per share. Excluding such non-recurring dividend(s), the ratio of net investment income (loss) to average net assets would have been 1.45%.
D Amount represents less than $.005 per share.
E The amount shown reflects reclassifications related to book to tax differences that were made in the year shown.
F Total distributions per share do not sum due to rounding.
G Total returns for periods of less than one year are not annualized.
H Total returns do not reflect charges attributable to your insurance company's separate account. Inclusion of these charges would reduce the total returns shown.
I Total returns would have been lower if certain expenses had not been reduced during the applicable periods shown.
J Fees and expenses of any underlying mutual funds or exchange-traded funds (ETFs) are not included in the Fund's expense ratio. The Fund indirectly bears its proportionate share of these expenses. For additional expense information related to investments in Fidelity Central Funds, please refer to the "Investments in Fidelity Central Funds" note found in the Notes to Financial Statements section of the most recent Annual or Semi-Annual report.
K Expense ratios reflect operating expenses of the class. Expenses before reductions do not reflect amounts reimbursed, waived, or reduced through arrangements with the investment adviser, brokerage services, or other offset arrangements, if applicable, and do not represent the amount paid by the class during periods when reimbursements, waivers or reductions occur.
L Annualized.
M Amount does not include the portfolio activity of any underlying mutual funds or exchange-traded funds (ETFs).
| VIP Growth & Income Portfolio Service Class 2 |
| |
| | Six months ended (Unaudited) June 30, 2023 | | Years ended December 31, 2022 | | 2021 | | 2020 | | 2019 | | 2018 |
Selected Per-Share Data | | | | | | | | | | | | |
| Net asset value, beginning of period | $ | 23.26 | $ | 25.42 | $ | 21.72 | $ | 21.58 | $ | 18.94 | $ | 22.22 |
| Income from Investment Operations | | | | | | | | | | | | |
Net investment income (loss) A,B | | .19 | | .34 | | .48 C | | .37 | | .40 | | .39 |
| Net realized and unrealized gain (loss) | | 2.32 | | (1.64) | | 4.92 | | 1.18 | | 4.78 | | (2.35) |
| Total from investment operations | | 2.51 | | (1.30) | | 5.40 | | 1.55 | | 5.18 | | (1.96) |
| Distributions from net investment income | | - D | | (.36) | | (.55) | | (.38) | | (.73) E | | (.04) |
| Distributions from net realized gain | | (.09) | | (.50) | | (1.14) | | (1.03) | | (1.81) E | | (1.28) |
| Total distributions | | (.09) | | (.86) | | (1.70) F | | (1.41) | | (2.54) | | (1.32) |
| Net asset value, end of period | $ | 25.68 | $ | 23.26 | $ | 25.42 | $ | 21.72 | $ | 21.58 | $ | 18.94 |
Total Return G,H,I | | 10.80% | | (5.17)% | | 25.64% | | 7.59% | | 29.68% | | (9.19)% |
Ratios to Average Net Assets B,J,K | | | | | | | | | | | | |
| Expenses before reductions | | .77% L | | .77% | | .77% | | .79% | | .79% | | .80% |
| Expenses net of fee waivers, if any | | .77% L | | .77% | | .77% | | .79% | | .79% | | .79% |
| Expenses net of all reductions | | .77% L | | .77% | | .77% | | .78% | | .79% | | .79% |
| Net investment income (loss) | | 1.53% L | | 1.43% | | 1.94% C | | 1.93% | | 2.02% | | 1.83% |
| Supplemental Data | | | | | | | | | | | | |
| Net assets, end of period (000 omitted) | $ | 1,149,767 | $ | 1,071,533 | $ | 1,137,635 | $ | 908,013 | $ | 790,495 | $ | 527,879 |
Portfolio turnover rate M | | 15% L | | 10% | | 15% | | 26% | | 34% | | 41% |
A Calculated based on average shares outstanding during the period.
B Net investment income (loss) is affected by the timing of the declaration of dividends by any underlying mutual funds or exchange-traded funds (ETFs). Net investment income (loss) of any mutual funds or ETFs is not included in the Fund's net investment income (loss) ratio.
C Net investment income per share reflects one or more large, non-recurring dividend(s) which amounted to $.16 per share. Excluding such non-recurring dividend(s), the ratio of net investment income (loss) to average net assets would have been 1.30%.
D Amount represents less than $.005 per share.
E The amount shown reflects reclassifications related to book to tax differences that were made in the year shown.
F Total distributions per share do not sum due to rounding.
G Total returns for periods of less than one year are not annualized.
H Total returns do not reflect charges attributable to your insurance company's separate account. Inclusion of these charges would reduce the total returns shown.
I Total returns would have been lower if certain expenses had not been reduced during the applicable periods shown.
J Fees and expenses of any underlying mutual funds or exchange-traded funds (ETFs) are not included in the Fund's expense ratio. The Fund indirectly bears its proportionate share of these expenses. For additional expense information related to investments in Fidelity Central Funds, please refer to the "Investments in Fidelity Central Funds" note found in the Notes to Financial Statements section of the most recent Annual or Semi-Annual report.
K Expense ratios reflect operating expenses of the class. Expenses before reductions do not reflect amounts reimbursed, waived, or reduced through arrangements with the investment adviser, brokerage services, or other offset arrangements, if applicable, and do not represent the amount paid by the class during periods when reimbursements, waivers or reductions occur.
L Annualized.
M Amount does not include the portfolio activity of any underlying mutual funds or exchange-traded funds (ETFs).
| VIP Growth & Income Portfolio Investor Class |
| |
| | Six months ended (Unaudited) June 30, 2023 | | Years ended December 31, 2022 | | 2021 | | 2020 | | 2019 | | 2018 |
Selected Per-Share Data | | | | | | | | | | | | |
| Net asset value, beginning of period | $ | 23.88 | $ | 26.07 | $ | 22.25 | $ | 22.07 | $ | 19.30 | $ | 22.62 |
| Income from Investment Operations | | | | | | | | | | | | |
Net investment income (loss) A,B | | .21 | | .40 | | .53 C | | .41 | | .44 | | .44 |
| Net realized and unrealized gain (loss) | | 2.39 | | (1.68) | | 5.03 | | 1.21 | | 4.90 | | (2.41) |
| Total from investment operations | | 2.60 | | (1.28) | | 5.56 | | 1.62 | | 5.34 | | (1.97) |
| Distributions from net investment income | | - D | | (.40) | | (.60) | | (.41) | | (.75) E | | (.06) |
| Distributions from net realized gain | | (.09) | | (.50) | | (1.14) | | (1.03) | | (1.81) E | | (1.29) |
| Total distributions | | (.09) | | (.91) F | | (1.74) | | (1.44) | | (2.57) F | | (1.35) |
| Net asset value, end of period | $ | 26.39 | $ | 23.88 | $ | 26.07 | $ | 22.25 | $ | 22.07 | $ | 19.30 |
Total Return G,H,I | | 10.90% | | (5.01)% | | 25.80% | | 7.76% | | 29.97% | | (9.05)% |
Ratios to Average Net Assets B,J,K | | | | | | | | | | | | |
| Expenses before reductions | | .60% L | | .60% | | .60% | | .61% | | .62% | | .62% |
| Expenses net of fee waivers, if any | | .60% L | | .60% | | .60% | | .61% | | .62% | | .62% |
| Expenses net of all reductions | | .60% L | | .60% | | .60% | | .61% | | .62% | | .62% |
| Net investment income (loss) | | 1.70% L | | 1.60% | | 2.11% C | | 2.10% | | 2.19% | | 2.01% |
| Supplemental Data | | | | | | | | | | | | |
| Net assets, end of period (000 omitted) | $ | 415,551 | $ | 378,005 | $ | 376,272 | $ | 283,497 | $ | 291,704 | $ | 258,292 |
Portfolio turnover rate M | | 15% L | | 10% | | 15% | | 26% | | 34% | | 41% |
A Calculated based on average shares outstanding during the period.
B Net investment income (loss) is affected by the timing of the declaration of dividends by any underlying mutual funds or exchange-traded funds (ETFs). Net investment income (loss) of any mutual funds or ETFs is not included in the Fund's net investment income (loss) ratio.
C Net investment income per share reflects one or more large, non-recurring dividend(s) which amounted to $.16 per share. Excluding such non-recurring dividend(s), the ratio of net investment income (loss) to average net assets would have been 1.48%.
D Amount represents less than $.005 per share.
E The amount shown reflects reclassifications related to book to tax differences that were made in the year shown.
F Total distributions per share do not sum due to rounding.
G Total returns for periods of less than one year are not annualized.
H Total returns do not reflect charges attributable to your insurance company's separate account. Inclusion of these charges would reduce the total returns shown.
I Total returns would have been lower if certain expenses had not been reduced during the applicable periods shown.
J Fees and expenses of any underlying mutual funds or exchange-traded funds (ETFs) are not included in the Fund's expense ratio. The Fund indirectly bears its proportionate share of these expenses. For additional expense information related to investments in Fidelity Central Funds, please refer to the "Investments in Fidelity Central Funds" note found in the Notes to Financial Statements section of the most recent Annual or Semi-Annual report.
K Expense ratios reflect operating expenses of the class. Expenses before reductions do not reflect amounts reimbursed, waived, or reduced through arrangements with the investment adviser, brokerage services, or other offset arrangements, if applicable, and do not represent the amount paid by the class during periods when reimbursements, waivers or reductions occur.
L Annualized.
M Amount does not include the portfolio activity of any underlying mutual funds or exchange-traded funds (ETFs).
For the period ended June 30, 2023
1. Organization.
VIP Growth & Income Portfolio (the Fund) is a fund of Variable Insurance Products Fund III (the Trust) and is authorized to issue an unlimited number of shares. The Trust is registered under the Investment Company Act of 1940, as amended (the 1940 Act), as an open-end management investment company organized as a Massachusetts business trust. Shares of the Fund may only be purchased by insurance companies for the purpose of funding variable annuity or variable life insurance contracts. The Fund offers the following classes of shares: Initial Class shares, Service Class shares, Service Class 2 shares and Investor Class shares. All classes have equal rights and voting privileges, except for matters affecting a single class.
2. Investments in Fidelity Central Funds.
Funds may invest in Fidelity Central Funds, which are open-end investment companies generally available only to other investment companies and accounts managed by the investment adviser and its affiliates. The Schedule of Investments lists any Fidelity Central Funds held as an investment as of period end, but does not include the underlying holdings of each Fidelity Central Fund. An investing fund indirectly bears its proportionate share of the expenses of the underlying Fidelity Central Funds.
Based on its investment objective, each Fidelity Central Fund may invest or participate in various investment vehicles or strategies that are similar to those of the investing fund. These strategies are consistent with the investment objectives of the investing fund and may involve certain economic risks which may cause a decline in value of each of the Fidelity Central Funds and thus a decline in the value of the investing fund.
| Fidelity Central Fund | Investment Manager | Investment Objective | Investment Practices | Expense Ratio A |
| Fidelity Money Market Central Funds | Fidelity Management & Research Company LLC (FMR) | Each fund seeks to obtain a high level of current income consistent with the preservation of capital and liquidity. | Short-term Investments | Less than .005% |
A Expenses expressed as a percentage of average net assets and are as of each underlying Central Fund's most recent annual or semi-annual shareholder report.
A complete unaudited list of holdings for each Fidelity Central Fund is available upon request or at the Securities and Exchange Commission website at www.sec.gov. In addition, the financial statements of the Fidelity Central Funds which contain the significant accounting policies (including investment valuation policies) of those funds, and are not covered by the Report of Independent Registered Public Accounting Firm, are available on the Securities and Exchange Commission website or upon request.
3. Significant Accounting Policies.
The Fund is an investment company and applies the accounting and reporting guidance of the Financial Accounting Standards Board (FASB) Accounting Standards Codification Topic 946 Financial Services - Investment Companies . The financial statements have been prepared in conformity with accounting principles generally accepted in the United States of America (GAAP), which require management to make certain estimates and assumptions at the date of the financial statements. Actual results could differ from those estimates. Subsequent events, if any, through the date that the financial statements were issued have been evaluated in the preparation of the financial statements. The Fund's Schedule of Investments lists any underlying mutual funds or exchange-traded funds (ETFs) but does not include the underlying holdings of these funds. The following summarizes the significant accounting policies of the Fund:
Investment Valuation. Investments are valued as of 4:00 p.m. Eastern time on the last calendar day of the period. The Board of Trustees (the Board) has designated the Fund's investment adviser as the valuation designee responsible for the fair valuation function and performing fair value determinations as needed. The investment adviser has established a Fair Value Committee (the Committee) to carry out the day-to-day fair valuation responsibilities and has adopted policies and procedures to govern the fair valuation process and the activities of the Committee. In accordance with these fair valuation policies and procedures, which have been approved by the Board, the Fund attempts to obtain prices from one or more third party pricing services or brokers to value its investments. When current market prices, quotations or currency exchange rates are not readily available or reliable, investments will be fair valued in good faith by the Committee, in accordance with the policies and procedures. Factors used in determining fair value vary by investment type and may include market or investment specific events, transaction data, estimated cash flows, and market observations of comparable investments. The frequency that the fair valuation procedures are used cannot be predicted and they may be utilized to a significant extent. The Committee manages the Fund's fair valuation practices and maintains the fair valuation policies and procedures. The Fund's investment adviser reports to the Board information regarding the fair valuation process and related material matters.
The Fund categorizes the inputs to valuation techniques used to value its investments into a disclosure hierarchy consisting of three levels as shown below:
Level 1 - unadjusted quoted prices in active markets for identical investments
Level 2 - other significant observable inputs (including quoted prices for similar investments, interest rates, prepayment speeds, etc.)
Level 3 - unobservable inputs (including the Fund's own assumptions based on the best information available)
Valuation techniques used to value the Fund's investments by major category are as follows:
Equity securities, including restricted securities, for which market quotations are readily available, are valued at the last reported sale price or official closing price as reported by a third party pricing service on the primary market or exchange on which they are traded and are categorized as Level 1 in the hierarchy. In the event there were no sales during the day or closing prices are not available, securities are valued at the last quoted bid price or may be valued using the last available price and are generally categorized as Level 2 in the hierarchy. For foreign equity securities, when market or security specific events arise, comparisons to the valuation of American Depositary Receipts (ADRs), futures contracts, ETFs and certain indexes as well as quoted prices for similar securities may be used and would be categorized as Level 2 in the hierarchy. For equity securities, including restricted securities, where observable inputs are limited, assumptions about market activity and risk are used and these securities may be categorized as Level 3 in the hierarchy.
Debt securities, including restricted securities, are valued based on evaluated prices received from third party pricing services or from brokers who make markets in such securities. Corporate bonds are valued by pricing services who utilize matrix pricing which considers yield or price of bonds of comparable quality, coupon, maturity and type or by broker-supplied prices. When independent prices are unavailable or unreliable, debt securities may be valued utilizing pricing methodologies which consider similar factors that would be used by third party pricing services. Debt securities are generally categorized as Level 2 in the hierarchy but may be Level 3 depending on the circumstances.
Exchange-traded options are valued using the last sale price or, in the absence of a sale, the last offering price and are categorized as Level 1 in the hierarchy. Investments in open-end mutual funds, including the Fidelity Central Funds, are valued at their closing net asset value (NAV) each business day and are categorized as Level 1 in the hierarchy.
Changes in valuation techniques may result in transfers in or out of an assigned level within the disclosure hierarchy. The aggregate value of investments by input level as of June 30, 2023 is included at the end of the Fund's Schedule of Investments.
Foreign Currency. Certain Funds may use foreign currency contracts to facilitate transactions in foreign-denominated securities. Gains and losses from these transactions may arise from changes in the value of the foreign currency or if the counterparties do not perform under the contracts' terms.
Foreign-denominated assets, including investment securities, and liabilities are translated into U.S. dollars at the exchange rates at period end. Purchases and sales of investment securities, income and dividends received, and expenses denominated in foreign currencies are translated into U.S. dollars at the exchange rate in effect on the transaction date.
The effects of exchange rate fluctuations on investments are included with the net realized and unrealized gain (loss) on investment securities. Other foreign currency transactions resulting in realized and unrealized gain (loss) are disclosed separately.
Investment Transactions and Income. For financial reporting purposes, the Fund's investment holdings and NAV include trades executed through the end of the last business day of the period. The NAV per share for processing shareholder transactions is calculated as of the close of business of the New York Stock Exchange (NYSE), normally 4:00 p.m. Eastern time and includes trades executed through the end of the prior business day. Gains and losses on securities sold are determined on the basis of identified cost and include proceeds received from litigation. Commissions paid to certain brokers with whom the investment adviser, or its affiliates, places trades on behalf of a fund include an amount in addition to trade execution, which may be rebated back to a fund. Any such rebates are included in net realized gain (loss) on investments in the Statement of Operations. Dividend income is recorded on the ex-dividend date, except for certain dividends from foreign securities where the ex-dividend date may have passed, which are recorded as soon as the Fund is informed of the ex-dividend date. Non-cash dividends included in dividend income, if any, are recorded at the fair market value of the securities received. Income and capital gain distributions from Fidelity Central Funds, if any, are recorded on the ex-dividend date. Certain distributions received by the Fund represent a return of capital or capital gain. The Fund determines the components of these distributions subsequent to the ex-dividend date, based upon receipt of tax filings or other correspondence relating to the underlying investment. These distributions are recorded as a reduction of cost of investments and/or as a realized gain. Interest income is accrued as earned and includes coupon interest and amortization of premium and accretion of discount on debt securities as applicable. Investment income is recorded net of foreign taxes withheld where recovery of such taxes is uncertain. Funds may file withholding tax reclaims in certain jurisdictions to recover a portion of amounts previously withheld. Any withholding tax reclaims income is included in the Statement of Operations in dividends . Any receivables for withholding tax reclaims are included in the Statement of Assets and Liabilities in dividends receivable.
Class Allocations and Expenses. Investment income, realized and unrealized capital gains and losses, common expenses of a fund, and certain fund-level expense reductions, if any, are allocated daily on a pro-rata basis to each class based on the relative net assets of each class to the total net assets of a fund. Each class differs with respect to transfer agent and distribution and service plan fees incurred, as applicable. Certain expense reductions may also differ by class, if applicable. For the reporting period, the allocated portion of income and expenses to each class as a percent of its average net assets may vary due to the timing of recording these transactions in relation to fluctuating net assets of the classes. Expenses directly attributable to a fund are charged to that fund. Expenses attributable to more than one fund are allocated among the respective funds on the basis of relative net assets or other appropriate methods. Expenses included in the accompanying financial statements reflect the expenses of that fund and do not include any expenses associated with any underlying mutual funds or exchange-traded funds (ETFs). Although not included in a fund's expenses, a fund indirectly bears its proportionate share of these expenses through the net asset value of each underlying mutual fund or exchange-traded fund (ETF). Expense estimates are accrued in the period to which they relate and adjustments are made when actual amounts are known.
Income Tax Information and Distributions to Shareholders. Each year, the Fund intends to qualify as a regulated investment company under Subchapter M of the Internal Revenue Code, including distributing substantially all of its taxable income and realized gains. As a result, no provision for U.S. Federal income taxes is required. The Fund files a U.S. federal tax return, in addition to state and local tax returns as required. The Fund's federal income tax returns are subject to examination by the Internal Revenue Service (IRS) for a period of three fiscal years after they are filed. State and local tax returns may be subject to examination for an additional fiscal year depending on the jurisdiction. Foreign taxes are provided for based on the Fund's understanding of the tax rules and rates that exist in the foreign markets in which it invests.
Distributions are declared and recorded on the ex-dividend date. Income and capital gain distributions are declared separately for each class. Income and capital gain distributions are determined in accordance with income tax regulations, which may differ from GAAP.
Capital accounts within the financial statements are adjusted for permanent book-tax differences. These adjustments have no impact on net assets or the results of operations. Capital accounts are not adjusted for temporary book-tax differences which will reverse in a subsequent period.
Book-tax differences are primarily due to foreign currency transactions, partnerships and losses deferred due to wash sales.
As of period end, the cost and unrealized appreciation (depreciation) in securities, and derivatives if applicable, for federal income tax purposes were as follows:
| Gross unrealized appreciation | $819,375,447 |
| Gross unrealized depreciation | (52,301,765) |
| Net unrealized appreciation (depreciation) | $767,073,682 |
| Tax cost | $1,362,404,370 |
Restricted Securities (including Private Placements). Funds may invest in securities that are subject to legal or contractual restrictions on resale. These securities generally may be resold in transactions exempt from registration or to the public if the securities are registered. Disposal of these securities may involve time-consuming negotiations and expense, and prompt sale at an acceptable price may be difficult. Information regarding restricted securities held at period end is included at the end of the Schedule of Investments, if applicable.
4. Derivative Instruments.
Risk Exposures and the Use of Derivative Instruments. The Fund's investment objectives allow for various types of derivative instruments, including options. Derivatives are investments whose value is primarily derived from underlying assets, indices or reference rates and may be transacted on an exchange or over-the-counter (OTC). Derivatives may involve a future commitment to buy or sell a specified asset based on specified terms, to exchange future cash flows at periodic intervals based on a notional principal amount, or for one party to make one or more payments upon the occurrence of specified events in exchange for periodic payments from the other party.
Derivatives were used to increase returns and to manage exposure to certain risks as defined below. The success of any strategy involving derivatives depends on analysis of numerous economic factors, and if the strategies for investment do not work as intended, the objectives may not be achieved.
Derivatives were used to increase or decrease exposure to the following risk(s):
| Equity Risk | Equity risk relates to the fluctuations in the value of financial instruments as a result of changes in market prices (other than those arising from interest rate risk or foreign exchange risk), whether caused by factors specific to an individual investment, its issuer, or all factors affecting all instruments traded in a market or market segment. |
Funds are also exposed to additional risks from investing in derivatives, such as liquidity risk and counterparty credit risk. Liquidity risk is the risk that a fund will be unable to close out the derivative in the open market in a timely manner. Counterparty credit risk is the risk that the counterparty will not be able to fulfill its obligation to a fund. Counterparty credit risk related to exchange-traded contracts may be mitigated by the protection provided by the exchange on which they trade.
Investing in derivatives may involve greater risks than investing in the underlying assets directly and, to varying degrees, may involve risk of loss in excess of any initial investment and collateral received and amounts recognized in the Statement of Assets and Liabilities. In addition, there may be the risk that the change in value of the derivative contract does not correspond to the change in value of the underlying instrument.
Options. Options give the purchaser the right, but not the obligation, to buy (call) or sell (put) an underlying security or financial instrument at an agreed exercise or strike price between or on certain dates. Options obligate the seller (writer) to buy (put) or sell (call) an underlying instrument at the exercise or strike price or cash settle an underlying derivative instrument if the holder exercises the option on or before the expiration date.
Exchange-traded written covered call options were used to manage exposure to the market. When a fund writes a covered call option, a fund holds the underlying instrument which must be delivered to the holder upon the exercise of the option.
Upon entering into a written options contract, a fund will receive a premium. Premiums received are reflected as a liability on the Statement of Assets and Liabilities. Options are valued daily and any unrealized appreciation (depreciation) is reflected in total accumulated earnings (loss) in the Statement of Assets and Liabilities. When a written option is exercised, the premium is added to the proceeds from the sale of the underlying instrument in determining the gain or loss realized on that investment. When an option is closed, a gain or loss is realized depending on whether the proceeds or amount paid for the closing sale transaction are greater or less than the premium received. When an option expires, gains and losses are realized to the extent of premiums received. The net realized gain (loss) on closed and expired written options and the change in net unrealized appreciation (depreciation) on written options are presented in the Statement of Operations.
Writing call options tends to decrease exposure to the underlying instrument and risk of loss is the change in value in excess of the premium received.
Any open options at period end are presented in the Schedule of Investments under the caption "Written Options", and are representative of volume of activity during the period unless an average contracts amount is presented.
5. Purchases and Sales of Investments.
Purchases and sales of securities, other than short-term securities and in-kind transactions, as applicable, are noted in the table below.
| | Purchases ($) | Sales ($) |
| VIP Growth & Income Portfolio | 152,159,382 | 147,679,872 |
6. Fees and Other Transactions with Affiliates.
Management Fee. Fidelity Management & Research Company LLC (the investment adviser) and its affiliates provide the Fund with investment management related services for which the Fund pays a monthly management fee. The management fee is the sum of an individual fund fee rate that is based on an annual rate of .20% of the Fund's average net assets and an annualized group fee rate that averaged .23% during the period. The group fee rate is based upon the monthly average net assets of a group of registered investment companies with which the investment adviser has management contracts. The group fee rate decreases as assets under management increase and increases as assets under management decrease. For the reporting period, the total annualized management fee rate was .43% of the Fund's average net assets.
Distribution and Service Plan Fees. In accordance with Rule 12b-1 of the 1940 Act, the Fund has adopted separate 12b-1 Plans for each Service Class of shares. Each Service Class pays Fidelity Distributors Company LLC (FDC), an affiliate of the investment adviser, a service fee. For the period, the service fee is based on an annual rate of .10% of Service Class' average net assets and .25% of Service Class 2's average net assets.
For the period, total fees, all of which were re-allowed to insurance companies for the distribution of shares and providing shareholder support services, were as follows:
| Service Class | $60,383 |
| Service Class 2 | 1,372,578 |
| | $1,432,961 |
Transfer Agent Fees. Fidelity Investments Institutional Operations Company LLC (FIIOC), an affiliate of the investment adviser, is the Fund's transfer, dividend disbursing, and shareholder servicing agent. FIIOC receives an asset-based fee with respect to each class. Each class pays a fee for transfer agent services, typesetting and printing and mailing of shareholder reports, excluding mailing of proxy statements. For the period, transfer agent fees for each class were as follows:
| | Amount | % of Class-Level Average Net Assets A |
| Initial Class | $119,148 | .06 |
| Service Class | 38,041 | .06 |
| Service Class 2 | 345,890 | .06 |
| Investor Class | 279,382 | .14 |
| | $782,461 | |
A Annualized
Accounting Fees. Fidelity Service Company, Inc. (FSC), an affiliate of the investment adviser, maintains the Fund's accounting records. The accounting fee is based on the level of average net assets for each month. For the period, the fees were equivalent to the following annualized rates:
| | % of Average Net Assets |
| VIP Growth & Income Portfolio | .03 |
Brokerage Commissions. A portion of portfolio transactions were placed with brokerage firms which are affiliates of the investment adviser. Brokerage commissions are included in net realized gain (loss) and change in net unrealized appreciation (depreciation) in the Statement of Operations. The commissions paid to these affiliated firms were as follows:
| | Amount |
| VIP Growth & Income Portfolio | $2,453 |
Interfund Trades. Funds may purchase from or sell securities to other Fidelity Funds under procedures adopted by the Board. The procedures have been designed to ensure these interfund trades are executed in accordance with Rule 17a-7 of the 1940 Act. Any interfund trades are included within the respective purchases and sales amounts shown in the Purchases and Sales of Investments note. Interfund trades during the period are noted in the table below.
| | Purchases ($) | Sales ($) | Realized Gain (Loss) ($) |
| VIP Growth & Income Portfolio | 13,062,256 | 2,544,099 | 1,025,807 |
7. Committed Line of Credit.
Certain Funds participate with other funds managed by the investment adviser or an affiliate in a $4.25 billion credit facility (the "line of credit") to be utilized for temporary or emergency purposes to fund shareholder redemptions or for other short-term liquidity purposes. The participating funds have agreed to pay commitment fees on their pro-rata portion of the line of credit, which are reflected in Miscellaneous expenses on the Statement of Operations, and are listed below. During the period, there were no borrowings on this line of credit.
| | Amount |
| VIP Growth & Income Portfolio | $1,925 |
8. Security Lending.
Funds lend portfolio securities from time to time in order to earn additional income. Lending agents are used, including National Financial Services (NFS), an affiliate of the investment adviser. Pursuant to a securities lending agreement, NFS will receive a fee, which is capped at 9.9% of a fund's daily lending revenue, for its services as lending agent. A fund may lend securities to certain qualified borrowers, including NFS. On the settlement date of the loan, a fund receives collateral (in the form of U.S. Treasury obligations, letters of credit and/or cash) against the loaned securities and maintains collateral in an amount not less than 100% of the market value of the loaned securities during the period of the loan. The market value of the loaned securities is determined at the close of business of a fund and any additional required collateral is delivered to a fund on the next business day. A fund or borrower may terminate the loan at any time, and if the borrower defaults on its obligation to return the securities loaned because of insolvency or other reasons, a fund may apply collateral received from the borrower against the obligation. A fund may experience delays and costs in recovering the securities loaned. Any cash collateral received is invested in the Fidelity Securities Lending Cash Central Fund. Any loaned securities are identified as such in the Schedule of Investments, and the value of loaned securities and cash collateral at period end, as applicable, are presented in the Statement of Assets and Liabilities. Security lending income represents the income earned on investing cash collateral, less rebates paid to borrowers and any lending agent fees associated with the loan, plus any premium payments received for lending certain types of securities. Security lending income is presented in the Statement of Operations as a component of income from Fidelity Central Funds. Affiliated security lending activity, if any, was as follows:
| | Total Security Lending Fees Paid to NFS | Security Lending Income From Securities Loaned to NFS | Value of Securities Loaned to NFS at Period End |
| VIP Growth & Income Portfolio | $6,996 | $- | $- |
9. Expense Reductions.
Through arrangements with the Fund's custodian, credits realized as a result of certain uninvested cash balances were used to reduce the Fund's expenses. During the period, custodian credits reduced the Fund's expenses by $184.
In addition, during the period the investment adviser or an affiliate reimbursed and/or waived a portion of fund-level operating expenses in the amount of $45,061.
10. Distributions to Shareholders.
Distributions to shareholders of each class were as follows:
| | Six months ended June 30, 2023 | Year ended December 31, 2022 |
| VIP Growth & Income Portfolio | | |
| Distributions to shareholders | | |
| Initial Class | $1,362,738 | 13,621,746 |
| Service Class | 440,892 | 4,287,387 |
| Service Class 2 | 4,025,156 | 38,453,504 |
| Investor Class | 1,435,238 | 13,695,832 |
Total | $7,264,024 | $70,058,469 |
11. Share Transactions.
Transactions for each class of shares were as follows and may contain in-kind transactions:
| | Shares | Shares | Dollars | Dollars |
| | Six months ended June 30, 2023 | Year ended December 31, 2022 | Six months ended June 30, 2023 | Year ended December 31, 2022 |
| VIP Growth & Income Portfolio | | | | |
| Initial Class | | | | |
| Shares sold | 1,006,896 | 4,205,341 | $25,404,099 | $105,061,293 |
| Reinvestment of distributions | 52,942 | 553,666 | 1,362,738 | 13,621,746 |
| Shares redeemed | (1,727,619) | (6,237,929) | (43,790,103) | (155,225,066) |
| Net increase (decrease) | (667,781) | (1,478,922) | $(17,023,266) | $(36,542,027) |
| Service Class | | | | |
| Shares sold | 82,689 | 225,906 | $2,067,430 | $5,617,209 |
| Reinvestment of distributions | 17,344 | 176,389 | 440,892 | 4,287,387 |
| Shares redeemed | (280,705) | (448,513) | (6,992,406) | (11,012,554) |
| Net increase (decrease) | (180,672) | (46,218) | $(4,484,084) | $(1,107,958) |
| Service Class 2 | | | | |
| Shares sold | 1,251,201 | 4,830,627 | $30,588,180 | $115,599,799 |
| Reinvestment of distributions | 161,588 | 1,614,154 | 4,025,156 | 38,453,504 |
| Shares redeemed | (2,706,547) | (5,135,070) | (66,151,598) | (125,404,991) |
| Net increase (decrease) | (1,293,758) | 1,309,711 | $(31,538,262) | $28,648,312 |
| Investor Class | | | | |
| Shares sold | 1,128,757 | 3,874,646 | $28,405,219 | $97,699,069 |
| Reinvestment of distributions | 56,086 | 559,919 | 1,435,238 | 13,695,832 |
| Shares redeemed | (1,267,233) | (3,039,935) | (31,889,581) | (74,235,526) |
| Net increase (decrease) | (82,390) | 1,394,630 | $(2,049,124) | $37,159,375 |
12. Other.
A fund's organizational documents provide former and current trustees and officers with a limited indemnification against liabilities arising in connection with the performance of their duties to the fund. In the normal course of business, a fund may also enter into contracts that provide general indemnifications. A fund's maximum exposure under these arrangements is unknown as this would be dependent on future claims that may be made against a fund. The risk of material loss from such claims is considered remote.
At the end of the period, the investment adviser or its affiliates were owners of record of more than 10% and certain otherwise unaffiliated shareholders each were owners of record of more than 10% of the outstanding shares as follows:
| Fund | Affiliated % | Number ofUnaffiliated Shareholders | Unaffiliated Shareholders % |
| VIP Growth & Income Portfolio | 27% | 2 | 53% |
13. Risk and Uncertainties.
Many factors affect a fund's performance. Developments that disrupt global economies and financial markets, such as pandemics, epidemics, outbreaks of infectious diseases, war, terrorism, and environmental disasters, may significantly affect a fund's investment performance. The effects of these developments to a fund will be impacted by the types of securities in which a fund invests, the financial condition, industry, economic sector, and geographic location of an issuer, and a fund's level of investment in the securities of that issuer. Significant concentrations in security types, issuers, industries, sectors, and geographic locations may magnify the factors that affect a fund's performance.
As a shareholder, you incur two types of costs: (1) transaction costs, which may include sales charges (loads) on purchase payments or redemption proceeds, as applicable and (2) ongoing costs, which generally include management fees, distribution and/or service (12b-1) fees and other Fund expenses. This Example is intended to help you understand your ongoing costs (in dollars) of investing in a fund and to compare these costs with the ongoing costs of investing in other mutual funds.
| The Example is based on an investment of $1,000 invested at the beginning of the period and held for the entire period (January 1, 2023 to June 30, 2023). |
Actual Expenses
The first line of the accompanying table provides information about actual account values and actual expenses. You may use the information in this line, together with the amount you invested, to estimate the expenses that you paid over the period. Simply divide your account value by $1,000.00 (for example, an $8,600 account value divided by $1,000.00 = 8.6), then multiply the result by the number in the first line for a class/Fund under the heading entitled "Expenses Paid During Period" to estimate the expenses you paid on your account during this period. If any fund is a shareholder of any underlying mutual funds or exchange-traded funds (ETFs) (the Underlying Funds), such fund indirectly bears its proportional share of the expenses of the Underlying Funds in addition to the direct expenses incurred presented in the table. These fees and expenses are not included in the annualized expense ratio used to calculate the expense estimate in the table below. The estimate of expenses does not include any fees or other expenses of any variable annuity or variable life insurance product. If they were, the estimate of expenses you paid during the period would be higher, and your ending account value would be lower.
Hypothetical Example for Comparison Purposes
The second line of the accompanying table provides information about hypothetical account values and hypothetical expenses based on the actual expense ratio and an assumed rate of return of 5% per year before expenses, which is not the actual return. The hypothetical account values and expenses may not be used to estimate the actual ending account balance or expenses you paid for the period. You may use this information to compare the ongoing costs of investing in the Fund and other funds. To do so, compare this 5% hypothetical example with the 5% hypothetical examples that appear in the shareholder reports of the other funds. If any fund is a shareholder of any Underlying Funds, such fund indirectly bears its proportional share of the expenses of the Underlying Funds in addition to the direct expenses as presented in the table. These fees and expenses are not included in the annualized expense ratio used to calculate the expense estimate in the table below. The estimate of expenses does not include any fees or other expenses of any variable annuity or variable life insurance product. If they were, the estimate of expenses you paid during the period would be higher, and your ending account value would be lower.
Please note that the expenses shown in the table are meant to highlight your ongoing costs only and do not reflect any transaction costs. Therefore, the second line of the table is useful in comparing ongoing costs only, and will not help you determine the relative total costs of owning different funds. In addition, if these transactional costs were included, your costs would have been higher.
| | | | | Annualized Expense Ratio- A | | Beginning Account Value January 1, 2023 | | Ending Account Value June 30, 2023 | | Expenses Paid During Period- C January 1, 2023 to June 30, 2023 |
| VIP Growth & Income Portfolio | | | | | | | | | | |
| Initial Class | | | | .52% | | | | | | |
| Actual | | | | | | $ 1,000 | | $ 1,109.60 | | $ 2.72 |
Hypothetical- B | | | | | | $ 1,000 | | $ 1,022.22 | | $ 2.61 |
| Service Class | | | | .62% | | | | | | |
| Actual | | | | | | $ 1,000 | | $ 1,108.80 | | $ 3.24 |
Hypothetical- B | | | | | | $ 1,000 | | $ 1,021.72 | | $ 3.11 |
| Service Class 2 | | | | .77% | | | | | | |
| Actual | | | | | | $ 1,000 | | $ 1,108.00 | | $ 4.02 |
Hypothetical- B | | | | | | $ 1,000 | | $ 1,020.98 | | $ 3.86 |
| Investor Class | | | | .60% | | | | | | |
| Actual | | | | | | $ 1,000 | | $ 1,109.00 | | $ 3.14 |
Hypothetical- B | | | | | | $ 1,000 | | $ 1,021.82 | | $ 3.01 |
| |
A Annualized expense ratio reflects expenses net of applicable fee waivers.
B 5% return per year before expenses
C Expenses are equal to the annualized expense ratio, multiplied by the average account value over the period, multiplied by 181/ 365 (to reflect the one-half year period). The fees and expenses of any Underlying Funds are not included in each annualized expense ratio.
Board Approval of Investment Advisory Contracts
VIP Growth & Income Portfolio
At its May 2023 meeting, the Board of Trustees, including the Independent Trustees (together, the Board), voted to continue the management contract with Fidelity Management & Research Company LLC (FMR), and the sub-advisory agreements and sub-subadvisory agreements, in each case, where applicable (together, the Advisory Contracts) for the fund for two months from June 1, 2023 through July 31, 2023. The Board determined that it will consider the annual renewal of the fund's Advisory Contracts for a full one year period in July 2023, following its review of additional materials provided by FMR.
The Board considered that the approval of the fund's Advisory Contracts will not result in any changes in (i) the investment process or strategies employed in the management of the fund's assets; (ii) the fees and expenses paid by shareholders; (iii) the nature, extent or quality of services provided under the fund's Advisory Contracts; or (iv) the day-to-day management of the fund or the persons primarily responsible for such management. The Board also considered that since its last approval of the fund's Advisory Contracts, FMR had provided additional information on the fund in support of the annual contract renewal process, including competitive analyses on total expenses and management fees and in-depth reviews of fund performance and fund profitability information. The Board concluded that the fund's Advisory Contracts are fair and reasonable, and that the fund's Advisory Contracts should be renewed, without modification, through July 31, 2023, with the understanding that the Board will consider the annual renewal for a full one year period in July 2023.
In connection with its consideration of future renewals of the fund's Advisory Contracts, the Board will consider: (i) the nature, extent and quality of services provided to the fund, including shareholder and administrative services and investment performance; (ii) the competitiveness of the management fee and total expenses for the fund; (iii) the costs of the services and profitability, including the revenues earned and the expenses incurred in conducting the business of developing, marketing, distributing, managing, administering, and servicing the fund and its shareholders, to the extent applicable; and (iv) whether there have been economies of scale in respect of the Fidelity funds, whether the Fidelity funds (including the fund) have appropriately benefited from any such economies of scale, and whether there is the potential for realization of any further economies.
Based on its evaluation of all of the conclusions noted above, and after considering all factors it believed relevant, the Board ultimately concluded that the fund's management fee structure is fair and reasonable, and that the continuation of the fund's Advisory Contracts should be approved for two months from June 1, 2023 through July 31, 2023.
The Securities and Exchange Commission adopted Rule 22e-4 under the Investment Company Act of 1940 (the Liquidity Rule) to promote effective liquidity risk management throughout the open-end investment company industry, thereby reducing the risk that funds will be unable to meet their redemption obligations and mitigating dilution of the interests of fund shareholders.
The Fund has adopted and implemented a liquidity risk management program (the Program) reasonably designed to assess and manage the Fund's liquidity risk and to comply with the requirements of the Liquidity Rule. The Fund's Board of Trustees (the Board) has designated the Fund's investment adviser as administrator of the Program. The Fidelity advisers have established a Liquidity Risk Management Committee (the LRM Committee) to manage the Program for each of the Fidelity Funds. The LRM Committee monitors the adequacy and effectiveness of implementation of the Program and on a periodic basis assesses each Fund's liquidity risk based on a variety of factors including (1) the Fund's investment strategy, (2) portfolio liquidity and cash flow projections during normal and reasonably foreseeable stressed conditions, (3) shareholder redemptions, (4) borrowings and other funding sources and (5) certain factors specific to ETFs including the effect of the Fund's prices and spreads, market participants, and basket compositions on the overall liquidity of the Fund's portfolio, as applicable.
In accordance with the Program, each of the Fund's portfolio investments is classified into one of four defined liquidity categories based on a determination of a reasonable expectation for how long it would take to convert the investment to cash (or sell or dispose of the investment) without significantly changing its market value.
- Highly liquid investments - cash or convertible to cash within three business days or less
- Moderately liquid investments - convertible to cash in three to seven calendar days
- Less liquid investments - can be sold or disposed of, but not settled, within seven calendar days
- Illiquid investments - cannot be sold or disposed of within seven calendar days
Liquidity classification determinations take into account a variety of factors including various market, trading and investment-specific considerations, as well as market depth, and generally utilize analysis from a third-party liquidity metrics service.
The Liquidity Rule places a 15% limit on a fund's illiquid investments and requires funds that do not primarily hold assets that are highly liquid investments to determine and maintain a minimum percentage of the fund's net assets to be invested in highly liquid investments (highly liquid investment minimum or HLIM). The Program includes provisions reasonably designed to comply with the 15% limit on illiquid investments and for determining, periodically reviewing and complying with the HLIM requirement as applicable.
At a recent meeting of the Fund's Board of Trustees, the LRM Committee provided a written report to the Board pertaining to the operation, adequacy, and effectiveness of the Program for the period December 1, 2021 through November 30, 2022. The report concluded that the Program is operating effectively and is reasonably designed to assess and manage the Fund's liquidity risk.
1.705698.125
VIPGI-SANN-0823
Fidelity® Variable Insurance Products:
VIP Growth Opportunities Portfolio
Semi-Annual Report
June 30, 2023
Contents
To view a fund's proxy voting guidelines and proxy voting record for the 12-month period ended June 30, visit http://www.fidelity.com/proxyvotingresults or visit the Securities and Exchange Commission's (SEC) web site at http://www.sec.gov.
You may also call 1-877-208-0098 to request a free copy of the proxy voting guidelines.
Fidelity® Variable Insurance Products are separate account options which are purchased through a variable insurance contract.
Standard & Poor's, S&P and S&P 500 are registered service marks of The McGraw-Hill Companies, Inc. and have been licensed for use by Fidelity Distributors Corporation.
Other third-party marks appearing herein are the property of their respective owners.
All other marks appearing herein are registered or unregistered trademarks or service marks of FMR LLC or an affiliated company. © 2023 FMR LLC. All rights reserved.
This report and the financial statements contained herein are submitted for the general information of the shareholders of the Fund. This report is not authorized for distribution to prospective investors in the Fund unless preceded or accompanied by an effective prospectus.
A fund files its complete schedule of portfolio holdings with the SEC for the first and third quarters of each fiscal year on Form N-PORT. Forms N-PORT are available on the SEC's web site at http://www.sec.gov. A fund's Forms N-PORT may be reviewed and copied at the SEC's Public Reference Room in Washington, DC. Information regarding the operation of the SEC's Public Reference Room may be obtained by calling 1-800-SEC-0330.
For a complete list of a fund's portfolio holdings, view the most recent holdings listing, semiannual report, or annual report on Fidelity's web site at http://www.fidelity.com, http://www.institutional.fidelity.com, or http://www.401k.com, as applicable.
NOT FDIC INSURED •MAY LOSE VALUE •NO BANK GUARANTEE
Neither the Fund nor Fidelity Distributors Corporation is a bank.
This report and the financial statements contained herein are submitted for the general information of the shareholders of the Fund. This report is not authorized for distribution to prospective investors in the Fund unless preceded or accompanied by an effective prospectus.
A fund files its complete schedule of portfolio holdings with the SEC for the first and third quarters of each fiscal year on Form N-PORT. Forms N-PORT are available on the SEC's web site at http://www.sec.gov. A fund's Forms N-PORT may be reviewed and copied at the SEC's Public Reference Room in Washington, DC. Information regarding the operation of the SEC's Public Reference Room may be obtained by calling 1-800-SEC-0330.
For a complete list of a fund's portfolio holdings, view the most recent holdings listing, semiannual report, or annual report on Fidelity's web site at http://www.fidelity.com, http://www.institutional.fidelity.com, or http://www.401k.com, as applicable.
NOT FDIC INSURED •MAY LOSE VALUE •NO BANK GUARANTEE
Neither the Fund nor Fidelity Distributors Corporation is a bank.
Top Holdings (% of Fund's net assets) |
| |
| Microsoft Corp. | 10.0 | |
| NVIDIA Corp. | 7.8 | |
| Alphabet, Inc. Class C | 4.8 | |
| Amazon.com, Inc. | 4.7 | |
| T-Mobile U.S., Inc. | 3.4 | |
| Meta Platforms, Inc. Class A | 2.9 | |
| Uber Technologies, Inc. | 2.8 | |
| Apple, Inc. | 2.4 | |
| ON Semiconductor Corp. | 2.2 | |
| Flex Ltd. | 2.0 | |
| | 43.0 | |
| |
| Market Sectors (% of Fund's net assets) |
| |
| Information Technology | 45.1 | |
| Communication Services | 17.1 | |
| Financials | 9.7 | |
| Health Care | 9.1 | |
| Consumer Discretionary | 8.1 | |
| Industrials | 5.0 | |
| Energy | 2.4 | |
| Utilities | 2.0 | |
| Investment Companies | 0.8 | |
| Consumer Staples | 0.3 | |
| Materials | 0.1 | |
| |
Asset Allocation (% of Fund's net assets) |
|
|
Showing Percentage of Net Assets
| Common Stocks - 96.2% |
| | | Shares | Value ($) |
| COMMUNICATION SERVICES - 16.9% | | | |
| Entertainment - 2.2% | | | |
| Netflix, Inc. (a) | | 33,200 | 14,624,268 |
| Roku, Inc. Class A (a) | | 449,524 | 28,751,555 |
| Sea Ltd. ADR (a) | | 238,488 | 13,841,844 |
| | | | 57,217,667 |
| Interactive Media & Services - 10.6% | | | |
| Alphabet, Inc.: | | | |
| Class A (a) | | 395,520 | 47,343,744 |
| Class C (a) | | 1,013,560 | 122,610,353 |
| Epic Games, Inc. (a)(b)(c) | | 8,216 | 5,783,735 |
| Meta Platforms, Inc. Class A (a) | | 259,079 | 74,350,491 |
| Snap, Inc. Class A (a) | | 741,100 | 8,774,624 |
| Zoominfo Technologies, Inc. (a) | | 539,100 | 13,687,749 |
| | | | 272,550,696 |
| Media - 0.7% | | | |
| Innovid Corp. (a) | | 141,062 | 153,758 |
| Magnite, Inc. (a) | | 906,150 | 12,368,948 |
| TechTarget, Inc. (a) | | 147,512 | 4,592,049 |
| The Trade Desk, Inc. (a) | | 17,550 | 1,355,211 |
| | | | 18,469,966 |
| Wireless Telecommunication Services - 3.4% | | | |
| T-Mobile U.S., Inc. (a) | | 637,088 | 88,491,523 |
TOTAL COMMUNICATION SERVICES | | | 436,729,852 |
| CONSUMER DISCRETIONARY - 7.9% | | | |
| Automobile Components - 0.1% | | | |
| Aptiv PLC (a) | | 25,800 | 2,633,922 |
| Automobiles - 0.2% | | | |
| Neutron Holdings, Inc. (a)(b)(c) | | 106,587 | 2,729 |
| Rad Power Bikes, Inc. (a)(b)(c) | | 56,834 | 126,740 |
| Rivian Automotive, Inc. (a) | | 209,400 | 3,488,604 |
| Tesla, Inc. (a) | | 5,775 | 1,511,722 |
| | | | 5,129,795 |
| Broadline Retail - 4.7% | | | |
| Amazon.com, Inc. (a) | | 935,760 | 121,985,674 |
| Hotels, Restaurants & Leisure - 0.3% | | | |
| Domino's Pizza, Inc. | | 600 | 202,194 |
| Doordash, Inc. (a)(d) | | 85,100 | 6,503,342 |
| Sonder Holdings, Inc.: | | | |
| rights (a)(c) | | 2,658 | 80 |
| rights (a)(c) | | 2,658 | 53 |
| rights (a)(c) | | 2,657 | 27 |
| rights (a)(c) | | 2,657 | 27 |
| rights (a)(c) | | 2,657 | 27 |
| rights (a)(c) | | 2,657 | 27 |
| | | | 6,705,777 |
| Household Durables - 0.1% | | | |
| D.R. Horton, Inc. | | 2,000 | 243,380 |
| Lennar Corp. Class A | | 2,600 | 325,806 |
| Tempur Sealy International, Inc. | | 32,200 | 1,290,254 |
| | | | 1,859,440 |
| Leisure Products - 0.0% | | | |
| Peloton Interactive, Inc. Class A (a) | | 79,000 | 607,510 |
| Specialty Retail - 2.0% | | | |
| Auto1 Group SE (a)(d)(e) | | 983,200 | 9,119,377 |
| Carvana Co. Class A (a)(d) | | 267,300 | 6,928,416 |
| Cazoo Group Ltd. Class A (a)(d) | | 82,778 | 97,678 |
| Floor & Decor Holdings, Inc. Class A (a)(d) | | 195,900 | 20,365,764 |
| Lowe's Companies, Inc. | | 53,000 | 11,962,100 |
| Wayfair LLC Class A (a) | | 70,874 | 4,607,519 |
| | | | 53,080,854 |
| Textiles, Apparel & Luxury Goods - 0.5% | | | |
| Bombas LLC (a)(b)(c) | | 745,906 | 2,245,177 |
| lululemon athletica, Inc. (a) | | 25,572 | 9,679,002 |
| | | | 11,924,179 |
TOTAL CONSUMER DISCRETIONARY | | | 203,927,151 |
| CONSUMER STAPLES - 0.1% | | | |
| Beverages - 0.1% | | | |
| Boston Beer Co., Inc. Class A (a) | | 9,000 | 2,775,960 |
| Consumer Staples Distribution & Retail - 0.0% | | | |
| BJ's Wholesale Club Holdings, Inc. (a) | | 4,000 | 252,040 |
| Food Products - 0.0% | | | |
| Local Bounti Corp. (a)(d) | | 38,874 | 105,737 |
| Tobacco - 0.0% | | | |
| JUUL Labs, Inc. Class B (a)(b)(c) | | 560 | 4,077 |
TOTAL CONSUMER STAPLES | | | 3,137,814 |
| ENERGY - 2.4% | | | |
| Oil, Gas & Consumable Fuels - 2.4% | | | |
| Antero Resources Corp. (a) | | 698,900 | 16,095,667 |
| Canadian Natural Resources Ltd. | | 140,900 | 7,921,670 |
| Denbury, Inc. (a) | | 6,700 | 577,942 |
| Exxon Mobil Corp. | | 24,100 | 2,584,725 |
| Hess Corp. | | 87,000 | 11,827,650 |
| Occidental Petroleum Corp. | | 6,400 | 376,320 |
| Ovintiv, Inc. | | 313,100 | 11,919,717 |
| Tourmaline Oil Corp. (d) | | 266,700 | 12,566,457 |
| | | | 63,870,148 |
| FINANCIALS - 9.4% | | | |
| Banks - 0.2% | | | |
| Starling Bank Ltd. Series D (a)(b)(c) | | 1,101,900 | 4,086,286 |
| Capital Markets - 0.7% | | | |
| LPL Financial | | 82,500 | 17,937,975 |
| Financial Services - 8.5% | | | |
| Adyen BV (a)(e) | | 2,500 | 4,329,169 |
| Apollo Global Management, Inc. | | 33,000 | 2,534,730 |
| Block, Inc. Class A (a) | | 724,700 | 48,243,279 |
| Dlocal Ltd. (a)(d) | | 927,065 | 11,314,828 |
| Fiserv, Inc. (a) | | 186,000 | 23,463,900 |
| FleetCor Technologies, Inc. (a) | | 2,000 | 502,160 |
| Global Payments, Inc. | | 200,300 | 19,733,556 |
| Marqeta, Inc. Class A (a) | | 2,709,560 | 13,195,557 |
| MasterCard, Inc. Class A | | 48,656 | 19,136,405 |
| Nuvei Corp. (Canada) (a)(e) | | 790,526 | 23,344,312 |
| Payoneer Global, Inc. (a)(b) | | 65,400 | 314,574 |
| Repay Holdings Corp. (a) | | 959,800 | 7,515,234 |
| Shift4 Payments, Inc. (a) | | 141,500 | 9,609,265 |
| Visa, Inc. Class A | | 157,033 | 37,292,197 |
| | | | 220,529,166 |
TOTAL FINANCIALS | | | 242,553,427 |
| HEALTH CARE - 9.0% | | | |
| Biotechnology - 1.8% | | | |
| Alnylam Pharmaceuticals, Inc. (a) | | 24,451 | 4,644,223 |
| ALX Oncology Holdings, Inc. (a) | | 85,500 | 642,105 |
| Arcutis Biotherapeutics, Inc. (a) | | 40,700 | 387,871 |
| Argenx SE ADR (a) | | 22,531 | 8,781,007 |
| Ascendis Pharma A/S sponsored ADR (a) | | 16,125 | 1,439,156 |
| Blueprint Medicines Corp. (a) | | 11,900 | 752,080 |
| Celldex Therapeutics, Inc. (a) | | 127,000 | 4,309,110 |
| Cytokinetics, Inc. (a) | | 160,300 | 5,228,986 |
| Icosavax, Inc. (a) | | 274,791 | 2,728,675 |
| Keros Therapeutics, Inc. (a) | | 44,000 | 1,767,920 |
| Moderna, Inc. (a) | | 1,100 | 133,650 |
| Morphic Holding, Inc. (a) | | 33,000 | 1,891,890 |
| Nuvalent, Inc. Class A (a) | | 46,984 | 1,981,315 |
| PTC Therapeutics, Inc. (a) | | 9,000 | 366,030 |
| Vaxcyte, Inc. (a) | | 171,804 | 8,579,892 |
| Verve Therapeutics, Inc. (a)(d) | | 29,100 | 545,625 |
| Zentalis Pharmaceuticals, Inc. (a) | | 118,900 | 3,354,169 |
| | | | 47,533,704 |
| Health Care Equipment & Supplies - 2.0% | | | |
| Blink Health LLC Series A1 (a)(b)(c) | | 8,327 | 398,613 |
| Boston Scientific Corp. (a) | | 457,592 | 24,751,151 |
| Insulet Corp. (a) | | 17,900 | 5,161,286 |
| Penumbra, Inc. (a) | | 34,500 | 11,870,070 |
| TransMedics Group, Inc. (a) | | 130,541 | 10,962,833 |
| | | | 53,143,953 |
| Health Care Providers & Services - 4.2% | | | |
| agilon health, Inc. (a) | | 1,068,400 | 18,526,056 |
| Alignment Healthcare, Inc. (a) | | 127,600 | 733,700 |
| Centene Corp. (a) | | 394,100 | 26,582,045 |
| Humana, Inc. | | 51,772 | 23,148,814 |
| P3 Health Partners, Inc. Class A (a) | | 215,114 | 643,191 |
| UnitedHealth Group, Inc. | | 79,148 | 38,041,695 |
| | | | 107,675,501 |
| Life Sciences Tools & Services - 0.6% | | | |
| Danaher Corp. | | 35,200 | 8,448,000 |
| Thermo Fisher Scientific, Inc. | | 12,400 | 6,469,700 |
| | | | 14,917,700 |
| Pharmaceuticals - 0.4% | | | |
| Eli Lilly & Co. | | 24,200 | 11,349,316 |
TOTAL HEALTH CARE | | | 234,620,174 |
| INDUSTRIALS - 4.3% | | | |
| Aerospace & Defense - 0.8% | | | |
| Lockheed Martin Corp. | | 16,900 | 7,780,422 |
| Space Exploration Technologies Corp. Class A (a)(b)(c) | | 13,000 | 1,053,000 |
| The Boeing Co. (a) | | 54,700 | 11,550,452 |
| | | | 20,383,874 |
| Commercial Services & Supplies - 0.3% | | | |
| ACV Auctions, Inc. Class A (a) | | 419,800 | 7,249,946 |
| Electrical Equipment - 0.1% | | | |
| Bloom Energy Corp. Class A (a)(d) | | 95,800 | 1,566,330 |
| Eaton Corp. PLC | | 1,400 | 281,540 |
| Nextracker, Inc. Class A (d) | | 8,700 | 346,347 |
| Sunrun, Inc. (a) | | 13,700 | 244,682 |
| | | | 2,438,899 |
| Ground Transportation - 3.1% | | | |
| Bird Global, Inc.: | | | |
| Stage 1 rights (a)(c) | | 625 | 6 |
| Stage 2 rights (a)(c) | | 625 | 0 |
| Stage 3 rights (a)(c) | | 625 | 0 |
| Lyft, Inc. (a) | | 837,816 | 8,034,655 |
| Uber Technologies, Inc. (a) | | 1,655,793 | 71,480,584 |
| | | | 79,515,245 |
| Professional Services - 0.0% | | | |
| Paycom Software, Inc. | | 3,600 | 1,156,464 |
TOTAL INDUSTRIALS | | | 110,744,428 |
| INFORMATION TECHNOLOGY - 44.2% | | | |
| Communications Equipment - 0.2% | | | |
| Lumentum Holdings, Inc. (a) | | 85,100 | 4,827,723 |
| Electronic Equipment, Instruments & Components - 2.9% | | | |
| Coherent Corp. (a)(d) | | 82,900 | 4,226,242 |
| Flex Ltd. (a) | | 1,899,052 | 52,489,797 |
| Jabil, Inc. | | 170,800 | 18,434,444 |
| | | | 75,150,483 |
| IT Services - 2.7% | | | |
| Cloudflare, Inc. (a) | | 37,400 | 2,444,838 |
| EPAM Systems, Inc. (a) | | 104,100 | 23,396,475 |
| Globant SA (a) | | 22,400 | 4,025,728 |
| MongoDB, Inc. Class A (a) | | 67,100 | 27,577,429 |
| Okta, Inc. (a) | | 19,200 | 1,331,520 |
| Shopify, Inc. Class A (a) | | 18,600 | 1,201,560 |
| Snowflake, Inc. (a) | | 6,600 | 1,161,468 |
| Twilio, Inc. Class A (a) | | 130,300 | 8,289,686 |
| | | | 69,428,704 |
| Semiconductors & Semiconductor Equipment - 17.8% | | | |
| Advanced Micro Devices, Inc. (a) | | 440,000 | 50,120,400 |
| Applied Materials, Inc. | | 108,495 | 15,681,867 |
| Enphase Energy, Inc. (a) | | 13,600 | 2,277,728 |
| GlobalFoundries, Inc. (a) | | 184,900 | 11,940,842 |
| Impinj, Inc. (a) | | 12,500 | 1,120,625 |
| Lam Research Corp. | | 13,744 | 8,835,468 |
| Lattice Semiconductor Corp. (a) | | 14,000 | 1,344,980 |
| Marvell Technology, Inc. | | 598,270 | 35,764,581 |
| Monolithic Power Systems, Inc. | | 1,900 | 1,026,437 |
| NVIDIA Corp. | | 475,452 | 201,125,705 |
| NXP Semiconductors NV | | 252,177 | 51,615,588 |
| ON Semiconductor Corp. (a) | | 612,939 | 57,971,771 |
| Rambus, Inc. (a) | | 68,200 | 4,376,394 |
| Taiwan Semiconductor Manufacturing Co. Ltd. sponsored ADR | | 176,800 | 17,842,656 |
| | | | 461,045,042 |
| Software - 18.0% | | | |
| Adobe, Inc. (a) | | 15,800 | 7,726,042 |
| Autodesk, Inc. (a) | | 5,800 | 1,186,738 |
| Bill Holdings, Inc. (a) | | 101,500 | 11,860,275 |
| Confluent, Inc. (a)(d) | | 296,200 | 10,458,822 |
| Convoy, Inc. warrants (a)(b)(c) | | 12,923 | 33,987 |
| Datadog, Inc. Class A (a) | | 132,800 | 13,064,864 |
| DoubleVerify Holdings, Inc. (a) | | 254,256 | 9,895,644 |
| Dynatrace, Inc. (a) | | 440,500 | 22,672,535 |
| Elastic NV (a) | | 131,581 | 8,436,974 |
| Five9, Inc. (a) | | 118,800 | 9,795,060 |
| HubSpot, Inc. (a) | | 25,793 | 13,724,197 |
| Intapp, Inc. (a) | | 232,581 | 9,747,470 |
| Intuit, Inc. | | 27,090 | 12,412,367 |
| Microsoft Corp. | | 760,744 | 259,063,759 |
| Oracle Corp. | | 187,400 | 22,317,466 |
| Palo Alto Networks, Inc. (a)(d) | | 26,200 | 6,694,362 |
| Pine Labs Private Ltd. (a)(b)(c) | | 2,299 | 1,174,122 |
| Salesforce, Inc. (a) | | 84,331 | 17,815,767 |
| ServiceNow, Inc. (a) | | 42,218 | 23,725,249 |
| Stripe, Inc. Class B (a)(b)(c) | | 10,400 | 209,352 |
| Viant Technology, Inc. (a) | | 66,759 | 307,759 |
| Workday, Inc. Class A (a) | | 17,300 | 3,907,897 |
| | | | 466,230,708 |
| Technology Hardware, Storage & Peripherals - 2.6% | | | |
| Apple, Inc. | | 322,404 | 62,536,704 |
| Pure Storage, Inc. Class A (a) | | 101,900 | 3,751,958 |
| | | | 66,288,662 |
TOTAL INFORMATION TECHNOLOGY | | | 1,142,971,322 |
| UTILITIES - 2.0% | | | |
| Electric Utilities - 1.5% | | | |
| Constellation Energy Corp. | | 75,033 | 6,869,271 |
| ORSTED A/S (e) | | 96,794 | 9,146,739 |
| PG&E Corp. (a) | | 1,276,600 | 22,059,648 |
| | | | 38,075,658 |
| Independent Power and Renewable Electricity Producers - 0.5% | | | |
| NextEra Energy Partners LP | | 233,100 | 13,668,984 |
TOTAL UTILITIES | | | 51,744,642 |
| TOTAL COMMON STOCKS (Cost $1,568,602,270) | | | 2,490,298,958 |
| | | | |
| Preferred Stocks - 2.5% |
| | | Shares | Value ($) |
| Convertible Preferred Stocks - 1.9% | | | |
| COMMUNICATION SERVICES - 0.2% | | | |
| Interactive Media & Services - 0.2% | | | |
| ByteDance Ltd. Series E1 (a)(b)(c) | | 17,456 | 3,942,263 |
| | | | |
| CONSUMER DISCRETIONARY - 0.1% | | | |
| Automobiles - 0.0% | | | |
| Rad Power Bikes, Inc.: | | | |
| Series A(a)(b)(c) | | 7,410 | 16,524 |
| Series C(a)(b)(c) | | 29,156 | 65,018 |
| Series D(a)(b)(c) | | 54,800 | 122,204 |
| | | | 203,746 |
| Broadline Retail - 0.1% | | | |
| Meesho Series F (a)(b)(c) | | 32,200 | 2,416,610 |
| | | | |
TOTAL CONSUMER DISCRETIONARY | | | 2,620,356 |
| | | | |
| CONSUMER STAPLES - 0.2% | | | |
| Consumer Staples Distribution & Retail - 0.1% | | | |
| GoBrands, Inc. Series G (a)(b)(c) | | 10,300 | 933,283 |
| Instacart, Inc.: | | | |
| Series H(a)(b)(c) | | 39,942 | 1,662,386 |
| Series I(a)(b)(c) | | 13,388 | 557,209 |
| | | | 3,152,878 |
| Food Products - 0.0% | | | |
| Bowery Farming, Inc. Series C1 (a)(b)(c) | | 57,277 | 492,582 |
| | | | |
| Tobacco - 0.1% | | | |
| JUUL Labs, Inc.: | | | |
| Series C(a)(b)(c) | | 131,549 | 957,677 |
| Series D(a)(b)(c) | | 741 | 5,394 |
| | | | 963,071 |
TOTAL CONSUMER STAPLES | | | 4,608,531 |
| | | | |
| FINANCIALS - 0.0% | | | |
| Financial Services - 0.0% | | | |
| Circle Internet Financial Ltd. Series F (a)(b)(c) | | 20,489 | 492,760 |
| | | | |
| HEALTH CARE - 0.1% | | | |
| Health Care Equipment & Supplies - 0.1% | | | |
| Blink Health LLC Series C (a)(b)(c) | | 40,445 | 1,936,102 |
| | | | |
| Health Care Technology - 0.0% | | | |
| Aledade, Inc. Series E1 (a)(b)(c) | | 19,932 | 998,992 |
| | | | |
TOTAL HEALTH CARE | | | 2,935,094 |
| | | | |
| INDUSTRIALS - 0.7% | | | |
| Aerospace & Defense - 0.5% | | | |
| Relativity Space, Inc. Series E (a)(b)(c) | | 149,903 | 2,636,794 |
| Space Exploration Technologies Corp.: | | | |
| Series I(a)(b)(c) | | 3,941 | 3,192,210 |
| Series N(a)(b)(c) | | 8,100 | 6,561,000 |
| | | | 12,390,004 |
| Construction & Engineering - 0.2% | | | |
| Beta Technologies, Inc. Series A (a)(b)(c) | | 64,780 | 6,523,346 |
| | | | |
TOTAL INDUSTRIALS | | | 18,913,350 |
| | | | |
| INFORMATION TECHNOLOGY - 0.5% | | | |
| Electronic Equipment, Instruments & Components - 0.1% | | | |
| CelLink Corp. Series D (a)(b)(c) | | 49,900 | 651,694 |
| Enevate Corp. Series E (a)(b)(c) | | 1,172,546 | 680,077 |
| | | | 1,331,771 |
| IT Services - 0.0% | | | |
| Yanka Industries, Inc.: | | | |
| Series E(a)(b)(c) | | 53,172 | 381,775 |
| Series F(a)(b)(c) | | 55,568 | 398,978 |
| | | | 780,753 |
| Semiconductors & Semiconductor Equipment - 0.1% | | | |
| GaN Systems, Inc.: | | | |
| Series F1(a)(b)(c) | | 44,969 | 497,807 |
| Series F2(a)(b)(c) | | 23,746 | 262,868 |
| SiMa.ai: | | | |
| Series B(a)(b)(c) | | 171,100 | 1,023,178 |
| Series B1(a)(b)(c) | | 24,426 | 171,959 |
| Xsight Labs Ltd. Series D (a)(b)(c) | | 74,300 | 520,843 |
| | | | 2,476,655 |
| Software - 0.3% | | | |
| Convoy, Inc. Series D (a)(b)(c) | | 197,216 | 1,147,797 |
| Databricks, Inc. Series G (a)(b)(c) | | 27,000 | 1,444,770 |
| Moloco, Inc. Series A (b)(c) | | 41,187 | 2,471,220 |
| Mountain Digital, Inc. Series D (a)(b)(c) | | 118,780 | 1,852,968 |
| Stripe, Inc. Series H (a)(b)(c) | | 24,195 | 487,045 |
| Tenstorrent, Inc. Series C1 (a)(b)(c) | | 4,700 | 277,206 |
| | | | 7,681,006 |
TOTAL INFORMATION TECHNOLOGY | | | 12,270,185 |
| | | | |
| MATERIALS - 0.1% | | | |
| Metals & Mining - 0.1% | | | |
| Diamond Foundry, Inc. Series C (a)(b)(c) | | 99,028 | 3,678,890 |
| | | | |
| TOTAL CONVERTIBLE PREFERRED STOCKS | | | 49,461,429 |
| Nonconvertible Preferred Stocks - 0.6% | | | |
| CONSUMER DISCRETIONARY - 0.0% | | | |
| Automobiles - 0.0% | | | |
| Neutron Holdings, Inc. Series 1C (a)(b)(c) | | 1,673,000 | 42,829 |
| Waymo LLC Series A2 (a)(b)(c) | | 7,496 | 381,846 |
| | | | 424,675 |
| FINANCIALS - 0.3% | | | |
| Financial Services - 0.3% | | | |
| Circle Internet Financial Ltd. Series E (a)(b)(c) | | 214,805 | 5,166,060 |
| Thriveworks TopCo LLC Series B (a)(b)(c)(f) | | 105,185 | 1,523,079 |
| | | | 6,689,139 |
| INFORMATION TECHNOLOGY - 0.3% | | | |
| IT Services - 0.0% | | | |
| Gupshup, Inc. (a)(b)(c) | | 70,900 | 807,551 |
| | | | |
| Software - 0.3% | | | |
| Pine Labs Private Ltd.: | | | |
| Series 1(a)(b)(c) | | 5,494 | 2,805,841 |
| Series A(a)(b)(c) | | 1,373 | 701,205 |
| Series B(a)(b)(c) | | 1,494 | 763,001 |
| Series B2(a)(b)(c) | | 1,208 | 616,938 |
| Series C(a)(b)(c) | | 2,247 | 1,147,565 |
| Series C1(a)(b)(c) | | 473 | 241,566 |
| Series D(a)(b)(c) | | 506 | 258,419 |
| | | | 6,534,535 |
TOTAL INFORMATION TECHNOLOGY | | | 7,342,086 |
| | | | |
| TOTAL NONCONVERTIBLE PREFERRED STOCKS | | | 14,455,900 |
| TOTAL PREFERRED STOCKS (Cost $63,568,894) | | | 63,917,329 |
| | | | |
| Convertible Bonds - 0.1% |
| | | Principal Amount (g) | Value ($) |
| CONSUMER DISCRETIONARY - 0.1% | | | |
| Automobiles - 0.1% | | | |
| Neutron Holdings, Inc.: | | | |
| 4% 5/22/27 (b)(c) | | 130,700 | 134,516 |
| 4% 6/12/27 (b)(c) | | 35,600 | 36,640 |
| 4.5% 10/27/25 (b)(c)(h) | | 1,707,782 | 1,648,864 |
| | | | 1,820,020 |
| INFORMATION TECHNOLOGY - 0.0% | | | |
| Software - 0.0% | | | |
| Convoy, Inc. 15% 9/30/26 (b)(c) | | 86,062 | 90,107 |
| TOTAL CONVERTIBLE BONDS (Cost $1,960,144) | | | 1,910,127 |
| | | | |
| Preferred Securities - 0.1% |
| | | Principal Amount (g) | Value ($) |
| INFORMATION TECHNOLOGY - 0.1% | | | |
| Semiconductors & Semiconductor Equipment - 0.1% | | | |
| GaN Systems, Inc. 0% (b)(c)(i) | | 1,054,022 | 1,295,393 |
| Software - 0.0% | | | |
| Tenstorrent, Inc. 0% (b)(c)(i) | | 260,000 | 257,920 |
| TOTAL PREFERRED SECURITIES (Cost $1,314,022) | | | 1,553,313 |
| | | | |
| Money Market Funds - 2.6% |
| | | Shares | Value ($) |
| Fidelity Cash Central Fund 5.14% (j) | | 8,686,785 | 8,688,522 |
| Fidelity Securities Lending Cash Central Fund 5.14% (j)(k) | | 59,626,881 | 59,632,844 |
| TOTAL MONEY MARKET FUNDS (Cost $68,321,366) | | | 68,321,366 |
| | | | |
| Equity Funds - 0.8% |
| | | Shares | Value ($) |
| Domestic Equity Funds - 0.8% | | | |
iShares Russell 1000 Growth Index ETF (d) (Cost $20,334,933) | | 75,800 | 20,858,644 |
| | | | |
| TOTAL INVESTMENT IN SECURITIES - 102.3% (Cost $1,724,101,629) | 2,646,859,737 |
NET OTHER ASSETS (LIABILITIES) - (2.3)% | (59,128,517) |
| NET ASSETS - 100.0% | 2,587,731,220 |
| | |
Security Type Abbreviations
Legend
| (b) | Restricted securities (including private placements) - Investment in securities not registered under the Securities Act of 1933 (excluding 144A issues). At the end of the period, the value of restricted securities (excluding 144A issues) amounted to $82,813,161 or 3.2% of net assets. |
| (d) | Security or a portion of the security is on loan at period end. |
| (e) | Security exempt from registration under Rule 144A of the Securities Act of 1933. These securities may be resold in transactions exempt from registration, normally to qualified institutional buyers. At the end of the period, the value of these securities amounted to $45,939,597 or 1.8% of net assets. |
| (f) | Investment is owned by a wholly-owned subsidiary (Subsidiary) that is treated as a corporation for U.S. tax purposes. |
| (g) | Amount is stated in United States dollars unless otherwise noted. |
| (h) | Security initially issued at one coupon which converts to a higher coupon at a specified date. The rate shown is the rate at period end. |
| (i) | Security is perpetual in nature with no stated maturity date. |
| (j) | Affiliated fund that is generally available only to investment companies and other accounts managed by Fidelity Investments. The rate quoted is the annualized seven-day yield of the fund at period end. A complete unaudited listing of the fund's holdings as of its most recent quarter end is available upon request. In addition, each Fidelity Central Fund's financial statements are available on the SEC's website or upon request. |
| (k) | Investment made with cash collateral received from securities on loan. |
| Additional information on each restricted holding is as follows: |
| Security | Acquisition Date | Acquisition Cost ($) |
| Aledade, Inc. Series E1 | 5/20/22 | 992,901 |
| | | |
| Beta Technologies, Inc. Series A | 4/09/21 | 4,746,431 |
| | | |
| Blink Health LLC Series A1 | 12/30/20 | 225,578 |
| | | |
| Blink Health LLC Series C | 11/07/19 - 7/14/21 | 1,544,028 |
| | | |
| Bombas LLC | 2/16/21 - 11/12/21 | 3,539,531 |
| | | |
| Bowery Farming, Inc. Series C1 | 5/18/21 | 3,450,899 |
| | | |
| ByteDance Ltd. Series E1 | 11/18/20 | 1,912,727 |
| | | |
| CelLink Corp. Series D | 1/20/22 | 1,039,113 |
| | | |
| Circle Internet Financial Ltd. Series E | 5/11/21 | 3,486,300 |
| | | |
| Circle Internet Financial Ltd. Series F | 5/09/22 | 863,406 |
| | | |
| Convoy, Inc. Series D | 10/30/19 | 2,670,305 |
| | | |
| Convoy, Inc. warrants | 3/24/23 | 0 |
| | | |
| Convoy, Inc. 15% 9/30/26 | 3/24/23 | 86,062 |
| | | |
| Databricks, Inc. Series G | 2/01/21 | 1,596,311 |
| | | |
| Diamond Foundry, Inc. Series C | 3/15/21 | 2,376,672 |
| | | |
| Enevate Corp. Series E | 1/29/21 | 1,299,984 |
| | | |
| Epic Games, Inc. | 7/13/20 - 3/29/21 | 6,646,200 |
| | | |
| GaN Systems, Inc. Series F1 | 11/30/21 | 381,337 |
| | | |
| GaN Systems, Inc. Series F2 | 11/30/21 | 201,366 |
| | | |
| GaN Systems, Inc. 0% | 11/30/21 | 1,054,022 |
| | | |
| GoBrands, Inc. Series G | 3/02/21 | 2,572,088 |
| | | |
| Gupshup, Inc. | 6/08/21 | 1,621,143 |
| | | |
| Instacart, Inc. Series H | 11/13/20 | 2,396,520 |
| | | |
| Instacart, Inc. Series I | 2/26/21 | 1,673,500 |
| | | |
| JUUL Labs, Inc. Class B | 11/21/17 | 0 |
| | | |
| JUUL Labs, Inc. Series C | 5/22/15 | 0 |
| | | |
| JUUL Labs, Inc. Series D | 6/25/18 | 0 |
| | | |
| Meesho Series F | 9/21/21 | 2,468,848 |
| | | |
| Moloco, Inc. Series A | 6/26/23 | 2,471,220 |
| | | |
| Mountain Digital, Inc. Series D | 11/05/21 | 2,727,818 |
| | | |
| Neutron Holdings, Inc. | 2/04/21 | 1,066 |
| | | |
| Neutron Holdings, Inc. Series 1C | 7/03/18 | 305,891 |
| | | |
| Neutron Holdings, Inc. 4% 5/22/27 | 6/04/20 | 130,700 |
| | | |
| Neutron Holdings, Inc. 4% 6/12/27 | 6/12/20 | 35,600 |
| | | |
| Neutron Holdings, Inc. 4.5% 10/27/25 | 10/29/21 - 4/27/23 | 1,707,782 |
| | | |
| Payoneer Global, Inc. | 2/03/21 | 654,000 |
| | | |
| Pine Labs Private Ltd. | 6/30/21 | 857,205 |
| | | |
| Pine Labs Private Ltd. Series 1 | 6/30/21 | 2,048,493 |
| | | |
| Pine Labs Private Ltd. Series A | 6/30/21 | 511,937 |
| | | |
| Pine Labs Private Ltd. Series B | 6/30/21 | 557,053 |
| | | |
| Pine Labs Private Ltd. Series B2 | 6/30/21 | 450,415 |
| | | |
| Pine Labs Private Ltd. Series C | 6/30/21 | 837,816 |
| | | |
| Pine Labs Private Ltd. Series C1 | 6/30/21 | 176,363 |
| | | |
| Pine Labs Private Ltd. Series D | 6/30/21 | 188,667 |
| | | |
| Rad Power Bikes, Inc. | 1/21/21 | 274,158 |
| | | |
| Rad Power Bikes, Inc. Series A | 1/21/21 | 35,745 |
| | | |
| Rad Power Bikes, Inc. Series C | 1/21/21 | 140,644 |
| | | |
| Rad Power Bikes, Inc. Series D | 9/17/21 | 525,192 |
| | | |
| Relativity Space, Inc. Series E | 5/27/21 | 3,423,050 |
| | | |
| SiMa.ai Series B | 5/10/21 | 877,298 |
| | | |
| SiMa.ai Series B1 | 4/25/22 - 10/17/22 | 173,203 |
| | | |
| Space Exploration Technologies Corp. Class A | 2/16/21 | 545,987 |
| | | |
| Space Exploration Technologies Corp. Series I | 4/05/18 | 666,029 |
| | | |
| Space Exploration Technologies Corp. Series N | 8/04/20 | 2,187,000 |
| | | |
| Starling Bank Ltd. Series D | 6/18/21 - 4/05/22 | 2,084,120 |
| | | |
| Stripe, Inc. Class B | 5/18/21 | 417,335 |
| | | |
| Stripe, Inc. Series H | 3/15/21 - 5/25/23 | 970,825 |
| | | |
| Tenstorrent, Inc. Series C1 | 4/23/21 | 279,435 |
| | | |
| Tenstorrent, Inc. 0% | 4/23/21 | 260,000 |
| | | |
| Thriveworks TopCo LLC Series B | 7/23/21 - 2/25/22 | 3,019,147 |
| | | |
| Waymo LLC Series A2 | 5/08/20 | 643,661 |
| | | |
| Xsight Labs Ltd. Series D | 2/16/21 | 594,103 |
| | | |
| Yanka Industries, Inc. Series E | 5/15/20 | 642,275 |
| | | |
| Yanka Industries, Inc. Series F | 4/08/21 | 1,771,330 |
| | | |
Affiliated Central Funds
Fiscal year to date information regarding the Fund's investments in Fidelity Central Funds, including the ownership percentage, is presented below.
| Affiliate | Value, beginning of period ($) | Purchases ($) | Sales Proceeds ($) | Dividend Income ($) | Realized Gain (loss) ($) | Change in Unrealized appreciation (depreciation) ($) | Value, end of period ($) | % ownership, end of period |
| Fidelity Cash Central Fund 5.14% | 3,547,601 | 268,919,047 | 263,778,126 | 328,419 | - | - | 8,688,522 | 0.0% |
| Fidelity Securities Lending Cash Central Fund 5.14% | 22,298,774 | 266,427,416 | 229,093,346 | 203,318 | - | - | 59,632,844 | 0.2% |
| Total | 25,846,375 | 535,346,463 | 492,871,472 | 531,737 | - | - | 68,321,366 | |
| | | | | | | | | |
Amounts in the dividend income column in the above table include any capital gain distributions from underlying funds, which are presented in the corresponding line item in the Statement of Operations, if applicable.
Amounts in the dividend income column for Fidelity Securities Lending Cash Central Fund represents the income earned on investing cash collateral, less rebates paid to borrowers and any lending agent fees associated with the loan, plus any premium payments received for lending certain types of securities.
Amounts included in the purchases and sales proceeds columns may include in-kind transactions, if applicable.
Investment Valuation
The following is a summary of the inputs used, as of June 30, 2023, involving the Fund's assets and liabilities carried at fair value. The inputs or methodology used for valuing securities may not be an indication of the risk associated with investing in those securities. For more information on valuation inputs, and their aggregation into the levels used below, please refer to the Investment Valuation section in the accompanying Notes to Financial Statements.
| Valuation Inputs at Reporting Date: |
| Description | Total ($) | Level 1 ($) | Level 2 ($) | Level 3 ($) |
Investments in Securities: | | | | |
|
| Equities: | | | | |
Communication Services | 440,672,115 | 430,946,117 | - | 9,725,998 |
Consumer Discretionary | 206,972,182 | 201,552,264 | - | 5,419,918 |
Consumer Staples | 7,746,345 | 3,133,737 | - | 4,612,608 |
Energy | 63,870,148 | 63,870,148 | - | - |
Financials | 249,735,326 | 234,137,972 | 4,329,169 | 11,268,185 |
Health Care | 237,555,268 | 234,221,561 | - | 3,333,707 |
Industrials | 129,657,778 | 109,691,422 | - | 19,966,356 |
Information Technology | 1,162,583,593 | 1,141,553,861 | - | 21,029,732 |
Materials | 3,678,890 | - | - | 3,678,890 |
Utilities | 51,744,642 | 51,744,642 | - | - |
|
| Corporate Bonds | 1,910,127 | - | - | 1,910,127 |
|
| Preferred Securities | 1,553,313 | - | - | 1,553,313 |
|
| Money Market Funds | 68,321,366 | 68,321,366 | - | - |
|
| Equity Funds | 20,858,644 | 20,858,644 | - | - |
| Total Investments in Securities: | 2,646,859,737 | 2,560,031,734 | 4,329,169 | 82,498,834 |
The following is a reconciliation of Investments in Securities for which Level 3 inputs were used in determining value:
| |
| Investments in Securities: | |
| Beginning Balance | $ | 79,404,535 | |
| Net Realized Gain (Loss) on Investment Securities | | - | |
| Net Unrealized Gain (Loss) on Investment Securities | | 119,868 | |
| Cost of Purchases | | 3,473,650 | |
| Proceeds of Sales | | (499,219) | |
| Amortization/Accretion | | - | |
| Transfers into Level 3 | | - | |
| Transfers out of Level 3 | | - | |
| Ending Balance | $ | 82,498,834 | |
| The change in unrealized gain (loss) for the period attributable to Level 3 securities held at June 30, 2023 | $ | 97,399 | |
| The information used in the above reconciliation represents fiscal year to date activity for any Investments in Securities identified as using Level 3 inputs at either the beginning or the end of the current fiscal period. Cost of purchases and proceeds of sales may include securities received and/or delivered through in-kind transactions, corporate actions or exchanges. Transfers into Level 3 were attributable to a lack of observable market data resulting from decreases in market activity, decreases in liquidity, security restructurings or corporate actions. Transfers out of Level 3 were attributable to observable market data becoming available for those securities. Transfers in or out of Level 3 represent the beginning value of any Security or Instrument where a change in the pricing level occurred from the beginning to the end of the period. Realized and unrealized gains (losses) disclosed in the reconciliation are included in Net Gain (Loss) on the Fund's Statement of Operations. | |
| Statement of Assets and Liabilities |
| | | | June 30, 2023 (Unaudited) |
| | | | | |
| Assets | | | | |
| Investment in securities, at value (including securities loaned of $59,050,501) - See accompanying schedule: | | | | |
Unaffiliated issuers (cost $1,655,780,263) | $ | 2,578,538,371 | | |
Fidelity Central Funds (cost $68,321,366) | | 68,321,366 | | |
| | | | | |
| | | | | |
| Total Investment in Securities (cost $1,724,101,629) | | | $ | 2,646,859,737 |
| Cash | | | | 4 |
| Foreign currency held at value (cost $74,471) | | | | 74,471 |
| Receivable for investments sold | | | | 110,901 |
| Receivable for fund shares sold | | | | 2,008,930 |
| Dividends receivable | | | | 646,197 |
| Interest receivable | | | | 40,786 |
| Distributions receivable from Fidelity Central Funds | | | | 74,245 |
| Other receivables | | | | 1,467 |
Total assets | | | | 2,649,816,738 |
| Liabilities | | | | |
| Payable for fund shares redeemed | $ | 827,125 | | |
| Accrued management fee | | 1,104,947 | | |
| Distribution and service plan fees payable | | 239,877 | | |
| Other affiliated payables | | 243,284 | | |
| Other payables and accrued expenses | | 44,658 | | |
| Collateral on securities loaned | | 59,625,627 | | |
| Total Liabilities | | | | 62,085,518 |
| Net Assets | | | $ | 2,587,731,220 |
| Net Assets consist of: | | | | |
| Paid in capital | | | $ | 1,944,718,882 |
| Total accumulated earnings (loss) | | | | 643,012,338 |
| Net Assets | | | $ | 2,587,731,220 |
| | | | | |
| Net Asset Value and Maximum Offering Price | | | | |
| Initial Class : | | | | |
Net Asset Value , offering price and redemption price per share ($441,913,583 ÷ 8,276,126 shares) | | | $ | 53.40 |
| Service Class : | | | | |
Net Asset Value , offering price and redemption price per share ($121,107,552 ÷ 2,278,058 shares) | | | $ | 53.16 |
| Service Class 2 : | | | | |
Net Asset Value , offering price and redemption price per share ($1,127,671,529 ÷ 21,735,328 shares) | | | $ | 51.88 |
| Investor Class : | | | | |
Net Asset Value , offering price and redemption price per share ($897,038,556 ÷ 16,991,341 shares) | | | $ | 52.79 |
| Statement of Operations |
| | | | Six months ended June 30, 2023 (Unaudited) |
| Investment Income | | | | |
| Dividends | | | $ | 5,981,305 |
| Interest | | | | 77,309 |
| Income from Fidelity Central Funds (including $203,318 from security lending) | | | | 531,737 |
| Total Income | | | | 6,590,351 |
| Expenses | | | | |
| Management fee | $ | 5,795,290 | | |
| Transfer agent fees | | 992,984 | | |
| Distribution and service plan fees | | 1,297,832 | | |
| Accounting fees | | 293,355 | | |
| Custodian fees and expenses | | 24,279 | | |
| Independent trustees' fees and expenses | | 7,190 | | |
| Audit | | 47,310 | | |
| Legal | | 6,706 | | |
| Interest | | 821 | | |
| Miscellaneous | | 5,938 | | |
| Total expenses before reductions | | 8,471,705 | | |
| Expense reductions | | (47,491) | | |
| Total expenses after reductions | | | | 8,424,214 |
| Net Investment income (loss) | | | | (1,833,863) |
| Realized and Unrealized Gain (Loss) | | | | |
| Net realized gain (loss) on: | | | | |
| Investment Securities: | | | | |
| Unaffiliated issuers (net of foreign taxes of $515,911) | | (13,382,641) | | |
| Foreign currency transactions | | (60,154) | | |
| Total net realized gain (loss) | | | | (13,442,795) |
| Change in net unrealized appreciation (depreciation) on: | | | | |
| Investment Securities: | | | | |
| Unaffiliated issuers (net of decrease in deferred foreign taxes of $448,746) | | 599,288,529 | | |
| Unfunded commitments | | 174,892 | | |
| Assets and liabilities in foreign currencies | | 2,529 | | |
| Total change in net unrealized appreciation (depreciation) | | | | 599,465,950 |
| Net gain (loss) | | | | 586,023,155 |
| Net increase (decrease) in net assets resulting from operations | | | $ | 584,189,292 |
| Statement of Changes in Net Assets |
| |
| | Six months ended June 30, 2023 (Unaudited) | | Year ended December 31, 2022 |
| Increase (Decrease) in Net Assets | | | | |
| Operations | | | | |
| Net investment income (loss) | $ | (1,833,863) | $ | (4,303,388) |
| Net realized gain (loss) | | (13,442,795) | | (223,211,828) |
| Change in net unrealized appreciation (depreciation) | | 599,465,950 | | (994,063,888) |
| Net increase (decrease) in net assets resulting from operations | | 584,189,292 | | (1,221,579,104) |
| Distributions to shareholders | | - | | (455,527,380) |
| | | | | |
| Share transactions - net increase (decrease) | | 96,924,137 | | 287,378,244 |
| Total increase (decrease) in net assets | | 681,113,429 | | (1,389,728,240) |
| | | | | |
| Net Assets | | | | |
| Beginning of period | | 1,906,617,791 | | 3,296,346,031 |
| End of period | $ | 2,587,731,220 | $ | 1,906,617,791 |
| | | | | |
| | | | | |
| VIP Growth Opportunities Portfolio Initial Class |
| |
| | Six months ended (Unaudited) June 30, 2023 | | Years ended December 31, 2022 | | 2021 | | 2020 | | 2019 | | 2018 |
Selected Per-Share Data | | | | | | | | | | | | |
| Net asset value, beginning of period | $ | 41.03 | $ | 79.25 | $ | 77.54 | $ | 48.86 | $ | 38.01 | $ | 36.08 |
| Income from Investment Operations | | | | | | | | | | | | |
Net investment income (loss) A,B | | (.01) | | (.02) | | (.24) | | (.06) | | .09 C | | .03 |
| Net realized and unrealized gain (loss) | | 12.38 | | (27.11) | | 9.38 | | 32.11 | | 14.54 | | 4.19 |
| Total from investment operations | | 12.37 | | (27.13) | | 9.14 | | 32.05 | | 14.63 | | 4.22 |
| Distributions from net investment income | | - | | - | | - | | (.01) | | (.07) | | (.05) |
| Distributions from net realized gain | | - | | (11.09) | | (7.43) | | (3.36) | | (3.71) | | (2.24) |
| Total distributions | | - | | (11.09) | | (7.43) | | (3.37) | | (3.78) | | (2.29) |
| Net asset value, end of period | $ | 53.40 | $ | 41.03 | $ | 79.25 | $ | 77.54 | $ | 48.86 | $ | 38.01 |
Total Return D,E,F | | 30.15% | | (38.15)% | | 11.94% | | 68.66% | | 40.84% | | 12.46% |
Ratios to Average Net Assets B,G,H | | | | | | | | | | | | |
| Expenses before reductions | | .62% I | | .62% | | .62% | | .64% | | .64% | | .65% |
| Expenses net of fee waivers, if any | | .62% I | | .62% | | .62% | | .64% | | .64% | | .65% |
| Expenses net of all reductions | | .62% I | | .62% | | .62% | | .63% | | .64% | | .65% |
| Net investment income (loss) | | (.02)% I | | (.05)% | | (.30)% | | (.10)% | | .20% C | | .09% |
| Supplemental Data | | | | | | | | | | | | |
| Net assets, end of period (000 omitted) | $ | 441,914 | $ | 256,757 | $ | 471,980 | $ | 470,897 | $ | 284,621 | $ | 187,106 |
Portfolio turnover rate J | | 64% I | | 68% | | 82% | | 65% | | 49% | | 39% |
A Calculated based on average shares outstanding during the period.
B Net investment income (loss) is affected by the timing of the declaration of dividends by any underlying mutual funds or exchange-traded funds (ETFs). Net investment income (loss) of any mutual funds or ETFs is not included in the Fund's net investment income (loss) ratio.
C Net investment income per share reflects one or more large, non-recurring dividend(s) which amounted to $.07 per share. Excluding such non-recurring dividend(s), the ratio of net investment income (loss) to average net assets would have been .03%.
D Total returns for periods of less than one year are not annualized.
E Total returns do not reflect charges attributable to your insurance company's separate account. Inclusion of these charges would reduce the total returns shown.
F Total returns would have been lower if certain expenses had not been reduced during the applicable periods shown.
G Fees and expenses of any underlying mutual funds or exchange-traded funds (ETFs) are not included in the Fund's expense ratio. The Fund indirectly bears its proportionate share of these expenses. For additional expense information related to investments in Fidelity Central Funds, please refer to the "Investments in Fidelity Central Funds" note found in the Notes to Financial Statements section of the most recent Annual or Semi-Annual report.
H Expense ratios reflect operating expenses of the class. Expenses before reductions do not reflect amounts reimbursed, waived, or reduced through arrangements with the investment adviser, brokerage services, or other offset arrangements, if applicable, and do not represent the amount paid by the class during periods when reimbursements, waivers or reductions occur.
I Annualized.
J Amount does not include the portfolio activity of any underlying mutual funds or exchange-traded funds (ETFs).
| VIP Growth Opportunities Portfolio Service Class |
| |
| | Six months ended (Unaudited) June 30, 2023 | | Years ended December 31, 2022 | | 2021 | | 2020 | | 2019 | | 2018 |
Selected Per-Share Data | | | | | | | | | | | | |
| Net asset value, beginning of period | $ | 40.87 | $ | 79.06 | $ | 77.37 | $ | 48.77 | $ | 37.95 | $ | 36.02 |
| Income from Investment Operations | | | | | | | | | | | | |
Net investment income (loss) A,B | | (.03) | | (.07) | | (.32) | | (.12) | | .04 C | | - D |
| Net realized and unrealized gain (loss) | | 12.32 | | (27.03) | | 9.35 | | 32.04 | | 14.52 | | 4.17 |
| Total from investment operations | | 12.29 | | (27.10) | | 9.03 | | 31.92 | | 14.56 | | 4.17 |
| Distributions from net investment income | | - | | - | | - | | - D | | (.02) | | (.04) |
| Distributions from net realized gain | | - | | (11.09) | | (7.34) | | (3.31) | | (3.71) | | (2.20) |
| Total distributions | | - | | (11.09) | | (7.34) | | (3.32) E | | (3.74) E | | (2.24) |
| Net asset value, end of period | $ | 53.16 | $ | 40.87 | $ | 79.06 | $ | 77.37 | $ | 48.77 | $ | 37.95 |
Total Return F,G,H | | 30.07% | | (38.21)% | | 11.83% | | 68.49% | | 40.70% | | 12.35% |
Ratios to Average Net Assets B,I,J | | | | | | | | | | | | |
| Expenses before reductions | | .72% K | | .72% | | .72% | | .74% | | .74% | | .75% |
| Expenses net of fee waivers, if any | | .72% K | | .72% | | .72% | | .74% | | .74% | | .75% |
| Expenses net of all reductions | | .72% K | | .72% | | .72% | | .73% | | .74% | | .75% |
| Net investment income (loss) | | (.12)% K | | (.15)% | | (.40)% | | (.20)% | | .10% C | | (.01)% |
| Supplemental Data | | | | | | | | | | | | |
| Net assets, end of period (000 omitted) | $ | 121,108 | $ | 94,433 | $ | 157,797 | $ | 163,452 | $ | 111,145 | $ | 94,561 |
Portfolio turnover rate L | | 64% K | | 68% | | 82% | | 65% | | 49% | | 39% |
A Calculated based on average shares outstanding during the period.
B Net investment income (loss) is affected by the timing of the declaration of dividends by any underlying mutual funds or exchange-traded funds (ETFs). Net investment income (loss) of any mutual funds or ETFs is not included in the Fund's net investment income (loss) ratio.
C Net investment income per share reflects one or more large, non-recurring dividend(s) which amounted to $.07 per share. Excluding such non-recurring dividend(s), the ratio of net investment income (loss) to average net assets would have been (.07)%.
D Amount represents less than $.005 per share.
E Total distributions per share do not sum due to rounding.
F Total returns for periods of less than one year are not annualized.
G Total returns do not reflect charges attributable to your insurance company's separate account. Inclusion of these charges would reduce the total returns shown.
H Total returns would have been lower if certain expenses had not been reduced during the applicable periods shown.
I Fees and expenses of any underlying mutual funds or exchange-traded funds (ETFs) are not included in the Fund's expense ratio. The Fund indirectly bears its proportionate share of these expenses. For additional expense information related to investments in Fidelity Central Funds, please refer to the "Investments in Fidelity Central Funds" note found in the Notes to Financial Statements section of the most recent Annual or Semi-Annual report.
J Expense ratios reflect operating expenses of the class. Expenses before reductions do not reflect amounts reimbursed, waived, or reduced through arrangements with the investment adviser, brokerage services, or other offset arrangements, if applicable, and do not represent the amount paid by the class during periods when reimbursements, waivers or reductions occur.
K Annualized.
L Amount does not include the portfolio activity of any underlying mutual funds or exchange-traded funds (ETFs).
| VIP Growth Opportunities Portfolio Service Class 2 |
| |
| | Six months ended (Unaudited) June 30, 2023 | | Years ended December 31, 2022 | | 2021 | | 2020 | | 2019 | | 2018 |
Selected Per-Share Data | | | | | | | | | | | | |
| Net asset value, beginning of period | $ | 39.91 | $ | 77.62 | $ | 76.08 | $ | 48.05 | $ | 37.46 | $ | 35.60 |
| Income from Investment Operations | | | | | | | | | | | | |
Net investment income (loss) A,B | | (.06) | | (.14) | | (.44) | | (.20) | | (.02) C | | (.06) |
| Net realized and unrealized gain (loss) | | 12.03 | | (26.48) | | 9.22 | | 31.50 | | 14.31 | | 4.13 |
| Total from investment operations | | 11.97 | | (26.62) | | 8.78 | | 31.30 | | 14.29 | | 4.07 |
| Distributions from net investment income | | - | | - | | - | | - | | - | | (.03) |
| Distributions from net realized gain | | - | | (11.09) | | (7.24) | | (3.27) | | (3.70) | | (2.17) |
| Total distributions | | - | | (11.09) | | (7.24) | | (3.27) | | (3.70) | | (2.21) D |
| Net asset value, end of period | $ | 51.88 | $ | 39.91 | $ | 77.62 | $ | 76.08 | $ | 48.05 | $ | 37.46 |
Total Return E,F,G | | 29.99% | | (38.32)% | | 11.68% | | 68.21% | | 40.49% | | 12.18% |
Ratios to Average Net Assets A,H,I | | | | | | | | | | | | |
| Expenses before reductions | | .87% J | | .87% | | .87% | | .88% | | .89% | | .90% |
| Expenses net of fee waivers, if any | | .87% J | | .87% | | .87% | | .88% | | .89% | | .90% |
| Expenses net of all reductions | | .87% J | | .87% | | .87% | | .88% | | .89% | | .90% |
| Net investment income (loss) | | (.27)% J | | (.30)% | | (.55)% | | (.35)% | | (.05)% C | | (.16)% |
| Supplemental Data | | | | | | | | | | | | |
| Net assets, end of period (000 omitted) | $ | 1,127,672 | $ | 868,129 | $ | 1,304,134 | $ | 1,079,778 | $ | 505,917 | $ | 273,228 |
Portfolio turnover rate K | | 64% J | | 68% | | 82% | | 65% | | 49% | | 39% |
A Net investment income (loss) is affected by the timing of the declaration of dividends by any underlying mutual funds or exchange-traded funds (ETFs). Net investment income (loss) of any mutual funds or ETFs is not included in the Fund's net investment income (loss) ratio.
B Calculated based on average shares outstanding during the period.
C Net investment income per share reflects one or more large, non-recurring dividend(s) which amounted to $.07 per share. Excluding such non-recurring dividend(s), the ratio of net investment income (loss) to average net assets would have been (.22)%.
D Total distributions per share do not sum due to rounding.
E Total returns for periods of less than one year are not annualized.
F Total returns do not reflect charges attributable to your insurance company's separate account. Inclusion of these charges would reduce the total returns shown.
G Total returns would have been lower if certain expenses had not been reduced during the applicable periods shown.
H Fees and expenses of any underlying mutual funds or exchange-traded funds (ETFs) are not included in the Fund's expense ratio. The Fund indirectly bears its proportionate share of these expenses. For additional expense information related to investments in Fidelity Central Funds, please refer to the "Investments in Fidelity Central Funds" note found in the Notes to Financial Statements section of the most recent Annual or Semi-Annual report.
I Expense ratios reflect operating expenses of the class. Expenses before reductions do not reflect amounts reimbursed, waived, or reduced through arrangements with the investment adviser, brokerage services, or other offset arrangements, if applicable, and do not represent the amount paid by the class during periods when reimbursements, waivers or reductions occur.
J Annualized.
K Amount does not include the portfolio activity of any underlying mutual funds or exchange-traded funds (ETFs).
| VIP Growth Opportunities Portfolio Investor Class |
| |
| | Six months ended (Unaudited) June 30, 2023 | | Years ended December 31, 2022 | | 2021 | | 2020 | | 2019 | | 2018 |
Selected Per-Share Data | | | | | | | | | | | | |
| Net asset value, beginning of period | $ | 40.58 | $ | 78.58 | $ | 76.94 | $ | 48.52 | $ | 37.78 | $ | 35.88 |
| Income from Investment Operations | | | | | | | | | | | | |
Net investment income (loss) A,B | | (.02) | | (.06) | | (.30) | | (.10) | | .05 C | | - D |
| Net realized and unrealized gain (loss) | | 12.23 | | (26.85) | | 9.31 | | 31.86 | | 14.44 | | 4.16 |
| Total from investment operations | | 12.21 | | (26.91) | | 9.01 | | 31.76 | | 14.49 | | 4.16 |
| Distributions from net investment income | | - | | - | | - | | (.01) | | (.04) | | (.04) |
| Distributions from net realized gain | | - | | (11.09) | | (7.37) | | (3.33) | | (3.71) | | (2.22) |
| Total distributions | | - | | (11.09) | | (7.37) | | (3.34) | | (3.75) | | (2.26) |
| Net asset value, end of period | $ | 52.79 | $ | 40.58 | $ | 78.58 | $ | 76.94 | $ | 48.52 | $ | 37.78 |
Total Return E,F,G | | 30.09% | | (38.20)% | | 11.87% | | 68.52% | | 40.71% | | 12.37% |
Ratios to Average Net Assets B,H,I | | | | | | | | | | | | |
| Expenses before reductions | | .70% J | | .70% | | .70% | | .71% | | .72% | | .73% |
| Expenses net of fee waivers, if any | | .69% J | | .70% | | .70% | | .71% | | .72% | | .73% |
| Expenses net of all reductions | | .69% J | | .70% | | .70% | | .71% | | .72% | | .73% |
| Net investment income (loss) | | (.10)% J | | (.12)% | | (.38)% | | (.18)% | | .12% C | | .01% |
| Supplemental Data | | | | | | | | | | | | |
| Net assets, end of period (000 omitted) | $ | 897,039 | $ | 687,300 | $ | 1,362,435 | $ | 1,251,032 | $ | 647,493 | $ | 347,473 |
Portfolio turnover rate K | | 64% J | | 68% | | 82% | | 65% | | 49% | | 39% |
A Calculated based on average shares outstanding during the period.
B Net investment income (loss) is affected by the timing of the declaration of dividends by any underlying mutual funds or exchange-traded funds (ETFs). Net investment income (loss) of any mutual funds or ETFs is not included in the Fund's net investment income (loss) ratio.
C Net investment income per share reflects one or more large, non-recurring dividend(s) which amounted to $.07 per share. Excluding such non-recurring dividend(s), the ratio of net investment income (loss) to average net assets would have been (.05)%.
D Amount represents less than $.005 per share.
E Total returns for periods of less than one year are not annualized.
F Total returns do not reflect charges attributable to your insurance company's separate account. Inclusion of these charges would reduce the total returns shown.
G Total returns would have been lower if certain expenses had not been reduced during the applicable periods shown.
H Fees and expenses of any underlying mutual funds or exchange-traded funds (ETFs) are not included in the Fund's expense ratio. The Fund indirectly bears its proportionate share of these expenses. For additional expense information related to investments in Fidelity Central Funds, please refer to the "Investments in Fidelity Central Funds" note found in the Notes to Financial Statements section of the most recent Annual or Semi-Annual report.
I Expense ratios reflect operating expenses of the class. Expenses before reductions do not reflect amounts reimbursed, waived, or reduced through arrangements with the investment adviser, brokerage services, or other offset arrangements, if applicable, and do not represent the amount paid by the class during periods when reimbursements, waivers or reductions occur.
J Annualized.
K Amount does not include the portfolio activity of any underlying mutual funds or exchange-traded funds (ETFs).
For the period ended June 30, 2023
1. Organization.
VIP Growth Opportunities Portfolio (the Fund) is a fund of Variable Insurance Products Fund III (the Trust) and is authorized to issue an unlimited number of shares. The Trust is registered under the Investment Company Act of 1940, as amended (the 1940 Act), as an open-end management investment company organized as a Massachusetts business trust. Shares of the Fund may only be purchased by insurance companies for the purpose of funding variable annuity or variable life insurance contracts. The Fund offers the following classes of shares: Initial Class shares, Service Class shares, Service Class 2 shares and Investor Class shares. All classes have equal rights and voting privileges, except for matters affecting a single class.
2. Investments in Fidelity Central Funds.
Funds may invest in Fidelity Central Funds, which are open-end investment companies generally available only to other investment companies and accounts managed by the investment adviser and its affiliates. The Schedule of Investments lists any Fidelity Central Funds held as an investment as of period end, but does not include the underlying holdings of each Fidelity Central Fund. An investing fund indirectly bears its proportionate share of the expenses of the underlying Fidelity Central Funds.
Based on its investment objective, each Fidelity Central Fund may invest or participate in various investment vehicles or strategies that are similar to those of the investing fund. These strategies are consistent with the investment objectives of the investing fund and may involve certain economic risks which may cause a decline in value of each of the Fidelity Central Funds and thus a decline in the value of the investing fund.
| Fidelity Central Fund | Investment Manager | Investment Objective | Investment Practices | Expense Ratio A |
| Fidelity Money Market Central Funds | Fidelity Management & Research Company LLC (FMR) | Each fund seeks to obtain a high level of current income consistent with the preservation of capital and liquidity. | Short-term Investments | Less than .005% |
A Expenses expressed as a percentage of average net assets and are as of each underlying Central Fund's most recent annual or semi-annual shareholder report.
A complete unaudited list of holdings for each Fidelity Central Fund is available upon request or at the Securities and Exchange Commission website at www.sec.gov. In addition, the financial statements of the Fidelity Central Funds which contain the significant accounting policies (including investment valuation policies) of those funds, and are not covered by the Report of Independent Registered Public Accounting Firm, are available on the Securities and Exchange Commission website or upon request.
3. Significant Accounting Policies.
The Fund is an investment company and applies the accounting and reporting guidance of the Financial Accounting Standards Board (FASB) Accounting Standards Codification Topic 946 Financial Services - Investment Companies . The financial statements have been prepared in conformity with accounting principles generally accepted in the United States of America (GAAP), which require management to make certain estimates and assumptions at the date of the financial statements. Actual results could differ from those estimates. Subsequent events, if any, through the date that the financial statements were issued have been evaluated in the preparation of the financial statements. The Fund's Schedule of Investments lists any underlying mutual funds or exchange-traded funds (ETFs) but does not include the underlying holdings of these funds. The following summarizes the significant accounting policies of the Fund:
Investment Valuation. Investments are valued as of 4:00 p.m. Eastern time on the last calendar day of the period. The Board of Trustees (the Board) has designated the Fund's investment adviser as the valuation designee responsible for the fair valuation function and performing fair value determinations as needed. The investment adviser has established a Fair Value Committee (the Committee) to carry out the day-to-day fair valuation responsibilities and has adopted policies and procedures to govern the fair valuation process and the activities of the Committee. In accordance with these fair valuation policies and procedures, which have been approved by the Board, the Fund attempts to obtain prices from one or more third party pricing services or brokers to value its investments. When current market prices, quotations or currency exchange rates are not readily available or reliable, investments will be fair valued in good faith by the Committee, in accordance with the policies and procedures. Factors used in determining fair value vary by investment type and may include market or investment specific events, transaction data, estimated cash flows, and market observations of comparable investments. The frequency that the fair valuation procedures are used cannot be predicted and they may be utilized to a significant extent. The Committee manages the Fund's fair valuation practices and maintains the fair valuation policies and procedures. The Fund's investment adviser reports to the Board information regarding the fair valuation process and related material matters.
The Fund categorizes the inputs to valuation techniques used to value its investments into a disclosure hierarchy consisting of three levels as shown below:
Level 1 - unadjusted quoted prices in active markets for identical investments
Level 2 - other significant observable inputs (including quoted prices for similar investments, interest rates, prepayment speeds, etc.)
Level 3 - unobservable inputs (including the Fund's own assumptions based on the best information available)
Valuation techniques used to value the Fund's investments by major category are as follows:
Equity securities, including restricted securities, for which market quotations are readily available, are valued at the last reported sale price or official closing price as reported by a third party pricing service on the primary market or exchange on which they are traded and are categorized as Level 1 in the hierarchy. In the event there were no sales during the day or closing prices are not available, securities are valued at the last quoted bid price or may be valued using the last available price and are generally categorized as Level 2 in the hierarchy. For foreign equity securities, when market or security specific events arise, comparisons to the valuation of American Depositary Receipts (ADRs), futures contracts, Exchange-Traded Funds (ETFs) and certain indexes as well as quoted prices for similar securities may be used and would be categorized as Level 2 in the hierarchy. For equity securities, including restricted securities, where observable inputs are limited, assumptions about market activity and risk are used and these securities may be categorized as Level 3 in the hierarchy. Securities, including private placements or other restricted securities, for which observable inputs are not available are valued using alternate valuation approaches, including the market approach, the income approach and cost approach, and are categorized as Level 3 in the hierarchy. The market approach considers factors including the price of recent investments in the same or a similar security or financial metrics of comparable securities. The income approach considers factors including expected future cash flows, security specific risks and corresponding discount rates. The cost approach considers factors including the value of the security's underlying assets and liabilities.
Debt securities, including restricted securities, are valued based on evaluated prices received from third party pricing services or from brokers who make markets in such securities. Corporate bonds and preferred securities are valued by pricing services who utilize matrix pricing which considers yield or price of bonds of comparable quality, coupon, maturity and type or by broker-supplied prices. When independent prices are unavailable or unreliable, debt securities may be valued utilizing pricing methodologies which consider similar factors that would be used by third party pricing services. Debt securities are generally categorized as Level 2 in the hierarchy but may be Level 3 depending on the circumstances. Exchange-Traded Funds (ETFs) are valued at their last sale price or official closing price as reported by a third party pricing service on the primary market or exchange on which they are traded and are categorized as Level 1 in the hierarchy. In the event there were no sales during the day but the exchange reports a closing bid level, ETFs are valued at the closing bid and would be categorized as Level 1 in the hierarchy. In the event there was no closing bid, ETFs may be valued by another method that the Board believes reflects fair value in accordance with the Board's fair value pricing policies and may be categorized as Level 2 in the hierarchy.
Investments in open-end mutual funds, including the Fidelity Central Funds, are valued at their closing net asset value (NAV) each business day and are categorized as Level 1 in the hierarchy.
The following provides information on Level 3 securities held by the Fund that were valued at period end based on unobservable inputs. These amounts exclude valuations provided by a broker.
| Asset Type | Fair Value | Valuation Technique(s) | Unobservable Input | Amount or Range/Weighted Average | Impact to Valuation from an Increase in Input A |
| Equities | $79,035,394 | Market comparable | Enterprise value/EBITDA multiple (EV/EBITDA) | 13.5 - 16.0 / 15.2 | Increase |
| | | | Enterprise value/Revenue multiple (EV/R) | 1.4 - 25.0 / 7.8 | Increase |
| | | | Enterprise value/Net income multiple (EV/NI) | 14.5 | Increase |
| | | | Enterprise value/Gross profit multiple (EV/GP) | 5.3 | Increase |
| | | | Probability rate | $25.00 - $75.00 / $50.00 | Increase |
| | | Recovery value | Recovery value | $0.00 - $0.31 / $0.13 | Increase |
| | | Market approach | Transaction price | $1.11 - $91.72 / $38.57 | Increase |
| | | | Discount rate | 15.0% - 50.0% / 37.3% | Decrease |
| | | | Premium rate | 10.0% | Increase |
| | | Discounted cash flow | Weighted average cost of capital (WACC) | 29.0% | Decrease |
| | | | Exit multiple | 1.8 | Increase |
| | | Black scholes | Discount rate | 4.0% - 4.7% / 4.3% | Increase |
| | | | Volatility | 50.0% - 100.0% / 72.2% | Increase |
| | | | Term | 2.0 - 5.0 / 3.7 | Increase |
| Corporate Bonds | $1,910,127 | Market comparable | Enterprise value/Revenue multiple (EV/R) | 1.4 - 2.5 / 2.4 | Increase |
| | | | Discount rate | 29.2% | Decrease |
| | | | Probability rate | 10.0% - 70.0% / 40.0% | Increase |
| | | Black scholes | Discount rate | 4.7% | Increase |
| | | | Volatility | 60.0% - 75.0% / 74.2% | Increase |
| | | | Term | 1.3 - 2.0 / 1.3 | Increase |
| Preferred Securities | $1,553,313 | Market comparable | Enterprise value/Revenue multiple (EV/R) | 4.5 | Increase |
| | | Market approach | Transaction price | $59.45 | Increase |
| | | | Premium rate | 10.0% | Increase |
| | | Discounted cash flow | Discount rate | 20.0% | Decrease |
| | | Black scholes | Discount rate | 4.70% | Increase |
| | | | Volatility | 70.0% | Increase |
| | | | Term | 2.0 | Increase |
A Represents the directional change in the fair value of the Level 3 investments that could have resulted from an increase in the corresponding input as of period end. A decrease to the unobservable input would have had the opposite effect. Significant changes in these inputs may have resulted in a significantly higher or lower fair value measurement at period end.
Changes in valuation techniques may result in transfers in or out of an assigned level within the disclosure hierarchy. The aggregate value of investments by input level as of June 30, 2023, as well as a roll forward of Level 3 investments, is included at the end of the Fund's Schedule of Investments.
Foreign Currency. Certain Funds may use foreign currency contracts to facilitate transactions in foreign-denominated securities. Gains and losses from these transactions may arise from changes in the value of the foreign currency or if the counterparties do not perform under the contracts' terms.
Foreign-denominated assets, including investment securities, and liabilities are translated into U.S. dollars at the exchange rates at period end. Purchases and sales of investment securities, income and dividends received, and expenses denominated in foreign currencies are translated into U.S. dollars at the exchange rate in effect on the transaction date.
The effects of exchange rate fluctuations on investments are included with the net realized and unrealized gain (loss) on investment securities. Other foreign currency transactions resulting in realized and unrealized gain (loss) are disclosed separately.
Investment Transactions and Income. For financial reporting purposes, the Fund's investment holdings and NAV include trades executed through the end of the last business day of the period. The NAV per share for processing shareholder transactions is calculated as of the close of business of the New York Stock Exchange (NYSE), normally 4:00 p.m. Eastern time and includes trades executed through the end of the prior business day. Gains and losses on securities sold are determined on the basis of identified cost and include proceeds received from litigation. Commissions paid to certain brokers with whom the investment adviser, or its affiliates, places trades on behalf of a fund include an amount in addition to trade execution, which may be rebated back to a fund. Any such rebates are included in net realized gain (loss) on investments in the Statement of Operations. Dividend income is recorded on the ex-dividend date, except for certain dividends from foreign securities where the ex-dividend date may have passed, which are recorded as soon as the Fund is informed of the ex-dividend date. Non-cash dividends included in dividend income, if any, are recorded at the fair market value of the securities received. Income and capital gain distributions from Fidelity Central Funds, if any, are recorded on the ex-dividend date. Certain distributions received by the Fund represent a return of capital or capital gain. The Fund determines the components of these distributions subsequent to the ex-dividend date, based upon receipt of tax filings or other correspondence relating to the underlying investment. These distributions are recorded as a reduction of cost of investments and/or as a realized gain. Interest income is accrued as earned and includes coupon interest and amortization of premium and accretion of discount on debt securities as applicable. Investment income is recorded net of foreign taxes withheld where recovery of such taxes is uncertain. Funds may file withholding tax reclaims in certain jurisdictions to recover a portion of amounts previously withheld. Any withholding tax reclaims income is included in the Statement of Operations in dividends. Any receivables for withholding tax reclaims are included in the Statement of Assets and Liabilities in dividends receivable.
Class Allocations and Expenses. Investment income, realized and unrealized capital gains and losses, common expenses of a fund, and certain fund-level expense reductions, if any, are allocated daily on a pro-rata basis to each class based on the relative net assets of each class to the total net assets of a fund. Each class differs with respect to transfer agent and distribution and service plan fees incurred, as applicable. Certain expense reductions may also differ by class, if applicable. For the reporting period, the allocated portion of income and expenses to each class as a percent of its average net assets may vary due to the timing of recording these transactions in relation to fluctuating net assets of the classes. Expenses directly attributable to a fund are charged to that fund. Expenses attributable to more than one fund are allocated among the respective funds on the basis of relative net assets or other appropriate methods. Expenses included in the accompanying financial statements reflect the expenses of that fund and do not include any expenses associated with any underlying mutual funds or exchange-traded funds (ETFs). Although not included in a fund's expenses, a fund indirectly bears its proportionate share of these expenses through the net asset value of each underlying mutual fund or exchange-traded fund (ETF). Expense estimates are accrued in the period to which they relate and adjustments are made when actual amounts are known.
Income Tax Information and Distributions to Shareholders. Each year, the Fund intends to qualify as a regulated investment company under Subchapter M of the Internal Revenue Code, including distributing substantially all of its taxable income and realized gains. As a result, no provision for U.S. Federal income taxes is required. The Fund files a U.S. federal tax return, in addition to state and local tax returns as required. The Fund's federal income tax returns are subject to examination by the Internal Revenue Service (IRS) for a period of three fiscal years after they are filed. State and local tax returns may be subject to examination for an additional fiscal year depending on the jurisdiction. Foreign taxes are provided for based on the Fund's understanding of the tax rules and rates that exist in the foreign markets in which it invests. The Fund is subject to a tax imposed on capital gains by certain countries in which it invests.
Distributions are declared and recorded on the ex-dividend date. Income and capital gain distributions are declared separately for each class. Income and capital gain distributions are determined in accordance with income tax regulations, which may differ from GAAP.
Capital accounts within the financial statements are adjusted for permanent book-tax differences. These adjustments have no impact on net assets or the results of operations. Capital accounts are not adjusted for temporary book-tax differences which will reverse in a subsequent period.
Book-tax differences are primarily due to foreign currency transactions, certain foreign taxes, passive foreign investment companies (PFIC), net operating losses, capital loss carryforwards and losses deferred due to wash sales and excise tax regulations.
As of period end, the cost and unrealized appreciation (depreciation) in securities, and derivatives if applicable, for federal income tax purposes were as follows:
| Gross unrealized appreciation | $1,072,795,712 |
| Gross unrealized depreciation | (166,578,164) |
| Net unrealized appreciation (depreciation) | $906,217,548 |
| Tax cost | $1,740,642,189 |
Capital loss carryforwards are only available to offset future capital gains of the Fund to the extent provided by regulations and may be limited. The capital loss carryforward information presented below, including any applicable limitation, is estimated as of prior fiscal period end and is subject to adjustment.
Short-term | $(244,873,386) |
Long-term | (-) |
| Total capital loss carryforward | $(244,873,386) |
The Fund elected to defer to its next fiscal year $1,139 of ordinary losses recognized during the period January 1, 2022 to December 31, 2022.
Restricted Securities (including Private Placements). Funds may invest in securities that are subject to legal or contractual restrictions on resale. These securities generally may be resold in transactions exempt from registration or to the public if the securities are registered. Disposal of these securities may involve time-consuming negotiations and expense, and prompt sale at an acceptable price may be difficult. Information regarding restricted securities held at period end is included at the end of the Schedule of Investments, if applicable.
Consolidated Subsidiary. The Funds included in the table below hold certain investments through a wholly-owned subsidiary ("Subsidiary"), which may be subject to federal and state taxes upon disposition.
As of period end, investments in Subsidiaries were as follows:
| | $ Amount | % of Net Assets |
| VIP Growth Opportunities Portfolio | 1,523,079 | .06 |
The financial statements have been consolidated to include the Subsidiary accounts where applicable. Accordingly, all inter-company transactions and balances have been eliminated.
At period end, any estimated tax liability for these investments is presented as "Deferred taxes" in the Statement of Assets and Liabilities and included in "Change in net unrealized appreciation (depreciation) on investment securities" in the Statement of Operations. The tax liability incurred may differ materially depending on conditions when these investments are disposed. Any cash held by a Subsidiary is restricted as to its use and is presented as "Restricted cash" in the Statement of Assets and Liabilities, if applicable.
New Accounting Pronouncement. In June 2022, the Financial Accounting Standards Board (FASB) issued Accounting Standards Update (ASU) 2022-03 Fair Value Measurement (Topic 820): Fair Value Measurement of Equity Securities Subject to Contractual Sale Restrictions. The amendments in this ASU clarify that a contractual restriction on the sale of an equity security is not considered part of the unit of account of the equity security and, therefore, is not considered in measuring fair value. They also clarify that an entity cannot, as a separate unit of account, recognize and measure a contractual sale restriction. They also require additional disclosures for equity securities subject to contractual sale restrictions. ASU 2022-03 will be effective for fiscal years, including interim periods within those fiscal years, beginning after December 15, 2023, and allows for early adoption. ASU 2022-03 will only be applicable to an equity security in which the contractual arrangement that restricts its sale is executed or modified on or after the adoption date. Management is currently evaluating the potential impact of ASU 2022-03 to the financial statements.
4. Purchases and Sales of Investments.
Purchases and sales of securities, other than short-term securities and in-kind transactions, as applicable, are noted in the table below.
| | Purchases ($) | Sales ($) |
| VIP Growth Opportunities Portfolio | 792,169,487 | 706,000,119 |
5. Fees and Other Transactions with Affiliates.
Management Fee. Fidelity Management & Research Company LLC (the investment adviser) and its affiliates provide the Fund with investment management related services for which the Fund pays a monthly management fee. The management fee is the sum of an individual fund fee rate that is based on an annual rate of .30% of the Fund's average net assets and an annualized group fee rate that averaged .23% during the period. The group fee rate is based upon the monthly average net assets of a group of registered investment companies with which the investment adviser has management contracts. The group fee rate decreases as assets under management increase and increases as assets under management decrease. For the reporting period, the total annualized management fee rate was .52% of the Fund's average net assets.
Distribution and Service Plan Fees. In accordance with Rule 12b-1 of the 1940 Act, the Fund has adopted separate 12b-1 Plans for each Service Class of shares. Each Service Class pays Fidelity Distributors Company LLC (FDC), an affiliate of the investment adviser, a service fee. For the period, the service fee is based on an annual rate of .10% of Service Class' average net assets and .25% of Service Class 2's average net assets.
For the period, total fees, all of which were re-allowed to insurance companies for the distribution of shares and providing shareholder support services, were as follows:
| Service Class | $53,591 |
| Service Class 2 | 1,244,241 |
| | $1,297,832 |
Transfer Agent Fees. Fidelity Investments Institutional Operations Company LLC (FIIOC), an affiliate of the investment adviser, is the Fund's transfer, dividend disbursing, and shareholder servicing agent. FIIOC receives an asset-based fee with respect to each class. Each class pays a fee for transfer agent services, typesetting and printing and mailing of shareholder reports, excluding mailing of proxy statements. For the period, transfer agent fees for each class were as follows:
| | Amount | % of Class-Level Average Net Assets A |
| Initial Class | $101,121 | .06 |
| Service Class | 33,762 | .06 |
| Service Class 2 | 313,549 | .06 |
| Investor Class | 544,552 | .14 |
| | $992,984 | |
A Annualized
Accounting Fees. Fidelity Service Company, Inc. (FSC), an affiliate of the investment adviser, maintains the Fund's accounting records. The accounting fee is based on the level of average net assets for each month. For the period, the fees were equivalent to the following annualized rates:
| | % of Average Net Assets |
| VIP Growth Opportunities Portfolio | .03 |
Brokerage Commissions. A portion of portfolio transactions were placed with brokerage firms which are affiliates of the investment adviser. Brokerage commissions are included in net realized gain (loss) and change in net unrealized appreciation (depreciation) in the Statement of Operations. The commissions paid to these affiliated firms were as follows:
| | Amount |
| VIP Growth Opportunities Portfolio | $15,227 |
Interfund Lending Program. Pursuant to an Exemptive Order issued by the Securities and Exchange Commission (the SEC), the Fund, along with other registered investment companies having management contracts with Fidelity Management & Research Company LLC (FMR), or other affiliated entities of FMR, may participate in an interfund lending program. This program provides an alternative credit facility allowing the Fund to borrow from, or lend money to, other participating affiliated funds. At period end, there were no interfund loans outstanding. Activity in this program during the period for which loans were outstanding was as follows:
| | Borrower or Lender | Average Loan Balance | Weighted Average Interest Rate | Interest Expense |
| VIP Growth Opportunities Portfolio | Borrower | $ 5,558,000 | 5.32% | $821 |
Interfund Trades. Funds may purchase from or sell securities to other Fidelity Funds under procedures adopted by the Board. The procedures have been designed to ensure these interfund trades are executed in accordance with Rule 17a-7 of the 1940 Act. Any interfund trades are included within the respective purchases and sales amounts shown in the Purchases and Sales of Investments note. Interfund trades during the period are noted in the table below.
| | Purchases ($) | Sales ($) | Realized Gain (Loss) ($) |
| VIP Growth Opportunities Portfolio | 50,281,433 | 68,275,193 | (6,844,405) |
6. Committed Line of Credit.
Certain Funds participate with other funds managed by the investment adviser or an affiliate in a $4.25 billion credit facility (the "line of credit") to be utilized for temporary or emergency purposes to fund shareholder redemptions or for other short-term liquidity purposes. The participating funds have agreed to pay commitment fees on their pro-rata portion of the line of credit, which are reflected in Miscellaneous expenses on the Statement of Operations, and are listed below. During the period, there were no borrowings on this line of credit.
| | Amount |
| VIP Growth Opportunities Portfolio | $2,011 |
7. Security Lending.
Funds lend portfolio securities from time to time in order to earn additional income. Lending agents are used, including National Financial Services (NFS), an affiliate of the investment adviser. Pursuant to a securities lending agreement, NFS will receive a fee, which is capped at 9.9% of a fund's daily lending revenue, for its services as lending agent. A fund may lend securities to certain qualified borrowers, including NFS. On the settlement date of the loan, a fund receives collateral (in the form of U.S. Treasury obligations, letters of credit and/or cash) against the loaned securities and maintains collateral in an amount not less than 100% of the market value of the loaned securities during the period of the loan. The market value of the loaned securities is determined at the close of business of a fund and any additional required collateral is delivered to a fund on the next business day. A fund or borrower may terminate the loan at any time, and if the borrower defaults on its obligation to return the securities loaned because of insolvency or other reasons, a fund may apply collateral received from the borrower against the obligation. A fund may experience delays and costs in recovering the securities loaned. Any cash collateral received is invested in the Fidelity Securities Lending Cash Central Fund. Any loaned securities are identified as such in the Schedule of Investments, and the value of loaned securities and cash collateral at period end, as applicable, are presented in the Statement of Assets and Liabilities. Security lending income represents the income earned on investing cash collateral, less rebates paid to borrowers and any lending agent fees associated with the loan, plus any premium payments received for lending certain types of securities. Security lending income is presented in the Statement of Operations as a component of income from Fidelity Central Funds. Affiliated security lending activity, if any, was as follows:
| | Total Security Lending Fees Paid to NFS | Security Lending Income From Securities Loaned to NFS | Value of Securities Loaned to NFS at Period End |
| VIP Growth Opportunities Portfolio | $22,086 | $18,089 | $7,675,725 |
8. Expense Reductions.
During the period the investment adviser or an affiliate reimbursed and/or waived a portion of fund-level operating expenses in the amount of $47,491.
9.Distributions to Shareholders.
Distributions to shareholders of each class were as follows:
| | Six months ended June 30, 2023 | Year ended December 31, 2022 |
| VIP Growth Opportunities Portfolio | | |
| Distributions to shareholders | | |
| Initial Class | $- | $64,630,110 |
| Service Class | - | 21,878,935 |
| Service Class 2 | - | 187,539,568 |
| Investor Class | - | 181,478,767 |
Total | $- | $455,527,380 |
10. Share Transactions.
Transactions for each class of shares were as follows and may contain in-kind transactions:
| | Shares | Shares | Dollars | Dollars |
| | Six months ended June 30, 2023 | Year ended December 31, 2022 | Six months ended June 30, 2023 | Year ended December 31, 2022 |
| VIP Growth Opportunities Portfolio | | | | |
| Initial Class | | | | |
| Shares sold | 2,415,158 | 445,956 | $113,749,862 | $22,595,346 |
| Reinvestment of distributions | - | 1,134,459 | - | 64,630,110 |
| Shares redeemed | (396,915) | (1,277,771) | (18,506,271) | (65,793,680) |
| Net increase (decrease) | 2,018,243 | 302,644 | $95,243,591 | $21,431,776 |
| Service Class | | | | |
| Shares sold | 114,629 | 227,137 | $5,445,970 | $10,515,341 |
| Reinvestment of distributions | - | 385,193 | - | 21,878,935 |
| Shares redeemed | (147,179) | (297,546) | (6,926,317) | (14,796,343) |
| Net increase (decrease) | (32,550) | 314,784 | $(1,480,347) | $17,597,933 |
| Service Class 2 | | | | |
| Shares sold | 1,557,653 | 5,179,254 | $71,129,552 | $250,307,062 |
| Reinvestment of distributions | - | 3,376,658 | - | 187,539,568 |
| Shares redeemed | (1,571,772) | (3,608,653) | (72,500,942) | (176,762,361) |
| Net increase (decrease) | (14,119) | 4,947,259 | $(1,371,390) | $261,084,269 |
| Investor Class | | | | |
| Shares sold | 783,985 | 455,013 | $37,855,481 | $22,738,381 |
| Reinvestment of distributions | - | 3,218,850 | - | 181,478,767 |
| Shares redeemed | (729,243) | (4,075,292) | (33,323,198) | (216,952,882) |
| Net increase (decrease) | 54,742 | (401,429) | $4,532,283 | $(12,735,734) |
11. Other.
A fund's organizational documents provide former and current trustees and officers with a limited indemnification against liabilities arising in connection with the performance of their duties to the fund. In the normal course of business, a fund may also enter into contracts that provide general indemnifications. A fund's maximum exposure under these arrangements is unknown as this would be dependent on future claims that may be made against a fund. The risk of material loss from such claims is considered remote.
At the end of the period, the investment adviser or its affiliates were owners of record of more than 10% and certain otherwise unaffiliated shareholders were owners of record of more than 10% of the outstanding shares as follows:
| Fund | Affiliated % | Number of Unaffiliated Shareholders | Unaffiliated Shareholders % |
| VIP Growth Opportunities Portfolio | 41% | 1 | 38% |
12. Risk and Uncertainties.
Many factors affect a fund's performance. Developments that disrupt global economies and financial markets, such as pandemics, epidemics, outbreaks of infectious diseases, war, terrorism, and environmental disasters, may significantly affect a fund's investment performance. The effects of these developments to a fund will be impacted by the types of securities in which a fund invests, the financial condition, industry, economic sector, and geographic location of an issuer, and a fund's level of investment in the securities of that issuer. Significant concentrations in security types, issuers, industries, sectors, and geographic locations may magnify the factors that affect a fund's performance.
As a shareholder, you incur two types of costs: (1) transaction costs, which may include sales charges (loads) on purchase payments or redemption proceeds, as applicable and (2) ongoing costs, which generally include management fees, distribution and/or service (12b-1) fees and other Fund expenses. This Example is intended to help you understand your ongoing costs (in dollars) of investing in a fund and to compare these costs with the ongoing costs of investing in other mutual funds.
| The Example is based on an investment of $1,000 invested at the beginning of the period and held for the entire period (January 1, 2023 to June 30, 2023). |
Actual Expenses
The first line of the accompanying table provides information about actual account values and actual expenses. You may use the information in this line, together with the amount you invested, to estimate the expenses that you paid over the period. Simply divide your account value by $1,000.00 (for example, an $8,600 account value divided by $1,000.00 = 8.6), then multiply the result by the number in the first line for a class/Fund under the heading entitled "Expenses Paid During Period" to estimate the expenses you paid on your account during this period. If any fund is a shareholder of any underlying mutual funds or exchange-traded funds (ETFs) (the Underlying Funds), such fund indirectly bears its proportional share of the expenses of the Underlying Funds in addition to the direct expenses incurred presented in the table. These fees and expenses are not included in the annualized expense ratio used to calculate the expense estimate in the table below. The estimate of expenses does not include any fees or other expenses of any variable annuity or variable life insurance product. If they were, the estimate of expenses you paid during the period would be higher, and your ending account value would be lower.
Hypothetical Example for Comparison Purposes
The second line of the accompanying table provides information about hypothetical account values and hypothetical expenses based on the actual expense ratio and an assumed rate of return of 5% per year before expenses, which is not the actual return. The hypothetical account values and expenses may not be used to estimate the actual ending account balance or expenses you paid for the period. You may use this information to compare the ongoing costs of investing in the Fund and other funds. To do so, compare this 5% hypothetical example with the 5% hypothetical examples that appear in the shareholder reports of the other funds. If any fund is a shareholder of any Underlying Funds, such fund indirectly bears its proportional share of the expenses of the Underlying Funds in addition to the direct expenses as presented in the table. These fees and expenses are not included in the annualized expense ratio used to calculate the expense estimate in the table below. The estimate of expenses does not include any fees or other expenses of any variable annuity or variable life insurance product. If they were, the estimate of expenses you paid during the period would be higher, and your ending account value would be lower.
Please note that the expenses shown in the table are meant to highlight your ongoing costs only and do not reflect any transaction costs. Therefore, the second line of the table is useful in comparing ongoing costs only, and will not help you determine the relative total costs of owning different funds. In addition, if these transactional costs were included, your costs would have been higher.
| | | | | Annualized Expense Ratio- A | | Beginning Account Value January 1, 2023 | | Ending Account Value June 30, 2023 | | Expenses Paid During Period- C January 1, 2023 to June 30, 2023 |
| VIP Growth Opportunities Portfolio | | | | | | | | | | |
| Initial Class | | | | .62% | | | | | | |
| Actual | | | | | | $ 1,000 | | $ 1,301.50 | | $ 3.54 |
Hypothetical- B | | | | | | $ 1,000 | | $ 1,021.72 | | $ 3.11 |
| Service Class | | | | .72% | | | | | | |
| Actual | | | | | | $ 1,000 | | $ 1,300.70 | | $ 4.11 |
Hypothetical- B | | | | | | $ 1,000 | | $ 1,021.22 | | $ 3.61 |
| Service Class 2 | | | | .87% | | | | | | |
| Actual | | | | | | $ 1,000 | | $ 1,299.90 | | $ 4.96 |
Hypothetical- B | | | | | | $ 1,000 | | $ 1,020.48 | | $ 4.36 |
| Investor Class | | | | .69% | | | | | | |
| Actual | | | | | | $ 1,000 | | $ 1,300.90 | | $ 3.94 |
Hypothetical- B | | | | | | $ 1,000 | | $ 1,021.37 | | $ 3.46 |
| |
A Annualized expense ratio reflects expenses net of applicable fee waivers.
B 5% return per year before expenses
C Expenses are equal to the annualized expense ratio, multiplied by the average account value over the period, multiplied by 181/ 365 (to reflect the one-half year period). The fees and expenses of any Underlying Funds are not included in each annualized expense ratio.
Board Approval of Investment Advisory Contracts
VIP Growth Opportunities Portfolio
At its May 2023 meeting, the Board of Trustees, including the Independent Trustees (together, the Board), voted to continue the management contract with Fidelity Management & Research Company LLC (FMR), and the sub-advisory agreements and sub-subadvisory agreements, in each case, where applicable (together, the Advisory Contracts) for the fund for two months from June 1, 2023 through July 31, 2023. The Board determined that it will consider the annual renewal of the fund's Advisory Contracts for a full one year period in July 2023, following its review of additional materials provided by FMR.
The Board considered that the approval of the fund's Advisory Contracts will not result in any changes in (i) the investment process or strategies employed in the management of the fund's assets; (ii) the fees and expenses paid by shareholders; (iii) the nature, extent or quality of services provided under the fund's Advisory Contracts; or (iv) the day-to-day management of the fund or the persons primarily responsible for such management. The Board also considered that since its last approval of the fund's Advisory Contracts, FMR had provided additional information on the fund in support of the annual contract renewal process, including competitive analyses on total expenses and management fees and in-depth reviews of fund performance and fund profitability information. The Board concluded that the fund's Advisory Contracts are fair and reasonable, and that the fund's Advisory Contracts should be renewed, without modification, through July 31, 2023, with the understanding that the Board will consider the annual renewal for a full one year period in July 2023.
In connection with its consideration of future renewals of the fund's Advisory Contracts, the Board will consider: (i) the nature, extent and quality of services provided to the fund, including shareholder and administrative services and investment performance; (ii) the competitiveness of the management fee and total expenses for the fund; (iii) the costs of the services and profitability, including the revenues earned and the expenses incurred in conducting the business of developing, marketing, distributing, managing, administering, and servicing the fund and its shareholders, to the extent applicable; and (iv) whether there have been economies of scale in respect of the Fidelity funds, whether the Fidelity funds (including the fund) have appropriately benefited from any such economies of scale, and whether there is the potential for realization of any further economies.
Based on its evaluation of all of the conclusions noted above, and after considering all factors it believed relevant, the Board ultimately concluded that the fund's management fee structure is fair and reasonable, and that the continuation of the fund's Advisory Contracts should be approved for two months from June 1, 2023 through July 31, 2023.
The Securities and Exchange Commission adopted Rule 22e-4 under the Investment Company Act of 1940 (the Liquidity Rule) to promote effective liquidity risk management throughout the open-end investment company industry, thereby reducing the risk that funds will be unable to meet their redemption obligations and mitigating dilution of the interests of fund shareholders.
The Fund has adopted and implemented a liquidity risk management program (the Program) reasonably designed to assess and manage the Fund's liquidity risk and to comply with the requirements of the Liquidity Rule. The Fund's Board of Trustees (the Board) has designated the Fund's investment adviser as administrator of the Program. The Fidelity advisers have established a Liquidity Risk Management Committee (the LRM Committee) to manage the Program for each of the Fidelity Funds. The LRM Committee monitors the adequacy and effectiveness of implementation of the Program and on a periodic basis assesses each Fund's liquidity risk based on a variety of factors including (1) the Fund's investment strategy, (2) portfolio liquidity and cash flow projections during normal and reasonably foreseeable stressed conditions, (3) shareholder redemptions, (4) borrowings and other funding sources and (5) certain factors specific to ETFs including the effect of the Fund's prices and spreads, market participants, and basket compositions on the overall liquidity of the Fund's portfolio, as applicable.
In accordance with the Program, each of the Fund's portfolio investments is classified into one of four defined liquidity categories based on a determination of a reasonable expectation for how long it would take to convert the investment to cash (or sell or dispose of the investment) without significantly changing its market value.
- Highly liquid investments - cash or convertible to cash within three business days or less
- Moderately liquid investments - convertible to cash in three to seven calendar days
- Less liquid investments - can be sold or disposed of, but not settled, within seven calendar days
- Illiquid investments - cannot be sold or disposed of within seven calendar days
Liquidity classification determinations take into account a variety of factors including various market, trading and investment-specific considerations, as well as market depth, and generally utilize analysis from a third-party liquidity metrics service.
The Liquidity Rule places a 15% limit on a fund's illiquid investments and requires funds that do not primarily hold assets that are highly liquid investments to determine and maintain a minimum percentage of the fund's net assets to be invested in highly liquid investments (highly liquid investment minimum or HLIM). The Program includes provisions reasonably designed to comply with the 15% limit on illiquid investments and for determining, periodically reviewing and complying with the HLIM requirement as applicable.
At a recent meeting of the Fund's Board of Trustees, the LRM Committee provided a written report to the Board pertaining to the operation, adequacy, and effectiveness of the Program for the period December 1, 2021 through November 30, 2022. The report concluded that the Program is operating effectively and is reasonably designed to assess and manage the Fund's liquidity risk.
1.705699.125
VIPGRO-SANN-0823
Fidelity® Variable Insurance Products:
VIP Value Strategies Portfolio
Semi-Annual Report
June 30, 2023
Contents
To view a fund's proxy voting guidelines and proxy voting record for the 12-month period ended June 30, visit http://www.fidelity.com/proxyvotingresults or visit the Securities and Exchange Commission's (SEC) web site at http://www.sec.gov.
You may also call 1-877-208-0098 to request a free copy of the proxy voting guidelines.
Fidelity® Variable Insurance Products are separate account options which are purchased through a variable insurance contract.
Standard & Poor's, S&P and S&P 500 are registered service marks of The McGraw-Hill Companies, Inc. and have been licensed for use by Fidelity Distributors Corporation.
Other third-party marks appearing herein are the property of their respective owners.
All other marks appearing herein are registered or unregistered trademarks or service marks of FMR LLC or an affiliated company. © 2023 FMR LLC. All rights reserved.
This report and the financial statements contained herein are submitted for the general information of the shareholders of the Fund. This report is not authorized for distribution to prospective investors in the Fund unless preceded or accompanied by an effective prospectus.
A fund files its complete schedule of portfolio holdings with the SEC for the first and third quarters of each fiscal year on Form N-PORT. Forms N-PORT are available on the SEC's web site at http://www.sec.gov. A fund's Forms N-PORT may be reviewed and copied at the SEC's Public Reference Room in Washington, DC. Information regarding the operation of the SEC's Public Reference Room may be obtained by calling 1-800-SEC-0330.
For a complete list of a fund's portfolio holdings, view the most recent holdings listing, semiannual report, or annual report on Fidelity's web site at http://www.fidelity.com, http://www.institutional.fidelity.com, or http://www.401k.com, as applicable.
NOT FDIC INSURED •MAY LOSE VALUE •NO BANK GUARANTEE
Neither the Fund nor Fidelity Distributors Corporation is a bank.
This report and the financial statements contained herein are submitted for the general information of the shareholders of the Fund. This report is not authorized for distribution to prospective investors in the Fund unless preceded or accompanied by an effective prospectus.
A fund files its complete schedule of portfolio holdings with the SEC for the first and third quarters of each fiscal year on Form N-PORT. Forms N-PORT are available on the SEC's web site at http://www.sec.gov. A fund's Forms N-PORT may be reviewed and copied at the SEC's Public Reference Room in Washington, DC. Information regarding the operation of the SEC's Public Reference Room may be obtained by calling 1-800-SEC-0330.
For a complete list of a fund's portfolio holdings, view the most recent holdings listing, semiannual report, or annual report on Fidelity's web site at http://www.fidelity.com, http://www.institutional.fidelity.com, or http://www.401k.com, as applicable.
NOT FDIC INSURED •MAY LOSE VALUE •NO BANK GUARANTEE
Neither the Fund nor Fidelity Distributors Corporation is a bank.
Top Holdings (% of Fund's net assets) |
| |
| Canadian Natural Resources Ltd. | 2.0 | |
| Constellation Energy Corp. | 1.7 | |
| Welltower, Inc. | 1.7 | |
| PG&E Corp. | 1.7 | |
| Hess Corp. | 1.7 | |
| Flex Ltd. | 1.6 | |
| Centene Corp. | 1.6 | |
| Cigna Group | 1.6 | |
| First Citizens Bancshares, Inc. | 1.5 | |
| Apollo Global Management, Inc. | 1.4 | |
| | 16.5 | |
| |
| Market Sectors (% of Fund's net assets) |
| |
| Financials | 17.8 | |
| Industrials | 17.8 | |
| Consumer Discretionary | 12.2 | |
| Materials | 11.0 | |
| Energy | 8.2 | |
| Utilities | 7.7 | |
| Real Estate | 7.2 | |
| Information Technology | 7.0 | |
| Health Care | 5.6 | |
| Consumer Staples | 3.7 | |
| Communication Services | 1.4 | |
| |
Asset Allocation (% of Fund's net assets) |
|
|
Showing Percentage of Net Assets
| Common Stocks - 99.6% |
| | | Shares | Value ($) |
| COMMUNICATION SERVICES - 1.4% | | | |
| Diversified Telecommunication Services - 1.0% | | | |
| Cellnex Telecom SA (a) | | 158,200 | 6,385,504 |
| Media - 0.4% | | | |
| Nexstar Broadcasting Group, Inc. Class A | | 17,500 | 2,914,625 |
TOTAL COMMUNICATION SERVICES | | | 9,300,129 |
| CONSUMER DISCRETIONARY - 12.2% | | | |
| Automobile Components - 1.4% | | | |
| Adient PLC (b) | | 106,500 | 4,081,080 |
| Autoliv, Inc. | | 59,400 | 5,051,376 |
| | | | 9,132,456 |
| Automobiles - 1.0% | | | |
| Harley-Davidson, Inc. | | 184,800 | 6,506,808 |
| Broadline Retail - 0.3% | | | |
| Kohl's Corp. | | 81,100 | 1,869,355 |
| Diversified Consumer Services - 0.5% | | | |
| Adtalem Global Education, Inc. (b) | | 88,379 | 3,034,935 |
| Hotels, Restaurants & Leisure - 1.2% | | | |
| Hilton Grand Vacations, Inc. (b) | | 96,400 | 4,380,416 |
| Red Rock Resorts, Inc. | | 70,600 | 3,302,668 |
| | | | 7,683,084 |
| Household Durables - 1.1% | | | |
| Tempur Sealy International, Inc. | | 178,000 | 7,132,460 |
| Leisure Products - 1.7% | | | |
| Brunswick Corp. | | 56,900 | 4,929,816 |
| Mattel, Inc. (b) | | 312,300 | 6,102,342 |
| | | | 11,032,158 |
| Specialty Retail - 3.9% | | | |
| American Eagle Outfitters, Inc. | | 421,802 | 4,977,264 |
| Bath & Body Works, Inc. | | 82,300 | 3,086,250 |
| Lithia Motors, Inc. Class A (sub. vtg.) (c) | | 16,600 | 5,048,226 |
| Signet Jewelers Ltd. | | 65,100 | 4,248,426 |
| Upbound Group, Inc. | | 151,017 | 4,701,159 |
| Victoria's Secret & Co. (b) | | 163,300 | 2,846,319 |
| | | | 24,907,644 |
| Textiles, Apparel & Luxury Goods - 1.1% | | | |
| Capri Holdings Ltd. (b) | | 98,100 | 3,520,809 |
| Gildan Activewear, Inc. | | 116,500 | 3,755,965 |
| | | | 7,276,774 |
TOTAL CONSUMER DISCRETIONARY | | | 78,575,674 |
| CONSUMER STAPLES - 3.7% | | | |
| Beverages - 0.1% | | | |
| Primo Water Corp. | | 46,310 | 580,727 |
| Consumer Staples Distribution & Retail - 1.5% | | | |
| U.S. Foods Holding Corp. (b) | | 212,200 | 9,336,800 |
| Food Products - 2.1% | | | |
| Bunge Ltd. | | 66,700 | 6,293,145 |
| Darling Ingredients, Inc. (b) | | 117,263 | 7,480,207 |
| | | | 13,773,352 |
TOTAL CONSUMER STAPLES | | | 23,690,879 |
| ENERGY - 8.2% | | | |
| Energy Equipment & Services - 1.8% | | | |
| Expro Group Holdings NV (b) | | 314,100 | 5,565,852 |
| Valaris Ltd. (b) | | 91,700 | 5,770,681 |
| | | | 11,336,533 |
| Oil, Gas & Consumable Fuels - 6.4% | | | |
| Antero Resources Corp. (b) | | 246,700 | 5,681,501 |
| Canadian Natural Resources Ltd. | | 222,500 | 12,509,381 |
| Hess Corp. | | 81,400 | 11,066,330 |
| Targa Resources Corp. | | 79,300 | 6,034,730 |
| Tourmaline Oil Corp. (c) | | 128,800 | 6,068,840 |
| | | | 41,360,782 |
TOTAL ENERGY | | | 52,697,315 |
| FINANCIALS - 17.8% | | | |
| Banks - 4.1% | | | |
| East West Bancorp, Inc. | | 144,300 | 7,617,597 |
| First Citizens Bancshares, Inc. | | 7,600 | 9,754,220 |
| Popular, Inc. | | 69,300 | 4,194,036 |
| U.S. Bancorp | | 144,900 | 4,787,496 |
| | | | 26,353,349 |
| Capital Markets - 3.1% | | | |
| Ameriprise Financial, Inc. | | 22,300 | 7,407,168 |
| LPL Financial | | 32,100 | 6,979,503 |
| Raymond James Financial, Inc. | | 50,700 | 5,261,139 |
| | | | 19,647,810 |
| Consumer Finance - 2.5% | | | |
| OneMain Holdings, Inc. | | 134,300 | 5,867,567 |
| PROG Holdings, Inc. (b) | | 117,471 | 3,773,169 |
| SLM Corp. | | 414,300 | 6,761,376 |
| | | | 16,402,112 |
| Financial Services - 3.7% | | | |
| Apollo Global Management, Inc. | | 123,000 | 9,447,630 |
| Global Payments, Inc. | | 76,700 | 7,556,484 |
| Walker & Dunlop, Inc. | | 86,900 | 6,872,921 |
| | | | 23,877,035 |
| Insurance - 4.4% | | | |
| American Financial Group, Inc. | | 55,100 | 6,543,125 |
| Assurant, Inc. | | 51,100 | 6,424,292 |
| First American Financial Corp. | | 85,100 | 4,852,402 |
| Reinsurance Group of America, Inc. | | 27,205 | 3,773,061 |
| The Travelers Companies, Inc. | | 39,100 | 6,790,106 |
| | | | 28,382,986 |
TOTAL FINANCIALS | | | 114,663,292 |
| HEALTH CARE - 5.6% | | | |
| Health Care Providers & Services - 4.8% | | | |
| AdaptHealth Corp. (b) | | 315,000 | 3,833,550 |
| Centene Corp. (b) | | 154,300 | 10,407,535 |
| Cigna Group | | 36,300 | 10,185,780 |
| CVS Health Corp. | | 89,700 | 6,200,961 |
| | | | 30,627,826 |
| Pharmaceuticals - 0.8% | | | |
| Jazz Pharmaceuticals PLC (b) | | 42,900 | 5,318,313 |
TOTAL HEALTH CARE | | | 35,946,139 |
| INDUSTRIALS - 17.8% | | | |
| Air Freight & Logistics - 1.1% | | | |
| FedEx Corp. | | 28,800 | 7,139,520 |
| Building Products - 1.1% | | | |
| Builders FirstSource, Inc. (b) | | 52,700 | 7,167,200 |
| Commercial Services & Supplies - 1.0% | | | |
| The Brink's Co. | | 95,600 | 6,484,548 |
| Construction & Engineering - 3.6% | | | |
| Fluor Corp. (b)(c) | | 192,800 | 5,706,880 |
| Granite Construction, Inc. | | 99,300 | 3,950,154 |
| MDU Resources Group, Inc. | | 218,800 | 4,581,672 |
| Willscot Mobile Mini Holdings (b) | | 186,900 | 8,931,951 |
| | | | 23,170,657 |
| Electrical Equipment - 1.6% | | | |
| Regal Rexnord Corp. | | 53,400 | 8,218,260 |
| Sensata Technologies, Inc. PLC | | 44,005 | 1,979,785 |
| | | | 10,198,045 |
| Ground Transportation - 4.2% | | | |
| Knight-Swift Transportation Holdings, Inc. Class A | | 118,000 | 6,556,080 |
| TFI International, Inc. (Canada) (c) | | 58,500 | 6,664,959 |
| U-Haul Holding Co. (non-vtg.) | | 135,500 | 6,865,785 |
| XPO, Inc. (b) | | 116,500 | 6,873,500 |
| | | | 26,960,324 |
| Machinery - 3.7% | | | |
| Allison Transmission Holdings, Inc. | | 129,100 | 7,288,986 |
| Chart Industries, Inc. (b)(c) | | 32,800 | 5,241,112 |
| Kennametal, Inc. | | 167,000 | 4,741,130 |
| Timken Co. | | 69,700 | 6,379,641 |
| | | | 23,650,869 |
| Professional Services - 0.7% | | | |
| Manpower, Inc. | | 59,700 | 4,740,180 |
| Trading Companies & Distributors - 0.8% | | | |
| Beacon Roofing Supply, Inc. (b) | | 58,500 | 4,854,330 |
TOTAL INDUSTRIALS | | | 114,365,673 |
| INFORMATION TECHNOLOGY - 7.0% | | | |
| Communications Equipment - 1.4% | | | |
| Lumentum Holdings, Inc. (b) | | 165,800 | 9,405,834 |
| Electronic Equipment, Instruments & Components - 3.2% | | | |
| Coherent Corp. (b) | | 84,600 | 4,312,908 |
| Flex Ltd. (b) | | 384,500 | 10,627,580 |
| Vontier Corp. | | 170,100 | 5,478,921 |
| | | | 20,419,409 |
| Semiconductors & Semiconductor Equipment - 0.6% | | | |
| Skyworks Solutions, Inc. | | 34,900 | 3,863,081 |
| Software - 1.0% | | | |
| NCR Corp. (b)(c) | | 253,200 | 6,380,640 |
| Technology Hardware, Storage & Peripherals - 0.8% | | | |
| Seagate Technology Holdings PLC | | 81,300 | 5,030,031 |
TOTAL INFORMATION TECHNOLOGY | | | 45,098,995 |
| MATERIALS - 11.0% | | | |
| Chemicals - 6.5% | | | |
| Axalta Coating Systems Ltd. (b) | | 136,300 | 4,472,003 |
| Celanese Corp. Class A | | 59,800 | 6,924,840 |
| Methanex Corp. | | 133,600 | 5,527,032 |
| Olin Corp. | | 137,101 | 7,045,620 |
| The Chemours Co. LLC | | 204,900 | 7,558,761 |
| Tronox Holdings PLC | | 238,000 | 3,024,980 |
| Westlake Corp. (c) | | 62,100 | 7,419,087 |
| | | | 41,972,323 |
| Construction Materials - 0.5% | | | |
| Knife River Holding Co. | | 68,500 | 2,979,750 |
| Containers & Packaging - 1.2% | | | |
| Crown Holdings, Inc. | | 35,600 | 3,092,572 |
| O-I Glass, Inc. (b) | | 211,300 | 4,507,029 |
| | | | 7,599,601 |
| Metals & Mining - 1.7% | | | |
| Constellium NV (b) | | 367,300 | 6,317,560 |
| Freeport-McMoRan, Inc. | | 110,400 | 4,416,000 |
| | | | 10,733,560 |
| Paper & Forest Products - 1.1% | | | |
| Louisiana-Pacific Corp. (c) | | 99,100 | 7,430,518 |
TOTAL MATERIALS | | | 70,715,752 |
| REAL ESTATE - 7.2% | | | |
| Equity Real Estate Investment Trusts (REITs) - 5.7% | | | |
| CubeSmart | | 124,000 | 5,537,840 |
| Equity Lifestyle Properties, Inc. | | 83,800 | 5,605,382 |
| Essex Property Trust, Inc. | | 27,100 | 6,349,530 |
| Prologis (REIT), Inc. | | 41,947 | 5,143,961 |
| Ventas, Inc. | | 66,880 | 3,161,418 |
| Welltower, Inc. | | 137,200 | 11,098,108 |
| | | | 36,896,239 |
| Real Estate Management & Development - 1.5% | | | |
| Jones Lang LaSalle, Inc. (b) | | 60,600 | 9,441,480 |
TOTAL REAL ESTATE | | | 46,337,719 |
| UTILITIES - 7.7% | | | |
| Electric Utilities - 5.8% | | | |
| Constellation Energy Corp. | | 123,333 | 11,291,136 |
| Edison International | | 75,400 | 5,236,530 |
| Evergy, Inc. | | 39,951 | 2,333,937 |
| PG&E Corp. (b) | | 640,700 | 11,071,296 |
| PPL Corp. | | 116,155 | 3,073,461 |
| Southern Co. | | 63,100 | 4,432,775 |
| | | | 37,439,135 |
| Independent Power and Renewable Electricity Producers - 1.9% | | | |
| The AES Corp. | | 294,300 | 6,100,839 |
| Vistra Corp. | | 241,100 | 6,328,875 |
| | | | 12,429,714 |
TOTAL UTILITIES | | | 49,868,849 |
| TOTAL COMMON STOCKS (Cost $518,546,054) | | | 641,260,416 |
| | | | |
| Money Market Funds - 3.3% |
| | | Shares | Value ($) |
| Fidelity Cash Central Fund 5.14% (d) | | 1,131,724 | 1,131,950 |
| Fidelity Securities Lending Cash Central Fund 5.14% (d)(e) | | 20,208,371 | 20,210,392 |
| TOTAL MONEY MARKET FUNDS (Cost $21,342,342) | | | 21,342,342 |
| | | | |
| TOTAL INVESTMENT IN SECURITIES - 102.9% (Cost $539,888,396) | 662,602,758 |
NET OTHER ASSETS (LIABILITIES) - (2.9)% | (18,685,179) |
| NET ASSETS - 100.0% | 643,917,579 |
| | |
Legend
| (a) | Security exempt from registration under Rule 144A of the Securities Act of 1933. These securities may be resold in transactions exempt from registration, normally to qualified institutional buyers. At the end of the period, the value of these securities amounted to $6,385,504 or 1.0% of net assets. |
| (c) | Security or a portion of the security is on loan at period end. |
| (d) | Affiliated fund that is generally available only to investment companies and other accounts managed by Fidelity Investments. The rate quoted is the annualized seven-day yield of the fund at period end. A complete unaudited listing of the fund's holdings as of its most recent quarter end is available upon request. In addition, each Fidelity Central Fund's financial statements are available on the SEC's website or upon request. |
| (e) | Investment made with cash collateral received from securities on loan. |
Affiliated Central Funds
Fiscal year to date information regarding the Fund's investments in Fidelity Central Funds, including the ownership percentage, is presented below.
| Affiliate | Value, beginning of period ($) | Purchases ($) | Sales Proceeds ($) | Dividend Income ($) | Realized Gain (loss) ($) | Change in Unrealized appreciation (depreciation) ($) | Value, end of period ($) | % ownership, end of period |
| Fidelity Cash Central Fund 5.14% | 1,879,817 | 79,558,219 | 80,306,086 | 169,017 | - | - | 1,131,950 | 0.0% |
| Fidelity Securities Lending Cash Central Fund 5.14% | 13,679,117 | 155,958,265 | 149,426,990 | 25,126 | - | - | 20,210,392 | 0.1% |
| Total | 15,558,934 | 235,516,484 | 229,733,076 | 194,143 | - | - | 21,342,342 | |
| | | | | | | | | |
Amounts in the dividend income column in the above table include any capital gain distributions from underlying funds, which are presented in the corresponding line item in the Statement of Operations, if applicable.
Amounts in the dividend income column for Fidelity Securities Lending Cash Central Fund represents the income earned on investing cash collateral, less rebates paid to borrowers and any lending agent fees associated with the loan, plus any premium payments received for lending certain types of securities.
Amounts included in the purchases and sales proceeds columns may include in-kind transactions, if applicable.
Investment Valuation
The following is a summary of the inputs used, as of June 30, 2023, involving the Fund's assets and liabilities carried at fair value. The inputs or methodology used for valuing securities may not be an indication of the risk associated with investing in those securities. For more information on valuation inputs, and their aggregation into the levels used below, please refer to the Investment Valuation section in the accompanying Notes to Financial Statements.
| Valuation Inputs at Reporting Date: |
| Description | Total ($) | Level 1 ($) | Level 2 ($) | Level 3 ($) |
Investments in Securities: | | | | |
|
| Equities: | | | | |
Communication Services | 9,300,129 | 9,300,129 | - | - |
Consumer Discretionary | 78,575,674 | 78,575,674 | - | - |
Consumer Staples | 23,690,879 | 23,690,879 | - | - |
Energy | 52,697,315 | 52,697,315 | - | - |
Financials | 114,663,292 | 114,663,292 | - | - |
Health Care | 35,946,139 | 35,946,139 | - | - |
Industrials | 114,365,673 | 114,365,673 | - | - |
Information Technology | 45,098,995 | 45,098,995 | - | - |
Materials | 70,715,752 | 70,715,752 | - | - |
Real Estate | 46,337,719 | 46,337,719 | - | - |
Utilities | 49,868,849 | 49,868,849 | - | - |
|
| Money Market Funds | 21,342,342 | 21,342,342 | - | - |
| Total Investments in Securities: | 662,602,758 | 662,602,758 | - | - |
| Statement of Assets and Liabilities |
| | | | June 30, 2023 (Unaudited) |
| | | | | |
| Assets | | | | |
| Investment in securities, at value (including securities loaned of $19,572,252) - See accompanying schedule: | | | | |
Unaffiliated issuers (cost $518,546,054) | $ | 641,260,416 | | |
Fidelity Central Funds (cost $21,342,342) | | 21,342,342 | | |
| | | | | |
| | | | | |
| Total Investment in Securities (cost $539,888,396) | | | $ | 662,602,758 |
| Foreign currency held at value (cost $645,857) | | | | 645,857 |
| Receivable for investments sold | | | | 8,187,317 |
| Receivable for fund shares sold | | | | 124,200 |
| Dividends receivable | | | | 664,651 |
| Distributions receivable from Fidelity Central Funds | | | | 28,985 |
Total assets | | | | 672,253,768 |
| Liabilities | | | | |
| Payable for investments purchased | $ | 4,116,671 | | |
| Payable for fund shares redeemed | | 3,568,507 | | |
| Accrued management fee | | 277,540 | | |
| Distribution and service plan fees payable | | 66,120 | | |
| Other affiliated payables | | 64,098 | | |
| Other payables and accrued expenses | | 32,903 | | |
| Collateral on securities loaned | | 20,210,350 | | |
| Total Liabilities | | | | 28,336,189 |
| Net Assets | | | $ | 643,917,579 |
| Net Assets consist of: | | | | |
| Paid in capital | | | $ | 505,176,979 |
| Total accumulated earnings (loss) | | | | 138,740,600 |
| Net Assets | | | $ | 643,917,579 |
| | | | | |
| Net Asset Value and Maximum Offering Price | | | | |
| Initial Class : | | | | |
Net Asset Value , offering price and redemption price per share ($92,762,227 ÷ 6,006,032 shares) | | | $ | 15.44 |
| Service Class : | | | | |
Net Asset Value , offering price and redemption price per share ($25,172,887 ÷ 1,636,930 shares) | | | $ | 15.38 |
| Service Class 2 : | | | | |
Net Asset Value , offering price and redemption price per share ($313,809,251 ÷ 20,107,706 shares) | | | $ | 15.61 |
| Investor Class : | | | | |
Net Asset Value , offering price and redemption price per share ($212,173,214 ÷ 13,876,887 shares) | | | $ | 15.29 |
| Statement of Operations |
| | | | Six months ended June 30, 2023 (Unaudited) |
| Investment Income | | | | |
| Dividends | | | $ | 5,466,330 |
| Income from Fidelity Central Funds (including $25,126 from security lending) | | | | 194,143 |
| Total Income | | | | 5,660,473 |
| Expenses | | | | |
| Management fee | $ | 1,733,873 | | |
| Transfer agent fees | | 293,386 | | |
| Distribution and service plan fees | | 407,991 | | |
| Accounting fees | | 107,731 | | |
| Custodian fees and expenses | | 9,900 | | |
| Independent trustees' fees and expenses | | 2,218 | | |
| Audit | | 27,554 | | |
| Legal | | 4,746 | | |
| Miscellaneous | | 1,950 | | |
| Total expenses before reductions | | 2,589,349 | | |
| Expense reductions | | (15,258) | | |
| Total expenses after reductions | | | | 2,574,091 |
| Net Investment income (loss) | | | | 3,086,382 |
| Realized and Unrealized Gain (Loss) | | | | |
| Net realized gain (loss) on: | | | | |
| Investment Securities: | | | | |
| Unaffiliated issuers | | 15,085,213 | | |
| Foreign currency transactions | | 4,619 | | |
| Total net realized gain (loss) | | | | 15,089,832 |
| Change in net unrealized appreciation (depreciation) on: | | | | |
| Investment Securities: | | | | |
| Unaffiliated issuers | | 26,848,584 | | |
| Assets and liabilities in foreign currencies | | (1,831) | | |
| Total change in net unrealized appreciation (depreciation) | | | | 26,846,753 |
| Net gain (loss) | | | | 41,936,585 |
| Net increase (decrease) in net assets resulting from operations | | | $ | 45,022,967 |
| Statement of Changes in Net Assets |
| |
| | Six months ended June 30, 2023 (Unaudited) | | Year ended December 31, 2022 |
| Increase (Decrease) in Net Assets | | | | |
| Operations | | | | |
| Net investment income (loss) | $ | 3,086,382 | $ | 6,173,232 |
| Net realized gain (loss) | | 15,089,832 | | 26,236,366 |
| Change in net unrealized appreciation (depreciation) | | 26,846,753 | | (92,982,726) |
| Net increase (decrease) in net assets resulting from operations | | 45,022,967 | | (60,573,128) |
| Distributions to shareholders | | (1,628,748) | | (37,922,025) |
| | | | | |
| Share transactions - net increase (decrease) | | (46,594,501) | | (4,512,076) |
| Total increase (decrease) in net assets | | (3,200,282) | | (103,007,229) |
| | | | | |
| Net Assets | | | | |
| Beginning of period | | 647,117,861 | | 750,125,090 |
| End of period | $ | 643,917,579 | $ | 647,117,861 |
| | | | | |
| | | | | |
| VIP Value Strategies Portfolio Initial Class |
| |
| | Six months ended (Unaudited) June 30, 2023 | | Years ended December 31, 2022 | | 2021 | | 2020 | | 2019 | | 2018 |
Selected Per-Share Data | | | | | | | | | | | | |
| Net asset value, beginning of period | $ | 14.38 | $ | 16.40 | $ | 13.55 | $ | 13.31 | $ | 11.11 | $ | 14.27 |
| Income from Investment Operations | | | | | | | | | | | | |
Net investment income (loss) A,B | | .08 | | .16 | | .24 C | | .14 | | .20 D | | .17 |
| Net realized and unrealized gain (loss) | | 1.02 | | (1.29) | | 4.26 | | .88 | | 3.39 | | (2.58) |
| Total from investment operations | | 1.10 | | (1.13) | | 4.50 | | 1.02 | | 3.59 | | (2.41) |
| Distributions from net investment income | | - | | (.16) E | | (.26) | | (.15) | | (.21) | | (.13) |
| Distributions from net realized gain | | (.04) | | (.73) E | | (1.39) | | (.63) | | (1.18) | | (.62) |
| Total distributions | | (.04) | | (.89) | | (1.65) | | (.78) | | (1.39) | | (.75) |
| Net asset value, end of period | $ | 15.44 | $ | 14.38 | $ | 16.40 | $ | 13.55 | $ | 13.31 | $ | 11.11 |
Total Return F,G,H | | 7.61% | | (7.03)% | | 33.60% | | 8.26% | | 34.53% | | (17.32)% |
Ratios to Average Net Assets B,I,J | | | | | | | | | | | | |
| Expenses before reductions | | .64% K | | .64% | | .64% | | .66% | | .66% | | .67% |
| Expenses net of fee waivers, if any | | .63% K | | .63% | | .63% | | .66% | | .66% | | .67% |
| Expenses net of all reductions | | .63% K | | .63% | | .63% | | .65% | | .66% | | .66% |
| Net investment income (loss) | | 1.09% K | | 1.02% | | 1.47% C | | 1.32% | | 1.64% D | | 1.29% |
| Supplemental Data | | | | | | | | | | | | |
| Net assets, end of period (000 omitted) | $ | 92,762 | $ | 92,162 | $ | 125,050 | $ | 95,708 | $ | 83,357 | $ | 77,279 |
Portfolio turnover rate L | | 78% K | | 59% | | 62% | | 85% | | 68% | | 68% |
A Calculated based on average shares outstanding during the period.
B Net investment income (loss) is affected by the timing of the declaration of dividends by any underlying mutual funds or exchange-traded funds (ETFs). Net investment income (loss) of any mutual funds or ETFs is not included in the Fund's net investment income (loss) ratio.
C Net investment income per share reflects one or more large, non-recurring dividend(s) which amounted to $.06 per share. Excluding such non-recurring dividend(s), the ratio of net investment income (loss) to average net assets would have been 1.09%.
D Net investment income per share reflects one or more large, non-recurring dividend(s) which amounted to $.03 per share. Excluding such non-recurring dividend(s), the ratio of net investment income (loss) to average net assets would have been 1.36%.
E The amount shown reflects reclassifications related to book to tax differences that were made in the year shown.
F Total returns for periods of less than one year are not annualized.
G Total returns do not reflect charges attributable to your insurance company's separate account. Inclusion of these charges would reduce the total returns shown.
H Total returns would have been lower if certain expenses had not been reduced during the applicable periods shown.
I Fees and expenses of any underlying mutual funds or exchange-traded funds (ETFs) are not included in the Fund's expense ratio. The Fund indirectly bears its proportionate share of these expenses. For additional expense information related to investments in Fidelity Central Funds, please refer to the "Investments in Fidelity Central Funds" note found in the Notes to Financial Statements section of the most recent Annual or Semi-Annual report.
J Expense ratios reflect operating expenses of the class. Expenses before reductions do not reflect amounts reimbursed, waived, or reduced through arrangements with the investment adviser, brokerage services, or other offset arrangements, if applicable, and do not represent the amount paid by the class during periods when reimbursements, waivers or reductions occur.
K Annualized.
L Amount does not include the portfolio activity of any underlying mutual funds or exchange-traded funds (ETFs).
| VIP Value Strategies Portfolio Service Class |
| |
| | Six months ended (Unaudited) June 30, 2023 | | Years ended December 31, 2022 | | 2021 | | 2020 | | 2019 | | 2018 |
Selected Per-Share Data | | | | | | | | | | | | |
| Net asset value, beginning of period | $ | 14.32 | $ | 16.35 | $ | 13.51 | $ | 13.27 | $ | 11.09 | $ | 14.23 |
| Income from Investment Operations | | | | | | | | | | | | |
Net investment income (loss) A,B | | .07 | | .14 | | .22 C | | .13 | | .19 D | | .16 |
| Net realized and unrealized gain (loss) | | 1.03 | | (1.29) | | 4.25 | | .88 | | 3.37 | | (2.56) |
| Total from investment operations | | 1.10 | | (1.15) | | 4.47 | | 1.01 | | 3.56 | | (2.40) |
| Distributions from net investment income | | - | | (.15) E | | (.24) | | (.14) | | (.20) | | (.12) |
| Distributions from net realized gain | | (.04) | | (.73) E | | (1.39) | | (.63) | | (1.18) | | (.62) |
| Total distributions | | (.04) | | (.88) | | (1.63) | | (.77) | | (1.38) | | (.74) |
| Net asset value, end of period | $ | 15.38 | $ | 14.32 | $ | 16.35 | $ | 13.51 | $ | 13.27 | $ | 11.09 |
Total Return F,G,H | | 7.64% | | (7.19)% | | 33.48% | | 8.18% | | 34.29% | | (17.33)% |
Ratios to Average Net Assets B,I,J | | | | | | | | | | | | |
| Expenses before reductions | | .74% K | | .74% | | .73% | | .76% | | .76% | | .77% |
| Expenses net of fee waivers, if any | | .73% K | | .73% | | .73% | | .76% | | .76% | | .77% |
| Expenses net of all reductions | | .73% K | | .73% | | .73% | | .75% | | .76% | | .76% |
| Net investment income (loss) | | .99% K | | .92% | | 1.37% C | | 1.22% | | 1.54% D | | 1.19% |
| Supplemental Data | | | | | | | | | | | | |
| Net assets, end of period (000 omitted) | $ | 25,173 | $ | 24,199 | $ | 27,216 | $ | 19,115 | $ | 20,992 | $ | 16,586 |
Portfolio turnover rate L | | 78% K | | 59% | | 62% | | 85% | | 68% | | 68% |
A Calculated based on average shares outstanding during the period.
B Net investment income (loss) is affected by the timing of the declaration of dividends by any underlying mutual funds or exchange-traded funds (ETFs). Net investment income (loss) of any mutual funds or ETFs is not included in the Fund's net investment income (loss) ratio.
C Net investment income per share reflects one or more large, non-recurring dividend(s) which amounted to $.06 per share. Excluding such non-recurring dividend(s), the ratio of net investment income (loss) to average net assets would have been .99%.
D Net investment income per share reflects one or more large, non-recurring dividend(s) which amounted to $.03 per share. Excluding such non-recurring dividend(s), the ratio of net investment income (loss) to average net assets would have been 1.26%.
E The amount shown reflects reclassifications related to book to tax differences that were made in the year shown.
F Total returns for periods of less than one year are not annualized.
G Total returns do not reflect charges attributable to your insurance company's separate account. Inclusion of these charges would reduce the total returns shown.
H Total returns would have been lower if certain expenses had not been reduced during the applicable periods shown.
I Fees and expenses of any underlying mutual funds or exchange-traded funds (ETFs) are not included in the Fund's expense ratio. The Fund indirectly bears its proportionate share of these expenses. For additional expense information related to investments in Fidelity Central Funds, please refer to the "Investments in Fidelity Central Funds" note found in the Notes to Financial Statements section of the most recent Annual or Semi-Annual report.
J Expense ratios reflect operating expenses of the class. Expenses before reductions do not reflect amounts reimbursed, waived, or reduced through arrangements with the investment adviser, brokerage services, or other offset arrangements, if applicable, and do not represent the amount paid by the class during periods when reimbursements, waivers or reductions occur.
K Annualized.
L Amount does not include the portfolio activity of any underlying mutual funds or exchange-traded funds (ETFs).
| VIP Value Strategies Portfolio Service Class 2 |
| |
| | Six months ended (Unaudited) June 30, 2023 | | Years ended December 31, 2022 | | 2021 | | 2020 | | 2019 | | 2018 |
Selected Per-Share Data | | | | | | | | | | | | |
| Net asset value, beginning of period | $ | 14.54 | $ | 16.59 | $ | 13.68 | $ | 13.43 | $ | 11.21 | $ | 14.38 |
| Income from Investment Operations | | | | | | | | | | | | |
Net investment income (loss) A,B | | .06 | | .12 | | .20 C | | .12 | | .17 D | | .14 |
| Net realized and unrealized gain (loss) | | 1.05 | | (1.31) | | 4.31 | | .88 | | 3.41 | | (2.59) |
| Total from investment operations | | 1.11 | | (1.19) | | 4.51 | | 1.00 | | 3.58 | | (2.45) |
| Distributions from net investment income | | - | | (.13) E | | (.21) | | (.12) | | (.18) | | (.10) |
| Distributions from net realized gain | | (.04) | | (.73) E | | (1.39) | | (.63) | | (1.18) | | (.62) |
| Total distributions | | (.04) | | (.86) | | (1.60) | | (.75) | | (1.36) | | (.72) |
| Net asset value, end of period | $ | 15.61 | $ | 14.54 | $ | 16.59 | $ | 13.68 | $ | 13.43 | $ | 11.21 |
Total Return F,G,H | | 7.60% | | (7.35)% | | 33.34% | | 8.02% | | 34.10% | | (17.50)% |
Ratios to Average Net Assets A,I,J | | | | | | | | | | | | |
| Expenses before reductions | | .89% K | | .89% | | .88% | | .91% | | .91% | | .92% |
| Expenses net of fee waivers, if any | | .88% K | | .88% | | .88% | | .91% | | .91% | | .92% |
| Expenses net of all reductions | | .88% K | | .88% | | .88% | | .90% | | .91% | | .91% |
| Net investment income (loss) | | .84% K | | .77% | | 1.22% C | | 1.07% | | 1.39% D | | 1.04% |
| Supplemental Data | | | | | | | | | | | | |
| Net assets, end of period (000 omitted) | $ | 313,809 | $ | 309,683 | $ | 315,104 | $ | 228,031 | $ | 220,982 | $ | 160,274 |
Portfolio turnover rate L | | 78% K | | 59% | | 62% | | 85% | | 68% | | 68% |
A Net investment income (loss) is affected by the timing of the declaration of dividends by any underlying mutual funds or exchange-traded funds (ETFs). Net investment income (loss) of any mutual funds or ETFs is not included in the Fund's net investment income (loss) ratio.
B Calculated based on average shares outstanding during the period.
C Net investment income per share reflects one or more large, non-recurring dividend(s) which amounted to $.06 per share. Excluding such non-recurring dividend(s), the ratio of net investment income (loss) to average net assets would have been .84%.
D Net investment income per share reflects one or more large, non-recurring dividend(s) which amounted to $.03 per share. Excluding such non-recurring dividend(s), the ratio of net investment income (loss) to average net assets would have been 1.11%.
E The amount shown reflects reclassifications related to book to tax differences that were made in the year shown.
F Total returns for periods of less than one year are not annualized.
G Total returns do not reflect charges attributable to your insurance company's separate account. Inclusion of these charges would reduce the total returns shown.
H Total returns would have been lower if certain expenses had not been reduced during the applicable periods shown.
I Fees and expenses of any underlying mutual funds or exchange-traded funds (ETFs) are not included in the Fund's expense ratio. The Fund indirectly bears its proportionate share of these expenses. For additional expense information related to investments in Fidelity Central Funds, please refer to the "Investments in Fidelity Central Funds" note found in the Notes to Financial Statements section of the most recent Annual or Semi-Annual report.
J Expense ratios reflect operating expenses of the class. Expenses before reductions do not reflect amounts reimbursed, waived, or reduced through arrangements with the investment adviser, brokerage services, or other offset arrangements, if applicable, and do not represent the amount paid by the class during periods when reimbursements, waivers or reductions occur.
K Annualized.
L Amount does not include the portfolio activity of any underlying mutual funds or exchange-traded funds (ETFs).
| VIP Value Strategies Portfolio Investor Class |
| |
| | Six months ended (Unaudited) June 30, 2023 | | Years ended December 31, 2022 | | 2021 | | 2020 | | 2019 | | 2018 |
Selected Per-Share Data | | | | | | | | | | | | |
| Net asset value, beginning of period | $ | 14.24 | $ | 16.25 | $ | 13.44 | $ | 13.20 | $ | 11.04 | $ | 14.18 |
| Income from Investment Operations | | | | | | | | | | | | |
Net investment income (loss) A,B | | .07 | | .14 | | .23 C | | .14 | | .19 D | | .16 |
| Net realized and unrealized gain (loss) | | 1.02 | | (1.27) | | 4.22 | | .87 | | 3.35 | | (2.56) |
| Total from investment operations | | 1.09 | | (1.13) | | 4.45 | | 1.01 | | 3.54 | | (2.40) |
| Distributions from net investment income | | - | | (.15) E | | (.24) | | (.14) | | (.20) | | (.12) |
| Distributions from net realized gain | | (.04) | | (.73) E | | (1.39) | | (.63) | | (1.18) | | (.62) |
| Total distributions | | (.04) | | (.88) | | (1.64) F | | (.77) | | (1.38) | | (.74) |
| Net asset value, end of period | $ | 15.29 | $ | 14.24 | $ | 16.25 | $ | 13.44 | $ | 13.20 | $ | 11.04 |
Total Return G,H,I | | 7.62% | | (7.11)% | | 33.48% | | 8.26% | | 34.27% | | (17.37)% |
Ratios to Average Net Assets B,J,K | | | | | | | | | | | | |
| Expenses before reductions | | .71% L | | .71% | | .71% | | .74% | | .74% | | .75% |
| Expenses net of fee waivers, if any | | .71% L | | .71% | | .71% | | .74% | | .74% | | .75% |
| Expenses net of all reductions | | .71% L | | .71% | | .71% | | .73% | | .74% | | .74% |
| Net investment income (loss) | | 1.01% L | | .95% | | 1.39% C | | 1.24% | | 1.56% D | | 1.21% |
| Supplemental Data | | | | | | | | | | | | |
| Net assets, end of period (000 omitted) | $ | 212,173 | $ | 221,074 | $ | 282,755 | $ | 149,707 | $ | 104,581 | $ | 85,385 |
Portfolio turnover rate M | | 78% L | | 59% | | 62% | | 85% | | 68% | | 68% |
A Calculated based on average shares outstanding during the period.
B Net investment income (loss) is affected by the timing of the declaration of dividends by any underlying mutual funds or exchange-traded funds (ETFs). Net investment income (loss) of any mutual funds or ETFs is not included in the Fund's net investment income (loss) ratio.
C Net investment income per share reflects one or more large, non-recurring dividend(s) which amounted to $.06 per share. Excluding such non-recurring dividend(s), the ratio of net investment income (loss) to average net assets would have been 1.02%.
D Net investment income per share reflects one or more large, non-recurring dividend(s) which amounted to $.03 per share. Excluding such non-recurring dividend(s), the ratio of net investment income (loss) to average net assets would have been 1.28%.
E The amount shown reflects reclassifications related to book to tax differences that were made in the year shown.
F Total distributions per share do not sum due to rounding.
G Total returns for periods of less than one year are not annualized.
H Total returns do not reflect charges attributable to your insurance company's separate account. Inclusion of these charges would reduce the total returns shown.
I Total returns would have been lower if certain expenses had not been reduced during the applicable periods shown.
J Fees and expenses of any underlying mutual funds or exchange-traded funds (ETFs) are not included in the Fund's expense ratio. The Fund indirectly bears its proportionate share of these expenses. For additional expense information related to investments in Fidelity Central Funds, please refer to the "Investments in Fidelity Central Funds" note found in the Notes to Financial Statements section of the most recent Annual or Semi-Annual report.
K Expense ratios reflect operating expenses of the class. Expenses before reductions do not reflect amounts reimbursed, waived, or reduced through arrangements with the investment adviser, brokerage services, or other offset arrangements, if applicable, and do not represent the amount paid by the class during periods when reimbursements, waivers or reductions occur.
L Annualized.
M Amount does not include the portfolio activity of any underlying mutual funds or exchange-traded funds (ETFs).
For the period ended June 30, 2023
1. Organization.
VIP Value Strategies Portfolio (the Fund) is a fund of Variable Insurance Products Fund III (the Trust) and is authorized to issue an unlimited number of shares. The Trust is registered under the Investment Company Act of 1940, as amended (the 1940 Act), as an open-end management investment company organized as a Massachusetts business trust. Shares of the Fund may only be purchased by insurance companies for the purpose of funding variable annuity or variable life insurance contracts. The Fund offers the following classes of shares: Initial Class shares, Service Class shares, Service Class 2 shares and Investor Class shares. All classes have equal rights and voting privileges, except for matters affecting a single class.
2. ��Investments in Fidelity Central Funds.
Funds may invest in Fidelity Central Funds, which are open-end investment companies generally available only to other investment companies and accounts managed by the investment adviser and its affiliates. The Schedule of Investments lists any Fidelity Central Funds held as an investment as of period end, but does not include the underlying holdings of each Fidelity Central Fund. An investing fund indirectly bears its proportionate share of the expenses of the underlying Fidelity Central Funds.
Based on its investment objective, each Fidelity Central Fund may invest or participate in various investment vehicles or strategies that are similar to those of the investing fund. These strategies are consistent with the investment objectives of the investing fund and may involve certain economic risks which may cause a decline in value of each of the Fidelity Central Funds and thus a decline in the value of the investing fund.
| Fidelity Central Fund | Investment Manager | Investment Objective | Investment Practices | Expense Ratio A |
| Fidelity Money Market Central Funds | Fidelity Management & Research Company LLC (FMR) | Each fund seeks to obtain a high level of current income consistent with the preservation of capital and liquidity. | Short-term Investments | Less than .005% |
A Expenses expressed as a percentage of average net assets and are as of each underlying Central Fund's most recent annual or semi-annual shareholder report.
A complete unaudited list of holdings for each Fidelity Central Fund is available upon request or at the Securities and Exchange Commission website at www.sec.gov. In addition, the financial statements of the Fidelity Central Funds which contain the significant accounting policies (including investment valuation policies) of those funds, and are not covered by the Report of Independent Registered Public Accounting Firm, are available on the Securities and Exchange Commission website or upon request.
3. Significant Accounting Policies.
The Fund is an investment company and applies the accounting and reporting guidance of the Financial Accounting Standards Board (FASB) Accounting Standards Codification Topic 946 Financial Services - Investment Companies . The financial statements have been prepared in conformity with accounting principles generally accepted in the United States of America (GAAP), which require management to make certain estimates and assumptions at the date of the financial statements. Actual results could differ from those estimates. Subsequent events, if any, through the date that the financial statements were issued have been evaluated in the preparation of the financial statements. The Fund's Schedule of Investments lists any underlying mutual funds or exchange-traded funds (ETFs) but does not include the underlying holdings of these funds. The following summarizes the significant accounting policies of the Fund:
Investment Valuation. Investments are valued as of 4:00 p.m. Eastern time on the last calendar day of the period. The Board of Trustees (the Board) has designated the Fund's investment adviser as the valuation designee responsible for the fair valuation function and performing fair value determinations as needed. The investment adviser has established a Fair Value Committee (the Committee) to carry out the day-to-day fair valuation responsibilities and has adopted policies and procedures to govern the fair valuation process and the activities of the Committee. In accordance with these fair valuation policies and procedures, which have been approved by the Board, the Fund attempts to obtain prices from one or more third party pricing services or brokers to value its investments. When current market prices, quotations or currency exchange rates are not readily available or reliable, investments will be fair valued in good faith by the Committee, in accordance with the policies and procedures. Factors used in determining fair value vary by investment type and may include market or investment specific events, transaction data, estimated cash flows, and market observations of comparable investments. The frequency that the fair valuation procedures are used cannot be predicted and they may be utilized to a significant extent. The Committee manages the Fund's fair valuation practices and maintains the fair valuation policies and procedures. The Fund's investment adviser reports to the Board information regarding the fair valuation process and related material matters.
The Fund categorizes the inputs to valuation techniques used to value its investments into a disclosure hierarchy consisting of three levels as shown below:
Level 1 - unadjusted quoted prices in active markets for identical investments
Level 2 - other significant observable inputs (including quoted prices for similar investments, interest rates, prepayment speeds, etc.)
Level 3 - unobservable inputs (including the Fund's own assumptions based on the best information available)
Valuation techniques used to value the Fund's investments by major category are as follows:
Equity securities, including restricted securities, for which market quotations are readily available, are valued at the last reported sale price or official closing price as reported by a third party pricing service on the primary market or exchange on which they are traded and are categorized as Level 1 in the hierarchy. In the event there were no sales during the day or closing prices are not available, securities are valued at the last quoted bid price or may be valued using the last available price and are generally categorized as Level 2 in the hierarchy. For foreign equity securities, when market or security specific events arise, comparisons to the valuation of American Depositary Receipts (ADRs), futures contracts, ETFs and certain indexes as well as quoted prices for similar securities may be used and would be categorized as Level 2 in the hierarchy. For equity securities, including restricted securities, where observable inputs are limited, assumptions about market activity and risk are used and these securities may be categorized as Level 3 in the hierarchy.
Investments in open-end mutual funds, including the Fidelity Central Funds, are valued at their closing net asset value (NAV) each business day and are categorized as Level 1 in the hierarchy.
Changes in valuation techniques may result in transfers in or out of an assigned level within the disclosure hierarchy. The aggregate value of investments by input level as of June 30, 2023 is included at the end of the Fund's Schedule of Investments.
Foreign Currency. Certain Funds may use foreign currency contracts to facilitate transactions in foreign-denominated securities. Gains and losses from these transactions may arise from changes in the value of the foreign currency or if the counterparties do not perform under the contracts' terms.
Foreign-denominated assets, including investment securities, and liabilities are translated into U.S. dollars at the exchange rates at period end. Purchases and sales of investment securities, income and dividends received, and expenses denominated in foreign currencies are translated into U.S. dollars at the exchange rate in effect on the transaction date.
The effects of exchange rate fluctuations on investments are included with the net realized and unrealized gain (loss) on investment securities. Other foreign currency transactions resulting in realized and unrealized gain (loss) are disclosed separately.
Investment Transactions and Income. For financial reporting purposes, the Fund's investment holdings and NAV include trades executed through the end of the last business day of the period. The NAV per share for processing shareholder transactions is calculated as of the close of business of the New York Stock Exchange (NYSE), normally 4:00 p.m. Eastern time and includes trades executed through the end of the prior business day. Gains and losses on securities sold are determined on the basis of identified cost and include proceeds received from litigation. Commissions paid to certain brokers with whom the investment adviser, or its affiliates, places trades on behalf of a fund include an amount in addition to trade execution, which may be rebated back to a fund. Any such rebates are included in net realized gain (loss) on investments in the Statement of Operations. Dividend income is recorded on the ex-dividend date, except for certain dividends from foreign securities where the ex-dividend date may have passed, which are recorded as soon as the Fund is informed of the ex-dividend date. Non-cash dividends included in dividend income, if any, are recorded at the fair market value of the securities received. Income and capital gain distributions from Fidelity Central Funds, if any, are recorded on the ex-dividend date. Certain distributions received by the Fund represent a return of capital or capital gain. The Fund determines the components of these distributions subsequent to the ex-dividend date, based upon receipt of tax filings or other correspondence relating to the underlying investment. These distributions are recorded as a reduction of cost of investments and/or as a realized gain. Investment income is recorded net of foreign taxes withheld where recovery of such taxes is uncertain. Funds may file withholding tax reclaims in certain jurisdictions to recover a portion of amounts previously withheld. Any withholding tax reclaims income is included in the Statement of Operations in dividends. Any receivables for withholding tax reclaims are included in the Statement of Assets and Liabilities in dividends receivable.
Class Allocations and Expenses. Investment income, realized and unrealized capital gains and losses, common expenses of a fund, and certain fund-level expense reductions, if any, are allocated daily on a pro-rata basis to each class based on the relative net assets of each class to the total net assets of a fund. Each class differs with respect to transfer agent and distribution and service plan fees incurred, as applicable. Certain expense reductions may also differ by class, if applicable. For the reporting period, the allocated portion of income and expenses to each class as a percent of its average net assets may vary due to the timing of recording these transactions in relation to fluctuating net assets of the classes. Expenses directly attributable to a fund are charged to that fund. Expenses attributable to more than one fund are allocated among the respective funds on the basis of relative net assets or other appropriate methods. Expenses included in the accompanying financial statements reflect the expenses of that fund and do not include any expenses associated with any underlying mutual funds or exchange-traded funds (ETFs). Although not included in a fund's expenses, a fund indirectly bears its proportionate share of these expenses through the net asset value of each underlying mutual fund or exchange-traded fund (ETF). Expense estimates are accrued in the period to which they relate and adjustments are made when actual amounts are known.
Income Tax Information and Distributions to Shareholders. Each year, the Fund intends to qualify as a regulated investment company under Subchapter M of the Internal Revenue Code, including distributing substantially all of its taxable income and realized gains. As a result, no provision for U.S. Federal income taxes is required. The Fund files a U.S. federal tax return, in addition to state and local tax returns as required. The Fund's federal income tax returns are subject to examination by the Internal Revenue Service (IRS) for a period of three fiscal years after they are filed. State and local tax returns may be subject to examination for an additional fiscal year depending on the jurisdiction. Foreign taxes are provided for based on the Fund's understanding of the tax rules and rates that exist in the foreign markets in which it invests.
Distributions are declared and recorded on the ex-dividend date. Income and capital gain distributions are declared separately for each class. Income and capital gain distributions are determined in accordance with income tax regulations, which may differ from GAAP.
Capital accounts within the financial statements are adjusted for permanent book-tax differences. These adjustments have no impact on net assets or the results of operations. Capital accounts are not adjusted for temporary book-tax differences which will reverse in a subsequent period.
Book-tax differences are primarily due to foreign currency transactions, partnerships and losses deferred due to wash sales.
As of period end, the cost and unrealized appreciation (depreciation) in securities, and derivatives if applicable, for federal income tax purposes were as follows:
| Gross unrealized appreciation | $147,672,643 |
| Gross unrealized depreciation | (26,069,558) |
| Net unrealized appreciation (depreciation) | $121,603,085 |
| Tax cost | $540,999,673 |
Restricted Securities (including Private Placements). Funds may invest in securities that are subject to legal or contractual restrictions on resale. These securities generally may be resold in transactions exempt from registration or to the public if the securities are registered. Disposal of these securities may involve time-consuming negotiations and expense, and prompt sale at an acceptable price may be difficult. Information regarding restricted securities held at period end is included at the end of the Schedule of Investments, if applicable.
4. Purchases and Sales of Investments.
Purchases and sales of securities, other than short-term securities and in-kind transactions, as applicable, are noted in the table below.
| | Purchases ($) | Sales ($) |
| VIP Value Strategies Portfolio | 254,903,291 | 300,682,214 |
5. Fees and Other Transactions with Affiliates.
Management Fee. Fidelity Management & Research Company LLC (the investment adviser) and its affiliates provide the Fund with investment management related services for which the Fund pays a monthly management fee. The management fee is the sum of an individual fund fee rate that is based on an annual rate of .30% of the Fund's average net assets and an annualized group fee rate that averaged .23% during the period. The group fee rate is based upon the monthly average net assets of a group of registered investment companies with which the investment adviser has management contracts. The group fee rate decreases as assets under management increase and increases as assets under management decrease. For the reporting period, the total annualized management fee rate was .53% of the Fund's average net assets.
Distribution and Service Plan Fees. In accordance with Rule 12b-1 of the 1940 Act, the Fund has adopted separate 12b-1 Plans for each Service Class of shares. Each Service Class pays Fidelity Distributors Company LLC (FDC), an affiliate of the investment adviser, a service fee. For the period, the service fee is based on an annual rate of .10% of Service Class' average net assets and .25% of Service Class 2's average net assets.
For the period, total fees, all of which were re-allowed to insurance companies for the distribution of shares and providing shareholder support services, were as follows:
| Service Class | $12,516 |
| Service Class 2 | 395,475 |
| | $407,991 |
Transfer Agent Fees. Fidelity Investments Institutional Operations Company LLC (FIIOC), an affiliate of the investment adviser, is the Fund's transfer, dividend disbursing, and shareholder servicing agent. FIIOC receives an asset-based fee with respect to each class. Each class pays a fee for transfer agent services, typesetting and printing and mailing of shareholder reports, excluding mailing of proxy statements. For the period, transfer agent fees for each class were as follows:
| | Amount | % of Class-Level Average Net Assets A |
| Initial Class | $29,643 | .06 |
| Service Class | 7,885 | .06 |
| Service Class 2 | 99,660 | .06 |
| Investor Class | 156,198 | .14 |
| | $293,386 | |
A Annualized
Accounting Fees. Fidelity Service Company, Inc. (FSC), an affiliate of the investment adviser, maintains the Fund's accounting records. The accounting fee is based on the level of average net assets for each month. For the period, the fees were equivalent to the following annualized rates:
| | % of Average Net Assets |
| VIP Value Strategies Portfolio | .03 |
Brokerage Commissions. A portion of portfolio transactions were placed with brokerage firms which are affiliates of the investment adviser. Brokerage commissions are included in net realized gain (loss) and change in net unrealized appreciation (depreciation) in the Statement of Operations. The commissions paid to these affiliated firms were as follows:
| | Amount |
| VIP Value Strategies Portfolio | $6,034 |
Interfund Trades. Funds may purchase from or sell securities to other Fidelity Funds under procedures adopted by the Board. The procedures have been designed to ensure these interfund trades are executed in accordance with Rule 17a-7 of the 1940 Act. Any interfund trades are included within the respective purchases and sales amounts shown in the Purchases and Sales of Investments note. Interfund trades during the period are noted in the table below.
| | Purchases ($) | Sales ($) | Realized Gain (Loss) ($) |
| VIP Value Strategies Portfolio | 20,465,181 | 24,187,995 | 2,114,855 |
6. Committed Line of Credit.
Certain Funds participate with other funds managed by the investment adviser or an affiliate in a $4.25 billion credit facility (the "line of credit") to be utilized for temporary or emergency purposes to fund shareholder redemptions or for other short-term liquidity purposes. The participating funds have agreed to pay commitment fees on their pro-rata portion of the line of credit, which are reflected in Miscellaneous expenses on the Statement of Operations, and are listed below. During the period, there were no borrowings on this line of credit.
| | Amount |
| VIP Value Strategies Portfolio | $664 |
7. Security Lending.
Funds lend portfolio securities from time to time in order to earn additional income. Lending agents are used, including National Financial Services (NFS), an affiliate of the investment adviser. Pursuant to a securities lending agreement, NFS will receive a fee, which is capped at 9.9% of a fund's daily lending revenue, for its services as lending agent. A fund may lend securities to certain qualified borrowers, including NFS. On the settlement date of the loan, a fund receives collateral (in the form of U.S. Treasury obligations, letters of credit and/or cash) against the loaned securities and maintains collateral in an amount not less than 100% of the market value of the loaned securities during the period of the loan. The market value of the loaned securities is determined at the close of business of a fund and any additional required collateral is delivered to a fund on the next business day. A fund or borrower may terminate the loan at any time, and if the borrower defaults on its obligation to return the securities loaned because of insolvency or other reasons, a fund may apply collateral received from the borrower against the obligation. A fund may experience delays and costs in recovering the securities loaned. Any cash collateral received is invested in the Fidelity Securities Lending Cash Central Fund. Any loaned securities are identified as such in the Schedule of Investments, and the value of loaned securities and cash collateral at period end, as applicable, are presented in the Statement of Assets and Liabilities. Security lending income represents the income earned on investing cash collateral, less rebates paid to borrowers and any lending agent fees associated with the loan, plus any premium payments received for lending certain types of securities. Security lending income is presented in the Statement of Operations as a component of income from Fidelity Central Funds. Affiliated security lending activity, if any, was as follows:
| | Total Security Lending Fees Paid to NFS | Security Lending Income From Securities Loaned to NFS | Value of Securities Loaned to NFS at Period End |
| VIP Value Strategies Portfolio | $2,524 | $- | $- |
8. Expense Reductions.
During the period the investment adviser or an affiliate reimbursed and/or waived a portion of fund-level operating expenses in the amount of $15,258.
9. Distributions to Shareholders.
Distributions to shareholders of each class were as follows:
| | Six months ended June 30, 2023 | Year ended December 31, 2022 |
| VIP Value Strategies Portfolio | | |
| Distributions to shareholders | | |
| Initial Class | $227,773 | $5,685,132 |
| Service Class | 61,091 | 1,349,204 |
| Service Class 2 | 774,878 | 17,261,213 |
| Investor Class | 565,006 | 13,626,476 |
Total | $1,628,748 | $37,922,025 |
10. Share Transactions.
Transactions for each class of shares were as follows and may contain in-kind transactions:
| | Shares | Shares | Dollars | Dollars |
| | Six months ended June 30, 2023 | Year ended December 31, 2022 | Six months ended June 30, 2023 | Year ended December 31, 2022 |
| VIP Value Strategies Portfolio | | | | |
| Initial Class | | | | |
| Shares sold | 577,249 | 1,947,608 | $8,578,263 | $30,529,762 |
| Reinvestment of distributions | 14,191 | 381,010 | 227,773 | 5,685,132 |
| Shares redeemed | (996,455) | (3,540,820) | (14,805,723) | (54,388,401) |
| Net increase (decrease) | (405,015) | (1,212,202) | $(5,999,687) | $(18,173,507) |
| Service Class | | | | |
| Shares sold | 171,802 | 1,240,779 | $2,582,644 | $19,740,105 |
| Reinvestment of distributions | 3,821 | 90,885 | 61,091 | 1,349,204 |
| Shares redeemed | (228,477) | (1,306,794) | (3,393,608) | (20,177,384) |
| Net increase (decrease) | (52,854) | 24,870 | $(749,873) | $911,925 |
| Service Class 2 | | | | |
| Shares sold | 1,428,562 | 5,294,423 | $21,707,169 | $83,174,293 |
| Reinvestment of distributions | 47,714 | 1,145,778 | 774,878 | 17,261,213 |
| Shares redeemed | (2,661,741) | (4,143,289) | (39,657,199) | (63,475,844) |
| Net increase (decrease) | (1,185,465) | 2,296,912 | $(17,175,152) | $36,959,662 |
| Investor Class | | | | |
| Shares sold | 1,083,963 | 3,558,568 | $16,653,121 | $56,415,018 |
| Reinvestment of distributions | 35,557 | 922,387 | 565,006 | 13,626,476 |
| Shares redeemed | (2,770,851) | (6,349,396) | (39,887,916) | (94,251,650) |
| Net increase (decrease) | (1,651,331) | (1,868,441) | $(22,669,789) | $(24,210,156) |
11. Other.
A fund's organizational documents provide former and current trustees and officers with a limited indemnification against liabilities arising in connection with the performance of their duties to the fund. In the normal course of business, a fund may also enter into contracts that provide general indemnifications. A fund's maximum exposure under these arrangements is unknown as this would be dependent on future claims that may be made against a fund. The risk of material loss from such claims is considered remote.
At the end of the period, the investment adviser or its affiliates were owners of record of more than 10% and certain otherwise unaffiliated shareholders were owners of record of more than 10% of the outstanding shares as follows:
| Fund | Affiliated % | Number ofUnaffiliated Shareholders | Unaffiliated Shareholders % |
| VIP Value Strategies Portfolio | 42% | 1 | 36% |
12. Risk and Uncertainties.
Many factors affect a fund's performance. Developments that disrupt global economies and financial markets, such as pandemics, epidemics, outbreaks of infectious diseases, war, terrorism, and environmental disasters, may significantly affect a fund's investment performance. The effects of these developments to a fund will be impacted by the types of securities in which a fund invests, the financial condition, industry, economic sector, and geographic location of an issuer, and a fund's level of investment in the securities of that issuer. Significant concentrations in security types, issuers, industries, sectors, and geographic locations may magnify the factors that affect a fund's performance.
As a shareholder, you incur two types of costs: (1) transaction costs, which may include sales charges (loads) on purchase payments or redemption proceeds, as applicable and (2) ongoing costs, which generally include management fees, distribution and/or service (12b-1) fees and other Fund expenses. This Example is intended to help you understand your ongoing costs (in dollars) of investing in a fund and to compare these costs with the ongoing costs of investing in other mutual funds.
| The Example is based on an investment of $1,000 invested at the beginning of the period and held for the entire period (January 1, 2023 to June 30, 2023). |
Actual Expenses
The first line of the accompanying table provides information about actual account values and actual expenses. You may use the information in this line, together with the amount you invested, to estimate the expenses that you paid over the period. Simply divide your account value by $1,000.00 (for example, an $8,600 account value divided by $1,000.00 = 8.6), then multiply the result by the number in the first line for a class/Fund under the heading entitled "Expenses Paid During Period" to estimate the expenses you paid on your account during this period. If any fund is a shareholder of any underlying mutual funds or exchange-traded funds (ETFs) (the Underlying Funds), such fund indirectly bears its proportional share of the expenses of the Underlying Funds in addition to the direct expenses incurred presented in the table. These fees and expenses are not included in the annualized expense ratio used to calculate the expense estimate in the table below. The estimate of expenses does not include any fees or other expenses of any variable annuity or variable life insurance product. If they were, the estimate of expenses you paid during the period would be higher, and your ending account value would be lower.
Hypothetical Example for Comparison Purposes
The second line of the accompanying table provides information about hypothetical account values and hypothetical expenses based on the actual expense ratio and an assumed rate of return of 5% per year before expenses, which is not the actual return. The hypothetical account values and expenses may not be used to estimate the actual ending account balance or expenses you paid for the period. You may use this information to compare the ongoing costs of investing in the Fund and other funds. To do so, compare this 5% hypothetical example with the 5% hypothetical examples that appear in the shareholder reports of the other funds. If any fund is a shareholder of any Underlying Funds, such fund indirectly bears its proportional share of the expenses of the Underlying Funds in addition to the direct expenses as presented in the table. These fees and expenses are not included in the annualized expense ratio used to calculate the expense estimate in the table below. The estimate of expenses does not include any fees or other expenses of any variable annuity or variable life insurance product. If they were, the estimate of expenses you paid during the period would be higher, and your ending account value would be lower.
Please note that the expenses shown in the table are meant to highlight your ongoing costs only and do not reflect any transaction costs. Therefore, the second line of the table is useful in comparing ongoing costs only, and will not help you determine the relative total costs of owning different funds. In addition, if these transactional costs were included, your costs would have been higher.
| | | | | Annualized Expense Ratio- A | | Beginning Account Value January 1, 2023 | | Ending Account Value June 30, 2023 | | Expenses Paid During Period- C January 1, 2023 to June 30, 2023 |
| VIP Value Strategies Portfolio | | | | | | | | | | |
| Initial Class | | | | .63% | | | | | | |
| Actual | | | | | | $ 1,000 | | $ 1,076.10 | | $ 3.24 |
Hypothetical- B | | | | | | $ 1,000 | | $ 1,021.67 | | $ 3.16 |
| Service Class | | | | .73% | | | | | | |
| Actual | | | | | | $ 1,000 | | $ 1,076.40 | | $ 3.76 |
Hypothetical- B | | | | | | $ 1,000 | | $ 1,021.17 | | $ 3.66 |
| Service Class 2 | | | | .88% | | | | | | |
| Actual | | | | | | $ 1,000 | | $ 1,076.00 | | $ 4.53 |
Hypothetical- B | | | | | | $ 1,000 | | $ 1,020.43 | | $ 4.41 |
| Investor Class | | | | .71% | | | | | | |
| Actual | | | | | | $ 1,000 | | $ 1,076.20 | | $ 3.65 |
Hypothetical- B | | | | | | $ 1,000 | | $ 1,021.27 | | $ 3.56 |
| |
A Annualized expense ratio reflects expenses net of applicable fee waivers.
B 5% return per year before expenses
C Expenses are equal to the annualized expense ratio, multiplied by the average account value over the period, multiplied by 181/ 365 (to reflect the one-half year period). The fees and expenses of any Underlying Funds are not included in each annualized expense ratio.
Board Approval of Investment Advisory Contracts
VIP Value Strategies Portfolio
At its May 2023 meeting, the Board of Trustees, including the Independent Trustees (together, the Board), voted to continue the management contract with Fidelity Management & Research Company LLC (FMR), and the sub-advisory agreements and sub-subadvisory agreements, in each case, where applicable (together, the Advisory Contracts) for the fund for two months from June 1, 2023 through July 31, 2023. The Board determined that it will consider the annual renewal of the fund's Advisory Contracts for a full one year period in July 2023, following its review of additional materials provided by FMR.
The Board considered that the approval of the fund's Advisory Contracts will not result in any changes in (i) the investment process or strategies employed in the management of the fund's assets; (ii) the fees and expenses paid by shareholders; (iii) the nature, extent or quality of services provided under the fund's Advisory Contracts; or (iv) the day-to-day management of the fund or the persons primarily responsible for such management. The Board also considered that since its last approval of the fund's Advisory Contracts, FMR had provided additional information on the fund in support of the annual contract renewal process, including competitive analyses on total expenses and management fees and in-depth reviews of fund performance and fund profitability information. The Board concluded that the fund's Advisory Contracts are fair and reasonable, and that the fund's Advisory Contracts should be renewed, without modification, through July 31, 2023, with the understanding that the Board will consider the annual renewal for a full one year period in July 2023.
In connection with its consideration of future renewals of the fund's Advisory Contracts, the Board will consider: (i) the nature, extent and quality of services provided to the fund, including shareholder and administrative services and investment performance; (ii) the competitiveness of the management fee and total expenses for the fund; (iii) the costs of the services and profitability, including the revenues earned and the expenses incurred in conducting the business of developing, marketing, distributing, managing, administering, and servicing the fund and its shareholders, to the extent applicable; and (iv) whether there have been economies of scale in respect of the Fidelity funds, whether the Fidelity funds (including the fund) have appropriately benefited from any such economies of scale, and whether there is the potential for realization of any further economies.
Based on its evaluation of all of the conclusions noted above, and after considering all factors it believed relevant, the Board ultimately concluded that the fund's management fee structure is fair and reasonable, and that the continuation of the fund's Advisory Contracts should be approved for two months from June 1, 2023 through July 31, 2023.
The Securities and Exchange Commission adopted Rule 22e-4 under the Investment Company Act of 1940 (the Liquidity Rule) to promote effective liquidity risk management throughout the open-end investment company industry, thereby reducing the risk that funds will be unable to meet their redemption obligations and mitigating dilution of the interests of fund shareholders.
The Fund has adopted and implemented a liquidity risk management program (the Program) reasonably designed to assess and manage the Fund's liquidity risk and to comply with the requirements of the Liquidity Rule. The Fund's Board of Trustees (the Board) has designated the Fund's investment adviser as administrator of the Program. The Fidelity advisers have established a Liquidity Risk Management Committee (the LRM Committee) to manage the Program for each of the Fidelity Funds. The LRM Committee monitors the adequacy and effectiveness of implementation of the Program and on a periodic basis assesses each Fund's liquidity risk based on a variety of factors including (1) the Fund's investment strategy, (2) portfolio liquidity and cash flow projections during normal and reasonably foreseeable stressed conditions, (3) shareholder redemptions, (4) borrowings and other funding sources and (5) certain factors specific to ETFs including the effect of the Fund's prices and spreads, market participants, and basket compositions on the overall liquidity of the Fund's portfolio, as applicable.
In accordance with the Program, each of the Fund's portfolio investments is classified into one of four defined liquidity categories based on a determination of a reasonable expectation for how long it would take to convert the investment to cash (or sell or dispose of the investment) without significantly changing its market value.
- Highly liquid investments - cash or convertible to cash within three business days or less
- Moderately liquid investments - convertible to cash in three to seven calendar days
- Less liquid investments - can be sold or disposed of, but not settled, within seven calendar days
- Illiquid investments - cannot be sold or disposed of within seven calendar days
Liquidity classification determinations take into account a variety of factors including various market, trading and investment-specific considerations, as well as market depth, and generally utilize analysis from a third-party liquidity metrics service.
The Liquidity Rule places a 15% limit on a fund's illiquid investments and requires funds that do not primarily hold assets that are highly liquid investments to determine and maintain a minimum percentage of the fund's net assets to be invested in highly liquid investments (highly liquid investment minimum or HLIM). The Program includes provisions reasonably designed to comply with the 15% limit on illiquid investments and for determining, periodically reviewing and complying with the HLIM requirement as applicable.
At a recent meeting of the Fund's Board of Trustees, the LRM Committee provided a written report to the Board pertaining to the operation, adequacy, and effectiveness of the Program for the period December 1, 2021 through November 30, 2022. The report concluded that the Program is operating effectively and is reasonably designed to assess and manage the Fund's liquidity risk.
1.774744.121
VIPVS-SANN-0823
Fidelity® Variable Insurance Products:
VIP Dynamic Capital Appreciation Portfolio
Semi-Annual Report
June 30, 2023
Contents
To view a fund's proxy voting guidelines and proxy voting record for the 12-month period ended June 30, visit http://www.fidelity.com/proxyvotingresults or visit the Securities and Exchange Commission's (SEC) web site at http://www.sec.gov.
You may also call 1-877-208-0098 to request a free copy of the proxy voting guidelines.
Fidelity® Variable Insurance Products are separate account options which are purchased through a variable insurance contract.
Standard & Poor's, S&P and S&P 500 are registered service marks of The McGraw-Hill Companies, Inc. and have been licensed for use by Fidelity Distributors Corporation.
Other third-party marks appearing herein are the property of their respective owners.
All other marks appearing herein are registered or unregistered trademarks or service marks of FMR LLC or an affiliated company. © 2023 FMR LLC. All rights reserved.
This report and the financial statements contained herein are submitted for the general information of the shareholders of the Fund. This report is not authorized for distribution to prospective investors in the Fund unless preceded or accompanied by an effective prospectus.
A fund files its complete schedule of portfolio holdings with the SEC for the first and third quarters of each fiscal year on Form N-PORT. Forms N-PORT are available on the SEC's web site at http://www.sec.gov. A fund's Forms N-PORT may be reviewed and copied at the SEC's Public Reference Room in Washington, DC. Information regarding the operation of the SEC's Public Reference Room may be obtained by calling 1-800-SEC-0330.
For a complete list of a fund's portfolio holdings, view the most recent holdings listing, semiannual report, or annual report on Fidelity's web site at http://www.fidelity.com, http://www.institutional.fidelity.com, or http://www.401k.com, as applicable.
NOT FDIC INSURED •MAY LOSE VALUE •NO BANK GUARANTEE
Neither the Fund nor Fidelity Distributors Corporation is a bank.
This report and the financial statements contained herein are submitted for the general information of the shareholders of the Fund. This report is not authorized for distribution to prospective investors in the Fund unless preceded or accompanied by an effective prospectus.
A fund files its complete schedule of portfolio holdings with the SEC for the first and third quarters of each fiscal year on Form N-PORT. Forms N-PORT are available on the SEC's web site at http://www.sec.gov. A fund's Forms N-PORT may be reviewed and copied at the SEC's Public Reference Room in Washington, DC. Information regarding the operation of the SEC's Public Reference Room may be obtained by calling 1-800-SEC-0330.
For a complete list of a fund's portfolio holdings, view the most recent holdings listing, semiannual report, or annual report on Fidelity's web site at http://www.fidelity.com, http://www.institutional.fidelity.com, or http://www.401k.com, as applicable.
NOT FDIC INSURED •MAY LOSE VALUE •NO BANK GUARANTEE
Neither the Fund nor Fidelity Distributors Corporation is a bank.
Top Holdings (% of Fund's net assets) |
| |
| Microsoft Corp. | 8.1 | |
| NVIDIA Corp. | 5.1 | |
| MasterCard, Inc. Class A | 2.7 | |
| Uber Technologies, Inc. | 2.7 | |
| JPMorgan Chase & Co. | 2.5 | |
| Apple, Inc. | 2.4 | |
| Oracle Corp. | 2.4 | |
| TJX Companies, Inc. | 2.1 | |
| Ingersoll Rand, Inc. | 2.0 | |
| CME Group, Inc. | 1.8 | |
| | 31.8 | |
| |
| Market Sectors (% of Fund's net assets) |
| |
| Information Technology | 32.0 | |
| Industrials | 15.5 | |
| Health Care | 15.1 | |
| Financials | 11.6 | |
| Consumer Discretionary | 10.3 | |
| Communication Services | 8.0 | |
| Energy | 3.8 | |
| Consumer Staples | 2.3 | |
| Utilities | 0.4 | |
| Materials | 0.3 | |
| |
Asset Allocation (% of Fund's net assets) |
|
|
Geographic Diversification (% of Fund's net assets) |
|
* Includes Short-Term investments and Net Other Assets (Liabilities). Percentages are adjusted for the effect of derivatives, if applicable. |
| |
Showing Percentage of Net Assets
| Common Stocks - 99.0% |
| | | Shares | Value ($) |
| COMMUNICATION SERVICES - 8.0% | | | |
| Entertainment - 4.4% | | | |
| Netflix, Inc. (a) | | 8,300 | 3,656,067 |
| Universal Music Group NV | | 163,035 | 3,620,342 |
| Warner Music Group Corp. Class A | | 77,575 | 2,023,932 |
| | | | 9,300,341 |
| Interactive Media & Services - 3.6% | | | |
| Alphabet, Inc.: | | | |
| Class A (a) | | 31,480 | 3,768,156 |
| Class C (a) | | 30,860 | 3,733,134 |
| Epic Games, Inc. (a)(b)(c) | | 156 | 109,818 |
| | | | 7,611,108 |
| Media - 0.0% | | | |
| Innovid Corp. (a) | | 11,766 | 12,825 |
TOTAL COMMUNICATION SERVICES | | | 16,924,274 |
| CONSUMER DISCRETIONARY - 10.3% | | | |
| Automobile Components - 0.1% | | | |
| Mobileye Global, Inc. | | 1,700 | 65,314 |
| Automobiles - 0.4% | | | |
| BYD Co. Ltd. (H Shares) | | 27,500 | 881,778 |
| Broadline Retail - 2.8% | | | |
| Amazon.com, Inc. (a) | | 25,960 | 3,384,146 |
| Dollarama, Inc. | | 10,800 | 731,441 |
| MercadoLibre, Inc. (a) | | 1,560 | 1,847,976 |
| | | | 5,963,563 |
| Hotels, Restaurants & Leisure - 2.4% | | | |
| Airbnb, Inc. Class A (a) | | 11,000 | 1,409,760 |
| Booking Holdings, Inc. (a) | | 445 | 1,201,647 |
| Flutter Entertainment PLC (a) | | 10,474 | 2,101,713 |
| Kura Sushi U.S.A., Inc. Class A (a) | | 3,500 | 325,325 |
| | | | 5,038,445 |
| Specialty Retail - 2.9% | | | |
| Five Below, Inc. (a) | | 8,100 | 1,591,974 |
| TJX Companies, Inc. | | 53,358 | 4,524,225 |
| | | | 6,116,199 |
| Textiles, Apparel & Luxury Goods - 1.7% | | | |
| Compagnie Financiere Richemont SA Series A | | 1,000 | 169,868 |
| LVMH Moet Hennessy Louis Vuitton SE | | 1,800 | 1,697,242 |
| LVMH Moet Hennessy Louis Vuitton SE | | 700 | 661,500 |
| Samsonite International SA (a)(d) | | 391,545 | 1,104,281 |
| | | | 3,632,891 |
TOTAL CONSUMER DISCRETIONARY | | | 21,698,190 |
| CONSUMER STAPLES - 2.3% | | | |
| Beverages - 1.5% | | | |
| Boston Beer Co., Inc. Class A (a) | | 2,400 | 740,256 |
| Monster Beverage Corp. | | 42,348 | 2,432,469 |
| | | | 3,172,725 |
| Household Products - 0.3% | | | |
| Energizer Holdings, Inc. | | 21,400 | 718,612 |
| Personal Care Products - 0.5% | | | |
| Estee Lauder Companies, Inc. Class A | | 3,100 | 608,778 |
| Kenvue, Inc. | | 12,800 | 338,176 |
| | | | 946,954 |
TOTAL CONSUMER STAPLES | | | 4,838,291 |
| ENERGY - 3.8% | | | |
| Energy Equipment & Services - 0.8% | | | |
| Baker Hughes Co. Class A | | 57,600 | 1,820,736 |
| Oil, Gas & Consumable Fuels - 3.0% | | | |
| Antero Resources Corp. (a) | | 15,900 | 366,177 |
| Canadian Natural Resources Ltd. | | 18,000 | 1,012,680 |
| Cheniere Energy, Inc. | | 20,600 | 3,138,616 |
| Denbury, Inc. (a) | | 6,000 | 517,560 |
| New Fortress Energy, Inc. | | 15,600 | 417,768 |
| Range Resources Corp. | | 29,100 | 855,540 |
| | | | 6,308,341 |
TOTAL ENERGY | | | 8,129,077 |
| FINANCIALS - 11.6% | | | |
| Banks - 2.5% | | | |
| JPMorgan Chase & Co. | | 36,600 | 5,323,104 |
| Capital Markets - 2.7% | | | |
| CME Group, Inc. | | 20,636 | 3,823,644 |
| Morgan Stanley | | 22,810 | 1,947,974 |
| | | | 5,771,618 |
| Financial Services - 3.4% | | | |
| Block, Inc. Class A (a) | | 15,800 | 1,051,806 |
| MasterCard, Inc. Class A | | 14,600 | 5,742,180 |
| One97 Communications Ltd. (a) | | 11,200 | 118,712 |
| Rocket Companies, Inc. (a)(e) | | 34,700 | 310,912 |
| | | | 7,223,610 |
| Insurance - 3.0% | | | |
| American Financial Group, Inc. | | 8,900 | 1,056,875 |
| Arthur J. Gallagher & Co. | | 12,157 | 2,669,312 |
| BRP Group, Inc. (a) | | 20,400 | 505,512 |
| Marsh & McLennan Companies, Inc. | | 11,000 | 2,068,880 |
| | | | 6,300,579 |
TOTAL FINANCIALS | | | 24,618,911 |
| HEALTH CARE - 15.1% | | | |
| Biotechnology - 5.7% | | | |
| 2seventy bio, Inc. (a) | | 2,300 | 23,276 |
| Adamas Pharmaceuticals, Inc.: | | | |
| rights (a)(c) | | 47,000 | 11,750 |
| rights (a)(c) | | 47,000 | 5,170 |
| Alnylam Pharmaceuticals, Inc. (a) | | 5,679 | 1,078,669 |
| Arcellx, Inc. (a) | | 1,700 | 53,754 |
| Beam Therapeutics, Inc. (a) | | 2,100 | 67,053 |
| Biogen, Inc. (a) | | 3,900 | 1,110,915 |
| Cytokinetics, Inc. (a) | | 5,500 | 179,410 |
| Evelo Biosciences, Inc. (a) | | 635 | 2,064 |
| Galapagos NV sponsored ADR (a) | | 13,500 | 548,910 |
| Gamida Cell Ltd. (a)(e) | | 75,514 | 145,742 |
| Gamida Cell Ltd. warrants 4/21/28 (a) | | 11,600 | 12,854 |
| Genmab A/S (a) | | 900 | 341,062 |
| Hookipa Pharma, Inc. (a) | | 32,100 | 28,248 |
| Immunocore Holdings PLC ADR (a) | | 4,600 | 275,816 |
| Legend Biotech Corp. ADR (a) | | 5,500 | 379,665 |
| Regeneron Pharmaceuticals, Inc. (a) | | 2,679 | 1,924,969 |
| Repligen Corp. (a) | | 3,500 | 495,110 |
| Seagen, Inc. (a) | | 9,100 | 1,751,386 |
| Seres Therapeutics, Inc. (a) | | 10,900 | 52,211 |
| Synlogic, Inc. (a)(e) | | 33,000 | 14,190 |
| Vertex Pharmaceuticals, Inc. (a) | | 9,225 | 3,246,370 |
| Vor Biopharma, Inc. (a) | | 19,984 | 61,751 |
| XOMA Corp. (a) | | 10,300 | 194,567 |
| | | | 12,004,912 |
| Health Care Equipment & Supplies - 2.5% | | | |
| Baxter International, Inc. | | 30,100 | 1,371,356 |
| Boston Scientific Corp. (a) | | 54,600 | 2,953,314 |
| Insulet Corp. (a) | | 400 | 115,336 |
| Penumbra, Inc. (a) | | 2,800 | 963,368 |
| | | | 5,403,374 |
| Health Care Providers & Services - 2.7% | | | |
| HealthEquity, Inc. (a) | | 30,600 | 1,932,084 |
| Option Care Health, Inc. (a) | | 21,600 | 701,784 |
| UnitedHealth Group, Inc. | | 6,424 | 3,087,631 |
| | | | 5,721,499 |
| Health Care Technology - 0.2% | | | |
| Evolent Health, Inc. (b) | | 10,100 | 290,729 |
| Simulations Plus, Inc. | | 2,500 | 108,325 |
| | | | 399,054 |
| Life Sciences Tools & Services - 3.1% | | | |
| Bio-Techne Corp. | | 6,800 | 555,084 |
| Bruker Corp. | | 14,600 | 1,079,232 |
| Charles River Laboratories International, Inc. (a) | | 3,400 | 714,850 |
| Codexis, Inc. (a) | | 12,700 | 35,560 |
| Danaher Corp. | | 3,900 | 936,000 |
| Sartorius Stedim Biotech | | 2,000 | 499,115 |
| Thermo Fisher Scientific, Inc. | | 5,300 | 2,765,275 |
| | | | 6,585,116 |
| Pharmaceuticals - 0.9% | | | |
| Aclaris Therapeutics, Inc. (a) | | 7,300 | 75,701 |
| AstraZeneca PLC sponsored ADR | | 20,300 | 1,452,871 |
| Revance Therapeutics, Inc. (a) | | 13,700 | 346,747 |
| | | | 1,875,319 |
TOTAL HEALTH CARE | | | 31,989,274 |
| INDUSTRIALS - 15.5% | | | |
| Aerospace & Defense - 1.5% | | | |
| Spirit AeroSystems Holdings, Inc. Class A | | 33,100 | 966,189 |
| The Boeing Co. (a) | | 10,100 | 2,132,716 |
| | | | 3,098,905 |
| Electrical Equipment - 1.5% | | | |
| Bloom Energy Corp. Class A (a)(e) | | 3,900 | 63,765 |
| Eaton Corp. PLC | | 10,700 | 2,151,770 |
| Hubbell, Inc. Class B | | 2,600 | 862,056 |
| | | | 3,077,591 |
| Ground Transportation - 2.7% | | | |
| Uber Technologies, Inc. (a) | | 131,400 | 5,672,538 |
| Industrial Conglomerates - 1.5% | | | |
| General Electric Co. | | 29,700 | 3,262,545 |
| Machinery - 3.9% | | | |
| Energy Recovery, Inc. (a) | | 6,800 | 190,060 |
| Ingersoll Rand, Inc. | | 63,422 | 4,145,262 |
| PACCAR, Inc. | | 8,700 | 727,755 |
| Parker Hannifin Corp. | | 4,700 | 1,833,188 |
| Westinghouse Air Brake Tech Co. | | 12,500 | 1,370,875 |
| | | | 8,267,140 |
| Passenger Airlines - 0.5% | | | |
| Ryanair Holdings PLC sponsored ADR (a) | | 10,500 | 1,161,300 |
| Professional Services - 2.7% | | | |
| Equifax, Inc. | | 5,300 | 1,247,090 |
| KBR, Inc. | | 55,785 | 3,629,372 |
| TransUnion Holding Co., Inc. | | 11,200 | 877,296 |
| | | | 5,753,758 |
| Trading Companies & Distributors - 1.2% | | | |
| Ferguson PLC | | 15,477 | 2,439,284 |
TOTAL INDUSTRIALS | | | 32,733,061 |
| INFORMATION TECHNOLOGY - 31.9% | | | |
| Electronic Equipment, Instruments & Components - 1.5% | | | |
| Flex Ltd. (a) | | 71,212 | 1,968,300 |
| Jabil, Inc. | | 10,700 | 1,154,851 |
| | | | 3,123,151 |
| IT Services - 2.6% | | | |
| Accenture PLC Class A | | 6,900 | 2,129,202 |
| Gartner, Inc. (a) | | 1,800 | 630,558 |
| MongoDB, Inc. Class A (a) | | 4,600 | 1,890,554 |
| Shopify, Inc. Class A (a) | | 13,400 | 865,640 |
| | | | 5,515,954 |
| Semiconductors & Semiconductor Equipment - 11.3% | | | |
| Aixtron AG | | 21,800 | 739,574 |
| Allegro MicroSystems LLC (a) | | 9,809 | 442,778 |
| Analog Devices, Inc. | | 8,800 | 1,714,328 |
| ASML Holding NV (depository receipt) | | 1,505 | 1,090,749 |
| BE Semiconductor Industries NV | | 9,900 | 1,072,726 |
| KLA Corp. | | 1,800 | 873,036 |
| Marvell Technology, Inc. | | 8,900 | 532,042 |
| Monolithic Power Systems, Inc. | | 1,200 | 648,276 |
| NVIDIA Corp. | | 25,587 | 10,823,813 |
| NXP Semiconductors NV | | 6,300 | 1,289,484 |
| SiTime Corp. (a) | | 7,300 | 861,181 |
| Taiwan Semiconductor Manufacturing Co. Ltd. sponsored ADR | | 27,800 | 2,805,576 |
| Universal Display Corp. | | 7,139 | 1,028,944 |
| | | | 23,922,507 |
| Software - 14.1% | | | |
| Confluent, Inc. (a) | | 37,600 | 1,327,656 |
| HashiCorp, Inc. (a) | | 14,900 | 390,082 |
| HubSpot, Inc. (a) | | 1,900 | 1,010,971 |
| Intuit, Inc. | | 1,600 | 733,104 |
| Manhattan Associates, Inc. (a) | | 6,100 | 1,219,268 |
| Microsoft Corp. | | 49,942 | 17,007,248 |
| NICE Ltd. sponsored ADR (a) | | 2,900 | 598,850 |
| Oracle Corp. | | 42,500 | 5,061,325 |
| ServiceNow, Inc. (a) | | 700 | 393,379 |
| Synopsys, Inc. (a) | | 4,300 | 1,872,263 |
| Volue A/S (a) | | 48,500 | 81,604 |
| | | | 29,695,750 |
| Technology Hardware, Storage & Peripherals - 2.4% | | | |
| Apple, Inc. | | 26,260 | 5,093,652 |
TOTAL INFORMATION TECHNOLOGY | | | 67,351,014 |
| MATERIALS - 0.1% | | | |
| Chemicals - 0.1% | | | |
| Aspen Aerogels, Inc. (a) | | 18,500 | 145,965 |
| UTILITIES - 0.4% | | | |
| Independent Power and Renewable Electricity Producers - 0.4% | | | |
| Brookfield Renewable Corp. | | 20,800 | 655,616 |
| Brookfield Renewable Partners LP | | 4,000 | 117,960 |
| | | | 773,576 |
| TOTAL COMMON STOCKS (Cost $151,664,075) | | | 209,201,633 |
| | | | |
| Convertible Preferred Stocks - 0.3% |
| | | Shares | Value ($) |
| HEALTH CARE - 0.0% | | | |
| Biotechnology - 0.0% | | | |
| ElevateBio LLC Series C (a)(b)(c) | | 5,300 | 22,472 |
| INFORMATION TECHNOLOGY - 0.1% | | | |
| Software - 0.1% | | | |
| ASAPP, Inc. Series C (a)(b)(c) | | 17,672 | 54,253 |
| MATERIALS - 0.2% | | | |
| Metals & Mining - 0.2% | | | |
| Illuminated Holdings, Inc.: | | | |
| Series C2 (a)(b)(c) | | 3,438 | 125,865 |
| Series C3 (a)(b)(c) | | 4,298 | 157,350 |
| Series C4 (a)(b)(c) | | 1,252 | 45,836 |
| Series C5 (a)(b)(c) | | 2,617 | 95,808 |
| | | | 424,859 |
| TOTAL CONVERTIBLE PREFERRED STOCKS (Cost $511,834) | | | 501,584 |
| | | | |
| Convertible Bonds - 0.0% |
| | | Principal Amount (f) | Value ($) |
| MATERIALS - 0.0% | | | |
| Metals & Mining - 0.0% | | | |
Illuminated Holdings, Inc. 0% (b)(c)(g) (Cost $49,600) | | 49,600 | 49,600 |
| | | | |
| Money Market Funds - 0.7% |
| | | Shares | Value ($) |
| Fidelity Cash Central Fund 5.14% (h) | | 1,070,399 | 1,070,613 |
| Fidelity Securities Lending Cash Central Fund 5.14% (h)(i) | | 421,345 | 421,387 |
| TOTAL MONEY MARKET FUNDS (Cost $1,492,000) | | | 1,492,000 |
| | | | |
| TOTAL INVESTMENT IN SECURITIES - 100.0% (Cost $153,717,509) | 211,244,817 |
NET OTHER ASSETS (LIABILITIES) - 0.0% | 12,512 |
| NET ASSETS - 100.0% | 211,257,329 |
| | |
Legend
| (b) | Restricted securities (including private placements) - Investment in securities not registered under the Securities Act of 1933 (excluding 144A issues). At the end of the period, the value of restricted securities (excluding 144A issues) amounted to $951,731 or 0.5% of net assets. |
| (d) | Security exempt from registration under Rule 144A of the Securities Act of 1933. These securities may be resold in transactions exempt from registration, normally to qualified institutional buyers. At the end of the period, the value of these securities amounted to $1,104,281 or 0.5% of net assets. |
| (e) | Security or a portion of the security is on loan at period end. |
| (f) | Amount is stated in United States dollars unless otherwise noted. |
| (g) | Security is perpetual in nature with no stated maturity date. |
| (h) | Affiliated fund that is generally available only to investment companies and other accounts managed by Fidelity Investments. The rate quoted is the annualized seven-day yield of the fund at period end. A complete unaudited listing of the fund's holdings as of its most recent quarter end is available upon request. In addition, each Fidelity Central Fund's financial statements are available on the SEC's website or upon request. |
| (i) | Investment made with cash collateral received from securities on loan. |
| Additional information on each restricted holding is as follows: |
| Security | Acquisition Date | Acquisition Cost ($) |
| ASAPP, Inc. Series C | 4/30/21 | 116,584 |
| | | |
| ElevateBio LLC Series C | 3/09/21 | 22,234 |
| | | |
| Epic Games, Inc. | 3/29/21 | 138,060 |
| | | |
| Evolent Health, Inc. | 3/28/23 | 292,900 |
| | | |
| Illuminated Holdings, Inc. Series C2 | 7/07/20 | 85,950 |
| | | |
| Illuminated Holdings, Inc. Series C3 | 7/07/20 | 128,940 |
| | | |
| Illuminated Holdings, Inc. Series C4 | 1/08/21 | 45,072 |
| | | |
| Illuminated Holdings, Inc. Series C5 | 6/16/21 | 113,054 |
| | | |
| Illuminated Holdings, Inc. 0% | 6/14/23 | 49,600 |
| | | |
Affiliated Central Funds
Fiscal year to date information regarding the Fund's investments in Fidelity Central Funds, including the ownership percentage, is presented below.
| Affiliate | Value, beginning of period ($) | Purchases ($) | Sales Proceeds ($) | Dividend Income ($) | Realized Gain (loss) ($) | Change in Unrealized appreciation (depreciation) ($) | Value, end of period ($) | % ownership, end of period |
| Fidelity Cash Central Fund 5.14% | 2,764,138 | 18,478,225 | 20,171,750 | 41,521 | - | - | 1,070,613 | 0.0% |
| Fidelity Securities Lending Cash Central Fund 5.14% | 1,089,387 | 9,161,464 | 9,829,464 | 17,131 | - | - | 421,387 | 0.0% |
| Total | 3,853,525 | 27,639,689 | 30,001,214 | 58,652 | - | - | 1,492,000 | |
| | | | | | | | | |
Amounts in the dividend income column in the above table include any capital gain distributions from underlying funds, which are presented in the corresponding line item in the Statement of Operations, if applicable.
Amounts in the dividend income column for Fidelity Securities Lending Cash Central Fund represents the income earned on investing cash collateral, less rebates paid to borrowers and any lending agent fees associated with the loan, plus any premium payments received for lending certain types of securities.
Amounts included in the purchases and sales proceeds columns may include in-kind transactions, if applicable.
Investment Valuation
The following is a summary of the inputs used, as of June 30, 2023, involving the Fund's assets and liabilities carried at fair value. The inputs or methodology used for valuing securities may not be an indication of the risk associated with investing in those securities. For more information on valuation inputs, and their aggregation into the levels used below, please refer to the Investment Valuation section in the accompanying Notes to Financial Statements.
| Valuation Inputs at Reporting Date: |
| Description | Total ($) | Level 1 ($) | Level 2 ($) | Level 3 ($) |
Investments in Securities: | | | | |
|
| Equities: | | | | |
Communication Services | 16,924,274 | 16,814,456 | - | 109,818 |
Consumer Discretionary | 21,698,190 | 18,949,302 | 2,748,888 | - |
Consumer Staples | 4,838,291 | 4,838,291 | - | - |
Energy | 8,129,077 | 8,129,077 | - | - |
Financials | 24,618,911 | 24,500,199 | 118,712 | - |
Health Care | 32,011,746 | 31,327,709 | 644,645 | 39,392 |
Industrials | 32,733,061 | 32,733,061 | - | - |
Information Technology | 67,405,267 | 67,351,014 | - | 54,253 |
Materials | 570,824 | 145,965 | - | 424,859 |
Utilities | 773,576 | 773,576 | - | - |
|
| Corporate Bonds | 49,600 | - | - | 49,600 |
|
| Money Market Funds | 1,492,000 | 1,492,000 | - | - |
| Total Investments in Securities: | 211,244,817 | 207,054,650 | 3,512,245 | 677,922 |
| Statement of Assets and Liabilities |
| | | | June 30, 2023 (Unaudited) |
| | | | | |
| Assets | | | | |
| Investment in securities, at value (including securities loaned of $407,103) - See accompanying schedule: | | | | |
Unaffiliated issuers (cost $152,225,509) | $ | 209,752,817 | | |
Fidelity Central Funds (cost $1,492,000) | | 1,492,000 | | |
| | | | | |
| | | | | |
| Total Investment in Securities (cost $153,717,509) | | | $ | 211,244,817 |
| Cash | | | | 641 |
| Foreign currency held at value (cost $3,512) | | | | 3,513 |
| Receivable for investments sold | | | | 726,023 |
| Dividends receivable | | | | 62,474 |
| Distributions receivable from Fidelity Central Funds | | | | 10,578 |
Total assets | | | | 212,048,046 |
| Liabilities | | | | |
| Payable for investments purchased | $ | 92,512 | | |
| Payable for fund shares redeemed | | 127,021 | | |
| Accrued management fee | | 90,323 | | |
| Distribution and service plan fees payable | | 3,224 | | |
| Other affiliated payables | | 27,589 | | |
| Other payables and accrued expenses | | 28,848 | | |
| Collateral on securities loaned | | 421,200 | | |
| Total Liabilities | | | | 790,717 |
| Net Assets | | | $ | 211,257,329 |
| Net Assets consist of: | | | | |
| Paid in capital | | | $ | 151,202,135 |
| Total accumulated earnings (loss) | | | | 60,055,194 |
| Net Assets | | | $ | 211,257,329 |
| | | | | |
| Net Asset Value and Maximum Offering Price | | | | |
| Initial Class : | | | | |
Net Asset Value , offering price and redemption price per share ($23,454,817 ÷ 1,528,317 shares) | | | $ | 15.35 |
| Service Class : | | | | |
Net Asset Value , offering price and redemption price per share ($457,963 ÷ 30,393 shares) | | | $ | 15.07 |
| Service Class 2 : | | | | |
Net Asset Value , offering price and redemption price per share ($15,295,485 ÷ 1,046,756 shares) | | | $ | 14.61 |
| Investor Class : | | | | |
Net Asset Value , offering price and redemption price per share ($172,049,064 ÷ 11,252,805 shares) | | | $ | 15.29 |
| Statement of Operations |
| | | | Six months ended June 30, 2023 (Unaudited) |
| Investment Income | | | | |
| Dividends | | | $ | 963,981 |
| Income from Fidelity Central Funds (including $17,131 from security lending) | | | | 58,652 |
| Total Income | | | | 1,022,633 |
| Expenses | | | | |
| Management fee | $ | 504,960 | | |
| Transfer agent fees | | 119,719 | | |
| Distribution and service plan fees | | 18,278 | | |
| Accounting fees | | 34,038 | | |
| Custodian fees and expenses | | 9,999 | | |
| Independent trustees' fees and expenses | | 632 | | |
| Audit | | 23,961 | | |
| Legal | | 4,211 | | |
| Miscellaneous | | 407 | | |
| Total expenses before reductions | | 716,205 | | |
| Expense reductions | | (4,303) | | |
| Total expenses after reductions | | | | 711,902 |
| Net Investment income (loss) | | | | 310,731 |
| Realized and Unrealized Gain (Loss) | | | | |
| Net realized gain (loss) on: | | | | |
| Investment Securities: | | | | |
| Unaffiliated issuers | | 2,367,856 | | |
| Foreign currency transactions | | 4,083 | | |
| Total net realized gain (loss) | | | | 2,371,939 |
| Change in net unrealized appreciation (depreciation) on: | | | | |
| Investment Securities: | | | | |
| Unaffiliated issuers | | 28,972,369 | | |
| Assets and liabilities in foreign currencies | | 94 | | |
| Total change in net unrealized appreciation (depreciation) | | | | 28,972,463 |
| Net gain (loss) | | | | 31,344,402 |
| Net increase (decrease) in net assets resulting from operations | | | $ | 31,655,133 |
| Statement of Changes in Net Assets |
| |
| | Six months ended June 30, 2023 (Unaudited) | | Year ended December 31, 2022 |
| Increase (Decrease) in Net Assets | | | | |
| Operations | | | | |
| Net investment income (loss) | $ | 310,731 | $ | 741,820 |
| Net realized gain (loss) | | 2,371,939 | | 9,662,143 |
| Change in net unrealized appreciation (depreciation) | | 28,972,463 | | (61,290,193) |
| Net increase (decrease) in net assets resulting from operations | | 31,655,133 | | (50,886,230) |
| Distributions to shareholders | | (9,955,611) | | (26,356,824) |
| | | | | |
| Share transactions - net increase (decrease) | | 9,866,634 | | 3,303,432 |
| Total increase (decrease) in net assets | | 31,566,156 | | (73,939,622) |
| | | | | |
| Net Assets | | | | |
| Beginning of period | | 179,691,173 | | 253,630,795 |
| End of period | $ | 211,257,329 | $ | 179,691,173 |
| | | | | |
| | | | | |
| VIP Dynamic Capital Appreciation Portfolio Initial Class |
| |
| | Six months ended (Unaudited) June 30, 2023 | | Years ended December 31, 2022 | | 2021 | | 2020 | | 2019 | | 2018 |
Selected Per-Share Data | | | | | | | | | | | | |
| Net asset value, beginning of period | $ | 13.72 | $ | 19.62 | $ | 17.36 | $ | 13.20 | $ | 12.24 | $ | 14.43 |
| Income from Investment Operations | | | | | | | | | | | | |
Net investment income (loss) A,B | | .03 | | .07 | | .09 C | | .03 | | .07 | | .08 |
| Net realized and unrealized gain (loss) | | 2.36 | | (3.87) | | 3.96 | | 4.35 | | 3.21 | | (.73) D |
| Total from investment operations | | 2.39 | | (3.80) | | 4.05 | | 4.38 | | 3.28 | | (.65) |
| Distributions from net investment income | | (.02) | | (.05) | | (.11) E | | (.03) | | (.08) | | (.08) |
| Distributions from net realized gain | | (.73) | | (2.05) | | (1.67) E | | (.19) | | (2.24) | | (1.46) |
| Total distributions | | (.76) F | | (2.10) | | (1.79) F | | (.22) | | (2.32) | | (1.54) |
| Net asset value, end of period | $ | 15.35 | $ | 13.72 | $ | 19.62 | $ | 17.36 | $ | 13.20 | $ | 12.24 |
Total Return G,H,I | | 17.90% | | (20.87)% | | 24.63% | | 33.61% | | 30.08% | | (4.89)% D |
Ratios to Average Net Assets B,J,K | | | | | | | | | | | | |
| Expenses before reductions | | .66% L | | .67% | | .66% | | .68% | | .68% | | .69% |
| Expenses net of fee waivers, if any | | .66% L | | .66% | | .66% | | .68% | | .68% | | .69% |
| Expenses net of all reductions | | .66% L | | .66% | | .66% | | .68% | | .68% | | .68% |
| Net investment income (loss) | | .40% L | | .45% | | .51% C | | .19% | | .57% | | .54% |
| Supplemental Data | | | | | | | | | | | | |
| Net assets, end of period (000 omitted) | $ | 23,455 | $ | 20,784 | $ | 30,029 | $ | 26,104 | $ | 22,638 | $ | 20,701 |
Portfolio turnover rate M | | 59% L | | 55% | | 61% | | 62% | | 66% | | 155% |
A Calculated based on average shares outstanding during the period.
B Net investment income (loss) is affected by the timing of the declaration of dividends by any underlying mutual funds or exchange-traded funds (ETFs). Net investment income (loss) of any mutual funds or ETFs is not included in the Fund's net investment income (loss) ratio.
C Net investment income per share reflects one or more large, non-recurring dividend(s) which amounted to $.06 per share. Excluding such non-recurring dividend(s), the ratio of net investment income (loss) to average net assets would have been .18%.
D Amount includes a reimbursement from the investment adviser for an operational error which amounted to less than $.33 per share. Excluding this reimbursement, the total return would have been (7.25)%.
E The amount shown reflects reclassifications related to book to tax differences that were made in the year shown.
F Total distributions per share do not sum due to rounding.
G Total returns for periods of less than one year are not annualized.
H Total returns do not reflect charges attributable to your insurance company's separate account. Inclusion of these charges would reduce the total returns shown.
I Total returns would have been lower if certain expenses had not been reduced during the applicable periods shown.
J Fees and expenses of any underlying mutual funds or exchange-traded funds (ETFs) are not included in the Fund's expense ratio. The Fund indirectly bears its proportionate share of these expenses. For additional expense information related to investments in Fidelity Central Funds, please refer to the "Investments in Fidelity Central Funds" note found in the Notes to Financial Statements section of the most recent Annual or Semi-Annual report.
K Expense ratios reflect operating expenses of the class. Expenses before reductions do not reflect amounts reimbursed, waived, or reduced through arrangements with the investment adviser, brokerage services, or other offset arrangements, if applicable, and do not represent the amount paid by the class during periods when reimbursements, waivers or reductions occur.
L Annualized.
M Amount does not include the portfolio activity of any underlying mutual funds or exchange-traded funds (ETFs).
| VIP Dynamic Capital Appreciation Portfolio Service Class |
| |
| | Six months ended (Unaudited) June 30, 2023 | | Years ended December 31, 2022 | | 2021 | | 2020 | | 2019 | | 2018 |
Selected Per-Share Data | | | | | | | | | | | | |
| Net asset value, beginning of period | $ | 13.49 | $ | 19.33 | $ | 17.13 | $ | 13.03 | $ | 12.11 | $ | 14.28 |
| Income from Investment Operations | | | | | | | | | | | | |
Net investment income (loss) A,B | | .02 | | .05 | | .08 C | | .01 | | .06 | | .06 |
| Net realized and unrealized gain (loss) | | 2.32 | | (3.80) | | 3.89 | | 4.30 | | 3.17 | | (.71) D |
| Total from investment operations | | 2.34 | | (3.75) | | 3.97 | | 4.31 | | 3.23 | | (.65) |
| Distributions from net investment income | | (.02) | | (.03) | | (.09) E | | (.02) | | (.07) | | (.06) |
| Distributions from net realized gain | | (.73) | | (2.05) | | (1.67) E | | (.19) | | (2.24) | | (1.46) |
| Total distributions | | (.76) F | | (2.09) F | | (1.77) F | | (.21) | | (2.31) | | (1.52) |
| Net asset value, end of period | $ | 15.07 | $ | 13.49 | $ | 19.33 | $ | 17.13 | $ | 13.03 | $ | 12.11 |
Total Return G,H,I | | 17.82% | | (20.94)% | | 24.47% | | 33.48% | | 29.96% | | (4.97)% D |
Ratios to Average Net Assets B,J,K | | | | | | | | | | | | |
| Expenses before reductions | | .76% L | | .77% | | .76% | | .78% | | .78% | | .79% |
| Expenses net of fee waivers, if any | | .76% L | | .76% | | .76% | | .78% | | .78% | | .79% |
| Expenses net of all reductions | | .76% L | | .76% | | .76% | | .78% | | .78% | | .78% |
| Net investment income (loss) | | .30% L | | .35% | | .42% C | | .09% | | .47% | | .44% |
| Supplemental Data | | | | | | | | | | | | |
| Net assets, end of period (000 omitted) | $ | 458 | $ | 358 | $ | 445 | $ | 327 | $ | 287 | $ | 265 |
Portfolio turnover rate M | | 59% L | | 55% | | 61% | | 62% | | 66% | | 155% |
A Calculated based on average shares outstanding during the period.
B Net investment income (loss) is affected by the timing of the declaration of dividends by any underlying mutual funds or exchange-traded funds (ETFs). Net investment income (loss) of any mutual funds or ETFs is not included in the Fund's net investment income (loss) ratio.
C Net investment income per share reflects one or more large, non-recurring dividend(s) which amounted to $.06 per share. Excluding such non-recurring dividend(s), the ratio of net investment income (loss) to average net assets would have been .08%.
D Amount includes a reimbursement from the investment adviser for an operational error which amounted to less than $.33 per share. Excluding this reimbursement, the total return would have been (7.33)%.
E The amount shown reflects reclassifications related to book to tax differences that were made in the year shown.
F Total distributions per share do not sum due to rounding.
G Total returns for periods of less than one year are not annualized.
H Total returns do not reflect charges attributable to your insurance company's separate account. Inclusion of these charges would reduce the total returns shown.
I Total returns would have been lower if certain expenses had not been reduced during the applicable periods shown.
J Fees and expenses of any underlying mutual funds or exchange-traded funds (ETFs) are not included in the Fund's expense ratio. The Fund indirectly bears its proportionate share of these expenses. For additional expense information related to investments in Fidelity Central Funds, please refer to the "Investments in Fidelity Central Funds" note found in the Notes to Financial Statements section of the most recent Annual or Semi-Annual report.
K Expense ratios reflect operating expenses of the class. Expenses before reductions do not reflect amounts reimbursed, waived, or reduced through arrangements with the investment adviser, brokerage services, or other offset arrangements, if applicable, and do not represent the amount paid by the class during periods when reimbursements, waivers or reductions occur.
L Annualized.
M Amount does not include the portfolio activity of any underlying mutual funds or exchange-traded funds (ETFs).
| VIP Dynamic Capital Appreciation Portfolio Service Class 2 |
| |
| | Six months ended (Unaudited) June 30, 2023 | | Years ended December 31, 2022 | | 2021 | | 2020 | | 2019 | | 2018 |
Selected Per-Share Data | | | | | | | | | | | | |
| Net asset value, beginning of period | $ | 13.11 | $ | 18.85 | $ | 16.74 | $ | 12.74 | $ | 11.88 | $ | 14.05 |
| Income from Investment Operations | | | | | | | | | | | | |
Net investment income (loss) A,B | | .01 | | .03 | | .05 C | | (.01) | | .04 | | .04 |
| Net realized and unrealized gain (loss) | | 2.24 | | (3.70) | | 3.79 | | 4.21 | | 3.11 | | (.71) D |
| Total from investment operations | | 2.25 | | (3.67) | | 3.84 | | 4.20 | | 3.15 | | (.67) |
| Distributions from net investment income | | (.02) | | (.02) | | (.05) E | | (.01) | | (.05) | | (.05) |
| Distributions from net realized gain | | (.73) | | (2.05) | | (1.67) E | | (.19) | | (2.24) | | (1.46) |
| Total distributions | | (.75) | | (2.07) | | (1.73) F | | (.20) | | (2.29) | | (1.50) F |
| Net asset value, end of period | $ | 14.61 | $ | 13.11 | $ | 18.85 | $ | 16.74 | $ | 12.74 | $ | 11.88 |
Total Return G,H,I | | 17.69% | | (21.05)% | | 24.27% | | 33.34% | | 29.82% | | (5.17)% D |
Ratios to Average Net Assets B,J,K | | | | | | | | | | | | |
| Expenses before reductions | | .91% L | | .92% | | .91% | | .93% | | .93% | | .94% |
| Expenses net of fee waivers, if any | | .91% L | | .91% | | .91% | | .93% | | .93% | | .94% |
| Expenses net of all reductions | | .91% L | | .91% | | .91% | | .93% | | .93% | | .93% |
| Net investment income (loss) | | .15% L | | .20% | | .26% C | | (.06)% | | .32% | | .29% |
| Supplemental Data | | | | | | | | | | | | |
| Net assets, end of period (000 omitted) | $ | 15,295 | $ | 13,739 | $ | 19,579 | $ | 18,900 | $ | 15,870 | $ | 14,533 |
Portfolio turnover rate M | | 59% L | | 55% | | 61% | | 62% | | 66% | | 155% |
A Calculated based on average shares outstanding during the period.
B Net investment income (loss) is affected by the timing of the declaration of dividends by any underlying mutual funds or exchange-traded funds (ETFs). Net investment income (loss) of any mutual funds or ETFs is not included in the Fund's net investment income (loss) ratio.
C Net investment income per share reflects one or more large, non-recurring dividend(s) which amounted to $.06 per share. Excluding such non-recurring dividend(s), the ratio of net investment income (loss) to average net assets would have been (.07)%.
D Amount includes a reimbursement from the investment adviser for an operational error which amounted to less than $.32 per share. Excluding this reimbursement, the total return would have been (7.53)%.
E The amount shown reflects reclassifications related to book to tax differences that were made in the year shown.
F Total distributions per share do not sum due to rounding.
G Total returns for periods of less than one year are not annualized.
H Total returns do not reflect charges attributable to your insurance company's separate account. Inclusion of these charges would reduce the total returns shown.
I Total returns would have been lower if certain expenses had not been reduced during the applicable periods shown.
J Fees and expenses of any underlying mutual funds or exchange-traded funds (ETFs) are not included in the Fund's expense ratio. The Fund indirectly bears its proportionate share of these expenses. For additional expense information related to investments in Fidelity Central Funds, please refer to the "Investments in Fidelity Central Funds" note found in the Notes to Financial Statements section of the most recent Annual or Semi-Annual report.
K Expense ratios reflect operating expenses of the class. Expenses before reductions do not reflect amounts reimbursed, waived, or reduced through arrangements with the investment adviser, brokerage services, or other offset arrangements, if applicable, and do not represent the amount paid by the class during periods when reimbursements, waivers or reductions occur.
L Annualized.
M Amount does not include the portfolio activity of any underlying mutual funds or exchange-traded funds (ETFs).
| VIP Dynamic Capital Appreciation Portfolio Investor Class |
| |
| | Six months ended (Unaudited) June 30, 2023 | | Years ended December 31, 2022 | | 2021 | | 2020 | | 2019 | | 2018 |
Selected Per-Share Data | | | | | | | | | | | | |
| Net asset value, beginning of period | $ | 13.68 | $ | 19.56 | $ | 17.32 | $ | 13.17 | $ | 12.21 | $ | 14.40 |
| Income from Investment Operations | | | | | | | | | | | | |
Net investment income (loss) A,B | | .02 | | .06 | | .08 C | | .02 | | .06 | | .06 |
| Net realized and unrealized gain (loss) | | 2.35 | | (3.85) | | 3.93 | | 4.34 | | 3.21 | | (.72) D |
| Total from investment operations | | 2.37 | | (3.79) | | 4.01 | | 4.36 | | 3.27 | | (.66) |
| Distributions from net investment income | | (.02) | | (.04) | | (.09) E | | (.02) | | (.07) | | (.07) |
| Distributions from net realized gain | | (.73) | | (2.05) | | (1.67) E | | (.19) | | (2.24) | | (1.46) |
| Total distributions | | (.76) F | | (2.09) | | (1.77) F | | (.21) | | (2.31) | | (1.53) |
| Net asset value, end of period | $ | 15.29 | $ | 13.68 | $ | 19.56 | $ | 17.32 | $ | 13.17 | $ | 12.21 |
Total Return G,H,I | | 17.79% | | (20.88)% | | 24.46% | | 33.54% | | 30.07% | | (5.00)% D |
Ratios to Average Net Assets B,J,K | | | | | | | | | | | | |
| Expenses before reductions | | .74% L | | .74% | | .73% | | .76% | | .76% | | .77% |
| Expenses net of fee waivers, if any | | .74% L | | .74% | | .73% | | .76% | | .76% | | .77% |
| Expenses net of all reductions | | .74% L | | .74% | | .73% | | .75% | | .76% | | .76% |
| Net investment income (loss) | | .33% L | | .38% | | .44% C | | .12% | | .50% | | .46% |
| Supplemental Data | | | | | | | | | | | | |
| Net assets, end of period (000 omitted) | $ | 172,049 | $ | 144,809 | $ | 203,577 | $ | 160,175 | $ | 124,723 | $ | 108,561 |
Portfolio turnover rate M | | 59% L | | 55% | | 61% | | 62% | | 66% | | 155% |
A Calculated based on average shares outstanding during the period.
B Net investment income (loss) is affected by the timing of the declaration of dividends by any underlying mutual funds or exchange-traded funds (ETFs). Net investment income (loss) of any mutual funds or ETFs is not included in the Fund's net investment income (loss) ratio.
C Net investment income per share reflects one or more large, non-recurring dividend(s) which amounted to $.06 per share. Excluding such non-recurring dividend(s), the ratio of net investment income (loss) to average net assets would have been .10%.
D Amount includes a reimbursement from the investment adviser for an operational error which amounted to less than $.33 per share. Excluding this reimbursement, the total return would have been (7.36)%.
E The amount shown reflects reclassifications related to book to tax differences that were made in the year shown.
F Total distributions per share do not sum due to rounding.
G Total returns for periods of less than one year are not annualized.
H Total returns do not reflect charges attributable to your insurance company's separate account. Inclusion of these charges would reduce the total returns shown.
I Total returns would have been lower if certain expenses had not been reduced during the applicable periods shown.
J Fees and expenses of any underlying mutual funds or exchange-traded funds (ETFs) are not included in the Fund's expense ratio. The Fund indirectly bears its proportionate share of these expenses. For additional expense information related to investments in Fidelity Central Funds, please refer to the "Investments in Fidelity Central Funds" note found in the Notes to Financial Statements section of the most recent Annual or Semi-Annual report.
K Expense ratios reflect operating expenses of the class. Expenses before reductions do not reflect amounts reimbursed, waived, or reduced through arrangements with the investment adviser, brokerage services, or other offset arrangements, if applicable, and do not represent the amount paid by the class during periods when reimbursements, waivers or reductions occur.
L Annualized.
M Amount does not include the portfolio activity of any underlying mutual funds or exchange-traded funds (ETFs).
For the period ended June 30, 2023
1. Organization.
VIP Dynamic Capital Appreciation Portfolio (the Fund) is a fund of Variable Insurance Products Fund III (the Trust) and is authorized to issue an unlimited number of shares. The Trust is registered under the Investment Company Act of 1940, as amended (the 1940 Act), as an open-end management investment company organized as a Massachusetts business trust. Shares of the Fund may only be purchased by insurance companies for the purpose of funding variable annuity or variable life insurance contracts. The Fund offers the following classes of shares: Initial Class shares, Service Class shares, Service Class 2 shares and Investor Class shares. All classes have equal rights and voting privileges, except for matters affecting a single class.
2. Investments in Fidelity Central Funds.
Funds may invest in Fidelity Central Funds, which are open-end investment companies generally available only to other investment companies and accounts managed by the investment adviser and its affiliates. The Schedule of Investments lists any Fidelity Central Funds held as an investment as of period end, but does not include the underlying holdings of each Fidelity Central Fund. An investing fund indirectly bears its proportionate share of the expenses of the underlying Fidelity Central Funds.
Based on its investment objective, each Fidelity Central Fund may invest or participate in various investment vehicles or strategies that are similar to those of the investing fund. These strategies are consistent with the investment objectives of the investing fund and may involve certain economic risks which may cause a decline in value of each of the Fidelity Central Funds and thus a decline in the value of the investing fund.
| Fidelity Central Fund | Investment Manager | Investment Objective | Investment Practices | Expense Ratio A |
| Fidelity Money Market Central Funds | Fidelity Management & Research Company LLC (FMR) | Each fund seeks to obtain a high level of current income consistent with the preservation of capital and liquidity. | Short-term Investments | Less than .005% |
A Expenses expressed as a percentage of average net assets and are as of each underlying Central Fund's most recent annual or semi-annual shareholder report.
A complete unaudited list of holdings for each Fidelity Central Fund is available upon request or at the Securities and Exchange Commission website at www.sec.gov. In addition, the financial statements of the Fidelity Central Funds which contain the significant accounting policies (including investment valuation policies) of those funds, and are not covered by the Report of Independent Registered Public Accounting Firm, are available on the Securities and Exchange Commission website or upon request.
3. Significant Accounting Policies.
The Fund is an investment company and applies the accounting and reporting guidance of the Financial Accounting Standards Board (FASB) Accounting Standards Codification Topic 946 Financial Services - Investment Companies . The financial statements have been prepared in conformity with accounting principles generally accepted in the United States of America (GAAP), which require management to make certain estimates and assumptions at the date of the financial statements. Actual results could differ from those estimates. Subsequent events, if any, through the date that the financial statements were issued have been evaluated in the preparation of the financial statements. The Fund's Schedule of Investments lists any underlying mutual funds or exchange-traded funds (ETFs) but does not include the underlying holdings of these funds. The following summarizes the significant accounting policies of the Fund:
Investment Valuation. Investments are valued as of 4:00 p.m. Eastern time on the last calendar day of the period. The Board of Trustees (the Board) has designated the Fund's investment adviser as the valuation designee responsible for the fair valuation function and performing fair value determinations as needed. The investment adviser has established a Fair Value Committee (the Committee) to carry out the day-to-day fair valuation responsibilities and has adopted policies and procedures to govern the fair valuation process and the activities of the Committee. In accordance with these fair valuation policies and procedures, which have been approved by the Board, the Fund attempts to obtain prices from one or more third party pricing services or brokers to value its investments. When current market prices, quotations or currency exchange rates are not readily available or reliable, investments will be fair valued in good faith by the Committee, in accordance with the policies and procedures. Factors used in determining fair value vary by investment type and may include market or investment specific events, transaction data, estimated cash flows, and market observations of comparable investments. The frequency that the fair valuation procedures are used cannot be predicted and they may be utilized to a significant extent. The Committee manages the Fund's fair valuation practices and maintains the fair valuation policies and procedures. The Fund's investment adviser reports to the Board information regarding the fair valuation process and related material matters.
The Fund categorizes the inputs to valuation techniques used to value its investments into a disclosure hierarchy consisting of three levels as shown below:
Level 1 - unadjusted quoted prices in active markets for identical investments
Level 2 - other significant observable inputs (including quoted prices for similar investments, interest rates, prepayment speeds, etc.)
Level 3 - unobservable inputs (including the Fund's own assumptions based on the best information available)
Valuation techniques used to value the Fund's investments by major category are as follows:
Equity securities, including restricted securities, for which market quotations are readily available, are valued at the last reported sale price or official closing price as reported by a third party pricing service on the primary market or exchange on which they are traded and are categorized as Level 1 in the hierarchy. In the event there were no sales during the day or closing prices are not available, securities are valued at the last quoted bid price or may be valued using the last available price and are generally categorized as Level 2 in the hierarchy. For foreign equity securities, when market or security specific events arise, comparisons to the valuation of American Depositary Receipts (ADRs), futures contracts, ETFs and certain indexes as well as quoted prices for similar securities may be used and would be categorized as Level 2 in the hierarchy. For equity securities, including restricted securities, where observable inputs are limited, assumptions about market activity and risk are used and these securities may be categorized as Level 3 in the hierarchy.
Debt securities, including restricted securities, are valued based on evaluated prices received from third party pricing services or from brokers who make markets in such securities. Corporate bonds are valued by pricing services who utilize matrix pricing which considers yield or price of bonds of comparable quality, coupon, maturity and type or by broker-supplied prices. When independent prices are unavailable or unreliable, debt securities may be valued utilizing pricing methodologies which consider similar factors that would be used by third party pricing services. Debt securities are generally categorized as Level 2 in the hierarchy but may be Level 3 depending on the circumstances.
Investments in open-end mutual funds, including the Fidelity Central Funds, are valued at their closing net asset value (NAV) each business day and are categorized as Level 1 in the hierarchy.
Changes in valuation techniques may result in transfers in or out of an assigned level within the disclosure hierarchy. The aggregate value of investments by input level as of June 30, 2023 is included at the end of the Fund's Schedule of Investments.
Foreign Currency. Certain Funds may use foreign currency contracts to facilitate transactions in foreign-denominated securities. Gains and losses from these transactions may arise from changes in the value of the foreign currency or if the counterparties do not perform under the contracts' terms.
Foreign-denominated assets, including investment securities, and liabilities are translated into U.S. dollars at the exchange rates at period end. Purchases and sales of investment securities, income and dividends received, and expenses denominated in foreign currencies are translated into U.S. dollars at the exchange rate in effect on the transaction date.
The effects of exchange rate fluctuations on investments are included with the net realized and unrealized gain (loss) on investment securities. Other foreign currency transactions resulting in realized and unrealized gain (loss) are disclosed separately.
Investment Transactions and Income. For financial reporting purposes, the Fund's investment holdings and NAV include trades executed through the end of the last business day of the period. The NAV per share for processing shareholder transactions is calculated as of the close of business of the New York Stock Exchange (NYSE), normally 4:00 p.m. Eastern time and includes trades executed through the end of the prior business day. Gains and losses on securities sold are determined on the basis of identified cost and include proceeds received from litigation. Commissions paid to certain brokers with whom the investment adviser, or its affiliates, places trades on behalf of a fund include an amount in addition to trade execution, which may be rebated back to a fund. Any such rebates are included in net realized gain (loss) on investments in the Statement of Operations. Dividend income is recorded on the ex-dividend date, except for certain dividends from foreign securities where the ex-dividend date may have passed, which are recorded as soon as the Fund is informed of the ex-dividend date. Non-cash dividends included in dividend income, if any, are recorded at the fair market value of the securities received. Income and capital gain distributions from Fidelity Central Funds, if any, are recorded on the ex-dividend date. Investment income is recorded net of foreign taxes withheld where recovery of such taxes is uncertain. Funds may file withholding tax reclaims in certain jurisdictions to recover a portion of amounts previously withheld. Any withholding tax reclaims income is included in the Statement of Operations in dividends. Any receivables for withholding tax reclaims are included in the Statement of Assets and Liabilities in dividends receivable.
Class Allocations and Expenses. Investment income, realized and unrealized capital gains and losses, common expenses of a fund, and certain fund-level expense reductions, if any, are allocated daily on a pro-rata basis to each class based on the relative net assets of each class to the total net assets of a fund. Each class differs with respect to transfer agent and distribution and service plan fees incurred, as applicable. Certain expense reductions may also differ by class, if applicable. For the reporting period, the allocated portion of income and expenses to each class as a percent of its average net assets may vary due to the timing of recording these transactions in relation to fluctuating net assets of the classes. Expenses directly attributable to a fund are charged to that fund. Expenses attributable to more than one fund are allocated among the respective funds on the basis of relative net assets or other appropriate methods. Expenses included in the accompanying financial statements reflect the expenses of that fund and do not include any expenses associated with any underlying mutual funds or ETFs. Although not included in a fund's expenses, a fund indirectly bears its proportionate share of these expenses through the net asset value of each underlying mutual fund or ETF. Expense estimates are accrued in the period to which they relate and adjustments are made when actual amounts are known.
Income Tax Information and Distributions to Shareholders. Each year, the Fund intends to qualify as a regulated investment company under Subchapter M of the Internal Revenue Code, including distributing substantially all of its taxable income and realized gains. As a result, no provision for U.S. Federal income taxes is required. The Fund files a U.S. federal tax return, in addition to state and local tax returns as required. The Fund's federal income tax returns are subject to examination by the Internal Revenue Service (IRS) for a period of three fiscal years after they are filed. State and local tax returns may be subject to examination for an additional fiscal year depending on the jurisdiction. Foreign taxes are provided for based on the Fund's understanding of the tax rules and rates that exist in the foreign markets in which it invests.
Distributions are declared and recorded on the ex-dividend date. Income and capital gain distributions are declared separately for each class. Income and capital gain distributions are determined in accordance with income tax regulations, which may differ from GAAP.
Capital accounts within the financial statements are adjusted for permanent book-tax differences. These adjustments have no impact on net assets or the results of operations. Capital accounts are not adjusted for temporary book-tax differences which will reverse in a subsequent period.
Book-tax differences are primarily due to foreign currency transactions, passive foreign investment companies (PFIC), partnerships and losses deferred due to wash sales and excise tax regulations.
As of period end, the cost and unrealized appreciation (depreciation) in securities, and derivatives if applicable, for federal income tax purposes were as follows:
| Gross unrealized appreciation | $63,492,245 |
| Gross unrealized depreciation | (6,064,110) |
| Net unrealized appreciation (depreciation) | $57,428,135 |
| Tax cost | $153,816,682 |
Restricted Securities (including Private Placements). Funds may invest in securities that are subject to legal or contractual restrictions on resale. These securities generally may be resold in transactions exempt from registration or to the public if the securities are registered. Disposal of these securities may involve time-consuming negotiations and expense, and prompt sale at an acceptable price may be difficult. Information regarding restricted securities held at period end is included at the end of the Schedule of Investments, if applicable.
4. Purchases and Sales of Investments.
Purchases and sales of securities, other than short-term securities and in-kind transactions, as applicable, are noted in the table below.
| | Purchases ($) | Sales ($) |
| VIP Dynamic Capital Appreciation Portfolio | 57,578,666 | 56,064,505 |
5. Fees and Other Transactions with Affiliates.
Management Fee. Fidelity Management & Research Company LLC (the investment adviser) and its affiliates provide the Fund with investment management related services for which the Fund pays a monthly management fee. The management fee is the sum of an individual fund fee rate that is based on an annual rate of .30% of the Fund's average net assets and an annualized group fee rate that averaged .23% during the period. The group fee rate is based upon the monthly average net assets of a group of registered investment companies with which the investment adviser has management contracts. The group fee rate decreases as assets under management increase and increases as assets under management decrease. For the reporting period, the total annualized management fee rate was .52% of the Fund's average net assets.
Distribution and Service Plan Fees. In accordance with Rule 12b-1 of the 1940 Act, the Fund has adopted separate 12b-1 Plans for each Service Class of shares. Each Service Class pays Fidelity Distributors Company LLC (FDC), an affiliate of the investment adviser, a service fee. For the period, the service fee is based on an annual rate of .10% of Service Class' average net assets and .25% of Service Class 2's average net assets.
For the period, total fees, all of which were re-allowed to insurance companies for the distribution of shares and providing shareholder support services, were as follows:
| Service Class | $206 |
| Service Class 2 | 18,072 |
| | $18,278 |
Transfer Agent Fees. Fidelity Investments Institutional Operations Company LLC (FIIOC), an affiliate of the investment adviser, is the Fund's transfer, dividend disbursing, and shareholder servicing agent. FIIOC receives an asset-based fee with respect to each class. Each class pays a fee for transfer agent services, typesetting and printing and mailing of shareholder reports, excluding mailing of proxy statements. For the period, transfer agent fees for each class were as follows:
| | Amount | % of Class-Level Average Net Assets A |
| Initial Class | $6,866 | .06 |
| Service Class | 130 | .06 |
| Service Class 2 | 4,554 | .06 |
| Investor Class | 108,169 | .14 |
| | $119,719 | |
A Annualized
Accounting Fees. Fidelity Service Company, Inc. (FSC), an affiliate of the investment adviser, maintains the Fund's accounting records. The accounting fee is based on the level of average net assets for each month. For the period, the fees were equivalent to the following annualized rates:
| | % of Average Net Assets |
| VIP Dynamic Capital Appreciation Portfolio | .04 |
Brokerage Commissions. A portion of portfolio transactions were placed with brokerage firms which are affiliates of the investment adviser. Brokerage commissions are included in net realized gain (loss) and change in net unrealized appreciation (depreciation) in the Statement of Operations. The commissions paid to these affiliated firms were as follows:
| | Amount |
| VIP Dynamic Capital Appreciation Portfolio | $836 |
Interfund Trades. Funds may purchase from or sell securities to other Fidelity Funds under procedures adopted by the Board. The procedures have been designed to ensure these interfund trades are executed in accordance with Rule 17a-7 of the 1940 Act. Any interfund trades are included within the respective purchases and sales amounts shown in the Purchases and Sales of Investments note. Interfund trades during the period are noted in the table below.
| | Purchases ($) | Sales ($) | Realized Gain (Loss) ($) |
| VIP Dynamic Capital Appreciation Portfolio | 1,851,300 | 4,462,695 | 813,931 |
6. Committed Line of Credit.
Certain Funds participate with other funds managed by the investment adviser or an affiliate in a $4.25 billion credit facility (the "line of credit") to be utilized for temporary or emergency purposes to fund shareholder redemptions or for other short-term liquidity purposes. The participating funds have agreed to pay commitment fees on their pro-rata portion of the line of credit, which are reflected in Miscellaneous expenses on the Statement of Operations, and are listed below. During the period, there were no borrowings on this line of credit.
| | Amount |
| VIP Dynamic Capital Appreciation Portfolio | $183 |
7. Security Lending.
Funds lend portfolio securities from time to time in order to earn additional income. Lending agents are used, including National Financial Services (NFS), an affiliate of the investment adviser. Pursuant to a securities lending agreement, NFS will receive a fee, which is capped at 9.9% of a fund's daily lending revenue, for its services as lending agent. A fund may lend securities to certain qualified borrowers, including NFS. On the settlement date of the loan, a fund receives collateral (in the form of U.S. Treasury obligations, letters of credit and/or cash) against the loaned securities and maintains collateral in an amount not less than 100% of the market value of the loaned securities during the period of the loan. The market value of the loaned securities is determined at the close of business of a fund and any additional required collateral is delivered to a fund on the next business day. A fund or borrower may terminate the loan at any time, and if the borrower defaults on its obligation to return the securities loaned because of insolvency or other reasons, a fund may apply collateral received from the borrower against the obligation. A fund may experience delays and costs in recovering the securities loaned. Any cash collateral received is invested in the Fidelity Securities Lending Cash Central Fund. Any loaned securities are identified as such in the Schedule of Investments, and the value of loaned securities and cash collateral at period end, as applicable, are presented in the Statement of Assets and Liabilities. Security lending income represents the income earned on investing cash collateral, less rebates paid to borrowers and any lending agent fees associated with the loan, plus any premium payments received for lending certain types of securities. Security lending income is presented in the Statement of Operations as a component of income from Fidelity Central Funds. Affiliated security lending activity, if any, was as follows:
| | Total Security Lending Fees Paid to NFS | Security Lending Income From Securities Loaned to NFS | Value of Securities Loaned to NFS at Period End |
| VIP Dynamic Capital Appreciation Portfolio | $1,837 | $1,888 | $- |
8. Expense Reductions.
During the period the investment adviser or an affiliate reimbursed and/or waived a portion of fund-level operating expenses in the amount of $4,303.
9. Distributions to Shareholders.
Distributions to shareholders of each class were as follows:
| | Six months ended June 30, 2023 | Year ended December 31, 2022 |
| VIP Dynamic Capital Appreciation Portfolio | | |
| Distributions to shareholders | | |
| Initial Class | $ 1,136,628 | $3,143,134 |
| Service Class | 21,789 | 48,086 |
| Service Class 2 | 780,644 | 2,058,569 |
| Investor Class | 8,016,550 | 21,107,035 |
Total | $9,955,611 | $26,356,824 |
10. Share Transactions.
Transactions for each class of shares were as follows and may contain in-kind transactions:
| | Shares | Shares | Dollars | Dollars |
| | Six months ended June 30, 2023 | Year ended December 31, 2022 | Six months ended June 30, 2023 | Year ended December 31, 2022 |
| VIP Dynamic Capital Appreciation Portfolio | | | | |
| Initial Class | | | | |
| Shares sold | 74,107 | 71,549 | $1,057,031 | $1,052,691 |
| Reinvestment of distributions | 80,841 | 196,532 | 1,136,628 | 3,143,134 |
| Shares redeemed | (140,986) | (284,462) | (1,951,323) | (4,322,145) |
| Net increase (decrease) | 13,962 | (16,381) | $242,336 | $(126,320) |
| Service Class | | | | |
| Shares sold | 2,438 | 28,979 | $35,322 | $398,871 |
| Reinvestment of distributions | 1,539 | 3,055 | 21,247 | 48,062 |
| Shares redeemed | (127) | (28,506) | (1,769) | (412,663) |
| Net increase (decrease) | 3,850 | 3,528 | $54,800 | $34,270 |
| Service Class 2 | | | | |
| Shares sold | 26,849 | 127,017 | $363,894 | $1,818,111 |
| Reinvestment of distributions | 58,257 | 134,480 | 780,644 | 2,058,569 |
| Shares redeemed | (86,227) | (252,412) | (1,178,236) | (3,709,828) |
| Net increase (decrease) | (1,121) | 9,085 | $(33,698) | $166,852 |
| Investor Class | | | | |
| Shares sold | 530,705 | 538,215 | $7,747,581 | $7,864,653 |
| Reinvestment of distributions | 572,202 | 1,323,379 | 8,016,550 | 21,107,034 |
| Shares redeemed | (436,031) | (1,682,766) | (6,160,935) | (25,743,057) |
| Net increase (decrease) | 666,876 | 178,828 | $9,603,196 | $3,228,630 |
11. Other.
A fund's organizational documents provide former and current trustees and officers with a limited indemnification against liabilities arising in connection with the performance of their duties to the fund. In the normal course of business, a fund may also enter into contracts that provide general indemnifications. A fund's maximum exposure under these arrangements is unknown as this would be dependent on future claims that may be made against a fund. The risk of material loss from such claims is considered remote.
At the end of the period, the investment adviser or its affiliates were owners of record of more than 10% of the outstanding shares as follows:
| Fund | Affiliated % |
VIP Dynamic Capital Appreciation Portfolio | 92% |
12. Risk and Uncertainties.
Many factors affect a fund's performance. Developments that disrupt global economies and financial markets, such as pandemics, epidemics, outbreaks of infectious diseases, war, terrorism, and environmental disasters, may significantly affect a fund's investment performance. The effects of these developments to a fund will be impacted by the types of securities in which a fund invests, the financial condition, industry, economic sector, and geographic location of an issuer, and a fund's level of investment in the securities of that issuer. Significant concentrations in security types, issuers, industries, sectors, and geographic locations may magnify the factors that affect a fund's performance.
As a shareholder, you incur two types of costs: (1) transaction costs, which may include sales charges (loads) on purchase payments or redemption proceeds, as applicable and (2) ongoing costs, which generally include management fees, distribution and/or service (12b-1) fees and other Fund expenses. This Example is intended to help you understand your ongoing costs (in dollars) of investing in a fund and to compare these costs with the ongoing costs of investing in other mutual funds.
| The Example is based on an investment of $1,000 invested at the beginning of the period and held for the entire period (January 1, 2023 to June 30, 2023). |
Actual Expenses
The first line of the accompanying table provides information about actual account values and actual expenses. You may use the information in this line, together with the amount you invested, to estimate the expenses that you paid over the period. Simply divide your account value by $1,000.00 (for example, an $8,600 account value divided by $1,000.00 = 8.6), then multiply the result by the number in the first line for a class/Fund under the heading entitled "Expenses Paid During Period" to estimate the expenses you paid on your account during this period. If any fund is a shareholder of any underlying mutual funds or exchange-traded funds (ETFs) (the Underlying Funds), such fund indirectly bears its proportional share of the expenses of the Underlying Funds in addition to the direct expenses incurred presented in the table. These fees and expenses are not included in the annualized expense ratio used to calculate the expense estimate in the table below. The estimate of expenses does not include any fees or other expenses of any variable annuity or variable life insurance product. If they were, the estimate of expenses you paid during the period would be higher, and your ending account value would be lower.
Hypothetical Example for Comparison Purposes
The second line of the accompanying table provides information about hypothetical account values and hypothetical expenses based on the actual expense ratio and an assumed rate of return of 5% per year before expenses, which is not the actual return. The hypothetical account values and expenses may not be used to estimate the actual ending account balance or expenses you paid for the period. You may use this information to compare the ongoing costs of investing in the Fund and other funds. To do so, compare this 5% hypothetical example with the 5% hypothetical examples that appear in the shareholder reports of the other funds. If any fund is a shareholder of any Underlying Funds, such fund indirectly bears its proportional share of the expenses of the Underlying Funds in addition to the direct expenses as presented in the table. These fees and expenses are not included in the annualized expense ratio used to calculate the expense estimate in the table below. The estimate of expenses does not include any fees or other expenses of any variable annuity or variable life insurance product. If they were, the estimate of expenses you paid during the period would be higher, and your ending account value would be lower.
Please note that the expenses shown in the table are meant to highlight your ongoing costs only and do not reflect any transaction costs. Therefore, the second line of the table is useful in comparing ongoing costs only, and will not help you determine the relative total costs of owning different funds. In addition, if these transactional costs were included, your costs would have been higher.
| | | | | Annualized Expense Ratio- A | | Beginning Account Value January 1, 2023 | | Ending Account Value June 30, 2023 | | Expenses Paid During Period- C January 1, 2023 to June 30, 2023 |
| VIP Dynamic Capital Appreciation Portfolio | | | | | | | | | | |
| Initial Class | | | | .66% | | | | | | |
| Actual | | | | | | $ 1,000 | | $ 1,179.00 | | $ 3.57 |
Hypothetical- B | | | | | | $ 1,000 | | $ 1,021.52 | | $ 3.31 |
| Service Class | | | | .76% | | | | | | |
| Actual | | | | | | $ 1,000 | | $ 1,178.20 | | $ 4.10 |
Hypothetical- B | | | | | | $ 1,000 | | $ 1,021.03 | | $ 3.81 |
| Service Class 2 | | | | .91% | | | | | | |
| Actual | | | | | | $ 1,000 | | $ 1,176.90 | | $ 4.91 |
Hypothetical- B | | | | | | $ 1,000 | | $ 1,020.28 | | $ 4.56 |
| Investor Class | | | | .74% | | | | | | |
| Actual | | | | | | $ 1,000 | | $ 1,177.90 | | $ 4.00 |
Hypothetical- B | | | | | | $ 1,000 | | $ 1,021.12 | | $ 3.71 |
| |
A Annualized expense ratio reflects expenses net of applicable fee waivers.
B 5% return per year before expenses
C Expenses are equal to the annualized expense ratio, multiplied by the average account value over the period, multiplied by 181/ 365 (to reflect the one-half year period). The fees and expenses of any Underlying Funds are not included in each annualized expense ratio.
Board Approval of Investment Advisory Contracts
VIP Dynamic Capital Appreciation Portfolio
At its May 2023 meeting, the Board of Trustees, including the Independent Trustees (together, the Board), voted to continue the management contract with Fidelity Management & Research Company LLC (FMR), and the sub-advisory agreements and sub-subadvisory agreements, in each case, where applicable (together, the Advisory Contracts) for the fund for two months from June 1, 2023 through July 31, 2023. The Board determined that it will consider the annual renewal of the fund's Advisory Contracts for a full one year period in July 2023, following its review of additional materials provided by FMR.
The Board considered that the approval of the fund's Advisory Contracts will not result in any changes in (i) the investment process or strategies employed in the management of the fund's assets; (ii) the fees and expenses paid by shareholders; (iii) the nature, extent or quality of services provided under the fund's Advisory Contracts; or (iv) the day-to-day management of the fund or the persons primarily responsible for such management. The Board also considered that since its last approval of the fund's Advisory Contracts, FMR had provided additional information on the fund in support of the annual contract renewal process, including competitive analyses on total expenses and management fees and in-depth reviews of fund performance and fund profitability information. The Board concluded that the fund's Advisory Contracts are fair and reasonable, and that the fund's Advisory Contracts should be renewed, without modification, through July 31, 2023, with the understanding that the Board will consider the annual renewal for a full one year period in July 2023.
In connection with its consideration of future renewals of the fund's Advisory Contracts, the Board will consider: (i) the nature, extent and quality of services provided to the fund, including shareholder and administrative services and investment performance; (ii) the competitiveness of the management fee and total expenses for the fund; (iii) the costs of the services and profitability, including the revenues earned and the expenses incurred in conducting the business of developing, marketing, distributing, managing, administering, and servicing the fund and its shareholders, to the extent applicable; and (iv) whether there have been economies of scale in respect of the Fidelity funds, whether the Fidelity funds (including the fund) have appropriately benefited from any such economies of scale, and whether there is the potential for realization of any further economies.
Based on its evaluation of all of the conclusions noted above, and after considering all factors it believed relevant, the Board ultimately concluded that the fund's management fee structure is fair and reasonable, and that the continuation of the fund's Advisory Contracts should be approved for two months from June 1, 2023 through July 31, 2023.
The Securities and Exchange Commission adopted Rule 22e-4 under the Investment Company Act of 1940 (the Liquidity Rule) to promote effective liquidity risk management throughout the open-end investment company industry, thereby reducing the risk that funds will be unable to meet their redemption obligations and mitigating dilution of the interests of fund shareholders.
The Fund has adopted and implemented a liquidity risk management program (the Program) reasonably designed to assess and manage the Fund's liquidity risk and to comply with the requirements of the Liquidity Rule. The Fund's Board of Trustees (the Board) has designated the Fund's investment adviser as administrator of the Program. The Fidelity advisers have established a Liquidity Risk Management Committee (the LRM Committee) to manage the Program for each of the Fidelity Funds. The LRM Committee monitors the adequacy and effectiveness of implementation of the Program and on a periodic basis assesses each Fund's liquidity risk based on a variety of factors including (1) the Fund's investment strategy, (2) portfolio liquidity and cash flow projections during normal and reasonably foreseeable stressed conditions, (3) shareholder redemptions, (4) borrowings and other funding sources and (5) certain factors specific to ETFs including the effect of the Fund's prices and spreads, market participants, and basket compositions on the overall liquidity of the Fund's portfolio, as applicable.
In accordance with the Program, each of the Fund's portfolio investments is classified into one of four defined liquidity categories based on a determination of a reasonable expectation for how long it would take to convert the investment to cash (or sell or dispose of the investment) without significantly changing its market value.
- Highly liquid investments - cash or convertible to cash within three business days or less
- Moderately liquid investments - convertible to cash in three to seven calendar days
- Less liquid investments - can be sold or disposed of, but not settled, within seven calendar days
- Illiquid investments - cannot be sold or disposed of within seven calendar days
Liquidity classification determinations take into account a variety of factors including various market, trading and investment-specific considerations, as well as market depth, and generally utilize analysis from a third-party liquidity metrics service.
The Liquidity Rule places a 15% limit on a fund's illiquid investments and requires funds that do not primarily hold assets that are highly liquid investments to determine and maintain a minimum percentage of the fund's net assets to be invested in highly liquid investments (highly liquid investment minimum or HLIM). The Program includes provisions reasonably designed to comply with the 15% limit on illiquid investments and for determining, periodically reviewing and complying with the HLIM requirement as applicable.
At a recent meeting of the Fund's Board of Trustees, the LRM Committee provided a written report to the Board pertaining to the operation, adequacy, and effectiveness of the Program for the period December 1, 2021 through November 30, 2022. The report concluded that the Program is operating effectively and is reasonably designed to assess and manage the Fund's liquidity risk.
1.761772.122
VIPDCA-SANN-0823
Fidelity® Variable Insurance Products:
VIP Mid Cap Portfolio
Semi-Annual Report
June 30, 2023
Contents
To view a fund's proxy voting guidelines and proxy voting record for the 12-month period ended June 30, visit http://www.fidelity.com/proxyvotingresults or visit the Securities and Exchange Commission's (SEC) web site at http://www.sec.gov.
You may also call 1-877-208-0098 to request a free copy of the proxy voting guidelines.
Fidelity® Variable Insurance Products are separate account options which are purchased through a variable insurance contract.
Standard & Poor's, S&P and S&P 500 are registered service marks of The McGraw-Hill Companies, Inc. and have been licensed for use by Fidelity Distributors Corporation.
Other third-party marks appearing herein are the property of their respective owners.
All other marks appearing herein are registered or unregistered trademarks or service marks of FMR LLC or an affiliated company. © 2023 FMR LLC. All rights reserved.
This report and the financial statements contained herein are submitted for the general information of the shareholders of the Fund. This report is not authorized for distribution to prospective investors in the Fund unless preceded or accompanied by an effective prospectus.
A fund files its complete schedule of portfolio holdings with the SEC for the first and third quarters of each fiscal year on Form N-PORT. Forms N-PORT are available on the SEC's web site at http://www.sec.gov. A fund's Forms N-PORT may be reviewed and copied at the SEC's Public Reference Room in Washington, DC. Information regarding the operation of the SEC's Public Reference Room may be obtained by calling 1-800-SEC-0330.
For a complete list of a fund's portfolio holdings, view the most recent holdings listing, semiannual report, or annual report on Fidelity's web site at http://www.fidelity.com, http://www.institutional.fidelity.com, or http://www.401k.com, as applicable.
NOT FDIC INSURED •MAY LOSE VALUE •NO BANK GUARANTEE
Neither the Fund nor Fidelity Distributors Corporation is a bank.
This report and the financial statements contained herein are submitted for the general information of the shareholders of the Fund. This report is not authorized for distribution to prospective investors in the Fund unless preceded or accompanied by an effective prospectus.
A fund files its complete schedule of portfolio holdings with the SEC for the first and third quarters of each fiscal year on Form N-PORT. Forms N-PORT are available on the SEC's web site at http://www.sec.gov. A fund's Forms N-PORT may be reviewed and copied at the SEC's Public Reference Room in Washington, DC. Information regarding the operation of the SEC's Public Reference Room may be obtained by calling 1-800-SEC-0330.
For a complete list of a fund's portfolio holdings, view the most recent holdings listing, semiannual report, or annual report on Fidelity's web site at http://www.fidelity.com, http://www.institutional.fidelity.com, or http://www.401k.com, as applicable.
NOT FDIC INSURED •MAY LOSE VALUE •NO BANK GUARANTEE
Neither the Fund nor Fidelity Distributors Corporation is a bank.
Top Holdings (% of Fund's net assets) |
| |
| Jabil, Inc. | 2.0 | |
| Deckers Outdoor Corp. | 1.9 | |
| ITT, Inc. | 1.4 | |
| KBR, Inc. | 1.4 | |
| Flex Ltd. | 1.3 | |
| Primerica, Inc. | 1.3 | |
| Churchill Downs, Inc. | 1.3 | |
| Builders FirstSource, Inc. | 1.2 | |
| Regal Rexnord Corp. | 1.2 | |
| Dynatrace, Inc. | 1.2 | |
| | 14.2 | |
| |
| Market Sectors (% of Fund's net assets) |
| |
| Industrials | 22.4 | |
| Financials | 13.2 | |
| Information Technology | 12.7 | |
| Consumer Discretionary | 12.6 | |
| Health Care | 8.5 | |
| Real Estate | 7.4 | |
| Materials | 7.2 | |
| Consumer Staples | 4.5 | |
| Energy | 4.4 | |
| Utilities | 3.7 | |
| Communication Services | 2.5 | |
| |
Asset Allocation (% of Fund's net assets) |
|
|
Showing Percentage of Net Assets
| Common Stocks - 99.1% |
| | | Shares | Value ($) |
| COMMUNICATION SERVICES - 2.5% | | | |
| Entertainment - 1.1% | | | |
| Endeavor Group Holdings, Inc. (a) | | 694,200 | 16,605,264 |
| Live Nation Entertainment, Inc. (a) | | 192,294 | 17,519,906 |
| Spotify Technology SA (a)(b) | | 142,200 | 22,830,210 |
| World Wrestling Entertainment, Inc. Class A (b) | | 199,300 | 21,618,071 |
| | | | 78,573,451 |
| Interactive Media & Services - 0.9% | | | |
| Bumble, Inc. (a) | | 1,507,200 | 25,290,816 |
| IAC, Inc. (a) | | 530,975 | 33,345,230 |
| | | | 58,636,046 |
| Media - 0.5% | | | |
| Interpublic Group of Companies, Inc. (b) | | 891,942 | 34,411,122 |
TOTAL COMMUNICATION SERVICES | | | 171,620,619 |
| CONSUMER DISCRETIONARY - 12.6% | | | |
| Automobile Components - 0.5% | | | |
| Autoliv, Inc. | | 427,100 | 36,320,584 |
| Distributors - 0.3% | | | |
| Pool Corp. | | 47,000 | 17,608,080 |
| Diversified Consumer Services - 0.5% | | | |
| European Wax Center, Inc. (a)(b) | | 628,300 | 11,705,229 |
| Grand Canyon Education, Inc. (a) | | 210,300 | 21,705,063 |
| | | | 33,410,292 |
| Hotels, Restaurants & Leisure - 4.1% | | | |
| Amadeus IT Holding SA Class A | | 554,300 | 42,158,195 |
| ARAMARK Holdings Corp. (b) | | 1,248,458 | 53,746,117 |
| Bowlero Corp. Class A (a)(b)(c) | | 1,602,377 | 18,651,668 |
| Caesars Entertainment, Inc. (a) | | 338,906 | 17,274,039 |
| Churchill Downs, Inc. | | 632,704 | 88,053,416 |
| Jubilant Foodworks Ltd. | | 750,700 | 4,597,716 |
| Light & Wonder, Inc. Class A (a) | | 428,100 | 29,436,156 |
| Noodles & Co. (a) | | 1,686,160 | 5,699,221 |
| Red Rock Resorts, Inc. | | 320,700 | 15,002,346 |
| Xponential Fitness, Inc. (a)(b) | | 219,777 | 3,791,153 |
| | | | 278,410,027 |
| Household Durables - 2.0% | | | |
| KB Home | | 371,618 | 19,216,367 |
| NVR, Inc. (a) | | 7,258 | 46,092,800 |
| Taylor Morrison Home Corp. (a) | | 1,306,712 | 63,728,344 |
| Vizio Holding Corp. (a) | | 933,000 | 6,297,750 |
| | | | 135,335,261 |
| Leisure Products - 0.3% | | | |
| YETI Holdings, Inc. (a)(b) | | 612,820 | 23,801,929 |
| Specialty Retail - 3.0% | | | |
| Academy Sports & Outdoors, Inc. | | 318,330 | 17,205,737 |
| America's Car Mart, Inc. (a) | | 116,649 | 11,639,237 |
| Dick's Sporting Goods, Inc. (b) | | 432,136 | 57,124,058 |
| Five Below, Inc. (a) | | 224,746 | 44,171,579 |
| Floor & Decor Holdings, Inc. Class A (a)(b) | | 169,600 | 17,631,616 |
| Revolve Group, Inc. (a)(b) | | 354,481 | 5,813,488 |
| Williams-Sonoma, Inc. (b) | | 413,923 | 51,798,324 |
| | | | 205,384,039 |
| Textiles, Apparel & Luxury Goods - 1.9% | | | |
| Deckers Outdoor Corp. (a) | | 242,239 | 127,819,831 |
TOTAL CONSUMER DISCRETIONARY | | | 858,090,043 |
| CONSUMER STAPLES - 4.5% | | | |
| Beverages - 0.5% | | | |
| Boston Beer Co., Inc. Class A (a) | | 99,800 | 30,782,312 |
| Consumer Staples Distribution & Retail - 3.4% | | | |
| BJ's Wholesale Club Holdings, Inc. (a)(b) | | 1,118,799 | 70,495,525 |
| Performance Food Group Co. (a) | | 1,064,000 | 64,095,360 |
| Sprouts Farmers Market LLC (a)(b) | | 805,700 | 29,593,361 |
| U.S. Foods Holding Corp. (a) | | 1,585,540 | 69,763,760 |
| | | | 233,948,006 |
| Food Products - 0.5% | | | |
| Nomad Foods Ltd. (a) | | 1,330,001 | 23,301,618 |
| Westrock Coffee Holdings (b) | | 1,043,826 | 11,346,389 |
| | | | 34,648,007 |
| Personal Care Products - 0.1% | | | |
| Olaplex Holdings, Inc. (a) | | 2,118,400 | 7,880,448 |
TOTAL CONSUMER STAPLES | | | 307,258,773 |
| ENERGY - 4.4% | | | |
| Energy Equipment & Services - 2.6% | | | |
| Baker Hughes Co. Class A | | 1,222,548 | 38,644,742 |
| Nextier Oilfield Solutions, Inc. (a) | | 3,392,300 | 30,327,162 |
| NOV, Inc. | | 1,098,900 | 17,626,356 |
| TechnipFMC PLC (a) | | 3,787,900 | 62,954,898 |
| Valaris Ltd. (a) | | 409,761 | 25,786,260 |
| | | | 175,339,418 |
| Oil, Gas & Consumable Fuels - 1.8% | | | |
| Antero Resources Corp. (a) | | 933,025 | 21,487,566 |
| Cheniere Energy, Inc. | | 108,870 | 16,587,433 |
| Hess Corp. | | 110,388 | 15,007,249 |
| Magnolia Oil & Gas Corp. Class A | | 747,031 | 15,612,948 |
| New Fortress Energy, Inc. (b) | | 875,462 | 23,444,872 |
| Ovintiv, Inc. | | 348,900 | 13,282,623 |
| Range Resources Corp. | | 718,368 | 21,120,019 |
| | | | 126,542,710 |
TOTAL ENERGY | | | 301,882,128 |
| FINANCIALS - 13.2% | | | |
| Banks - 3.6% | | | |
| Associated Banc-Corp. | | 1,235,600 | 20,053,788 |
| Bancorp, Inc., Delaware (a) | | 1,831,222 | 59,789,398 |
| Cadence Bank | | 771,200 | 15,146,368 |
| East West Bancorp, Inc. | | 1,036,217 | 54,701,895 |
| Popular, Inc. | | 625,327 | 37,844,790 |
| Signature Bank | | 299,630 | 62,922 |
| Wintrust Financial Corp. | | 805,141 | 58,469,339 |
| | | | 246,068,500 |
| Capital Markets - 2.2% | | | |
| Ameriprise Financial, Inc. | | 122,327 | 40,632,136 |
| Northern Trust Corp. | | 451,055 | 33,441,218 |
| Raymond James Financial, Inc. (b) | | 405,697 | 42,099,178 |
| TMX Group Ltd. | | 1,354,500 | 30,479,445 |
| | | | 146,651,977 |
| Financial Services - 1.9% | | | |
| Equitable Holdings, Inc. | | 625,444 | 16,987,059 |
| Essent Group Ltd. | | 642,304 | 30,059,827 |
| Euronet Worldwide, Inc. (a) | | 458,422 | 53,804,990 |
| Shift4 Payments, Inc. (a)(b) | | 427,800 | 29,051,898 |
| | | | 129,903,774 |
| Insurance - 5.5% | | | |
| American Financial Group, Inc. | | 215,313 | 25,568,419 |
| Arch Capital Group Ltd. (a) | | 653,900 | 48,944,415 |
| Assurant, Inc. | | 208,627 | 26,228,586 |
| Hartford Financial Services Group, Inc. | | 694,522 | 50,019,474 |
| Old Republic International Corp. | | 1,726,310 | 43,451,223 |
| Primerica, Inc. | | 455,347 | 90,049,423 |
| Reinsurance Group of America, Inc. | | 465,978 | 64,626,489 |
| Selective Insurance Group, Inc. | | 307,600 | 29,514,220 |
| | | | 378,402,249 |
TOTAL FINANCIALS | | | 901,026,500 |
| HEALTH CARE - 8.5% | | | |
| Biotechnology - 1.5% | | | |
| Argenx SE ADR (a) | | 35,652 | 13,894,654 |
| Arrowhead Pharmaceuticals, Inc. (a) | | 237,083 | 8,454,380 |
| Blueprint Medicines Corp. (a) | | 159,900 | 10,105,680 |
| Legend Biotech Corp. ADR (a) | | 213,500 | 14,737,905 |
| Repligen Corp. (a) | | 76,500 | 10,821,690 |
| United Therapeutics Corp. (a) | | 211,400 | 46,666,550 |
| | | | 104,680,859 |
| Health Care Equipment & Supplies - 3.3% | | | |
| Boston Scientific Corp. (a) | | 728,243 | 39,390,664 |
| Envista Holdings Corp. (a) | | 507,866 | 17,186,185 |
| Hologic, Inc. (a) | | 252,072 | 20,410,270 |
| Masimo Corp. (a) | | 261,800 | 43,079,190 |
| ResMed, Inc. | | 83,585 | 18,263,323 |
| The Cooper Companies, Inc. | | 76,439 | 29,309,006 |
| Zimmer Biomet Holdings, Inc. | | 373,832 | 54,429,939 |
| | | | 222,068,577 |
| Health Care Providers & Services - 2.1% | | | |
| agilon health, Inc. (a) | | 1,065,200 | 18,470,568 |
| Encompass Health Corp. | | 517,000 | 35,006,070 |
| Guardant Health, Inc. (a) | | 166,000 | 5,942,800 |
| Molina Healthcare, Inc. (a) | | 121,468 | 36,591,020 |
| Option Care Health, Inc. (a) | | 1,489,320 | 48,388,007 |
| | | | 144,398,465 |
| Health Care Technology - 0.2% | | | |
| Evolent Health, Inc. (d) | | 573,000 | 16,493,805 |
| Life Sciences Tools & Services - 0.8% | | | |
| Bio-Rad Laboratories, Inc. Class A (a) | | 42,300 | 16,036,776 |
| ICON PLC (a) | | 75,354 | 18,853,571 |
| Thermo Fisher Scientific, Inc. | | 32,661 | 17,040,877 |
| | | | 51,931,224 |
| Pharmaceuticals - 0.6% | | | |
| UCB SA | | 468,200 | 41,485,067 |
TOTAL HEALTH CARE | | | 581,057,997 |
| INDUSTRIALS - 22.4% | | | |
| Aerospace & Defense - 1.5% | | | |
| AerSale Corp. (a) | | 1,062,000 | 15,611,400 |
| Axon Enterprise, Inc. (a)(b) | | 85,754 | 16,732,320 |
| Howmet Aerospace, Inc. | | 1,070,552 | 53,056,557 |
| Spirit AeroSystems Holdings, Inc. Class A | | 617,300 | 18,018,987 |
| | | | 103,419,264 |
| Air Freight & Logistics - 0.8% | | | |
| GXO Logistics, Inc. (a)(b) | | 837,232 | 52,594,914 |
| Building Products - 1.4% | | | |
| Builders FirstSource, Inc. (a)(b) | | 627,971 | 85,404,056 |
| Trex Co., Inc. (a) | | 196,800 | 12,902,208 |
| | | | 98,306,264 |
| Commercial Services & Supplies - 0.5% | | | |
| Driven Brands Holdings, Inc. (a) | | 1,148,821 | 31,087,096 |
| Construction & Engineering - 2.1% | | | |
| Quanta Services, Inc. | | 337,569 | 66,315,430 |
| Willscot Mobile Mini Holdings (a) | | 1,558,619 | 74,486,402 |
| | | | 140,801,832 |
| Electrical Equipment - 4.8% | | | |
| Acuity Brands, Inc. | | 200,523 | 32,701,291 |
| AMETEK, Inc. | | 402,626 | 65,177,097 |
| Array Technologies, Inc. (a) | | 1,112,300 | 25,137,980 |
| Generac Holdings, Inc. (a) | | 259,290 | 38,667,918 |
| nVent Electric PLC | | 621,900 | 32,133,573 |
| Regal Rexnord Corp. | | 533,664 | 82,130,890 |
| Sunrun, Inc. (a)(b) | | 1,311,746 | 23,427,784 |
| Vertiv Holdings Co. | | 1,206,600 | 29,887,482 |
| | | | 329,264,015 |
| Ground Transportation - 0.9% | | | |
| J.B. Hunt Transport Services, Inc. | | 146,000 | 26,430,380 |
| RXO, Inc. | | 870,300 | 19,729,701 |
| U-Haul Holding Co. (b) | | 223,100 | 12,341,892 |
| | | | 58,501,973 |
| Machinery - 5.7% | | | |
| Chart Industries, Inc. (a)(b) | | 316,400 | 50,557,556 |
| Crane Co. (b) | | 649,736 | 57,904,472 |
| Crane Nxt Co. (b) | | 547,536 | 30,902,932 |
| Fortive Corp. | | 761,814 | 56,960,833 |
| Hillenbrand, Inc. | | 361,600 | 18,542,848 |
| IDEX Corp. | | 193,294 | 41,608,466 |
| Ingersoll Rand, Inc. | | 561,000 | 36,666,960 |
| ITT, Inc. (b) | | 1,055,609 | 98,393,315 |
| | | | 391,537,382 |
| Marine Transportation - 0.3% | | | |
| Clarkson PLC | | 481,675 | 18,107,127 |
| Professional Services - 3.8% | | | |
| ASGN, Inc. (a) | | 387,106 | 29,276,827 |
| FTI Consulting, Inc. (a)(b) | | 287,700 | 54,720,540 |
| KBR, Inc. | | 1,423,039 | 92,582,917 |
| Maximus, Inc. | | 652,900 | 55,176,579 |
| WNS Holdings Ltd. sponsored ADR (a) | | 413,403 | 30,476,069 |
| | | | 262,232,932 |
| Trading Companies & Distributors - 0.6% | | | |
| Applied Industrial Technologies, Inc. | | 3,266 | 473,015 |
| NOW, Inc. (a) | | 1,922,800 | 19,920,208 |
| RS GROUP PLC | | 2,373,799 | 22,917,938 |
| | | | 43,311,161 |
TOTAL INDUSTRIALS | | | 1,529,163,960 |
| INFORMATION TECHNOLOGY - 12.7% | | | |
| Communications Equipment - 0.8% | | | |
| Digi International, Inc. (a) | | 1,379,301 | 54,330,666 |
| Electronic Equipment, Instruments & Components - 4.3% | | | |
| CDW Corp. | | 181,176 | 33,245,796 |
| Flex Ltd. (a) | | 3,307,300 | 91,413,772 |
| IPG Photonics Corp. (a) | | 222,800 | 30,260,696 |
| Jabil, Inc. (b) | | 1,275,175 | 137,629,636 |
| | | | 292,549,900 |
| IT Services - 0.4% | | | |
| Endava PLC ADR (a) | | 149,000 | 7,716,710 |
| Wix.com Ltd. (a) | | 249,800 | 19,544,352 |
| | | | 27,261,062 |
| Semiconductors & Semiconductor Equipment - 5.1% | | | |
| Allegro MicroSystems LLC (a) | | 418,700 | 18,900,118 |
| Axcelis Technologies, Inc. (a) | | 89,400 | 16,389,702 |
| Lattice Semiconductor Corp. (a) | | 586,600 | 56,354,662 |
| Marvell Technology, Inc. | | 303,978 | 18,171,805 |
| MKS Instruments, Inc. (b) | | 451,271 | 48,782,395 |
| Nova Ltd. (a) | | 208,600 | 24,468,780 |
| ON Semiconductor Corp. (a) | | 760,214 | 71,901,040 |
| Skyworks Solutions, Inc. | | 184,700 | 20,444,443 |
| SolarEdge Technologies, Inc. (a) | | 66,643 | 17,930,299 |
| Teradyne, Inc. | | 509,545 | 56,727,645 |
| | | | 350,070,889 |
| Software - 1.6% | | | |
| Dynatrace, Inc. (a) | | 1,511,749 | 77,809,721 |
| PowerSchool Holdings, Inc. (a) | | 834,800 | 15,978,072 |
| Zoom Video Communications, Inc. Class A (a) | | 235,500 | 15,985,740 |
| | | | 109,773,533 |
| Technology Hardware, Storage & Peripherals - 0.5% | | | |
| Corsair Gaming, Inc. (a) | | 707,800 | 12,556,372 |
| Super Micro Computer, Inc. (a) | | 73,100 | 18,220,175 |
| | | | 30,776,547 |
TOTAL INFORMATION TECHNOLOGY | | | 864,762,597 |
| MATERIALS - 7.2% | | | |
| Chemicals - 2.1% | | | |
| Axalta Coating Systems Ltd. (a) | | 1,242,300 | 40,759,863 |
| Cabot Corp. | | 167,000 | 11,170,630 |
| Celanese Corp. Class A | | 324,237 | 37,546,645 |
| Element Solutions, Inc. | | 2,726,105 | 52,341,216 |
| | | | 141,818,354 |
| Construction Materials - 0.9% | | | |
| Martin Marietta Materials, Inc. | | 133,937 | 61,837,374 |
| Containers & Packaging - 1.1% | | | |
| Aptargroup, Inc. | | 297,300 | 34,445,178 |
| Avery Dennison Corp. | | 241,783 | 41,538,319 |
| | | | 75,983,497 |
| Metals & Mining - 3.1% | | | |
| Commercial Metals Co. | | 556,100 | 29,284,226 |
| First Quantum Minerals Ltd. | | 2,634,000 | 62,313,312 |
| Reliance Steel & Aluminum Co. | | 274,227 | 74,477,311 |
| Wheaton Precious Metals Corp. | | 961,700 | 41,589,578 |
| | | | 207,664,427 |
TOTAL MATERIALS | | | 487,303,652 |
| REAL ESTATE - 7.4% | | | |
| Equity Real Estate Investment Trusts (REITs) - 6.9% | | | |
| Alexandria Real Estate Equities, Inc. | | 147,783 | 16,771,893 |
| CubeSmart | | 1,188,300 | 53,069,478 |
| EastGroup Properties, Inc. | | 396,300 | 68,797,680 |
| Equity Lifestyle Properties, Inc. | | 282,900 | 18,923,181 |
| Essex Property Trust, Inc. | | 96,500 | 22,609,950 |
| Invitation Homes, Inc. | | 1,387,472 | 47,729,037 |
| Lamar Advertising Co. Class A | | 633,381 | 62,863,064 |
| Mid-America Apartment Communities, Inc. | | 100,105 | 15,201,945 |
| NNN (REIT), Inc. | | 537,811 | 23,012,933 |
| Ryman Hospitality Properties, Inc. | | 585,700 | 54,423,244 |
| Sun Communities, Inc. | | 133,600 | 17,429,456 |
| Terreno Realty Corp. | | 274,300 | 16,485,430 |
| Ventas, Inc. | | 1,078,237 | 50,968,263 |
| | | | 468,285,554 |
| Real Estate Management & Development - 0.5% | | | |
| CBRE Group, Inc. (a) | | 323,928 | 26,144,229 |
| Zillow Group, Inc. Class C (a) | | 161,600 | 8,122,016 |
| | | | 34,266,245 |
TOTAL REAL ESTATE | | | 502,551,799 |
| UTILITIES - 3.7% | | | |
| Electric Utilities - 2.3% | | | |
| Constellation Energy Corp. | | 565,300 | 51,753,215 |
| OGE Energy Corp. (b) | | 1,739,800 | 62,476,218 |
| PG&E Corp. (a) | | 2,521,000 | 43,562,880 |
| | | | 157,792,313 |
| Independent Power and Renewable Electricity Producers - 1.0% | | | |
| Clearway Energy, Inc. Class C | | 1,205,854 | 34,439,190 |
| NextEra Energy Partners LP | | 290,723 | 17,047,997 |
| The AES Corp. | | 803,038 | 16,646,978 |
| | | | 68,134,165 |
| Multi-Utilities - 0.4% | | | |
| NorthWestern Energy Corp. | | 503,600 | 28,584,336 |
TOTAL UTILITIES | | | 254,510,814 |
| TOTAL COMMON STOCKS (Cost $5,069,121,890) | | | 6,759,228,882 |
| | | | |
| Money Market Funds - 6.2% |
| | | Shares | Value ($) |
| Fidelity Cash Central Fund 5.14% (e) | | 54,552,610 | 54,563,521 |
| Fidelity Securities Lending Cash Central Fund 5.14% (e)(f) | | 370,144,838 | 370,181,853 |
| TOTAL MONEY MARKET FUNDS (Cost $424,745,374) | | | 424,745,374 |
| | | | |
| TOTAL INVESTMENT IN SECURITIES - 105.3% (Cost $5,493,867,264) | 7,183,974,256 |
NET OTHER ASSETS (LIABILITIES) - (5.3)% | (362,275,870) |
| NET ASSETS - 100.0% | 6,821,698,386 |
| | |
Legend
| (b) | Security or a portion of the security is on loan at period end. |
| (d) | Restricted securities (including private placements) - Investment in securities not registered under the Securities Act of 1933 (excluding 144A issues). At the end of the period, the value of restricted securities (excluding 144A issues) amounted to $16,493,805 or 0.2% of net assets. |
| (e) | Affiliated fund that is generally available only to investment companies and other accounts managed by Fidelity Investments. The rate quoted is the annualized seven-day yield of the fund at period end. A complete unaudited listing of the fund's holdings as of its most recent quarter end is available upon request. In addition, each Fidelity Central Fund's financial statements are available on the SEC's website or upon request. |
| (f) | Investment made with cash collateral received from securities on loan. |
| Additional information on each restricted holding is as follows: |
| Security | Acquisition Date | Acquisition Cost ($) |
| Evolent Health, Inc. | 3/28/23 | 16,617,000 |
| | | |
Affiliated Central Funds
Fiscal year to date information regarding the Fund's investments in Fidelity Central Funds, including the ownership percentage, is presented below.
| Affiliate | Value, beginning of period ($) | Purchases ($) | Sales Proceeds ($) | Dividend Income ($) | Realized Gain (loss) ($) | Change in Unrealized appreciation (depreciation) ($) | Value, end of period ($) | % ownership, end of period |
| Fidelity Cash Central Fund 5.14% | 101,362,444 | 542,746,777 | 589,545,700 | 1,774,168 | - | - | 54,563,521 | 0.1% |
| Fidelity Securities Lending Cash Central Fund 5.14% | 208,510,362 | 1,116,510,139 | 954,838,648 | 962,720 | - | - | 370,181,853 | 1.3% |
| Total | 309,872,806 | 1,659,256,916 | 1,544,384,348 | 2,736,888 | - | - | 424,745,374 | |
| | | | | | | | | |
Amounts in the dividend income column in the above table include any capital gain distributions from underlying funds, which are presented in the corresponding line item in the Statement of Operations, if applicable.
Amounts in the dividend income column for Fidelity Securities Lending Cash Central Fund represents the income earned on investing cash collateral, less rebates paid to borrowers and any lending agent fees associated with the loan, plus any premium payments received for lending certain types of securities.
Amounts included in the purchases and sales proceeds columns may include in-kind transactions, if applicable.
Other Affiliated Issuers
An affiliated company is a company in which the Fund has ownership of at least 5% of the voting securities. Fiscal year to date transactions with companies which are or were affiliates are presented in the table below. Certain corporate actions, such as mergers, are excluded from the amounts in this table if applicable. A dash in the Value end of period ($) column means either the issuer is no longer held at period end, or the issuer is held at period end but is no longer an affiliate.
| Affiliate | Value, beginning of period ($) | Purchases ($) | Sales Proceeds ($) | Dividend Income ($) | Realized Gain (loss) ($) | Change in Unrealized appreciation (depreciation) ($) | Value, end of period ($) |
| Bowlero Corp. Class A | 11,981,024 | 13,781,735 | 2,902,750 | - | (1,191,385) | (3,016,956) | 18,651,668 |
| Noodles & Co. | 16,771,730 | - | 4,722,182 | - | (6,454,131) | 103,804 | - |
| Total | 28,752,754 | 13,781,735 | 7,624,932 | - | (7,645,516) | (2,913,152) | 18,651,668 |
Amounts included in the purchases and sales proceeds columns may include in-kind transactions, if applicable.
Investment Valuation
The following is a summary of the inputs used, as of June 30, 2023, involving the Fund's assets and liabilities carried at fair value. The inputs or methodology used for valuing securities may not be an indication of the risk associated with investing in those securities. For more information on valuation inputs, and their aggregation into the levels used below, please refer to the Investment Valuation section in the accompanying Notes to Financial Statements.
| Valuation Inputs at Reporting Date: |
| Description | Total ($) | Level 1 ($) | Level 2 ($) | Level 3 ($) |
Investments in Securities: | | | | |
|
| Equities: | | | | |
Communication Services | 171,620,619 | 171,620,619 | - | - |
Consumer Discretionary | 858,090,043 | 853,492,327 | 4,597,716 | - |
Consumer Staples | 307,258,773 | 307,258,773 | - | - |
Energy | 301,882,128 | 301,882,128 | - | - |
Financials | 901,026,500 | 901,026,500 | - | - |
Health Care | 581,057,997 | 564,564,192 | 16,493,805 | - |
Industrials | 1,529,163,960 | 1,529,163,960 | - | - |
Information Technology | 864,762,597 | 864,762,597 | - | - |
Materials | 487,303,652 | 487,303,652 | - | - |
Real Estate | 502,551,799 | 502,551,799 | - | - |
Utilities | 254,510,814 | 254,510,814 | - | - |
|
| Money Market Funds | 424,745,374 | 424,745,374 | - | - |
| Total Investments in Securities: | 7,183,974,256 | 7,162,882,735 | 21,091,521 | - |
| Statement of Assets and Liabilities |
| | | | June 30, 2023 (Unaudited) |
| | | | | |
| Assets | | | | |
| Investment in securities, at value (including securities loaned of $365,535,879) - See accompanying schedule: | | | | |
Unaffiliated issuers (cost $5,047,493,680) | $ | 6,740,577,214 | | |
Fidelity Central Funds (cost $424,745,374) | | 424,745,374 | | |
Other affiliated issuers (cost $21,628,210) | | 18,651,668 | | |
| | | | | |
| | | | | |
| Total Investment in Securities (cost $5,493,867,264) | | | $ | 7,183,974,256 |
| Foreign currency held at value (cost $47,356) | | | | 47,109 |
| Receivable for investments sold | | | | 36,279,214 |
| Receivable for fund shares sold | | | | 5,498,536 |
| Dividends receivable | | | | 6,018,406 |
| Distributions receivable from Fidelity Central Funds | | | | 351,115 |
| Other receivables | | | | 122,516 |
Total assets | | | | 7,232,291,152 |
| Liabilities | | | | |
| Payable for investments purchased | $ | 30,746,770 | | |
| Payable for fund shares redeemed | | 5,330,056 | | |
| Accrued management fee | | 2,905,042 | | |
| Distribution and service plan fees payable | | 863,888 | | |
| Other affiliated payables | | 476,204 | | |
| Other payables and accrued expenses | | 104,522 | | |
| Collateral on securities loaned | | 370,166,284 | | |
| Total Liabilities | | | | 410,592,766 |
| Net Assets | | | $ | 6,821,698,386 |
| Net Assets consist of: | | | | |
| Paid in capital | | | $ | 4,957,789,506 |
| Total accumulated earnings (loss) | | | | 1,863,908,880 |
| Net Assets | | | $ | 6,821,698,386 |
| | | | | |
| Net Asset Value and Maximum Offering Price | | | | |
| Initial Class : | | | | |
Net Asset Value , offering price and redemption price per share ($1,508,665,577 ÷ 42,738,733 shares) | | | $ | 35.30 |
| Service Class : | | | | |
Net Asset Value , offering price and redemption price per share ($630,958,780 ÷ 18,140,227 shares) | | | $ | 34.78 |
| Service Class 2 : | | | | |
Net Asset Value , offering price and redemption price per share ($4,030,138,943 ÷ 119,893,958 shares) | | | $ | 33.61 |
| Investor Class : | | | | |
Net Asset Value , offering price and redemption price per share ($651,935,086 ÷ 18,645,282 shares) | | | $ | 34.97 |
| Statement of Operations |
| | | | Six months ended June 30, 2023 (Unaudited) |
| Investment Income | | | | |
| Dividends | | | $ | 39,753,610 |
| Income from Fidelity Central Funds (including $962,720 from security lending) | | | | 2,736,888 |
| Total Income | | | | 42,490,498 |
| Expenses | | | | |
| Management fee | $ | 17,444,342 | | |
| Transfer agent fees | | 2,342,608 | | |
| Distribution and service plan fees | | 5,178,535 | | |
| Accounting fees | | 512,932 | | |
| Custodian fees and expenses | | 33,911 | | |
| Independent trustees' fees and expenses | | 21,979 | | |
| Audit | | 33,055 | | |
| Legal | | 13,246 | | |
| Miscellaneous | | 18,640 | | |
| Total expenses before reductions | | 25,599,248 | | |
| Expense reductions | | (157,618) | | |
| Total expenses after reductions | | | | 25,441,630 |
| Net Investment income (loss) | | | | 17,048,868 |
| Realized and Unrealized Gain (Loss) | | | | |
| Net realized gain (loss) on: | | | | |
| Investment Securities: | | | | |
| Unaffiliated issuers | | 170,739,825 | | |
| Affiliated issuers | | (7,645,516) | | |
| Foreign currency transactions | | 74,423 | | |
| Total net realized gain (loss) | | | | 163,168,732 |
| Change in net unrealized appreciation (depreciation) on: | | | | |
| Investment Securities: | | | | |
| Unaffiliated issuers | | 330,494,587 | | |
| Affiliated issuers | | (2,913,152) | | |
| Assets and liabilities in foreign currencies | | (616) | | |
| Total change in net unrealized appreciation (depreciation) | | | | 327,580,819 |
| Net gain (loss) | | | | 490,749,551 |
| Net increase (decrease) in net assets resulting from operations | | | $ | 507,798,419 |
| Statement of Changes in Net Assets |
| |
| | Six months ended June 30, 2023 (Unaudited) | | Year ended December 31, 2022 |
| Increase (Decrease) in Net Assets | | | | |
| Operations | | | | |
| Net investment income (loss) | $ | 17,048,868 | $ | 29,380,299 |
| Net realized gain (loss) | | 163,168,732 | | 318,370,136 |
| Change in net unrealized appreciation (depreciation) | | 327,580,819 | | (1,557,891,401) |
| Net increase (decrease) in net assets resulting from operations | | 507,798,419 | | (1,210,140,966) |
| Distributions to shareholders | | (16,134,136) | | (483,587,759) |
| | | | | |
| Share transactions - net increase (decrease) | | (123,333,030) | | (99,655,685) |
| Total increase (decrease) in net assets | | 368,331,253 | | (1,793,384,410) |
| | | | | |
| Net Assets | | | | |
| Beginning of period | | 6,453,367,133 | | 8,246,751,543 |
| End of period | $ | 6,821,698,386 | $ | 6,453,367,133 |
| | | | | |
| | | | | |
| VIP Mid Cap Portfolio Initial Class |
| |
| | Six months ended (Unaudited) June 30, 2023 | | Years ended December 31, 2022 | | 2021 | | 2020 | | 2019 | | 2018 |
Selected Per-Share Data | | | | | | | | | | | | |
| Net asset value, beginning of period | $ | 32.72 | $ | 41.17 | $ | 38.72 | $ | 32.95 | $ | 30.19 | $ | 38.94 |
| Income from Investment Operations | | | | | | | | | | | | |
Net investment income (loss) A,B | | .11 | | .21 | | .23 | | .15 | | .27 | | .23 |
| Net realized and unrealized gain (loss) | | 2.55 | | (6.16) | | 9.57 | | 5.83 | | 6.39 | | (5.47) |
| Total from investment operations | | 2.66 | | (5.95) | | 9.80 | | 5.98 | | 6.66 | | (5.24) |
| Distributions from net investment income | | - | | (.17) C | | (.28) | | (.21) | | (.28) | | (.24) |
| Distributions from net realized gain | | (.08) | | (2.33) C | | (7.07) | | - | | (3.63) | | (3.27) |
| Total distributions | | (.08) | | (2.50) | | (7.35) | | (.21) | | (3.90) D | | (3.51) |
| Net asset value, end of period | $ | 35.30 | $ | 32.72 | $ | 41.17 | $ | 38.72 | $ | 32.95 | $ | 30.19 |
Total Return E,F,G | | 8.12% | | (14.74)% | | 25.60% | | 18.19% | | 23.45% | | (14.54)% |
Ratios to Average Net Assets B,H,I | | | | | | | | | | | | |
| Expenses before reductions | | .61% J | | .61% | | .61% | | .62% | | .62% | | .62% |
| Expenses net of fee waivers, if any | | .60% J | | .60% | | .60% | | .62% | | .62% | | .62% |
| Expenses net of all reductions | | .60% J | | .60% | | .60% | | .62% | | .61% | | .62% |
| Net investment income (loss) | | .68% J | | .60% | | .52% | | .48% | | .88% | | .62% |
| Supplemental Data | | | | | | | | | | | | |
| Net assets, end of period (000 omitted) | $ | 1,508,666 | $ | 1,455,364 | $ | 1,810,651 | $ | 1,579,450 | $ | 843,080 | $ | 1,141,305 |
Portfolio turnover rate K | | 41% J | | 31% | | 37% L | | 44% | | 34% | | 47% |
A Calculated based on average shares outstanding during the period.
B Net investment income (loss) is affected by the timing of the declaration of dividends by any underlying mutual funds or exchange-traded funds (ETFs). Net investment income (loss) of any mutual funds or ETFs is not included in the Fund's net investment income (loss) ratio.
C The amount shown reflects reclassifications related to book to tax differences that were made in the year shown.
D Total distributions per share do not sum due to rounding.
E Total returns for periods of less than one year are not annualized.
F Total returns do not reflect charges attributable to your insurance company's separate account. Inclusion of these charges would reduce the total returns shown.
G Total returns would have been lower if certain expenses had not been reduced during the applicable periods shown.
H Fees and expenses of any underlying mutual funds or exchange-traded funds (ETFs) are not included in the Fund's expense ratio. The Fund indirectly bears its proportionate share of these expenses. For additional expense information related to investments in Fidelity Central Funds, please refer to the "Investments in Fidelity Central Funds" note found in the Notes to Financial Statements section of the most recent Annual or Semi-Annual report.
I Expense ratios reflect operating expenses of the class. Expenses before reductions do not reflect amounts reimbursed, waived, or reduced through arrangements with the investment adviser, brokerage services, or other offset arrangements, if applicable, and do not represent the amount paid by the class during periods when reimbursements, waivers or reductions occur.
J Annualized.
K Amount does not include the portfolio activity of any underlying mutual funds or exchange-traded funds (ETFs).
L Portfolio turnover rate excludes securities received or delivered in-kind.
| VIP Mid Cap Portfolio Service Class |
| |
| | Six months ended (Unaudited) June 30, 2023 | | Years ended December 31, 2022 | | 2021 | | 2020 | | 2019 | | 2018 |
Selected Per-Share Data | | | | | | | | | | | | |
| Net asset value, beginning of period | $ | 32.25 | $ | 40.63 | $ | 38.28 | $ | 32.59 | $ | 29.90 | $ | 38.60 |
| Income from Investment Operations | | | | | | | | | | | | |
Net investment income (loss) A,B | | .10 | | .17 | | .18 | | .12 | | .24 | | .19 |
| Net realized and unrealized gain (loss) | | 2.51 | | (6.09) | | 9.47 | | 5.74 | | 6.33 | | (5.42) |
| Total from investment operations | | 2.61 | | (5.92) | | 9.65 | | 5.86 | | 6.57 | | (5.23) |
| Distributions from net investment income | | - | | (.13) C | | (.23) | | (.17) | | (.25) | | (.20) |
| Distributions from net realized gain | | (.08) | | (2.33) C | | (7.07) | | - | | (3.63) | | (3.27) |
| Total distributions | | (.08) | | (2.46) | | (7.30) | | (.17) | | (3.88) | | (3.47) |
| Net asset value, end of period | $ | 34.78 | $ | 32.25 | $ | 40.63 | $ | 38.28 | $ | 32.59 | $ | 29.90 |
Total Return D,E,F | | 8.09% | | (14.85)% | | 25.51% | | 18.04% | | 23.35% | | (14.64)% |
Ratios to Average Net Assets B,G,H | | | | | | | | | | | | |
| Expenses before reductions | | .71% I | | .71% | | .71% | | .72% | | .72% | | .72% |
| Expenses net of fee waivers, if any | | .70% I | | .70% | | .70% | | .72% | | .72% | | .72% |
| Expenses net of all reductions | | .70% I | | .70% | | .70% | | .72% | | .71% | | .72% |
| Net investment income (loss) | | .58% I | | .50% | | .42% | | .38% | | .78% | | .52% |
| Supplemental Data | | | | | | | | | | | | |
| Net assets, end of period (000 omitted) | $ | 630,959 | $ | 586,964 | $ | 726,039 | $ | 642,654 | $ | 564,678 | $ | 504,156 |
Portfolio turnover rate J | | 41% I | | 31% | | 37% K | | 44% | | 34% | | 47% |
A Calculated based on average shares outstanding during the period.
B Net investment income (loss) is affected by the timing of the declaration of dividends by any underlying mutual funds or exchange-traded funds (ETFs). Net investment income (loss) of any mutual funds or ETFs is not included in the Fund's net investment income (loss) ratio.
C The amount shown reflects reclassifications related to book to tax differences that were made in the year shown.
D Total returns for periods of less than one year are not annualized.
E Total returns do not reflect charges attributable to your insurance company's separate account. Inclusion of these charges would reduce the total returns shown.
F Total returns would have been lower if certain expenses had not been reduced during the applicable periods shown.
G Fees and expenses of any underlying mutual funds or exchange-traded funds (ETFs) are not included in the Fund's expense ratio. The Fund indirectly bears its proportionate share of these expenses. For additional expense information related to investments in Fidelity Central Funds, please refer to the "Investments in Fidelity Central Funds" note found in the Notes to Financial Statements section of the most recent Annual or Semi-Annual report.
H Expense ratios reflect operating expenses of the class. Expenses before reductions do not reflect amounts reimbursed, waived, or reduced through arrangements with the investment adviser, brokerage services, or other offset arrangements, if applicable, and do not represent the amount paid by the class during periods when reimbursements, waivers or reductions occur.
I Annualized.
J Amount does not include the portfolio activity of any underlying mutual funds or exchange-traded funds (ETFs).
K Portfolio turnover rate excludes securities received or delivered in-kind.
| VIP Mid Cap Portfolio Service Class 2 |
| |
| | Six months ended (Unaudited) June 30, 2023 | | Years ended December 31, 2022 | | 2021 | | 2020 | | 2019 | | 2018 |
Selected Per-Share Data | | | | | | | | | | | | |
| Net asset value, beginning of period | $ | 31.20 | $ | 39.39 | $ | 37.29 | $ | 31.75 | $ | 29.22 | $ | 37.79 |
| Income from Investment Operations | | | | | | | | | | | | |
Net investment income (loss) A,B | | .07 | | .12 | | .11 | | .07 | | .19 | | .13 |
| Net realized and unrealized gain (loss) | | 2.42 | | (5.90) | | 9.22 | | 5.59 | | 6.18 | | (5.28) |
| Total from investment operations | | 2.49 | | (5.78) | | 9.33 | | 5.66 | | 6.37 | | (5.15) |
| Distributions from net investment income | | - | | (.08) C | | (.16) | | (.12) | | (.21) | | (.15) |
| Distributions from net realized gain | | (.08) | | (2.33) C | | (7.07) | | - | | (3.63) | | (3.27) |
| Total distributions | | (.08) | | (2.41) | | (7.23) | | (.12) | | (3.84) | | (3.42) |
| Net asset value, end of period | $ | 33.61 | $ | 31.20 | $ | 39.39 | $ | 37.29 | $ | 31.75 | $ | 29.22 |
Total Return D,E,F | | 7.97% | | (14.97)% | | 25.31% | | 17.87% | | 23.17% | | (14.77)% |
Ratios to Average Net Assets B,G,H | | | | | | | | | | | | |
| Expenses before reductions | | .86% I | | .86% | | .86% | | .87% | | .87% | | .87% |
| Expenses net of fee waivers, if any | | .85% I | | .85% | | .85% | | .87% | | .87% | | .87% |
| Expenses net of all reductions | | .85% I | | .85% | | .85% | | .87% | | .86% | | .87% |
| Net investment income (loss) | | .43% I | | .35% | | .27% | | .23% | | .63% | | .37% |
| Supplemental Data | | | | | | | | | | | | |
| Net assets, end of period (000 omitted) | $ | 4,030,139 | $ | 3,776,819 | $ | 4,970,428 | $ | 4,807,908 | $ | 5,282,468 | $ | 4,526,446 |
Portfolio turnover rate J | | 41% I | | 31% | | 37% K | | 44% | | 34% | | 47% |
A Calculated based on average shares outstanding during the period.
B Net investment income (loss) is affected by the timing of the declaration of dividends by any underlying mutual funds or exchange-traded funds (ETFs). Net investment income (loss) of any mutual funds or ETFs is not included in the Fund's net investment income (loss) ratio.
C The amount shown reflects reclassifications related to book to tax differences that were made in the year shown.
D Total returns for periods of less than one year are not annualized.
E Total returns do not reflect charges attributable to your insurance company's separate account. Inclusion of these charges would reduce the total returns shown.
F Total returns would have been lower if certain expenses had not been reduced during the applicable periods shown.
G Fees and expenses of any underlying mutual funds or exchange-traded funds (ETFs) are not included in the Fund's expense ratio. The Fund indirectly bears its proportionate share of these expenses. For additional expense information related to investments in Fidelity Central Funds, please refer to the "Investments in Fidelity Central Funds" note found in the Notes to Financial Statements section of the most recent Annual or Semi-Annual report.
H Expense ratios reflect operating expenses of the class. Expenses before reductions do not reflect amounts reimbursed, waived, or reduced through arrangements with the investment adviser, brokerage services, or other offset arrangements, if applicable, and do not represent the amount paid by the class during periods when reimbursements, waivers or reductions occur.
I Annualized.
J Amount does not include the portfolio activity of any underlying mutual funds or exchange-traded funds (ETFs).
K Portfolio turnover rate excludes securities received or delivered in-kind.
| VIP Mid Cap Portfolio Investor Class |
| |
| | Six months ended (Unaudited) June 30, 2023 | | Years ended December 31, 2022 | | 2021 | | 2020 | | 2019 | | 2018 |
Selected Per-Share Data | | | | | | | | | | | | |
| Net asset value, beginning of period | $ | 32.42 | $ | 40.83 | $ | 38.44 | $ | 32.72 | $ | 30.01 | $ | 38.72 |
| Income from Investment Operations | | | | | | | | | | | | |
Net investment income (loss) A,B | | .10 | | .18 | | .20 | | .12 | | .25 | | .20 |
| Net realized and unrealized gain (loss) | | 2.53 | | (6.12) | | 9.51 | | 5.78 | | 6.34 | | (5.43) |
| Total from investment operations | | 2.63 | | (5.94) | | 9.71 | | 5.90 | | 6.59 | | (5.23) |
| Distributions from net investment income | | - | | (.14) C | | (.24) | | (.18) | | (.26) | | (.21) |
| Distributions from net realized gain | | (.08) | | (2.33) C | | (7.07) | | - | | (3.63) | | (3.27) |
| Total distributions | | (.08) | | (2.47) | | (7.32) D | | (.18) | | (3.88) D | | (3.48) |
| Net asset value, end of period | $ | 34.97 | $ | 32.42 | $ | 40.83 | $ | 38.44 | $ | 32.72 | $ | 30.01 |
Total Return E,F,G | | 8.11% | | (14.83)% | | 25.54% | | 18.08% | | 23.35% | | (14.60)% |
Ratios to Average Net Assets B,H,I | | | | | | | | | | | | |
| Expenses before reductions | | .68% J | | .68% | | .68% | | .70% | | .70% | | .70% |
| Expenses net of fee waivers, if any | | .68% J | | .68% | | .68% | | .70% | | .70% | | .70% |
| Expenses net of all reductions | | .68% J | | .68% | | .68% | | .69% | | .69% | | .70% |
| Net investment income (loss) | | .60% J | | .52% | | .44% | | .41% | | .80% | | .54% |
| Supplemental Data | | | | | | | | | | | | |
| Net assets, end of period (000 omitted) | $ | 651,935 | $ | 634,220 | $ | 739,633 | $ | 593,584 | $ | 583,760 | $ | 530,794 |
Portfolio turnover rate K | | 41% J | | 31% | | 37% L | | 44% | | 34% | | 47% |
A Calculated based on average shares outstanding during the period.
B Net investment income (loss) is affected by the timing of the declaration of dividends by any underlying mutual funds or exchange-traded funds (ETFs). Net investment income (loss) of any mutual funds or ETFs is not included in the Fund's net investment income (loss) ratio.
C The amount shown reflects reclassifications related to book to tax differences that were made in the year shown.
D Total distributions per share do not sum due to rounding.
E Total returns for periods of less than one year are not annualized.
F Total returns do not reflect charges attributable to your insurance company's separate account. Inclusion of these charges would reduce the total returns shown.
G Total returns would have been lower if certain expenses had not been reduced during the applicable periods shown.
H Fees and expenses of any underlying mutual funds or exchange-traded funds (ETFs) are not included in the Fund's expense ratio. The Fund indirectly bears its proportionate share of these expenses. For additional expense information related to investments in Fidelity Central Funds, please refer to the "Investments in Fidelity Central Funds" note found in the Notes to Financial Statements section of the most recent Annual or Semi-Annual report.
I Expense ratios reflect operating expenses of the class. Expenses before reductions do not reflect amounts reimbursed, waived, or reduced through arrangements with the investment adviser, brokerage services, or other offset arrangements, if applicable, and do not represent the amount paid by the class during periods when reimbursements, waivers or reductions occur.
J Annualized.
K Amount does not include the portfolio activity of any underlying mutual funds or exchange-traded funds (ETFs).
L Portfolio turnover rate excludes securities received or delivered in-kind.
For the period ended June 30, 2023
1. Organization.
VIP Mid Cap Portfolio (the Fund) is a fund of Variable Insurance Products Fund III (the Trust) and is authorized to issue an unlimited number of shares. The Trust is registered under the Investment Company Act of 1940, as amended (the 1940 Act), as an open-end management investment company organized as a Massachusetts business trust. Shares of the Fund may only be purchased by insurance companies for the purpose of funding variable annuity or variable life insurance contracts. The Fund offers the following classes of shares: Initial Class shares, Service Class shares, Service Class 2 shares and Investor Class shares. All classes have equal rights and voting privileges, except for matters affecting a single class.
2. Investments in Fidelity Central Funds.
Funds may invest in Fidelity Central Funds, which are open-end investment companies generally available only to other investment companies and accounts managed by the investment adviser and its affiliates. The Schedule of Investments lists any Fidelity Central Funds held as an investment as of period end, but does not include the underlying holdings of each Fidelity Central Fund. An investing fund indirectly bears its proportionate share of the expenses of the underlying Fidelity Central Funds.
Based on its investment objective, each Fidelity Central Fund may invest or participate in various investment vehicles or strategies that are similar to those of the investing fund. These strategies are consistent with the investment objectives of the investing fund and may involve certain economic risks which may cause a decline in value of each of the Fidelity Central Funds and thus a decline in the value of the investing fund.
| Fidelity Central Fund | Investment Manager | Investment Objective | Investment Practices | Expense Ratio A |
| Fidelity Money Market Central Funds | Fidelity Management & Research Company LLC (FMR) | Each fund seeks to obtain a high level of current income consistent with the preservation of capital and liquidity. | Short-term Investments | Less than .005% |
A Expenses expressed as a percentage of average net assets and are as of each underlying Central Fund's most recent annual or semi-annual shareholder report.
A complete unaudited list of holdings for each Fidelity Central Fund is available upon request or at the Securities and Exchange Commission website at www.sec.gov. In addition, the financial statements of the Fidelity Central Funds which contain the significant accounting policies (including investment valuation policies) of those funds, and are not covered by the Report of Independent Registered Public Accounting Firm, are available on the Securities and Exchange Commission website or upon request.
3. Significant Accounting Policies.
The Fund is an investment company and applies the accounting and reporting guidance of the Financial Accounting Standards Board (FASB) Accounting Standards Codification Topic 946 Financial Services - Investment Companies . The financial statements have been prepared in conformity with accounting principles generally accepted in the United States of America (GAAP), which require management to make certain estimates and assumptions at the date of the financial statements. Actual results could differ from those estimates. Subsequent events, if any, through the date that the financial statements were issued have been evaluated in the preparation of the financial statements. The Fund's Schedule of Investments lists any underlying mutual funds or exchange-traded funds (ETFs) but does not include the underlying holdings of these funds. The following summarizes the significant accounting policies of the Fund:
Investment Valuation. Investments are valued as of 4:00 p.m. Eastern time on the last calendar day of the period. The Board of Trustees (the Board) has designated the Fund's investment adviser as the valuation designee responsible for the fair valuation function and performing fair value determinations as needed. The investment adviser has established a Fair Value Committee (the Committee) to carry out the day-to-day fair valuation responsibilities and has adopted policies and procedures to govern the fair valuation process and the activities of the Committee. In accordance with these fair valuation policies and procedures, which have been approved by the Board, the Fund attempts to obtain prices from one or more third party pricing services or brokers to value its investments. When current market prices, quotations or currency exchange rates are not readily available or reliable, investments will be fair valued in good faith by the Committee, in accordance with the policies and procedures. Factors used in determining fair value vary by investment type and may include market or investment specific events, transaction data, estimated cash flows, and market observations of comparable investments. The frequency that the fair valuation procedures are used cannot be predicted and they may be utilized to a significant extent. The Committee manages the Fund's fair valuation practices and maintains the fair valuation policies and procedures. The Fund's investment adviser reports to the Board information regarding the fair valuation process and related material matters.
The Fund categorizes the inputs to valuation techniques used to value its investments into a disclosure hierarchy consisting of three levels as shown below:
Level 1 - unadjusted quoted prices in active markets for identical investments
Level 2 - other significant observable inputs (including quoted prices for similar investments, interest rates, prepayment speeds, etc.)
Level 3 - unobservable inputs (including the Fund's own assumptions based on the best information available)
Valuation techniques used to value the Fund's investments by major category are as follows:
Equity securities, including restricted securities, for which market quotations are readily available, are valued at the last reported sale price or official closing price as reported by a third party pricing service on the primary market or exchange on which they are traded and are categorized as Level 1 in the hierarchy. In the event there were no sales during the day or closing prices are not available, securities are valued at the last quoted bid price or may be valued using the last available price and are generally categorized as Level 2 in the hierarchy. For foreign equity securities, when market or security specific events arise, comparisons to the valuation of American Depositary Receipts (ADRs), futures contracts, ETFs and certain indexes as well as quoted prices for similar securities may be used and would be categorized as Level 2 in the hierarchy. For equity securities, including restricted securities, where observable inputs are limited, assumptions about market activity and risk are used and these securities may be categorized as Level 3 in the hierarchy.
Investments in open-end mutual funds, including the Fidelity Central Funds, are valued at their closing net asset value (NAV) each business day and are categorized as Level 1 in the hierarchy.
Changes in valuation techniques may result in transfers in or out of an assigned level within the disclosure hierarchy. The aggregate value of investments by input level as of June 30, 2023 is included at the end of the Fund's Schedule of Investments.
Foreign Currency. Certain Funds may use foreign currency contracts to facilitate transactions in foreign-denominated securities. Gains and losses from these transactions may arise from changes in the value of the foreign currency or if the counterparties do not perform under the contracts' terms.
Foreign-denominated assets, including investment securities, and liabilities are translated into U.S. dollars at the exchange rates at period end. Purchases and sales of investment securities, income and dividends received, and expenses denominated in foreign currencies are translated into U.S. dollars at the exchange rate in effect on the transaction date.
The effects of exchange rate fluctuations on investments are included with the net realized and unrealized gain (loss) on investment securities. Other foreign currency transactions resulting in realized and unrealized gain (loss) are disclosed separately.
Investment Transactions and Income. For financial reporting purposes, the Fund's investment holdings and NAV include trades executed through the end of the last business day of the period. The NAV per share for processing shareholder transactions is calculated as of the close of business of the New York Stock Exchange (NYSE), normally 4:00 p.m. Eastern time and includes trades executed through the end of the prior business day. Gains and losses on securities sold are determined on the basis of identified cost and include proceeds received from litigation. Commissions paid to certain brokers with whom the investment adviser, or its affiliates, places trades on behalf of a fund include an amount in addition to trade execution, which may be rebated back to a fund. Any such rebates are included in net realized gain (loss) on investments in the Statement of Operations. Dividend income is recorded on the ex-dividend date, except for certain dividends from foreign securities where the ex-dividend date may have passed, which are recorded as soon as the Fund is informed of the ex-dividend date. Non-cash dividends included in dividend income, if any, are recorded at the fair market value of the securities received. Income and capital gain distributions from Fidelity Central Funds, if any, are recorded on the ex-dividend date. Certain distributions received by the Fund represent a return of capital or capital gain. The Fund determines the components of these distributions subsequent to the ex-dividend date, based upon receipt of tax filings or other correspondence relating to the underlying investment. These distributions are recorded as a reduction of cost of investments and/or as a realized gain. Investment income is recorded net of foreign taxes withheld where recovery of such taxes is uncertain. Funds may file withholding tax reclaims in certain jurisdictions to recover a portion of amounts previously withheld. Any withholding tax reclaims income is included in the Statement of Operations in dividends. Any receivables for withholding tax reclaims are included in the Statement of Assets and Liabilities in dividends receivable.
Class Allocations and Expenses. Investment income, realized and unrealized capital gains and losses, common expenses of a fund, and certain fund-level expense reductions, if any, are allocated daily on a pro-rata basis to each class based on the relative net assets of each class to the total net assets of a fund. Each class differs with respect to transfer agent and distribution and service plan fees incurred, as applicable. Certain expense reductions may also differ by class, if applicable. For the reporting period, the allocated portion of income and expenses to each class as a percent of its average net assets may vary due to the timing of recording these transactions in relation to fluctuating net assets of the classes. Expenses directly attributable to a fund are charged to that fund. Expenses attributable to more than one fund are allocated among the respective funds on the basis of relative net assets or other appropriate methods. Expenses included in the accompanying financial statements reflect the expenses of that fund and do not include any expenses associated with any underlying mutual funds or exchange-traded funds (ETFs). Although not included in a fund's expenses, a fund indirectly bears its proportionate share of these expenses through the net asset value of each underlying mutual fund or exchange-traded fund (ETF). Expense estimates are accrued in the period to which they relate and adjustments are made when actual amounts are known.
Deferred Trustee Compensation. Under a Deferred Compensation Plan (the Plan) for certain Funds, certain independent Trustees have elected to defer receipt of a portion of their annual compensation. Deferred amounts are invested in affiliated mutual funds, are marked-to-market and remain in a fund until distributed in accordance with the Plan. The investment of deferred amounts and the offsetting payable to the Trustees presented below are included in the accompanying Statement of Assets and Liabilities in other receivables and other payables and accrued expenses, as applicable.
| VIP Mid Cap Portfolio | $64,214 |
Income Tax Information and Distributions to Shareholders. Each year, the Fund intends to qualify as a regulated investment company under Subchapter M of the Internal Revenue Code, including distributing substantially all of its taxable income and realized gains. As a result, no provision for U.S. Federal income taxes is required. The Fund files a U.S. federal tax return, in addition to state and local tax returns as required. The Fund's federal income tax returns are subject to examination by the Internal Revenue Service (IRS) for a period of three fiscal years after they are filed. State and local tax returns may be subject to examination for an additional fiscal year depending on the jurisdiction. Foreign taxes are provided for based on the Fund's understanding of the tax rules and rates that exist in the foreign markets in which it invests.
Distributions are declared and recorded on the ex-dividend date. Income and capital gain distributions are declared separately for each class. Income and capital gain distributions are determined in accordance with income tax regulations, which may differ from GAAP.
Capital accounts within the financial statements are adjusted for permanent book-tax differences. These adjustments have no impact on net assets or the results of operations. Capital accounts are not adjusted for temporary book-tax differences which will reverse in a subsequent period.
Book-tax differences are primarily due to foreign currency transactions, passive foreign investment companies (PFIC), partnerships, losses deferred due to wash sales and excise tax regulations.
As of period end, the cost and unrealized appreciation (depreciation) in securities, and derivatives if applicable, for federal income tax purposes were as follows:
| Gross unrealized appreciation | $2,018,681,647 |
| Gross unrealized depreciation | (332,984,075) |
| Net unrealized appreciation (depreciation) | $1,685,697,572 |
| Tax cost | $5,498,276,684 |
The Fund elected to defer to its next fiscal year approximately $2,350,503 of capital losses recognized during the period November 1, 2022 to December 31, 2022.
Restricted Securities (including Private Placements). Funds may invest in securities that are subject to legal or contractual restrictions on resale. These securities generally may be resold in transactions exempt from registration or to the public if the securities are registered. Disposal of these securities may involve time-consuming negotiations and expense, and prompt sale at an acceptable price may be difficult. Information regarding restricted securities held at period end is included at the end of the Schedule of Investments, if applicable.
4. Purchases and Sales of Investments.
Purchases and sales of securities, other than short-term securities and in-kind transactions, as applicable, are noted in the table below.
| | Purchases ($) | Sales ($) |
| VIP Mid Cap Portfolio | 1,363,055,578 | 1,449,109,896 |
5. Fees and Other Transactions with Affiliates.
Management Fee. Fidelity Management & Research Company LLC (the investment adviser) and its affiliates provide the Fund with investment management related services for which the Fund pays a monthly management fee. The management fee is the sum of an individual fund fee rate that is based on an annual rate of .30% of the Fund's average net assets and an annualized group fee rate that averaged .23% during the period. The group fee rate is based upon the monthly average net assets of a group of registered investment companies with which the investment adviser has management contracts. The group fee rate decreases as assets under management increase and increases as assets under management decrease. For the reporting period, the total annualized management fee rate was .53% of the Fund's average net assets.
Distribution and Service Plan Fees. In accordance with Rule 12b-1 of the 1940 Act, the Fund has adopted separate 12b-1 Plans for each Service Class of shares. Each Service Class pays Fidelity Distributors Company LLC (FDC), an affiliate of the investment adviser, a service fee. For the period, the service fee is based on an annual rate of .10% of Service Class' average net assets and .25% of Service Class 2's average net assets.
For the period, total fees, all of which were re-allowed to insurance companies for the distribution of shares and providing shareholder support services, were as follows:
| Service Class | $304,135 |
| Service Class 2 | 4,874,400 |
| | $5,178,535 |
Transfer Agent Fees. Fidelity Investments Institutional Operations Company LLC (FIIOC), an affiliate of the investment adviser, is the Fund's transfer, dividend disbursing, and shareholder servicing agent. FIIOC receives an asset-based fee with respect to each class. Each class pays a fee for transfer agent services, typesetting and printing and mailing of shareholder reports, excluding mailing of proxy statements. For the period, transfer agent fees for each class were as follows:
| | Amount | % of Class-Level Average Net Assets A |
| Initial Class | $465,308 | .06 |
| Service Class | 191,605 | .06 |
| Service Class 2 | 1,228,349 | .06 |
| Investor Class | 457,346 | .14 |
| | $2,342,608 | |
A Annualized
Accounting Fees. Fidelity Service Company, Inc. (FSC), an affiliate of the investment adviser, maintains the Fund's accounting records. The accounting fee is based on the level of average net assets for each month. For the period, the fees were equivalent to the following annualized rates:
| | % of Average Net Assets |
| VIP Mid Cap Portfolio | .02 |
Brokerage Commissions. A portion of portfolio transactions were placed with brokerage firms which are affiliates of the investment adviser. Brokerage commissions are included in net realized gain (loss) and change in net unrealized appreciation (depreciation) in the Statement of Operations. The commissions paid to these affiliated firms were as follows:
| | Amount |
| VIP Mid Cap Portfolio | $37,104 |
Interfund Trades. Funds may purchase from or sell securities to other Fidelity Funds under procedures adopted by the Board. The procedures have been designed to ensure these interfund trades are executed in accordance with Rule 17a-7 of the 1940 Act. Any interfund trades are included within the respective purchases and sales amounts shown in the Purchases and Sales of Investments note. Interfund trades during the period are noted in the table below.
| | Purchases ($) | Sales ($) | Realized Gain (Loss) ($) |
| VIP Mid Cap Portfolio | 50,739,954 | 94,570,574 | 18,161,234 |
6. Committed Line of Credit.
Certain Funds participate with other funds managed by the investment adviser or an affiliate in a $4.25 billion credit facility (the "line of credit") to be utilized for temporary or emergency purposes to fund shareholder redemptions or for other short-term liquidity purposes. The participating funds have agreed to pay commitment fees on their pro-rata portion of the line of credit, which are reflected in Miscellaneous expenses on the Statement of Operations, and are listed below. During the period, there were no borrowings on this line of credit.
| | Amount |
| VIP Mid Cap Portfolio | $6,564 |
7. Security Lending.
Funds lend portfolio securities from time to time in order to earn additional income. Lending agents are used, including National Financial Services (NFS), an affiliate of the investment adviser. Pursuant to a securities lending agreement, NFS will receive a fee, which is capped at 9.9% of a fund's daily lending revenue, for its services as lending agent. A fund may lend securities to certain qualified borrowers, including NFS. On the settlement date of the loan, a fund receives collateral (in the form of U.S. Treasury obligations, letters of credit and/or cash) against the loaned securities and maintains collateral in an amount not less than 100% of the market value of the loaned securities during the period of the loan. The market value of the loaned securities is determined at the close of business of a fund and any additional required collateral is delivered to a fund on the next business day. A fund or borrower may terminate the loan at any time, and if the borrower defaults on its obligation to return the securities loaned because of insolvency or other reasons, a fund may apply collateral received from the borrower against the obligation. A fund may experience delays and costs in recovering the securities loaned. Any cash collateral received is invested in the Fidelity Securities Lending Cash Central Fund. Any loaned securities are identified as such in the Schedule of Investments, and the value of loaned securities and cash collateral at period end, as applicable, are presented in the Statement of Assets and Liabilities. Security lending income represents the income earned on investing cash collateral, less rebates paid to borrowers and any lending agent fees associated with the loan, plus any premium payments received for lending certain types of securities. Security lending income is presented in the Statement of Operations as a component of income from Fidelity Central Funds. Affiliated security lending activity, if any, was as follows:
| | Total Security Lending Fees Paid to NFS | Security Lending Income From Securities Loaned to NFS | Value of Securities Loaned to NFS at Period End |
| VIP Mid Cap Portfolio | $102,211 | $- | $- |
8. Expense Reductions.
Through arrangements with the Fund's custodian, credits realized as a result of certain uninvested cash balances were used to reduce the Fund's expenses. During the period, custodian credits reduced the Fund's expenses by $5,473.
In addition, during the period the investment adviser or an affiliate reimbursed and/or waived a portion of fund-level operating expenses in the amount of $152,145.
9. Distributions to Shareholders.
Distributions to shareholders of each class were as follows:
| | Six months ended June 30, 2023 | Year ended December 31, 2022 |
| VIP Mid Cap Portfolio | | |
| Distributions to shareholders | | |
| Initial Class | $ 3,475,732 | $107,333,067 |
| Service Class | 1,440,921 | 43,228,209 |
| Service Class 2 | 9,669,572 | 287,207,276 |
| Investor Class | 1,547,911 | 45,819,207 |
Total | $16,134,136 | $483,587,759 |
10. Share Transactions.
Transactions for each class of shares were as follows and may contain in-kind transactions:
| | Shares | Shares | Dollars | Dollars |
| | Six months ended June 30, 2023 | Year ended December 31, 2022 | Six months ended June 30, 2023 | Year ended December 31, 2022 |
| VIP Mid Cap Portfolio | | | | |
| Initial Class | | | | |
| Shares sold | 727,168 | 1,959,807 | $24,567,103 | $68,533,102 |
| Reinvestment of distributions | 96,871 | 3,075,073 | 3,475,732 | 107,333,067 |
| Shares redeemed | (2,568,232) | (4,527,612) | (87,393,264) | (158,853,983) |
| Net increase (decrease) | (1,744,193) | 507,268 | $(59,350,429) | $17,012,186 |
| Service Class | | | | |
| Shares sold | 598,658 | 1,591,303 | $19,800,817 | $56,040,722 |
| Reinvestment of distributions | 40,739 | 1,255,402 | 1,440,921 | 43,228,209 |
| Shares redeemed | (696,821) | (2,517,964) | (23,326,509) | (87,089,991) |
| Net increase (decrease) | (57,424) | 328,741 | $(2,084,771) | $12,178,940 |
| Service Class 2 | | | | |
| Shares sold | 9,401,682 | 6,492,926 | $305,451,230 | $219,838,257 |
| Reinvestment of distributions | 282,736 | 8,605,525 | 9,669,572 | 287,207,276 |
| Shares redeemed | (10,852,276) | (20,223,486) | (346,163,917) | (684,617,429) |
| Net increase (decrease) | (1,167,858) | (5,125,035) | $(31,043,115) | $(177,571,896) |
| Investor Class | | | | |
| Shares sold | 439,479 | 1,426,971 | $14,922,467 | $48,048,062 |
| Reinvestment of distributions | 43,542 | 1,325,820 | 1,547,911 | 45,819,207 |
| Shares redeemed | (1,400,212) | (1,305,948) | (47,325,093) | (45,142,184) |
| Net increase (decrease) | (917,191) | 1,446,843 | $(30,854,715) | $48,725,085 |
11. Other.
A fund's organizational documents provide former and current trustees and officers with a limited indemnification against liabilities arising in connection with the performance of their duties to the fund. In the normal course of business, a fund may also enter into contracts that provide general indemnifications. A fund's maximum exposure under these arrangements is unknown as this would be dependent on future claims that may be made against a fund. The risk of material loss from such claims is considered remote.
At the end of the period, the investment adviser or its affiliates were owners of record of more than 10% and certain otherwise unaffiliated shareholders were owners of record of more than 10% of the outstanding shares as follows:
| Fund | Affiliated % | Number ofUnaffiliated Shareholders | Unaffiliated Shareholders % |
| VIP Mid Cap Portfolio | 13% | 1 | 13% |
12. Risk and Uncertainties.
Many factors affect a fund's performance. Developments that disrupt global economies and financial markets, such as pandemics, epidemics, outbreaks of infectious diseases, war, terrorism, and environmental disasters, may significantly affect a fund's investment performance. The effects of these developments to a fund will be impacted by the types of securities in which a fund invests, the financial condition, industry, economic sector, and geographic location of an issuer, and a fund's level of investment in the securities of that issuer. Significant concentrations in security types, issuers, industries, sectors, and geographic locations may magnify the factors that affect a fund's performance.
As a shareholder, you incur two types of costs: (1) transaction costs, which may include sales charges (loads) on purchase payments or redemption proceeds, as applicable and (2) ongoing costs, which generally include management fees, distribution and/or service (12b-1) fees and other Fund expenses. This Example is intended to help you understand your ongoing costs (in dollars) of investing in a fund and to compare these costs with the ongoing costs of investing in other mutual funds.
| The Example is based on an investment of $1,000 invested at the beginning of the period and held for the entire period (January 1, 2023 to June 30, 2023). |
Actual Expenses
The first line of the accompanying table provides information about actual account values and actual expenses. You may use the information in this line, together with the amount you invested, to estimate the expenses that you paid over the period. Simply divide your account value by $1,000.00 (for example, an $8,600 account value divided by $1,000.00 = 8.6), then multiply the result by the number in the first line for a class/Fund under the heading entitled "Expenses Paid During Period" to estimate the expenses you paid on your account during this period. If any fund is a shareholder of any underlying mutual funds or exchange-traded funds (ETFs) (the Underlying Funds), such fund indirectly bears its proportional share of the expenses of the Underlying Funds in addition to the direct expenses incurred presented in the table. These fees and expenses are not included in the annualized expense ratio used to calculate the expense estimate in the table below. The estimate of expenses does not include any fees or other expenses of any variable annuity or variable life insurance product. If they were, the estimate of expenses you paid during the period would be higher, and your ending account value would be lower.
Hypothetical Example for Comparison Purposes
The second line of the accompanying table provides information about hypothetical account values and hypothetical expenses based on the actual expense ratio and an assumed rate of return of 5% per year before expenses, which is not the actual return. The hypothetical account values and expenses may not be used to estimate the actual ending account balance or expenses you paid for the period. You may use this information to compare the ongoing costs of investing in the Fund and other funds. To do so, compare this 5% hypothetical example with the 5% hypothetical examples that appear in the shareholder reports of the other funds. If any fund is a shareholder of any Underlying Funds, such fund indirectly bears its proportional share of the expenses of the Underlying Funds in addition to the direct expenses as presented in the table. These fees and expenses are not included in the annualized expense ratio used to calculate the expense estimate in the table below. The estimate of expenses does not include any fees or other expenses of any variable annuity or variable life insurance product. If they were, the estimate of expenses you paid during the period would be higher, and your ending account value would be lower.
Please note that the expenses shown in the table are meant to highlight your ongoing costs only and do not reflect any transaction costs. Therefore, the second line of the table is useful in comparing ongoing costs only, and will not help you determine the relative total costs of owning different funds. In addition, if these transactional costs were included, your costs would have been higher.
| | | | | Annualized Expense Ratio- A | | Beginning Account Value January 1, 2023 | | Ending Account Value June 30, 2023 | | Expenses Paid During Period- C January 1, 2023 to June 30, 2023 |
| VIP Mid Cap Portfolio | | | | | | | | | | |
| Initial Class | | | | .60% | | | | | | |
| Actual | | | | | | $ 1,000 | | $ 1,081.20 | | $ 3.10 |
Hypothetical- B | | | | | | $ 1,000 | | $ 1,021.82 | | $ 3.01 |
| Service Class | | | | .70% | | | | | | |
| Actual | | | | | | $ 1,000 | | $ 1,080.90 | | $ 3.61 |
Hypothetical- B | | | | | | $ 1,000 | | $ 1,021.32 | | $ 3.51 |
| Service Class 2 | | | | .85% | | | | | | |
| Actual | | | | | | $ 1,000 | | $ 1,079.70 | | $ 4.38 |
Hypothetical- B | | | | | | $ 1,000 | | $ 1,020.58 | | $ 4.26 |
| Investor Class | | | | .68% | | | | | | |
| Actual | | | | | | $ 1,000 | | $ 1,081.10 | | $ 3.51 |
Hypothetical- B | | | | | | $ 1,000 | | $ 1,021.42 | | $ 3.41 |
| |
A Annualized expense ratio reflects expenses net of applicable fee waivers.
B 5% return per year before expenses
C Expenses are equal to the annualized expense ratio, multiplied by the average account value over the period, multiplied by 181/ 365 (to reflect the one-half year period). The fees and expenses of any Underlying Funds are not included in each annualized expense ratio.
Board Approval of Investment Advisory Contracts
VIP Mid Cap Portfolio
At its May 2023 meeting, the Board of Trustees, including the Independent Trustees (together, the Board), voted to continue the management contract with Fidelity Management & Research Company LLC (FMR), and the sub-advisory agreements and sub-subadvisory agreements, in each case, where applicable (together, the Advisory Contracts) for the fund for two months from June 1, 2023 through July 31, 2023. The Board determined that it will consider the annual renewal of the fund's Advisory Contracts for a full one year period in July 2023, following its review of additional materials provided by FMR.
The Board considered that the approval of the fund's Advisory Contracts will not result in any changes in (i) the investment process or strategies employed in the management of the fund's assets; (ii) the fees and expenses paid by shareholders; (iii) the nature, extent or quality of services provided under the fund's Advisory Contracts; or (iv) the day-to-day management of the fund or the persons primarily responsible for such management. The Board also considered that since its last approval of the fund's Advisory Contracts, FMR had provided additional information on the fund in support of the annual contract renewal process, including competitive analyses on total expenses and management fees and in-depth reviews of fund performance and fund profitability information. The Board concluded that the fund's Advisory Contracts are fair and reasonable, and that the fund's Advisory Contracts should be renewed, without modification, through July 31, 2023, with the understanding that the Board will consider the annual renewal for a full one year period in July 2023.
In connection with its consideration of future renewals of the fund's Advisory Contracts, the Board will consider: (i) the nature, extent and quality of services provided to the fund, including shareholder and administrative services and investment performance; (ii) the competitiveness of the management fee and total expenses for the fund; (iii) the costs of the services and profitability, including the revenues earned and the expenses incurred in conducting the business of developing, marketing, distributing, managing, administering, and servicing the fund and its shareholders, to the extent applicable; and (iv) whether there have been economies of scale in respect of the Fidelity funds, whether the Fidelity funds (including the fund) have appropriately benefited from any such economies of scale, and whether there is the potential for realization of any further economies.
Based on its evaluation of all of the conclusions noted above, and after considering all factors it believed relevant, the Board ultimately concluded that the fund's management fee structure is fair and reasonable, and that the continuation of the fund's Advisory Contracts should be approved for two months from June 1, 2023 through July 31, 2023.
The Securities and Exchange Commission adopted Rule 22e-4 under the Investment Company Act of 1940 (the Liquidity Rule) to promote effective liquidity risk management throughout the open-end investment company industry, thereby reducing the risk that funds will be unable to meet their redemption obligations and mitigating dilution of the interests of fund shareholders.
The Fund has adopted and implemented a liquidity risk management program (the Program) reasonably designed to assess and manage the Fund's liquidity risk and to comply with the requirements of the Liquidity Rule. The Fund's Board of Trustees (the Board) has designated the Fund's investment adviser as administrator of the Program. The Fidelity advisers have established a Liquidity Risk Management Committee (the LRM Committee) to manage the Program for each of the Fidelity Funds. The LRM Committee monitors the adequacy and effectiveness of implementation of the Program and on a periodic basis assesses each Fund's liquidity risk based on a variety of factors including (1) the Fund's investment strategy, (2) portfolio liquidity and cash flow projections during normal and reasonably foreseeable stressed conditions, (3) shareholder redemptions, (4) borrowings and other funding sources and (5) certain factors specific to ETFs including the effect of the Fund's prices and spreads, market participants, and basket compositions on the overall liquidity of the Fund's portfolio, as applicable.
In accordance with the Program, each of the Fund's portfolio investments is classified into one of four defined liquidity categories based on a determination of a reasonable expectation for how long it would take to convert the investment to cash (or sell or dispose of the investment) without significantly changing its market value.
- Highly liquid investments - cash or convertible to cash within three business days or less
- Moderately liquid investments - convertible to cash in three to seven calendar days
- Less liquid investments - can be sold or disposed of, but not settled, within seven calendar days
- Illiquid investments - cannot be sold or disposed of within seven calendar days
Liquidity classification determinations take into account a variety of factors including various market, trading and investment-specific considerations, as well as market depth, and generally utilize analysis from a third-party liquidity metrics service.
The Liquidity Rule places a 15% limit on a fund's illiquid investments and requires funds that do not primarily hold assets that are highly liquid investments to determine and maintain a minimum percentage of the fund's net assets to be invested in highly liquid investments (highly liquid investment minimum or HLIM). The Program includes provisions reasonably designed to comply with the 15% limit on illiquid investments and for determining, periodically reviewing and complying with the HLIM requirement as applicable.
At a recent meeting of the Fund's Board of Trustees, the LRM Committee provided a written report to the Board pertaining to the operation, adequacy, and effectiveness of the Program for the period December 1, 2021 through November 30, 2022. The report concluded that the Program is operating effectively and is reasonably designed to assess and manage the Fund's liquidity risk.
1.723369.124
VIPMID-SANN-0823
Fidelity® Variable Insurance Products:
VIP Balanced Portfolio
Semi-Annual Report
June 30, 2023
Contents
To view a fund's proxy voting guidelines and proxy voting record for the 12-month period ended June 30, visit http://www.fidelity.com/proxyvotingresults or visit the Securities and Exchange Commission's (SEC) web site at http://www.sec.gov.
You may also call 1-877-208-0098 to request a free copy of the proxy voting guidelines.
Fidelity® Variable Insurance Products are separate account options which are purchased through a variable insurance contract.
Standard & Poor's, S&P and S&P 500 are registered service marks of The McGraw-Hill Companies, Inc. and have been licensed for use by Fidelity Distributors Corporation.
Other third-party marks appearing herein are the property of their respective owners.
All other marks appearing herein are registered or unregistered trademarks or service marks of FMR LLC or an affiliated company. © 2023 FMR LLC. All rights reserved.
This report and the financial statements contained herein are submitted for the general information of the shareholders of the Fund. This report is not authorized for distribution to prospective investors in the Fund unless preceded or accompanied by an effective prospectus.
A fund files its complete schedule of portfolio holdings with the SEC for the first and third quarters of each fiscal year on Form N-PORT. Forms N-PORT are available on the SEC's web site at http://www.sec.gov. A fund's Forms N-PORT may be reviewed and copied at the SEC's Public Reference Room in Washington, DC. Information regarding the operation of the SEC's Public Reference Room may be obtained by calling 1-800-SEC-0330.
For a complete list of a fund's portfolio holdings, view the most recent holdings listing, semiannual report, or annual report on Fidelity's web site at http://www.fidelity.com, http://www.institutional.fidelity.com, or http://www.401k.com, as applicable.
NOT FDIC INSURED •MAY LOSE VALUE •NO BANK GUARANTEE
Neither the Fund nor Fidelity Distributors Corporation is a bank.
This report and the financial statements contained herein are submitted for the general information of the shareholders of the Fund. This report is not authorized for distribution to prospective investors in the Fund unless preceded or accompanied by an effective prospectus.
A fund files its complete schedule of portfolio holdings with the SEC for the first and third quarters of each fiscal year on Form N-PORT. Forms N-PORT are available on the SEC's web site at http://www.sec.gov. A fund's Forms N-PORT may be reviewed and copied at the SEC's Public Reference Room in Washington, DC. Information regarding the operation of the SEC's Public Reference Room may be obtained by calling 1-800-SEC-0330.
For a complete list of a fund's portfolio holdings, view the most recent holdings listing, semiannual report, or annual report on Fidelity's web site at http://www.fidelity.com, http://www.institutional.fidelity.com, or http://www.401k.com, as applicable.
NOT FDIC INSURED •MAY LOSE VALUE •NO BANK GUARANTEE
Neither the Fund nor Fidelity Distributors Corporation is a bank.
The information in the following tables is based on the combined Investments of the Fund and its pro-rata share of investments in Fidelity's Central Funds, other than the Money Market Central Funds.
Top Holdings (% of Fund's net assets) |
| |
| Microsoft Corp. | 5.1 | |
| Apple, Inc. | 4.1 | |
| Amazon.com, Inc. | 2.3 | |
| NVIDIA Corp. | 2.0 | |
| Alphabet, Inc. Class A | 1.5 | |
| Meta Platforms, Inc. Class A | 1.4 | |
| Exxon Mobil Corp. | 1.2 | |
| UnitedHealth Group, Inc. | 1.1 | |
| Tesla, Inc. | 1.0 | |
| Eli Lilly & Co. | 1.0 | |
| | 20.7 | |
| |
| Top Bond Issuers (% of Fund's net assets) |
(with maturities greater than one year) |
| U.S. Treasury Obligations | 15.5 | |
| Uniform Mortgage Backed Securities | 2.3 | |
| Fannie Mae | 2.0 | |
| Freddie Mac | 1.7 | |
| Ginnie Mae | 1.2 | |
| JPMorgan Chase & Co. | 0.7 | |
| Bank of America Corp. | 0.5 | |
| Morgan Stanley | 0.5 | |
| Citigroup, Inc. | 0.5 | |
| Petroleos Mexicanos | 0.3 | |
| | 25.2 | |
| |
| Market Sectors (% of Fund's net assets) |
| |
| Information Technology | 17.4 | |
| Financials | 12.9 | |
| Health Care | 9.1 | |
| Consumer Discretionary | 6.8 | |
| Communication Services | 6.6 | |
| Industrials | 5.8 | |
| Consumer Staples | 5.3 | |
| Energy | 3.7 | |
| Real Estate | 2.4 | |
| Utilities | 2.1 | |
| Materials | 1.6 | |
| |
Quality Diversification (% of Fund's net assets) |
|
| |
| We have used ratings from Moody's Investors Service, Inc. Where Moody's® ratings are not available, we have used S&P® ratings. All ratings are as of the date indicated and do not reflect subsequent changes. |
Asset Allocation (% of Fund's net assets) |
|
Short-Term Investments and Net Other Assets (Liabilities) - (1.7)% |
Futures - 0.8% |
|
Percentages in the above tables are adjusted for the effect of TBA Sale Commitments.
Percentages in the above tables are adjusted for the effect of futures contracts and swaps, if applicable.
An unaudited holdings listing for the fund, which presents direct holdings as well as the pro-rata share of any securities and other investments held indirectly through its investment in underlying Fidelity Central Funds, other than the Money Market Central Funds, is available at fidelity.com and/or institutional.fidelity.com, as applicable.
Showing Percentage of Net Assets
| Common Stocks - 63.4% |
| | | Shares | Value ($) |
| COMMUNICATION SERVICES - 5.6% | | | |
| Diversified Telecommunication Services - 0.1% | | | |
| AT&T, Inc. | | 22,400 | 357,280 |
| Cellnex Telecom SA (a) | | 53,300 | 2,151,374 |
| Liberty Global PLC Class C (b) | | 102,263 | 1,817,214 |
| | | | 4,325,868 |
| Entertainment - 1.1% | | | |
| Activision Blizzard, Inc. | | 150,775 | 12,710,333 |
| Cinemark Holdings, Inc. (b)(c) | | 120,082 | 1,981,353 |
| Netflix, Inc. (b) | | 69,458 | 30,595,554 |
| Sea Ltd. ADR (b) | | 112,900 | 6,552,716 |
| Take-Two Interactive Software, Inc. (b) | | 43,418 | 6,389,393 |
| The Walt Disney Co. (b) | | 134,932 | 12,046,729 |
| World Wrestling Entertainment, Inc. Class A (c) | | 32,194 | 3,492,083 |
| | | | 73,768,161 |
| Interactive Media & Services - 3.7% | | | |
| Alphabet, Inc.: | | | |
| Class A (b) | | 791,860 | 94,785,642 |
| Class C (b) | | 390,640 | 47,255,721 |
| Epic Games, Inc. (b)(d)(e) | | 1,812 | 1,275,576 |
| Meta Platforms, Inc. Class A (b) | | 323,042 | 92,706,593 |
| Pinterest, Inc. Class A (b) | | 68,300 | 1,867,322 |
| Snap, Inc. Class A (b) | | 404,149 | 4,785,124 |
| | | | 242,675,978 |
| Media - 0.5% | | | |
| Altice U.S.A., Inc. Class A (b)(c) | | 147,845 | 446,492 |
| Charter Communications, Inc. Class A (b) | | 16,000 | 5,877,920 |
| Comcast Corp. Class A | | 442,409 | 18,382,094 |
| Liberty Broadband Corp.: | | | |
| Class A (b) | | 55,400 | 4,417,042 |
| Class C (b) | | 49,000 | 3,925,390 |
| | | | 33,048,938 |
| Wireless Telecommunication Services - 0.2% | | | |
| T-Mobile U.S., Inc. (b) | | 110,351 | 15,327,754 |
TOTAL COMMUNICATION SERVICES | | | 369,146,699 |
| CONSUMER DISCRETIONARY - 6.6% | | | |
| Automobile Components - 0.1% | | | |
| Adient PLC (b) | | 107,200 | 4,107,904 |
| Automobiles - 1.1% | | | |
| Ferrari NV | | 19,300 | 6,276,553 |
| Tesla, Inc. (b) | | 259,800 | 68,007,846 |
| | | | 74,284,399 |
| Broadline Retail - 2.5% | | | |
| Amazon.com, Inc. (b) | | 1,158,300 | 150,995,988 |
| eBay, Inc. | | 199,400 | 8,911,186 |
| | | | 159,907,174 |
| Hotels, Restaurants & Leisure - 1.2% | | | |
| Booking Holdings, Inc. (b) | | 6,300 | 17,012,079 |
| Caesars Entertainment, Inc. (b) | | 93,200 | 4,750,404 |
| Churchill Downs, Inc. | | 66,200 | 9,213,054 |
| Domino's Pizza, Inc. | | 16,500 | 5,560,335 |
| Marriott International, Inc. Class A | | 90,400 | 16,605,576 |
| McDonald's Corp. | | 41,800 | 12,473,538 |
| Sweetgreen, Inc. Class A (b) | | 11,200 | 143,584 |
| Yum! Brands, Inc. | | 88,800 | 12,303,240 |
| | | | 78,061,810 |
| Household Durables - 0.1% | | | |
| D.R. Horton, Inc. | | 12,600 | 1,533,294 |
| Mohawk Industries, Inc. (b) | | 29,300 | 3,022,588 |
| | | | 4,555,882 |
| Specialty Retail - 1.3% | | | |
| Cazoo Group Ltd. (b)(d) | | 2,820 | 3,328 |
| Fast Retailing Co. Ltd. | | 13,500 | 3,462,410 |
| Lowe's Companies, Inc. | | 127,200 | 28,709,040 |
| The Home Depot, Inc. | | 58,608 | 18,205,989 |
| TJX Companies, Inc. | | 343,280 | 29,106,711 |
| Valvoline, Inc. | | 148,000 | 5,551,480 |
| | | | 85,038,958 |
| Textiles, Apparel & Luxury Goods - 0.3% | | | |
| LVMH Moet Hennessy Louis Vuitton SE | | 1,900 | 1,791,533 |
| NIKE, Inc. Class B | | 80,030 | 8,832,911 |
| PVH Corp. | | 61,700 | 5,242,649 |
| Tapestry, Inc. | | 148,100 | 6,338,680 |
| | | | 22,205,773 |
TOTAL CONSUMER DISCRETIONARY | | | 428,161,900 |
| CONSUMER STAPLES - 4.6% | | | |
| Beverages - 1.7% | | | |
| Boston Beer Co., Inc. Class A (b) | | 5,700 | 1,758,108 |
| Celsius Holdings, Inc. (b) | | 37,700 | 5,624,463 |
| Constellation Brands, Inc. Class A (sub. vtg.) | | 59,300 | 14,595,509 |
| Duckhorn Portfolio, Inc. (b) | | 83,000 | 1,076,510 |
| Keurig Dr. Pepper, Inc. | | 182,817 | 5,716,688 |
| Molson Coors Beverage Co. Class B | | 40,000 | 2,633,600 |
| Monster Beverage Corp. | | 216,852 | 12,455,979 |
| PepsiCo, Inc. | | 161,500 | 29,913,030 |
| Pernod Ricard SA | | 18,400 | 4,063,803 |
| The Coca-Cola Co. | | 520,900 | 31,368,598 |
| The Vita Coco Co., Inc. (b) | | 52,800 | 1,418,736 |
| | | | 110,625,024 |
| Consumer Staples Distribution & Retail - 1.3% | | | |
| Alimentation Couche-Tard, Inc. Class A (multi-vtg.) | | 80,100 | 4,107,336 |
| Costco Wholesale Corp. | | 56,500 | 30,418,470 |
| Dollar General Corp. | | 18,500 | 3,140,930 |
| Dollar Tree, Inc. (b) | | 70,100 | 10,059,350 |
| U.S. Foods Holding Corp. (b) | | 158,100 | 6,956,400 |
| Walmart, Inc. | | 208,300 | 32,740,594 |
| | | | 87,423,080 |
| Food Products - 0.6% | | | |
| Freshpet, Inc. (b) | | 68,600 | 4,514,566 |
| Lamb Weston Holdings, Inc. | | 31,500 | 3,620,925 |
| McCormick & Co., Inc. (non-vtg.) | | 58,400 | 5,094,232 |
| Mondelez International, Inc. | | 222,200 | 16,207,268 |
| Sovos Brands, Inc. (b) | | 139,600 | 2,730,576 |
| The Hershey Co. | | 28,400 | 7,091,480 |
| TreeHouse Foods, Inc. (b) | | 26,800 | 1,350,184 |
| | | | 40,609,231 |
| Household Products - 0.8% | | | |
| Procter & Gamble Co. | | 330,200 | 50,104,548 |
| Personal Care Products - 0.2% | | | |
| elf Beauty, Inc. (b) | | 10,300 | 1,176,569 |
| Estee Lauder Companies, Inc. Class A | | 42,900 | 8,424,702 |
| Kenvue, Inc. | | 26,200 | 692,204 |
| | | | 10,293,475 |
TOTAL CONSUMER STAPLES | | | 299,055,358 |
| ENERGY - 2.6% | | | |
| Energy Equipment & Services - 0.3% | | | |
| Expro Group Holdings NV (b) | | 239,700 | 4,247,484 |
| Schlumberger Ltd. | | 169,300 | 8,316,016 |
| Weatherford International PLC (b) | | 99,000 | 6,575,580 |
| | | | 19,139,080 |
| Oil, Gas & Consumable Fuels - 2.3% | | | |
| Africa Oil Corp. | | 1,617,347 | 3,442,852 |
| Athabasca Oil Corp. (b) | | 46,500 | 100,740 |
| Canadian Natural Resources Ltd. | | 131,400 | 7,387,561 |
| Eco Atlantic Oil & Gas Ltd. (b) | | 1,232,500 | 209,332 |
| Exxon Mobil Corp. | | 741,200 | 79,493,700 |
| Hess Corp. | | 114,300 | 15,539,085 |
| Imperial Oil Ltd. | | 260,300 | 13,318,086 |
| Kosmos Energy Ltd. (b) | | 655,000 | 3,923,450 |
| MEG Energy Corp. (b) | | 636,500 | 10,089,828 |
| Phillips 66 Co. | | 88,826 | 8,472,224 |
| Valero Energy Corp. | | 92,500 | 10,850,250 |
| | | | 152,827,108 |
TOTAL ENERGY | | | 171,966,188 |
| FINANCIALS - 8.0% | | | |
| Banks - 3.2% | | | |
| AIB Group PLC | | 386,760 | 1,624,825 |
| Bank of America Corp. | | 1,232,152 | 35,350,441 |
| BNP Paribas SA | | 170,709 | 10,772,755 |
| Citigroup, Inc. | | 235,180 | 10,827,687 |
| DNB Bank ASA | | 168,800 | 3,156,680 |
| Eurobank Ergasias Services and Holdings SA (b) | | 3,050,236 | 5,022,582 |
| JPMorgan Chase & Co. | | 402,723 | 58,572,033 |
| KBC Group NV | | 45,400 | 3,166,627 |
| KeyCorp | | 701,900 | 6,485,556 |
| M&T Bank Corp. | | 42,961 | 5,316,853 |
| NatWest Group PLC | | 963,007 | 2,943,423 |
| Piraeus Financial Holdings SA (b) | | 782,863 | 2,567,906 |
| PNC Financial Services Group, Inc. | | 57,700 | 7,267,315 |
| Standard Chartered PLC (United Kingdom) | | 258,600 | 2,243,122 |
| Starling Bank Ltd. Series D (b)(d)(e) | | 756,521 | 2,805,482 |
| Sumitomo Mitsui Financial Group, Inc. | | 94,500 | 4,050,218 |
| U.S. Bancorp | | 109,714 | 3,624,951 |
| UniCredit SpA | | 242,376 | 5,636,109 |
| Wells Fargo & Co. | | 806,792 | 34,433,883 |
| Zions Bancorp NA (c) | | 125,900 | 3,381,674 |
| | | | 209,250,122 |
| Capital Markets - 0.8% | | | |
| Bank of New York Mellon Corp. | | 409,753 | 18,242,204 |
| BlackRock, Inc. Class A | | 5,252 | 3,629,867 |
| Cboe Global Markets, Inc. | | 28,529 | 3,937,287 |
| State Street Corp. | | 197,257 | 14,435,267 |
| StepStone Group, Inc. Class A | | 94,046 | 2,333,281 |
| UBS Group AG | | 349,500 | 7,084,365 |
| Virtu Financial, Inc. Class A | | 125,325 | 2,141,804 |
| | | | 51,804,075 |
| Consumer Finance - 0.1% | | | |
| American Express Co. | | 9,258 | 1,612,744 |
| Capital One Financial Corp. | | 14,775 | 1,615,942 |
| OneMain Holdings, Inc. | | 107,748 | 4,707,510 |
| Shriram Transport Finance Co. Ltd. | | 94,743 | 2,007,898 |
| | | | 9,944,094 |
| Financial Services - 2.0% | | | |
| Ant International Co. Ltd. Class C (b)(d)(e) | | 915,084 | 1,381,777 |
| Apollo Global Management, Inc. | | 171,388 | 13,164,312 |
| Berkshire Hathaway, Inc.: | | | |
| Class A (b) | | 13 | 6,731,530 |
| Class B (b) | | 24,351 | 8,303,691 |
| Block, Inc. Class A (b) | | 138,000 | 9,186,660 |
| Dlocal Ltd. (b) | | 202,200 | 2,467,851 |
| Fiserv, Inc. (b) | | 117,440 | 14,815,056 |
| FleetCor Technologies, Inc. (b) | | 25,800 | 6,477,864 |
| Global Payments, Inc. | | 55,100 | 5,428,452 |
| Jumo World Ltd. (b)(e) | | 176 | 168,106 |
| One97 Communications Ltd. (b) | | 318,100 | 3,371,627 |
| UWM Holdings Corp. Class A (c) | | 116,656 | 653,274 |
| Visa, Inc. Class A | | 208,303 | 49,467,796 |
| Voya Financial, Inc. | | 35,200 | 2,524,192 |
| Worldline SA (a)(b) | | 99,105 | 3,622,803 |
| | | | 127,764,991 |
| Insurance - 1.9% | | | |
| Arthur J. Gallagher & Co. | | 30,045 | 6,596,981 |
| Chubb Ltd. | | 142,606 | 27,460,211 |
| Direct Line Insurance Group PLC | | 1,158,400 | 2,000,053 |
| Everest Re Group Ltd. | | 13,000 | 4,444,180 |
| Fairfax Financial Holdings Ltd. (sub. vtg.) | | 6,500 | 4,868,756 |
| Globe Life, Inc. | | 47,128 | 5,166,171 |
| Hartford Financial Services Group, Inc. | | 154,054 | 11,094,969 |
| Marsh & McLennan Companies, Inc. | | 63,505 | 11,944,020 |
| Progressive Corp. | | 109,000 | 14,428,330 |
| Prudential PLC | | 172,368 | 2,434,421 |
| The Travelers Companies, Inc. | | 156,331 | 27,148,441 |
| Unum Group | | 125,200 | 5,972,040 |
| | | | 123,558,573 |
TOTAL FINANCIALS | | | 522,321,855 |
| HEALTH CARE - 8.6% | | | |
| Biotechnology - 1.6% | | | |
| Apellis Pharmaceuticals, Inc. (b) | | 22,800 | 2,077,080 |
| Biogen, Inc. (b) | | 50,803 | 14,471,235 |
| Exact Sciences Corp. (b) | | 31,860 | 2,991,654 |
| Gilead Sciences, Inc. | | 412,771 | 31,812,261 |
| Legend Biotech Corp. ADR (b) | | 89,940 | 6,208,558 |
| PTC Therapeutics, Inc. (b) | | 82,213 | 3,343,603 |
| Regeneron Pharmaceuticals, Inc. (b) | | 5,190 | 3,729,223 |
| Sarepta Therapeutics, Inc. (b) | | 32,300 | 3,698,996 |
| Vertex Pharmaceuticals, Inc. (b) | | 91,363 | 32,151,553 |
| | | | 100,484,163 |
| Health Care Equipment & Supplies - 2.1% | | | |
| Abbott Laboratories | | 116,818 | 12,735,498 |
| Boston Scientific Corp. (b) | | 820,235 | 44,366,511 |
| Intuitive Surgical, Inc. (b) | | 63,700 | 21,781,578 |
| Masimo Corp. (b) | | 52,900 | 8,704,695 |
| Penumbra, Inc. (b) | | 27,017 | 9,295,469 |
| ResMed, Inc. | | 15,550 | 3,397,675 |
| Stryker Corp. | | 122,700 | 37,434,543 |
| | | | 137,715,969 |
| Health Care Providers & Services - 2.2% | | | |
| agilon health, Inc. (b) | | 328,344 | 5,693,485 |
| AmerisourceBergen Corp. | | 152,689 | 29,381,944 |
| Humana, Inc. | | 38,351 | 17,147,883 |
| Surgery Partners, Inc. (b) | | 477,570 | 21,485,874 |
| UnitedHealth Group, Inc. | | 150,207 | 72,195,492 |
| | | | 145,904,678 |
| Life Sciences Tools & Services - 0.7% | | | |
| Gerresheimer AG | | 113,062 | 12,719,782 |
| IQVIA Holdings, Inc. (b) | | 46,600 | 10,474,282 |
| Thermo Fisher Scientific, Inc. | | 47,560 | 24,814,430 |
| | | | 48,008,494 |
| Pharmaceuticals - 2.0% | | | |
| AstraZeneca PLC sponsored ADR | | 313,547 | 22,440,559 |
| Eli Lilly & Co. | | 133,984 | 62,835,816 |
| Indivior PLC (b) | | 207,000 | 4,792,485 |
| Merck & Co., Inc. | | 246,242 | 28,413,864 |
| Royalty Pharma PLC | | 340,767 | 10,475,178 |
| | | | 128,957,902 |
TOTAL HEALTH CARE | | | 561,071,206 |
| INDUSTRIALS - 5.6% | | | |
| Aerospace & Defense - 1.3% | | | |
| Howmet Aerospace, Inc. | | 161,500 | 8,003,940 |
| Lockheed Martin Corp. | | 52,770 | 24,294,253 |
| Northrop Grumman Corp. | | 18,870 | 8,600,946 |
| Raytheon Technologies Corp. | | 64,277 | 6,296,575 |
| Space Exploration Technologies Corp. Class A (b)(d)(e) | | 17,000 | 1,377,000 |
| The Boeing Co. (b) | | 111,317 | 23,505,698 |
| TransDigm Group, Inc. | | 12,400 | 11,087,708 |
| | | | 83,166,120 |
| Air Freight & Logistics - 0.1% | | | |
| United Parcel Service, Inc. Class B | | 30,523 | 5,471,248 |
| Building Products - 0.4% | | | |
| Trane Technologies PLC | | 133,194 | 25,474,684 |
| Electrical Equipment - 0.6% | | | |
| AMETEK, Inc. | | 173,753 | 28,127,136 |
| Eaton Corp. PLC | | 53,000 | 10,658,300 |
| | | | 38,785,436 |
| Ground Transportation - 0.7% | | | |
| CSX Corp. | | 528,262 | 18,013,734 |
| Old Dominion Freight Lines, Inc. | | 49,500 | 18,302,625 |
| Uber Technologies, Inc. (b) | | 256,647 | 11,079,451 |
| | | | 47,395,810 |
| Industrial Conglomerates - 0.6% | | | |
| General Electric Co. | | 239,089 | 26,263,927 |
| Honeywell International, Inc. | | 53,616 | 11,125,320 |
| | | | 37,389,247 |
| Machinery - 1.8% | | | |
| Caterpillar, Inc. | | 70,725 | 17,401,886 |
| Deere & Co. | | 25,200 | 10,210,788 |
| Dover Corp. | | 134,800 | 19,903,220 |
| Fortive Corp. | | 359,640 | 26,890,283 |
| Ingersoll Rand, Inc. | | 299,200 | 19,555,712 |
| Parker Hannifin Corp. | | 69,701 | 27,186,178 |
| | | | 121,148,067 |
| Passenger Airlines - 0.1% | | | |
| Delta Air Lines, Inc. | | 154,300 | 7,335,422 |
| Professional Services - 0.0% | | | |
| Dun & Bradstreet Holdings, Inc. (c) | | 229,129 | 2,651,023 |
TOTAL INDUSTRIALS | | | 368,817,057 |
| INFORMATION TECHNOLOGY - 17.0% | | | |
| Electronic Equipment, Instruments & Components - 0.2% | | | |
| Amphenol Corp. Class A | | 153,200 | 13,014,340 |
| IT Services - 0.8% | | | |
| Accenture PLC Class A | | 22,500 | 6,943,050 |
| Capgemini SA | | 31,400 | 5,945,356 |
| EPAM Systems, Inc. (b) | | 29,400 | 6,607,650 |
| MongoDB, Inc. Class A (b) | | 35,900 | 14,754,541 |
| Shopify, Inc. Class A (b) | | 39,900 | 2,577,540 |
| Snowflake, Inc. (b) | | 35,600 | 6,264,888 |
| Twilio, Inc. Class A (b) | | 92,500 | 5,884,850 |
| Wix.com Ltd. (b) | | 51,800 | 4,052,832 |
| | | | 53,030,707 |
| Semiconductors & Semiconductor Equipment - 4.1% | | | |
| Advanced Micro Devices, Inc. (b) | | 150,800 | 17,177,628 |
| ASML Holding NV (Netherlands) | | 13,300 | 9,646,869 |
| Lam Research Corp. | | 30,800 | 19,800,088 |
| Marvell Technology, Inc. | | 188,572 | 11,272,834 |
| MediaTek, Inc. | | 113,000 | 2,495,634 |
| Micron Technology, Inc. | | 341,600 | 21,558,376 |
| NVIDIA Corp. | | 315,700 | 133,547,414 |
| NXP Semiconductors NV | | 68,212 | 13,961,632 |
| Renesas Electronics Corp. (b) | | 554,900 | 10,472,247 |
| SolarEdge Technologies, Inc. (b) | | 28,300 | 7,614,115 |
| Taiwan Semiconductor Manufacturing Co. Ltd. | | 935,000 | 17,268,408 |
| | | | 264,815,245 |
| Software - 7.7% | | | |
| Adobe, Inc. (b) | | 85,400 | 41,759,746 |
| Autodesk, Inc. (b) | | 64,600 | 13,217,806 |
| CCC Intelligent Solutions Holdings, Inc. (b)(d) | | 36,613 | 410,432 |
| Elastic NV (b) | | 63,200 | 4,052,384 |
| Five9, Inc. (b) | | 90,600 | 7,469,970 |
| HubSpot, Inc. (b) | | 27,200 | 14,472,848 |
| Intuit, Inc. | | 58,400 | 26,758,296 |
| Microsoft Corp. | | 978,100 | 333,082,171 |
| Salesforce, Inc. (b) | | 163,300 | 34,498,758 |
| Stripe, Inc. Class B (b)(d)(e) | | 19,953 | 401,654 |
| Synopsys, Inc. (b) | | 28,900 | 12,583,349 |
| Tenable Holdings, Inc. (b) | | 69,200 | 3,013,660 |
| Workday, Inc. Class A (b) | | 47,000 | 10,616,830 |
| | | | 502,337,904 |
| Technology Hardware, Storage & Peripherals - 4.2% | | | |
| Apple, Inc. | | 1,391,864 | 269,979,860 |
| Samsung Electronics Co. Ltd. | | 102,060 | 5,620,100 |
| | | | 275,599,960 |
TOTAL INFORMATION TECHNOLOGY | | | 1,108,798,156 |
| MATERIALS - 1.6% | | | |
| Chemicals - 1.0% | | | |
| Air Products & Chemicals, Inc. | | 23,103 | 6,920,042 |
| Cabot Corp. | | 32,000 | 2,140,480 |
| Celanese Corp. Class A | | 40,300 | 4,666,740 |
| Chemtrade Logistics Income Fund | | 198,900 | 1,229,659 |
| Corteva, Inc. | | 112,500 | 6,446,250 |
| DuPont de Nemours, Inc. | | 66,250 | 4,732,900 |
| Linde PLC | | 71,670 | 27,312,004 |
| LyondellBasell Industries NV Class A | | 64,700 | 5,941,401 |
| Olin Corp. | | 39,530 | 2,031,447 |
| The Chemours Co. LLC | | 90,100 | 3,323,789 |
| Tronox Holdings PLC | | 155,600 | 1,977,676 |
| Westlake Corp. | | 10,400 | 1,242,488 |
| | | | 67,964,876 |
| Construction Materials - 0.1% | | | |
| Martin Marietta Materials, Inc. | | 7,684 | 3,547,626 |
| Vulcan Materials Co. | | 16,520 | 3,724,269 |
| | | | 7,271,895 |
| Containers & Packaging - 0.1% | | | |
| Aptargroup, Inc. | | 19,500 | 2,259,270 |
| Greif, Inc. Class A | | 31,600 | 2,176,924 |
| | | | 4,436,194 |
| Metals & Mining - 0.4% | | | |
| First Quantum Minerals Ltd. | | 224,000 | 5,299,234 |
| Franco-Nevada Corp. | | 19,500 | 2,779,238 |
| Freeport-McMoRan, Inc. | | 212,251 | 8,490,040 |
| Glencore PLC | | 206,800 | 1,172,532 |
| Horizonte Minerals PLC (b) | | 312,200 | 570,951 |
| Ivanhoe Mines Ltd. (b) | | 120,000 | 1,096,056 |
| Major Drilling Group International, Inc. (b) | | 80,300 | 554,023 |
| Reliance Steel & Aluminum Co. | | 11,118 | 3,019,538 |
| | | | 22,981,612 |
TOTAL MATERIALS | | | 102,654,577 |
| REAL ESTATE - 1.5% | | | |
| Equity Real Estate Investment Trusts (REITs) - 1.5% | | | |
| Alexandria Real Estate Equities, Inc. | | 2,600 | 295,074 |
| American Tower Corp. | | 55,900 | 10,841,246 |
| Corporate Office Properties Trust (SBI) | | 81,500 | 1,935,625 |
| Crown Castle International Corp. | | 36,400 | 4,147,416 |
| CubeSmart | | 17,900 | 799,414 |
| Digital Realty Trust, Inc. | | 61,900 | 7,048,553 |
| Equinix, Inc. | | 16,800 | 13,170,192 |
| Equity Lifestyle Properties, Inc. | | 92,700 | 6,200,703 |
| Essex Property Trust, Inc. | | 28,600 | 6,700,980 |
| Host Hotels & Resorts, Inc. | | 118,800 | 1,999,404 |
| Invitation Homes, Inc. | | 169,500 | 5,830,800 |
| Life Storage, Inc. | | 1,800 | 239,328 |
| Mid-America Apartment Communities, Inc. | | 40,300 | 6,119,958 |
| Prologis (REIT), Inc. | | 117,000 | 14,347,710 |
| Simon Property Group, Inc. | | 15,600 | 1,801,488 |
| Ventas, Inc. | | 132,200 | 6,249,094 |
| Welltower, Inc. | | 94,600 | 7,652,194 |
| | | | 95,379,179 |
| Real Estate Management & Development - 0.0% | | | |
| WeWork, Inc. (b) | | 97,321 | 24,856 |
TOTAL REAL ESTATE | | | 95,404,035 |
| UTILITIES - 1.7% | | | |
| Electric Utilities - 1.2% | | | |
| Constellation Energy Corp. | | 113,878 | 10,425,531 |
| Edison International | | 79,500 | 5,521,275 |
| Exelon Corp. | | 156,035 | 6,356,866 |
| FirstEnergy Corp. | | 60,200 | 2,340,576 |
| NextEra Energy, Inc. | | 281,004 | 20,850,497 |
| PG&E Corp. (b) | | 659,219 | 11,391,304 |
| PPL Corp. | | 187,300 | 4,955,958 |
| Southern Co. | | 252,700 | 17,752,175 |
| | | | 79,594,182 |
| Independent Power and Renewable Electricity Producers - 0.0% | | | |
| The AES Corp. | | 51,400 | 1,065,522 |
| Multi-Utilities - 0.4% | | | |
| Dominion Energy, Inc. | | 151,678 | 7,855,404 |
| NiSource, Inc. | | 143,500 | 3,924,725 |
| Sempra Energy | | 76,598 | 11,151,903 |
| | | | 22,932,032 |
| Water Utilities - 0.1% | | | |
| American Water Works Co., Inc. | | 35,500 | 5,067,625 |
TOTAL UTILITIES | | | 108,659,361 |
| TOTAL COMMON STOCKS (Cost $2,664,151,185) | | | 4,136,056,392 |
| | | | |
| Preferred Stocks - 0.3% |
| | | Shares | Value ($) |
| Convertible Preferred Stocks - 0.2% | | | |
| COMMUNICATION SERVICES - 0.1% | | | |
| Interactive Media & Services - 0.1% | | | |
| ByteDance Ltd. Series E1 (b)(d)(e) | | 21,701 | 4,900,954 |
| | | | |
| FINANCIALS - 0.0% | | | |
| Financial Services - 0.0% | | | |
| Circle Internet Financial Ltd. Series F (b)(d)(e) | | 36,875 | 886,844 |
| | | | |
| INDUSTRIALS - 0.0% | | | |
| Aerospace & Defense - 0.0% | | | |
| ABL Space Systems: | | | |
| Series B(b)(d)(e) | | 17,763 | 586,179 |
| Series B2(b)(d)(e) | | 8,188 | 260,215 |
| | | | 846,394 |
| Construction & Engineering - 0.0% | | | |
| Beta Technologies, Inc. Series A (b)(d)(e) | | 7,264 | 731,485 |
| | | | |
TOTAL INDUSTRIALS | | | 1,577,879 |
| | | | |
| INFORMATION TECHNOLOGY - 0.1% | | | |
| Communications Equipment - 0.0% | | | |
| Astranis Space Technologies Corp. Series C (b)(d)(e) | | 60,816 | 1,333,087 |
| | | | |
| Semiconductors & Semiconductor Equipment - 0.0% | | | |
| Astera Labs, Inc. Series C (b)(d)(e) | | 155,858 | 1,477,534 |
| GaN Systems, Inc.: | | | |
| Series F1(b)(d)(e) | | 14,731 | 163,072 |
| Series F2(b)(d)(e) | | 7,778 | 86,102 |
| Xsight Labs Ltd. Series D (b)(d)(e) | | 65,770 | 461,048 |
| | | | 2,187,756 |
| Software - 0.1% | | | |
| Algolia, Inc. Series D (b)(d)(e) | | 28,064 | 448,182 |
| Bolt Technology OU Series E (b)(d)(e) | | 6,283 | 829,029 |
| Databricks, Inc.: | | | |
| Series G(b)(d)(e) | | 4,461 | 238,708 |
| Series H(b)(d)(e) | | 18,642 | 997,533 |
| Skyryse, Inc. Series B (b)(d)(e) | | 50,000 | 1,091,500 |
| Stripe, Inc. Series H (b)(d)(e) | | 19,876 | 400,104 |
| | | | 4,005,056 |
TOTAL INFORMATION TECHNOLOGY | | | 7,525,899 |
| | | | |
| TOTAL CONVERTIBLE PREFERRED STOCKS | | | 14,891,576 |
| Nonconvertible Preferred Stocks - 0.1% | | | |
| FINANCIALS - 0.1% | | | |
| Financial Services - 0.1% | | | |
| Circle Internet Financial Ltd. Series E (b)(d)(e) | | 68,071 | 1,637,108 |
| | | | |
| INDUSTRIALS - 0.0% | | | |
| Professional Services - 0.0% | | | |
| Checkr, Inc. Series E (b)(e) | | 87,327 | 953,611 |
| | | | |
| INFORMATION TECHNOLOGY - 0.0% | | | |
| IT Services - 0.0% | | | |
| Gupshup, Inc. (b)(d)(e) | | 59,838 | 681,555 |
| | | | |
| TOTAL NONCONVERTIBLE PREFERRED STOCKS | | | 3,272,274 |
| TOTAL PREFERRED STOCKS (Cost $18,557,702) | | | 18,163,850 |
| | | | |
| U.S. Treasury Obligations - 0.0% |
| | | Principal Amount (f) | Value ($) |
U.S. Treasury Bills, yield at date of purchase 5.17% to 5.29% 7/27/23 to 9/7/23 (g) (Cost $2,637,708) | | 2,650,000 | 2,638,715 |
| | | | |
| Preferred Securities - 0.0% |
| | | Principal Amount (f) | Value ($) |
| INFORMATION TECHNOLOGY - 0.0% | | | |
| Semiconductors & Semiconductor Equipment - 0.0% | | | |
GaN Systems, Inc. 0% (d)(e)(h) (Cost $345,272) | | 345,272 | 424,339 |
| | | | |
| Fixed-Income Funds - 35.1% |
| | | Shares | Value ($) |
Fidelity VIP Investment Grade Central Fund (i) (Cost $2,580,437,176) | | 24,751,349 | 2,288,509,731 |
| | | | |
| Money Market Funds - 1.4% |
| | | Shares | Value ($) |
| Fidelity Cash Central Fund 5.14% (j) | | 83,977,960 | 83,994,755 |
| Fidelity Securities Lending Cash Central Fund 5.14% (j)(k) | | 8,760,774 | 8,761,650 |
| TOTAL MONEY MARKET FUNDS (Cost $92,755,897) | | | 92,756,405 |
| | | | |
| TOTAL INVESTMENT IN SECURITIES - 100.2% (Cost $5,358,884,940) | 6,538,549,432 |
NET OTHER ASSETS (LIABILITIES) - (0.2)% | (10,312,439) |
| NET ASSETS - 100.0% | 6,528,236,993 |
| | |
| Futures Contracts |
| | Number of contracts | Expiration Date | Notional Amount ($) | Value ($) | Unrealized Appreciation/ (Depreciation) ($) |
| Purchased | | | | | |
| | | | | | |
| Equity Index Contracts | | | | | |
| CME E-mini S&P 500 Index Contracts (United States) | 222 | Sep 2023 | 49,819,575 | 1,538,678 | 1,538,678 |
| | | | | | |
| The notional amount of futures purchased as a percentage of Net Assets is 0.8% |
Legend
| (a) | Security exempt from registration under Rule 144A of the Securities Act of 1933. These securities may be resold in transactions exempt from registration, normally to qualified institutional buyers. At the end of the period, the value of these securities amounted to $5,774,177 or 0.1% of net assets. |
| (c) | Security or a portion of the security is on loan at period end. |
| (d) | Restricted securities (including private placements) - Investment in securities not registered under the Securities Act of 1933 (excluding 144A issues). At the end of the period, the value of restricted securities (excluding 144A issues) amounted to $25,289,827 or 0.4% of net assets. |
| (f) | Amount is stated in United States dollars unless otherwise noted. |
| (g) | Security or a portion of the security was pledged to cover margin requirements for futures contracts. At period end, the value of securities pledged amounted to $2,638,715. |
| (h) | Security is perpetual in nature with no stated maturity date. |
| (i) | Affiliated fund that is generally available only to investment companies and other accounts managed by Fidelity Investments. A complete unaudited schedule of portfolio holdings for each Fidelity Central Fund is filed with the SEC for the first and third quarters of each fiscal year on Form N-PORT and is available upon request or at the SEC's website at www.sec.gov. An unaudited holdings listing for the Fund, which presents direct holdings as well as the pro-rata share of securities and other investments held indirectly through its investment in underlying non-money market Fidelity Central Funds, is available at fidelity.com and/or institutional.fidelity.com, as applicable. In addition, each Fidelity Central Fund's financial statements are available on the SEC's website or upon request. |
| (j) | Affiliated fund that is generally available only to investment companies and other accounts managed by Fidelity Investments. The rate quoted is the annualized seven-day yield of the fund at period end. A complete unaudited listing of the fund's holdings as of its most recent quarter end is available upon request. In addition, each Fidelity Central Fund's financial statements are available on the SEC's website or upon request. |
| (k) | Investment made with cash collateral received from securities on loan. |
| Additional information on each restricted holding is as follows: |
| Security | Acquisition Date | Acquisition Cost ($) |
| ABL Space Systems Series B | 3/24/21 | 799,967 |
| | | |
| ABL Space Systems Series B2 | 10/22/21 | 556,752 |
| | | |
| Algolia, Inc. Series D | 7/23/21 | 820,733 |
| | | |
| Ant International Co. Ltd. Class C | 5/16/18 | 3,487,731 |
| | | |
| Astera Labs, Inc. Series C | 8/24/21 | 523,963 |
| | | |
| Astranis Space Technologies Corp. Series C | 3/19/21 | 1,333,143 |
| | | |
| Beta Technologies, Inc. Series A | 4/09/21 | 532,233 |
| | | |
| Bolt Technology OU Series E | 1/03/22 | 1,632,302 |
| | | |
| ByteDance Ltd. Series E1 | 11/18/20 | 2,377,869 |
| | | |
| Cazoo Group Ltd. | 3/28/21 | 564,000 |
| | | |
| CCC Intelligent Solutions Holdings, Inc. | 2/02/21 | 366,130 |
| | | |
| Circle Internet Financial Ltd. Series E | 5/11/21 | 1,104,800 |
| | | |
| Circle Internet Financial Ltd. Series F | 5/09/22 | 1,553,913 |
| | | |
| Databricks, Inc. Series G | 2/01/21 | 263,746 |
| | | |
| Databricks, Inc. Series H | 8/31/21 | 1,369,891 |
| | | |
| Epic Games, Inc. | 3/29/21 | 1,603,620 |
| | | |
| GaN Systems, Inc. Series F1 | 11/30/21 | 124,919 |
| | | |
| GaN Systems, Inc. Series F2 | 11/30/21 | 65,957 |
| | | |
| GaN Systems, Inc. 0% | 11/30/21 | 345,272 |
| | | |
| Gupshup, Inc. | 6/08/21 | 1,368,208 |
| | | |
| Skyryse, Inc. Series B | 10/21/21 | 1,233,999 |
| | | |
| Space Exploration Technologies Corp. Class A | 2/16/21 | 713,983 |
| | | |
| Starling Bank Ltd. Series D | 6/18/21 | 1,352,573 |
| | | |
| Stripe, Inc. Class B | 5/18/21 | 800,682 |
| | | |
| Stripe, Inc. Series H | 3/15/21 - 5/25/23 | 797,525 |
| | | |
| Xsight Labs Ltd. Series D | 2/16/21 | 525,897 |
| | | |
Affiliated Central Funds
Fiscal year to date information regarding the Fund's investments in Fidelity Central Funds, including the ownership percentage, is presented below.
| Affiliate | Value, beginning of period ($) | Purchases ($) | Sales Proceeds ($) | Dividend Income ($) | Realized Gain (loss) ($) | Change in Unrealized appreciation (depreciation) ($) | Value, end of period ($) | % ownership, end of period |
| Fidelity Cash Central Fund 5.14% | 68,250,848 | 591,232,028 | 575,488,121 | 1,463,960 | - | - | 83,994,755 | 0.2% |
| Fidelity Securities Lending Cash Central Fund 5.14% | 2,108,836 | 57,292,962 | 50,640,148 | 45,610 | - | - | 8,761,650 | 0.0% |
| Fidelity VIP Investment Grade Central Fund | 2,082,963,744 | 192,706,773 | - | 41,779,273 | - | 12,839,214 | 2,288,509,731 | 86.0% |
| Total | 2,153,323,428 | 841,231,763 | 626,128,269 | 43,288,843 | - | 12,839,214 | 2,381,266,136 | |
| | | | | | | | | |
Amounts in the dividend income column in the above table include any capital gain distributions from underlying funds, which are presented in the corresponding line item in the Statement of Operations, if applicable.
Amounts in the dividend income column for Fidelity Securities Lending Cash Central Fund represents the income earned on investing cash collateral, less rebates paid to borrowers and any lending agent fees associated with the loan, plus any premium payments received for lending certain types of securities.
Amounts included in the purchases and sales proceeds columns may include in-kind transactions, if applicable.
Investment Valuation
The following is a summary of the inputs used, as of June 30, 2023, involving the Fund's assets and liabilities carried at fair value. The inputs or methodology used for valuing securities may not be an indication of the risk associated with investing in those securities. For more information on valuation inputs, and their aggregation into the levels used below, please refer to the Investment Valuation section in the accompanying Notes to Financial Statements.
| Valuation Inputs at Reporting Date: |
| Description | Total ($) | Level 1 ($) | Level 2 ($) | Level 3 ($) |
Investments in Securities: | | | | |
|
| Equities: | | | | |
Communication Services | 374,047,653 | 367,871,123 | - | 6,176,530 |
Consumer Discretionary | 428,161,900 | 422,907,957 | 5,253,943 | - |
Consumer Staples | 299,055,358 | 299,055,358 | - | - |
Energy | 171,966,188 | 171,966,188 | - | - |
Financials | 524,845,807 | 483,593,359 | 34,373,131 | 6,879,317 |
Health Care | 561,071,206 | 561,071,206 | - | - |
Industrials | 371,348,547 | 367,440,057 | - | 3,908,490 |
Information Technology | 1,117,005,610 | 1,059,443,522 | 48,952,980 | 8,609,108 |
Materials | 102,654,577 | 101,482,045 | 1,172,532 | - |
Real Estate | 95,404,035 | 95,404,035 | - | - |
Utilities | 108,659,361 | 108,659,361 | - | - |
|
| U.S. Government and Government Agency Obligations | 2,638,715 | - | 2,638,715 | - |
|
| Preferred Securities | 424,339 | - | - | 424,339 |
|
| Fixed-Income Funds | 2,288,509,731 | 2,288,509,731 | - | - |
|
| Money Market Funds | 92,756,405 | 92,756,405 | - | - |
| Total Investments in Securities: | 6,538,549,432 | 6,420,160,347 | 92,391,301 | 25,997,784 |
Derivative Instruments: | | | | |
|
| Assets | | | | |
Futures Contracts | 1,538,678 | 1,538,678 | - | - |
| Total Assets | 1,538,678 | 1,538,678 | - | - |
| Total Derivative Instruments: | 1,538,678 | 1,538,678 | - | - |
Value of Derivative Instruments
The following table is a summary of the Fund's value of derivative instruments by primary risk exposure as of June 30, 2023. For additional information on derivative instruments, please refer to the Derivative Instruments section in the accompanying Notes to Financial Statements.
Primary Risk Exposure / Derivative Type | Value |
| Asset ($) | Liability ($) |
| Equity Risk | | |
Futures Contracts (a) | 1,538,678 | 0 |
| Total Equity Risk | 1,538,678 | 0 |
| Total Value of Derivatives | 1,538,678 | 0 |
(a)Reflects gross cumulative appreciation (depreciation) on futures contracts as presented in the Schedule of Investments. In the Statement of Assets and Liabilities, the period end daily variation margin is included in receivable or payable for daily variation margin on futures contracts, and the net cumulative appreciation (depreciation) is included in Total accumulated earnings (loss).
| Statement of Assets and Liabilities |
| | | | June 30, 2023 (Unaudited) |
| | | | | |
| Assets | | | | |
| Investment in securities, at value (including securities loaned of $8,468,732) - See accompanying schedule: | | | | |
Unaffiliated issuers (cost $2,685,691,867) | $ | 4,157,283,296 | | |
Fidelity Central Funds (cost $2,673,193,073) | | 2,381,266,136 | | |
| | | | | |
| | | | | |
| Total Investment in Securities (cost $5,358,884,940) | | | $ | 6,538,549,432 |
| Cash | | | | 20,390 |
| Foreign currency held at value (cost $278,317) | | | | 278,318 |
| Receivable for investments sold | | | | 9,635,109 |
| Receivable for fund shares sold | | | | 1,551,707 |
| Dividends receivable | | | | 3,216,432 |
| Distributions receivable from Fidelity Central Funds | | | | 365,998 |
| Receivable for daily variation margin on futures contracts | | | | 582,750 |
| Other receivables | | | | 15,602 |
Total assets | | | | 6,554,215,738 |
| Liabilities | | | | |
| Payable for investments purchased | $ | 11,417,592 | | |
| Payable for fund shares redeemed | | 2,332,789 | | |
| Accrued management fee | | 2,006,525 | | |
| Distribution and service plan fees payable | | 496,059 | | |
| Other affiliated payables | | 687,173 | | |
| Other payables and accrued expenses | | 276,957 | | |
| Collateral on securities loaned | | 8,761,650 | | |
| Total Liabilities | | | | 25,978,745 |
| Net Assets | | | $ | 6,528,236,993 |
| Net Assets consist of: | | | | |
| Paid in capital | | | $ | 5,269,414,862 |
| Total accumulated earnings (loss) | | | | 1,258,822,131 |
| Net Assets | | | $ | 6,528,236,993 |
| | | | | |
| Net Asset Value and Maximum Offering Price | | | | |
| Initial Class : | | | | |
Net Asset Value , offering price and redemption price per share ($293,749,746 ÷ 13,854,568 shares) | | | $ | 21.20 |
| Service Class : | | | | |
Net Asset Value , offering price and redemption price per share ($37,032,551 ÷ 1,764,223 shares) | | | $ | 20.99 |
| Service Class 2 : | | | | |
Net Asset Value , offering price and redemption price per share ($2,409,494,236 ÷ 117,755,090 shares) | | | $ | 20.46 |
| Investor Class : | | | | |
Net Asset Value , offering price and redemption price per share ($3,787,960,460 ÷ 180,736,508 shares) | | | $ | 20.96 |
| Statement of Operations |
| | | | Six months ended June 30, 2023 (Unaudited) |
| Investment Income | | | | |
| Dividends | | | $ | 25,763,441 |
| Interest | | | | 53,314 |
| Income from Fidelity Central Funds (including $45,610 from security lending) | | | | 43,288,843 |
| Total Income | | | | 69,105,598 |
| Expenses | | | | |
| Management fee | $ | 11,591,515 | | |
| Transfer agent fees | | 3,319,855 | | |
| Distribution and service plan fees | | 2,830,920 | | |
| Accounting fees | | 672,426 | | |
| Custodian fees and expenses | | 74,639 | | |
| Independent trustees' fees and expenses | | 20,279 | | |
| Audit | | 50,023 | | |
| Legal | | 23,210 | | |
| Interest | | 7,017 | | |
| Miscellaneous | | 17,418 | | |
| Total expenses before reductions | | 18,607,302 | | |
| Expense reductions | | (139,530) | | |
| Total expenses after reductions | | | | 18,467,772 |
| Net Investment income (loss) | | | | 50,637,826 |
| Realized and Unrealized Gain (Loss) | | | | |
| Net realized gain (loss) on: | | | | |
| Investment Securities: | | | | |
| Unaffiliated issuers (net of foreign taxes of $377) | | 31,798,076 | | |
| Foreign currency transactions | | (36,516) | | |
| Futures contracts | | 3,254,826 | | |
| Total net realized gain (loss) | | | | 35,016,386 |
| Change in net unrealized appreciation (depreciation) on: | | | | |
| Investment Securities: | | | | |
| Unaffiliated issuers(net of increase in deferred foreign taxes of $139,889) | | 695,987,234 | | |
| Fidelity Central Funds | | 12,839,214 | | |
| Unfunded commitments | | 117,891 | | |
| Assets and liabilities in foreign currencies | | 6,369 | | |
| Futures contracts | | 2,531,197 | | |
| Total change in net unrealized appreciation (depreciation) | | | | 711,481,905 |
| Net gain (loss) | | | | 746,498,291 |
| Net increase (decrease) in net assets resulting from operations | | | $ | 797,136,117 |
| Statement of Changes in Net Assets |
| |
| | Six months ended June 30, 2023 (Unaudited) | | Year ended December 31, 2022 |
| Increase (Decrease) in Net Assets | | | | |
| Operations | | | | |
| Net investment income (loss) | $ | 50,637,826 | $ | 75,763,858 |
| Net realized gain (loss) | | 35,016,386 | | 230,897,367 |
| Change in net unrealized appreciation (depreciation) | | 711,481,905 | | (1,643,117,850) |
| Net increase (decrease) in net assets resulting from operations | | 797,136,117 | | (1,336,456,625) |
| Distributions to shareholders | | (247,478,506) | | (460,415,308) |
| | | | | |
| Share transactions - net increase (decrease) | | 136,139,473 | | 225,085,361 |
| Total increase (decrease) in net assets | | 685,797,084 | | (1,571,786,572) |
| | | | | |
| Net Assets | | | | |
| Beginning of period | | 5,842,439,909 | | 7,414,226,481 |
| End of period | $ | 6,528,236,993 | $ | 5,842,439,909 |
| | | | | |
| | | | | |
| VIP Balanced Portfolio Initial Class |
| |
| | Six months ended (Unaudited) June 30, 2023 | | Years ended December 31, 2022 | | 2021 | | 2020 | | 2019 | | 2018 |
Selected Per-Share Data | | | | | | | | | | | | |
| Net asset value, beginning of period | $ | 19.38 | $ | 25.29 | $ | 23.29 | $ | 19.55 | $ | 16.78 | $ | 18.76 |
| Income from Investment Operations | | | | | | | | | | | | |
Net investment income (loss) A,B | | .18 | | .28 | | .25 | | .29 | | .33 | | .30 |
| Net realized and unrealized gain (loss) | | 2.46 | | (4.62) | | 3.79 | | 4.02 | | 3.62 | | (1.07) |
| Total from investment operations | | 2.64 | | (4.34) | | 4.04 | | 4.31 | | 3.95 | | (.77) |
| Distributions from net investment income | | (.07) | | (.27) | | (.23) | | (.30) | | (.32) | | (.27) |
| Distributions from net realized gain | | (.75) | | (1.30) | | (1.81) | | (.28) | | (.86) | | (.94) |
| Total distributions | | (.82) | | (1.57) | | (2.04) | | (.57) C | | (1.18) | | (1.21) |
| Net asset value, end of period | $ | 21.20 | $ | 19.38 | $ | 25.29 | $ | 23.29 | $ | 19.55 | $ | 16.78 |
Total Return D,E,F | | 13.85% | | (17.94)% | | 18.26% | | 22.39% | | 24.51% | | (4.22)% |
Ratios to Average Net Assets B,G,H | | | | | | | | | | | | |
| Expenses before reductions | | .47% I | | .47% | | .46% | | .48% | | .49% | | .49% |
| Expenses net of fee waivers, if any | | .46% I | | .46% | | .46% | | .48% | | .49% | | .49% |
| Expenses net of all reductions | | .46% I | | .46% | | .46% | | .47% | | .48% | | .49% |
| Net investment income (loss) | | 1.77% I | | 1.32% | | 1.01% | | 1.45% | | 1.81% | | 1.64% |
| Supplemental Data | | | | | | | | | | | | |
| Net assets, end of period (000 omitted) | $ | 293,750 | $ | 266,447 | $ | 332,976 | $ | 271,384 | $ | 240,746 | $ | 206,293 |
Portfolio turnover rate J | | 28% I | | 37% | | 33% | | 62% | | 41% | | 55% |
A Calculated based on average shares outstanding during the period.
B Net investment income (loss) is affected by the timing of the declaration of dividends by any underlying mutual funds or exchange-traded funds (ETFs). Net investment income (loss) of any mutual funds or ETFs is not included in the Fund's net investment income (loss) ratio.
C Total distributions per share do not sum due to rounding.
D Total returns for periods of less than one year are not annualized.
E Total returns do not reflect charges attributable to your insurance company's separate account. Inclusion of these charges would reduce the total returns shown.
F Total returns would have been lower if certain expenses had not been reduced during the applicable periods shown.
G Fees and expenses of any underlying mutual funds or exchange-traded funds (ETFs) are not included in the Fund's expense ratio. The Fund indirectly bears its proportionate share of these expenses. For additional expense information related to investments in Fidelity Central Funds, please refer to the "Investments in Fidelity Central Funds" note found in the Notes to Financial Statements section of the most recent Annual or Semi-Annual report.
H Expense ratios reflect operating expenses of the class. Expenses before reductions do not reflect amounts reimbursed, waived, or reduced through arrangements with the investment adviser, brokerage services, or other offset arrangements, if applicable, and do not represent the amount paid by the class during periods when reimbursements, waivers or reductions occur.
I Annualized.
J Amount does not include the portfolio activity of any underlying mutual funds or exchange-traded funds (ETFs).
| VIP Balanced Portfolio Service Class |
| |
| | Six months ended (Unaudited) June 30, 2023 | | Years ended December 31, 2022 | | 2021 | | 2020 | | 2019 | | 2018 |
Selected Per-Share Data | | | | | | | | | | | | |
| Net asset value, beginning of period | $ | 19.20 | $ | 25.07 | $ | 23.11 | $ | 19.40 | $ | 16.67 | $ | 18.65 |
| Income from Investment Operations | | | | | | | | | | | | |
Net investment income (loss) A,B | | .17 | | .25 | | .22 | | .27 | | .31 | | .28 |
| Net realized and unrealized gain (loss) | | 2.43 | | (4.57) | | 3.76 | | 4.00 | | 3.58 | | (1.05) |
| Total from investment operations | | 2.60 | | (4.32) | | 3.98 | | 4.27 | | 3.89 | | (.77) |
| Distributions from net investment income | | (.06) | | (.25) | | (.21) | | (.28) | | (.30) | | (.27) |
| Distributions from net realized gain | | (.75) | | (1.30) | | (1.81) | | (.28) | | (.86) | | (.94) |
| Total distributions | | (.81) | | (1.55) | | (2.02) | | (.56) | | (1.16) | | (1.21) |
| Net asset value, end of period | $ | 20.99 | $ | 19.20 | $ | 25.07 | $ | 23.11 | $ | 19.40 | $ | 16.67 |
Total Return C,D,E | | 13.81% | | (18.02)% | | 18.13% | | 22.32% | | 24.30% | | (4.27)% |
Ratios to Average Net Assets B,F,G | | | | | | | | | | | | |
| Expenses before reductions | | .57% H | | .57% | | .56% | | .58% | | .59% | | .59% |
| Expenses net of fee waivers, if any | | .56% H | | .56% | | .56% | | .58% | | .59% | | .59% |
| Expenses net of all reductions | | .56% H | | .56% | | .56% | | .57% | | .58% | | .59% |
| Net investment income (loss) | | 1.67% H | | 1.22% | | .91% | | 1.35% | | 1.71% | | 1.53% |
| Supplemental Data | | | | | | | | | | | | |
| Net assets, end of period (000 omitted) | $ | 37,033 | $ | 35,778 | $ | 41,039 | $ | 30,072 | $ | 19,258 | $ | 16,616 |
Portfolio turnover rate I | | 28% H | | 37% | | 33% | | 62% | | 41% | | 55% |
A Calculated based on average shares outstanding during the period.
B Net investment income (loss) is affected by the timing of the declaration of dividends by any underlying mutual funds or exchange-traded funds (ETFs). Net investment income (loss) of any mutual funds or ETFs is not included in the Fund's net investment income (loss) ratio.
C Total returns for periods of less than one year are not annualized.
D Total returns do not reflect charges attributable to your insurance company's separate account. Inclusion of these charges would reduce the total returns shown.
E Total returns would have been lower if certain expenses had not been reduced during the applicable periods shown.
F Fees and expenses of any underlying mutual funds or exchange-traded funds (ETFs) are not included in the Fund's expense ratio. The Fund indirectly bears its proportionate share of these expenses. For additional expense information related to investments in Fidelity Central Funds, please refer to the "Investments in Fidelity Central Funds" note found in the Notes to Financial Statements section of the most recent Annual or Semi-Annual report.
G Expense ratios reflect operating expenses of the class. Expenses before reductions do not reflect amounts reimbursed, waived, or reduced through arrangements with the investment adviser, brokerage services, or other offset arrangements, if applicable, and do not represent the amount paid by the class during periods when reimbursements, waivers or reductions occur.
H Annualized.
I Amount does not include the portfolio activity of any underlying mutual funds or exchange-traded funds (ETFs).
| VIP Balanced Portfolio Service Class 2 |
| |
| | Six months ended (Unaudited) June 30, 2023 | | Years ended December 31, 2022 | | 2021 | | 2020 | | 2019 | | 2018 |
Selected Per-Share Data | | | | | | | | | | | | |
| Net asset value, beginning of period | $ | 18.74 | $ | 24.52 | $ | 22.64 | $ | 19.02 | $ | 16.37 | $ | 18.33 |
| Income from Investment Operations | | | | | | | | | | | | |
Net investment income (loss) A,B | | .15 | | .22 | | .18 | | .24 | | .28 | | .25 |
| Net realized and unrealized gain (loss) | | 2.38 | | (4.48) | | 3.68 | | 3.91 | | 3.51 | | (1.04) |
| Total from investment operations | | 2.53 | | (4.26) | | 3.86 | | 4.15 | | 3.79 | | (.79) |
| Distributions from net investment income | | (.06) | | (.22) | | (.18) | | (.25) | | (.28) | | (.23) |
| Distributions from net realized gain | | (.75) | | (1.30) | | (1.81) | | (.28) | | (.86) | | (.94) |
| Total distributions | | (.81) | | (1.52) | | (1.98) C | | (.53) | | (1.14) | | (1.17) |
| Net asset value, end of period | $ | 20.46 | $ | 18.74 | $ | 24.52 | $ | 22.64 | $ | 19.02 | $ | 16.37 |
Total Return D,E,F | | 13.75% | | (18.19)% | | 17.99% | | 22.13% | | 24.11% | | (4.44)% |
Ratios to Average Net Assets B,G,H | | | | | | | | | | | | |
| Expenses before reductions | | .72% I | | .72% | | .71% | | .73% | | .74% | | .74% |
| Expenses net of fee waivers, if any | | .71% I | | .71% | | .71% | | .73% | | .74% | | .74% |
| Expenses net of all reductions | | .71% I | | .71% | | .71% | | .72% | | .73% | | .74% |
| Net investment income (loss) | | 1.52% I | | 1.07% | | .76% | | 1.20% | | 1.56% | | 1.39% |
| Supplemental Data | | | | | | | | | | | | |
| Net assets, end of period (000 omitted) | $ | 2,409,494 | $ | 2,104,753 | $ | 2,562,199 | $ | 1,985,175 | $ | 1,492,773 | $ | 1,045,617 |
Portfolio turnover rate J | | 28% I | | 37% | | 33% | | 62% | | 41% | | 55% |
A Calculated based on average shares outstanding during the period.
B Net investment income (loss) is affected by the timing of the declaration of dividends by any underlying mutual funds or exchange-traded funds (ETFs). Net investment income (loss) of any mutual funds or ETFs is not included in the Fund's net investment income (loss) ratio.
C Total distributions per share do not sum due to rounding.
D Total returns for periods of less than one year are not annualized.
E Total returns do not reflect charges attributable to your insurance company's separate account. Inclusion of these charges would reduce the total returns shown.
F Total returns would have been lower if certain expenses had not been reduced during the applicable periods shown.
G Fees and expenses of any underlying mutual funds or exchange-traded funds (ETFs) are not included in the Fund's expense ratio. The Fund indirectly bears its proportionate share of these expenses. For additional expense information related to investments in Fidelity Central Funds, please refer to the "Investments in Fidelity Central Funds" note found in the Notes to Financial Statements section of the most recent Annual or Semi-Annual report.
H Expense ratios reflect operating expenses of the class. Expenses before reductions do not reflect amounts reimbursed, waived, or reduced through arrangements with the investment adviser, brokerage services, or other offset arrangements, if applicable, and do not represent the amount paid by the class during periods when reimbursements, waivers or reductions occur.
I Annualized.
J Amount does not include the portfolio activity of any underlying mutual funds or exchange-traded funds (ETFs).
| VIP Balanced Portfolio Investor Class |
| |
| | Six months ended (Unaudited) June 30, 2023 | | Years ended December 31, 2022 | | 2021 | | 2020 | | 2019 | | 2018 |
Selected Per-Share Data | | | | | | | | | | | | |
| Net asset value, beginning of period | $ | 19.17 | $ | 25.04 | $ | 23.08 | $ | 19.37 | $ | 16.64 | $ | 18.61 |
| Income from Investment Operations | | | | | | | | | | | | |
Net investment income (loss) A,B | | .17 | | .26 | | .22 | | .27 | | .31 | | .28 |
| Net realized and unrealized gain (loss) | | 2.43 | | (4.58) | | 3.76 | | 4.00 | | 3.59 | | (1.05) |
| Total from investment operations | | 2.60 | | (4.32) | | 3.98 | | 4.27 | | 3.90 | | (.77) |
| Distributions from net investment income | | (.06) | | (.25) | | (.21) | | (.28) | | (.31) | | (.26) |
| Distributions from net realized gain | | (.75) | | (1.30) | | (1.81) | | (.28) | | (.86) | | (.94) |
| Total distributions | | (.81) | | (1.55) | | (2.02) | | (.56) | | (1.17) | | (1.20) |
| Net asset value, end of period | $ | 20.96 | $ | 19.17 | $ | 25.04 | $ | 23.08 | $ | 19.37 | $ | 16.64 |
Total Return C,D,E | | 13.84% | | (18.03)% | | 18.17% | | 22.35% | | 24.38% | | (4.28)% |
Ratios to Average Net Assets A,F,G | | | | | | | | | | | | |
| Expenses before reductions | | .54% H | | .54% | | .54% | | .56% | | .57% | | .57% |
| Expenses net of fee waivers, if any | | .54% H | | .54% | | .54% | | .55% | | .57% | | .57% |
| Expenses net of all reductions | | .54% H | | .54% | | .54% | | .55% | | .56% | | .57% |
| Net investment income (loss) | | 1.70% H | | 1.25% | | .93% | | 1.37% | | 1.73% | | 1.56% |
| Supplemental Data | | | | | | | | | | | | |
| Net assets, end of period (000 omitted) | $ | 3,787,960 | $ | 3,435,461 | $ | 4,478,013 | $ | 3,696,708 | $ | 3,152,822 | $ | 2,599,494 |
Portfolio turnover rate I | | 28% H | | 37% | | 33% | | 62% | | 41% | | 55% |
A Net investment income (loss) is affected by the timing of the declaration of dividends by any underlying mutual funds or exchange-traded funds (ETFs). Net investment income (loss) of any mutual funds or ETFs is not included in the Fund's net investment income (loss) ratio.
B Calculated based on average shares outstanding during the period.
C Total returns for periods of less than one year are not annualized.
D Total returns do not reflect charges attributable to your insurance company's separate account. Inclusion of these charges would reduce the total returns shown.
E Total returns would have been lower if certain expenses had not been reduced during the applicable periods shown.
F Fees and expenses of any underlying mutual funds or exchange-traded funds (ETFs) are not included in the Fund's expense ratio. The Fund indirectly bears its proportionate share of these expenses. For additional expense information related to investments in Fidelity Central Funds, please refer to the "Investments in Fidelity Central Funds" note found in the Notes to Financial Statements section of the most recent Annual or Semi-Annual report.
G Expense ratios reflect operating expenses of the class. Expenses before reductions do not reflect amounts reimbursed, waived, or reduced through arrangements with the investment adviser, brokerage services, or other offset arrangements, if applicable, and do not represent the amount paid by the class during periods when reimbursements, waivers or reductions occur.
H Annualized.
I Amount does not include the portfolio activity of any underlying mutual funds or exchange-traded funds (ETFs).
For the period ended June 30, 2023
1. Organization.
VIP Balanced Portfolio (the Fund) is a fund of Variable Insurance Products Fund III (the Trust) and is authorized to issue an unlimited number of shares. The Trust is registered under the Investment Company Act of 1940, as amended (the 1940 Act), as an open-end management investment company organized as a Massachusetts business trust. Shares of the Fund may only be purchased by insurance companies for the purpose of funding variable annuity or variable life insurance contracts. The Fund offers the following classes of shares: Initial Class shares, Service Class shares, Service Class 2 shares and Investor Class shares. All classes have equal rights and voting privileges, except for matters affecting a single class.
2. Investments in Fidelity Central Funds.
Funds may invest in Fidelity Central Funds, which are open-end investment companies generally available only to other investment companies and accounts managed by the investment adviser and its affiliates. The Schedule of Investments lists any Fidelity Central Funds held as an investment as of period end, but does not include the underlying holdings of each Fidelity Central Fund. An investing fund indirectly bears its proportionate share of the expenses of the underlying Fidelity Central Funds.
Based on its investment objective, each Fidelity Central Fund may invest or participate in various investment vehicles or strategies that are similar to those of the investing fund. These strategies are consistent with the investment objectives of the investing fund and may involve certain economic risks which may cause a decline in value of each of the Fidelity Central Funds and thus a decline in the value of the investing fund.
| Fidelity Central Fund | Investment Manager | Investment Objective | Investment Practices | Expense Ratio A |
| Fidelity VIP Investment Grade Central Fund | Fidelity Management & Research Company LLC (FMR) | Seeks a high level of current income by normally investing in investment-grade debt securities and repurchase agreements. | Delayed Delivery & When Issued Securities Restricted Securities | Less than .005% |
| Fidelity Money Market Central Funds | Fidelity Management & Research Company LLC (FMR) | Each fund seeks to obtain a high level of current income consistent with the preservation of capital and liquidity. | Short-term Investments | Less than .005% |
A Expenses expressed as a percentage of average net assets and are as of each underlying Central Fund's most recent annual or semi-annual shareholder report.
An unaudited holdings listing for the investing fund, which presents direct holdings as well as the pro-rata share of any securities and other investments held indirectly through its investment in underlying non-money market Fidelity Central Funds, is available at fidelity.com and/or institutional.fidelity.com, as applicable. A complete unaudited list of holdings for each Fidelity Central Fund is available upon request or at the Securities and Exchange Commission website at www.sec.gov. In addition, the financial statements of the Fidelity Central Funds which contain the significant accounting policies (including investment valuation policies) of those funds, and are not covered by the Report of Independent Registered Public Accounting Firm, are available on the Securities and Exchange Commission website or upon request.
3. Significant Accounting Policies.
The Fund is an investment company and applies the accounting and reporting guidance of the Financial Accounting Standards Board (FASB) Accounting Standards Codification Topic 946 Financial Services - Investment Companies . The financial statements have been prepared in conformity with accounting principles generally accepted in the United States of America (GAAP), which require management to make certain estimates and assumptions at the date of the financial statements. Actual results could differ from those estimates. Subsequent events, if any, through the date that the financial statements were issued have been evaluated in the preparation of the financial statements. The Fund's Schedule of Investments lists any underlying mutual funds or exchange-traded funds (ETFs) but does not include the underlying holdings of these funds. The following summarizes the significant accounting policies of the Fund:
Investment Valuation. Investments are valued as of 4:00 p.m. Eastern time on the last calendar day of the period. The Board of Trustees (the Board) has designated the Fund's investment adviser as the valuation designee responsible for the fair valuation function and performing fair value determinations as needed. The investment adviser has established a Fair Value Committee (the Committee) to carry out the day-to-day fair valuation responsibilities and has adopted policies and procedures to govern the fair valuation process and the activities of the Committee. In accordance with these fair valuation policies and procedures, which have been approved by the Board, the Fund attempts to obtain prices from one or more third party pricing services or brokers to value its investments. When current market prices, quotations or currency exchange rates are not readily available or reliable, investments will be fair valued in good faith by the Committee, in accordance with the policies and procedures. Factors used in determining fair value vary by investment type and may include market or investment specific events, transaction data, estimated cash flows, and market observations of comparable investments. The frequency that the fair valuation procedures are used cannot be predicted and they may be utilized to a significant extent. The Committee manages the Fund's fair valuation practices and maintains the fair valuation policies and procedures. The Fund's investment adviser reports to the Board information regarding the fair valuation process and related material matters.
The Fund categorizes the inputs to valuation techniques used to value its investments into a disclosure hierarchy consisting of three levels as shown below:
Level 1 - unadjusted quoted prices in active markets for identical investments
Level 2 - other significant observable inputs (including quoted prices for similar investments, interest rates, prepayment speeds, etc.)
Level 3 - unobservable inputs (including the Fund's own assumptions based on the best information available)
Valuation techniques used to value the Fund's investments by major category are as follows:
Equity securities, including restricted securities, for which market quotations are readily available, are valued at the last reported sale price or official closing price as reported by a third party pricing service on the primary market or exchange on which they are traded and are categorized as Level 1 in the hierarchy. In the event there were no sales during the day or closing prices are not available, securities are valued at the last quoted bid price or may be valued using the last available price and are generally categorized as Level 2 in the hierarchy. For foreign equity securities, when market or security specific events arise, comparisons to the valuation of ADRs, futures contracts, ETFs and certain indexes as well as quoted prices for similar securities may be used and would be categorized as Level 2 in the hierarchy. For equity securities, including restricted securities, where observable inputs are limited, assumptions about market activity and risk are used and these securities may be categorized as Level 3 in the hierarchy.
Debt securities, including restricted securities, are valued based on evaluated prices received from third party pricing services or from brokers who make markets in such securities. Preferred securities and U.S. government and government agency obligations are valued by pricing services who utilize matrix pricing which considers yield or price of bonds of comparable quality, coupon, maturity and type or by broker-supplied prices. When independent prices are unavailable or unreliable, debt securities may be valued utilizing pricing methodologies which consider similar factors that would be used by third party pricing services. Debt securities are generally categorized as Level 2 in the hierarchy but may be Level 3 depending on the circumstances.
Futures contracts are valued at the settlement price established each day by the board of trade or exchange on which they are traded and are categorized as Level 1 in the hierarchy. Investments in open-end mutual funds ,including the Fidelity Central Funds, are valued at their closing net asset value (NAV) each business day and are categorized as Level 1 in the hierarchy.
Changes in valuation techniques may result in transfers in or out of an assigned level within the disclosure hierarchy. The aggregate value of investments by input level as of June 30, 2023 is included at the end of Fund's Schedule of Investments.
Foreign Currency. Certain Funds may use foreign currency contracts to facilitate transactions in foreign-denominated securities. Gains and losses from these transactions may arise from changes in the value of the foreign currency or if the counterparties do not perform under the contracts' terms.
Foreign-denominated assets, including investment securities, and liabilities are translated into U.S. dollars at the exchange rates at period end. Purchases and sales of investment securities, income and dividends received, and expenses denominated in foreign currencies are translated into U.S. dollars at the exchange rate in effect on the transaction date.
The effects of exchange rate fluctuations on investments are included with the net realized and unrealized gain (loss) on investment securities. Other foreign currency transactions resulting in realized and unrealized gain (loss) are disclosed separately.
Investment Transactions and Income. For financial reporting purposes, the Fund's investment holdings and NAV include trades executed through the end of the last business day of the period. The NAV per share for processing shareholder transactions is calculated as of the close of business of the New York Stock Exchange (NYSE), normally 4:00 p.m. Eastern time and includes trades executed through the end of the prior business day. Gains and losses on securities sold are determined on the basis of identified cost and include proceeds received from litigation. Commissions paid to certain brokers with whom the investment adviser, or its affiliates, places trades on behalf of a fund include an amount in addition to trade execution, which may be rebated back to a fund. Any such rebates are included in net realized gain (loss) on investments in the Statement of Operations. Dividend income is recorded on the ex-dividend date, except for certain dividends from foreign securities where the ex-dividend date may have passed, which are recorded as soon as the Fund is informed of the ex-dividend date. Non-cash dividends included in dividend income, if any, are recorded at the fair market value of the securities received. Income and capital gain distributions from Fidelity Central Funds, if any, are recorded on the ex-dividend date. Certain distributions received by the Fund represent a return of capital or capital gain. The Fund determines the components of these distributions subsequent to the ex-dividend date, based upon receipt of tax filings or other correspondence relating to the underlying investment. These distributions are recorded as a reduction of cost of investments and/or as a realized gain. Interest income is accrued as earned and includes coupon interest and amortization of premium and accretion of discount on debt securities as applicable. Investment income is recorded net of foreign taxes withheld where recovery of such taxes is uncertain. Funds may file withholding tax reclaims in certain jurisdictions to recover a portion of amounts previously withheld. Any withholding tax reclaims income is included in the Statement of Operations in dividends. Any receivables for withholding tax reclaims are included in the Statement of Assets and Liabilities in dividends receivable.
Class Allocations and Expenses. Investment income, realized and unrealized capital gains and losses, common expenses of a fund, and certain fund-level expense reductions, if any, are allocated daily on a pro-rata basis to each class based on the relative net assets of each class to the total net assets of a fund. Each class differs with respect to transfer agent and distribution and service plan fees incurred, as applicable. Certain expense reductions may also differ by class, if applicable. For the reporting period, the allocated portion of income and expenses to each class as a percent of its average net assets may vary due to the timing of recording these transactions in relation to fluctuating net assets of the classes. Expenses directly attributable to a fund are charged to that fund. Expenses attributable to more than one fund are allocated among the respective funds on the basis of relative net assets or other appropriate methods. Expenses included in the accompanying financial statements reflect the expenses of that fund and do not include any expenses associated with any underlying mutual funds or exchange-traded funds (ETFs). Although not included in a fund's expenses, a fund indirectly bears its proportionate share of these expenses through the net asset value of each underlying mutual fund or exchange-traded fund (ETF). Expense estimates are accrued in the period to which they relate and adjustments are made when actual amounts are known.
Income Tax Information and Distributions to Shareholders. Each year, the Fund intends to qualify as a regulated investment company under Subchapter M of the Internal Revenue Code, including distributing substantially all of its taxable income and realized gains. As a result, no provision for U.S. Federal income taxes is required. The Fund files a U.S. federal tax return, in addition to state and local tax returns as required. The Fund's federal income tax returns are subject to examination by the Internal Revenue Service (IRS) for a period of three fiscal years after they are filed. State and local tax returns may be subject to examination for an additional fiscal year depending on the jurisdiction. Foreign taxes are provided for based on the Fund's understanding of the tax rules and rates that exist in the foreign markets in which it invests. The Fund is subject to a tax imposed on capital gains by certain countries in which it invests. An estimated deferred tax liability for net unrealized appreciation on the applicable securities is included in Other payables and accrued expenses on the Statement of Assets & Liabilities.
Distributions are declared and recorded on the ex-dividend date. Income and capital gain distributions are declared separately for each class. Income and capital gain distributions are determined in accordance with income tax regulations, which may differ from GAAP.
Capital accounts within the financial statements are adjusted for permanent book-tax differences. These adjustments have no impact on net assets or the results of operations. Capital accounts are not adjusted for temporary book-tax differences which will reverse in a subsequent period.
Book-tax differences are primarily due to futures contracts, foreign currency transactions, certain foreign taxes, passive foreign investment companies (PFIC), partnerships and losses deferred due to wash sales.
As of period end, the cost and unrealized appreciation (depreciation) in securities, and derivatives if applicable, for federal income tax purposes were as follows:
| Gross unrealized appreciation | $1,607,739,351 |
| Gross unrealized depreciation | (431,591,100) |
| Net unrealized appreciation (depreciation) | $1,176,148,251 |
| Tax cost | $5,363,939,859 |
Restricted Securities (including Private Placements). Funds may invest in securities that are subject to legal or contractual restrictions on resale. These securities generally may be resold in transactions exempt from registration or to the public if the securities are registered. Disposal of these securities may involve time-consuming negotiations and expense, and prompt sale at an acceptable price may be difficult. Information regarding restricted securities held at period end is included at the end of the Schedule of Investments, if applicable.
4. Derivative Instruments.
Risk Exposures and the Use of Derivative Instruments. The Fund's investment objectives allow for various types of derivative instruments, including futures contracts. Derivatives are investments whose value is primarily derived from underlying assets, indices or reference rates and may be transacted on an exchange or over-the-counter (OTC). Derivatives may involve a future commitment to buy or sell a specified asset based on specified terms, to exchange future cash flows at periodic intervals based on a notional principal amount, or for one party to make one or more payments upon the occurrence of specified events in exchange for periodic payments from the other party.
Derivatives were used to increase returns and to manage exposure to certain risks as defined below. The success of any strategy involving derivatives depends on analysis of numerous economic factors, and if the strategies for investment do not work as intended, the objectives may not be achieved.
Derivatives were used to increase or decrease exposure to the following risk(s):
| | |
| Equity Risk | Equity risk relates to the fluctuations in the value of financial instruments as a result of changes in market prices (other than those arising from interest rate risk or foreign exchange risk), whether caused by factors specific to an individual investment, its issuer, or all factors affecting all instruments traded in a market or market segment. |
Funds are also exposed to additional risks from investing in derivatives, such as liquidity risk and counterparty credit risk. Liquidity risk is the risk that a fund will be unable to close out the derivative in the open market in a timely manner. Counterparty credit risk is the risk that the counterparty will not be able to fulfill its obligation to a fund. Counterparty credit risk related to exchange-traded contracts may be mitigated by the protection provided by the exchange on which they trade.
Investing in derivatives may involve greater risks than investing in the underlying assets directly and, to varying degrees, may involve risk of loss in excess of any initial investment and collateral received and amounts recognized in the Statement of Assets and Liabilities. In addition, there may be the risk that the change in value of the derivative contract does not correspond to the change in value of the underlying instrument.
Futures Contracts. A futures contract is an agreement between two parties to buy or sell a specified underlying instrument for a fixed price at a specified future date. Futures contracts were used to manage exposure to the stock market.
Upon entering into a futures contract, a fund is required to deposit either cash or securities (initial margin) with a clearing broker in an amount equal to a certain percentage of the face value of the contract. Futures contracts are marked-to-market daily and subsequent daily payments are made or received by a fund depending on the daily fluctuations in the value of the futures contracts and are recorded as unrealized appreciation or (depreciation). This receivable and/or payable, if any, is included in daily variation margin on futures contracts in the Statement of Assets and Liabilities. Realized gain or (loss) is recorded upon the expiration or closing of a futures contract. The net realized gain (loss) and change in net unrealized appreciation (depreciation) on futures contracts during the period is presented in the Statement of Operations.
Any open futures contracts at period end are presented in the Schedule of Investments under the caption "Futures Contracts". The notional amount at value reflects each contract's exposure to the underlying instrument or index at period end, and is representative of volume of activity during the period unless an average notional amount is presented. Any securities deposited to meet initial margin requirements are identified in the Schedule of Investments. Any cash deposited to meet initial margin requirements is presented as segregated cash with brokers for derivative instruments in the Statement of Assets and Liabilities.
5. Purchases and Sales of Investments.
Purchases and sales of securities, other than short-term securities and in-kind transactions, as applicable, are noted in the table below.
| | Purchases ($) | Sales ($) |
| VIP Balanced Portfolio | 862,077,561 | 923,982,665 |
6. Fees and Other Transactions with Affiliates.
Management Fee. Fidelity Management & Research Company LLC (the investment adviser) and its affiliates provide the Fund with investment management related services for which the Fund pays a monthly management fee. The management fee is the sum of an individual fund fee rate that is based on an annual rate of .15% of the Fund's average net assets and an annualized group fee rate that averaged .23% during the period. The group fee rate is based upon the monthly average net assets of a group of registered investment companies with which the investment adviser has management contracts. The group fee rate decreases as assets under management increase and increases as assets under management decrease. For the reporting period, the total annualized management fee rate was .38% of the Fund's average net assets.
Distribution and Service Plan Fees. In accordance with Rule 12b-1 of the 1940 Act, the Fund has adopted separate 12b-1 Plans for each Service Class of shares. Each Service Class pays Fidelity Distributors Company LLC (FDC), an affiliate of the investment adviser, a service fee. For the period, the service fee is based on an annual rate of .10% of Service Class' average net assets and .25% of Service Class 2's average net assets.
For the period, total fees, all of which were re-allowed to insurance companies for the distribution of shares and providing shareholder support services, were as follows:
| Service Class | $17,640 |
| Service Class 2 | 2,813,280 |
| | $2,830,920 |
Transfer Agent Fees. Fidelity Investments Institutional Operations Company LLC (FIIOC), an affiliate of the investment adviser, is the Fund's transfer, dividend disbursing, and shareholder servicing agent. FIIOC receives an asset-based fee with respect to each class. Each class pays a fee for transfer agent services, typesetting and printing and mailing of shareholder reports, excluding mailing of proxy statements. For the period, transfer agent fees for each class were as follows:
| | Amount | % of Class-Level Average Net Assets A |
| Initial Class | $ 87,971 | .06 |
| Service Class | 11,113 | .06 |
| Service Class 2 | 708,947 | .06 |
| Investor Class | 2,511,824 | .14 |
| | $3,319,855 | |
A Annualized
Accounting Fees. Fidelity Service Company, Inc. (FSC), an affiliate of the investment adviser, maintains the Fund's accounting records. The accounting fee is based on the level of average net assets for each month. For the period, the fees were equivalent to the following annualized rates:
| | % of Average Net Assets |
| VIP Balanced Portfolio | .02 |
Brokerage Commissions. A portion of portfolio transactions were placed with brokerage firms which are affiliates of the investment adviser. Brokerage commissions are included in net realized gain (loss) and change in net unrealized appreciation (depreciation) in the Statement of Operations. The commissions paid to these affiliated firms were as follows:
| | Amount |
| VIP Balanced Portfolio | $ 11,634 |
| |
Interfund Lending Program. Pursuant to an Exemptive Order issued by the Securities and Exchange Commission (the SEC), the Fund, along with other registered investment companies having management contracts with Fidelity Management & Research Company LLC (FMR), or other affiliated entities of FMR, may participate in an interfund lending program. This program provides an alternative credit facility allowing the Fund to borrow from, or lend money to, other participating affiliated funds. At period end, there were no interfund loans outstanding. Activity in this program during the period for which loans were outstanding was as follows:
| | Borrower or Lender | Average Loan Balance | Weighted Average Interest Rate | Interest Expense |
| VIP Balanced Portfolio | Borrower | $ 11,067,000 | 4.57% | $7,017 |
Interfund Trades. Funds may purchase from or sell securities to other Fidelity Funds under procedures adopted by the Board. The procedures have been designed to ensure these interfund trades are executed in accordance with Rule 17a-7 of the 1940 Act. Any interfund trades are included within the respective purchases and sales amounts shown in the Purchases and Sales of Investments note. Interfund trades during the period are noted in the table below.
| | Purchases ($) | Sales ($) | Realized Gain (Loss) ($) |
| VIP Balanced Portfolio | 35,414,967 | 44,549,391 | 68,067 |
Other. During the period, the investment adviser reimbursed the Fund for certain losses as follows:
| | Amount ($) |
| VIP Balanced Portfolio | 16,539 |
7. Committed Line of Credit.
Certain Funds participate with other funds managed by the investment adviser or an affiliate in a $4.25 billion credit facility (the "line of credit") to be utilized for temporary or emergency purposes to fund shareholder redemptions or for other short-term liquidity purposes. The participating funds have agreed to pay commitment fees on their pro-rata portion of the line of credit, which are reflected in Miscellaneous expenses on the Statement of Operations, and are listed below. During the period, there were no borrowings on this line of credit.
| | Amount |
| | |
| VIP Balanced Portfolio | $5,905 |
8. Security Lending.
Funds lend portfolio securities from time to time in order to earn additional income. Lending agents are used, including National Financial Services (NFS), an affiliate of the investment adviser. Pursuant to a securities lending agreement, NFS will receive a fee, which is capped at 9.9% of a fund's daily lending revenue, for its services as lending agent. A fund may lend securities to certain qualified borrowers, including NFS. On the settlement date of the loan, a fund receives collateral (in the form of U.S. Treasury obligations, letters of credit and/or cash) against the loaned securities and maintains collateral in an amount not less than 100% of the market value of the loaned securities during the period of the loan. The market value of the loaned securities is determined at the close of business of a fund and any additional required collateral is delivered to a fund on the next business day. A fund or borrower may terminate the loan at any time, and if the borrower defaults on its obligation to return the securities loaned because of insolvency or other reasons, a fund may apply collateral received from the borrower against the obligation. A fund may experience delays and costs in recovering the securities loaned. Any cash collateral received is invested in the Fidelity Securities Lending Cash Central Fund. Any loaned securities are identified as such in the Schedule of Investments, and the value of loaned securities and cash collateral at period end, as applicable, are presented in the Statement of Assets and Liabilities. Security lending income represents the income earned on investing cash collateral, less rebates paid to borrowers and any lending agent fees associated with the loan, plus any premium payments received for lending certain types of securities. Security lending income is presented in the Statement of Operations as a component of income from Fidelity Central Funds. Affiliated security lending activity, if any, was as follows:
| | Total Security Lending Fees Paid to NFS | Security Lending Income From Securities Loaned to NFS | Value of Securities Loaned to NFS at Period End |
| VIP Balanced Portfolio | $4,949 | $ 5,798 | $652,960 |
9. Expense Reductions.
During the period the investment adviser or an affiliate reimbursed and/or waived a portion of fund-level operating expenses in the amount of $139,530.
10. Distributions to Shareholders.
Distributions to shareholders of each class were as follows:
| | Six months ended June 30, 2023 | Year ended December 31, 2022 |
| VIP Balanced Portfolio | | |
| Distributions to shareholders | | |
| Initial Class | $ 11,071,181 | $20,604,790 |
| Service Class | 1,381,888 | 2,493,974 |
| Service Class 2 | 90,570,783 | 160,737,445 |
| Investor Class | 144,454,654 | 276,579,099 |
Total | $247,478,506 | $460,415,308 |
11. Share Transactions.
Transactions for each class of shares were as follows and may contain in-kind transactions:
| | Shares | Shares | Dollars | Dollars |
| | Six months ended June 30, 2023 | Year ended December 31, 2022 | Six months ended June 30, 2023 | Year ended December 31, 2022 |
| VIP Balanced Portfolio | | | | |
| Initial Class | | | | |
| Shares sold | 319,322 | 1,835,940 | $6,411,427 | $39,365,194 |
| Reinvestment of distributions | 553,836 | 922,872 | 11,071,181 | 20,604,790 |
| Shares redeemed | (769,023) | (2,172,887) | (15,326,163) | (45,541,686) |
| Net increase (decrease) | 104,135 | 585,925 | $2,156,445 | $14,428,298 |
| Service Class | | | | |
| Shares sold | 125,410 | 502,131 | $2,476,312 | $10,709,871 |
| Reinvestment of distributions | 69,828 | 112,708 | 1,381,888 | 2,493,974 |
| Shares redeemed | (294,648) | (387,864) | (5,868,002) | (8,164,125) |
| Net increase (decrease) | (99,410) | 226,975 | $(2,009,802) | $5,039,720 |
| Service Class 2 | | | | |
| Shares sold | 5,994,418 | 14,124,040 | $117,094,022 | $289,431,617 |
| Reinvestment of distributions | 4,690,356 | 7,416,339 | 90,570,783 | 160,737,445 |
| Shares redeemed | (5,223,477) | (13,745,239) | (101,338,420) | (277,401,627) |
| Net increase (decrease) | 5,461,297 | 7,795,140 | $106,326,385 | $172,767,435 |
| Investor Class | | | | |
| Shares sold | 992,221 | 2,608,451 | $19,749,276 | $55,900,558 |
| Reinvestment of distributions | 7,310,458 | 12,498,473 | 144,454,654 | 276,579,099 |
| Shares redeemed | (6,791,767) | (14,736,457) | (134,537,485) | (299,629,749) |
| Net increase (decrease) | 1,510,912 | 370,467 | $29,666,445 | $32,849,908 |
12. Other.
A fund's organizational documents provide former and current trustees and officers with a limited indemnification against liabilities arising in connection with the performance of their duties to the fund. In the normal course of business, a fund may also enter into contracts that provide general indemnifications. A fund's maximum exposure under these arrangements is unknown as this would be dependent on future claims that may be made against a fund. The risk of material loss from such claims is considered remote.
At the end of the period, the investment adviser or its affiliates were owners of record of more than 10% and certain otherwise unaffiliated shareholders were owners of record of more than 10% of the outstanding shares as follows:
| Fund | Affiliated % | Number ofUnaffiliated Shareholders | Unaffiliated Shareholders % |
| VIP Balanced Portfolio | 60% | 1 | 19% |
13. Risk and Uncertainties.
Many factors affect a fund's performance. Developments that disrupt global economies and financial markets, such as pandemics, epidemics, outbreaks of infectious diseases, war, terrorism, and environmental disasters, may significantly affect a fund's investment performance. The effects of these developments to a fund will be impacted by the types of securities in which a fund invests, the financial condition, industry, economic sector, and geographic location of an issuer, and a fund's level of investment in the securities of that issuer. Significant concentrations in security types, issuers, industries, sectors, and geographic locations may magnify the factors that affect a fund's performance.
As a shareholder, you incur two types of costs: (1) transaction costs, which may include sales charges (loads) on purchase payments or redemption proceeds, as applicable and (2) ongoing costs, which generally include management fees, distribution and/or service (12b-1) fees and other Fund expenses. This Example is intended to help you understand your ongoing costs (in dollars) of investing in a fund and to compare these costs with the ongoing costs of investing in other mutual funds.
| The Example is based on an investment of $1,000 invested at the beginning of the period and held for the entire period (January 1, 2023 to June 30, 2023). |
Actual Expenses
The first line of the accompanying table provides information about actual account values and actual expenses. You may use the information in this line, together with the amount you invested, to estimate the expenses that you paid over the period. Simply divide your account value by $1,000.00 (for example, an $8,600 account value divided by $1,000.00 = 8.6), then multiply the result by the number in the first line for a class/Fund under the heading entitled "Expenses Paid During Period" to estimate the expenses you paid on your account during this period. If any fund is a shareholder of any underlying mutual funds or exchange-traded funds (ETFs) (the Underlying Funds), such fund indirectly bears its proportional share of the expenses of the Underlying Funds in addition to the direct expenses incurred presented in the table. These fees and expenses are not included in the annualized expense ratio used to calculate the expense estimate in the table below. The estimate of expenses does not include any fees or other expenses of any variable annuity or variable life insurance product. If they were, the estimate of expenses you paid during the period would be higher, and your ending account value would be lower.
Hypothetical Example for Comparison Purposes
The second line of the accompanying table provides information about hypothetical account values and hypothetical expenses based on the actual expense ratio and an assumed rate of return of 5% per year before expenses, which is not the actual return. The hypothetical account values and expenses may not be used to estimate the actual ending account balance or expenses you paid for the period. You may use this information to compare the ongoing costs of investing in the Fund and other funds. To do so, compare this 5% hypothetical example with the 5% hypothetical examples that appear in the shareholder reports of the other funds. If any fund is a shareholder of any Underlying Funds, such fund indirectly bears its proportional share of the expenses of the Underlying Funds in addition to the direct expenses as presented in the table. These fees and expenses are not included in the annualized expense ratio used to calculate the expense estimate in the table below. The estimate of expenses does not include any fees or other expenses of any variable annuity or variable life insurance product. If they were, the estimate of expenses you paid during the period would be higher, and your ending account value would be lower.
Please note that the expenses shown in the table are meant to highlight your ongoing costs only and do not reflect any transaction costs. Therefore, the second line of the table is useful in comparing ongoing costs only, and will not help you determine the relative total costs of owning different funds. In addition, if these transactional costs were included, your costs would have been higher.
| | | | | Annualized Expense Ratio- A | | Beginning Account Value January 1, 2023 | | Ending Account Value June 30, 2023 | | Expenses Paid During Period- C January 1, 2023 to June 30, 2023 |
| VIP Balanced Portfolio | | | | | | | | | | |
| Initial Class | | | | .46% | | | | | | |
| Actual | | | | | | $ 1,000 | | $ 1,138.50 | | $ 2.44 |
Hypothetical- B | | | | | | $ 1,000 | | $ 1,022.51 | | $ 2.31 |
| Service Class | | | | .56% | | | | | | |
| Actual | | | | | | $ 1,000 | | $ 1,138.10 | | $ 2.97 |
Hypothetical- B | | | | | | $ 1,000 | | $ 1,022.02 | | $ 2.81 |
| Service Class 2 | | | | .71% | | | | | | |
| Actual | | | | | | $ 1,000 | | $ 1,137.50 | | $ 3.76 |
Hypothetical- B | | | | | | $ 1,000 | | $ 1,021.27 | | $ 3.56 |
| Investor Class | | | | .54% | | | | | | |
| Actual | | | | | | $ 1,000 | | $ 1,138.40 | | $ 2.86 |
Hypothetical- B | | | | | | $ 1,000 | | $ 1,022.12 | | $ 2.71 |
| |
A Annualized expense ratio reflects expenses net of applicable fee waivers.
B 5% return per year before expenses
C Expenses are equal to the annualized expense ratio, multiplied by the average account value over the period, multiplied by 181/ 365 (to reflect the one-half year period). The fees and expenses of any Underlying Funds are not included in each annualized expense ratio.
Board Approval of Investment Advisory Contracts
VIP Balanced Portfolio
At its May 2023 meeting, the Board of Trustees, including the Independent Trustees (together, the Board), voted to continue the management contract with Fidelity Management & Research Company LLC (FMR), and the sub-advisory agreements and sub-subadvisory agreements, in each case, where applicable (together, the Advisory Contracts) for the fund for two months from June 1, 2023 through July 31, 2023. The Board determined that it will consider the annual renewal of the fund's Advisory Contracts for a full one year period in July 2023, following its review of additional materials provided by FMR.
The Board considered that the approval of the fund's Advisory Contracts will not result in any changes in (i) the investment process or strategies employed in the management of the fund's assets; (ii) the fees and expenses paid by shareholders; (iii) the nature, extent or quality of services provided under the fund's Advisory Contracts; or (iv) the day-to-day management of the fund or the persons primarily responsible for such management. The Board also considered that since its last approval of the fund's Advisory Contracts, FMR had provided additional information on the fund in support of the annual contract renewal process, including competitive analyses on total expenses and management fees and in-depth reviews of fund performance and fund profitability information. The Board concluded that the fund's Advisory Contracts are fair and reasonable, and that the fund's Advisory Contracts should be renewed, without modification, through July 31, 2023, with the understanding that the Board will consider the annual renewal for a full one year period in July 2023.
In connection with its consideration of future renewals of the fund's Advisory Contracts, the Board will consider: (i) the nature, extent and quality of services provided to the fund, including shareholder and administrative services and investment performance; (ii) the competitiveness of the management fee and total expenses for the fund; (iii) the costs of the services and profitability, including the revenues earned and the expenses incurred in conducting the business of developing, marketing, distributing, managing, administering, and servicing the fund and its shareholders, to the extent applicable; and (iv) whether there have been economies of scale in respect of the Fidelity funds, whether the Fidelity funds (including the fund) have appropriately benefited from any such economies of scale, and whether there is the potential for realization of any further economies.
Based on its evaluation of all of the conclusions noted above, and after considering all factors it believed relevant, the Board ultimately concluded that the fund's management fee structure is fair and reasonable, and that the continuation of the fund's Advisory Contracts should be approved for two months from June 1, 2023 through July 31, 2023.
The Securities and Exchange Commission adopted Rule 22e-4 under the Investment Company Act of 1940 (the Liquidity Rule) to promote effective liquidity risk management throughout the open-end investment company industry, thereby reducing the risk that funds will be unable to meet their redemption obligations and mitigating dilution of the interests of fund shareholders.
The Fund has adopted and implemented a liquidity risk management program (the Program) reasonably designed to assess and manage the Fund's liquidity risk and to comply with the requirements of the Liquidity Rule. The Fund's Board of Trustees (the Board) has designated the Fund's investment adviser as administrator of the Program. The Fidelity advisers have established a Liquidity Risk Management Committee (the LRM Committee) to manage the Program for each of the Fidelity Funds. The LRM Committee monitors the adequacy and effectiveness of implementation of the Program and on a periodic basis assesses each Fund's liquidity risk based on a variety of factors including (1) the Fund's investment strategy, (2) portfolio liquidity and cash flow projections during normal and reasonably foreseeable stressed conditions, (3) shareholder redemptions, (4) borrowings and other funding sources and (5) certain factors specific to ETFs including the effect of the Fund's prices and spreads, market participants, and basket compositions on the overall liquidity of the Fund's portfolio, as applicable.
In accordance with the Program, each of the Fund's portfolio investments is classified into one of four defined liquidity categories based on a determination of a reasonable expectation for how long it would take to convert the investment to cash (or sell or dispose of the investment) without significantly changing its market value.
- Highly liquid investments - cash or convertible to cash within three business days or less
- Moderately liquid investments - convertible to cash in three to seven calendar days
- Less liquid investments - can be sold or disposed of, but not settled, within seven calendar days
- Illiquid investments - cannot be sold or disposed of within seven calendar days
Liquidity classification determinations take into account a variety of factors including various market, trading and investment-specific considerations, as well as market depth, and generally utilize analysis from a third-party liquidity metrics service.
The Liquidity Rule places a 15% limit on a fund's illiquid investments and requires funds that do not primarily hold assets that are highly liquid investments to determine and maintain a minimum percentage of the fund's net assets to be invested in highly liquid investments (highly liquid investment minimum or HLIM). The Program includes provisions reasonably designed to comply with the 15% limit on illiquid investments and for determining, periodically reviewing and complying with the HLIM requirement as applicable.
At a recent meeting of the Fund's Board of Trustees, the LRM Committee provided a written report to the Board pertaining to the operation, adequacy, and effectiveness of the Program for the period December 1, 2021 through November 30, 2022. The report concluded that the Program is operating effectively and is reasonably designed to assess and manage the Fund's liquidity risk.
1.705697.125
VIPBAL-SANN-0823
Item 2.
Code of Ethics
Not applicable.
Item 3.
Audit Committee Financial Expert
Not applicable.
Item 4.
Principal Accountant Fees and Services
Not applicable.
Item 5.
Audit Committee of Listed Registrants
Not applicable.
Item 6.
Investments
(a)
Not applicable.
(b)
Not applicable
Item 7.
Disclosure of Proxy Voting Policies and Procedures for Closed-End Management Investment Companies
Not applicable.
Item 8.
Portfolio Managers of Closed-End Management Investment Companies
Not applicable.
Item 9.
Purchase of Equity Securities by Closed-End Management Investment Company and Affiliated Purchasers
Not applicable.
Item 10.
Submission of Matters to a Vote of Security Holders
There were no material changes to the procedures by which shareholders may recommend nominees to the Variable Insurance Products Fund III’s Board of Trustees.
Item 11.
Controls and Procedures
(a)(i) The President and Treasurer and the Chief Financial Officer have concluded that the Variable Insurance Products Fund III’s (the “Trust”) disclosure controls and
procedures (as defined in Rule 30a-3(c) under the Investment Company Act) provide reasonable assurances that material information relating to the Trust is made known to them by the appropriate persons, based on their evaluation of these controls and procedures as of a date within 90 days of the filing date of this report.
(a)(ii) There was no change in the Trust’s internal control over financial reporting (as defined in Rule 30a-3(d) under the Investment Company Act) that occurred during the period covered by this report that has materially affected, or is reasonably likely to materially affect, the Trust’s internal control over financial reporting.
Item 12.
Disclosure of Securities Lending Activities for Closed-End Management
Investment Companies
Not applicable.
Item 13.
Exhibits
SIGNATURES
Pursuant to the requirements of the Securities Exchange Act of 1934 and the Investment Company Act of 1940, the registrant has duly caused this report to be signed on its behalf by the undersigned, thereunto duly authorized.
Variable Insurance Products Fund III
| |
By: | /s/Stacie M. Smith |
| Stacie M. Smith |
| President and Treasurer |
|
|
Date: | August 22, 2023 |
Pursuant to the requirements of the Securities Exchange Act of 1934 and the Investment Company Act of 1940, this report has been signed below by the following persons on behalf of the registrant and in the capacities and on the dates indicated.
| |
By: | /s/Stacie M. Smith |
| Stacie M. Smith |
| President and Treasurer |
|
|
Date: | August 22, 2023 |
| |
By: | /s/John J. Burke III |
| John J. Burke III |
| Chief Financial Officer |
|
|
Date: | August 22, 2023 |