UNITED STATES
SECURITIES AND EXCHANGE COMMISSION
Washington, D.C. 20549
FORM N-CSR
CERTIFIED SHAREHOLDER REPORT OF REGISTERED
MANAGEMENT INVESTMENT COMPANIES
Investment Company Act file number 811-07205
Variable Insurance Products Fund III
(Exact name of registrant as specified in charter)
245 Summer St., Boston, MA 02210
(Address of principal executive offices) (Zip code)
Cynthia Lo Bessette, Secretary
245 Summer St.
Boston, Massachusetts 02210
(Name and address of agent for service)
Registrant's telephone number, including area code:
617-563-7000
| |
Date of fiscal year end: | December 31 |
|
|
Date of reporting period: | June 30, 2021 |
Item 1.
Reports to Stockholders
Fidelity® Variable Insurance Products:
Growth & Income Portfolio
Semi-Annual Report
June 30, 2021


Contents
To view a fund's proxy voting guidelines and proxy voting record for the 12-month period ended June 30, visit http://www.fidelity.com/proxyvotingresults or visit the Securities and Exchange Commission's (SEC) web site at http://www.sec.gov.
You may also call 1-877-208-0098 to request a free copy of the proxy voting guidelines.
Fidelity® Variable Insurance Products are separate account options which are purchased through a variable insurance contract.
Standard & Poor's, S&P and S&P 500 are registered service marks of The McGraw-Hill Companies, Inc. and have been licensed for use by Fidelity Distributors Corporation.
Other third-party marks appearing herein are the property of their respective owners.
All other marks appearing herein are registered or unregistered trademarks or service marks of FMR LLC or an affiliated company. © 2021 FMR LLC. All rights reserved.
This report and the financial statements contained herein are submitted for the general information of the shareholders of the Fund. This report is not authorized for distribution to prospective investors in the Fund unless preceded or accompanied by an effective prospectus.
A fund files its complete schedule of portfolio holdings with the SEC for the first and third quarters of each fiscal year on Form N-PORT. Forms N-PORT are available on the SEC’s web site at http://www.sec.gov. A fund's Forms N-PORT may be reviewed and copied at the SEC’s Public Reference Room in Washington, DC. Information regarding the operation of the SEC's Public Reference Room may be obtained by calling 1-800-SEC-0330.
For a complete list of a fund's portfolio holdings, view the most recent holdings listing, semiannual report, or annual report on Fidelity's web site at http://www.fidelity.com, http://www.institutional.fidelity.com, or http://www.401k.com, as applicable.
NOT FDIC INSURED •MAY LOSE VALUE •NO BANK GUARANTEE
Neither the Fund nor Fidelity Distributors Corporation is a bank.
Note to Shareholders:
Early in 2020, the outbreak and spread of a new coronavirus emerged as a public health emergency that had a major influence on financial markets, primarily based on its impact on the global economy and the outlook for corporate earnings. The virus causes a respiratory disease known as COVID-19. On March 11, 2020 the World Health Organization declared the COVID-19 outbreak a pandemic, citing sustained risk of further global spread.
In the weeks following, as the crisis worsened, we witnessed an escalating human tragedy with wide-scale social and economic consequences from coronavirus-containment measures. The outbreak of COVID-19 prompted a number of measures to limit the spread, including travel and border restrictions, quarantines, and restrictions on large gatherings. In turn, these resulted in lower consumer activity, diminished demand for a wide range of products and services, disruption in manufacturing and supply chains, and – given the wide variability in outcomes regarding the outbreak – significant market uncertainty and volatility. Amid the turmoil, global governments and central banks took unprecedented action to help support consumers, businesses, and the broader economies, and to limit disruption to financial systems.
The situation continues to unfold, and the extent and duration of its impact on financial markets and the economy remain highly uncertain. Extreme events such as the coronavirus crisis are “exogenous shocks” that can have significant adverse effects on mutual funds and their investments. Although multiple asset classes may be affected by market disruption, the duration and impact may not be the same for all types of assets.
Fidelity is committed to helping you stay informed amid news about COVID-19 and during increased market volatility, and we’re taking extra steps to be responsive to customer needs. We encourage you to visit our websites, where we offer ongoing updates, commentary, and analysis on the markets and our funds.
Investment Summary (Unaudited)
Top Ten Stocks as of June 30, 2021
| | % of fund's net assets |
| Microsoft Corp. | 6.2 |
| General Electric Co. | 6.0 |
| Wells Fargo & Co. | 4.6 |
| Exxon Mobil Corp. | 4.6 |
| Bank of America Corp.(a) | 3.6 |
| Comcast Corp. Class A | 3.3 |
| Apple, Inc. | 3.1 |
| Altria Group, Inc. | 2.7 |
| United Parcel Service, Inc. Class B | 2.0 |
| Qualcomm, Inc. | 1.9 |
| | 38.0 |
(a) Security or a portion of the security is pledged as collateral for call options written.
Top Five Market Sectors as of June 30, 2021
| | % of fund's net assets |
| Information Technology | 19.4 |
| Financials | 18.0 |
| Industrials | 17.3 |
| Health Care | 14.0 |
| Energy | 8.2 |
Asset Allocation (% of fund's net assets)
| As of June 30, 2021 *,** |
| | Stocks | 98.2% |
| | Bonds | 0.1% |
| | Short-Term Investments and Net Other Assets (Liabilities) | 1.7% |

* Foreign investments - 13.0%
** Written options - (0.0)%
Percentages shown as 0.0% may reflect amounts less than 0.05%.
Schedule of Investments June 30, 2021 (Unaudited)
Showing Percentage of Net Assets
| Common Stocks - 97.9% | | | |
| | | Shares | Value |
| COMMUNICATION SERVICES - 7.2% | | | |
| Diversified Telecommunication Services - 0.7% | | | |
| Elisa Corp. (A Shares) | | 29,400 | $1,754,208 |
| Verizon Communications, Inc. | | 234,780 | 13,154,723 |
| | | | 14,908,931 |
| Entertainment - 2.5% | | | |
| Activision Blizzard, Inc. | | 87,700 | 8,370,088 |
| Nintendo Co. Ltd. ADR | | 63,900 | 4,634,667 |
| The Walt Disney Co. (a) | | 124,200 | 21,830,634 |
| Vivendi SA (b) | | 427,300 | 14,356,910 |
| | | | 49,192,299 |
| Media - 4.0% | | | |
| Comcast Corp. Class A | | 1,128,162 | 64,327,797 |
| Interpublic Group of Companies, Inc. | | 439,000 | 14,263,110 |
| | | | 78,590,907 |
|
| TOTAL COMMUNICATION SERVICES | | | 142,692,137 |
|
| CONSUMER DISCRETIONARY - 3.2% | | | |
| Auto Components - 0.7% | | | |
| BorgWarner, Inc. (c) | | 287,880 | 13,973,695 |
| Automobiles - 0.2% | | | |
| Harley-Davidson, Inc. | | 69,200 | 3,170,744 |
| Hotels, Restaurants & Leisure - 0.3% | | | |
| Churchill Downs, Inc. | | 6,000 | 1,189,560 |
| Marriott International, Inc. Class A (a) | | 10,100 | 1,378,852 |
| Starbucks Corp. | | 27,400 | 3,063,594 |
| | | | 5,632,006 |
| Household Durables - 0.7% | | | |
| Sony Group Corp. sponsored ADR | | 31,400 | 3,052,708 |
| Whirlpool Corp. (c) | | 52,600 | 11,467,852 |
| | | | 14,520,560 |
| Specialty Retail - 1.2% | | | |
| Lowe's Companies, Inc. | | 120,417 | 23,357,285 |
| Textiles, Apparel & Luxury Goods - 0.1% | | | |
| Puma AG | | 17,402 | 2,074,791 |
| Tapestry, Inc. (a) | | 900 | 39,132 |
| | | | 2,113,923 |
|
| TOTAL CONSUMER DISCRETIONARY | | | 62,768,213 |
|
| CONSUMER STAPLES - 6.7% | | | |
| Beverages - 2.1% | | | |
| Anheuser-Busch InBev SA NV ADR | | 36,300 | 2,613,963 |
| Diageo PLC sponsored ADR | | 50,100 | 9,603,669 |
| Keurig Dr. Pepper, Inc. | | 157,300 | 5,543,252 |
| Pernod Ricard SA | | 16,000 | 3,551,558 |
| Remy Cointreau SA | | 9,368 | 1,933,921 |
| The Coca-Cola Co. | | 346,453 | 18,746,572 |
| | | | 41,992,935 |
| Food & Staples Retailing - 0.7% | | | |
| Alimentation Couche-Tard, Inc. Class B (sub. vtg.) | | 11,500 | 422,576 |
| Costco Wholesale Corp. | | 1,400 | 553,938 |
| Sysco Corp. | | 154,800 | 12,035,700 |
| Walmart, Inc. | | 4,200 | 592,284 |
| | | | 13,604,498 |
| Food Products - 0.2% | | | |
| Lamb Weston Holdings, Inc. | | 41,100 | 3,315,126 |
| Household Products - 0.4% | | | |
| Colgate-Palmolive Co. | | 18,600 | 1,513,110 |
| Energizer Holdings, Inc. | | 22,100 | 949,858 |
| Procter & Gamble Co. | | 6,300 | 850,059 |
| Spectrum Brands Holdings, Inc. | | 56,900 | 4,838,776 |
| | | | 8,151,803 |
| Tobacco - 3.3% | | | |
| Altria Group, Inc. | | 1,125,700 | 53,673,376 |
| British American Tobacco PLC sponsored ADR | | 215,600 | 8,475,236 |
| Swedish Match Co. AB | | 335,500 | 2,861,008 |
| | | | 65,009,620 |
|
| TOTAL CONSUMER STAPLES | | | 132,073,982 |
|
| ENERGY - 8.2% | | | |
| Oil, Gas & Consumable Fuels - 8.2% | | | |
| Canadian Natural Resources Ltd. | | 106,300 | 3,858,906 |
| Cenovus Energy, Inc. | | 7,000 | 67,060 |
| Cenovus Energy, Inc. (Canada) | | 1,744,304 | 16,688,807 |
| Exxon Mobil Corp. | | 1,432,600 | 90,368,408 |
| Hess Corp. | | 324,400 | 28,326,608 |
| Imperial Oil Ltd. | | 90,300 | 2,752,125 |
| Kosmos Energy Ltd. (a) | | 1,165,730 | 4,033,426 |
| Magellan Midstream Partners LP | | 109,100 | 5,336,081 |
| Phillips 66 Co. | | 111,200 | 9,543,184 |
| | | | 160,974,605 |
| FINANCIALS - 18.0% | | | |
| Banks - 12.6% | | | |
| Bank of America Corp. (c) | | 1,705,812 | 70,330,629 |
| JPMorgan Chase & Co. | | 139,232 | 21,656,145 |
| M&T Bank Corp. | | 30,800 | 4,475,548 |
| PNC Financial Services Group, Inc. | | 139,872 | 26,681,983 |
| Truist Financial Corp. | | 355,104 | 19,708,272 |
| U.S. Bancorp | | 263,198 | 14,994,390 |
| Wells Fargo & Co. | | 2,013,779 | 91,204,051 |
| | | | 249,051,018 |
| Capital Markets - 3.6% | | | |
| Brookfield Asset Management, Inc. Class A | | 79,545 | 4,055,204 |
| KKR & Co. LP | | 137,593 | 8,151,009 |
| Morgan Stanley | | 90,883 | 8,333,062 |
| Northern Trust Corp. | | 207,845 | 24,031,039 |
| Raymond James Financial, Inc. | | 68,500 | 8,898,150 |
| S&P Global, Inc. | | 300 | 123,135 |
| State Street Corp. (c) | | 210,279 | 17,301,756 |
| | | | 70,893,355 |
| Consumer Finance - 0.5% | | | |
| Discover Financial Services | | 78,400 | 9,273,936 |
| Insurance - 0.9% | | | |
| American Financial Group, Inc. | | 10,500 | 1,309,560 |
| Brookfield Asset Management Reinsurance Partners Ltd. (a) | | 548 | 28,507 |
| Chubb Ltd. | | 34,800 | 5,531,112 |
| Marsh & McLennan Companies, Inc. | | 43,142 | 6,069,217 |
| Old Republic International Corp. | | 47,100 | 1,173,261 |
| The Travelers Companies, Inc. | | 23,100 | 3,458,301 |
| | | | 17,569,958 |
| Thrifts & Mortgage Finance - 0.4% | | | |
| Essent Group Ltd. | | 63,400 | 2,849,830 |
| Radian Group, Inc. | | 191,850 | 4,268,663 |
| | | | 7,118,493 |
|
| TOTAL FINANCIALS | | | 353,906,760 |
|
| HEALTH CARE - 13.6% | | | |
| Biotechnology - 0.2% | | | |
| AbbVie, Inc. | | 34,100 | 3,841,024 |
| Intercept Pharmaceuticals, Inc. (a) | | 48,358 | 965,709 |
| | | | 4,806,733 |
| Health Care Equipment & Supplies - 1.5% | | | |
| Abbott Laboratories | | 11,700 | 1,356,381 |
| Becton, Dickinson & Co. | | 25,576 | 6,219,827 |
| Boston Scientific Corp. (a) | | 318,800 | 13,631,888 |
| Danaher Corp. | | 8,600 | 2,307,896 |
| GN Store Nord A/S | | 12,500 | 1,091,888 |
| Koninklijke Philips Electronics NV (depositary receipt) (NY Reg.) (b) | | 73,582 | 3,657,025 |
| Sonova Holding AG Class B | | 6,040 | 2,271,732 |
| | | | 30,536,637 |
| Health Care Providers & Services - 5.6% | | | |
| AmerisourceBergen Corp. (c) | | 38,510 | 4,409,010 |
| Cardinal Health, Inc. | | 203,200 | 11,600,688 |
| Cigna Corp. | | 93,690 | 22,211,088 |
| CVS Health Corp. | | 294,964 | 24,611,796 |
| Humana, Inc. | | 2,900 | 1,283,888 |
| McKesson Corp. | | 104,488 | 19,982,285 |
| UDG Healthcare PLC (United Kingdom) | | 47,400 | 700,926 |
| UnitedHealth Group, Inc. | | 63,700 | 25,508,028 |
| | | | 110,307,709 |
| Pharmaceuticals - 6.3% | | | |
| Bayer AG | | 303,833 | 18,471,598 |
| Bristol-Myers Squibb Co. | | 560,900 | 37,479,338 |
| Eli Lilly & Co. | | 21,900 | 5,026,488 |
| GlaxoSmithKline PLC sponsored ADR | | 516,594 | 20,570,773 |
| Johnson & Johnson | | 189,159 | 31,162,054 |
| Sanofi SA sponsored ADR | | 91,200 | 4,802,592 |
| UCB SA | | 51,000 | 5,331,322 |
| Viatris, Inc. | | 22,500 | 321,525 |
| | | | 123,165,690 |
|
| TOTAL HEALTH CARE | | | 268,816,769 |
|
| INDUSTRIALS - 17.3% | | | |
| Aerospace & Defense - 2.3% | | | |
| Airbus Group NV (a) | | 43,800 | 5,643,755 |
| General Dynamics Corp. | | 35,800 | 6,739,708 |
| Huntington Ingalls Industries, Inc. | | 28,000 | 5,901,000 |
| MTU Aero Engines AG | | 10,900 | 2,699,965 |
| Raytheon Technologies Corp. | | 48,987 | 4,179,081 |
| Safran SA | | 22,400 | 3,108,738 |
| The Boeing Co. (a) | | 75,300 | 18,038,868 |
| | | | 46,311,115 |
| Air Freight & Logistics - 2.5% | | | |
| DSV Panalpina A/S | | 6,200 | 1,445,884 |
| Expeditors International of Washington, Inc. | | 2,095 | 265,227 |
| FedEx Corp. (c) | | 26,000 | 7,756,580 |
| United Parcel Service, Inc. Class B | | 191,072 | 39,737,244 |
| | | | 49,204,935 |
| Airlines - 0.0% | | | |
| Copa Holdings SA Class A (a) | | 200 | 15,066 |
| Building Products - 0.4% | | | |
| A.O. Smith Corp. | | 16,700 | 1,203,402 |
| Johnson Controls International PLC | | 99,600 | 6,835,548 |
| | | | 8,038,950 |
| Commercial Services & Supplies - 0.5% | | | |
| Healthcare Services Group, Inc. (b) | | 188,500 | 5,950,945 |
| HNI Corp. | | 29,000 | 1,275,130 |
| Interface, Inc. | | 124,400 | 1,903,320 |
| Ritchie Bros. Auctioneers, Inc. | | 4,000 | 237,141 |
| | | | 9,366,536 |
| Electrical Equipment - 1.3% | | | |
| Acuity Brands, Inc. | | 26,300 | 4,918,889 |
| Hubbell, Inc. Class B | | 33,679 | 6,292,584 |
| Rockwell Automation, Inc. | | 5,100 | 1,458,702 |
| Vertiv Holdings LLC (a)(d) | | 441,500 | 12,052,950 |
| | | | 24,723,125 |
| Industrial Conglomerates - 6.3% | | | |
| 3M Co. | | 36,100 | 7,170,543 |
| General Electric Co. | | 8,752,650 | 117,810,669 |
| | | | 124,981,212 |
| Machinery - 2.1% | | | |
| Allison Transmission Holdings, Inc. | | 62,900 | 2,499,646 |
| Caterpillar, Inc. (c) | | 15,600 | 3,395,028 |
| Cummins, Inc. | | 14,000 | 3,413,340 |
| Donaldson Co., Inc. | | 148,600 | 9,440,558 |
| Epiroc AB (A Shares) | | 54,400 | 1,238,343 |
| Flowserve Corp. | | 82,900 | 3,342,528 |
| Fortive Corp. | | 59,100 | 4,121,634 |
| Kardex AG | | 1,700 | 393,191 |
| Nordson Corp. | | 23,200 | 5,092,632 |
| Otis Worldwide Corp. | | 22,643 | 1,851,518 |
| Stanley Black & Decker, Inc. | | 15,400 | 3,156,846 |
| Westinghouse Air Brake Co. | | 46,521 | 3,828,678 |
| | | | 41,773,942 |
| Professional Services - 0.5% | | | |
| Equifax, Inc. | | 16,100 | 3,856,111 |
| RELX PLC (London Stock Exchange) | | 196,688 | 5,221,187 |
| Robert Half International, Inc. | | 2,600 | 231,322 |
| | | | 9,308,620 |
| Road & Rail - 0.5% | | | |
| Knight-Swift Transportation Holdings, Inc. Class A | | 210,038 | 9,548,327 |
| Trading Companies & Distributors - 0.9% | | | |
| Brenntag AG | | 8,900 | 827,580 |
| Fastenal Co. | | 32,300 | 1,679,600 |
| MSC Industrial Direct Co., Inc. Class A | | 2,000 | 179,460 |
| Watsco, Inc. | | 50,092 | 14,358,371 |
| | | | 17,045,011 |
|
| TOTAL INDUSTRIALS | | | 340,316,839 |
|
| INFORMATION TECHNOLOGY - 19.4% | | | |
| Electronic Equipment & Components - 0.3% | | | |
| CDW Corp. | | 26,300 | 4,593,295 |
| Vontier Corp. | | 48,840 | 1,591,207 |
| | | | 6,184,502 |
| IT Services - 4.3% | | | |
| Amadeus IT Holding SA Class A (a) | | 136,700 | 9,615,299 |
| DXC Technology Co. (a) | | 29,500 | 1,148,730 |
| Edenred SA | | 96,900 | 5,520,905 |
| Fidelity National Information Services, Inc. | | 109,200 | 15,470,364 |
| Genpact Ltd. | | 141,200 | 6,414,716 |
| IBM Corp. | | 49,700 | 7,285,523 |
| MasterCard, Inc. Class A | | 6,700 | 2,446,103 |
| Unisys Corp. (a) | | 210,696 | 5,332,716 |
| Visa, Inc. Class A | | 135,276 | 31,630,234 |
| | | | 84,864,590 |
| Semiconductors & Semiconductor Equipment - 4.0% | | | |
| Analog Devices, Inc. | | 38,200 | 6,576,512 |
| Applied Materials, Inc. | | 33,900 | 4,827,360 |
| Intel Corp. | | 181,000 | 10,161,340 |
| Lam Research Corp. | | 6,000 | 3,904,200 |
| Marvell Technology, Inc. | | 85,500 | 4,987,215 |
| NXP Semiconductors NV | | 53,000 | 10,903,160 |
| Qualcomm, Inc. | | 263,761 | 37,699,360 |
| | | | 79,059,147 |
| Software - 7.5% | | | |
| Microsoft Corp. | | 446,218 | 120,880,457 |
| Open Text Corp. | | 42,600 | 2,163,335 |
| SAP SE sponsored ADR (b) | | 140,600 | 19,748,676 |
| Temenos Group AG | | 29,740 | 4,776,400 |
| | | | 147,568,868 |
| Technology Hardware, Storage & Peripherals - 3.3% | | | |
| Apple, Inc. | | 442,632 | 60,622,879 |
| Samsung Electronics Co. Ltd. | | 41,980 | 2,998,041 |
| | | | 63,620,920 |
|
| TOTAL INFORMATION TECHNOLOGY | | | 381,298,027 |
|
| MATERIALS - 2.2% | | | |
| Chemicals - 0.9% | | | |
| DuPont de Nemours, Inc. | | 185,400 | 14,351,814 |
| PPG Industries, Inc. | | 22,500 | 3,819,825 |
| | | | 18,171,639 |
| Metals & Mining - 1.3% | | | |
| BHP Group Ltd. sponsored ADR (b) | | 151,300 | 11,019,179 |
| First Quantum Minerals Ltd. | | 161,900 | 3,731,432 |
| Freeport-McMoRan, Inc. | | 280,800 | 10,420,488 |
| Lundin Mining Corp. | | 3,700 | 33,370 |
| | | | 25,204,469 |
|
| TOTAL MATERIALS | | | 43,376,108 |
|
| REAL ESTATE - 1.2% | | | |
| Equity Real Estate Investment Trusts (REITs) - 1.2% | | | |
| American Tower Corp. | | 32,800 | 8,860,592 |
| CoreSite Realty Corp. | | 22,900 | 3,082,340 |
| Equinix, Inc. | | 200 | 160,520 |
| Public Storage | | 700 | 210,483 |
| Simon Property Group, Inc. | | 87,200 | 11,377,856 |
| | | | 23,691,791 |
| UTILITIES - 0.9% | | | |
| Electric Utilities - 0.7% | | | |
| Duke Energy Corp. | | 28,100 | 2,774,032 |
| Entergy Corp. | | 34,900 | 3,479,530 |
| Exelon Corp. | | 37,000 | 1,639,470 |
| Southern Co. (c) | | 90,400 | 5,470,104 |
| | | | 13,363,136 |
| Multi-Utilities - 0.2% | | | |
| CenterPoint Energy, Inc. | | 67,200 | 1,647,744 |
| Sempra Energy | | 17,900 | 2,371,392 |
| | | | 4,019,136 |
|
| TOTAL UTILITIES | | | 17,382,272 |
|
| TOTAL COMMON STOCKS | | | |
| (Cost $1,200,937,127) | | | 1,927,297,503 |
|
| Convertible Preferred Stocks - 0.3% | | | |
| HEALTH CARE - 0.3% | | | |
| Health Care Equipment & Supplies - 0.3% | | | |
| Becton, Dickinson & Co. 6.50% | | 40,000 | 2,139,200 |
| Boston Scientific Corp. Series A, 5.50% | | 23,900 | 2,758,060 |
| TOTAL CONVERTIBLE PREFERRED STOCKS | | | |
| (Cost $4,390,000) | | | 4,897,260 |
| | | Principal Amount | Value |
|
| Convertible Bonds - 0.1% | | | |
| HEALTH CARE - 0.1% | | | |
| Biotechnology - 0.1% | | | |
Intercept Pharmaceuticals, Inc. 2% 5/15/26
(Cost $2,504,442) | | 3,194,000 | 2,118,006 |
| | | Shares | Value |
|
| Money Market Funds - 3.5% | | | |
| Fidelity Cash Central Fund 0.06% (e) | | 32,446,589 | 32,453,079 |
| Fidelity Securities Lending Cash Central Fund 0.06% (e)(f) | | 37,350,633 | 37,354,368 |
| TOTAL MONEY MARKET FUNDS | | | |
| (Cost $69,807,447) | | | 69,807,447 |
| TOTAL INVESTMENT IN SECURITIES - 101.8% | | | |
| (Cost $1,277,639,016) | | | 2,004,120,216 |
| NET OTHER ASSETS (LIABILITIES) - (1.8)% | | | (36,343,439) |
| NET ASSETS - 100% | | | $1,967,776,777 |
| Written Options | | | | | | |
| | Counterparty | Number of Contracts | Notional Amount | Exercise Price | Expiration Date | Value |
| Call Options | | | | | | |
| AmerisourceBergen Corp. | Chicago Board Options Exchange | 172 | $1,969,228 | $125.00 | 8/20/21 | $(18,060) |
| AmerisourceBergen Corp. | Chicago Board Options Exchange | 172 | 1,969,228 | 130.00 | 8/20/21 | (13,330) |
| Bank of America Corp. | Chicago Board Options Exchange | 1,680 | 6,926,640 | 46.00 | 8/20/21 | (44,520) |
| BorgWarner, Inc. | Chicago Board Options Exchange | 578 | 2,805,612 | 55.00 | 7/16/21 | (1,445) |
| Caterpillar, Inc. | Chicago Board Options Exchange | 35 | 761,705 | 250.00 | 7/16/21 | (788) |
| FedEx Corp. | Chicago Board Options Exchange | 90 | 2,684,970 | 350.00 | 8/20/21 | (8,820) |
| Southern Co. | Chicago Board Options Exchange | 86 | 520,386 | 70.00 | 8/20/21 | (430) |
| State Street Corp. | Chicago Board Options Exchange | 524 | 4,311,472 | 95.00 | 8/20/21 | (14,410) |
| Whirlpool Corp. | Chicago Board Options Exchange | 69 | 1,504,338 | 250.00 | 9/17/21 | (16,905) |
| Whirlpool Corp. | Chicago Board Options Exchange | 69 | 1,504,338 | 260.00 | 9/17/21 | (11,040) |
| TOTAL WRITTEN OPTIONS | | | | | | $(129,748) |
Legend
(a) Non-income producing
(b) Security or a portion of the security is on loan at period end.
(c) Security or a portion of the security is pledged as collateral for call options written. At period end, the value of securities pledged amounted to $24,957,917.
(d) Restricted securities (including private placements) - Investment in securities not registered under the Securities Act of 1933 (excluding 144A issues). At the end of the period, the value of restricted securities (excluding 144A issues) amounted to $12,052,950 or 0.6% of net assets.
(e) Affiliated fund that is generally available only to investment companies and other accounts managed by Fidelity Investments. The rate quoted is the annualized seven-day yield of the fund at period end. A complete unaudited listing of the fund's holdings as of its most recent quarter end is available upon request. In addition, each Fidelity Central Fund's financial statements are available on the SEC's website or upon request.
(f) Investment made with cash collateral received from securities on loan.
Additional information on each restricted holding is as follows:
| Security | Acquisition Date | Acquisition Cost |
| Vertiv Holdings LLC | 2/6/20 | $4,415,000 |
Affiliated Central Funds
Information regarding fiscal year to date income earned by the Fund from investments in Fidelity Central Funds is as follows:
| Fund | Income earned |
| Fidelity Cash Central Fund | $3,761 |
| Fidelity Securities Lending Cash Central Fund | 82,100 |
| Total | $85,861 |
Amounts in the income column in the above table include any capital gain distributions from underlying funds, which are presented in the corresponding line-item in the Statement of Operations, if applicable. Amount for Fidelity Securities Lending Cash Central Fund represents the income earned on investing cash collateral, less rebates paid to borrowers and any lending agent fees associated with the loan, plus any premium payments received for lending certain types of securities.
Fiscal year to date information regarding the Fund's investments in Fidelity Central Funds, including the ownership percentage, is presented below.
| Fund | Value, beginning of period | Purchases | Sales Proceeds | Realized Gain/Loss | Change in Unrealized appreciation (depreciation) | Value, end of period | % ownership, end of period |
| Fidelity Cash Central Fund 0.06% | $8,194,193 | $107,927,092 | $83,668,151 | $(55) | $-- | $32,453,079 | 0.1% |
| Fidelity Securities Lending Cash Central Fund 0.06% | 30,888,660 | 170,537,849 | 164,072,141 | -- | -- | 37,354,368 | 0.1% |
| Total | $39,082,853 | $278,464,941 | $247,740,292 | $(55) | $-- | $69,807,447 | |
Investment Valuation
The following is a summary of the inputs used, as of June 30, 2021, involving the Fund's assets and liabilities carried at fair value. The inputs or methodology used for valuing securities may not be an indication of the risk associated with investing in those securities. For more information on valuation inputs, and their aggregation into the levels used below, please refer to the Investment Valuation section in the accompanying Notes to Financial Statements.
| | Valuation Inputs at Reporting Date: |
| Description | Total | Level 1 | Level 2 | Level 3 |
| Investments in Securities: | | | | |
| Equities: | | | | |
| Communication Services | $142,692,137 | $128,335,227 | $14,356,910 | $-- |
| Consumer Discretionary | 62,768,213 | 62,768,213 | -- | -- |
| Consumer Staples | 132,073,982 | 132,073,982 | -- | -- |
| Energy | 160,974,605 | 160,974,605 | -- | -- |
| Financials | 353,906,760 | 353,906,760 | -- | -- |
| Health Care | 273,714,029 | 250,345,171 | 23,368,858 | -- |
| Industrials | 340,316,839 | 330,326,003 | 9,990,836 | -- |
| Information Technology | 381,298,027 | 381,298,027 | -- | -- |
| Materials | 43,376,108 | 43,376,108 | -- | -- |
| Real Estate | 23,691,791 | 23,691,791 | -- | -- |
| Utilities | 17,382,272 | 17,382,272 | -- | -- |
| Corporate Bonds | 2,118,006 | -- | 2,118,006 | -- |
| Money Market Funds | 69,807,447 | 69,807,447 | -- | -- |
| Total Investments in Securities: | $2,004,120,216 | $1,954,285,606 | $49,834,610 | $-- |
| Derivative Instruments: | | | | |
| Liabilities | | | | |
| Written Options | $(129,748) | $(129,748) | $-- | $-- |
| Total Liabilities | $(129,748) | $(129,748) | $-- | $-- |
| Total Derivative Instruments: | $(129,748) | $(129,748) | $-- | $-- |
Value of Derivative Instruments
The following table is a summary of the Fund's value of derivative instruments by primary risk exposure as of June 30, 2021. For additional information on derivative instruments, please refer to the Derivative Instruments section in the accompanying Notes to Financial Statements.
| Primary Risk Exposure / Derivative Type | Value |
| | Asset | Liability |
| Equity Risk | | |
| Written Options(a) | $0 | $(129,748) |
| Total Equity Risk | 0 | (129,748) |
| Total Value of Derivatives | $0 | $(129,748) |
(a) Gross value is presented in the Statement of Assets and Liabilities in the written options, at value line-item.
Other Information
Distribution of investments by country or territory of incorporation, as a percentage of Total Net Assets, is as follows (Unaudited):
| United States of America | 87.0% |
| United Kingdom | 2.3% |
| Germany | 2.2% |
| Canada | 1.7% |
| France | 1.7% |
| Netherlands | 1.1% |
| Others (Individually Less Than 1%) | 4.0% |
| | 100.0% |
See accompanying notes which are an integral part of the financial statements.
Financial Statements
Statement of Assets and Liabilities
| | | June 30, 2021 (Unaudited) |
| Assets | | |
Investment in securities, at value (including securities loaned of $35,942,856) — See accompanying schedule:
Unaffiliated issuers (cost $1,207,831,569) | $1,934,312,769 | |
| Fidelity Central Funds (cost $69,807,447) | 69,807,447 | |
| Total Investment in Securities (cost $1,277,639,016) | | $2,004,120,216 |
| Cash | | 8,910 |
| Foreign currency held at value (cost $21,384) | | 21,384 |
| Receivable for fund shares sold | | 1,228,208 |
| Dividends receivable | | 2,848,402 |
| Interest receivable | | 8,162 |
| Distributions receivable from Fidelity Central Funds | | 27,470 |
| Other receivables | | 12,303 |
| Total assets | | 2,008,275,055 |
| Liabilities | | |
| Payable for investments purchased | $977,658 | |
| Payable for fund shares redeemed | 894,498 | |
| Accrued management fee | 693,682 | |
| Distribution and service plan fees payable | 229,529 | |
| Written options, at value (premium received $721,980) | 129,748 | |
| Other affiliated payables | 175,969 | |
| Other payables and accrued expenses | 43,336 | |
| Collateral on securities loaned | 37,353,858 | |
| Total liabilities | | 40,498,278 |
| Net Assets | | $1,967,776,777 |
| Net Assets consist of: | | |
| Paid in capital | | $1,200,589,264 |
| Total accumulated earnings (loss) | | 767,187,513 |
| Net Assets | | $1,967,776,777 |
| Net Asset Value and Maximum Offering Price | | |
| Initial Class: | | |
| Net Asset Value, offering price and redemption price per share ($431,301,926 ÷ 16,624,513 shares) | | $25.94 |
| Service Class: | | |
| Net Asset Value, offering price and redemption price per share ($131,749,728 ÷ 5,137,705 shares) | | $25.64 |
| Service Class 2: | | |
| Net Asset Value, offering price and redemption price per share ($1,058,596,147 ÷ 42,079,991 shares) | | $25.16 |
| Investor Class: | | |
| Net Asset Value, offering price and redemption price per share ($346,128,976 ÷ 13,415,024 shares) | | $25.80 |
See accompanying notes which are an integral part of the financial statements.
Statement of Operations
| | | Six months ended June 30, 2021 (Unaudited) |
| Investment Income | | |
| Dividends | | $20,056,341 |
| Interest | | 87,009 |
| Income from Fidelity Central Funds (including $82,100 from security lending) | | 85,861 |
| Total income | | 20,229,211 |
| Expenses | | |
| Management fee | $3,910,536 | |
| Transfer agent fees | 705,132 | |
| Distribution and service plan fees | 1,291,020 | |
| Accounting fees | 280,935 | |
| Custodian fees and expenses | 19,636 | |
| Independent trustees' fees and expenses | 2,992 | |
| Audit | 27,276 | |
| Legal | 3,474 | |
| Interest | 943 | |
| Miscellaneous | 4,479 | |
| Total expenses before reductions | 6,246,423 | |
| Expense reductions | (36,347) | |
| Total expenses after reductions | | 6,210,076 |
| Net investment income (loss) | | 14,019,135 |
| Realized and Unrealized Gain (Loss) | | |
| Net realized gain (loss) on: | | |
| Investment securities: | | |
| Unaffiliated issuers (net of foreign taxes of $31,812) | 29,493,871 | |
| Fidelity Central Funds | (55) | |
| Foreign currency transactions | 2,952 | |
| Written options | 1,888,646 | |
| Total net realized gain (loss) | | 31,385,414 |
| Change in net unrealized appreciation (depreciation) on: | | |
| Investment securities: | | |
| Unaffiliated issuers (net of decrease in deferred foreign taxes of $11,333) | 273,719,526 | |
| Assets and liabilities in foreign currencies | (10,775) | |
| Written options | 536,675 | |
| Total change in net unrealized appreciation (depreciation) | | 274,245,426 |
| Net gain (loss) | | 305,630,840 |
| Net increase (decrease) in net assets resulting from operations | | $319,649,975 |
See accompanying notes which are an integral part of the financial statements.
Statement of Changes in Net Assets
| | Six months ended June 30, 2021 (Unaudited) | Year ended December 31, 2020 |
| Increase (Decrease) in Net Assets | | |
| Operations | | |
| Net investment income (loss) | $14,019,135 | $29,455,166 |
| Net realized gain (loss) | 31,385,414 | 45,665,304 |
| Change in net unrealized appreciation (depreciation) | 274,245,426 | 55,004,630 |
| Net increase (decrease) in net assets resulting from operations | 319,649,975 | 130,125,100 |
| Distributions to shareholders | (50,861,933) | (102,686,211) |
| Share transactions - net increase (decrease) | 14,160,309 | 98,890,002 |
| Total increase (decrease) in net assets | 282,948,351 | 126,328,891 |
| Net Assets | | |
| Beginning of period | 1,684,828,426 | 1,558,499,535 |
| End of period | $1,967,776,777 | $1,684,828,426 |
See accompanying notes which are an integral part of the financial statements.
Financial Highlights
VIP Growth & Income Portfolio Initial Class
| | Six months ended (Unaudited) June 30, | Years endedDecember 31, | | | | |
| | 2021 | 2020 | 2019 | 2018 | 2017 | 2016 |
| Selected Per–Share Data | | | | | | |
| Net asset value, beginning of period | $22.36 | $22.17 | $19.38 | $22.71 | $20.15 | $18.88 |
| Income from Investment Operations | | | | | | |
| Net investment income (loss)A | .20 | .42 | .46 | .46 | .38 | .35 |
| Net realized and unrealized gain (loss) | 4.06 | 1.23 | 4.91 | (2.42) | 2.96 | 2.38 |
| Total from investment operations | 4.26 | 1.65 | 5.37 | (1.96) | 3.34 | 2.73 |
| Distributions from net investment income | (.08) | (.42) | (.77)B | (.08) | (.28) | (.32) |
| Distributions from net realized gain | (.60) | (1.03) | (1.81)B | (1.29) | (.51) | (1.14) |
| Total distributions | (.68) | (1.46)C | (2.58) | (1.37) | (.78)C | (1.46) |
| Net asset value, end of period | $25.94 | $22.36 | $22.17 | $19.38 | $22.71 | $20.15 |
| Total ReturnD,E,F | 19.51% | 7.85% | 30.05% | (8.98)% | 16.90% | 16.08% |
| Ratios to Average Net AssetsG,H | | | | | | |
| Expenses before reductions | .53%I | .54% | .54% | .55% | .55% | .56% |
| Expenses net of fee waivers, if any | .53%I | .54% | .54% | .54% | .55% | .56% |
| Expenses net of all reductions | .52%I | .53% | .54% | .54% | .55% | .56% |
| Net investment income (loss) | 1.68%I | 2.18% | 2.27% | 2.08% | 1.78% | 1.91% |
| Supplemental Data | | | | | | |
| Net assets, end of period (000 omitted) | $431,302 | $377,942 | $358,103 | $361,868 | $433,702 | $375,639 |
| Portfolio turnover rateJ | 16%I | 26% | 34% | 41% | 35% | 34% |
A Calculated based on average shares outstanding during the period.
B The amounts shown reflect certain reclassifications related to book to tax differences that were made in the year shown.
C Total distributions per share do not sum due to rounding.
D Total returns for periods of less than one year are not annualized.
E Total returns do not reflect charges attributable to your insurance company's separate account. Inclusion of these charges would reduce the total returns shown.
F Total returns would have been lower if certain expenses had not been reduced during the applicable periods shown.
G Fees and expenses of any underlying mutual funds or exchange-traded funds (ETFs) are not included in the Fund's expense ratio. The Fund indirectly bears its proportionate share of these expenses. For additional expense information related to investments in Fidelity Central Funds, please refer to the "Investments in Fidelity Central Funds" note found in the Notes to Financial Statements section of the most recent Annual or Semi-Annual report.
H Expense ratios reflect operating expenses of the class. Expenses before reductions do not reflect amounts reimbursed, waived, or reduced through arrangements with the investment adviser, brokerage services, or other offset arrangements, if applicable, and do not represent the amount paid by the class during periods when reimbursements, waivers or reductions occur.
I Annualized
J Amount does not include the portfolio activity of any underlying mutual funds or exchange-traded funds (ETFs).
See accompanying notes which are an integral part of the financial statements.
VIP Growth & Income Portfolio Service Class
| | Six months ended (Unaudited) June 30, | Years endedDecember 31, | | | | |
| | 2021 | 2020 | 2019 | 2018 | 2017 | 2016 |
| Selected Per–Share Data | | | | | | |
| Net asset value, beginning of period | $22.12 | $21.95 | $19.21 | $22.52 | $19.99 | $18.75 |
| Income from Investment Operations | | | | | | |
| Net investment income (loss)A | .19 | .40 | .44 | .43 | .35 | .33 |
| Net realized and unrealized gain (loss) | 4.01 | 1.21 | 4.87 | (2.39) | 2.94 | 2.35 |
| Total from investment operations | 4.20 | 1.61 | 5.31 | (1.96) | 3.29 | 2.68 |
| Distributions from net investment income | (.08) | (.40) | (.75)B | (.06) | (.25) | (.31) |
| Distributions from net realized gain | (.60) | (1.03) | (1.81)B | (1.29) | (.51) | (1.14) |
| Total distributions | (.68) | (1.44)C | (2.57)C | (1.35) | (.76) | (1.44)C |
| Net asset value, end of period | $25.64 | $22.12 | $21.95 | $19.21 | $22.52 | $19.99 |
| Total ReturnD,E,F | 19.43% | 7.74% | 29.94% | (9.07)% | 16.77% | 15.94% |
| Ratios to Average Net AssetsG,H | | | | | | |
| Expenses before reductions | .63%I | .64% | .64% | .65% | .65% | .66% |
| Expenses net of fee waivers, if any | .63%I | .64% | .64% | .64% | .65% | .66% |
| Expenses net of all reductions | .62%I | .63% | .64% | .64% | .65% | .66% |
| Net investment income (loss) | 1.58%I | 2.08% | 2.17% | 1.98% | 1.68% | 1.81% |
| Supplemental Data | | | | | | |
| Net assets, end of period (000 omitted) | $131,750 | $115,376 | $118,198 | $101,089 | $125,661 | $119,952 |
| Portfolio turnover rateJ | 16%I | 26% | 34% | 41% | 35% | 34% |
A Calculated based on average shares outstanding during the period.
B The amounts shown reflect certain reclassifications related to book to tax differences that were made in the year shown.
C Total distributions per share do not sum due to rounding.
D Total returns for periods of less than one year are not annualized.
E Total returns do not reflect charges attributable to your insurance company's separate account. Inclusion of these charges would reduce the total returns shown.
F Total returns would have been lower if certain expenses had not been reduced during the applicable periods shown.
G Fees and expenses of any underlying mutual funds or exchange-traded funds (ETFs) are not included in the Fund's expense ratio. The Fund indirectly bears its proportionate share of these expenses. For additional expense information related to investments in Fidelity Central Funds, please refer to the "Investments in Fidelity Central Funds" note found in the Notes to Financial Statements section of the most recent Annual or Semi-Annual report.
H Expense ratios reflect operating expenses of the class. Expenses before reductions do not reflect amounts reimbursed, waived, or reduced through arrangements with the investment adviser, brokerage services, or other offset arrangements, if applicable, and do not represent the amount paid by the class during periods when reimbursements, waivers or reductions occur.
I Annualized
J Amount does not include the portfolio activity of any underlying mutual funds or exchange-traded funds (ETFs).
See accompanying notes which are an integral part of the financial statements.
VIP Growth & Income Portfolio Service Class 2
| | Six months ended (Unaudited) June 30, | Years endedDecember 31, | | | | |
| | 2021 | 2020 | 2019 | 2018 | 2017 | 2016 |
| Selected Per–Share Data | | | | | | |
| Net asset value, beginning of period | $21.72 | $21.58 | $18.94 | $22.22 | $19.74 | $18.54 |
| Income from Investment Operations | | | | | | |
| Net investment income (loss)A | .17 | .37 | .40 | .39 | .32 | .30 |
| Net realized and unrealized gain (loss) | 3.94 | 1.18 | 4.78 | (2.35) | 2.90 | 2.33 |
| Total from investment operations | 4.11 | 1.55 | 5.18 | (1.96) | 3.22 | 2.63 |
| Distributions from net investment income | (.07) | (.38) | (.73)B | (.04) | (.23) | (.29) |
| Distributions from net realized gain | (.60) | (1.03) | (1.81)B | (1.28) | (.51) | (1.14) |
| Total distributions | (.67) | (1.41) | (2.54) | (1.32) | (.74) | (1.43) |
| Net asset value, end of period | $25.16 | $21.72 | $21.58 | $18.94 | $22.22 | $19.74 |
| Total ReturnC,D,E | 19.39% | 7.59% | 29.68% | (9.19)% | 16.61% | 15.81% |
| Ratios to Average Net AssetsF,G | | | | | | |
| Expenses before reductions | .78%H | .79% | .79% | .80% | .80% | .81% |
| Expenses net of fee waivers, if any | .77%H | .79% | .79% | .79% | .80% | .81% |
| Expenses net of all reductions | .77%H | .78% | .79% | .79% | .80% | .81% |
| Net investment income (loss) | 1.43%H | 1.93% | 2.02% | 1.83% | 1.53% | 1.66% |
| Supplemental Data | | | | | | |
| Net assets, end of period (000 omitted) | $1,058,596 | $908,013 | $790,495 | $527,879 | $546,278 | $356,194 |
| Portfolio turnover rateI | 16%H | 26% | 34% | 41% | 35% | 34% |
A Calculated based on average shares outstanding during the period.
B The amounts shown reflect certain reclassifications related to book to tax differences that were made in the year shown.
C Total returns for periods of less than one year are not annualized.
D Total returns do not reflect charges attributable to your insurance company's separate account. Inclusion of these charges would reduce the total returns shown.
E Total returns would have been lower if certain expenses had not been reduced during the applicable periods shown.
F Fees and expenses of any underlying mutual funds or exchange-traded funds (ETFs) are not included in the Fund's expense ratio. The Fund indirectly bears its proportionate share of these expenses. For additional expense information related to investments in Fidelity Central Funds, please refer to the "Investments in Fidelity Central Funds" note found in the Notes to Financial Statements section of the most recent Annual or Semi-Annual report.
G Expense ratios reflect operating expenses of the class. Expenses before reductions do not reflect amounts reimbursed, waived, or reduced through arrangements with the investment adviser, brokerage services, or other offset arrangements, if applicable, and do not represent the amount paid by the class during periods when reimbursements, waivers or reductions occur.
H Annualized
I Amount does not include the portfolio activity of any underlying mutual funds or exchange-traded funds (ETFs).
See accompanying notes which are an integral part of the financial statements.
VIP Growth & Income Portfolio Investor Class
| | Six months ended (Unaudited) June 30, | Years endedDecember 31, | | | | |
| | 2021 | 2020 | 2019 | 2018 | 2017 | 2016 |
| Selected Per–Share Data | | | | | | |
| Net asset value, beginning of period | $22.25 | $22.07 | $19.30 | $22.62 | $20.07 | $18.82 |
| Income from Investment Operations | | | | | | |
| Net investment income (loss)A | .19 | .41 | .44 | .44 | .36 | .33 |
| Net realized and unrealized gain (loss) | 4.04 | 1.21 | 4.90 | (2.41) | 2.96 | 2.37 |
| Total from investment operations | 4.23 | 1.62 | 5.34 | (1.97) | 3.32 | 2.70 |
| Distributions from net investment income | (.08) | (.41) | (.75)B | (.06) | (.26) | (.31) |
| Distributions from net realized gain | (.60) | (1.03) | (1.81)B | (1.29) | (.51) | (1.14) |
| Total distributions | (.68) | (1.44) | (2.57)C | (1.35) | (.77) | (1.45) |
| Net asset value, end of period | $25.80 | $22.25 | $22.07 | $19.30 | $22.62 | $20.07 |
| Total ReturnD,E,F | 19.45% | 7.76% | 29.97% | (9.05)% | 16.83% | 15.96% |
| Ratios to Average Net AssetsG,H | | | | | | |
| Expenses before reductions | .60%I | .61% | .62% | .62% | .63% | .64% |
| Expenses net of fee waivers, if any | .60%I | .61% | .62% | .62% | .63% | .64% |
| Expenses net of all reductions | .60%I | .61% | .62% | .62% | .63% | .64% |
| Net investment income (loss) | 1.60%I | 2.10% | 2.19% | 2.01% | 1.70% | 1.83% |
| Supplemental Data | | | | | | |
| Net assets, end of period (000 omitted) | $346,129 | $283,497 | $291,704 | $258,292 | $320,793 | $278,661 |
| Portfolio turnover rateJ | 16%I | 26% | 34% | 41% | 35% | 34% |
A Calculated based on average shares outstanding during the period.
B The amounts shown reflect certain reclassifications related to book to tax differences that were made in the year shown.
C Total distributions per share do not sum due to rounding.
D Total returns for periods of less than one year are not annualized.
E Total returns do not reflect charges attributable to your insurance company's separate account. Inclusion of these charges would reduce the total returns shown.
F Total returns would have been lower if certain expenses had not been reduced during the applicable periods shown.
G Fees and expenses of any underlying mutual funds or exchange-traded funds (ETFs) are not included in the Fund's expense ratio. The Fund indirectly bears its proportionate share of these expenses. For additional expense information related to investments in Fidelity Central Funds, please refer to the "Investments in Fidelity Central Funds" note found in the Notes to Financial Statements section of the most recent Annual or Semi-Annual report.
H Expense ratios reflect operating expenses of the class. Expenses before reductions do not reflect amounts reimbursed, waived, or reduced through arrangements with the investment adviser, brokerage services, or other offset arrangements, if applicable, and do not represent the amount paid by the class during periods when reimbursements, waivers or reductions occur.
I Annualized
J Amount does not include the portfolio activity of any underlying mutual funds or exchange-traded funds (ETFs).
See accompanying notes which are an integral part of the financial statements.
Notes to Financial Statements (Unaudited)
For the period ended June 30, 2021
1. Organization.
VIP Growth & Income Portfolio (the Fund) is a fund of Variable Insurance Products Fund III (the Trust) and is authorized to issue an unlimited number of shares. The Trust is registered under the Investment Company Act of 1940, as amended (the 1940 Act), as an open-end management investment company organized as a Massachusetts business trust. Shares of the Fund may only be purchased by insurance companies for the purpose of funding variable annuity or variable life insurance contracts. The Fund offers the following classes of shares: Initial Class shares, Service Class shares, Service Class 2 shares and Investor Class shares. All classes have equal rights and voting privileges, except for matters affecting a single class.
2. Investments in Fidelity Central Funds.
Funds may invest in Fidelity Central Funds, which are open-end investment companies generally available only to other investment companies and accounts managed by the investment adviser and its affiliates. The Schedule of Investments lists any Fidelity Central Funds held as an investment as of period end, but does not include the underlying holdings of each Fidelity Central Fund. An investing fund indirectly bears its proportionate share of the expenses of the underlying Fidelity Central Funds.
Based on its investment objective, each Fidelity Central Fund may invest or participate in various investment vehicles or strategies that are similar to those of the investing fund. These strategies are consistent with the investment objectives of the investing fund and may involve certain economic risks which may cause a decline in value of each of the Fidelity Central Funds and thus a decline in the value of the investing fund.
| Fidelity Central Fund | Investment Manager | Investment Objective | Investment Practices | Expense Ratio(a) |
| Fidelity Money Market Central Funds | Fidelity Management & Research Company LLC (FMR) | Each fund seeks to obtain a high level of current income consistent with the preservation of capital and liquidity. | Short-term Investments | Less than .005% to .01% |
(a) Expenses expressed as a percentage of average net assets and are as of each underlying Central Fund's most recent annual or semi-annual shareholder report.
A complete unaudited list of holdings for each Fidelity Central Fund is available upon request or at the Securities and Exchange Commission website at www.sec.gov. In addition, the financial statements of the Fidelity Central Funds which contain the significant accounting policies (including investment valuation policies) of those funds, and are not covered by the Report of Independent Registered Public Accounting Firm, are available on the Securities and Exchange Commission website or upon request.
3. Significant Accounting Policies.
The Fund is an investment company and applies the accounting and reporting guidance of the Financial Accounting Standards Board (FASB) Accounting Standards Codification Topic 946 Financial Services - Investment Companies. The financial statements have been prepared in conformity with accounting principles generally accepted in the United States of America (GAAP), which require management to make certain estimates and assumptions at the date of the financial statements. Actual results could differ from those estimates. Subsequent events, if any, through the date that the financial statements were issued have been evaluated in the preparation of the financial statements. The Fund's Schedule of Investments lists any underlying mutual funds or exchange-traded funds (ETFs) but does not include the underlying holdings of these funds. The following summarizes the significant accounting policies of the Fund:
Investment Valuation. Investments are valued as of 4:00 p.m. Eastern time on the last calendar day of the period. The Board of Trustees (the Board) has delegated the day to day responsibility for the valuation of the Fund's investments to the Fair Value Committee (the Committee) established by the Fund's investment adviser. In accordance with valuation policies and procedures approved by the Board, the Fund attempts to obtain prices from one or more third party pricing vendors or brokers to value its investments. When current market prices, quotations or currency exchange rates are not readily available or reliable, investments will be fair valued in good faith by the Committee, in accordance with procedures adopted by the Board. Factors used in determining fair value vary by investment type and may include market or investment specific events, changes in interest rates and credit quality. The frequency with which these procedures are used cannot be predicted and they may be utilized to a significant extent. The Committee oversees the Fund's valuation policies and procedures and reports to the Board on the Committee's activities and fair value determinations. The Board monitors the appropriateness of the procedures used in valuing the Fund's investments and ratifies the fair value determinations of the Committee.
The Fund categorizes the inputs to valuation techniques used to value its investments into a disclosure hierarchy consisting of three levels as shown below:
- Level 1 – quoted prices in active markets for identical investments
- Level 2 – other significant observable inputs (including quoted prices for similar investments, interest rates, prepayment speeds, etc.)
- Level 3 – unobservable inputs (including the Fund's own assumptions based on the best information available)
Valuation techniques used to value the Fund's investments by major category are as follows:
Equity securities, including restricted securities, for which market quotations are readily available, are valued at the last reported sale price or official closing price as reported by a third party pricing vendor on the primary market or exchange on which they are traded and are categorized as Level 1 in the hierarchy. In the event there were no sales during the day or closing prices are not available, securities are valued at the last quoted bid price or may be valued using the last available price and are generally categorized as Level 2 in the hierarchy. For foreign equity securities, when market or security specific events arise, comparisons to the valuation of American Depositary Receipts (ADRs), futures contracts, Exchange-Traded Funds (ETFs) and certain indexes as well as quoted prices for similar securities may be used and would be categorized as Level 2 in the hierarchy. For equity securities, including restricted securities, where observable inputs are limited, assumptions about market activity and risk are used and these securities may be categorized as Level 3 in the hierarchy.
Debt securities, including restricted securities, are valued based on evaluated prices received from third party pricing vendors or from brokers who make markets in such securities. Corporate bonds are valued by pricing vendors who utilize matrix pricing which considers yield or price of bonds of comparable quality, coupon, maturity and type or by broker-supplied prices. When independent prices are unavailable or unreliable, debt securities may be valued utilizing pricing methodologies which consider similar factors that would be used by third party pricing vendors. Debt securities are generally categorized as Level 2 in the hierarchy but may be Level 3 depending on the circumstances.
Exchange-traded options are valued using the last sale price or, in the absence of a sale, the last offering price and are categorized as Level 1 in the hierarchy. Investments in open-end mutual funds, including the Fidelity Central Funds, are valued at their closing net asset value (NAV) each business day and are categorized as Level 1 in the hierarchy.
Changes in valuation techniques may result in transfers in or out of an assigned level within the disclosure hierarchy. The aggregate value of investments by input level as of June 30, 2021 is included at the end of the Fund's Schedule of Investments.
Foreign Currency. Certain Funds may use foreign currency contracts to facilitate transactions in foreign-denominated securities. Gains and losses from these transactions may arise from changes in the value of the foreign currency or if the counterparties do not perform under the contracts' terms.
Foreign-denominated assets, including investment securities, and liabilities are translated into U.S. dollars at the exchange rates at period end. Purchases and sales of investment securities, income and dividends received, and expenses denominated in foreign currencies are translated into U.S. dollars at the exchange rate in effect on the transaction date.
The effects of exchange rate fluctuations on investments are included with the net realized and unrealized gain (loss) on investment securities. Other foreign currency transactions resulting in realized and unrealized gain (loss) are disclosed separately.
Investment Transactions and Income. For financial reporting purposes, the Fund's investment holdings and NAV include trades executed through the end of the last business day of the period. The NAV per share for processing shareholder transactions is calculated as of the close of business of the New York Stock Exchange (NYSE), normally 4:00 p.m. Eastern time and includes trades executed through the end of the prior business day. Gains and losses on securities sold are determined on the basis of identified cost and include proceeds received from litigation. Dividend income is recorded on the ex-dividend date, except for certain dividends from foreign securities where the ex-dividend date may have passed, which are recorded as soon as the Fund is informed of the ex-dividend date. Non-cash dividends included in dividend income, if any, are recorded at the fair market value of the securities received. Income and capital gain distributions from Fidelity Central Funds, if any, are recorded on the ex-dividend date. Certain distributions received by the Fund represent a return of capital or capital gain. The Fund determines the components of these distributions subsequent to the ex-dividend date, based upon receipt of tax filings or other correspondence relating to the underlying investment. These distributions are recorded as a reduction of cost of investments and/or as a realized gain. Interest income is accrued as earned and includes coupon interest and amortization of premium and accretion of discount on debt securities as applicable. Investment income is recorded net of foreign taxes withheld where recovery of such taxes is uncertain.
Class Allocations and Expenses. Investment income, realized and unrealized capital gains and losses, common expenses of a fund, and certain fund-level expense reductions, if any, are allocated daily on a pro-rata basis to each class based on the relative net assets of each class to the total net assets of a fund. Each class differs with respect to transfer agent and distribution and service plan fees incurred, as applicable. Certain expense reductions may also differ by class, if applicable. For the reporting period, the allocated portion of income and expenses to each class as a percent of its average net assets may vary due to the timing of recording these transactions in relation to fluctuating net assets of the classes. Expenses directly attributable to a fund are charged to that fund. Expenses attributable to more than one fund are allocated among the respective funds on the basis of relative net assets or other appropriate methods. Expenses included in the accompanying financial statements reflect the expenses of that fund and do not include any expenses associated with any underlying mutual funds or exchange-traded funds. Although not included in a fund's expenses, a fund indirectly bears its proportionate share of these expenses through the net asset value of each underlying mutual fund or exchange-traded fund. Expense estimates are accrued in the period to which they relate and adjustments are made when actual amounts are known.
Income Tax Information and Distributions to Shareholders. Each year, the Fund intends to qualify as a regulated investment company under Subchapter M of the Internal Revenue Code, including distributing substantially all of its taxable income and realized gains. As a result, no provision for U.S. Federal income taxes is required. The Fund files a U.S. federal tax return, in addition to state and local tax returns as required. The Fund's federal income tax returns are subject to examination by the Internal Revenue Service (IRS) for a period of three fiscal years after they are filed. State and local tax returns may be subject to examination for an additional fiscal year depending on the jurisdiction. Foreign taxes are provided for based on the Fund's understanding of the tax rules and rates that exist in the foreign markets in which it invests. The Fund is subject to a tax imposed on capital gains by certain countries in which it invests.
Distributions are declared and recorded on the ex-dividend date. Income and capital gain distributions are declared separately for each class. Income and capital gain distributions are determined in accordance with income tax regulations, which may differ from GAAP.
Capital accounts within the financial statements are adjusted for permanent book-tax differences. These adjustments have no impact on net assets or the results of operations. Capital accounts are not adjusted for temporary book-tax differences which will reverse in a subsequent period.
Book-tax differences are primarily due to foreign currency transactions, market discount and losses deferred due to wash sales.
As of period end, the cost and unrealized appreciation (depreciation) in securities, and derivatives if applicable, for federal income tax purposes were as follows:
| Gross unrealized appreciation | $769,661,241 |
| Gross unrealized depreciation | (48,382,313) |
| Net unrealized appreciation (depreciation) | $721,278,928 |
| Tax cost | $1,283,433,520 |
Restricted Securities (including Private Placements). Funds may invest in securities that are subject to legal or contractual restrictions on resale. These securities generally may be resold in transactions exempt from registration or to the public if the securities are registered. Disposal of these securities may involve time-consuming negotiations and expense, and prompt sale at an acceptable price may be difficult. Information regarding restricted securities held at period end is included at the end of the Schedule of Investments, if applicable.
4. Derivative Instruments.
Risk Exposures and the Use of Derivative Instruments. The Fund's investment objective allows the Fund to enter into various types of derivative contracts, including options. Derivatives are investments whose value is primarily derived from underlying assets, indices or reference rates and may be transacted on an exchange or over-the-counter (OTC). Derivatives may involve a future commitment to buy or sell a specified asset based on specified terms, to exchange future cash flows at periodic intervals based on a notional principal amount, or for one party to make one or more payments upon the occurrence of specified events in exchange for periodic payments from the other party.
The Fund used derivatives to increase returns and to manage exposure to certain risks as defined below. The success of any strategy involving derivatives depends on analysis of numerous economic factors, and if the strategies for investment do not work as intended, the Fund may not achieve its objectives.
The Fund's use of derivatives increased or decreased its exposure to the following risk:
| Equity Risk | Equity risk relates to the fluctuations in the value of financial instruments as a result of changes in market prices (other than those arising from interest rate risk or foreign exchange risk), whether caused by factors specific to an individual investment, its issuer, or all factors affecting all instruments traded in a market or market segment.
|
The Fund is also exposed to additional risks from investing in derivatives, such as liquidity risk and counterparty credit risk. Liquidity risk is the risk that the Fund will be unable to close out the derivative in the open market in a timely manner. Counterparty credit risk is the risk that the counterparty will not be able to fulfill its obligation to the Fund. Counterparty credit risk related to exchange-traded options may be mitigated by the protection provided by the exchange on which they trade.
Investing in derivatives may involve greater risks than investing in the underlying assets directly and, to varying degrees, may involve risk of loss in excess of any initial investment and collateral received and amounts recognized in the Statement of Assets and Liabilities. In addition, there may be the risk that the change in value of the derivative contract does not correspond to the change in value of the underlying instrument.
Options. Options give the purchaser the right, but not the obligation, to buy (call) or sell (put) an underlying security or financial instrument at an agreed exercise or strike price between or on certain dates. Options obligate the seller (writer) to buy (put) or sell (call) an underlying instrument at the exercise or strike price or cash settle an underlying derivative instrument if the holder exercises the option on or before the expiration date.
The Fund used exchange-traded written covered call options to manage its exposure to the market. When the Fund writes a covered call option, the Fund holds the underlying instrument which must be delivered to the holder upon the exercise of the option.
Upon entering into a written options contract, the Fund will receive a premium. Premiums received are reflected as a liability on the Statement of Assets and Liabilities. Options are valued daily and any unrealized appreciation (depreciation) is reflected on the Statement of Assets and Liabilities. When a written option is exercised, the premium is added to the proceeds from the sale of the underlying instrument in determining the gain or loss realized on that investment. When an option is closed the Fund will realize a gain or loss depending on whether the proceeds or amount paid for the closing sale transaction are greater or less than the premium received. When an option expires, gains and losses are realized to the extent of premiums received. The net realized gain (loss) on closed and expired written options and the change in net unrealized appreciation (depreciation) on written options are presented in the Statement of Operations.
Writing call options tends to decrease exposure to the underlying instrument and risk of loss is the change in value in excess of the premium received.
Any open options at period end are presented in the Schedule of Investments under the caption "Written Options" and are representative of volume of activity during the period.
5. Purchases and Sales of Investments.
Purchases and sales of securities, other than short-term securities and in-kind transactions, as applicable, are noted in the table below.
| | Purchases ($) | Sales ($) |
| VIP Growth & Income Portfolio | 143,172,843 | 188,064,736 |
6. Fees and Other Transactions with Affiliates.
Management Fee. Fidelity Management & Research Company LLC (the investment adviser) and its affiliates provide the Fund with investment management related services for which the Fund pays a monthly management fee. The management fee is the sum of an individual fund fee rate that is based on an annual rate of .20% of the Fund's average net assets and an annualized group fee rate that averaged .23% during the period. The group fee rate is based upon the monthly average net assets of a group of registered investment companies with which the investment adviser has management contracts. The group fee rate decreases as assets under management increase and increases as assets under management decrease. For the reporting period, the total annualized management fee rate was .43% of the Fund's average net assets.
Distribution and Service Plan Fees. In accordance with Rule 12b-1 of the 1940 Act, the Fund has adopted separate 12b-1 Plans for each Service Class of shares. Each Service Class pays Fidelity Distributors Company LLC (FDC), an affiliate of the investment adviser, a service fee. For the period, the service fee is based on an annual rate of .10% of Service Class' average net assets and .25% of Service Class 2's average net assets.
For the period, total fees, all of which were re-allowed to insurance companies for the distribution of shares and providing shareholder support services, were as follows:
| Service Class | $62,815 |
| Service Class 2 | 1,228,205 |
| | $1,291,020 |
Transfer Agent Fees. Fidelity Investments Institutional Operations Company LLC (FIIOC), an affiliate of the investment adviser, is the Fund's transfer, dividend disbursing, and shareholder servicing agent. FIIOC receives an asset-based fee with respect to each class. Each class pays a fee for transfer agent services, typesetting and printing and mailing of shareholder reports, excluding mailing of proxy statements. For the period, transfer agent fees for each class were as follows:
| | Amount | % of Class-Level Average Net Assets(a) |
| Initial Class | $130,581 | .06 |
| Service Class | 39,937 | .06 |
| Service Class 2 | 312,376 | .06 |
| Investor Class | 222,238 | .14 |
| | $705,132 | |
(a) Annualized
Accounting Fees. Fidelity Service Company, Inc. (FSC), an affiliate of the investment adviser, maintains the Fund's accounting records. The accounting fee is based on the level of average net assets for each month. For the period, the fees were equivalent to the following annualized rates:
| | % of Average Net Assets |
| VIP Growth & Income Portfolio | .03 |
Brokerage Commissions. A portion of portfolio transactions were placed with brokerage firms which are affiliates of the investment adviser. Brokerage commissions are included in net realized gain (loss) and change in net unrealized appreciation (depreciation) in the Statement of Operations. The commissions paid to these affiliated firms were as follows:
| | Amount |
| VIP Growth & Income Portfolio | $3,183 |
Interfund Lending Program. Pursuant to an Exemptive Order issued by the Securities and Exchange Commission (the SEC), the Fund, along with other registered investment companies having management contracts with Fidelity Management & Research Company LLC (FMR), or other affiliated entities of FMR, may participate in an interfund lending program. This program provides an alternative credit facility allowing the Fund to borrow from, or lend money to, other participating affiliated funds. At period end, there were no interfund loans outstanding. Activity in this program during the period for which loans were outstanding was as follows:
| | Borrower or Lender | Average Loan Balance | Weighted Average Interest Rate | Interest Expense |
| VIP Growth & Income Portfolio | Borrower | $18,171,500 | .31% | $943 |
Interfund Trades. Funds may purchase from or sell securities to other Fidelity Funds under procedures adopted by the Board. The procedures have been designed to ensure these interfund trades are executed in accordance with Rule 17a-7 of the 1940 Act. Any interfund trades are included within the respective purchases and sales amounts shown in the Purchases and Sales of Investments note and are noted in the table below.
| | Purchases ($) | Sales ($) |
| VIP Growth & Income Portfolio | 11,014,368 | 15,382,707 |
7. Committed Line of Credit.
Certain Funds participate with other funds managed by the investment adviser or an affiliate in a $4.25 billion credit facility (the "line of credit") to be utilized for temporary or emergency purposes to fund shareholder redemptions or for other short-term liquidity purposes. The participating funds have agreed to pay commitment fees on their pro-rata portion of the line of credit, which are reflected in Miscellaneous expenses on the Statement of Operations, and are listed below. During the period, there were no borrowings on this line of credit.
| | Amount |
| VIP Growth & Income Portfolio | $1,665 |
8. Security Lending.
Funds lend portfolio securities from time to time in order to earn additional income. Lending agents are used, including National Financial Services (NFS), an affiliate of the investment adviser. Pursuant to a securities lending agreement, NFS will receive a fee, which is capped at 9.9% of a fund's daily lending revenue, for its services as lending agent. A fund may lend securities to certain qualified borrowers, including NFS. On the settlement date of the loan, a fund receives collateral (in the form of U.S. Treasury obligations, letters of credit and/or cash) against the loaned securities and maintains collateral in an amount not less than 100% of the market value of the loaned securities during the period of the loan. The market value of the loaned securities is determined at the close of business of a fund and any additional required collateral is delivered to a fund on the next business day. A fund or borrower may terminate the loan at any time, and if the borrower defaults on its obligation to return the securities loaned because of insolvency or other reasons, a fund may apply collateral received from the borrower against the obligation. A fund may experience delays and costs in recovering the securities loaned. Any cash collateral received is invested in the Fidelity Securities Lending Cash Central Fund. Any loaned securities are identified as such in the Schedule of Investments, and the value of loaned securities and cash collateral at period end, as applicable, are presented in the Statement of Assets and Liabilities. Security lending income represents the income earned on investing cash collateral, less rebates paid to borrowers and any lending agent fees associated with the loan, plus any premium payments received for lending certain types of securities. Security lending income is presented in the Statement of Operations as a component of income from Fidelity Central Funds. Affiliated security lending activity, if any, was as follows:
| | Total Security Lending Fees Paid to NFS | Security Lending Income From Securities Loaned to NFS | Value of Securities Loaned to NFS at Period End |
| VIP Growth & Income Portfolio | $8,923 | $– | $– |
9. Expense Reductions.
Commissions paid to certain brokers with whom the investment adviser, or its affiliates, places trades on behalf of the Fund include an amount in addition to trade execution, which may be rebated back to the Fund to offset expenses. This amount totaled $33,858 for the period.
In addition, during the period the investment adviser or an affiliate reimbursed and/or waived a portion of fund-level operating expenses in the amount of $2,489.
10. Distributions to Shareholders.
Distributions to shareholders of each class were as follows:
| | Six months ended
June 30, 2021 | Year ended
December 31, 2020 |
| VIP Growth & Income Portfolio | | |
| Distributions to shareholders | | |
| Initial Class | $11,481,882 | $23,820,213 |
| Service Class | 3,490,004 | 7,568,632 |
| Service Class 2 | 27,318,313 | 52,427,068 |
| Investor Class | 8,571,734 | 18,870,298 |
| Total | $50,861,933 | $102,686,211 |
11. Share Transactions.
Transactions for each class of shares were as follows and may contain in-kind transactions:
| | Shares | Shares | Dollars | Dollars |
| | Six months ended June 30, 2021 | Year ended December 31, 2020 | Six months ended June 30, 2021 | Year ended December 31, 2020 |
| VIP Growth & Income Portfolio | | | | |
| Initial Class | | | | |
| Shares sold | 1,470,476 | 4,431,851 | $35,629,920 | $84,585,498 |
| Reinvestment of distributions | 508,949 | 1,120,957 | 11,481,882 | 23,820,213 |
| Shares redeemed | (2,254,492) | (4,806,114) | (54,112,293) | (93,599,673) |
| Net increase (decrease) | (275,067) | 746,694 | $(7,000,491) | $14,806,038 |
| Service Class | | | | |
| Shares sold | 47,997 | 194,351 | $1,167,784 | $3,612,761 |
| Reinvestment of distributions | 156,432 | 360,081 | 3,490,004 | 7,568,632 |
| Shares redeemed | (282,427) | (724,655) | (6,749,590) | (13,854,349) |
| Net increase (decrease) | (77,998) | (170,223) | $(2,091,802) | $(2,672,956) |
| Service Class 2 | | | | |
| Shares sold | 3,280,836 | 7,576,371 | $77,815,475 | $134,274,373 |
| Reinvestment of distributions | 1,247,412 | 2,537,601 | 27,318,313 | 52,427,068 |
| Shares redeemed | (4,245,437) | (4,942,164) | (98,404,981) | (92,856,140) |
| Net increase (decrease) | 282,811 | 5,171,808 | $6,728,807 | $93,845,301 |
| Investor Class | | | | |
| Shares sold | 1,405,110 | 2,085,858 | $34,454,222 | $39,525,615 |
| Reinvestment of distributions | 381,985 | 892,615 | 8,571,734 | 18,870,298 |
| Shares redeemed | (1,113,212) | (3,457,444) | (26,502,161) | (65,484,294) |
| Net increase (decrease) | 673,883 | (478,971) | $16,523,795 | $(7,088,381) |
12. Other.
Fund's organizational documents provide former and current trustees and officers with a limited indemnification against liabilities arising in connection with the performance of their duties to the fund. In the normal course of business, the fund may also enter into contracts that provide general indemnifications. The fund's maximum exposure under these arrangements is unknown as this would be dependent on future claims that may be made against the fund. The risk of material loss from such claims is considered remote.
At the end of the period, the investment adviser or its affiliates were owners of record of more than 10% and certain otherwise unaffiliated shareholders each were owners of record of more than 10% of the outstanding shares as follows:
| Fund | Affiliated % | Number of
Unaffiliated Shareholders | Unaffiliated Shareholders % |
| VIP Growth & Income Portfolio | 21% | 2 | 52% |
13. Coronavirus (COVID-19) Pandemic.
An outbreak of COVID-19 first detected in China during December 2019 has since spread globally and was declared a pandemic by the World Health Organization during March 2020. Developments that disrupt global economies and financial markets, such as the COVID-19 pandemic, may magnify factors that affect the Fund's performance.
Shareholder Expense Example
As a shareholder, you incur two types of costs: (1) transaction costs, which may include sales charges (loads) on purchase payments or redemption proceeds, as applicable and (2) ongoing costs, which generally include management fees, distribution and/or service (12b-1) fees and other Fund expenses. This Example is intended to help you understand your ongoing costs (in dollars) of investing in a fund and to compare these costs with the ongoing costs of investing in other mutual funds.
The Example is based on an investment of $1,000 invested at the beginning of the period and held for the entire period (January 1, 2021 to June 30, 2021).
Actual Expenses
The first line of the accompanying table provides information about actual account values and actual expenses. You may use the information in this line, together with the amount you invested, to estimate the expenses that you paid over the period. Simply divide your account value by $1,000.00 (for example, an $8,600 account value divided by $1,000.00 = 8.6), then multiply the result by the number in the first line for a class/Fund under the heading entitled "Expenses Paid During Period" to estimate the expenses you paid on your account during this period. If any fund is a shareholder of any underlying mutual funds or exchange-traded funds (ETFs) (the Underlying Funds), such fund indirectly bears its proportional share of the expenses of the Underlying Funds in addition to the direct expenses incurred presented in the table. These fees and expenses are not included in the annualized expense ratio used to calculate the expense estimate in the table below. The estimate of expenses does not include any fees or other expenses of any variable annuity or variable life insurance product. If they were, the estimate of expenses you paid during the period would be higher, and your ending account value would be lower.
Hypothetical Example for Comparison Purposes
The second line of the accompanying table provides information about hypothetical account values and hypothetical expenses based on the actual expense ratio and an assumed rate of return of 5% per year before expenses, which is not the actual return. The hypothetical account values and expenses may not be used to estimate the actual ending account balance or expenses you paid for the period. You may use this information to compare the ongoing costs of investing in the Fund and other funds. To do so, compare this 5% hypothetical example with the 5% hypothetical examples that appear in the shareholder reports of the other funds. If any fund is a shareholder of any Underlying Funds, such fund indirectly bears its proportional share of the expenses of the Underlying Funds in addition to the direct expenses as presented in the table. These fees and expenses are not included in the annualized expense ratio used to calculate the expense estimate in the table below. The estimate of expenses does not include any fees or other expenses of any variable annuity or variable life insurance product. If they were, the estimate of expenses you paid during the period would be higher, and your ending account value would be lower.
Please note that the expenses shown in the table are meant to highlight your ongoing costs only and do not reflect any transaction costs. Therefore, the second line of the table is useful in comparing ongoing costs only, and will not help you determine the relative total costs of owning different funds.
| | Annualized Expense Ratio-A | Beginning
Account Value
January 1, 2021 | Ending
Account Value
June 30, 2021 | Expenses Paid
During Period-B
January 1, 2021
to June 30, 2021 |
| VIP Growth & Income Portfolio | | | | |
| Initial Class | .53% | | | |
| Actual | | $1,000.00 | $1,195.10 | $2.88 |
| Hypothetical-C | | $1,000.00 | $1,022.17 | $2.66 |
| Service Class | .63% | | | |
| Actual | | $1,000.00 | $1,194.30 | $3.43 |
| Hypothetical-C | | $1,000.00 | $1,021.67 | $3.16 |
| Service Class 2 | .77% | | | |
| Actual | | $1,000.00 | $1,193.90 | $4.19 |
| Hypothetical-C | | $1,000.00 | $1,020.98 | $3.86 |
| Investor Class | .60% | | | |
| Actual | | $1,000.00 | $1,194.50 | $3.26 |
| Hypothetical-C | | $1,000.00 | $1,021.82 | $3.01 |
A Annualized expense ratio reflects expenses net of applicable fee waivers.
B Expenses are equal to the annualized expense ratio, multiplied by the average account value over the period, multiplied by 181/ 365 (to reflect the one-half year period). The fees and expenses of any Underlying Funds are not included in each annualized expense ratio.
C 5% return per year before expenses
Board Approval of Investment Advisory Contracts and Management Fees
VIP Growth & Income Portfolio
Each year, the Board of Trustees, including the Independent Trustees (together, the Board), votes on the renewal of the management contract with Fidelity Management & Research Company LLC (FMR) and the sub-advisory agreements (together, the Advisory Contracts) for the fund. FMR and the sub-advisers are referred to herein as the Investment Advisers. The Board, assisted by the advice of fund counsel and Independent Trustees' counsel, requests and considers a broad range of information relevant to the renewal of the Advisory Contracts throughout the year.
The Board meets regularly and, at each of its meetings, covers an extensive agenda of topics and materials and considers factors that are relevant to its annual consideration of the renewal of the fund's Advisory Contracts, including the services and support provided to the fund and its shareholders. The Board has established various standing committees (Committees), each composed of and chaired by Independent Trustees with varying backgrounds, to which the Board has assigned specific subject matter responsibilities in order to enhance effective decision-making by the Board. The Board, acting directly and through its Committees, requests and receives information concerning the annual consideration of the renewal of the fund's Advisory Contracts. The Board also meets as needed to review matters specifically related to the Board's annual consideration of the renewal of the Advisory Contracts. Members of the Board may also meet with trustees of other Fidelity funds through joint ad hoc committees to discuss certain matters relevant to all of the Fidelity funds.
Approval of Stub Period Continuation. At its January 2021 meeting, the Board of Trustees voted to continue the fund's management contract with FMR, and the sub-advisory agreements and sub-subadvisory agreements, in each case, where applicable (together, the Advisory Contracts), without modification, for four months from February 1, 2021 through May 31, 2021, in connection with changes to the Board's meeting calendar. The Board considered that the approval of the fund's Advisory Contracts will not result in any changes in (i) the investment process or strategies employed in the management of the fund's assets; (ii) the fees and expenses paid by shareholders; (iii) the nature, extent or quality of services provided under the fund's Advisory Contracts; or (iv) the day-to-day management of the fund or the persons primarily responsible for such management. The Board also considered that since its last approval of the fund's Advisory Contracts, FMR had provided additional information on the fund in support of the annual contract renewal process, including competitive analyses on total expenses and management fees and in-depth reviews of fund performance and fund profitability information. The Board also considered the findings of certain ad hoc committees that had been previously formed to discuss matters relevant to all of the Fidelity funds, including economies of scale, fall-out benefits and retail vs. institutional funds. The Board concluded that the fund's Advisory Contracts are fair and reasonable, and that the fund's Advisory Contracts should be renewed, without modification, through May 31, 2021, with the understanding that the Board will consider the annual renewal for a full one year period in May 2021.
At its May 2021 meeting, the Board unanimously determined to renew the fund's Advisory Contracts. In reaching its determination, the Board considered all factors it believed relevant, including (i) the nature, extent, and quality of the services provided to the fund and its shareholders (including the investment performance of the fund); (ii) the competitiveness of the fund's management fee and total expense ratio relative to peer funds; (iii) the total costs of the services provided by and the profits realized by Fidelity from its relationships with the fund; and (iv) the extent to which, if any, economies of scale exist and are realized as the fund grows, and whether any economies of scale are appropriately shared with fund shareholders.
In considering whether to renew the Advisory Contracts for the fund, the Board reached a determination, with the assistance of fund counsel and Independent Trustees' counsel and through the exercise of its business judgment, that the renewal of the Advisory Contracts was in the best interests of the fund and its shareholders and that the compensation payable under the Advisory Contracts was fair and reasonable. The Board's decision to renew the Advisory Contracts was not based on any single factor, but rather was based on a comprehensive consideration of all the information provided to the Board at its meetings throughout the year. The Board, in reaching its determination to renew the Advisory Contracts, was aware that shareholders of the fund have a broad range of investment choices available to them, including a wide choice among funds offered by Fidelity's competitors, and that the fund's shareholders, who have the opportunity to review and weigh the disclosure provided by the fund in its prospectus and other public disclosures, have chosen to invest in this fund, which is part of the Fidelity family of funds.
Nature, Extent, and Quality of Services Provided. The Board considered Fidelity's staffing as it relates to the fund, including the backgrounds of investment personnel of Fidelity, and also considered the fund's investment objective, strategies, and related investment philosophy. The Independent Trustees also had discussions with senior management of Fidelity's investment operations and investment groups. The Board considered the structure of the investment personnel compensation program and whether this structure provides appropriate incentives to act in the best interests of the fund. Additionally, the Board considered the portfolio managers' investments, if any, in the funds that they manage.
Resources Dedicated to Investment Management and Support Services. The Board and the Fund Oversight and Research Committees reviewed the general qualifications and capabilities of Fidelity's investment staff, including its size, education, experience, and resources, as well as Fidelity's approach to recruiting, training, managing, and compensating investment personnel. The Board noted that Fidelity has continued to increase the resources devoted to non-U.S. offices, including expansion of Fidelity's global investment organization. The Board also noted that Fidelity's analysts have extensive resources, tools and capabilities that allow them to conduct sophisticated quantitative and fundamental analysis, as well as credit analysis of issuers, counterparties and guarantors. Further, the Board considered that Fidelity's investment professionals have sufficient access to global information and data so as to provide competitive investment results over time, and that those professionals also have access to sophisticated tools that permit them to assess portfolio construction and risk and performance attribution characteristics continuously, as well as to transmit new information and research conclusions rapidly around the world. Additionally, in its deliberations, the Board considered Fidelity's trading, risk management, compliance, and technology and operations capabilities and resources, which are integral parts of the investment management process. The Board also considered Fidelity's investments in business continuity planning, and its success in continuously providing services to the fund notwithstanding the severe disruptions caused by the COVID-19 pandemic.
Shareholder and Administrative Services. The Board considered (i) the nature, extent, quality, and cost of advisory, administrative, and shareholder services performed by the Investment Advisers and their affiliates under the Advisory Contracts and under separate agreements covering transfer agency, pricing and bookkeeping, and securities lending services for the fund; (ii) the nature and extent of the supervision of third party service providers, principally custodians, subcustodians, and pricing vendors; and (iii) the resources devoted to, and the record of compliance with, the fund's compliance policies and procedures. The Board also reviewed the allocation of fund brokerage, including allocations to brokers affiliated with the Investment Advisers, the use of brokerage commissions to pay fund expenses, and the use of "soft" commission dollars to pay for research services.
The Board noted that the growth of fund assets over time across the complex allows Fidelity to reinvest in the development of services designed to enhance the value and convenience of the Fidelity funds as investment vehicles. These services include 24-hour access to account information and market information over the Internet and through telephone representatives, investor education materials and asset allocation tools, and the expanded availability of Fidelity Investor Centers.
The Board noted that, in the past, it and the boards of certain other Fidelity funds had formed an ad hoc Committee on Transfer Agency Fees to review the variety of transfer agency fee structures throughout the industry and Fidelity's competitive positioning with respect to industry participants.
Investment in a Large Fund Family. The Board considered the benefits to shareholders of investing in a Fidelity fund, including the benefits of investing in a fund that is part of a large family of funds offering a variety of investment disciplines and providing a large variety of mutual fund investor services. The Board noted that Fidelity had taken, or had made recommendations that resulted in the Fidelity funds taking, a number of actions over the previous year that benefited particular funds, including: (i) continuing to dedicate additional resources to Fidelity's investment research process, which includes meetings with management of issuers of securities in which the funds invest, and to the support of the senior management team that oversees asset management; (ii) continuing efforts to enhance Fidelity's global research capabilities; (iii) launching new funds and ETFs with innovative structures, strategies and pricing and making other enhancements to meet client needs; (iv) launching new share classes of existing funds; (v) eliminating purchase minimums and broadening eligibility requirements for certain funds and share classes; (vi) approving the reduction in the holding period for the Class C to Class A conversion policy; (vii) reducing management fees and total expenses for certain target date funds and classes and index funds; (viii) lowering expenses for certain existing funds and classes by implementing or lowering expense caps; (ix) rationalizing product lines and gaining increased efficiencies from fund mergers, liquidations, and share class consolidations; (x) continuing to develop, acquire and implement systems and technology to improve services to the funds and shareholders, strengthen information security, and increase efficiency; and (xi) continuing to implement enhancements to further strengthen Fidelity's product line to increase investors' probability of success in achieving their investment goals, including retirement income goals.
Investment Performance. The Board considered whether the fund has operated in accordance with its investment objective, as well as its record of compliance with its investment restrictions and its performance history.
The Board took into account discussions that occur at Board meetings throughout the year with representatives of the Investment Advisers about fund investment performance. In this regard the Board noted that as part of regularly scheduled fund reviews and other reports to the Board on fund performance, the Board considers annualized return information for the fund for different time periods, measured against an appropriate securities market index (benchmark index) and an appropriate peer group of funds with similar objectives (peer group). In its evaluation of fund investment performance, the Board gave particular attention to information indicating changes in performance of certain Fidelity funds for specific time periods and discussed with the Investment Advisers the reasons for any overperformance or underperformance.
In addition to reviewing absolute and relative fund performance, the Independent Trustees periodically consider the appropriateness of fund performance metrics in evaluating the results achieved. In general, the Independent Trustees believe that fund performance should be evaluated based on net performance (after fees and expenses) of both the highest performing and lowest performing fund share classes, where applicable, compared to appropriate benchmark indices, over appropriate time periods that may include full market cycles, and compared to peer groups, as applicable, over the same periods, taking into account relevant factors including the following: general market conditions; issuer-specific information; and fund cash flows and other factors.
The Independent Trustees recognize that shareholders evaluate performance on a net basis over their own holding periods, for which one-, three-, and five-year periods are often used as a proxy. For this reason, the performance information reviewed by the Board also included net cumulative total return information for the fund and an appropriate benchmark index and peer group for the most recent one-, three-, and five-year periods ended September 30, 2020, as shown below. Returns are shown compared to the 25th percentile (top of box, 75% beaten) and 75th percentile (bottom of box, 25% beaten) of the peer universe.
VIP Growth & Income Portfolio
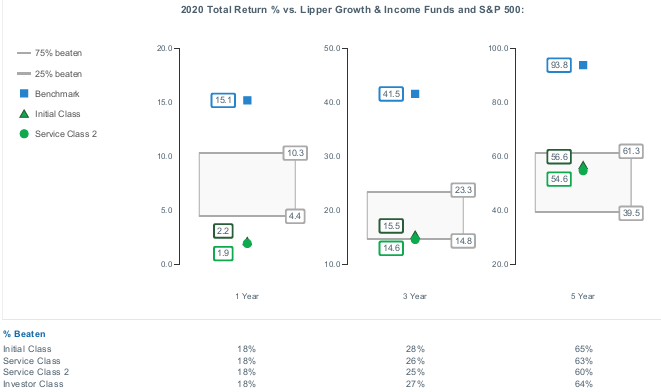
The Board considered the fund's underperformance for different time periods ended September 30, 2020 and for different time periods ended December 31, 2020 (which periods are not reflected in the chart above). The Board's discussions with FMR regarding underperformance cover topics including, but not limited to: the longer-term track record of a fund's portfolio manager(s); broader trends in the market that may adversely impact a fund's performance; and attribution reports on contributors to the fund's underperformance. The Board engages with FMR on steps that might be taken to address a fund's underperformance.
Based on its review, the Board concluded that the nature, extent, and quality of services provided to the fund under the Advisory Contracts should continue to benefit the shareholders of the fund.
Competitiveness of Management Fee and Total Expense Ratio. The Board considered the fund's management fee and total expense ratio compared to "mapped groups" of competitive funds and classes created for the purpose of facilitating the Trustees' competitive analysis of management fees and total expenses. Fidelity creates "mapped groups" by combining similar Lipper investment objective categories that have comparable investment mandates. Combining Lipper investment objective categories aids the Board's management fee and total expense ratio comparisons by broadening the competitive group used for comparison.
Management Fee. The Board considered two proprietary management fee comparisons for the 12-month periods ended September 30 (June 30 for periods ended 2019 and 2018 and December 31 for periods prior to 2018) shown in basis points (BP) in the chart below. The group of Lipper funds used by the Board for management fee comparisons is referred to below as the "Total Mapped Group." The Total Mapped Group comparison focuses on a fund's standing in terms of gross management fees before expense reimbursements or caps relative to the total universe of funds with comparable investment mandates, regardless of whether their management fee structures also are comparable. Funds with comparable investment mandates offer exposure to similar types of securities. Funds with comparable management fee structures have similar management fee contractual arrangements (
e.g., flat rate charged for advisory services, all-inclusive fee rate,
etc.). "TMG %" represents the percentage of funds in the Total Mapped Group that had management fees that were lower than the fund's. For example, a hypothetical TMG % of 20% would mean that 80% of the funds in the Total Mapped Group had higher, and 20% had lower, management fees than the fund. The fund's actual TMG %s and the number of funds in the Total Mapped Group are in the chart below. The "Asset-Sized Peer Group" (ASPG) comparison focuses on a fund's standing relative to a subset of non-Fidelity funds within the Total Mapped Group that are similar in size and management fee structure. For example, if a fund is in the first quartile of the ASPG, the fund's management fee ranks in the least expensive or lowest 25% of funds in the ASPG. The ASPG represents at least 15% of the funds in the Total Mapped Group with comparable asset size and management fee structures, subject to a minimum of 50 funds (or all funds in the Total Mapped Group if fewer than 50). Additional information, such as the ASPG quartile in which the fund's management fee rate ranked, is also included in the chart and was considered by the Board.
VIP Growth & Income Portfolio
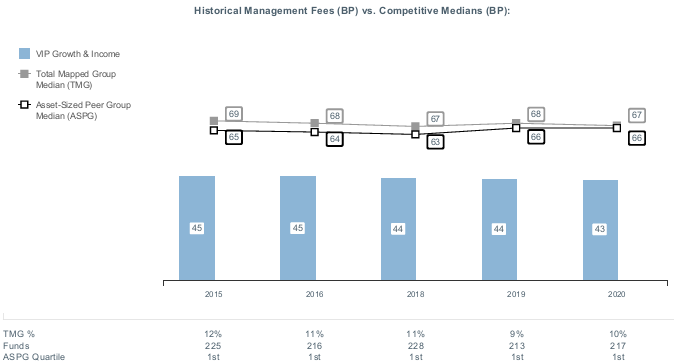
The Board noted that the fund's management fee rate ranked below the median of its Total Mapped Group and below the median of its ASPG for the 12-month period ended September 30, 2020.
The Board noted that, in the past, it and the boards of other Fidelity funds had formed an ad hoc Committee on Group Fee to conduct an in-depth review of the "group fee" component of the management fee of funds with such management fee structures. The Committee's focus included the mechanics of the group fee, the competitive landscape of group fee structures, Fidelity funds with no group fee component and investment products not included in group fee assets. The Board also considered that, for funds subject to the group fee, FMR agreed to voluntarily waive fees over a specified period of time in amounts designed to account for assets converted from certain funds to certain collective investment trusts.
The Board also noted that, in 2013, the ad hoc Committee on Management Fees was formed to conduct an in-depth review of the management fee rates of Fidelity's active equity mutual funds. The Committee focused on the following areas: (i) standard fee structures; (ii) research consumption and trading evolution; (iii) management fee competitiveness/profitability by category; and (iv) factors that drive institutional pricing.
Based on its review, the Board concluded that the fund's management fee is fair and reasonable in light of the services that the fund receives and the other factors considered.
Total Expense Ratio. In its review of each class's total expense ratio, the Board considered the fund's management fee rate as well as other fund or class expenses, as applicable, such as transfer agent fees, pricing and bookkeeping fees, fund-paid 12b-1 fees, and custodial, legal, and audit fees. The Board also noted that Fidelity may agree to waive fees or reimburse expenses from time to time, and the extent to which, if any, it has done so for the fund. As part of its review, the Board also considered the current and historical total expense ratios of each class of the fund compared to competitive fund median expenses. The fund's representative class is compared to those funds and classes in the Total Mapped Group (used by the Board for management fee comparisons) that have a similar sales load structure (SLTG). The Board also considered a total expense ASPG comparison for the representative class, which focuses on the total expenses of the representative class relative to a subset of non-Fidelity funds within the total expense SLTG. The total expense ASPG is limited to 15 larger and 15 smaller classes in fund average assets for a total of 30 classes, where possible. The total expense ASPG comparison excludes performance adjustments and fund-paid 12b-1 fees to eliminate variability in fee structures.
The Board noted that the total expense ratio of Initial Class ranked below the SLTG competitive median and below the ASPG competitive median for the 12-month period ended September 30, 2020.
Fees Charged to Other Fidelity Clients. The Board also considered Fidelity fee structures and other information with respect to clients of Fidelity, such as other funds advised or subadvised by Fidelity, pension plan clients, and other institutional clients with similar mandates. The Board noted that a joint ad hoc committee created by it and the boards of other Fidelity funds periodically reviews and compares Fidelity's institutional investment advisory business with its business of providing services to the Fidelity funds and also noted the most recent findings of the committee. The Board noted that the committee's review included a consideration of the differences in services provided, fees charged, and costs incurred, as well as competition in the markets serving the different categories of clients.
Based on its review of total expense ratios and fees charged to other Fidelity clients, the Board concluded that the total expense ratio of each class of the fund was reasonable in light of the services that the fund and its shareholders receive and the other factors considered.
Costs of the Services and Profitability. The Board considered the revenues earned and the expenses incurred by Fidelity in conducting the business of developing, marketing, distributing, managing, administering and servicing the fund and servicing the fund's shareholders. The Board also considered the level of Fidelity's profits in respect of all the Fidelity funds.
On an annual basis, Fidelity presents to the Board information about the profitability of its relationships with the fund. Fidelity calculates profitability information for each fund, as well as aggregate profitability information for groups of Fidelity funds and all Fidelity funds, using a series of detailed revenue and cost allocation methodologies which originate with the books and records of Fidelity on which Fidelity's audited financial statements are based. The Audit Committee of the Board reviews any significant changes from the prior year's methodologies and the full Board approves such changes.
A public accounting firm has been engaged annually by the Board as part of the Board's assessment of Fidelity's profitability analysis. The engagement includes the review and assessment of the methodologies used by Fidelity in determining the revenues and expenses attributable to Fidelity's mutual fund business, and completion of agreed-upon procedures in respect of the mathematical accuracy of certain fund profitability information and its conformity to established allocation methodologies. After considering the reports issued under the engagement and information provided by Fidelity, the Board concluded that while other allocation methods may also be reasonable, Fidelity's profitability methodologies are reasonable in all material respects.
The Board also reviewed Fidelity's non-fund businesses and potential indirect benefits such businesses may have received as a result of their association with Fidelity's mutual fund business (i.e., fall-out benefits) as well as cases where Fidelity's affiliates may benefit from the funds' business. The Board considered areas where potential indirect benefits to the Fidelity funds from their relationships with Fidelity may exist. The Board also considered that in 2019 a joint ad hoc committee created by it and the boards of other Fidelity funds evaluated potential fall-out benefits (PFOB Committee). The Board noted that it considered the PFOB Committee's findings in connection with its consideration of the renewal of the Advisory Contracts.
The Board considered the costs of the services provided by and the profits realized by Fidelity in connection with the operation of the fund, including the conclusions of the PFOB Committee, and was satisfied that the profitability was not excessive.
Economies of Scale. The Board considered whether there have been economies of scale in respect of the management of the Fidelity funds, whether the Fidelity funds (including the fund) have appropriately benefited from any such economies of scale, and whether there is potential for realization of any further economies of scale. The Board considered the extent to which the fund will benefit from economies of scale as assets grow through increased services to the fund, through waivers or reimbursements, or through fee or expense ratio reductions. The Board also noted that a committee (the Economies of Scale Committee) created by it and the boards of other Fidelity funds periodically analyzes whether Fidelity attains economies of scale in respect of the management and servicing of the Fidelity funds, whether the Fidelity funds have appropriately benefited from such economies of scale, and whether there is potential for realization of any further economies of scale.
The Board recognized that the fund's management contract incorporates a "group fee" structure, which provides for lower group fee rates as total "group assets" increase, and for higher group fee rates as total "group assets" decrease ("group assets" as defined in the management contract). FMR calculates the group fee rates based on a tiered asset "breakpoint" schedule that varies based on asset class. The Board considered that the group fee is designed to deliver the benefits of economies of scale to fund shareholders when total Fidelity fund assets increase, even if assets of any particular fund are unchanged or have declined, because some portion of Fidelity's costs are attributable to services provided to all Fidelity funds, and all funds benefit if those costs can be allocated among more assets. The Board further considered that Fidelity agreed to impose a temporary fee waiver in the form of additional breakpoints to the current breakpoint schedule. The Board concluded that, given the group fee structure, fund shareholders will benefit from lower management fees as "group assets" increase at the fund complex level, regardless of whether Fidelity achieves any such economies of scale.
The Board concluded, taking into account the analysis of the Economies of Scale Committee, that economies of scale, if any, are being appropriately shared between fund shareholders and Fidelity.
Additional Information Requested by the Board. In order to develop fully the factual basis for consideration of the Fidelity funds' advisory contracts, the Board requested and received additional information on certain topics, including: (i) fund flow and performance trends, in particular the underperformance of certain funds and strategies, and Fidelity's long-term strategies for certain funds; (ii) consideration of expanding the use of performance fees for additional funds; (iii) Fidelity's pricing philosophy compared to competitors; (iv) metrics for evaluating index fund and ETF performance and information about ETF trading characteristics; (v) the methodology with respect to evaluating competitive fund data and peer group classifications and fee and expense comparisons; (vi) the expense structures for different funds and classes and information about the differences between various expense structures; (vii) group fee breakpoints; (viii) information regarding other accounts managed by Fidelity and sub-advisory arrangements; and (ix) Fidelity's philosophies and strategies for evaluating funds and classes with lower or declining asset levels.
Based on its evaluation of all of the conclusions noted above, and after considering all factors it believed relevant, the Board concluded that the advisory fee arrangements are fair and reasonable, and that the fund's Advisory Contracts should be renewed.
Liquidity Risk Management Program
The Securities and Exchange Commission adopted Rule 22e-4 under the Investment Company Act of 1940 (the Liquidity Rule) to promote effective liquidity risk management throughout the open-end investment company industry, thereby reducing the risk that funds will be unable to meet their redemption obligations and mitigating dilution of the interests of fund shareholders.
The Fund has adopted and implemented a liquidity risk management program pursuant to the Liquidity Rule (the Program) effective December 1, 2018. The Program is reasonably designed to assess and manage the Fund’s liquidity risk and to comply with the requirements of the Liquidity Rule. The Fund’s Board of Trustees (the Board) has designated the Fund’s investment adviser as administrator of the Program. The Fidelity advisers have established a Liquidity Risk Management Committee (the LRM Committee) to manage the Program for each of the Fidelity Funds. The LRM Committee monitors the adequacy and effectiveness of implementation of the Program and on a periodic basis assesses each Fund’s liquidity risk based on a variety of factors including (1) the Fund’s investment strategy, (2) portfolio liquidity and cash flow projections during normal and reasonably foreseeable stressed conditions, (3) shareholder redemptions, (4) borrowings and other funding sources and (5) in the case of exchange-traded funds, certain additional factors including the effect of the Fund’s prices and spreads, market participants, and basket compositions on the overall liquidity of the Fund’s portfolio, as applicable.
In accordance with the Program, each of the Fund’s portfolio investments is classified into one of four liquidity categories described below based on a determination of a reasonable expectation for how long it would take to convert the investment to cash (or sell or dispose of the investment) without significantly changing its market value.
- Highly liquid investments – cash or convertible to cash within three business days or less
- Moderately liquid investments – convertible to cash in three to seven calendar days
- Less liquid investments – can be sold or disposed of, but not settled, within seven calendar days
- Illiquid investments – cannot be sold or disposed of within seven calendar days
Liquidity classification determinations take into account a variety of factors including various market, trading and investment-specific considerations, as well as market depth, and generally utilize analysis from a third-party liquidity metrics service.
The Liquidity Rule places a 15% limit on a fund’s illiquid investments and requires funds that do not primarily hold assets that are highly liquid investments to determine and maintain a minimum percentage of the fund’s net assets to be invested in highly liquid investments (highly liquid investment minimum or HLIM). The Program includes provisions reasonably designed to comply with the 15% limit on illiquid investments and for determining, periodically reviewing and complying with the HLIM requirement as applicable.
At a recent meeting of the Fund’s Board of Trustees, the LRM Committee provided a written report to the Board pertaining to the operation, adequacy, and effectiveness of implementation of the Program for the annual period from December 1, 2019 through November 30, 2020. The report concluded that the Program has been implemented and is operating effectively and is reasonably designed to assess and manage the Fund’s liquidity risk.

VIPGI-SANN-0821
1.705698.123
Fidelity® Variable Insurance Products:
Dynamic Capital Appreciation Portfolio
Semi-Annual Report
June 30, 2021
Contents
To view a fund's proxy voting guidelines and proxy voting record for the 12-month period ended June 30, visit http://www.fidelity.com/proxyvotingresults or visit the Securities and Exchange Commission's (SEC) web site at http://www.sec.gov.
You may also call 1-877-208-0098 to request a free copy of the proxy voting guidelines.
Fidelity® Variable Insurance Products are separate account options which are purchased through a variable insurance contract.
Standard & Poor's, S&P and S&P 500 are registered service marks of The McGraw-Hill Companies, Inc. and have been licensed for use by Fidelity Distributors Corporation.
Other third-party marks appearing herein are the property of their respective owners.
All other marks appearing herein are registered or unregistered trademarks or service marks of FMR LLC or an affiliated company. © 2021 FMR LLC. All rights reserved.
This report and the financial statements contained herein are submitted for the general information of the shareholders of the Fund. This report is not authorized for distribution to prospective investors in the Fund unless preceded or accompanied by an effective prospectus.
A fund files its complete schedule of portfolio holdings with the SEC for the first and third quarters of each fiscal year on Form N-PORT. Forms N-PORT are available on the SEC’s web site at http://www.sec.gov. A fund's Forms N-PORT may be reviewed and copied at the SEC’s Public Reference Room in Washington, DC. Information regarding the operation of the SEC's Public Reference Room may be obtained by calling 1-800-SEC-0330.
For a complete list of a fund's portfolio holdings, view the most recent holdings listing, semiannual report, or annual report on Fidelity's web site at http://www.fidelity.com, http://www.institutional.fidelity.com, or http://www.401k.com, as applicable.
NOT FDIC INSURED •MAY LOSE VALUE •NO BANK GUARANTEE
Neither the Fund nor Fidelity Distributors Corporation is a bank.
Note to Shareholders:
Early in 2020, the outbreak and spread of a new coronavirus emerged as a public health emergency that had a major influence on financial markets, primarily based on its impact on the global economy and the outlook for corporate earnings. The virus causes a respiratory disease known as COVID-19. On March 11, 2020 the World Health Organization declared the COVID-19 outbreak a pandemic, citing sustained risk of further global spread.
In the weeks following, as the crisis worsened, we witnessed an escalating human tragedy with wide-scale social and economic consequences from coronavirus-containment measures. The outbreak of COVID-19 prompted a number of measures to limit the spread, including travel and border restrictions, quarantines, and restrictions on large gatherings. In turn, these resulted in lower consumer activity, diminished demand for a wide range of products and services, disruption in manufacturing and supply chains, and – given the wide variability in outcomes regarding the outbreak – significant market uncertainty and volatility. Amid the turmoil, global governments and central banks took unprecedented action to help support consumers, businesses, and the broader economies, and to limit disruption to financial systems.
The situation continues to unfold, and the extent and duration of its impact on financial markets and the economy remain highly uncertain. Extreme events such as the coronavirus crisis are “exogenous shocks” that can have significant adverse effects on mutual funds and their investments. Although multiple asset classes may be affected by market disruption, the duration and impact may not be the same for all types of assets.
Fidelity is committed to helping you stay informed amid news about COVID-19 and during increased market volatility, and we’re taking extra steps to be responsive to customer needs. We encourage you to visit our websites, where we offer ongoing updates, commentary, and analysis on the markets and our funds.
Investment Summary (Unaudited)
Top Ten Stocks as of June 30, 2021
| | % of fund's net assets |
| Microsoft Corp. | 8.7 |
| Alphabet, Inc. Class A | 4.9 |
| UnitedHealth Group, Inc. | 4.1 |
| Amazon.com, Inc. | 3.6 |
| NVIDIA Corp. | 3.1 |
| Apple, Inc. | 2.5 |
| Adobe, Inc. | 2.5 |
| Facebook, Inc. Class A | 2.2 |
| Alphabet, Inc. Class C | 2.0 |
| Qualcomm, Inc. | 2.0 |
| | 35.6 |
Top Five Market Sectors as of June 30, 2021
| | % of fund's net assets |
| Information Technology | 29.5 |
| Health Care | 15.4 |
| Industrials | 15.3 |
| Communication Services | 14.3 |
| Consumer Discretionary | 9.4 |
Asset Allocation (% of fund's net assets)
| As of June 30, 2021* |
| | Stocks | 100.0% |

* Foreign investments - 19.1%
Schedule of Investments June 30, 2021 (Unaudited)
Showing Percentage of Net Assets
| Common Stocks - 99.7% | | | |
| | | Shares | Value |
| COMMUNICATION SERVICES - 14.3% | | | |
| Diversified Telecommunication Services - 0.9% | | | |
| Cellnex Telecom SA (a) | | 34,415 | $2,192,184 |
| Entertainment - 1.4% | | | |
| Take-Two Interactive Software, Inc. (b) | | 7,500 | 1,327,650 |
| Warner Music Group Corp. Class A | | 54,000 | 1,946,160 |
| | | | 3,273,810 |
| Interactive Media & Services - 11.4% | | | |
| Alphabet, Inc.: | | | |
| Class A (b) | | 4,705 | 11,488,622 |
| Class C (b) | | 1,844 | 4,621,654 |
| Facebook, Inc. Class A (b) | | 14,600 | 5,076,566 |
| Snap, Inc. Class A (b) | | 5,200 | 354,328 |
| Tencent Holdings Ltd. | | 60,300 | 4,540,138 |
| Tongdao Liepin Group (b) | | 102,800 | 237,527 |
| Zoominfo Technologies, Inc. | | 10,300 | 537,351 |
| | | | 26,856,186 |
| Media - 0.6% | | | |
| Cable One, Inc. | | 655 | 1,252,891 |
|
| TOTAL COMMUNICATION SERVICES | | | 33,575,071 |
|
| CONSUMER DISCRETIONARY - 9.4% | | | |
| Automobiles - 0.7% | | | |
| Ferrari NV | | 7,600 | 1,565,980 |
| Diversified Consumer Services - 0.7% | | | |
| Laureate Education, Inc. Class A (b) | | 117,700 | 1,707,827 |
| Hotels, Restaurants & Leisure - 0.5% | | | |
| Airbnb, Inc. Class A | | 2,300 | 352,222 |
| Dalata Hotel Group PLC (b) | | 27,000 | 122,778 |
| Flutter Entertainment PLC (b) | | 4,600 | 836,440 |
| | | | 1,311,440 |
| Household Durables - 0.9% | | | |
| D.R. Horton, Inc. | | 13,700 | 1,238,069 |
| NVR, Inc. (b) | | 105 | 522,197 |
| Toll Brothers, Inc. | | 7,900 | 456,699 |
| | | | 2,216,965 |
| Internet & Direct Marketing Retail - 5.0% | | | |
| Alibaba Group Holding Ltd. sponsored ADR (b) | | 13,900 | 3,152,242 |
| Amazon.com, Inc. (b) | | 2,445 | 8,411,191 |
| Coupang, Inc. Class A (b)(c) | | 1,800 | 75,276 |
| Pinduoduo, Inc. ADR (b) | | 700 | 88,914 |
| | | | 11,727,623 |
| Multiline Retail - 0.1% | | | |
| Dollarama, Inc. | | 5,100 | 233,441 |
| Specialty Retail - 0.1% | | | |
| Mister Car Wash, Inc. | | 6,900 | 148,557 |
| Textiles, Apparel & Luxury Goods - 1.4% | | | |
| LVMH Moet Hennessy Louis Vuitton SE | | 1,600 | 1,258,651 |
| LVMH Moet Hennessy Louis Vuitton SE | | 1,000 | 790,080 |
| Prada SpA | | 107,900 | 819,225 |
| Samsonite International SA (a)(b) | | 213,900 | 437,481 |
| | | | 3,305,437 |
|
| TOTAL CONSUMER DISCRETIONARY | | | 22,217,270 |
|
| CONSUMER STAPLES - 4.4% | | | |
| Beverages - 1.4% | | | |
| Kweichow Moutai Co. Ltd. (A Shares) | | 2,023 | 644,351 |
| Monster Beverage Corp. (b) | | 30,400 | 2,777,040 |
| | | | 3,421,391 |
| Household Products - 2.4% | | | |
| Energizer Holdings, Inc. (c) | | 35,400 | 1,521,492 |
| Reckitt Benckiser Group PLC | | 27,395 | 2,420,354 |
| The Clorox Co. | | 9,000 | 1,619,190 |
| | | | 5,561,036 |
| Tobacco - 0.6% | | | |
| Swedish Match Co. AB | | 171,000 | 1,458,219 |
|
| TOTAL CONSUMER STAPLES | | | 10,440,646 |
|
| ENERGY - 0.1% | | | |
| Oil, Gas & Consumable Fuels - 0.1% | | | |
| Reliance Industries Ltd. | | 8,200 | 232,735 |
| FINANCIALS - 7.3% | | | |
| Banks - 1.5% | | | |
| Comerica, Inc. | | 13,900 | 991,626 |
| HDFC Bank Ltd. sponsored ADR (b) | | 7,500 | 548,400 |
| M&T Bank Corp. | | 8,600 | 1,249,666 |
| Wintrust Financial Corp. | | 8,800 | 665,544 |
| | | | 3,455,236 |
| Capital Markets - 2.9% | | | |
| BlackRock, Inc. Class A | | 950 | 831,222 |
| CME Group, Inc. | | 10,800 | 2,296,944 |
| Franklin Resources, Inc. | | 29,900 | 956,501 |
| Morningstar, Inc. | | 5,300 | 1,362,683 |
| MSCI, Inc. | | 700 | 373,156 |
| S&P Global, Inc. | | 300 | 123,135 |
| T. Rowe Price Group, Inc. | | 4,100 | 811,677 |
| | | | 6,755,318 |
| Consumer Finance - 1.0% | | | |
| Capital One Financial Corp. | | 15,300 | 2,366,757 |
| Insurance - 1.9% | | | |
| American Financial Group, Inc. | | 9,300 | 1,159,896 |
| American International Group, Inc. | | 13,600 | 647,360 |
| Arthur J. Gallagher & Co. | | 18,900 | 2,647,512 |
| BRP Group, Inc. (b) | | 3,700 | 98,605 |
| | | | 4,553,373 |
|
| TOTAL FINANCIALS | | | 17,130,684 |
|
| HEALTH CARE - 15.4% | | | |
| Biotechnology - 3.0% | | | |
| Adamas Pharmaceuticals, Inc. (b) | | 50,000 | 264,000 |
| Alnylam Pharmaceuticals, Inc. (b) | | 2,200 | 372,944 |
| Applied Therapeutics, Inc. (b) | | 10,000 | 207,800 |
| BioNTech SE ADR (b) | | 1,300 | 291,044 |
| Evelo Biosciences, Inc. (b) | | 1,600 | 21,984 |
| Exelixis, Inc. (b) | | 9,200 | 167,624 |
| Gamida Cell Ltd. (b) | | 38,300 | 245,503 |
| Hookipa Pharma, Inc. (b) | | 8,300 | 76,028 |
| Innovent Biologics, Inc. (a)(b) | | 36,000 | 419,845 |
| Prelude Therapeutics, Inc. | | 800 | 22,904 |
| Regeneron Pharmaceuticals, Inc. (b) | | 6,300 | 3,518,802 |
| Rubius Therapeutics, Inc. (b) | | 6,100 | 148,901 |
| Seres Therapeutics, Inc. (b) | | 4,500 | 107,325 |
| Synlogic, Inc. (b) | | 29,400 | 114,366 |
| Vertex Pharmaceuticals, Inc. (b) | | 3,100 | 625,053 |
| Vor Biopharma, Inc. (b) | | 100 | 1,865 |
| Vor Biopharma, Inc. | | 11,384 | 201,696 |
| XOMA Corp. (b) | | 6,200 | 210,800 |
| | | | 7,018,484 |
| Health Care Equipment & Supplies - 2.6% | | | |
| Axonics Modulation Technologies, Inc. (b) | | 2,600 | 164,866 |
| Danaher Corp. | | 6,700 | 1,798,012 |
| Edwards Lifesciences Corp. (b) | | 10,400 | 1,077,128 |
| Insulet Corp. (b) | | 400 | 109,804 |
| Intuitive Surgical, Inc. (b) | | 2,000 | 1,839,280 |
| Medacta Group SA (a)(b) | | 370 | 48,547 |
| Nevro Corp. (b) | | 1,500 | 248,685 |
| Outset Medical, Inc. | | 3,100 | 154,938 |
| Penumbra, Inc. (b) | | 2,400 | 657,744 |
| | | | 6,099,004 |
| Health Care Providers & Services - 4.7% | | | |
| Guardant Health, Inc. (b) | | 2,000 | 248,380 |
| HealthEquity, Inc. (b) | | 11,100 | 893,328 |
| Option Care Health, Inc. (b) | | 11,000 | 240,570 |
| UnitedHealth Group, Inc. | | 24,100 | 9,650,604 |
| | | | 11,032,882 |
| Health Care Technology - 0.6% | | | |
| agilon health, Inc. (b) | | 4,900 | 198,793 |
| Certara, Inc. | | 4,200 | 118,986 |
| Doximity, Inc. | | 400 | 23,280 |
| MultiPlan Corp. (d) | | 32,914 | 313,341 |
| MultiPlan Corp.: | | | |
| warrants (b)(d) | | 1,629 | 5,037 |
| Class A (b)(c) | | 13,700 | 130,424 |
| Schrodinger, Inc. (b) | | 1,000 | 75,610 |
| Simulations Plus, Inc. (c) | | 2,000 | 109,820 |
| Veeva Systems, Inc. Class A (b) | | 1,300 | 404,235 |
| | | | 1,379,526 |
| Life Sciences Tools & Services - 0.9% | | | |
| 10X Genomics, Inc. (b) | | 1,500 | 293,730 |
| Berkeley Lights, Inc. (b) | | 4,700 | 210,607 |
| Bio-Techne Corp. | | 500 | 225,130 |
| Bruker Corp. | | 16,200 | 1,230,876 |
| Codexis, Inc. (b) | | 9,000 | 203,940 |
| Nanostring Technologies, Inc. (b) | | 500 | 32,395 |
| Olink Holding AB ADR (b) | | 800 | 27,536 |
| | | | 2,224,214 |
| Pharmaceuticals - 3.6% | | | |
| Aclaris Therapeutics, Inc. (b) | | 6,700 | 117,652 |
| Eli Lilly & Co. | | 18,000 | 4,131,360 |
| Endo International PLC (b) | | 68,600 | 321,048 |
| Horizon Therapeutics PLC (b) | | 20,100 | 1,882,164 |
| Revance Therapeutics, Inc. (b) | | 8,100 | 240,084 |
| Zoetis, Inc. Class A | | 9,800 | 1,826,328 |
| | | | 8,518,636 |
|
| TOTAL HEALTH CARE | | | 36,272,746 |
|
| INDUSTRIALS - 15.3% | | | |
| Aerospace & Defense - 2.5% | | | |
| Airbus Group NV (b) | | 16,100 | 2,074,531 |
| Axon Enterprise, Inc. (b) | | 1,900 | 335,920 |
| HEICO Corp. Class A | | 5,700 | 707,826 |
| Northrop Grumman Corp. | | 5,100 | 1,853,493 |
| TransDigm Group, Inc. (b) | | 1,300 | 841,477 |
| | | | 5,813,247 |
| Airlines - 0.9% | | | |
| Ryanair Holdings PLC sponsored ADR (b) | | 19,500 | 2,110,095 |
| Building Products - 0.3% | | | |
| Builders FirstSource, Inc. (b) | | 9,975 | 425,534 |
| Fortune Brands Home & Security, Inc. | | 1,600 | 159,376 |
| | | | 584,910 |
| Construction & Engineering - 0.5% | | | |
| Fluor Corp. (b) | | 57,300 | 1,014,210 |
| Willscot Mobile Mini Holdings (b) | | 8,000 | 222,960 |
| | | | 1,237,170 |
| Electrical Equipment - 1.5% | | | |
| AMETEK, Inc. | | 4,500 | 600,750 |
| Ballard Power Systems, Inc. (b)(c) | | 800 | 14,496 |
| Bloom Energy Corp. Class A (b)(c) | | 3,900 | 104,793 |
| Ceres Power Holdings PLC (b) | | 15,200 | 222,247 |
| Eaton Corp. PLC | | 4,200 | 622,356 |
| Encore Wire Corp. | | 4,300 | 325,897 |
| Generac Holdings, Inc. (b) | | 4,000 | 1,660,600 |
| | | | 3,551,139 |
| Industrial Conglomerates - 1.9% | | | |
| General Electric Co. | | 335,200 | 4,511,792 |
| Machinery - 1.9% | | | |
| Deere & Co. | | 4,200 | 1,481,382 |
| Ingersoll Rand, Inc. (b) | | 40,700 | 1,986,567 |
| Otis Worldwide Corp. | | 5,973 | 488,412 |
| Woodward, Inc. | | 5,000 | 614,400 |
| | | | 4,570,761 |
| Professional Services - 3.1% | | | |
| CACI International, Inc. Class A (b) | | 6,945 | 1,771,808 |
| Clarivate Analytics PLC (b) | | 20,900 | 575,377 |
| Dun& Bradstreet Holdings, Inc. (b) | | 25,800 | 551,346 |
| Equifax, Inc. | | 4,100 | 981,991 |
| Experian PLC | | 37,037 | 1,429,968 |
| KBR, Inc. | | 27,600 | 1,052,940 |
| Upwork, Inc. (b) | | 14,700 | 856,863 |
| | | | 7,220,293 |
| Road & Rail - 2.0% | | | |
| Canadian Pacific Railway Ltd. | | 18,000 | 1,384,380 |
| CSX Corp. | | 50,400 | 1,616,832 |
| Uber Technologies, Inc. (b) | | 31,400 | 1,573,768 |
| | | | 4,574,980 |
| Trading Companies & Distributors - 0.7% | | | |
| Ferguson PLC | | 12,500 | 1,737,771 |
|
| TOTAL INDUSTRIALS | | | 35,912,158 |
|
| INFORMATION TECHNOLOGY - 29.4% | | | |
| Electronic Equipment & Components - 1.0% | | | |
| Dolby Laboratories, Inc. Class A | | 5,800 | 570,082 |
| Hon Hai Precision Industry Co. Ltd. (Foxconn) | | 72,000 | 288,851 |
| Jabil, Inc. | | 2,000 | 116,240 |
| Zebra Technologies Corp. Class A (b) | | 2,400 | 1,270,776 |
| | | | 2,245,949 |
| IT Services - 2.3% | | | |
| Adyen BV (a)(b) | | 310 | 760,223 |
| Amadeus IT Holding SA Class A (b) | | 16,400 | 1,153,555 |
| Black Knight, Inc. (b) | | 14,200 | 1,107,316 |
| MongoDB, Inc. Class A (b) | | 3,500 | 1,265,320 |
| Square, Inc. (b) | | 2,900 | 707,020 |
| VeriSign, Inc. (b) | | 2,000 | 455,380 |
| | | | 5,448,814 |
| Semiconductors & Semiconductor Equipment - 7.6% | | | |
| Aixtron AG | | 20,200 | 547,307 |
| ASML Holding NV | | 2,300 | 1,588,932 |
| eMemory Technology, Inc. | | 2,000 | 95,639 |
| Enphase Energy, Inc. (b) | | 4,300 | 789,609 |
| Lam Research Corp. | | 2,700 | 1,756,890 |
| NVIDIA Corp. | | 9,100 | 7,280,910 |
| Qualcomm, Inc. | | 32,300 | 4,616,639 |
| SolarEdge Technologies, Inc. (b) | | 1,100 | 304,007 |
| Universal Display Corp. | | 3,800 | 844,854 |
| | | | 17,824,787 |
| Software - 15.1% | | | |
| Adobe, Inc. (b) | | 10,100 | 5,914,964 |
| Anaplan, Inc. (b) | | 3,100 | 165,230 |
| Autodesk, Inc. (b) | | 2,000 | 583,800 |
| Cloudflare, Inc. (b) | | 3,700 | 391,608 |
| Coupa Software, Inc. (b) | | 1,500 | 393,165 |
| CyberArk Software Ltd. (b) | | 8,300 | 1,081,241 |
| Epic Games, Inc. (d)(e) | | 156 | 138,060 |
| FireEye, Inc. (b) | | 109,900 | 2,222,178 |
| Intuit, Inc. | | 1,200 | 588,204 |
| Manhattan Associates, Inc. (b) | | 7,700 | 1,115,268 |
| Microsoft Corp. | | 75,300 | 20,398,766 |
| Palo Alto Networks, Inc. (b) | | 6,300 | 2,337,615 |
| SentinelOne, Inc. | | 1,000 | 42,500 |
| Volue A/S | | 22,500 | 129,876 |
| | | | 35,502,475 |
| Technology Hardware, Storage & Peripherals - 3.4% | | | |
| Apple, Inc. | | 43,660 | 5,979,674 |
| Samsung Electronics Co. Ltd. | | 28,080 | 2,005,359 |
| | | | 7,985,033 |
|
| TOTAL INFORMATION TECHNOLOGY | | | 69,007,058 |
|
| MATERIALS - 2.7% | | | |
| Chemicals - 2.5% | | | |
| Albemarle Corp. U.S. | | 5,800 | 977,068 |
| Axalta Coating Systems Ltd. (b) | | 10,200 | 310,998 |
| Corbion NV | | 3,200 | 182,890 |
| LG Chemical Ltd. | | 1,580 | 1,188,496 |
| Sherwin-Williams Co. | | 7,900 | 2,152,355 |
| The Chemours Co. LLC | | 28,200 | 981,360 |
| | | | 5,793,167 |
| Metals & Mining - 0.2% | | | |
| First Quantum Minerals Ltd. | | 16,900 | 389,507 |
| Lynas Rare Earths Ltd. (b) | | 10,817 | 46,321 |
| MP Materials Corp. (b)(c) | | 3,500 | 129,010 |
| | | | 564,838 |
|
| TOTAL MATERIALS | | | 6,358,005 |
|
| REAL ESTATE - 1.2% | | | |
| Equity Real Estate Investment Trusts (REITs) - 1.2% | | | |
| Equity Residential (SBI) | | 5,000 | 385,000 |
| Prologis (REIT), Inc. | | 19,700 | 2,354,741 |
| | | | 2,739,741 |
| UTILITIES - 0.2% | | | |
| Independent Power and Renewable Electricity Producers - 0.2% | | | |
| Brookfield Renewable Corp. | | 6,200 | 260,028 |
| Brookfield Renewable Partners LP | | 2,900 | 111,853 |
| | | | 371,881 |
| TOTAL COMMON STOCKS | | | |
| (Cost $151,006,271) | | | 234,257,995 |
|
| Convertible Preferred Stocks - 0.3% | | | |
| HEALTH CARE - 0.0% | | | |
| Biotechnology - 0.0% | | | |
| ElevateBio LLC Series C (d)(e) | | 5,300 | 22,234 |
| INFORMATION TECHNOLOGY - 0.1% | | | |
| Software - 0.1% | | | |
| ASAPP, Inc. Series C (d)(e) | | 17,672 | 116,584 |
| MATERIALS - 0.2% | | | |
| Metals & Mining - 0.2% | | | |
| Illuminated Holdings, Inc.: | | | |
| Series C2 (d)(e) | | 3,438 | 148,522 |
| Series C3 (d)(e) | | 4,298 | 185,674 |
| Series C4 (d)(e) | | 1,252 | 54,086 |
| Series C5 (d)(e) | | 2,617 | 113,054 |
| | | | 501,336 |
| TOTAL CONVERTIBLE PREFERRED STOCKS | | | |
| (Cost $511,834) | | | 640,154 |
|
| Money Market Funds - 0.5% | | | |
| Fidelity Cash Central Fund 0.06% (f) | | 84,744 | 84,761 |
| Fidelity Securities Lending Cash Central Fund 0.06% (f)(g) | | 1,205,667 | 1,205,787 |
| TOTAL MONEY MARKET FUNDS | | | |
| (Cost $1,290,548) | | | 1,290,548 |
| TOTAL INVESTMENT IN SECURITIES - 100.5% | | | |
| (Cost $152,808,653) | | | 236,188,697 |
| NET OTHER ASSETS (LIABILITIES) - (0.5)% | | | (1,223,821) |
| NET ASSETS - 100% | | | $234,964,876 |
Legend
(a) Security exempt from registration under Rule 144A of the Securities Act of 1933. These securities may be resold in transactions exempt from registration, normally to qualified institutional buyers. At the end of the period, the value of these securities amounted to $3,858,280 or 1.6% of net assets.
(b) Non-income producing
(c) Security or a portion of the security is on loan at period end.
(d) Restricted securities (including private placements) - Investment in securities not registered under the Securities Act of 1933 (excluding 144A issues). At the end of the period, the value of restricted securities (excluding 144A issues) amounted to $1,096,592 or 0.5% of net assets.
(e) Level 3 security
(f) Affiliated fund that is generally available only to investment companies and other accounts managed by Fidelity Investments. The rate quoted is the annualized seven-day yield of the fund at period end. A complete unaudited listing of the fund's holdings as of its most recent quarter end is available upon request. In addition, each Fidelity Central Fund's financial statements are available on the SEC's website or upon request.
(g) Investment made with cash collateral received from securities on loan.
Additional information on each restricted holding is as follows:
| Security | Acquisition Date | Acquisition Cost |
| ASAPP, Inc. Series C | 4/30/21 | $116,584 |
| ElevateBio LLC Series C | 3/9/21 | $22,234 |
| Epic Games, Inc. | 3/29/21 | $138,060 |
| Illuminated Holdings, Inc. Series C2 | 7/7/20 | $85,950 |
| Illuminated Holdings, Inc. Series C3 | 7/7/20 | $128,940 |
| Illuminated Holdings, Inc. Series C4 | 1/8/21 | $45,072 |
| Illuminated Holdings, Inc. Series C5 | 6/16/21 | $113,054 |
| MultiPlan Corp. | 10/8/20 | $325,881 |
| MultiPlan Corp. warrants | 10/8/20 | $0 |
Affiliated Central Funds
Information regarding fiscal year to date income earned by the Fund from investments in Fidelity Central Funds is as follows:
| Fund | Income earned |
| Fidelity Cash Central Fund | $570 |
| Fidelity Securities Lending Cash Central Fund | 8,138 |
| Total | $8,708 |
Amounts in the income column in the above table include any capital gain distributions from underlying funds, which are presented in the corresponding line-item in the Statement of Operations, if applicable. Amount for Fidelity Securities Lending Cash Central Fund represents the income earned on investing cash collateral, less rebates paid to borrowers and any lending agent fees associated with the loan, plus any premium payments received for lending certain types of securities.
Fiscal year to date information regarding the Fund's investments in Fidelity Central Funds, including the ownership percentage, is presented below.
| Fund | Value, beginning of period | Purchases | Sales Proceeds | Realized Gain/Loss | Change in Unrealized appreciation (depreciation) | Value, end of period | % ownership, end of period |
| Fidelity Cash Central Fund 0.06% | $1,799,442 | $24,669,198 | $26,383,868 | $(11) | $-- | $84,761 | 0.0% |
| Fidelity Securities Lending Cash Central Fund 0.06% | 1,225,037 | 5,963,487 | 5,982,737 | -- | -- | 1,205,787 | 0.0% |
| Total | $3,024,479 | $30,632,685 | $32,366,605 | $(11) | $-- | $1,290,548 | |
Investment Valuation
The following is a summary of the inputs used, as of June 30, 2021, involving the Fund's assets and liabilities carried at fair value. The inputs or methodology used for valuing securities may not be an indication of the risk associated with investing in those securities. For more information on valuation inputs, and their aggregation into the levels used below, please refer to the Investment Valuation section in the accompanying Notes to Financial Statements.
| | Valuation Inputs at Reporting Date: |
| Description | Total | Level 1 | Level 2 | Level 3 |
| Investments in Securities: | | | | |
| Equities: | | | | |
| Communication Services | $33,575,071 | $29,034,933 | $4,540,138 | $-- |
| Consumer Discretionary | 22,217,270 | 20,958,619 | 1,258,651 | -- |
| Consumer Staples | 10,440,646 | 8,020,292 | 2,420,354 | -- |
| Energy | 232,735 | 232,735 | -- | -- |
| Financials | 17,130,684 | 17,130,684 | -- | -- |
| Health Care | 36,294,980 | 36,066,013 | 206,733 | 22,234 |
| Industrials | 35,912,158 | 32,407,659 | 3,504,499 | -- |
| Information Technology | 69,123,642 | 68,108,775 | 760,223 | 254,644 |
| Materials | 6,859,341 | 6,358,005 | -- | 501,336 |
| Real Estate | 2,739,741 | 2,739,741 | -- | -- |
| Utilities | 371,881 | 371,881 | -- | -- |
| Money Market Funds | 1,290,548 | 1,290,548 | -- | -- |
| Total Investments in Securities: | $236,188,697 | $222,719,885 | $12,690,598 | $778,214 |
| Net unrealized depreciation on unfunded commitments | $( 49,329) | $-- | $( 49,329) | $-- |
See accompanying notes which are an integral part of the financial statements.
Financial Statements
Statement of Assets and Liabilities
| | | June 30, 2021 (Unaudited) |
| Assets | | |
Investment in securities, at value (including securities loaned of $1,174,372) — See accompanying schedule:
Unaffiliated issuers (cost $151,518,105) | $234,898,149 | |
| Fidelity Central Funds (cost $1,290,548) | 1,290,548 | |
| Total Investment in Securities (cost $152,808,653) | | $236,188,697 |
| Cash | | 1,601 |
| Foreign currency held at value (cost $7,823) | | 7,801 |
| Receivable for investments sold | | 542,121 |
| Receivable for fund shares sold | | 291,027 |
| Dividends receivable | | 78,192 |
| Distributions receivable from Fidelity Central Funds | | 210 |
| Other receivables | | 3,303 |
| Total assets | | 237,112,952 |
| Liabilities | | |
| Payable for investments purchased | $716,985 | |
| Unrealized depreciation on unfunded commitments | 49,329 | |
| Payable for fund shares redeemed | 5,598 | |
| Accrued management fee | 101,870 | |
| Distribution and service plan fees payable | 4,244 | |
| Other affiliated payables | 31,693 | |
| Other payables and accrued expenses | 32,757 | |
| Collateral on securities loaned | 1,205,600 | |
| Total liabilities | | 2,148,076 |
| Net Assets | | $234,964,876 |
| Net Assets consist of: | | |
| Paid in capital | | $133,826,102 |
| Total accumulated earnings (loss) | | 101,138,774 |
| Net Assets | | $234,964,876 |
| Net Asset Value and Maximum Offering Price | | |
| Initial Class: | | |
| Net Asset Value, offering price and redemption price per share ($29,097,801 ÷ 1,573,616 shares) | | $18.49 |
| Service Class: | | |
| Net Asset Value, offering price and redemption price per share ($414,953 ÷ 22,773 shares) | | $18.22 |
| Service Class 2: | | |
| Net Asset Value, offering price and redemption price per share ($20,186,379 ÷ 1,136,490 shares) | | $17.76 |
| Investor Class: | | |
| Net Asset Value, offering price and redemption price per share ($185,265,743 ÷ 10,050,191 shares) | | $18.43 |
See accompanying notes which are an integral part of the financial statements.
Statement of Operations
| | | Six months ended June 30, 2021 (Unaudited) |
| Investment Income | | |
| Dividends | | $1,014,477 |
| Income from Fidelity Central Funds (including $8,138 from security lending) | | 8,708 |
| Total income | | 1,023,185 |
| Expenses | | |
| Management fee | $581,774 | |
| Transfer agent fees | 136,747 | |
| Distribution and service plan fees | 24,905 | |
| Accounting fees | 43,024 | |
| Custodian fees and expenses | 11,774 | |
| Independent trustees' fees and expenses | 363 | |
| Audit | 24,407 | |
| Legal | 1,439 | |
| Miscellaneous | 418 | |
| Total expenses before reductions | 824,851 | |
| Expense reductions | (9,087) | |
| Total expenses after reductions | | 815,764 |
| Net investment income (loss) | | 207,421 |
| Realized and Unrealized Gain (Loss) | | |
| Net realized gain (loss) on: | | |
| Investment securities: | | |
| Unaffiliated issuers | 17,791,576 | |
| Fidelity Central Funds | (11) | |
| Foreign currency transactions | 868 | |
| Total net realized gain (loss) | | 17,792,433 |
| Change in net unrealized appreciation (depreciation) on: | | |
| Investment securities: | | |
| Unaffiliated issuers | 10,855,275 | |
| Unfunded commitments | (49,329) | |
| Assets and liabilities in foreign currencies | (398) | |
| Total change in net unrealized appreciation (depreciation) | | 10,805,548 |
| Net gain (loss) | | 28,597,981 |
| Net increase (decrease) in net assets resulting from operations | | $28,805,402 |
See accompanying notes which are an integral part of the financial statements.
Statement of Changes in Net Assets
| | Six months ended June 30, 2021 (Unaudited) | Year ended December 31, 2020 |
| Increase (Decrease) in Net Assets | | |
| Operations | | |
| Net investment income (loss) | $207,421 | $186,019 |
| Net realized gain (loss) | 17,792,433 | 14,280,842 |
| Change in net unrealized appreciation (depreciation) | 10,805,548 | 35,337,355 |
| Net increase (decrease) in net assets resulting from operations | 28,805,402 | 49,804,216 |
| Distributions to shareholders | (14,454,087) | (2,607,792) |
| Share transactions - net increase (decrease) | 15,107,246 | (5,208,589) |
| Total increase (decrease) in net assets | 29,458,561 | 41,987,835 |
| Net Assets | | |
| Beginning of period | 205,506,315 | 163,518,480 |
| End of period | $234,964,876 | $205,506,315 |
See accompanying notes which are an integral part of the financial statements.
Financial Highlights
VIP Dynamic Capital Appreciation Portfolio Initial Class
| | Six months ended (Unaudited) June 30, | Years endedDecember 31, | | | | |
| | 2021 | 2020 | 2019 | 2018 | 2017 | 2016 |
| Selected Per–Share Data | | | | | | |
| Net asset value, beginning of period | $17.36 | $13.20 | $12.24 | $14.43 | $12.53 | $12.85 |
| Income from Investment Operations | | | | | | |
| Net investment income (loss)A | .02 | .03 | .07 | .08 | .10 | .12 |
| Net realized and unrealized gain (loss) | 2.33 | 4.35 | 3.21 | (.73)B | 2.77 | .17 |
| Total from investment operations | 2.35 | 4.38 | 3.28 | (.65) | 2.87 | .29 |
| Distributions from net investment income | (.01) | (.03) | (.08) | (.08) | (.12) | (.11) |
| Distributions from net realized gain | (1.21) | (.19) | (2.24) | (1.46) | (.86) | (.49) |
| Total distributions | (1.22) | (.22) | (2.32) | (1.54) | (.97)C | (.61)C |
| Net asset value, end of period | $18.49 | $17.36 | $13.20 | $12.24 | $14.43 | $12.53 |
| Total ReturnD,E,F | 14.05% | 33.61% | 30.08% | (4.89)%B | 23.89% | 2.88% |
| Ratios to Average Net AssetsG,H | | | | | | |
| Expenses before reductions | .66%I | .68% | .68% | .69% | .72% | .71% |
| Expenses net of fee waivers, if any | .66%I | .68% | .68% | .69% | .72% | .71% |
| Expenses net of all reductions | .65%I | .68% | .68% | .68% | .71% | .70% |
| Net investment income (loss) | .27%I | .19% | .57% | .54% | .73% | .99% |
| Supplemental Data | | | | | | |
| Net assets, end of period (000 omitted) | $29,098 | $26,104 | $22,638 | $20,701 | $24,566 | $25,141 |
| Portfolio turnover rateJ | 61%I | 62% | 66% | 155% | 116% | 123% |
A Calculated based on average shares outstanding during the period.
B Amount includes a reimbursement from the investment adviser for an operational error which amounted to less than $.33 per share. Excluding this reimbursement, the total return would have been (7.25) %.
C Total distributions per share do not sum due to rounding.
D Total returns for periods of less than one year are not annualized.
E Total returns do not reflect charges attributable to your insurance company's separate account. Inclusion of these charges would reduce the total returns shown.
F Total returns would have been lower if certain expenses had not been reduced during the applicable periods shown.
G Fees and expenses of any underlying mutual funds or exchange-traded funds (ETFs) are not included in the Fund's expense ratio. The Fund indirectly bears its proportionate share of these expenses. For additional expense information related to investments in Fidelity Central Funds, please refer to the "Investments in Fidelity Central Funds" note found in the Notes to Financial Statements section of the most recent Annual or Semi-Annual report.
H Expense ratios reflect operating expenses of the class. Expenses before reductions do not reflect amounts reimbursed, waived, or reduced through arrangements with the investment adviser, brokerage services, or other offset arrangements, if applicable, and do not represent the amount paid by the class during periods when reimbursements, waivers or reductions occur.
I Annualized
J Amount does not include the portfolio activity of any underlying mutual funds or exchange-traded funds (ETFs).
See accompanying notes which are an integral part of the financial statements.
VIP Dynamic Capital Appreciation Portfolio Service Class
| | Six months ended (Unaudited) June 30, | Years endedDecember 31, | | | | |
| | 2021 | 2020 | 2019 | 2018 | 2017 | 2016 |
| Selected Per–Share Data | | | | | | |
| Net asset value, beginning of period | $17.13 | $13.03 | $12.11 | $14.28 | $12.41 | $12.74 |
| Income from Investment Operations | | | | | | |
| Net investment income (loss)A | .01 | .01 | .06 | .06 | .08 | .11 |
| Net realized and unrealized gain (loss) | 2.30 | 4.30 | 3.17 | (.71)B | 2.75 | .16 |
| Total from investment operations | 2.31 | 4.31 | 3.23 | (.65) | 2.83 | .27 |
| Distributions from net investment income | (.01) | (.02) | (.07) | (.06) | (.10) | (.10) |
| Distributions from net realized gain | (1.21) | (.19) | (2.24) | (1.46) | (.86) | (.49) |
| Total distributions | (1.22) | (.21) | (2.31) | (1.52) | (.96) | (.60)C |
| Net asset value, end of period | $18.22 | $17.13 | $13.03 | $12.11 | $14.28 | $12.41 |
| Total ReturnD,E,F | 13.99% | 33.48% | 29.96% | (4.97)%B | 23.76% | 2.76% |
| Ratios to Average Net AssetsG,H | | | | | | |
| Expenses before reductions | .76%I | .78% | .78% | .79% | .82% | .81% |
| Expenses net of fee waivers, if any | .76%I | .78% | .78% | .79% | .82% | .81% |
| Expenses net of all reductions | .75%I | .78% | .78% | .78% | .81% | .80% |
| Net investment income (loss) | .17%I | .09% | .47% | .44% | .63% | .89% |
| Supplemental Data | | | | | | |
| Net assets, end of period (000 omitted) | $415 | $327 | $287 | $265 | $631 | $530 |
| Portfolio turnover rateJ | 61%I | 62% | 66% | 155% | 116% | 123% |
A Calculated based on average shares outstanding during the period.
B Amount includes a reimbursement from the investment adviser for an operational error which amounted to less than $.33 per share. Excluding this reimbursement, the total return would have been (7.33) %.
C Total distributions per share do not sum due to rounding.
D Total returns for periods of less than one year are not annualized.
E Total returns do not reflect charges attributable to your insurance company's separate account. Inclusion of these charges would reduce the total returns shown.
F Total returns would have been lower if certain expenses had not been reduced during the applicable periods shown.
G Fees and expenses of any underlying mutual funds or exchange-traded funds (ETFs) are not included in the Fund's expense ratio. The Fund indirectly bears its proportionate share of these expenses. For additional expense information related to investments in Fidelity Central Funds, please refer to the "Investments in Fidelity Central Funds" note found in the Notes to Financial Statements section of the most recent Annual or Semi-Annual report.
H Expense ratios reflect operating expenses of the class. Expenses before reductions do not reflect amounts reimbursed, waived, or reduced through arrangements with the investment adviser, brokerage services, or other offset arrangements, if applicable, and do not represent the amount paid by the class during periods when reimbursements, waivers or reductions occur.
I Annualized
J Amount does not include the portfolio activity of any underlying mutual funds or exchange-traded funds (ETFs).
See accompanying notes which are an integral part of the financial statements.
VIP Dynamic Capital Appreciation Portfolio Service Class 2
| | Six months ended (Unaudited) June 30, | Years endedDecember 31, | | | | |
| | 2021 | 2020 | 2019 | 2018 | 2017 | 2016 |
| Selected Per–Share Data | | | | | | |
| Net asset value, beginning of period | $16.74 | $12.74 | $11.88 | $14.05 | $12.23 | $12.56 |
| Income from Investment Operations | | | | | | |
| Net investment income (loss)A | –B | (.01) | .04 | .04 | .06 | .09 |
| Net realized and unrealized gain (loss) | 2.24 | 4.21 | 3.11 | (.71)C | 2.70 | .16 |
| Total from investment operations | 2.24 | 4.20 | 3.15 | (.67) | 2.76 | .25 |
| Distributions from net investment income | –B | (.01) | (.05) | (.05) | (.08) | (.09) |
| Distributions from net realized gain | (1.21) | (.19) | (2.24) | (1.46) | (.86) | (.49) |
| Total distributions | (1.22)D | (.20) | (2.29) | (1.50)D | (.94) | (.58) |
| Net asset value, end of period | $17.76 | $16.74 | $12.74 | $11.88 | $14.05 | $12.23 |
| Total ReturnE,F,G | 13.86% | 33.34% | 29.82% | (5.17)%C | 23.50% | 2.66% |
| Ratios to Average Net AssetsH,I | | | | | | |
| Expenses before reductions | .91%J | .93% | .93% | .94% | .97% | .96% |
| Expenses net of fee waivers, if any | .91%J | .93% | .93% | .94% | .97% | .96% |
| Expenses net of all reductions | .90%J | .93% | .93% | .93% | .96% | .95% |
| Net investment income (loss) | .02%J | (.06)% | .32% | .29% | .48% | .74% |
| Supplemental Data | | | | | | |
| Net assets, end of period (000 omitted) | $20,186 | $18,900 | $15,870 | $14,533 | $17,294 | $16,830 |
| Portfolio turnover rateK | 61%J | 62% | 66% | 155% | 116% | 123% |
A Calculated based on average shares outstanding during the period.
B Amount represents less than $.005 per share.
C Amount includes a reimbursement from the investment adviser for an operational error which amounted to less than $.32 per share. Excluding this reimbursement, the total return would have been (7.53) %.
D Total distributions per share do not sum due to rounding.
E Total returns for periods of less than one year are not annualized.
F Total returns do not reflect charges attributable to your insurance company's separate account. Inclusion of these charges would reduce the total returns shown.
G Total returns would have been lower if certain expenses had not been reduced during the applicable periods shown.
H Fees and expenses of any underlying mutual funds or exchange-traded funds (ETFs) are not included in the Fund's expense ratio. The Fund indirectly bears its proportionate share of these expenses. For additional expense information related to investments in Fidelity Central Funds, please refer to the "Investments in Fidelity Central Funds" note found in the Notes to Financial Statements section of the most recent Annual or Semi-Annual report.
I Expense ratios reflect operating expenses of the class. Expenses before reductions do not reflect amounts reimbursed, waived, or reduced through arrangements with the investment adviser, brokerage services, or other offset arrangements, if applicable, and do not represent the amount paid by the class during periods when reimbursements, waivers or reductions occur.
J Annualized
K Amount does not include the portfolio activity of any underlying mutual funds or exchange-traded funds (ETFs).
See accompanying notes which are an integral part of the financial statements.
VIP Dynamic Capital Appreciation Portfolio Investor Class
| | Six months ended (Unaudited) June 30, | Years endedDecember 31, | | | | |
| | 2021 | 2020 | 2019 | 2018 | 2017 | 2016 |
| Selected Per–Share Data | | | | | | |
| Net asset value, beginning of period | $17.32 | $13.17 | $12.21 | $14.40 | $12.51 | $12.83 |
| Income from Investment Operations | | | | | | |
| Net investment income (loss)A | .02 | .02 | .06 | .06 | .09 | .11 |
| Net realized and unrealized gain (loss) | 2.31 | 4.34 | 3.21 | (.72)B | 2.76 | .17 |
| Total from investment operations | 2.33 | 4.36 | 3.27 | (.66) | 2.85 | .28 |
| Distributions from net investment income | (.01) | (.02) | (.07) | (.07) | (.11) | (.10) |
| Distributions from net realized gain | (1.21) | (.19) | (2.24) | (1.46) | (.86) | (.49) |
| Total distributions | (1.22) | (.21) | (2.31) | (1.53) | (.96)C | (.60)C |
| Net asset value, end of period | $18.43 | $17.32 | $13.17 | $12.21 | $14.40 | $12.51 |
| Total ReturnD,E,F | 13.95% | 33.54% | 30.07% | (5.00)%B | 23.74% | 2.81% |
| Ratios to Average Net AssetsG,H | | | | | | |
| Expenses before reductions | .74%I | .76% | .76% | .77% | .80% | .79% |
| Expenses net of fee waivers, if any | .74%I | .76% | .76% | .77% | .80% | .79% |
| Expenses net of all reductions | .73%I | .75% | .76% | .76% | .79% | .78% |
| Net investment income (loss) | .19%I | .12% | .50% | .46% | .65% | .90% |
| Supplemental Data | | | | | | |
| Net assets, end of period (000 omitted) | $185,266 | $160,175 | $124,723 | $108,561 | $118,071 | $112,998 |
| Portfolio turnover rateJ | 61%I | 62% | 66% | 155% | 116% | 123% |
A Calculated based on average shares outstanding during the period.
B Amount includes a reimbursement from the investment adviser for an operational error which amounted to less than $.33 per share. Excluding this reimbursement, the total return would have been (7.36) %.
C Total distributions per share do not sum due to rounding.
D Total returns for periods of less than one year are not annualized.
E Total returns do not reflect charges attributable to your insurance company's separate account. Inclusion of these charges would reduce the total returns shown.
F Total returns would have been lower if certain expenses had not been reduced during the applicable periods shown.
G Fees and expenses of any underlying mutual funds or exchange-traded funds (ETFs) are not included in the Fund's expense ratio. The Fund indirectly bears its proportionate share of these expenses. For additional expense information related to investments in Fidelity Central Funds, please refer to the "Investments in Fidelity Central Funds" note found in the Notes to Financial Statements section of the most recent Annual or Semi-Annual report.
H Expense ratios reflect operating expenses of the class. Expenses before reductions do not reflect amounts reimbursed, waived, or reduced through arrangements with the investment adviser, brokerage services, or other offset arrangements, if applicable, and do not represent the amount paid by the class during periods when reimbursements, waivers or reductions occur.
I Annualized
J Amount does not include the portfolio activity of any underlying mutual funds or exchange-traded funds (ETFs).
See accompanying notes which are an integral part of the financial statements.
Notes to Financial Statements (Unaudited)
For the period ended June 30, 2021
1. Organization.
VIP Dynamic Capital Appreciation Portfolio (the Fund) is a fund of Variable Insurance Products Fund III (the Trust) and is authorized to issue an unlimited number of shares. The Trust is registered under the Investment Company Act of 1940, as amended (the 1940 Act), as an open-end management investment company organized as a Massachusetts business trust. Shares of the Fund may only be purchased by insurance companies for the purpose of funding variable annuity or variable life insurance contracts. The Fund offers the following classes of shares: Initial Class shares, Service Class shares, Service Class 2 shares and Investor Class shares. All classes have equal rights and voting privileges, except for matters affecting a single class.
2. Investments in Fidelity Central Funds.
Funds may invest in Fidelity Central Funds, which are open-end investment companies generally available only to other investment companies and accounts managed by the investment adviser and its affiliates. The Schedule of Investments lists any Fidelity Central Funds held as an investment as of period end, but does not include the underlying holdings of each Fidelity Central Fund. An investing fund indirectly bears its proportionate share of the expenses of the underlying Fidelity Central Funds.
Based on its investment objective, each Fidelity Central Fund may invest or participate in various investment vehicles or strategies that are similar to those of the investing fund. These strategies are consistent with the investment objectives of the investing fund and may involve certain economic risks which may cause a decline in value of each of the Fidelity Central Funds and thus a decline in the value of the investing fund.
| Fidelity Central Fund | Investment Manager | Investment Objective | Investment Practices | Expense Ratio(a) |
| Fidelity Money Market Central Funds | Fidelity Management & Research Company LLC (FMR) | Each fund seeks to obtain a high level of current income consistent with the preservation of capital and liquidity. | Short-term Investments | Less than .005% to .01% |
(a) Expenses expressed as a percentage of average net assets and are as of each underlying Central Fund's most recent annual or semi-annual shareholder report.
A complete unaudited list of holdings for each Fidelity Central Fund is available upon request or at the Securities and Exchange Commission website at www.sec.gov. In addition, the financial statements of the Fidelity Central Funds which contain the significant accounting policies (including investment valuation policies) of those funds, and are not covered by the Report of Independent Registered Public Accounting Firm, are available on the Securities and Exchange Commission website or upon request.
3. Significant Accounting Policies.
The Fund is an investment company and applies the accounting and reporting guidance of the Financial Accounting Standards Board (FASB) Accounting Standards Codification Topic 946 Financial Services - Investment Companies. The financial statements have been prepared in conformity with accounting principles generally accepted in the United States of America (GAAP), which require management to make certain estimates and assumptions at the date of the financial statements. Actual results could differ from those estimates. Subsequent events, if any, through the date that the financial statements were issued have been evaluated in the preparation of the financial statements. The Fund's Schedule of Investments lists any underlying mutual funds or exchange-traded funds (ETFs) but does not include the underlying holdings of these funds. The following summarizes the significant accounting policies of the Fund:
Investment Valuation. Investments are valued as of 4:00 p.m. Eastern time on the last calendar day of the period. The Board of Trustees (the Board) has delegated the day to day responsibility for the valuation of the Fund's investments to the Fair Value Committee (the Committee) established by the Fund's investment adviser. In accordance with valuation policies and procedures approved by the Board, the Fund attempts to obtain prices from one or more third party pricing vendors or brokers to value its investments. When current market prices, quotations or currency exchange rates are not readily available or reliable, investments will be fair valued in good faith by the Committee, in accordance with procedures adopted by the Board. Factors used in determining fair value vary by investment type and may include market or investment specific events. The frequency with which these procedures are used cannot be predicted and they may be utilized to a significant extent. The Committee oversees the Fund's valuation policies and procedures and reports to the Board on the Committee's activities and fair value determinations. The Board monitors the appropriateness of the procedures used in valuing the Fund's investments and ratifies the fair value determinations of the Committee.
The Fund categorizes the inputs to valuation techniques used to value its investments into a disclosure hierarchy consisting of three levels as shown below:
- Level 1 – quoted prices in active markets for identical investments
- Level 2 – other significant observable inputs (including quoted prices for similar investments, interest rates, prepayment speeds, etc.)
- Level 3 – unobservable inputs (including the Fund's own assumptions based on the best information available)
Valuation techniques used to value the Fund's investments by major category are as follows:
Equity securities, including restricted securities, for which market quotations are readily available, are valued at the last reported sale price or official closing price as reported by a third party pricing vendor on the primary market or exchange on which they are traded and are categorized as Level 1 in the hierarchy. In the event there were no sales during the day or closing prices are not available, securities are valued at the last quoted bid price or may be valued using the last available price and are generally categorized as Level 2 in the hierarchy. For foreign equity securities, when market or security specific events arise, comparisons to the valuation of American Depositary Receipts (ADRs), futures contracts, Exchange-Traded Funds (ETFs) and certain indexes as well as quoted prices for similar securities may be used and would be categorized as Level 2 in the hierarchy. For equity securities, including restricted securities, where observable inputs are limited, assumptions about market activity and risk are used and these securities may be categorized as Level 3 in the hierarchy.
Investments in open-end mutual funds, including the Fidelity Central Funds, are valued at their closing net asset value (NAV) each business day and are categorized as Level 1 in the hierarchy.
Changes in valuation techniques may result in transfers in or out of an assigned level within the disclosure hierarchy. The aggregate value of investments by input level as of June 30, 2021 is included at the end of the Fund's Schedule of Investments.
Foreign Currency. Certain Funds may use foreign currency contracts to facilitate transactions in foreign-denominated securities. Gains and losses from these transactions may arise from changes in the value of the foreign currency or if the counterparties do not perform under the contracts' terms.
Foreign-denominated assets, including investment securities, and liabilities are translated into U.S. dollars at the exchange rates at period end. Purchases and sales of investment securities, income and dividends received, and expenses denominated in foreign currencies are translated into U.S. dollars at the exchange rate in effect on the transaction date.
The effects of exchange rate fluctuations on investments are included with the net realized and unrealized gain (loss) on investment securities. Other foreign currency transactions resulting in realized and unrealized gain (loss) are disclosed separately.
Investment Transactions and Income. For financial reporting purposes, the Fund's investment holdings and NAV include trades executed through the end of the last business day of the period. The NAV per share for processing shareholder transactions is calculated as of the close of business of the New York Stock Exchange (NYSE), normally 4:00 p.m. Eastern time and includes trades executed through the end of the prior business day. Gains and losses on securities sold are determined on the basis of identified cost and include proceeds received from litigation. Dividend income is recorded on the ex-dividend date, except for certain dividends from foreign securities where the ex-dividend date may have passed, which are recorded as soon as the Fund is informed of the ex-dividend date. Non-cash dividends included in dividend income, if any, are recorded at the fair market value of the securities received. Income and capital gain distributions from Fidelity Central Funds, if any, are recorded on the ex-dividend date. Certain distributions received by the Fund represent a return of capital or capital gain. The Fund determines the components of these distributions subsequent to the ex-dividend date, based upon receipt of tax filings or other correspondence relating to the underlying investment. These distributions are recorded as a reduction of cost of investments and/or as a realized gain. Investment income is recorded net of foreign taxes withheld where recovery of such taxes is uncertain.
Class Allocations and Expenses. Investment income, realized and unrealized capital gains and losses, common expenses of a fund, and certain fund-level expense reductions, if any, are allocated daily on a pro-rata basis to each class based on the relative net assets of each class to the total net assets of a fund. Each class differs with respect to transfer agent and distribution and service plan fees incurred, as applicable. Certain expense reductions may also differ by class, if applicable. For the reporting period, the allocated portion of income and expenses to each class as a percent of its average net assets may vary due to the timing of recording these transactions in relation to fluctuating net assets of the classes. Expenses directly attributable to a fund are charged to that fund. Expenses attributable to more than one fund are allocated among the respective funds on the basis of relative net assets or other appropriate methods. Expenses included in the accompanying financial statements reflect the expenses of that fund and do not include any expenses associated with any underlying mutual funds or exchange-traded funds. Although not included in a fund's expenses, a fund indirectly bears its proportionate share of these expenses through the net asset value of each underlying mutual fund or exchange-traded fund. Expense estimates are accrued in the period to which they relate and adjustments are made when actual amounts are known.
Income Tax Information and Distributions to Shareholders. Each year, the Fund intends to qualify as a regulated investment company under Subchapter M of the Internal Revenue Code, including distributing substantially all of its taxable income and realized gains. As a result, no provision for U.S. Federal income taxes is required. The Fund files a U.S. federal tax return, in addition to state and local tax returns as required. The Fund's federal income tax returns are subject to examination by the Internal Revenue Service (IRS) for a period of three fiscal years after they are filed. State and local tax returns may be subject to examination for an additional fiscal year depending on the jurisdiction. Foreign taxes are provided for based on the Fund's understanding of the tax rules and rates that exist in the foreign markets in which it invests.
Distributions are declared and recorded on the ex-dividend date. Income and capital gain distributions are declared separately for each class. Income and capital gain distributions are determined in accordance with income tax regulations, which may differ from GAAP.
Capital accounts within the financial statements are adjusted for permanent book-tax differences. These adjustments have no impact on net assets or the results of operations. Capital accounts are not adjusted for temporary book-tax differences which will reverse in a subsequent period.
Book-tax differences are primarily due to foreign currency transactions, certain foreign taxes, passive foreign investment companies (PFIC), partnerships and losses deferred due to wash sales.
As of period end, the cost and unrealized appreciation (depreciation) in securities, and derivatives if applicable, for federal income tax purposes were as follows:
| Gross unrealized appreciation | $85,730,355 |
| Gross unrealized depreciation | (2,425,962) |
| Net unrealized appreciation (depreciation) | $83,304,393 |
| Tax cost | $152,834,975 |
Restricted Securities (including Private Placements). Funds may invest in securities that are subject to legal or contractual restrictions on resale. These securities generally may be resold in transactions exempt from registration or to the public if the securities are registered. Disposal of these securities may involve time-consuming negotiations and expense, and prompt sale at an acceptable price may be difficult. Information regarding restricted securities held at period end is included at the end of the Schedule of Investments, if applicable.
Special Purpose Acquisition Companies. Funds may invest in stock, warrants, and other securities of special purpose acquisition companies (SPACs) or similar special purpose entities. A SPAC is a publicly traded company that raises investment capital via an initial public offering (IPO) for the purpose of acquiring the equity securities of one or more existing companies via merger, business combination, acquisition or other similar transactions within a designated time frame.
Private Investment in Public Equity. Funds may acquire equity securities of an issuer through a private investment in a public equity (PIPE) transaction, including through commitments to purchase securities on a when-issued basis. A PIPE typically involves the purchase of securities directly from a publicly traded company in a private placement transaction. Securities purchased through PIPE transactions will be restricted from trading and considered illiquid until a resale registration statement for the shares is filed and declared effective.
At period end, the Fund had commitments to purchase when-issued securities through PIPE transactions with SPACs. The commitments are contingent upon the SPACs acquiring the securities of target companies. Unrealized appreciation (depreciation) on these commitments is separately presented in the Statements of Assets and Liabilities as Unrealized appreciation (depreciation) on unfunded commitments, and in the Statement of Operations as Change in unrealized appreciation (depreciation) on unfunded commitments.
4. Purchases and Sales of Investments.
Purchases and sales of securities, other than short-term securities and in-kind transactions, as applicable, are noted in the table below.
| | Purchases ($) | Sales ($) |
| VIP Dynamic Capital Appreciation Portfolio | 68,195,146 | 65,908,639 |
5. Fees and Other Transactions with Affiliates.
Management Fee. Fidelity Management & Research Company LLC (the investment adviser) and its affiliates provide the Fund with investment management related services for which the Fund pays a monthly management fee. The management fee is the sum of an individual fund fee rate that is based on an annual rate of .30% of the Fund's average net assets and an annualized group fee rate that averaged .23% during the period. The group fee rate is based upon the monthly average net assets of a group of registered investment companies with which the investment adviser has management contracts. The group fee rate decreases as assets under management increase and increases as assets under management decrease. For the reporting period, the total annualized management fee rate was .53% of the Fund's average net assets.
Distribution and Service Plan Fees. In accordance with Rule 12b-1 of the 1940 Act, the Fund has adopted separate 12b-1 Plans for each Service Class of shares. Each Service Class pays Fidelity Distributors Company LLC (FDC), an affiliate of the investment adviser, a service fee. For the period, the service fee is based on an annual rate of .10% of Service Class' average net assets and .25% of Service Class 2's average net assets.
For the period, total fees, all of which were re-allowed to insurance companies for the distribution of shares and providing shareholder support services, were as follows:
| Service Class | $181 |
| Service Class 2 | 24,724 |
| | $24,905 |
Transfer Agent Fees. Fidelity Investments Institutional Operations Company LLC (FIIOC), an affiliate of the investment adviser, is the Fund's transfer, dividend disbursing, and shareholder servicing agent. FIIOC receives an asset-based fee with respect to each class. Each class pays a fee for transfer agent services, typesetting and printing and mailing of shareholder reports, excluding mailing of proxy statements. For the period, transfer agent fees for each class were as follows:
| | Amount | % of Class-Level Average Net Assets(a) |
| Initial Class | $8,803 | .06 |
| Service Class | 115 | .06 |
| Service Class 2 | 6,286 | .06 |
| Investor Class | 121,543 | .14 |
| | $136,747 | |
(a) Annualized
Accounting Fees. Fidelity Service Company, Inc. (FSC), an affiliate of the investment adviser, maintains the Fund's accounting records. The accounting fee is based on the level of average net assets for each month. For the period, the fees were equivalent to the following annualized rates:
| | % of Average Net Assets |
| VIP Dynamic Capital Appreciation Portfolio | .04 |
Brokerage Commissions. A portion of portfolio transactions were placed with brokerage firms which are affiliates of the investment adviser. Brokerage commissions are included in net realized gain (loss) and change in net unrealized appreciation (depreciation) in the Statement of Operations. The commissions paid to these affiliated firms were as follows:
| | Amount |
| VIP Dynamic Capital Appreciation Portfolio | $1,032 |
Interfund Trades. Funds may purchase from or sell securities to other Fidelity Funds under procedures adopted by the Board. The procedures have been designed to ensure these interfund trades are executed in accordance with Rule 17a-7 of the 1940 Act. Any interfund trades are included within the respective purchases and sales amounts shown in the Purchases and Sales of Investments note and are noted in the table below.
| | Purchases ($) | Sales ($) |
| VIP Dynamic Capital Appreciation Portfolio | 3,169,600 | 2,751,914 |
6. Committed Line of Credit.
Certain Funds participate with other funds managed by the investment adviser or an affiliate in a $4.25 billion credit facility (the "line of credit") to be utilized for temporary or emergency purposes to fund shareholder redemptions or for other short-term liquidity purposes. The participating funds have agreed to pay commitment fees on their pro-rata portion of the line of credit, which are reflected in Miscellaneous expenses on the Statement of Operations, and are listed below. During the period, there were no borrowings on this line of credit.
| | Amount |
| VIP Dynamic Capital Appreciation Portfolio | $205 |
7. Security Lending.
Funds lend portfolio securities from time to time in order to earn additional income. Lending agents are used, including National Financial Services (NFS), an affiliate of the investment adviser. Pursuant to a securities lending agreement, NFS will receive a fee, which is capped at 9.9% of a fund's daily lending revenue, for its services as lending agent. A fund may lend securities to certain qualified borrowers, including NFS. On the settlement date of the loan, a fund receives collateral (in the form of U.S. Treasury obligations, letters of credit and/or cash) against the loaned securities and maintains collateral in an amount not less than 100% of the market value of the loaned securities during the period of the loan. The market value of the loaned securities is determined at the close of business of a fund and any additional required collateral is delivered to a fund on the next business day. A fund or borrower may terminate the loan at any time, and if the borrower defaults on its obligation to return the securities loaned because of insolvency or other reasons, a fund may apply collateral received from the borrower against the obligation. A fund may experience delays and costs in recovering the securities loaned. Any cash collateral received is invested in the Fidelity Securities Lending Cash Central Fund. Any loaned securities are identified as such in the Schedule of Investments, and the value of loaned securities and cash collateral at period end, as applicable, are presented in the Statement of Assets and Liabilities. Security lending income represents the income earned on investing cash collateral, less rebates paid to borrowers and any lending agent fees associated with the loan, plus any premium payments received for lending certain types of securities. Security lending income is presented in the Statement of Operations as a component of income from Fidelity Central Funds. Affiliated security lending activity, if any, was as follows:
| | Total Security Lending Fees Paid to NFS | Security Lending Income From Securities Loaned to NFS | Value of Securities Loaned to NFS at Period End |
| VIP Dynamic Capital Appreciation Portfolio | $861 | $44 | $44,232 |
8. Expense Reductions.
Commissions paid to certain brokers with whom the investment adviser, or its affiliates, places trades on behalf of the Fund include an amount in addition to trade execution, which may be rebated back to the Fund to offset expenses. This amount totaled $8,782 for the period.
In addition, during the period the investment adviser or an affiliate reimbursed and/or waived a portion of fund-level operating expenses in the amount of $305.
9. Distributions to Shareholders.
Distributions to shareholders of each class were as follows:
| | Six months ended
June 30, 2021 | Year ended
December 31, 2020 |
| VIP Dynamic Capital Appreciation Portfolio | | |
| Distributions to shareholders | | |
| Initial Class | $1,815,155 | $364,145 |
| Service Class | 23,246 | 3,946 |
| Service Class 2 | 1,370,623 | 238,875 |
| Investor Class | 11,245,063 | 2,000,826 |
| Total | $14,454,087 | $2,607,792 |
10. Share Transactions.
Transactions for each class of shares were as follows and may contain in-kind transactions:
| | Shares | Shares | Dollars | Dollars |
| | Six months ended June 30, 2021 | Year ended December 31, 2020 | Six months ended June 30, 2021 | Year ended December 31, 2020 |
| VIP Dynamic Capital Appreciation Portfolio | | | | |
| Initial Class | | | | |
| Shares sold | 78,708 | 116,401 | $1,376,266 | $1,654,235 |
| Reinvestment of distributions | 105,226 | 26,220 | 1,815,155 | 364,145 |
| Shares redeemed | (113,613) | (354,192) | (2,009,721) | (4,586,499) |
| Net increase (decrease) | 70,321 | (211,571) | $1,181,700 | $(2,568,119) |
| Service Class | | | | |
| Shares sold | 2,415 | 1 | $41,895 | $7 |
| Reinvestment of distributions | 1,367 | 290 | 23,246 | 3,946 |
| Shares redeemed | (96) | (3,200) | (1,677) | (43,506) |
| Net increase (decrease) | 3,686 | (2,909) | $63,464 | $(39,553) |
| Service Class 2 | | | | |
| Shares sold | 57,037 | 108,547 | $971,080 | $1,422,488 |
| Reinvestment of distributions | 82,617 | 18,124 | 1,370,623 | 238,875 |
| Shares redeemed | (132,299) | (242,941) | (2,232,686) | (3,256,668) |
| Net increase (decrease) | 7,355 | (116,270) | $109,017 | $(1,595,305) |
| Investor Class | | | | |
| Shares sold | 651,799 | 976,276 | $11,360,441 | $14,370,083 |
| Reinvestment of distributions | 653,403 | 145,249 | 11,245,063 | 2,000,826 |
| Shares redeemed | (503,936) | (1,343,259) | (8,852,439) | (17,376,521) |
| Net increase (decrease) | 801,266 | (221,734) | $13,753,065 | $(1,005,612) |
11. Other.
Fund's organizational documents provide former and current trustees and officers with a limited indemnification against liabilities arising in connection with the performance of their duties to the fund. In the normal course of business, the fund may also enter into contracts that provide general indemnifications. The fund's maximum exposure under these arrangements is unknown as this would be dependent on future claims that may be made against the fund. The risk of material loss from such claims is considered remote.
At the end of the period, the investment adviser or its affiliates were owners of record of more than 10% were owners of record of more than 50% of the outstanding shares as follows:
| Fund | Affiliated % |
| VIP: Dynamic Capital Appreciation Portfolio | 91% |
12. Coronavirus (COVID-19) Pandemic.
An outbreak of COVID-19 first detected in China during December 2019 has since spread globally and was declared a pandemic by the World Health Organization during March 2020. Developments that disrupt global economies and financial markets, such as the COVID-19 pandemic, may magnify factors that affect the Fund's performance.
Shareholder Expense Example
As a shareholder, you incur two types of costs: (1) transaction costs, which may include sales charges (loads) on purchase payments or redemption proceeds, as applicable and (2) ongoing costs, which generally include management fees, distribution and/or service (12b-1) fees and other Fund expenses. This Example is intended to help you understand your ongoing costs (in dollars) of investing in a fund and to compare these costs with the ongoing costs of investing in other mutual funds.
The Example is based on an investment of $1,000 invested at the beginning of the period and held for the entire period (January 1, 2021 to June 30, 2021).
Actual Expenses
The first line of the accompanying table provides information about actual account values and actual expenses. You may use the information in this line, together with the amount you invested, to estimate the expenses that you paid over the period. Simply divide your account value by $1,000.00 (for example, an $8,600 account value divided by $1,000.00 = 8.6), then multiply the result by the number in the first line for a class/Fund under the heading entitled "Expenses Paid During Period" to estimate the expenses you paid on your account during this period. If any fund is a shareholder of any underlying mutual funds or exchange-traded funds (ETFs) (the Underlying Funds), such fund indirectly bears its proportional share of the expenses of the Underlying Funds in addition to the direct expenses incurred presented in the table. These fees and expenses are not included in the annualized expense ratio used to calculate the expense estimate in the table below. The estimate of expenses does not include any fees or other expenses of any variable annuity or variable life insurance product. If they were, the estimate of expenses you paid during the period would be higher, and your ending account value would be lower.
Hypothetical Example for Comparison Purposes
The second line of the accompanying table provides information about hypothetical account values and hypothetical expenses based on the actual expense ratio and an assumed rate of return of 5% per year before expenses, which is not the actual return. The hypothetical account values and expenses may not be used to estimate the actual ending account balance or expenses you paid for the period. You may use this information to compare the ongoing costs of investing in the Fund and other funds. To do so, compare this 5% hypothetical example with the 5% hypothetical examples that appear in the shareholder reports of the other funds. If any fund is a shareholder of any Underlying Funds, such fund indirectly bears its proportional share of the expenses of the Underlying Funds in addition to the direct expenses as presented in the table. These fees and expenses are not included in the annualized expense ratio used to calculate the expense estimate in the table below. The estimate of expenses does not include any fees or other expenses of any variable annuity or variable life insurance product. If they were, the estimate of expenses you paid during the period would be higher, and your ending account value would be lower.
Please note that the expenses shown in the table are meant to highlight your ongoing costs only and do not reflect any transaction costs. Therefore, the second line of the table is useful in comparing ongoing costs only, and will not help you determine the relative total costs of owning different funds.
| | Annualized Expense Ratio-A | Beginning
Account Value
January 1, 2021 | Ending
Account Value
June 30, 2021 | Expenses Paid
During Period-B
January 1, 2021
to June 30, 2021 |
| VIP Dynamic Capital Appreciation Portfolio | | | | |
| Initial Class | .66% | | | |
| Actual | | $1,000.00 | $1,140.50 | $3.50 |
| Hypothetical-C | | $1,000.00 | $1,021.52 | $3.31 |
| Service Class | .76% | | | |
| Actual | | $1,000.00 | $1,139.90 | $4.03 |
| Hypothetical-C | | $1,000.00 | $1,021.03 | $3.81 |
| Service Class 2 | .91% | | | |
| Actual | | $1,000.00 | $1,138.60 | $4.83 |
| Hypothetical-C | | $1,000.00 | $1,020.28 | $4.56 |
| Investor Class | .74% | | | |
| Actual | | $1,000.00 | $1,139.50 | $3.93 |
| Hypothetical-C | | $1,000.00 | $1,021.12 | $3.71 |
A Annualized expense ratio reflects expenses net of applicable fee waivers.
B Expenses are equal to the annualized expense ratio, multiplied by the average account value over the period, multiplied by 181/ 365 (to reflect the one-half year period). The fees and expenses of any Underlying Funds are not included in each annualized expense ratio.
C 5% return per year before expenses
Board Approval of Investment Advisory Contracts and Management Fees
VIP Dynamic Capital Appreciation Portfolio
Each year, the Board of Trustees, including the Independent Trustees (together, the Board), votes on the renewal of the management contract with Fidelity Management & Research Company LLC (FMR) and the sub-advisory agreements (together, the Advisory Contracts) for the fund. FMR and the sub-advisers are referred to herein as the Investment Advisers. The Board, assisted by the advice of fund counsel and Independent Trustees' counsel, requests and considers a broad range of information relevant to the renewal of the Advisory Contracts throughout the year.
The Board meets regularly and, at each of its meetings, covers an extensive agenda of topics and materials and considers factors that are relevant to its annual consideration of the renewal of the fund's Advisory Contracts, including the services and support provided to the fund and its shareholders. The Board has established various standing committees (Committees), each composed of and chaired by Independent Trustees with varying backgrounds, to which the Board has assigned specific subject matter responsibilities in order to enhance effective decision-making by the Board. The Board, acting directly and through its Committees, requests and receives information concerning the annual consideration of the renewal of the fund's Advisory Contracts. The Board also meets as needed to review matters specifically related to the Board's annual consideration of the renewal of the Advisory Contracts. Members of the Board may also meet with trustees of other Fidelity funds through joint ad hoc committees to discuss certain matters relevant to all of the Fidelity funds.
Approval of Stub Period Continuation. At its January 2021 meeting, the Board of Trustees voted to continue the fund's management contract with FMR, and the sub-advisory agreements and sub-subadvisory agreements, in each case, where applicable (together, the Advisory Contracts), without modification, for four months from February 1, 2021 through May 31, 2021, in connection with changes to the Board's meeting calendar. The Board considered that the approval of the fund's Advisory Contracts will not result in any changes in (i) the investment process or strategies employed in the management of the fund's assets; (ii) the fees and expenses paid by shareholders; (iii) the nature, extent or quality of services provided under the fund's Advisory Contracts; or (iv) the day-to-day management of the fund or the persons primarily responsible for such management. The Board also considered that since its last approval of the fund's Advisory Contracts, FMR had provided additional information on the fund in support of the annual contract renewal process, including competitive analyses on total expenses and management fees and in-depth reviews of fund performance and fund profitability information. The Board also considered the findings of certain ad hoc committees that had been previously formed to discuss matters relevant to all of the Fidelity funds, including economies of scale, fall-out benefits and retail vs. institutional funds. The Board concluded that the fund's Advisory Contracts are fair and reasonable, and that the fund's Advisory Contracts should be renewed, without modification, through May 31, 2021, with the understanding that the Board will consider the annual renewal for a full one year period in May 2021.
At its May 2021 meeting, the Board unanimously determined to renew the fund's Advisory Contracts. In reaching its determination, the Board considered all factors it believed relevant, including (i) the nature, extent, and quality of the services provided to the fund and its shareholders (including the investment performance of the fund); (ii) the competitiveness of the fund's management fee and total expense ratio relative to peer funds; (iii) the total costs of the services provided by and the profits realized by Fidelity from its relationships with the fund; and (iv) the extent to which, if any, economies of scale exist and are realized as the fund grows, and whether any economies of scale are appropriately shared with fund shareholders.
In considering whether to renew the Advisory Contracts for the fund, the Board reached a determination, with the assistance of fund counsel and Independent Trustees' counsel and through the exercise of its business judgment, that the renewal of the Advisory Contracts was in the best interests of the fund and its shareholders and that the compensation payable under the Advisory Contracts was fair and reasonable. The Board's decision to renew the Advisory Contracts was not based on any single factor, but rather was based on a comprehensive consideration of all the information provided to the Board at its meetings throughout the year. The Board, in reaching its determination to renew the Advisory Contracts, was aware that shareholders of the fund have a broad range of investment choices available to them, including a wide choice among funds offered by Fidelity's competitors, and that the fund's shareholders, who have the opportunity to review and weigh the disclosure provided by the fund in its prospectus and other public disclosures, have chosen to invest in this fund, which is part of the Fidelity family of funds.
Nature, Extent, and Quality of Services Provided. The Board considered Fidelity's staffing as it relates to the fund, including the backgrounds of investment personnel of Fidelity, and also considered the fund's investment objective, strategies, and related investment philosophy. The Independent Trustees also had discussions with senior management of Fidelity's investment operations and investment groups. The Board considered the structure of the investment personnel compensation program and whether this structure provides appropriate incentives to act in the best interests of the fund. Additionally, the Board considered the portfolio managers' investments, if any, in the funds that they manage.
Resources Dedicated to Investment Management and Support Services. The Board and the Fund Oversight and Research Committees reviewed the general qualifications and capabilities of Fidelity's investment staff, including its size, education, experience, and resources, as well as Fidelity's approach to recruiting, training, managing, and compensating investment personnel. The Board noted that Fidelity has continued to increase the resources devoted to non-U.S. offices, including expansion of Fidelity's global investment organization. The Board also noted that Fidelity's analysts have extensive resources, tools and capabilities that allow them to conduct sophisticated quantitative and fundamental analysis, as well as credit analysis of issuers, counterparties and guarantors. Further, the Board considered that Fidelity's investment professionals have sufficient access to global information and data so as to provide competitive investment results over time, and that those professionals also have access to sophisticated tools that permit them to assess portfolio construction and risk and performance attribution characteristics continuously, as well as to transmit new information and research conclusions rapidly around the world. Additionally, in its deliberations, the Board considered Fidelity's trading, risk management, compliance, and technology and operations capabilities and resources, which are integral parts of the investment management process. The Board also considered Fidelity's investments in business continuity planning, and its success in continuously providing services to the fund notwithstanding the severe disruptions caused by the COVID-19 pandemic.
Shareholder and Administrative Services. The Board considered (i) the nature, extent, quality, and cost of advisory, administrative, and shareholder services performed by the Investment Advisers and their affiliates under the Advisory Contracts and under separate agreements covering transfer agency, pricing and bookkeeping, and securities lending services for the fund; (ii) the nature and extent of the supervision of third party service providers, principally custodians, subcustodians, and pricing vendors; and (iii) the resources devoted to, and the record of compliance with, the fund's compliance policies and procedures. The Board also reviewed the allocation of fund brokerage, including allocations to brokers affiliated with the Investment Advisers, the use of brokerage commissions to pay fund expenses, and the use of "soft" commission dollars to pay for research services.
The Board noted that the growth of fund assets over time across the complex allows Fidelity to reinvest in the development of services designed to enhance the value and convenience of the Fidelity funds as investment vehicles. These services include 24-hour access to account information and market information over the Internet and through telephone representatives, investor education materials and asset allocation tools, and the expanded availability of Fidelity Investor Centers.
The Board noted that, in the past, it and the boards of certain other Fidelity funds had formed an ad hoc Committee on Transfer Agency Fees to review the variety of transfer agency fee structures throughout the industry and Fidelity's competitive positioning with respect to industry participants.
Investment in a Large Fund Family. The Board considered the benefits to shareholders of investing in a Fidelity fund, including the benefits of investing in a fund that is part of a large family of funds offering a variety of investment disciplines and providing a large variety of mutual fund investor services. The Board noted that Fidelity had taken, or had made recommendations that resulted in the Fidelity funds taking, a number of actions over the previous year that benefited particular funds, including: (i) continuing to dedicate additional resources to Fidelity's investment research process, which includes meetings with management of issuers of securities in which the funds invest, and to the support of the senior management team that oversees asset management; (ii) continuing efforts to enhance Fidelity's global research capabilities; (iii) launching new funds and ETFs with innovative structures, strategies and pricing and making other enhancements to meet client needs; (iv) launching new share classes of existing funds; (v) eliminating purchase minimums and broadening eligibility requirements for certain funds and share classes; (vi) approving the reduction in the holding period for the Class C to Class A conversion policy; (vii) reducing management fees and total expenses for certain target date funds and classes and index funds; (viii) lowering expenses for certain existing funds and classes by implementing or lowering expense caps; (ix) rationalizing product lines and gaining increased efficiencies from fund mergers, liquidations, and share class consolidations; (x) continuing to develop, acquire and implement systems and technology to improve services to the funds and shareholders, strengthen information security, and increase efficiency; and (xi) continuing to implement enhancements to further strengthen Fidelity's product line to increase investors' probability of success in achieving their investment goals, including retirement income goals.
Investment Performance. The Board considered whether the fund has operated in accordance with its investment objective, as well as its record of compliance with its investment restrictions and its performance history. The Board noted that there were portfolio management changes for the fund in October 2018 and March 2019. The Board will continue to monitor closely the fund's performance, taking into account the portfolio management changes.
The Board took into account discussions that occur at Board meetings throughout the year with representatives of the Investment Advisers about fund investment performance. In this regard the Board noted that as part of regularly scheduled fund reviews and other reports to the Board on fund performance, the Board considers annualized return information for the fund for different time periods, measured against an appropriate securities market index (benchmark index) and an appropriate peer group of funds with similar objectives (peer group). In its evaluation of fund investment performance, the Board gave particular attention to information indicating changes in performance of certain Fidelity funds for specific time periods and discussed with the Investment Advisers the reasons for any overperformance or underperformance.
In addition to reviewing absolute and relative fund performance, the Independent Trustees periodically consider the appropriateness of fund performance metrics in evaluating the results achieved. In general, the Independent Trustees believe that fund performance should be evaluated based on net performance (after fees and expenses) of both the highest performing and lowest performing fund share classes, where applicable, compared to appropriate benchmark indices, over appropriate time periods that may include full market cycles, and compared to peer groups, as applicable, over the same periods, taking into account relevant factors including the following: general market conditions; issuer-specific information; and fund cash flows and other factors.
The Independent Trustees recognize that shareholders evaluate performance on a net basis over their own holding periods, for which one-, three-, and five-year periods are often used as a proxy. For this reason, the performance information reviewed by the Board also included net cumulative total return information for the fund and an appropriate benchmark index and peer group for the most recent one-, three-, and five-year periods ended September 30, 2020, as shown below. Returns are shown compared to the 25th percentile (top of box, 75% beaten) and 75th percentile (bottom of box, 25% beaten) of the peer universe.
VIP Dynamic Capital Appreciation Portfolio
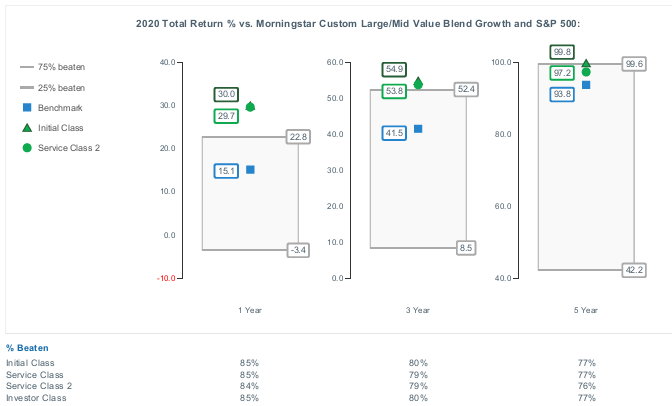
Based on its review, the Board concluded that the nature, extent, and quality of services provided to the fund under the Advisory Contracts should continue to benefit the shareholders of the fund.
Competitiveness of Management Fee and Total Expense Ratio. The Board considered the fund's management fee and total expense ratio compared to "mapped groups" of competitive funds and classes created for the purpose of facilitating the Trustees' competitive analysis of management fees and total expenses. Fidelity creates "mapped groups" by combining similar Lipper investment objective categories that have comparable investment mandates. Combining Lipper investment objective categories aids the Board's management fee and total expense ratio comparisons by broadening the competitive group used for comparison.
Management Fee. The Board considered two proprietary management fee comparisons for the 12-month periods ended September 30 (June 30 for periods ended 2019 and 2018 and December 31 for periods prior to 2018) shown in basis points (BP) in the chart below. The group of Lipper funds used by the Board for management fee comparisons is referred to below as the "Total Mapped Group." The Total Mapped Group comparison focuses on a fund's standing in terms of gross management fees before expense reimbursements or caps relative to the total universe of funds with comparable investment mandates, regardless of whether their management fee structures also are comparable. Funds with comparable investment mandates offer exposure to similar types of securities. Funds with comparable management fee structures have similar management fee contractual arrangements (
e.g., flat rate charged for advisory services, all-inclusive fee rate,
etc.). "TMG %" represents the percentage of funds in the Total Mapped Group that had management fees that were lower than the fund's. For example, a hypothetical TMG % of 20% would mean that 80% of the funds in the Total Mapped Group had higher, and 20% had lower, management fees than the fund. The fund's actual TMG %s and the number of funds in the Total Mapped Group are in the chart below. The "Asset-Sized Peer Group" (ASPG) comparison focuses on a fund's standing relative to a subset of non-Fidelity funds within the Total Mapped Group that are similar in size and management fee structure. For example, if a fund is in the first quartile of the ASPG, the fund's management fee ranks in the least expensive or lowest 25% of funds in the ASPG. The ASPG represents at least 15% of the funds in the Total Mapped Group with comparable asset size and management fee structures, subject to a minimum of 50 funds (or all funds in the Total Mapped Group if fewer than 50). Additional information, such as the ASPG quartile in which the fund's management fee rate ranked, is also included in the chart and was considered by the Board.
VIP Dynamic Capital Appreciation Portfolio
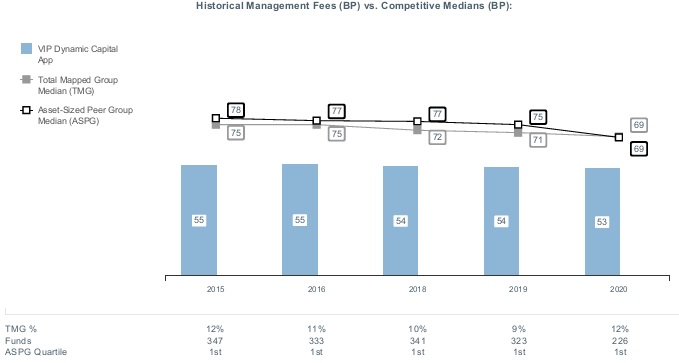
The Board noted that the fund's management fee rate ranked below the median of its Total Mapped Group and below the median of its ASPG for the 12-month period ended September 30, 2020.
The Board noted that, in the past, it and the boards of other Fidelity funds had formed an ad hoc Committee on Group Fee to conduct an in-depth review of the "group fee" component of the management fee of funds with such management fee structures. The Committee's focus included the mechanics of the group fee, the competitive landscape of group fee structures, Fidelity funds with no group fee component and investment products not included in group fee assets. The Board also considered that, for funds subject to the group fee, FMR agreed to voluntarily waive fees over a specified period of time in amounts designed to account for assets converted from certain funds to certain collective investment trusts.
The Board also noted that, in 2013, the ad hoc Committee on Management Fees was formed to conduct an in-depth review of the management fee rates of Fidelity's active equity mutual funds. The Committee focused on the following areas: (i) standard fee structures; (ii) research consumption and trading evolution; (iii) management fee competitiveness/profitability by category; and (iv) factors that drive institutional pricing.
Based on its review, the Board concluded that the fund's management fee is fair and reasonable in light of the services that the fund receives and the other factors considered.
Total Expense Ratio. In its review of each class's total expense ratio, the Board considered the fund's management fee rate as well as other fund or class expenses, as applicable, such as transfer agent fees, pricing and bookkeeping fees, fund-paid 12b-1 fees, and custodial, legal, and audit fees. The Board also noted that Fidelity may agree to waive fees or reimburse expenses from time to time, and the extent to which, if any, it has done so for the fund. As part of its review, the Board also considered the current and historical total expense ratios of each class of the fund compared to competitive fund median expenses. The fund's representative class is compared to those funds and classes in the Total Mapped Group (used by the Board for management fee comparisons) that have a similar sales load structure (SLTG). The Board also considered a total expense ASPG comparison for the representative class, which focuses on the total expenses of the representative class relative to a subset of non-Fidelity funds within the total expense SLTG. The total expense ASPG is limited to 15 larger and 15 smaller classes in fund average assets for a total of 30 classes, where possible. The total expense ASPG comparison excludes performance adjustments and fund-paid 12b-1 fees to eliminate variability in fee structures.
The Board noted that the total expense ratio of Initial Class ranked below the SLTG competitive median and below the ASPG competitive median for the 12-month period ended September 30, 2020.
Fees Charged to Other Fidelity Clients. The Board also considered Fidelity fee structures and other information with respect to clients of Fidelity, such as other funds advised or subadvised by Fidelity, pension plan clients, and other institutional clients with similar mandates. The Board noted that a joint ad hoc committee created by it and the boards of other Fidelity funds periodically reviews and compares Fidelity's institutional investment advisory business with its business of providing services to the Fidelity funds and also noted the most recent findings of the committee. The Board noted that the committee's review included a consideration of the differences in services provided, fees charged, and costs incurred, as well as competition in the markets serving the different categories of clients.
Based on its review of total expense ratios and fees charged to other Fidelity clients, the Board concluded that the total expense ratio of each class of the fund was reasonable in light of the services that the fund and its shareholders receive and the other factors considered.
Costs of the Services and Profitability. The Board considered the revenues earned and the expenses incurred by Fidelity in conducting the business of developing, marketing, distributing, managing, administering and servicing the fund and servicing the fund's shareholders. The Board also considered the level of Fidelity's profits in respect of all the Fidelity funds.
On an annual basis, Fidelity presents to the Board information about the profitability of its relationships with the fund. Fidelity calculates profitability information for each fund, as well as aggregate profitability information for groups of Fidelity funds and all Fidelity funds, using a series of detailed revenue and cost allocation methodologies which originate with the books and records of Fidelity on which Fidelity's audited financial statements are based. The Audit Committee of the Board reviews any significant changes from the prior year's methodologies and the full Board approves such changes.
A public accounting firm has been engaged annually by the Board as part of the Board's assessment of Fidelity's profitability analysis. The engagement includes the review and assessment of the methodologies used by Fidelity in determining the revenues and expenses attributable to Fidelity's mutual fund business, and completion of agreed-upon procedures in respect of the mathematical accuracy of certain fund profitability information and its conformity to established allocation methodologies. After considering the reports issued under the engagement and information provided by Fidelity, the Board concluded that while other allocation methods may also be reasonable, Fidelity's profitability methodologies are reasonable in all material respects.
The Board also reviewed Fidelity's non-fund businesses and potential indirect benefits such businesses may have received as a result of their association with Fidelity's mutual fund business (i.e., fall-out benefits) as well as cases where Fidelity's affiliates may benefit from the funds' business. The Board considered areas where potential indirect benefits to the Fidelity funds from their relationships with Fidelity may exist. The Board also considered that in 2019 a joint ad hoc committee created by it and the boards of other Fidelity funds evaluated potential fall-out benefits (PFOB Committee). The Board noted that it considered the PFOB Committee's findings in connection with its consideration of the renewal of the Advisory Contracts.
The Board considered the costs of the services provided by and the profits realized by Fidelity in connection with the operation of the fund, including the conclusions of the PFOB Committee, and was satisfied that the profitability was not excessive.
Economies of Scale. The Board considered whether there have been economies of scale in respect of the management of the Fidelity funds, whether the Fidelity funds (including the fund) have appropriately benefited from any such economies of scale, and whether there is potential for realization of any further economies of scale. The Board considered the extent to which the fund will benefit from economies of scale as assets grow through increased services to the fund, through waivers or reimbursements, or through fee or expense ratio reductions. The Board also noted that a committee (the Economies of Scale Committee) created by it and the boards of other Fidelity funds periodically analyzes whether Fidelity attains economies of scale in respect of the management and servicing of the Fidelity funds, whether the Fidelity funds have appropriately benefited from such economies of scale, and whether there is potential for realization of any further economies of scale.
The Board recognized that the fund's management contract incorporates a "group fee" structure, which provides for lower group fee rates as total "group assets" increase, and for higher group fee rates as total "group assets" decrease ("group assets" as defined in the management contract). FMR calculates the group fee rates based on a tiered asset "breakpoint" schedule that varies based on asset class. The Board considered that the group fee is designed to deliver the benefits of economies of scale to fund shareholders when total Fidelity fund assets increase, even if assets of any particular fund are unchanged or have declined, because some portion of Fidelity's costs are attributable to services provided to all Fidelity funds, and all funds benefit if those costs can be allocated among more assets. The Board further considered that Fidelity agreed to impose a temporary fee waiver in the form of additional breakpoints to the current breakpoint schedule. The Board concluded that, given the group fee structure, fund shareholders will benefit from lower management fees as "group assets" increase at the fund complex level, regardless of whether Fidelity achieves any such economies of scale.
The Board concluded, taking into account the analysis of the Economies of Scale Committee, that economies of scale, if any, are being appropriately shared between fund shareholders and Fidelity.
Additional Information Requested by the Board. In order to develop fully the factual basis for consideration of the Fidelity funds' advisory contracts, the Board requested and received additional information on certain topics, including: (i) fund flow and performance trends, in particular the underperformance of certain funds and strategies, and Fidelity's long-term strategies for certain funds; (ii) consideration of expanding the use of performance fees for additional funds; (iii) Fidelity's pricing philosophy compared to competitors; (iv) metrics for evaluating index fund and ETF performance and information about ETF trading characteristics; (v) the methodology with respect to evaluating competitive fund data and peer group classifications and fee and expense comparisons; (vi) the expense structures for different funds and classes and information about the differences between various expense structures; (vii) group fee breakpoints; (viii) information regarding other accounts managed by Fidelity and sub-advisory arrangements; and (ix) Fidelity's philosophies and strategies for evaluating funds and classes with lower or declining asset levels.
Based on its evaluation of all of the conclusions noted above, and after considering all factors it believed relevant, the Board concluded that the advisory fee arrangements are fair and reasonable, and that the fund's Advisory Contracts should be renewed.
Liquidity Risk Management Program
The Securities and Exchange Commission adopted Rule 22e-4 under the Investment Company Act of 1940 (the Liquidity Rule) to promote effective liquidity risk management throughout the open-end investment company industry, thereby reducing the risk that funds will be unable to meet their redemption obligations and mitigating dilution of the interests of fund shareholders.
The Fund has adopted and implemented a liquidity risk management program pursuant to the Liquidity Rule (the Program) effective December 1, 2018. The Program is reasonably designed to assess and manage the Fund’s liquidity risk and to comply with the requirements of the Liquidity Rule. The Fund’s Board of Trustees (the Board) has designated the Fund’s investment adviser as administrator of the Program. The Fidelity advisers have established a Liquidity Risk Management Committee (the LRM Committee) to manage the Program for each of the Fidelity Funds. The LRM Committee monitors the adequacy and effectiveness of implementation of the Program and on a periodic basis assesses each Fund’s liquidity risk based on a variety of factors including (1) the Fund’s investment strategy, (2) portfolio liquidity and cash flow projections during normal and reasonably foreseeable stressed conditions, (3) shareholder redemptions, (4) borrowings and other funding sources and (5) in the case of exchange-traded funds, certain additional factors including the effect of the Fund’s prices and spreads, market participants, and basket compositions on the overall liquidity of the Fund’s portfolio, as applicable.
In accordance with the Program, each of the Fund’s portfolio investments is classified into one of four liquidity categories described below based on a determination of a reasonable expectation for how long it would take to convert the investment to cash (or sell or dispose of the investment) without significantly changing its market value.
- Highly liquid investments – cash or convertible to cash within three business days or less
- Moderately liquid investments – convertible to cash in three to seven calendar days
- Less liquid investments – can be sold or disposed of, but not settled, within seven calendar days
- Illiquid investments – cannot be sold or disposed of within seven calendar days
Liquidity classification determinations take into account a variety of factors including various market, trading and investment-specific considerations, as well as market depth, and generally utilize analysis from a third-party liquidity metrics service.
The Liquidity Rule places a 15% limit on a fund’s illiquid investments and requires funds that do not primarily hold assets that are highly liquid investments to determine and maintain a minimum percentage of the fund’s net assets to be invested in highly liquid investments (highly liquid investment minimum or HLIM). The Program includes provisions reasonably designed to comply with the 15% limit on illiquid investments and for determining, periodically reviewing and complying with the HLIM requirement as applicable.
At a recent meeting of the Fund’s Board of Trustees, the LRM Committee provided a written report to the Board pertaining to the operation, adequacy, and effectiveness of implementation of the Program for the annual period from December 1, 2019 through November 30, 2020. The report concluded that the Program has been implemented and is operating effectively and is reasonably designed to assess and manage the Fund’s liquidity risk.
VIPDCA-SANN-0821
1.761772.120
Fidelity® Variable Insurance Products:
Balanced Portfolio
Semi-Annual Report
June 30, 2021
Contents
To view a fund's proxy voting guidelines and proxy voting record for the 12-month period ended June 30, visit http://www.fidelity.com/proxyvotingresults or visit the Securities and Exchange Commission's (SEC) web site at http://www.sec.gov.
You may also call 1-877-208-0098 to request a free copy of the proxy voting guidelines.
Fidelity® Variable Insurance Products are separate account options which are purchased through a variable insurance contract.
Standard & Poor's, S&P and S&P 500 are registered service marks of The McGraw-Hill Companies, Inc. and have been licensed for use by Fidelity Distributors Corporation.
Other third-party marks appearing herein are the property of their respective owners.
All other marks appearing herein are registered or unregistered trademarks or service marks of FMR LLC or an affiliated company. © 2021 FMR LLC. All rights reserved.
This report and the financial statements contained herein are submitted for the general information of the shareholders of the Fund. This report is not authorized for distribution to prospective investors in the Fund unless preceded or accompanied by an effective prospectus.
A fund files its complete schedule of portfolio holdings with the SEC for the first and third quarters of each fiscal year on Form N-PORT. Forms N-PORT are available on the SEC’s web site at http://www.sec.gov. A fund's Forms N-PORT may be reviewed and copied at the SEC’s Public Reference Room in Washington, DC. Information regarding the operation of the SEC's Public Reference Room may be obtained by calling 1-800-SEC-0330.
For a complete list of a fund's portfolio holdings, view the most recent holdings listing, semiannual report, or annual report on Fidelity's web site at http://www.fidelity.com, http://www.institutional.fidelity.com, or http://www.401k.com, as applicable.
NOT FDIC INSURED •MAY LOSE VALUE •NO BANK GUARANTEE
Neither the Fund nor Fidelity Distributors Corporation is a bank.
Note to Shareholders:
Early in 2020, the outbreak and spread of a new coronavirus emerged as a public health emergency that had a major influence on financial markets, primarily based on its impact on the global economy and the outlook for corporate earnings. The virus causes a respiratory disease known as COVID-19. On March 11, 2020 the World Health Organization declared the COVID-19 outbreak a pandemic, citing sustained risk of further global spread.
In the weeks following, as the crisis worsened, we witnessed an escalating human tragedy with wide-scale social and economic consequences from coronavirus-containment measures. The outbreak of COVID-19 prompted a number of measures to limit the spread, including travel and border restrictions, quarantines, and restrictions on large gatherings. In turn, these resulted in lower consumer activity, diminished demand for a wide range of products and services, disruption in manufacturing and supply chains, and – given the wide variability in outcomes regarding the outbreak – significant market uncertainty and volatility. Amid the turmoil, global governments and central banks took unprecedented action to help support consumers, businesses, and the broader economies, and to limit disruption to financial systems.
The situation continues to unfold, and the extent and duration of its impact on financial markets and the economy remain highly uncertain. Extreme events such as the coronavirus crisis are “exogenous shocks” that can have significant adverse effects on mutual funds and their investments. Although multiple asset classes may be affected by market disruption, the duration and impact may not be the same for all types of assets.
Fidelity is committed to helping you stay informed amid news about COVID-19 and during increased market volatility, and we’re taking extra steps to be responsive to customer needs. We encourage you to visit our websites, where we offer ongoing updates, commentary, and analysis on the markets and our funds.
Investment Summary (Unaudited)
The information in the following tables is based on the combined investments of the Fund and its pro-rata share of the investments of Fidelity's Fixed-Income Central Funds.
Top Five Stocks as of June 30, 2021
| | % of fund's net assets |
| Microsoft Corp. | 4.2 |
| Apple, Inc. | 2.7 |
| Amazon.com, Inc. | 2.6 |
| Alphabet, Inc. Class C | 2.4 |
| Facebook, Inc. Class A | 1.8 |
| | 13.7 |
Top Five Bond Issuers as of June 30, 2021
| (with maturities greater than one year) | % of fund's net assets |
| U.S. Treasury Obligations | 9.6 |
| Ginnie Mae | 1.3 |
| Fannie Mae | 1.2 |
| Freddie Mac | 0.7 |
| Morgan Stanley | 0.5 |
| | 13.3 |
Top Five Market Sectors as of June 30, 2021
| | % of fund's net assets |
| Information Technology | 18.0 |
| Financials | 12.8 |
| Health Care | 9.4 |
| Communication Services | 8.7 |
| Consumer Discretionary | 8.4 |
Asset Allocation (% of fund's net assets)
| As of June 30, 2021* |
| | Stocks and Equity Futures | 72.5% |
| | Bonds | 25.5% |
| | Short-Term Investments and Net Other Assets (Liabilities) | 1.9% |
| | Other Investments | 0.1% |

* Foreign investments - 9.5%
An unaudited holdings listing for the Fund, which presents direct holdings as well as the pro-rata share of any securities and other investments held indirectly through its investment in underlying non-money market Fidelity Central Funds, is available at fidelity.com and/or institutional.fidelity.com, as applicable.
Percentages in the above tables are adjusted for the effect of TBA Sale Commitments.
Percentages are adjusted for the effect of futures contracts and swaps, if applicable.
Schedule of Investments June 30, 2021 (Unaudited)
Showing Percentage of Net Assets
| Common Stocks - 70.5% | | | |
| | | Shares | Value |
| COMMUNICATION SERVICES - 7.8% | | | |
| Entertainment - 1.5% | | | |
| Activision Blizzard, Inc. | | 116,277 | $11,097,477 |
| Electronic Arts, Inc. | | 43,023 | 6,187,998 |
| Live Nation Entertainment, Inc. (a) | | 33,508 | 2,934,966 |
| Marcus Corp. (a) | | 60,800 | 1,289,568 |
| Netflix, Inc. (a) | | 61,025 | 32,234,015 |
| Take-Two Interactive Software, Inc. (a) | | 6,300 | 1,115,226 |
| The Walt Disney Co. (a) | | 258,671 | 45,466,602 |
| | | | 100,325,852 |
| Interactive Media & Services - 5.4% | | | |
| Alphabet, Inc.: | | | |
| Class A (a) | | 19,829 | 48,418,254 |
| Class C (a) | | 65,887 | 165,133,906 |
| Facebook, Inc. Class A (a) | | 359,698 | 125,070,592 |
| JOYY, Inc. ADR | | 31,200 | 2,058,264 |
| Snap, Inc. Class A (a) | | 77,200 | 5,260,408 |
| Tongdao Liepin Group (a) | | 1,711,598 | 3,954,776 |
| Twitter, Inc. (a) | | 126,275 | 8,688,983 |
| Vimeo, Inc. (a) | | 51,211 | 2,509,339 |
| Z Holdings Corp. | | 620,100 | 3,107,896 |
| Zoominfo Technologies, Inc. | | 36,100 | 1,883,337 |
| | | | 366,085,755 |
| Media - 0.6% | | | |
| Altice U.S.A., Inc. Class A (a) | | 38,231 | 1,305,206 |
| Comcast Corp. Class A | | 586,500 | 33,442,230 |
| Liberty Media Corp. Liberty Formula One Group Series C (a) | | 31,152 | 1,501,838 |
| ViacomCBS, Inc. Class B | | 139,300 | 6,296,360 |
| | | | 42,545,634 |
| Wireless Telecommunication Services - 0.3% | | | |
| T-Mobile U.S., Inc. | | 161,252 | 23,354,127 |
|
| TOTAL COMMUNICATION SERVICES | | | 532,311,368 |
|
| CONSUMER DISCRETIONARY - 8.1% | | | |
| Automobiles - 0.7% | | | |
| Ferrari NV | | 19,400 | 3,997,370 |
| Tesla, Inc. (a) | | 65,700 | 44,656,290 |
| | | | 48,653,660 |
| Distributors - 0.1% | | | |
| LKQ Corp. (a) | | 190,400 | 9,371,488 |
| Hotels, Restaurants & Leisure - 1.4% | | | |
| Aristocrat Leisure Ltd. | | 165,767 | 5,356,818 |
| Booking Holdings, Inc. (a) | | 8,900 | 19,474,001 |
| Boyd Gaming Corp. (a) | | 68,600 | 4,218,214 |
| Caesars Entertainment, Inc. (a) | | 63,300 | 6,567,375 |
| Churchill Downs, Inc. | | 31,900 | 6,324,494 |
| Compass Group PLC (a) | | 384,900 | 8,109,041 |
| Domino's Pizza, Inc. | | 19,700 | 9,189,853 |
| MakeMyTrip Ltd. (a) | | 85,660 | 2,574,083 |
| Marriott International, Inc. Class A (a) | | 125,600 | 17,146,912 |
| McDonald's Corp. | | 52,200 | 12,057,678 |
| Penn National Gaming, Inc. (a) | | 14,700 | 1,124,403 |
| | | | 92,142,872 |
| Household Durables - 0.5% | | | |
| GoPro, Inc. Class A (a) | | 265,900 | 3,097,735 |
| Leggett & Platt, Inc. | | 133,000 | 6,890,730 |
| Lennar Corp. Class A | | 152,800 | 15,180,680 |
| Mohawk Industries, Inc. (a) | | 29,500 | 5,669,605 |
| Tempur Sealy International, Inc. | | 134,100 | 5,255,379 |
| | | | 36,094,129 |
| Internet & Direct Marketing Retail - 3.1% | | | |
| Amazon.com, Inc. (a) | | 51,210 | 176,170,594 |
| Chewy, Inc. (a)(b) | | 7,800 | 621,738 |
| Coupang, Inc. Class A (a)(b) | | 38,800 | 1,622,616 |
| Deliveroo PLC (a)(b)(c) | | 337,000 | 1,344,440 |
| Deliveroo PLC | | 200,000 | 757,993 |
| eBay, Inc. | | 219,400 | 15,404,074 |
| Farfetch Ltd. Class A (a) | | 101,800 | 5,126,648 |
| Kogan.Com Ltd. | | 33,311 | 289,287 |
| Porch Group, Inc. Class A (a) | | 468,780 | 9,066,205 |
| Shop Apotheke Europe NV (a)(c) | | 5,300 | 995,461 |
| THG PLC | | 242,900 | 2,049,622 |
| ZOZO, Inc. | | 20,100 | 682,997 |
| | | | 214,131,675 |
| Leisure Products - 0.1% | | | |
| Mattel, Inc. (a) | | 191,700 | 3,853,170 |
| Multiline Retail - 0.2% | | | |
| Dollar Tree, Inc. (a) | | 113,800 | 11,323,100 |
| Nordstrom, Inc. (a) | | 121,300 | 4,435,941 |
| | | | 15,759,041 |
| Specialty Retail - 1.4% | | | |
| Auto1 Group SE (c) | | 65,277 | 2,867,752 |
| Burlington Stores, Inc. (a) | | 13,500 | 4,346,865 |
| Industria de Diseno Textil SA | | 127,200 | 4,491,027 |
| Lowe's Companies, Inc. | | 226,600 | 43,953,602 |
| The Home Depot, Inc. | | 76,908 | 24,525,192 |
| TJX Companies, Inc. | | 269,380 | 18,161,600 |
| | | | 98,346,038 |
| Textiles, Apparel & Luxury Goods - 0.6% | | | |
| Capri Holdings Ltd. (a) | | 46,600 | 2,665,054 |
| LVMH Moet Hennessy Louis Vuitton SE | | 8,400 | 6,607,919 |
| NIKE, Inc. Class B | | 79,930 | 12,348,386 |
| PVH Corp. (a) | | 49,500 | 5,325,705 |
| Tapestry, Inc. (a) | | 276,700 | 12,030,916 |
| | | | 38,977,980 |
|
| TOTAL CONSUMER DISCRETIONARY | | | 557,330,053 |
|
| CONSUMER STAPLES - 4.3% | | | |
| Beverages - 1.5% | | | |
| Boston Beer Co., Inc. Class A (a) | | 1,900 | 1,939,520 |
| Constellation Brands, Inc. Class A (sub. vtg.) | | 35,700 | 8,349,873 |
| Keurig Dr. Pepper, Inc. | | 127,917 | 4,507,795 |
| Kweichow Moutai Co. Ltd. (A Shares) | | 8,600 | 2,739,209 |
| Molson Coors Beverage Co. Class B (a) | | 50,600 | 2,716,714 |
| Monster Beverage Corp. (a) | | 128,626 | 11,749,985 |
| PepsiCo, Inc. | | 200,100 | 29,648,817 |
| Pernod Ricard SA | | 27,700 | 6,148,635 |
| The Coca-Cola Co. | | 583,900 | 31,594,829 |
| | | | 99,395,377 |
| Food & Staples Retailing - 1.2% | | | |
| BJ's Wholesale Club Holdings, Inc. (a) | | 166,700 | 7,931,586 |
| Costco Wholesale Corp. | | 69,300 | 27,419,931 |
| U.S. Foods Holding Corp. (a) | | 223,900 | 8,588,804 |
| Walgreens Boots Alliance, Inc. | | 139,200 | 7,323,312 |
| Walmart, Inc. | | 203,500 | 28,697,570 |
| Zur Rose Group AG (a) | | 3,410 | 1,306,506 |
| | | | 81,267,709 |
| Food Products - 0.4% | | | |
| Bunge Ltd. | | 18,000 | 1,406,700 |
| Darling Ingredients, Inc. (a) | | 41,600 | 2,808,000 |
| Freshpet, Inc. (a) | | 10,300 | 1,678,488 |
| Hotel Chocolat Group Ltd. (a) | | 30,400 | 150,968 |
| Lamb Weston Holdings, Inc. | | 84,800 | 6,839,968 |
| Mondelez International, Inc. | | 278,300 | 17,377,052 |
| | | | 30,261,176 |
| Household Products - 0.8% | | | |
| Procter & Gamble Co. | | 365,100 | 49,262,943 |
| The Clorox Co. | | 22,400 | 4,029,984 |
| | | | 53,292,927 |
| Personal Products - 0.2% | | | |
| Estee Lauder Companies, Inc. Class A | | 46,700 | 14,854,336 |
| Herbalife Nutrition Ltd. (a) | | 40,400 | 2,130,292 |
| | | | 16,984,628 |
| Tobacco - 0.2% | | | |
| Altria Group, Inc. | | 263,500 | 12,563,680 |
|
| TOTAL CONSUMER STAPLES | | | 293,765,497 |
|
| ENERGY - 2.6% | | | |
| Energy Equipment & Services - 0.2% | | | |
| Baker Hughes Co. Class A | | 201,600 | 4,610,592 |
| Halliburton Co. | | 199,400 | 4,610,128 |
| Oceaneering International, Inc. (a) | | 111,690 | 1,739,013 |
| Subsea 7 SA | | 341,800 | 3,281,382 |
| | | | 14,241,115 |
| Oil, Gas & Consumable Fuels - 2.4% | | | |
| Africa Oil Corp. (a) | | 1,702,854 | 1,634,718 |
| APA Corp. | | 130,500 | 2,822,715 |
| Canadian Natural Resources Ltd. | | 313,100 | 11,366,167 |
| Cheniere Energy, Inc. (a) | | 34,800 | 3,018,552 |
| Chevron Corp. | | 36,100 | 3,781,114 |
| DHT Holdings, Inc. | | 73,400 | 476,366 |
| Enterprise Products Partners LP | | 32,200 | 776,986 |
| Euronav NV | | 47,600 | 442,503 |
| Exxon Mobil Corp. | | 916,100 | 57,787,588 |
| Harbour Energy PLC (a) | | 332,150 | 1,732,176 |
| Hess Corp. | | 174,500 | 15,237,340 |
| Imperial Oil Ltd. | | 157,300 | 4,794,122 |
| Kosmos Energy Ltd. (a) | | 423,100 | 1,463,926 |
| Magellan Midstream Partners LP | | 81,400 | 3,981,274 |
| Marathon Petroleum Corp. | | 28,700 | 1,734,054 |
| MEG Energy Corp. (a) | | 1,229,400 | 8,896,191 |
| Murphy Oil Corp. | | 137,200 | 3,194,016 |
| Phillips 66 Co. | | 125,826 | 10,798,387 |
| Range Resources Corp. (a) | | 90,000 | 1,508,400 |
| Reliance Industries Ltd. | | 18,564 | 371,193 |
| Reliance Industries Ltd. | | 539,137 | 15,301,950 |
| Reliance Industries Ltd. sponsored GDR (c) | | 83,400 | 4,720,440 |
| Valero Energy Corp. | | 101,200 | 7,901,696 |
| | | | 163,741,874 |
|
| TOTAL ENERGY | | | 177,982,989 |
|
| FINANCIALS - 8.4% | | | |
| Banks - 3.3% | | | |
| Bank of America Corp. | | 1,312,087 | 54,097,347 |
| BNP Paribas SA | | 55,100 | 3,458,056 |
| Citigroup, Inc. | | 149,854 | 10,602,171 |
| Citizens Financial Group, Inc. | | 194,200 | 8,907,954 |
| Comerica, Inc. | | 65,400 | 4,665,636 |
| EFG Eurobank Ergasias SA (a) | | 4,660,800 | 4,697,562 |
| First Horizon National Corp. | | 170,700 | 2,949,696 |
| JPMorgan Chase & Co. | | 203,200 | 31,605,728 |
| M&T Bank Corp. | | 32,800 | 4,766,168 |
| NatWest Group PLC | | 539,000 | 1,515,057 |
| Piraeus Financial Holdings SA (a) | | 777,300 | 1,373,308 |
| PNC Financial Services Group, Inc. | | 118,000 | 22,509,680 |
| Signature Bank | | 14,100 | 3,463,665 |
| Societe Generale Series A | | 242,000 | 7,158,703 |
| Standard Chartered PLC (United Kingdom) | | 566,000 | 3,609,389 |
| Starling Bank Ltd. Series D (a)(d) | | 756,521 | 1,354,531 |
| UniCredit SpA | | 282,800 | 3,336,535 |
| Wells Fargo & Co. | | 1,246,300 | 56,444,927 |
| | | | 226,516,113 |
| Capital Markets - 1.9% | | | |
| Bank of New York Mellon Corp. | | 681,300 | 34,902,999 |
| BlackRock, Inc. Class A | | 28,400 | 24,849,148 |
| Cboe Global Markets, Inc. | | 42,825 | 5,098,316 |
| Coinbase Global, Inc. (a) | | 2,700 | 683,910 |
| Goldman Sachs Group, Inc. | | 28,800 | 10,930,464 |
| Intercontinental Exchange, Inc. | | 36,000 | 4,273,200 |
| Morgan Stanley | | 305,700 | 28,029,633 |
| State Street Corp. | | 102,000 | 8,392,560 |
| StepStone Group, Inc. Class A | | 156,711 | 5,390,858 |
| Virtu Financial, Inc. Class A | | 218,700 | 6,042,681 |
| | | | 128,593,769 |
| Consumer Finance - 1.6% | | | |
| 360 DigiTech, Inc. ADR (a) | | 42,000 | 1,757,280 |
| Ally Financial, Inc. | | 45,500 | 2,267,720 |
| American Express Co. | | 169,800 | 28,056,054 |
| Capital One Financial Corp. | | 388,858 | 60,152,444 |
| OneMain Holdings, Inc. | | 273,529 | 16,387,122 |
| Shriram Transport Finance Co. Ltd. | | 101,146 | 1,826,177 |
| | | | 110,446,797 |
| Diversified Financial Services - 0.6% | | | |
| Ant International Co. Ltd. Class C (a)(d)(e) | | 621,699 | 1,809,144 |
| Berkshire Hathaway, Inc.: | | | |
| Class A (a) | | 13 | 5,441,813 |
| Class B (a) | | 91,000 | 25,290,720 |
| Latch, Inc. (e) | | 77,900 | 908,041 |
| Proterra, Inc. (e) | | 114,600 | 1,862,766 |
| Voya Financial, Inc. | | 93,100 | 5,725,650 |
| | | | 41,038,134 |
| Insurance - 1.0% | | | |
| AIA Group Ltd. | | 298,400 | 3,701,825 |
| American International Group, Inc. | | 209,900 | 9,991,240 |
| Arthur J. Gallagher & Co. | | 59,328 | 8,310,666 |
| Fairfax Financial Holdings Ltd. (sub. vtg.) | | 6,300 | 2,762,730 |
| Hartford Financial Services Group, Inc. | | 232,100 | 14,383,237 |
| The Travelers Companies, Inc. | | 157,500 | 23,579,325 |
| Willis Towers Watson PLC | | 31,602 | 7,269,092 |
| | | | 69,998,115 |
| Thrifts & Mortgage Finance - 0.0% | | | |
| Mr. Cooper Group, Inc. (a) | | 7 | 231 |
|
| TOTAL FINANCIALS | | | 576,593,159 |
|
| HEALTH CARE - 9.0% | | | |
| Biotechnology - 0.8% | | | |
| Amgen, Inc. | | 115,304 | 28,105,350 |
| Argenx SE ADR (a) | | 15,700 | 4,726,799 |
| Biogen, Inc. (a) | | 3,933 | 1,361,880 |
| Blueprint Medicines Corp. (a) | | 30,200 | 2,656,392 |
| Regeneron Pharmaceuticals, Inc. (a) | | 29,600 | 16,532,784 |
| Vertex Pharmaceuticals, Inc. (a) | | 7,400 | 1,492,062 |
| | | | 54,875,267 |
| Health Care Equipment & Supplies - 2.6% | | | |
| Abbott Laboratories | | 326,719 | 37,876,534 |
| Boston Scientific Corp. (a) | | 857,780 | 36,678,673 |
| DexCom, Inc. (a) | | 23,800 | 10,162,600 |
| Envista Holdings Corp. (a) | | 235,000 | 10,154,350 |
| Intuitive Surgical, Inc. (a) | | 28,300 | 26,025,812 |
| Nevro Corp. (a) | | 32,200 | 5,338,438 |
| ResMed, Inc. | | 16,371 | 4,035,779 |
| Siemens Healthineers AG (c) | | 217,300 | 13,316,048 |
| Stryker Corp. | | 143,271 | 37,211,777 |
| | | | 180,800,011 |
| Health Care Providers & Services - 2.5% | | | |
| AmerisourceBergen Corp. | | 108,600 | 12,433,614 |
| dentalcorp Holdings Ltd. (a) | | 146,933 | 1,951,046 |
| Guardant Health, Inc. (a) | | 23,400 | 2,906,046 |
| HCA Holdings, Inc. | | 111,500 | 23,051,510 |
| Humana, Inc. | | 59,300 | 26,253,296 |
| LifeStance Health Group, Inc. | | 154,800 | 4,312,728 |
| Oak Street Health, Inc. (a) | | 68,100 | 3,988,617 |
| Option Care Health, Inc. (a) | | 293,400 | 6,416,658 |
| Surgery Partners, Inc. (a) | | 240,900 | 16,048,758 |
| UnitedHealth Group, Inc. | | 174,189 | 69,752,243 |
| | | | 167,114,516 |
| Health Care Technology - 0.1% | | | |
| Health Catalyst, Inc. (a) | | 114,300 | 6,344,793 |
| Life Sciences Tools & Services - 0.7% | | | |
| Avantor, Inc. (a) | | 342,200 | 12,151,522 |
| Thermo Fisher Scientific, Inc. | | 66,834 | 33,715,748 |
| | | | 45,867,270 |
| Pharmaceuticals - 2.3% | | | |
| AstraZeneca PLC sponsored ADR (b) | | 241,300 | 14,453,870 |
| Bristol-Myers Squibb Co. | | 470,360 | 31,429,455 |
| Eli Lilly & Co. | | 153,000 | 35,116,560 |
| Horizon Therapeutics PLC (a) | | 183,300 | 17,164,212 |
| Roche Holding AG (participation certificate) | | 28,919 | 10,897,782 |
| Royalty Pharma PLC (b) | | 261,500 | 10,718,885 |
| UCB SA | | 118,279 | 12,364,380 |
| Zoetis, Inc. Class A | | 147,829 | 27,549,412 |
| | | | 159,694,556 |
|
| TOTAL HEALTH CARE | | | 614,696,413 |
|
| INDUSTRIALS - 7.6% | | | |
| Aerospace & Defense - 2.0% | | | |
| General Dynamics Corp. | | 118,016 | 22,217,692 |
| Lockheed Martin Corp. | | 41,000 | 15,512,350 |
| Northrop Grumman Corp. | | 70,800 | 25,730,844 |
| Raytheon Technologies Corp. | | 414,300 | 35,343,933 |
| Space Exploration Technologies Corp. Class A (a)(d)(e) | | 1,700 | 713,983 |
| The Boeing Co. (a) | | 149,868 | 35,902,378 |
| | | | 135,421,180 |
| Air Freight & Logistics - 0.6% | | | |
| FedEx Corp. | | 104,519 | 31,181,153 |
| United Parcel Service, Inc. Class B | | 58,600 | 12,187,042 |
| | | | 43,368,195 |
| Airlines - 0.0% | | | |
| Spirit Airlines, Inc. (a) | | 136,900 | 4,167,236 |
| Commercial Services & Supplies - 0.1% | | | |
| CoreCivic, Inc. (a) | | 486,700 | 5,095,749 |
| Construction & Engineering - 0.4% | | | |
| AECOM (a) | | 340,617 | 21,567,868 |
| Granite Construction, Inc. | | 115,014 | 4,776,531 |
| | | | 26,344,399 |
| Electrical Equipment - 1.1% | | | |
| Array Technologies, Inc. | | 330,666 | 5,158,390 |
| Emerson Electric Co. | | 4,700 | 452,328 |
| Plug Power, Inc. (a) | | 63,900 | 2,184,741 |
| Sensata Technologies, Inc. PLC (a) | | 456,235 | 26,447,943 |
| Shoals Technologies Group, Inc. | | 53,950 | 1,915,225 |
| Sunrun, Inc. (a) | | 701,540 | 39,131,901 |
| | | | 75,290,528 |
| Industrial Conglomerates - 0.7% | | | |
| 3M Co. | | 42,668 | 8,475,145 |
| General Electric Co. | | 2,450,439 | 32,982,909 |
| Honeywell International, Inc. | | 27,400 | 6,010,190 |
| | | | 47,468,244 |
| Machinery - 1.0% | | | |
| Allison Transmission Holdings, Inc. | | 589,659 | 23,433,049 |
| Caterpillar, Inc. | | 175,647 | 38,226,057 |
| Flowserve Corp. | | 123,800 | 4,991,616 |
| | | | 66,650,722 |
| Marine - 0.2% | | | |
| Genco Shipping & Trading Ltd. | | 195,700�� | 3,694,816 |
| Golden Ocean Group Ltd. | | 184,400 | 2,035,776 |
| Star Bulk Carriers Corp. | | 382,560 | 8,779,752 |
| | | | 14,510,344 |
| Professional Services - 0.6% | | | |
| Dun & Bradstreet Holdings, Inc. (a) | | 209,200 | 4,470,604 |
| Nielsen Holdings PLC | | 1,659,031 | 40,928,295 |
| Renrui Human Resources Technology Holdings Ltd. | | 96,400 | 266,940 |
| | | | 45,665,839 |
| Road & Rail - 0.9% | | | |
| Lyft, Inc. (a) | | 155,863 | 9,426,594 |
| Norfolk Southern Corp. | | 80,746 | 21,430,796 |
| Uber Technologies, Inc. (a) | | 477,722 | 23,943,427 |
| Union Pacific Corp. | | 23,049 | 5,069,167 |
| | | | 59,869,984 |
|
| TOTAL INDUSTRIALS | | | 523,852,420 |
|
| INFORMATION TECHNOLOGY - 17.4% | | | |
| Electronic Equipment & Components - 1.5% | | | |
| Corning, Inc. | | 53,700 | 2,196,330 |
| Flex Ltd. (a) | | 1,522,026 | 27,198,605 |
| Hon Hai Precision Industry Co. Ltd. (Foxconn) | | 1,204,000 | 4,830,232 |
| Insight Enterprises, Inc. (a) | | 38,838 | 3,884,188 |
| Jabil, Inc. | | 1,053,700 | 61,241,044 |
| | | | 99,350,399 |
| IT Services - 3.5% | | | |
| Bright Health Group, Inc. (b) | | 168,168 | 2,885,763 |
| Capgemini SA | | 25,200 | 4,840,706 |
| Cognizant Technology Solutions Corp. Class A | | 81,300 | 5,630,838 |
| Dlocal Ltd. | | 63,000 | 3,309,390 |
| Fidelity National Information Services, Inc. | | 49,700 | 7,040,999 |
| Fiserv, Inc. (a) | | 18,400 | 1,966,776 |
| Genpact Ltd. | | 109,100 | 4,956,413 |
| Global Payments, Inc. | | 51,500 | 9,658,310 |
| GoDaddy, Inc. (a) | | 31,700 | 2,756,632 |
| Liveramp Holdings, Inc. (a) | | 47,000 | 2,201,950 |
| MasterCard, Inc. Class A | | 230,900 | 84,299,281 |
| PayPal Holdings, Inc. (a) | | 149,100 | 43,459,668 |
| Visa, Inc. Class A | | 252,532 | 59,047,032 |
| Wix.com Ltd. (a) | | 22,000 | 6,386,160 |
| | | | 238,439,918 |
| Semiconductors & Semiconductor Equipment - 3.1% | | | |
| Advanced Micro Devices, Inc. (a) | | 6,700 | 629,331 |
| Applied Materials, Inc. | | 115,000 | 16,376,000 |
| Cirrus Logic, Inc. (a) | | 58,200 | 4,953,984 |
| eMemory Technology, Inc. | | 51,000 | 2,438,793 |
| Lam Research Corp. | | 20,600 | 13,404,420 |
| Marvell Technology, Inc. | | 221,272 | 12,906,796 |
| Micron Technology, Inc. (a) | | 256,900 | 21,831,362 |
| NVIDIA Corp. | | 82,600 | 66,088,260 |
| NXP Semiconductors NV | | 149,712 | 30,798,753 |
| ON Semiconductor Corp. (a) | | 539,112 | 20,637,207 |
| Qualcomm, Inc. | | 72,397 | 10,347,703 |
| Renesas Electronics Corp. (a) | | 168,800 | 1,824,824 |
| Semtech Corp. (a) | | 28,400 | 1,953,920 |
| SiTime Corp. (a) | | 15,200 | 1,924,168 |
| Xilinx, Inc. | | 26,100 | 3,775,104 |
| | | | 209,890,625 |
| Software - 6.5% | | | |
| Adobe, Inc. (a) | | 18,200 | 10,658,648 |
| Anaplan, Inc. (a) | | 185,500 | 9,887,150 |
| Autodesk, Inc. (a) | | 75,769 | 22,116,971 |
| Avalara, Inc. (a) | | 11,300 | 1,828,340 |
| Ceridian HCM Holding, Inc. (a) | | 22,400 | 2,148,608 |
| Cognyte Software Ltd. (a) | | 315,548 | 7,730,926 |
| Coupa Software, Inc. (a) | | 7,400 | 1,939,614 |
| Digital Turbine, Inc. (a) | | 11,300 | 859,139 |
| Elastic NV (a) | | 18,200 | 2,652,832 |
| Epic Games, Inc. (d)(e) | | 1,812 | 1,603,620 |
| Everbridge, Inc. (a) | | 12,600 | 1,714,608 |
| Intapp, Inc. | | 1,100 | 30,800 |
| Intuit, Inc. | | 18,100 | 8,872,077 |
| Lightspeed POS, Inc. | | 18,300 | 1,530,063 |
| LivePerson, Inc. (a) | | 13,000 | 822,120 |
| Microsoft Corp. | | 1,047,100 | 283,659,390 |
| Momentive Global, Inc. (a) | | 908,700 | 19,146,309 |
| Salesforce.com, Inc. (a) | | 143,100 | 34,955,037 |
| SentinelOne, Inc. | | 28,300 | 1,202,750 |
| ServiceNow, Inc. (a) | | 9,400 | 5,165,770 |
| Stripe, Inc. Class B (a)(d)(e) | | 19,953 | 800,614 |
| Verint Systems, Inc. (a) | | 84,700 | 3,817,429 |
| Workday, Inc. Class A (a) | | 42,400 | 10,122,576 |
| Workiva, Inc. (a) | | 6,900 | 768,177 |
| Yext, Inc. (a) | | 592,000 | 8,459,680 |
| Zendesk, Inc. (a) | | 38,200 | 5,513,788 |
| | | | 448,007,036 |
| Technology Hardware, Storage & Peripherals - 2.8% | | | |
| Apple, Inc. | | 1,362,664 | 186,630,461 |
| HP, Inc. | | 175,300 | 5,292,307 |
| Western Digital Corp. (a) | | 46,300 | 3,295,171 |
| | | | 195,217,939 |
|
| TOTAL INFORMATION TECHNOLOGY | | | 1,190,905,917 |
|
| MATERIALS - 2.0% | | | |
| Chemicals - 1.1% | | | |
| Air Products & Chemicals, Inc. | | 19,173 | 5,515,689 |
| Albemarle Corp. U.S. | | 19,700 | 3,318,662 |
| Amyris, Inc. (a) | | 579,179 | 9,481,160 |
| Balchem Corp. | | 19,200 | 2,520,192 |
| Ecolab, Inc. | | 31,386 | 6,464,574 |
| FMC Corp. | | 33,400 | 3,613,880 |
| Innospec, Inc. | | 35,400 | 3,207,594 |
| Linde PLC | | 44,480 | 12,859,168 |
| LyondellBasell Industries NV Class A | | 41,100 | 4,227,957 |
| Olin Corp. | | 231,800 | 10,723,068 |
| Sherwin-Williams Co. | | 17,871 | 4,868,954 |
| Valvoline, Inc. | | 173,300 | 5,625,318 |
| | | | 72,426,216 |
| Construction Materials - 0.3% | | | |
| Martin Marietta Materials, Inc. | | 19,034 | 6,696,352 |
| Summit Materials, Inc. (a) | | 173,945 | 6,061,983 |
| Vulcan Materials Co. | | 32,000 | 5,570,240 |
| | | | 18,328,575 |
| Containers & Packaging - 0.1% | | | |
| Crown Holdings, Inc. | | 81,100 | 8,289,231 |
| Metals & Mining - 0.5% | | | |
| Commercial Metals Co. | | 125,914 | 3,868,078 |
| First Quantum Minerals Ltd. | | 433,700 | 9,995,812 |
| Freeport-McMoRan, Inc. | | 317,931 | 11,798,419 |
| Newmont Corp. | | 138,903 | 8,803,672 |
| | | | 34,465,981 |
|
| TOTAL MATERIALS | | | 133,510,003 |
|
| REAL ESTATE - 1.7% | | | |
| Equity Real Estate Investment Trusts (REITs) - 1.6% | | | |
| Alexandria Real Estate Equities, Inc. | | 32,100 | 5,840,274 |
| American Tower Corp. | | 65,700 | 17,748,198 |
| Corporate Office Properties Trust (SBI) | | 39,400 | 1,102,806 |
| CubeSmart | | 159,200 | 7,374,144 |
| Digital Realty Trust, Inc. | | 45,700 | 6,876,022 |
| Douglas Emmett, Inc. | | 61,500 | 2,067,630 |
| Equinix, Inc. | | 3,900 | 3,130,140 |
| Equity Lifestyle Properties, Inc. | | 99,500 | 7,393,845 |
| Invitation Homes, Inc. | | 203,400 | 7,584,786 |
| Kilroy Realty Corp. | | 54,600 | 3,802,344 |
| Lexington Corporate Properties Trust | | 311,100 | 3,717,645 |
| Mid-America Apartment Communities, Inc. | | 56,500 | 9,515,730 |
| Prologis (REIT), Inc. | | 125,600 | 15,012,968 |
| SBA Communications Corp. Class A | | 14,700 | 4,684,890 |
| Ventas, Inc. | | 75,400 | 4,305,340 |
| VICI Properties, Inc. | | 41,700 | 1,293,534 |
| Welltower, Inc. | | 43,400 | 3,606,540 |
| Weyerhaeuser Co. | | 46,500 | 1,600,530 |
| | | | 106,657,366 |
| Real Estate Management & Development - 0.1% | | | |
| Cushman & Wakefield PLC (a) | | 427,100 | 7,461,437 |
| Jones Lang LaSalle, Inc. (a) | | 13,200 | 2,580,072 |
| | | | 10,041,509 |
|
| TOTAL REAL ESTATE | | | 116,698,875 |
|
| UTILITIES - 1.6% | | | |
| Electric Utilities - 1.1% | | | |
| American Electric Power Co., Inc. | | 12,100 | 1,023,539 |
| Edison International | | 141,100 | 8,158,402 |
| Entergy Corp. | | 38,678 | 3,856,197 |
| Evergy, Inc. | | 95,025 | 5,742,361 |
| Exelon Corp. | | 255,635 | 11,327,187 |
| FirstEnergy Corp. | | 193,500 | 7,200,135 |
| NextEra Energy, Inc. | | 278,404 | 20,401,445 |
| NRG Energy, Inc. | | 44,443 | 1,791,053 |
| PG&E Corp. (a) | | 620,619 | 6,311,695 |
| Southern Co. | | 203,800 | 12,331,938 |
| | | | 78,143,952 |
| Independent Power and Renewable Electricity Producers - 0.1% | | | |
| FTC Solar, Inc. (a) | | 96,100 | 1,279,091 |
| The AES Corp. | | 209,600 | 5,464,272 |
| | | | 6,743,363 |
| Multi-Utilities - 0.4% | | | |
| CenterPoint Energy, Inc. | | 232,583 | 5,702,935 |
| Dominion Energy, Inc. | | 119,478 | 8,789,996 |
| NiSource, Inc. | | 143,500 | 3,515,750 |
| Sempra Energy | | 73,498 | 9,737,015 |
| | | | 27,745,696 |
|
| TOTAL UTILITIES | | | 112,633,011 |
|
| TOTAL COMMON STOCKS | | | |
| (Cost $2,941,347,976) | | | 4,830,279,705 |
|
| Preferred Stocks - 0.3% | | | |
| Convertible Preferred Stocks - 0.1% | | | |
| INDUSTRIALS - 0.0% | | | |
| Aerospace & Defense - 0.0% | | | |
| ABL Space Systems Series B (d)(e) | | 17,763 | 799,967 |
| Construction & Engineering - 0.0% | | | |
| Beta Technologies, Inc. Series A (d)(e) | | 7,264 | 532,233 |
| TOTAL INDUSTRIALS | | | 1,332,200 |
| INFORMATION TECHNOLOGY - 0.1% | | | |
| Communications Equipment - 0.0% | | | |
| Astranis Space Technologies Corp. Series C (d)(e) | | 60,816 | 1,333,143 |
| Xsight Labs Ltd. Series D (d)(e) | | 65,770 | 525,897 |
| | | | 1,859,040 |
| IT Services - 0.0% | | | |
| ByteDance Ltd. Series E1 (d)(e) | | 21,701 | 2,576,560 |
| Software - 0.1% | | | |
| Databricks, Inc. Series G (d)(e) | | 1,487 | 263,746 |
| Stripe, Inc. Series H (d)(e) | | 6,600 | 264,825 |
| ThoughtWorks, Inc.: | | | |
| Series A (d)(e) | | 2,622 | 1,735,266 |
| Series B (d)(e) | | 1,242 | 821,968 |
| | | | 3,085,805 |
| TOTAL INFORMATION TECHNOLOGY | | | 7,521,405 |
|
| TOTAL CONVERTIBLE PREFERRED STOCKS | | | 8,853,605 |
|
| Nonconvertible Preferred Stocks - 0.2% | | | |
| CONSUMER DISCRETIONARY - 0.1% | | | |
| Automobiles - 0.1% | | | |
| Porsche Automobil Holding SE (Germany) | | 72,800 | 7,815,138 |
| INFORMATION TECHNOLOGY - 0.1% | | | |
| IT Services - 0.1% | | | |
| Gupshup, Inc. (d)(e)(f) | | 59,838 | 1,368,208 |
|
| TOTAL NONCONVERTIBLE PREFERRED STOCKS | | | 9,183,346 |
|
| TOTAL PREFERRED STOCKS | | | |
| (Cost $14,766,693) | | | 18,036,951 |
| | | Principal Amount | Value |
|
| U.S. Treasury Obligations - 0.1% | | | |
| U.S. Treasury Bills, yield at date of purchase 0.01% to 0.04% 7/8/21 to 9/30/21 (g) | | | |
| (Cost $6,169,800) | | 6,170,000 | 6,169,576 |
|
| Preferred Securities - 0.0% | | | |
| CONSUMER DISCRETIONARY - 0.0% | | | |
| Internet & Direct Marketing Retail - 0.0% | | | |
Circle Internet Financial Ltd. 0%
(Cost $1,104,800)(d)(e)(h) | | $1,104,800 | $1,104,800 |
| | | Shares | Value |
|
| Fixed-Income Funds - 27.0% | | | |
| Fidelity VIP Investment Grade Central Fund (i) | | | |
| (Cost $1,778,434,423) | | 16,665,214 | 1,849,672,144 |
|
| Money Market Funds - 2.5% | | | |
| Fidelity Cash Central Fund 0.06% (j) | | 149,911,522 | 149,941,504 |
| Fidelity Securities Lending Cash Central Fund 0.06% (j)(k) | | 23,287,396 | 23,289,725 |
| TOTAL MONEY MARKET FUNDS | | | |
| (Cost $173,230,721) | | | 173,231,229 |
| TOTAL INVESTMENT IN SECURITIES - 100.4% | | | |
| (Cost $4,915,054,413) | | | 6,878,494,405 |
| NET OTHER ASSETS (LIABILITIES) - (0.4)% | | | (26,934,786) |
| NET ASSETS - 100% | | | $6,851,559,619 |
| Futures Contracts | | | | | |
| | Number of contracts | Expiration Date | Notional Amount | Value | Unrealized Appreciation/(Depreciation) |
| Purchased | | | | | |
| Equity Index Contracts | | | | | |
| CME E-mini S&P 500 Index Contracts (United States) | 532 | Sept. 2021 | $114,076,760 | $1,128,065 | $1,128,065 |
The notional amount of futures purchased as a percentage of Net Assets is 1.7%
Legend
(a) Non-income producing
(b) Security or a portion of the security is on loan at period end.
(c) Security exempt from registration under Rule 144A of the Securities Act of 1933. These securities may be resold in transactions exempt from registration, normally to qualified institutional buyers. At the end of the period, the value of these securities amounted to $23,244,141 or 0.3% of net assets.
(d) Level 3 security
(e) Restricted securities (including private placements) - Investment in securities not registered under the Securities Act of 1933 (excluding 144A issues). At the end of the period, the value of restricted securities (excluding 144A issues) amounted to $19,024,781 or 0.3% of net assets.
(f) Security or a portion of the security purchased on a delayed delivery or when-issued basis.
(g) Security or a portion of the security was pledged to cover margin requirements for futures contracts. At period end, the value of securities pledged amounted to $6,169,576.
(h) Security is perpetual in nature with no stated maturity date.
(i) Affiliated fund that is generally available only to investment companies and other accounts managed by Fidelity Investments. A complete unaudited schedule of portfolio holdings for each Fidelity Central Fund is filed with the SEC for the first and third quarters of each fiscal year on Form N-PORT and is available upon request or at the SEC's website at www.sec.gov. An unaudited holdings listing for the Fund, which presents direct holdings as well as the pro-rata share of securities and other investments held indirectly through its investment in underlying non-money market Fidelity Central Funds, is available at fidelity.com and/or institutional.fidelity.com, as applicable. In addition, each Fidelity Central Fund's financial statements are available on the SEC's website or upon request.
(j) Affiliated fund that is generally available only to investment companies and other accounts managed by Fidelity Investments. The rate quoted is the annualized seven-day yield of the fund at period end. A complete unaudited listing of the fund's holdings as of its most recent quarter end is available upon request. In addition, each Fidelity Central Fund's financial statements are available on the SEC's website or upon request.
(k) Investment made with cash collateral received from securities on loan.
Additional information on each restricted holding is as follows:
| Security | Acquisition Date | Acquisition Cost |
| ABL Space Systems Series B | 3/24/21 | $799,967 |
| Ant International Co. Ltd. Class C | 5/16/18 | $3,487,731 |
| Astranis Space Technologies Corp. Series C | 3/19/21 | $1,333,143 |
| Beta Technologies, Inc. Series A | 4/9/21 | $532,233 |
| ByteDance Ltd. Series E1 | 11/18/20 | $2,377,869 |
| Circle Internet Financial Ltd. 0% | 5/11/21 | $1,104,800 |
| Databricks, Inc. Series G | 2/1/21 | $263,746 |
| Epic Games, Inc. | 3/29/21 | $1,603,620 |
| Gupshup, Inc. | 6/8/21 | $1,368,208 |
| Latch, Inc. | 1/24/21 | $779,000 |
| Proterra, Inc. | 1/11/21 | $1,146,000 |
| Space Exploration Technologies Corp. Class A | 2/16/21 | $713,983 |
| Stripe, Inc. Class B | 5/18/21 | $800,682 |
| Stripe, Inc. Series H | 3/15/21 | $264,825 |
| ThoughtWorks, Inc. Series A | 1/13/21 | $1,605,057 |
| ThoughtWorks, Inc. Series B | 6/25/21 | $821,968 |
| Xsight Labs Ltd. Series D | 2/16/21 | $525,897 |
Affiliated Central Funds
Information regarding fiscal year to date income earned by the Fund from investments in Fidelity Central Funds is as follows:
| Fund | Income earned |
| Fidelity Cash Central Fund | $36,326 |
| Fidelity High Income Central Fund | 91,843 |
| Fidelity Securities Lending Cash Central Fund | 22,009 |
| Fidelity VIP Investment Grade Central Fund | 48,517,634 |
| Total | $48,667,812 |
Amounts in the income column in the above table include any capital gain distributions from underlying funds, which are presented in the corresponding line-item in the Statement of Operations, if applicable. Amount for Fidelity Securities Lending Cash Central Fund represents the income earned on investing cash collateral, less rebates paid to borrowers and any lending agent fees associated with the loan, plus any premium payments received for lending certain types of securities.
Fiscal year to date information regarding the Fund's investments in Fidelity Central Funds, including the ownership percentage, is presented below.
| Fund | Value, beginning of period | Purchases | Sales Proceeds | Realized Gain/Loss | Change in Unrealized appreciation (depreciation) | Value, end of period | % ownership, end of period |
| Fidelity Cash Central Fund 0.06% | $111,643,553 | $541,642,587 | $503,344,099 | $(537) | $-- | $149,941,504 | 0.2% |
| Fidelity High Income Central Fund | 57,944,325 | -- | 58,067,211 | 9,408,236 | (9,285,350) | -- | 0.0% |
| Fidelity Securities Lending Cash Central Fund 0.06% | 10,070,364 | 89,705,381 | 76,486,020 | -- | -- | 23,289,725 | 0.1% |
| Fidelity VIP Investment Grade Central Fund | 1,724,676,019 | 183,678,640 | -- | -- | (58,682,515) | 1,849,672,144 | 24.5% |
| Total | $1,904,334,261 | $815,026,608 | $637,897,330 | $9,407,699 | $(67,967,865) | $2,022,903,373 | |
Investment Valuation
The following is a summary of the inputs used, as of June 30, 2021, involving the Fund's assets and liabilities carried at fair value. The inputs or methodology used for valuing securities may not be an indication of the risk associated with investing in those securities. For more information on valuation inputs, and their aggregation into the levels used below, please refer to the Investment Valuation section in the accompanying Notes to Financial Statements.
| | Valuation Inputs at Reporting Date: |
| Description | Total | Level 1 | Level 2 | Level 3 |
| Investments in Securities: | | | | |
| Equities: | | | | |
| Communication Services | $532,311,368 | $532,311,368 | $-- | $-- |
| Consumer Discretionary | 565,145,191 | 537,364,073 | 27,781,118 | -- |
| Consumer Staples | 293,765,497 | 293,765,497 | -- | -- |
| Energy | 177,982,989 | 177,982,989 | -- | -- |
| Financials | 576,593,159 | 556,340,093 | 17,089,391 | 3,163,675 |
| Health Care | 614,696,413 | 603,798,631 | 10,897,782 | -- |
| Industrials | 525,184,620 | 523,138,437 | -- | 2,046,183 |
| Information Technology | 1,199,795,530 | 1,188,501,683 | -- | 11,293,847 |
| Materials | 133,510,003 | 133,510,003 | -- | -- |
| Real Estate | 116,698,875 | 116,698,875 | -- | -- |
| Utilities | 112,633,011 | 112,633,011 | -- | -- |
| U.S. Government and Government Agency Obligations | 6,169,576 | -- | 6,169,576 | -- |
| Preferred Securities | 1,104,800 | -- | -- | 1,104,800 |
| Fixed-Income Funds | 1,849,672,144 | 1,849,672,144 | -- | -- |
| Money Market Funds | 173,231,229 | 173,231,229 | -- | -- |
| Total Investments in Securities: | $6,878,494,405 | $6,798,948,033 | $61,937,867 | $17,608,505 |
| Derivative Instruments: | | | | |
| Assets | | | | |
| Futures Contracts | $1,128,065 | $1,128,065 | $-- | $-- |
| Total Assets | $1,128,065 | $1,128,065 | $-- | $-- |
| Total Derivative Instruments: | $1,128,065 | $1,128,065 | $-- | $-- |
| Net unrealized depreciation on unfunded commitments | $(52,768) | $-- | $(52,768) | $-- |
Value of Derivative Instruments
The following table is a summary of the Fund's value of derivative instruments by primary risk exposure as of June 30, 2021. For additional information on derivative instruments, please refer to the Derivative Instruments section in the accompanying Notes to Financial Statements.
| Primary Risk Exposure / Derivative Type | Value |
| | Asset | Liability |
| Equity Risk | | |
| Futures Contracts(a) | $1,128,065 | $0 |
| Total Equity Risk | 1,128,065 | 0 |
| Total Value of Derivatives | $1,128,065 | $0 |
(a) Reflects gross cumulative appreciation (depreciation) on futures contracts as presented in the Schedule of Investments. In the Statement of Assets and Liabilities, the period end daily variation margin is included in receivable or payable for daily variation margin on futures contracts, and the net cumulative appreciation (depreciation) is included in Total accumulated earnings (loss).
Other Information
The composition of credit quality ratings as a percentage of Total Net Assets is as follows (Unaudited):
| U.S. Government and U.S. Government Agency Obligations | 13.3% |
| AAA,AA,A | 4.7% |
| BBB | 5.7% |
| BB | 1.5% |
| B | 0.0% |
| Not Rated | 0.4% |
| Equities | 70.8% |
| Short-Term Investments and Net Other Assets | 3.6% |
| | 100.0% |
We have used ratings from Moody's Investors Service, Inc. Where Moody's® ratings are not available, we have used S&P® ratings. All ratings are as of the date indicated and do not reflect subsequent changes.
See accompanying notes which are an integral part of the financial statements.
Financial Statements
Statement of Assets and Liabilities
| | | June 30, 2021 (Unaudited) |
| Assets | | |
Investment in securities, at value (including securities loaned of $22,620,807) — See accompanying schedule:
Unaffiliated issuers (cost $2,963,389,269) | $4,855,591,032 | |
| Fidelity Central Funds (cost $1,951,665,144) | 2,022,903,373 | |
| Total Investment in Securities (cost $4,915,054,413) | | $6,878,494,405 |
| Cash | | 150,456 |
| Receivable for investments sold | | 12,571,863 |
| Receivable for fund shares sold | | 1,957,149 |
| Unrealized appreciation on unfunded commitments | | 573,993 |
| Dividends receivable | | 2,591,500 |
| Distributions receivable from Fidelity Central Funds | | 5,489 |
| Receivable for daily variation margin on futures contracts | | 175,560 |
| Other receivables | | 92,758 |
| Total assets | | 6,896,613,173 |
| Liabilities | | |
| Payable to custodian | | |
| Payable for investments purchased | $108 | |
| Regular delivery | 14,990,356 | |
| Delayed delivery | 1,368,208 | |
| Payable for fund shares redeemed | 782,166 | |
| Unrealized depreciation on unfunded commitments | 626,761 | |
| Accrued management fee | 2,116,406 | |
| Distribution and service plan fees payable | 481,156 | |
| Other affiliated payables | 746,171 | |
| Other payables and accrued expenses | 652,497 | |
| Collateral on securities loaned | 23,289,725 | |
| Total liabilities | | 45,053,554 |
| Net Assets | | $6,851,559,619 |
| Net Assets consist of: | | |
| Paid in capital | | $4,578,806,451 |
| Total accumulated earnings (loss) | | 2,272,753,168 |
| Net Assets | | $6,851,559,619 |
| Net Asset Value and Maximum Offering Price | | |
| Initial Class: | | |
| Net Asset Value, offering price and redemption price per share ($291,014,212 ÷ 11,883,822 shares) | | $24.49 |
| Service Class: | | |
| Net Asset Value, offering price and redemption price per share ($38,923,439 ÷ 1,603,304 shares) | | $24.28 |
| Service Class 2: | | |
| Net Asset Value, offering price and redemption price per share ($2,333,476,780 ÷ 98,273,483 shares) | | $23.74 |
| Investor Class: | | |
| Net Asset Value, offering price and redemption price per share ($4,188,145,188 ÷ 172,766,707 shares) | | $24.24 |
See accompanying notes which are an integral part of the financial statements.
Statement of Operations
| | | Six months ended June 30, 2021 (Unaudited) |
| Investment Income | | |
| Dividends | | $25,471,889 |
| Interest | | 143 |
| Income from Fidelity Central Funds (including $22,009 from security lending) | | 18,556,903 |
| Total income | | 44,028,935 |
| Expenses | | |
| Management fee | $12,055,251 | |
| Transfer agent fees | 3,550,527 | |
| Distribution and service plan fees | 2,710,694 | |
| Accounting fees | 712,199 | |
| Custodian fees and expenses | 55,297 | |
| Independent trustees' fees and expenses | 10,515 | |
| Audit | 32,207 | |
| Legal | 9,336 | |
| Miscellaneous | 15,787 | |
| Total expenses before reductions | 19,151,813 | |
| Expense reductions | (195,249) | |
| Total expenses after reductions | | 18,956,564 |
| Net investment income (loss) | | 25,072,371 |
| Realized and Unrealized Gain (Loss) | | |
| Net realized gain (loss) on: | | |
| Investment securities: | | |
| Unaffiliated issuers (net of foreign taxes of $154,079) | 258,900,181 | |
| Fidelity Central Funds | 9,407,699 | |
| Foreign currency transactions | (43,667) | |
| Futures contracts | 12,394,835 | |
| Capital gain distributions from Fidelity Central Funds | 30,110,909 | |
| Total net realized gain (loss) | | 310,769,957 |
| Change in net unrealized appreciation (depreciation) on: | | |
| Investment securities: | | |
| Unaffiliated issuers (net of decrease in deferred foreign taxes of $30,066) | 406,268,346 | |
| Fidelity Central Funds | (67,967,865) | |
| Assets and liabilities in foreign currencies | (29,142) | |
| Futures contracts | (336,598) | |
| Unfunded commitments | (52,768) | |
| Total change in net unrealized appreciation (depreciation) | | 337,881,973 |
| Net gain (loss) | | 648,651,930 |
| Net increase (decrease) in net assets resulting from operations | | $673,724,301 |
See accompanying notes which are an integral part of the financial statements.
Statement of Changes in Net Assets
| | Six months ended June 30, 2021 (Unaudited) | Year ended December 31, 2020 |
| Increase (Decrease) in Net Assets | | |
| Operations | | |
| Net investment income (loss) | $25,072,371 | $67,205,569 |
| Net realized gain (loss) | 310,769,957 | 333,588,513 |
| Change in net unrealized appreciation (depreciation) | 337,881,973 | 669,132,914 |
| Net increase (decrease) in net assets resulting from operations | 673,724,301 | 1,069,926,996 |
| Distributions to shareholders | (342,421,135) | (140,729,871) |
| Share transactions - net increase (decrease) | 536,917,478 | 148,542,086 |
| Total increase (decrease) in net assets | 868,220,644 | 1,077,739,211 |
| Net Assets | | |
| Beginning of period | 5,983,338,975 | 4,905,599,764 |
| End of period | $6,851,559,619 | $5,983,338,975 |
See accompanying notes which are an integral part of the financial statements.
Financial Highlights
VIP Balanced Portfolio Initial Class
| | Six months ended (Unaudited) June 30, | Years endedDecember 31, | | | | |
| | 2021 | 2020 | 2019 | 2018 | 2017 | 2016 |
| Selected Per–Share Data | | | | | | |
| Net asset value, beginning of period | $23.29 | $19.55 | $16.78 | $18.76 | $16.77 | $16.27 |
| Income from Investment Operations | | | | | | |
| Net investment income (loss)A | .11 | .29 | .33 | .30 | .28 | .27 |
| Net realized and unrealized gain (loss) | 2.40 | 4.02 | 3.62 | (1.07) | 2.44 | .85 |
| Total from investment operations | 2.51 | 4.31 | 3.95 | (.77) | 2.72 | 1.12 |
| Distributions from net investment income | (.05) | (.30) | (.32) | (.27) | (.27) | (.22) |
| Distributions from net realized gain | (1.26) | (.28) | (.86) | (.94) | (.46) | (.40) |
| Total distributions | (1.31) | (.57)B | (1.18) | (1.21) | (.73) | (.62) |
| Net asset value, end of period | $24.49 | $23.29 | $19.55 | $16.78 | $18.76 | $16.77 |
| Total ReturnC,D,E | 11.20% | 22.39% | 24.51% | (4.22)% | 16.43% | 7.26% |
| Ratios to Average Net AssetsF,G | | | | | | |
| Expenses before reductions | .47%H | .48% | .49% | .49% | .50% | .51% |
| Expenses net of fee waivers, if any | .46%H | .48% | .49% | .49% | .50% | .51% |
| Expenses net of all reductions | .46%H | .47% | .48% | .49% | .50% | .51% |
| Net investment income (loss) | .91%H | 1.45% | 1.81% | 1.64% | 1.56% | 1.66% |
| Supplemental Data | | | | | | |
| Net assets, end of period (000 omitted) | $291,014 | $271,384 | $240,746 | $206,293 | $231,977 | $209,201 |
| Portfolio turnover rateI | 35%H | 62% | 41% | 55% | 45% | 43% |
A Calculated based on average shares outstanding during the period.
B Total distributions per share do not sum due to rounding.
C Total returns for periods of less than one year are not annualized.
D Total returns do not reflect charges attributable to your insurance company's separate account. Inclusion of these charges would reduce the total returns shown.
E Total returns would have been lower if certain expenses had not been reduced during the applicable periods shown.
F Fees and expenses of any underlying mutual funds or exchange-traded funds (ETFs) are not included in the Fund's expense ratio. The Fund indirectly bears its proportionate share of these expenses. For additional expense information related to investments in Fidelity Central Funds, please refer to the "Investments in Fidelity Central Funds" note found in the Notes to Financial Statements section of the most recent Annual or Semi-Annual report.
G Expense ratios reflect operating expenses of the class. Expenses before reductions do not reflect amounts reimbursed, waived, or reduced through arrangements with the investment adviser, brokerage services, or other offset arrangements, if applicable, and do not represent the amount paid by the class during periods when reimbursements, waivers or reductions occur.
H Annualized
I Amount does not include the portfolio activity of any underlying mutual funds or exchange-traded funds (ETFs).
See accompanying notes which are an integral part of the financial statements.
VIP Balanced Portfolio Service Class
| | Six months ended (Unaudited) June 30, | Years endedDecember 31, | | | | |
| | 2021 | 2020 | 2019 | 2018 | 2017 | 2016 |
| Selected Per–Share Data | | | | | | |
| Net asset value, beginning of period | $23.11 | $19.40 | $16.67 | $18.65 | $16.69 | $16.20 |
| Income from Investment Operations | | | | | | |
| Net investment income (loss)A | .09 | .27 | .31 | .28 | .26 | .25 |
| Net realized and unrealized gain (loss) | 2.39 | 4.00 | 3.58 | (1.05) | 2.41 | .85 |
| Total from investment operations | 2.48 | 4.27 | 3.89 | (.77) | 2.67 | 1.10 |
| Distributions from net investment income | (.05) | (.28) | (.30) | (.27) | (.26) | (.21) |
| Distributions from net realized gain | (1.26) | (.28) | (.86) | (.94) | (.46) | (.40) |
| Total distributions | (1.31) | (.56) | (1.16) | (1.21) | (.71)B | (.61) |
| Net asset value, end of period | $24.28 | $23.11 | $19.40 | $16.67 | $18.65 | $16.69 |
| Total ReturnC,D,E | 11.14% | 22.32% | 24.30% | (4.27)% | 16.25% | 7.16% |
| Ratios to Average Net AssetsF,G | | | | | | |
| Expenses before reductions | .56%H | .58% | .59% | .59% | .60% | .61% |
| Expenses net of fee waivers, if any | .56%H | .58% | .59% | .59% | .60% | .61% |
| Expenses net of all reductions | .56%H | .57% | .58% | .59% | .60% | .61% |
| Net investment income (loss) | .81%H | 1.35% | 1.71% | 1.53% | 1.46% | 1.56% |
| Supplemental Data | | | | | | |
| Net assets, end of period (000 omitted) | $38,923 | $30,072 | $19,258 | $16,616 | $7,933 | $4,865 |
| Portfolio turnover rateI | 35%H | 62% | 41% | 55% | 45% | 43% |
A Calculated based on average shares outstanding during the period.
B Total distributions per share do not sum due to rounding.
C Total returns for periods of less than one year are not annualized.
D Total returns do not reflect charges attributable to your insurance company's separate account. Inclusion of these charges would reduce the total returns shown.
E Total returns would have been lower if certain expenses had not been reduced during the applicable periods shown.
F Fees and expenses of any underlying mutual funds or exchange-traded funds (ETFs) are not included in the Fund's expense ratio. The Fund indirectly bears its proportionate share of these expenses. For additional expense information related to investments in Fidelity Central Funds, please refer to the "Investments in Fidelity Central Funds" note found in the Notes to Financial Statements section of the most recent Annual or Semi-Annual report.
G Expense ratios reflect operating expenses of the class. Expenses before reductions do not reflect amounts reimbursed, waived, or reduced through arrangements with the investment adviser, brokerage services, or other offset arrangements, if applicable, and do not represent the amount paid by the class during periods when reimbursements, waivers or reductions occur.
H Annualized
I Amount does not include the portfolio activity of any underlying mutual funds or exchange-traded funds (ETFs).
See accompanying notes which are an integral part of the financial statements.
VIP Balanced Portfolio Service Class 2
| | Six months ended (Unaudited) June 30, | Years endedDecember 31, | | | | |
| | 2021 | 2020 | 2019 | 2018 | 2017 | 2016 |
| Selected Per–Share Data | | | | | | |
| Net asset value, beginning of period | $22.64 | $19.02 | $16.37 | $18.33 | $16.41 | $15.95 |
| Income from Investment Operations | | | | | | |
| Net investment income (loss)A | .08 | .24 | .28 | .25 | .23 | .22 |
| Net realized and unrealized gain (loss) | 2.32 | 3.91 | 3.51 | (1.04) | 2.38 | .83 |
| Total from investment operations | 2.40 | 4.15 | 3.79 | (.79) | 2.61 | 1.05 |
| Distributions from net investment income | (.04) | (.25) | (.28) | (.23) | (.23) | (.19) |
| Distributions from net realized gain | (1.26) | (.28) | (.86) | (.94) | (.46) | (.40) |
| Total distributions | (1.30) | (.53) | (1.14) | (1.17) | (.69) | (.59) |
| Net asset value, end of period | $23.74 | $22.64 | $19.02 | $16.37 | $18.33 | $16.41 |
| Total ReturnB,C,D | 11.03% | 22.13% | 24.11% | (4.44)% | 16.12% | 6.98% |
| Ratios to Average Net AssetsE,F | | | | | | |
| Expenses before reductions | .71%G | .73% | .74% | .74% | .75% | .76% |
| Expenses net of fee waivers, if any | .71%G | .73% | .74% | .74% | .75% | .76% |
| Expenses net of all reductions | .71%G | .72% | .73% | .74% | .75% | .76% |
| Net investment income (loss) | .66%G | 1.20% | 1.56% | 1.39% | 1.31% | 1.41% |
| Supplemental Data | | | | | | |
| Net assets, end of period (000 omitted) | $2,333,477 | $1,985,175 | $1,492,773 | $1,045,617 | $979,052 | $687,973 |
| Portfolio turnover rateH | 35%G | 62% | 41% | 55% | 45% | 43% |
A Calculated based on average shares outstanding during the period.
B Total returns for periods of less than one year are not annualized.
C Total returns do not reflect charges attributable to your insurance company's separate account. Inclusion of these charges would reduce the total returns shown.
D Total returns would have been lower if certain expenses had not been reduced during the applicable periods shown.
E Fees and expenses of any underlying mutual funds or exchange-traded funds (ETFs) are not included in the Fund's expense ratio. The Fund indirectly bears its proportionate share of these expenses. For additional expense information related to investments in Fidelity Central Funds, please refer to the "Investments in Fidelity Central Funds" note found in the Notes to Financial Statements section of the most recent Annual or Semi-Annual report.
F Expense ratios reflect operating expenses of the class. Expenses before reductions do not reflect amounts reimbursed, waived, or reduced through arrangements with the investment adviser, brokerage services, or other offset arrangements, if applicable, and do not represent the amount paid by the class during periods when reimbursements, waivers or reductions occur.
G Annualized
H Amount does not include the portfolio activity of any underlying mutual funds or exchange-traded funds (ETFs).
See accompanying notes which are an integral part of the financial statements.
VIP Balanced Portfolio Investor Class
| | Six months ended (Unaudited) June 30, | Years endedDecember 31, | | | | |
| | 2021 | 2020 | 2019 | 2018 | 2017 | 2016 |
| Selected Per–Share Data | | | | | | |
| Net asset value, beginning of period | $23.08 | $19.37 | $16.64 | $18.61 | $16.65 | $16.16 |
| Income from Investment Operations | | | | | | |
| Net investment income (loss)A | .10 | .27 | .31 | .28 | .26 | .25 |
| Net realized and unrealized gain (loss) | 2.37 | 4.00 | 3.59 | (1.05) | 2.41 | .85 |
| Total from investment operations | 2.47 | 4.27 | 3.90 | (.77) | 2.67 | 1.10 |
| Distributions from net investment income | (.05) | (.28) | (.31) | (.26) | (.25) | (.21) |
| Distributions from net realized gain | (1.26) | (.28) | (.86) | (.94) | (.46) | (.40) |
| Total distributions | (1.31) | (.56) | (1.17) | (1.20) | (.71) | (.61) |
| Net asset value, end of period | $24.24 | $23.08 | $19.37 | $16.64 | $18.61 | $16.65 |
| Total ReturnB,C,D | 11.12% | 22.35% | 24.38% | (4.28)% | 16.28% | 7.18% |
| Ratios to Average Net AssetsE,F | | | | | | |
| Expenses before reductions | .54%G | .56% | .57% | .57% | .58% | .59% |
| Expenses net of fee waivers, if any | .54%G | .55% | .57% | .57% | .58% | .59% |
| Expenses net of all reductions | .54%G | .55% | .56% | .57% | .58% | .59% |
| Net investment income (loss) | .84%G | 1.37% | 1.73% | 1.56% | 1.48% | 1.58% |
| Supplemental Data | | | | | | |
| Net assets, end of period (000 omitted) | $4,188,145 | $3,696,708 | $3,152,822 | $2,599,494 | $2,750,265 | $2,350,058 |
| Portfolio turnover rateH | 35%G | 62% | 41% | 55% | 45% | 43% |
A Calculated based on average shares outstanding during the period.
B Total returns for periods of less than one year are not annualized.
C Total returns do not reflect charges attributable to your insurance company's separate account. Inclusion of these charges would reduce the total returns shown.
D Total returns would have been lower if certain expenses had not been reduced during the applicable periods shown.
E Fees and expenses of any underlying mutual funds or exchange-traded funds (ETFs) are not included in the Fund's expense ratio. The Fund indirectly bears its proportionate share of these expenses. For additional expense information related to investments in Fidelity Central Funds, please refer to the "Investments in Fidelity Central Funds" note found in the Notes to Financial Statements section of the most recent Annual or Semi-Annual report.
F Expense ratios reflect operating expenses of the class. Expenses before reductions do not reflect amounts reimbursed, waived, or reduced through arrangements with the investment adviser, brokerage services, or other offset arrangements, if applicable, and do not represent the amount paid by the class during periods when reimbursements, waivers or reductions occur.
G Annualized
H Amount does not include the portfolio activity of any underlying mutual funds or exchange-traded funds (ETFs).
See accompanying notes which are an integral part of the financial statements.
Notes to Financial Statements (Unaudited)
For the period ended June 30, 2021
1. Organization.
VIP Balanced Portfolio (the Fund) is a fund of Variable Insurance Products Fund III (the Trust) and is authorized to issue an unlimited number of shares. The Trust is registered under the Investment Company Act of 1940, as amended (the 1940 Act), as an open-end management investment company organized as a Massachusetts business trust. Shares of the Fund may only be purchased by insurance companies for the purpose of funding variable annuity or variable life insurance contracts. The Fund offers the following classes of shares: Initial Class shares, Service Class shares, Service Class 2 shares and Investor Class shares. All classes have equal rights and voting privileges, except for matters affecting a single class.
2. Investments in Fidelity Central Funds.
Funds may invest in Fidelity Central Funds, which are open-end investment companies generally available only to other investment companies and accounts managed by the investment adviser and its affiliates. The Schedule of Investments lists any Fidelity Central Funds held as an investment as of period end, but does not include the underlying holdings of each Fidelity Central Fund. An investing fund indirectly bears its proportionate share of the expenses of the underlying Fidelity Central Funds.
Based on its investment objective, each Fidelity Central Fund may invest or participate in various investment vehicles or strategies that are similar to those of the investing fund. These strategies are consistent with the investment objectives of the investing fund and may involve certain economic risks which may cause a decline in value of each of the Fidelity Central Funds and thus a decline in the value of the investing fund.
| Fidelity Central Fund | Investment Manager | Investment Objective | Investment Practices | Expense Ratio(a) |
| Fidelity VIP Investment Grade Central Fund | Fidelity Management & Research Company LLC (FMR) | Seeks a high level of current income by normally investing in investment-grade debt securities and repurchase agreements. | Delayed Delivery & When Issued Securities
Restricted Securities
| Less than .005% |
| Fidelity Money Market Central Funds | Fidelity Management & Research Company LLC (FMR) | Each fund seeks to obtain a high level of current income consistent with the preservation of capital and liquidity. | Short-term Investments | Less than .005% to .01% |
(a) Expenses expressed as a percentage of average net assets and are as of each underlying Central Fund's most recent annual or semi-annual shareholder report.
An unaudited holdings listing for the investing fund, which presents direct holdings as well as the pro-rata share of any securities and other investments held indirectly through its investment in underlying non-money market Fidelity Central Funds, is available at fidelity.com and/or institutional.fidelity.com, as applicable. A complete unaudited list of holdings for each Fidelity Central Fund is available upon request or at the Securities and Exchange Commission website at www.sec.gov. In addition, the financial statements of the Fidelity Central Funds which contain the significant accounting policies (including investment valuation policies) of those funds, and are not covered by the Report of Independent Registered Public Accounting Firm, are available on the Securities and Exchange Commission website or upon request.
3. Significant Accounting Policies.
The Fund is an investment company and applies the accounting and reporting guidance of the Financial Accounting Standards Board (FASB) Accounting Standards Codification Topic 946 Financial Services - Investment Companies. The financial statements have been prepared in conformity with accounting principles generally accepted in the United States of America (GAAP), which require management to make certain estimates and assumptions at the date of the financial statements. Actual results could differ from those estimates. Subsequent events, if any, through the date that the financial statements were issued have been evaluated in the preparation of the financial statements. The Fund's Schedule of Investments lists any underlying mutual funds or exchange-traded funds (ETFs) but does not include the underlying holdings of these funds. The following summarizes the significant accounting policies of the Fund:
Investment Valuation. Investments are valued as of 4:00 p.m. Eastern time on the last calendar day of the period. The Board of Trustees (the Board) has delegated the day to day responsibility for the valuation of the Fund's investments to the Fair Value Committee (the Committee) established by the Fund's investment adviser. In accordance with valuation policies and procedures approved by the Board, the Fund attempts to obtain prices from one or more third party pricing vendors or brokers to value its investments. When current market prices, quotations or currency exchange rates are not readily available or reliable, investments will be fair valued in good faith by the Committee, in accordance with procedures adopted by the Board. Factors used in determining fair value vary by investment type and may include market or investment specific events, changes in interest rates and credit quality. The frequency with which these procedures are used cannot be predicted and they may be utilized to a significant extent. The Committee oversees the Fund's valuation policies and procedures and reports to the Board on the Committee's activities and fair value determinations. The Board monitors the appropriateness of the procedures used in valuing the Fund's investments and ratifies the fair value determinations of the Committee.
The Fund categorizes the inputs to valuation techniques used to value its investments into a disclosure hierarchy consisting of three levels as shown below:
- Level 1 – quoted prices in active markets for identical investments
- Level 2 – other significant observable inputs (including quoted prices for similar investments, interest rates, prepayment speeds, etc.)
- Level 3 – unobservable inputs (including the Fund's own assumptions based on the best information available)
Valuation techniques used to value the Fund's investments by major category are as follows:
Equity securities, including restricted securities, for which market quotations are readily available, are valued at the last reported sale price or official closing price as reported by a third party pricing vendor on the primary market or exchange on which they are traded and are categorized as Level 1 in the hierarchy. In the event there were no sales during the day or closing prices are not available, securities are valued at the last quoted bid price or may be valued using the last available price and are generally categorized as Level 2 in the hierarchy. For foreign equity securities, when market or security specific events arise, comparisons to the valuation of American Depositary Receipts (ADRs), futures contracts, Exchange-Traded Funds (ETFs) and certain indexes as well as quoted prices for similar securities may be used and would be categorized as Level 2 in the hierarchy. For equity securities, including restricted securities, where observable inputs are limited, assumptions about market activity and risk are used and these securities may be categorized as Level 3 in the hierarchy.
Debt securities, including restricted securities, are valued based on evaluated prices received from third party pricing vendors or from brokers who make markets in such securities. U.S. government and government agency obligations are valued by pricing vendors who utilize matrix pricing which considers yield or price of bonds of comparable quality, coupon, maturity and type or by broker-supplied prices. When independent prices are unavailable or unreliable, debt securities may be valued utilizing pricing methodologies which consider similar factors that would be used by third party pricing vendors. Debt securities are generally categorized as Level 2 in the hierarchy but may be Level 3 depending on the circumstances.
Futures contracts are valued at the settlement price established each day by the board of trade or exchange on which they are traded and are categorized as Level 1 in the hierarchy. Investments in open-end mutual funds, including the Fidelity Central Funds, are valued at their closing net asset value (NAV) each business day and are categorized as Level 1 in the hierarchy.
Changes in valuation techniques may result in transfers in or out of an assigned level within the disclosure hierarchy. The aggregate value of investments by input level as of June 30, 2021 is included at the end of the Fund's Schedule of Investments.
Foreign Currency. Certain Funds may use foreign currency contracts to facilitate transactions in foreign-denominated securities. Gains and losses from these transactions may arise from changes in the value of the foreign currency or if the counterparties do not perform under the contracts' terms.
Foreign-denominated assets, including investment securities, and liabilities are translated into U.S. dollars at the exchange rates at period end. Purchases and sales of investment securities, income and dividends received, and expenses denominated in foreign currencies are translated into U.S. dollars at the exchange rate in effect on the transaction date.
The effects of exchange rate fluctuations on investments are included with the net realized and unrealized gain (loss) on investment securities. Other foreign currency transactions resulting in realized and unrealized gain (loss) are disclosed separately.
Investment Transactions and Income. For financial reporting purposes, the Fund's investment holdings and NAV include trades executed through the end of the last business day of the period. The NAV per share for processing shareholder transactions is calculated as of the close of business of the New York Stock Exchange (NYSE), normally 4:00 p.m. Eastern time and includes trades executed through the end of the prior business day. Gains and losses on securities sold are determined on the basis of identified cost and include proceeds received from litigation. Dividend income is recorded on the ex-dividend date, except for certain dividends from foreign securities where the ex-dividend date may have passed, which are recorded as soon as the Fund is informed of the ex-dividend date. Non-cash dividends included in dividend income, if any, are recorded at the fair market value of the securities received. Income and capital gain distributions from Fidelity Central Funds, if any, are recorded on the ex-dividend date. Certain distributions received by the Fund represent a return of capital or capital gain. The Fund determines the components of these distributions subsequent to the ex-dividend date, based upon receipt of tax filings or other correspondence relating to the underlying investment. These distributions are recorded as a reduction of cost of investments and/or as a realized gain. Interest income is accrued as earned and includes coupon interest and amortization of premium and accretion of discount on debt securities as applicable. Investment income is recorded net of foreign taxes withheld where recovery of such taxes is uncertain. Debt obligations may be placed on non-accrual status and related interest income may be reduced by ceasing current accruals and writing off interest receivables when the collection of all or a portion of interest has become doubtful based on consistently applied procedures. A debt obligation is removed from non-accrual status when the issuer resumes interest payments or when collectability of interest is reasonably assured.
Class Allocations and Expenses. Investment income, realized and unrealized capital gains and losses, common expenses of a fund, and certain fund-level expense reductions, if any, are allocated daily on a pro-rata basis to each class based on the relative net assets of each class to the total net assets of a fund. Each class differs with respect to transfer agent and distribution and service plan fees incurred, as applicable. Certain expense reductions may also differ by class, if applicable. For the reporting period, the allocated portion of income and expenses to each class as a percent of its average net assets may vary due to the timing of recording these transactions in relation to fluctuating net assets of the classes. Expenses directly attributable to a fund are charged to that fund. Expenses attributable to more than one fund are allocated among the respective funds on the basis of relative net assets or other appropriate methods. Expenses included in the accompanying financial statements reflect the expenses of that fund and do not include any expenses associated with any underlying mutual funds or exchange-traded funds. Although not included in a fund's expenses, a fund indirectly bears its proportionate share of these expenses through the net asset value of each underlying mutual fund or exchange-traded fund. Expense estimates are accrued in the period to which they relate and adjustments are made when actual amounts are known.
Income Tax Information and Distributions to Shareholders. Each year, the Fund intends to qualify as a regulated investment company under Subchapter M of the Internal Revenue Code, including distributing substantially all of its taxable income and realized gains. As a result, no provision for U.S. Federal income taxes is required. The Fund files a U.S. federal tax return, in addition to state and local tax returns as required. The Fund's federal income tax returns are subject to examination by the Internal Revenue Service (IRS) for a period of three fiscal years after they are filed. State and local tax returns may be subject to examination for an additional fiscal year depending on the jurisdiction. Foreign taxes are provided for based on the Fund's understanding of the tax rules and rates that exist in the foreign markets in which it invests. The Fund is subject to a tax imposed on capital gains by certain countries in which it invests. An estimated deferred tax liability for net unrealized appreciation on the applicable securities is included in Other payables and accrued expenses on the Statement of Assets & Liabilities.
Distributions are declared and recorded on the ex-dividend date. Income and capital gain distributions are declared separately for each class. Income and capital gain distributions are determined in accordance with income tax regulations, which may differ from GAAP.
Capital accounts within the financial statements are adjusted for permanent book-tax differences. These adjustments have no impact on net assets or the results of operations. Capital accounts are not adjusted for temporary book-tax differences which will reverse in a subsequent period.
Book-tax differences are primarily due to the short-term gain distributions from the Fidelity Central Funds, futures contracts, foreign currency transactions, certain foreign taxes, passive foreign investment companies (PFIC), partnerships, market discount and losses deferred due to wash sales.
As of period end, the cost and unrealized appreciation (depreciation) in securities, and derivatives if applicable, for federal income tax purposes were as follows:
| Gross unrealized appreciation | $2,011,122,677 |
| Gross unrealized depreciation | (53,950,497) |
| Net unrealized appreciation (depreciation) | $1,957,172,180 |
| Tax cost | $4,922,397,522 |
Delayed Delivery Transactions and When-Issued Securities. During the period, certain Funds transacted in securities on a delayed delivery or when-issued basis. Payment and delivery may take place after the customary settlement period for that security. The price of the underlying securities and the date when the securities will be delivered and paid for are fixed at the time the transaction is negotiated. Securities purchased on a delayed delivery or when-issued basis are identified as such in the Schedule of Investments. Compensation for interest forgone in the purchase of a delayed delivery or when-issued debt security may be received. With respect to purchase commitments, each applicable Fund identifies securities as segregated in its records with a value at least equal to the amount of the commitment. Payables and receivables associated with the purchases and sales of delayed delivery securities having the same coupon, settlement date and broker are offset. Delayed delivery or when-issued securities that have been purchased from and sold to different brokers are reflected as both payables and receivables in the Statement of Assets and Liabilities under the caption "Delayed delivery", as applicable. Losses may arise due to changes in the value of the underlying securities or if the counterparty does not perform under the contract's terms, or if the issuer does not issue the securities due to political, economic, or other factors.
Restricted Securities (including Private Placements). Funds may invest in securities that are subject to legal or contractual restrictions on resale. These securities generally may be resold in transactions exempt from registration or to the public if the securities are registered. Disposal of these securities may involve time-consuming negotiations and expense, and prompt sale at an acceptable price may be difficult. Information regarding restricted securities held at period end is included at the end of the Schedule of Investments, if applicable.
Special Purpose Acquisition Companies. Funds may invest in stock, warrants, and other securities of special purpose acquisition companies (SPACs) or similar special purpose entities. A SPAC is a publicly traded company that raises investment capital via an initial public offering (IPO) for the purpose of acquiring the equity securities of one or more existing companies via merger, business combination, acquisition or other similar transactions within a designated time frame.
Private Investment in Public Equity. Funds may acquire equity securities of an issuer through a private investment in a public equity (PIPE) transaction, including through commitments to purchase securities on a when-issued basis. A PIPE typically involves the purchase of securities directly from a publicly traded company in a private placement transaction. Securities purchased through PIPE transactions will be restricted from trading and considered illiquid until a resale registration statement for the shares is filed and declared effective.
At period end, the Fund had commitments to purchase when-issued securities through PIPE transactions with SPACs. The commitments are contingent upon the SPACs acquiring the securities of target companies. Unrealized appreciation (depreciation) on these commitments is separately presented in the Statements of Assets and Liabilities as Unrealized appreciation (depreciation) on unfunded commitments, and in the Statement of Operations as Change in unrealized appreciation (depreciation) on unfunded commitments.
4. Derivative Instruments.
Risk Exposures and the Use of Derivative Instruments. The Fund's investment objective allows the Fund to enter into various types of derivative contracts, including futures contracts. Derivatives are investments whose value is primarily derived from underlying assets, indices or reference rates and may be transacted on an exchange or over-the-counter (OTC). Derivatives may involve a future commitment to buy or sell a specified asset based on specified terms, to exchange future cash flows at periodic intervals based on a notional principal amount, or for one party to make one or more payments upon the occurrence of specified events in exchange for periodic payments from the other party.
The Fund used derivatives to increase returns and to manage exposure to certain risks as defined below. The success of any strategy involving derivatives depends on analysis of numerous economic factors, and if the strategies for investment do not work as intended, the Fund may not achieve its objectives.
The Fund's use of derivatives increased or decreased its exposure to the following risk:
| Equity Risk | Equity risk relates to the fluctuations in the value of financial instruments as a result of changes in market prices (other than those arising from interest rate risk or foreign exchange risk), whether caused by factors specific to an individual investment, its issuer, or all factors affecting all instruments traded in a market or market segment.
|
The Fund is also exposed to additional risks from investing in derivatives, such as liquidity risk and counterparty credit risk. Liquidity risk is the risk that the Fund will be unable to close out the derivative in the open market in a timely manner. Counterparty credit risk is the risk that the counterparty will not be able to fulfill its obligation to the Fund. Counterparty credit risk related to exchange-traded futures contracts may be mitigated by the protection provided by the exchange on which they trade.
Investing in derivatives may involve greater risks than investing in the underlying assets directly and, to varying degrees, may involve risk of loss in excess of any initial investment and collateral received and amounts recognized in the Statement of Assets and Liabilities. In addition, there may be the risk that the change in value of the derivative contract does not correspond to the change in value of the underlying instrument.
Futures Contracts. A futures contract is an agreement between two parties to buy or sell a specified underlying instrument for a fixed price at a specified future date. The Fund used futures contracts to manage its exposure to the stock market.
Upon entering into a futures contract, a fund is required to deposit either cash or securities (initial margin) with a clearing broker in an amount equal to a certain percentage of the face value of the contract. Futures contracts are marked-to-market daily and subsequent daily payments (variation margin) are made or received by a fund depending on the daily fluctuations in the value of the futures contracts and are recorded as unrealized appreciation or (depreciation). This receivable and/or payable, if any, is included in daily variation margin on futures contracts in the Statement of Assets and Liabilities. Realized gain or (loss) is recorded upon the expiration or closing of a futures contract. The net realized gain (loss) and change in net unrealized appreciation (depreciation) on futures contracts during the period is presented in the Statement of Operations.
Any open futures contracts at period end are presented in the Schedule of Investments under the caption "Futures Contracts". The notional amount at value reflects each contract's exposure to the underlying instrument or index at period end and is representative of volume of activity during the period. Securities deposited to meet initial margin requirements are identified in the Schedule of Investments.
5. Purchases and Sales of Investments.
Purchases and sales of securities, other than short-term securities and in-kind transactions, as applicable, are noted in the table below.
| | Purchases ($) | Sales ($) |
| VIP Balanced Portfolio | 1,317,822,474 | 1,093,871,378 |
6. Fees and Other Transactions with Affiliates.
Management Fee. Fidelity Management & Research Company LLC (the investment adviser) and its affiliates provide the Fund with investment management related services for which the Fund pays a monthly management fee. The management fee is the sum of an individual fund fee rate that is based on an annual rate of .15% of the Fund's average net assets and an annualized group fee rate that averaged .23% during the period. The group fee rate is based upon the monthly average net assets of a group of registered investment companies with which the investment adviser has management contracts. The group fee rate decreases as assets under management increase and increases as assets under management decrease. For the reporting period, the total annualized management fee rate was .38% of the Fund's average net assets.
Distribution and Service Plan Fees. In accordance with Rule 12b-1 of the 1940 Act, the Fund has adopted separate 12b-1 Plans for each Service Class of shares. Each Service Class pays Fidelity Distributors Company LLC (FDC), an affiliate of the investment adviser, a service fee. For the period, the service fee is based on an annual rate of .10% of Service Class' average net assets and .25% of Service Class 2's average net assets.
For the period, total fees, all of which were re-allowed to insurance companies for the distribution of shares and providing shareholder support services, were as follows:
| Service Class | $16,485 |
| Service Class 2 | 2,694,209 |
| | $2,710,694 |
Transfer Agent Fees. Fidelity Investments Institutional Operations Company LLC (FIIOC), an affiliate of the investment adviser, is the Fund's transfer, dividend disbursing, and shareholder servicing agent. FIIOC receives an asset-based fee with respect to each class. Each class pays a fee for transfer agent services, typesetting and printing and mailing of shareholder reports, excluding mailing of proxy statements. For the period, transfer agent fees for each class were as follows:
| | Amount | % of Class-Level Average Net Assets(a) |
| Initial Class | $88,184 | .06 |
| Service Class | 10,482 | .06 |
| Service Class 2 | 685,204 | .06 |
| Investor Class | 2,766,657 | .14 |
| | $3,550,527 | |
(a) Annualized
Accounting Fees. Fidelity Service Company, Inc. (FSC), an affiliate of the investment adviser, maintains the Fund's accounting records. The accounting fee is based on the level of average net assets for each month. For the period, the fees were equivalent to the following annualized rates:
| | % of Average Net Assets |
| VIP Balanced Portfolio | .02 |
Brokerage Commissions. A portion of portfolio transactions were placed with brokerage firms which are affiliates of the investment adviser. Brokerage commissions are included in net realized gain (loss) and change in net unrealized appreciation (depreciation) in the Statement of Operations. The commissions paid to these affiliated firms were as follows:
| | Amount |
| VIP Balanced Portfolio | $20,981 |
Interfund Trades. Funds may purchase from or sell securities to other Fidelity Funds under procedures adopted by the Board. The procedures have been designed to ensure these interfund trades are executed in accordance with Rule 17a-7 of the 1940 Act. Any interfund trades are included within the respective purchases and sales amounts shown in the Purchases and Sales of Investments note and are noted in the table below.
| | Purchases ($) | Sales ($) |
| VIP Balanced Portfolio | 92,023,508 | 55,117,014 |
7. Committed Line of Credit.
Certain Funds participate with other funds managed by the investment adviser or an affiliate in a $4.25 billion credit facility (the "line of credit") to be utilized for temporary or emergency purposes to fund shareholder redemptions or for other short-term liquidity purposes. The participating funds have agreed to pay commitment fees on their pro-rata portion of the line of credit, which are reflected in Miscellaneous expenses on the Statement of Operations, and are listed below. During the period, there were no borrowings on this line of credit.
| | Amount |
| VIP Balanced Portfolio | $5,939 |
8. Security Lending.
Funds lend portfolio securities from time to time in order to earn additional income. Lending agents are used, including National Financial Services (NFS), an affiliate of the investment adviser. Pursuant to a securities lending agreement, NFS will receive a fee, which is capped at 9.9% of a fund's daily lending revenue, for its services as lending agent. A fund may lend securities to certain qualified borrowers, including NFS. On the settlement date of the loan, a fund receives collateral (in the form of U.S. Treasury obligations, letters of credit and/or cash) against the loaned securities and maintains collateral in an amount not less than 100% of the market value of the loaned securities during the period of the loan. The market value of the loaned securities is determined at the close of business of a fund and any additional required collateral is delivered to a fund on the next business day. A fund or borrower may terminate the loan at any time, and if the borrower defaults on its obligation to return the securities loaned because of insolvency or other reasons, a fund may apply collateral received from the borrower against the obligation. A fund may experience delays and costs in recovering the securities loaned. Any cash collateral received is invested in the Fidelity Securities Lending Cash Central Fund. Any loaned securities are identified as such in the Schedule of Investments, and the value of loaned securities and cash collateral at period end, as applicable, are presented in the Statement of Assets and Liabilities. Security lending income represents the income earned on investing cash collateral, less rebates paid to borrowers and any lending agent fees associated with the loan, plus any premium payments received for lending certain types of securities. Security lending income is presented in the Statement of Operations as a component of income from Fidelity Central Funds. Affiliated security lending activity, if any, was as follows:
| | Total Security Lending Fees Paid to NFS | Security Lending Income From Securities Loaned to NFS | Value of Securities Loaned to NFS at Period End |
| VIP Balanced Portfolio | $2,416 | $– | $– |
9. Expense Reductions.
Commissions paid to certain brokers with whom the investment adviser, or its affiliates, places trades on behalf of the Fund include an amount in addition to trade execution, which may be rebated back to the Fund to offset expenses. This amount totaled $186,439 for the period.
In addition, during the period the investment adviser or an affiliate reimbursed and/or waived a portion of fund-level operating expenses in the amount of $8,810.
10. Distributions to Shareholders.
Distributions to shareholders of each class were as follows:
| | Six months ended
June 30, 2021 | Year ended
December 31, 2020 |
| VIP Balanced Portfolio | | |
| Distributions to shareholders | | |
| Initial Class | $15,224,779 | $6,811,268 |
| Service Class | 1,732,915 | 622,582 |
| Service Class 2 | 115,114,918 | 43,635,462 |
| Investor Class | 210,348,523 | 89,660,559 |
| Total | $342,421,135 | $140,729,871 |
11. Share Transactions.
Transactions for each class of shares were as follows and may contain in-kind transactions:
| | Shares | Shares | Dollars | Dollars |
| | Six months ended June 30, 2021 | Year ended December 31, 2020 | Six months ended June 30, 2021 | Year ended December 31, 2020 |
| VIP Balanced Portfolio | | | | |
| Initial Class | | | | |
| Shares sold | 666,639 | 1,469,953 | $15,681,150 | $29,756,335 |
| Reinvestment of distributions | 668,340 | 323,113 | 15,224,779 | 6,811,268 |
| Shares redeemed | (1,101,687) | (2,458,918) | (25,516,629) | (48,439,077) |
| Net increase (decrease) | 233,292 | (665,852) | $5,389,300 | $(11,871,474) |
| Service Class | | | | |
| Shares sold | 301,215 | 557,479 | $7,137,314 | $11,219,030 |
| Reinvestment of distributions | 76,678 | 29,571 | 1,732,915 | 622,582 |
| Shares redeemed | (75,732) | (278,360) | (1,746,292) | (5,401,738) |
| Net increase (decrease) | 302,161 | 308,690 | $7,123,937 | $6,439,874 |
| Service Class 2 | | | | |
| Shares sold | 9,381,922 | 17,807,960 | $214,065,803 | $341,896,250 |
| Reinvestment of distributions | 5,206,464 | 2,130,334 | 115,114,918 | 43,635,462 |
| Shares redeemed | (3,982,826) | (10,736,601) | (90,969,846) | (205,709,214) |
| Net increase (decrease) | 10,605,560 | 9,201,693 | $238,210,875 | $179,822,498 |
| Investor Class | | | | |
| Shares sold | 5,102,355 | 5,557,583 | $118,555,238 | $113,503,524 |
| Reinvestment of distributions | 9,323,959 | 4,297,716 | 210,348,523 | 89,660,559 |
| Shares redeemed | (1,839,773) | (12,427,422) | (42,710,395) | (229,012,895) |
| Net increase (decrease) | 12,586,541 | (2,572,123) | $286,193,366 | $(25,848,812) |
12. Other.
Fund's organizational documents provide former and current trustees and officers with a limited indemnification against liabilities arising in connection with the performance of their duties to the fund. In the normal course of business, the fund may also enter into contracts that provide general indemnifications. The fund's maximum exposure under these arrangements is unknown as this would be dependent on future claims that may be made against the fund. The risk of material loss from such claims is considered remote.
At the end of the period, the investment adviser or its affiliates were owners of record of more than 10% and certain otherwise unaffiliated shareholders were owners of record of more than 10% of the outstanding shares as follows:
| Fund | Affiliated % | Number of
Unaffiliated Shareholders | Unaffiliated Shareholders % |
| VIP: Balanced Portfolio | 64% | 1 | 17% |
13. Coronavirus (COVID-19) Pandemic.
An outbreak of COVID-19 first detected in China during December 2019 has since spread globally and was declared a pandemic by the World Health Organization during March 2020. Developments that disrupt global economies and financial markets, such as the COVID-19 pandemic, may magnify factors that affect the Fund's performance.
Shareholder Expense Example
As a shareholder, you incur two types of costs: (1) transaction costs, which may include sales charges (loads) on purchase payments or redemption proceeds, as applicable and (2) ongoing costs, which generally include management fees, distribution and/or service (12b-1) fees and other Fund expenses. This Example is intended to help you understand your ongoing costs (in dollars) of investing in a fund and to compare these costs with the ongoing costs of investing in other mutual funds.
The Example is based on an investment of $1,000 invested at the beginning of the period and held for the entire period (January 1, 2021 to June 30, 2021).
Actual Expenses
The first line of the accompanying table provides information about actual account values and actual expenses. You may use the information in this line, together with the amount you invested, to estimate the expenses that you paid over the period. Simply divide your account value by $1,000.00 (for example, an $8,600 account value divided by $1,000.00 = 8.6), then multiply the result by the number in the first line for a class/Fund under the heading entitled "Expenses Paid During Period" to estimate the expenses you paid on your account during this period. If any fund is a shareholder of any underlying mutual funds or exchange-traded funds (ETFs) (the Underlying Funds), such fund indirectly bears its proportional share of the expenses of the Underlying Funds in addition to the direct expenses incurred presented in the table. These fees and expenses are not included in the annualized expense ratio used to calculate the expense estimate in the table below. The estimate of expenses does not include any fees or other expenses of any variable annuity or variable life insurance product. If they were, the estimate of expenses you paid during the period would be higher, and your ending account value would be lower.
Hypothetical Example for Comparison Purposes
The second line of the accompanying table provides information about hypothetical account values and hypothetical expenses based on the actual expense ratio and an assumed rate of return of 5% per year before expenses, which is not the actual return. The hypothetical account values and expenses may not be used to estimate the actual ending account balance or expenses you paid for the period. You may use this information to compare the ongoing costs of investing in the Fund and other funds. To do so, compare this 5% hypothetical example with the 5% hypothetical examples that appear in the shareholder reports of the other funds. If any fund is a shareholder of any Underlying Funds, such fund indirectly bears its proportional share of the expenses of the Underlying Funds in addition to the direct expenses as presented in the table. These fees and expenses are not included in the annualized expense ratio used to calculate the expense estimate in the table below. The estimate of expenses does not include any fees or other expenses of any variable annuity or variable life insurance product. If they were, the estimate of expenses you paid during the period would be higher, and your ending account value would be lower.
Please note that the expenses shown in the table are meant to highlight your ongoing costs only and do not reflect any transaction costs. Therefore, the second line of the table is useful in comparing ongoing costs only, and will not help you determine the relative total costs of owning different funds.
| | Annualized Expense Ratio-A | Beginning
Account Value
January 1, 2021 | Ending
Account Value
June 30, 2021 | Expenses Paid
During Period-B
January 1, 2021
to June 30, 2021 |
| VIP Balanced Portfolio | | | | |
| Initial Class | .46% | | | |
| Actual | | $1,000.00 | $1,112.00 | $2.41 |
| Hypothetical-C | | $1,000.00 | $1,022.51 | $2.31 |
| Service Class | .56% | | | |
| Actual | | $1,000.00 | $1,111.40 | $2.93 |
| Hypothetical-C | | $1,000.00 | $1,022.02 | $2.81 |
| Service Class 2 | .71% | | | |
| Actual | | $1,000.00 | $1,110.30 | $3.71 |
| Hypothetical-C | | $1,000.00 | $1,021.27 | $3.56 |
| Investor Class | .54% | | | |
| Actual | | $1,000.00 | $1,111.20 | $2.83 |
| Hypothetical-C | | $1,000.00 | $1,022.12 | $2.71 |
A Annualized expense ratio reflects expenses net of applicable fee waivers.
B Expenses are equal to the annualized expense ratio, multiplied by the average account value over the period, multiplied by 181/ 365 (to reflect the one-half year period). The fees and expenses of any Underlying Funds are not included in each annualized expense ratio.
C 5% return per year before expenses
Board Approval of Investment Advisory Contracts and Management Fees
VIP Balanced Portfolio
Each year, the Board of Trustees, including the Independent Trustees (together, the Board), votes on the renewal of the management contract with Fidelity Management & Research Company LLC (FMR) and the sub-advisory agreements (together, the Advisory Contracts) for the fund. FMR and the sub-advisers are referred to herein as the Investment Advisers. The Board, assisted by the advice of fund counsel and Independent Trustees' counsel, requests and considers a broad range of information relevant to the renewal of the Advisory Contracts throughout the year.
The Board meets regularly and, at each of its meetings, covers an extensive agenda of topics and materials and considers factors that are relevant to its annual consideration of the renewal of the fund's Advisory Contracts, including the services and support provided to the fund and its shareholders. The Board has established various standing committees (Committees), each composed of and chaired by Independent Trustees with varying backgrounds, to which the Board has assigned specific subject matter responsibilities in order to enhance effective decision-making by the Board. The Board, acting directly and through its Committees, requests and receives information concerning the annual consideration of the renewal of the fund's Advisory Contracts. The Board also meets as needed to review matters specifically related to the Board's annual consideration of the renewal of the Advisory Contracts. Members of the Board may also meet with trustees of other Fidelity funds through joint ad hoc committees to discuss certain matters relevant to all of the Fidelity funds.
Approval of Stub Period Continuation. At its January 2021 meeting, the Board of Trustees voted to continue the fund's management contract with FMR, and the sub-advisory agreements and sub-subadvisory agreements, in each case, where applicable (together, the Advisory Contracts), without modification, for four months from February 1, 2021 through May 31, 2021, in connection with changes to the Board's meeting calendar. The Board considered that the approval of the fund's Advisory Contracts will not result in any changes in (i) the investment process or strategies employed in the management of the fund's assets; (ii) the fees and expenses paid by shareholders; (iii) the nature, extent or quality of services provided under the fund's Advisory Contracts; or (iv) the day-to-day management of the fund or the persons primarily responsible for such management. The Board also considered that since its last approval of the fund's Advisory Contracts, FMR had provided additional information on the fund in support of the annual contract renewal process, including competitive analyses on total expenses and management fees and in-depth reviews of fund performance and fund profitability information. The Board also considered the findings of certain ad hoc committees that had been previously formed to discuss matters relevant to all of the Fidelity funds, including economies of scale, fall-out benefits and retail vs. institutional funds. The Board concluded that the fund's Advisory Contracts are fair and reasonable, and that the fund's Advisory Contracts should be renewed, without modification, through May 31, 2021, with the understanding that the Board will consider the annual renewal for a full one year period in May 2021.
At its May 2021 meeting, the Board unanimously determined to renew the fund's Advisory Contracts. In reaching its determination, the Board considered all factors it believed relevant, including (i) the nature, extent, and quality of the services provided to the fund and its shareholders (including the investment performance of the fund); (ii) the competitiveness of the fund's management fee and total expense ratio relative to peer funds; (iii) the total costs of the services provided by and the profits realized by Fidelity from its relationships with the fund; and (iv) the extent to which, if any, economies of scale exist and are realized as the fund grows, and whether any economies of scale are appropriately shared with fund shareholders.
In considering whether to renew the Advisory Contracts for the fund, the Board reached a determination, with the assistance of fund counsel and Independent Trustees' counsel and through the exercise of its business judgment, that the renewal of the Advisory Contracts was in the best interests of the fund and its shareholders and that the compensation payable under the Advisory Contracts was fair and reasonable. The Board's decision to renew the Advisory Contracts was not based on any single factor, but rather was based on a comprehensive consideration of all the information provided to the Board at its meetings throughout the year. The Board, in reaching its determination to renew the Advisory Contracts, was aware that shareholders of the fund have a broad range of investment choices available to them, including a wide choice among funds offered by Fidelity's competitors, and that the fund's shareholders, who have the opportunity to review and weigh the disclosure provided by the fund in its prospectus and other public disclosures, have chosen to invest in this fund, which is part of the Fidelity family of funds.
Nature, Extent, and Quality of Services Provided. The Board considered Fidelity's staffing as it relates to the fund, including the backgrounds of investment personnel of Fidelity, and also considered the fund's investment objective, strategies, and related investment philosophy. The Independent Trustees also had discussions with senior management of Fidelity's investment operations and investment groups. The Board considered the structure of the investment personnel compensation program and whether this structure provides appropriate incentives to act in the best interests of the fund. Additionally, the Board considered the portfolio managers' investments, if any, in the funds that they manage.
Resources Dedicated to Investment Management and Support Services. The Board and the Fund Oversight and Research Committees reviewed the general qualifications and capabilities of Fidelity's investment staff, including its size, education, experience, and resources, as well as Fidelity's approach to recruiting, training, managing, and compensating investment personnel. The Board noted that Fidelity has continued to increase the resources devoted to non-U.S. offices, including expansion of Fidelity's global investment organization. The Board also noted that Fidelity's analysts have extensive resources, tools and capabilities that allow them to conduct sophisticated quantitative and fundamental analysis, as well as credit analysis of issuers, counterparties and guarantors. Further, the Board considered that Fidelity's investment professionals have sufficient access to global information and data so as to provide competitive investment results over time, and that those professionals also have access to sophisticated tools that permit them to assess portfolio construction and risk and performance attribution characteristics continuously, as well as to transmit new information and research conclusions rapidly around the world. Additionally, in its deliberations, the Board considered Fidelity's trading, risk management, compliance, and technology and operations capabilities and resources, which are integral parts of the investment management process. The Board also considered Fidelity's investments in business continuity planning, and its success in continuously providing services to the fund notwithstanding the severe disruptions caused by the COVID-19 pandemic.
Shareholder and Administrative Services. The Board considered (i) the nature, extent, quality, and cost of advisory, administrative, and shareholder services performed by the Investment Advisers and their affiliates under the Advisory Contracts and under separate agreements covering transfer agency, pricing and bookkeeping, and securities lending services for the fund; (ii) the nature and extent of the supervision of third party service providers, principally custodians, subcustodians, and pricing vendors; and (iii) the resources devoted to, and the record of compliance with, the fund's compliance policies and procedures. The Board also reviewed the allocation of fund brokerage, including allocations to brokers affiliated with the Investment Advisers, the use of brokerage commissions to pay fund expenses, and the use of "soft" commission dollars to pay for research services.
The Board noted that the growth of fund assets over time across the complex allows Fidelity to reinvest in the development of services designed to enhance the value and convenience of the Fidelity funds as investment vehicles. These services include 24-hour access to account information and market information over the Internet and through telephone representatives, investor education materials and asset allocation tools, and the expanded availability of Fidelity Investor Centers.
The Board noted that, in the past, it and the boards of certain other Fidelity funds had formed an ad hoc Committee on Transfer Agency Fees to review the variety of transfer agency fee structures throughout the industry and Fidelity's competitive positioning with respect to industry participants.
Investment in a Large Fund Family. The Board considered the benefits to shareholders of investing in a Fidelity fund, including the benefits of investing in a fund that is part of a large family of funds offering a variety of investment disciplines and providing a large variety of mutual fund investor services. The Board noted that Fidelity had taken, or had made recommendations that resulted in the Fidelity funds taking, a number of actions over the previous year that benefited particular funds, including: (i) continuing to dedicate additional resources to Fidelity's investment research process, which includes meetings with management of issuers of securities in which the funds invest, and to the support of the senior management team that oversees asset management; (ii) continuing efforts to enhance Fidelity's global research capabilities; (iii) launching new funds and ETFs with innovative structures, strategies and pricing and making other enhancements to meet client needs; (iv) launching new share classes of existing funds; (v) eliminating purchase minimums and broadening eligibility requirements for certain funds and share classes; (vi) approving the reduction in the holding period for the Class C to Class A conversion policy; (vii) reducing management fees and total expenses for certain target date funds and classes and index funds; (viii) lowering expenses for certain existing funds and classes by implementing or lowering expense caps; (ix) rationalizing product lines and gaining increased efficiencies from fund mergers, liquidations, and share class consolidations; (x) continuing to develop, acquire and implement systems and technology to improve services to the funds and shareholders, strengthen information security, and increase efficiency; and (xi) continuing to implement enhancements to further strengthen Fidelity's product line to increase investors' probability of success in achieving their investment goals, including retirement income goals.
Investment Performance. The Board considered whether the fund has operated in accordance with its investment objective, as well as its record of compliance with its investment restrictions and its performance history. The Board noted that there were portfolio management changes for the fund in August 2018, November 2018, March 2019, October 2019, November 2019, and January 2020. The Board will continue to monitor closely the fund's performance, taking into account the portfolio management changes.
The Board took into account discussions that occur at Board meetings throughout the year with representatives of the Investment Advisers about fund investment performance. In this regard the Board noted that as part of regularly scheduled fund reviews and other reports to the Board on fund performance, the Board considers annualized return information for the fund for different time periods, measured against an appropriate securities market index (benchmark index) and an appropriate peer group of funds with similar objectives (peer group). In its evaluation of fund investment performance, the Board gave particular attention to information indicating changes in performance of certain Fidelity funds for specific time periods and discussed with the Investment Advisers the reasons for any overperformance or underperformance.
In addition to reviewing absolute and relative fund performance, the Independent Trustees periodically consider the appropriateness of fund performance metrics in evaluating the results achieved. In general, the Independent Trustees believe that fund performance should be evaluated based on net performance (after fees and expenses) of both the highest performing and lowest performing fund share classes, where applicable, compared to appropriate benchmark indices, over appropriate time periods that may include full market cycles, and compared to peer groups, as applicable, over the same periods, taking into account relevant factors including the following: general market conditions; issuer-specific information; and fund cash flows and other factors.
The Independent Trustees recognize that shareholders evaluate performance on a net basis over their own holding periods, for which one-, three-, and five-year periods are often used as a proxy. For this reason, the performance information reviewed by the Board also included net cumulative total return information for the fund and an appropriate benchmark index and peer group for the most recent one-, three-, and five-year periods ended September 30, 2020, as shown below. Returns are shown compared to the 25th percentile (top of box, 75% beaten) and 75th percentile (bottom of box, 25% beaten) of the peer universe.
VIP Balanced Portfolio
Based on its review, the Board concluded that the nature, extent, and quality of services provided to the fund under the Advisory Contracts should continue to benefit the shareholders of the fund.
Competitiveness of Management Fee and Total Expense Ratio. The Board considered the fund's management fee and total expense ratio compared to "mapped groups" of competitive funds and classes created for the purpose of facilitating the Trustees' competitive analysis of management fees and total expenses. Fidelity creates "mapped groups" by combining similar Lipper investment objective categories that have comparable investment mandates. Combining Lipper investment objective categories aids the Board's management fee and total expense ratio comparisons by broadening the competitive group used for comparison.
Management Fee. The Board considered two proprietary management fee comparisons for the 12-month periods ended September 30 (June 30 for periods ended 2019 and 2018 and December 31 for periods prior to 2018) shown in basis points (BP) in the chart below. The group of Lipper funds used by the Board for management fee comparisons is referred to below as the "Total Mapped Group." The Total Mapped Group is broader than the Lipper peer group used by the Board for performance comparisons because the Total Mapped Group combines several Lipper investment objective categories while the Lipper peer group does not. The Total Mapped Group comparison focuses on a fund's standing in terms of gross management fees before expense reimbursements or caps relative to the total universe of funds with comparable investment mandates, regardless of whether their management fee structures also are comparable. Funds with comparable investment mandates offer exposure to similar types of securities. Funds with comparable management fee structures have similar management fee contractual arrangements (
e.g., flat rate charged for advisory services, all-inclusive fee rate,
etc.). "TMG %" represents the percentage of funds in the Total Mapped Group that had management fees that were lower than the fund's. For example, a hypothetical TMG % of 20% would mean that 80% of the funds in the Total Mapped Group had higher, and 20% had lower, management fees than the fund. The fund's actual TMG %s and the number of funds in the Total Mapped Group are in the chart below. The "Asset-Sized Peer Group" (ASPG) comparison focuses on a fund's standing relative to a subset of non-Fidelity funds within the Total Mapped Group that are similar in size and management fee structure. For example, if a fund is in the first quartile of the ASPG, the fund's management fee ranks in the least expensive or lowest 25% of funds in the ASPG. The ASPG represents at least 15% of the funds in the Total Mapped Group with comparable asset size and management fee structures, subject to a minimum of 50 funds (or all funds in the Total Mapped Group if fewer than 50). Additional information, such as the ASPG quartile in which the fund's management fee rate ranked, is also included in the chart and was considered by the Board.
VIP Balanced Portfolio
The Board noted that the fund's management fee rate ranked below the median of its Total Mapped Group and below the median of its ASPG for the 12-month period ended September 30, 2020.
The Board noted that, in the past, it and the boards of other Fidelity funds had formed an ad hoc Committee on Group Fee to conduct an in-depth review of the "group fee" component of the management fee of funds with such management fee structures. The Committee's focus included the mechanics of the group fee, the competitive landscape of group fee structures, Fidelity funds with no group fee component and investment products not included in group fee assets. The Board also considered that, for funds subject to the group fee, FMR agreed to voluntarily waive fees over a specified period of time in amounts designed to account for assets converted from certain funds to certain collective investment trusts.
The Board also noted that, in 2013, the ad hoc Committee on Management Fees was formed to conduct an in-depth review of the management fee rates of Fidelity's active equity mutual funds. The Committee focused on the following areas: (i) standard fee structures; (ii) research consumption and trading evolution; (iii) management fee competitiveness/profitability by category; and (iv) factors that drive institutional pricing.
Based on its review, the Board concluded that the fund's management fee is fair and reasonable in light of the services that the fund receives and the other factors considered.
Total Expense Ratio. In its review of each class's total expense ratio, the Board considered the fund's management fee rate as well as other fund or class expenses, as applicable, such as transfer agent fees, pricing and bookkeeping fees, fund-paid 12b-1 fees, and custodial, legal, and audit fees. The Board also noted that Fidelity may agree to waive fees or reimburse expenses from time to time, and the extent to which, if any, it has done so for the fund. As part of its review, the Board also considered the current and historical total expense ratios of a representative class of the fund compared to competitive fund median expenses. The fund's representative class is compared to those funds and classes in the Total Mapped Group (used by the Board for management fee comparisons) that have a similar sales load structure (SLTG). The Board also considered a total expense ASPG comparison for the representative class, which focuses on the total expenses of the representative class relative to a subset of non-Fidelity funds within the total expense SLTG. The total expense ASPG is limited to 15 larger and 15 smaller classes in fund average assets for a total of 30 classes, where possible. The total expense ASPG comparison excludes performance adjustments and fund-paid 12b-1 fees to eliminate variability in fee structures.
The Board noted that the total expense ratio of Initial Class ranked below the SLTG competitive median and below the ASPG competitive median for the 12-month period ended September 30, 2020.
Fees Charged to Other Fidelity Clients. The Board also considered Fidelity fee structures and other information with respect to clients of Fidelity, such as other funds advised or subadvised by Fidelity, pension plan clients, and other institutional clients with similar mandates. The Board noted that a joint ad hoc committee created by it and the boards of other Fidelity funds periodically reviews and compares Fidelity's institutional investment advisory business with its business of providing services to the Fidelity funds and also noted the most recent findings of the committee. The Board noted that the committee's review included a consideration of the differences in services provided, fees charged, and costs incurred, as well as competition in the markets serving the different categories of clients.
Based on its review of total expense ratios and fees charged to other Fidelity clients, the Board concluded that the total expense ratio of each class of the fund was reasonable in light of the services that the fund and its shareholders receive and the other factors considered.
Costs of the Services and Profitability. The Board considered the revenues earned and the expenses incurred by Fidelity in conducting the business of developing, marketing, distributing, managing, administering and servicing the fund and servicing the fund's shareholders. The Board also considered the level of Fidelity's profits in respect of all the Fidelity funds.
On an annual basis, Fidelity presents to the Board information about the profitability of its relationships with the fund. Fidelity calculates profitability information for each fund, as well as aggregate profitability information for groups of Fidelity funds and all Fidelity funds, using a series of detailed revenue and cost allocation methodologies which originate with the books and records of Fidelity on which Fidelity's audited financial statements are based. The Audit Committee of the Board reviews any significant changes from the prior year's methodologies and the full Board approves such changes.
A public accounting firm has been engaged annually by the Board as part of the Board's assessment of Fidelity's profitability analysis. The engagement includes the review and assessment of the methodologies used by Fidelity in determining the revenues and expenses attributable to Fidelity's mutual fund business, and completion of agreed-upon procedures in respect of the mathematical accuracy of certain fund profitability information and its conformity to established allocation methodologies. After considering the reports issued under the engagement and information provided by Fidelity, the Board concluded that while other allocation methods may also be reasonable, Fidelity's profitability methodologies are reasonable in all material respects.
The Board also reviewed Fidelity's non-fund businesses and potential indirect benefits such businesses may have received as a result of their association with Fidelity's mutual fund business (i.e., fall-out benefits) as well as cases where Fidelity's affiliates may benefit from the funds' business. The Board considered areas where potential indirect benefits to the Fidelity funds from their relationships with Fidelity may exist. The Board also considered that in 2019 a joint ad hoc committee created by it and the boards of other Fidelity funds evaluated potential fall-out benefits (PFOB Committee). The Board noted that it considered the PFOB Committee's findings in connection with its consideration of the renewal of the Advisory Contracts.
The Board considered the costs of the services provided by and the profits realized by Fidelity in connection with the operation of the fund, including the conclusions of the PFOB Committee, and was satisfied that the profitability was not excessive.
Economies of Scale. The Board considered whether there have been economies of scale in respect of the management of the Fidelity funds, whether the Fidelity funds (including the fund) have appropriately benefited from any such economies of scale, and whether there is potential for realization of any further economies of scale. The Board considered the extent to which the fund will benefit from economies of scale as assets grow through increased services to the fund, through waivers or reimbursements, or through fee or expense ratio reductions. The Board also noted that a committee (the Economies of Scale Committee) created by it and the boards of other Fidelity funds periodically analyzes whether Fidelity attains economies of scale in respect of the management and servicing of the Fidelity funds, whether the Fidelity funds have appropriately benefited from such economies of scale, and whether there is potential for realization of any further economies of scale.
The Board recognized that the fund's management contract incorporates a "group fee" structure, which provides for lower group fee rates as total "group assets" increase, and for higher group fee rates as total "group assets" decrease ("group assets" as defined in the management contract). FMR calculates the group fee rates based on a tiered asset "breakpoint" schedule that varies based on asset class. The Board considered that the group fee is designed to deliver the benefits of economies of scale to fund shareholders when total Fidelity fund assets increase, even if assets of any particular fund are unchanged or have declined, because some portion of Fidelity's costs are attributable to services provided to all Fidelity funds, and all funds benefit if those costs can be allocated among more assets. The Board further considered that Fidelity agreed to impose a temporary fee waiver in the form of additional breakpoints to the current breakpoint schedule. The Board concluded that, given the group fee structure, fund shareholders will benefit from lower management fees as "group assets" increase at the fund complex level, regardless of whether Fidelity achieves any such economies of scale.
The Board concluded, taking into account the analysis of the Economies of Scale Committee, that economies of scale, if any, are being appropriately shared between fund shareholders and Fidelity.
Additional Information Requested by the Board. In order to develop fully the factual basis for consideration of the Fidelity funds' advisory contracts, the Board requested and received additional information on certain topics, including: (i) fund flow and performance trends, in particular the underperformance of certain funds and strategies, and Fidelity's long-term strategies for certain funds; (ii) consideration of expanding the use of performance fees for additional funds; (iii) Fidelity's pricing philosophy compared to competitors; (iv) metrics for evaluating index fund and ETF performance and information about ETF trading characteristics; (v) the methodology with respect to evaluating competitive fund data and peer group classifications and fee and expense comparisons; (vi) the expense structures for different funds and classes and information about the differences between various expense structures; (vii) group fee breakpoints; (viii) information regarding other accounts managed by Fidelity and sub-advisory arrangements; and (ix) Fidelity's philosophies and strategies for evaluating funds and classes with lower or declining asset levels.
Based on its evaluation of all of the conclusions noted above, and after considering all factors it believed relevant, the Board concluded that the advisory fee arrangements are fair and reasonable, and that the fund's Advisory Contracts should be renewed.
Liquidity Risk Management Program
The Securities and Exchange Commission adopted Rule 22e-4 under the Investment Company Act of 1940 (the Liquidity Rule) to promote effective liquidity risk management throughout the open-end investment company industry, thereby reducing the risk that funds will be unable to meet their redemption obligations and mitigating dilution of the interests of fund shareholders.
The Fund has adopted and implemented a liquidity risk management program pursuant to the Liquidity Rule (the Program) effective December 1, 2018. The Program is reasonably designed to assess and manage the Fund’s liquidity risk and to comply with the requirements of the Liquidity Rule. The Fund’s Board of Trustees (the Board) has designated the Fund’s investment adviser as administrator of the Program. The Fidelity advisers have established a Liquidity Risk Management Committee (the LRM Committee) to manage the Program for each of the Fidelity Funds. The LRM Committee monitors the adequacy and effectiveness of implementation of the Program and on a periodic basis assesses each Fund’s liquidity risk based on a variety of factors including (1) the Fund’s investment strategy, (2) portfolio liquidity and cash flow projections during normal and reasonably foreseeable stressed conditions, (3) shareholder redemptions, (4) borrowings and other funding sources and (5) in the case of exchange-traded funds, certain additional factors including the effect of the Fund’s prices and spreads, market participants, and basket compositions on the overall liquidity of the Fund’s portfolio, as applicable.
In accordance with the Program, each of the Fund’s portfolio investments is classified into one of four liquidity categories described below based on a determination of a reasonable expectation for how long it would take to convert the investment to cash (or sell or dispose of the investment) without significantly changing its market value.
- Highly liquid investments – cash or convertible to cash within three business days or less
- Moderately liquid investments – convertible to cash in three to seven calendar days
- Less liquid investments – can be sold or disposed of, but not settled, within seven calendar days
- Illiquid investments – cannot be sold or disposed of within seven calendar days
Liquidity classification determinations take into account a variety of factors including various market, trading and investment-specific considerations, as well as market depth, and generally utilize analysis from a third-party liquidity metrics service.
The Liquidity Rule places a 15% limit on a fund’s illiquid investments and requires funds that do not primarily hold assets that are highly liquid investments to determine and maintain a minimum percentage of the fund’s net assets to be invested in highly liquid investments (highly liquid investment minimum or HLIM). The Program includes provisions reasonably designed to comply with the 15% limit on illiquid investments and for determining, periodically reviewing and complying with the HLIM requirement as applicable.
At a recent meeting of the Fund’s Board of Trustees, the LRM Committee provided a written report to the Board pertaining to the operation, adequacy, and effectiveness of implementation of the Program for the annual period from December 1, 2019 through November 30, 2020. The report concluded that the Program has been implemented and is operating effectively and is reasonably designed to assess and manage the Fund’s liquidity risk.
VIPBAL-SANN-0821
1.705697.123
Fidelity® Variable Insurance Products:
Growth Opportunities Portfolio
Semi-Annual Report
June 30, 2021
Contents
To view a fund's proxy voting guidelines and proxy voting record for the 12-month period ended June 30, visit http://www.fidelity.com/proxyvotingresults or visit the Securities and Exchange Commission's (SEC) web site at http://www.sec.gov.
You may also call 1-877-208-0098 to request a free copy of the proxy voting guidelines.
Fidelity® Variable Insurance Products are separate account options which are purchased through a variable insurance contract.
Standard & Poor's, S&P and S&P 500 are registered service marks of The McGraw-Hill Companies, Inc. and have been licensed for use by Fidelity Distributors Corporation.
Other third-party marks appearing herein are the property of their respective owners.
All other marks appearing herein are registered or unregistered trademarks or service marks of FMR LLC or an affiliated company. © 2021 FMR LLC. All rights reserved.
This report and the financial statements contained herein are submitted for the general information of the shareholders of the Fund. This report is not authorized for distribution to prospective investors in the Fund unless preceded or accompanied by an effective prospectus.
A fund files its complete schedule of portfolio holdings with the SEC for the first and third quarters of each fiscal year on Form N-PORT. Forms N-PORT are available on the SEC’s web site at http://www.sec.gov. A fund's Forms N-PORT may be reviewed and copied at the SEC’s Public Reference Room in Washington, DC. Information regarding the operation of the SEC's Public Reference Room may be obtained by calling 1-800-SEC-0330.
For a complete list of a fund's portfolio holdings, view the most recent holdings listing, semiannual report, or annual report on Fidelity's web site at http://www.fidelity.com, http://www.institutional.fidelity.com, or http://www.401k.com, as applicable.
NOT FDIC INSURED •MAY LOSE VALUE •NO BANK GUARANTEE
Neither the Fund nor Fidelity Distributors Corporation is a bank.
Note to Shareholders:
Early in 2020, the outbreak and spread of a new coronavirus emerged as a public health emergency that had a major influence on financial markets, primarily based on its impact on the global economy and the outlook for corporate earnings. The virus causes a respiratory disease known as COVID-19. On March 11, 2020 the World Health Organization declared the COVID-19 outbreak a pandemic, citing sustained risk of further global spread.
In the weeks following, as the crisis worsened, we witnessed an escalating human tragedy with wide-scale social and economic consequences from coronavirus-containment measures. The outbreak of COVID-19 prompted a number of measures to limit the spread, including travel and border restrictions, quarantines, and restrictions on large gatherings. In turn, these resulted in lower consumer activity, diminished demand for a wide range of products and services, disruption in manufacturing and supply chains, and – given the wide variability in outcomes regarding the outbreak – significant market uncertainty and volatility. Amid the turmoil, global governments and central banks took unprecedented action to help support consumers, businesses, and the broader economies, and to limit disruption to financial systems.
The situation continues to unfold, and the extent and duration of its impact on financial markets and the economy remain highly uncertain. Extreme events such as the coronavirus crisis are “exogenous shocks” that can have significant adverse effects on mutual funds and their investments. Although multiple asset classes may be affected by market disruption, the duration and impact may not be the same for all types of assets.
Fidelity is committed to helping you stay informed amid news about COVID-19 and during increased market volatility, and we’re taking extra steps to be responsive to customer needs. We encourage you to visit our websites, where we offer ongoing updates, commentary, and analysis on the markets and our funds.
Investment Summary (Unaudited)
Top Ten Stocks as of June 30, 2021
| | % of fund's net assets |
| Microsoft Corp. | 6.8 |
| Alphabet, Inc. Class C | 4.9 |
| Amazon.com, Inc. | 4.6 |
| Apple, Inc. | 3.8 |
| Facebook, Inc. Class A | 3.7 |
| NVIDIA Corp. | 2.4 |
| Sea Ltd. ADR | 2.1 |
| Alphabet, Inc. Class A | 2.0 |
| Salesforce.com, Inc. | 1.8 |
| T-Mobile U.S., Inc. | 1.7 |
| | 33.8 |
Top Five Market Sectors as of June 30, 2021
| | % of fund's net assets |
| Information Technology | 37.6 |
| Communication Services | 20.8 |
| Consumer Discretionary | 14.9 |
| Health Care | 14.4 |
| Industrials | 3.7 |
Asset Allocation (% of fund's net assets)
| As of June 30, 2021* |
| | Stocks | 100.1% |
| | Other Investments | 0.1% |
| | Short-Term Investments and Net Other Assets (Liabilities)** | (0.2)% |

* Foreign investments - 14.1%
** Short-Term Investments and Net Other Assets (Liabilities) are not included in the pie chart
Schedule of Investments June 30, 2021 (Unaudited)
Showing Percentage of Net Assets
| Common Stocks - 97.3% | | | |
| | | Shares | Value |
| COMMUNICATION SERVICES - 20.8% | | | |
| Entertainment - 5.4% | | | |
| Netflix, Inc. (a) | | 91,200 | $48,172,752 |
| Roku, Inc. Class A (a) | | 121,324 | 55,718,047 |
| Sea Ltd. ADR (a) | | 256,688 | 70,486,525 |
| Spotify Technology SA (a) | | 5,600 | 1,543,304 |
| The Walt Disney Co. (a) | | 35,651 | 6,266,376 |
| | | | 182,187,004 |
| Interactive Media & Services - 12.3% | | | |
| Alphabet, Inc.: | | | |
| Class A (a) | | 28,176 | 68,799,875 |
| Class C (a) | | 66,223 | 165,976,029 |
| Facebook, Inc. Class A (a) | | 363,379 | 126,350,512 |
| LegalZoom.com, Inc. | | 12,100 | 457,985 |
| Match Group, Inc. (a) | | 34,174 | 5,510,558 |
| MediaAlpha, Inc. Class A | | 42,300 | 1,780,830 |
| Snap, Inc. Class A (a) | | 358,200 | 24,407,748 |
| Vimeo, Inc. (a) | | 25,162 | 1,232,938 |
| Zoominfo Technologies, Inc. | | 492,000 | 25,667,640 |
| | | | 420,184,115 |
| Media - 1.4% | | | |
| Comcast Corp. Class A | | 259,890 | 14,818,928 |
| Magnite, Inc. (a)(b) | | 726,850 | 24,596,604 |
| TechTarget, Inc. (a) | | 111,328 | 8,626,807 |
| | | | 48,042,339 |
| Wireless Telecommunication Services - 1.7% | | | |
| T-Mobile U.S., Inc. | | 392,088 | 56,786,105 |
|
| TOTAL COMMUNICATION SERVICES | | | 707,199,563 |
|
| CONSUMER DISCRETIONARY - 14.1% | | | |
| Automobiles - 1.6% | | | |
| Arrival SA (c) | | 240,957 | 3,775,796 |
| Lordstown Motors Corp. (c) | | 130,761 | 1,373,906 |
| Neutron Holdings, Inc. (a)(c)(d) | | 106,587 | 1,460 |
| Rad Power Bikes, Inc. (c)(d) | | 56,834 | 274,158 |
| Tesla, Inc. (a) | | 73,725 | 50,110,883 |
| | | | 55,536,203 |
| Diversified Consumer Services - 0.2% | | | |
| Arco Platform Ltd. Class A (a) | | 116,277 | 3,565,053 |
| FSN E-Commerce Ventures Pvt Ltd. (c)(d) | | 12,079 | 1,748,828 |
| | | | 5,313,881 |
| Hotels, Restaurants & Leisure - 0.3% | | | |
| Airbnb, Inc. Class A | | 64,000 | 9,800,960 |
| Penn National Gaming, Inc. (a) | | 13,400 | 1,024,966 |
| Rush Street Interactive, Inc. (c) | | 60,600 | 742,956 |
| | | | 11,568,882 |
| Household Durables - 0.5% | | | |
| Lovesac (a) | | 18,000 | 1,436,220 |
| Purple Innovation, Inc. (a) | | 640,000 | 16,902,400 |
| | | | 18,338,620 |
| Internet & Direct Marketing Retail - 8.1% | | | |
| Alibaba Group Holding Ltd. sponsored ADR (a) | | 126,092 | 28,595,144 |
| Amazon.com, Inc. (a) | | 45,728 | 157,311,636 |
| Doordash, Inc. (b) | | 34,900 | 6,223,717 |
| Farfetch Ltd. Class A (a) | | 47,500 | 2,392,100 |
| Global-e Online Ltd. (a) | | 182,033 | 10,390,444 |
| Marqeta, Inc. Class A | | 13,700 | 384,559 |
| Meituan Class B (a)(e) | | 286,900 | 11,839,156 |
| Pinduoduo, Inc. ADR (a) | | 282,403 | 35,870,829 |
| Porch Group, Inc. Class A (a) | | 194,900 | 3,769,366 |
| thredUP, Inc. (a) | | 6,100 | 177,388 |
| Wayfair LLC Class A (a) | | 60,718 | 19,169,280 |
| Zomato Ltd. (c) | | 1,567,800 | 1,272,329 |
| | | | 277,395,948 |
| Leisure Products - 0.4% | | | |
| Beachbody Co. Group LLC (c)(f) | | 119,354 | 1,117,153 |
| Peloton Interactive, Inc. Class A (a) | | 109,500 | 13,580,190 |
| | | | 14,697,343 |
| Specialty Retail - 2.4% | | | |
| Academy Sports & Outdoors, Inc. | | 31,400 | 1,294,936 |
| American Eagle Outfitters, Inc. | | 30,363 | 1,139,523 |
| Auto1 Group SE (e) | | 356,000 | 15,639,805 |
| Carvana Co. Class A (a)(b) | | 187,870 | 56,702,923 |
| Cazoo Holdings Ltd. (c) | | 19,630 | 602,762 |
| Shift Technologies, Inc. Class A (a)(b) | | 540,700 | 4,639,206 |
| | | | 80,019,155 |
| Textiles, Apparel & Luxury Goods - 0.6% | | | |
| Allbirds, Inc. (a)(c)(d) | | 6,630 | 71,670 |
| Bombas LLC (c)(d) | | 677,445 | 2,993,955 |
| Capri Holdings Ltd. (a) | | 40,000 | 2,287,600 |
| Deckers Outdoor Corp. (a) | | 2,400 | 921,768 |
| Figs, Inc. Class A (a) | | 5,100 | 255,510 |
| lululemon athletica, Inc. (a) | | 26,272 | 9,588,492 |
| Paymentus Holdings, Inc. (a) | | 5,900 | 209,450 |
| Tapestry, Inc. (a) | | 92,000 | 4,000,160 |
| | | | 20,328,605 |
|
| TOTAL CONSUMER DISCRETIONARY | | | 483,198,637 |
|
| CONSUMER STAPLES - 1.4% | | | |
| Food & Staples Retailing - 0.9% | | | |
| BJ's Wholesale Club Holdings, Inc. (a) | | 218,400 | 10,391,472 |
| Blink Health, Inc. Series A1 (c)(d) | | 8,327 | 317,925 |
| Costco Wholesale Corp. | | 46,900 | 18,556,923 |
| Oatly Group AB ADR (a) | | 35,400 | 865,884 |
| Sweetgreen, Inc. warrants 1/21/26 (a)(c)(d) | | 56,101 | 221,599 |
| | | | 30,353,803 |
| Food Products - 0.5% | | | |
| AppHarvest, Inc. (c) | | 608,885 | 9,742,160 |
| AppHarvest, Inc. (a)(b) | | 249,800 | 3,996,800 |
| Beyond Meat, Inc. (a)(b) | | 13,811 | 2,175,094 |
| | | | 15,914,054 |
| Tobacco - 0.0% | | | |
| JUUL Labs, Inc. Class B (a)(c)(d) | | 560 | 34,272 |
|
| TOTAL CONSUMER STAPLES | | | 46,302,129 |
|
| ENERGY - 1.1% | | | |
| Oil, Gas & Consumable Fuels - 1.1% | | | |
| Reliance Industries Ltd. | | 1,276,535 | 36,231,004 |
| Reliance Industries Ltd. | | 77,762 | 1,554,874 |
| | | | 37,785,878 |
| FINANCIALS - 2.5% | | | |
| Banks - 0.7% | | | |
| Starling Bank Ltd. Series D (a)(d) | | 1,013,900 | 1,815,362 |
| Wells Fargo & Co. | | 488,600 | 22,128,694 |
| | | | 23,944,056 |
| Capital Markets - 0.2% | | | |
| Coinbase Global, Inc. (a) | | 2,700 | 683,910 |
| XP, Inc. Class A (a) | | 116,200 | 5,060,510 |
| | | | 5,744,420 |
| Consumer Finance - 0.8% | | | |
| Capital One Financial Corp. | | 56,800 | 8,786,392 |
| LendingTree, Inc. (a)(b) | | 82,123 | 17,400,221 |
| | | | 26,186,613 |
| Diversified Financial Services - 0.6% | | | |
| CareMax, Inc. (c) | | 100,000 | 1,161,000 |
| CareMax, Inc. Class A (a)(b) | | 252,706 | 3,259,907 |
| Flywire Corp. (a) | | 73,927 | 2,716,078 |
| Latch, Inc. (c) | | 55,500 | 646,936 |
| Latch, Inc. (a)(b) | | 191,000 | 2,343,570 |
| Payoneer, Inc. (c)(f) | | 65,400 | 610,378 |
| Proterra, Inc. (c) | | 81,000 | 1,316,615 |
| The Original BARK Co. (c) | | 596,891 | 6,282,875 |
| The Original BARK Co. Class A (a)(b) | | 72,830 | 806,956 |
| View, Inc. (c) | | 179,413 | 1,445,351 |
| | | | 20,589,666 |
| Insurance - 0.2% | | | |
| Goosehead Insurance | | 22,200 | 2,826,060 |
| Palomar Holdings, Inc. (a)(b) | | 48,400 | 3,652,264 |
| Trupanion, Inc. (a)(b) | | 21,700 | 2,497,670 |
| | | | 8,975,994 |
|
| TOTAL FINANCIALS | | | 85,440,749 |
|
| HEALTH CARE - 14.4% | | | |
| Biotechnology - 5.4% | | | |
| AbbVie, Inc. | | 90,500 | 10,193,920 |
| ADC Therapeutics SA (a) | | 37,288 | 907,963 |
| Agios Pharmaceuticals, Inc. (a) | | 138,500 | 7,632,735 |
| Alnylam Pharmaceuticals, Inc. (a) | | 84,451 | 14,316,134 |
| Applied Therapeutics, Inc. (a) | | 57,437 | 1,193,541 |
| Arcutis Biotherapeutics, Inc. (a) | | 40,700 | 1,110,703 |
| Argenx SE ADR (a) | | 21,131 | 6,361,910 |
| Ascendis Pharma A/S sponsored ADR (a) | | 16,125 | 2,121,244 |
| Aurinia Pharmaceuticals, Inc. (a)(b) | | 205,200 | 2,659,392 |
| Crinetics Pharmaceuticals, Inc. (a) | | 75,786 | 1,428,566 |
| Cullinan Oncology, Inc. | | 12,200 | 314,150 |
| Cytokinetics, Inc. (a) | | 131,600 | 2,604,364 |
| Exelixis, Inc. (a) | | 157,900 | 2,876,938 |
| Forma Therapeutics Holdings, Inc. | | 71,800 | 1,787,102 |
| Fusion Pharmaceuticals, Inc. (a) | | 22,300 | 180,184 |
| Generation Bio Co. | | 19,705 | 530,065 |
| Gritstone Bio, Inc. (a)(b) | | 149,524 | 1,365,154 |
| Instil Bio, Inc. (a) | | 132,900 | 2,567,628 |
| Keros Therapeutics, Inc. (a) | | 39,700 | 1,686,059 |
| Kura Oncology, Inc. (a) | | 50,300 | 1,048,755 |
| Mirati Therapeutics, Inc. (a) | | 26,600 | 4,296,698 |
| Moderna, Inc. (a) | | 31,000 | 7,284,380 |
| Monte Rosa Therapeutics, Inc. | | 22,000 | 499,400 |
| Morphic Holding, Inc. (a) | | 38,600 | 2,215,254 |
| Neurocrine Biosciences, Inc. (a) | | 185,922 | 18,093,929 |
| Novavax, Inc. (a)(b) | | 99,100 | 21,039,921 |
| ORIC Pharmaceuticals, Inc. (a) | | 12,700 | 224,663 |
| Passage Bio, Inc. (a) | | 43,581 | 577,012 |
| Poseida Therapeutics, Inc. (a) | | 9,300 | 93,186 |
| Prelude Therapeutics, Inc. | | 52,200 | 1,494,486 |
| Protagonist Therapeutics, Inc. (a) | | 86,866 | 3,898,546 |
| PTC Therapeutics, Inc. (a) | | 9,000 | 380,430 |
| Regeneron Pharmaceuticals, Inc. (a) | | 64,782 | 36,183,338 |
| Relay Therapeutics, Inc. (a) | | 79,300 | 2,901,587 |
| Repare Therapeutics, Inc. | | 3,400 | 106,012 |
| Revolution Medicines, Inc. (a) | | 70,593 | 2,240,622 |
| Sage Therapeutics, Inc. (a) | | 800 | 45,448 |
| Sarepta Therapeutics, Inc. (a) | | 84,913 | 6,601,137 |
| TG Therapeutics, Inc. (a) | | 67,900 | 2,633,841 |
| Translate Bio, Inc. (a) | | 115,900 | 3,191,886 |
| Vaxcyte, Inc. | | 69,704 | 1,569,037 |
| Zentalis Pharmaceuticals, Inc. (a) | | 77,300 | 4,112,360 |
| Zymeworks, Inc. (a) | | 13,900 | 482,191 |
| | | | 183,051,871 |
| Health Care Equipment & Supplies - 3.0% | | | |
| Boston Scientific Corp. (a) | | 618,492 | 26,446,718 |
| Danaher Corp. | | 43,200 | 11,593,152 |
| DexCom, Inc. (a) | | 27,800 | 11,870,600 |
| Hologic, Inc. (a) | | 107,366 | 7,163,460 |
| Insulet Corp. (a) | | 26,800 | 7,356,868 |
| JEOL Ltd. | | 6,900 | 403,709 |
| Novocure Ltd. (a) | | 76,546 | 16,979,434 |
| Penumbra, Inc. (a) | | 29,400 | 8,057,364 |
| TransMedics Group, Inc. (a) | | 337,741 | 11,206,246 |
| ViewRay, Inc. (a) | | 92,400 | 609,840 |
| | | | 101,687,391 |
| Health Care Providers & Services - 4.8% | | | |
| 1Life Healthcare, Inc. (a) | | 566,820 | 18,739,069 |
| Alignment Healthcare, Inc. (a) | | 117,300 | 2,741,301 |
| Cano Health LLC (c) | | 601,200 | 6,910,794 |
| Cano Health, Inc. (a) | | 318,100 | 3,849,010 |
| Centene Corp. (a) | | 232,200 | 16,934,346 |
| Cigna Corp. | | 53,145 | 12,599,085 |
| Clover Health Investments Corp. (c) | | 40,700 | 542,124 |
| Clover Health Investments Corp. Class B | | 126,670 | 1,670,372 |
| Humana, Inc. | | 77,672 | 34,386,948 |
| LifeStance Health Group, Inc. | | 67,500 | 1,880,550 |
| Oak Street Health, Inc. (a)(b) | | 210,400 | 12,323,128 |
| UnitedHealth Group, Inc. | | 124,148 | 49,713,825 |
| | | | 162,290,552 |
| Health Care Technology - 0.5% | | | |
| agilon health, Inc. (a) | | 188,200 | 7,635,274 |
| Doximity, Inc. | | 30,000 | 1,746,000 |
| GoodRx Holdings, Inc. (b) | | 103,300 | 3,719,833 |
| Inspire Medical Systems, Inc. (a) | | 20,300 | 3,923,178 |
| | | | 17,024,285 |
| Life Sciences Tools & Services - 0.2% | | | |
| 10X Genomics, Inc. (a) | | 5,500 | 1,077,010 |
| Maravai LifeSciences Holdings, Inc. | | 37,599 | 1,569,006 |
| Sartorius Stedim Biotech | | 11,926 | 5,640,946 |
| | | | 8,286,962 |
| Pharmaceuticals - 0.5% | | | |
| Arvinas Holding Co. LLC (a) | | 22,000 | 1,694,000 |
| Horizon Therapeutics PLC (a) | | 42,700 | 3,998,428 |
| IMARA, Inc. (a) | | 192,221 | 1,518,546 |
| Intra-Cellular Therapies, Inc. (a) | | 20,380 | 831,912 |
| Nabriva Therapeutics PLC (a)(b) | | 163,155 | 220,259 |
| Nabriva Therapeutics PLC warrants 6/1/22 (a) | | 1,049,672 | 11 |
| Nektar Therapeutics (a) | | 301,699 | 5,177,155 |
| Nuvation Bio, Inc. (c) | | 243,417 | 2,266,212 |
| Nuvation Bio, Inc. | | 78,128 | 691,003 |
| Terns Pharmaceuticals, Inc. | | 108,800 | 1,333,888 |
| Theravance Biopharma, Inc. (a) | | 56,900 | 826,188 |
| | | | 18,557,602 |
|
| TOTAL HEALTH CARE | | | 490,898,663 |
|
| INDUSTRIALS - 3.2% | | | |
| Aerospace & Defense - 0.0% | | | |
| Space Exploration Technologies Corp. Class A (a)(c)(d) | | 1,300 | 545,987 |
| Air Freight & Logistics - 0.3% | | | |
| InPost SA | | 439,700 | 8,824,781 |
| Building Products - 0.1% | | | |
| The AZEK Co., Inc. | | 122,300 | 5,192,858 |
| Electrical Equipment - 0.7% | | | |
| Sunrun, Inc. (a) | | 279,618 | 15,597,092 |
| Vestas Wind Systems A/S | | 196,785 | 7,681,558 |
| | | | 23,278,650 |
| Marine - 0.0% | | | |
| Star Bulk Carriers Corp. | | 16,800 | 385,560 |
| Road & Rail - 2.1% | | | |
| Lyft, Inc. (a) | | 407,216 | 24,628,424 |
| TuSimple Holdings, Inc. (a) | | 62,400 | 4,445,376 |
| Uber Technologies, Inc. (a) | | 838,493 | 42,025,269 |
| | | | 71,099,069 |
|
| TOTAL INDUSTRIALS | | | 109,326,905 |
|
| INFORMATION TECHNOLOGY - 37.0% | | | |
| Communications Equipment - 0.2% | | | |
| Lumentum Holdings, Inc. (a) | | 100,900 | 8,276,827 |
| Electronic Equipment & Components - 0.3% | | | |
| Flex Ltd. (a) | | 281,652 | 5,033,121 |
| Hon Hai Precision Industry Co. Ltd. (Foxconn) | | 74,000 | 296,875 |
| Jabil, Inc. | | 84,200 | 4,893,704 |
| | | | 10,223,700 |
| IT Services - 6.3% | | | |
| Affirm Holdings, Inc. (b) | | 7,500 | 505,125 |
| Afterpay Ltd. (a) | | 35,307 | 3,128,963 |
| Dlocal Ltd. | | 47,000 | 2,468,910 |
| EPAM Systems, Inc. (a) | | 9,471 | 4,839,302 |
| Global Payments, Inc. | | 38,474 | 7,215,414 |
| GoDaddy, Inc. (a) | | 375,106 | 32,619,218 |
| MasterCard, Inc. Class A | | 35,256 | 12,871,613 |
| MongoDB, Inc. Class A (a) | | 30,786 | 11,129,755 |
| Nuvei Corp. (e) | | 181,600 | 14,863,775 |
| PayPal Holdings, Inc. (a) | | 71,747 | 20,912,816 |
| Repay Holdings Corp. (a) | | 208,900 | 5,021,956 |
| Riskified Ltd. (a)(c)(d) | | 122,600 | 1,593,800 |
| Riskified Ltd. warrants (a)(c)(d) | | 147 | 0 |
| Snowflake Computing, Inc. | | 6,286 | 1,519,955 |
| Square, Inc. (a) | | 96,300 | 23,477,940 |
| TaskUs, Inc. | | 138,600 | 4,745,664 |
| Twilio, Inc. Class A (a) | | 46,677 | 18,398,206 |
| Visa, Inc. Class A | | 59,633 | 13,943,388 |
| Wix.com Ltd. (a) | | 120,190 | 34,888,753 |
| | | | 214,144,553 |
| Semiconductors & Semiconductor Equipment - 7.7% | | | |
| Applied Materials, Inc. | | 200,595 | 28,564,728 |
| Cirrus Logic, Inc. (a) | | 11,600 | 987,392 |
| Lam Research Corp. | | 34,444 | 22,412,711 |
| Marvell Technology, Inc. | | 283,770 | 16,552,304 |
| Micron Technology, Inc. (a) | | 472,255 | 40,132,230 |
| NVIDIA Corp. | | 103,863 | 83,100,786 |
| NXP Semiconductors NV | | 215,045 | 44,239,057 |
| ON Semiconductor Corp. (a) | | 346,839 | 13,276,997 |
| Semtech Corp. (a) | | 14,200 | 976,960 |
| SolarEdge Technologies, Inc. (a) | | 38,643 | 10,679,766 |
| Taiwan Semiconductor Manufacturing Co. Ltd. sponsored ADR | | 24,200 | 2,907,872 |
| | | | 263,830,803 |
| Software - 18.3% | | | |
| ACV Auctions, Inc. | | 221,821 | 5,401,009 |
| ACV Auctions, Inc. Class A (a) | | 12,740 | 326,526 |
| Adobe, Inc. (a) | | 56,057 | 32,829,221 |
| Alkami Technology, Inc. | | 137,573 | 4,416,506 |
| Alkami Technology, Inc. (a) | | 1,700 | 60,639 |
| Alteryx, Inc. Class A (a)(b) | | 2,800 | 240,856 |
| Anaplan, Inc. (a) | | 181,300 | 9,663,290 |
| Autodesk, Inc. (a) | | 37,185 | 10,854,302 |
| BTRS Holdings, Inc. (c) | | 242,599 | 3,061,599 |
| Ceridian HCM Holding, Inc. (a) | | 97,900 | 9,390,568 |
| Clear Secure, Inc. | | 5,200 | 208,000 |
| Cloudflare, Inc. (a) | | 49,297 | 5,217,594 |
| Confluent, Inc. | | 8,300 | 394,250 |
| Coupa Software, Inc. (a) | | 22,360 | 5,860,780 |
| Digital Turbine, Inc. (a) | | 218,900 | 16,642,967 |
| DocuSign, Inc. (a) | | 12,752 | 3,565,077 |
| DoubleVerify Holdings, Inc. (a) | | 158,100 | 6,693,954 |
| DoubleVerify Holdings, Inc. | | 164,233 | 6,258,263 |
| Dynatrace, Inc. (a) | | 531,700 | 31,061,914 |
| Elastic NV (a) | | 69,781 | 10,171,279 |
| Epic Games, Inc. (c)(d) | | 8,216 | 7,271,160 |
| fuboTV, Inc. (a)(b) | | 275,300 | 8,839,883 |
| HubSpot, Inc. (a) | | 40,593 | 23,654,353 |
| Intapp, Inc. | | 171,500 | 4,802,000 |
| Intuit, Inc. | | 40,790 | 19,994,034 |
| Lightspeed POS, Inc. (Canada) (a) | | 298,237 | 24,961,349 |
| Microsoft Corp. | | 848,744 | 229,924,746 |
| Monday.com Ltd. (b) | | 17,900 | 4,002,261 |
| Olo, Inc. (a)(b) | | 12,000 | 448,680 |
| Pine Labs Private Ltd. (c)(d) | | 2,299 | 857,205 |
| RingCentral, Inc. (a) | | 9,217 | 2,678,276 |
| Salesforce.com, Inc. (a) | | 257,231 | 62,833,816 |
| SentinelOne, Inc. | | 15,000 | 637,500 |
| ServiceNow, Inc. (a) | | 37,518 | 20,618,017 |
| Stripe, Inc. Class B (a)(c)(d) | | 10,400 | 417,300 |
| Technology One Ltd. | | 47,904 | 334,467 |
| The Trade Desk, Inc. (a) | | 84,450 | 6,533,052 |
| Viant Technology, Inc. | | 182,101 | 5,422,968 |
| Volue A/S | | 309,200 | 1,784,782 |
| Workday, Inc. Class A (a) | | 47,393 | 11,314,605 |
| Zendesk, Inc. (a) | | 21,600 | 3,117,744 |
| Zoom Video Communications, Inc. Class A (a) | | 48,000 | 18,577,440 |
| Zuora, Inc. (a) | | 38,600 | 665,850 |
| | | | 622,010,082 |
| Technology Hardware, Storage & Peripherals - 4.2% | | | |
| Apple, Inc. | | 936,504 | 128,263,588 |
| Samsung Electronics Co. Ltd. | | 182,850 | 13,058,403 |
| | | | 141,321,991 |
|
| TOTAL INFORMATION TECHNOLOGY | | | 1,259,807,956 |
|
| MATERIALS - 0.8% | | | |
| Chemicals - 0.0% | | | |
| Corbion NV | | 18,521 | 1,058,533 |
| Metals & Mining - 0.8% | | | |
| First Quantum Minerals Ltd. | | 147,000 | 3,388,020 |
| Freeport-McMoRan, Inc. | | 585,300 | 21,720,483 |
| | | | 25,108,503 |
|
| TOTAL MATERIALS | | | 26,167,036 |
|
| UTILITIES - 2.0% | | | |
| Electric Utilities - 1.1% | | | |
| Edison International | | 174,507 | 10,089,995 |
| FirstEnergy Corp. | | 126,800 | 4,718,228 |
| NextEra Energy, Inc. | | 81,052 | 5,939,491 |
| ORSTED A/S (e) | | 117,794 | 16,529,196 |
| | | | 37,276,910 |
| Independent Power and Renewable Electricity Producers - 0.9% | | | |
| Brookfield Renewable Corp. | | 58,450 | 2,455,692 |
| NextEra Energy Partners LP | | 272,300 | 20,792,828 |
| The AES Corp. | | 252,600 | 6,585,282 |
| | | | 29,833,802 |
|
| TOTAL UTILITIES | | | 67,110,712 |
|
| TOTAL COMMON STOCKS | | | |
| (Cost $1,733,382,466) | | | 3,313,238,228 |
|
| Preferred Stocks - 2.3% | | | |
| Convertible Preferred Stocks - 2.0% | | | |
| COMMUNICATION SERVICES - 0.0% | | | |
| Diversified Telecommunication Services - 0.0% | | | |
| Starry, Inc. Series D (a)(c)(d) | | 236,200 | 396,816 |
| CONSUMER DISCRETIONARY - 0.6% | | | |
| Automobiles - 0.3% | | | |
| Bird Rides, Inc. (c) | | 286,744 | 2,152,587 |
| Rad Power Bikes, Inc.: | | | |
| Series A (c)(d) | | 7,410 | 35,745 |
| Series C (c)(d) | | 29,156 | 140,644 |
| Rivian Automotive, Inc.: | | | |
| Series E (c)(d) | | 203,741 | 7,507,856 |
| Series F (c)(d) | | 39,077 | 1,439,987 |
| | | | 11,276,819 |
| Internet & Direct Marketing Retail - 0.3% | | | |
| GoBrands, Inc. Series G (c)(d) | | 10,300 | 2,572,088 |
| Instacart, Inc.: | | | |
| Series H (c)(d) | | 39,942 | 4,992,750 |
| Series I (c)(d) | | 13,388 | 1,673,500 |
| | | | 9,238,338 |
| Textiles, Apparel & Luxury Goods - 0.0% | | | |
| Allbirds, Inc.: | | | |
| Series A (a)(c)(d) | | 2,615 | 28,268 |
| Series B (a)(c)(d) | | 460 | 4,973 |
| Series C (a)(c)(d) | | 4,390 | 47,456 |
| Series Seed (a)(c)(d) | | 1,405 | 15,188 |
| | | | 95,885 |
| TOTAL CONSUMER DISCRETIONARY | | | 20,611,042 |
| CONSUMER STAPLES - 0.4% | | | |
| Food & Staples Retailing - 0.1% | | | |
| Blink Health, Inc. Series C (a)(c)(d) | | 37,050 | 1,414,569 |
| Sweetgreen, Inc.: | | | |
| Series C (a)(c)(d) | | 749 | 9,849 |
| Series D (a)(c)(d) | | 12,050 | 158,458 |
| Series I (a)(c)(d) | | 28,401 | 373,473 |
| Series J (c)(d) | | 56,101 | 737,728 |
| | | | 2,694,077 |
| Food Products - 0.1% | | | |
| Bowery Farming, Inc. Series C1 (c)(d) | | 57,277 | 3,450,899 |
| Tobacco - 0.2% | | | |
| JUUL Labs, Inc.: | | | |
| Series C (a)(c)(d) | | 131,549 | 8,050,799 |
| Series D (a)(c)(d) | | 741 | 45,349 |
| | | | 8,096,148 |
| TOTAL CONSUMER STAPLES | | | 14,241,124 |
| FINANCIALS - 0.0% | | | |
| Diversified Financial Services - 0.0% | | | |
| Sonder Holdings, Inc.: | | | |
| Series D1 (c) | | 28,666 | 406,535 |
| Series E (a)(c) | | 122,861 | 1,742,386 |
| | | | 2,148,921 |
| INDUSTRIALS - 0.5% | | | |
| Aerospace & Defense - 0.3% | | | |
| Relativity Space, Inc. Series E (c)(d) | | 149,903 | 3,423,050 |
| Space Exploration Technologies Corp.: | | | |
| Series I (a)(c)(d) | | 3,941 | 1,655,181 |
| Series N (c)(d) | | 8,100 | 3,401,919 |
| | | | 8,480,150 |
| Construction & Engineering - 0.1% | | | |
| Beta Technologies, Inc. Series A (c)(d) | | 64,780 | 4,746,431 |
| Road & Rail - 0.1% | | | |
| Convoy, Inc. Series D (a)(c)(d) | | 197,216 | 2,603,251 |
| Transportation Infrastructure - 0.0% | | | |
| Delhivery Pvt Ltd. Series H (c)(d) | | 1,519 | 728,299 |
| TOTAL INDUSTRIALS | | | 16,558,131 |
| INFORMATION TECHNOLOGY - 0.4% | | | |
| Communications Equipment - 0.0% | | | |
| Xsight Labs Ltd. Series D (c)(d) | | 74,300 | 594,103 |
| Electronic Equipment & Components - 0.1% | | | |
| Enevate Corp. Series E (c)(d) | | 1,172,546 | 1,299,983 |
| IT Services - 0.2% | | | |
| ByteDance Ltd. Series E1 (c)(d) | | 17,456 | 2,072,551 |
| Riskified Ltd. Series E (a)(c)(d) | | 17,500 | 227,500 |
| Yanka Industries, Inc.: | | | |
| Series E (a)(c)(d) | | 53,172 | 1,694,953 |
| Series F (c)(d) | | 55,568 | 1,771,330 |
| | | | 5,766,334 |
| Semiconductors & Semiconductor Equipment - 0.0% | | | |
| SiMa.ai Series B (c)(d) | | 171,100 | 877,298 |
| Tenstorrent, Inc. Series C1 (c)(d) | | 4,700 | 279,435 |
| | | | 1,156,733 |
| Software - 0.1% | | | |
| Databricks, Inc. Series G (c)(d) | | 9,000 | 1,596,311 |
| Stripe, Inc. Series H (c)(d) | | 4,500 | 180,563 |
| ThoughtWorks, Inc.: | | | |
| Series A (c)(d) | | 2,054 | 1,359,358 |
| Series B (c)(d) | | 1,300 | 860,353 |
| | | | 3,996,585 |
| TOTAL INFORMATION TECHNOLOGY | | | 12,813,738 |
| MATERIALS - 0.1% | | | |
| Metals & Mining - 0.1% | | | |
| Diamond Foundry, Inc. Series C (c)(d) | | 99,028 | 2,376,672 |
|
| TOTAL CONVERTIBLE PREFERRED STOCKS | | | 69,146,444 |
|
| Nonconvertible Preferred Stocks - 0.3% | | | |
| COMMUNICATION SERVICES - 0.0% | | | |
| Diversified Telecommunication Services - 0.0% | | | |
| Starry, Inc. Series E1 (c)(d) | | 659,560 | 1,108,061 |
| CONSUMER DISCRETIONARY - 0.1% | | | |
| Automobiles - 0.0% | | | |
| Neutron Holdings, Inc. Series 1C (a)(c)(d) | | 1,673,000 | 22,920 |
| Waymo LLC Series A2 (a)(c)(d) | | 7,496 | 687,548 |
| | | | 710,468 |
| Specialty Retail - 0.1% | | | |
| Cazoo Holdings Ltd.: | | | |
| Series A (c) | | 641 | 19,683 |
| Series B (c) | | 11,220 | 344,523 |
| Series C (c) | | 228 | 7,001 |
| Series D (c) | | 40,082 | 1,230,765 |
| | | | 1,601,972 |
| TOTAL CONSUMER DISCRETIONARY | | | 2,312,440 |
| INFORMATION TECHNOLOGY - 0.2% | | | |
| IT Services - 0.1% | | | |
| Gupshup, Inc. (c)(d)(f) | | 70,900 | 1,621,143 |
| Software - 0.1% | | | |
| Pine Labs Private Ltd.: | | | |
| Series 1 (c)(d) | | 5,494 | 2,048,493 |
| Series A (c)(d) | | 1,373 | 511,937 |
| Series B (c)(d) | | 1,494 | 557,053 |
| Series B2 (c)(d) | | 1,208 | 450,415 |
| Series C (c)(d) | | 2,247 | 837,816 |
| Series C1 (c)(d) | | 473 | 176,363 |
| Series D (c)(d) | | 506 | 188,667 |
| | | | 4,770,744 |
| TOTAL INFORMATION TECHNOLOGY | | | 6,391,887 |
|
| TOTAL NONCONVERTIBLE PREFERRED STOCKS | | | 9,812,388 |
|
| TOTAL PREFERRED STOCKS | | | |
| (Cost $58,723,954) | | | 78,958,832 |
| | | Principal Amount | Value |
|
| Convertible Bonds - 0.0% | | | |
| CONSUMER DISCRETIONARY - 0.0% | | | |
| Automobiles - 0.0% | | | |
| Neutron Holdings, Inc.: | | | |
| 4% 5/22/27 (c)(d) | | 130,700 | 130,700 |
| 4% 6/12/27 (c)(d) | | 35,600 | 35,600 |
| TOTAL CONVERTIBLE BONDS | | | |
| (Cost $166,300) | | | 166,300 |
|
| Preferred Securities - 0.1% | | | |
| CONSUMER DISCRETIONARY - 0.1% | | | |
| Internet & Direct Marketing Retail - 0.1% | | | |
| Circle Internet Financial Ltd. 0% (c)(d)(g) | | 3,486,300 | 3,486,300 |
| INFORMATION TECHNOLOGY - 0.0% | | | |
| Electronic Equipment & Components - 0.0% | | | |
| Enevate Corp. 0% 1/29/23 (c)(d) | | 499,219 | 499,219 |
| Semiconductors & Semiconductor Equipment - 0.0% | | | |
| Tenstorrent, Inc. 0% (c)(d)(g) | | 260,000 | 260,000 |
|
| TOTAL INFORMATION TECHNOLOGY | | | 759,219 |
|
| TOTAL PREFERRED SECURITIES | | | |
| (Cost $4,245,519) | | | 4,245,519 |
| | | Shares | Value |
|
| Money Market Funds - 3.0% | | | |
| Fidelity Cash Central Fund 0.06% (h) | | 11,462,994 | 11,465,287 |
| Fidelity Securities Lending Cash Central Fund 0.06% (h)(i) | | 88,181,449 | 88,190,267 |
| TOTAL MONEY MARKET FUNDS | | | |
| (Cost $99,655,554) | | | 99,655,554 |
|
| Equity Funds - 0.5% | | | |
| Domestic Equity Funds - 0.5% | | | |
| iShares Russell 1000 Growth Index ETF (b) | | | |
| (Cost $15,924,459) | | 59,600 | 16,180,208 |
| TOTAL INVESTMENT IN SECURITIES - 103.2% | | | |
| (Cost $1,912,098,252) | | | 3,512,444,641 |
| NET OTHER ASSETS (LIABILITIES) - (3.2)% | | | (107,476,615) |
| NET ASSETS - 100% | | | $3,404,968,026 |
Security Type Abbreviations
ETF – Exchange-Traded Fund
Legend
(a) Non-income producing
(b) Security or a portion of the security is on loan at period end.
(c) Restricted securities (including private placements) - Investment in securities not registered under the Securities Act of 1933 (excluding 144A issues). At the end of the period, the value of restricted securities (excluding 144A issues) amounted to $142,590,916 or 4.2% of net assets.
(d) Level 3 security
(e) Security exempt from registration under Rule 144A of the Securities Act of 1933. These securities may be resold in transactions exempt from registration, normally to qualified institutional buyers. At the end of the period, the value of these securities amounted to $58,871,932 or 1.7% of net assets.
(f) Security or a portion of the security purchased on a delayed delivery or when-issued basis.
(g) Security is perpetual in nature with no stated maturity date.
(h) Affiliated fund that is generally available only to investment companies and other accounts managed by Fidelity Investments. The rate quoted is the annualized seven-day yield of the fund at period end. A complete unaudited listing of the fund's holdings as of its most recent quarter end is available upon request. In addition, each Fidelity Central Fund's financial statements are available on the SEC's website or upon request.
(i) Investment made with cash collateral received from securities on loan.
Additional information on each restricted holding is as follows:
| Security | Acquisition Date | Acquisition Cost |
| Allbirds, Inc. | 10/9/18 | $72,712 |
| Allbirds, Inc. Series A | 10/9/18 | $28,679 |
| Allbirds, Inc. Series B | 10/9/18 | $5,045 |
| Allbirds, Inc. Series C | 10/9/18 | $48,146 |
| Allbirds, Inc. Series Seed | 10/9/18 | $15,409 |
| AppHarvest, Inc. | 1/29/21 | $6,088,850 |
| Arrival SA | 3/24/21 | $2,409,570 |
| Beachbody Co. Group LLC | 2/9/21 | $1,193,540 |
| Beta Technologies, Inc. Series A | 4/9/21 | $4,746,431 |
| Bird Rides, Inc. | 2/12/21 - 4/20/21 | $1,488,022 |
| Blink Health, Inc. Series A1 | 12/30/20 | $225,578 |
| Blink Health, Inc. Series C | 11/7/19 - 1/21/21 | $1,414,420 |
| Bombas LLC | 2/16/21 | $2,993,957 |
| Bowery Farming, Inc. Series C1 | 5/18/21 | $3,450,899 |
| BTRS Holdings, Inc. | 1/12/21 | $2,425,990 |
| ByteDance Ltd. Series E1 | 11/18/20 | $1,912,727 |
| Cano Health LLC | 11/11/20 | $6,012,000 |
| CareMax, Inc. | 12/18/20 | $1,000,000 |
| Cazoo Holdings Ltd. | 9/30/20 | $269,127 |
| Cazoo Holdings Ltd. Series A | 9/30/20 | $8,788 |
| Cazoo Holdings Ltd. Series B | 9/30/20 | $153,826 |
| Cazoo Holdings Ltd. Series C | 9/30/20 | $3,126 |
| Cazoo Holdings Ltd. Series D | 9/30/20 | $549,523 |
| Circle Internet Financial Ltd. 0% | 5/11/21 | $3,486,300 |
| Clover Health Investments Corp. | 1/5/21 | $407,000 |
| Convoy, Inc. Series D | 10/30/19 | $2,670,305 |
| Databricks, Inc. Series G | 2/1/21 | $1,596,311 |
| Delhivery Pvt Ltd. Series H | 5/20/21 | $741,460 |
| Diamond Foundry, Inc. Series C | 3/15/21 | $2,376,672 |
| Enevate Corp. Series E | 1/29/21 | $1,299,984 |
| Enevate Corp. 0% 1/29/23 | 1/29/21 | $499,219 |
| Epic Games, Inc. | 7/13/20 - 3/29/21 | $6,646,200 |
| FSN E-Commerce Ventures Pvt Ltd. | 10/7/20 - 10/26/20 | $994,523 |
| GoBrands, Inc. Series G | 3/2/21 | $2,572,088 |
| Gupshup, Inc. | 6/8/21 | $1,621,143 |
| Instacart, Inc. Series H | 11/13/20 | $2,396,520 |
| Instacart, Inc. Series I | 2/26/21 | $1,673,500 |
| JUUL Labs, Inc. Class B | 11/21/17 | $0 |
| JUUL Labs, Inc. Series C | 5/22/15 | $0 |
| JUUL Labs, Inc. Series D | 6/25/18 | $0 |
| Latch, Inc. | 1/24/21 | $555,000 |
| Lordstown Motors Corp. | 10/23/20 | $1,307,610 |
| Neutron Holdings, Inc. | 2/4/21 | $1,066 |
| Neutron Holdings, Inc. Series 1C | 7/3/18 | $305,891 |
| Neutron Holdings, Inc. 4% 5/22/27 | 6/4/20 | $130,700 |
| Neutron Holdings, Inc. 4% 6/12/27 | 6/12/20 | $35,600 |
| Nuvation Bio, Inc. | 2/10/21 | $2,434,170 |
| Payoneer, Inc. | 2/3/21 | $654,000 |
| Pine Labs Private Ltd. | 6/30/21 | $857,205 |
| Pine Labs Private Ltd. Series 1 | 6/30/21 | $2,048,493 |
| Pine Labs Private Ltd. Series A | 6/30/21 | $511,937 |
| Pine Labs Private Ltd. Series B | 6/30/21 | $557,053 |
| Pine Labs Private Ltd. Series B2 | 6/30/21 | $450,415 |
| Pine Labs Private Ltd. Series C | 6/30/21 | $837,816 |
| Pine Labs Private Ltd. Series C1 | 6/30/21 | $176,363 |
| Pine Labs Private Ltd. Series D | 6/30/21 | $188,667 |
| Proterra, Inc. | 1/11/21 | $810,000 |
| Rad Power Bikes, Inc. | 1/21/21 | $274,158 |
| Rad Power Bikes, Inc. Series A | 1/21/21 | $35,745 |
| Rad Power Bikes, Inc. Series C | 1/21/21 | $140,644 |
| Relativity Space, Inc. Series E | 5/27/21 | $3,423,050 |
| Riskified Ltd. | 12/20/19 - 4/15/20 | $1,109,209 |
| Riskified Ltd. Series E | 10/28/19 | $166,502 |
| Riskified Ltd. warrants | 10/28/19 | $0 |
| Rivian Automotive, Inc. Series E | 7/10/20 | $3,155,948 |
| Rivian Automotive, Inc. Series F | 1/19/21 | $1,439,987 |
| Rush Street Interactive, Inc. | 12/29/20 | $606,000 |
| SiMa.ai Series B | 5/10/21 | $877,298 |
| Sonder Holdings, Inc. Series D1 | 12/20/19 | $300,878 |
| Sonder Holdings, Inc. Series E | 4/3/20 - 5/6/20 | $1,322,833 |
| Space Exploration Technologies Corp. Class A | 2/16/21 | $545,987 |
| Space Exploration Technologies Corp. Series I | 4/5/18 | $666,029 |
| Space Exploration Technologies Corp. Series N | 8/4/20 | $2,187,000 |
| Starry, Inc. Series D | 7/30/20 | $337,766 |
| Starry, Inc. Series E1 | 9/4/20 | $927,692 |
| Stripe, Inc. Class B | 5/18/21 | $417,335 |
| Stripe, Inc. Series H | 3/15/21 | $180,563 |
| Sweetgreen, Inc. warrants 1/21/26 | 1/21/21 | $0 |
| Sweetgreen, Inc. Series C | 9/13/19 | $12,808 |
| Sweetgreen, Inc. Series D | 9/13/19 | $206,055 |
| Sweetgreen, Inc. Series I | 9/13/19 | $485,657 |
| Sweetgreen, Inc. Series J | 1/21/21 | $959,327 |
| Tenstorrent, Inc. Series C1 | 4/23/21 | $279,435 |
| Tenstorrent, Inc. 0% | 4/23/21 | $260,000 |
| The Original BARK Co. | 12/17/20 | $5,968,910 |
| ThoughtWorks, Inc. Series A | 1/13/21 | $1,257,356 |
| ThoughtWorks, Inc. Series B | 6/25/21 | $860,353 |
| View, Inc. | 3/5/21 | $1,794,130 |
| Waymo LLC Series A2 | 5/8/20 | $643,661 |
| Xsight Labs Ltd. Series D | 2/16/21 | $594,103 |
| Yanka Industries, Inc. Series E | 5/15/20 | $642,275 |
| Yanka Industries, Inc. Series F | 4/8/21 | $1,771,330 |
| Zomato Ltd. | 12/9/20 - 2/10/21 | $1,100,721 |
Affiliated Central Funds
Information regarding fiscal year to date income earned by the Fund from investments in Fidelity Central Funds is as follows:
| Fund | Income earned |
| Fidelity Cash Central Fund | $1,748 |
| Fidelity Securities Lending Cash Central Fund | 241,954 |
| Total | $243,702 |
Amounts in the income column in the above table include any capital gain distributions from underlying funds, which are presented in the corresponding line-item in the Statement of Operations, if applicable. Amount for Fidelity Securities Lending Cash Central Fund represents the income earned on investing cash collateral, less rebates paid to borrowers and any lending agent fees associated with the loan, plus any premium payments received for lending certain types of securities.
Fiscal year to date information regarding the Fund's investments in Fidelity Central Funds, including the ownership percentage, is presented below.
| Fund | Value, beginning of period | Purchases | Sales Proceeds | Realized Gain/Loss | Change in Unrealized appreciation (depreciation) | Value, end of period | % ownership, end of period |
| Fidelity Cash Central Fund 0.06% | $6,556,539 | $326,082,788 | $321,173,492 | $(548) | $-- | $11,465,287 | 0.0% |
| Fidelity Securities Lending Cash Central Fund 0.06% | 113,740,484 | 194,609,910 | 220,160,127 | -- | -- | 88,190,267 | 0.3% |
| Total | $120,297,023 | $520,692,698 | $541,333,619 | $(548) | $-- | $99,655,554 | |
Investment Valuation
The following is a summary of the inputs used, as of June 30, 2021, involving the Fund's assets and liabilities carried at fair value. The inputs or methodology used for valuing securities may not be an indication of the risk associated with investing in those securities. For more information on valuation inputs, and their aggregation into the levels used below, please refer to the Investment Valuation section in the accompanying Notes to Financial Statements.
| | Valuation Inputs at Reporting Date: |
| Description | Total | Level 1 | Level 2 | Level 3 |
| Investments in Securities: | | | | |
| Equities: | | | | |
| Communication Services | $708,704,440 | $707,199,563 | $-- | $1,504,877 |
| Consumer Discretionary | 506,122,119 | 473,742,416 | 8,120,709 | 24,258,994 |
| Consumer Staples | 60,543,253 | 45,728,333 | -- | 14,814,920 |
| Energy | 37,785,878 | 37,785,878 | -- | -- |
| Financials | 87,589,670 | 72,162,232 | 13,612,076 | 1,815,362 |
| Health Care | 490,898,663 | 481,626,483 | 9,272,180 | -- |
| Industrials | 125,885,036 | 108,780,918 | -- | 17,104,118 |
| Information Technology | 1,279,013,581 | 1,233,592,713 | 16,075,778 | 29,345,090 |
| Materials | 28,543,708 | 26,167,036 | -- | 2,376,672 |
| Utilities | 67,110,712 | 67,110,712 | -- | -- |
| Corporate Bonds | 166,300 | -- | -- | 166,300 |
| Preferred Securities | 4,245,519 | -- | -- | 4,245,519 |
| Money Market Funds | 99,655,554 | 99,655,554 | -- | -- |
| Equity Funds | 16,180,208 | 16,180,208 | -- | -- |
| Total Investments in Securities: | $3,512,444,641 | $3,369,732,046 | $47,080,743 | $95,631,852 |
| Net unrealized depreciation on unfunded commitments | $(837,905) | $-- | $(837,905) | $-- |
The following is a reconciliation of Investments in Securities for which Level 3 inputs were used in determining value:
| Investments in Securities: | |
| Beginning Balance | $42,895,621 |
| Net Realized Gain (Loss) on Investment Securities | -- |
| Net Unrealized Gain (Loss) on Investment Securities | 10,530,782 |
| Cost of Purchases | 53,679,383 |
| Proceeds of Sales | -- |
| Amortization/Accretion | -- |
| Transfers into Level 3 | 936,737 |
| Transfers out of Level 3 | (12,410,671) |
| Ending Balance | $95,631,852 |
| The change in unrealized gain (loss) for the period attributable to Level 3 securities held at June 30, 2021 | $10,530,782 |
The information used in the above reconciliation represents fiscal year to date activity for any Investments in Securities identified as using Level 3 inputs at either the beginning or the end of the current fiscal period. Cost of purchases and proceeds of sales may include securities received and/or delivered through in-kind transactions. Transfers in or out of Level 3 represent the beginning value of any Security or Instrument where a change in the pricing level occurred from the beginning to the end of the period. The cost of purchases and the proceeds of sales may include securities received or delivered through corporate actions or exchanges. Realized and unrealized gains (losses) disclosed in the reconciliation are included in Net Gain (Loss) on the Fund's Statement of Operations.
Other Information
Distribution of investments by country or territory of incorporation, as a percentage of Total Net Assets, is as follows (Unaudited):
| United States of America | 85.9% |
| Cayman Islands | 4.3% |
| Netherlands | 1.8% |
| Canada | 1.4% |
| Israel | 1.4% |
| India | 1.3% |
| Others (Individually Less Than 1%) | 3.9% |
| | 100.0% |
See accompanying notes which are an integral part of the financial statements.
Financial Statements
Statement of Assets and Liabilities
| | | June 30, 2021 (Unaudited) |
| Assets | | |
Investment in securities, at value (including securities loaned of $86,000,696) — See accompanying schedule:
Unaffiliated issuers (cost $1,812,442,698) | $3,412,789,087 | |
| Fidelity Central Funds (cost $99,655,554) | 99,655,554 | |
| Total Investment in Securities (cost $1,912,098,252) | | $3,512,444,641 |
| Foreign currency held at value (cost $103,113) | | 103,030 |
| Receivable for investments sold | | 12,394,771 |
| Receivable for fund shares sold | | 2,860,400 |
| Unrealized appreciation on unfunded commitments | | 2,257,794 |
| Dividends receivable | | 429,540 |
| Interest receivable | | 7,119 |
| Distributions receivable from Fidelity Central Funds | | 39,744 |
| Other receivables | | 38,615 |
| Total assets | | 3,530,575,654 |
| Liabilities | | |
| Payable for investments purchased | | |
| Regular delivery | $27,670,331 | |
| Delayed delivery | 1,621,143 | |
| Payable for fund shares redeemed | 1,009,117 | |
| Unrealized depreciation on unfunded commitments | 3,095,699 | |
| Accrued management fee | 1,433,109 | |
| Distribution and service plan fees payable | 278,833 | |
| Other affiliated payables | 340,177 | |
| Other payables and accrued expenses | 1,976,169 | |
| Collateral on securities loaned | 88,183,050 | |
| Total liabilities | | 125,607,628 |
| Net Assets | | $3,404,968,026 |
| Net Assets consist of: | | |
| Paid in capital | | $1,549,806,709 |
| Total accumulated earnings (loss) | | 1,855,161,317 |
| Net Assets | | $3,404,968,026 |
| Net Asset Value and Maximum Offering Price | | |
| Initial Class: | | |
| Net Asset Value, offering price and redemption price per share ($515,224,188 ÷ 6,254,935 shares) | | $82.37 |
| Service Class: | | |
| Net Asset Value, offering price and redemption price per share ($167,065,335 ÷ 2,033,751 shares) | | $82.15 |
| Service Class 2: | | |
| Net Asset Value, offering price and redemption price per share ($1,323,971,458 ÷ 16,415,553 shares) | | $80.65 |
| Investor Class: | | |
| Net Asset Value, offering price and redemption price per share ($1,398,707,045 ÷ 17,126,102 shares) | | $81.67 |
See accompanying notes which are an integral part of the financial statements.
Statement of Operations
| | | Six months ended June 30, 2021 (Unaudited) |
| Investment Income | | |
| Dividends | | $5,065,633 |
| Interest | | 3,326 |
| Income from Fidelity Central Funds (including $241,954 from security lending) | | 243,702 |
| Total income | | 5,312,661 |
| Expenses | | |
| Management fee | $8,375,655 | |
| Transfer agent fees | 1,524,366 | |
| Distribution and service plan fees | 1,568,353 | |
| Accounting fees | 466,371 | |
| Custodian fees and expenses | 69,883 | |
| Independent trustees' fees and expenses | 5,218 | |
| Audit | 36,722 | |
| Legal | 5,104 | |
| Interest | 4,507 | |
| Miscellaneous | 6,818 | |
| Total expenses before reductions | 12,062,997 | |
| Expense reductions | (83,054) | |
| Total expenses after reductions | | 11,979,943 |
| Net investment income (loss) | | (6,667,282) |
| Realized and Unrealized Gain (Loss) | | |
| Net realized gain (loss) on: | | |
| Investment securities: | | |
| Unaffiliated issuers (net of foreign taxes of $2,153) | 273,176,890 | |
| Fidelity Central Funds | (548) | |
| Foreign currency transactions | (53,725) | |
| Total net realized gain (loss) | | 273,122,617 |
| Change in net unrealized appreciation (depreciation) on: | | |
| Investment securities: | | |
| Unaffiliated issuers (net of increase in deferred foreign taxes of $109,675) | 123,323,236 | |
| Assets and liabilities in foreign currencies | (4,051) | |
| Unfunded commitments | (837,905) | |
| Total change in net unrealized appreciation (depreciation) | | 122,481,280 |
| Net gain (loss) | | 395,603,897 |
| Net increase (decrease) in net assets resulting from operations | | $388,936,615 |
See accompanying notes which are an integral part of the financial statements.
Statement of Changes in Net Assets
| | Six months ended June 30, 2021 (Unaudited) | Year ended December 31, 2020 |
| Increase (Decrease) in Net Assets | | |
| Operations | | |
| Net investment income (loss) | $(6,667,282) | $(4,626,867) |
| Net realized gain (loss) | 273,122,617 | 237,350,499 |
| Change in net unrealized appreciation (depreciation) | 122,481,280 | 888,836,913 |
| Net increase (decrease) in net assets resulting from operations | 388,936,615 | 1,121,560,545 |
| Distributions to shareholders | (207,376,676) | (111,120,843) |
| Share transactions - net increase (decrease) | 258,248,559 | 405,543,918 |
| Total increase (decrease) in net assets | 439,808,498 | 1,415,983,620 |
| Net Assets | | |
| Beginning of period | 2,965,159,528 | 1,549,175,908 |
| End of period | $3,404,968,026 | $2,965,159,528 |
See accompanying notes which are an integral part of the financial statements.
Financial Highlights
VIP Growth Opportunities Portfolio Initial Class
| | Six months ended (Unaudited) June 30, | Years endedDecember 31, | | | | |
| | 2021 | 2020 | 2019 | 2018 | 2017 | 2016 |
| Selected Per–Share Data | | | | | | |
| Net asset value, beginning of period | $77.54 | $48.86 | $38.01 | $36.08 | $31.06 | $31.75 |
| Income from Investment Operations | | | | | | |
| Net investment income (loss)A | (.11) | (.06) | .09B | .03 | .13 | .11 |
| Net realized and unrealized gain (loss) | 10.26 | 32.11 | 14.54 | 4.19 | 9.54 | (.10) |
| Total from investment operations | 10.15 | 32.05 | 14.63 | 4.22 | 9.67 | .01 |
| Distributions from net investment income | – | (.01) | (.07) | (.05) | (.10) | (.10) |
| Distributions from net realized gain | (5.32) | (3.36) | (3.71) | (2.24) | (4.54) | (.60) |
| Total distributions | (5.32) | (3.37) | (3.78) | (2.29) | (4.65)C | (.70) |
| Net asset value, end of period | $82.37 | $77.54 | $48.86 | $38.01 | $36.08 | $31.06 |
| Total ReturnD,E,F | 13.28% | 68.66% | 40.84% | 12.46% | 34.47% | .37% |
| Ratios to Average Net AssetsG,H | | | | | | |
| Expenses before reductions | .63%I | .64% | .64% | .65% | .67% | .68% |
| Expenses net of fee waivers, if any | .63%I | .64% | .64% | .65% | .66% | .68% |
| Expenses net of all reductions | .62%I | .63% | .64% | .65% | .66% | .68% |
| Net investment income (loss) | (.29)%I | (.10)% | .20%B | .09% | .40% | .36% |
| Supplemental Data | | | | | | |
| Net assets, end of period (000 omitted) | $515,224 | $470,897 | $284,621 | $187,106 | $167,740 | $133,393 |
| Portfolio turnover rateJ | 82%I | 65% | 49% | 39% | 54% | 65% |
A Calculated based on average shares outstanding during the period.
B Net investment income per share reflects one or more large, non-recurring dividend(s) which amounted to $.07 per share. Excluding such non-recurring dividend(s), the ratio of net investment income (loss) to average net assets would have been .03%.
C Total distributions per share do not sum due to rounding.
D Total returns for periods of less than one year are not annualized.
E Total returns do not reflect charges attributable to your insurance company's separate account. Inclusion of these charges would reduce the total returns shown.
F Total returns would have been lower if certain expenses had not been reduced during the applicable periods shown.
G Fees and expenses of any underlying mutual funds or exchange-traded funds (ETFs) are not included in the Fund's expense ratio. The Fund indirectly bears its proportionate share of these expenses. For additional expense information related to investments in Fidelity Central Funds, please refer to the "Investments in Fidelity Central Funds" note found in the Notes to Financial Statements section of the most recent Annual or Semi-Annual report.
H Expense ratios reflect operating expenses of the class. Expenses before reductions do not reflect amounts reimbursed, waived, or reduced through arrangements with the investment adviser, brokerage services, or other offset arrangements, if applicable, and do not represent the amount paid by the class during periods when reimbursements, waivers or reductions occur.
I Annualized
J Amount does not include the portfolio activity of any underlying mutual funds or exchange-traded funds (ETFs).
See accompanying notes which are an integral part of the financial statements.
VIP Growth Opportunities Portfolio Service Class
| | Six months ended (Unaudited) June 30, | Years endedDecember 31, | | | | |
| | 2021 | 2020 | 2019 | 2018 | 2017 | 2016 |
| Selected Per–Share Data | | | | | | |
| Net asset value, beginning of period | $77.37 | $48.77 | $37.95 | $36.02 | $31.01 | $31.70 |
| Income from Investment Operations | | | | | | |
| Net investment income (loss)A | (.15) | (.12) | .04B | –C | .10 | .08 |
| Net realized and unrealized gain (loss) | 10.24 | 32.04 | 14.52 | 4.17 | 9.52 | (.09) |
| Total from investment operations | 10.09 | 31.92 | 14.56 | 4.17 | 9.62 | (.01) |
| Distributions from net investment income | – | –C | (.02) | (.04) | (.07) | (.07) |
| Distributions from net realized gain | (5.31) | (3.31) | (3.71) | (2.20) | (4.54) | (.60) |
| Total distributions | (5.31) | (3.32)D | (3.74)D | (2.24) | (4.61) | (.68)D |
| Net asset value, end of period | $82.15 | $77.37 | $48.77 | $37.95 | $36.02 | $31.01 |
| Total ReturnE,F,G | 13.23% | 68.49% | 40.70% | 12.35% | 34.36% | .28% |
| Ratios to Average Net AssetsH,I | | | | | | |
| Expenses before reductions | .73%J | .74% | .74% | .75% | .77% | .78% |
| Expenses net of fee waivers, if any | .73%J | .74% | .74% | .75% | .76% | .78% |
| Expenses net of all reductions | .72%J | .73% | .74% | .75% | .76% | .78% |
| Net investment income (loss) | (.39)%J | (.20)% | .10%B | (.01)% | .30% | .26% |
| Supplemental Data | | | | | | |
| Net assets, end of period (000 omitted) | $167,065 | $163,452 | $111,145 | $94,561 | $102,730 | $92,664 |
| Portfolio turnover rateK | 82%J | 65% | 49% | 39% | 54% | 65% |
A Calculated based on average shares outstanding during the period.
B Net investment income per share reflects one or more large, non-recurring dividend(s) which amounted to $.07 per share. Excluding such non-recurring dividend(s), the ratio of net investment income (loss) to average net assets would have been (.07) %.
C Amount represents less than $.005 per share.
D Total distributions per share do not sum due to rounding.
E Total returns for periods of less than one year are not annualized.
F Total returns do not reflect charges attributable to your insurance company's separate account. Inclusion of these charges would reduce the total returns shown.
G Total returns would have been lower if certain expenses had not been reduced during the applicable periods shown.
H Fees and expenses of any underlying mutual funds or exchange-traded funds (ETFs) are not included in the Fund's expense ratio. The Fund indirectly bears its proportionate share of these expenses. For additional expense information related to investments in Fidelity Central Funds, please refer to the "Investments in Fidelity Central Funds" note found in the Notes to Financial Statements section of the most recent Annual or Semi-Annual report.
I Expense ratios reflect operating expenses of the class. Expenses before reductions do not reflect amounts reimbursed, waived, or reduced through arrangements with the investment adviser, brokerage services, or other offset arrangements, if applicable, and do not represent the amount paid by the class during periods when reimbursements, waivers or reductions occur.
J Annualized
K Amount does not include the portfolio activity of any underlying mutual funds or exchange-traded funds (ETFs).
See accompanying notes which are an integral part of the financial statements.
VIP Growth Opportunities Portfolio Service Class 2
| | Six months ended (Unaudited) June 30, | Years endedDecember 31, | | | | |
| | 2021 | 2020 | 2019 | 2018 | 2017 | 2016 |
| Selected Per–Share Data | | | | | | |
| Net asset value, beginning of period | $76.08 | $48.05 | $37.46 | $35.60 | $30.71 | $31.40 |
| Income from Investment Operations | | | | | | |
| Net investment income (loss)A | (.20) | (.20) | (.02)B | (.06) | .05 | .03 |
| Net realized and unrealized gain (loss) | 10.06 | 31.50 | 14.31 | 4.13 | 9.42 | (.10) |
| Total from investment operations | 9.86 | 31.30 | 14.29 | 4.07 | 9.47 | (.07) |
| Distributions from net investment income | – | – | – | (.03) | (.04) | (.02) |
| Distributions from net realized gain | (5.29) | (3.27) | (3.70) | (2.17) | (4.54) | (.60) |
| Total distributions | (5.29) | (3.27) | (3.70) | (2.21)C | (4.58) | (.62) |
| Net asset value, end of period | $80.65 | $76.08 | $48.05 | $37.46 | $35.60 | $30.71 |
| Total ReturnD,E,F | 13.15% | 68.21% | 40.49% | 12.18% | 34.17% | .10% |
| Ratios to Average Net AssetsG,H | | | | | | |
| Expenses before reductions | .88%I | .88% | .89% | .90% | .91% | .93% |
| Expenses net of fee waivers, if any | .88%I | .88% | .89% | .90% | .91% | .93% |
| Expenses net of all reductions | .87%I | .88% | .89% | .90% | .91% | .93% |
| Net investment income (loss) | (.54)%I | (.35)% | (.05)%B | (.16)% | .15% | .11% |
| Supplemental Data | | | | | | |
| Net assets, end of period (000 omitted) | $1,323,971 | $1,079,778 | $505,917 | $273,228 | $193,945 | $117,623 |
| Portfolio turnover rateJ | 82%I | 65% | 49% | 39% | 54% | 65% |
A Calculated based on average shares outstanding during the period.
B Net investment income per share reflects one or more large, non-recurring dividend(s) which amounted to $.07 per share. Excluding such non-recurring dividend(s), the ratio of net investment income (loss) to average net assets would have been (.22) %.
C Total distributions per share do not sum due to rounding.
D Total returns for periods of less than one year are not annualized.
E Total returns do not reflect charges attributable to your insurance company's separate account. Inclusion of these charges would reduce the total returns shown.
F Total returns would have been lower if certain expenses had not been reduced during the applicable periods shown.
G Fees and expenses of any underlying mutual funds or exchange-traded funds (ETFs) are not included in the Fund's expense ratio. The Fund indirectly bears its proportionate share of these expenses. For additional expense information related to investments in Fidelity Central Funds, please refer to the "Investments in Fidelity Central Funds" note found in the Notes to Financial Statements section of the most recent Annual or Semi-Annual report.
H Expense ratios reflect operating expenses of the class. Expenses before reductions do not reflect amounts reimbursed, waived, or reduced through arrangements with the investment adviser, brokerage services, or other offset arrangements, if applicable, and do not represent the amount paid by the class during periods when reimbursements, waivers or reductions occur.
I Annualized
J Amount does not include the portfolio activity of any underlying mutual funds or exchange-traded funds (ETFs).
See accompanying notes which are an integral part of the financial statements.
VIP Growth Opportunities Portfolio Investor Class
| | Six months ended (Unaudited) June 30, | Years endedDecember 31, | | | | |
| | 2021 | 2020 | 2019 | 2018 | 2017 | 2016 |
| Selected Per–Share Data | | | | | | |
| Net asset value, beginning of period | $76.94 | $48.52 | $37.78 | $35.88 | $30.91 | $31.60 |
| Income from Investment Operations | | | | | | |
| Net investment income (loss)A | (.14) | (.10) | .05B | –C | .10 | .08 |
| Net realized and unrealized gain (loss) | 10.18 | 31.86 | 14.44 | 4.16 | 9.49 | (.09) |
| Total from investment operations | 10.04 | 31.76 | 14.49 | 4.16 | 9.59 | (.01) |
| Distributions from net investment income | – | (.01) | (.04) | (.04) | (.08) | (.07) |
| Distributions from net realized gain | (5.31) | (3.33) | (3.71) | (2.22) | (4.54) | (.60) |
| Total distributions | (5.31) | (3.34) | (3.75) | (2.26) | (4.62) | (.68)D |
| Net asset value, end of period | $81.67 | $76.94 | $48.52 | $37.78 | $35.88 | $30.91 |
| Total ReturnE,F,G | 13.24% | 68.52% | 40.71% | 12.37% | 34.38% | .28% |
| Ratios to Average Net AssetsH,I | | | | | | |
| Expenses before reductions | .70%J | .71% | .72% | .73% | .75% | .76% |
| Expenses net of fee waivers, if any | .70%J | .71% | .72% | .73% | .75% | .76% |
| Expenses net of all reductions | .70%J | .71% | .72% | .73% | .74% | .76% |
| Net investment income (loss) | (.36)%J | (.18)% | .12%B | .01% | .32% | .28% |
| Supplemental Data | | | | | | |
| Net assets, end of period (000 omitted) | $1,398,707 | $1,251,032 | $647,493 | $347,473 | $243,040 | $175,086 |
| Portfolio turnover rateK | 82%J | 65% | 49% | 39% | 54% | 65% |
A Calculated based on average shares outstanding during the period.
B Net investment income per share reflects one or more large, non-recurring dividend(s) which amounted to $.07 per share. Excluding such non-recurring dividend(s), the ratio of net investment income (loss) to average net assets would have been (.05) %.
C Amount represents less than $.005 per share.
D Total distributions per share do not sum due to rounding.
E Total returns for periods of less than one year are not annualized.
F Total returns do not reflect charges attributable to your insurance company's separate account. Inclusion of these charges would reduce the total returns shown.
G Total returns would have been lower if certain expenses had not been reduced during the applicable periods shown.
H Fees and expenses of any underlying mutual funds or exchange-traded funds (ETFs) are not included in the Fund's expense ratio. The Fund indirectly bears its proportionate share of these expenses. For additional expense information related to investments in Fidelity Central Funds, please refer to the "Investments in Fidelity Central Funds" note found in the Notes to Financial Statements section of the most recent Annual or Semi-Annual report.
I Expense ratios reflect operating expenses of the class. Expenses before reductions do not reflect amounts reimbursed, waived, or reduced through arrangements with the investment adviser, brokerage services, or other offset arrangements, if applicable, and do not represent the amount paid by the class during periods when reimbursements, waivers or reductions occur.
J Annualized
K Amount does not include the portfolio activity of any underlying mutual funds or exchange-traded funds (ETFs).
See accompanying notes which are an integral part of the financial statements.
Notes to Financial Statements (Unaudited)
For the period ended June 30, 2021
1. Organization.
VIP Growth Opportunities Portfolio (the Fund) is a fund of Variable Insurance Products Fund III (the Trust) and is authorized to issue an unlimited number of shares. The Trust is registered under the Investment Company Act of 1940, as amended (the 1940 Act), as an open-end management investment company organized as a Massachusetts business trust. Shares of the Fund may only be purchased by insurance companies for the purpose of funding variable annuity or variable life insurance contracts. The Fund offers the following classes of shares: Initial Class shares, Service Class shares, Service Class 2 shares and Investor Class shares. All classes have equal rights and voting privileges, except for matters affecting a single class.
2. Investments in Fidelity Central Funds.
Funds may invest in Fidelity Central Funds, which are open-end investment companies generally available only to other investment companies and accounts managed by the investment adviser and its affiliates. The Schedule of Investments lists any Fidelity Central Funds held as an investment as of period end, but does not include the underlying holdings of each Fidelity Central Fund. An investing fund indirectly bears its proportionate share of the expenses of the underlying Fidelity Central Funds.
Based on its investment objective, each Fidelity Central Fund may invest or participate in various investment vehicles or strategies that are similar to those of the investing fund. These strategies are consistent with the investment objectives of the investing fund and may involve certain economic risks which may cause a decline in value of each of the Fidelity Central Funds and thus a decline in the value of the investing fund.
| Fidelity Central Fund | Investment Manager | Investment Objective | Investment Practices | Expense Ratio(a) |
| Fidelity Money Market Central Funds | Fidelity Management & Research Company LLC (FMR) | Each fund seeks to obtain a high level of current income consistent with the preservation of capital and liquidity. | Short-term Investments | Less than .005% to .01% |
(a) Expenses expressed as a percentage of average net assets and are as of each underlying Central Fund's most recent annual or semi-annual shareholder report.
A complete unaudited list of holdings for each Fidelity Central Fund is available upon request or at the Securities and Exchange Commission website at www.sec.gov. In addition, the financial statements of the Fidelity Central Funds which contain the significant accounting policies (including investment valuation policies) of those funds, and are not covered by the Report of Independent Registered Public Accounting Firm, are available on the Securities and Exchange Commission website or upon request.
3. Significant Accounting Policies.
The Fund is an investment company and applies the accounting and reporting guidance of the Financial Accounting Standards Board (FASB) Accounting Standards Codification Topic 946 Financial Services - Investment Companies. The financial statements have been prepared in conformity with accounting principles generally accepted in the United States of America (GAAP), which require management to make certain estimates and assumptions at the date of the financial statements. Actual results could differ from those estimates. Subsequent events, if any, through the date that the financial statements were issued have been evaluated in the preparation of the financial statements. The Fund's Schedule of Investments lists any underlying mutual funds or exchange-traded funds (ETFs) but does not include the underlying holdings of these funds. The following summarizes the significant accounting policies of the Fund:
Investment Valuation. Investments are valued as of 4:00 p.m. Eastern time on the last calendar day of the period. The Board of Trustees (the Board) has delegated the day to day responsibility for the valuation of the Fund's investments to the Fair Value Committee (the Committee) established by the Fund's investment adviser. In accordance with valuation policies and procedures approved by the Board, the Fund attempts to obtain prices from one or more third party pricing vendors or brokers to value its investments. When current market prices, quotations or currency exchange rates are not readily available or reliable, investments will be fair valued in good faith by the Committee, in accordance with procedures adopted by the Board. Factors used in determining fair value vary by investment type and may include market or investment specific events, changes in interest rates and credit quality. The frequency with which these procedures are used cannot be predicted and they may be utilized to a significant extent. The Committee oversees the Fund's valuation policies and procedures and reports to the Board on the Committee's activities and fair value determinations. The Board monitors the appropriateness of the procedures used in valuing the Fund's investments and ratifies the fair value determinations of the Committee.
The Fund categorizes the inputs to valuation techniques used to value its investments into a disclosure hierarchy consisting of three levels as shown below:
- Level 1 – quoted prices in active markets for identical investments
- Level 2 – other significant observable inputs (including quoted prices for similar investments, interest rates, prepayment speeds, etc.)
- Level 3 – unobservable inputs (including the Fund's own assumptions based on the best information available)
Valuation techniques used to value the Fund's investments by major category are as follows:
Equity securities, including restricted securities, for which market quotations are readily available, are valued at the last reported sale price or official closing price as reported by a third party pricing vendor on the primary market or exchange on which they are traded and are categorized as Level 1 in the hierarchy. In the event there were no sales during the day or closing prices are not available, securities are valued at the last quoted bid price or may be valued using the last available price and are generally categorized as Level 2 in the hierarchy. For foreign equity securities, when market or security specific events arise, comparisons to the valuation of American Depositary Receipts (ADRs), futures contracts, Exchange-Traded Funds (ETFs) and certain indexes as well as quoted prices for similar securities may be used and would be categorized as Level 2 in the hierarchy. For equity securities, including restricted securities, where observable inputs are limited, assumptions about market activity and risk are used and these securities may be categorized as Level 3 in the hierarchy. Securities, including private placements or other restricted securities, for which observable inputs are not available are valued using alternate valuation approaches, including the market approach, the income approach and cost approach, and are categorized as Level 3 in the hierarchy. The market approach considers factors including the price of recent investments in the same or a similar security or financial metrics of comparable securities. The income approach considers factors including expected future cash flows, security specific risks and corresponding discount rates. The cost approach considers factors including the value of the security's underlying assets and liabilities.
Debt securities, including restricted securities, are valued based on evaluated prices received from third party pricing vendors or from brokers who make markets in such securities. Corporate bonds and preferred securities are valued by pricing vendors who utilize matrix pricing which considers yield or price of bonds of comparable quality, coupon, maturity and type or by broker-supplied prices. When independent prices are unavailable or unreliable, debt securities may be valued utilizing pricing methodologies which consider similar factors that would be used by third party pricing vendors. Debt securities are generally categorized as Level 2 in the hierarchy but may be Level 3 depending on the circumstances.
Investments in open-end mutual funds, including the Fidelity Central Funds, are valued at their closing net asset value (NAV) each business day and are categorized as Level 1 in the hierarchy.
The following provides information on Level 3 securities held by the Fund that were valued at period end based on unobservable inputs. These amounts exclude valuations provided by a broker.
| Asset Type | Fair Value | Valuation Technique(s) | Unobservable Input | Amount or Range/Weighted Average | Impact to Valuation from an Increase in Input(a) |
| Equities | $ 91,220,033 | Market comparable | Enterprise value/Sales multiple | 1.0 – 6.2/4.7 | Increase |
| | | | Discount rate | 32.5% - 85.7% / 52.0% | Decrease |
| | | | Premium rate | 7.8% | Increase |
| | | | Discount for lack of marketability | 10.0% | Decrease |
| | | Market approach | Transaction price | $0.00 - $885.00 / $203.24 | Increase |
| Corporate Bonds | $166,300 | Market approach | Transaction price | $100.00 | Increase |
| Preferred Securities | $4,245,519 | Market approach | Transaction price | $100.00 | Increase |
(a) Represents the directional change in the fair value of the Level 3 investments that could have resulted from an increase in the corresponding input as of period end. A decrease to the unobservable input would have had the opposite effect. Significant changes in these inputs may have resulted in a significantly higher or lower fair value measurement at period end.
Changes in valuation techniques may result in transfers in or out of an assigned level within the disclosure hierarchy. The aggregate value of investments by input level as of June 30, 2021, as well as a roll forward of Level 3 investments, is included at the end of the Fund's Schedule of Investments.
Foreign Currency. Certain Funds may use foreign currency contracts to facilitate transactions in foreign-denominated securities. Gains and losses from these transactions may arise from changes in the value of the foreign currency or if the counterparties do not perform under the contracts' terms.
Foreign-denominated assets, including investment securities, and liabilities are translated into U.S. dollars at the exchange rates at period end. Purchases and sales of investment securities, income and dividends received, and expenses denominated in foreign currencies are translated into U.S. dollars at the exchange rate in effect on the transaction date.
The effects of exchange rate fluctuations on investments are included with the net realized and unrealized gain (loss) on investment securities. Other foreign currency transactions resulting in realized and unrealized gain (loss) are disclosed separately.
Investment Transactions and Income. For financial reporting purposes, the Fund's investment holdings and NAV include trades executed through the end of the last business day of the period. The NAV per share for processing shareholder transactions is calculated as of the close of business of the New York Stock Exchange (NYSE), normally 4:00 p.m. Eastern time and includes trades executed through the end of the prior business day. Gains and losses on securities sold are determined on the basis of identified cost and include proceeds received from litigation. Dividend income is recorded on the ex-dividend date, except for certain dividends from foreign securities where the ex-dividend date may have passed, which are recorded as soon as the Fund is informed of the ex-dividend date. Non-cash dividends included in dividend income, if any, are recorded at the fair market value of the securities received. Income and capital gain distributions from Fidelity Central Funds, if any, are recorded on the ex-dividend date. Certain distributions received by the Fund represent a return of capital or capital gain. The Fund determines the components of these distributions subsequent to the ex-dividend date, based upon receipt of tax filings or other correspondence relating to the underlying investment. These distributions are recorded as a reduction of cost of investments and/or as a realized gain. Interest income is accrued as earned and includes coupon interest and amortization of premium and accretion of discount on debt securities as applicable. Investment income is recorded net of foreign taxes withheld where recovery of such taxes is uncertain.
Class Allocations and Expenses. Investment income, realized and unrealized capital gains and losses, common expenses of a fund, and certain fund-level expense reductions, if any, are allocated daily on a pro-rata basis to each class based on the relative net assets of each class to the total net assets of a fund. Each class differs with respect to transfer agent and distribution and service plan fees incurred, as applicable. Certain expense reductions may also differ by class, if applicable. For the reporting period, the allocated portion of income and expenses to each class as a percent of its average net assets may vary due to the timing of recording these transactions in relation to fluctuating net assets of the classes. Expenses directly attributable to a fund are charged to that fund. Expenses attributable to more than one fund are allocated among the respective funds on the basis of relative net assets or other appropriate methods. Expenses included in the accompanying financial statements reflect the expenses of that fund and do not include any expenses associated with any underlying mutual funds or exchange-traded funds. Although not included in a fund's expenses, a fund indirectly bears its proportionate share of these expenses through the net asset value of each underlying mutual fund or exchange-traded fund. Expense estimates are accrued in the period to which they relate and adjustments are made when actual amounts are known.
Income Tax Information and Distributions to Shareholders. Each year, the Fund intends to qualify as a regulated investment company under Subchapter M of the Internal Revenue Code, including distributing substantially all of its taxable income and realized gains. As a result, no provision for U.S. Federal income taxes is required. The Fund files a U.S. federal tax return, in addition to state and local tax returns as required. The Fund's federal income tax returns are subject to examination by the Internal Revenue Service (IRS) for a period of three fiscal years after they are filed. State and local tax returns may be subject to examination for an additional fiscal year depending on the jurisdiction. Foreign taxes are provided for based on the Fund's understanding of the tax rules and rates that exist in the foreign markets in which it invests. The Fund is subject to a tax imposed on capital gains by certain countries in which it invests. An estimated deferred tax liability for net unrealized appreciation on the applicable securities is included in Other payables and accrued expenses on the Statement of Assets & Liabilities.
Distributions are declared and recorded on the ex-dividend date. Income and capital gain distributions are declared separately for each class. Income and capital gain distributions are determined in accordance with income tax regulations, which may differ from GAAP.
Capital accounts within the financial statements are adjusted for permanent book-tax differences. These adjustments have no impact on net assets or the results of operations. Capital accounts are not adjusted for temporary book-tax differences which will reverse in a subsequent period.
Book-tax differences are primarily due to foreign currency transactions, passive foreign investment companies (PFIC), net operating losses, certain foreign taxes and losses deferred due to wash sales and excise tax regulations.
As of period end, the cost and unrealized appreciation (depreciation) in securities, and derivatives if applicable, for federal income tax purposes were as follows:
| Gross unrealized appreciation | $1,642,597,388 |
| Gross unrealized depreciation | (53,159,115) |
| Net unrealized appreciation (depreciation) | $1,589,438,273 |
| Tax cost | $1,922,168,463 |
Delayed Delivery Transactions and When-Issued Securities. During the period, certain Funds transacted in securities on a delayed delivery or when-issued basis. Payment and delivery may take place after the customary settlement period for that security. The price of the underlying securities and the date when the securities will be delivered and paid for are fixed at the time the transaction is negotiated. Securities purchased on a delayed delivery or when-issued basis are identified as such in the Schedule of Investments. Compensation for interest forgone in the purchase of a delayed delivery or when-issued debt security may be received. With respect to purchase commitments, each applicable Fund identifies securities as segregated in its records with a value at least equal to the amount of the commitment. Payables and receivables associated with the purchases and sales of delayed delivery securities having the same coupon, settlement date and broker are offset. Delayed delivery or when-issued securities that have been purchased from and sold to different brokers are reflected as both payables and receivables in the Statement of Assets and Liabilities under the caption "Delayed delivery", as applicable. Losses may arise due to changes in the value of the underlying securities or if the counterparty does not perform under the contract's terms, or if the issuer does not issue the securities due to political, economic, or other factors.
Restricted Securities (including Private Placements). Funds may invest in securities that are subject to legal or contractual restrictions on resale. These securities generally may be resold in transactions exempt from registration or to the public if the securities are registered. Disposal of these securities may involve time-consuming negotiations and expense, and prompt sale at an acceptable price may be difficult. Information regarding restricted securities held at period end is included at the end of the Schedule of Investments, if applicable.
Special Purpose Acquisition Companies. Funds may invest in stock, warrants, and other securities of special purpose acquisition companies (SPACs) or similar special purpose entities. A SPAC is a publicly traded company that raises investment capital via an initial public offering (IPO) for the purpose of acquiring the equity securities of one or more existing companies via merger, business combination, acquisition or other similar transactions within a designated time frame.
Private Investment in Public Equity. Funds may acquire equity securities of an issuer through a private investment in a public equity (PIPE) transaction, including through commitments to purchase securities on a when-issued basis. A PIPE typically involves the purchase of securities directly from a publicly traded company in a private placement transaction. Securities purchased through PIPE transactions will be restricted from trading and considered illiquid until a resale registration statement for the shares is filed and declared effective.
At period end, the Fund had commitments to purchase when-issued securities through PIPE transactions with SPACs. The commitments are contingent upon the SPACs acquiring the securities of target companies. Unrealized appreciation (depreciation) on these commitments is separately presented in the Statements of Assets and Liabilities as Unrealized appreciation (depreciation) on unfunded commitments, and in the Statement of Operations as Change in unrealized appreciation (depreciation) on unfunded commitments.
4. Purchases and Sales of Investments.
Purchases and sales of securities, other than short-term securities and in-kind transactions, as applicable, are noted in the table below.
| | Purchases ($) | Sales ($) |
| VIP Growth Opportunities Portfolio | 1,356,886,541 | 1,301,791,610 |
5. Fees and Other Transactions with Affiliates.
Management Fee. Fidelity Management & Research Company LLC (the investment adviser) and its affiliates provide the Fund with investment management related services for which the Fund pays a monthly management fee. The management fee is the sum of an individual fund fee rate that is based on an annual rate of .30% of the Fund's average net assets and an annualized group fee rate that averaged .23% during the period. The group fee rate is based upon the monthly average net assets of a group of registered investment companies with which the investment adviser has management contracts. The group fee rate decreases as assets under management increase and increases as assets under management decrease. For the reporting period, the total annualized management fee rate was .53% of the Fund's average net assets.
Distribution and Service Plan Fees. In accordance with Rule 12b-1 of the 1940 Act, the Fund has adopted separate 12b-1 Plans for each Service Class of shares. Each Service Class pays Fidelity Distributors Company LLC (FDC), an affiliate of the investment adviser, a service fee. For the period, the service fee is based on an annual rate of .10% of Service Class' average net assets and .25% of Service Class 2's average net assets.
For the period, total fees, all of which were re-allowed to insurance companies for the distribution of shares and providing shareholder support services, were as follows:
| Service Class | $81,929 |
| Service Class 2 | 1,486,424 |
| | $1,568,353 |
Transfer Agent Fees. Fidelity Investments Institutional Operations Company LLC (FIIOC), an affiliate of the investment adviser, is the Fund's transfer, dividend disbursing, and shareholder servicing agent. FIIOC receives an asset-based fee with respect to each class. Each class pays a fee for transfer agent services, typesetting and printing and mailing of shareholder reports, excluding mailing of proxy statements. For the period, transfer agent fees for each class were as follows:
| | Amount | % of Class-Level Average Net Assets(a) |
| Initial Class | $157,340 | .06 |
| Service Class | 52,060 | .06 |
| Service Class 2 | 378,048 | .06 |
| Investor Class | 936,918 | .14 |
| | $1,524,366 | |
(a) Annualized
Accounting Fees. Fidelity Service Company, Inc. (FSC), an affiliate of the investment adviser, maintains the Fund's accounting records. The accounting fee is based on the level of average net assets for each month. For the period, the fees were equivalent to the following annualized rates:
| | % of Average Net Assets |
| VIP Growth Opportunities Portfolio | .03 |
Brokerage Commissions. A portion of portfolio transactions were placed with brokerage firms which are affiliates of the investment adviser. Brokerage commissions are included in net realized gain (loss) and change in net unrealized appreciation (depreciation) in the Statement of Operations. The commissions paid to these affiliated firms were as follows:
| | Amount |
| VIP Growth Opportunities Portfolio | $20,797 |
Interfund Lending Program. Pursuant to an Exemptive Order issued by the Securities and Exchange Commission (the SEC), the Fund, along with other registered investment companies having management contracts with Fidelity Management & Research Company LLC (FMR), or other affiliated entities of FMR, may participate in an interfund lending program. This program provides an alternative credit facility allowing the Fund to borrow from, or lend money to, other participating affiliated funds. At period end, there were no interfund loans outstanding. Activity in this program during the period for which loans were outstanding was as follows:
| | Borrower or Lender | Average Loan Balance | Weighted Average Interest Rate | Interest Expense |
| VIP Growth Opportunities Portfolio | Borrower | $7,392,054 | .29% | $4,393 |
Interfund Trades. Funds may purchase from or sell securities to other Fidelity Funds under procedures adopted by the Board. The procedures have been designed to ensure these interfund trades are executed in accordance with Rule 17a-7 of the 1940 Act. Any interfund trades are included within the respective purchases and sales amounts shown in the Purchases and Sales of Investments note and are noted in the table below.
| | Purchases ($) | Sales ($) |
| VIP Growth Opportunities Portfolio | 137,625,303 | 61,402,338 |
6. Committed Line of Credit.
Certain Funds participate with other funds managed by the investment adviser or an affiliate in a $4.25 billion credit facility (the "line of credit") to be utilized for temporary or emergency purposes to fund shareholder redemptions or for other short-term liquidity purposes. The participating funds have agreed to pay commitment fees on their pro-rata portion of the line of credit, which are reflected in Miscellaneous expenses on the Statement of Operations, and are listed below. During the period, there were no borrowings on this line of credit.
| | Amount |
| VIP Growth Opportunities Portfolio | $2,932 |
7. Security Lending.
Funds lend portfolio securities from time to time in order to earn additional income. Lending agents are used, including National Financial Services (NFS), an affiliate of the investment adviser. Pursuant to a securities lending agreement, NFS will receive a fee, which is capped at 9.9% of a fund's daily lending revenue, for its services as lending agent. A fund may lend securities to certain qualified borrowers, including NFS. On the settlement date of the loan, a fund receives collateral (in the form of U.S. Treasury obligations, letters of credit and/or cash) against the loaned securities and maintains collateral in an amount not less than 100% of the market value of the loaned securities during the period of the loan. The market value of the loaned securities is determined at the close of business of a fund and any additional required collateral is delivered to a fund on the next business day. A fund or borrower may terminate the loan at any time, and if the borrower defaults on its obligation to return the securities loaned because of insolvency or other reasons, a fund may apply collateral received from the borrower against the obligation. A fund may experience delays and costs in recovering the securities loaned. Any cash collateral received is invested in the Fidelity Securities Lending Cash Central Fund. Any loaned securities are identified as such in the Schedule of Investments, and the value of loaned securities and cash collateral at period end, as applicable, are presented in the Statement of Assets and Liabilities. Security lending income represents the income earned on investing cash collateral, less rebates paid to borrowers and any lending agent fees associated with the loan, plus any premium payments received for lending certain types of securities. Security lending income is presented in the Statement of Operations as a component of income from Fidelity Central Funds. Affiliated security lending activity, if any, was as follows:
| | Total Security Lending Fees Paid to NFS | Security Lending Income From Securities Loaned to NFS | Value of Securities Loaned to NFS at Period End |
| VIP Growth Opportunities Portfolio | $25,954 | $953 | $– |
8. Bank Borrowings.
The Fund is permitted to have bank borrowings for temporary or emergency purposes to fund shareholder redemptions or for other short-term liquidity requirements. The Fund has established borrowing arrangements with certain banks. The interest rate on the borrowings is the bank's base rate, as revised from time to time. Any open loans, including accrued interest, at period end are presented under the caption "Notes payable" in the Statement of Assets and Liabilities, if applicable. Activity in this program during the period for which loans were outstanding was as follows:
| | Average Loan Balance | Weighted Average Interest Rate | Interest Expense |
| VIP Growth Opportunities Portfolio | $7,339,000 | .56% | $114 |
9. Expense Reductions.
Commissions paid to certain brokers with whom the investment adviser, or its affiliates, places trades on behalf of the Fund include an amount in addition to trade execution, which may be rebated back to the Fund to offset expenses. This amount totaled $78,741 for the period.
In addition, during the period the investment adviser or an affiliate reimbursed and/or waived a portion of fund-level operating expenses in the amount of $4,313.
10. Distributions to Shareholders.
Distributions to shareholders of each class were as follows:
| | Six months ended
June 30, 2021 | Year ended
December 31, 2020 |
| VIP Growth Opportunities Portfolio | | |
| Distributions to shareholders | | |
| Initial Class | $32,319,327 | $19,773,811 |
| Service Class | 11,021,394 | 7,324,810 |
| Service Class 2 | 75,536,784 | 37,307,036 |
| Investor Class | 88,499,171 | 46,715,186 |
| Total | $207,376,676 | $111,120,843 |
11. Share Transactions.
Transactions for each class of shares were as follows and may contain in-kind transactions:
| | Shares | Shares | Dollars | Dollars |
| | Six months ended June 30, 2021 | Year ended December 31, 2020 | Six months ended June 30, 2021 | Year ended December 31, 2020 |
| VIP Growth Opportunities Portfolio | | | | |
| Initial Class | | | | |
| Shares sold | 525,162 | 1,516,142 | $41,423,339 | $87,925,044 |
| Reinvestment of distributions | 403,437 | 364,216 | 32,319,327 | 19,773,811 |
| Shares redeemed | (746,833) | (1,632,375) | (57,080,563) | (90,133,836) |
| Net increase (decrease) | 181,766 | 247,983 | $16,662,103 | $17,565,019 |
| Service Class | | | | |
| Shares sold | 83,990 | 282,747 | $6,629,832 | $16,690,237 |
| Reinvestment of distributions | 137,905 | 136,262 | 11,021,394 | 7,324,810 |
| Shares redeemed | (300,882) | (585,221) | (23,329,095) | (33,790,015) |
| Net increase (decrease) | (78,987) | (166,212) | $(5,677,869) | $(9,774,968) |
| Service Class 2 | | | | |
| Shares sold | 2,877,222 | 6,862,279 | $218,907,542 | $388,339,876 |
| Reinvestment of distributions | 962,007 | 693,564 | 75,536,784 | 37,307,036 |
| Shares redeemed | (1,615,482) | (3,893,717) | (123,757,963) | (214,231,200) |
| Net increase (decrease) | 2,223,747 | 3,662,126 | $170,686,363 | $211,415,712 |
| Investor Class | | | | |
| Shares sold | 1,400,035 | 4,772,661 | $110,645,015 | $277,337,414 |
| Reinvestment of distributions | 1,113,898 | 861,285 | 88,499,171 | 46,715,186 |
| Shares redeemed | (1,647,534) | (2,718,915) | (122,566,224) | (137,714,445) |
| Net increase (decrease) | 866,399 | 2,915,031 | $76,577,962 | $186,338,155 |
12. Other.
Fund's organizational documents provide former and current trustees and officers with a limited indemnification against liabilities arising in connection with the performance of their duties to the fund. In the normal course of business, the fund may also enter into contracts that provide general indemnifications. The fund's maximum exposure under these arrangements is unknown as this would be dependent on future claims that may be made against the fund. The risk of material loss from such claims is considered remote.
At the end of the period, the investment adviser or its affiliates were owners of record of more than 10% and certain otherwise unaffiliated shareholders were owners of record of more than 10% of the outstanding shares as follows:
| Fund | Affiliated % | Number of
Unaffiliated Shareholders | Unaffiliated Shareholders % |
| VIP: Growth Opportunities Portfolio | 50% | 1 | 29% |
13. Coronavirus (COVID-19) Pandemic.
An outbreak of COVID-19 first detected in China during December 2019 has since spread globally and was declared a pandemic by the World Health Organization during March 2020. Developments that disrupt global economies and financial markets, such as the COVID-19 pandemic, may magnify factors that affect the Fund's performance.
Shareholder Expense Example
As a shareholder, you incur two types of costs: (1) transaction costs, which may include sales charges (loads) on purchase payments or redemption proceeds, as applicable and (2) ongoing costs, which generally include management fees, distribution and/or service (12b-1) fees and other Fund expenses. This Example is intended to help you understand your ongoing costs (in dollars) of investing in a fund and to compare these costs with the ongoing costs of investing in other mutual funds.
The Example is based on an investment of $1,000 invested at the beginning of the period and held for the entire period (January 1, 2021 to June 30, 2021).
Actual Expenses
The first line of the accompanying table provides information about actual account values and actual expenses. You may use the information in this line, together with the amount you invested, to estimate the expenses that you paid over the period. Simply divide your account value by $1,000.00 (for example, an $8,600 account value divided by $1,000.00 = 8.6), then multiply the result by the number in the first line for a class/Fund under the heading entitled "Expenses Paid During Period" to estimate the expenses you paid on your account during this period. If any fund is a shareholder of any underlying mutual funds or exchange-traded funds (ETFs) (the Underlying Funds), such fund indirectly bears its proportional share of the expenses of the Underlying Funds in addition to the direct expenses incurred presented in the table. These fees and expenses are not included in the annualized expense ratio used to calculate the expense estimate in the table below. The estimate of expenses does not include any fees or other expenses of any variable annuity or variable life insurance product. If they were, the estimate of expenses you paid during the period would be higher, and your ending account value would be lower.
Hypothetical Example for Comparison Purposes
The second line of the accompanying table provides information about hypothetical account values and hypothetical expenses based on the actual expense ratio and an assumed rate of return of 5% per year before expenses, which is not the actual return. The hypothetical account values and expenses may not be used to estimate the actual ending account balance or expenses you paid for the period. You may use this information to compare the ongoing costs of investing in the Fund and other funds. To do so, compare this 5% hypothetical example with the 5% hypothetical examples that appear in the shareholder reports of the other funds. If any fund is a shareholder of any Underlying Funds, such fund indirectly bears its proportional share of the expenses of the Underlying Funds in addition to the direct expenses as presented in the table. These fees and expenses are not included in the annualized expense ratio used to calculate the expense estimate in the table below. The estimate of expenses does not include any fees or other expenses of any variable annuity or variable life insurance product. If they were, the estimate of expenses you paid during the period would be higher, and your ending account value would be lower.
Please note that the expenses shown in the table are meant to highlight your ongoing costs only and do not reflect any transaction costs. Therefore, the second line of the table is useful in comparing ongoing costs only, and will not help you determine the relative total costs of owning different funds.
| | Annualized Expense Ratio-A | Beginning
Account Value
January 1, 2021 | Ending
Account Value
June 30, 2021 | Expenses Paid
During Period-B
January 1, 2021
to June 30, 2021 |
| VIP Growth Opportunities Portfolio | | | | |
| Initial Class | .63% | | | |
| Actual | | $1,000.00 | $1,132.80 | $3.33 |
| Hypothetical-C | | $1,000.00 | $1,021.67 | $3.16 |
| Service Class | .73% | | | |
| Actual | | $1,000.00 | $1,132.30 | $3.86 |
| Hypothetical-C | | $1,000.00 | $1,021.17 | $3.66 |
| Service Class 2 | .88% | | | |
| Actual | | $1,000.00 | $1,131.50 | $4.65 |
| Hypothetical-C | | $1,000.00 | $1,020.43 | $4.41 |
| Investor Class | .70% | | | |
| Actual | | $1,000.00 | $1,132.40 | $3.70 |
| Hypothetical-C | | $1,000.00 | $1,021.32 | $3.51 |
A Annualized expense ratio reflects expenses net of applicable fee waivers.
B Expenses are equal to the annualized expense ratio, multiplied by the average account value over the period, multiplied by 181/ 365 (to reflect the one-half year period). The fees and expenses of any Underlying Funds are not included in each annualized expense ratio.
C 5% return per year before expenses
Board Approval of Investment Advisory Contracts and Management Fees
VIP Growth Opportunities Portfolio
Each year, the Board of Trustees, including the Independent Trustees (together, the Board), votes on the renewal of the management contract with Fidelity Management & Research Company LLC (FMR) and the sub-advisory agreements (together, the Advisory Contracts) for the fund. FMR and the sub-advisers are referred to herein as the Investment Advisers. The Board, assisted by the advice of fund counsel and Independent Trustees' counsel, requests and considers a broad range of information relevant to the renewal of the Advisory Contracts throughout the year.
The Board meets regularly and, at each of its meetings, covers an extensive agenda of topics and materials and considers factors that are relevant to its annual consideration of the renewal of the fund's Advisory Contracts, including the services and support provided to the fund and its shareholders. The Board has established various standing committees (Committees), each composed of and chaired by Independent Trustees with varying backgrounds, to which the Board has assigned specific subject matter responsibilities in order to enhance effective decision-making by the Board. The Board, acting directly and through its Committees, requests and receives information concerning the annual consideration of the renewal of the fund's Advisory Contracts. The Board also meets as needed to review matters specifically related to the Board's annual consideration of the renewal of the Advisory Contracts. Members of the Board may also meet with trustees of other Fidelity funds through joint ad hoc committees to discuss certain matters relevant to all of the Fidelity funds.
Approval of Stub Period Continuation. At its January 2021 meeting, the Board of Trustees voted to continue the fund's management contract with FMR, and the sub-advisory agreements and sub-subadvisory agreements, in each case, where applicable (together, the Advisory Contracts), without modification, for four months from February 1, 2021 through May 31, 2021, in connection with changes to the Board's meeting calendar. The Board considered that the approval of the fund's Advisory Contracts will not result in any changes in (i) the investment process or strategies employed in the management of the fund's assets; (ii) the fees and expenses paid by shareholders; (iii) the nature, extent or quality of services provided under the fund's Advisory Contracts; or (iv) the day-to-day management of the fund or the persons primarily responsible for such management. The Board also considered that since its last approval of the fund's Advisory Contracts, FMR had provided additional information on the fund in support of the annual contract renewal process, including competitive analyses on total expenses and management fees and in-depth reviews of fund performance and fund profitability information. The Board also considered the findings of certain ad hoc committees that had been previously formed to discuss matters relevant to all of the Fidelity funds, including economies of scale, fall-out benefits and retail vs. institutional funds. The Board concluded that the fund's Advisory Contracts are fair and reasonable, and that the fund's Advisory Contracts should be renewed, without modification, through May 31, 2021, with the understanding that the Board will consider the annual renewal for a full one year period in May 2021.
At its May 2021 meeting, the Board unanimously determined to renew the fund's Advisory Contracts. In reaching its determination, the Board considered all factors it believed relevant, including (i) the nature, extent, and quality of the services provided to the fund and its shareholders (including the investment performance of the fund); (ii) the competitiveness of the fund's management fee and total expense ratio relative to peer funds; (iii) the total costs of the services provided by and the profits realized by Fidelity from its relationships with the fund; and (iv) the extent to which, if any, economies of scale exist and are realized as the fund grows, and whether any economies of scale are appropriately shared with fund shareholders.
In considering whether to renew the Advisory Contracts for the fund, the Board reached a determination, with the assistance of fund counsel and Independent Trustees' counsel and through the exercise of its business judgment, that the renewal of the Advisory Contracts was in the best interests of the fund and its shareholders and that the compensation payable under the Advisory Contracts was fair and reasonable. The Board's decision to renew the Advisory Contracts was not based on any single factor, but rather was based on a comprehensive consideration of all the information provided to the Board at its meetings throughout the year. The Board, in reaching its determination to renew the Advisory Contracts, was aware that shareholders of the fund have a broad range of investment choices available to them, including a wide choice among funds offered by Fidelity's competitors, and that the fund's shareholders, who have the opportunity to review and weigh the disclosure provided by the fund in its prospectus and other public disclosures, have chosen to invest in this fund, which is part of the Fidelity family of funds.
Nature, Extent, and Quality of Services Provided. The Board considered Fidelity's staffing as it relates to the fund, including the backgrounds of investment personnel of Fidelity, and also considered the fund's investment objective, strategies, and related investment philosophy. The Independent Trustees also had discussions with senior management of Fidelity's investment operations and investment groups. The Board considered the structure of the investment personnel compensation program and whether this structure provides appropriate incentives to act in the best interests of the fund. Additionally, the Board considered the portfolio managers' investments, if any, in the funds that they manage.
Resources Dedicated to Investment Management and Support Services. The Board and the Fund Oversight and Research Committees reviewed the general qualifications and capabilities of Fidelity's investment staff, including its size, education, experience, and resources, as well as Fidelity's approach to recruiting, training, managing, and compensating investment personnel. The Board noted that Fidelity has continued to increase the resources devoted to non-U.S. offices, including expansion of Fidelity's global investment organization. The Board also noted that Fidelity's analysts have extensive resources, tools and capabilities that allow them to conduct sophisticated quantitative and fundamental analysis, as well as credit analysis of issuers, counterparties and guarantors. Further, the Board considered that Fidelity's investment professionals have sufficient access to global information and data so as to provide competitive investment results over time, and that those professionals also have access to sophisticated tools that permit them to assess portfolio construction and risk and performance attribution characteristics continuously, as well as to transmit new information and research conclusions rapidly around the world. Additionally, in its deliberations, the Board considered Fidelity's trading, risk management, compliance, and technology and operations capabilities and resources, which are integral parts of the investment management process. The Board also considered Fidelity's investments in business continuity planning, and its success in continuously providing services to the fund notwithstanding the severe disruptions caused by the COVID-19 pandemic.
Shareholder and Administrative Services. The Board considered (i) the nature, extent, quality, and cost of advisory, administrative, and shareholder services performed by the Investment Advisers and their affiliates under the Advisory Contracts and under separate agreements covering transfer agency, pricing and bookkeeping, and securities lending services for the fund; (ii) the nature and extent of the supervision of third party service providers, principally custodians, subcustodians, and pricing vendors; and (iii) the resources devoted to, and the record of compliance with, the fund's compliance policies and procedures. The Board also reviewed the allocation of fund brokerage, including allocations to brokers affiliated with the Investment Advisers, the use of brokerage commissions to pay fund expenses, and the use of "soft" commission dollars to pay for research services.
The Board noted that the growth of fund assets over time across the complex allows Fidelity to reinvest in the development of services designed to enhance the value and convenience of the Fidelity funds as investment vehicles. These services include 24-hour access to account information and market information over the Internet and through telephone representatives, investor education materials and asset allocation tools, and the expanded availability of Fidelity Investor Centers.
The Board noted that, in the past, it and the boards of certain other Fidelity funds had formed an ad hoc Committee on Transfer Agency Fees to review the variety of transfer agency fee structures throughout the industry and Fidelity's competitive positioning with respect to industry participants.
Investment in a Large Fund Family. The Board considered the benefits to shareholders of investing in a Fidelity fund, including the benefits of investing in a fund that is part of a large family of funds offering a variety of investment disciplines and providing a large variety of mutual fund investor services. The Board noted that Fidelity had taken, or had made recommendations that resulted in the Fidelity funds taking, a number of actions over the previous year that benefited particular funds, including: (i) continuing to dedicate additional resources to Fidelity's investment research process, which includes meetings with management of issuers of securities in which the funds invest, and to the support of the senior management team that oversees asset management; (ii) continuing efforts to enhance Fidelity's global research capabilities; (iii) launching new funds and ETFs with innovative structures, strategies and pricing and making other enhancements to meet client needs; (iv) launching new share classes of existing funds; (v) eliminating purchase minimums and broadening eligibility requirements for certain funds and share classes; (vi) approving the reduction in the holding period for the Class C to Class A conversion policy; (vii) reducing management fees and total expenses for certain target date funds and classes and index funds; (viii) lowering expenses for certain existing funds and classes by implementing or lowering expense caps; (ix) rationalizing product lines and gaining increased efficiencies from fund mergers, liquidations, and share class consolidations; (x) continuing to develop, acquire and implement systems and technology to improve services to the funds and shareholders, strengthen information security, and increase efficiency; and (xi) continuing to implement enhancements to further strengthen Fidelity's product line to increase investors' probability of success in achieving their investment goals, including retirement income goals.
Investment Performance. The Board considered whether the fund has operated in accordance with its investment objective, as well as its record of compliance with its investment restrictions and its performance history.
The Board took into account discussions that occur at Board meetings throughout the year with representatives of the Investment Advisers about fund investment performance. In this regard the Board noted that as part of regularly scheduled fund reviews and other reports to the Board on fund performance, the Board considers annualized return information for the fund for different time periods, measured against an appropriate securities market index (benchmark index) and an appropriate peer group of funds with similar objectives (peer group). In its evaluation of fund investment performance, the Board gave particular attention to information indicating changes in performance of certain Fidelity funds for specific time periods and discussed with the Investment Advisers the reasons for any overperformance or underperformance.
In addition to reviewing absolute and relative fund performance, the Independent Trustees periodically consider the appropriateness of fund performance metrics in evaluating the results achieved. In general, the Independent Trustees believe that fund performance should be evaluated based on net performance (after fees and expenses) of both the highest performing and lowest performing fund share classes, where applicable, compared to appropriate benchmark indices, over appropriate time periods that may include full market cycles, and compared to peer groups, as applicable, over the same periods, taking into account relevant factors including the following: general market conditions; issuer-specific information; and fund cash flows and other factors.
The Independent Trustees recognize that shareholders evaluate performance on a net basis over their own holding periods, for which one-, three-, and five-year periods are often used as a proxy. For this reason, the performance information reviewed by the Board also included net cumulative total return information for the fund and an appropriate benchmark index and peer group for the most recent one-, three-, and five-year periods ended September 30, 2020, as shown below. Returns are shown compared to the 25th percentile (top of box, 75% beaten) and 75th percentile (bottom of box, 25% beaten) of the peer universe.
VIP Growth Opportunities Portfolio
Based on its review, the Board concluded that the nature, extent, and quality of services provided to the fund under the Advisory Contracts should continue to benefit the shareholders of the fund.
Competitiveness of Management Fee and Total Expense Ratio. The Board considered the fund's management fee and total expense ratio compared to "mapped groups" of competitive funds and classes created for the purpose of facilitating the Trustees' competitive analysis of management fees and total expenses. Fidelity creates "mapped groups" by combining similar Lipper investment objective categories that have comparable investment mandates. Combining Lipper investment objective categories aids the Board's management fee and total expense ratio comparisons by broadening the competitive group used for comparison.
Management Fee. The Board considered two proprietary management fee comparisons for the 12-month periods ended September 30 (June 30 for periods ended 2019 and 2018 and December 31 for periods prior to 2018) shown in basis points (BP) in the chart below. The group of Lipper funds used by the Board for management fee comparisons is referred to below as the "Total Mapped Group." The Total Mapped Group comparison focuses on a fund's standing in terms of gross management fees before expense reimbursements or caps relative to the total universe of funds with comparable investment mandates, regardless of whether their management fee structures also are comparable. Funds with comparable investment mandates offer exposure to similar types of securities. Funds with comparable management fee structures have similar management fee contractual arrangements (
e.g., flat rate charged for advisory services, all-inclusive fee rate,
etc.). "TMG %" represents the percentage of funds in the Total Mapped Group that had management fees that were lower than the fund's. For example, a hypothetical TMG % of 20% would mean that 80% of the funds in the Total Mapped Group had higher, and 20% had lower, management fees than the fund. The fund's actual TMG %s and the number of funds in the Total Mapped Group are in the chart below. The "Asset-Sized Peer Group" (ASPG) comparison focuses on a fund's standing relative to a subset of non-Fidelity funds within the Total Mapped Group that are similar in size and management fee structure. For example, if a fund is in the first quartile of the ASPG, the fund's management fee ranks in the least expensive or lowest 25% of funds in the ASPG. The ASPG represents at least 15% of the funds in the Total Mapped Group with comparable asset size and management fee structures, subject to a minimum of 50 funds (or all funds in the Total Mapped Group if fewer than 50). Additional information, such as the ASPG quartile in which the fund's management fee rate ranked, is also included in the chart and was considered by the Board.
VIP Growth Opportunities Portfolio
The Board noted that the fund's management fee rate ranked below the median of its Total Mapped Group and below the median of its ASPG for the 12-month period ended September 30, 2020.
The Board noted that, in the past, it and the boards of other Fidelity funds had formed an ad hoc Committee on Group Fee to conduct an in-depth review of the "group fee" component of the management fee of funds with such management fee structures. The Committee's focus included the mechanics of the group fee, the competitive landscape of group fee structures, Fidelity funds with no group fee component and investment products not included in group fee assets. The Board also considered that, for funds subject to the group fee, FMR agreed to voluntarily waive fees over a specified period of time in amounts designed to account for assets converted from certain funds to certain collective investment trusts.
The Board also noted that, in 2013, the ad hoc Committee on Management Fees was formed to conduct an in-depth review of the management fee rates of Fidelity's active equity mutual funds. The Committee focused on the following areas: (i) standard fee structures; (ii) research consumption and trading evolution; (iii) management fee competitiveness/profitability by category; and (iv) factors that drive institutional pricing.
Based on its review, the Board concluded that the fund's management fee is fair and reasonable in light of the services that the fund receives and the other factors considered.
Total Expense Ratio. In its review of each class's total expense ratio, the Board considered the fund's management fee rate as well as other fund or class expenses, as applicable, such as transfer agent fees, pricing and bookkeeping fees, fund-paid 12b-1 fees, and custodial, legal, and audit fees. The Board also noted that Fidelity may agree to waive fees or reimburse expenses from time to time, and the extent to which, if any, it has done so for the fund. As part of its review, the Board also considered the current and historical total expense ratios of each class of the fund compared to competitive fund median expenses. The fund's representative class is compared to those funds and classes in the Total Mapped Group (used by the Board for management fee comparisons) that have a similar sales load structure (SLTG). The Board also considered a total expense ASPG comparison for the representative class, which focuses on the total expenses of the representative class relative to a subset of non-Fidelity funds within the total expense SLTG. The total expense ASPG is limited to 15 larger and 15 smaller classes in fund average assets for a total of 30 classes, where possible. The total expense ASPG comparison excludes performance adjustments and fund-paid 12b-1 fees to eliminate variability in fee structures.
The Board noted that the total expense ratio of Initial Class ranked below the SLTG competitive median and above the ASPG competitive median for the 12-month period ended September 30, 2020. The Board considered that, in general, various factors can affect total expense ratios. The Board noted that the fund offers multiple classes, each of which has a different 12b-1 fee structure, and that the multiple structures are intended to offer a range of pricing options for the intermediary market. The Board also noted that the total expense ratios of the classes vary primarily by the level of their 12b-1 fees, although differences in transfer agent fees may also cause expenses to vary from class to class.
Fees Charged to Other Fidelity Clients. The Board also considered Fidelity fee structures and other information with respect to clients of Fidelity, such as other funds advised or subadvised by Fidelity, pension plan clients, and other institutional clients with similar mandates. The Board noted that a joint ad hoc committee created by it and the boards of other Fidelity funds periodically reviews and compares Fidelity's institutional investment advisory business with its business of providing services to the Fidelity funds and also noted the most recent findings of the committee. The Board noted that the committee's review included a consideration of the differences in services provided, fees charged, and costs incurred, as well as competition in the markets serving the different categories of clients.
Based on its review of total expense ratios and fees charged to other Fidelity clients, the Board concluded that the total expense ratio of each class of the fund was reasonable in light of the services that the fund and its shareholders receive and the other factors considered.
Costs of the Services and Profitability. The Board considered the revenues earned and the expenses incurred by Fidelity in conducting the business of developing, marketing, distributing, managing, administering and servicing the fund and servicing the fund's shareholders. The Board also considered the level of Fidelity's profits in respect of all the Fidelity funds.
On an annual basis, Fidelity presents to the Board information about the profitability of its relationships with the fund. Fidelity calculates profitability information for each fund, as well as aggregate profitability information for groups of Fidelity funds and all Fidelity funds, using a series of detailed revenue and cost allocation methodologies which originate with the books and records of Fidelity on which Fidelity's audited financial statements are based. The Audit Committee of the Board reviews any significant changes from the prior year's methodologies and the full Board approves such changes.
A public accounting firm has been engaged annually by the Board as part of the Board's assessment of Fidelity's profitability analysis. The engagement includes the review and assessment of the methodologies used by Fidelity in determining the revenues and expenses attributable to Fidelity's mutual fund business, and completion of agreed-upon procedures in respect of the mathematical accuracy of certain fund profitability information and its conformity to established allocation methodologies. After considering the reports issued under the engagement and information provided by Fidelity, the Board concluded that while other allocation methods may also be reasonable, Fidelity's profitability methodologies are reasonable in all material respects.
The Board also reviewed Fidelity's non-fund businesses and potential indirect benefits such businesses may have received as a result of their association with Fidelity's mutual fund business (i.e., fall-out benefits) as well as cases where Fidelity's affiliates may benefit from the funds' business. The Board considered areas where potential indirect benefits to the Fidelity funds from their relationships with Fidelity may exist. The Board also considered that in 2019 a joint ad hoc committee created by it and the boards of other Fidelity funds evaluated potential fall-out benefits (PFOB Committee). The Board noted that it considered the PFOB Committee's findings in connection with its consideration of the renewal of the Advisory Contracts.
The Board considered the costs of the services provided by and the profits realized by Fidelity in connection with the operation of the fund, including the conclusions of the PFOB Committee, and was satisfied that the profitability was not excessive.
Economies of Scale. The Board considered whether there have been economies of scale in respect of the management of the Fidelity funds, whether the Fidelity funds (including the fund) have appropriately benefited from any such economies of scale, and whether there is potential for realization of any further economies of scale. The Board considered the extent to which the fund will benefit from economies of scale as assets grow through increased services to the fund, through waivers or reimbursements, or through fee or expense ratio reductions. The Board also noted that a committee (the Economies of Scale Committee) created by it and the boards of other Fidelity funds periodically analyzes whether Fidelity attains economies of scale in respect of the management and servicing of the Fidelity funds, whether the Fidelity funds have appropriately benefited from such economies of scale, and whether there is potential for realization of any further economies of scale.
The Board recognized that the fund's management contract incorporates a "group fee" structure, which provides for lower group fee rates as total "group assets" increase, and for higher group fee rates as total "group assets" decrease ("group assets" as defined in the management contract). FMR calculates the group fee rates based on a tiered asset "breakpoint" schedule that varies based on asset class. The Board considered that the group fee is designed to deliver the benefits of economies of scale to fund shareholders when total Fidelity fund assets increase, even if assets of any particular fund are unchanged or have declined, because some portion of Fidelity's costs are attributable to services provided to all Fidelity funds, and all funds benefit if those costs can be allocated among more assets. The Board further considered that Fidelity agreed to impose a temporary fee waiver in the form of additional breakpoints to the current breakpoint schedule. The Board concluded that, given the group fee structure, fund shareholders will benefit from lower management fees as "group assets" increase at the fund complex level, regardless of whether Fidelity achieves any such economies of scale.
The Board concluded, taking into account the analysis of the Economies of Scale Committee, that economies of scale, if any, are being appropriately shared between fund shareholders and Fidelity.
Additional Information Requested by the Board. In order to develop fully the factual basis for consideration of the Fidelity funds' advisory contracts, the Board requested and received additional information on certain topics, including: (i) fund flow and performance trends, in particular the underperformance of certain funds and strategies, and Fidelity's long-term strategies for certain funds; (ii) consideration of expanding the use of performance fees for additional funds; (iii) Fidelity's pricing philosophy compared to competitors; (iv) metrics for evaluating index fund and ETF performance and information about ETF trading characteristics; (v) the methodology with respect to evaluating competitive fund data and peer group classifications and fee and expense comparisons; (vi) the expense structures for different funds and classes and information about the differences between various expense structures; (vii) group fee breakpoints; (viii) information regarding other accounts managed by Fidelity and sub-advisory arrangements; and (ix) Fidelity's philosophies and strategies for evaluating funds and classes with lower or declining asset levels.
Based on its evaluation of all of the conclusions noted above, and after considering all factors it believed relevant, the Board concluded that the advisory fee arrangements are fair and reasonable, and that the fund's Advisory Contracts should be renewed.
Liquidity Risk Management Program
The Securities and Exchange Commission adopted Rule 22e-4 under the Investment Company Act of 1940 (the Liquidity Rule) to promote effective liquidity risk management throughout the open-end investment company industry, thereby reducing the risk that funds will be unable to meet their redemption obligations and mitigating dilution of the interests of fund shareholders.
The Fund has adopted and implemented a liquidity risk management program pursuant to the Liquidity Rule (the Program) effective December 1, 2018. The Program is reasonably designed to assess and manage the Fund’s liquidity risk and to comply with the requirements of the Liquidity Rule. The Fund’s Board of Trustees (the Board) has designated the Fund’s investment adviser as administrator of the Program. The Fidelity advisers have established a Liquidity Risk Management Committee (the LRM Committee) to manage the Program for each of the Fidelity Funds. The LRM Committee monitors the adequacy and effectiveness of implementation of the Program and on a periodic basis assesses each Fund’s liquidity risk based on a variety of factors including (1) the Fund’s investment strategy, (2) portfolio liquidity and cash flow projections during normal and reasonably foreseeable stressed conditions, (3) shareholder redemptions, (4) borrowings and other funding sources and (5) in the case of exchange-traded funds, certain additional factors including the effect of the Fund’s prices and spreads, market participants, and basket compositions on the overall liquidity of the Fund’s portfolio, as applicable.
In accordance with the Program, each of the Fund’s portfolio investments is classified into one of four liquidity categories described below based on a determination of a reasonable expectation for how long it would take to convert the investment to cash (or sell or dispose of the investment) without significantly changing its market value.
- Highly liquid investments – cash or convertible to cash within three business days or less
- Moderately liquid investments – convertible to cash in three to seven calendar days
- Less liquid investments – can be sold or disposed of, but not settled, within seven calendar days
- Illiquid investments – cannot be sold or disposed of within seven calendar days
Liquidity classification determinations take into account a variety of factors including various market, trading and investment-specific considerations, as well as market depth, and generally utilize analysis from a third-party liquidity metrics service.
The Liquidity Rule places a 15% limit on a fund’s illiquid investments and requires funds that do not primarily hold assets that are highly liquid investments to determine and maintain a minimum percentage of the fund’s net assets to be invested in highly liquid investments (highly liquid investment minimum or HLIM). The Program includes provisions reasonably designed to comply with the 15% limit on illiquid investments and for determining, periodically reviewing and complying with the HLIM requirement as applicable.
At a recent meeting of the Fund’s Board of Trustees, the LRM Committee provided a written report to the Board pertaining to the operation, adequacy, and effectiveness of implementation of the Program for the annual period from December 1, 2019 through November 30, 2020. The report concluded that the Program has been implemented and is operating effectively and is reasonably designed to assess and manage the Fund’s liquidity risk.
VIPGRO-SANN-0821
1.705699.123
Fidelity® Variable Insurance Products:
Mid Cap Portfolio
Semi-Annual Report
June 30, 2021
Contents
To view a fund's proxy voting guidelines and proxy voting record for the 12-month period ended June 30, visit http://www.fidelity.com/proxyvotingresults or visit the Securities and Exchange Commission's (SEC) web site at http://www.sec.gov.
You may also call 1-877-208-0098 to request a free copy of the proxy voting guidelines.
Fidelity® Variable Insurance Products are separate account options which are purchased through a variable insurance contract.
Standard & Poor's, S&P and S&P 500 are registered service marks of The McGraw-Hill Companies, Inc. and have been licensed for use by Fidelity Distributors Corporation.
Other third-party marks appearing herein are the property of their respective owners.
All other marks appearing herein are registered or unregistered trademarks or service marks of FMR LLC or an affiliated company. © 2021 FMR LLC. All rights reserved.
This report and the financial statements contained herein are submitted for the general information of the shareholders of the Fund. This report is not authorized for distribution to prospective investors in the Fund unless preceded or accompanied by an effective prospectus.
A fund files its complete schedule of portfolio holdings with the SEC for the first and third quarters of each fiscal year on Form N-PORT. Forms N-PORT are available on the SEC’s web site at http://www.sec.gov. A fund's Forms N-PORT may be reviewed and copied at the SEC’s Public Reference Room in Washington, DC. Information regarding the operation of the SEC's Public Reference Room may be obtained by calling 1-800-SEC-0330.
For a complete list of a fund's portfolio holdings, view the most recent holdings listing, semiannual report, or annual report on Fidelity's web site at http://www.fidelity.com, http://www.institutional.fidelity.com, or http://www.401k.com, as applicable.
NOT FDIC INSURED •MAY LOSE VALUE •NO BANK GUARANTEE
Neither the Fund nor Fidelity Distributors Corporation is a bank.
Note to Shareholders:
Early in 2020, the outbreak and spread of a new coronavirus emerged as a public health emergency that had a major influence on financial markets, primarily based on its impact on the global economy and the outlook for corporate earnings. The virus causes a respiratory disease known as COVID-19. On March 11, 2020 the World Health Organization declared the COVID-19 outbreak a pandemic, citing sustained risk of further global spread.
In the weeks following, as the crisis worsened, we witnessed an escalating human tragedy with wide-scale social and economic consequences from coronavirus-containment measures. The outbreak of COVID-19 prompted a number of measures to limit the spread, including travel and border restrictions, quarantines, and restrictions on large gatherings. In turn, these resulted in lower consumer activity, diminished demand for a wide range of products and services, disruption in manufacturing and supply chains, and – given the wide variability in outcomes regarding the outbreak – significant market uncertainty and volatility. Amid the turmoil, global governments and central banks took unprecedented action to help support consumers, businesses, and the broader economies, and to limit disruption to financial systems.
The situation continues to unfold, and the extent and duration of its impact on financial markets and the economy remain highly uncertain. Extreme events such as the coronavirus crisis are “exogenous shocks” that can have significant adverse effects on mutual funds and their investments. Although multiple asset classes may be affected by market disruption, the duration and impact may not be the same for all types of assets.
Fidelity is committed to helping you stay informed amid news about COVID-19 and during increased market volatility, and we’re taking extra steps to be responsive to customer needs. We encourage you to visit our websites, where we offer ongoing updates, commentary, and analysis on the markets and our funds.
Investment Summary (Unaudited)
Top Ten Stocks as of June 30, 2021
| | % of fund's net assets |
| Deckers Outdoor Corp. | 1.7 |
| ITT, Inc. | 1.5 |
| Signature Bank | 1.4 |
| Molina Healthcare, Inc. | 1.3 |
| Williams-Sonoma, Inc. | 1.3 |
| Builders FirstSource, Inc. | 1.2 |
| Element Solutions, Inc. | 1.2 |
| Nomad Foods Ltd. | 1.2 |
| Activision Blizzard, Inc. | 1.1 |
| Old Republic International Corp. | 1.1 |
| | 13.0 |
Top Five Market Sectors as of June 30, 2021
| | % of fund's net assets |
| Industrials | 18.9 |
| Consumer Discretionary | 15.8 |
| Financials | 15.3 |
| Information Technology | 12.9 |
| Health Care | 9.7 |
Asset Allocation (% of fund's net assets)
| As of June 30, 2021 * |
| | Stocks | 99.6% |
| | Short-Term Investments and Net Other Assets (Liabilities) | 0.4% |

* Foreign investments - 10.0%
Schedule of Investments June 30, 2021 (Unaudited)
Showing Percentage of Net Assets
| Common Stocks - 99.6% | | | |
| | | Shares | Value |
| COMMUNICATION SERVICES - 2.4% | | | |
| Entertainment - 1.4% | | | |
| Activision Blizzard, Inc. | | 981,200 | $93,645,728 |
| Live Nation Entertainment, Inc. (a) | | 245,500 | 21,503,345 |
| | | | 115,149,073 |
| Interactive Media & Services - 0.2% | | | |
| IAC (a) | | 134,300 | 20,705,031 |
| Media - 0.8% | | | |
| Interpublic Group of Companies, Inc. | | 2,040,685 | 66,301,856 |
|
| TOTAL COMMUNICATION SERVICES | | | 202,155,960 |
|
| CONSUMER DISCRETIONARY - 15.8% | | | |
| Auto Components - 0.3% | | | |
| Adient PLC (a) | | 618,400 | 27,951,680 |
| Diversified Consumer Services - 0.5% | | | |
| Grand Canyon Education, Inc. (a) | | 407,400 | 36,653,778 |
| Hotels, Restaurants & Leisure - 4.7% | | | |
| ARAMARK Holdings Corp. | | 1,102,000 | 41,049,500 |
| Brinker International, Inc. (a) | | 348,300 | 21,542,355 |
| Caesars Entertainment, Inc. (a) | | 673,039 | 69,827,796 |
| Churchill Downs, Inc. | | 390,000 | 77,321,400 |
| Hilton Grand Vacations, Inc. (a) | | 1,001,800 | 41,464,502 |
| Jubilant Foodworks Ltd. (a) | | 150,140 | 6,218,802 |
| Marriott International, Inc. Class A (a) | | 119,100 | 16,259,532 |
| Noodles & Co. (a)(b)(c) | | 2,939,212 | 36,681,366 |
| Penn National Gaming, Inc. (a) | | 353,500 | 27,039,215 |
| Planet Fitness, Inc. (a) | | 305,200 | 22,966,300 |
| Vail Resorts, Inc. (a) | | 91,700 | 29,024,884 |
| | | | 389,395,652 |
| Household Durables - 2.1% | | | |
| KB Home | | 632,900 | 25,771,688 |
| Lovesac (a) | | 170,500 | 13,604,195 |
| Meritage Homes Corp. (a) | | 192,400 | 18,100,992 |
| NVR, Inc. (a) | | 5,846 | 29,073,912 |
| Taylor Morrison Home Corp. (a) | | 2,024,200 | 53,479,364 |
| Toll Brothers, Inc. | | 508,900 | 29,419,509 |
| | | | 169,449,660 |
| Internet & Direct Marketing Retail - 0.4% | | | |
| Revolve Group, Inc. (a)(b) | | 463,600 | 31,942,040 |
| thredUP, Inc. (a) | | 26,600 | 773,528 |
| | | | 32,715,568 |
| Leisure Products - 0.6% | | | |
| YETI Holdings, Inc. (a) | | 558,300 | 51,263,106 |
| Specialty Retail - 4.4% | | | |
| Academy Sports & Outdoors, Inc. | | 821,500 | 33,878,660 |
| America's Car Mart, Inc. (a) | | 89,300 | 12,655,596 |
| American Eagle Outfitters, Inc. (b) | | 1,522,000 | 57,120,660 |
| Dick's Sporting Goods, Inc. (b) | | 514,500 | 51,547,755 |
| Five Below, Inc. (a) | | 374,300 | 72,340,961 |
| Gap, Inc. | | 897,000 | 30,184,050 |
| Williams-Sonoma, Inc. | | 673,100 | 107,460,415 |
| | | | 365,188,097 |
| Textiles, Apparel & Luxury Goods - 2.8% | | | |
| Capri Holdings Ltd. (a) | | 616,039 | 35,231,270 |
| Deckers Outdoor Corp. (a) | | 350,525 | 134,626,136 |
| PVH Corp. (a) | | 237,200 | 25,520,348 |
| Tapestry, Inc. (a) | | 762,600 | 33,157,848 |
| | | | 228,535,602 |
|
| TOTAL CONSUMER DISCRETIONARY | | | 1,301,153,143 |
|
| CONSUMER STAPLES - 4.2% | | | |
| Beverages - 0.4% | | | |
| C&C Group PLC (United Kingdom) (a) | | 10,064,821 | 33,832,080 |
| Food & Staples Retailing - 1.8% | | | |
| BJ's Wholesale Club Holdings, Inc. (a) | | 1,891,100 | 89,978,538 |
| U.S. Foods Holding Corp. (a) | | 1,638,300 | 62,845,188 |
| | | | 152,823,726 |
| Food Products - 1.2% | | | |
| Nomad Foods Ltd. (a) | | 3,382,400 | 95,620,448 |
| Household Products - 0.8% | | | |
| Spectrum Brands Holdings, Inc. | | 756,700 | 64,349,768 |
|
| TOTAL CONSUMER STAPLES | | | 346,626,022 |
|
| ENERGY - 2.7% | | | |
| Energy Equipment & Services - 0.3% | | | |
| Baker Hughes Co. Class A | | 1,079,881 | 24,696,878 |
| Oil, Gas & Consumable Fuels - 2.4% | | | |
| Antero Resources Corp. (a) | | 573,800 | 8,624,214 |
| Cheniere Energy, Inc. (a) | | 391,100 | 33,924,014 |
| Hess Corp. | | 441,300 | 38,534,316 |
| Magnolia Oil & Gas Corp. Class A (a) | | 2,489,400 | 38,909,322 |
| New Fortress Energy, Inc. | | 500,480 | 18,958,182 |
| Range Resources Corp. (a)(b) | | 2,274,771 | 38,125,162 |
| Renewable Energy Group, Inc. (a) | | 306,000 | 19,076,040 |
| | | | 196,151,250 |
|
| TOTAL ENERGY | | | 220,848,128 |
|
| FINANCIALS - 15.3% | | | |
| Banks - 6.4% | | | |
| Atlantic Union Bankshares Corp. | | 523,200 | 18,950,304 |
| Bancorp, Inc., Delaware (a)(b) | | 1,069,300 | 24,604,593 |
| BankUnited, Inc. | | 813,761 | 34,739,457 |
| Comerica, Inc. | | 338,500 | 24,148,590 |
| CVB Financial Corp. | | 1,207,362 | 24,859,584 |
| First Horizon National Corp. | | 3,524,178 | 60,897,796 |
| First Republic Bank | | 138,900 | 25,997,913 |
| Huntington Bancshares, Inc. | | 3,248,216 | 46,352,042 |
| KeyCorp | | 1,918,400 | 39,614,960 |
| M&T Bank Corp. | | 281,400 | 40,890,234 |
| Signature Bank | | 462,300 | 113,563,995 |
| Wintrust Financial Corp. | | 1,001,700 | 75,758,571 |
| | | | 530,378,039 |
| Capital Markets - 1.9% | | | |
| Ameriprise Financial, Inc. | | 272,813 | 67,897,699 |
| Raymond James Financial, Inc. | | 557,695 | 72,444,581 |
| TMX Group Ltd. | | 187,900 | 19,848,036 |
| | | | 160,190,316 |
| Consumer Finance - 0.7% | | | |
| Synchrony Financial | | 1,144,000 | 55,506,880 |
| Diversified Financial Services - 0.7% | | | |
| Equitable Holdings, Inc. | | 1,813,400 | 55,218,030 |
| Insurance - 4.7% | | | |
| American Financial Group, Inc. | | 256,200 | 31,953,264 |
| Assurant, Inc. | | 371,800 | 58,067,724 |
| GoHealth, Inc. (a) | | 993,200 | 11,133,772 |
| Hartford Financial Services Group, Inc. | | 760,100 | 47,103,397 |
| Hiscox Ltd. (a) | | 1,364,717 | 15,699,053 |
| Old Republic International Corp. | | 3,621,800 | 90,219,038 |
| Primerica, Inc. | | 567,420 | 86,894,699 |
| Reinsurance Group of America, Inc. | | 439,024 | 50,048,736 |
| | | | 391,119,683 |
| Thrifts & Mortgage Finance - 0.9% | | | |
| Essent Group Ltd. | | 979,270 | 44,018,187 |
| Meta Financial Group, Inc. | | 623,500 | 31,567,805 |
| | | | 75,585,992 |
|
| TOTAL FINANCIALS | | | 1,267,998,940 |
|
| HEALTH CARE - 9.7% | | | |
| Biotechnology - 1.3% | | | |
| Argenx SE ADR (a) | | 33,945 | 10,219,821 |
| Exelixis, Inc. (a) | | 1,445,200 | 26,331,544 |
| Neurocrine Biosciences, Inc. (a) | | 394,300 | 38,373,276 |
| Novavax, Inc. (a) | | 66,800 | 14,182,308 |
| Regeneron Pharmaceuticals, Inc. (a) | | 26,800 | 14,968,872 |
| | | | 104,075,821 |
| Health Care Equipment & Supplies - 3.1% | | | |
| Boston Scientific Corp. (a) | | 803,003 | 34,336,408 |
| Envista Holdings Corp. (a) | | 565,536 | 24,436,811 |
| Hologic, Inc. (a) | | 538,281 | 35,914,108 |
| ResMed, Inc. | | 110,648 | 27,276,945 |
| Tandem Diabetes Care, Inc. (a) | | 244,900 | 23,853,260 |
| The Cooper Companies, Inc. | | 78,983 | 31,298,593 |
| Zimmer Biomet Holdings, Inc. | | 494,700 | 79,557,654 |
| | | | 256,673,779 |
| Health Care Providers & Services - 2.5% | | | |
| Centene Corp. (a) | | 567,076 | 41,356,853 |
| Molina Healthcare, Inc. (a) | | 429,500 | 108,689,270 |
| Option Care Health, Inc. (a) | | 1,556,000 | 34,029,720 |
| Signify Health, Inc. | | 19,700 | 599,471 |
| Universal Health Services, Inc. Class B | | 158,400 | 23,194,512 |
| | | | 207,869,826 |
| Life Sciences Tools & Services - 2.3% | | | |
| 10X Genomics, Inc. (a) | | 59,399 | 11,631,512 |
| Avantor, Inc. (a) | | 1,175,600 | 41,745,556 |
| Maravai LifeSciences Holdings, Inc. | | 452,000 | 18,861,960 |
| Sartorius Stedim Biotech | | 25,100 | 11,872,191 |
| Sotera Health Co. | | 422,900 | 10,246,867 |
| Syneos Health, Inc. (a) | | 586,400 | 52,476,936 |
| Thermo Fisher Scientific, Inc. | | 82,463 | 41,600,110 |
| | | | 188,435,132 |
| Pharmaceuticals - 0.5% | | | |
| Nektar Therapeutics (a) | | 648,600 | 11,129,976 |
| UCB SA | | 297,000 | 31,047,109 |
| | | | 42,177,085 |
|
| TOTAL HEALTH CARE | | | 799,231,643 |
|
| INDUSTRIALS - 18.9% | | | |
| Aerospace & Defense - 0.9% | | | |
| Axon Enterprise, Inc. (a) | | 218,800 | 38,683,840 |
| Howmet Aerospace, Inc. (a) | | 911,300 | 31,412,511 |
| | | | 70,096,351 |
| Air Freight & Logistics - 1.1% | | | |
| XPO Logistics, Inc. (a)(b) | | 638,081 | 89,261,151 |
| Airlines - 0.5% | | | |
| Allegiant Travel Co. (a) | | 39,700 | 7,701,800 |
| Copa Holdings SA Class A (a) | | 132,300 | 9,966,159 |
| Jet2 PLC (a) | | 1,328,500 | 21,749,346 |
| | | | 39,417,305 |
| Building Products - 2.5% | | | |
| Builders FirstSource, Inc. (a) | | 2,332,900 | 99,521,514 |
| Fortune Brands Home & Security, Inc. | | 211,700 | 21,087,437 |
| Jeld-Wen Holding, Inc. (a) | | 2,357,400 | 61,905,324 |
| UFP Industries, Inc. | | 332,500 | 24,718,050 |
| | | | 207,232,325 |
| Commercial Services & Supplies - 0.5% | | | |
| Stericycle, Inc. (a) | | 619,492 | 44,324,653 |
| Construction & Engineering - 1.7% | | | |
| Dycom Industries, Inc. (a) | | 605,900 | 45,157,727 |
| MasTec, Inc. (a)(b) | | 236,700 | 25,113,870 |
| Quanta Services, Inc. | | 435,700 | 39,461,349 |
| Willscot Mobile Mini Holdings (a) | | 1,180,400 | 32,897,748 |
| | | | 142,630,694 |
| Electrical Equipment - 4.1% | | | |
| Acuity Brands, Inc. | | 218,600 | 40,884,758 |
| AMETEK, Inc. | | 542,600 | 72,437,100 |
| Generac Holdings, Inc. (a) | | 180,400 | 74,893,060 |
| Regal Beloit Corp. | | 299,715 | 40,014,950 |
| Sensata Technologies, Inc. PLC (a) | | 824,300 | 47,784,671 |
| Sunrun, Inc. (a) | | 1,162,483 | 64,843,302 |
| | | | 340,857,841 |
| Machinery - 3.6% | | | |
| Crane Co. | | 526,400 | 48,623,568 |
| Fortive Corp. | | 502,600 | 35,051,324 |
| IDEX Corp. | | 74,700 | 16,437,735 |
| ITT, Inc. | | 1,307,000 | 119,708,130 |
| Oshkosh Corp. | | 408,400 | 50,902,976 |
| Woodward, Inc. | | 210,100 | 25,817,088 |
| | | | 296,540,821 |
| Marine - 0.2% | | | |
| Clarkson PLC | | 459,000 | 20,254,417 |
| Professional Services - 2.0% | | | |
| ASGN, Inc. (a) | | 387,393 | 37,550,003 |
| Clarivate Analytics PLC (a) | | 1,421,400 | 39,131,142 |
| Jacobs Engineering Group, Inc. | | 179,055 | 23,889,518 |
| KBR, Inc. | | 893,800 | 34,098,470 |
| TriNet Group, Inc. (a) | | 435,800 | 31,586,784 |
| | | | 166,255,917 |
| Road & Rail - 0.5% | | | |
| Knight-Swift Transportation Holdings, Inc. Class A | | 861,500 | 39,163,790 |
| Trading Companies & Distributors - 1.3% | | | |
| GMS, Inc. (a) | | 778,400 | 37,472,176 |
| Univar, Inc. (a) | | 2,792,200 | 68,073,836 |
| | | | 105,546,012 |
|
| TOTAL INDUSTRIALS | | | 1,561,581,277 |
|
| INFORMATION TECHNOLOGY - 12.9% | | | |
| Communications Equipment - 0.9% | | | |
| Digi International, Inc. (a) | | 1,689,200 | 33,969,812 |
| Ericsson (B Shares) | | 1,647,400 | 20,714,255 |
| Lumentum Holdings, Inc. (a) | | 200,500 | 16,447,015 |
| | | | 71,131,082 |
| Electronic Equipment & Components - 1.2% | | | |
| CDW Corp. | | 143,601 | 25,079,915 |
| Jabil, Inc. | | 361,900 | 21,033,628 |
| Trimble, Inc. (a) | | 244,300 | 19,991,069 |
| Zebra Technologies Corp. Class A (a) | | 59,700 | 31,610,553 |
| | | | 97,715,165 |
| IT Services - 4.9% | | | |
| Akamai Technologies, Inc. (a) | | 207,900 | 24,241,140 |
| Amadeus IT Holding SA Class A (a) | | 291,500 | 20,503,728 |
| Black Knight, Inc. (a) | | 578,500 | 45,111,430 |
| Concentrix Corp. (a) | | 306,000 | 49,204,800 |
| EPAM Systems, Inc. (a) | | 42,800 | 21,869,088 |
| Euronet Worldwide, Inc. (a) | | 432,777 | 58,576,367 |
| Genpact Ltd. | | 1,367,488 | 62,124,980 |
| GoDaddy, Inc. (a) | | 840,800 | 73,115,968 |
| WNS Holdings Ltd. sponsored ADR (a) | | 621,300 | 49,623,231 |
| | | | 404,370,732 |
| Semiconductors & Semiconductor Equipment - 4.6% | | | |
| Marvell Technology, Inc. | | 963,300 | 56,189,289 |
| MediaTek, Inc. | | 796,000 | 27,429,104 |
| MKS Instruments, Inc. | | 485,300 | 86,359,135 |
| NXP Semiconductors NV | | 99,100 | 20,386,852 |
| ON Semiconductor Corp. (a) | | 1,683,100 | 64,429,068 |
| Semtech Corp. (a) | | 415,551 | 28,589,909 |
| SolarEdge Technologies, Inc. (a) | | 259,500 | 71,718,015 |
| Teradyne, Inc. | | 165,300 | 22,143,588 |
| | | | 377,244,960 |
| Software - 1.3% | | | |
| Adobe, Inc. (a) | | 47,700 | 27,935,028 |
| Digital Turbine, Inc. (a) | | 620,600 | 47,184,218 |
| Dynatrace, Inc. (a) | | 616,400 | 36,010,088 |
| | | | 111,129,334 |
|
| TOTAL INFORMATION TECHNOLOGY | | | 1,061,591,273 |
|
| MATERIALS - 7.4% | | | |
| Chemicals - 3.3% | | | |
| Albemarle Corp. U.S. | | 111,458 | 18,776,215 |
| Celanese Corp. Class A | | 321,800 | 48,784,880 |
| Element Solutions, Inc. | | 4,099,300 | 95,841,634 |
| Olin Corp. | | 1,265,500 | 58,542,030 |
| The Chemours Co. LLC | | 1,380,900 | 48,055,320 |
| | | | 270,000,079 |
| Construction Materials - 0.8% | | | |
| Eagle Materials, Inc. | | 278,500 | 39,577,635 |
| Martin Marietta Materials, Inc. | | 85,800 | 30,185,298 |
| | | | 69,762,933 |
| Containers & Packaging - 0.7% | | | |
| Avery Dennison Corp. | | 286,200 | 60,170,688 |
| Metals & Mining - 2.6% | | | |
| Agnico Eagle Mines Ltd. (Canada) | | 518,000 | 31,324,040 |
| Cleveland-Cliffs, Inc. (a) | | 1,689,043 | 36,415,767 |
| First Quantum Minerals Ltd. | | 1,973,000 | 45,473,225 |
| Kirkland Lake Gold Ltd. | | 572,000 | 22,042,949 |
| Reliance Steel & Aluminum Co. | | 210,300 | 31,734,270 |
| Wheaton Precious Metals Corp. | | 1,024,500 | 45,158,664 |
| | | | 212,148,915 |
|
| TOTAL MATERIALS | | | 612,082,615 |
|
| REAL ESTATE - 7.5% | | | |
| Equity Real Estate Investment Trusts (REITs) - 6.9% | | | |
| Alexandria Real Estate Equities, Inc. | | 221,000 | 40,208,740 |
| CyrusOne, Inc. | | 674,800 | 48,261,696 |
| Digital Realty Trust, Inc. | | 260,000 | 39,119,600 |
| Douglas Emmett, Inc. | | 1,219,600 | 41,002,952 |
| Duke Realty Corp. | | 651,700 | 30,857,995 |
| Healthcare Trust of America, Inc. | | 883,400 | 23,586,780 |
| Highwoods Properties, Inc. (SBI) | | 1,326,200 | 59,904,454 |
| Invitation Homes, Inc. | | 1,811,200 | 67,539,648 |
| Lamar Advertising Co. Class A | | 606,100 | 63,288,962 |
| Mid-America Apartment Communities, Inc. | | 138,900 | 23,393,538 |
| National Retail Properties, Inc. | | 1,690,200 | 79,236,576 |
| Ventas, Inc. | | 507,200 | 28,961,120 |
| VICI Properties, Inc. | | 826,400 | 25,634,928 |
| | | | 570,996,989 |
| Real Estate Management & Development - 0.6% | | | |
| CBRE Group, Inc. (a) | | 580,523 | 49,768,237 |
|
| TOTAL REAL ESTATE | | | 620,765,226 |
|
| UTILITIES - 2.8% | | | |
| Electric Utilities - 0.4% | | | |
| PG&E Corp. (a) | | 3,411,900 | 34,699,023 |
| Independent Power and Renewable Electricity Producers - 2.4% | | | |
| Clearway Energy, Inc. Class C | | 1,672,000 | 44,274,560 |
| NextEra Energy Partners LP (b) | | 1,145,100 | 87,439,836 |
| The AES Corp. | | 2,439,500 | 63,597,765 |
| | | | 195,312,161 |
|
| TOTAL UTILITIES | | | 230,011,184 |
|
| TOTAL COMMON STOCKS | | | |
| (Cost $5,561,160,972) | | | 8,224,045,411 |
|
| Money Market Funds - 1.4% | | | |
| Fidelity Cash Central Fund 0.06% (d) | | 39,589,094 | 39,597,012 |
| Fidelity Securities Lending Cash Central Fund 0.06% (d)(e) | | 77,233,420 | 77,241,144 |
| TOTAL MONEY MARKET FUNDS | | | |
| (Cost $116,838,156) | | | 116,838,156 |
| TOTAL INVESTMENT IN SECURITIES - 101.0% | | | |
| (Cost $5,677,999,128) | | | 8,340,883,567 |
| NET OTHER ASSETS (LIABILITIES) - (1.0)% | | | (80,869,743) |
| NET ASSETS - 100% | | | $8,260,013,824 |
Legend
(a) Non-income producing
(b) Security or a portion of the security is on loan at period end.
(c) Affiliated company
(d) Affiliated fund that is generally available only to investment companies and other accounts managed by Fidelity Investments. The rate quoted is the annualized seven-day yield of the fund at period end. A complete unaudited listing of the fund's holdings as of its most recent quarter end is available upon request. In addition, each Fidelity Central Fund's financial statements are available on the SEC's website or upon request.
(e) Investment made with cash collateral received from securities on loan.
Affiliated Central Funds
Information regarding fiscal year to date income earned by the Fund from investments in Fidelity Central Funds is as follows:
| Fund | Income earned |
| Fidelity Cash Central Fund | $13,895 |
| Fidelity Securities Lending Cash Central Fund | 34,922 |
| Total | $48,817 |
Amounts in the income column in the above table include any capital gain distributions from underlying funds, which are presented in the corresponding line-item in the Statement of Operations, if applicable. Amount for Fidelity Securities Lending Cash Central Fund represents the income earned on investing cash collateral, less rebates paid to borrowers and any lending agent fees associated with the loan, plus any premium payments received for lending certain types of securities.
Fiscal year to date information regarding the Fund's investments in Fidelity Central Funds, including the ownership percentage, is presented below.
| Fund | Value, beginning of period | Purchases | Sales Proceeds | Realized Gain/Loss | Change in Unrealized appreciation (depreciation) | Value, end of period | % ownership, end of period |
| Fidelity Cash Central Fund 0.06% | $36,996,886 | $826,034,560 | $823,432,311 | $(2,123) | $-- | $39,597,012 | 0.1% |
| Fidelity Securities Lending Cash Central Fund 0.06% | 11,512,106 | 540,008,685 | 474,279,647 | -- | -- | 77,241,144 | 0.2% |
| Total | $48,508,992 | $1,366,043,245 | $1,297,711,958 | $(2,123) | $-- | $116,838,156 | |
Other Affiliated Issuers
An affiliated company is a company in which the Fund has ownership of at least 5% of the voting securities. Fiscal year to date transactions with companies which are or were affiliates are as follows:
| Affiliate | Value, beginning of period | Purchases | Sales Proceeds | Dividend Income | Realized Gain (loss) | Change in Unrealized appreciation (depreciation) | Value, end of period |
| Digi International, Inc. | $27,673,380 | $4,387,500 | $-- | $-- | $-- | $1,908,932 | $-- |
| Noodles & Co. | 23,219,775 | -- | -- | -- | -- | 13,461,591 | 36,681,366 |
| Total | $50,893,155 | $4,387,500 | $-- | $-- | $-- | $15,370,523 | $36,681,366 |
Investment Valuation
The following is a summary of the inputs used, as of June 30, 2021, involving the Fund's assets and liabilities carried at fair value. The inputs or methodology used for valuing securities may not be an indication of the risk associated with investing in those securities. For more information on valuation inputs, and their aggregation into the levels used below, please refer to the Investment Valuation section in the accompanying Notes to Financial Statements.
| | Valuation Inputs at Reporting Date: |
| Description | Total | Level 1 | Level 2 | Level 3 |
| Investments in Securities: | | | | |
| Equities: | | | | |
| Communication Services | $202,155,960 | $202,155,960 | $-- | $-- |
| Consumer Discretionary | 1,301,153,143 | 1,301,153,143 | -- | -- |
| Consumer Staples | 346,626,022 | 346,626,022 | -- | -- |
| Energy | 220,848,128 | 220,848,128 | -- | -- |
| Financials | 1,267,998,940 | 1,267,998,940 | -- | -- |
| Health Care | 799,231,643 | 799,231,643 | -- | -- |
| Industrials | 1,561,581,277 | 1,561,581,277 | -- | -- |
| Information Technology | 1,061,591,273 | 1,040,877,018 | 20,714,255 | -- |
| Materials | 612,082,615 | 612,082,615 | -- | -- |
| Real Estate | 620,765,226 | 620,765,226 | -- | -- |
| Utilities | 230,011,184 | 230,011,184 | -- | -- |
| Money Market Funds | 116,838,156 | 116,838,156 | -- | -- |
| Total Investments in Securities: | $8,340,883,567 | $8,320,169,312 | $20,714,255 | $-- |
See accompanying notes which are an integral part of the financial statements.
Financial Statements
Statement of Assets and Liabilities
| | | June 30, 2021 (Unaudited) |
| Assets | | |
Investment in securities, at value (including securities loaned of $76,169,997) — See accompanying schedule:
Unaffiliated issuers (cost $5,540,755,452) | $8,187,364,045 | |
| Fidelity Central Funds (cost $116,838,156) | 116,838,156 | |
| Other affiliated issuers (cost $20,405,520) | 36,681,366 | |
| Total Investment in Securities (cost $5,677,999,128) | | $8,340,883,567 |
| Foreign currency held at value (cost $657,558) | | 656,494 |
| Receivable for investments sold | | 254,825 |
| Receivable for fund shares sold | | 1,732,076 |
| Dividends receivable | | 4,659,147 |
| Distributions receivable from Fidelity Central Funds | | 6,691 |
| Other receivables | | 308,002 |
| Total assets | | 8,348,500,802 |
| Liabilities | | |
| Payable for investments purchased | $1,722,051 | |
| Payable for fund shares redeemed | 4,059,754 | |
| Accrued management fee | 3,638,531 | |
| Distribution and service plan fees payable | 1,133,404 | |
| Other affiliated payables | 589,174 | |
| Other payables and accrued expenses | 118,489 | |
| Collateral on securities loaned | 77,225,575 | |
| Total liabilities | | 88,486,978 |
| Net Assets | | $8,260,013,824 |
| Net Assets consist of: | | |
| Paid in capital | | $4,478,064,052 |
| Total accumulated earnings (loss) | | 3,781,949,772 |
| Net Assets | | $8,260,013,824 |
| Net Asset Value and Maximum Offering Price | | |
| Initial Class: | | |
| Net Asset Value, offering price and redemption price per share ($1,735,240,808 ÷ 38,898,838 shares) | | $44.61 |
| Service Class: | | |
| Net Asset Value, offering price and redemption price per share ($701,444,705 ÷ 15,911,005 shares) | | $44.09 |
| Service Class 2: | | |
| Net Asset Value, offering price and redemption price per share ($5,125,733,913 ÷ 119,472,105 shares) | | $42.90 |
| Investor Class: | | |
| Net Asset Value, offering price and redemption price per share ($697,594,398 ÷ 15,756,353 shares) | | $44.27 |
See accompanying notes which are an integral part of the financial statements.
Statement of Operations
| | | Six months ended June 30, 2021 (Unaudited) |
| Investment Income | | |
| Dividends | | $46,273,956 |
| Income from Fidelity Central Funds (including $34,922 from security lending) | | 48,817 |
| Total income | | 46,322,773 |
| Expenses | | |
| Management fee | $21,478,638 | |
| Transfer agent fees | 2,850,825 | |
| Distribution and service plan fees | 6,723,263 | |
| Accounting fees | 605,413 | |
| Custodian fees and expenses | 46,327 | |
| Independent trustees' fees and expenses | 13,478 | |
| Audit | 24,144 | |
| Legal | 9,135 | |
| Interest | 145 | |
| Miscellaneous | 20,012 | |
| Total expenses before reductions | 31,771,380 | |
| Expense reductions | (371,613) | |
| Total expenses after reductions | | 31,399,767 |
| Net investment income (loss) | | 14,923,006 |
| Realized and Unrealized Gain (Loss) | | |
| Net realized gain (loss) on: | | |
| Investment securities: | | |
| Unaffiliated issuers | 1,120,682,688 | |
| Fidelity Central Funds | (2,123) | |
| Foreign currency transactions | (49,370) | |
| Total net realized gain (loss) | | 1,120,631,195 |
| Change in net unrealized appreciation (depreciation) on: | | |
| Investment securities: | | |
| Unaffiliated issuers | 6,730,462 | |
| Affiliated issuers | 15,370,523 | |
| Assets and liabilities in foreign currencies | (8,457) | |
| Total change in net unrealized appreciation (depreciation) | | 22,092,528 |
| Net gain (loss) | | 1,142,723,723 |
| Net increase (decrease) in net assets resulting from operations | | $1,157,646,729 |
See accompanying notes which are an integral part of the financial statements.
Statement of Changes in Net Assets
| | Six months ended June 30, 2021 (Unaudited) | Year ended December 31, 2020 |
| Increase (Decrease) in Net Assets | | |
| Operations | | |
| Net investment income (loss) | $14,923,006 | $19,597,251 |
| Net realized gain (loss) | 1,120,631,195 | 247,943,721 |
| Change in net unrealized appreciation (depreciation) | 22,092,528 | 880,743,954 |
| Net increase (decrease) in net assets resulting from operations | 1,157,646,729 | 1,148,284,926 |
| Distributions to shareholders | (29,953,409) | (30,609,677) |
| Share transactions - net increase (decrease) | (491,275,510) | (768,065,252) |
| Total increase (decrease) in net assets | 636,417,810 | 349,609,997 |
| Net Assets | | |
| Beginning of period | 7,623,596,014 | 7,273,986,017 |
| End of period | $8,260,013,824 | $7,623,596,014 |
See accompanying notes which are an integral part of the financial statements.
Financial Highlights
VIP Mid Cap Portfolio Initial Class
| | Six months ended (Unaudited) June 30, | Years endedDecember 31, | | | | |
| | 2021 | 2020 | 2019 | 2018 | 2017 | 2016 |
| Selected Per–Share Data | | | | | | |
| Net asset value, beginning of period | $38.72 | $32.95 | $30.19 | $38.94 | $33.98 | $32.65 |
| Income from Investment Operations | | | | | | |
| Net investment income (loss)A | .12 | .15 | .27 | .23 | .26 | .21 |
| Net realized and unrealized gain (loss) | 5.92 | 5.83 | 6.39 | (5.47) | 6.59 | 3.27 |
| Total from investment operations | 6.04 | 5.98 | 6.66 | (5.24) | 6.85 | 3.48 |
| Distributions from net investment income | – | (.21) | (.28) | (.24) | (.26) | (.16) |
| Distributions from net realized gain | (.15) | – | (3.63) | (3.27) | (1.63) | (1.99) |
| Total distributions | (.15) | (.21) | (3.90)B | (3.51) | (1.89) | (2.15) |
| Net asset value, end of period | $44.61 | $38.72 | $32.95 | $30.19 | $38.94 | $33.98 |
| Total ReturnC,D,E | 15.63% | 18.19% | 23.45% | (14.54)% | 20.81% | 12.23% |
| Ratios to Average Net AssetsF,G | | | | | | |
| Expenses before reductions | .61%H | .62% | .62% | .62% | .63% | .63% |
| Expenses net of fee waivers, if any | .61%H | .62% | .62% | .62% | .63% | .63% |
| Expenses net of all reductions | .60%H | .62% | .61% | .62% | .62% | .63% |
| Net investment income (loss) | .54%H | .48% | .88% | .62% | .74% | .68% |
| Supplemental Data | | | | | | |
| Net assets, end of period (000 omitted) | $1,735,241 | $1,579,450 | $843,080 | $1,141,305 | $1,463,407 | $1,360,134 |
| Portfolio turnover rateI | 52%H | 44% | 34% | 47% | 31% | 30% |
A Calculated based on average shares outstanding during the period.
B Total distributions per share do not sum due to rounding.
C Total returns for periods of less than one year are not annualized.
D Total returns do not reflect charges attributable to your insurance company's separate account. Inclusion of these charges would reduce the total returns shown.
E Total returns would have been lower if certain expenses had not been reduced during the applicable periods shown.
F Fees and expenses of any underlying mutual funds or exchange-traded funds (ETFs) are not included in the Fund's expense ratio. The Fund indirectly bears its proportionate share of these expenses. For additional expense information related to investments in Fidelity Central Funds, please refer to the "Investments in Fidelity Central Funds" note found in the Notes to Financial Statements section of the most recent Annual or Semi-Annual report.
G Expense ratios reflect operating expenses of the class. Expenses before reductions do not reflect amounts reimbursed, waived, or reduced through arrangements with the investment adviser, brokerage services, or other offset arrangements, if applicable, and do not represent the amount paid by the class during periods when reimbursements, waivers or reductions occur.
H Annualized
I Amount does not include the portfolio activity of any underlying mutual funds or exchange-traded funds (ETFs).
See accompanying notes which are an integral part of the financial statements.
VIP Mid Cap Portfolio Service Class
| | Six months ended (Unaudited) June 30, | Years endedDecember 31, | | | | |
| | 2021 | 2020 | 2019 | 2018 | 2017 | 2016 |
| Selected Per–Share Data | | | | | | |
| Net asset value, beginning of period | $38.28 | $32.59 | $29.90 | $38.60 | $33.70 | $32.41 |
| Income from Investment Operations | | | | | | |
| Net investment income (loss)A | .09 | .12 | .24 | .19 | .23 | .18 |
| Net realized and unrealized gain (loss) | 5.87 | 5.74 | 6.33 | (5.42) | 6.52 | 3.23 |
| Total from investment operations | 5.96 | 5.86 | 6.57 | (5.23) | 6.75 | 3.41 |
| Distributions from net investment income | – | (.17) | (.25) | (.20) | (.22) | (.14) |
| Distributions from net realized gain | (.15) | – | (3.63) | (3.27) | (1.63) | (1.99) |
| Total distributions | (.15) | (.17) | (3.88) | (3.47) | (1.85) | (2.12)B |
| Net asset value, end of period | $44.09 | $38.28 | $32.59 | $29.90 | $38.60 | $33.70 |
| Total ReturnC,D,E | 15.60% | 18.04% | 23.35% | (14.64)% | 20.70% | 12.11% |
| Ratios to Average Net AssetsF,G | | | | | | |
| Expenses before reductions | .71%H | .72% | .72% | .72% | .73% | .73% |
| Expenses net of fee waivers, if any | .71%H | .72% | .72% | .72% | .73% | .73% |
| Expenses net of all reductions | .70%H | .72% | .71% | .72% | .72% | .73% |
| Net investment income (loss) | .44%H | .38% | .78% | .52% | .64% | .58% |
| Supplemental Data | | | | | | |
| Net assets, end of period (000 omitted) | $701,445 | $642,654 | $564,678 | $504,156 | $629,727 | $566,378 |
| Portfolio turnover rateI | 52%H | 44% | 34% | 47% | 31% | 30% |
A Calculated based on average shares outstanding during the period.
B Total distributions per share do not sum due to rounding.
C Total returns for periods of less than one year are not annualized.
D Total returns do not reflect charges attributable to your insurance company's separate account. Inclusion of these charges would reduce the total returns shown.
E Total returns would have been lower if certain expenses had not been reduced during the applicable periods shown.
F Fees and expenses of any underlying mutual funds or exchange-traded funds (ETFs) are not included in the Fund's expense ratio. The Fund indirectly bears its proportionate share of these expenses. For additional expense information related to investments in Fidelity Central Funds, please refer to the "Investments in Fidelity Central Funds" note found in the Notes to Financial Statements section of the most recent Annual or Semi-Annual report.
G Expense ratios reflect operating expenses of the class. Expenses before reductions do not reflect amounts reimbursed, waived, or reduced through arrangements with the investment adviser, brokerage services, or other offset arrangements, if applicable, and do not represent the amount paid by the class during periods when reimbursements, waivers or reductions occur.
H Annualized
I Amount does not include the portfolio activity of any underlying mutual funds or exchange-traded funds (ETFs).
See accompanying notes which are an integral part of the financial statements.
VIP Mid Cap Portfolio Service Class 2
| | Six months ended (Unaudited) June 30, | Years endedDecember 31, | | | | |
| | 2021 | 2020 | 2019 | 2018 | 2017 | 2016 |
| Selected Per–Share Data | | | | | | |
| Net asset value, beginning of period | $37.29 | $31.75 | $29.22 | $37.79 | $33.03 | $31.83 |
| Income from Investment Operations | | | | | | |
| Net investment income (loss)A | .06 | .07 | .19 | .13 | .17 | .13 |
| Net realized and unrealized gain (loss) | 5.70 | 5.59 | 6.18 | (5.28) | 6.39 | 3.16 |
| Total from investment operations | 5.76 | 5.66 | 6.37 | (5.15) | 6.56 | 3.29 |
| Distributions from net investment income | – | (.12) | (.21) | (.15) | (.17) | (.10) |
| Distributions from net realized gain | (.15) | – | (3.63) | (3.27) | (1.63) | (1.99) |
| Total distributions | (.15) | (.12) | (3.84) | (3.42) | (1.80) | (2.09) |
| Net asset value, end of period | $42.90 | $37.29 | $31.75 | $29.22 | $37.79 | $33.03 |
| Total ReturnB,C,D | 15.48% | 17.87% | 23.17% | (14.77)% | 20.54% | 11.92% |
| Ratios to Average Net AssetsE,F | | | | | | |
| Expenses before reductions | .86%G | .87% | .87% | .87% | .88% | .88% |
| Expenses net of fee waivers, if any | .86%G | .87% | .87% | .87% | .88% | .88% |
| Expenses net of all reductions | .85%G | .87% | .86% | .87% | .87% | .88% |
| Net investment income (loss) | .29%G | .23% | .63% | .37% | .49% | .43% |
| Supplemental Data | | | | | | |
| Net assets, end of period (000 omitted) | $5,125,734 | $4,807,908 | $5,282,468 | $4,526,446 | $6,070,380 | $5,746,266 |
| Portfolio turnover rateH | 52%G | 44% | 34% | 47% | 31% | 30% |
A Calculated based on average shares outstanding during the period.
B Total returns for periods of less than one year are not annualized.
C Total returns do not reflect charges attributable to your insurance company's separate account. Inclusion of these charges would reduce the total returns shown.
D Total returns would have been lower if certain expenses had not been reduced during the applicable periods shown.
E Fees and expenses of any underlying mutual funds or exchange-traded funds (ETFs) are not included in the Fund's expense ratio. The Fund indirectly bears its proportionate share of these expenses. For additional expense information related to investments in Fidelity Central Funds, please refer to the "Investments in Fidelity Central Funds" note found in the Notes to Financial Statements section of the most recent Annual or Semi-Annual report.
F Expense ratios reflect operating expenses of the class. Expenses before reductions do not reflect amounts reimbursed, waived, or reduced through arrangements with the investment adviser, brokerage services, or other offset arrangements, if applicable, and do not represent the amount paid by the class during periods when reimbursements, waivers or reductions occur.
G Annualized
H Amount does not include the portfolio activity of any underlying mutual funds or exchange-traded funds (ETFs).
See accompanying notes which are an integral part of the financial statements.
VIP Mid Cap Portfolio Investor Class
| | Six months ended (Unaudited) June 30, | Years endedDecember 31, | | | | |
| | 2021 | 2020 | 2019 | 2018 | 2017 | 2016 |
| Selected Per–Share Data | | | | | | |
| Net asset value, beginning of period | $38.44 | $32.72 | $30.01 | $38.72 | $33.80 | $32.50 |
| Income from Investment Operations | | | | | | |
| Net investment income (loss)A | .10 | .12 | .25 | .20 | .23 | .19 |
| Net realized and unrealized gain (loss) | 5.88 | 5.78 | 6.34 | (5.43) | 6.55 | 3.24 |
| Total from investment operations | 5.98 | 5.90 | 6.59 | (5.23) | 6.78 | 3.43 |
| Distributions from net investment income | – | (.18) | (.26) | (.21) | (.23) | (.14) |
| Distributions from net realized gain | (.15) | – | (3.63) | (3.27) | (1.63) | (1.99) |
| Total distributions | (.15) | (.18) | (3.88)B | (3.48) | (1.86) | (2.13) |
| Net asset value, end of period | $44.27 | $38.44 | $32.72 | $30.01 | $38.72 | $33.80 |
| Total ReturnC,D,E | 15.59% | 18.08% | 23.35% | (14.60)% | 20.72% | 12.13% |
| Ratios to Average Net AssetsF,G | | | | | | |
| Expenses before reductions | .68%H | .70% | .70% | .70% | .71% | .71% |
| Expenses net of fee waivers, if any | .68%H | .70% | .70% | .70% | .71% | .71% |
| Expenses net of all reductions | .67%H | .69% | .69% | .70% | .71% | .71% |
| Net investment income (loss) | .46%H | .41% | .80% | .54% | .65% | .60% |
| Supplemental Data | | | | | | |
| Net assets, end of period (000 omitted) | $697,594 | $593,584 | $583,760 | $530,794 | $658,785 | $561,609 |
| Portfolio turnover rateI | 52%H | 44% | 34% | 47% | 31% | 30% |
A Calculated based on average shares outstanding during the period.
B Total distributions per share do not sum due to rounding.
C Total returns for periods of less than one year are not annualized.
D Total returns do not reflect charges attributable to your insurance company's separate account. Inclusion of these charges would reduce the total returns shown.
E Total returns would have been lower if certain expenses had not been reduced during the applicable periods shown.
F Fees and expenses of any underlying mutual funds or exchange-traded funds (ETFs) are not included in the Fund's expense ratio. The Fund indirectly bears its proportionate share of these expenses. For additional expense information related to investments in Fidelity Central Funds, please refer to the "Investments in Fidelity Central Funds" note found in the Notes to Financial Statements section of the most recent Annual or Semi-Annual report.
G Expense ratios reflect operating expenses of the class. Expenses before reductions do not reflect amounts reimbursed, waived, or reduced through arrangements with the investment adviser, brokerage services, or other offset arrangements, if applicable, and do not represent the amount paid by the class during periods when reimbursements, waivers or reductions occur.
H Annualized
I Amount does not include the portfolio activity of any underlying mutual funds or exchange-traded funds (ETFs).
See accompanying notes which are an integral part of the financial statements.
Notes to Financial Statements (Unaudited)
For the period ended June 30, 2021
1. Organization.
VIP Mid Cap Portfolio (the Fund) is a fund of Variable Insurance Products Fund III (the Trust) and is authorized to issue an unlimited number of shares. The Trust is registered under the Investment Company Act of 1940, as amended (the 1940 Act), as an open-end management investment company organized as a Massachusetts business trust. Shares of the Fund may only be purchased by insurance companies for the purpose of funding variable annuity or variable life insurance contracts. The Fund offers the following classes of shares: Initial Class shares, Service Class shares, Service Class 2 shares and Investor Class shares. All classes have equal rights and voting privileges, except for matters affecting a single class.
2. Investments in Fidelity Central Funds.
Funds may invest in Fidelity Central Funds, which are open-end investment companies generally available only to other investment companies and accounts managed by the investment adviser and its affiliates. The Schedule of Investments lists any Fidelity Central Funds held as an investment as of period end, but does not include the underlying holdings of each Fidelity Central Fund. An investing fund indirectly bears its proportionate share of the expenses of the underlying Fidelity Central Funds.
Based on its investment objective, each Fidelity Central Fund may invest or participate in various investment vehicles or strategies that are similar to those of the investing fund. These strategies are consistent with the investment objectives of the investing fund and may involve certain economic risks which may cause a decline in value of each of the Fidelity Central Funds and thus a decline in the value of the investing fund.
| Fidelity Central Fund | Investment Manager | Investment Objective | Investment Practices | Expense Ratio(a) |
| Fidelity Money Market Central Funds | Fidelity Management & Research Company LLC (FMR) | Each fund seeks to obtain a high level of current income consistent with the preservation of capital and liquidity. | Short-term Investments | Less than .005% to .01% |
(a) Expenses expressed as a percentage of average net assets and are as of each underlying Central Fund's most recent annual or semi-annual shareholder report.
A complete unaudited list of holdings for each Fidelity Central Fund is available upon request or at the Securities and Exchange Commission website at www.sec.gov. In addition, the financial statements of the Fidelity Central Funds which contain the significant accounting policies (including investment valuation policies) of those funds, and are not covered by the Report of Independent Registered Public Accounting Firm, are available on the Securities and Exchange Commission website or upon request.
3. Significant Accounting Policies.
The Fund is an investment company and applies the accounting and reporting guidance of the Financial Accounting Standards Board (FASB) Accounting Standards Codification Topic 946 Financial Services - Investment Companies. The financial statements have been prepared in conformity with accounting principles generally accepted in the United States of America (GAAP), which require management to make certain estimates and assumptions at the date of the financial statements. Actual results could differ from those estimates. Subsequent events, if any, through the date that the financial statements were issued have been evaluated in the preparation of the financial statements. The Fund's Schedule of Investments lists any underlying mutual funds or exchange-traded funds (ETFs) but does not include the underlying holdings of these funds. The following summarizes the significant accounting policies of the Fund:
Investment Valuation. Investments are valued as of 4:00 p.m. Eastern time on the last calendar day of the period. The Board of Trustees (the Board) has delegated the day to day responsibility for the valuation of the Fund's investments to the Fair Value Committee (the Committee) established by the Fund's investment adviser. In accordance with valuation policies and procedures approved by the Board, the Fund attempts to obtain prices from one or more third party pricing vendors or brokers to value its investments. When current market prices, quotations or currency exchange rates are not readily available or reliable, investments will be fair valued in good faith by the Committee, in accordance with procedures adopted by the Board. Factors used in determining fair value vary by investment type and may include market or investment specific events. The frequency with which these procedures are used cannot be predicted and they may be utilized to a significant extent. The Committee oversees the Fund's valuation policies and procedures and reports to the Board on the Committee's activities and fair value determinations. The Board monitors the appropriateness of the procedures used in valuing the Fund's investments and ratifies the fair value determinations of the Committee.
The Fund categorizes the inputs to valuation techniques used to value its investments into a disclosure hierarchy consisting of three levels as shown below:
- Level 1 – quoted prices in active markets for identical investments
- Level 2 – other significant observable inputs (including quoted prices for similar investments, interest rates, prepayment speeds, etc.)
- Level 3 – unobservable inputs (including the Fund's own assumptions based on the best information available)
Valuation techniques used to value the Fund's investments by major category are as follows:
Equity securities, including restricted securities, for which market quotations are readily available, are valued at the last reported sale price or official closing price as reported by a third party pricing vendor on the primary market or exchange on which they are traded and are categorized as Level 1 in the hierarchy. In the event there were no sales during the day or closing prices are not available, securities are valued at the last quoted bid price or may be valued using the last available price and are generally categorized as Level 2 in the hierarchy. For foreign equity securities, when market or security specific events arise, comparisons to the valuation of American Depositary Receipts (ADRs), futures contracts, Exchange-Traded Funds (ETFs) and certain indexes as well as quoted prices for similar securities may be used and would be categorized as Level 2 in the hierarchy. For equity securities, including restricted securities, where observable inputs are limited, assumptions about market activity and risk are used and these securities may be categorized as Level 3 in the hierarchy.
Investments in open-end mutual funds, including the Fidelity Central Funds, are valued at their closing net asset value (NAV) each business day and are categorized as Level 1 in the hierarchy.
Changes in valuation techniques may result in transfers in or out of an assigned level within the disclosure hierarchy. The aggregate value of investments by input level as of June 30, 2021 is included at the end of the Fund's Schedule of Investments.
Foreign Currency. Certain Funds may use foreign currency contracts to facilitate transactions in foreign-denominated securities. Gains and losses from these transactions may arise from changes in the value of the foreign currency or if the counterparties do not perform under the contracts' terms.
Foreign-denominated assets, including investment securities, and liabilities are translated into U.S. dollars at the exchange rates at period end. Purchases and sales of investment securities, income and dividends received, and expenses denominated in foreign currencies are translated into U.S. dollars at the exchange rate in effect on the transaction date.
The effects of exchange rate fluctuations on investments are included with the net realized and unrealized gain (loss) on investment securities. Other foreign currency transactions resulting in realized and unrealized gain (loss) are disclosed separately.
Investment Transactions and Income. For financial reporting purposes, the Fund's investment holdings and NAV include trades executed through the end of the last business day of the period. The NAV per share for processing shareholder transactions is calculated as of the close of business of the New York Stock Exchange (NYSE), normally 4:00 p.m. Eastern time and includes trades executed through the end of the prior business day. Gains and losses on securities sold are determined on the basis of identified cost and include proceeds received from litigation. Dividend income is recorded on the ex-dividend date, except for certain dividends from foreign securities where the ex-dividend date may have passed, which are recorded as soon as the Fund is informed of the ex-dividend date. Non-cash dividends included in dividend income, if any, are recorded at the fair market value of the securities received. Income and capital gain distributions from Fidelity Central Funds, if any, are recorded on the ex-dividend date. Certain distributions received by the Fund represent a return of capital or capital gain. The Fund determines the components of these distributions subsequent to the ex-dividend date, based upon receipt of tax filings or other correspondence relating to the underlying investment. These distributions are recorded as a reduction of cost of investments and/or as a realized gain. Investment income is recorded net of foreign taxes withheld where recovery of such taxes is uncertain.
Class Allocations and Expenses. Investment income, realized and unrealized capital gains and losses, common expenses of a fund, and certain fund-level expense reductions, if any, are allocated daily on a pro-rata basis to each class based on the relative net assets of each class to the total net assets of a fund. Each class differs with respect to transfer agent and distribution and service plan fees incurred, as applicable. Certain expense reductions may also differ by class, if applicable. For the reporting period, the allocated portion of income and expenses to each class as a percent of its average net assets may vary due to the timing of recording these transactions in relation to fluctuating net assets of the classes. Expenses directly attributable to a fund are charged to that fund. Expenses attributable to more than one fund are allocated among the respective funds on the basis of relative net assets or other appropriate methods. Expenses included in the accompanying financial statements reflect the expenses of that fund and do not include any expenses associated with any underlying mutual funds or exchange-traded funds. Although not included in a fund's expenses, a fund indirectly bears its proportionate share of these expenses through the net asset value of each underlying mutual fund or exchange-traded fund. Expense estimates are accrued in the period to which they relate and adjustments are made when actual amounts are known.
Deferred Trustee Compensation. Under a Deferred Compensation Plan (the Plan) for certain Funds, certain independent Trustees have elected to defer receipt of a portion of their annual compensation. Deferred amounts are invested in affiliated mutual funds, are marked-to-market and remain in a fund until distributed in accordance with the Plan. The investment of deferred amounts and the offsetting payable to the Trustees presented below are included in the accompanying Statement of Assets and Liabilities in other receivables and other payables and accrued expenses, as applicable.
| VIP Mid Cap Portfolio | $68,215 |
Income Tax Information and Distributions to Shareholders. Each year, the Fund intends to qualify as a regulated investment company under Subchapter M of the Internal Revenue Code, including distributing substantially all of its taxable income and realized gains. As a result, no provision for U.S. Federal income taxes is required. The Fund files a U.S. federal tax return, in addition to state and local tax returns as required. The Fund's federal income tax returns are subject to examination by the Internal Revenue Service (IRS) for a period of three fiscal years after they are filed. State and local tax returns may be subject to examination for an additional fiscal year depending on the jurisdiction. Foreign taxes are provided for based on the Fund's understanding of the tax rules and rates that exist in the foreign markets in which it invests.
Distributions are declared and recorded on the ex-dividend date. Income and capital gain distributions are declared separately for each class. Income and capital gain distributions are determined in accordance with income tax regulations, which may differ from GAAP.
Capital accounts within the financial statements are adjusted for permanent book-tax differences. These adjustments have no impact on net assets or the results of operations. Capital accounts are not adjusted for temporary book-tax differences which will reverse in a subsequent period.
Book-tax differences are primarily due to foreign currency transactions, passive foreign investment companies (PFIC), deferred trustees compensation, capital loss carryforwards and losses deferred due to wash sales.
As of period end, the cost and unrealized appreciation (depreciation) in securities, and derivatives if applicable, for federal income tax purposes were as follows:
| Gross unrealized appreciation | $2,746,815,712 |
| Gross unrealized depreciation | (91,596,640) |
| Net unrealized appreciation (depreciation) | $2,655,219,072 |
| Tax cost | $5,685,664,495 |
4. Purchases and Sales of Investments.
Purchases and sales of securities, other than short-term securities and in-kind transactions, as applicable, are noted in the table below.
| | Purchases ($) | Sales ($) |
| VIP Mid Cap Portfolio | 2,074,425,937 | 2,586,591,592 |
5. Fees and Other Transactions with Affiliates.
Management Fee. Fidelity Management & Research Company LLC (the investment adviser) and its affiliates provide the Fund with investment management related services for which the Fund pays a monthly management fee. The management fee is the sum of an individual fund fee rate that is based on an annual rate of .30% of the Fund's average net assets and an annualized group fee rate that averaged .23% during the period. The group fee rate is based upon the monthly average net assets of a group of registered investment companies with which the investment adviser has management contracts. The group fee rate decreases as assets under management increase and increases as assets under management decrease. For the reporting period, the total annualized management fee rate was .53% of the Fund's average net assets.
Distribution and Service Plan Fees. In accordance with Rule 12b-1 of the 1940 Act, the Fund has adopted separate 12b-1 Plans for each Service Class of shares. Each Service Class pays Fidelity Distributors Company LLC (FDC), an affiliate of the investment adviser, a service fee. For the period, the service fee is based on an annual rate of .10% of Service Class' average net assets and .25% of Service Class 2's average net assets.
For the period, total fees, all of which were re-allowed to insurance companies for the distribution of shares and providing shareholder support services, were as follows:
| Service Class | $345,566 |
| Service Class 2 | 6,377,697 |
| | $6,723,263 |
Transfer Agent Fees. Fidelity Investments Institutional Operations Company LLC (FIIOC), an affiliate of the investment adviser, is the Fund's transfer, dividend disbursing, and shareholder servicing agent. FIIOC receives an asset-based fee with respect to each class. Each class pays a fee for transfer agent services, typesetting and printing and mailing of shareholder reports, excluding mailing of proxy statements. For the period, transfer agent fees for each class were as follows:
| | Amount | % of Class-Level Average Net Assets(a) |
| Initial Class | $542,747 | .06 |
| Service Class | 219,678 | .06 |
| Service Class 2 | 1,621,601 | .06 |
| Investor Class | 466,799 | .14 |
| | $2,850,825 | |
(a) Annualized
Accounting Fees. Fidelity Service Company, Inc. (FSC), an affiliate of the investment adviser, maintains the Fund's accounting records. The accounting fee is based on the level of average net assets for each month. For the period, the fees were equivalent to the following annualized rates:
| | % of Average Net Assets |
| VIP Mid Cap Portfolio | .01 |
Brokerage Commissions. A portion of portfolio transactions were placed with brokerage firms which are affiliates of the investment adviser. Brokerage commissions are included in net realized gain (loss) and change in net unrealized appreciation (depreciation) in the Statement of Operations. The commissions paid to these affiliated firms were as follows:
| | Amount |
| VIP Mid Cap Portfolio | $50,554 |
Interfund Lending Program. Pursuant to an Exemptive Order issued by the Securities and Exchange Commission (the SEC), the Fund, along with other registered investment companies having management contracts with Fidelity Management & Research Company LLC (FMR), or other affiliated entities of FMR, may participate in an interfund lending program. This program provides an alternative credit facility allowing the Fund to borrow from, or lend money to, other participating affiliated funds. At period end, there were no interfund loans outstanding. Activity in this program during the period for which loans were outstanding was as follows:
| | Borrower or Lender | Average Loan Balance | Weighted Average Interest Rate | Interest Expense |
| VIP Mid Cap Portfolio | Borrower | $ 8,232,500 | .32% | $ 145 |
Interfund Trades. Funds may purchase from or sell securities to other Fidelity Funds under procedures adopted by the Board. The procedures have been designed to ensure these interfund trades are executed in accordance with Rule 17a-7 of the 1940 Act. Any interfund trades are included within the respective purchases and sales amounts shown in the Purchases and Sales of Investments note and are noted in the table below.
| | Purchases ($) | Sales ($) |
| VIP Mid Cap Portfolio | 69,410,583 | 121,233,919 |
6. Committed Line of Credit.
Certain Funds participate with other funds managed by the investment adviser or an affiliate in a $4.25 billion credit facility (the "line of credit") to be utilized for temporary or emergency purposes to fund shareholder redemptions or for other short-term liquidity purposes. The participating funds have agreed to pay commitment fees on their pro-rata portion of the line of credit, which are reflected in Miscellaneous expenses on the Statement of Operations, and are listed below. During the period, there were no borrowings on this line of credit.
| | Amount |
| VIP Mid Cap Portfolio | $7,615 |
7. Security Lending.
Funds lend portfolio securities from time to time in order to earn additional income. Lending agents are used, including National Financial Services (NFS), an affiliate of the investment adviser. Pursuant to a securities lending agreement, NFS will receive a fee, which is capped at 9.9% of a fund's daily lending revenue, for its services as lending agent. A fund may lend securities to certain qualified borrowers, including NFS. On the settlement date of the loan, a fund receives collateral (in the form of U.S. Treasury obligations, letters of credit and/or cash) against the loaned securities and maintains collateral in an amount not less than 100% of the market value of the loaned securities during the period of the loan. The market value of the loaned securities is determined at the close of business of a fund and any additional required collateral is delivered to a fund on the next business day. A fund or borrower may terminate the loan at any time, and if the borrower defaults on its obligation to return the securities loaned because of insolvency or other reasons, a fund may apply collateral received from the borrower against the obligation. A fund may experience delays and costs in recovering the securities loaned. Any cash collateral received is invested in the Fidelity Securities Lending Cash Central Fund. Any loaned securities are identified as such in the Schedule of Investments, and the value of loaned securities and cash collateral at period end, as applicable, are presented in the Statement of Assets and Liabilities. Security lending income represents the income earned on investing cash collateral, less rebates paid to borrowers and any lending agent fees associated with the loan, plus any premium payments received for lending certain types of securities. Security lending income is presented in the Statement of Operations as a component of income from Fidelity Central Funds. Affiliated security lending activity, if any, was as follows:
| | Total Security Lending Fees Paid to NFS | Security Lending Income From Securities Loaned to NFS | Value of Securities Loaned to NFS at Period End |
| VIP Mid Cap Portfolio | $3,690 | $757 | $– |
8. Expense Reductions.
Commissions paid to certain brokers with whom the investment adviser, or its affiliates, places trades on behalf of the Fund include an amount in addition to trade execution, which may be rebated back to the Fund to offset expenses. This amount totaled $360,254 for the period. In addition, through arrangements with the Fund's custodian, credits realized as a result of certain uninvested cash balances were used to reduce the Fund's expenses. During the period, custodian credits reduced the Fund's expenses by $93.
In addition, during the period the investment adviser or an affiliate reimbursed and/or waived a portion of fund-level operating expenses in the amount of $11,266.
9. Distributions to Shareholders.
Distributions to shareholders of each class were as follows:
| | Six months ended
June 30, 2021 | Year ended
December 31, 2020 |
| VIP Mid Cap Portfolio | | |
| Distributions to shareholders | | |
| Initial Class | $6,067,953 | $7,591,233 |
| Service Class | 2,493,507 | 2,947,263 |
| Service Class 2 | 19,063,385 | 17,182,216 |
| Investor Class | 2,328,564 | 2,888,965 |
| Total | $29,953,409 | $30,609,677 |
10. Share Transactions.
Transactions for each class of shares were as follows and may contain in-kind transactions:
| | Shares | Shares | Dollars | Dollars |
| | Six months ended June 30, 2021 | Year ended December 31, 2020 | Six months ended June 30, 2021 | Year ended December 31, 2020 |
| VIP Mid Cap Portfolio | | | | |
| Initial Class | | | | |
| Shares sold | 804,472 | 21,181,826 | $34,547,398 | $546,687,174 |
| Reinvestment of distributions | 146,040 | 211,540 | 6,067,953 | 7,591,233 |
| Shares redeemed | (2,847,509) | (6,180,803) | (121,369,555) | (191,581,574) |
| Net increase (decrease) | (1,896,997) | 15,212,563 | $(80,754,204) | $362,696,833 |
| Service Class | | | | |
| Shares sold | 237,054 | 1,939,735 | $10,138,594 | $53,696,565 |
| Reinvestment of distributions | 60,699 | 84,002 | 2,493,507 | 2,947,263 |
| Shares redeemed | (1,173,990) | (2,562,942) | (49,491,120) | (78,898,820) |
| Net increase (decrease) | (876,237) | (539,205) | $(36,859,019) | $(22,254,992) |
| Service Class 2 | | | | |
| Shares sold | 2,492,595 | 15,456,377 | $103,752,855 | $410,010,791 |
| Reinvestment of distributions | 476,585 | 508,274 | 19,063,385 | 17,182,216 |
| Shares redeemed | (12,439,618) | (53,411,317) | (510,070,037) | (1,466,060,643) |
| Net increase (decrease) | (9,470,438) | (37,446,666) | $(387,253,797) | $(1,038,867,636) |
| Investor Class | | | | |
| Shares sold | 673,075 | 938,949 | $28,734,723 | $28,839,304 |
| Reinvestment of distributions | 56,450 | 82,157 | 2,328,564 | 2,888,965 |
| Shares redeemed | (414,722) | (3,419,543) | (17,471,777) | (101,367,726) |
| Net increase (decrease) | 314,803 | (2,398,437) | $13,591,510 | $(69,639,457) |
11. Other.
Fund's organizational documents provide former and current trustees and officers with a limited indemnification against liabilities arising in connection with the performance of their duties to the fund. In the normal course of business, the fund may also enter into contracts that provide general indemnifications. The fund's maximum exposure under these arrangements is unknown as this would be dependent on future claims that may be made against the fund. The risk of material loss from such claims is considered remote.
At the end of the period, the investment adviser or its affiliates were owners of record of more than 10% and certain otherwise unaffiliated shareholders were owners of record of more than 10% of the outstanding shares as follows:
| Fund | Affiliated % | Number of
Unaffiliated Shareholders | Unaffiliated Shareholders % |
| VIP Mid Cap Portfolio | 12% | 1 | 12% |
12. Coronavirus (COVID-19) Pandemic.
An outbreak of COVID-19 first detected in China during December 2019 has since spread globally and was declared a pandemic by the World Health Organization during March 2020. Developments that disrupt global economies and financial markets, such as the COVID-19 pandemic, may magnify factors that affect the Fund's performance.
Shareholder Expense Example
As a shareholder, you incur two types of costs: (1) transaction costs, which may include sales charges (loads) on purchase payments or redemption proceeds, as applicable and (2) ongoing costs, which generally include management fees, distribution and/or service (12b-1) fees and other Fund expenses. This Example is intended to help you understand your ongoing costs (in dollars) of investing in a fund and to compare these costs with the ongoing costs of investing in other mutual funds.
The Example is based on an investment of $1,000 invested at the beginning of the period and held for the entire period (January 1, 2021 to June 30, 2021).
Actual Expenses
The first line of the accompanying table provides information about actual account values and actual expenses. You may use the information in this line, together with the amount you invested, to estimate the expenses that you paid over the period. Simply divide your account value by $1,000.00 (for example, an $8,600 account value divided by $1,000.00 = 8.6), then multiply the result by the number in the first line for a class/Fund under the heading entitled "Expenses Paid During Period" to estimate the expenses you paid on your account during this period. If any fund is a shareholder of any underlying mutual funds or exchange-traded funds (ETFs) (the Underlying Funds), such fund indirectly bears its proportional share of the expenses of the Underlying Funds in addition to the direct expenses incurred presented in the table. These fees and expenses are not included in the annualized expense ratio used to calculate the expense estimate in the table below. The estimate of expenses does not include any fees or other expenses of any variable annuity or variable life insurance product. If they were, the estimate of expenses you paid during the period would be higher, and your ending account value would be lower.
Hypothetical Example for Comparison Purposes
The second line of the accompanying table provides information about hypothetical account values and hypothetical expenses based on the actual expense ratio and an assumed rate of return of 5% per year before expenses, which is not the actual return. The hypothetical account values and expenses may not be used to estimate the actual ending account balance or expenses you paid for the period. You may use this information to compare the ongoing costs of investing in the Fund and other funds. To do so, compare this 5% hypothetical example with the 5% hypothetical examples that appear in the shareholder reports of the other funds. If any fund is a shareholder of any Underlying Funds, such fund indirectly bears its proportional share of the expenses of the Underlying Funds in addition to the direct expenses as presented in the table. These fees and expenses are not included in the annualized expense ratio used to calculate the expense estimate in the table below. The estimate of expenses does not include any fees or other expenses of any variable annuity or variable life insurance product. If they were, the estimate of expenses you paid during the period would be higher, and your ending account value would be lower.
Please note that the expenses shown in the table are meant to highlight your ongoing costs only and do not reflect any transaction costs. Therefore, the second line of the table is useful in comparing ongoing costs only, and will not help you determine the relative total costs of owning different funds.
| | Annualized Expense Ratio-A | Beginning
Account Value
January 1, 2021 | Ending
Account Value
June 30, 2021 | Expenses Paid
During Period-B
January 1, 2021
to June 30, 2021 |
| VIP Mid Cap Portfolio | | | | |
| Initial Class | .61% | | | |
| Actual | | $1,000.00 | $1,156.30 | $3.26 |
| Hypothetical-C | | $1,000.00 | $1,021.77 | $3.06 |
| Service Class | .71% | | | |
| Actual | | $1,000.00 | $1,156.00 | $3.80 |
| Hypothetical-C | | $1,000.00 | $1,021.27 | $3.56 |
| Service Class 2 | .86% | | | |
| Actual | | $1,000.00 | $1,154.80 | $4.59 |
| Hypothetical-C | | $1,000.00 | $1,020.53 | $4.31 |
| Investor Class | .68% | | | |
| Actual | | $1,000.00 | $1,155.90 | $3.63 |
| Hypothetical-C | | $1,000.00 | $1,021.42 | $3.41 |
A Annualized expense ratio reflects expenses net of applicable fee waivers.
B Expenses are equal to the annualized expense ratio, multiplied by the average account value over the period, multiplied by 181/ 365 (to reflect the one-half year period). The fees and expenses of any Underlying Funds are not included in each annualized expense ratio.
C 5% return per year before expenses
Board Approval of Investment Advisory Contracts and Management Fees
VIP Mid Cap Portfolio
Each year, the Board of Trustees, including the Independent Trustees (together, the Board), votes on the renewal of the management contract with Fidelity Management & Research Company LLC (FMR) and the sub-advisory agreements (together, the Advisory Contracts) for the fund. FMR and the sub-advisers are referred to herein as the Investment Advisers. The Board, assisted by the advice of fund counsel and Independent Trustees' counsel, requests and considers a broad range of information relevant to the renewal of the Advisory Contracts throughout the year.
The Board meets regularly and, at each of its meetings, covers an extensive agenda of topics and materials and considers factors that are relevant to its annual consideration of the renewal of the fund's Advisory Contracts, including the services and support provided to the fund and its shareholders. The Board has established various standing committees (Committees), each composed of and chaired by Independent Trustees with varying backgrounds, to which the Board has assigned specific subject matter responsibilities in order to enhance effective decision-making by the Board. The Board, acting directly and through its Committees, requests and receives information concerning the annual consideration of the renewal of the fund's Advisory Contracts. The Board also meets as needed to review matters specifically related to the Board's annual consideration of the renewal of the Advisory Contracts. Members of the Board may also meet with trustees of other Fidelity funds through joint ad hoc committees to discuss certain matters relevant to all of the Fidelity funds.
Approval of Stub Period Continuation. At its January 2021 meeting, the Board of Trustees voted to continue the fund's management contract with FMR, and the sub-advisory agreements and sub-subadvisory agreements, in each case, where applicable (together, the Advisory Contracts), without modification, for four months from February 1, 2021 through May 31, 2021, in connection with changes to the Board's meeting calendar. The Board considered that the approval of the fund's Advisory Contracts will not result in any changes in (i) the investment process or strategies employed in the management of the fund's assets; (ii) the fees and expenses paid by shareholders; (iii) the nature, extent or quality of services provided under the fund's Advisory Contracts; or (iv) the day-to-day management of the fund or the persons primarily responsible for such management. The Board also considered that since its last approval of the fund's Advisory Contracts, FMR had provided additional information on the fund in support of the annual contract renewal process, including competitive analyses on total expenses and management fees and in-depth reviews of fund performance and fund profitability information. The Board also considered the findings of certain ad hoc committees that had been previously formed to discuss matters relevant to all of the Fidelity funds, including economies of scale, fall-out benefits and retail vs. institutional funds. The Board concluded that the fund's Advisory Contracts are fair and reasonable, and that the fund's Advisory Contracts should be renewed, without modification, through May 31, 2021, with the understanding that the Board will consider the annual renewal for a full one year period in May 2021.
At its May 2021 meeting, the Board unanimously determined to renew the fund's Advisory Contracts. In reaching its determination, the Board considered all factors it believed relevant, including (i) the nature, extent, and quality of the services provided to the fund and its shareholders (including the investment performance of the fund); (ii) the competitiveness of the fund's management fee and total expense ratio relative to peer funds; (iii) the total costs of the services provided by and the profits realized by Fidelity from its relationships with the fund; and (iv) the extent to which, if any, economies of scale exist and are realized as the fund grows, and whether any economies of scale are appropriately shared with fund shareholders.
In considering whether to renew the Advisory Contracts for the fund, the Board reached a determination, with the assistance of fund counsel and Independent Trustees' counsel and through the exercise of its business judgment, that the renewal of the Advisory Contracts was in the best interests of the fund and its shareholders and that the compensation payable under the Advisory Contracts was fair and reasonable. The Board's decision to renew the Advisory Contracts was not based on any single factor, but rather was based on a comprehensive consideration of all the information provided to the Board at its meetings throughout the year. The Board, in reaching its determination to renew the Advisory Contracts, was aware that shareholders of the fund have a broad range of investment choices available to them, including a wide choice among funds offered by Fidelity's competitors, and that the fund's shareholders, who have the opportunity to review and weigh the disclosure provided by the fund in its prospectus and other public disclosures, have chosen to invest in this fund, which is part of the Fidelity family of funds.
Nature, Extent, and Quality of Services Provided. The Board considered Fidelity's staffing as it relates to the fund, including the backgrounds of investment personnel of Fidelity, and also considered the fund's investment objective, strategies, and related investment philosophy. The Independent Trustees also had discussions with senior management of Fidelity's investment operations and investment groups. The Board considered the structure of the investment personnel compensation program and whether this structure provides appropriate incentives to act in the best interests of the fund. Additionally, the Board considered the portfolio managers' investments, if any, in the funds that they manage.
Resources Dedicated to Investment Management and Support Services. The Board and the Fund Oversight and Research Committees reviewed the general qualifications and capabilities of Fidelity's investment staff, including its size, education, experience, and resources, as well as Fidelity's approach to recruiting, training, managing, and compensating investment personnel. The Board noted that Fidelity has continued to increase the resources devoted to non-U.S. offices, including expansion of Fidelity's global investment organization. The Board also noted that Fidelity's analysts have extensive resources, tools and capabilities that allow them to conduct sophisticated quantitative and fundamental analysis, as well as credit analysis of issuers, counterparties and guarantors. Further, the Board considered that Fidelity's investment professionals have sufficient access to global information and data so as to provide competitive investment results over time, and that those professionals also have access to sophisticated tools that permit them to assess portfolio construction and risk and performance attribution characteristics continuously, as well as to transmit new information and research conclusions rapidly around the world. Additionally, in its deliberations, the Board considered Fidelity's trading, risk management, compliance, and technology and operations capabilities and resources, which are integral parts of the investment management process. The Board also considered Fidelity's investments in business continuity planning, and its success in continuously providing services to the fund notwithstanding the severe disruptions caused by the COVID-19 pandemic.
Shareholder and Administrative Services. The Board considered (i) the nature, extent, quality, and cost of advisory, administrative, and shareholder services performed by the Investment Advisers and their affiliates under the Advisory Contracts and under separate agreements covering transfer agency, pricing and bookkeeping, and securities lending services for the fund; (ii) the nature and extent of the supervision of third party service providers, principally custodians, subcustodians, and pricing vendors; and (iii) the resources devoted to, and the record of compliance with, the fund's compliance policies and procedures. The Board also reviewed the allocation of fund brokerage, including allocations to brokers affiliated with the Investment Advisers, the use of brokerage commissions to pay fund expenses, and the use of "soft" commission dollars to pay for research services.
The Board noted that the growth of fund assets over time across the complex allows Fidelity to reinvest in the development of services designed to enhance the value and convenience of the Fidelity funds as investment vehicles. These services include 24-hour access to account information and market information over the Internet and through telephone representatives, investor education materials and asset allocation tools, and the expanded availability of Fidelity Investor Centers.
The Board noted that, in the past, it and the boards of certain other Fidelity funds had formed an ad hoc Committee on Transfer Agency Fees to review the variety of transfer agency fee structures throughout the industry and Fidelity's competitive positioning with respect to industry participants.
Investment in a Large Fund Family. The Board considered the benefits to shareholders of investing in a Fidelity fund, including the benefits of investing in a fund that is part of a large family of funds offering a variety of investment disciplines and providing a large variety of mutual fund investor services. The Board noted that Fidelity had taken, or had made recommendations that resulted in the Fidelity funds taking, a number of actions over the previous year that benefited particular funds, including: (i) continuing to dedicate additional resources to Fidelity's investment research process, which includes meetings with management of issuers of securities in which the funds invest, and to the support of the senior management team that oversees asset management; (ii) continuing efforts to enhance Fidelity's global research capabilities; (iii) launching new funds and ETFs with innovative structures, strategies and pricing and making other enhancements to meet client needs; (iv) launching new share classes of existing funds; (v) eliminating purchase minimums and broadening eligibility requirements for certain funds and share classes; (vi) approving the reduction in the holding period for the Class C to Class A conversion policy; (vii) reducing management fees and total expenses for certain target date funds and classes and index funds; (viii) lowering expenses for certain existing funds and classes by implementing or lowering expense caps; (ix) rationalizing product lines and gaining increased efficiencies from fund mergers, liquidations, and share class consolidations; (x) continuing to develop, acquire and implement systems and technology to improve services to the funds and shareholders, strengthen information security, and increase efficiency; and (xi) continuing to implement enhancements to further strengthen Fidelity's product line to increase investors' probability of success in achieving their investment goals, including retirement income goals.
Investment Performance. The Board considered whether the fund has operated in accordance with its investment objective, as well as its record of compliance with its investment restrictions and its performance history. The Board noted that there was a portfolio management change for the fund in February 2019. The Board will continue to monitor closely the fund's performance, taking into account the portfolio management changes.
The Board took into account discussions that occur at Board meetings throughout the year with representatives of the Investment Advisers about fund investment performance. In this regard the Board noted that as part of regularly scheduled fund reviews and other reports to the Board on fund performance, the Board considers annualized return information for the fund for different time periods, measured against an appropriate securities market index (benchmark index) and an appropriate peer group of funds with similar objectives (peer group). In its evaluation of fund investment performance, the Board gave particular attention to information indicating changes in performance of certain Fidelity funds for specific time periods and discussed with the Investment Advisers the reasons for any overperformance or underperformance.
In addition to reviewing absolute and relative fund performance, the Independent Trustees periodically consider the appropriateness of fund performance metrics in evaluating the results achieved. In general, the Independent Trustees believe that fund performance should be evaluated based on net performance (after fees and expenses) of both the highest performing and lowest performing fund share classes, where applicable, compared to appropriate benchmark indices, over appropriate time periods that may include full market cycles, and compared to peer groups, as applicable, over the same periods, taking into account relevant factors including the following: general market conditions; issuer-specific information; and fund cash flows and other factors.
The Independent Trustees recognize that shareholders evaluate performance on a net basis over their own holding periods, for which one-, three-, and five-year periods are often used as a proxy. For this reason, the performance information reviewed by the Board also included net cumulative total return information for the fund and an appropriate benchmark index and peer group for the most recent one-, three-, and five-year periods ended September 30, 2020, as shown below. Returns are shown compared to the 25th percentile (top of box, 75% beaten) and 75th percentile (bottom of box, 25% beaten) of the peer universe.
VIP Mid Cap Portfolio
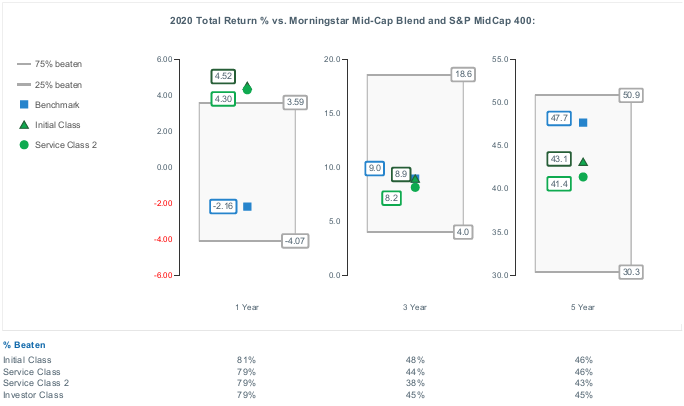
Based on its review, the Board concluded that the nature, extent, and quality of services provided to the fund under the Advisory Contracts should continue to benefit the shareholders of the fund.
Competitiveness of Management Fee and Total Expense Ratio. The Board considered the fund's management fee and total expense ratio compared to "mapped groups" of competitive funds and classes created for the purpose of facilitating the Trustees' competitive analysis of management fees and total expenses. Fidelity creates "mapped groups" by combining similar Lipper investment objective categories that have comparable investment mandates. Combining Lipper investment objective categories aids the Board's management fee and total expense ratio comparisons by broadening the competitive group used for comparison.
Management Fee. The Board considered two proprietary management fee comparisons for the 12-month periods ended September 30 (June 30 for periods ended 2019 and 2018 and December 31 for periods prior to 2018) shown in basis points (BP) in the chart below. The group of Lipper funds used by the Board for management fee comparisons is referred to below as the "Total Mapped Group." The Total Mapped Group comparison focuses on a fund's standing in terms of gross management fees before expense reimbursements or caps relative to the total universe of funds with comparable investment mandates, regardless of whether their management fee structures also are comparable. Funds with comparable investment mandates offer exposure to similar types of securities. Funds with comparable management fee structures have similar management fee contractual arrangements (
e.g., flat rate charged for advisory services, all-inclusive fee rate,
etc.). "TMG %" represents the percentage of funds in the Total Mapped Group that had management fees that were lower than the fund's. For example, a hypothetical TMG % of 20% would mean that 80% of the funds in the Total Mapped Group had higher, and 20% had lower, management fees than the fund. The fund's actual TMG %s and the number of funds in the Total Mapped Group are in the chart below. The "Asset-Sized Peer Group" (ASPG) comparison focuses on a fund's standing relative to a subset of non-Fidelity funds within the Total Mapped Group that are similar in size and management fee structure. For example, if a fund is in the first quartile of the ASPG, the fund's management fee ranks in the least expensive or lowest 25% of funds in the ASPG. The ASPG represents at least 15% of the funds in the Total Mapped Group with comparable asset size and management fee structures, subject to a minimum of 50 funds (or all funds in the Total Mapped Group if fewer than 50). Additional information, such as the ASPG quartile in which the fund's management fee rate ranked, is also included in the chart and was considered by the Board.
VIP Mid Cap Portfolio
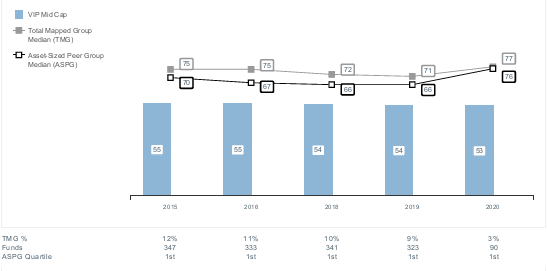
The Board noted that the fund's management fee rate ranked below the median of its Total Mapped Group and below the median of its ASPG for the 12-month period ended September 30, 2020.
The Board noted that, in the past, it and the boards of other Fidelity funds had formed an ad hoc Committee on Group Fee to conduct an in-depth review of the "group fee" component of the management fee of funds with such management fee structures. The Committee's focus included the mechanics of the group fee, the competitive landscape of group fee structures, Fidelity funds with no group fee component and investment products not included in group fee assets. The Board also considered that, for funds subject to the group fee, FMR agreed to voluntarily waive fees over a specified period of time in amounts designed to account for assets converted from certain funds to certain collective investment trusts.
The Board also noted that, in 2013, the ad hoc Committee on Management Fees was formed to conduct an in-depth review of the management fee rates of Fidelity's active equity mutual funds. The Committee focused on the following areas: (i) standard fee structures; (ii) research consumption and trading evolution; (iii) management fee competitiveness/profitability by category; and (iv) factors that drive institutional pricing.
Based on its review, the Board concluded that the fund's management fee is fair and reasonable in light of the services that the fund receives and the other factors considered.
Total Expense Ratio. In its review of each class's total expense ratio, the Board considered the fund's management fee rate as well as other fund or class expenses, as applicable, such as transfer agent fees, pricing and bookkeeping fees, fund-paid 12b-1 fees, and custodial, legal, and audit fees. The Board also noted that Fidelity may agree to waive fees or reimburse expenses from time to time, and the extent to which, if any, it has done so for the fund. As part of its review, the Board also considered the current and historical total expense ratios of each class of the fund compared to competitive fund median expenses. The fund's representative class is compared to those funds and classes in the Total Mapped Group (used by the Board for management fee comparisons) that have a similar sales load structure (SLTG). The Board also considered a total expense ASPG comparison for the representative class, which focuses on the total expenses of the representative class relative to a subset of non-Fidelity funds within the total expense SLTG. The total expense ASPG is limited to 15 larger and 15 smaller classes in fund average assets for a total of 30 classes, where possible. The total expense ASPG comparison excludes performance adjustments and fund-paid 12b-1 fees to eliminate variability in fee structures.
The Board noted that the total expense ratio of Initial Class ranked below the SLTG competitive median and below the ASPG competitive median for the 12-month period ended September 30, 2020.
Fees Charged to Other Fidelity Clients. The Board also considered Fidelity fee structures and other information with respect to clients of Fidelity, such as other funds advised or subadvised by Fidelity, pension plan clients, and other institutional clients with similar mandates. The Board noted that a joint ad hoc committee created by it and the boards of other Fidelity funds periodically reviews and compares Fidelity's institutional investment advisory business with its business of providing services to the Fidelity funds and also noted the most recent findings of the committee. The Board noted that the committee's review included a consideration of the differences in services provided, fees charged, and costs incurred, as well as competition in the markets serving the different categories of clients.
Based on its review of total expense ratios and fees charged to other Fidelity clients, the Board concluded that the total expense ratio of each class of the fund was reasonable in light of the services that the fund and its shareholders receive and the other factors considered.
Costs of the Services and Profitability. The Board considered the revenues earned and the expenses incurred by Fidelity in conducting the business of developing, marketing, distributing, managing, administering and servicing the fund and servicing the fund's shareholders. The Board also considered the level of Fidelity's profits in respect of all the Fidelity funds.
On an annual basis, Fidelity presents to the Board information about the profitability of its relationships with the fund. Fidelity calculates profitability information for each fund, as well as aggregate profitability information for groups of Fidelity funds and all Fidelity funds, using a series of detailed revenue and cost allocation methodologies which originate with the books and records of Fidelity on which Fidelity's audited financial statements are based. The Audit Committee of the Board reviews any significant changes from the prior year's methodologies and the full Board approves such changes.
A public accounting firm has been engaged annually by the Board as part of the Board's assessment of Fidelity's profitability analysis. The engagement includes the review and assessment of the methodologies used by Fidelity in determining the revenues and expenses attributable to Fidelity's mutual fund business, and completion of agreed-upon procedures in respect of the mathematical accuracy of certain fund profitability information and its conformity to established allocation methodologies. After considering the reports issued under the engagement and information provided by Fidelity, the Board concluded that while other allocation methods may also be reasonable, Fidelity's profitability methodologies are reasonable in all material respects.
The Board also reviewed Fidelity's non-fund businesses and potential indirect benefits such businesses may have received as a result of their association with Fidelity's mutual fund business (i.e., fall-out benefits) as well as cases where Fidelity's affiliates may benefit from the funds' business. The Board considered areas where potential indirect benefits to the Fidelity funds from their relationships with Fidelity may exist. The Board also considered that in 2019 a joint ad hoc committee created by it and the boards of other Fidelity funds evaluated potential fall-out benefits (PFOB Committee). The Board noted that it considered the PFOB Committee's findings in connection with its consideration of the renewal of the Advisory Contracts.
The Board considered the costs of the services provided by and the profits realized by Fidelity in connection with the operation of the fund, including the conclusions of the PFOB Committee, and was satisfied that the profitability was not excessive.
Economies of Scale. The Board considered whether there have been economies of scale in respect of the management of the Fidelity funds, whether the Fidelity funds (including the fund) have appropriately benefited from any such economies of scale, and whether there is potential for realization of any further economies of scale. The Board considered the extent to which the fund will benefit from economies of scale as assets grow through increased services to the fund, through waivers or reimbursements, or through fee or expense ratio reductions. The Board also noted that a committee (the Economies of Scale Committee) created by it and the boards of other Fidelity funds periodically analyzes whether Fidelity attains economies of scale in respect of the management and servicing of the Fidelity funds, whether the Fidelity funds have appropriately benefited from such economies of scale, and whether there is potential for realization of any further economies of scale.
The Board recognized that the fund's management contract incorporates a "group fee" structure, which provides for lower group fee rates as total "group assets" increase, and for higher group fee rates as total "group assets" decrease ("group assets" as defined in the management contract). FMR calculates the group fee rates based on a tiered asset "breakpoint" schedule that varies based on asset class. The Board considered that the group fee is designed to deliver the benefits of economies of scale to fund shareholders when total Fidelity fund assets increase, even if assets of any particular fund are unchanged or have declined, because some portion of Fidelity's costs are attributable to services provided to all Fidelity funds, and all funds benefit if those costs can be allocated among more assets. The Board further considered that Fidelity agreed to impose a temporary fee waiver in the form of additional breakpoints to the current breakpoint schedule. The Board concluded that, given the group fee structure, fund shareholders will benefit from lower management fees as "group assets" increase at the fund complex level, regardless of whether Fidelity achieves any such economies of scale.
The Board concluded, taking into account the analysis of the Economies of Scale Committee, that economies of scale, if any, are being appropriately shared between fund shareholders and Fidelity.
Additional Information Requested by the Board. In order to develop fully the factual basis for consideration of the Fidelity funds' advisory contracts, the Board requested and received additional information on certain topics, including: (i) fund flow and performance trends, in particular the underperformance of certain funds and strategies, and Fidelity's long-term strategies for certain funds; (ii) consideration of expanding the use of performance fees for additional funds; (iii) Fidelity's pricing philosophy compared to competitors; (iv) metrics for evaluating index fund and ETF performance and information about ETF trading characteristics; (v) the methodology with respect to evaluating competitive fund data and peer group classifications and fee and expense comparisons; (vi) the expense structures for different funds and classes and information about the differences between various expense structures; (vii) group fee breakpoints; (viii) information regarding other accounts managed by Fidelity and sub-advisory arrangements; and (ix) Fidelity's philosophies and strategies for evaluating funds and classes with lower or declining asset levels.
Based on its evaluation of all of the conclusions noted above, and after considering all factors it believed relevant, the Board concluded that the advisory fee arrangements are fair and reasonable, and that the fund's Advisory Contracts should be renewed.
Liquidity Risk Management Program
The Securities and Exchange Commission adopted Rule 22e-4 under the Investment Company Act of 1940 (the Liquidity Rule) to promote effective liquidity risk management throughout the open-end investment company industry, thereby reducing the risk that funds will be unable to meet their redemption obligations and mitigating dilution of the interests of fund shareholders.
The Fund has adopted and implemented a liquidity risk management program pursuant to the Liquidity Rule (the Program) effective December 1, 2018. The Program is reasonably designed to assess and manage the Fund’s liquidity risk and to comply with the requirements of the Liquidity Rule. The Fund’s Board of Trustees (the Board) has designated the Fund’s investment adviser as administrator of the Program. The Fidelity advisers have established a Liquidity Risk Management Committee (the LRM Committee) to manage the Program for each of the Fidelity Funds. The LRM Committee monitors the adequacy and effectiveness of implementation of the Program and on a periodic basis assesses each Fund’s liquidity risk based on a variety of factors including (1) the Fund’s investment strategy, (2) portfolio liquidity and cash flow projections during normal and reasonably foreseeable stressed conditions, (3) shareholder redemptions, (4) borrowings and other funding sources and (5) in the case of exchange-traded funds, certain additional factors including the effect of the Fund’s prices and spreads, market participants, and basket compositions on the overall liquidity of the Fund’s portfolio, as applicable.
In accordance with the Program, each of the Fund’s portfolio investments is classified into one of four liquidity categories described below based on a determination of a reasonable expectation for how long it would take to convert the investment to cash (or sell or dispose of the investment) without significantly changing its market value.
- Highly liquid investments – cash or convertible to cash within three business days or less
- Moderately liquid investments – convertible to cash in three to seven calendar days
- Less liquid investments – can be sold or disposed of, but not settled, within seven calendar days
- Illiquid investments – cannot be sold or disposed of within seven calendar days
Liquidity classification determinations take into account a variety of factors including various market, trading and investment-specific considerations, as well as market depth, and generally utilize analysis from a third-party liquidity metrics service.
The Liquidity Rule places a 15% limit on a fund’s illiquid investments and requires funds that do not primarily hold assets that are highly liquid investments to determine and maintain a minimum percentage of the fund’s net assets to be invested in highly liquid investments (highly liquid investment minimum or HLIM). The Program includes provisions reasonably designed to comply with the 15% limit on illiquid investments and for determining, periodically reviewing and complying with the HLIM requirement as applicable.
At a recent meeting of the Fund’s Board of Trustees, the LRM Committee provided a written report to the Board pertaining to the operation, adequacy, and effectiveness of implementation of the Program for the annual period from December 1, 2019 through November 30, 2020. The report concluded that the Program has been implemented and is operating effectively and is reasonably designed to assess and manage the Fund’s liquidity risk.
VIPMID-SANN-0821
1.723369.122
Fidelity® Variable Insurance Products:
Value Strategies Portfolio
Semi-Annual Report
June 30, 2021
Contents
To view a fund's proxy voting guidelines and proxy voting record for the 12-month period ended June 30, visit http://www.fidelity.com/proxyvotingresults or visit the Securities and Exchange Commission's (SEC) web site at http://www.sec.gov.
You may also call 1-877-208-0098 to request a free copy of the proxy voting guidelines.
Fidelity® Variable Insurance Products are separate account options which are purchased through a variable insurance contract.
Standard & Poor's, S&P and S&P 500 are registered service marks of The McGraw-Hill Companies, Inc. and have been licensed for use by Fidelity Distributors Corporation.
Other third-party marks appearing herein are the property of their respective owners.
All other marks appearing herein are registered or unregistered trademarks or service marks of FMR LLC or an affiliated company. © 2021 FMR LLC. All rights reserved.
This report and the financial statements contained herein are submitted for the general information of the shareholders of the Fund. This report is not authorized for distribution to prospective investors in the Fund unless preceded or accompanied by an effective prospectus.
A fund files its complete schedule of portfolio holdings with the SEC for the first and third quarters of each fiscal year on Form N-PORT. Forms N-PORT are available on the SEC’s web site at http://www.sec.gov. A fund's Forms N-PORT may be reviewed and copied at the SEC’s Public Reference Room in Washington, DC. Information regarding the operation of the SEC's Public Reference Room may be obtained by calling 1-800-SEC-0330.
For a complete list of a fund's portfolio holdings, view the most recent holdings listing, semiannual report, or annual report on Fidelity's web site at http://www.fidelity.com, http://www.institutional.fidelity.com, or http://www.401k.com, as applicable.
NOT FDIC INSURED •MAY LOSE VALUE •NO BANK GUARANTEE
Neither the Fund nor Fidelity Distributors Corporation is a bank.
Note to Shareholders:
Early in 2020, the outbreak and spread of a new coronavirus emerged as a public health emergency that had a major influence on financial markets, primarily based on its impact on the global economy and the outlook for corporate earnings. The virus causes a respiratory disease known as COVID-19. On March 11, 2020 the World Health Organization declared the COVID-19 outbreak a pandemic, citing sustained risk of further global spread.
In the weeks following, as the crisis worsened, we witnessed an escalating human tragedy with wide-scale social and economic consequences from coronavirus-containment measures. The outbreak of COVID-19 prompted a number of measures to limit the spread, including travel and border restrictions, quarantines, and restrictions on large gatherings. In turn, these resulted in lower consumer activity, diminished demand for a wide range of products and services, disruption in manufacturing and supply chains, and – given the wide variability in outcomes regarding the outbreak – significant market uncertainty and volatility. Amid the turmoil, global governments and central banks took unprecedented action to help support consumers, businesses, and the broader economies, and to limit disruption to financial systems.
The situation continues to unfold, and the extent and duration of its impact on financial markets and the economy remain highly uncertain. Extreme events such as the coronavirus crisis are “exogenous shocks” that can have significant adverse effects on mutual funds and their investments. Although multiple asset classes may be affected by market disruption, the duration and impact may not be the same for all types of assets.
Fidelity is committed to helping you stay informed amid news about COVID-19 and during increased market volatility, and we’re taking extra steps to be responsive to customer needs. We encourage you to visit our websites, where we offer ongoing updates, commentary, and analysis on the markets and our funds.
Investment Summary (Unaudited)
Top Ten Stocks as of June 30, 2021
| | % of fund's net assets |
| Cigna Corp. | 2.5 |
| Canadian Natural Resources Ltd. | 2.1 |
| CubeSmart | 2.1 |
| Equity Lifestyle Properties, Inc. | 1.9 |
| The AES Corp. | 1.8 |
| Cushman & Wakefield PLC | 1.8 |
| Edison International | 1.7 |
| Hess Corp. | 1.7 |
| Americold Realty Trust | 1.6 |
| Equinix, Inc. | 1.5 |
| | 18.7 |
Top Five Market Sectors as of June 30, 2021
| | % of fund's net assets |
| Financials | 19.5 |
| Industrials | 18.2 |
| Consumer Discretionary | 10.3 |
| Real Estate | 10.2 |
| Utilities | 8.5 |
Asset Allocation (% of fund's net assets)
| As of June 30, 2021* |
| | Stocks | 100.8% |
| | Short-Term Investments and Net Other Assets (Liabilities)** | (0.8)% |

* Foreign investments - 16.7%
** Short-Term Investments and Net Other Assets (Liabilities) are not included in the pie chart
Schedule of Investments June 30, 2021 (Unaudited)
Showing Percentage of Net Assets
| Common Stocks - 100.8% | | | |
| | | Shares | Value |
| COMMUNICATION SERVICES - 2.4% | | | |
| Diversified Telecommunication Services - 0.5% | | | |
| Liberty Global PLC Class C (a) | | 154,300 | $4,172,272 |
| Media - 1.9% | | | |
| Interpublic Group of Companies, Inc. | | 267,500 | 8,691,075 |
| Nexstar Broadcasting Group, Inc. Class A | | 37,700 | 5,575,076 |
| | | | 14,266,151 |
|
| TOTAL COMMUNICATION SERVICES | | | 18,438,423 |
|
| CONSUMER DISCRETIONARY - 10.3% | | | |
| Auto Components - 0.5% | | | |
| Adient PLC (a) | | 87,400 | 3,950,480 |
| Distributors - 1.3% | | | |
| LKQ Corp. (a) | | 197,200 | 9,706,184 |
| Diversified Consumer Services - 0.7% | | | |
| Laureate Education, Inc. Class A (a) | | 387,700 | 5,625,527 |
| Hotels, Restaurants & Leisure - 1.3% | | | |
| Caesars Entertainment, Inc. (a) | | 98,200 | 10,188,250 |
| Household Durables - 2.3% | | | |
| Mohawk Industries, Inc. (a) | | 52,502 | 10,090,359 |
| Taylor Morrison Home Corp. (a) | | 274,000 | 7,239,080 |
| | | | 17,329,439 |
| Internet & Direct Marketing Retail - 1.3% | | | |
| eBay, Inc. | | 142,700 | 10,018,967 |
| Leisure Products - 1.1% | | | |
| Mattel, Inc. (a) | | 413,400 | 8,309,340 |
| Specialty Retail - 1.8% | | | |
| Gap, Inc. | | 251,100 | 8,449,515 |
| Sally Beauty Holdings, Inc. (a) | | 258,500 | 5,705,095 |
| | | | 14,154,610 |
|
| TOTAL CONSUMER DISCRETIONARY | | | 79,282,797 |
|
| CONSUMER STAPLES - 4.6% | | | |
| Beverages - 0.8% | | | |
| Primo Water Corp. | | 377,900 | 6,322,267 |
| Food & Staples Retailing - 1.0% | | | |
| BJ's Wholesale Club Holdings, Inc. (a) | | 154,500 | 7,351,110 |
| Food Products - 1.3% | | | |
| Darling Ingredients, Inc. (a) | | 145,763 | 9,839,003 |
| Household Products - 0.7% | | | |
| Reynolds Consumer Products, Inc. | | 181,600 | 5,511,560 |
| Tobacco - 0.8% | | | |
| Altria Group, Inc. | | 137,000 | 6,532,160 |
|
| TOTAL CONSUMER STAPLES | | | 35,556,100 |
|
| ENERGY - 6.0% | | | |
| Energy Equipment & Services - 0.8% | | | |
| Liberty Oilfield Services, Inc. Class A (a) | | 420,004 | 5,947,257 |
| Oil, Gas & Consumable Fuels - 5.2% | | | |
| Canadian Natural Resources Ltd. | | 453,600 | 16,466,602 |
| Cheniere Energy, Inc. (a) | | 128,400 | 11,137,416 |
| Hess Corp. | | 145,500 | 12,705,060 |
| | | | 40,309,078 |
|
| TOTAL ENERGY | | | 46,256,335 |
|
| FINANCIALS - 19.5% | | | |
| Banks - 2.7% | | | |
| East West Bancorp, Inc. | | 78,400 | 5,620,496 |
| First Citizens Bancshares, Inc. | | 9,400 | 7,827,756 |
| Signature Bank | | 29,400 | 7,222,110 |
| | | | 20,670,362 |
| Capital Markets - 4.7% | | | |
| Ameriprise Financial, Inc. | | 46,800 | 11,647,584 |
| Bank of New York Mellon Corp. | | 118,100 | 6,050,263 |
| Lazard Ltd. Class A | | 211,214 | 9,557,434 |
| LPL Financial | | 68,200 | 9,205,636 |
| | | | 36,460,917 |
| Consumer Finance - 4.8% | | | |
| Capital One Financial Corp. | | 50,200 | 7,765,438 |
| OneMain Holdings, Inc. | | 161,200 | 9,657,492 |
| SLM Corp. | | 480,900 | 10,070,046 |
| Synchrony Financial | | 191,700 | 9,301,284 |
| | | | 36,794,260 |
| Diversified Financial Services - 0.9% | | | |
| Voya Financial, Inc. | | 108,500 | 6,672,750 |
| Insurance - 6.4% | | | |
| American Financial Group, Inc. | | 80,400 | 10,027,488 |
| Arch Capital Group Ltd. (a) | | 256,000 | 9,968,640 |
| Assurant, Inc. | | 64,700 | 10,104,846 |
| Fairfax Financial Holdings Ltd. (sub. vtg.) | | 8,100 | 3,552,081 |
| Reinsurance Group of America, Inc. | | 45,700 | 5,209,800 |
| The Travelers Companies, Inc. | | 66,000 | 9,880,860 |
| | | | 48,743,715 |
|
| TOTAL FINANCIALS | | | 149,342,004 |
|
| HEALTH CARE - 7.5% | | | |
| Health Care Providers & Services - 5.5% | | | |
| Centene Corp. (a) | | 156,000 | 11,377,080 |
| Cigna Corp. | | 80,900 | 19,178,961 |
| Laboratory Corp. of America Holdings (a) | | 40,900 | 11,282,265 |
| | | | 41,838,306 |
| Pharmaceuticals - 2.0% | | | |
| Bristol-Myers Squibb Co. | | 120,200 | 8,031,764 |
| Jazz Pharmaceuticals PLC (a) | | 41,300 | 7,336,532 |
| | | | 15,368,296 |
|
| TOTAL HEALTH CARE | | | 57,206,602 |
|
| INDUSTRIALS - 18.2% | | | |
| Air Freight & Logistics - 1.9% | | | |
| FedEx Corp. | | 19,500 | 5,817,435 |
| XPO Logistics, Inc. (a) | | 63,200 | 8,841,048 |
| | | | 14,658,483 |
| Building Products - 2.6% | | | |
| Builders FirstSource, Inc. (a) | | 229,500 | 9,790,470 |
| Jeld-Wen Holding, Inc. (a) | | 379,500 | 9,965,670 |
| | | | 19,756,140 |
| Commercial Services & Supplies - 1.1% | | | |
| The Brink's Co. | | 106,600 | 8,191,144 |
| Construction & Engineering - 1.9% | | | |
| Fluor Corp. (a)(b) | | 386,500 | 6,841,050 |
| Willscot Mobile Mini Holdings (a) | | 284,900 | 7,940,163 |
| | | | 14,781,213 |
| Machinery - 1.1% | | | |
| Allison Transmission Holdings, Inc. | | 190,740 | 7,580,008 |
| Crane Co. | | 7,153 | 660,723 |
| | | | 8,240,731 |
| Marine - 1.0% | | | |
| Kirby Corp. (a) | | 122,500 | 7,428,400 |
| Professional Services - 3.9% | | | |
| ASGN, Inc. (a) | | 63,900 | 6,193,827 |
| KBR, Inc. | | 143,700 | 5,482,155 |
| Manpower, Inc. | | 65,800 | 7,824,278 |
| Nielsen Holdings PLC | | 412,300 | 10,171,441 |
| | | | 29,671,701 |
| Road & Rail - 1.7% | | | |
| Ryder System, Inc. | | 68,700 | 5,106,471 |
| TFI International, Inc. (Canada) | | 87,000 | 7,942,715 |
| | | | 13,049,186 |
| Trading Companies & Distributors - 3.0% | | | |
| AerCap Holdings NV (a) | | 101,700 | 5,208,057 |
| Beacon Roofing Supply, Inc. (a) | | 168,900 | 8,993,925 |
| Univar, Inc. (a) | | 376,378 | 9,176,096 |
| | | | 23,378,078 |
|
| TOTAL INDUSTRIALS | | | 139,155,076 |
|
| INFORMATION TECHNOLOGY - 5.4% | | | |
| Electronic Equipment & Components - 1.3% | | | |
| Flex Ltd. (a) | | 548,396 | 9,799,837 |
| IT Services - 2.3% | | | |
| DXC Technology Co. (a) | | 227,700 | 8,866,638 |
| Unisys Corp. (a) | | 340,739 | 8,624,104 |
| | | | 17,490,742 |
| Software - 1.5% | | | |
| SS&C Technologies Holdings, Inc. | | 163,100 | 11,752,986 |
| Technology Hardware, Storage & Peripherals - 0.3% | | | |
| NCR Corp. (a) | | 47,714 | 2,176,236 |
|
| TOTAL INFORMATION TECHNOLOGY | | | 41,219,801 |
|
| MATERIALS - 8.2% | | | |
| Chemicals - 3.6% | | | |
| Axalta Coating Systems Ltd. (a) | | 278,100 | 8,479,269 |
| Olin Corp. | | 243,730 | 11,274,950 |
| Tronox Holdings PLC | | 361,600 | 8,099,840 |
| | | | 27,854,059 |
| Construction Materials - 1.0% | | | |
| Eagle Materials, Inc. | | 52,400 | 7,446,564 |
| Containers & Packaging - 2.6% | | | |
| Berry Global Group, Inc. (a) | | 75,249 | 4,907,740 |
| Crown Holdings, Inc. | | 78,900 | 8,064,369 |
| O-I Glass, Inc. (a) | | 434,200 | 7,090,486 |
| | | | 20,062,595 |
| Metals & Mining - 1.0% | | | |
| Arconic Corp. (a) | | 107,800 | 3,839,836 |
| Constellium NV (a) | | 201,300 | 3,814,635 |
| | | | 7,654,471 |
|
| TOTAL MATERIALS | | | 63,017,689 |
|
| REAL ESTATE - 10.2% | | | |
| Equity Real Estate Investment Trusts (REITs) - 8.4% | | | |
| American Tower Corp. | | 36,000 | 9,725,040 |
| Americold Realty Trust | | 333,900 | 12,638,115 |
| CubeSmart | | 348,100 | 16,123,992 |
| Equinix, Inc. | | 14,700 | 11,798,220 |
| Equity Lifestyle Properties, Inc. | | 191,717 | 14,246,490 |
| | | | 64,531,857 |
| Real Estate Management & Development - 1.8% | | | |
| Cushman & Wakefield PLC (a) | | 771,500 | 13,478,105 |
|
| TOTAL REAL ESTATE | | | 78,009,962 |
|
| UTILITIES - 8.5% | | | |
| Electric Utilities - 3.9% | | | |
| Edison International | | 226,700 | 13,107,794 |
| NRG Energy, Inc. | | 158,200 | 6,375,460 |
| PG&E Corp. (a) | | 1,029,900 | 10,474,083 |
| | | | 29,957,337 |
| Independent Power and Renewable Electricity Producers - 2.4% | | | |
| The AES Corp. | | 518,100 | 13,506,867 |
| Vistra Corp. | | 239,960 | 4,451,258 |
| | | | 17,958,125 |
| Multi-Utilities - 2.2% | | | |
| CenterPoint Energy, Inc. | | 355,200 | 8,709,504 |
| MDU Resources Group, Inc. | | 265,047 | 8,306,573 |
| | | | 17,016,077 |
|
| TOTAL UTILITIES | | | 64,931,539 |
|
| TOTAL COMMON STOCKS | | | |
| (Cost $602,779,659) | | | 772,416,328 |
|
| Money Market Funds - 0.4% | | | |
| Fidelity Cash Central Fund 0.06% (c) | | 2,609,896 | 2,610,418 |
| Fidelity Securities Lending Cash Central Fund 0.06% (c)(d) | | 460,796 | 460,842 |
| TOTAL MONEY MARKET FUNDS | | | |
| (Cost $3,071,260) | | | 3,071,260 |
| TOTAL INVESTMENT IN SECURITIES - 101.2% | | | |
| (Cost $605,850,919) | | | 775,487,588 |
| NET OTHER ASSETS (LIABILITIES) - (1.2)% | | | (9,179,312) |
| NET ASSETS - 100% | | | $766,308,276 |
Legend
(a) Non-income producing
(b) Security or a portion of the security is on loan at period end.
(c) Affiliated fund that is generally available only to investment companies and other accounts managed by Fidelity Investments. The rate quoted is the annualized seven-day yield of the fund at period end. A complete unaudited listing of the fund's holdings as of its most recent quarter end is available upon request. In addition, each Fidelity Central Fund's financial statements [[, which are not covered by the Fund's Report of Independent Registered Public Accounting Firm,]] are available on the SEC's website or upon request.
(d) Investment made with cash collateral received from securities on loan.
Affiliated Central Funds
Information regarding fiscal year to date income earned by the Fund from investments in Fidelity Central Funds is as follows:
| Fund | Income earned |
| Fidelity Cash Central Fund | $4,400 |
| Fidelity Securities Lending Cash Central Fund | 1,417 |
| Total | $5,817 |
Amounts in the income column in the above table include any capital gain distributions from underlying funds, which are presented in the corresponding line-item in the Statement of Operations, if applicable. Amount for Fidelity Securities Lending Cash Central Fund represents the income earned on investing cash collateral, less rebates paid to borrowers and any lending agent fees associated with the loan, plus any premium payments received for lending certain types of securities.
Fiscal year to date information regarding the Fund's investments in Fidelity Central Funds, including the ownership percentage, is presented below.
| Fund | Value, beginning of period | Purchases | Sales Proceeds | Realized Gain/Loss | Change in Unrealized appreciation (depreciation) | Value, end of period | % ownership, end of period |
| Fidelity Cash Central Fund 0.06% | $12,362,829 | $151,324,966 | $161,077,381 | $4 | $-- | $2,610,418 | 0.0% |
| Fidelity Securities Lending Cash Central Fund 0.06% | 1,395,842 | 45,532,769 | 46,467,769 | -- | -- | 460,842 | 0.0% |
| Total | $13,758,671 | $196,857,735 | $207,545,150 | $4 | $-- | $3,071,260 | |
Investment Valuation
The following is a summary of the inputs used, as of June 30, 2021, involving the Fund's assets and liabilities carried at fair value. The inputs or methodology used for valuing securities may not be an indication of the risk associated with investing in those securities. For more information on valuation inputs, and their aggregation into the levels used below, please refer to the Investment Valuation section in the accompanying Notes to Financial Statements.
| | Valuation Inputs at Reporting Date: |
| Description | Total | Level 1 | Level 2 | Level 3 |
| Investments in Securities: | | | | |
| Equities: | | | | |
| Communication Services | $18,438,423 | $18,438,423 | $-- | $-- |
| Consumer Discretionary | 79,282,797 | 79,282,797 | -- | -- |
| Consumer Staples | 35,556,100 | 35,556,100 | -- | -- |
| Energy | 46,256,335 | 46,256,335 | -- | -- |
| Financials | 149,342,004 | 149,342,004 | -- | -- |
| Health Care | 57,206,602 | 57,206,602 | -- | -- |
| Industrials | 139,155,076 | 139,155,076 | -- | -- |
| Information Technology | 41,219,801 | 41,219,801 | -- | -- |
| Materials | 63,017,689 | 63,017,689 | -- | -- |
| Real Estate | 78,009,962 | 78,009,962 | -- | -- |
| Utilities | 64,931,539 | 64,931,539 | -- | -- |
| Money Market Funds | 3,071,260 | 3,071,260 | -- | -- |
| Total Investments in Securities: | $775,487,588 | $775,487,588 | $-- | $-- |
Other Information
Distribution of investments by country or territory of incorporation, as a percentage of Total Net Assets, is as follows (Unaudited):
| United States of America | 83.3% |
| United Kingdom | 4.7% |
| Canada | 4.4% |
| Bermuda | 3.6% |
| Ireland | 1.5% |
| Singapore | 1.3% |
| Others (Individually Less Than 1%) | 1.2% |
| | 100.0% |
See accompanying notes which are an integral part of the financial statements.
Financial Statements
Statement of Assets and Liabilities
| | | June 30, 2021 (Unaudited) |
| Assets | | |
Investment in securities, at value (including securities loaned of $453,120) — See accompanying schedule:
Unaffiliated issuers (cost $602,779,659) | $772,416,328 | |
| Fidelity Central Funds (cost $3,071,260) | 3,071,260 | |
| Total Investment in Securities (cost $605,850,919) | | $775,487,588 |
| Cash | | 819,656 |
| Receivable for investments sold | | 4,270,454 |
| Receivable for fund shares sold | | 1,251,652 |
| Dividends receivable | | 660,227 |
| Distributions receivable from Fidelity Central Funds | | 1,849 |
| Other receivables | | 16,812 |
| Total assets | | 782,508,238 |
| Liabilities | | |
| Payable for investments purchased | $13,188,653 | |
| Payable for fund shares redeemed | 2,023,768 | |
| Accrued management fee | 340,491 | |
| Distribution and service plan fees payable | 68,200 | |
| Other affiliated payables | 83,434 | |
| Other payables and accrued expenses | 34,616 | |
| Collateral on securities loaned | 460,800 | |
| Total liabilities | | 16,199,962 |
| Net Assets | | $766,308,276 |
| Net Assets consist of: | | |
| Paid in capital | | $555,592,814 |
| Total accumulated earnings (loss) | | 210,715,462 |
| Net Assets | | $766,308,276 |
| Net Asset Value and Maximum Offering Price | | |
| Initial Class: | | |
| Net Asset Value, offering price and redemption price per share ($129,930,837 ÷ 7,723,212 shares) | | $16.82 |
| Service Class: | | |
| Net Asset Value, offering price and redemption price per share ($27,026,408 ÷ 1,612,321 shares) | | $16.76 |
| Service Class 2: | | |
| Net Asset Value, offering price and redemption price per share ($311,190,004 ÷ 18,334,416 shares) | | $16.97 |
| Investor Class: | | |
| Net Asset Value, offering price and redemption price per share ($298,161,027 ÷ 17,876,918 shares) | | $16.68 |
See accompanying notes which are an integral part of the financial statements.
Statement of Operations
| | | Six months ended June 30, 2021 (Unaudited) |
| Investment Income | | |
| Dividends | | $5,554,179 |
| Income from Fidelity Central Funds (including $1,417 from security lending) | | 5,817 |
| Total income | | 5,559,996 |
| Expenses | | |
| Management fee | $1,695,968 | |
| Transfer agent fees | 292,055 | |
| Distribution and service plan fees | 361,401 | |
| Accounting fees | 117,176 | |
| Custodian fees and expenses | 9,548 | |
| Independent trustees' fees and expenses | 980 | |
| Audit | 25,994 | |
| Legal | 1,198 | |
| Miscellaneous | 957 | |
| Total expenses before reductions | 2,505,277 | |
| Expense reductions | (42,494) | |
| Total expenses after reductions | | 2,462,783 |
| Net investment income (loss) | | 3,097,213 |
| Realized and Unrealized Gain (Loss) | | |
| Net realized gain (loss) on: | | |
| Investment securities: | | |
| Unaffiliated issuers | 53,930,926 | |
| Fidelity Central Funds | 4 | |
| Foreign currency transactions | 194 | |
| Futures contracts | 31,053 | |
| Total net realized gain (loss) | | 53,962,177 |
| Change in net unrealized appreciation (depreciation) on: | | |
| Investment securities: | | |
| Unaffiliated issuers | 67,761,166 | |
| Assets and liabilities in foreign currencies | (362) | |
| Total change in net unrealized appreciation (depreciation) | | 67,760,804 |
| Net gain (loss) | | 121,722,981 |
| Net increase (decrease) in net assets resulting from operations | | $124,820,194 |
See accompanying notes which are an integral part of the financial statements.
Statement of Changes in Net Assets
| | Six months ended June 30, 2021 (Unaudited) | Year ended December 31, 2020 |
| Increase (Decrease) in Net Assets | | |
| Operations | | |
| Net investment income (loss) | $3,097,213 | $4,302,141 |
| Net realized gain (loss) | 53,962,177 | (15,239,774) |
| Change in net unrealized appreciation (depreciation) | 67,760,804 | 44,777,396 |
| Net increase (decrease) in net assets resulting from operations | 124,820,194 | 33,839,763 |
| Distributions to shareholders | (754,643) | (24,950,740) |
| Share transactions - net increase (decrease) | 149,681,325 | 53,759,415 |
| Total increase (decrease) in net assets | 273,746,876 | 62,648,438 |
| Net Assets | | |
| Beginning of period | 492,561,400 | 429,912,962 |
| End of period | $766,308,276 | $492,561,400 |
See accompanying notes which are an integral part of the financial statements.
Financial Highlights
VIP Value Strategies Portfolio Initial Class
| | Six months ended (Unaudited) June 30, | Years endedDecember 31, | | | | |
| | 2021 | 2020 | 2019 | 2018 | 2017 | 2016 |
| Selected Per–Share Data | | | | | | |
| Net asset value, beginning of period | $13.55 | $13.31 | $11.11 | $14.27 | $15.77 | $14.54 |
| Income from Investment Operations | | | | | | |
| Net investment income (loss)A | .09 | .14 | .20B | .17 | .25C | .23 |
| Net realized and unrealized gain (loss) | 3.20 | .88 | 3.39 | (2.58) | 2.35 | 1.17 |
| Total from investment operations | 3.29 | 1.02 | 3.59 | (2.41) | 2.60 | 1.40 |
| Distributions from net investment income | (.02) | (.15) | (.21) | (.13) | (.22) | (.17) |
| Distributions from net realized gain | – | (.63) | (1.18) | (.62) | (3.88) | – |
| Total distributions | (.02) | (.78) | (1.39) | (.75) | (4.10) | (.17) |
| Net asset value, end of period | $16.82 | $13.55 | $13.31 | $11.11 | $14.27 | $15.77 |
| Total ReturnD,E,F | 24.33% | 8.26% | 34.53% | (17.32)% | 19.36% | 9.62% |
| Ratios to Average Net AssetsG,H | | | | | | |
| Expenses before reductions | .64%I | .66% | .66% | .67% | .68% | .67% |
| Expenses net of fee waivers, if any | .63%I | .66% | .66% | .67% | .68% | .67% |
| Expenses net of all reductions | .62%I | .65% | .66% | .66% | .67% | .67% |
| Net investment income (loss) | 1.09%I | 1.32% | 1.64%B | 1.29% | 1.74%C | 1.56% |
| Supplemental Data | | | | | | |
| Net assets, end of period (000 omitted) | $129,931 | $95,708 | $83,357 | $77,279 | $99,324 | $93,648 |
| Portfolio turnover rateJ | 72%I | 85% | 68% | 68% | 53% | 108% |
A Calculated based on average shares outstanding during the period.
B Net investment income per share reflects one or more large, non-recurring dividend(s) which amounted to $.03 per share. Excluding such non-recurring dividend(s), the ratio of net investment income (loss) to average net assets would have been 1.36%.
C Net investment income per share reflects one or more large, non-recurring dividend(s) which amounted to $.05 per share. Excluding such non-recurring dividend(s), the ratio of net investment income (loss) to average net assets would have been 1.38%.
D Total returns for periods of less than one year are not annualized.
E Total returns do not reflect charges attributable to your insurance company's separate account. Inclusion of these charges would reduce the total returns shown.
F Total returns would have been lower if certain expenses had not been reduced during the applicable periods shown.
G Fees and expenses of any underlying mutual funds or exchange-traded funds (ETFs) are not included in the Fund's expense ratio. The Fund indirectly bears its proportionate share of these expenses. For additional expense information related to investments in Fidelity Central Funds, please refer to the "Investments in Fidelity Central Funds" note found in the Notes to Financial Statements section of the most recent Annual or Semi-Annual report.
H Expense ratios reflect operating expenses of the class. Expenses before reductions do not reflect amounts reimbursed, waived, or reduced through arrangements with the investment adviser, brokerage services, or other offset arrangements, if applicable, and do not represent the amount paid by the class during periods when reimbursements, waivers or reductions occur.
I Annualized
J Amount does not include the portfolio activity of any underlying mutual funds or exchange-traded funds (ETFs).
See accompanying notes which are an integral part of the financial statements.
VIP Value Strategies Portfolio Service Class
| | Six months ended (Unaudited) June 30, | Years endedDecember 31, | | | | |
| | 2021 | 2020 | 2019 | 2018 | 2017 | 2016 |
| Selected Per–Share Data | | | | | | |
| Net asset value, beginning of period | $13.51 | $13.27 | $11.09 | $14.23 | $15.74 | $14.52 |
| Income from Investment Operations | | | | | | |
| Net investment income (loss)A | .08 | .13 | .19B | .16 | .23C | .21 |
| Net realized and unrealized gain (loss) | 3.19 | .88 | 3.37 | (2.56) | 2.34 | 1.17 |
| Total from investment operations | 3.27 | 1.01 | 3.56 | (2.40) | 2.57 | 1.38 |
| Distributions from net investment income | (.02) | (.14) | (.20) | (.12) | (.20) | (.16) |
| Distributions from net realized gain | – | (.63) | (1.18) | (.62) | (3.88) | – |
| Total distributions | (.02) | (.77) | (1.38) | (.74) | (4.08) | (.16) |
| Net asset value, end of period | $16.76 | $13.51 | $13.27 | $11.09 | $14.23 | $15.74 |
| Total ReturnD,E,F | 24.24% | 8.18% | 34.29% | (17.33)% | 19.21% | 9.48% |
| Ratios to Average Net AssetsG,H | | | | | | |
| Expenses before reductions | .73%I | .76% | .76% | .77% | .78% | .77% |
| Expenses net of fee waivers, if any | .73%I | .76% | .76% | .77% | .78% | .77% |
| Expenses net of all reductions | .72%I | .75% | .76% | .76% | .77% | .77% |
| Net investment income (loss) | .99%I | 1.22% | 1.54%B | 1.19% | 1.64%C | 1.46% |
| Supplemental Data | | | | | | |
| Net assets, end of period (000 omitted) | $27,026 | $19,115 | $20,992 | $16,586 | $22,859 | $21,949 |
| Portfolio turnover rateJ | 72%I | 85% | 68% | 68% | 53% | 108% |
A Calculated based on average shares outstanding during the period.
B Net investment income per share reflects one or more large, non-recurring dividend(s) which amounted to $.03 per share. Excluding such non-recurring dividend(s), the ratio of net investment income (loss) to average net assets would have been 1.26%.
C Net investment income per share reflects one or more large, non-recurring dividend(s) which amounted to $.05 per share. Excluding such non-recurring dividend(s), the ratio of net investment income (loss) to average net assets would have been 1.28%.
D Total returns for periods of less than one year are not annualized.
E Total returns do not reflect charges attributable to your insurance company's separate account. Inclusion of these charges would reduce the total returns shown.
F Total returns would have been lower if certain expenses had not been reduced during the applicable periods shown.
G Fees and expenses of any underlying mutual funds or exchange-traded funds (ETFs) are not included in the Fund's expense ratio. The Fund indirectly bears its proportionate share of these expenses. For additional expense information related to investments in Fidelity Central Funds, please refer to the "Investments in Fidelity Central Funds" note found in the Notes to Financial Statements section of the most recent Annual or Semi-Annual report.
H Expense ratios reflect operating expenses of the class. Expenses before reductions do not reflect amounts reimbursed, waived, or reduced through arrangements with the investment adviser, brokerage services, or other offset arrangements, if applicable, and do not represent the amount paid by the class during periods when reimbursements, waivers or reductions occur.
I Annualized
J Amount does not include the portfolio activity of any underlying mutual funds or exchange-traded funds (ETFs).
See accompanying notes which are an integral part of the financial statements.
VIP Value Strategies Portfolio Service Class 2
| | Six months ended (Unaudited) June 30, | Years endedDecember 31, | | | | |
| | 2021 | 2020 | 2019 | 2018 | 2017 | 2016 |
| Selected Per–Share Data | | | | | | |
| Net asset value, beginning of period | $13.68 | $13.43 | $11.21 | $14.38 | $15.86 | $14.64 |
| Income from Investment Operations | | | | | | |
| Net investment income (loss)A | .07 | .12 | .17B | .14 | .21C | .19 |
| Net realized and unrealized gain (loss) | 3.24 | .88 | 3.41 | (2.59) | 2.37 | 1.17 |
| Total from investment operations | 3.31 | 1.00 | 3.58 | (2.45) | 2.58 | 1.36 |
| Distributions from net investment income | (.02) | (.12) | (.18) | (.10) | (.18) | (.14) |
| Distributions from net realized gain | – | (.63) | (1.18) | (.62) | (3.88) | – |
| Total distributions | (.02) | (.75) | (1.36) | (.72) | (4.06) | (.14) |
| Net asset value, end of period | $16.97 | $13.68 | $13.43 | $11.21 | $14.38 | $15.86 |
| Total ReturnD,E,F | 24.20% | 8.02% | 34.10% | (17.50)% | 19.08% | 9.27% |
| Ratios to Average Net AssetsG,H | | | | | | |
| Expenses before reductions | .88%I | .91% | .91% | .92% | .93% | .92% |
| Expenses net of fee waivers, if any | .88%I | .91% | .91% | .92% | .92% | .92% |
| Expenses net of all reductions | .87%I | .90% | .91% | .91% | .92% | .92% |
| Net investment income (loss) | .85%I | 1.07% | 1.39%B | 1.04% | 1.49%C | 1.31% |
| Supplemental Data | | | | | | |
| Net assets, end of period (000 omitted) | $311,190 | $228,031 | $220,982 | $160,274 | $210,354 | $187,876 |
| Portfolio turnover rateJ | 72%I | 85% | 68% | 68% | 53% | 108% |
A Calculated based on average shares outstanding during the period.
B Net investment income per share reflects one or more large, non-recurring dividend(s) which amounted to $.03 per share. Excluding such non-recurring dividend(s), the ratio of net investment income (loss) to average net assets would have been 1.11%.
C Net investment income per share reflects one or more large, non-recurring dividend(s) which amounted to $.05 per share. Excluding such non-recurring dividend(s), the ratio of net investment income (loss) to average net assets would have been 1.13%.
D Total returns for periods of less than one year are not annualized.
E Total returns do not reflect charges attributable to your insurance company's separate account. Inclusion of these charges would reduce the total returns shown.
F Total returns would have been lower if certain expenses had not been reduced during the applicable periods shown.
G Fees and expenses of any underlying mutual funds or exchange-traded funds (ETFs) are not included in the Fund's expense ratio. The Fund indirectly bears its proportionate share of these expenses. For additional expense information related to investments in Fidelity Central Funds, please refer to the "Investments in Fidelity Central Funds" note found in the Notes to Financial Statements section of the most recent Annual or Semi-Annual report.
H Expense ratios reflect operating expenses of the class. Expenses before reductions do not reflect amounts reimbursed, waived, or reduced through arrangements with the investment adviser, brokerage services, or other offset arrangements, if applicable, and do not represent the amount paid by the class during periods when reimbursements, waivers or reductions occur.
I Annualized
J Amount does not include the portfolio activity of any underlying mutual funds or exchange-traded funds (ETFs).
See accompanying notes which are an integral part of the financial statements.
VIP Value Strategies Portfolio Investor Class
| | Six months ended (Unaudited) June 30, | Years endedDecember 31, | | | | |
| | 2021 | 2020 | 2019 | 2018 | 2017 | 2016 |
| Selected Per–Share Data | | | | | | |
| Net asset value, beginning of period | $13.44 | $13.20 | $11.04 | $14.18 | $15.69 | $14.47 |
| Income from Investment Operations | | | | | | |
| Net investment income (loss)A | .08 | .14 | .19B | .16 | .23C | .22 |
| Net realized and unrealized gain (loss) | 3.18 | .87 | 3.35 | (2.56) | 2.34 | 1.16 |
| Total from investment operations | 3.26 | 1.01 | 3.54 | (2.40) | 2.57 | 1.38 |
| Distributions from net investment income | (.02) | (.14) | (.20) | (.12) | (.21) | (.16) |
| Distributions from net realized gain | – | (.63) | (1.18) | (.62) | (3.88) | – |
| Total distributions | (.02) | (.77) | (1.38) | (.74) | (4.08)D | (.16) |
| Net asset value, end of period | $16.68 | $13.44 | $13.20 | $11.04 | $14.18 | $15.69 |
| Total ReturnE,F,G | 24.30% | 8.26% | 34.27% | (17.37)% | 19.30% | 9.53% |
| Ratios to Average Net AssetsH,I | | | | | | |
| Expenses before reductions | .71%J | .74% | .74% | .75% | .76% | .75% |
| Expenses net of fee waivers, if any | .71%J | .74% | .74% | .75% | .76% | .75% |
| Expenses net of all reductions | .70%J | .73% | .74% | .74% | .75% | .75% |
| Net investment income (loss) | 1.02%J | 1.24% | 1.56%B | 1.21% | 1.66%C | 1.48% |
| Supplemental Data | | | | | | |
| Net assets, end of period (000 omitted) | $298,161 | $149,707 | $104,581 | $85,385 | $121,110 | $117,276 |
| Portfolio turnover rateK | 72%J | 85% | 68% | 68% | 53% | 108% |
A Calculated based on average shares outstanding during the period.
B Net investment income per share reflects one or more large, non-recurring dividend(s) which amounted to $.03 per share. Excluding such non-recurring dividend(s), the ratio of net investment income (loss) to average net assets would have been 1.28%.
C Net investment income per share reflects one or more large, non-recurring dividend(s) which amounted to $.05 per share. Excluding such non-recurring dividend(s), the ratio of net investment income (loss) to average net assets would have been 1.29%.
D Total distributions per share do not sum due to rounding.
E Total returns for periods of less than one year are not annualized.
F Total returns do not reflect charges attributable to your insurance company's separate account. Inclusion of these charges would reduce the total returns shown.
G Total returns would have been lower if certain expenses had not been reduced during the applicable periods shown.
H Fees and expenses of any underlying mutual funds or exchange-traded funds (ETFs) are not included in the Fund's expense ratio. The Fund indirectly bears its proportionate share of these expenses. For additional expense information related to investments in Fidelity Central Funds, please refer to the "Investments in Fidelity Central Funds" note found in the Notes to Financial Statements section of the most recent Annual or Semi-Annual report.
I Expense ratios reflect operating expenses of the class. Expenses before reductions do not reflect amounts reimbursed, waived, or reduced through arrangements with the investment adviser, brokerage services, or other offset arrangements, if applicable, and do not represent the amount paid by the class during periods when reimbursements, waivers or reductions occur.
J Annualized
K Amount does not include the portfolio activity of any underlying mutual funds or exchange-traded funds (ETFs).
See accompanying notes which are an integral part of the financial statements.
Notes to Financial Statements (Unaudited)
For the period ended June 30, 2021
1. Organization.
VIP Value Strategies Portfolio (the Fund) is a fund of Variable Insurance Products Fund III (the Trust) and is authorized to issue an unlimited number of shares. The Trust is registered under the Investment Company Act of 1940, as amended (the 1940 Act), as an open-end management investment company organized as a Massachusetts business trust. Shares of the Fund may only be purchased by insurance companies for the purpose of funding variable annuity or variable life insurance contracts. The Fund offers the following classes of shares: Initial Class shares, Service Class shares, Service Class 2 shares and Investor Class shares.
2. Investments in Fidelity Central Funds.
Funds may invest in Fidelity Central Funds, which are open-end investment companies generally available only to other investment companies and accounts managed by the investment adviser and its affiliates. The Schedule of Investments lists any Fidelity Central Funds held as an investment as of period end, but does not include the underlying holdings of each Fidelity Central Fund. An investing fund indirectly bears its proportionate share of the expenses of the underlying Fidelity Central Funds.
Based on its investment objective, each Fidelity Central Fund may invest or participate in various investment vehicles or strategies that are similar to those of the investing fund. These strategies are consistent with the investment objectives of the investing fund and may involve certain economic risks which may cause a decline in value of each of the Fidelity Central Funds and thus a decline in the value of the investing fund.
| Fidelity Central Fund | Investment Manager | Investment Objective | Investment Practices | Expense Ratio(a) |
| Fidelity Money Market Central Funds | Fidelity Management & Research Company LLC (FMR) | Each fund seeks to obtain a high level of current income consistent with the preservation of capital and liquidity. | Short-term Investments | Less than .005% to .01% |
(a) Expenses expressed as a percentage of average net assets and are as of each underlying Central Fund's most recent annual or semi-annual shareholder report.
A complete unaudited list of holdings for each Fidelity Central Fund is available upon request or at the Securities and Exchange Commission website at www.sec.gov. In addition, the financial statements of the Fidelity Central Funds which contain the significant accounting policies (including investment valuation policies) of those funds, and are not covered by the Report of Independent Registered Public Accounting Firm, are available on the Securities and Exchange Commission website or upon request.
3. Significant Accounting Policies.
The Fund is an investment company and applies the accounting and reporting guidance of the Financial Accounting Standards Board (FASB) Accounting Standards Codification Topic 946 Financial Services - Investment Companies. The financial statements have been prepared in conformity with accounting principles generally accepted in the United States of America (GAAP), which require management to make certain estimates and assumptions at the date of the financial statements. Actual results could differ from those estimates. Subsequent events, if any, through the date that the financial statements were issued have been evaluated in the preparation of the financial statements. The Fund's Schedule of Investments lists any underlying mutual funds or exchange-traded funds (ETFs) but does not include the underlying holdings of these funds. The following summarizes the significant accounting policies of the Fund:
Investment Valuation. Investments are valued as of 4:00 p.m. Eastern time on the last calendar day of the period. The Board of Trustees (the Board) has delegated the day to day responsibility for the valuation of the Fund's investments to the Fair Value Committee (the Committee) established by the Fund's investment adviser. In accordance with valuation policies and procedures approved by the Board, the Fund attempts to obtain prices from one or more third party pricing vendors or brokers to value its investments. When current market prices, quotations or currency exchange rates are not readily available or reliable, investments will be fair valued in good faith by the Committee, in accordance with procedures adopted by the Board. Factors used in determining fair value vary by investment type and may include market or investment specific events. The frequency with which these procedures are used cannot be predicted and they may be utilized to a significant extent. The Committee oversees the Fund's valuation policies and procedures and reports to the Board on the Committee's activities and fair value determinations. The Board monitors the appropriateness of the procedures used in valuing the Fund's investments and ratifies the fair value determinations of the Committee.
The Fund categorizes the inputs to valuation techniques used to value its investments into a disclosure hierarchy consisting of three levels as shown below:
- Level 1 – quoted prices in active markets for identical investments
- Level 2 – other significant observable inputs (including quoted prices for similar investments, interest rates, prepayment speeds, etc.)
- Level 3 – unobservable inputs (including the Fund's own assumptions based on the best information available)
Valuation techniques used to value the Fund's investments by major category are as follows:
Equity securities, including restricted securities, for which market quotations are readily available, are valued at the last reported sale price or official closing price as reported by a third party pricing vendor on the primary market or exchange on which they are traded and are categorized as Level 1 in the hierarchy. In the event there were no sales during the day or closing prices are not available, securities are valued at the last quoted bid price or may be valued using the last available price and are generally categorized as Level 2 in the hierarchy. For foreign equity securities, when market or security specific events arise, comparisons to the valuation of American Depositary Receipts (ADRs), futures contracts, Exchange-Traded Funds (ETFs) and certain indexes as well as quoted prices for similar securities may be used and would be categorized as Level 2 in the hierarchy. For equity securities, including restricted securities, where observable inputs are limited, assumptions about market activity and risk are used and these securities may be categorized as Level 3 in the hierarchy.
Investments in open-end mutual funds, including the Fidelity Central Funds, are valued at their closing net asset value (NAV) each business day and are categorized as Level 1 in the hierarchy.
Changes in valuation techniques may result in transfers in or out of an assigned level within the disclosure hierarchy. The aggregate value of investments by input level as of June 30, 2021 is included at the end of the Fund's Schedule of Investments.
Foreign Currency. Certain Funds may use foreign currency contracts to facilitate transactions in foreign-denominated securities. Gains and losses from these transactions may arise from changes in the value of the foreign currency or if the counterparties do not perform under the contracts' terms.
Foreign-denominated assets, including investment securities, and liabilities are translated into U.S. dollars at the exchange rates at period end. Purchases and sales of investment securities, income and dividends received, and expenses denominated in foreign currencies are translated into U.S. dollars at the exchange rate in effect on the transaction date.
The effects of exchange rate fluctuations on investments are included with the net realized and unrealized gain (loss) on investment securities. Other foreign currency transactions resulting in realized and unrealized gain (loss) are disclosed separately.
Investment Transactions and Income. For financial reporting purposes, the Fund's investment holdings and NAV include trades executed through the end of the last business day of the period. The NAV per share for processing shareholder transactions is calculated as of the close of business of the New York Stock Exchange (NYSE), normally 4:00 p.m. Eastern time and includes trades executed through the end of the prior business day. Gains and losses on securities sold are determined on the basis of identified cost and include proceeds received from litigation. Dividend income is recorded on the ex-dividend date, except for certain dividends from foreign securities where the ex-dividend date may have passed, which are recorded as soon as the Fund is informed of the ex-dividend date. Non-cash dividends included in dividend income, if any, are recorded at the fair market value of the securities received. Income and capital gain distributions from Fidelity Central Funds, if any, are recorded on the ex-dividend date. Certain distributions received by the Fund represent a return of capital or capital gain. The Fund determines the components of these distributions subsequent to the ex-dividend date, based upon receipt of tax filings or other correspondence relating to the underlying investment. These distributions are recorded as a reduction of cost of investments and/or as a realized gain.
Class Allocations and Expenses. Investment income, realized and unrealized capital gains and losses, common expenses of a fund, and certain fund-level expense reductions, if any, are allocated daily on a pro-rata basis to each class based on the relative net assets of each class to the total net assets of a fund. Each class differs with respect to transfer agent and distribution and service plan fees incurred, as applicable. Certain expense reductions may also differ by class, if applicable. For the reporting period, the allocated portion of income and expenses to each class as a percent of its average net assets may vary due to the timing of recording these transactions in relation to fluctuating net assets of the classes. Expenses directly attributable to a fund are charged to that fund. Expenses attributable to more than one fund are allocated among the respective funds on the basis of relative net assets or other appropriate methods. Expenses included in the accompanying financial statements reflect the expenses of that fund and do not include any expenses associated with any underlying mutual funds or exchange-traded funds. Although not included in a fund's expenses, a fund indirectly bears its proportionate share of these expenses through the net asset value of each underlying mutual fund or exchange-traded fund. Expense estimates are accrued in the period to which they relate and adjustments are made when actual amounts are known.
Income Tax Information and Distributions to Shareholders. Each year, the Fund intends to qualify as a regulated investment company under Subchapter M of the Internal Revenue Code, including distributing substantially all of its taxable income and realized gains. As a result, no provision for U.S. Federal income taxes is required. The Fund files a U.S. federal tax return, in addition to state and local tax returns as required. The Fund's federal income tax returns are subject to examination by the Internal Revenue Service (IRS) for a period of three fiscal years after they are filed. State and local tax returns may be subject to examination for an additional fiscal year depending on the jurisdiction. Foreign taxes are provided for based on the Fund's understanding of the tax rules and rates that exist in the foreign markets in which it invests.
Distributions are declared and recorded on the ex-dividend date. Income and capital gain distributions are declared separately for each class. Income and capital gain distributions are determined in accordance with income tax regulations, which may differ from GAAP.
Capital accounts within the financial statements are adjusted for permanent book-tax differences. These adjustments have no impact on net assets or the results of operations. Capital accounts are not adjusted for temporary book-tax differences which will reverse in a subsequent period.
Book-tax differences are primarily due to foreign currency transactions, partnerships and losses deferred due to wash sales and capital loss carryforwards.
As of period end, the cost and unrealized appreciation (depreciation) in securities, and derivatives if applicable, for federal income tax purposes were as follows:
| Gross unrealized appreciation | $179,326,459 |
| Gross unrealized depreciation | (12,042,746) |
| Net unrealized appreciation (depreciation) | $167,283,713 |
| Tax cost | $608,203,875 |
Capital loss carryforwards are only available to offset future capital gains of the Fund to the extent provided by regulations and may be limited. The capital loss carryforward information presented below, including any applicable limitation, is estimated as of prior fiscal period end and is subject to adjustment.
| No expiration | |
| Short-term | $(12,424,631) |
| Long-term | (677,421) |
| Total capital loss carryforward | $(13,112,052) |
4. Derivative Instruments.
Risk Exposures and the Use of Derivative Instruments. The Fund's investment objective allows the Fund to enter into various types of derivative contracts, including futures contracts. Derivatives are investments whose value is primarily derived from underlying assets, indices or reference rates and may be transacted on an exchange or over-the-counter (OTC). Derivatives may involve a future commitment to buy or sell a specified asset based on specified terms, to exchange future cash flows at periodic intervals based on a notional principal amount, or for one party to make one or more payments upon the occurrence of specified events in exchange for periodic payments from the other party.
The Fund used derivatives to increase returns and to manage exposure to certain risks as defined below. The success of any strategy involving derivatives depends on analysis of numerous economic factors, and if the strategies for investment do not work as intended, the Fund may not achieve its objectives.
The Fund's use of derivatives increased or decreased its exposure to the following risk:
| Equity Risk | Equity risk relates to the fluctuations in the value of financial instruments as a result of changes in market prices (other than those arising from interest rate risk or foreign exchange risk), whether caused by factors specific to an individual investment, its issuer, or all factors affecting all instruments traded in a market or market segment.
|
The Fund is also exposed to additional risks from investing in derivatives, such as liquidity risk and counterparty credit risk. Liquidity risk is the risk that the Fund will be unable to close out the derivative in the open market in a timely manner. Counterparty credit risk is the risk that the counterparty will not be able to fulfill its obligation to the Fund. Counterparty credit risk related to exchange-traded futures contracts may be mitigated by the protection provided by the exchange on which they trade.
Investing in derivatives may involve greater risks than investing in the underlying assets directly and, to varying degrees, may involve risk of loss in excess of any initial investment and collateral received and amounts recognized in the Statement of Assets and Liabilities. In addition, there may be the risk that the change in value of the derivative contract does not correspond to the change in value of the underlying instrument.
Futures Contracts. A futures contract is an agreement between two parties to buy or sell a specified underlying instrument for a fixed price at a specified future date. The Fund used futures contracts to manage its exposure to the stock market.
Upon entering into a futures contract, a fund is required to deposit either cash or securities (initial margin) with a clearing broker in an amount equal to a certain percentage of the face value of the contract. Futures contracts are marked-to-market daily and subsequent daily payments (variation margin) are made or received by a fund depending on the daily fluctuations in the value of the futures contracts and are recorded as unrealized appreciation or (depreciation). This receivable and/or payable, if any, is included in daily variation margin on futures contracts in the Statement of Assets and Liabilities. Realized gain or (loss) is recorded upon the expiration or closing of a futures contract. The net realized gain (loss) and change in net unrealized appreciation (depreciation) on futures contracts during the period is presented in the Statement of Operations.
Any open futures contracts at period end are presented in the Schedule of Investments under the caption "Futures Contracts". The notional amount at value reflects each contract's exposure to the underlying instrument or index at period end.
5. Purchases and Sales of Investments.
Purchases and sales of securities, other than short-term securities and in-kind transactions, as applicable, are noted in the table below.
| | Purchases ($) | Sales ($) |
| VIP Value Strategies Portfolio | 391,226,989 | 221,880,220 |
6. Fees and Other Transactions with Affiliates.
Management Fee. Fidelity Management & Research Company LLC (the investment adviser) and its affiliates provide the Fund with investment management related services for which the Fund pays a monthly management fee. The management fee is the sum of an individual fund fee rate that is based on an annual rate of .30% of the Fund's average net assets and an annualized group fee rate that averaged .23% during the period. The group fee rate is based upon the monthly average net assets of a group of registered investment companies with which the investment adviser has management contracts. The group fee rate decreases as assets under management increase and increases as assets under management decrease. For the reporting period, the total annualized management fee rate was .52% of the Fund's average net assets.
Distribution and Service Plan Fees. In accordance with Rule 12b-1 of the 1940 Act, the Fund has adopted separate 12b-1 Plans for each Service Class of shares. Each Service Class pays Fidelity Distributors Company LLC (FDC), an affiliate of the investment adviser, a service fee. For the period, the service fee is based on an annual rate of .10% of Service Class' average net assets and .25% of Service Class 2's average net assets.
For the period, total fees, all of which were re-allowed to insurance companies for the distribution of shares and providing shareholder support services, were as follows:
| Service Class | $11,782 |
| Service Class 2 | 349,619 |
| | $361,401 |
Transfer Agent Fees. Fidelity Investments Institutional Operations Company LLC (FIIOC), an affiliate of the investment adviser, is the Fund's transfer, dividend disbursing, and shareholder servicing agent. FIIOC receives an asset-based fee with respect to each class. Each class pays a fee for transfer agent services, typesetting and printing and mailing of shareholder reports, excluding mailing of proxy statements. For the period, transfer agent fees for each class were as follows:
| | Amount | % of Class-Level Average Net Assets(a) |
| Initial Class | $36,665 | .06 |
| Service Class | 7,496 | .06 |
| Service Class 2 | 88,973 | .06 |
| Investor Class | 158,921 | .14 |
| | $292,055 | |
(a) Annualized
Accounting Fees. Fidelity Service Company, Inc. (FSC), an affiliate of the investment adviser, maintains the Fund's accounting records. The accounting fee is based on the level of average net assets for each month. For the period, the fees were equivalent to the following annualized rates:
| | % of Average Net Assets |
| VIP Value Strategies Portfolio | .04 |
Brokerage Commissions. A portion of portfolio transactions were placed with brokerage firms which are affiliates of the investment adviser. Brokerage commissions are included in net realized gain (loss) and change in net unrealized appreciation (depreciation) in the Statement of Operations. The commissions paid to these affiliated firms were as follows:
| | Amount |
| VIP Value Strategies Portfolio | $6,229 |
Interfund Trades. Funds may purchase from or sell securities to other Fidelity Funds under procedures adopted by the Board. The procedures have been designed to ensure these interfund trades are executed in accordance with Rule 17a-7 of the 1940 Act. Any interfund trades are included within the respective purchases and sales amounts shown in the Purchases and Sales of Investments note and are noted in the table below.
| | Purchases ($) | Sales ($) |
| VIP Value Strategies Portfolio | 37,886,511 | 11,795,065 |
7. Committed Line of Credit.
Certain Funds participate with other funds managed by the investment adviser or an affiliate in a $4.25 billion credit facility (the "line of credit") to be utilized for temporary or emergency purposes to fund shareholder redemptions or for other short-term liquidity purposes. The participating funds have agreed to pay commitment fees on their pro-rata portion of the line of credit, which are reflected in Miscellaneous expenses on the Statement of Operations, and are listed below. During the period, there were no borrowings on this line of credit.
| | Amount |
| VIP Value Strategies Portfolio | $488 |
8. Security Lending.
Funds lend portfolio securities from time to time in order to earn additional income. Lending agents are used, including National Financial Services (NFS), an affiliate of the investment adviser. Pursuant to a securities lending agreement, NFS will receive a fee, which is capped at 9.9% of a fund's daily lending revenue, for its services as lending agent. A fund may lend securities to certain qualified borrowers, including NFS. On the settlement date of the loan, a fund receives collateral (in the form of U.S. Treasury obligations, letters of credit and/or cash) against the loaned securities and maintains collateral in an amount not less than 100% of the market value of the loaned securities during the period of the loan. The market value of the loaned securities is determined at the close of business of a fund and any additional required collateral is delivered to a fund on the next business day. A fund or borrower may terminate the loan at any time, and if the borrower defaults on its obligation to return the securities loaned because of insolvency or other reasons, a fund may apply collateral received from the borrower against the obligation. A fund may experience delays and costs in recovering the securities loaned. Any cash collateral received is invested in the Fidelity Securities Lending Cash Central Fund. Any loaned securities are identified as such in the Schedule of Investments, and the value of loaned securities and cash collateral at period end, as applicable, are presented in the Statement of Assets and Liabilities. Security lending income represents the income earned on investing cash collateral, less rebates paid to borrowers and any lending agent fees associated with the loan, plus any premium payments received for lending certain types of securities. Security lending income is presented in the Statement of Operations as a component of income from Fidelity Central Funds. Affiliated security lending activity, if any, was as follows:
| | Total Security Lending Fees Paid to NFS | Security Lending Income From Securities Loaned to NFS | Value of Securities Loaned to NFS at Period End |
| VIP Value Strategies Portfolio | $150 | $– | $– |
9. Expense Reductions.
Commissions paid to certain brokers with whom the investment adviser, or its affiliates, places trades on behalf of the Fund include an amount in addition to trade execution, which may be rebated back to the Fund to offset expenses. This amount totaled $41,773 for the period.
In addition, during the period the investment adviser or an affiliate reimbursed and/or waived a portion of fund-level operating expenses in the amount of $721.
10. Distributions to Shareholders.
Distributions to shareholders of each class were as follows:
| | Six months ended
June 30, 2021 | Year ended
December 31, 2020 |
| VIP Value Strategies Portfolio | | |
| Distributions to shareholders | | |
| Initial Class | $166,068 | $5,042,291 |
| Service Class | 29,445 | 1,149,494 |
| Service Class 2 | 302,123 | 12,433,558 |
| Investor Class | 257,007 | 6,325,397 |
| Total | $754,643 | $24,950,740 |
11. Share Transactions.
Transactions for each class of shares were as follows and may contain in-kind transactions:
| | Shares | Shares | Dollars | Dollars |
| | Six months ended June 30, 2021 | Year ended December 31, 2020 | Six months ended June 30, 2021 | Year ended December 31, 2020 |
| VIP Value Strategies Portfolio | | | | |
| Initial Class | | | | |
| Shares sold | 2,003,854 | 3,393,775 | $32,077,105 | $35,537,580 |
| Reinvestment of distributions | 11,398 | 406,190 | 166,068 | 5,042,291 |
| Shares redeemed | (1,355,528) | (3,001,429) | (21,006,135) | (32,702,956) |
| Net increase (decrease) | 659,724 | 798,536 | $11,237,038 | $7,876,915 |
| Service Class | | | | |
| Shares sold | 341,044 | 174,956 | $5,575,325 | $1,767,349 |
| Reinvestment of distributions | 2,026 | 92,930 | 29,445 | 1,149,494 |
| Shares redeemed | (146,129) | (434,986) | (2,308,232) | (4,718,892) |
| Net increase (decrease) | 196,941 | (167,100) | $3,296,538 | $(1,802,049) |
| Service Class 2 | | | | |
| Shares sold | 2,990,107 | 2,589,987 | $48,268,225 | $28,270,081 |
| Reinvestment of distributions | 20,525 | 992,555 | 302,123 | 12,433,558 |
| Shares redeemed | (1,342,218) | (3,368,070) | (21,509,137) | (35,982,187) |
| Net increase (decrease) | 1,668,414 | 214,472 | $27,061,211 | $4,721,452 |
| Investor Class | | | | |
| Shares sold | 7,756,517 | 5,639,298 | $124,255,299 | $67,496,060 |
| Reinvestment of distributions | 17,786 | 513,158 | 257,007 | 6,325,397 |
| Shares redeemed | (1,038,425) | (2,931,577) | (16,425,768) | (30,858,360) |
| Net increase (decrease) | 6,735,878 | 3,220,879 | $108,086,538 | $42,963,097 |
12. Other.
Fund's organizational documents provide former and current trustees and officers with a limited indemnification against liabilities arising in connection with the performance of their duties to the fund. In the normal course of business, the fund may also enter into contracts that provide general indemnifications. The fund's maximum exposure under these arrangements is unknown as this would be dependent on future claims that may be made against the fund. The risk of material loss from such claims is considered remote.
At the end of the period, the investment adviser or its affiliates and certain otherwise unaffiliated shareholders were owners of record of more than 10% of the outstanding shares as follows:
| Fund | Affiliated % | Number of
Unaffiliated Shareholders | Unaffiliated Shareholders % |
| VIP: Value Strategies Portfolio | 45% | 1 | 32% |
13. Coronavirus (COVID-19) Pandemic.
An outbreak of COVID-19 first detected in China during December 2019 has since spread globally and was declared a pandemic by the World Health Organization during March 2020. Developments that disrupt global economies and financial markets, such as the COVID-19 pandemic, may magnify factors that affect the Fund's performance.
Shareholder Expense Example
As a shareholder, you incur two types of costs: (1) transaction costs, which may include sales charges (loads) on purchase payments or redemption proceeds, as applicable and (2) ongoing costs, which generally include management fees, distribution and/or service (12b-1) fees and other Fund expenses. This Example is intended to help you understand your ongoing costs (in dollars) of investing in a fund and to compare these costs with the ongoing costs of investing in other mutual funds.
The Example is based on an investment of $1,000 invested at the beginning of the period and held for the entire period (January 1, 2021 to June 30, 2021).
Actual Expenses
The first line of the accompanying table provides information about actual account values and actual expenses. You may use the information in this line, together with the amount you invested, to estimate the expenses that you paid over the period. Simply divide your account value by $1,000.00 (for example, an $8,600 account value divided by $1,000.00 = 8.6), then multiply the result by the number in the first line for a class/Fund under the heading entitled "Expenses Paid During Period" to estimate the expenses you paid on your account during this period. If any fund is a shareholder of any underlying mutual funds or exchange-traded funds (ETFs) (the Underlying Funds), such fund indirectly bears its proportional share of the expenses of the Underlying Funds in addition to the direct expenses incurred presented in the table. These fees and expenses are not included in the annualized expense ratio used to calculate the expense estimate in the table below. The estimate of expenses does not include any fees or other expenses of any variable annuity or variable life insurance product. If they were, the estimate of expenses you paid during the period would be higher, and your ending account value would be lower.
Hypothetical Example for Comparison Purposes
The second line of the accompanying table provides information about hypothetical account values and hypothetical expenses based on the actual expense ratio and an assumed rate of return of 5% per year before expenses, which is not the actual return. The hypothetical account values and expenses may not be used to estimate the actual ending account balance or expenses you paid for the period. You may use this information to compare the ongoing costs of investing in the Fund and other funds. To do so, compare this 5% hypothetical example with the 5% hypothetical examples that appear in the shareholder reports of the other funds. If any fund is a shareholder of any Underlying Funds, such fund indirectly bears its proportional share of the expenses of the Underlying Funds in addition to the direct expenses as presented in the table. These fees and expenses are not included in the annualized expense ratio used to calculate the expense estimate in the table below. The estimate of expenses does not include any fees or other expenses of any variable annuity or variable life insurance product. If they were, the estimate of expenses you paid during the period would be higher, and your ending account value would be lower.
Please note that the expenses shown in the table are meant to highlight your ongoing costs only and do not reflect any transaction costs. Therefore, the second line of the table is useful in comparing ongoing costs only, and will not help you determine the relative total costs of owning different funds.
| | Annualized Expense Ratio-A | Beginning
Account Value
January 1, 2021 | Ending
Account Value
June 30, 2021 | Expenses Paid
During Period-B
January 1, 2021
to June 30, 2021 |
| VIP Value Strategies Portfolio | | | | |
| Initial Class | .63% | | | |
| Actual | | $1,000.00 | $1,243.30 | $3.50 |
| Hypothetical-C | | $1,000.00 | $1,021.67 | $3.16 |
| Service Class | .73% | | | |
| Actual | | $1,000.00 | $1,242.40 | $4.06 |
| Hypothetical-C | | $1,000.00 | $1,021.17 | $3.66 |
| Service Class 2 | .88% | | | |
| Actual | | $1,000.00 | $1,242.00 | $4.89 |
| Hypothetical-C | | $1,000.00 | $1,020.43 | $4.41 |
| Investor Class | .71% | | | |
| Actual | | $1,000.00 | $1,243.00 | $3.95 |
| Hypothetical-C | | $1,000.00 | $1,021.27 | $3.56 |
A Annualized expense ratio reflects expenses net of applicable fee waivers.
B Expenses are equal to the annualized expense ratio, multiplied by the average account value over the period, multiplied by 181/ 365 (to reflect the one-half year period). The fees and expenses of any Underlying Funds are not included in each annualized expense ratio.
C 5% return per year before expenses
Board Approval of Investment Advisory Contracts and Management Fees
VIP Value Strategies Portfolio
Each year, the Board of Trustees, including the Independent Trustees (together, the Board), votes on the renewal of the management contract with Fidelity Management & Research Company LLC (FMR) and the sub-advisory agreements (together, the Advisory Contracts) for the fund. FMR and the sub-advisers are referred to herein as the Investment Advisers. The Board, assisted by the advice of fund counsel and Independent Trustees' counsel, requests and considers a broad range of information relevant to the renewal of the Advisory Contracts throughout the year.
The Board meets regularly and, at each of its meetings, covers an extensive agenda of topics and materials and considers factors that are relevant to its annual consideration of the renewal of the fund's Advisory Contracts, including the services and support provided to the fund and its shareholders. The Board has established various standing committees (Committees), each composed of and chaired by Independent Trustees with varying backgrounds, to which the Board has assigned specific subject matter responsibilities in order to enhance effective decision-making by the Board. The Board, acting directly and through its Committees, requests and receives information concerning the annual consideration of the renewal of the fund's Advisory Contracts. The Board also meets as needed to review matters specifically related to the Board's annual consideration of the renewal of the Advisory Contracts. Members of the Board may also meet with trustees of other Fidelity funds through joint ad hoc committees to discuss certain matters relevant to all of the Fidelity funds.
Approval of Stub Period Continuation. At its January 2021 meeting, the Board of Trustees voted to continue the fund's management contract with FMR, and the sub-advisory agreements and sub-subadvisory agreements, in each case, where applicable (together, the Advisory Contracts), without modification, for four months from February 1, 2021 through May 31, 2021, in connection with changes to the Board's meeting calendar. The Board considered that the approval of the fund's Advisory Contracts will not result in any changes in (i) the investment process or strategies employed in the management of the fund's assets; (ii) the fees and expenses paid by shareholders; (iii) the nature, extent or quality of services provided under the fund's Advisory Contracts; or (iv) the day-to-day management of the fund or the persons primarily responsible for such management. The Board also considered that since its last approval of the fund's Advisory Contracts, FMR had provided additional information on the fund in support of the annual contract renewal process, including competitive analyses on total expenses and management fees and in-depth reviews of fund performance and fund profitability information. The Board also considered the findings of certain ad hoc committees that had been previously formed to discuss matters relevant to all of the Fidelity funds, including economies of scale, fall-out benefits and retail vs. institutional funds. The Board concluded that the fund's Advisory Contracts are fair and reasonable, and that the fund's Advisory Contracts should be renewed, without modification, through May 31, 2021, with the understanding that the Board will consider the annual renewal for a full one year period in May 2021.
At its May 2021 meeting, the Board unanimously determined to renew the fund's Advisory Contracts. In reaching its determination, the Board considered all factors it believed relevant, including (i) the nature, extent, and quality of the services provided to the fund and its shareholders (including the investment performance of the fund); (ii) the competitiveness of the fund's management fee and total expense ratio relative to peer funds; (iii) the total costs of the services provided by and the profits realized by Fidelity from its relationships with the fund; and (iv) the extent to which, if any, economies of scale exist and are realized as the fund grows, and whether any economies of scale are appropriately shared with fund shareholders.
In considering whether to renew the Advisory Contracts for the fund, the Board reached a determination, with the assistance of fund counsel and Independent Trustees' counsel and through the exercise of its business judgment, that the renewal of the Advisory Contracts was in the best interests of the fund and its shareholders and that the compensation payable under the Advisory Contracts was fair and reasonable. The Board's decision to renew the Advisory Contracts was not based on any single factor, but rather was based on a comprehensive consideration of all the information provided to the Board at its meetings throughout the year. The Board, in reaching its determination to renew the Advisory Contracts, was aware that shareholders of the fund have a broad range of investment choices available to them, including a wide choice among funds offered by Fidelity's competitors, and that the fund's shareholders, who have the opportunity to review and weigh the disclosure provided by the fund in its prospectus and other public disclosures, have chosen to invest in this fund, which is part of the Fidelity family of funds.
Nature, Extent, and Quality of Services Provided. The Board considered Fidelity's staffing as it relates to the fund, including the backgrounds of investment personnel of Fidelity, and also considered the fund's investment objective, strategies, and related investment philosophy. The Independent Trustees also had discussions with senior management of Fidelity's investment operations and investment groups. The Board considered the structure of the investment personnel compensation program and whether this structure provides appropriate incentives to act in the best interests of the fund. Additionally, the Board considered the portfolio managers' investments, if any, in the funds that they manage.
Resources Dedicated to Investment Management and Support Services. The Board and the Fund Oversight and Research Committees reviewed the general qualifications and capabilities of Fidelity's investment staff, including its size, education, experience, and resources, as well as Fidelity's approach to recruiting, training, managing, and compensating investment personnel. The Board noted that Fidelity has continued to increase the resources devoted to non-U.S. offices, including expansion of Fidelity's global investment organization. The Board also noted that Fidelity's analysts have extensive resources, tools and capabilities that allow them to conduct sophisticated quantitative and fundamental analysis, as well as credit analysis of issuers, counterparties and guarantors. Further, the Board considered that Fidelity's investment professionals have sufficient access to global information and data so as to provide competitive investment results over time, and that those professionals also have access to sophisticated tools that permit them to assess portfolio construction and risk and performance attribution characteristics continuously, as well as to transmit new information and research conclusions rapidly around the world. Additionally, in its deliberations, the Board considered Fidelity's trading, risk management, compliance, and technology and operations capabilities and resources, which are integral parts of the investment management process. The Board also considered Fidelity's investments in business continuity planning, and its success in continuously providing services to the fund notwithstanding the severe disruptions caused by the COVID-19 pandemic.
Shareholder and Administrative Services. The Board considered (i) the nature, extent, quality, and cost of advisory, administrative, and shareholder services performed by the Investment Advisers and their affiliates under the Advisory Contracts and under separate agreements covering transfer agency, pricing and bookkeeping, and securities lending services for the fund; (ii) the nature and extent of the supervision of third party service providers, principally custodians, subcustodians, and pricing vendors; and (iii) the resources devoted to, and the record of compliance with, the fund's compliance policies and procedures. The Board also reviewed the allocation of fund brokerage, including allocations to brokers affiliated with the Investment Advisers, the use of brokerage commissions to pay fund expenses, and the use of "soft" commission dollars to pay for research services.
The Board noted that the growth of fund assets over time across the complex allows Fidelity to reinvest in the development of services designed to enhance the value and convenience of the Fidelity funds as investment vehicles. These services include 24-hour access to account information and market information over the Internet and through telephone representatives, investor education materials and asset allocation tools, and the expanded availability of Fidelity Investor Centers.
The Board noted that, in the past, it and the boards of certain other Fidelity funds had formed an ad hoc Committee on Transfer Agency Fees to review the variety of transfer agency fee structures throughout the industry and Fidelity's competitive positioning with respect to industry participants.
Investment in a Large Fund Family. The Board considered the benefits to shareholders of investing in a Fidelity fund, including the benefits of investing in a fund that is part of a large family of funds offering a variety of investment disciplines and providing a large variety of mutual fund investor services. The Board noted that Fidelity had taken, or had made recommendations that resulted in the Fidelity funds taking, a number of actions over the previous year that benefited particular funds, including: (i) continuing to dedicate additional resources to Fidelity's investment research process, which includes meetings with management of issuers of securities in which the funds invest, and to the support of the senior management team that oversees asset management; (ii) continuing efforts to enhance Fidelity's global research capabilities; (iii) launching new funds and ETFs with innovative structures, strategies and pricing and making other enhancements to meet client needs; (iv) launching new share classes of existing funds; (v) eliminating purchase minimums and broadening eligibility requirements for certain funds and share classes; (vi) approving the reduction in the holding period for the Class C to Class A conversion policy; (vii) reducing management fees and total expenses for certain target date funds and classes and index funds; (viii) lowering expenses for certain existing funds and classes by implementing or lowering expense caps; (ix) rationalizing product lines and gaining increased efficiencies from fund mergers, liquidations, and share class consolidations; (x) continuing to develop, acquire and implement systems and technology to improve services to the funds and shareholders, strengthen information security, and increase efficiency; and (xi) continuing to implement enhancements to further strengthen Fidelity's product line to increase investors' probability of success in achieving their investment goals, including retirement income goals.
Investment Performance. The Board considered whether the fund has operated in accordance with its investment objective, as well as its record of compliance with its investment restrictions and its performance history.
The Board took into account discussions that occur at Board meetings throughout the year with representatives of the Investment Advisers about fund investment performance. In this regard the Board noted that as part of regularly scheduled fund reviews and other reports to the Board on fund performance, the Board considers annualized return information for the fund for different time periods, measured against an appropriate securities market index (benchmark index) and an appropriate peer group of funds with similar objectives (peer group). In its evaluation of fund investment performance, the Board gave particular attention to information indicating changes in performance of certain Fidelity funds for specific time periods and discussed with the Investment Advisers the reasons for any overperformance or underperformance.
In addition to reviewing absolute and relative fund performance, the Independent Trustees periodically consider the appropriateness of fund performance metrics in evaluating the results achieved. In general, the Independent Trustees believe that fund performance should be evaluated based on net performance (after fees and expenses) of both the highest performing and lowest performing fund share classes, where applicable, compared to appropriate benchmark indices, over appropriate time periods that may include full market cycles, and compared to peer groups, as applicable, over the same periods, taking into account relevant factors including the following: general market conditions; issuer-specific information; and fund cash flows and other factors.
The Independent Trustees recognize that shareholders evaluate performance on a net basis over their own holding periods, for which one-, three-, and five-year periods are often used as a proxy. For this reason, the performance information reviewed by the Board also included net cumulative total return information for the fund and an appropriate benchmark index and peer group for the most recent one-, three-, and five-year periods ended September 30, 2020, as shown below. Returns are shown compared to the 25th percentile (top of box, 75% beaten) and 75th percentile (bottom of box, 25% beaten) of the peer universe.
VIP Value Strategies Portfolio
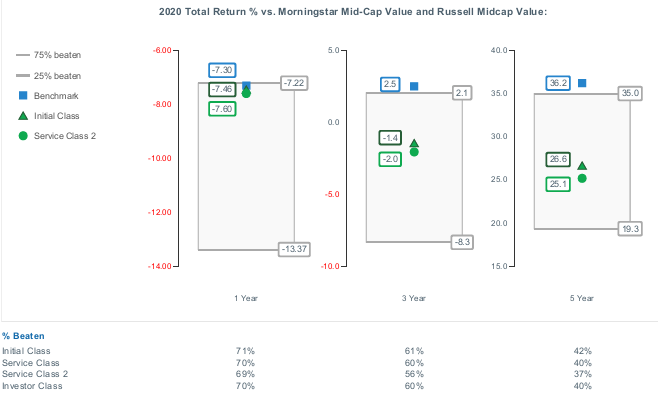
Based on its review, the Board concluded that the nature, extent, and quality of services provided to the fund under the Advisory Contracts should continue to benefit the shareholders of the fund.
Competitiveness of Management Fee and Total Expense Ratio. The Board considered the fund's management fee and total expense ratio compared to "mapped groups" of competitive funds and classes created for the purpose of facilitating the Trustees' competitive analysis of management fees and total expenses. Fidelity creates "mapped groups" by combining similar Lipper investment objective categories that have comparable investment mandates. Combining Lipper investment objective categories aids the Board's management fee and total expense ratio comparisons by broadening the competitive group used for comparison.
Management Fee. The Board considered two proprietary management fee comparisons for the 12-month periods ended September 30 (June 30 for periods ended 2019 and 2018 and December 31 for periods prior to 2018) shown in basis points (BP) in the chart below. The group of Lipper funds used by the Board for management fee comparisons is referred to below as the "Total Mapped Group." The Total Mapped Group comparison focuses on a fund's standing in terms of gross management fees before expense reimbursements or caps relative to the total universe of funds with comparable investment mandates, regardless of whether their management fee structures also are comparable. Funds with comparable investment mandates offer exposure to similar types of securities. Funds with comparable management fee structures have similar management fee contractual arrangements (
e.g., flat rate charged for advisory services, all-inclusive fee rate,
etc.). "TMG %" represents the percentage of funds in the Total Mapped Group that had management fees that were lower than the fund's. For example, a hypothetical TMG % of 20% would mean that 80% of the funds in the Total Mapped Group had higher, and 20% had lower, management fees than the fund. The fund's actual TMG %s and the number of funds in the Total Mapped Group are in the chart below. The "Asset-Sized Peer Group" (ASPG) comparison focuses on a fund's standing relative to a subset of non-Fidelity funds within the Total Mapped Group that are similar in size and management fee structure. For example, if a fund is in the first quartile of the ASPG, the fund's management fee ranks in the least expensive or lowest 25% of funds in the ASPG. The ASPG represents at least 15% of the funds in the Total Mapped Group with comparable asset size and management fee structures, subject to a minimum of 50 funds (or all funds in the Total Mapped Group if fewer than 50). Additional information, such as the ASPG quartile in which the fund's management fee rate ranked, is also included in the chart and was considered by the Board.
VIP Value Strategies Portfolio
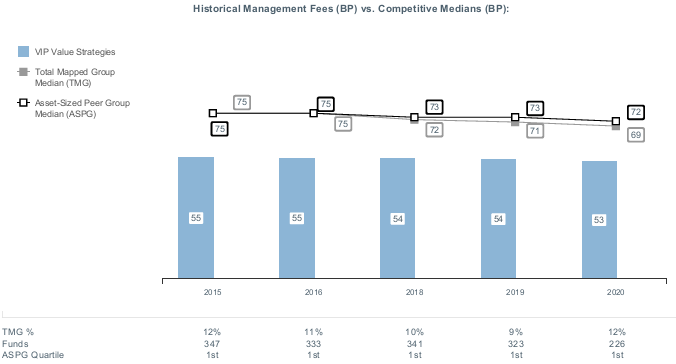
The Board noted that the fund's management fee rate ranked below the median of its Total Mapped Group and below the median of its ASPG for the 12-month period ended September 30, 2020.
The Board noted that, in the past, it and the boards of other Fidelity funds had formed an ad hoc Committee on Group Fee to conduct an in-depth review of the "group fee" component of the management fee of funds with such management fee structures. The Committee's focus included the mechanics of the group fee, the competitive landscape of group fee structures, Fidelity funds with no group fee component and investment products not included in group fee assets. The Board also considered that, for funds subject to the group fee, FMR agreed to voluntarily waive fees over a specified period of time in amounts designed to account for assets converted from certain funds to certain collective investment trusts.
The Board also noted that, in 2013, the ad hoc Committee on Management Fees was formed to conduct an in-depth review of the management fee rates of Fidelity's active equity mutual funds. The Committee focused on the following areas: (i) standard fee structures; (ii) research consumption and trading evolution; (iii) management fee competitiveness/profitability by category; and (iv) factors that drive institutional pricing.
Based on its review, the Board concluded that the fund's management fee is fair and reasonable in light of the services that the fund receives and the other factors considered.
Total Expense Ratio. In its review of each class's total expense ratio, the Board considered the fund's management fee rate as well as other fund or class expenses, as applicable, such as transfer agent fees, pricing and bookkeeping fees, fund-paid 12b-1 fees, and custodial, legal, and audit fees. The Board also noted that Fidelity may agree to waive fees or reimburse expenses from time to time, and the extent to which, if any, it has done so for the fund. As part of its review, the Board also considered the current and historical total expense ratios of each class of the fund compared to competitive fund median expenses. The fund's representative class is compared to those funds and classes in the Total Mapped Group (used by the Board for management fee comparisons) that have a similar sales load structure (SLTG). The Board also considered a total expense ASPG comparison for the representative class, which focuses on the total expenses of the representative class relative to a subset of non-Fidelity funds within the total expense SLTG. The total expense ASPG is limited to 15 larger and 15 smaller classes in fund average assets for a total of 30 classes, where possible. The total expense ASPG comparison excludes performance adjustments and fund-paid 12b-1 fees to eliminate variability in fee structures.
The Board noted that the total expense ratio of Initial Class ranked below the SLTG competitive median and below the ASPG competitive median for the 12-month period ended September 30, 2020.
Fees Charged to Other Fidelity Clients. The Board also considered Fidelity fee structures and other information with respect to clients of Fidelity, such as other funds advised or subadvised by Fidelity, pension plan clients, and other institutional clients with similar mandates. The Board noted that a joint ad hoc committee created by it and the boards of other Fidelity funds periodically reviews and compares Fidelity's institutional investment advisory business with its business of providing services to the Fidelity funds and also noted the most recent findings of the committee. The Board noted that the committee's review included a consideration of the differences in services provided, fees charged, and costs incurred, as well as competition in the markets serving the different categories of clients.
Based on its review of total expense ratios and fees charged to other Fidelity clients, the Board concluded that the total expense ratio of each class of the fund was reasonable in light of the services that the fund and its shareholders receive and the other factors considered.
Costs of the Services and Profitability. The Board considered the revenues earned and the expenses incurred by Fidelity in conducting the business of developing, marketing, distributing, managing, administering and servicing the fund and servicing the fund's shareholders. The Board also considered the level of Fidelity's profits in respect of all the Fidelity funds.
On an annual basis, Fidelity presents to the Board information about the profitability of its relationships with the fund. Fidelity calculates profitability information for each fund, as well as aggregate profitability information for groups of Fidelity funds and all Fidelity funds, using a series of detailed revenue and cost allocation methodologies which originate with the books and records of Fidelity on which Fidelity's audited financial statements are based. The Audit Committee of the Board reviews any significant changes from the prior year's methodologies and the full Board approves such changes.
A public accounting firm has been engaged annually by the Board as part of the Board's assessment of Fidelity's profitability analysis. The engagement includes the review and assessment of the methodologies used by Fidelity in determining the revenues and expenses attributable to Fidelity's mutual fund business, and completion of agreed-upon procedures in respect of the mathematical accuracy of certain fund profitability information and its conformity to established allocation methodologies. After considering the reports issued under the engagement and information provided by Fidelity, the Board concluded that while other allocation methods may also be reasonable, Fidelity's profitability methodologies are reasonable in all material respects.
The Board also reviewed Fidelity's non-fund businesses and potential indirect benefits such businesses may have received as a result of their association with Fidelity's mutual fund business (i.e., fall-out benefits) as well as cases where Fidelity's affiliates may benefit from the funds' business. The Board considered areas where potential indirect benefits to the Fidelity funds from their relationships with Fidelity may exist. The Board also considered that in 2019 a joint ad hoc committee created by it and the boards of other Fidelity funds evaluated potential fall-out benefits (PFOB Committee). The Board noted that it considered the PFOB Committee's findings in connection with its consideration of the renewal of the Advisory Contracts.
The Board considered the costs of the services provided by and the profits realized by Fidelity in connection with the operation of the fund, including the conclusions of the PFOB Committee, and was satisfied that the profitability was not excessive.
Economies of Scale. The Board considered whether there have been economies of scale in respect of the management of the Fidelity funds, whether the Fidelity funds (including the fund) have appropriately benefited from any such economies of scale, and whether there is potential for realization of any further economies of scale. The Board considered the extent to which the fund will benefit from economies of scale as assets grow through increased services to the fund, through waivers or reimbursements, or through fee or expense ratio reductions. The Board also noted that a committee (the Economies of Scale Committee) created by it and the boards of other Fidelity funds periodically analyzes whether Fidelity attains economies of scale in respect of the management and servicing of the Fidelity funds, whether the Fidelity funds have appropriately benefited from such economies of scale, and whether there is potential for realization of any further economies of scale.
The Board recognized that the fund's management contract incorporates a "group fee" structure, which provides for lower group fee rates as total "group assets" increase, and for higher group fee rates as total "group assets" decrease ("group assets" as defined in the management contract). FMR calculates the group fee rates based on a tiered asset "breakpoint" schedule that varies based on asset class. The Board considered that the group fee is designed to deliver the benefits of economies of scale to fund shareholders when total Fidelity fund assets increase, even if assets of any particular fund are unchanged or have declined, because some portion of Fidelity's costs are attributable to services provided to all Fidelity funds, and all funds benefit if those costs can be allocated among more assets. The Board further considered that Fidelity agreed to impose a temporary fee waiver in the form of additional breakpoints to the current breakpoint schedule. The Board concluded that, given the group fee structure, fund shareholders will benefit from lower management fees as "group assets" increase at the fund complex level, regardless of whether Fidelity achieves any such economies of scale.
The Board concluded, taking into account the analysis of the Economies of Scale Committee, that economies of scale, if any, are being appropriately shared between fund shareholders and Fidelity.
Additional Information Requested by the Board. In order to develop fully the factual basis for consideration of the Fidelity funds' advisory contracts, the Board requested and received additional information on certain topics, including: (i) fund flow and performance trends, in particular the underperformance of certain funds and strategies, and Fidelity's long-term strategies for certain funds; (ii) consideration of expanding the use of performance fees for additional funds; (iii) Fidelity's pricing philosophy compared to competitors; (iv) metrics for evaluating index fund and ETF performance and information about ETF trading characteristics; (v) the methodology with respect to evaluating competitive fund data and peer group classifications and fee and expense comparisons; (vi) the expense structures for different funds and classes and information about the differences between various expense structures; (vii) group fee breakpoints; (viii) information regarding other accounts managed by Fidelity and sub-advisory arrangements; and (ix) Fidelity's philosophies and strategies for evaluating funds and classes with lower or declining asset levels.
Based on its evaluation of all of the conclusions noted above, and after considering all factors it believed relevant, the Board concluded that the advisory fee arrangements are fair and reasonable, and that the fund's Advisory Contracts should be renewed.
Liquidity Risk Management Program
The Securities and Exchange Commission adopted Rule 22e-4 under the Investment Company Act of 1940 (the Liquidity Rule) to promote effective liquidity risk management throughout the open-end investment company industry, thereby reducing the risk that funds will be unable to meet their redemption obligations and mitigating dilution of the interests of fund shareholders.
The Fund has adopted and implemented a liquidity risk management program pursuant to the Liquidity Rule (the Program) effective December 1, 2018. The Program is reasonably designed to assess and manage the Fund’s liquidity risk and to comply with the requirements of the Liquidity Rule. The Fund’s Board of Trustees (the Board) has designated the Fund’s investment adviser as administrator of the Program. The Fidelity advisers have established a Liquidity Risk Management Committee (the LRM Committee) to manage the Program for each of the Fidelity Funds. The LRM Committee monitors the adequacy and effectiveness of implementation of the Program and on a periodic basis assesses each Fund’s liquidity risk based on a variety of factors including (1) the Fund’s investment strategy, (2) portfolio liquidity and cash flow projections during normal and reasonably foreseeable stressed conditions, (3) shareholder redemptions, (4) borrowings and other funding sources and (5) in the case of exchange-traded funds, certain additional factors including the effect of the Fund’s prices and spreads, market participants, and basket compositions on the overall liquidity of the Fund’s portfolio, as applicable.
In accordance with the Program, each of the Fund’s portfolio investments is classified into one of four liquidity categories described below based on a determination of a reasonable expectation for how long it would take to convert the investment to cash (or sell or dispose of the investment) without significantly changing its market value.
- Highly liquid investments – cash or convertible to cash within three business days or less
- Moderately liquid investments – convertible to cash in three to seven calendar days
- Less liquid investments – can be sold or disposed of, but not settled, within seven calendar days
- Illiquid investments – cannot be sold or disposed of within seven calendar days
Liquidity classification determinations take into account a variety of factors including various market, trading and investment-specific considerations, as well as market depth, and generally utilize analysis from a third-party liquidity metrics service.
The Liquidity Rule places a 15% limit on a fund’s illiquid investments and requires funds that do not primarily hold assets that are highly liquid investments to determine and maintain a minimum percentage of the fund’s net assets to be invested in highly liquid investments (highly liquid investment minimum or HLIM). The Program includes provisions reasonably designed to comply with the 15% limit on illiquid investments and for determining, periodically reviewing and complying with the HLIM requirement as applicable.
At a recent meeting of the Fund’s Board of Trustees, the LRM Committee provided a written report to the Board pertaining to the operation, adequacy, and effectiveness of implementation of the Program for the annual period from December 1, 2019 through November 30, 2020. The report concluded that the Program has been implemented and is operating effectively and is reasonably designed to assess and manage the Fund’s liquidity risk.
VIPVS-SANN-0821
1.774744.119
Item 2.
Code of Ethics
Not applicable.
Item 3.
Audit Committee Financial Expert
Not applicable.
Item 4.
Principal Accountant Fees and Services
Not applicable.
Item 5.
Audit Committee of Listed Registrants
Not applicable.
Item 6.
Investments
(a)
Not applicable.
(b)
Not applicable
Item 7.
Disclosure of Proxy Voting Policies and Procedures for Closed-End Management Investment Companies
Not applicable.
Item 8.
Portfolio Managers of Closed-End Management Investment Companies
Not applicable.
Item 9.
Purchase of Equity Securities by Closed-End Management Investment Company and Affiliated Purchasers
Not applicable.
Item 10.
Submission of Matters to a Vote of Security Holders
There were no material changes to the procedures by which shareholders may recommend nominees to the Variable Insurance Products Fund III’s Board of Trustees.
Item 11.
Controls and Procedures
(a)(i) The President and Treasurer and the Chief Financial Officer have concluded that the Variable Insurance Products Fund III’s (the “Trust”) disclosure controls and procedures (as defined in Rule 30a-3(c) under the Investment Company Act) provide reasonable assurances that material information relating to the Trust is made known to them by the appropriate persons, based on their evaluation of these controls and procedures as of a date within 90 days of the filing date of this report.
(a)(ii) There was no change in the Trust’s internal control over financial reporting (as defined in Rule 30a-3(d) under the Investment Company Act) that occurred during the period covered by this report that has materially affected, or is reasonably likely to materially affect, the Trust’s internal control over financial reporting.
Item 12.
Disclosure of Securities Lending Activities for Closed-End Management
Investment Companies
Not applicable.
Item 13.
Exhibits
SIGNATURES
Pursuant to the requirements of the Securities Exchange Act of 1934 and the Investment Company Act of 1940, the registrant has duly caused this report to be signed on its behalf by the undersigned, thereunto duly authorized.
Variable Insurance Products Fund III
| |
By: | /s/Stacie M. Smith |
| Stacie M. Smith |
| President and Treasurer |
|
|
Date: | August 19, 2021 |
Pursuant to the requirements of the Securities Exchange Act of 1934 and the Investment Company Act of 1940, this report has been signed below by the following persons on behalf of the registrant and in the capacities and on the dates indicated.
| |
By: | /s/Stacie M. Smith |
| Stacie M. Smith |
| President and Treasurer |
|
|
Date: | August 19, 2021 |
| |
By: | /s/John J. Burke III |
| John J. Burke III |
| Chief Financial Officer |
|
|
Date: | August 19, 2021 |