UNITED STATES
SECURITIES AND EXCHANGE COMMISSION
Washington, D.C. 20549
FORM N-CSR
CERTIFIED SHAREHOLDER REPORT OF REGISTERED
MANAGEMENT INVESTMENT COMPANIES
Investment Company Act File Number: 811-07209
| T. Rowe Price Value Fund, Inc. |
|
| (Exact name of registrant as specified in charter) |
| |
| 100 East Pratt Street, Baltimore, MD 21202 |
|
| (Address of principal executive offices) |
| |
| David Oestreicher |
| 100 East Pratt Street, Baltimore, MD 21202 |
|
| (Name and address of agent for service) |
Registrant’s telephone number, including area code: (410) 345-2000
Date of fiscal year end: December 31
Date of reporting period: December 31, 2017
Item 1. Report to Shareholders
| Value Fund | December 31, 2017 |
The views and opinions in this report were current as of December 31, 2017. They are not guarantees of performance or investment results and should not be taken as investment advice. Investment decisions reflect a variety of factors, and the managers reserve the right to change their views about individual stocks, sectors, and the markets at any time. As a result, the views expressed should not be relied upon as a forecast of the fund’s future investment intent. The report is certified under the Sarbanes-Oxley Act, which requires mutual funds and other public companies to affirm that, to the best of their knowledge, the information in their financial reports is fairly and accurately stated in all material respects.
REPORTS ON THE WEB
Sign up for our Email Program, and you can begin to receive updated fund reports and prospectuses online rather than through the mail. Log in to your account at troweprice.com for more information.
Manager’s Letter
Fellow Shareholders
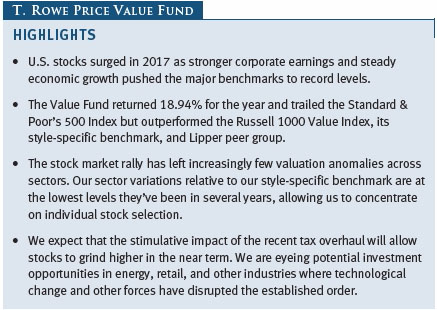
A recovery in corporate profits, steady economic growth overseas, and optimism about the Trump administration’s plans for tax reform drove U.S. stocks higher in 2017. The S&P 500 Index and other major benchmarks surged to record levels into December as earnings rebounded after more than a year of declining profits and the U.S. economy showed signs of growing strength. The improving economic backdrop worldwide allayed concerns about rising U.S. interest rates and geopolitical tensions in a few countries. Against this favorable backdrop, the Value Fund posted a strong return for the year.
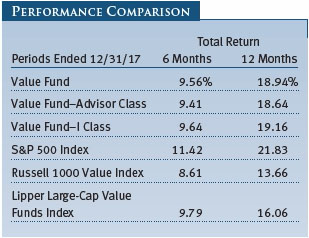
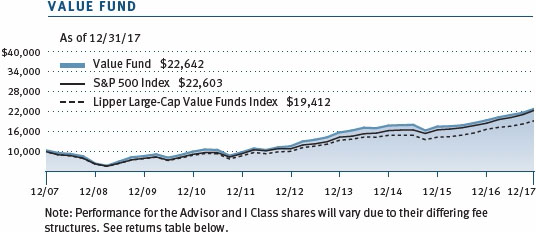
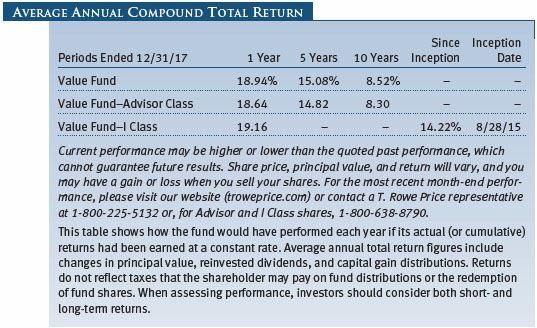
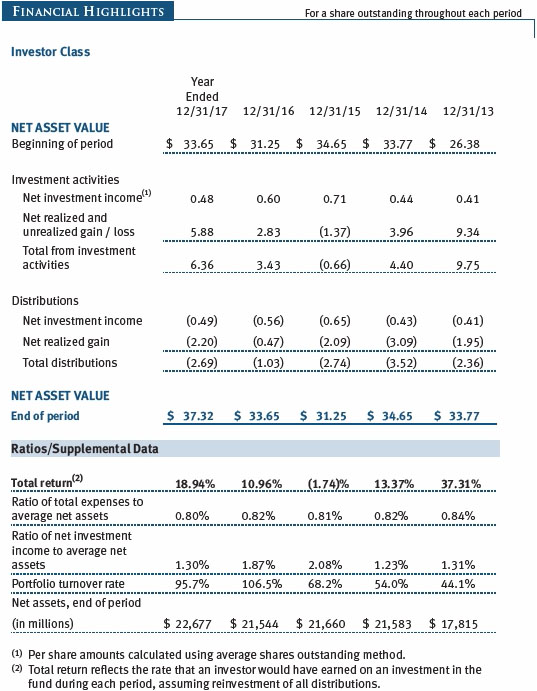
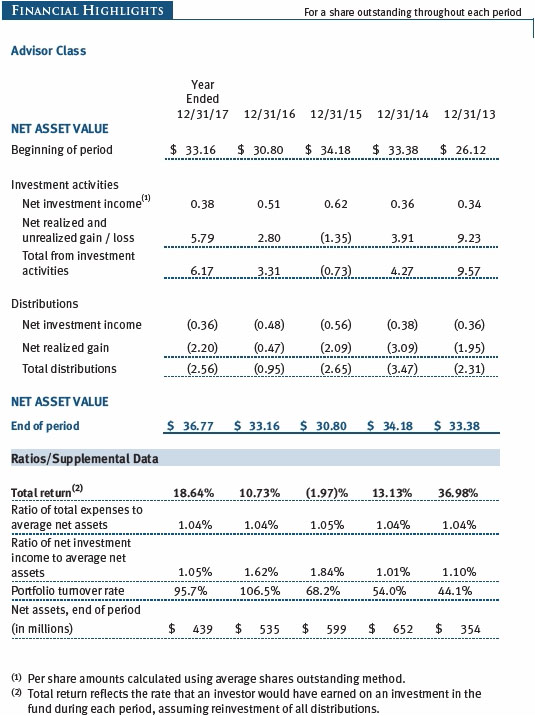
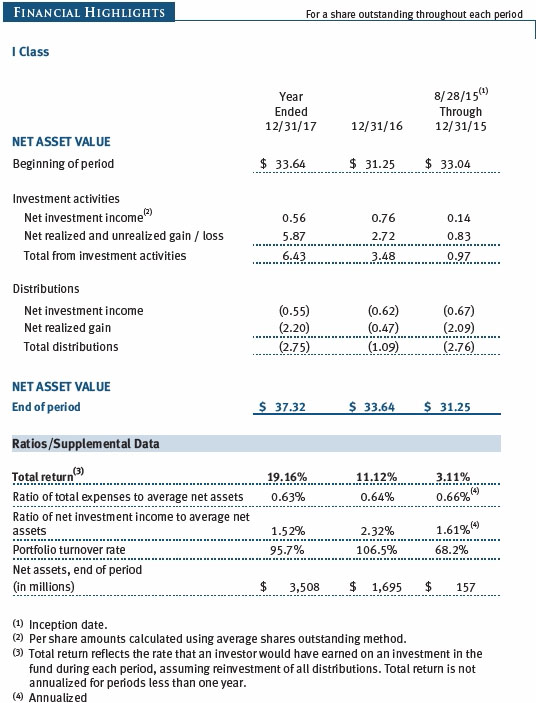
The Value Fund returned 9.56% and 18.94% for the six and 12 months ended December 31, 2017, respectively, versus 11.42% and 21.83% for the Standard & Poor’s 500 Index. (Returns for Advisor and I Class shares reflect their different fee structures.) The fund outpaced the Russell 1000 Value Index, its style-specific benchmark, which returned 8.61% and 13.66% over the corresponding periods. It slightly trailed its peer group, the Lipper Large-Cap Value Funds Index, over the six-month period but outpaced it for the full year.
The Value Fund’s underperformance against the S&P 500 Index reflects the unusually large disparity in returns for growth and value stocks in 2017, when growth stocks returned more than twice as much as value stocks in the large-cap universe, according to Russell indexes. The strong outperformance of growth stocks hurt the Value Fund’s relative performance against the S&P 500 Index, which encompasses both growth and value stocks. Because we invest in undervalued companies with long-term appreciation prospects, it is unsurprising that the fund lagged the S&P 500 Index in a year when growth stocks widely outpaced value.
Effective March 1, 2018, the performance benchmark of the Value Fund will change to the Russell 1000 Value Index from the current S&P 500 Index. We believe that the Russell 1000 Value Index is a more appropriate style-specific benchmark that better aligns with our value-focused investment style. Moreover, the Russell 1000 Value Index better captures our investment universe, which is much broader than the S&P 500, and provides a more accurate performance comparison when one investment style dominates another for an extended period. The benchmark change will not affect day-to-day management of the Value Fund or its investment style, which remains unchanged since its 1994 inception.
Every sector contributed to the fund’s absolute returns for the year. Compared with the S&P 500 Index, consumer staples followed by energy contributed the most to relative performance, while information technology, the best-performing sector of the S&P 500, detracted the most due to our sizable underweight. Measured against the Russell 1000 Value Index, energy and industrials and business services stocks, respectively, contributed the most to relative returns, while financials and materials were the largest detractors.
The fund’s performance versus its peers over longer periods remained solid. The Value Fund ranks in the top quintile of its Lipper peer group for the trailing one-year period, the top third for the trailing three-year period, and the top decile for the trailing 5- and 10-year periods, respectively. Based on cumulative total return, Lipper ranked the fund 85 of 473, 141 of 416, 37 of 373, and 18 of 266 large-cap value funds for the 1-, 3-, 5-, and 10-year periods ended December 31, 2017, respectively. Since your fund’s inception in 1994, it has outpaced both the broad market and its Lipper peer group by posting an annualized gain of 11.25% compared with the S&P 500’s return of 9.94% and the Lipper index’s return of 8.88%. Past performance cannot guarantee future results.
MARKET ENVIRONMENT
The major U.S. stock market indexes rose to record levels in the year’s second half as earnings beat expectations and investors anticipated that corporate tax cuts would boost profits even further. Overseas, signs of synchronized growth grew more plentiful over the year as the global economic recovery broadened and corporate earnings improved worldwide. The S&P 500 Index ended 2017 near a record high, joining other global stock benchmarks that finished at all-time or multiyear highs. The strong performance in the U.S. and other major markets occurred even as the Federal Reserve continued to tighten its accommodative monetary policy in place since the 2008 financial crisis. The Fed raised short-term interest rates three times over the year and signaled three more increases in 2018.
Large-cap shares outperformed their smaller peers in 2017. Growth stocks widely outpaced value stocks across all market capitalizations, according to various Russell indexes. In both the S&P 500 and Russell 1000 Value Indexes, nine out of 11 sectors advanced and two fell. IT stocks performed the best in both benchmarks, driven by outsized gains in a handful of high-growth technology and Internet stocks. Materials, consumer discretionary, financials, and health care were the next-best performers. On the other hand, telecommunication services stocks retreated as wireless companies contended with slowing growth and stiffer price competition. Energy stocks also declined as low oil prices weighed on the sector in the year’s first half. However, cooperation among the world’s major oil producers to curb output drove oil prices higher and helped energy stocks pare their losses by year-end.
PORTFOLIO REVIEW
The Value Fund buys and holds fundamentally sound, undervalued companies with potential for improved performance. The fund’s holdings are typically solid, higher-quality companies that generate strong free cash flow and trade at a discount to our estimated sum-of-the-parts valuation. We spend much effort assessing the potential return and risk associated with a specific company, believing that if we can successfully identify companies with asymmetric return potential, then we should be able to outperform the market and our peers over time. We rely on the insights of T. Rowe Price’s large team of equity analysts and use an active, research-driven investment approach to pick individual stocks based on their unique merits, rather than picking stocks based on broader market or economic trends.
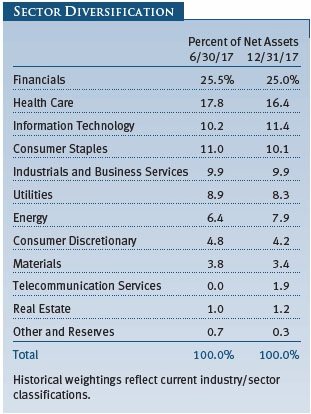
The 2017 stock market rally pushed valuations higher in most sectors, leaving fewer opportunities to exploit valuation anomalies between different sectors. Due to the scarcity of valuation anomalies, we anticipate keeping our sector allocations closer to their respective weights in the Russell 1000 Value Index as we concentrate on individual stock selection. Our sector bets relative to the Russell 1000 Value Index have fallen to lower levels than they’ve been in several years as a result, and we expect that stock selection will become more important in driving performance in the medium term.
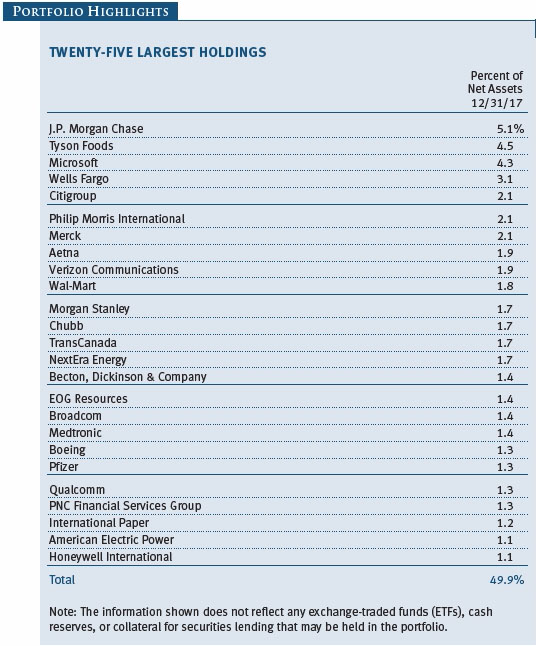
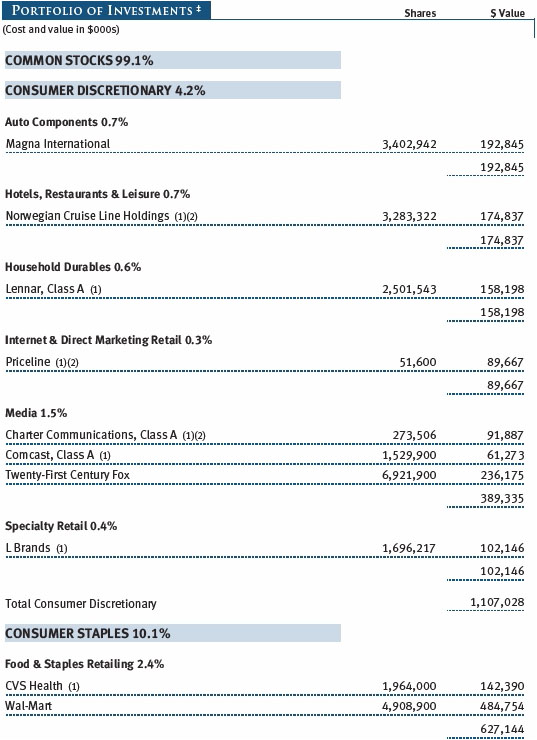
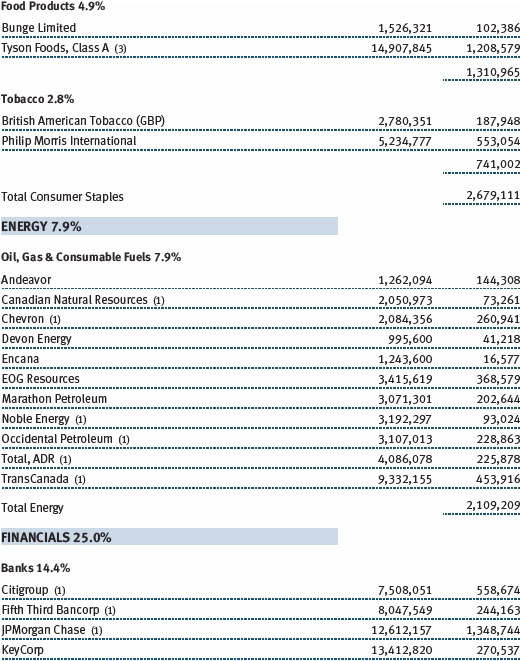
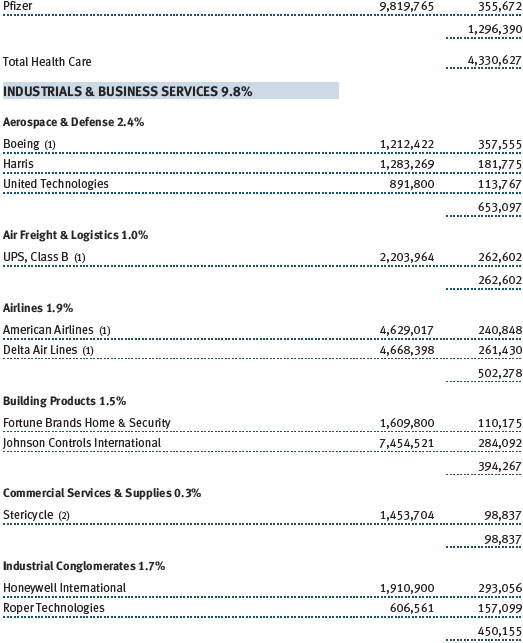
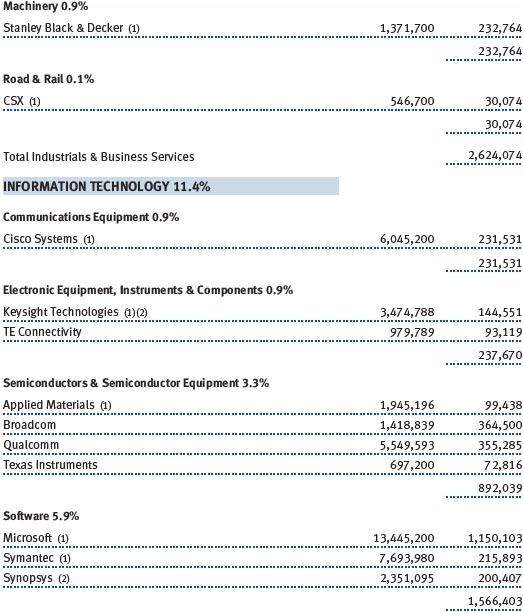
Stock selection was notably strong in consumer staples, which produced several of the year’s top contributors. Packaged meats company Tyson Foods and tobacco company Philip Morris International were both standout performers. Wal-Mart was another major contributor as the retailer stepped up efforts to improve its e-commerce business. Positive selection in industrials and business services also helped returns. Boeing led contributors in this sector as the aerospace company reaped the benefits of productivity gains, cost cuts, and growth in global air traffic. We trimmed our Boeing position as its risk/reward profile grew less attractive after its shares climbed to record levels, but we continue to favor the company, which remains one of the fund’s top 25 holdings. (Please refer to our portfolio of investments for a complete list of holdings and the amount each represents in the portfolio.)
Energy stocks underperformed in 2017, but we added value in the sector as we focused on companies with strong balance sheets, access to low-cost energy sources, and comparatively low cost structures that can withstand an environment of relatively low oil prices. Our positions in French oil producer Total, pipeline operator TransCanada, and oil and gas exploration and production company EOG Resources posted solid returns, bucking the energy sector’s decline. After reducing our energy exposure in the year’s first half, we reversed course in December as Republicans in Congress drew closer to passing a sweeping tax bill, which we reasoned would benefit energy and other economically sensitive sectors. We added to U.S. oil major Chevron and other energy holdings late in the period. Our long-term view of the sector remains bearish, however, as we believe that rising U.S. shale production and a continued global oversupply of oil will restrain crude prices for a prolonged period. As the tax overhaul effort gained momentum at year-end, we increased our exposure to consumer discretionary, another cyclical sector that stands to gain from lower taxes. We initiated a position in Charter Communications on weakness after the cable company reported a steep drop in customers in the fall.
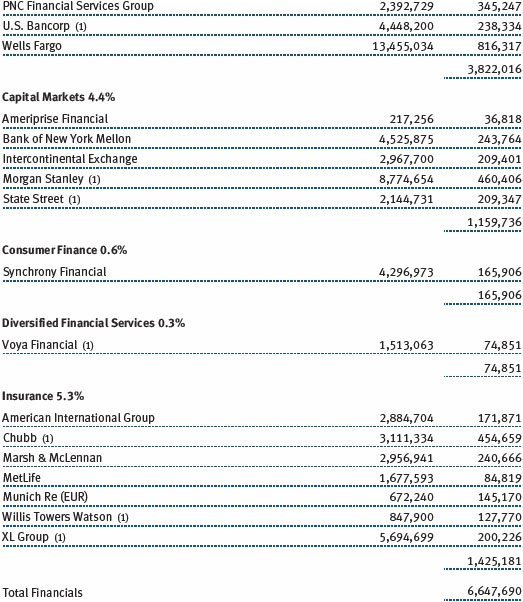
We maintained our relatively large allocation to financials. This sector performed strongly last year amid expectations that rising interest rates, industry deregulation, and lower corporate taxes would boost earnings for banks and other financial companies. Wells Fargo ranked among our largest purchases in the year’s second half. Despite the continued fallout from a scandal involving cross-selling multiple financial products to customers, we regard Wells Fargo as a fundamentally strong, high-quality bank whose problems are already reflected in its stock price.
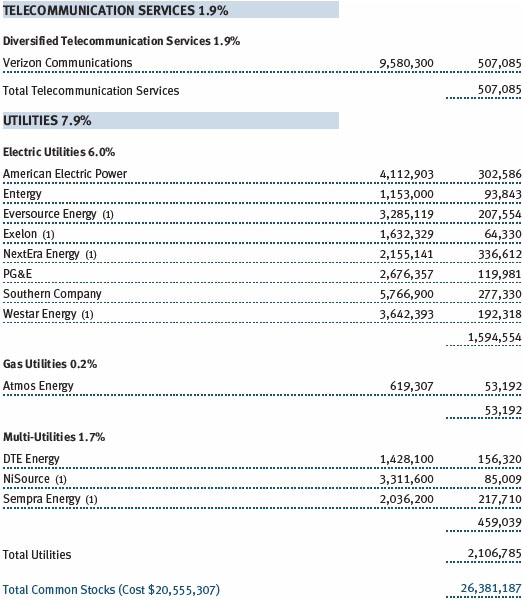
Major detractors came from a range of sectors. Utility PG&E was the biggest performance detractor in 2017 as its shares fell amid uncertainty about the scope of its liability in deadly wildfires that struck California in October and the company suspended its dividend at year-end. GE also weighed on performance as the company struggled to overhaul its sprawling operations and investors expressed skepticism about a turnaround plan unveiled by its new chief executive. We significantly reduced our PG&E position and eliminated GE from the fund in the year’s second half at meaningfully higher prices than the company’s stock price at the end of December.
OUTLOOK
U.S. stocks benefited in 2017 from a rare confluence of favorable events including better-than-expected earnings, tame inflation, and synchronized global growth. Fortunately, most of the risks that investors feared at the outset of the year—such as a shift toward U.S. protectionism or a geopolitical crisis—did not materialize. The U.S. economy is in solid shape, and the underpinnings for stronger corporate profits growth are intact. However, the past year’s rally has left stock valuations looking stretched, while other asset prices appear increasingly expensive.
We would not be surprised to see the stock market grind higher in the coming months, aided by the stimulative impact of the recent tax overhaul. In the near term, we intend to keep our relatively low sector bets versus the Russell 1000 Value Index and use our strengths in fundamental analysis to find undervalued companies with a particular focus on energy, media, telecommunications, and retail. These industries are experiencing major changes brought on by rapidly evolving technologies, changing consumer habits, and other secular forces that have eroded the dominance of traditional players. Finding the long-term winners in these areas that are undergoing disruption will be crucial for generating good performance in the coming years, in our view.
We anticipate a bumpier ride in 2018 as geopolitical risks resurface and economic data and corporate earnings become more mixed after last year’s universally positive performance. Thanks to T. Rowe Price’s strengths in fundamental research and the collective insights of our equity analysts, we are well equipped to navigate what will likely be a more volatile environment and continue to identify higher-quality, undervalued companies for your fund. We are confident that our disciplined investment approach, thoughtful stock selection, and attention to valuation will allow us to continue delivering solid shareholder returns over the long term.
Thank you for investing with T. Rowe Price.
Respectfully submitted,

Mark S. Finn
President of the fund and chairman of its Investment Advisory Committee
January 23, 2018
The committee chairman has day-to-day responsibility for managing the portfolio and works with committee members in developing and executing the fund’s investment program.
RISKS OF INVESTING IN THE FUND
Value investors seek to invest in companies whose stock prices are low in relation to their real worth or future prospects. By identifying companies whose stocks are currently out of favor or misunderstood, value investors hope to realize significant appreciation as other investors recognize the stock’s intrinsic value and the price rises accordingly. The value approach carries the risk that the market will not recognize a security’s intrinsic value for a long time or that a stock judged to be undervalued may actually be appropriately priced.
GLOSSARY
Lipper index: An index of mutual fund performance returns for specified periods in defined categories as tracked by Lipper Inc.
Russell 1000 Index: An index that tracks the performance of the 1,000 largest companies in the Russell 3000 Index.
S&P 500 Index: A market cap-weighted index of 500 widely held stocks often used as a proxy for the overall stock market. Performance is reported on a total return basis.
Note: Russell Investment Group is the source and owner of the trademarks, service marks, and copyrights related to the Russell indexes. Russell® is a trademark of Russell Investment Group.

Performance and Expenses
This chart shows the value of a hypothetical $10,000 investment in the fund over the past 10 fiscal year periods or since inception (for funds lacking 10-year records). The result is compared with benchmarks, which may include a broad-based market index and a peer group average or index. Market indexes do not include expenses, which are deducted from fund returns as well as mutual fund averages and indexes.
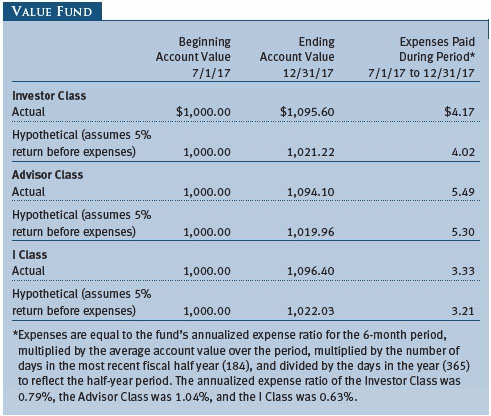
As a mutual fund shareholder, you may incur two types of costs: (1) transaction costs, such as redemption fees or sales loads, and (2) ongoing costs, including management fees, distribution and service (12b-1) fees, and other fund expenses. The following example is intended to help you understand your ongoing costs (in dollars) of investing in the fund and to compare these costs with the ongoing costs of investing in other mutual funds. The example is based on an investment of $1,000 invested at the beginning of the most recent six-month period and held for the entire period.
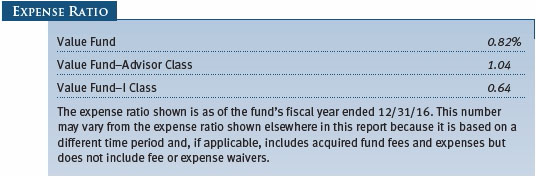
Please note that the fund has three share classes: The original share class (Investor Class) charges no distribution and service (12b-1) fee, the Advisor Class shares are offered only through unaffiliated brokers and other financial intermediaries and charge a 0.25% 12b-1 fee, and I Class shares are available to institutionally oriented clients and impose no 12b-1 or administrative fee payment. Each share class is presented separately in the table.
Actual Expenses
The first line of the following table (Actual) provides information about actual account values and expenses based on the fund’s actual returns. You may use the information on this line, together with your account balance, to estimate the expenses that you paid over the period. Simply divide your account value by $1,000 (for example, an $8,600 account value divided by $1,000 = 8.6), then multiply the result by the number on the first line under the heading “Expenses Paid During Period” to estimate the expenses you paid on your account during this period.
Hypothetical Example for Comparison Purposes
The information on the second line of the table (Hypothetical) is based on hypothetical account values and expenses derived from the fund’s actual expense ratio and an assumed 5% per year rate of return before expenses (not the fund’s actual return). You may compare the ongoing costs of investing in the fund with other funds by contrasting this 5% hypothetical example and the 5% hypothetical examples that appear in the shareholder reports of the other funds. The hypothetical account values and expenses may not be used to estimate the actual ending account balance or expenses you paid for the period.
Note: T. Rowe Price charges an annual account service fee of $20, generally for accounts with less than $10,000. The fee is waived for any investor whose T. Rowe Price mutual fund accounts total $50,000 or more; accounts electing to receive electronic delivery of account statements, transaction confirmations, prospectuses, and shareholder reports; or accounts of an investor who is a T. Rowe Price Personal Services or Enhanced Personal Services client (enrollment in these programs generally requires T. Rowe Price assets of at least $250,000). This fee is not included in the accompanying table. If you are subject to the fee, keep it in mind when you are estimating the ongoing expenses of investing in the fund and when comparing the expenses of this fund with other funds.
You should also be aware that the expenses shown in the table highlight only your ongoing costs and do not reflect any transaction costs, such as redemption fees or sales loads. Therefore, the second line of the table is useful in comparing ongoing costs only and will not help you determine the relative total costs of owning different funds. To the extent a fund charges transaction costs, however, the total cost of owning that fund is higher.
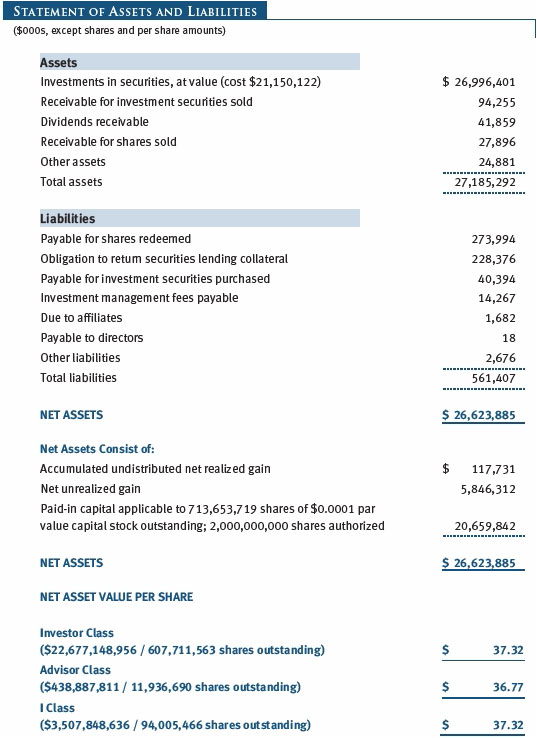
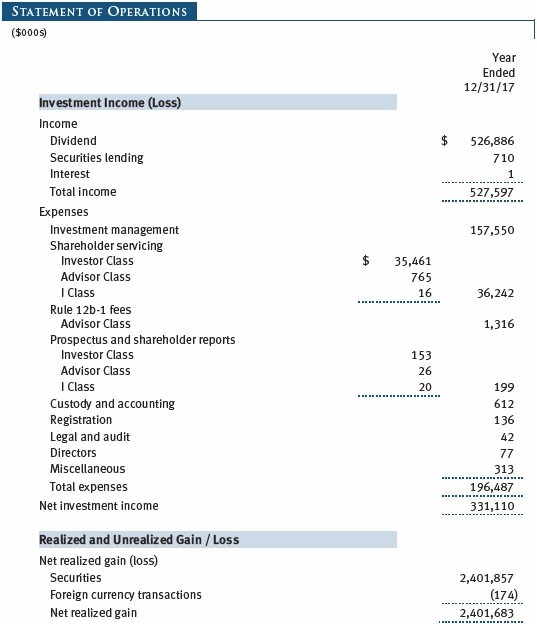
The accompanying notes are an integral part of these financial statements.
The accompanying notes are an integral part of these financial statements.
The accompanying notes are an integral part of these financial statements.
The accompanying notes are an integral part of these financial statements.
The accompanying notes are an integral part of these financial statements.
The accompanying notes are an integral part of these financial statements.
The accompanying notes are an integral part of these financial statements.
| Notes to Financial Statements |
T. Rowe Price Value Fund, Inc. (the fund) is registered under the Investment Company Act of 1940 (the 1940 Act) as a diversified, open-end management investment company. The fund seeks to provide long-term capital appreciation by investing in common stocks believed to be undervalued. Income is a secondary objective. The fund has three classes of shares: the Value Fund (Investor Class), the Value Fund–Advisor Class (Advisor Class), and the Value Fund–I Class (I Class). Advisor Class shares are sold only through unaffiliated brokers and other unaffiliated financial intermediaries. I Class shares generally are available only to investors meeting a $1,000,000 minimum investment or certain other criteria. The Advisor Class operates under a Board-approved Rule 12b-1 plan pursuant to which the class compensates financial intermediaries for distribution, shareholder servicing, and/or certain administrative services; the Investor and I Classes do not pay Rule 12b-1 fees. Each class has exclusive voting rights on matters related solely to that class; separate voting rights on matters that relate to all classes; and, in all other respects, the same rights and obligations as the other classes.
NOTE 1 - SIGNIFICANT ACCOUNTING POLICIES
Basis of Preparation The fund is an investment company and follows accounting and reporting guidance in the Financial Accounting Standards Board (FASB) Accounting Standards Codification Topic 946 (ASC 946). The accompanying financial statements were prepared in accordance with accounting principles generally accepted in the United States of America (GAAP), including, but not limited to, ASC 946. GAAP requires the use of estimates made by management. Management believes that estimates and valuations are appropriate; however, actual results may differ from those estimates, and the valuations reflected in the accompanying financial statements may differ from the value ultimately realized upon sale or maturity.
Investment Transactions, Investment Income, and Distributions Investment transactions are accounted for on the trade date basis. Income and expenses are recorded on the accrual basis. Realized gains and losses are reported on the identified cost basis. Dividends received from mutual fund investments are reflected as dividend income; capital gain distributions are reflected as realized gain/loss. Dividend income and capital gain distributions are recorded on the ex-dividend date. Income tax-related interest and penalties, if incurred, are recorded as income tax expense. Distributions from REITs are initially recorded as dividend income and, to the extent such represent a return of capital or capital gain for tax purposes, are reclassified when such information becomes available. Income distributions are declared and paid by each class annually. Distributions to shareholders are recorded on the ex-dividend date. A capital gain distribution may also be declared and paid by the fund annually.
Currency Translation Assets, including investments, and liabilities denominated in foreign currencies are translated into U.S. dollar values each day at the prevailing exchange rate, using the mean of the bid and asked prices of such currencies against U.S. dollars as quoted by a major bank. Purchases and sales of securities, income, and expenses are translated into U.S. dollars at the prevailing exchange rate on the respective date of such transaction. The portion of the results of operations attributable to changes in foreign exchange rates on investments is not bifurcated from the portion attributable to changes in market prices. The effect of changes in foreign currency exchange rates on realized and unrealized security gains and losses is reflected as a component of security gains and losses.
Class Accounting Shareholder servicing, prospectus, and shareholder report expenses incurred by each class are charged directly to the class to which they relate. Expenses common to all classes, investment income, and realized and unrealized gains and losses are allocated to the classes based upon the relative daily net assets of each class. To the extent any expenses are waived or reimbursed in accordance with an expense limitation (see Note 5), the waiver or reimbursement is charged to the applicable class or allocated across the classes in the same manner as the related expense. The Advisor Class pays Rule 12b-1 fees, in an amount not exceeding 0.25% of the class’s average daily net assets.
Rebates Subject to best execution, the fund may direct certain security trades to brokers who have agreed to rebate a portion of the related brokerage commission to the fund in cash. Commission rebates are reflected as realized gain on securities in the accompanying financial statements and totaled $596,000 for the year ended December 31, 2017.
In-Kind Redemptions In accordance with guidelines described in the fund’s prospectus, and when considered to be in the best interest of all shareholders, the fund may distribute portfolio securities rather than cash as payment for a redemption of fund shares (in-kind redemption). Gains and losses realized on in-kind redemptions are not recognized for tax purposes and are reclassified from undistributed realized gain (loss) to paid-in capital. During the year ended December 31, 2017, the fund realized $590,313,000 of net gain on $1,818,470,000 of in-kind redemptions.
New Accounting Guidance In March 2017, the FASB issued amended guidance to shorten the amortization period for certain callable debt securities, held at a premium. The guidance is effective for fiscal years and interim periods beginning after December 15, 2018. Adoption will have no effect on the fund’s net assets or results of operations.
On August 1, 2017, the fund implemented amendments to Regulation S-X, issued by the Securities and Exchange Commission, which require standardized, enhanced disclosures, particularly related to derivatives, in investment company financial statements. Adoption had no effect on the fund’s net assets or results of operations.
Indemnification In the normal course of business, the fund may provide indemnification in connection with its officers and directors, service providers, and/or private company investments. The fund’s maximum exposure under these arrangements is unknown; however, the risk of material loss is currently considered to be remote.
NOTE 2 - VALUATION
The fund’s financial instruments are valued and each class’s net asset value (NAV) per share is computed at the close of the New York Stock Exchange (NYSE), normally 4 p.m. ET, each day the NYSE is open for business. However, the NAV per share may be calculated at a time other than the normal close of the NYSE if trading on the NYSE is restricted, if the NYSE closes earlier, or as may be permitted by the SEC.
Fair Value The fund’s financial instruments are reported at fair value, which GAAP defines as the price that would be received to sell an asset or paid to transfer a liability in an orderly transaction between market participants at the measurement date. The T. Rowe Price Valuation Committee (the Valuation Committee) is an internal committee that has been delegated certain responsibilities by the fund’s Board of Directors (the Board) to ensure that financial instruments are appropriately priced at fair value in accordance with GAAP and the 1940 Act. Subject to oversight by the Board, the Valuation Committee develops and oversees pricing-related policies and procedures and approves all fair value determinations. Specifically, the Valuation Committee establishes procedures to value securities; determines pricing techniques, sources, and persons eligible to effect fair value pricing actions; oversees the selection, services, and performance of pricing vendors; oversees valuation-related business continuity practices; and provides guidance on internal controls and valuation-related matters. The Valuation Committee reports to the Board and has representation from legal, portfolio management and trading, operations, risk management, and the fund’s treasurer.
Various valuation techniques and inputs are used to determine the fair value of financial instruments. GAAP establishes the following fair value hierarchy that categorizes the inputs used to measure fair value:
Level 1 – quoted prices (unadjusted) in active markets for identical financial instruments that the fund can access at the reporting date
Level 2 – inputs other than Level 1 quoted prices that are observable, either directly or indirectly (including, but not limited to, quoted prices for similar financial instruments in active markets, quoted prices for identical or similar financial instruments in inactive markets, interest rates and yield curves, implied volatilities, and credit spreads)
Level 3 – unobservable inputs
Observable inputs are developed using market data, such as publicly available information about actual events or transactions, and reflect the assumptions that market participants would use to price the financial instrument. Unobservable inputs are those for which market data are not available and are developed using the best information available about the assumptions that market participants would use to price the financial instrument. GAAP requires valuation techniques to maximize the use of relevant observable inputs and minimize the use of unobservable inputs. When multiple inputs are used to derive fair value, the financial instrument is assigned to the level within the fair value hierarchy based on the lowest-level input that is significant to the fair value of the financial instrument. Input levels are not necessarily an indication of the risk or liquidity associated with financial instruments at that level but rather the degree of judgment used in determining those values.
Valuation Techniques Equity securities listed or regularly traded on a securities exchange or in the over-the-counter (OTC) market are valued at the last quoted sale price or, for certain markets, the official closing price at the time the valuations are made. OTC Bulletin Board securities are valued at the mean of the closing bid and asked prices. A security that is listed or traded on more than one exchange is valued at the quotation on the exchange determined to be the primary market for such security. Listed securities not traded on a particular day are valued at the mean of the closing bid and asked prices for domestic securities and the last quoted sale or closing price for international securities.
For valuation purposes, the last quoted prices of non-U.S. equity securities may be adjusted to reflect the fair value of such securities at the close of the NYSE. If the fund determines that developments between the close of a foreign market and the close of the NYSE will affect the value of some or all of its portfolio securities, the fund will adjust the previous quoted prices to reflect what it believes to be the fair value of the securities as of the close of the NYSE. In deciding whether it is necessary to adjust quoted prices to reflect fair value, the fund reviews a variety of factors, including developments in foreign markets, the performance of U.S. securities markets, and the performance of instruments trading in U.S. markets that represent foreign securities and baskets of foreign securities. The fund may also fair value securities in other situations, such as when a particular foreign market is closed but the fund is open. The fund uses outside pricing services to provide it with quoted prices and information to evaluate or adjust those prices. The fund cannot predict how often it will use quoted prices and how often it will determine it necessary to adjust those prices to reflect fair value. As a means of evaluating its security valuation process, the fund routinely compares quoted prices, the next day’s opening prices in the same markets, and adjusted prices.
Actively traded equity securities listed on a domestic exchange generally are categorized in Level 1 of the fair value hierarchy. Non-U.S. equity securities generally are categorized in Level 2 of the fair value hierarchy despite the availability of quoted prices because, as described above, the fund evaluates and determines whether those quoted prices reflect fair value at the close of the NYSE or require adjustment. OTC Bulletin Board securities, certain preferred securities, and equity securities traded in inactive markets generally are categorized in Level 2 of the fair value hierarchy.
Investments in mutual funds are valued at the mutual fund’s closing NAV per share on the day of valuation and are categorized in Level 1 of the fair value hierarchy. Assets and liabilities other than financial instruments, including short-term receivables and payables, are carried at cost, or estimated realizable value, if less, which approximates fair value.
Thinly traded financial instruments and those for which the above valuation procedures are inappropriate or are deemed not to reflect fair value are stated at fair value as determined in good faith by the Valuation Committee. The objective of any fair value pricing determination is to arrive at a price that could reasonably be expected from a current sale. Financial instruments fair valued by the Valuation Committee are primarily private placements, restricted securities, warrants, rights, and other securities that are not publicly traded.
Subject to oversight by the Board, the Valuation Committee regularly makes good faith judgments to establish and adjust the fair valuations of certain securities as events occur and circumstances warrant. For instance, in determining the fair value of an equity investment with limited market activity, such as a private placement or a thinly traded public company stock, the Valuation Committee considers a variety of factors, which may include, but are not limited to, the issuer’s business prospects, its financial standing and performance, recent investment transactions in the issuer, new rounds of financing, negotiated transactions of significant size between other investors in the company, relevant market valuations of peer companies, strategic events affecting the company, market liquidity for the issuer, and general economic conditions and events. In consultation with the investment and pricing teams, the Valuation Committee will determine an appropriate valuation technique based on available information, which may include both observable and unobservable inputs. The Valuation Committee typically will afford greatest weight to actual prices in arm’s length transactions, to the extent they represent orderly transactions between market participants, transaction information can be reliably obtained, and prices are deemed representative of fair value. However, the Valuation Committee may also consider other valuation methods such as market-based valuation multiples; a discount or premium from market value of a similar, freely traded security of the same issuer; or some combination. Fair value determinations are reviewed on a regular basis and updated as information becomes available, including actual purchase and sale transactions of the issue. Because any fair value determination involves a significant amount of judgment, there is a degree of subjectivity inherent in such pricing decisions, and fair value prices determined by the Valuation Committee could differ from those of other market participants. Depending on the relative significance of unobservable inputs, including the valuation technique(s) used, fair valued securities may be categorized in Level 2 or 3 of the fair value hierarchy.
Valuation Inputs The following table summarizes the fund’s financial instruments, based on the inputs used to determine their fair values on December 31, 2017:
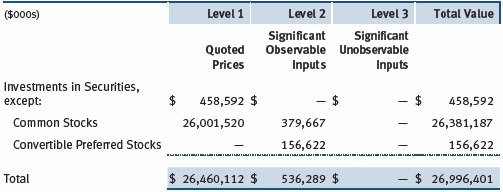
There were no material transfers between Levels 1 and 2 during the year ended December 31, 2017.
NOTE 3 - OTHER INVESTMENT TRANSACTIONS
Consistent with its investment objective, the fund engages in the following practices to manage exposure to certain risks and/or to enhance performance. The investment objective, policies, program, and risk factors of the fund are described more fully in the fund’s prospectus and Statement of Additional Information.
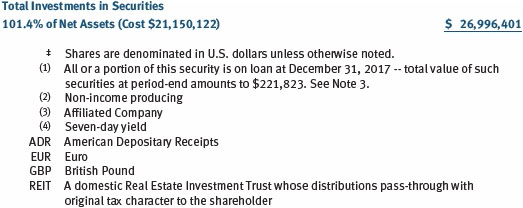
Securities Lending The fund may lend its securities to approved borrowers to earn additional income. Its securities lending activities are administered by a lending agent in accordance with a securities lending agreement. Security loans generally do not have stated maturity dates, and the fund may recall a security at any time. The fund receives collateral in the form of cash or U.S. government securities, valued at 102% to 105% of the value of the securities on loan. Collateral is maintained over the life of the loan in an amount not less than the value of loaned securities; any additional collateral required due to changes in security values is delivered to the fund the next business day. Cash collateral is invested in accordance with investment guidelines approved by fund management. Additionally, the lending agent indemnifies the fund against losses resulting from borrower default. Although risk is mitigated by the collateral and indemnification, the fund could experience a delay in recovering its securities and a possible loss of income or value if the borrower fails to return the securities, collateral investments decline in value, and the lending agent fails to perform. Securities lending revenue consists of earnings on invested collateral and borrowing fees, net of any rebates to the borrower, compensation to the lending agent, and other administrative costs. In accordance with GAAP, investments made with cash collateral are reflected in the accompanying financial statements, but collateral received in the form of securities is not. At December 31, 2017, the value of loaned securities was $221,823,000; the value of cash collateral and related investments was $228,376,000.
Other Purchases and sales of portfolio securities other than short-term securities aggregated $23,806,485,000 and $24,847,197,000, respectively, for the year ended December 31, 2017.
NOTE 4 - FEDERAL INCOME TAXES
No provision for federal income taxes is required since the fund intends to continue to qualify as a regulated investment company under Subchapter M of the Internal Revenue Code and distribute to shareholders all of its taxable income and gains. Distributions determined in accordance with federal income tax regulations may differ in amount or character from net investment income and realized gains for financial reporting purposes. Financial reporting records are adjusted for permanent book/tax differences to reflect tax character but are not adjusted for temporary differences.
The fund files U.S. federal, state, and local tax returns as required. The fund’s tax returns are subject to examination by the relevant tax authorities until expiration of the applicable statute of limitations, which is generally three years after the filing of the tax return but which can be extended to six years in certain circumstances. Tax returns for open years have incorporated no uncertain tax positions that require a provision for income taxes.
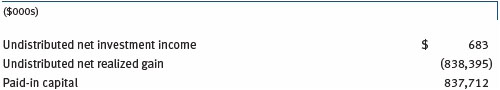
Reclassifications to paid-in capital relate primarily to redemptions in kind and a tax practice that treats a portion of the proceeds from each redemption of capital shares as a distribution of taxable net investment income or realized capital gain. Reclassifications between income and gain relate primarily to the recharacterization of distributions. For the year ended December 31, 2017, the following reclassifications were recorded to reflect tax character (there was no impact on results of operations or net assets):
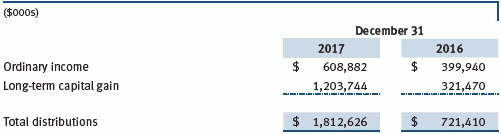
Distributions during the years ended December 31, 2017 and December 31, 2016, were characterized for tax purposes as follows:
At December 31, 2017, the tax-basis cost of investments, including derivatives, and components of net assets were as follows:

The difference between book-basis and tax-basis net unrealized appreciation (depreciation) is attributable to the deferral of losses from wash sales for tax purposes. In accordance with federal tax laws applicable to investment companies, net specified losses realized between November 1 and December 31 are not recognized for tax purposes until the subsequent year (late-year ordinary loss deferrals); however, such losses are recognized for financial reporting purposes in the year realized.
NOTE 5 - RELATED PARTY TRANSACTIONS
The fund is managed by T. Rowe Price Associates, Inc. (Price Associates), a wholly owned subsidiary of T. Rowe Price Group, Inc. (Price Group). The investment management agreement between the fund and Price Associates provides for an annual investment management fee that consists of an individual fund fee and a group fee; management fees are computed daily and paid monthly. The investment management agreement provides for an individual fund fee equal to 0.35% of the fund’s average daily net assets. Through April 30, 2018, Price Associates agreed to reduce the fund’s individual fee to 0.2975% for the portion of average daily net assets equal to or in excess of $20 billion. This contractual arrangement will renew automatically for one-year terms thereafter and may be revised, revoked, or terminated only with approval of the fund’s Board. Further, the fund has no obligation to repay fees reduced under this arrangement. The group fee rate is calculated based on the combined net assets of certain mutual funds sponsored by Price Associates (the group) applied to a graduated fee schedule, with rates ranging from 0.48% for the first $1 billion of assets to 0.265% for assets in excess of $650 billion. The fund’s group fee is determined by applying the group fee rate to the fund’s average daily net assets. At December 31, 2017, the effective annual group fee rate was 0.29%.
The I Class is subject to an operating expense limitation (I Class limit) pursuant to which Price Associates is contractually required to pay all operating expenses of the I Class, excluding management fees, interest, expenses related to borrowings, taxes, brokerage, and other non-recurring expenses permitted by the investment management agreement, to the extent such operating expenses, on an annualized basis, exceed 0.05% of average net assets. This agreement will continue until April 30, 2018, and may be renewed, revised, or revoked only with approval of the fund’s Board. The I Class is required to repay Price Associates for expenses previously paid to the extent the class’s net assets grow or expenses decline sufficiently to allow repayment without causing the class’s operating expenses (after the repayment is taken into account) to exceed both: (1) the expense limitation in place at the time such amounts were paid; and (2) the class’s current expense limitation. However, no repayment will be made more than three years after the date of a payment or waiver. For the year ended December 31, 2017, the I Class operated below its expense limitation.
In addition, the fund has entered into service agreements with Price Associates and two wholly owned subsidiaries of Price Associates (collectively, Price). Price Associates provides certain accounting and administrative services to the fund. T. Rowe Price Services, Inc. provides shareholder and administrative services in its capacity as the fund’s transfer and dividend-disbursing agent. T. Rowe Price Retirement Plan Services, Inc. provides subaccounting and recordkeeping services for certain retirement accounts invested in the fund. For the year ended December 31, 2017, expenses incurred pursuant to these service agreements were $86,000 for Price Associates; $1,099,000 for T. Rowe Price Services, Inc.; and $735,000 for T. Rowe Price Retirement Plan Services, Inc. The total amount payable at period-end pursuant to these service agreements is reflected as Due to Affiliates in the accompanying financial statements.
Additionally, the fund is one of several mutual funds in which certain college savings plans managed by Price Associates may invest. As approved by the fund’s Board of Directors, shareholder servicing costs associated with each college savings plan are borne by the fund in proportion to the average daily value of its shares owned by the college savings plan. For the year ended December 31, 2017, the fund was charged $656,000 for shareholder servicing costs related to the college savings plans, of which $548,000 was for services provided by Price. The amount payable at period-end pursuant to this agreement is reflected as Due to Affiliates in the accompanying financial statements. At December 31, 2017, approximately 2% of the outstanding shares of the Investor Class were held by college savings plans.
The fund is also one of several mutual funds sponsored by Price Associates (underlying Price funds) in which the T. Rowe Price Spectrum Funds (Spectrum Funds) and T. Rowe Price Retirement Funds (Retirement Funds) may invest. None of the Spectrum Funds or Retirement Funds invest in the underlying Price funds for the purpose of exercising management or control. Pursuant to special servicing agreements, expenses associated with the operation of the Spectrum Funds and Retirement Funds are borne by each underlying Price fund to the extent of estimated savings to it and in proportion to the average daily value of its shares owned by the Spectrum Funds and Retirement Funds. Expenses allocated under these special servicing agreements are reflected as shareholder servicing expense in the accompanying financial statements. For the year ended December 31, 2017, the fund was allocated $451,000 of Spectrum Funds’ expenses and $29,457,000 of Retirement Funds’ expenses. Of these amounts, $10,847,000 related to services provided by Price. At period-end, the amount payable to Price pursuant to these special servicing agreements is reflected as Due to Affiliates in the accompanying financial statements. At December 31, 2017, approximately 81% of the outstanding Investor Class were held by the Spectrum Funds and Retirement Funds.
In addition, other mutual funds, trusts, and other accounts managed by Price Associates or its affiliates (collectively, Price funds and accounts) may invest in the fund and are not subject to the special servicing agreements disclosed above. No Price fund or account may invest for the purpose of exercising management or control over the fund. At December 31, 2017, approximately 65% of the I Class’s outstanding shares were held by Price funds and accounts.
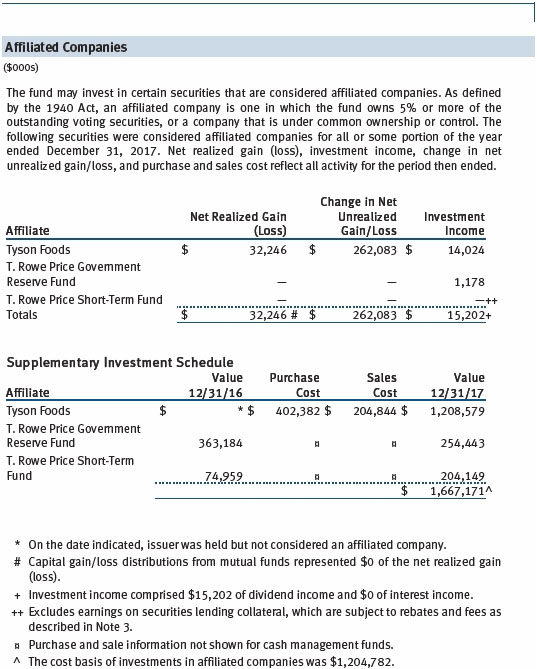
The fund may invest its cash reserves in certain open-end management investment companies managed by Price Associates and considered affiliates of the fund: the T. Rowe Price Government Reserve Fund or the T. Rowe Price Treasury Reserve Fund, organized as money market funds, or the T. Rowe Price Short-Term Fund, a short-term bond fund (collectively, the Price Reserve Funds). The Price Reserve Funds are offered as short-term investment options to mutual funds, trusts, and other accounts managed by Price Associates or its affiliates and are not available for direct purchase by members of the public. Cash collateral from securities lending is invested in the T. Rowe Price Short-Term Fund. The Price Reserve Funds pay no investment management fees.
The fund may participate in securities purchase and sale transactions with other funds or accounts advised by Price Associates (cross trades), in accordance with procedures adopted by the fund’s Board and Securities and Exchange Commission rules, which require, among other things, that such purchase and sale cross trades be effected at the independent current market price of the security. During the year ended December 31, 2017, the aggregate value of purchases and sales cross trades with other funds or accounts advised by Price Associates was less than 1% of the fund’s net assets as of December 31, 2017.
| Report of Independent Registered Public Accounting Firm |
To the Board of Directors and Shareholders of
T. Rowe Price Value Fund, Inc.
Opinion on the Financial Statements
We have audited the accompanying statement of assets and liabilities, including the portfolio of investments, of T. Rowe Price Value Fund, Inc. (the “Fund”) as of December 31, 2017, the related statement of operations for the year ended December 31, 2017, the statement of changes in net assets for each of the two years in the period ended December 31, 2017, including the related notes, and the financial highlights for each of the periods indicated therein (collectively referred to as the “financial statements”). In our opinion, the financial statements present fairly, in all material respects, the financial position of the Fund as of December 31, 2017, the results of its operations for the year then ended, the changes in its net assets for each of the two years in the period ended December 31, 2017 and the financial highlights for each of the periods indicated therein, in conformity with accounting principles generally accepted in the United States of America.
Basis for Opinion
These financial statements are the responsibility of the Fund’s management. Our responsibility is to express an opinion on the Fund’s financial statements based on our audits. We are a public accounting firm registered with the Public Company Accounting Oversight Board (United States) (“PCAOB”) and are required to be independent with respect to the Fund in accordance with the U.S. federal securities laws and the applicable rules and regulations of the Securities and Exchange Commission and the PCAOB.
We conducted our audits of these financial statements in accordance with the standards of the PCAOB. Those standards require that we plan and perform the audit to obtain reasonable assurance about whether the financial statements are free of material misstatement, whether due to error or fraud.
Our audits included performing procedures to assess the risks of material misstatement of the financial statements, whether due to error or fraud, and performing procedures that respond to those risks. Such procedures included examining, on a test basis, evidence regarding the amounts and disclosures in the financial statements. Our audits also included evaluating the accounting principles used and significant estimates made by management, as well as evaluating the overall presentation of the financial statements. Our procedures included confirmation of securities owned as of December 31, 2017 by correspondence with the custodians, transfer agent and brokers; when replies were not received from brokers, we performed other auditing procedures. We believe that our audits provide a reasonable basis for our opinion.
PricewaterhouseCoopers LLP
Baltimore, Maryland
February 15, 2018
We have served as the auditor of one or more investment companies in the T. Rowe Price group of investment companies since 1973.
| Tax Information (Unaudited) for the Tax Year Ended 12/31/17 |
We are providing this information as required by the Internal Revenue Code. The amounts shown may differ from those elsewhere in this report because of differences between tax and financial reporting requirements.
The fund’s distributions to shareholders included:
| ● | $336,032,000 from short-term capital gains. |
| | |
| ● | $1,419,331,000 from long-term capital gains, of which $1,419,000,000 was subject to a long-term capital gains tax rate of not greater than 20%, and $331,000 to a long-term capital gains tax rate of not greater than 25%. |
For taxable non-corporate shareholders, $515,727,000 of the fund’s income represents qualified dividend income subject to a long-term capital gains tax rate of not greater than 20%.
For corporate shareholders, $432,719,000 of the fund’s income qualifies for the dividends-received deduction.
| Information on Proxy Voting Policies, Procedures, and Records |
A description of the policies and procedures used by T. Rowe Price funds and portfolios to determine how to vote proxies relating to portfolio securities is available in each fund’s Statement of Additional Information. You may request this document by calling 1-800-225-5132 or by accessing the SEC’s website, sec.gov.
The description of our proxy voting policies and procedures is also available on our corporate website. To access it, please visit the following Web page:
https://www3.troweprice.com/usis/corporate/en/utility/policies.html
Scroll down to the section near the bottom of the page that says, “Proxy Voting Policies.” Click on the Proxy Voting Policies link in the shaded box.
Each fund’s most recent annual proxy voting record is available on our website and through the SEC’s website. To access it through T. Rowe Price, visit the website location shown above, and scroll down to the section near the bottom of the page that says, “Proxy Voting Records.” Click on the Proxy Voting Records link in the shaded box.
| How to Obtain Quarterly Portfolio Holdings |
The fund files a complete schedule of portfolio holdings with the Securities and Exchange Commission for the first and third quarters of each fiscal year on Form N-Q. The fund’s Form N-Q is available electronically on the SEC’s website (sec.gov); hard copies may be reviewed and copied at the SEC’s Public Reference Room, 100 F St. N.E., Washington, DC 20549. For more information on the Public Reference Room, call 1-800-SEC-0330.
| About the Fund’s Directors and Officers |
Your fund is overseen by a Board of Directors (Board) that meets regularly to review a wide variety of matters affecting or potentially affecting the fund, including performance, investment programs, compliance matters, advisory fees and expenses, service providers, and business and regulatory affairs. The Board elects the fund’s officers, who are listed in the final table. At least 75% of the Board’s members are independent of T. Rowe Price Associates, Inc. (T. Rowe Price), and its affiliates; “inside” or “interested” directors are employees or officers of T. Rowe Price. The business address of each director and officer is 100 East Pratt Street, Baltimore, Maryland 21202. The Statement of Additional Information includes additional information about the fund directors and is available without charge by calling a T. Rowe Price representative at 1-800-638-5660.
Independent Directors
| Name | | |
| (Year of Birth) | | |
| Year Elected* | | |
| [Number of T. Rowe Price | | Principal Occupation(s) and Directorships of Public Companies and |
| Portfolios Overseen] | | Other Investment Companies During the Past Five Years |
| | | |
| Bruce W. Duncan | | Chief Executive Officer and Director (2009 to December 2016), |
| (1951) | | Chairman of the Board (January 2016 to present), and President |
| 2013 | | (2009 to September 2016), First Industrial Realty Trust, an owner |
| [191] | | and operator of industrial properties; Chairman of the Board |
| | (2005 to September 2016) and Director (1999 to September |
| | 2016), Starwood Hotels & Resorts, a hotel and leisure company; |
| | Director, Boston Properties (May 2016 to present); Director, |
| | Marriott International, Inc. (September 2016 to present) |
| | | |
| Robert J. Gerrard, Jr. | | Advisory Board Member, Pipeline Crisis/Winning Strategies, a |
| (1952) | | collaborative working to improve opportunities for young African |
| 2012 | | Americans (1997 to present) |
| [191] | | |
| | | |
| Paul F. McBride | | Advisory Board Member, Vizzia Technologies (2015 to present) |
| (1956) | | |
| 2013 | | |
| [191] | | |
| | | |
| Cecilia E. Rouse, Ph.D. | | Dean, Woodrow Wilson School (2012 to present); Professor and |
| (1963) | | Researcher, Princeton University (1992 to present); Member of |
| 2012 | | National Academy of Education (2010 to present); Director, MDRC, |
| [191] | | a nonprofit education and social policy research organization |
| | (2011 to present); Research Associate of Labor Studies Program |
| | (2011 to 2015) and Board Member (2015 to present), National |
| | Bureau of Economic Research (2011 to present); Chair of Committee |
| | on the Status of Minority Groups in the Economic Profession |
| | (2012 to present); Vice President (2015 to present), American |
| | Economic Association |
| | | |
| John G. Schreiber | | Owner/President, Centaur Capital Partners, Inc., a real estate |
| (1946) | | investment company (1991 to present); Cofounder, Partner, and |
| 2001 | | Cochairman of the Investment Committee, Blackstone Real Estate |
| [191] | | Advisors, L.P. (1992 to 2015); Director, General Growth Properties, |
| | Inc. (2010 to 2013); Director, Blackstone Mortgage Trust, a real |
| | estate finance company (2012 to 2016); Director and Chairman of |
| | the Board, Brixmor Property Group, Inc. (2013 to present); Director, |
| | Hilton Worldwide (2013 to present); Director, Hudson Pacific |
| | Properties (2014 to 2016) |
| | | |
| Mark R. Tercek | | President and Chief Executive Officer, The Nature Conservancy |
| (1957) | | (2008 to present) |
| 2009 | | |
| [191] | | |
| |
| *Each independent director serves until retirement, resignation, or election of a successor. |
Inside Directors
| Name | | |
| (Year of Birth) | | |
| Year Elected* | | |
| [Number of T. Rowe Price | | Principal Occupation(s) and Directorships of Public Companies and |
| Portfolios Overseen] | | Other Investment Companies During the Past Five Years |
| | | |
| Edward C. Bernard | | Director and Vice President, T. Rowe Price; Vice Chairman of the |
| (1956) | | Board, Director, and Vice President, T. Rowe Price Group, Inc.; |
| 2006 | | Chairman of the Board, Director, and Vice President, T. Rowe Price |
| [191] | | Investment Services, Inc., and T. Rowe Price Services, Inc.; Chairman |
| | of the Board and Director, T. Rowe Price Retirement Plan Services, |
| | Inc.; Chairman of the Board, Chief Executive Officer, Director, and |
| | President, T. Rowe Price International and T. Rowe Price Trust |
| | Company; Chairman of the Board, all funds |
| | | |
| Robert W. Sharps, CFA, CPA** | | Vice President, T. Rowe Price, T. Rowe Price Group, Inc., and T. Rowe |
| (1971) | | Price Trust Company |
| 2017 | | |
| [135] | | |
| |
| *Each inside director serves until retirement, resignation, or election of a successor. |
| **Effective April 1, 2017, Brian C. Rogers was replaced by Robert W. Sharps as an inside director of certain Price Funds. |
| Officers | | |
| |
| Name (Year of Birth) | | |
| Position Held With Value Fund | | Principal Occupation(s) |
| | | |
| Peter J. Bates, CFA (1974) | | Vice President, T. Rowe Price and T. Rowe Price |
| Vice President | | Group, Inc. |
| | | |
| Jason A. Bauer (1979) | | Vice President, T. Rowe Price and T. Rowe Price |
| Vice President | | Group, Inc. |
| | | |
| Darrell N. Braman (1963) | | Vice President, Price Hong Kong, Price |
| Vice President and Secretary | | Singapore, T. Rowe Price, T. Rowe Price Group, |
| | Inc., T. Rowe Price International, T. Rowe Price |
| | Investment Services, Inc., and T. Rowe Price |
| | Services, Inc. |
| | | |
| Andrew S. Davis (1978) | | Vice President, T. Rowe Price and T. Rowe Price |
| Vice President | | Group, Inc. |
| | | |
| Vincent M. DeAugustino (1983) | | Vice President, T. Rowe Price and T. Rowe Price |
| Vice President | | Group, Inc. |
| | | |
| Mark S. Finn, CFA, CPA (1963) | | Vice President, T. Rowe Price, T. Rowe Price |
| President | | Group, Inc., and T. Rowe Price Trust Company |
| | | |
| John R. Gilner (1961) | | Chief Compliance Officer and Vice President, |
| Chief Compliance Officer | | T. Rowe Price; Vice President, T. Rowe Price |
| | Group, Inc., and T. Rowe Price Investment |
| | Services, Inc. |
| | | |
| Joel Grant (1978) | | Vice President, T. Rowe Price and T. Rowe |
| Vice President | | Price Group, Inc.; formerly, Analyst, Fidelity |
| | International (to 2014) |
| | | |
| Jon Hussey, CFA (1982) | | Vice President, T. Rowe Price; formerly, |
| Vice President | | student, University of Chicago Booth School of |
| | Business (to 2016); Analyst, Driehaus Capital |
| | Management (to 2014) |
| | | |
| Paul J. Krug, CPA (1964) | | Vice President, T. Rowe Price, T. Rowe Price |
| Vice President | | Group, Inc., and T. Rowe Price Trust Company |
| |
| John D. Linehan, CFA (1965) | | Vice President, T. Rowe Price, T. Rowe Price |
| Vice President | | Group, Inc., and T. Rowe Price Trust Company |
| | | |
| Daniel Martino, CFA (1974) | | Vice President, T. Rowe Price and T. Rowe Price |
| Vice President | | Group, Inc. |
| | | |
| Catherine D. Mathews (1963) | | Vice President, T. Rowe Price, T. Rowe Price |
| Treasurer and Vice President | | Group, Inc., and T. Rowe Price Trust Company |
| | | |
| Heather K. McPherson, CPA (1967) | | Vice President, T. Rowe Price and T. Rowe Price |
| Vice President | | Group, Inc. |
| | | |
| David Oestreicher (1967) | | Director, Vice President, and Secretary, T. Rowe |
| Vice President | | Price Investment Services, Inc., T. Rowe |
| | Price Retirement Plan Services, Inc., T. Rowe |
| | Price Services, Inc., and T. Rowe Price Trust |
| | Company; Chief Legal Officer, Vice President, |
| | and Secretary, T. Rowe Price Group, Inc.; Vice |
| | President and Secretary, T. Rowe Price and |
| | T. Rowe Price International; Vice President, |
| | Price Hong Kong and Price Singapore |
| | | |
| Christian M. O’Neill (1969) | | Vice President, T. Rowe Price and T. Rowe Price |
| Vice President | | Group, Inc.; formerly, Analyst, Lord Abbett & |
| | Company, LLC (to 2013) |
| | | |
| John W. Ratzesberger (1975) | | Vice President, T. Rowe Price, T. Rowe Price |
| Vice President | | Group, Inc., and T. Rowe Price Trust Company; |
| | formerly, North American Head of Listed |
| | Derivatives Operation, Morgan Stanley |
| | (to 2013) |
| | | |
| Shannon H. Rauser (1987) | | Employee, T. Rowe Price |
| Assistant Secretary | | |
| | | |
| Weijie Si (1983) | | Vice President, T. Rowe Price and T. Rowe Price |
| Vice President | | Group, Inc. |
| | | |
| Joshua K. Spencer, CFA (1973) | | Vice President, T. Rowe Price and T. Rowe Price |
| Vice President | | Group, Inc. |
| | | |
| Megan Warren (1968) | | Vice President, T. Rowe Price, T. Rowe Price |
| Vice President | | Group, Inc., T. Rowe Price Retirement Plan |
| | Services, Inc., T. Rowe Price Services, Inc., |
| | and T. Rowe Price Trust Company; formerly, |
| | Executive Director, JP Morgan Chase (to 2017) |
| | | |
| Tamara P. Wiggs (1979) | | Vice President, T. Rowe Price and T. Rowe Price |
| Vice President | | Group, Inc. |
| | | |
| Jon D. Wood, CFA (1979) | | Vice President, T. Rowe Price and T. Rowe Price |
| Vice President | | Group, Inc.; formerly, Senior Vice President and |
| | Senior Research Analyst, Jeffries & Company, |
| | Inc. (to 2013) |
| |
| Unless otherwise noted, officers have been employees of T. Rowe Price or T. Rowe Price International for at least 5 years. |
Item 2. Code of Ethics.
The registrant has adopted a code of ethics, as defined in Item 2 of Form N-CSR, applicable to its principal executive officer, principal financial officer, principal accounting officer or controller, or persons performing similar functions. A copy of this code of ethics is filed as an exhibit to this Form N-CSR. No substantive amendments were approved or waivers were granted to this code of ethics during the period covered by this report.
Item 3. Audit Committee Financial Expert.
The registrant’s Board of Directors/Trustees has determined that Mr. Bruce W. Duncan qualifies as an audit committee financial expert, as defined in Item 3 of Form N-CSR. Mr. Duncan is considered independent for purposes of Item 3 of Form N-CSR.
Item 4. Principal Accountant Fees and Services.
(a) – (d) Aggregate fees billed for the last two fiscal years for professional services rendered to, or on behalf of, the registrant by the registrant’s principal accountant were as follows:
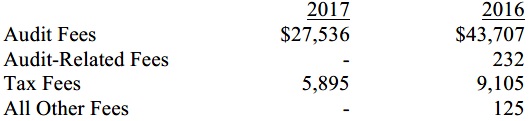
Audit fees include amounts related to the audit of the registrant’s annual financial statements and services normally provided by the accountant in connection with statutory and regulatory filings. Audit-related fees include amounts reasonably related to the performance of the audit of the registrant’s financial statements and specifically include the issuance of a report on internal controls and, if applicable, agreed-upon procedures related to fund acquisitions. Tax fees include amounts related to services for tax compliance, tax planning, and tax advice. The nature of these services specifically includes the review of distribution calculations and the preparation of Federal, state, and excise tax returns. All other fees include the registrant’s pro-rata share of amounts for agreed-upon procedures in conjunction with service contract approvals by the registrant’s Board of Directors/Trustees.
(e)(1) The registrant’s audit committee has adopted a policy whereby audit and non-audit services performed by the registrant’s principal accountant for the registrant, its investment adviser, and any entity controlling, controlled by, or under common control with the investment adviser that provides ongoing services to the registrant require pre-approval in advance at regularly scheduled audit committee meetings. If such a service is required between regularly scheduled audit committee meetings, pre-approval may be authorized by one audit committee member with ratification at the next scheduled audit committee meeting. Waiver of pre-approval for audit or non-audit services requiring fees of a de minimis amount is not permitted.
(2) No services included in (b) – (d) above were approved pursuant to paragraph (c)(7)(i)(C) of Rule 2-01 of Regulation S-X.
(f) Less than 50 percent of the hours expended on the principal accountant’s engagement to audit the registrant’s financial statements for the most recent fiscal year were attributed to work performed by persons other than the principal accountant’s full-time, permanent employees.
(g) The aggregate fees billed for the most recent fiscal year and the preceding fiscal year by the registrant’s principal accountant for non-audit services rendered to the registrant, its investment adviser, and any entity controlling, controlled by, or under common control with the investment adviser that provides ongoing services to the registrant were $2,169,000 and $2,146,000, respectively.
(h) All non-audit services rendered in (g) above were pre-approved by the registrant’s audit committee. Accordingly, these services were considered by the registrant’s audit committee in maintaining the principal accountant’s independence.
Item 5. Audit Committee of Listed Registrants.
Not applicable.
Item 6. Investments.
(a) Not applicable. The complete schedule of investments is included in Item 1 of this Form N-CSR.
(b) Not applicable.
Item 7. Disclosure of Proxy Voting Policies and Procedures for Closed-End Management Investment Companies.
Not applicable.
Item 8. Portfolio Managers of Closed-End Management Investment Companies.
Not applicable.
Item 9. Purchases of Equity Securities by Closed-End Management Investment Company and Affiliated Purchasers.
Not applicable.
Item 10. Submission of Matters to a Vote of Security Holders.
Not applicable.
Item 11. Controls and Procedures.
(a) The registrant’s principal executive officer and principal financial officer have evaluated the registrant’s disclosure controls and procedures within 90 days of this filing and have concluded that the registrant’s disclosure controls and procedures were effective, as of that date, in ensuring that information required to be disclosed by the registrant in this Form N-CSR was recorded, processed, summarized, and reported timely.
(b) The registrant’s principal executive officer and principal financial officer are aware of no change in the registrant’s internal control over financial reporting that occurred during the registrant’s second fiscal quarter covered by this report that has materially affected, or is reasonably likely to materially affect, the registrant’s internal control over financial reporting.
Item 12. Exhibits.
(a)(1) The registrant’s code of ethics pursuant to Item 2 of Form N-CSR is attached.
(2) Separate certifications by the registrant's principal executive officer and principal financial officer, pursuant to Section 302 of the Sarbanes-Oxley Act of 2002 and required by Rule 30a-2(a) under the Investment Company Act of 1940, are attached.
(3) Written solicitation to repurchase securities issued by closed-end companies: not applicable.
(b) A certification by the registrant's principal executive officer and principal financial officer, pursuant to Section 906 of the Sarbanes-Oxley Act of 2002 and required by Rule 30a-2(b) under the Investment Company Act of 1940, is attached.
SIGNATURES
Pursuant to the requirements of the Securities Exchange Act of 1934 and the Investment Company Act of 1940, the registrant has duly caused this report to be signed on its behalf by the undersigned, thereunto duly authorized.
T. Rowe Price Value Fund, Inc.
| By | | /s/ Edward C. Bernard |
| | | Edward C. Bernard |
| | | Principal Executive Officer |
| |
| Date | | February 15, 2018 | | | | |
Pursuant to the requirements of the Securities Exchange Act of 1934 and the Investment Company Act of 1940, this report has been signed below by the following persons on behalf of the registrant and in the capacities and on the dates indicated.
| By | | /s/ Edward C. Bernard |
| | | Edward C. Bernard |
| | | Principal Executive Officer |
| |
| Date | | February 15, 2018 | | | | |
| |
| |
| By | | /s/ Catherine D. Mathews |
| | | Catherine D. Mathews |
| | | Principal Financial Officer |
| |
| Date | | February 15, 2018 | | | | |