UNITED STATES
SECURITIES AND EXCHANGE COMMISSION
Washington, D.C. 20549
FORM N-CSR
CERTIFIED SHAREHOLDER REPORT OF REGISTERED
MANAGEMENT INVESTMENT COMPANIES
Investment Company Act File Number: 811-07209
| T. Rowe Price Value Fund, Inc. |
|
| (Exact name of registrant as specified in charter) |
| |
| 100 East Pratt Street, Baltimore, MD 21202 |
|
| (Address of principal executive offices) |
| |
| David Oestreicher |
| 100 East Pratt Street, Baltimore, MD 21202 |
|
| (Name and address of agent for service) |
Registrant’s telephone number, including area code: (410) 345-2000
Date of fiscal year end: December 31
Date of reporting period: December 31, 2015
Item 1. Report to Shareholders
| Value Fund | December 31, 2015 |
The views and opinions in this report were current as of December 31, 2015. They are not guarantees of performance or investment results and should not be taken as investment advice. Investment decisions reflect a variety of factors, and the managers reserve the right to change their views about individual stocks, sectors, and the markets at any time. As a result, the views expressed should not be relied upon as a forecast of the fund’s future investment intent. The report is certified under the Sarbanes-Oxley Act, which requires mutual funds and other public companies to affirm that, to the best of their knowledge, the information in their financial reports is fairly and accurately stated in all material respects.
REPORTS ON THE WEB
Sign up for our E-mail Program, and you can begin to receive updated fund reports and prospectuses online rather than through the mail. Log in to your account at troweprice.com for more information.
Manager’s Letter
Fellow Shareholders
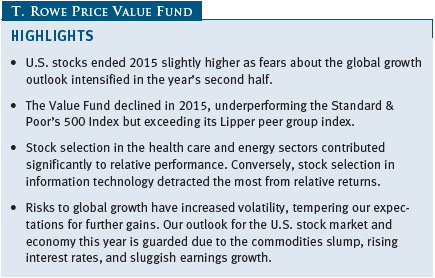
U.S. stocks endured a volatile 2015 as fears about the global growth outlook intensified late in the year. Mounting evidence of economic weakness in China, sluggish growth overseas, and a collapse in commodities prices added to uncertainty about the timing of the Federal Reserve’s first rate hike since 2006. The S&P 500 Index edged higher in 2015, driven entirely by dividends.
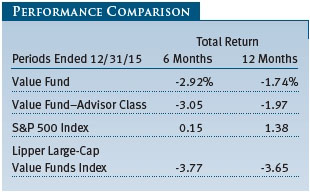
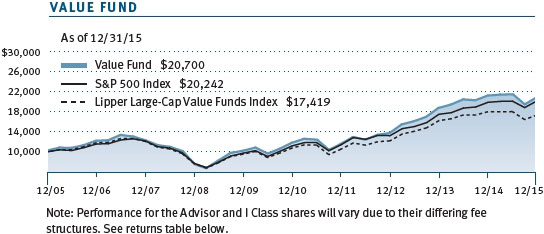
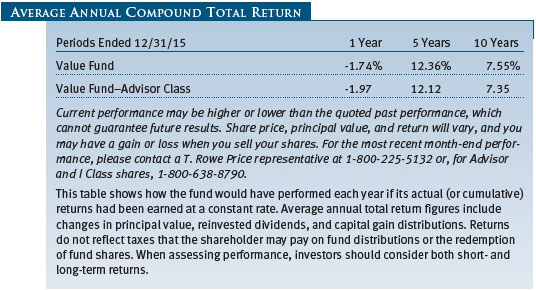
The Value Fund returned -2.92% and -1.74% for the six and 12 months ended December 31, 2015, respectively. It trailed the returns of the Standard & Poor’s 500, which rose 0.15% and 1.38% over the same periods, but exceeded the returns of its peer group, the Lipper Large-Cap Value Funds Index, which fell even more in both periods. (Returns for Advisor Class shares reflect their different fee structure.)
The fund’s performance versus its peers over longer time periods remained outstanding. The Value Fund is in the top quintile of its Lipper peer group for the trailing one-year period and in the top decile for the trailing 3-, 5-, and 10-year periods. Based on cumulative total return, Lipper ranked the fund 76 of 513, 9 of 455, 15 of 409, and 10 of 297 large-cap value funds for the 1-, 3-, 5-, and 10-year periods ended December 31, 2015, respectively. Past performance cannot guarantee future results.
MARKET ENVIRONMENT
After posting a small gain in the first half of 2015, U.S. stocks fell into correction territory for the first time since 2011 following China’s surprise decision to devalue its currency in August. The yuan’s depreciation reverberated across global commodities and currency markets, pushing U.S. crude oil prices below $40 a barrel for the first time since 2009 and many emerging markets currencies to record lows against the dollar. The sell-off in commodities and emerging markets assets revived longstanding worries about slowing global growth and its potential impact on U.S. corporate earnings. Though U.S. stocks recovered from August’s sell-off, volatility returned in the final weeks of 2015 as oil entered another downturn. The dollar surged against most currencies over the year as the Fed drew closer to a widely expected rate hike at the end of 2015. Because a relatively strong dollar hurts the profitability of U.S. companies doing business overseas, its appreciation added to concerns about slowing earnings growth.
For the year, the S&P 500 added 1.38%, including dividends—its smallest total return since 2008 and ending three years of double-digit gains. Excluding dividends, the S&P 500 returned -0.70%, its worst annual performance since 2008. Declining and advancing sectors in the S&P 500 were evenly matched. Consumer discretionary was the best performer with a roughly 10% gain. Energy stocks fared the worst, falling about 21% as U.S. oil prices plunged 30% for the year to end at roughly $37 a barrel.
Growth stocks outperformed value stocks for the year, extending a trend in the years since the 2007–2008 global financial crisis. Several factors drove growth’s lead over value during the year, particularly the strong performance of many momentum-driven technology names that are typically not held by value funds and weakness in the energy sector. Lagging performance of many value-focused financials weighed down by a low interest rate environment and stricter regulation after the crisis has also held back value stocks. While value’s underperformance versus growth in recent years has been challenging for value investors, academic research has shown that large-cap value stocks have outpaced large-cap growth stocks over longer time periods. Moreover, our research has shown that value stocks tend to do better than growth in the years following the start of tighter monetary policy. Given expectations that the Fed will gradually increase interest rates in 2016 if the U.S. economy holds up, we anticipate a more favorable environment for value investing, though the timing of such a shift is unclear.
PORTFOLIO REVIEW
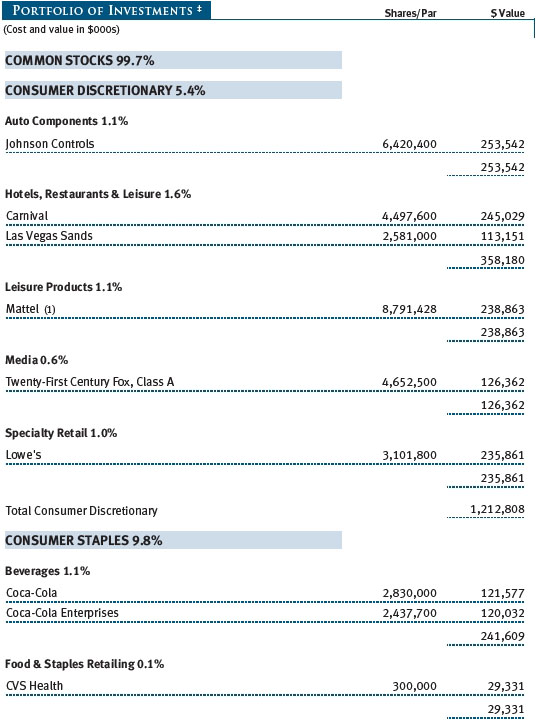
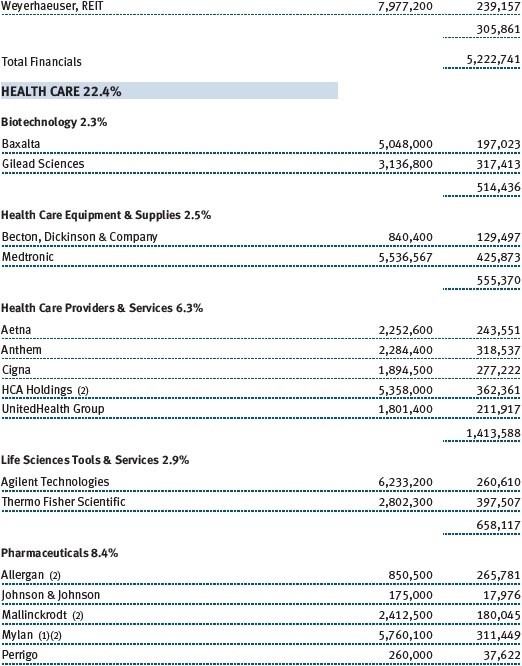
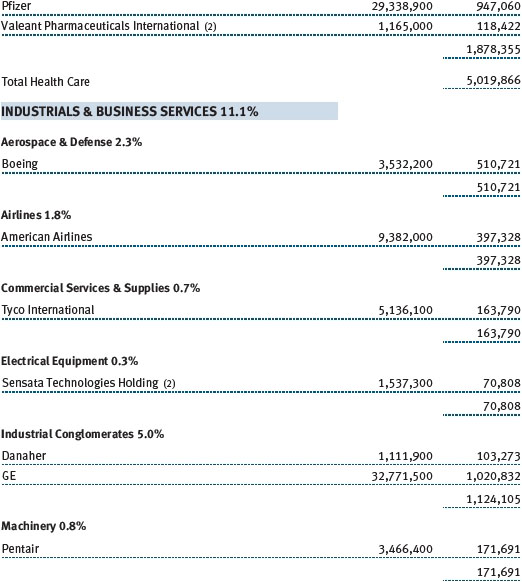
Health care stocks contributed the most to relative returns. In addition to strong stock selection, we benefited from an overweight allocation to health care, which outperformed the broader S&P 500. Four of your fund’s top 10 absolute contributors in 2015 were health care companies whose shares rallied as deal-making heated up last year. Health insurer Cigna led contributors in the sector after Anthem announced in July that it agreed to buy Cigna for $48 billion, one of several proposed mergers that are transforming the managed care industry as companies seek to rationalize costs and increase scale. Speculation of possible tie-ups among the nation’s top health insurers lifted shares of UnitedHealth Group, the biggest U.S. health insurer, while shares of drugmaker Hospira surged after it agreed to be acquired by Pfizer for a hefty premium. Thermo Fisher Scientific, which makes lab equipment and instruments for medical research, was another strong contributor on solid earnings growth and an increase in funding for the National Institutes of Health, which funds some of the company’s clients. We reduced our position in Cigna and eliminated Hospira following Pfizer’s buyout, but we maintain sizable positions in UnitedHealth Group and Thermo Fisher Scientific. (Please refer to our portfolio of investments for a complete list of holdings and the amount each represents in the portfolio.)
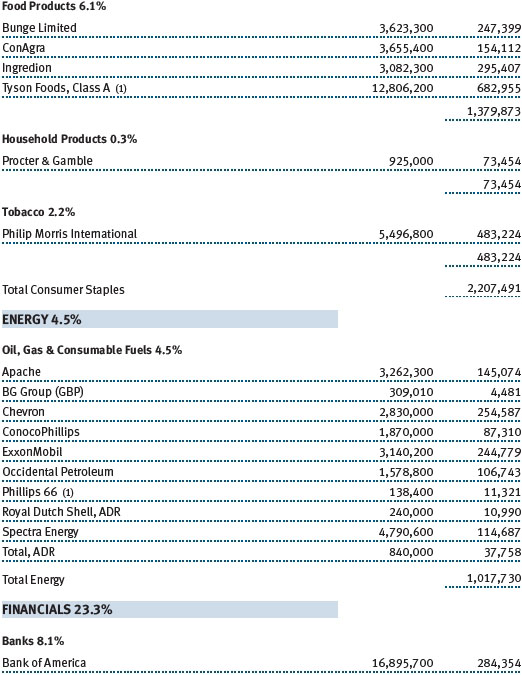
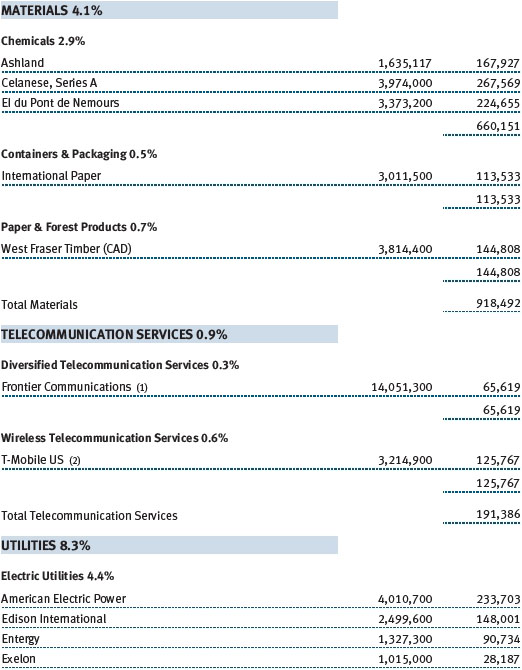
Energy was the worst-performing sector in the S&P 500 in 2015 as oil and natural gas prices collapsed. However, we added value through an underweight allocation to energy and favorable stock selection, a testament to the insightful work of our research analysts who cover the sector. Much of our outperformance in energy stems from our lack of exposure to oil and gas companies whose shares plummeted last year as energy prices kept dropping. We remain underweight in energy, as we believe that commodity prices will remain low as global oil oversupply persists and economic growth slows in many countries. Our energy holdings have strong balance sheets, access to low-cost sources of oil and natural gas, and lower cost structures—advantages that we believe will allow them to stay competitive in a sustained downturn. Our top energy investments at year-end were integrated oil and gas companies ExxonMobil and Chevron, which we added in the second half of 2015.
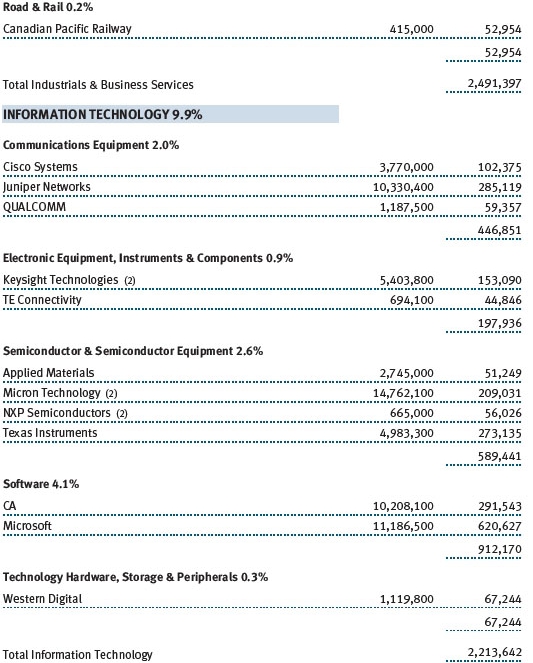
Our stock selection proved less helpful in information technology, which detracted heavily from relative returns. Memory chipmaker Micron Technology, whose shares sank about 60% last year due to slowing demand for personal computers, was the most significant underperformer. Micron is the only U.S. maker of dynamic random access memory (DRAM) chips, a highly cyclical business that has grown more stable after industry consolidation. Despite the high volatility in its shares, we favor Micron for its leading position in an industry with few global players and high barriers to entry, and maintain an overweight position. Other large detractors were IT services provider Xerox and disk drive maker Seagate Technology, which reported weaker earnings and revenue amid changes in their respective industries. We eliminated our positions in both companies in favor of others with clearer turnaround prospects.
PORTFOLIO STRATEGY AND CHANGES
Before launching into a discussion about portfolio changes over the past year, we believe it is helpful to review our investment strategy. We invest in companies with attractive relative valuations and favorable long-term fundamentals and hold them for a long time. To ascertain relative value, we spend much effort on determining the potential return and risk associated with a given company. We seek to identify companies in which we believe our investment’s implicit upside is significantly greater than its inherent risk. Companies that generate strong free cash flow and trade at a discount to our estimated sum-of-the-parts valuation are among the key features we look for. If we can continue to successfully identify companies with asymmetric return potential, then we should be able to outperform the market and our peers over the long term.
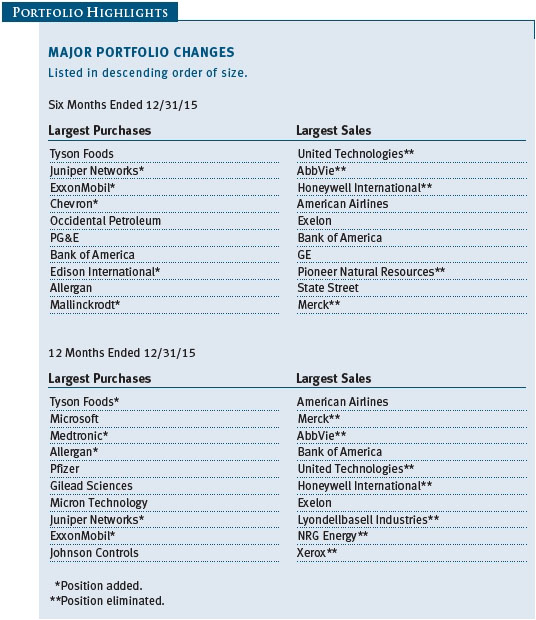
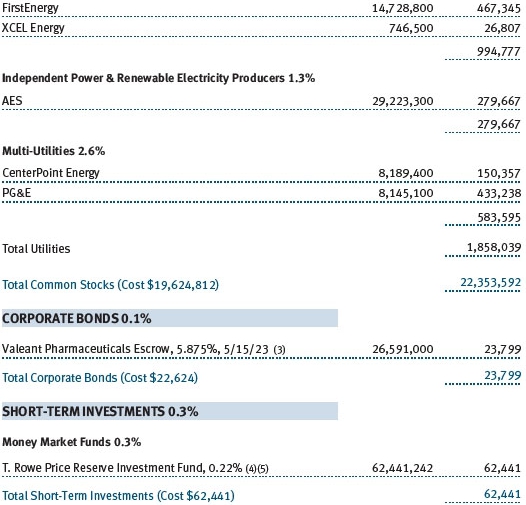
In recent months, we sought to position your fund more conservatively as our confidence in the U.S. outlook dimmed. Given our muted expectations for the economy and stock market performance, we eliminated riskier names from the fund while maintaining sizable exposure to health care, consumer staples, and utilities—defensive areas that typically outperform in down markets. We purchased meat producer Tyson Foods, which is moving away from its commodity meat processing business and transforming into a more valuable branded consumer goods company following its 2014 acquisition of Hillshire Brands. In utilities, we took advantage of price weakness and purchased PG&E and Edison International, two high-quality California utility owners with above-average dividends and earnings growth. Utilities are typically resilient performers in a slowing economy and have historically outpaced the broader market in the months after Fed tightening cycles. In health care, we added to Allergan and initiated a position in drugmaker Mallinckrodt, which produces several drugs that we believe are durable in nature and won’t be subject to generic competition any time soon. We also believe that Mallinckrodt’s shares are undervalued given the company’s strong track record of integrating recent acquisitions.
Most of our sales resulted from trimming or eliminating names whose shares rose to levels that we believed more accurately reflected their fundamentals. We trimmed shares of GE on strength after it announced plans to shed most of its financing unit, which we regard as a positive move that will result in a simpler company more focused on industrial businesses, though we maintain a sizable position in GE. Other sales resulted from our investment thesis failing to pan out as expected or other adverse developments. We eliminated United Technologies after management reduced its full-year profit forecast for the third time in less than a year, exposing a turnaround that will be longer and more risky than we expected. We also eliminated drugmaker AbbVie amid new signs that its top-selling product Humira will face generic competition sooner than we thought and concerns about the high price of AbbVie’s $21 billion acquisition of Pharmacyclics.

OUTLOOK
In our last letter six months ago, we expressed concern about how U.S. stocks appeared expensive and valuations for most sectors exceeded their long-term historical averages. Given that the S&P 500 has barely budged since then but the risks facing the global economy have increased, we anticipate subdued returns for U.S. stocks this year. As a result of our guarded outlook, we have taken steps to eliminate unnecessary risk from your fund and focused on companies that we expect will hold up reasonably well even in a down market.
However, there are reasons to be cautiously optimistic about the U.S. outlook. Consumers are in a relatively strong position as unemployment has declined over the past year, wage growth has lately picked up, and low energy prices should in theory boost discretionary spending. Conversely, the plunge in commodities prices has spurred recession-like conditions for companies in the energy and industrials and business services sectors. The effects of the Fed’s December 16 rate hike—its first in nine years—could undermine the U.S. economy’s growth momentum while the global economy is fragile. A strong dollar has left many emerging markets at risk of greater capital outflows and higher borrowing costs at a time when their economies are already slowing, which could hurt profitability for U.S. companies. We expect that weak commodities, dollar strength, and sluggish global growth will restrain corporate earnings in 2016, just as they did for most of last year.
Stock market volatility surged near the end of 2015 as worries grew about China’s management of its economy and the collapse in commodities prices. Those headwinds will likely persist in the coming months, and we anticipate volatility will remain elevated well into 2016. High volatility in the stock market is unsettling for many investors. However, it also yields better stock-picking opportunities for active managers by allowing us to take advantage of temporary market dislocations to opportunistically buy companies that we believe represent compelling value at lower prices. Regardless of the stock market’s day-to-day performance, we remain committed to our investment strategy of investing in high-quality companies that are trading below their intrinsic value and maintaining a long-term horizon to give them time to reach their full potential.
Thank you for investing with T. Rowe Price.
Respectfully submitted,

Mark S. Finn
President of the fund and chairman of its Investment Advisory Committee
January 16, 2016
The committee chairman has day-to-day responsibility for managing the portfolio and works with committee members in developing and executing the fund’s investment program.
RISKS OF INVESTING IN THE FUND
Value investors seek to invest in companies whose stock prices are low in relation to their real worth or future prospects. By identifying companies whose stocks are currently out of favor or misunderstood, value investors hope to realize significant appreciation as other investors recognize the stock’s intrinsic value and the price rises accordingly. The value approach carries the risk that the market will not recognize a security’s intrinsic value for a long time or that a stock judged to be undervalued may actually be appropriately priced.
GLOSSARY
Lipper index: An index of mutual fund performance returns for specified periods in defined categories as tracked by Lipper Inc.
S&P 500 Index: A market cap-weighted index of 500 widely held stocks often used as a proxy for the overall stock market. Performance is reported on a total return basis.
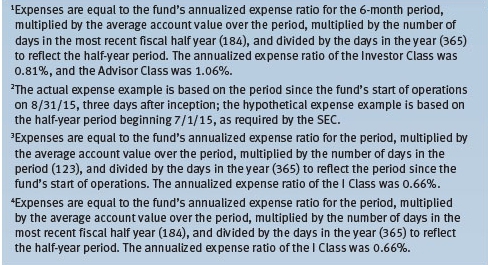
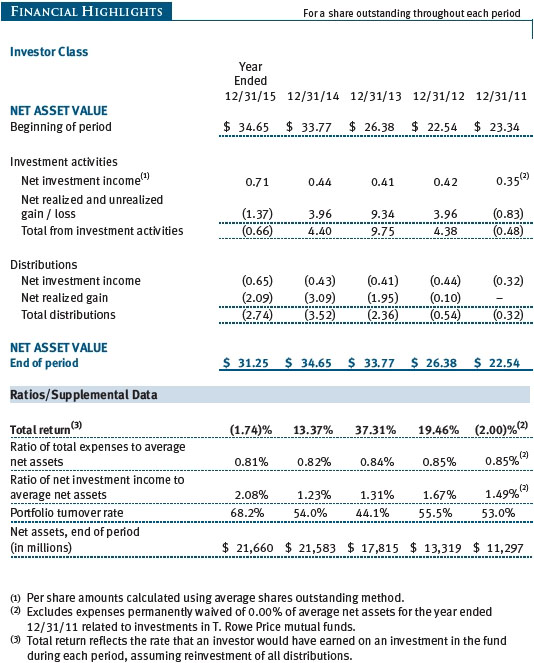
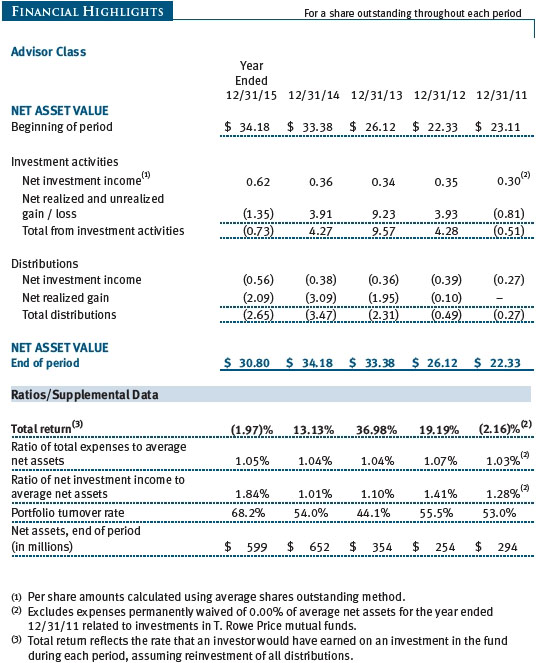
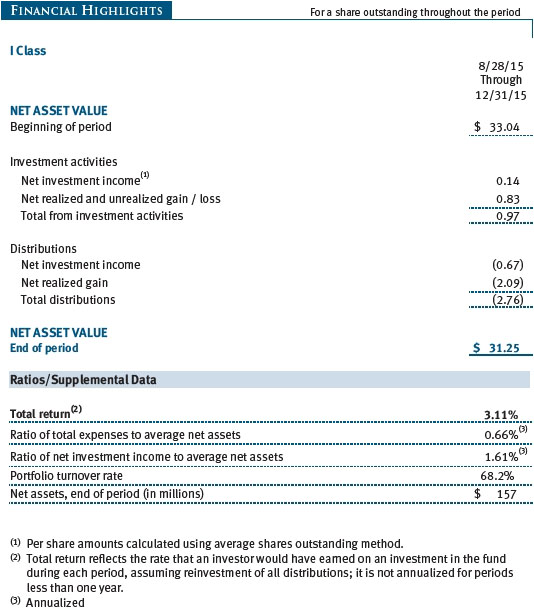
Performance and Expenses
This chart shows the value of a hypothetical $10,000 investment in the fund over the past 10 fiscal year periods or since inception (for funds lacking 10-year records). The result is compared with benchmarks, which may include a broad-based market index and a peer group average or index. Market indexes do not include expenses, which are deducted from fund returns as well as mutual fund averages and indexes.
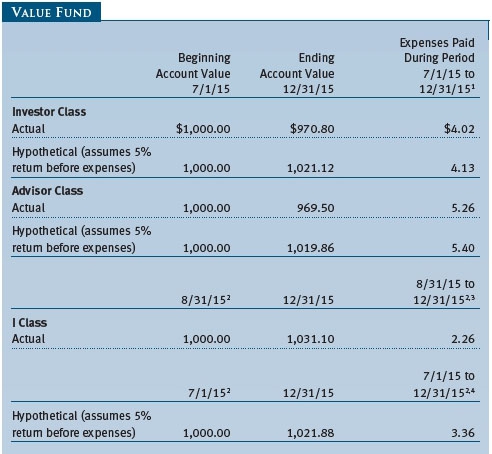
As a mutual fund shareholder, you may incur two types of costs: (1) transaction costs, such as redemption fees or sales loads, and (2) ongoing costs, including management fees, distribution and service (12b-1) fees, and other fund expenses. The following example is intended to help you understand your ongoing costs (in dollars) of investing in the fund and to compare these costs with the ongoing costs of investing in other mutual funds. The example is based on an investment of $1,000 invested at the beginning of the most recent six-month period and held for the entire period.
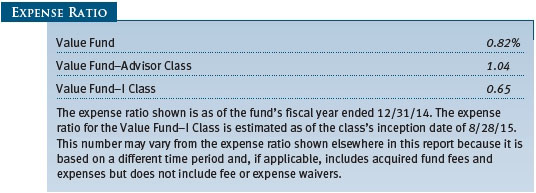
Please note that the fund has three share classes: The original share class (Investor Class) charges no distribution and service (12b-1) fee, the Advisor Class shares are offered only through unaffiliated brokers and other financial intermediaries and charge a 0.25% 12b-1 fee, and I Class shares are available to institutionally oriented clients and impose no 12b-1 or administrative fee payment. Each share class is presented separately in the table.
Actual Expenses
The first line of the following table (Actual) provides information about actual account values and expenses based on the fund’s actual returns. You may use the information on this line, together with your account balance, to estimate the expenses that you paid over the period. Simply divide your account value by $1,000 (for example, an $8,600 account value divided by $1,000 = 8.6), then multiply the result by the number on the first line under the heading “Expenses Paid During Period” to estimate the expenses you paid on your account during this period.
Hypothetical Example for Comparison Purposes
The information on the second line of the table (Hypothetical) is based on hypothetical account values and expenses derived from the fund’s actual expense ratio and an assumed 5% per year rate of return before expenses (not the fund’s actual return). You may compare the ongoing costs of investing in the fund with other funds by contrasting this 5% hypothetical example and the 5% hypothetical examples that appear in the shareholder reports of the other funds. The hypothetical account values and expenses may not be used to estimate the actual ending account balance or expenses you paid for the period.
Note: T. Rowe Price charges an annual account service fee of $20, generally for accounts with less than $10,000. The fee is waived for any investor whose T. Rowe Price mutual fund accounts total $50,000 or more; accounts electing to receive electronic delivery of account statements, transaction confirmations, prospectuses, and shareholder reports; or accounts of an investor who is a T. Rowe Price Preferred Services, Personal Services, or Enhanced Personal Services client (enrollment in these programs generally requires T. Rowe Price assets of at least $100,000). This fee is not included in the accompanying table. If you are subject to the fee, keep it in mind when you are estimating the ongoing expenses of investing in the fund and when comparing the expenses of this fund with other funds.
You should also be aware that the expenses shown in the table highlight only your ongoing costs and do not reflect any transaction costs, such as redemption fees or sales loads. Therefore, the second line of the table is useful in comparing ongoing costs only and will not help you determine the relative total costs of owning different funds. To the extent a fund charges transaction costs, however, the total cost of owning that fund is higher.
The accompanying notes are an integral part of these financial statements.
The accompanying notes are an integral part of these financial statements.
The accompanying notes are an integral part of these financial statements.
The accompanying notes are an integral part of these financial statements.
The accompanying notes are an integral part of these financial statements.
The accompanying notes are an integral part of these financial statements.

The accompanying notes are an integral part of these financial statements.
| Notes to Financial Statements |
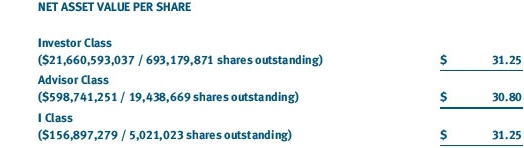
T. Rowe Price Value Fund, Inc. (the fund), is registered under the Investment Company Act of 1940 (the 1940 Act) as a diversified, open-end management investment company. The fund seeks to provide long-term capital appreciation by investing in common stocks believed to be undervalued. Income is a secondary objective. The fund has three classes of shares: the Value Fund original share class, referred to in this report as the Investor Class, offered since September 30, 1994; the Value Fund–Advisor Class (Advisor Class), offered since March 31, 2000; and the Value Fund–I Class (I Class), offered since August 28, 2015. Advisor Class shares are sold only through unaffiliated brokers and other unaffiliated financial intermediaries. I Class shares generally are available only to investors meeting a $1,000,000 minimum investment or certain other criteria. The Advisor Class operates under a Board-approved Rule 12b-1 plan pursuant to which the class compensates financial intermediaries for distribution, shareholder servicing, and/or certain administrative services; the Investor and I Classes do not pay Rule 12b-1 fees. Each class has exclusive voting rights on matters related solely to that class; separate voting rights on matters that relate to all classes; and, in all other respects, the same rights and obligations as the other classes.
NOTE 1 - SIGNIFICANT ACCOUNTING POLICIES
Basis of Preparation The fund is an investment company and follows accounting and reporting guidance in the Financial Accounting Standards Board (FASB) Accounting Standards Codification Topic 946 (ASC 946). The accompanying financial statements were prepared in accordance with accounting principles generally accepted in the United States of America (GAAP), including, but not limited to, ASC 946. GAAP requires the use of estimates made by management. Management believes that estimates and valuations are appropriate; however, actual results may differ from those estimates, and the valuations reflected in the accompanying financial statements may differ from the value ultimately realized upon sale or maturity.
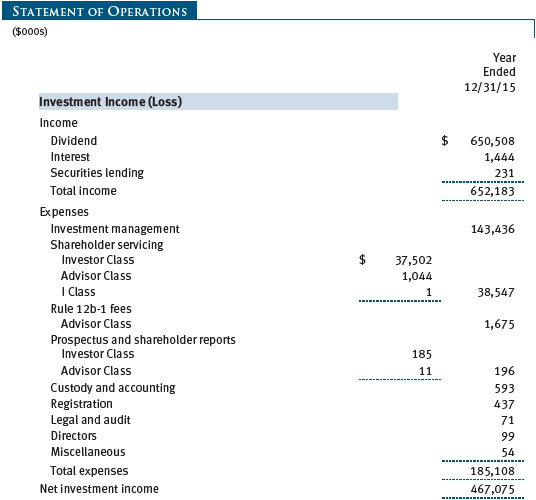
Investment Transactions, Investment Income, and Distributions Income and expenses are recorded on the accrual basis. Premiums and discounts on debt securities are amortized for financial reporting purposes. Dividends received from mutual fund investments are reflected as dividend income; capital gain distributions are reflected as realized gain/loss. Dividend income and capital gain distributions are recorded on the ex-dividend date. Income tax-related interest and penalties, if incurred, would be recorded as income tax expense. Investment transactions are accounted for on the trade date. Realized gains and losses are reported on the identified cost basis. Distributions to shareholders are recorded on the ex-dividend date. Distributions from REITs are initially recorded as dividend income and, to the extent such represent a return of capital or capital gain for tax purposes, are reclassified when such information becomes available. Income distributions are declared and paid by each class annually. Capital gain distributions, if any, are generally declared and paid by the fund annually.
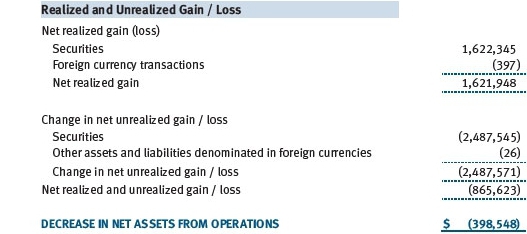
Currency Translation Assets, including investments, and liabilities denominated in foreign currencies are translated into U.S. dollar values each day at the prevailing exchange rate, using the mean of the bid and asked prices of such currencies against U.S. dollars as quoted by a major bank. Purchases and sales of securities, income, and expenses are translated into U.S. dollars at the prevailing exchange rate on the date of the transaction. The effect of changes in foreign currency exchange rates on realized and unrealized security gains and losses is reflected as a component of security gains and losses.
Class Accounting Shareholder servicing, prospectus, and shareholder report expenses incurred by each class are charged directly to the class to which they relate. Expenses common to all classes, investment income, and realized and unrealized gains and losses are allocated to the classes based upon the relative daily net assets of each class. The Advisor Class pays distribution, shareholder servicing, and/or certain administrative expenses in the form of Rule 12b-1 fees, in an amount not exceeding 0.25% of the class’s average daily net assets.
Rebates Subject to best execution, the fund may direct certain security trades to brokers who have agreed to rebate a portion of the related brokerage commission to the fund in cash. Commission rebates are reflected as realized gain on securities in the accompanying financial statements and totaled $639,000 for the year ended December 31, 2015.
In-Kind Redemptions In accordance with guidelines described in the fund’s prospectus, the fund may distribute portfolio securities rather than cash as payment for a redemption of fund shares (in-kind redemption). For financial reporting purposes, the fund recognizes a gain on in-kind redemptions to the extent the value of the distributed securities on the date of redemption exceeds the cost of those securities. Gains and losses realized on in-kind redemptions are not recognized for tax purposes and are reclassified from undistributed realized gain (loss) to paid-in capital. During the year ended December 31, 2015, the fund realized $139,698,000 of net gain on $383,238,000 of in-kind redemptions.
New Accounting Guidance In May 2015, FASB issued ASU No. 2015-07, Fair Value Measurement (Topic 820), Disclosures for Investments in Certain Entities That Calculate Net Asset Value per Share (or Its Equivalent). The ASU removes the requirement to categorize within the fair value hierarchy all investments for which fair value is measured using the net asset value per share practical expedient and amends certain disclosure requirements for such investments. The ASU is effective for interim and annual reporting periods beginning after December 15, 2015. Adoption will have no effect on the fund’s net assets or results of operations.
NOTE 2 - VALUATION
The fund’s financial instruments are valued and each class’s net asset value (NAV) per share is computed at the close of the New York Stock Exchange (NYSE), normally 4 p.m. ET, each day the NYSE is open for business.
Fair Value The fund’s financial instruments are reported at fair value, which GAAP defines as the price that would be received to sell an asset or paid to transfer a liability in an orderly transaction between market participants at the measurement date. The T. Rowe Price Valuation Committee (the Valuation Committee) has been established by the fund’s Board of Directors (the Board) to ensure that financial instruments are appropriately priced at fair value in accordance with GAAP and the 1940 Act. Subject to oversight by the Board, the Valuation Committee develops and oversees pricing-related policies and procedures and approves all fair value determinations. Specifically, the Valuation Committee establishes procedures to value securities; determines pricing techniques, sources, and persons eligible to effect fair value pricing actions; oversees the selection, services, and performance of pricing vendors; oversees valuation-related business continuity practices; and provides guidance on internal controls and valuation-related matters. The Valuation Committee reports to the Board and has representation from legal, portfolio management and trading, operations, risk management, and the fund’s treasurer.
Various valuation techniques and inputs are used to determine the fair value of financial instruments. GAAP establishes the following fair value hierarchy that categorizes the inputs used to measure fair value:
Level 1 – quoted prices (unadjusted) in active markets for identical financial instruments that the fund can access at the reporting date
Level 2 – inputs other than Level 1 quoted prices that are observable, either directly or indirectly (including, but not limited to, quoted prices for similar financial instruments in active markets, quoted prices for identical or similar financial instruments in inactive markets, interest rates and yield curves, implied volatilities, and credit spreads)
Level 3 – unobservable inputs
Observable inputs are developed using market data, such as publicly available information about actual events or transactions, and reflect the assumptions that market participants would use to price the financial instrument. Unobservable inputs are those for which market data are not available and are developed using the best information available about the assumptions that market participants would use to price the financial instrument. GAAP requires valuation techniques to maximize the use of relevant observable inputs and minimize the use of unobservable inputs. When multiple inputs are used to derive fair value, the financial instrument is assigned to the level within the fair value hierarchy based on the lowest-level input that is significant to the fair value of the financial instrument. Input levels are not necessarily an indication of the risk or liquidity associated with financial instruments at that level but rather the degree of judgment used in determining those values.
Valuation Techniques Equity securities listed or regularly traded on a securities exchange or in the over-the-counter (OTC) market are valued at the last quoted sale price or, for certain markets, the official closing price at the time the valuations are made. OTC Bulletin Board securities are valued at the mean of the closing bid and asked prices. A security that is listed or traded on more than one exchange is valued at the quotation on the exchange determined to be the primary market for such security. Listed securities not traded on a particular day are valued at the mean of the closing bid and asked prices for domestic securities and the last quoted sale or closing price for international securities.
For valuation purposes, the last quoted prices of non-U.S. equity securities may be adjusted to reflect the fair value of such securities at the close of the NYSE. If the fund determines that developments between the close of a foreign market and the close of the NYSE will, in its judgment, materially affect the value of some or all of its portfolio securities, the fund will adjust the previous quoted prices to reflect what it believes to be the fair value of the securities as of the close of the NYSE. In deciding whether it is necessary to adjust quoted prices to reflect fair value, the fund reviews a variety of factors, including developments in foreign markets, the performance of U.S. securities markets, and the performance of instruments trading in U.S. markets that represent foreign securities and baskets of foreign securities. The fund may also fair value securities in other situations, such as when a particular foreign market is closed but the fund is open. The fund uses outside pricing services to provide it with quoted prices and information to evaluate or adjust those prices. The fund cannot predict how often it will use quoted prices and how often it will determine it necessary to adjust those prices to reflect fair value. As a means of evaluating its security valuation process, the fund routinely compares quoted prices, the next day’s opening prices in the same markets, and adjusted prices.
Actively traded equity securities listed on a domestic exchange generally are categorized in Level 1 of the fair value hierarchy. Non-U.S. equity securities generally are categorized in Level 2 of the fair value hierarchy despite the availability of quoted prices because, as described above, the fund evaluates and determines whether those quoted prices reflect fair value at the close of the NYSE or require adjustment. OTC Bulletin Board securities, certain preferred securities, and equity securities traded in inactive markets generally are categorized in Level 2 of the fair value hierarchy.
Debt securities generally are traded in the OTC market. Securities with remaining maturities of one year or more at the time of acquisition are valued at prices furnished by dealers who make markets in such securities or by an independent pricing service, which considers the yield or price of bonds of comparable quality, coupon, maturity, and type, as well as prices quoted by dealers who make markets in such securities. Generally, debt securities are categorized in Level 2 of the fair value hierarchy; however, to the extent the valuations include significant unobservable inputs, the securities would be categorized in Level 3.
Investments in mutual funds are valued at the mutual fund’s closing NAV per share on the day of valuation and are categorized in Level 1 of the fair value hierarchy. Assets and liabilities other than financial instruments, including short-term receivables and payables, are carried at cost, or estimated realizable value, if less, which approximates fair value.
Thinly traded financial instruments and those for which the above valuation procedures are inappropriate or are deemed not to reflect fair value are stated at fair value as determined in good faith by the Valuation Committee. The objective of any fair value pricing determination is to arrive at a price that could reasonably be expected from a current sale. Financial instruments fair valued by the Valuation Committee are primarily private placements, restricted securities, warrants, rights, and other securities that are not publicly traded.
Subject to oversight by the Board, the Valuation Committee regularly makes good faith judgments to establish and adjust the fair valuations of certain securities as events occur and circumstances warrant. For instance, in determining the fair value of an equity investment with limited market activity, such as a private placement or a thinly traded public company stock, the Valuation Committee considers a variety of factors, which may include, but are not limited to, the issuer’s business prospects, its financial standing and performance, recent investment transactions in the issuer, new rounds of financing, negotiated transactions of significant size between other investors in the company, relevant market valuations of peer companies, strategic events affecting the company, market liquidity for the issuer, and general economic conditions and events. In consultation with the investment and pricing teams, the Valuation Committee will determine an appropriate valuation technique based on available information, which may include both observable and unobservable inputs. The Valuation Committee typically will afford greatest weight to actual prices in arm’s length transactions, to the extent they represent orderly transactions between market participants, transaction information can be reliably obtained, and prices are deemed representative of fair value. However, the Valuation Committee may also consider other valuation methods such as market-based valuation multiples; a discount or premium from market value of a similar, freely traded security of the same issuer; or some combination. Fair value determinations are reviewed on a regular basis and updated as information becomes available, including actual purchase and sale transactions of the issue. Because any fair value determination involves a significant amount of judgment, there is a degree of subjectivity inherent in such pricing decisions, and fair value prices determined by the Valuation Committee could differ from those of other market participants. Depending on the relative significance of unobservable inputs, including the valuation technique(s) used, fair valued securities may be categorized in Level 2 or 3 of the fair value hierarchy.
Valuation Inputs The following table summarizes the fund’s financial instruments, based on the inputs used to determine their fair values on December 31, 2015:

There were no material transfers between Levels 1 and 2 during the year ended December 31, 2015.
NOTE 3 - OTHER INVESTMENT TRANSACTIONS
Consistent with its investment objective, the fund engages in the following practices to manage exposure to certain risks and/or to enhance performance. The investment objective, policies, program, and risk factors of the fund are described more fully in the fund’s prospectus and Statement of Additional Information.
Restricted Securities The fund may invest in securities that are subject to legal or contractual restrictions on resale. Prompt sale of such securities at an acceptable price may be difficult and may involve substantial delays and additional costs.
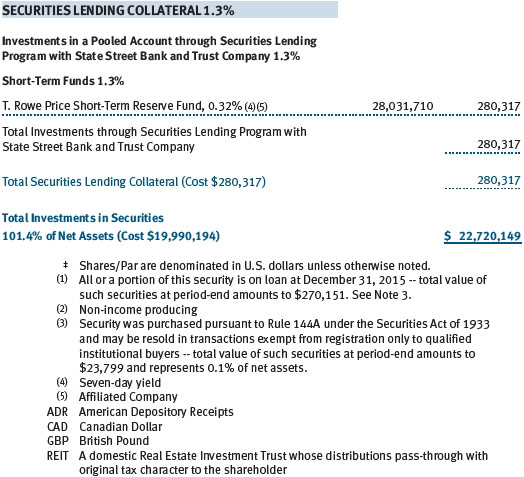
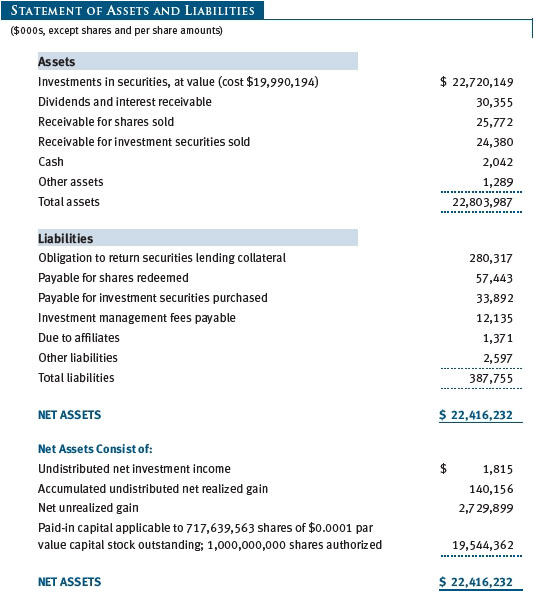
Securities Lending The fund may lend its securities to approved brokers to earn additional income. Its securities lending activities are administered by a lending agent in accordance with a securities lending agreement. Security loans generally do not have stated maturity dates, and the fund may recall a security at any time. The fund receives collateral in the form of cash or U.S. government securities, valued at 102% to 105% of the value of the securities on loan. Collateral is maintained over the life of the loan in an amount not less than the value of loaned securities; any additional collateral required due to changes in security values is delivered to the fund the next business day. Cash collateral is invested by the lending agent(s) in accordance with investment guidelines approved by fund management. Additionally, the lending agent indemnifies the fund against losses resulting from borrower default. Although risk is mitigated by the collateral and indemnification, the fund could experience a delay in recovering its securities and a possible loss of income or value if the borrower fails to return the securities, collateral investments decline in value, and the lending agent fails to perform. Securities lending revenue consists of earnings on invested collateral and borrowing fees, net of any rebates to the borrower, compensation to the lending agent, and other administrative costs. In accordance with GAAP, investments made with cash collateral are reflected in the accompanying financial statements, but collateral received in the form of securities is not. At December 31, 2015, the value of loaned securities was $270,151,000; the value of cash collateral and related investments was $280,317,000.
Other Purchases and sales of portfolio securities other than short-term securities aggregated $16,294,667,000 and $15,219,743,000, respectively, for the year ended December 31, 2015.
NOTE 4 - FEDERAL INCOME TAXES
No provision for federal income taxes is required since the fund intends to continue to qualify as a regulated investment company under Subchapter M of the Internal Revenue Code and distribute to shareholders all of its taxable income and gains. Distributions determined in accordance with federal income tax regulations may differ in amount or character from net investment income and realized gains for financial reporting purposes. Financial reporting records are adjusted for permanent book/tax differences to reflect tax character but are not adjusted for temporary differences.
The fund files U.S. federal, state, and local tax returns as required. The fund’s tax returns are subject to examination by the relevant tax authorities until expiration of the applicable statute of limitations, which is generally three years after the filing of the tax return but which can be extended to six years in certain circumstances. Tax returns for open years have incorporated no uncertain tax positions that require a provision for income taxes.
Reclassifications to paid-in capital relate primarily to redemptions in kind and a tax practice that treats a portion of the proceeds from each redemption of capital shares as a distribution of taxable net investment income or realized capital gain. For the year ended December 31, 2015, the following reclassifications were recorded to reflect tax character (there was no impact on results of operations or net assets):
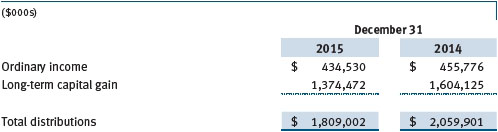
Distributions during the years ended December 31, 2015 and December 31, 2014, were characterized for tax purposes as follows:
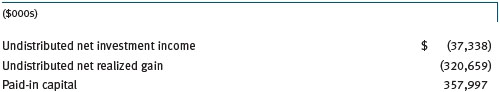
At December 31, 2015, the tax-basis cost of investments and components of net assets were as follows:
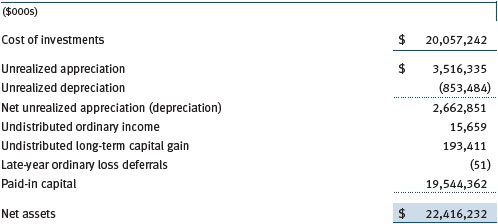
The difference between book-basis and tax-basis net unrealized appreciation (depreciation) is attributable to the deferral of losses from wash sales for tax purposes. In accordance with federal tax laws applicable to investment companies, specified net losses realized between November 1 and December 31 are not recognized for tax purposes until the subsequent year (late-year ordinary loss deferrals); however, such losses are recognized for financial reporting purposes in the year realized.
NOTE 5 - RELATED PARTY TRANSACTIONS
The fund is managed by T. Rowe Price Associates, Inc. (Price Associates), a wholly owned subsidiary of T. Rowe Price Group, Inc. (Price Group). The investment management agreement between the fund and Price Associates provides for an annual investment management fee that consists of an individual fund fee and a group fee; management fees are computed daily and paid monthly. The investment management agreement provides for an individual fund fee equal to 0.35% of the fund’s average daily net assets. Effective May 1, 2014, through April 30, 2016, Price Associates has agreed to reduce the fund’s individual fee to 0.2975% for the portion of average daily net assets in excess of $20 billion. This contractual arrangement will renew automatically for one year terms thereafter and may be revised, revoked, or terminated only with approval of the fund’s Board. Further, the fund has no obligation to repay fees reduced under this arrangement. The group fee rate is calculated based on the combined net assets of certain mutual funds sponsored by Price Associates (the group) applied to a graduated fee schedule, with rates ranging from 0.48% for the first $1 billion of assets to 0.275% for assets in excess of $400 billion. The fund’s group fee is determined by applying the group fee rate to the fund’s average daily net assets. At December 31, 2015, the effective annual group fee rate was 0.29%.
The I Class is subject to an operating expense limitation (I Class limit) pursuant to which Price Associates is contractually required to pay all operating expenses of the I Class, excluding management fees, interest, borrowing-related expenses, taxes, brokerage commissions, and extraordinary expenses, to the extent such operating expenses, on an annualized basis, exceed 0.05% of average net assets. This agreement will continue until April 30, 2018, and may be renewed, revised or revoked only with approval of the fund’s Board. The I Class is required to repay Price Associates for expenses previously paid to the extent the class’s net assets grow or expenses decline sufficiently to allow repayment without causing the class’s operating expenses to exceed the I Class limit. However, no repayment will be made more than three years after the date of a payment or waiver.
In addition, the fund has entered into service agreements with Price Associates and two wholly owned subsidiaries of Price Associates (collectively, Price). Price Associates provides certain accounting and administrative services to the fund. T. Rowe Price Services, Inc., provides shareholder and administrative services in its capacity as the fund’s transfer and dividend-disbursing agent. T. Rowe Price Retirement Plan Services, Inc., provides subaccounting and recordkeeping services for certain retirement accounts invested in the Investor Class. For the year ended December 31, 2015, expenses incurred pursuant to these service agreements were $92,000 for Price Associates; $1,111,000 for T. Rowe Price Services, Inc.; and $1,026,000 for T. Rowe Price Retirement Plan Services, Inc. The total amount payable at period-end pursuant to these service agreements is reflected as Due to Affiliates in the accompanying financial statements.
Additionally, the fund is one of several mutual funds in which certain college savings plans managed by Price Associates may invest. As approved by the fund’s Board of Directors, shareholder servicing costs associated with each college savings plan are borne by the fund in proportion to the average daily value of its shares owned by the college savings plan. For the year ended December 31, 2015, the fund was charged $691,000 for shareholder servicing costs related to the college savings plans, of which $578,000 was for services provided by Price. The amount payable at period-end pursuant to this agreement is reflected as Due to Affiliates in the accompanying financial statements. At December 31, 2015, approximately 2% of the outstanding shares of the Investor Class were held by college savings plans.
The fund is also one of several mutual funds sponsored by Price Associates (underlying Price funds) in which the T. Rowe Price Spectrum Funds (Spectrum Funds), as well as the T. Rowe Price Retirement Funds and T. Rowe Price Target Retirement Funds (Retirement Funds) may invest. Neither the Spectrum Funds nor the Retirement Funds invest in the underlying Price funds for the purpose of exercising management or control. Pursuant to separate special servicing agreements, expenses associated with the operation of the Spectrum Funds and Retirement Funds are borne by each underlying Price fund to the extent of estimated savings to it and in proportion to the average daily value of its shares owned by the Spectrum Funds and Retirement Funds, respectively. Expenses allocated under these agreements are reflected as shareholder servicing expenses in the accompanying financial statements. For the year ended December 31, 2015, the fund was allocated $589,000 of Spectrum Funds’ expenses and $30,419,000 of Retirement Funds’ expenses. Of these amounts, $12,501,000 related to services provided by Price. At period-end, the amount payable to Price pursuant to this agreement is reflected as Due to Affiliates in the accompanying financial statements. At December 31, 2015, approximately 2% of the outstanding shares of the Investor Class were held by the Spectrum Funds and 77% were held by the Retirement Funds.
In addition, other mutual funds, trusts, and other accounts managed by Price Associates or its affiliates (collectively, Price funds and accounts) may invest in the fund; however, no Price fund or account may invest for the purpose of exercising management or control over the fund. At December 31, 2015, less than 1% of the fund’s outstanding shares were held by Price funds and accounts.
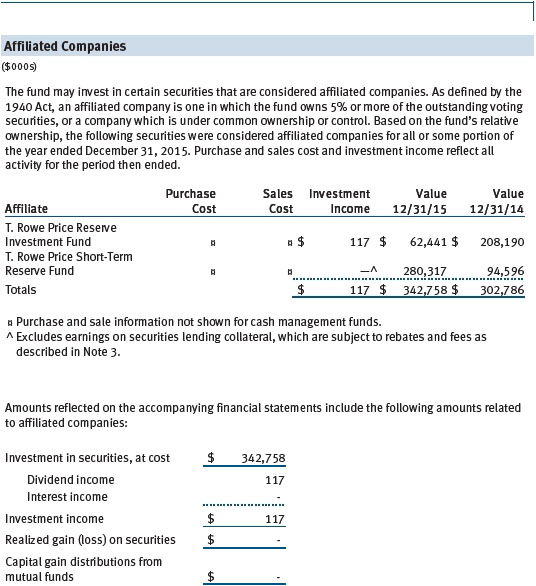
The fund may invest in the T. Rowe Price Reserve Investment Fund, the T. Rowe Price Government Reserve Investment Fund, or the T. Rowe Price Short-Term Reserve Fund (collectively, the Price Reserve Investment Funds), open-end management investment companies managed by Price Associates and considered affiliates of the fund. The Price Reserve Investment Funds are offered as short-term investment options to mutual funds, trusts, and other accounts managed by Price Associates or its affiliates and are not available for direct purchase by members of the public. The Price Reserve Investment Funds pay no investment management fees.
As of December 31, 2015, T. Rowe Price Group, Inc., or its wholly owned subsidiaries owned 1,424,654 shares of the Investor Class and 7,567 shares of the I Class, aggregating less than 1% of the fund’s net assets.
| Report of Independent Registered Public Accounting Firm |
To the Board of Directors and Shareholders of
T. Rowe Price Value Fund, Inc.
In our opinion, the accompanying statement of assets and liabilities, including the portfolio of investments, and the related statements of operations and of changes in net assets and the financial highlights present fairly, in all material respects, the financial position of T. Rowe Price Value Fund, Inc. (the “Fund”) at December 31, 2015, the results of its operations, the changes in its net assets and the financial highlights for each of the periods indicated therein, in conformity with accounting principles generally accepted in the United States of America. These financial statements and financial highlights (hereafter referred to as “financial statements”) are the responsibility of the Fund’s management. Our responsibility is to express an opinion on these financial statements based on our audits. We conducted our audits of these financial statements in accordance with the standards of the Public Company Accounting Oversight Board (United States). Those standards require that we plan and perform the audit to obtain reasonable assurance about whether the financial statements are free of material misstatement. An audit includes examining, on a test basis, evidence supporting the amounts and disclosures in the financial statements, assessing the accounting principles used and significant estimates made by management, and evaluating the overall financial statement presentation. We believe that our audits, which included confirmation of securities at December 31, 2015 by correspondence with the custodian and brokers, and confirmation of the underlying funds by correspondence with the transfer agent, provide a reasonable basis for our opinion.
PricewaterhouseCoopers LLP
Baltimore, Maryland
February 17, 2016
| Tax Information (Unaudited) for the Tax Year Ended 12/31/15 |
We are providing this information as required by the Internal Revenue Code. The amounts shown may differ from those elsewhere in this report because of differences between tax and financial reporting requirements.
The fund’s distributions to shareholders included:
| ● | $6,608,000 from short-term capital gains, |
| | |
| ● | $1,576,383,000 from long-term capital gains, subject to a long-term capital gains tax rate of not greater than 20%. |
For taxable non-corporate shareholders, $466,729,000 of the fund’s income represents qualified dividend income subject to a long-term capital gains tax rate of not greater than 20%.
For corporate shareholders, $466,729,000 of the fund’s income qualifies for the dividends-received deduction.
| Information on Proxy Voting Policies, Procedures, and Records |
A description of the policies and procedures used by T. Rowe Price funds and portfolios to determine how to vote proxies relating to portfolio securities is available in each fund’s Statement of Additional Information. You may request this document by calling 1-800-225-5132 or by accessing the SEC’s website, sec.gov.
The description of our proxy voting policies and procedures is also available on our website, troweprice.com. To access it, click on the words “Social Responsibility” at the top of our corporate homepage. Next, click on the words “Conducting Business Responsibly” on the left side of the page that appears. Finally, click on the words “Proxy Voting Policies” on the left side of the page that appears.
Each fund’s most recent annual proxy voting record is available on our website and through the SEC’s website. To access it through our website, follow the above directions to reach the “Conducting Business Responsibly” page. Click on the words “Proxy Voting Records” on the left side of that page, and then click on the “View Proxy Voting Records” link at the bottom of the page that appears.
| How to Obtain Quarterly Portfolio Holdings |
The fund files a complete schedule of portfolio holdings with the Securities and Exchange Commission for the first and third quarters of each fiscal year on Form N-Q. The fund’s Form N-Q is available electronically on the SEC’s website (sec.gov); hard copies may be reviewed and copied at the SEC’s Public Reference Room, 100 F St. N.E., Washington, DC 20549. For more information on the Public Reference Room, call 1-800-SEC-0330.
| About the Fund’s Directors and Officers |
Your fund is overseen by a Board of Directors (Board) that meets regularly to review a wide variety of matters affecting or potentially affecting the fund, including performance, investment programs, compliance matters, advisory fees and expenses, service providers, and business and regulatory affairs. The Board elects the fund’s officers, who are listed in the final table. At least 75% of the Board’s members are independent of T. Rowe Price Associates, Inc. (T. Rowe Price), and its affiliates; “inside” or “interested” directors are employees or officers of T. Rowe Price. The business address of each director and officer is 100 East Pratt Street, Baltimore, Maryland 21202. The Statement of Additional Information includes additional information about the fund directors and is available without charge by calling a T. Rowe Price representative at 1-800-638-5660.
| Independent Directors | | |
| |
| Name | | |
| (Year of Birth) | | |
| Year Elected* | | |
| [Number of T. Rowe Price | | Principal Occupation(s) and Directorships of Public Companies and |
| Portfolios Overseen] | | Other Investment Companies During the Past Five Years |
| | | |
| William R. Brody, M.D., Ph.D. | | President and Trustee, Salk Institute for Biological Studies (2009 to |
| (1944) | | present); Director, BioMed Realty Trust (2013 to present); Director, |
| 2009 | | Novartis, Inc. (2009 to 2014); Director, IBM (2007 to present) |
| [181] | | |
| | |
| Anthony W. Deering | | Chairman, Exeter Capital, LLC, a private investment firm (2004 to |
| (1945) | | present); Director, Brixmor Real Estate Investment Trust (2012 to |
| 2001 | | present); Director and Advisory Board Member, Deutsche Bank North |
| [181] | | America (2004 to present); Director, Under Armour (2008 to present); |
| | Director, Vornado Real Estate Investment Trust (2004 to 2012) |
| | |
| Bruce W. Duncan | | President, Chief Executive Officer, and Director, First Industrial |
| (1951) | | Realty Trust, an owner and operator of industrial properties |
| 2013 | | (2009 to present); Chairman of the Board (2005 to present) and |
| [181] | | Director (1999 to present), Starwood Hotels & Resorts, a hotel and |
| | leisure company |
| | |
| Robert J. Gerrard, Jr. | | Chairman of Compensation Committee and Director, Syniverse |
| (1952) | | Holdings, Inc., a provider of wireless voice and data services for |
| 2012 | | telecommunications companies (2008 to 2011); Advisory Board |
| [181] | | Member, Pipeline Crisis/Winning Strategies, a collaborative |
| | working to improve opportunities for young African Americans |
| | (1997 to present) |
| | |
| Paul F. McBride | | Former Company Officer and Senior Vice President, Human |
| (1956) | | Resources and Corporate Initiatives, Black & Decker Corporation |
| 2013 | | (2004 to 2010) |
| [181] | | |
| | |
| Cecilia E. Rouse, Ph.D. | | Dean, Woodrow Wilson School (2012 to present); Professor and |
| (1963) | | Researcher, Princeton University (1992 to present); Director, MDRC, a |
| 2012 | | nonprofit education and social policy research organization (2011 to |
| [181] | | present); Member, National Academy of Education (2010 to present); |
| | Research Associate, National Bureau of Economic Research’s Labor |
| | Studies Program (2011 to present); Member, President’s Council of |
| | Economic Advisers (2009 to 2011); Chair of Committee on the Status |
| | of Minority Groups in the Economic Profession, American Economic |
| | Association (2012 to present) |
| | |
| John G. Schreiber | | Owner/President, Centaur Capital Partners, Inc., a real estate |
| (1946) | | investment company (1991 to present); Cofounder and Partner, |
| 2001 | | Blackstone Real Estate Advisors, L.P. (1992 to present); Director, |
| [181] | | General Growth Properties, Inc. (2010 to 2013); Director, Blackstone |
| | Mortgage Trust, a real estate financial company (2012 to present); |
| | Director and Chairman of the Board, Brixmor Property Group, Inc. |
| | (2013 to present); Director, Hilton Worldwide (2013 to present); |
| | Director, Hudson Pacific Properties (2014 to present) |
| | |
| Mark R. Tercek | | President and Chief Executive Officer, The Nature Conservancy |
| (1957) | | (2008 to present) |
| 2009 | | |
| [181] | | |
| |
| *Each independent director serves until retirement, resignation, or election of a successor. |
| Inside Directors | | |
| |
| Name | | |
| (Year of Birth) | | |
| Year Elected* | | |
| [Number of T. Rowe Price | | Principal Occupation(s) and Directorships of Public Companies and |
| Portfolios Overseen] | | Other Investment Companies During the Past Five Years |
| | | |
| Edward C. Bernard | | Director and Vice President, T. Rowe Price; Vice Chairman of the |
| (1956) | | Board, Director, and Vice President, T. Rowe Price Group, Inc.; |
| 2006 | | Chairman of the Board, Director, and President, T. Rowe Price |
| [181] | | Investment Services, Inc.; Chairman of the Board and Director, |
| | T. Rowe Price Retirement Plan Services, Inc., and T. Rowe Price |
| | Services, Inc.; Chairman of the Board, Chief Executive Officer, |
| | Director, and President, T. Rowe Price International and T. Rowe |
| | Price Trust Company; Chairman of the Board, all funds |
| | |
| Brian C. Rogers, CFA, CIC | | Chief Investment Officer, Director, and Vice President, T. Rowe Price; |
| (1955) | | Chairman of the Board, Chief Investment Officer, Director, and Vice |
| 2006 | | President, T. Rowe Price Group, Inc.; Vice President, T. Rowe Price |
| [127] | | Trust Company; Vice President, Value Fund |
| |
| *Each inside director serves until retirement, resignation, or election of a successor. |
| Officers | | |
| |
| Name (Year of Birth) | | |
| Position Held With Value Fund | | Principal Occupation(s) |
| | | |
| Peter J. Bates, CFA (1974) | | Vice President, T. Rowe Price and T. Rowe Price |
| Vice President | | Group, Inc. |
| | |
| Jason A. Bauer (1979) | | Vice President, T. Rowe Price and T. Rowe Price |
| Vice President | | Group, Inc. |
| | |
| Darrell N. Braman (1963) | | Vice President, Price Hong Kong, Price |
| Vice President | | Singapore, T. Rowe Price, T. Rowe Price Group, |
| | Inc., T. Rowe Price International, T. Rowe Price |
| | Investment Services, Inc., and T. Rowe Price |
| | Services, Inc. |
| | |
| Ryan N. Burgess, CFA (1974) | | Vice President, T. Rowe Price and T. Rowe Price |
| Vice President | | Group, Inc. |
| | |
| Ira W. Carnahan, CFA (1963) | | Vice President, T. Rowe Price and T. Rowe Price |
| Vice President | | Group, Inc. |
| | |
| Andrew S. Davis (1978) | | Vice President, T. Rowe Price and T. Rowe Price |
| Vice President | | Group, Inc. |
| | | |
| Mark S. Finn, CFA, CPA (1963) | | Vice President, T. Rowe Price, T. Rowe Price |
| President | | Group, Inc., and T. Rowe Price Trust Company |
| | | |
| John R. Gilner (1961) | | Chief Compliance Officer and Vice President, |
| Chief Compliance Officer | | T. Rowe Price; Vice President, T. Rowe Price |
| | Group, Inc., and T. Rowe Price Investment |
| | Services, Inc. |
| | |
| David R. Giroux, CFA (1975) | | Vice President, T. Rowe Price, T. Rowe Price |
| Vice President | | Group, Inc., and T. Rowe Price Trust Company |
| | | |
| Joel Grant (1978) | | Vice President, T. Rowe Price and T. Rowe |
| Vice President | | Price Group, Inc.; formerly, Analyst, Fidelity |
| | International (to 2014) |
| | |
| Dominic Janssens (1965) | | Vice President, T. Rowe Price, T. Rowe Price |
| Vice President | | Group, Inc., and T. Rowe Price Trust Company |
| | | |
| Paul J. Krug, CPA (1964) | | Vice President, T. Rowe Price, T. Rowe Price |
| Vice President | | Group, Inc., and T. Rowe Price Trust Company |
| | | |
| John D. Linehan, CFA (1965) | | Vice President, T. Rowe Price, T. Rowe Price |
| Vice President | | Group, Inc., and T. Rowe Price Trust Company |
| | | |
| Patricia B. Lippert (1953) | | Assistant Vice President, T. Rowe Price and |
| Secretary | | T. Rowe Price Investment Services, Inc. |
| | | |
| Catherine D. Mathews (1963) | | Vice President, T. Rowe Price, T. Rowe Price |
| Treasurer and Vice President | | Group, Inc., and T. Rowe Price Trust Company |
| | | |
| Heather K. McPherson, CPA (1967) | | Vice President, T. Rowe Price and T. Rowe Price |
| Vice President | | Group, Inc. |
| | | |
| David Oestreicher (1967) | | Director, Vice President, and Secretary, |
| Vice President | | T. Rowe Price Investment Services, Inc., T. Rowe |
| | Price Retirement Plan Services, Inc., T. Rowe |
| | Price Services, Inc., and T. Rowe Price Trust |
| | Company; Chief Legal Officer, Vice President, |
| | and Secretary, T. Rowe Price Group, Inc.; Vice |
| | President and Secretary, T. Rowe Price and |
| | T. Rowe Price International; Vice President, |
| | Price Hong Kong and Price Singapore |
| | |
| Robert T. Quinn, Jr. (1972) | | Vice President, T. Rowe Price and T. Rowe Price |
| Vice President | | Group, Inc. |
| | |
| John W. Ratzesberger (1975) | | Vice President, T. Rowe Price, T. Rowe Price |
| Vice President | | Group, Inc., and T. Rowe Price Trust Company; |
| | formerly, North American Head of Listed |
| | Derivatives Operation, Morgan Stanley |
| | (to 2013) |
| | |
| Deborah D. Seidel (1962) | | Vice President, T. Rowe Price, T. Rowe Price |
| Vice President | | Group, Inc., T. Rowe Price Investment Services, |
| | Inc., and T. Rowe Price Services, Inc. |
| | |
| Gabriel Solomon (1977) | | Vice President, T. Rowe Price and T. Rowe Price |
| Vice President | | Group, Inc. |
| | |
| Joshua K. Spencer, CFA (1973) | | Vice President, T. Rowe Price and T. Rowe Price |
| Vice President | | Group, Inc. |
| | |
| Tamara P. Wiggs (1979) | | Vice President, T. Rowe Price and T. Rowe Price |
| Vice President | | Group, Inc. |
| | |
| Jeffrey T. Zoller (1970) | | Vice President, T. Rowe Price, T. Rowe Price |
| Vice President | | International, and T. Rowe Price Trust Company |
| |
| Unless otherwise noted, officers have been employees of T. Rowe Price or T. Rowe Price International for at least 5 years. |
Item 2. Code of Ethics.
The registrant has adopted a code of ethics, as defined in Item 2 of Form N-CSR, applicable to its principal executive officer, principal financial officer, principal accounting officer or controller, or persons performing similar functions. A copy of this code of ethics is filed as an exhibit to this Form N-CSR. No substantive amendments were approved or waivers were granted to this code of ethics during the period covered by this report.
Item 3. Audit Committee Financial Expert.
The registrant’s Board of Directors/Trustees has determined that Mr. Bruce W. Duncan qualifies as an audit committee financial expert, as defined in Item 3 of Form N-CSR. Mr. Duncan is considered independent for purposes of Item 3 of Form N-CSR.
Item 4. Principal Accountant Fees and Services.
(a) – (d) Aggregate fees billed for the last two fiscal years for professional services rendered to, or on behalf of, the registrant by the registrant’s principal accountant were as follows:

Audit fees include amounts related to the audit of the registrant’s annual financial statements and services normally provided by the accountant in connection with statutory and regulatory filings. Audit-related fees include amounts reasonably related to the performance of the audit of the registrant’s financial statements and specifically include the issuance of a report on internal controls and, if applicable, agreed-upon procedures related to fund acquisitions. Tax fees include amounts related to services for tax compliance, tax planning, and tax advice. The nature of these services specifically includes the review of distribution calculations and the preparation of Federal, state, and excise tax returns. All other fees include the registrant’s pro-rata share of amounts for agreed-upon procedures in conjunction with service contract approvals by the registrant’s Board of Directors/Trustees.
(e)(1) The registrant’s audit committee has adopted a policy whereby audit and non-audit services performed by the registrant’s principal accountant for the registrant, its investment adviser, and any entity controlling, controlled by, or under common control with the investment adviser that provides ongoing services to the registrant require pre-approval in advance at regularly scheduled audit committee meetings. If such a service is required between regularly scheduled audit committee meetings, pre-approval may be authorized by one audit committee member with ratification at the next scheduled audit committee meeting. Waiver of pre-approval for audit or non-audit services requiring fees of a de minimis amount is not permitted.
(2) No services included in (b) – (d) above were approved pursuant to paragraph (c)(7)(i)(C) of Rule 2-01 of Regulation S-X.
(f) Less than 50 percent of the hours expended on the principal accountant’s engagement to audit the registrant’s financial statements for the most recent fiscal year were attributed to work performed by persons other than the principal accountant’s full-time, permanent employees.
(g) The aggregate fees billed for the most recent fiscal year and the preceding fiscal year by the registrant’s principal accountant for non-audit services rendered to the registrant, its investment adviser, and any entity controlling, controlled by, or under common control with the investment adviser that provides ongoing services to the registrant were $2,158,000 and $2,283,000, respectively.
(h) All non-audit services rendered in (g) above were pre-approved by the registrant’s audit committee. Accordingly, these services were considered by the registrant’s audit committee in maintaining the principal accountant’s independence.
Item 5. Audit Committee of Listed Registrants.
Not applicable.
Item 6. Investments.
(a) Not applicable. The complete schedule of investments is included in Item 1 of this Form N-CSR.
(b) Not applicable.
Item 7. Disclosure of Proxy Voting Policies and Procedures for Closed-End Management Investment Companies.
Not applicable.
Item 8. Portfolio Managers of Closed-End Management Investment Companies.
Not applicable.
Item 9. Purchases of Equity Securities by Closed-End Management Investment Company and Affiliated Purchasers.
Not applicable.
Item 10. Submission of Matters to a Vote of Security Holders.
Not applicable.
Item 11. Controls and Procedures.
(a) The registrant’s principal executive officer and principal financial officer have evaluated the registrant’s disclosure controls and procedures within 90 days of this filing and have concluded that the registrant’s disclosure controls and procedures were effective, as of that date, in ensuring that information required to be disclosed by the registrant in this Form N-CSR was recorded, processed, summarized, and reported timely.
(b) The registrant’s principal executive officer and principal financial officer are aware of no change in the registrant’s internal control over financial reporting that occurred during the registrant’s second fiscal quarter covered by this report that has materially affected, or is reasonably likely to materially affect, the registrant’s internal control over financial reporting.
Item 12. Exhibits.
(a)(1) The registrant’s code of ethics pursuant to Item 2 of Form N-CSR is attached.
(2) Separate certifications by the registrant's principal executive officer and principal financial officer, pursuant to Section 302 of the Sarbanes-Oxley Act of 2002 and required by Rule 30a-2(a) under the Investment Company Act of 1940, are attached.
(3) Written solicitation to repurchase securities issued by closed-end companies: not applicable.
(b) A certification by the registrant's principal executive officer and principal financial officer, pursuant to Section 906 of the Sarbanes-Oxley Act of 2002 and required by Rule 30a-2(b) under the Investment Company Act of 1940, is attached.
SIGNATURES
Pursuant to the requirements of the Securities Exchange Act of 1934 and the Investment Company Act of 1940, the registrant has duly caused this report to be signed on its behalf by the undersigned, thereunto duly authorized.
T. Rowe Price Value Fund, Inc.
| | By | /s/ Edward C. Bernard |
| | Edward C. Bernard |
| | Principal Executive Officer |
| |
| Date February 17, 2016 | | |
Pursuant to the requirements of the Securities Exchange Act of 1934 and the Investment Company Act of 1940, this report has been signed below by the following persons on behalf of the registrant and in the capacities and on the dates indicated.
| | By | /s/ Edward C. Bernard |
| | Edward C. Bernard |
| | Principal Executive Officer |
| |
| Date February 17, 2016 | | |
| |
| |
| By | /s/ Catherine D. Mathews |
| | Catherine D. Mathews |
| | Principal Financial Officer |
| |
| Date February 17, 2016 | | |