UNITED STATES
SECURITIES AND EXCHANGE COMMISSION
Washington, D.C. 20549
FORM N-CSR
CERTIFIED SHAREHOLDER REPORT OF REGISTERED
MANAGEMENT INVESTMENT COMPANIES
Investment Company Act File Number: 811-07209
| T. Rowe Price Value Fund, Inc. |
|
| (Exact name of registrant as specified in charter) |
| |
| 100 East Pratt Street, Baltimore, MD 21202 |
|
| (Address of principal executive offices) |
| |
| David Oestreicher |
| 100 East Pratt Street, Baltimore, MD 21202 |
|
| (Name and address of agent for service) |
Registrant’s telephone number, including area code: (410) 345-2000
Date of fiscal year end: December 31
Date of reporting period: December 31, 2013
Item 1. Report to Shareholders
| Value Fund | December 31, 2013 |
The views and opinions in this report were current as of December 31, 2013. They are not guarantees of performance or investment results and should not be taken as investment advice. Investment decisions reflect a variety of factors, and the managers reserve the right to change their views about individual stocks, sectors, and the markets at any time. As a result, the views expressed should not be relied upon as a forecast of the fund’s future investment intent. The report is certified under the Sarbanes-Oxley Act, which requires mutual funds and other public companies to affirm that, to the best of their knowledge, the information in their financial reports is fairly and accurately stated in all material respects.
REPORTS ON THE WEB
Sign up for our E-mail Program, and you can begin to receive updated fund reports and prospectuses online rather than through the mail. Log in to your account at troweprice.com for more information.
Manager’s Letter
Fellow Shareholders
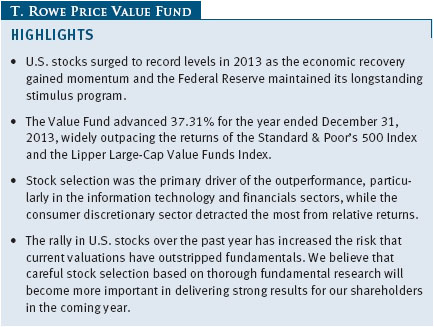
U.S. stocks surged in 2013 as the economic recovery gained momentum. Growing evidence of a stronger economy helped overcome concerns about a reduction in Federal Reserve stimulus, the threat of a U.S. default, and a federal government shutdown in the year’s second half. Major large-cap indexes rose to record highs as the year ended. The S&P 500 Index recorded its best year since 1997, while the Dow Jones Industrial Average posted its biggest annual gain since 1995. In this environment, your fund produced excellent gains and outperformed its benchmark.
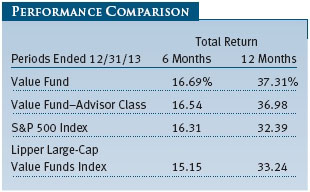
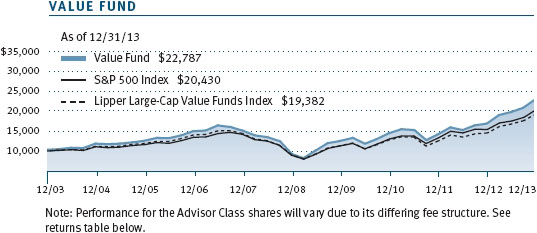
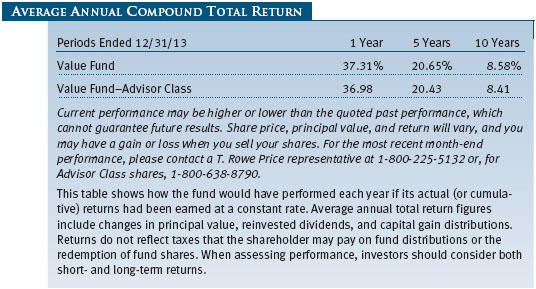
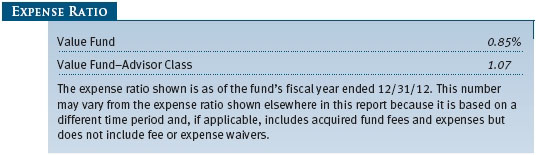
The Value Fund returned 16.69% and 37.31% over the six and 12 months ended December 31, 2013, respectively, exceeding the return of its benchmark, the S&P 500, and of its peer group, the Lipper Large-Cap Value Funds Index, over both periods. (Returns for Advisor Class shares reflect their different fee structure.) Since your fund’s inception in 1994, it has outpaced both the market and Lipper peer group by posting an annualized gain of 11.49% as compared with the S&P 500 gain of 9.52% and the Lipper index’s gain of 8.72%. The fund’s long-term performance versus its peers remains outstanding. The Value Fund is in the top 10% of its Lipper peer group for the trailing 1-, 3-, 5-, and 10-year periods. Based on cumulative total return, Lipper ranked the fund 30 of 472, 29 of 417, 3 of 368, and 15 of 237 large-cap value funds for the 1-, 3-, 5-, and 10-year periods ended December 31, 2013, respectively. (Current performance may be higher or lower than the quoted past performance, which cannot guarantee future results. Share price, principal value, and return will vary, and you may have a gain or loss when you sell your shares. To obtain the most recent month-end performance, please call 1-800-225-5132 or go to troweprice.com.) The fund’s expense ratio was 0.85% as of its fiscal year ended December 31, 2012.
MARKET ENVIRONMENT
The U.S. economy improved gradually over 2013 but still faster than many expected. Third-quarter gross domestic product grew at a revised annualized 4.1% rate, its strongest pace in two years. The jobless rate fell steadily and averaged 7.4% for 2013, its lowest level since 2008. Most of the monthly declines, however, resulted from people leaving the workforce as opposed to new job creation, and the level of long-term unemployed workers stayed stubbornly high. The housing market continued its solid recovery. Home prices across the country advanced, though the housing market slowed over the summer as mortgage rates rose. The Fed continued to play an influential role in swaying market sentiment. After alarming investors by signaling in the spring that it might soon wind down its monthly $85 billion asset purchase program, the Fed surprised markets by announcing in September it would maintain the pace of its purchases after all. In December, Fed Chairman Ben Bernanke said the central bank would reduce its asset purchases by $10 billion to $75 billion in January 2014—the first step in the Fed’s long-awaited taper of its stimulus program.
All sectors in the S&P 500 Index produced double-digit returns in 2013. Consumer discretionary, health care, and industrials and business services performed the best, with each sector surging more than 40%. Financials returned more than 35%. Information technology, consumer staples, materials, and energy each returned more than 20% but lagged the index. Telecommunication services stocks rose the least, advancing a relatively modest 11.5%, followed by utilities, which added 13.2%. These last two sectors—which pay the highest dividend yields in the S&P 500—fared well in early 2013 as investors sought defensive stocks with solid dividends in a low interest rate environment. But they suffered in the spring as yields surged after the Fed telegraphed its intention to start tapering, leading investors to sell high-yielding stocks in favor of greater returns in the bond market. Value slightly trailed growth stocks in the large-cap universe for the year, according to various Russell indexes.
PORTFOLIO REVIEW
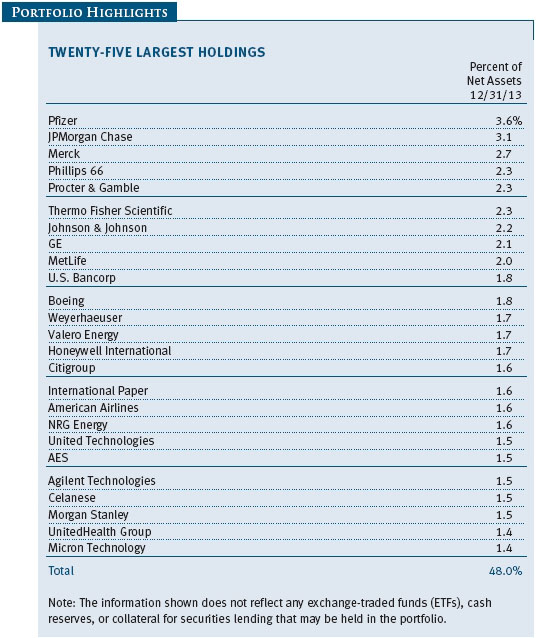
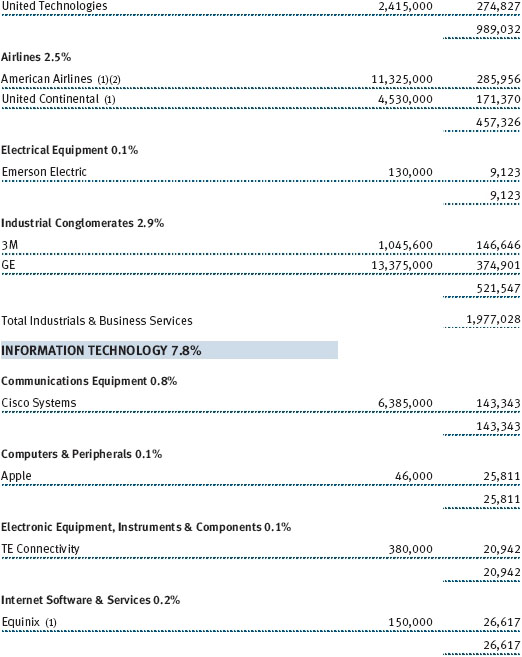
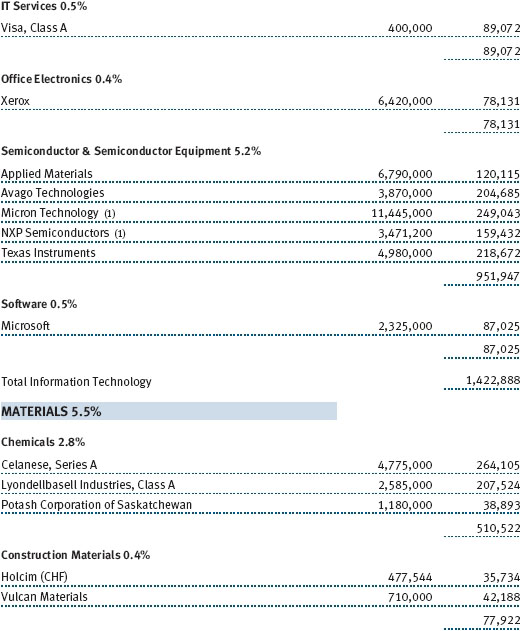
Information technology contributed the most to relative returns in 2013, led by semiconductor maker Micron Technology, whose shares more than tripled amid industry consolidation and an expected increase in memory chip prices. Micron operates in a highly volatile industry, but we believed that more rational supply/demand dynamics in the chip market and the 2012 acquisition of a former Japanese rival would greatly improve its profitability. Our investment thesis was borne out in the fall, when Micron posted earnings that exceeded many analysts’ forecasts. (Please refer to our portfolio of investments for a complete list of holdings and the amount each represents in the portfolio.)
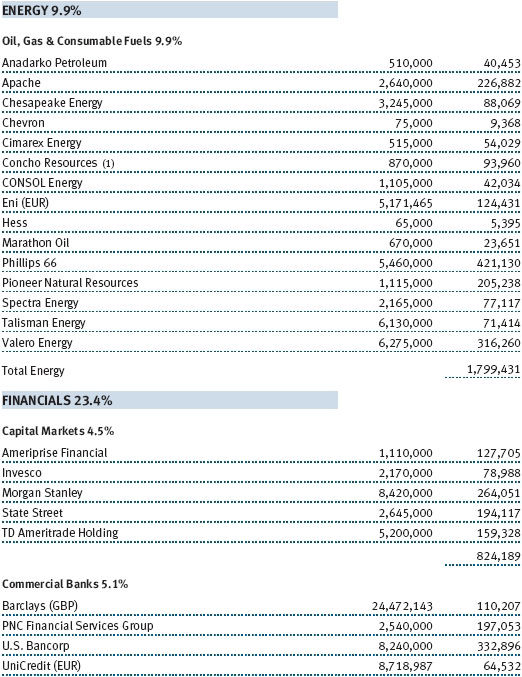
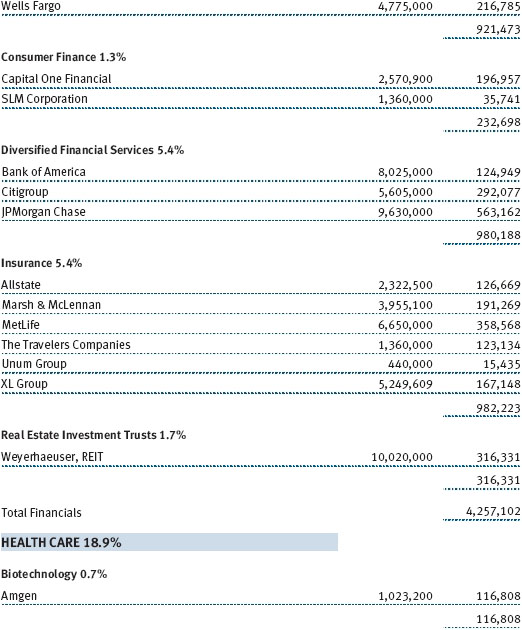
Financial stocks also contributed significantly to performance, led by JPMorgan Chase. Despite being the subject of unfavorable coverage for various civil and criminal investigations, JPMorgan shares rallied to multiyear highs as the U.S. economy strengthened and its earnings rose. JPMorgan paid roughly $20 billion in settlements in the past year, but investors have reacted positively to its efforts to resolve pending legal issues. Given the runup in its shares, we reduced our JPMorgan position, but the bank remains one of our largest holdings.
MetLife, the biggest U.S. life insurer, was another large contributor. We believe MetLife is a solid business operating in a tough environment. Over the past decade, MetLife accumulated a large portfolio of interest rate hedges that has helped offset the impact of low interest rates, which have made it hard for insurers to earn worthwhile returns on their investments. Additionally, MetLife has been focused on expanding its presence in fast-growing emerging markets, which we believe will drive earnings growth over the long term. Our rationale for holding MetLife was rewarded after it raised its dividend for the first time since 2007 and reported solid earnings over the year. In light of the rally in MetLife shares—up roughly 67% in 2013—we elected to trim our position size, but the company remains a significant holding.
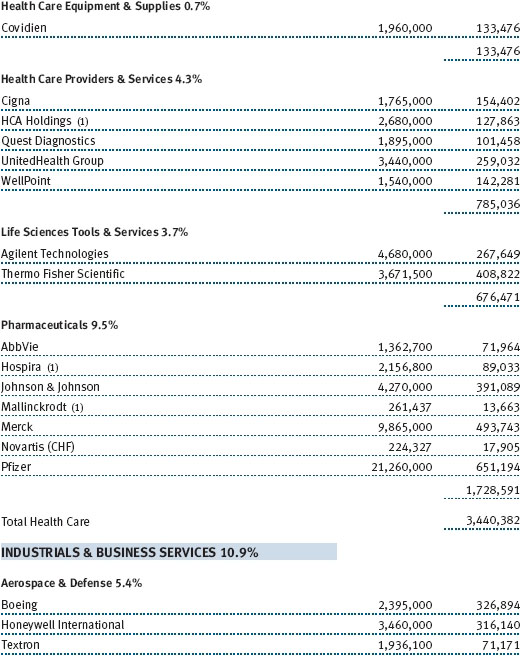
Other notable contributors include lab equipment maker Thermo Fisher Scientific and aerospace leader Boeing. Thermo Fisher announced in April that it would acquire Life Technologies, a maker of genetic sequencing technology, in a deal that will expand its reach in the promising field of DNA-based medical testing. Boeing shares surged as it reported stronger-than-expected earnings and generated impressive cash flow amid soaring aircraft demand. Boeing has more than $15 billion in cash on its balance sheet, and in December the board approved a 50% dividend increase and $10 billion to buy back its shares over the next several years.
Stock selection proved less helpful in consumer discretionary, the biggest detractor from relative returns. Apollo Education Group was a sizable detractor. Apollo shares have performed poorly since early 2012 amid flagging enrollment and increased scrutiny of the for-profit college industry. We anticipated that the number of new students at Apollo would stabilize in 2013; unfortunately, this failed to happen and we eliminated our position. Sizable detractors in other sectors included medical testing services company Quest Diagnostics, which suffered from lower volume and a decline in insurers’ reimbursement rates for many of its core testing services, and Potash Corporation of Saskatchewan, whose shares sank after the collapse of a potash-producing cartel in Europe caused prices of the chemical to slump. We continue to hold both companies due to our belief that their risk/reward profiles are compelling at current valuations.
PORTFOLIO STRATEGY AND CHANGES
To put our portfolio changes in perspective, we believe it is important to review the investment strategy we use in managing your fund. Our goal is to invest in companies with attractive relative valuations and favorable long-term fundamentals. We see ourselves as investors, not speculators, and have a longer-term time horizon when we make our decisions. We focus a great deal on understanding the potential return and risk associated with a given company. Our approach is predicated on identifying companies where we believe the investment’s implicit upside is significantly greater than its inherent risk. We particularly favor companies that generate strong free cash flow and are trading at a discount to our estimated sum-of-the-parts valuation. While we may not always be right, if we can successfully identify companies with asymmetric return potential, then we should be able to outperform the market and our peers over the long term.
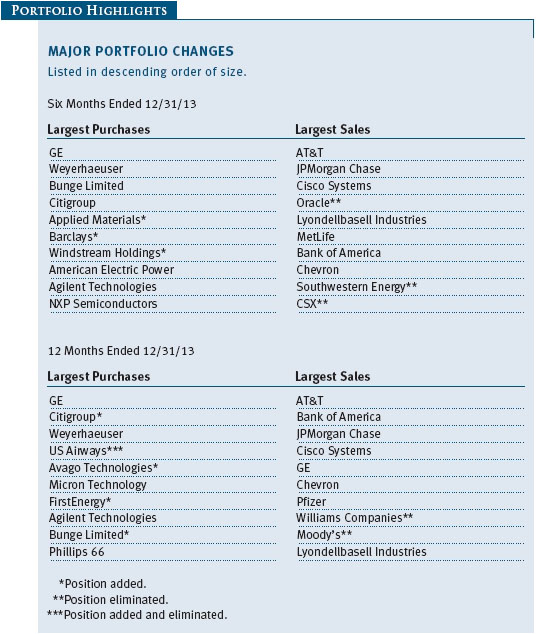
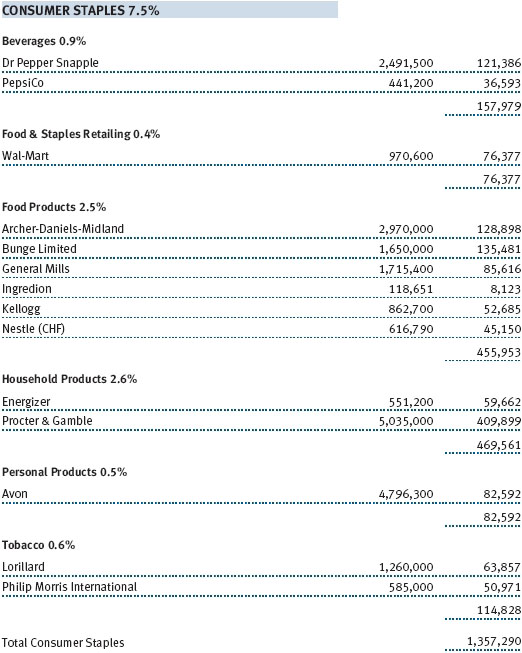
Over the past year, we made some sizable purchases in consumer staples following a sell-off in agricultural commodities. We added to our stake in grain processing company Archer Daniels Midland and initiated positions in Bunge Limited and Ingredion. Grain processing companies are uniquely positioned to take advantage of lower grain prices through their ability to process and transport grain and grain products. Bunge, a leading trader and transporter of grains and oilseeds, has struggled due to flagging performance in its sugar business, but we believe the company’s new chief executive is taking the necessary steps to rationalize Bunge’s business units and improve capital allocation decisions. Ingredion, which makes starches and sweeteners, has lagged because it makes high fructose corn syrup, an ingredient being targeted by health experts, but we believe it will also benefit from lower grain prices. The company generates strong free cash flow, has historically been a good capital allocator, and pays an attractive dividend.
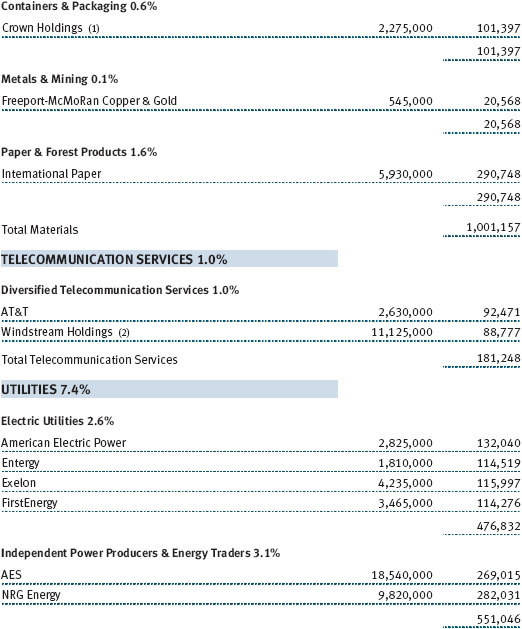
We were also active buyers in utilities, which lagged the broader market in 2013. We initiated a position in FirstEnergy, one of the largest regulated U.S. utilities. FirstEnergy shares have suffered due to disappointing earnings guidance, an expected dividend cut, and the potential need to raise equity. We believe that much of the downside risk is already reflected in FirstEnergy’s shares, however, and that the company will benefit from renewed power demand.
Our views on energy prices informed many investment decisions over the past year. Based on close collaboration with our energy analysts, we believe we are experiencing a technological revolution in onshore oil discovery in the U.S. that will result in a meaningful and prolonged increase in oil supply. This increased supply, on top of the large supply of natural gas discovered in recent years, should lead to lower energy prices over time. As a result, we have focused on higher-quality energy and production companies with access to abundant, low-cost oil and natural gas sources. We added to positions in Pioneer Natural Resources, a leader in the onshore oil shale revolution, and Apache. Apache has faced concerns about its Egypt operations but has made smart decisions in monetizing its assets and has exposure to some attractive onshore plays in North America.
Our views on declining energy prices also led us to seek companies that stand to benefit from lower commodity prices. For example, refinery companies Phillips 66 and Valero Energy—which both ranked among the year’s top contributors—should continue to benefit from their ability to buy cheaper oil sourced in North America and refine it into products sold on global markets. We initiated positions in the airline and leisure cruise industries, theorizing that these businesses would also benefit from lower fuel prices. We bought US Airways in anticipation of its now completed merger with American Airlines. After making concessions to satisfy antitrust regulators, the companies announced their merger in November, the latest mega-merger in an industry that has undergone major consolidation since 2008. Cruise companies have also experienced consolidation, which should pave the way for slower supply growth and improved pricing. The changing industry landscape partly drove our decision to own Carnival, despite the negative coverage of the company following a series of tragic mishaps at sea. Carnival pays an attractive dividend, plans to buy back its stock, and recently finished a lengthy period of capital spending that should lead to higher free cash flow growth. A new chief executive who started in July also gave us confidence in the company’s outlook.
Our sales in 2013 largely resulted from trimming or eliminating names whose shares reached levels that accurately reflected their fundamentals. We reduced positions in AT&T, JPMorgan Chase, Pfizer, and LyondellBasell Industries. We eliminated our holdings in Moody’s, one of the fund’s strongest performers since we initiated the position in 2010.
OUTLOOK
We are pleased with the stock market’s stellar performance in 2013, but the magnitude of the rally has tempered our expectations for continued gains in the near term. Much of the credit for the stock market advance goes to the Fed, whose efforts to suppress interest rates and pump money into the economy encouraged investors to buy higher-risk assets. Looking ahead, there are reasons to be cautiously optimistic about the economy. A bipartisan budget deal passed in December will soften the impact from spending cuts and tax hikes that hurt growth in 2013. More importantly, the deal promises to end a pattern of fiscal instability and brinkmanship that have unsettled financial markets since 2011.
Despite an improved economic outlook, we remain concerned that the rally may have outpaced the recovery. Given the disparity between the S&P 500’s rally and the relatively modest pace of expected earnings growth of its underlying companies, we believe valuations have generally become much less appealing than they were at the start of 2013. It is our belief that companies will need to deliver solid earnings growth to see further gains. As the Fed gradually winds down its stimulus program, fundamental factors like corporate earnings, cash flow, and jobs growth should become more important in assessing the health of individual companies and the overall economy. The transition from a liquidity-driven to a fundamentals-driven market underscores the unique attributes of our investment strategy, which relies on rigorous analysis and careful stock selection. Indeed, we believe this renewed emphasis on traditional indicators plays into T. Rowe Price’s longstanding strengths in fundamental research and positions your fund for long-term outperformance.
Thank you for investing with T. Rowe Price.
Respectfully submitted,

Mark S. Finn
President of the fund and chairman of its Investment Advisory Committee
January 18, 2014
The committee chairman has day-to-day responsibility for managing the portfolio and works with committee members in developing and executing the fund’s investment program.
RISKS OF INVESTING IN THE FUND
Value investors seek to invest in companies whose stock prices are low in relation to their real worth or future prospects. By identifying companies whose stocks are currently out of favor or misunderstood, value investors hope to realize significant appreciation as other investors recognize the stock’s intrinsic value and the price rises accordingly. The value approach carries the risk that the market will not recognize a security’s intrinsic value for a long time or that a stock judged to be undervalued may actually be appropriately priced.
GLOSSARY
Gross domestic product: The total market value of all goods and services produced in a country in a given year.
Lipper index: An index of mutual fund performance returns for specified periods in categories defined by Lipper Inc.
S&P 500 Index: A market cap-weighted index of 500 widely held stocks often used as a proxy for the overall stock market. Performance is reported on a total return basis.
Note: Russell Investment Group is the source and owner of the trademarks, service marks, and copyrights related to the Russell indexes. Russell® is a trademark of Russell Investment Group.
Performance and Expenses
This chart shows the value of a hypothetical $10,000 investment in the fund over the past 10 fiscal year periods or since inception (for funds lacking 10-year records). The result is compared with benchmarks, which may include a broad-based market index and a peer group average or index. Market indexes do not include expenses, which are deducted from fund returns as well as mutual fund averages and indexes.
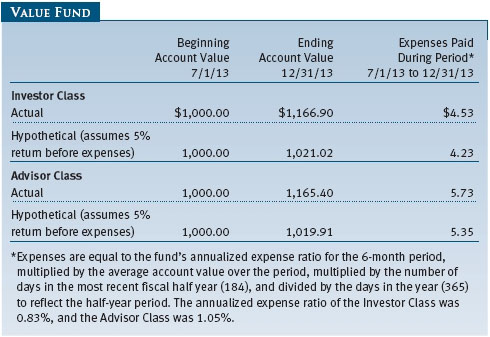
As a mutual fund shareholder, you may incur two types of costs: (1) transaction costs, such as redemption fees or sales loads, and (2) ongoing costs, including management fees, distribution and service (12b-1) fees, and other fund expenses. The following example is intended to help you understand your ongoing costs (in dollars) of investing in the fund and to compare these costs with the ongoing costs of investing in other mutual funds. The example is based on an investment of $1,000 invested at the beginning of the most recent six-month period and held for the entire period.
Please note that the fund has two share classes: The original share class (Investor Class) charges no distribution and service (12b-1) fee, and the Advisor Class shares are offered only through unaffiliated brokers and other financial intermediaries and charge a 0.25% 12b-1 fee. Each share class is presented separately in the table.
Actual Expenses
The first line of the following table (Actual) provides information about actual account values and expenses based on the fund’s actual returns. You may use the information on this line, together with your account balance, to estimate the expenses that you paid over the period. Simply divide your account value by $1,000 (for example, an $8,600 account value divided by $1,000 = 8.6), then multiply the result by the number on the first line under the heading “Expenses Paid During Period” to estimate the expenses you paid on your account during this period.
Hypothetical Example for Comparison Purposes
The information on the second line of the table (Hypothetical) is based on hypothetical account values and expenses derived from the fund’s actual expense ratio and an assumed 5% per year rate of return before expenses (not the fund’s actual return). You may compare the ongoing costs of investing in the fund with other funds by contrasting this 5% hypothetical example and the 5% hypothetical examples that appear in the shareholder reports of the other funds. The hypothetical account values and expenses may not be used to estimate the actual ending account balance or expenses you paid for the period.
Note: T. Rowe Price charges an annual account service fee of $20, generally for accounts with less than $10,000. The fee is waived for any investor whose T. Rowe Price mutual fund accounts total $50,000 or more; accounts electing to receive electronic delivery of account statements, transaction confirmations, prospectuses, and shareholder reports; or accounts of an investor who is a T. Rowe Price Preferred Services, Personal Services, or Enhanced Personal Services client (enrollment in these programs generally requires T. Rowe Price assets of at least $100,000). This fee is not included in the accompanying table. If you are subject to the fee, keep it in mind when you are estimating the ongoing expenses of investing in the fund and when comparing the expenses of this fund with other funds.
You should also be aware that the expenses shown in the table highlight only your ongoing costs and do not reflect any transaction costs, such as redemption fees or sales loads. Therefore, the second line of the table is useful in comparing ongoing costs only and will not help you determine the relative total costs of owning different funds. To the extent a fund charges transaction costs, however, the total cost of owning that fund is higher.
The accompanying notes are an integral part of these financial statements.
The accompanying notes are an integral part of these financial statements.
The accompanying notes are an integral part of these financial statements.
The accompanying notes are an integral part of these financial statements.
The accompanying notes are an integral part of these financial statements.
The accompanying notes are an integral part of these financial statements.
| Notes to Financial Statements |
T. Rowe Price Value Fund, Inc. (the fund), is registered under the Investment Company Act of 1940 (the 1940 Act) as a diversified, open-end management investment company. The fund seeks to provide long-term capital appreciation by investing in common stocks believed to be undervalued. Income is a secondary objective. The fund has two classes of shares: the Value Fund original share class, referred to in this report as the Investor Class, offered since September 30, 1994, and the Value Fund–Advisor Class (Advisor Class), offered since March 31, 2000. Advisor Class shares are sold only through unaffiliated brokers and other unaffiliated financial intermediaries that are compensated by the class for distribution, shareholder servicing, and/or certain administrative services under a Board-approved Rule 12b-1 plan. Each class has exclusive voting rights on matters related solely to that class; separate voting rights on matters that relate to both classes; and, in all other respects, the same rights and obligations as the other class.
NOTE 1 - SIGNIFICANT ACCOUNTING POLICIES
Basis of Preparation The fund is an investment company and follows accounting and reporting guidance in the Financial Accounting Standards Board Accounting Standards Codification Topic 946 (ASC 946). The accompanying financial statements were prepared in accordance with accounting principles generally accepted in the United States of America (GAAP), including but not limited to ASC 946. GAAP requires the use of estimates made by management. Management believes that estimates and valuations are appropriate; however, actual results may differ from those estimates, and the valuations reflected in the accompanying financial statements may differ from the value ultimately realized upon sale or maturity.
Investment Transactions, Investment Income, and Distributions Income and expenses are recorded on the accrual basis. Dividends received from mutual fund investments are reflected as dividend income; capital gain distributions are reflected as realized gain/loss. Dividend income and capital gain distributions are recorded on the ex-dividend date. Income tax-related interest and penalties, if incurred, would be recorded as income tax expense. Investment transactions are accounted for on the trade date. Realized gains and losses are reported on the identified cost basis. Distributions to shareholders are recorded on the ex-dividend date. Income distributions are declared and paid by each class annually. Capital gain distributions, if any, are generally declared and paid by the fund annually.
Currency Translation Assets, including investments, and liabilities denominated in foreign currencies are translated into U.S. dollar values each day at the prevailing exchange rate, using the mean of the bid and asked prices of such currencies against U.S. dollars as quoted by a major bank. Purchases and sales of securities, income, and expenses are translated into U.S. dollars at the prevailing exchange rate on the date of the transaction. The effect of changes in foreign currency exchange rates on realized and unrealized security gains and losses is reflected as a component of security gains and losses.
Class Accounting The Advisor Class pays distribution, shareholder servicing, and/or certain administrative expenses in the form of Rule 12b-1 fees, in an amount not exceeding 0.25% of the class’s average daily net assets. Shareholder servicing, prospectus, and shareholder report expenses incurred by each class are charged directly to the class to which they relate. Expenses common to both classes, investment income, and realized and unrealized gains and losses are allocated to the classes based upon the relative daily net assets of each class.
Rebates and Credits Subject to best execution, the fund may direct certain security trades to brokers who have agreed to rebate a portion of the related brokerage commission to the fund in cash. Commission rebates are reflected as realized gain on securities in the accompanying financial statements and totaled $426,000 for the year ended December 31, 2013. Additionally, the fund earns credits on temporarily uninvested cash balances held at the custodian, which reduce the fund’s custody charges. Custody expense in the accompanying financial statements is presented before reduction for credits.
In-Kind Redemptions In accordance with guidelines described in the fund’s prospectus, the fund may distribute portfolio securities rather than cash as payment for a redemption of fund shares (in-kind redemption). For financial reporting purposes, the fund recognizes a gain on in-kind redemptions to the extent the value of the distributed securities on the date of redemption exceeds the cost of those securities. Gains and losses realized on in-kind redemptions are not recognized for tax purposes and are reclassified from undistributed realized gain (loss) to paid-in capital. During the year ended December 31, 2013, the fund realized $254,685,000 of net gain on $677,721,000 of in-kind redemptions.
New Accounting Guidance On January 1, 2013, the fund adopted new accounting guidance, issued by the Financial Accounting Standards Board, that requires an entity to disclose information about offsetting and related arrangements to enable users of its financial statements to understand the effect of those arrangements on its financial position. Adoption had no effect on the fund’s net assets or results of operations.
NOTE 2 - VALUATION
The fund’s financial instruments are valued, and each class’s net asset value (NAV) per share is computed at the close of the New York Stock Exchange (NYSE), normally 4 p.m. ET, each day the NYSE is open for business.
Fair Value The fund’s financial instruments are reported at fair value, which GAAP defines as the price that would be received to sell an asset or paid to transfer a liability in an orderly transaction between market participants at the measurement date. The T. Rowe Price Valuation Committee (the Valuation Committee) has been established by the fund’s Board of Directors (the Board) to ensure that financial instruments are appropriately priced at fair value in accordance with GAAP and the 1940 Act. Subject to oversight by the Board, the Valuation Committee develops and oversees pricing-related policies and procedures and approves all fair value determinations. Specifically, the Valuation Committee establishes procedures to value securities; determines pricing techniques, sources, and persons eligible to effect fair value pricing actions; oversees the selection, services, and performance of pricing vendors; oversees valuation-related business continuity practices; and provides guidance on internal controls and valuation-related matters. The Valuation Committee reports to the fund’s Board; is chaired by the fund’s treasurer; and has representation from legal, portfolio management and trading, operations, and risk management.
Various valuation techniques and inputs are used to determine the fair value of financial instruments. GAAP establishes the following fair value hierarchy that categorizes the inputs used to measure fair value:
Level 1 – quoted prices (unadjusted) in active markets for identical financial instruments that the fund can access at the reporting date
Level 2 – inputs other than Level 1 quoted prices that are observable, either directly or indirectly (including, but not limited to, quoted prices for similar financial instruments in active markets, quoted prices for identical or similar financial instruments in inactive markets, interest rates and yield curves, implied volatilities, and credit spreads)
Level 3 – unobservable inputs
Observable inputs are developed using market data, such as publicly available information about actual events or transactions, and reflect the assumptions that market participants would use to price the financial instrument. Unobservable inputs are those for which market data are not available and are developed using the best information available about the assumptions that market participants would use to price the financial instrument. GAAP requires valuation techniques to maximize the use of relevant observable inputs and minimize the use of unobservable inputs. When multiple inputs are used to derive fair value, the financial instrument is assigned to the level within the fair value hierarchy based on the lowest-level input that is significant to the fair value of the financial instrument. Input levels are not necessarily an indication of the risk or liquidity associated with financial instruments at that level but rather the degree of judgment used in determining those values.
Valuation Techniques Equity securities listed or regularly traded on a securities exchange or in the over-the-counter (OTC) market are valued at the last quoted sale price or, for certain markets, the official closing price at the time the valuations are made. OTC Bulletin Board securities are valued at the mean of the closing bid and asked prices. A security that is listed or traded on more than one exchange is valued at the quotation on the exchange determined to be the primary market for such security. Listed securities not traded on a particular day are valued at the mean of the closing bid and asked prices for domestic securities and the last quoted sale or closing price for international securities.
For valuation purposes, the last quoted prices of non-U.S. equity securities may be adjusted to reflect the fair value of such securities at the close of the NYSE. If the fund determines that developments between the close of a foreign market and the close of the NYSE will, in its judgment, materially affect the value of some or all of its portfolio securities, the fund will adjust the previous quoted prices to reflect what it believes to be the fair value of the securities as of the close of the NYSE. In deciding whether it is necessary to adjust quoted prices to reflect fair value, the fund reviews a variety of factors, including developments in foreign markets, the performance of U.S. securities markets, and the performance of instruments trading in U.S. markets that represent foreign securities and baskets of foreign securities. The fund may also fair value securities in other situations, such as when a particular foreign market is closed but the fund is open. The fund uses outside pricing services to provide it with quoted prices and information to evaluate or adjust those prices. The fund cannot predict how often it will use quoted prices and how often it will determine it necessary to adjust those prices to reflect fair value. As a means of evaluating its security valuation process, the fund routinely compares quoted prices, the next day’s opening prices in the same markets, and adjusted prices.
Actively traded domestic equity securities generally are categorized in Level 1 of the fair value hierarchy. Non-U.S. equity securities generally are categorized in Level 2 of the fair value hierarchy despite the availability of quoted prices because, as described above, the fund evaluates and determines whether those quoted prices reflect fair value at the close of the NYSE or require adjustment. OTC Bulletin Board securities, certain preferred securities, and equity securities traded in inactive markets generally are categorized in Level 2 of the fair value hierarchy.
Investments in mutual funds are valued at the mutual fund’s closing NAV per share on the day of valuation and are categorized in Level 1 of the fair value hierarchy. Assets and liabilities other than financial instruments, including short-term receivables and payables, are carried at cost, or estimated realizable value, if less, which approximates fair value.
Thinly traded financial instruments and those for which the above valuation procedures are inappropriate or are deemed not to reflect fair value are stated at fair value as determined in good faith by the Valuation Committee. The objective of any fair value pricing determination is to arrive at a price that could reasonably be expected from a current sale. Financial instruments fair valued by the Valuation Committee are primarily private placements, restricted securities, warrants, rights, and other securities that are not publicly traded.
Subject to oversight by the Board, the Valuation Committee regularly makes good faith judgments to establish and adjust the fair valuations of certain securities as events occur and circumstances warrant. For instance, in determining the fair value of an equity investment with limited market activity, such as a private placement or a thinly traded public company stock, the Valuation Committee considers a variety of factors, which may include, but are not limited to, the issuer’s business prospects, its financial standing and performance, recent investment transactions in the issuer, new rounds of financing, negotiated transactions of significant size between other investors in the company, relevant market valuations of peer companies, strategic events affecting the company, market liquidity for the issuer, and general economic conditions and events. In consultation with the investment and pricing teams, the Valuation Committee will determine an appropriate valuation technique based on available information, which may include both observable and unobservable inputs. The Valuation Committee typically will afford greatest weight to actual prices in arm’s length transactions, to the extent they represent orderly transactions between market participants; transaction information can be reliably obtained; and prices are deemed representative of fair value. However, the Valuation Committee may also consider other valuation methods such as market-based valuation multiples; a discount or premium from market value of a similar, freely traded security of the same issuer; or some combination. Fair value determinations are reviewed on a regular basis and updated as information becomes available, including actual purchase and sale transactions of the issue. Because any fair value determination involves a significant amount of judgment, there is a degree of subjectivity inherent in such pricing decisions, and fair value prices determined by the Valuation Committee could differ from those of other market participants. Depending on the relative significance of unobservable inputs, including the valuation technique(s) used, fair valued securities may be categorized in Level 2 or 3 of the fair value hierarchy.
Valuation Inputs The following table summarizes the fund’s financial instruments, based on the inputs used to determine their fair values on December 31, 2013:
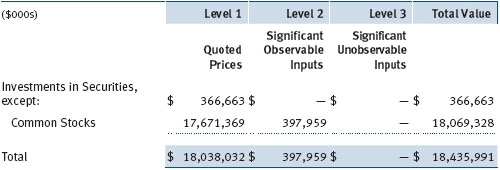
There were no material transfers between Levels 1 and 2 during the year.
NOTE 3 - OTHER INVESTMENT TRANSACTIONS
Consistent with its investment objective, the fund engages in the following practices to manage exposure to certain risks and/or to enhance performance. The investment objective, policies, program, and risk factors of the fund are described more fully in the fund’s prospectus and Statement of Additional Information.
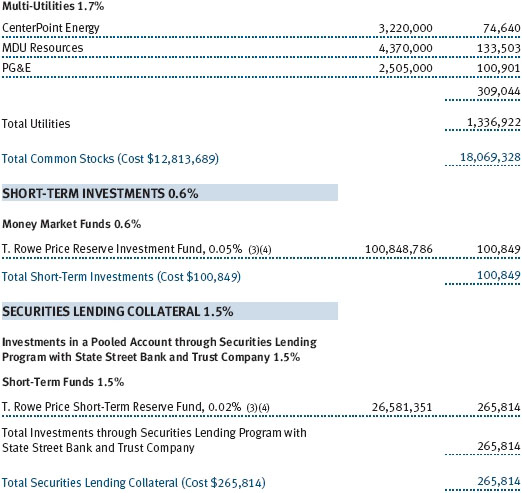
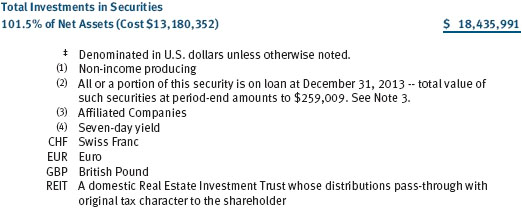
Securities Lending The fund lends its securities to approved brokers to earn additional income. Its securities lending activities are administered by a lending agent in accordance with a securities lending agreement. It receives collateral in the form of cash or U.S. government securities, valued at 102% to 105% of the value of the securities on loan. Collateral is maintained over the life of the loan in an amount not less than the value of loaned securities; any additional collateral required due to changes in security values is delivered to the fund the next business day. Cash collateral is invested by the lending agent(s) in accordance with investment guidelines approved by fund management. Additionally, the lending agent indemnifies the fund against losses resulting from borrower default. Although risk is mitigated by the collateral and indemnification, the fund could experience a delay in recovering its securities and a possible loss of income or value if the borrower fails to return the securities, collateral investments decline in value and the lending agent fails to perform. Securities lending revenue consists of earnings on invested collateral and borrowing fees, net of any rebates to the borrower, compensation to the lending agent, and other administrative costs. In accordance with GAAP, investments made with cash collateral are reflected in the accompanying financial statements, but collateral received in the form of securities is not. At December 31, 2013, the value of loaned securities was $259,009,000; the value of cash collateral and related investments was $265,814,000.
Other Purchases and sales of portfolio securities other than short-term securities aggregated $6,873,624,000 and $7,017,338,000, respectively, for the year ended December 31, 2013.
NOTE 4 - FEDERAL INCOME TAXES
No provision for federal income taxes is required since the fund intends to continue to qualify as a regulated investment company under Subchapter M of the Internal Revenue Code and distribute to shareholders all of its taxable income and gains. Distributions determined in accordance with federal income tax regulations may differ in amount or character from net investment income and realized gains for financial reporting purposes. Financial reporting records are adjusted for permanent book/tax differences to reflect tax character but are not adjusted for temporary differences.
The fund files U.S. federal, state, and local tax returns as required. The fund’s tax returns are subject to examination by the relevant tax authorities until expiration of the applicable statute of limitations, which is generally three years after the filing of the tax return but which can be extended to six years in certain circumstances. Tax returns for open years have incorporated no uncertain tax positions that require a provision for income taxes.
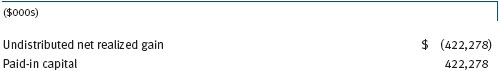
Reclassifications to paid-in capital relate primarily to redemptions in kind and a tax practice that treats a portion of the proceeds from each redemption of capital shares as a distribution of taxable net investment income or realized capital gain. For the year ended December 31, 2013, the following reclassifications were recorded to reflect tax character (there was no impact on results of operations or net assets):
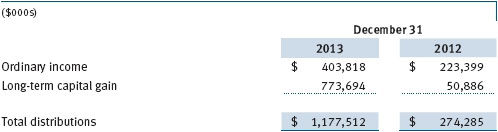
Distributions during the years ended December 31, 2013 and December 31, 2012, were characterized for tax purposes as follows:
At December 31, 2013, the tax-basis cost of investments and components of net assets were as follows:
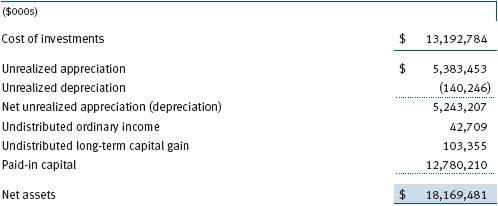
The difference between book-basis and tax-basis net unrealized appreciation (depreciation) is attributable to the deferral of losses from wash sales for tax purposes.
NOTE 5 - RELATED PARTY TRANSACTIONS
The fund is managed by T. Rowe Price Associates, Inc. (Price Associates), a wholly owned subsidiary of T. Rowe Price Group, Inc. (Price Group). The investment management agreement between the fund and Price Associates provides for an annual investment management fee, which is computed daily and paid monthly. The fee consists of an individual fund fee, equal to 0.35% of the fund’s average daily net assets, and a group fee. The group fee rate is calculated based on the combined net assets of certain mutual funds sponsored by Price Associates (the group) applied to a graduated fee schedule, with rates ranging from 0.48% for the first $1 billion of assets to 0.275% for assets in excess of $400 billion. The fund’s group fee is determined by applying the group fee rate to the fund’s average daily net assets. At December 31, 2013, the effective annual group fee rate was 0.29%.
In addition, the fund has entered into service agreements with Price Associates and two wholly owned subsidiaries of Price Associates (collectively, Price). Price Associates computes the daily share prices and provides certain other administrative services to the fund. T. Rowe Price Services, Inc., provides shareholder and administrative services in its capacity as the fund’s transfer and dividend-disbursing agent. T. Rowe Price Retirement Plan Services, Inc., provides subaccounting and recordkeeping services for certain retirement accounts invested in the Investor Class. For the year ended December 31, 2013, expenses incurred pursuant to these service agreements were $110,000 for Price Associates; $750,000 for T. Rowe Price Services, Inc.; and $1,047,000 for T. Rowe Price Retirement Plan Services, Inc. The total amount payable at period-end pursuant to these service agreements is reflected as Due to Affiliates in the accompanying financial statements.
Additionally, the fund is one of several mutual funds in which certain college savings plans managed by Price Associates may invest. As approved by the fund’s Board of Directors, shareholder servicing costs associated with each college savings plan are borne by the fund in proportion to the average daily value of its shares owned by the college savings plan. For the year ended December 31, 2013, the fund was charged $515,000 for shareholder servicing costs related to the college savings plans, of which $413,000 was for services provided by Price. The amount payable at period-end pursuant to this agreement is reflected as Due to Affiliates in the accompanying financial statements. At December 31, 2013, approximately 2% of the outstanding shares of the Investor Class were held by college savings plans.
The fund is also one of several mutual funds sponsored by Price Associates (underlying Price funds) in which the T. Rowe Price Spectrum Funds (Spectrum Funds), as well as the T. Rowe Price Retirement Funds and T. Rowe Price Target Retirement Funds (Retirement Funds) may invest. Neither the Spectrum Funds nor the Retirement Funds invest in the underlying Price funds for the purpose of exercising management or control. Pursuant to separate special servicing agreements, expenses associated with the operation of the Spectrum Funds and Retirement Funds are borne by each underlying Price fund to the extent of estimated savings to it and in proportion to the average daily value of its shares owned by the Spectrum Funds and Retirement Funds, respectively. Expenses allocated under these agreements are reflected as shareholder servicing expenses in the accompanying financial statements. For the year ended December 31, 2013, the fund was allocated $570,000 of Spectrum Funds’ expenses and $23,642,000 of Retirement Funds’ expenses. Of these amounts, $12,061,000 related to services provided by Price. At period-end, the amount payable to Price pursuant to this agreement is reflected as Due to Affiliates in the accompanying financial statements. At December 31, 2013, approximately 3% of the outstanding shares of the Investor Class were held by the Spectrum Funds and 75% were held by the Retirement Funds.
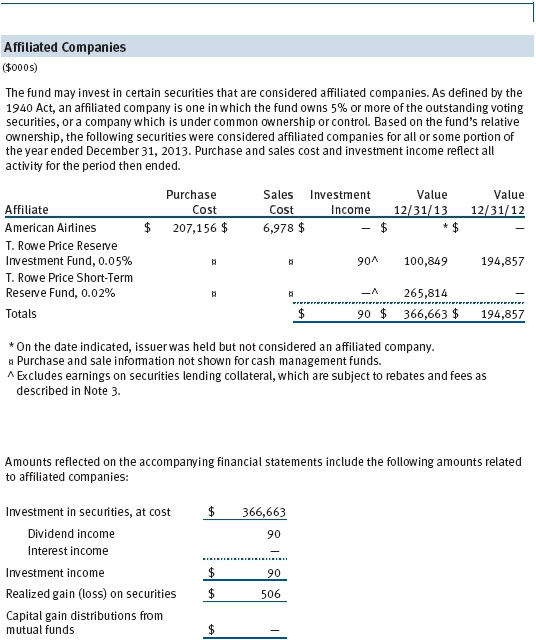
The fund may invest in the T. Rowe Price Reserve Investment Fund, the T. Rowe Price Government Reserve Investment Fund, or the T. Rowe Price Short-Term Reserve Fund (collectively, the Price Reserve Investment Funds), open-end management investment companies managed by Price Associates and considered affiliates of the fund. The Price Reserve Investment Funds are offered as short-term investment options to mutual funds, trusts, and other accounts managed by Price Associates or its affiliates and are not available for direct purchase by members of the public. The Price Reserve Investment Funds pay no investment management fees.
As of December 31, 2013, T. Rowe Price Group, Inc., or its wholly owned subsidiaries owned 1,424,654 shares of the Investor Class, representing less than 1% of the fund’s net assets.
| Report of Independent Registered Public Accounting Firm |
To the Board of Directors and Shareholders of
T. Rowe Price Value Fund, Inc.
In our opinion, the accompanying statement of assets and liabilities, including the portfolio of investments, and the related statements of operations and of changes in net assets and the financial highlights present fairly, in all material respects, the financial position of T. Rowe Price Value Fund, Inc. (the “Fund”) at December 31, 2013, and the results of its operations, the changes in its net assets and the financial highlights for each of the periods indicated therein, in conformity with accounting principles generally accepted in the United States of America. These financial statements and financial highlights (hereafter referred to as “financial statements”) are the responsibility of the Fund’s management; our responsibility is to express an opinion on these financial statements based on our audits. We conducted our audits of these financial statements in accordance with the standards of the Public Company Accounting Oversight Board (United States). Those standards require that we plan and perform the audit to obtain reasonable assurance about whether the financial statements are free of material misstatement. An audit includes examining, on a test basis, evidence supporting the amounts and disclosures in the financial statements, assessing the accounting principles used and significant estimates made by management, and evaluating the overall financial statement presentation. We believe that our audits, which included confirmation of securities at December 31, 2013 by correspondence with the custodian and brokers, and confirmation of the underlying funds by correspondence with the transfer agent, provide a reasonable basis for our opinion.
PricewaterhouseCoopers LLP
Baltimore, Maryland
February 14, 2014
| Tax Information (Unaudited) for the Tax Year Ended 12/31/13 |
We are providing this information as required by the Internal Revenue Code. The amounts shown may differ from those elsewhere in this report because of differences between tax and financial reporting requirements.
The fund’s distributions to shareholders included:
- $249,277,000 from short-term capital gains,
- $893,160,000 from long-term capital gains, subject to the 15% rate gains category.
For taxable non-corporate shareholders, $337,122,000 of the fund’s income represents qualified dividend income subject to the 15% rate category.
For corporate shareholders, $309,058,000 of the fund’s income qualifies for the dividends-received deduction.
| Information on Proxy Voting Policies, Procedures, and Records |
A description of the policies and procedures used by T. Rowe Price funds and portfolios to determine how to vote proxies relating to portfolio securities is available in each fund’s Statement of Additional Information. You may request this document by calling 1-800-225-5132 or by accessing the SEC’s website, sec.gov.
The description of our proxy voting policies and procedures is also available on our website, troweprice.com. To access it, click on the words “Social Responsibility” at the top of our corporate homepage. Next, click on the words “Conducting Business Responsibly” on the left side of the page that appears. Finally, click on the words “Proxy Voting Policies” on the left side of the page that appears.
Each fund’s most recent annual proxy voting record is available on our website and through the SEC’s website. To access it through our website, follow the above directions to reach the “Conducting Business Responsibly” page. Click on the words “Proxy Voting Records” on the left side of that page, and then click on the “View Proxy Voting Records” link at the bottom of the page that appears.
| How to Obtain Quarterly Portfolio Holdings |
The fund files a complete schedule of portfolio holdings with the Securities and Exchange Commission for the first and third quarters of each fiscal year on Form N-Q. The fund’s Form N-Q is available electronically on the SEC’s website (sec.gov); hard copies may be reviewed and copied at the SEC’s Public Reference Room, 100 F St. N.E., Washington, DC 20549. For more information on the Public Reference Room, call 1-800-SEC-0330.
| About the Fund’s Directors and Officers |
Your fund is overseen by a Board of Directors (Board) that meets regularly to review a wide variety of matters affecting or potentially affecting the fund, including performance, investment programs, compliance matters, advisory fees and expenses, service providers, and business and regulatory affairs. The Board elects the fund’s officers, who are listed in the final table. At least 75% of the Board’s members are independent of T. Rowe Price Associates, Inc. (T. Rowe Price), and its affiliates; “inside” or “interested” directors are employees or officers of T. Rowe Price. The business address of each director and officer is 100 East Pratt Street, Baltimore, Maryland 21202. The Statement of Additional Information includes additional information about the fund directors and is available without charge by calling a T. Rowe Price representative at 1-800-638-5660.
| Independent Directors | | |
| |
| Name | | |
| (Year of Birth) | | |
| Year Elected* | | |
| [Number of T. Rowe Price | | Principal Occupation(s) and Directorships of Public Companies and |
| Portfolios Overseen] | | Other Investment Companies During the Past Five Years |
| | | |
| William R. Brody, M.D., Ph.D. | | President and Trustee, Salk Institute for Biological Studies (2009 |
| (1944) | | to present); Director, Novartis, Inc. (2009 to present); Director, IBM |
| 2009 | | (2007 to present); President and Trustee, Johns Hopkins University |
| [157] | | (1996 to 2009); Chairman of Executive Committee and Trustee, |
| | Johns Hopkins Health System (1996 to 2009) |
| | | |
| Anthony W. Deering | | Chairman, Exeter Capital, LLC, a private investment firm (2004 to |
| (1945) | | present); Director and Member of the Advisory Board, Deutsche |
| 2001 | | Bank North America (2004 to present); Director, Under Armour |
| [157] | | (2008 to present); Director, Vornado Real Estate Investment Trust |
| | (2004 to 2012) |
| | | |
| Donald W. Dick, Jr. | | Principal, EuroCapital Partners, LLC, an acquisition and management |
| (1943) | | advisory firm (1995 to present) |
| 1994 | | |
| [157] | | |
| | | |
| Bruce W. Duncan | | President, Chief Executive Officer, and Director, First Industrial Realty |
| (1951) | | Trust, owner and operator of industrial properties (2009 to present); |
| 2013 | | Chairman of the Board (2005 to present), Interim Chief Executive |
| [157] | | Officer (2007), and Director (1999 to present), Starwood Hotels & |
| | Resorts, a hotel and leisure company; Senior Advisor, Kohlberg, |
| | Kravis, Roberts & Co. LP, a global investment firm (2008 to 2009); |
| | Trustee, Starwood Lodging Trust, a real estate investment trust and |
| | former subsidiary of Starwood (1995 to 2006) |
| | | |
| Robert J. Gerrard, Jr. | | Advisory Board Member, Pipeline Crisis/Winning Strategies (1997 |
| (1952) | | to present); Chairman of Compensation Committee and Director, |
| 2012 | | Syniverse Holdings, Inc. (2008 to 2011); Executive Vice President |
| [157] | | and General Counsel, Scripps Networks, LLC (1997 to 2009) |
| | | |
| Karen N. Horn | | Limited Partner and Senior Managing Director, Brock Capital Group, |
| (1943) | | an advisory and investment banking firm (2004 to present); Director, |
| 2003 | | Eli Lilly and Company (1987 to present); Director, Simon Property |
| [157] | | Group (2004 to present); Director, Norfolk Southern (2008 to |
| | present); Director, Fannie Mae (2006 to 2008) |
| | | |
| Paul F. McBride | | Former Company Officer and Senior Vice President, Human Resources |
| (1956) | | and Corporate Initiatives (2004 to 2010) |
| 2013 | | |
| [157] | | |
| | | |
| Cecilia E. Rouse, Ph.D. | | Dean, Woodrow Wilson School (2012 to present); Professor and |
| (1963) | | Researcher, Princeton University (1992 to present); Director, MDRC |
| 2012 | | (2011 to present); Member, National Academy of Education (2010 |
| [157] | | to present); Research Associate, National Bureau of Economic |
| | Research’s Labor Studies Program (1998 to 2009 and 2011 to |
| | present); Member, President’s Council of Economic Advisors |
| | (2009 to 2011); Member, The MacArthur Foundation Network on |
| | the Transition to Adulthood and Public Policy (2000 to 2008); |
| | Member, National Advisory Committee for the Robert Wood |
| | Johnson Foundation’s Scholars in Health Policy Research Program |
| | (2008); Director and Member, National Economic Association |
| | (2006 to 2008); Member, Association of Public Policy Analysis and |
| | Management Policy Council (2006 to 2008); Member, Hamilton |
| | Project’s Advisory Board at The Brookings Institute (2006 to 2008); |
| | Chair of Committee on the Status of Minority Groups in the Economic |
| | Profession, American Economic Association (2006 to 2008 and |
| | 2012 to present) |
| | | |
| John G. Schreiber | | Owner/President, Centaur Capital Partners, Inc., a real estate |
| (1946) | | investment company (1991 to present); Cofounder and Partner, |
| 2001 | | Blackstone Real Estate Advisors, L.P. (1992 to present); Director, |
| [157] | | General Growth Properties, Inc. (2010 to present); Director, BXMT |
| | (formerly Capital Trust, Inc.), a real estate investment company |
| | (2012 to present); Director and Chairman of the Board, Brixmor |
| | Property Group, Inc. (2013 to present) |
| |
| Mark R. Tercek | | President and Chief Executive Officer, The Nature Conservancy (2008 |
| (1957) | | to present); Managing Director, The Goldman Sachs Group, Inc. |
| 2009 | | (1984 to 2008) |
| [157] | | |
| |
| *Each independent director serves until retirement, resignation, or election of a successor. |
| Inside Directors | | |
| |
| Name | | |
| (Year of Birth) | | |
| Year Elected* | | |
| [Number of T. Rowe Price | | Principal Occupation(s) and Directorships of Public Companies and |
| Portfolios Overseen] | | Other Investment Companies During the Past Five Years |
| | | |
| Edward C. Bernard | | Director and Vice President, T. Rowe Price; Vice Chairman of the |
| (1956) | | Board, Director, and Vice President, T. Rowe Price Group, Inc.; |
| 2006 | | Chairman of the Board, Director, and President, T. Rowe Price |
| [157] | | Investment Services, Inc.; Chairman of the Board and Director, |
| | T. Rowe Price Retirement Plan Services, Inc., and T. Rowe Price |
| | Services, Inc.; Chairman of the Board, Chief Executive Officer, |
| | and Director, T. Rowe Price International; Chairman of the Board, |
| | Chief Executive Officer, Director, and President, T. Rowe Price Trust |
| | Company; Chairman of the Board, all funds |
| | | |
| Brian C. Rogers, CFA, CIC | | Chief Investment Officer, Director, and Vice President, T. Rowe Price; |
| (1955) | | Chairman of the Board, Chief Investment Officer, Director, and Vice |
| 2006 | | President, T. Rowe Price Group, Inc.; Vice President, T. Rowe Price |
| [105] | | Trust Company; Vice President, Value Fund |
| |
| *Each inside director serves until retirement, resignation, or election of a successor. |
| Officers | | |
| |
| Name (Year of Birth) | | |
| Position Held With Value Fund | | Principal Occupation(s) |
| | | |
| Peter J. Bates, CFA (1974) | | Vice President, T. Rowe Price and T. Rowe Price |
| Vice President | | Group, Inc. |
| | | |
| Ryan N. Burgess, CFA (1974) | | Vice President, T. Rowe Price and T. Rowe Price |
| Vice President | | Group, Inc. |
| | | |
| Ira W. Carnahan, CFA (1963) | | Vice President, T. Rowe Price and T. Rowe Price |
| Vice President | | Group, Inc. |
| | | |
| Andrew S. Davis (1978) | | Vice President, T. Rowe Price and T. Rowe Price |
| Vice President | | Group, Inc.; formerly intern, Franklin Templeton |
| | Investments (to 2009) |
| | | |
| Roger L. Fiery III, CPA (1959) | | Vice President, Price Hong Kong, Price |
| Vice President | | Singapore, T. Rowe Price, T. Rowe Price Group, |
| | Inc., T. Rowe Price International, and T. Rowe |
| | Price Trust Company |
| | | |
| Mark S. Finn, CFA, CPA (1963) | | Vice President, T. Rowe Price, T. Rowe Price |
| President | | Group, Inc., and T. Rowe Price Trust Company |
| | | |
| John R. Gilner (1961) | | Chief Compliance Officer and Vice President, |
| Chief Compliance Officer | | T. Rowe Price; Vice President, T. Rowe Price |
| | Group, Inc., and T. Rowe Price Investment |
| | Services, Inc. |
| | | |
| David R. Giroux, CFA (1975) | | Vice President, T. Rowe Price, T. Rowe Price |
| Vice President | | Group, Inc., and T. Rowe Price Trust Company |
| | | |
| Gregory S. Golczewski (1966) | | Vice President, T. Rowe Price and T. Rowe Price |
| Vice President | | Trust Company |
| | | |
| Gregory K. Hinkle, CPA (1958) | | Vice President, T. Rowe Price, T. Rowe Price |
| Treasurer | | Group, Inc., and T. Rowe Price Trust Company |
| | | |
| John D. Linehan, CFA (1965) | | Vice President, T. Rowe Price, T. Rowe Price |
| Vice President | | Group, Inc., and T. Rowe Price Trust Company |
| | | |
| Patricia B. Lippert (1953) | | Assistant Vice President, T. Rowe Price and |
| Secretary | | T. Rowe Price Investment Services, Inc. |
| | | |
| Heather K. McPherson, CPA (1967) | | Vice President, T. Rowe Price and T. Rowe Price |
| Vice President | | Group, Inc. |
| | | |
| David Oestreicher (1967) | | Director, Vice President, and Secretary, T. Rowe |
| Vice President | | Price Investment Services, Inc., T. Rowe |
| | Price Retirement Plan Services, Inc., T. Rowe |
| | Price Services, Inc., and T. Rowe Price Trust |
| | Company; Chief Legal Officer, Vice President, |
| | and Secretary, T. Rowe Price Group, Inc.; Vice |
| | President and Secretary, T. Rowe Price and |
| | T. Rowe Price International; Vice President, |
| | Price Hong Kong and Price Singapore |
| | | |
| Robert T. Quinn, Jr. (1972) | | Vice President, T. Rowe Price and T. Rowe Price |
| Vice President | | Group, Inc. |
| | | |
| Deborah D. Seidel (1962) | | Vice President, T. Rowe Price, T. Rowe Price |
| Vice President | | Group, Inc., T. Rowe Price Investment Services, |
| | Inc., and T. Rowe Price Services, Inc. |
| | | |
| Joshua K. Spencer, CFA (1973) | | Vice President, T. Rowe Price and T. Rowe Price |
| Vice President | | Group, Inc. |
| | | |
| Walter P. Stuart III, CFA (1960) | | Vice President, T. Rowe Price and T. Rowe Price |
| Vice President | | Group, Inc. |
| | | |
| Eric L. Veiel, CFA (1972) | | Vice President, T. Rowe Price and T. Rowe Price |
| Vice President | | Group, Inc. |
| | | |
| Julie L. Waples (1970) | | Vice President, T. Rowe Price |
| Vice President | | |
| | | |
| Tamara P. Wiggs (1979) | | Vice President, T. Rowe Price and T. Rowe Price |
| Vice President | | Group, Inc. |
| |
| Unless otherwise noted, officers have been employees of T. Rowe Price or T. Rowe Price International for at least 5 years. |
Item 2. Code of Ethics.
The registrant has adopted a code of ethics, as defined in Item 2 of Form N-CSR, applicable to its principal executive officer, principal financial officer, principal accounting officer or controller, or persons performing similar functions. A copy of this code of ethics is filed as an exhibit to this Form N-CSR. No substantive amendments were approved or waivers were granted to this code of ethics during the period covered by this report.
Item 3. Audit Committee Financial Expert.
The registrant’s Board of Directors/Trustees has determined that Mr. Anthony W. Deering qualifies as an audit committee financial expert, as defined in Item 3 of Form N-CSR. Mr. Deering is considered independent for purposes of Item 3 of Form N-CSR.
Item 4. Principal Accountant Fees and Services.
(a) – (d) Aggregate fees billed for the last two fiscal years for professional services rendered to, or on behalf of, the registrant by the registrant’s principal accountant were as follows:
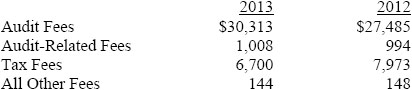
Audit fees include amounts related to the audit of the registrant’s annual financial statements and services normally provided by the accountant in connection with statutory and regulatory filings. Audit-related fees include amounts reasonably related to the performance of the audit of the registrant’s financial statements and specifically include the issuance of a report on internal controls and, if applicable, agreed-upon procedures related to fund acquisitions. Tax fees include amounts related to services for tax compliance, tax planning, and tax advice. The nature of these services specifically includes the review of distribution calculations and the preparation of Federal, state, and excise tax returns. All other fees include the registrant’s pro-rata share of amounts for agreed-upon procedures in conjunction with service contract approvals by the registrant’s Board of Directors/Trustees.
(e)(1) The registrant’s audit committee has adopted a policy whereby audit and non-audit services performed by the registrant’s principal accountant for the registrant, its investment adviser, and any entity controlling, controlled by, or under common control with the investment adviser that provides ongoing services to the registrant require pre-approval in advance at regularly scheduled audit committee meetings. If such a service is required between regularly scheduled audit committee meetings, pre-approval may be authorized by one audit committee member with ratification at the next scheduled audit committee meeting. Waiver of pre-approval for audit or non-audit services requiring fees of a de minimis amount is not permitted.
(2) No services included in (b) – (d) above were approved pursuant to paragraph (c)(7)(i)(C) of Rule 2-01 of Regulation S-X.
(f) Less than 50 percent of the hours expended on the principal accountant’s engagement to audit the registrant’s financial statements for the most recent fiscal year were attributed to work performed by persons other than the principal accountant’s full-time, permanent employees.
(g) The aggregate fees billed for the most recent fiscal year and the preceding fiscal year by the registrant’s principal accountant for non-audit services rendered to the registrant, its investment adviser, and any entity controlling, controlled by, or under common control with the investment adviser that provides ongoing services to the registrant were $1,691,000 and $1,802,000, respectively.
(h) All non-audit services rendered in (g) above were pre-approved by the registrant’s audit committee. Accordingly, these services were considered by the registrant’s audit committee in maintaining the principal accountant’s independence.
Item 5. Audit Committee of Listed Registrants.
Not applicable.
Item 6. Investments.
(a) Not applicable. The complete schedule of investments is included in Item 1 of this Form N-CSR.
(b) Not applicable.
Item 7. Disclosure of Proxy Voting Policies and Procedures for Closed-End Management Investment Companies.
Not applicable.
Item 8. Portfolio Managers of Closed-End Management Investment Companies.
Not applicable.
Item 9. Purchases of Equity Securities by Closed-End Management Investment Company and Affiliated Purchasers.
Not applicable.
Item 10. Submission of Matters to a Vote of Security Holders.
Not applicable.
Item 11. Controls and Procedures.
(a) The registrant’s principal executive officer and principal financial officer have evaluated the registrant’s disclosure controls and procedures within 90 days of this filing and have concluded that the registrant’s disclosure controls and procedures were effective, as of that date, in ensuring that information required to be disclosed by the registrant in this Form N-CSR was recorded, processed, summarized, and reported timely.
(b) The registrant’s principal executive officer and principal financial officer are aware of no change in the registrant’s internal control over financial reporting that occurred during the registrant’s second fiscal quarter covered by this report that has materially affected, or is reasonably likely to materially affect, the registrant’s internal control over financial reporting.
Item 12. Exhibits.
(a)(1) The registrant’s code of ethics pursuant to Item 2 of Form N-CSR is attached.
(2) Separate certifications by the registrant's principal executive officer and principal financial officer, pursuant to Section 302 of the Sarbanes-Oxley Act of 2002 and required by Rule 30a-2(a) under the Investment Company Act of 1940, are attached.
(3) Written solicitation to repurchase securities issued by closed-end companies: not applicable.
(b) A certification by the registrant's principal executive officer and principal financial officer, pursuant to Section 906 of the Sarbanes-Oxley Act of 2002 and required by Rule 30a-2(b) under the Investment Company Act of 1940, is attached.
SIGNATURES
Pursuant to the requirements of the Securities Exchange Act of 1934 and the Investment Company Act of 1940, the registrant has duly caused this report to be signed on its behalf by the undersigned, thereunto duly authorized.
T. Rowe Price Value Fund, Inc.
| | By | /s/ Edward C. Bernard |
| | Edward C. Bernard |
| | Principal Executive Officer |
| |
| Date February 14, 2014 | | |
Pursuant to the requirements of the Securities Exchange Act of 1934 and the Investment Company Act of 1940, this report has been signed below by the following persons on behalf of the registrant and in the capacities and on the dates indicated.
| | By | /s/ Edward C. Bernard |
| | Edward C. Bernard |
| | Principal Executive Officer |
| |
| Date February 14, 2014 | | |
| |
| |
| By | /s/ Gregory K. Hinkle |
| | Gregory K. Hinkle |
| | Principal Financial Officer |
| |
| Date February 14, 2014 | | |