Filed by Koninklijke Ahold N.V.
Pursuant to Rule 425 under the Securities Act of 1933
Subject Company: Delhaize Group
Commission File No.: 333-13302
Date: November 12, 2015
Ahold November 11, 2015 Interim Report Third quarter 2015 Zaandam, the Netherlands Ahold today published its interim report for the third quarter of 2015. Highlights of the third quarter are: Strong sales performance, with Group sales up 13.0% (up 1.7% at constant exchange rates) Sales excluding gas up 3.3% at constant exchange rates Underlying operating income increased to 319 million; underlying operating margin at 3.8% Strong free cash flow of 230 million, up 160 million Identical sales in the Netherlands up 4.0%, reflecting positive sales trends at Albert Heijn and in online Underlying sales trends in the United States continued to improve, with identical sales growth of 1.8% excluding gas, adjusted for competitive disruption last year Agreement reached for Stop & Shop to acquire 25 A&P stores in New York CEO Dick Boer said: The Group delivered a strong performance during the third quarter and we are pleased to report an increase in sales, operating income and net income, as well as a strong free cash flow. We made further progress against our strategic priorities and the investments in our brands are strengthening our customer proposition across all of our markets. In recognition of our continued commitment to responsible retailing, Ahold was included in the Dow Jones Sustainability World Index for the seventh consecutive year. “In the Netherlands, the strength of the Albert Heijn brand continues to drive positive sales trends and we were particularly pleased with the increase in identical store sales. Our strategy to focus on quality and assortment improvements led to an increase in transactions and market share gains. Our market- leading Dutch online businesses, Albert Heijn Online and bol.com, grew net consumer sales by over 30%, and in the United States, Peapod?s performance improved, reporting double-digit sales growth. We rolled out our enhanced customer proposition in the U.S. to additional stores during the quarter and as a result, we saw an improved underlying sales performance across our divisions. “Looking ahead, we are on track to deliver a full year performance in line with expectations and to complete the proposed merger with Delhaize by mid-2016. This combination will create a stronger international food retailer for the benefit of our customers, associates and shareholders.” Group performance million, except per share data Q3 2015 Q3 2014 % change% change constant rates Q3 YTD 2015 Q3 YTD 2014 % change% change constant rates Net sales 8,440 7,472 13.0% 1.7 % 28,417 24,713 15.0% 2.0 % Underlying operating income 319 285 11.9% 1.0 % 1,040 965 7.8%(4.0)% Underlying operating margin 3.8% 3.8% 3.7% 3.9% Operating income 284 274 3.6%(6.9)% 931 914 1.9%(9.6)% Income from continuing operations 189 177 6.8%(4.9)% 595 570 4.4%(6.9)% Net income1 189 178 6.2%(5.3)% 597 375 59.2% 52.6 % continuing operations 0.23 0.21 9.5%(1.7)% 0.72 0.64 12.5% 1.4 % 1 Net income in Q3 YTD 2014 included a charge of 192 million recorded in discontinued operations representing the net of the tax settlement amount and associated legal fees for the Waterbury litigation. Press Office: +31 88 659 5134 Investor Relations: +31 88 659 5213 www.ahold.com Follow us on Twitter: @AholdNews Page 1/22
Ahold Interim report, Third quarter 2015 Management report Performance by segment Ahold USA € million Q3 2015 Q3 2014 % change% change constant rates Q3 YTD 2015 Q3 YTD 2014 % change% change constant rates Net sales 5,248 4,501 16.6 %(1.4)% 17,672 14,768 19.7 %(1.3)% Underlying operating income 212 169 25.4 % 6.8 % 681 558 22.0 % 0.8 % Underlying operating margin 4.0 % 3.8% 3.9 % 3.8 % Identical sales growth(1.8)% 0.7%(1.7)%(0.3)% Identical sales growth excluding gasoline 0.4 % 1.2% 0.7 %(0.2)% Comparable sales growth excluding gasoline 0.6 % 1.3% 0.8 %(0.1)% Underlying sales trends in the United States continued to improve, with identical sales growth of 1.8% excluding gas and adjusted for last year’s sales uplift as a result of a business disruption at one of the Stop & Shop New England division’s main competitors. Total third quarter net sales of €5,248 million were up 16.6%. As a result of lower gas sales this was 1.4% lower than last year at constant exchange rates. Excluding gas, net sales at constant exchange rates were 0.8% higher than last year, while reported identical sales growth excluding gas was 0.4%. As part of our program to improve our customer proposition, we are continuing the roll-out of our new produce department format, launching it to another 149 stores during the quarter, bringing the total to 316 stores. We are encouraged by the volume uplift that we see in the converted produce departments. With the exception of Stop & Shop New England, volume market share grew in comparison to last year. Our online business Peapod improved the capacity usage at its newest distribution facility and achieved double-digit sales growth. Ahold USA’s underlying operating margin stood at 4.0%, up 0.2 percentage points from the same quarter last year. The improvement reflects stronger operational performance across our business, driven by our Simplicity program, and reflects sourcing savings, improved labor efficiency and stronger shrink performance. Lower gas sales, due to falling gas prices, with a higher margin had a positive impact on the operating margin, but were more than offset by lower reimbursements on pharmacy products. On July 20, Stop & Shop New York Metro entered into a conditional agreement to acquire stores from A&P. On October 8, 2015, all conditions had been met and we commenced the purchase of the 25 stores. The conversion of the stores is ongoing, with the final group of stores expected to be converted in mid-November. The Netherlands € million Q3 2015 Q3 2014 % change Q3 YTD 2015 Q3 YTD 2014 % change Net sales 2,796 2,604 7.4% 9,434 8,857 6.5 % Underlying operating income 129 127 1.6% 425 439(3.2)% Underlying operating margin 4.6% 4.9 % 4.5% 5.0 % Identical sales growth 4.0%(1.1)% 3.2%(1.4)% Comparable sales growth 4.5%(0.8)% 3.7%(1.2)% Our business in the Netherlands continued its positive sales trend, with third quarter net sales of €2,796 million, an increase of 7.4% compared to last year, or 4.0% on an identical sales basis. Higher volumes at Albert Heijn were driven by an increased number of transactions, which resulted in a higher market share than last year. Volume growth was particularly strong for our Fresh assortment. Page 2/22
Ahold Interim report, Third quarter 2015 Management report At Albert Heijn we continue to respond to what customers want and we improved our customer proposition through quality and assortment improvements across all categories. We also introduced innovative concepts, such as a fully self-scan store, the Allerhande meal box and approximately 1,000 new products this year, in addition to offering attractive promotions. In addition to the identical sales growth, net sales growth versus last year benefited from the conversion of former C1000 stores in the Netherlands and the opening of new Albert Heijn stores in Belgium. During the quarter we opened our 33rd store in Belgium. The underlying operating margin of the Netherlands, excluding bol.com, was 5.1% (Q3 2014: 5.2%). Excluding the impact of higher pension costs, as a result of lower interest rates, margin excluding bol.com was slightly higher compared to last year. The margin increase was driven by an improvement at our Albert Heijn supermarkets, primarily as a result of increased sales and Simplicity cost savings. Our online operations, bol.com and Albert Heijn Online, achieved a net consumer sales growth of over 30%, as we continue to invest in strengthening our leading position as an online retailer. Bol.com recorded especially strong sales growth versus last year for both its Plaza platform and in Belgium, with bol.com now offering an assortment of 10 million products. Sales growth at Albert Heijn Online was primarily the result of attracting new customers in our existing market areas. The additional investments in our online businesses have diluted our year-to-date margin in line with our full-year expectations of 25 basis points. Czech Republic million Q3 2015 Q3 2014 % change% change constant rates Q3 YTD 2015 Q3 YTD 2014 % change% change constant rates Net sales 396 367 7.9% 5.5% 1,311 1,088 20.5 % 19.8 % Underlying operating income 5(1) nm nm 11 14(21.4)%(23.3)% Underlying operating margin 1.3 %(0.3)% 0.8 % 1.3 % Identical sales growth(1.3)%(3.2)%(0.8)%(2.0)% Identical sales growth excluding gasoline(0.7)%(2.0)%(0.5)%(1.3)% Comparable sales growth excluding gasoline (0.6)% (2.0)% (0.4)% (1.2)% Excluding gas, net sales at constant exchange rates were 6.4% higher than last year. Total third quarter net sales of 396 million were 5.5% higher than last year at constant exchange rates, driven by the inclusion of 49 SPAR stores acquired as of August 1, 2014. During the quarter, the former SPAR stores became part of our identical store base. Identical sales growth excluding gas was down by 0.7%, adversely affected by the larger former SPAR stores. Initiatives are being piloted and implemented to improve the performance of these stores. Excluding these stores, the Czech Republic posted positive identical sales growth driven by the performance of our supermarkets. During the quarter we finalized the antitrust requirement to divest five stores, related to the SPAR acquisition. The underlying operating margin of 1.3% included 1 million of non-recurring costs related to the SPAR integration this quarter (YTD Q3 2015: 7 million). Corporate Center Underlying Corporate Center costs were 27 million, an increase of 17 million over the prior year, of which 9 million relates to insurance activities (primarily reflecting a non-cash charge from lower discount rates). Page 3/22
Ahold Interim report, Third quarter 2015 Management report Outlook Our business performance remains on track to deliver in line with full year expectations. We expect free cash flow to be slightly ahead of last year, based on current exchange rates. Consistent with previous guidance, gross capital expenditure for 2015 is expected to be around 900 million, (2014: 732 million) including the capital required for the conversion of the acquired A&P stores in the United States. Financial review Third quarter 2015 (compared to third quarter 2014) Underlying operating income was 319 million; 34 million higher than last year. Underlying operating margin was 3.8%, which is unchanged from last year. Operating income increased by 10 million to 284 million. This included increased restructuring and related charges of 6 million, lower gains on the sale of assets of 4 million, lower impairments of 2 million, an 11 million charge resulting from the withdrawal from an Ahold USA multi-employer pension plan and a 5 million loss for a change in inventory valuation measurement technique in The Netherlands, when compared to Q3 2014. Restructuring and related charges in Q3 2015 included 12 million of costs incurred in connection with the planned merger with Delhaize and 1 million of pre-acquisition costs related to the former A&P stores in the U.S. In Q3 2014, restructuring and related charges of 7 million primarily related to the SPAR acquisition in the Czech Republic. Income from continuing operations was 189 million; 12 million higher than last year. This follows from the increase in operating income of 10 million. Net income was 189 million, up 11 million compared with last year. Free cash flow of 230 million increased by 160 million compared to Q3 2014. This increase was mainly driven by higher cash generated from continuing operations of 148 million and lower purchases of non-current assets of 23 million, offset by lower proceeds from the divestments of assets of 12 million. The increase in cash generated from continuing operations was predominantly due to favorable year-over-year changes in working capital of 127 million. Net debt decreased in Q3 2015 by 241 million to 1,222 million. The decrease was primarily due to the free cash flow of 230 million. First three quarters 2015 (compared to first three quarters 2014) Underlying operating income was 1,040 million, up 75 million from 965 million in 2014. Underlying operating margin was 3.7%, compared to 3.9% last year, mainly as a result of increased investments in our online businesses and the integration of SPAR in the Czech Republic. Operating income increased by 17 million to 931 million. This included, when compared to the first three quarters of 2014, increased restructuring and related charges of 34 million, higher impairments of 6 million, lower gains on the sale of assets of 2 million and the 16 million of other costs incurred in Q3 2015 mentioned above. The increase in restructuring and related charges is due to the difference between the cost of the 2015 Ahold USA support office restructuring as well as the early retirement incentive offered to Giant Landover store associates and the 2014 reorganization of the support roles at Albert Heijn and the Corporate Center. 2015 also includes additional costs for the acquisition and integration of the SPAR business in the Czech Republic of 14 million and an additional 22 million of costs incurred in connection with the planned merger with Delhaize. Income from continuing operations was 595 million; 25 million higher than last year. This reflects the increase in operating income adjusted for higher net financial expenses of 20 million and lower income taxes of 26 million. The higher financial expenses are mainly related to higher interest expense in 2015 of 17 million, due to the strengthening of the U.S. dollar. At constant exchange rates, interest expense decreased by 8 million. Page 4/22
Ahold Interim report, Third quarter 2015 Management report Net income was 597 million, up 222 million. The change is primarily due to a 2014 charge of 192 million to settle the Waterbury litigation, associated tax impact and legal fees. Free cash flow was 783 million; 341 million higher than last year. The increase is due to higher operating cash flows from continuing operations of 384 million offset by higher capital expenditures of 3 million, lower proceeds from divestment of assets of 27 million and higher payments of interest of 13 million. Contributing to the increase in cash generated from continuing operations were lower income taxes paid of 106 million and favorable year-over-year changes in working capital of 72 million. Page 5/22
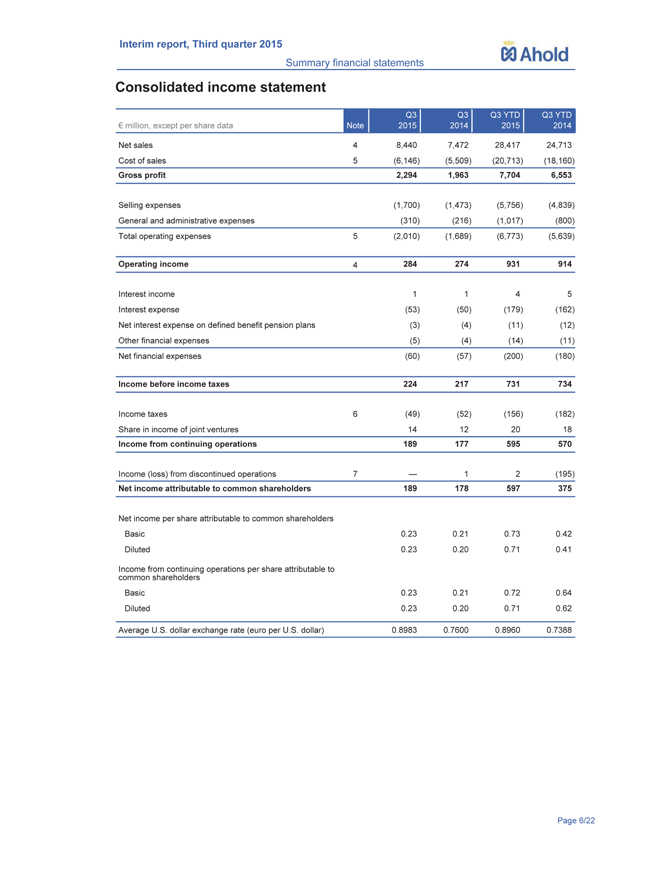
Ahold Interim report, Third quarter 2015 Summary financial statements Consolidated income statement million, except per share data Note Q3 2015 Q3 2014 Q3 YTD 2015 Q3 YTD 2014 Net sales 4 8,440 7,472 28,417 24,713 Cost of sales 5(6,146)(5,509)(20,713)(18,160) Gross profit 2,294 1,963 7,704 6,553 Selling expenses (1,700) (1,473) (5,756) (4,839) General and administrative expenses(310)(216)(1,017)(800) Total operating expenses 5(2,010)(1,689)(6,773)(5,639) Operating income 4 284 274 931 914 Interest income 1 1 4 5 Interest expense(53)(50)(179)(162) Net interest expense on defined benefit pension plans(3)(4)(11)(12) Other financial expenses(5)(4)(14)(11) Net financial expenses(60)(57)(200)(180) Income before income taxes 224 217 731 734 Income taxes 6 (49) (52) (156) (182) Share in income of joint ventures 14 12 20 18 Income from continuing operations 189 177 595 570 Income (loss) from discontinued operations 7 ? 1 2 (195) Net income attributable to common shareholders 189 178 597 375 Net income per share attributable to common shareholders Basic 0.23 0.21 0.73 0.42 Diluted Income from continuing operations per share attributable to 0.23 0.20 0.71 0.41 common shareholders Basic 0.23 0.21 0.72 0.64 Diluted 0.23 0.20 0.71 0.62 Average U.S. dollar exchange rate (euro per U.S. dollar) 0.8983 0.7600 0.8960 0.7388 Page 6/22
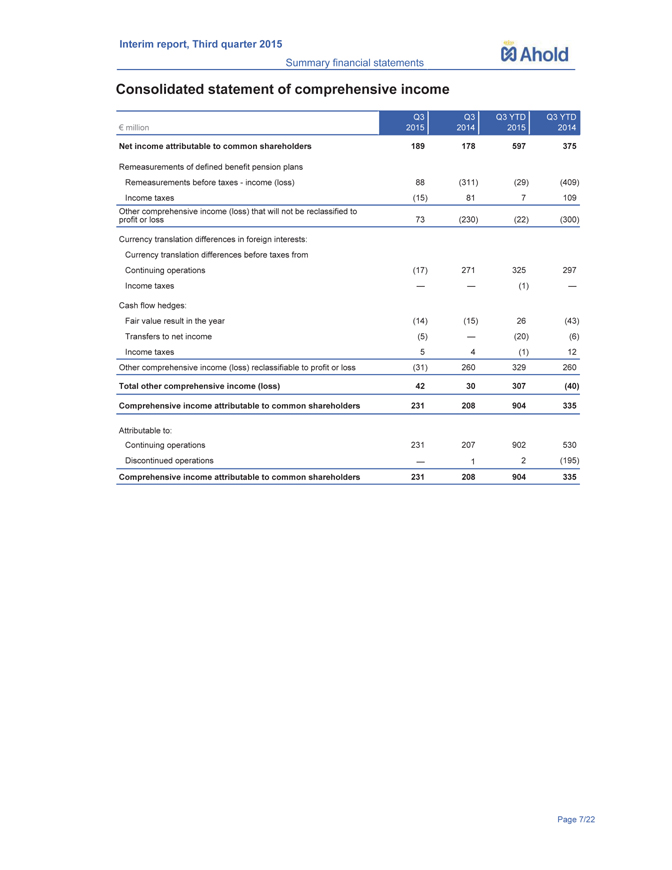
Ahold Interim report, Third quarter 2015 Summary financial statements Consolidated statement of comprehensive income million Q3 2015 Q3 2014 Q3 YTD 2015 Q3 YTD 2014 Net income attributable to common shareholders Remeasurements of defined benefit pension plans 189 178 597 375 Remeasurements before taxes—income (loss) 88(311)(29)(409) Income taxes(15) 81 7 109 Other comprehensive income (loss) that will not be reclassified to profit or loss 73 (230) (22) (300) Currency translation differences in foreign interests: Currency translation differences before taxes from Continuing operations(17) 271 325 297 Income taxes ? ?(1) ? Cash flow hedges: Fair value result in the year(14)(15) 26(43) Transfers to net income(5) ?(20)(6) Income taxes 5 4(1) 12 Other comprehensive income (loss) reclassifiable to profit or loss(31) 260 329 260 Total other comprehensive income (loss) 42 30 307 (40) Comprehensive income attributable to common shareholders 231 208 904 335 Attributable to: Continuing operations 231 207 902 530 Discontinued operations ? 1 2(195) Comprehensive income attributable to common shareholders 231 208 904 335 Page 7/22
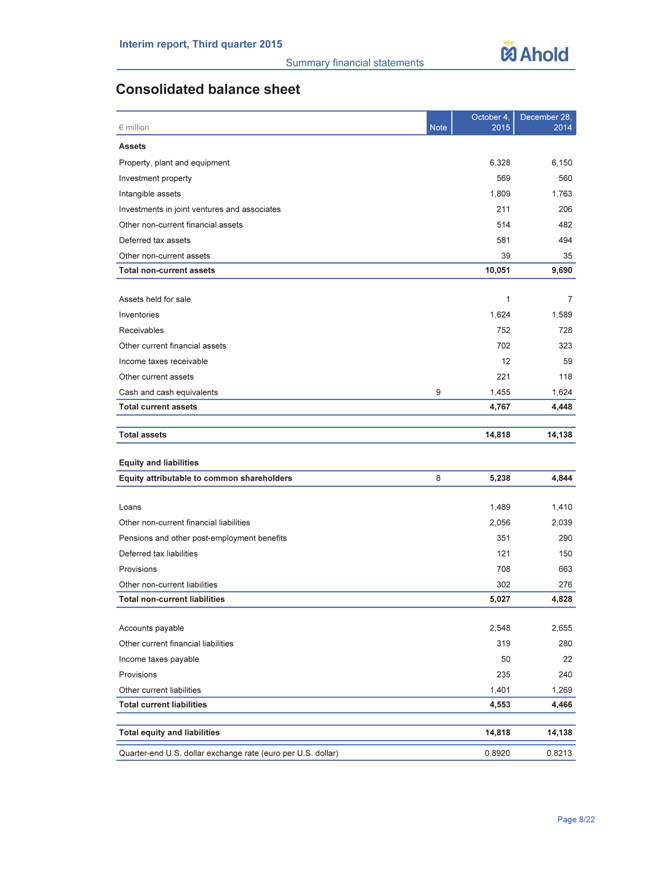
Ahold Interim report, Third quarter 2015 Summary financial statements Consolidated balance sheet million Note October 4, 2015 December 28, 2014 Assets Property, plant and equipment 6,328 6,150 Investment property 569 560 Intangible assets 1,809 1,763 Investments in joint ventures and associates 211 206 Other non-current financial assets 514 482 Deferred tax assets 581 494 Other non-current assets 39 35 Total non-current assets 10,051 9,690 Assets held for sale 1 7 Inventories 1,624 1,589 Receivables 752 728 Other current financial assets 702 323 Income taxes receivable 12 59 Other current assets 221 118 Cash and cash equivalents 9 1,455 1,624 Total current assets 4,767 4,448 Total assets 14,818 14,138 Equity and liabilities Equity attributable to common shareholders 8 5,238 4,844 Loans 1,489 1,410 Other non-current financial liabilities 2,056 2,039 Pensions and other post-employment benefits 351 290 Deferred tax liabilities 121 150 Provisions 708 663 Other non-current liabilities 302 276 Total non-current liabilities 5,027 4,828 Accounts payable 2,548 2,655 Other current financial liabilities 319 280 Income taxes payable 50 22 Provisions 235 240 Other current liabilities 1,401 1,269 Total current liabilities 4,553 4,466 Total equity and liabilities 14,818 14,138 Quarter-end U.S. dollar exchange rate (euro per U.S. dollar) 0.8920 0.8213 Page 8/22
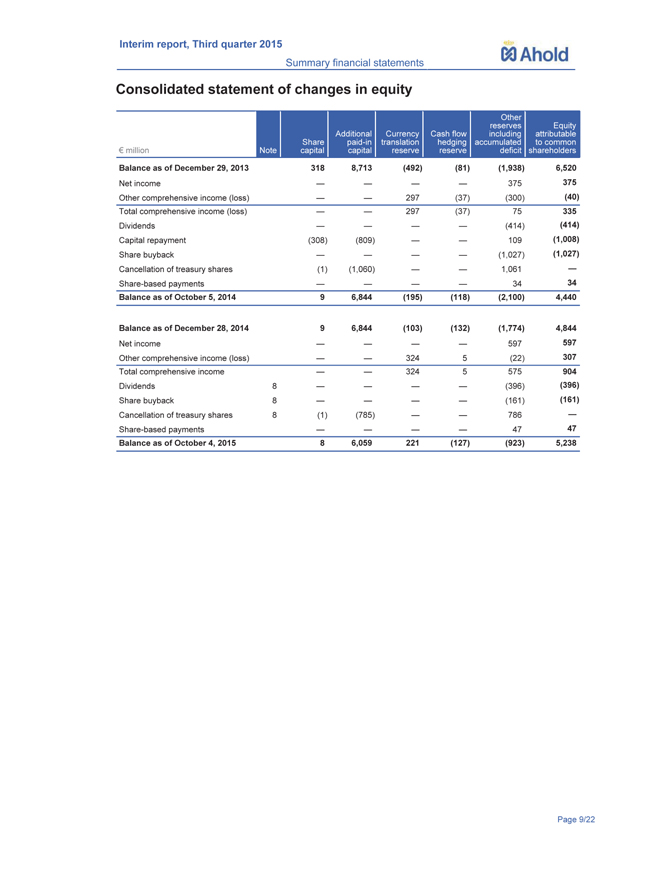
Ahold Interim report, Third quarter 2015 Summary financial statements Consolidated statement of changes in equity € million Note Share capital Additional paid-in capital Currency translation reserve Cash flow hedging reserve Other reserves including accumulated deficit Equity attributable to common shareholders Balance as of December 29, 2013 318 8,713(492)(81)(1,938) 6,520 Net income — — — — 375 375 Other comprehensive income (loss) — — 297(37)(300)(40) Total comprehensive income (loss) — — 297(37) 75 335 Dividends — — — —(414)(414) Capital repayment(308)(809) — — 109(1,008) Share buyback — — — —(1,027)(1,027) Cancellation of treasury shares(1)(1,060) — — 1,061 — Share-based payments — — — — 34 34 Balance as of October 5, 2014 9 6,844(195)(118)(2,100) 4,440 Balance as of December 28, 2014 9 6,844 (103) (132) (1,774) 4,844 Net income — — — — 597 597 Other comprehensive income (loss) — — 324 5(22) 307 Total comprehensive income — — 324 5 575 904 Dividends 8 — — — —(396)(396) Share buyback 8 — — — —(161)(161) Cancellation of treasury shares 8(1)(785) — — 786 — Share-based payments — — — — 47 47 Balance as of October 4, 2015 8 6,059 221(127)(923) 5,238 Page 9/22
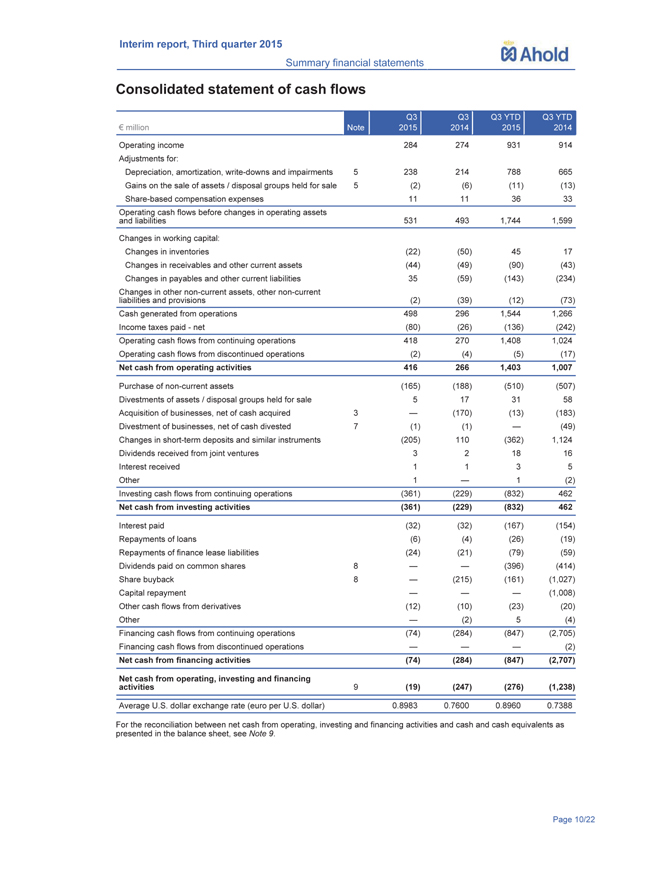
Ahold Interim report, Third quarter 2015 Summary financial statements Consolidated statement of cash flows million Note Q3 2015 Q3 2014 Q3 YTD 2015 Q3 YTD 2014 Operating income Adjustments for: Depreciation, amortization, write-downs and impairments 5 284 238 274 214 931 788 914 665 Gains on the sale of assets / disposal groups held for sale 5(2)(6)(11)(13) Share-based compensation expenses 11 11 36 33 Operating cash flows before changes in operating assets and liabilities 531 493 1,744 1,599 Changes in working capital: Changes in inventories(22)(50) 45 17 Changes in receivables and other current assets(44)(49)(90)(43) Changes in payables and other current liabilities 35(59)(143)(234) Changes in other non-current assets, other non-current liabilities and provisions (2) (39) (12) (73) Cash generated from operations 498 296 1,544 1,266 Income taxes paid—net(80)(26)(136)(242) Operating cash flows from continuing operations 418 270 1,408 1,024 Operating cash flows from discontinued operations(2)(4)(5)(17) Net cash from operating activities 416 266 1,403 1,007 Purchase of non-current assets(165)(188)(510)(507) Divestments of assets / disposal groups held for sale 5 17 31 58 Acquisition of businesses, net of cash acquired 3 ?(170)(13)(183) Divestment of businesses, net of cash divested 7(1)(1) ?(49) Changes in short-term deposits and similar instruments(205) 110(362) 1,124 Dividends received from joint ventures 3 2 18 16 Interest received 1 1 3 5 Other 1 ? 1(2) Investing cash flows from continuing operations(361)(229)(832) 462 Net cash from investing activities(361)(229)(832) 462 Interest paid(32)(32)(167)(154) Repayments of loans(6)(4)(26)(19) Repayments of finance lease liabilities(24)(21)(79)(59) Dividends paid on common shares 8 ? ?(396)(414) Share buyback 8 ?(215)(161)(1,027) Capital repayment ? ? ?(1,008) Other cash flows from derivatives(12)(10)(23)(20) Other ?(2) 5(4) Financing cash flows from continuing operations(74)(284)(847)(2,705) Financing cash flows from discontinued operations ? ? ?(2) Net cash from financing activities(74)(284)(847)(2,707) Net cash from operating, investing and financing activities 9 (19) (247) (276) (1,238) Average U.S. dollar exchange rate (euro per U.S. dollar) 0.8983 0.7600 0.8960 0.7388 For the reconciliation between net cash from operating, investing and financing activities and cash and cash equivalents as presented in the balance sheet, see Note 9. Page 10/22
Ahold Interim report, Third quarter 2015 Summary financial statements Notes to the consolidated summary financial statements 1. The Company and its operations The principal activity of Koninklijke Ahold N.V. (?Ahold? or the ?Company? or “Group” or “Ahold Group”), a public limited liability company with its registered seat and head office in Zaandam, the Netherlands, is the operation of retail food stores in the United States and Europe through subsidiaries and joint ventures. The information in these condensed consolidated interim financial statements (“financial statements”) is unaudited. 2. Accounting policies Basis of preparation These financial statements have been prepared in accordance with IAS 34 ?Interim Financial Reporting.? The accounting policies applied in these financial statements are consistent with those applied in Ahold?s 2014 consolidated financial statements. Taxes on income in the interim periods are accrued using the tax rate that would be applicable to expected total annual profit or loss. Ahold?s reporting calendar in 2015 is based on 12 periods of four weeks and one period of five weeks, for a total of 53 weeks. The 2014 reporting calendar is based on 13 periods of four weeks, for a total of 52 weeks. In 2015 and 2014, the first quarter comprised 16 weeks and the second and third quarters each comprised 12 weeks. New and revised IFRSs effective in 2015 Contributions from employees to defined benefit plans—Amendments to IAS 19 The objective of the amendments was to simplify the accounting for contributions that are independent of the number of years of employee service, for example, employee contributions that are calculated according to a fixed percentage of salary. The simplification was to allow entities the option to recognize employee contributions as a reduction of service costs in the period in which the related service is rendered, instead of attributing the employee contributions to periods of service. The amendments have no impact on the Group, as Ahold has chosen not to avail itself of the practical expedient offered in the amendment and will continue to attribute employee contributions to periods of service. IFRIC 21 Levies IFRIC 21 addresses the issue of when to recognize a liability to pay a levy imposed by a government. The interpretation defines a levy and specifies that the obligating event that gives rise to the liability is the activity that triggers the payment of the levy, as identified by legislation. The adoption of IFRIC 21 does not have a significant financial effect on the consolidated financial statements of the Group. Annual improvements to IFRSs 2010-2012 and to IFRSs 2011-2013 Annual improvements to IFRSs 2010-2012 Cycle and annual improvements to IFRSs 2011-2013 Cycle made a number of amendments to various IFRSs, which, based on Ahold’s current financial position, will not have a significant effect on the consolidated financial statements. 3. Business combinations On August 14, 2012, Ahold announced that its Albert Heijn division had completed the acquisition of 78 C1000 and four Jumbo stores from Jumbo for 290 million in cash. A net amount of 273 million was paid by October 4, 2015 (of which 7 million was paid during 2015) in relation to the transferred stores. As of October 4, 2015, Ahold had reached agreements concerning 75 franchisees, of which 71 stores have been converted and opened under the Albert Heijn banner and four stores have been divested directly upon acquisition. For the remaining seven stores, Ahold did not reach agreements with the franchisees and these stores have been transferred back to Jumbo. As of the end of Q3, Page11/22 .
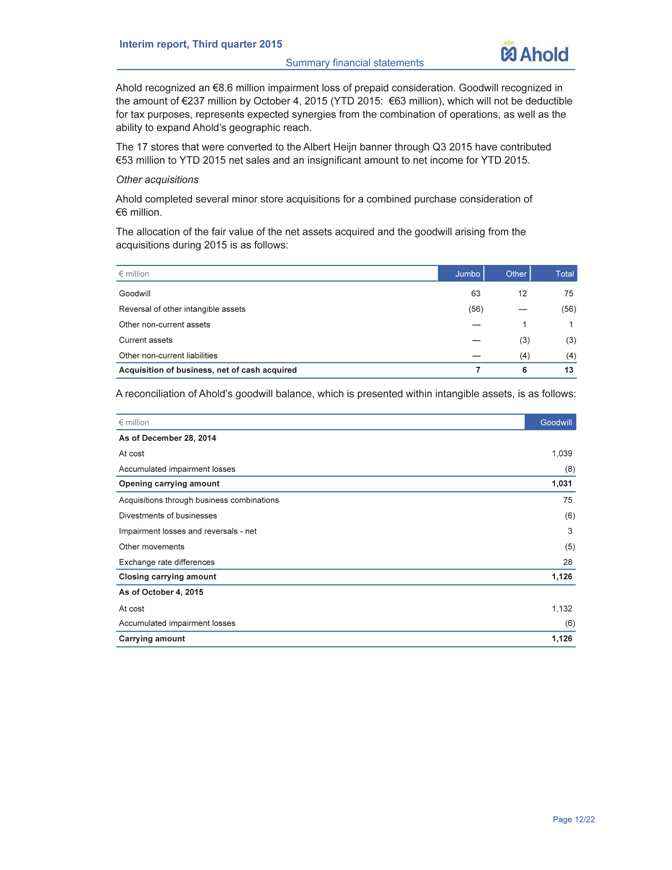
Ahold Interim report, Third quarter 2015 Summary financial statements Ahold recognized an €8.6 million impairment loss of prepaid consideration. Goodwill recognized in the amount of €237 million by October 4, 2015 (YTD 2015: €63 million), which will not be deductible for tax purposes, represents expected synergies from the combination of operations, as well as the ability to expand Ahold’s geographic reach. The 17 stores that were converted to the Albert Heijn banner through Q3 2015 have contributed €53 million to YTD 2015 net sales and an insignificant amount to net income for YTD 2015. Other acquisitions Ahold completed several minor store acquisitions for a combined purchase consideration of €6 million. The allocation of the fair value of the net assets acquired and the goodwill arising from the acquisitions during 2015 is as follows: € million Jumbo Other Total Goodwill 63 12 75 Reversal of other intangible assets(56) —(56) Other non-current assets — 1 1 Current assets —(3)(3) Other non-current liabilities —(4)(4) Acquisition of business, net of cash acquired 7 6 13 A reconciliation of Ahold’s goodwill balance, which is presented within intangible assets, is as follows: € million Goodwill As of December 28, 2014 At cost 1,039 Accumulated impairment losses(8) Opening carrying amount 1,031 Acquisitions through business combinations 75 Divestments of businesses(6) Impairment losses and reversals—net 3 Other movements(5) Exchange rate differences 28 Closing carrying amount 1,126 As of October 4, 2015 At cost 1,132 Accumulated impairment losses(6) Carrying amount 1,126 Page 12/22
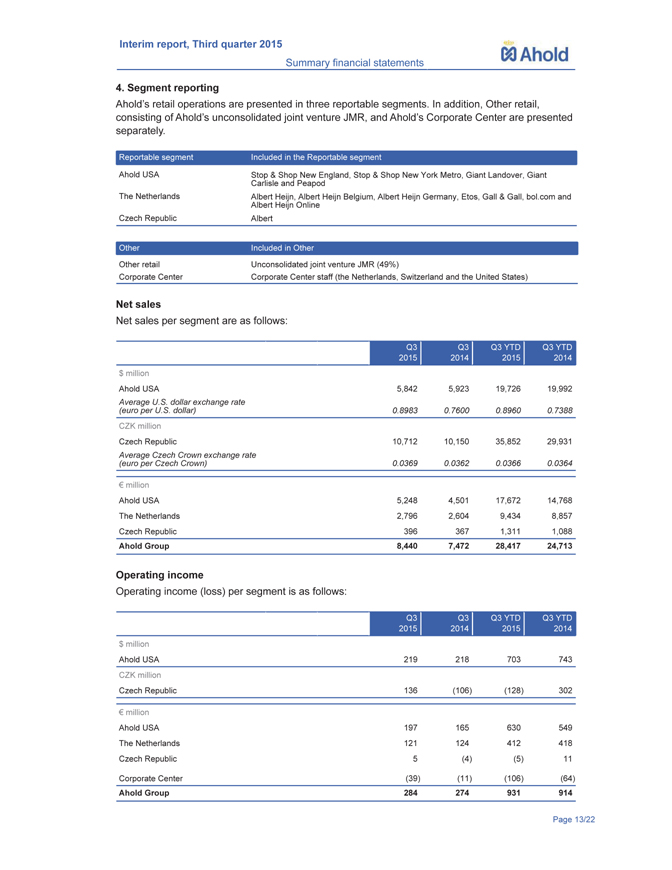
Ahold Interim report, Third quarter 2015 Summary financial statements 4. Segment reporting Ahold?s retail operations are presented in three reportable segments. In addition, Other retail, consisting of Ahold?s unconsolidated joint venture JMR, and Ahold?s Corporate Center are presented separately. Reportable segment Included in the Reportable segment Ahold USA Stop & Shop New England, Stop & Shop New York Metro, Giant Landover, Giant Carlisle and Peapod The Netherlands Albert Heijn, Albert Heijn Belgium, Albert Heijn Germany, Etos, Gall & Gall, bol.com and Albert Heijn Online Czech Republic Albert Other Included in Other Other retail Unconsolidated joint venture JMR (49%) Corporate Center Corporate Center staff (the Netherlands, Switzerland and the United States) Net sales Net sales per segment are as follows: $ million Ahold USA 5,842 5,923 19,726 19,992 Average U.S. dollar exchange rate (euro per U.S. dollar) 0.8983 0.7600 0.8960 0.7388 CZK million Czech Republic 10,712 10,150 35,852 29,931 Average Czech Crown exchange rate (euro per Czech Crown) 0.0369 0.0362 0.0366 0.0364 million Ahold USA 5,248 4,501 17,672 14,768 The Netherlands 2,796 2,604 9,434 8,857 Czech Republic 396 367 1,311 1,088 Ahold Group 8,440 7,472 28,417 24,713 Operating income Operating income (loss) per segment is as follows: $ million Ahold USA 219 218 703 743 CZK million Czech Republic 136 (106) (128) 302 million Ahold USA 197 165 630 549 The Netherlands 121 124 412 418 Czech Republic 5(4)(5) 11 Corporate Center(39)(11)(106)(64) Ahold Group 284 274 931 914 Page 13/22
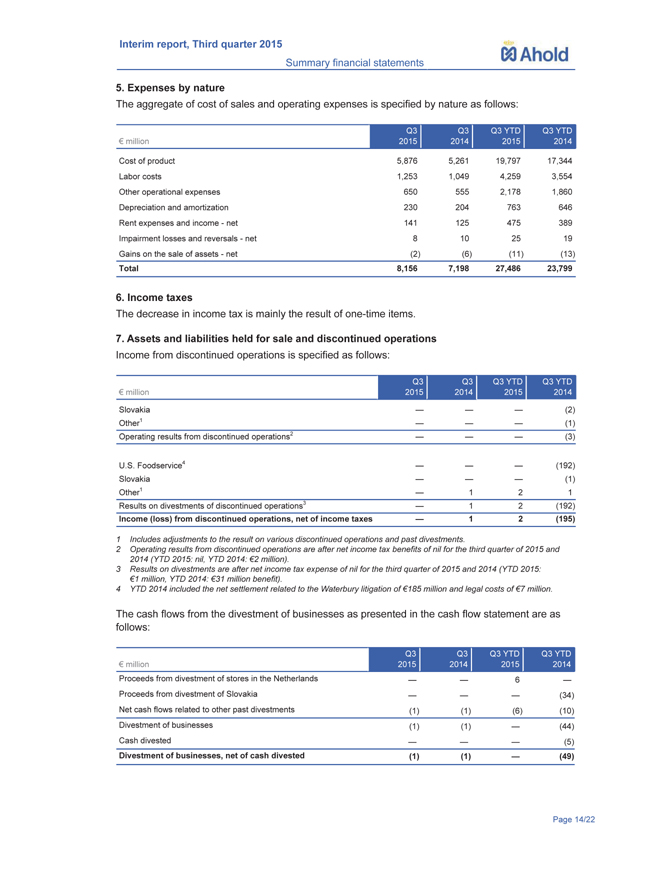
Ahold Interim report, Third quarter 2015 Summary financial statements 5. Expenses by nature The aggregate of cost of sales and operating expenses is specified by nature as follows: € million Q3 2015 Q3 2014 Q3 YTD 2015 Q3 YTD 2014 Cost of product 5,876 5,261 19,797 17,344 Labor costs 1,253 1,049 4,259 3,554 Other operational expenses 650 555 2,178 1,860 Depreciation and amortization 230 204 763 646 Rent expenses and income—net 141 125 475 389 Impairment losses and reversals—net 8 10 25 19 Gains on the sale of assets—net(2)(6)(11)(13) Total 8,156 7,198 27,486 23,799 6. Income taxes The decrease in income tax is mainly the result of one-time items. 7. Assets and liabilities held for sale and discontinued operations Income from discontinued operations is specified as follows: € million Q3 2015 Q3 2014 Q3 YTD 2015 Q3 YTD 2014 Slovakia — — —(2) Other1 — — —(1) Operating results from discontinued operations2 — — —(3) U.S. Foodservice4 — — — (192) Slovakia — — —(1) Other1 — 1 2 1 Results on divestments of discontinued operations3 — 1 2(192) Income (loss) from discontinued operations, net of income taxes — 1 2(195) 1 Includes adjustments to the result on various discontinued operations and past divestments. 2 Operating results from discontinued operations are after net income tax benefits of nil for the third quarter of 2015 and 2014 (YTD 2015: nil, YTD 2014: €2 million). 3 Results on divestments are after net income tax expense of nil for the third quarter of 2015 and 2014 (YTD 2015: €1 million, YTD 2014: €31 million benefit). 4 YTD 2014 included the net settlement related to the Waterbury litigation of €185 million and legal costs of €7 million. The cash flows from the divestment of businesses as presented in the cash flow statement are as follows: Proceeds from divestment of stores in the Netherlands Proceeds from divestment of Slovakia — — — — 6 — — (34) Net cash flows related to other past divestments(1)(1)(6)(10) Divestment of businesses(1)(1) —(44) Cash divested — — —(5) Divestment of businesses, net of cash divested(1)(1) —(49) Page14/22
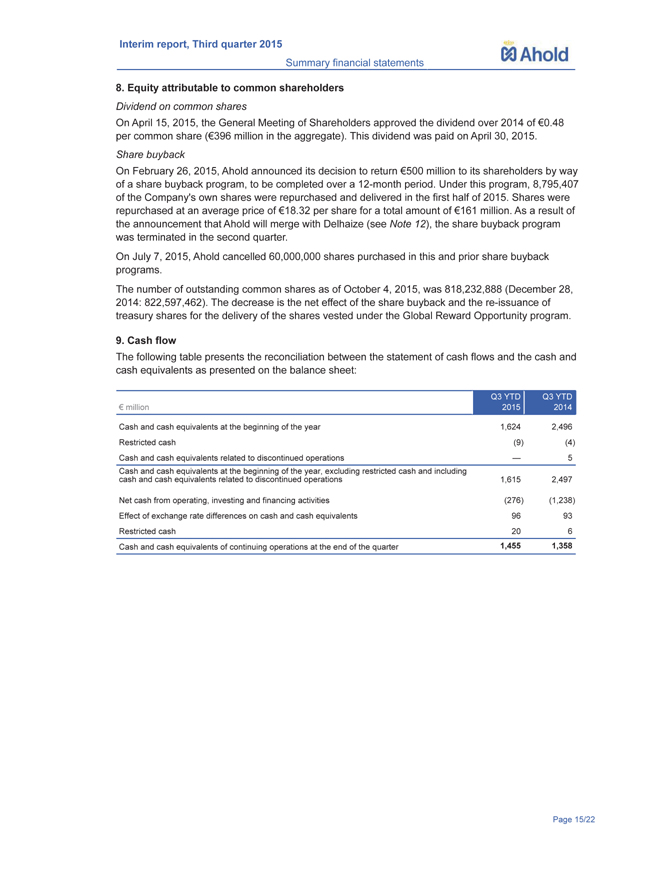
. Ahold Interim report, Third quarter 2015 Summary financial statements 8. Equity attributable to common shareholders Dividend on common shares On April 15, 2015, the General Meeting of Shareholders approved the dividend over 2014 of 0.48 per common share (396 million in the aggregate). This dividend was paid on April 30, 2015. Share buyback On February 26, 2015, Ahold announced its decision to return 500 million to its shareholders by way of a share buyback program, to be completed over a 12-month period. Under this program, 8,795,407 of the Company’s own shares were repurchased and delivered in the first half of 2015. Shares were repurchased at an average price of 18.32 per share for a total amount of 161 million. As a result of the announcement that Ahold will merge with Delhaize (see Note 12), the share buyback program was terminated in the second quarter. On July 7, 2015, Ahold cancelled 60,000,000 shares purchased in this and prior share buyback programs. The number of outstanding common shares as of October 4, 2015, was 818,232,888 (December 28, 2014: 822,597,462). The decrease is the net effect of the share buyback and the re-issuance of treasury shares for the delivery of the shares vested under the Global Reward Opportunity program. 9. Cash flow The following table presents the reconciliation between the statement of cash flows and the cash and cash equivalents as presented on the balance sheet: million Q3 YTD 2015 Q3 YTD 2014 Cash and cash equivalents at the beginning of the year 1,624 2,496 Restricted cash(9)(4) Cash and cash equivalents related to discontinued operations ? 5 Cash and cash equivalents at the beginning of the year, excluding restricted cash and including cash and cash equivalents related to discontinued operations 1,615 2,497 Net cash from operating, investing and financing activities (276) (1,238) Effect of exchange rate differences on cash and cash equivalents 96 93 Restricted cash 20 6 Cash and cash equivalents of continuing operations at the end of the quarter 1,455 1,358 Page 15/22
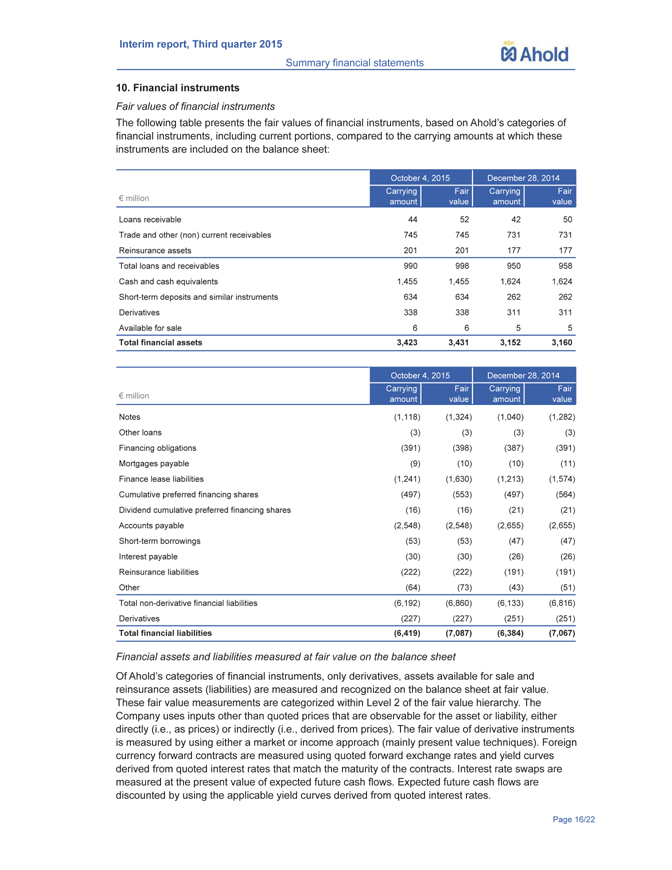
Ahold Interim report, Third quarter 2015 Summary financial statements 10. Financial instruments Fair values of financial instruments The following table presents the fair values of financial instruments, based on Ahold?s categories of financial instruments, including current portions, compared to the carrying amounts at which these instruments are included on the balance sheet: million October 4, 2015 December 28, 2014 Carrying amount Fair value Carrying amount Fair value Loans receivable 44 52 42 50 Trade and other (non) current receivables 745 745 731 731 Reinsurance assets 201 201 177 177 Total loans and receivables 990 998 950 958 Cash and cash equivalents 1,455 1,455 1,624 1,624 Short-term deposits and similar instruments 634 634 262 262 Derivatives 338 338 311 311 Available for sale 6 6 5 5 Total financial assets 3,423 3,431 3,152 3,160 million October 4, 2015 December 28, 2014 Carrying amount Fair value Carrying amount Fair value Notes(1,118)(1,324)(1,040)(1,282) Other loans(3)(3)(3)(3) Financing obligations(391)(398)(387)(391) Mortgages payable(9)(10)(10)(11) Finance lease liabilities(1,241)(1,630)(1,213)(1,574) Cumulative preferred financing shares(497)(553)(497)(564) Dividend cumulative preferred financing shares(16)(16)(21)(21) Accounts payable(2,548)(2,548)(2,655)(2,655) Short-term borrowings(53)(53)(47)(47) Interest payable(30)(30)(26)(26) Reinsurance liabilities(222)(222)(191)(191) Other(64)(73)(43)(51) Total non-derivative financial liabilities(6,192)(6,860)(6,133)(6,816) Derivatives(227)(227)(251)(251) Total financial liabilities(6,419)(7,087)(6,384)(7,067) Financial assets and liabilities measured at fair value on the balance sheet Of Ahold?s categories of financial instruments, only derivatives, assets available for sale and reinsurance assets (liabilities) are measured and recognized on the balance sheet at fair value. These fair value measurements are categorized within Level 2 of the fair value hierarchy. The Company uses inputs other than quoted prices that are observable for the asset or liability, either directly (i.e., as prices) or indirectly (i.e., derived from prices). The fair value of derivative instruments is measured by using either a market or income approach (mainly present value techniques). Foreign currency forward contracts are measured using quoted forward exchange rates and yield curves derived from quoted interest rates that match the maturity of the contracts. Interest rate swaps are measured at the present value of expected future cash flows. Expected future cash flows are discounted by using the applicable yield curves derived from quoted interest rates.
Ahold Interim report, Third quarter 2015 Summary financial statements The valuation of Ahold?s derivative instruments is adjusted for the credit risk of the counterparty, called Credit Valuation Adjustment (“CVA”), and for the reporting entity’s own credit risk, called Debit Valuation Adjustment (“DVA”). The CVA / DVA calculations have been added to the risk-free fair value of Ahold?s interest and cross-currency swaps. The valuation technique for the CVA / DVA calculation is based on relevant observable market inputs. The carrying amount of receivables, cash and cash equivalents, accounts payable, short-term deposits and similar instruments, and other current financial assets and liabilities approximate their fair values because of the short-term nature of these instruments and, for receivables, because of the fact that any recoverability loss is reflected in an impairment loss. The fair values of quoted borrowings are based on ask-market quoted prices at the end of the reporting period. The fair value of other non-derivative financial assets and liabilities that are not traded in an active market are estimated using discounted cash flow analyses based on prevailing market rates. The fair value calculation method and the conditions for redemption and conversion of the cumulative preferred financing shares are disclosed in Note 22 of Ahold?s Annual Report 2014. The accrued interest is included in other current financial liabilities and not in the carrying amounts of non-derivative financial assets and liabilities. 11. Commitments and contingencies A comprehensive overview of commitments and contingencies as of December 28, 2014, was included in Note 34 of Ahold?s 2014 consolidated financial statements, which were published as part of Ahold’s Annual Report 2014 on February 26, 2015. There were no significant changes to this overview through Q3 2015. 12. Merger with Delhaize On June 24, 2015, Ahold and Delhaize announced their intention to merge their businesses through a merger of equals. As a result of this announcement, Ahold has terminated its ongoing share buyback program and 1 billion will be returned to Ahold shareholders via a capital return and a reverse stock split prior to completion of the merger. Per the merger agreement, Delhaize shareholders are to receive 4.75 Ahold ordinary shares for each Delhaize ordinary share. Upon completion, Ahold shareholders will own approximately 61% of the combined company’s equity and Delhaize shareholders will own approximately 39%. The transaction is expected to be completed in mid-2016, following regulatory clearances, associate consultation procedures and shareholder approval. 13. Subsequent events On July 20, 2015, Ahold announced that it had entered into an agreement with The Great Atlantic & Pacific Tea Company to acquire 25 A&P stores in Greater New York. On October 8, 2015, all conditions had been met and Ahold commenced its purchase of 25 former A&P stores. The purchase and conversion of the stores is planned to occur on a weekly basis in batches of five stores, with the final tranche of stores expected to be converted in mid-November. The purchase price for all of the stores is $150 million (134 million). Page 17/22
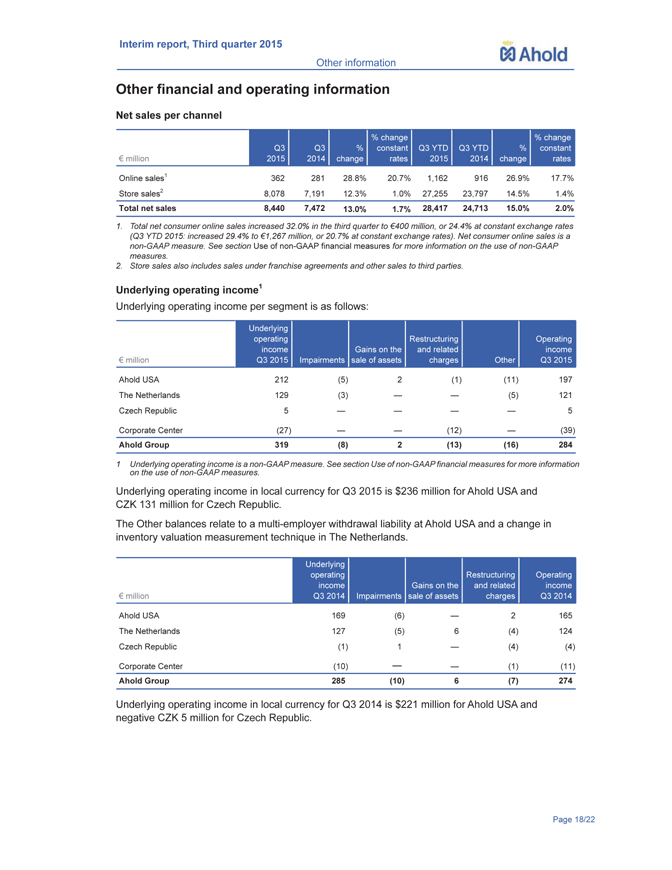
Ahold Interim report, Third quarter 2015 Other information Other financial and operating information Net sales per channel million Q3 2015 Q3 2014 % change% change constant rates Q3 YTD 2015 Q3 YTD 2014 % change% change constant rates Online sales1 362 281 28.8% 20.7% 1,162 916 26.9% 17.7% Store sales2 8,078 7,191 12.3% 1.0% 27,255 23,797 14.5% 1.4% Total net sales 8,440 7,472 13.0% 1.7% 28,417 24,713 15.0% 2.0% 1. Total net consumer online sales increased 32.0% in the third quarter to 400 million, or 24.4% at constant exchange rates (Q3 YTD 2015: increased 29.4% to 1,267 million, or 20.7% at constant exchange rates). Net consumer online sales is a non-GAAP measure. See section Use of non-GAAP financial measures for more information on the use of non-GAAP measures. 2. Store sales also includes sales under franchise agreements and other sales to third parties. Underlying operating income1 Underlying operating income per segment is as follows: million Underlying operating income Q3 2015 Impairments Gains on the sale of assets Restructuring and related charges Other Operating income Q3 2015 Ahold USA 212(5) 2(1)(11) 197 The Netherlands 129(3) ? ?(5) 121 Czech Republic 5 ? ? ? ? 5 Corporate Center(27) ? ?(12) ?(39) Ahold Group 319(8) 2(13)(16) 284 1 Underlying operating income is a non-GAAP measure. See section Use of non-GAAP financial measures for more information on the use of non-GAAP measures. Underlying operating income in local currency for Q3 2015 is $236 million for Ahold USA and CZK 131 million for Czech Republic. The Other balances relate to a multi-employer withdrawal liability at Ahold USA and a change in inventory valuation measurement technique in The Netherlands. million Underlying operating income Q3 2014 Impairments Gains on the sale of assets Restructuring and related charges Operating income Q3 2014 Ahold USA 169(6) ? 2 165 The Netherlands 127(5) 6(4) 124 Czech Republic(1) 1 ?(4)(4) Corporate Center (10) ? ? (1) (11) Ahold Group 285(10) 6(7) 274 Underlying operating income in local currency for Q3 2014 is $221 million for Ahold USA and negative CZK 5 million for Czech Republic. Page 18/22
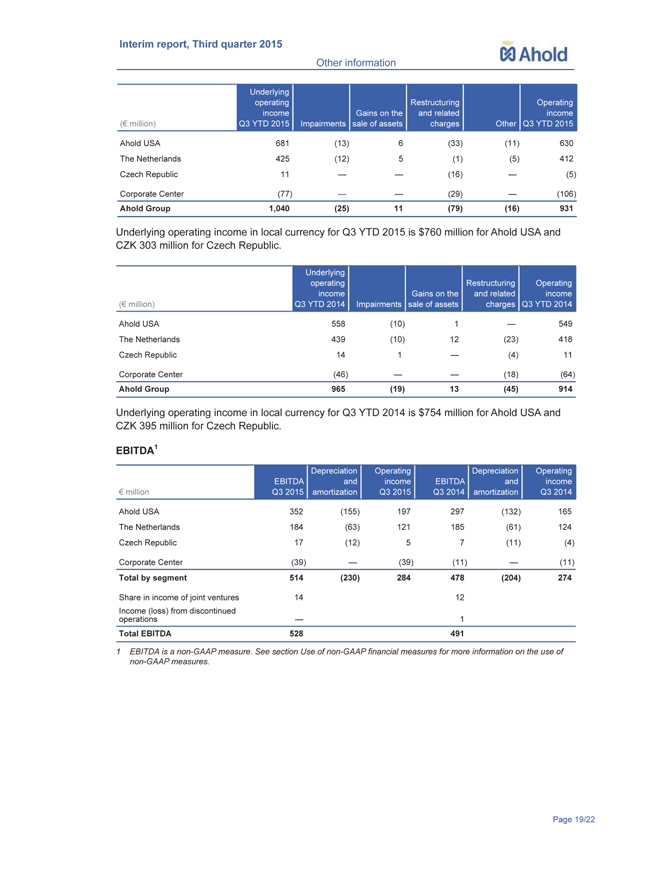
Ahold Interim report, Third quarter 2015 Other information ( million) Underlying operating income Q3 YTD 2015 Impairments Gains on the sale of assets Restructuring and related charges Other Operating income Q3 YTD 2015 Ahold USA 681(13) 6(33)(11) 630 The Netherlands 425(12) 5(1)(5) 412 Czech Republic 11 ? ?(16) ?(5) Corporate Center(77) ? ?(29) ?(106) Ahold Group 1,040(25) 11(79)(16) 931 Underlying operating income in local currency for Q3 YTD 2015 is $760 million for Ahold USA and CZK 303 million for Czech Republic. ( million) Underlying operating income Q3 YTD 2014 Impairments Gains on the sale of assets Restructuring and related charges Operating income Q3 YTD 2014 Ahold USA 558(10) 1 ? 549 The Netherlands 439(10) 12(23) 418 Czech Republic 14 1 ?(4) 11 Corporate Center(46) ? ?(18)(64) Ahold Group 965(19) 13(45) 914 Underlying operating income in local currency for Q3 YTD 2014 is $754 million for Ahold USA and CZK 395 million for Czech Republic. EBITDA1 million EBITDA Q3 2015 Depreciation and amortization Operating income Q3 2015 EBITDA Q3 2014 Depreciation and amortization Operating income Q3 2014 Ahold USA 352(155) 197 297(132) 165 The Netherlands 184(63) 121 185(61) 124 Czech Republic 17(12) 5 7(11)(4) Corporate Center(39) ?(39)(11) ?(11) Total by segment 514(230) 284 478(204) 274 Share in income of joint ventures 14 12 Income (loss) from discontinued operations ? 1 Total EBITDA 528 491 1 EBITDA is a non-GAAP measure. See section Use of non-GAAP financial measures for more information on the use of non-GAAP measures. Page 19/22
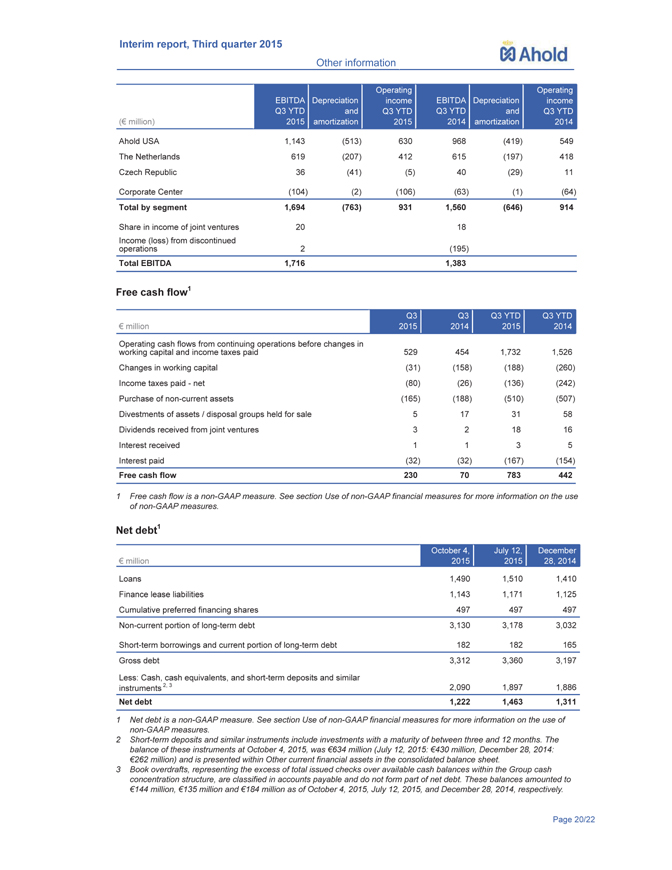
. Ahold Interim report, Third quarter 2015 Other information ( million) EBITDA Q3 YTD 2015 Depreciation and amortization Operating income Q3 YTD 2015 EBITDA Q3 YTD 2014 Depreciation and amortization Operating income Q3 YTD 2014 Ahold USA 1,143(513) 630 968(419) 549 The Netherlands 619(207) 412 615(197) 418 Czech Republic 36(41)(5) 40(29) 11 Corporate Center(104)(2)(106)(63)(1)(64) Total by segment 1,694(763) 931 1,560(646) 914 Share in income of joint ventures 20 18 Income (loss) from discontinued operations 2 (195) Total EBITDA 1,716 1,383 Free cash flow1 million Q3 2015 Q3 2014 Q3 YTD 2015 Q3 YTD 2014 Operating cash flows from continuing operations before changes in working capital and income taxes paid 529 454 1,732 1,526 Changes in working capital(31)(158)(188)(260) Income taxes paid—net(80)(26)(136)(242) Purchase of non-current assets(165)(188)(510)(507) Divestments of assets / disposal groups held for sale 5 17 31 58 Dividends received from joint ventures 3 2 18 16 Interest received 1 1 3 5 Interest paid(32)(32)(167)(154) Free cash flow 230 70 783 442 1 Free cash flow is a non-GAAP measure. See section Use of non-GAAP financial measures for more information on the use of non-GAAP measures. Net debt1 million October 4, 2015 July 12, 2015 December 28, 2014 Loans 1,490 1,510 1,410 Finance lease liabilities 1,143 1,171 1,125 Cumulative preferred financing shares 497 497 497 Non-current portion of long-term debt 3,130 3,178 3,032 Short-term borrowings and current portion of long-term debt 182 182 165 Gross debt 3,312 3,360 3,197 Less: Cash, cash equivalents, and short-term deposits and similar instruments 2, 3 2,090 1,897 1,886 Net debt 1,222 1,463 1,311 1 Net debt is a non-GAAP measure. See section Use of non-GAAP financial measures for more information on the use of non-GAAP measures. 2 Short-term deposits and similar instruments include investments with a maturity of between three and 12 months. The balance of these instruments at October 4, 2015, was 634 million (July 12, 2015: 430 million, December 28, 2014: 262 million) and is presented within Other current financial assets in the consolidated balance sheet. 3 Book overdrafts, representing the excess of total issued checks over available cash balances within the Group cash concentration structure, are classified in accounts payable and do not form part of net debt. These balances amounted to 144 million, 135 million and 184 million as of October 4, 2015, July 12, 2015, and December 28, 2014, respectively. Page 20/22
Ahold Interim report, Third quarter 2015 Other information Store portfolio (including franchise stores) End of 2014 Opened / acquired Closed / sold End of Q3 2015 End of Q3 2014 Ahold USA 768 2(8) 762 767 1
The Netherlands 2,105 53(34) 2,124 2,082
Czech Republic 333 4(6) 331 332 Total 3,206 59(48) 3,217 3,181 1 The number of stores at the end of Q3 2015 includes 1,137 specialty stores (Etos and Gall & Gall) (Q3 2014: 1,130). Through Q3 YTD 2015, 17 C1000 stores were converted to the Albert Heijn banner. Use of non-GAAP financial measures This interim report includes non-GAAP financial measures. The descriptions of these non-GAAP financial measures are included on page 37 of Ahold’s Annual Report 2014, with the exception of EBITDA, which is defined below. Earnings before interest, taxes, depreciation and amortization, or EBITDA, is net income before net financial expense, income taxes, depreciation and amortization. However, EBITDA does not exclude impairments. EBITDA allows investors to analyze the profitability between companies and industries by eliminating the effects of financing (i.e., net financial expense) and capital investments (i.e., depreciation and amortization). Financial calendar Ahold’s financial year consists of 52 or 53 weeks and ends on the Sunday nearest to December 31. Ahold’s 2015 financial year consists of 53 weeks and ends on January 3, 2016. The quarters in 2015 are: First quarter (16 weeks) December 29, 2014, through April 19, 2015 Second quarter (12 weeks) April 20 through July 12, 2015 Third quarter (12 weeks) July 13 through October 4, 2015 Fourth quarter (13 weeks) October 5, 2015, through January 3, 2016 2015/19 Legal notices No offer or solicitation This communication is being made in connection with, among others, the proposed business combination transaction between Koninklijke Ahold N.V. also known as Royal Ahold (?Ahold?), and Delhaize Group (?Delhaize?).This communication is not intended to and does not constitute an offer to sell or the solicitation of an offer to subscribe for or buy or an invitation to purchase or subscribe for any securities or the solicitation of any vote or approval in any jurisdiction in connection with the proposed transaction or otherwise, nor shall there be any sale, issuance or transfer of securities in any jurisdiction in contravention of applicable law. No offer of securities shall be made except by means of a prospectus meeting the requirements of Section 10 of the Securities Act of 1933, as amended, and applicable Dutch, Belgian and other European regulations. This communication is not for release, publication or distribution, in whole or in part, in or into, directly or indirectly, any jurisdiction in which such release, publication or distribution would be unlawful. Important additional information will be filed with the SEC In connection with the proposed transaction, Ahold will file with the U.S. Securities and Exchange Commission (the ?SEC?) a registration statement on Form F-4 that will include a prospectus. The prospectus will be mailed to the holders of American Depositary Shares of Delhaize and holders of ordinary shares of Delhaize (other than holders of ordinary shares of Delhaize that are non-U.S. persons (as defined in the applicable rules of the SEC). INVESTORS AND SECURITY HOLDERS ARE URGED TO READ THE PROSPECTUS AND OTHER RELEVANT DOCUMENTS FILED OR TO BE FILED WITH THE SEC CAREFULLY WHEN THEY BECOME AVAILABLE BECAUSE THEY WILL CONTAIN IMPORTANT INFORMATION ABOUT AHOLD, DELHAIZE, THE TRANSACTION AND RELATED MATTERS. Investors and security holders will be able to obtain free copies of the prospectus and other documents filed with the SEC by Ahold and Delhaize through the website maintained Page 21/22
Ahold Interim report, Third quarter 2015 Other information by the SEC at www.sec.gov. In addition, investors and security holders will be able to obtain free copies of the prospectus and other documents filed by Ahold with the SEC by contacting Ahold Investor Relations at investor.relations@ahold.com or by calling +31 88 659 5213, and will be able to obtain free copies of the prospectus and other documents filed by Delhaize by contacting Investor Relations Delhaize Group at Investor@delhaizegroup.com or by calling +32 2 412 2151. Forward-looking statements This communication contains forward-looking statements, which do not refer to historical facts but refer to expectations based on management’s current views and assumptions and involve known and unknown risks and uncertainties and other factors that could cause actual results, performance, or events to differ materially from those included in such statements. These statements or disclosures may discuss goals, intentions and expectations as to future trends, plans, events, results of operations or financial condition, or state other information relating to Ahold, based on current beliefs of management as well as assumptions made by, and information currently available to, management. Forward-looking statements generally will be accompanied by words such as “anticipate,” “believe,” “plan,” “could,” “estimate,” “expect,” “forecast,” “guidance,” “intend,” “may,” “possible,” “potential,” “predict,” “project” or other similar words, phrases or expressions. Many of these risks and uncertainties relate to factors that are beyond Ahold’s control. Factors that could cause actual results to differ materially from those in the forward-looking statements include, but are not limited to: the occurrence of any change, event or development that could give rise to the termination of the merger agreement; the ability to obtain the approval of the transaction by Ahold’s and Delhaize’s shareholders; the risk that the necessary regulatory approvals may not be obtained or may be obtained subject to conditions that are not anticipated; failure to satisfy other closing conditions with respect to the transaction on the proposed terms and time frame; the possibility that the transaction does not close when expected or at all; the risks that the new businesses will not be integrated successfully or promptly or that the combined company will not realize the expected benefits from the transaction; Ahold’s ability to successfully implement and complete its plans and strategies and to meet its targets; risks related to disruption of management time from ongoing business operations due to the proposed transaction; the benefits from Ahold’s plans and strategies being less than anticipated; risks related to disruption of management time from ongoing business operations due to the proposed transaction; the effect of the announcement or completion of the proposed transaction on the ability of Ahold to retain customers and retain and attract employees who are integral to the success of the business; maintain relationships with suppliers, and on their operating results and businesses generally; litigation relating to the transaction; the effect of general economic or political conditions; fluctuations in exchange rates or interest rates; increases or changes in competition; changes in Ahold’s liquidity needs; the actions of competitors and third parties business and IT continuity; collective bargaining; distinctiveness; competitive advantage and economic condition; information security; legislative and regulatory environment and litigation risks; product safety; pension plan funding; strategic projects; responsible retailing; insurance and unforeseen tax liabilities and other factors discussed in Ahold’s public filings and other disclosures. Furthermore, this communication contains Ahold forward-looking statements as to its strategy to focus on quality and assortment improvements, outlook for the business, including but not limited to identical sales growth, delivery of a full-year performance in line with expectations, improvement of its customer proposition, the purchase and conversion of A&P stores as part of its acquisition by Stop & Shop New York Metro, continued investments in strengthening its leading position as an online retailer, initiatives to improve the performance of compact hypermarkets in Czech Republic, free cash flow, gross capital expenditure, including but not limited to the capital required for the conversion of the acquired A&P stores in the United States, the effect of improvements in accounting standards on the consolidated financial statements of Ahold and goodwill. The foregoing list of factors is not exhaustive. Investors and shareholders are cautioned not to place undue reliance on these forward-looking statements, which speak only as of the date of this communication. Ahold does not assume any obligation to update any public information or forward-looking statements in this communication to reflect subsequent events or circumstances, except as may be required by applicable laws. Outside the Netherlands, Koninklijke Ahold N.V., being its registered name, presents itself under the name of “Royal Ahold” or simply “Ahold.” Page 22/22
1FNREF2FNREF
1ENREF2ENREF
Interim report, Third quarter 2015
Other information
Page 15
Interim report, Third quarter 2015
Page 2
Interim report, Third quarter 2015
Management report