Table of Contents
UNITED STATES
SECURITIES AND EXCHANGE COMMISSION
Washington, D.C. 20549
FORM N-CSR
CERTIFIED SHAREHOLDER REPORT OF REGISTERED
MANAGEMENT INVESTMENT COMPANIES
Investment Company Act file number 811-09102
iShares, Inc.
(Exact name of Registrant as specified in charter)
c/o: State Street Bank and Trust Company
200 Clarendon Street, Boston, MA 02116
(Address of principal executive offices) (Zip code)
The Corporation Trust Incorporated
351 West Camden Street, Baltimore, MD 21201
(Name and address of agent for service)
Registrant’s telephone number, including area code: 415-670-2000
Date of fiscal year end: October 31, 2013
Date of reporting period: October 31, 2013
Table of Contents
Item 1. Reports to Stockholders.
Copies of the annual reports transmitted to shareholders pursuant to Rule 30e-1 under the Investment Company Act of 1940 are attached.
Table of Contents
OCTOBER 31, 2013
2013 ANNUAL REPORT |  |
iShares, Inc.
| Ø | iShares Emerging Markets Corporate Bond ETF | CEMB | BATS |
| Ø | iShares Emerging Markets High Yield Bond ETF | EMHY | BATS |
| Ø | iShares Emerging Markets Local Currency Bond ETF | LEMB | NYSE Arca |
| Ø | iShares Global ex USD High Yield Corporate Bond ETF | HYXU | BATS |
| Ø | iShares Global High Yield Corporate Bond ETF | GHYG | BATS |
Table of Contents
| 5 | ||||
| 16 | ||||
| 16 | ||||
| 17 | ||||
| 17 | ||||
| 23 | ||||
| 29 | ||||
| 32 | ||||
| 39 | ||||
| 59 | ||||
| 66 | ||||
| 71 | ||||
| 81 | ||||
| 82 | ||||
| 83 | ||||
| 97 | ||||
| 101 |
Table of Contents
Management’s Discussion of Fund Performance
iSHARES®, INC.
GLOBAL BOND MARKET OVERVIEW
Global bonds produced mixed results for the 12-month period ended October 31, 2013 (the “reporting period”). As the reporting period began, slowing global economic growth led central banks around the world to take more aggressive actions to stimulate economic activity. Most notably, the U.S. Federal Reserve Bank (the “Fed”) and the Bank of England increased their quantitative easing activity, while the Bank of Japan introduced quantitative easing measures for the first time.
By early 2013, global economic conditions began to improve, though the overall pace of growth remained subdued. In the U.S., signs of better economic growth included a five-year low in the unemployment rate (7.2% in September 2013), stronger vehicle sales, and a burgeoning recovery in the housing market. European economies stabilized, helping the euro zone emerge from an 18-month recession in the second and third quarters of 2013, while the U.K. economy benefited from growth in home construction and consumer spending. Meanwhile, the Bank of Japan’s aggressive economic stimulus efforts began to bear fruit as Japan reported positive economic growth for the three consecutive quarters ended September 30, 2013. In contrast, many of the largest emerging economies — including China, India, Russia, and Brazil — all experienced slowing economic growth in the first half of 2013.
Beyond the economic environment, the global fixed-income markets were also impacted by other events. Federal budget conflicts in the U.S. led to the fiscal cliff and the “sequester” in early 2013, which involved addressing expiring federal tax cuts and across-the-board spending reductions, as well as a two-week government shutdown over the federal debt ceiling in October 2013. In addition, the Fed signaled in May 2013 that it may taper its quantitative easing measures before the end of the year. Although the Fed delayed its tapering plans late in the reporting period, the Fed’s May announcement pushed bond yields higher in most regions of the world throughout the summer months.
For the reporting period, bond yields rose in the U.S. and the U.K., as well as in select core European bond markets, particularly Germany and the Netherlands. Yields in other core European markets, such as France and Belgium, were largely unchanged. Bond yields in peripheral European markets, such as Italy and Spain, fell significantly during the reporting period, benefiting from a pledge of support from the European Central Bank. Yields in Japan also declined during the reporting period, reflecting the more accommodative policies initiated by the Bank of Japan.
From a sector perspective, corporate bonds and other non-government securities outperformed government bonds on a global basis for the reporting period. This outperformance was driven in large part by strong and growing global demand for yield. Non-government securities typically have higher yields than government bonds, and increased investor demand for these higher-yielding securities contributed to their outperformance.
For U.S. investors, currency fluctuations had a mostly negative impact on global bond performance. A stronger U.S. dollar reduces returns on non-U.S. investments for U.S. investors, and the U.S. dollar appreciated by approximately 0.5% versus the British pound, 4.5% against the Canadian dollar, 9.5% versus the Australian dollar, and more than 20% against the Japanese yen (reflecting the changing central bank policies in the two countries). The main exception was the euro — the U.S. dollar depreciated by about 4.5% against the euro for the reporting period.
MANAGEMENT’S DISCUSSIONSOF FUND PERFORMANCE | 5 |
Table of Contents
Management’s Discussion of Fund Performance
iSHARES® EMERGING MARKETS CORPORATE BOND ETF
Performance as of October 31, 2013
| Average Annual Total Returns | Cumulative Total Returns | |||||||||||||||||||||||||
| NAV | MARKET | INDEX | NAV | MARKET | INDEX | |||||||||||||||||||||
1 Year | (1.07)% | (4.06)% | (0.68)% | (1.07)% | (4.06)% | (0.68)% | ||||||||||||||||||||
Since Inception | 4.22% | 2.81% | 4.73% | 6.59% | 4.37% | 7.35% | ||||||||||||||||||||
GROWTH OF $10,000 INVESTMENT
(SINCE INCEPTION AT NET ASSET VALUE)
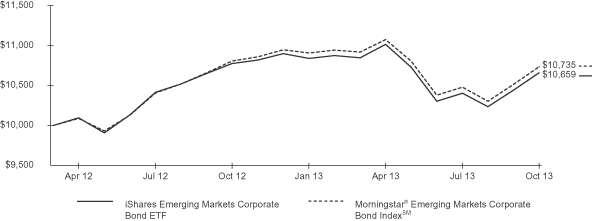
The inception date of the Fund was 4/17/12. The first day of secondary market trading was 4/19/12.
Past performance is no guarantee of future results. Performance results do not reflect the deduction of taxes that a shareholder would pay on fund distributions or on the redemption or sale of fund shares. See “About Fund Performance” on page 16 for more information.
| Shareholder Expenses | ||||||||||||||||||||||||||
| Actual | Hypothetical 5% Return | |||||||||||||||||||||||||
| Beginning Account Value (5/1/13) | Ending Account Value (10/31/13) | Expenses Paid During Period a | Beginning Account Value (5/1/13) | Ending Account Value (10/31/13) | Expenses Paid During Period a | Annualized Expense Ratio | ||||||||||||||||||||
| $ | 1,000.00 | $ | 967.80 | $ | 2.98 | $ | 1,000.00 | $ | 1,022.20 | $ | 3.06 | 0.60% | ||||||||||||||
| a | Expenses are calculated using the Fund’s annualized expense ratio (as disclosed in the table), multiplied by the average account value for the period, multiplied by the number of days in the period (184 days) and divided by the number of days in the year (365 days). See “Shareholder Expenses” on page 16 for more information. |
| 6 | 2013 iSHARES ANNUAL REPORTTO SHAREHOLDERS |
Table of Contents
Management’s Discussion of Fund Performance (Continued)
iSHARES® EMERGING MARKETS CORPORATE BOND ETF
The iShares Emerging Markets Corporate Bond ETF (the “Fund”), formerly the iShares Emerging Markets Corporate Bond Fund, seeks investment results that correspond generally to the price and yield performance, before fees and expenses, of the Morningstar® Emerging Markets Corporate Bond IndexSM (the “Index”). The Index measures the performance of the U.S. dollar-denominated emerging market corporate bond market. The Fund invests in a representative sample of securities included in the Index that collectively has an investment profile similar to the Index. Due to the use of representative sampling, the Fund may or may not hold all of the securities that are included in the Index. For the 12-month reporting period ended October 31, 2013, the total return for the Fund was -1.07%, net of fees, while the total return for the Index was -0.68%.
As represented by the Index, corporate bonds in emerging markets declined modestly for the reporting period. The negative returns for emerging markets corporate bonds were driven primarily by slowing growth in many emerging economies. Among the largest countries represented in the Index, Brazil’s year-over-year economic growth rate increased from 0.5% to 3.3% during the reporting period, but that was still below the country’s average growth rate over the past decade. Russia saw its 12-month economic growth rate decline from 3% to 1.2%, while Mexico’s economy slowed from 4.2% to 1.5%. Corporate bonds tend to perform well when economic growth is robust, and the economic weakness in emerging markets, especially when compared to improving growth in the U.S. and other developed countries, led to reduced investor demand for emerging markets corporate bonds.
All of the corporate bonds represented in the Index are denominated in U.S. dollars, so they are unaffected by currency fluctuations.
BOND CREDIT QUALITY
As of 10/31/13
| Moody’s Credit Rating | Percentage of Total Investments* |
Aa1 | 0.89 | % | ||
Aa2 | 0.83 | |||
Aa3 | 10.91 | |||
A1 | 6.95 | |||
A2 | 3.45 | |||
A3 | 6.51 | |||
Baa1 | 16.71 | |||
Baa2 | 13.62 | |||
Baa3 | 18.69 | |||
Ba1 | 3.65 | |||
Ba2 | 2.99 | |||
Ba3 | 2.67 | |||
B1 | 2.40 | |||
B2 | 0.59 | |||
Caa1 | 0.60 | |||
Caa2 | 0.26 | |||
Not Rated | 8.28 | |||
|
| |||
TOTAL | 100.00 | % | ||
|
|
TEN LARGEST COUNTRY ALLOCATIONS
As of 10/31/13
| Country | Percentage of Total Investments* |
Brazil | 18.54 | % | ||
Mexico | 10.80 | |||
Russia | 10.72 | |||
South Korea | 8.43 | |||
China | 7.59 | |||
United Arab Emirates | 5.58 | |||
India | 4.34 | |||
Hong Kong | 3.87 | |||
Qatar | 3.29 | |||
Venezuela | 2.94 | |||
|
| |||
TOTAL | 76.10 | % | ||
|
|
| * | Excludes money market funds. |
MANAGEMENT’S DISCUSSIONSOF FUND PERFORMANCE | 7 |
Table of Contents
Management’s Discussion of Fund Performance
iSHARES® EMERGING MARKETS HIGH YIELD BOND ETF
Performance as of October 31, 2013
| Average Annual Total Returns | Cumulative Total Returns | |||||||||||||||||||||||||
| NAV | MARKET | INDEX | NAV | MARKET | INDEX | |||||||||||||||||||||
1 Year | 0.14% | (1.44)% | 0.53% | 0.14% | (1.44)% | 0.53% | ||||||||||||||||||||
Since Inception | 6.43% | 6.31% | 7.02% | 10.36% | 10.15% | 11.27% | ||||||||||||||||||||
GROWTH OF $10,000 INVESTMENT
(SINCE INCEPTION AT NET ASSET VALUE)
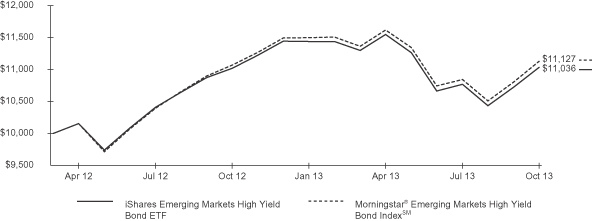
The inception date of the Fund was 4/3/12. The first day of secondary market trading was 4/3/12.
Past performance is no guarantee of future results. Performance results do not reflect the deduction of taxes that a shareholder would pay on fund distributions or on the redemption or sale of fund shares. See “About Fund Performance” on page 16 for more information.
| Shareholder Expenses | ||||||||||||||||||||||||||
| Actual | Hypothetical 5% Return | |||||||||||||||||||||||||
| Beginning Account Value (5/1/13) | Ending Account Value (10/31/13) | Expenses Paid During Period a | Beginning Account Value (5/1/13) | Ending Account Value (10/31/13) | Expenses Paid During Period a | Annualized Expense Ratio | ||||||||||||||||||||
| $ | 1,000.00 | $ | 955.60 | $ | 3.20 | $ | 1,000.00 | $ | 1,021.90 | $ | 3.31 | 0.65% | ||||||||||||||
| a | Expenses are calculated using the Fund’s annualized expense ratio (as disclosed in the table), multiplied by the average account value for the period, multiplied by the number of days in the period (184 days) and divided by the number of days in the year (365 days). See “Shareholder Expenses” on page 16 for more information. |
| 8 | 2013 iSHARES ANNUAL REPORTTO SHAREHOLDERS |
Table of Contents
Management’s Discussion of Fund Performance (Continued)
iSHARES® EMERGING MARKETS HIGH YIELD BOND ETF
The iShares Emerging Markets High Yield Bond ETF (the “Fund”), formerly the iShares Emerging Markets High Yield Bond Fund, seeks investment results that correspond generally to the price and yield performance, before fees and expenses, of the Morningstar® Emerging Markets High Yield Bond IndexSM (the “Index”). The Index measures the performance of the below-investment-grade U.S. dollar-denominated emerging market sovereign and corporate high yield bond market. The Fund invests in a representative sample of securities included in the Index that collectively has an investment profile similar to the Index. Due to the use of representative sampling, the Fund may or may not hold all of the securities that are included in the Index. For the 12-month reporting period ended October 31, 2013, the total return for the Fund was 0.14%, net of fees, while the total return for the Index was 0.53%.
As represented by the Index, high-yield bonds in emerging markets posted slightly positive returns for the reporting period despite rising interest rates, especially over the last six months in the wake of the announcement by the Fed that it planned to taper its economic stimulus efforts before the end of 2013. The announcement led to rising interest rates and falling bond prices around the globe, as well as a broad shift away from riskier assets. As part of this shift, high-yield bonds in emerging markets experienced a significant decline in investor demand throughout the summer of 2013. Slowing growth in many emerging economies, including some of the larger components of the Index (such as Venezuela, Indonesia, and Russia) also had a negative impact on high-yield bonds from emerging markets.
However, interest income helped the Index overcome the price declines. The relatively high yields of emerging markets bonds helped offset the price declines and attracted some investor demand, particularly late in the reporting period when the Fed decided to delay its tapering plans until economic conditions improved further.
All of the bonds represented in the Index are denominated in U.S. dollars, so they are unaffected by currency fluctuations.
BOND CREDIT QUALITY
As of 10/31/13
| Moody’s Credit Rating | Percentage of Total Investments* |
A3 | 0.27 | % | ||
Baa3 | 32.57 | |||
Ba1 | 16.01 | |||
Ba2 | 4.16 | |||
Ba3 | 6.53 | |||
B1 | 7.62 | |||
B2 | 11.02 | |||
B3 | 0.66 | |||
Caa1 | 5.41 | |||
Caa2 | 0.59 | |||
Caa3 | 0.42 | |||
Not Rated | 14.74 | |||
|
| |||
TOTAL | 100.00 | % | ||
|
|
TEN LARGEST COUNTRY ALLOCATIONS
As of 10/31/13
| Country | Percentage of Total Investments* |
Turkey | 15.13 | % | ||
Venezuela | 14.48 | |||
Indonesia | 12.86 | |||
Russia | 8.86 | |||
China | 4.38 | |||
Hungary | 3.79 | |||
Mexico | 3.79 | |||
Brazil | 3.77 | |||
Ukraine | 3.53 | |||
Lebanon | 3.17 | |||
|
| |||
TOTAL | 73.76 | % | ||
|
|
| * | Excludes money market funds. |
MANAGEMENT’S DISCUSSIONSOF FUND PERFORMANCE | 9 |
Table of Contents
Management’s Discussion of Fund Performance
iSHARES® EMERGING MARKETS LOCAL CURRENCY BOND ETF
Performance as of October 31, 2013
| Average Annual Total Returns | Cumulative Total Returns | |||||||||||||||||||||||||
| NAV | MARKET | INDEX | NAV | MARKET | INDEX | |||||||||||||||||||||
1 Year | 0.28% | (1.60)% | 0.57% | 0.28% | (1.60)% | 0.57% | ||||||||||||||||||||
Since Inception | 4.10% | 3.82% | 4.31% | 8.54% | 7.93% | 8.96% | ||||||||||||||||||||
GROWTH OF $10,000 INVESTMENT
(SINCE INCEPTION AT NET ASSET VALUE)
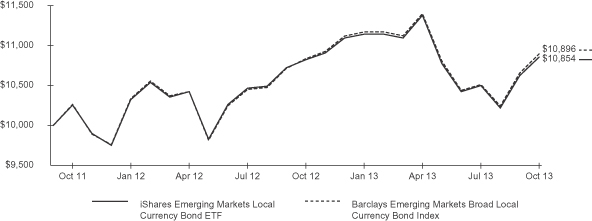
The inception date of the Fund was 10/18/11. The first day of secondary market trading was 10/20/11.
Past performance is no guarantee of future results. Performance results do not reflect the deduction of taxes that a shareholder would pay on fund distributions or on the redemption or sale of fund shares. See “About Fund Performance” on page 16 for more information.
| Shareholder Expenses | ||||||||||||||||||||||||||
| Actual | Hypothetical 5% Return | |||||||||||||||||||||||||
| Beginning Account Value (5/1/13) | Ending Account Value (10/31/13) | Expenses Paid During Period a | Beginning Account Value (5/1/13) | Ending Account Value (10/31/13) | Expenses Paid During Period a | Annualized Expense Ratio | ||||||||||||||||||||
| $ | 1,000.00 | $ | 953.90 | $ | 2.95 | $ | 1,000.00 | $ | 1,022.20 | $ | 3.06 | 0.60% | ||||||||||||||
| a | Expenses are calculated using the Fund’s annualized expense ratio (as disclosed in the table), multiplied by the average account value for the period, multiplied by the number of days in the period (184 days) and divided by the number of days in the year (365 days). See “Shareholder Expenses” on page 16 for more information. |
| 10 | 2013 iSHARES ANNUAL REPORTTO SHAREHOLDERS |
Table of Contents
Management’s Discussion of Fund Performance (Continued)
iSHARES® EMERGING MARKETS LOCAL CURRENCY BOND ETF
The iShares Emerging Markets Local Currency Bond ETF (the “Fund”), formerly the iShares Emerging Markets Local Currency Bond Fund, seeks investment results that correspond generally to the price and yield performance, before fees and expenses, of the Barclays Emerging Markets Broad Local Currency Bond Index (the “Index”). The Index measures the performance of local currency-denominated sovereign bond markets of emerging market countries. The Fund invests in a representative sample of securities included in the Index that collectively has an investment profile similar to the Index. Due to the use of representative sampling, the Fund may or may not hold all of the securities that are included in the Index. For the 12-month reporting period ended October 31, 2013, the total return for the Fund was 0.28%, net of fees, while the total return for the Index was 0.57%.
As represented by the Index, emerging markets bonds issued in local currencies posted slightly positive returns for the reporting period despite rising interest rates, especially over the last six months in the wake of the announcement by the Fed that it planned to taper its economic stimulus efforts before the end of 2013. The announcement led to rising interest rates and falling bond prices around the globe, as well as a broad shift away from riskier assets. As part of this shift, emerging markets bonds, many of which have lower credit ratings than bonds issued by the governments of developed countries, experienced a significant decline in investor demand throughout the summer of 2013.
However, interest income helped the Index overcome the price declines. The relatively high yields of emerging markets bonds helped offset much of the price declines.
In addition, currency fluctuations had a mixed but generally positive overall impact on Index performance. A weaker U.S. dollar increases returns on non-U.S. investments for U.S. investors, and the U.S. dollar depreciated by 2.5% against the South Korean won, 3.5% versus the Polish zloty, and 0.5% against the Mexican peso. Bonds denominated in these currencies comprised approximately 35% of the Index as of October 31, 2013.
BOND CREDIT QUALITY
As of 10/31/13
| Moody’s Credit Rating | Percentage of Total Investments* |
Aa3 | 21.32 | % | ||
A1 | 4.13 | |||
A2 | 4.95 | |||
A3 | 4.59 | |||
Baa1 | 20.93 | |||
Baa2 | 13.57 | |||
Baa3 | 14.87 | |||
Ba1 | 3.56 | |||
Ba3 | 0.79 | |||
Caa1 | 0.34 | |||
Not Rated | 10.95 | |||
|
| |||
TOTAL | 100.00 | % | ||
|
|
| * | Excludes money market funds. |
TEN LARGEST COUNTRY ALLOCATIONS
As of 10/31/13
| Country | Percentage of Total Investments* |
South Korea | 21.25 | % | ||
Brazil | 12.53 | |||
Mexico | 7.57 | |||
Poland | 6.83 | |||
Malaysia | 4.59 | |||
Turkey | 4.55 | |||
Indonesia | 4.54 | |||
Israel | 4.53 | |||
South Africa | 4.52 | |||
Thailand | 4.49 | |||
|
| |||
TOTAL | 75.40 | % | ||
|
|
MANAGEMENT’S DISCUSSIONSOF FUND PERFORMANCE | 11 |
Table of Contents
Management’s Discussion of Fund Performance
iSHARES® GLOBAL EX USD HIGH YIELD CORPORATE BOND ETF
Performance as of October 31, 2013
| Average Annual Total Returns | Cumulative Total Returns | |||||||||||||||||||||||||
| NAV | MARKET | INDEX | NAV | MARKET | INDEX | |||||||||||||||||||||
1 Year | 15.20% | 15.57% | 15.10% | 15.20% | 15.57% | 15.10% | ||||||||||||||||||||
Since Inception | 13.80% | 14.21% | 13.76% | 22.68% | 23.37% | 22.51% | ||||||||||||||||||||
GROWTH OF $10,000 INVESTMENT
(SINCE INCEPTION AT NET ASSET VALUE)
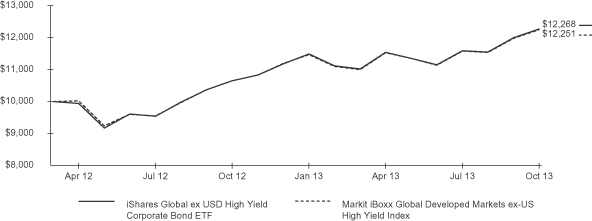
The inception date of the Fund was 4/3/12. The first day of secondary market trading was 4/3/12.
Past performance is no guarantee of future results. Performance results do not reflect the deduction of taxes that a shareholder would pay on fund distributions or on the redemption or sale of fund shares. See “About Fund Performance” on page 16 for more information.
| Shareholder Expenses | ||||||||||||||||||||||||||
| Actual | Hypothetical 5% Return | |||||||||||||||||||||||||
| Beginning Account Value (5/1/13) | Ending Account Value (10/31/13) | Expenses Paid During Period a | Beginning Account Value (5/1/13) | Ending Account Value (10/31/13) | Expenses Paid During Period a | Annualized Expense Ratio | ||||||||||||||||||||
| $ | 1,000.00 | $ | 1,063.00 | $ | 2.08 | $ | 1,000.00 | $ | 1,023.20 | $ | 2.04 | 0.40% | ||||||||||||||
| a | Expenses are calculated using the Fund’s annualized expense ratio (as disclosed in the table), multiplied by the average account value for the period, multiplied by the number of days in the period (184 days) and divided by the number of days in the year (365 days). See “Shareholder Expenses” on page 16 for more information. |
| 12 | 2013 iSHARES ANNUAL REPORTTO SHAREHOLDERS |
Table of Contents
Management’s Discussion of Fund Performance (Continued)
iSHARES® GLOBAL EX USD HIGH YIELD CORPORATE BOND ETF
The iShares Global ex USD High Yield Corporate Bond ETF (the “Fund”), formerly the iShares Global ex USD High Yield Corporate Bond Fund, seeks investment results that correspond generally to the price and yield performance, before fees and expenses, of the Markit iBoxx Global Developed Markets ex-US High Yield Index (the “Index”). The Index is a rules-based index designed to provide a broad representation of the global ex-U.S. dollar high yield corporate bond market and consists of high yield corporate bonds denominated in euros, British pounds sterling and Canadian dollars. The Fund invests in a representative sample of securities included in the Index that collectively has an investment profile similar to the Index. Due to the use of representative sampling, the Fund may or may not hold all of the securities that are included in the Index. For the 12-month reporting period ended October 31, 2013, the total return for the Fund was 15.20%, net of fees, while the total return for the Index was 15.10%.
As represented by the Index, international high-yield corporate bonds posted solid gains for the reporting period. High-yield corporate bonds around the world benefited from improving economic growth in many developed regions of the world, particularly in the U.S. and Europe (the U.K. and countries in the euro zone together represented more than 90% of the Index as of the end of the reporting period). In addition, strong investor demand for yield provided another leg of support for high-yield corporate bonds. This yield advantage helped attract investor demand to the high-yield segment of the international bond market.
Currency fluctuations also contributed positively to Index performance for the reporting period. As of October 31, 2013, more than 80% of the bonds in the Index were denominated in euros. The euro appreciated by approximately 4.5% versus the U.S. dollar for the reporting period, and a weaker U.S. dollar increases returns on non-U.S. investments for U.S. investors. Among the remaining currencies represented in the Index, the U.S. dollar rallied by 0.5% against the British pound and 4.5% versus the Canadian dollar, which reduced returns on high-yield bonds in these two countries.
BOND CREDIT QUALITY
As of 10/31/13
| Moody’s Credit Rating | Percentage of Total Investments* | |||
Baa2 | 0.60 | % | ||
Baa3 | 0.60 | |||
Ba1 | 17.11 | |||
Ba2 | 19.19 | |||
Ba3 | 12.71 | |||
B1 | 13.95 | |||
B2 | 9.12 | |||
B3 | 8.95 | |||
Caa1 | 6.82 | |||
Caa2 | 1.40 | |||
Caa3 | 0.29 | |||
Ca | 0.38 | |||
C | 0.38 | |||
Not Rated | 8.50 | |||
|
| |||
TOTAL | 100.00 | % | ||
|
| |||
TEN LARGEST COUNTRY ALLOCATIONS
As of 10/31/13
| Country | Percentage of Total Investments* | |||
Luxembourg | 15.92 | % | ||
France | 14.85 | |||
Netherlands | 13.91 | |||
Germany | 12.23 | |||
United Kingdom | 11.09 | |||
Italy | 9.38 | |||
Spain | 5.88 | |||
Canada | 4.24 | |||
Portugal | 3.47 | |||
Ireland | 3.30 | |||
|
| |||
TOTAL | 94.27 | % | ||
|
| |||
| * | Excludes money market funds. |
MANAGEMENT’S DISCUSSIONSOF FUND PERFORMANCE | 13 |
Table of Contents
Management’s Discussion of Fund Performance
iSHARES® GLOBAL HIGH YIELD CORPORATE BOND ETF
Performance as of October 31, 2013
| Average Annual Total Returns | Cumulative Total Returns | |||||||||||||||||||||||||
| NAV | MARKET | INDEX | NAV | MARKET | INDEX | |||||||||||||||||||||
1 Year | 9.50% | 9.50% | 9.55% | 9.50% | 9.50% | 9.55% | ||||||||||||||||||||
Since Inception | 10.23% | 10.55% | 10.47% | 16.65% | 17.18% | 16.97% | ||||||||||||||||||||
GROWTH OF $10,000 INVESTMENT
(SINCE INCEPTION AT NET ASSET VALUE)
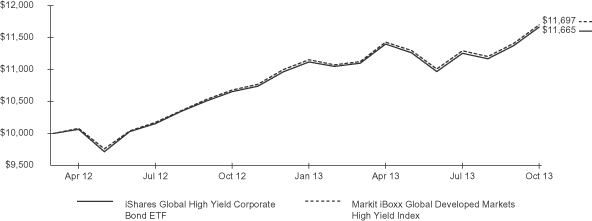
The inception date of the Fund was 4/3/12. The first day of secondary market trading was 4/5/12.
Past performance is no guarantee of future results. Performance results do not reflect the deduction of taxes that a shareholder would pay on fund distributions or on the redemption or sale of fund shares. See “About Fund Performance” on page 16 for more information.
| Shareholder Expenses | ||||||||||||||||||||||||||
| Actual | Hypothetical 5% Return | |||||||||||||||||||||||||
| Beginning Account Value (5/1/13) | Ending Account Value (10/31/13) | Expenses Paid During Period a | Beginning Account Value (5/1/13) | Ending Account Value (10/31/13) | Expenses Paid During Period a | Annualized Expense Ratio | ||||||||||||||||||||
| $ | 1,000.00 | $ | 1,023.10 | $ | 2.04 | $ | 1,000.00 | $ | 1,023.20 | $ | 2.04 | 0.40% | ||||||||||||||
| a | Expenses are calculated using the Fund’s annualized expense ratio (as disclosed in the table), multiplied by the average account value for the period, multiplied by the number of days in the period (184 days) and divided by the number of days in the year (365 days). See “Shareholder Expenses” on page 16 for more information. |
| 14 | 2013 iSHARES ANNUAL REPORTTO SHAREHOLDERS |
Table of Contents
Management’s Discussion of Fund Performance (Continued)
iSHARES® GLOBAL HIGH YIELD CORPORATE BOND ETF
The iShares Global High Yield Corporate Bond ETF (the “Fund”), formerly the iShares Global High Yield Corporate Bond Fund, seeks investment results that correspond generally to the price and yield performance, before fees and expenses, of the Markit iBoxx Global Developed Markets High Yield Index (the “Index”). The Index is a rules-based index designed to provide a broad representation of the global high yield corporate bond market and consists of high yield corporate bonds denominated in U.S. dollars, euros, British pounds sterling and Canadian dollars. The Fund invests in a representative sample of securities included in the Index that collectively has an investment profile similar to the Index. Due to the use of representative sampling, the Fund may or may not hold all of the securities that are included in the Index. For the 12-month reporting period ended October 31, 2013, the total return for the Fund was 9.50%, net of fees, while the total return for the Index was 9.55%.
As represented by the Index, global high-yield corporate bonds posted solid gains for the reporting period. High-yield corporate bonds benefited from improving economic growth in many developed regions of the world, particularly in the U.S. and Europe (which together represented nearly 95% of the Index as of the end of the reporting period). In addition, strong investor demand for yield provided another leg of support for global high-yield corporate bonds. This yield advantage helped attract investor demand to the high-yield segment of the global bond market.
Currency fluctuations also contributed positively to Index performance for the reporting period. Although U.S. high-yield bonds comprised more than 60% of Index as of October 31, 2013, the bulk of the non-U.S. bonds in the Index were denominated in euros. The euro appreciated by approximately 4.5% versus the U.S. dollar for the reporting period, and a weaker U.S. dollar increases returns on non-U.S. investments for U.S. investors. Among the remaining currencies represented in the Index, the U.S. dollar rallied by 0.5% against the British pound and 4.5% versus the Canadian dollar, which reduced returns on high-yield bonds in these two countries.
BOND CREDIT QUALITY
As of 10/31/13
| Moody’s Credit Rating | Percentage of Total Investments* |
Baa2 | 0.20 | % | ||
Baa3 | 0.47 | |||
Ba1 | 10.46 | |||
Ba2 | 14.42 | |||
Ba3 | 19.22 | |||
B1 | 20.48 | |||
B2 | 9.05 | |||
B3 | 11.90 | |||
Caa1 | 7.16 | |||
Caa2 | 2.79 | |||
Caa3 | 0.37 | |||
Ca | 0.26 | |||
Not Rated | 3.22 | |||
|
| |||
TOTAL | 100.00 | % | ||
|
|
TEN LARGEST COUNTRY ALLOCATIONS
As of 10/31/13
| Country | Percentage of Total Investments* |
United States | 63.33 | % | ||
Luxembourg | 7.05 | |||
United Kingdom | 4.69 | |||
France | 4.62 | |||
Germany | 4.35 | |||
Netherlands | 3.95 | |||
Canada | 3.03 | |||
Italy | 2.42 | |||
Ireland | 1.65 | |||
Spain | 1.63 | |||
|
| |||
TOTAL | 96.72 | % | ||
|
|
| * | Excludes money market funds. |
MANAGEMENT’S DISCUSSIONSOF FUND PERFORMANCE | 15 |
Table of Contents
Past performance is no guarantee of future results. Current performance may be lower or higher than the performance data quoted. Performance data current to the most recent month-end is available at www.iShares.com. Performance results assume reinvestment of all dividends and capital gain distributions and do not reflect the deduction of taxes that a shareholder would pay on fund distributions or on the redemption or sale of fund shares. The investment return and principal value of shares will vary with changes in market conditions. Shares may be worth more or less than their original cost when they are redeemed or sold in the market. Performance for certain funds may reflect a waiver of a portion of investment management fees. Without such waiver, performance would have been lower.
Net asset value or “NAV” is the value of one share of a fund as calculated in accordance with the standard formula for valuing mutual fund shares. The price used to calculate market return (“Market Price”) is determined by using the midpoint between the highest bid and the lowest offer on the primary stock exchange on which shares of a fund are listed for trading, as of the time that such fund’s NAV is calculated. Since shares of a fund may not have traded in the secondary market until after the fund’s inception, for the period from inception to the first day of secondary trading, the NAV of the fund is used as a proxy for the Market Price to calculate market returns. Market and NAV returns assume that dividends and capital gain distributions have been reinvested at Market Price and NAV, respectively.
An index is a statistical composite that tracks a specified financial market or sector. Unlike a fund, an index does not actually hold a portfolio of securities and therefore does not incur the expenses incurred by a fund. These expenses negatively impact fund performance. Also, market returns do not include brokerage commissions that may be payable on secondary market transactions. If brokerage commissions were included, market returns would be lower.
As a shareholder of a Fund, you incur two types of costs: (1) transaction costs, including brokerage commissions on purchases and sales of fund shares and (2) ongoing costs, including management fees and other fund expenses. The expense example, which is based on an investment of $1,000 invested on May 1, 2013 and held through October 31, 2013, is intended to help you understand your ongoing costs (in dollars and cents) of investing in a Fund and to compare these costs with the ongoing costs of investing in other funds.
Actual Expenses — The table provides information about actual account values and actual expenses. To estimate the expenses that you paid on your account over the period, simply divide your account value by $1,000 (for example, an $8,600 account value divided by $1,000 = 8.6), then multiply the result by the number for your Fund under the heading entitled “Expenses Paid During Period.”
Hypothetical Example for Comparison Purposes — The table also provides information about hypothetical account values and hypothetical expenses based on each Fund’s actual expense ratio and an assumed rate of return of 5% per year before expenses. You may use this information to compare the ongoing costs of investing in your Fund and other funds. To do so, compare this 5% hypothetical example with the 5% hypothetical examples that appear in the shareholder reports of the other funds.
Please note that the expenses shown in the table are meant to highlight your ongoing costs only and do not reflect any transactional costs, such as brokerage commissions paid on purchases and sales of fund shares. Therefore, the hypothetical examples are useful in comparing ongoing costs only and will not help you determine the relative total costs of owning different funds. In addition, if these transactional costs were included, your costs would have been higher.
| 16 | 2013 iSHARES ANNUAL REPORTTO SHAREHOLDERS |
Table of Contents
iSHARES® EMERGING MARKETS CORPORATE BOND ETF
October 31, 2013
| Security | Principal (000s) | Value | ||||||
CORPORATE BONDS & NOTESa — 50.20% |
| |||||||
BRAZIL — 11.11% |
| |||||||
Banco Bradesco SA | ||||||||
5.90%, 01/16/21b | $ | 100 | $ | 102,750 | ||||
6.75%, 09/29/19b | 150 | 165,900 | ||||||
Banco BTG Pactual SA | ||||||||
4.00%, 01/16/20b | 200 | 181,300 | ||||||
Banco Santander Brasil SA | ||||||||
4.50%, 04/06/15b | 100 | 103,500 | ||||||
Banco Votorantim SA | ||||||||
7.38%, 01/21/20b | 100 | 108,000 | ||||||
Braskem Finance Ltd. | ||||||||
7.00%, 05/07/20b | 100 | 109,250 | ||||||
7.25%, 06/05/18b | 100 | 111,500 | ||||||
BRF SA | ||||||||
3.95%, 05/22/23b | 200 | 180,000 | ||||||
CSN Resources SA | ||||||||
6.50%, 07/21/20b | 100 | 102,250 | ||||||
Fibria Overseas Finance Ltd. | ||||||||
7.50%, 05/04/20 (Call 05/04/15)b | 100 | 110,000 | ||||||
Gerdau Trade Inc. | ||||||||
5.75%, 01/30/21b | 100 | 103,100 | ||||||
GTL Trade Finance Inc. | ||||||||
7.25%, 10/20/17b | 200 | 223,500 | ||||||
Itau Unibanco Holding SA | ||||||||
5.50%, 08/06/22b | 200 | 197,000 | ||||||
5.75%, 01/22/21b | 200 | 203,600 | ||||||
6.20%, 04/15/20b | 100 | 107,000 | ||||||
JBS USA LLC/JBS USA Finance Inc. | ||||||||
7.25%, 06/01/21 (Call 06/01/15)b | 86 | 88,365 | ||||||
8.25%, 02/01/20 (Call 02/01/15)b | 63 | 67,568 | ||||||
Marfrig Overseas Ltd. | ||||||||
9.50%, 05/04/20 (Call 05/04/15)b | 100 | 96,500 | ||||||
Odebrecht Drilling Norbe VIII/IX Ltd. | ||||||||
6.35%, 06/30/21 (Call 06/30/20)b | 94 | 99,303 | ||||||
Odebrecht Finance Ltd. | ||||||||
4.38%, 04/25/25b | 200 | 179,500 | ||||||
Telemar Norte Leste SA | ||||||||
5.50%, 10/23/20b | 200 | 192,000 | ||||||
Vale Overseas Ltd. | ||||||||
4.38%, 01/11/22 | 200 | 195,704 | ||||||
4.63%, 09/15/20 | 75 | 77,633 | ||||||
5.63%, 09/15/19 | 75 | 82,247 | ||||||
| Security | Principal (000s) | Value | ||||||
6.25%, 01/23/17 | $ | 75 | $ | 83,805 | ||||
6.88%, 11/21/36 | 169 | 175,762 | ||||||
6.88%, 11/10/39 | 100 | 103,443 | ||||||
8.25%, 01/17/34 | 50 | 58,404 | ||||||
Vale SA | ||||||||
5.63%, 09/11/42 | 100 | 90,257 | ||||||
Voto Votorantim Overseas Trading Co. | ||||||||
6.63%, 09/25/19b | 200 | 227,300 | ||||||
|
| |||||||
| 3,926,441 | ||||||||
CHILE — 0.54% |
| |||||||
Celulosa Arauco y Constitucion SA | ||||||||
4.75%, 01/11/22 (Call 10/11/21) | 37 | 36,253 | ||||||
Cencosud SA | ||||||||
5.50%, 01/20/21b | 150 | 155,552 | ||||||
|
| |||||||
| 191,805 | ||||||||
CHINA — 4.38% |
| |||||||
Agile Property Holdings Ltd. | ||||||||
8.88%, 04/28/17 (Call 04/28/14)b | 200 | 210,500 | ||||||
Baidu Inc. | ||||||||
2.25%, 11/28/17 | 200 | 198,530 | ||||||
China Overseas Finance II Ltd. | ||||||||
5.50%, 11/10/20b | 200 | 211,381 | ||||||
Evergrande Real Estate Group Ltd. | ||||||||
13.00%, 01/27/15b | 100 | 107,250 | ||||||
Kaisa Group Holdings Ltd. | ||||||||
8.88%, 03/19/18 (Call 03/19/16)b | 200 | 204,000 | ||||||
Longfor Properties Co. Ltd. | ||||||||
9.50%, 04/07/16 (Call 04/07/14)b | 200 | 213,500 | ||||||
Shimao Property Holdings Ltd. | ||||||||
9.65%, 08/03/17 (Call 08/03/14)b | 200 | 215,240 | ||||||
State Grid Overseas Investment 2013 Ltd. | ||||||||
3.13%, 05/22/23b | 200 | 188,607 | ||||||
|
| |||||||
| 1,549,008 | ||||||||
COLOMBIA — 1.40% |
| |||||||
Banco Davivienda SA | ||||||||
2.95%, 01/29/18b | 200 | 195,000 | ||||||
Bancolombia SA | ||||||||
5.13%, 09/11/22 | 50 | 47,750 | ||||||
6.13%, 07/26/20 | 147 | 155,085 | ||||||
Pacific Rubiales Energy Corp. | ||||||||
5.13%, 03/28/23 (Call 03/28/18)b | 100 | 95,750 | ||||||
|
| |||||||
| 493,585 | ||||||||
SCHEDULESOF INVESTMENTS | 17 |
Table of Contents
Schedule of Investments (Continued)
iSHARES® EMERGING MARKETS CORPORATE BOND ETF
October 31, 2013
| Security | Principal (000s) | Value | ||||||
HONG KONG — 3.80% |
| |||||||
Bank of China Hong Kong Ltd. | ||||||||
5.55%, 02/11/20b | $ | 200 | $ | 218,372 | ||||
Bank of East Asia Ltd. | ||||||||
6.13%, 07/16/20 | 100 | 111,975 | ||||||
CITIC Pacific Ltd. | ||||||||
6.63%, 04/15/21b | 100 | 97,500 | ||||||
Hongkong Land Finance (Cayman Island) Co. Ltd. (The) | ||||||||
4.50%, 10/07/25 | 100 | 99,057 | ||||||
Hutchison Whampoa Finance (CI) Ltd. | ||||||||
7.45%, 08/01/17b | 100 | 119,292 | ||||||
Hutchison Whampoa International Ltd. | ||||||||
4.63%, 09/11/15b | 100 | 106,366 | ||||||
7.45%, 11/24/33b | 100 | 129,047 | ||||||
7.63%, 04/09/19b | 200 | 243,535 | ||||||
Li & Fung Ltd. | ||||||||
5.25%, 05/13/20b | 100 | 106,525 | ||||||
Swire Pacific MTN Financing Ltd. | ||||||||
5.50%, 08/19/19b | 100 | 111,507 | ||||||
|
| |||||||
| 1,343,176 | ||||||||
INDIA — 3.69% |
| |||||||
Axis Bank Ltd. | ||||||||
4.75%, 05/02/16b | 100 | 103,085 | ||||||
Bharti Airtel International Netherlands BV | ||||||||
5.13%, 03/11/23b | 200 | 187,500 | ||||||
ICICI Bank Ltd. | ||||||||
5.00%, 01/15/16b | 116 | 120,869 | ||||||
5.75%, 11/16/20b | 100 | 103,599 | ||||||
6.38%, 04/30/22 (Call 04/30/17)b,c | 100 | 95,000 | ||||||
Reliance Holdings USA Inc. | ||||||||
5.40%, 02/14/22b | 250 | 255,612 | ||||||
State Bank of India | ||||||||
4.50%, 07/27/15b | 100 | 103,089 | ||||||
Vedanta Resources PLC | ||||||||
9.50%, 07/18/18b | 300 | 333,360 | ||||||
|
| |||||||
| 1,302,114 | ||||||||
ISRAEL — 0.39% |
| |||||||
Teva Pharmaceutical Finance Co. BV | ||||||||
2.95%, 12/18/22 | 150 | 139,112 | ||||||
|
| |||||||
| 139,112 | ||||||||
| Security | Principal (000s) | Value | ||||||
JAMAICA — 0.85% |
| |||||||
Digicel Group Ltd. | ||||||||
10.50%, 04/15/18 (Call 04/15/14)b | $ | 100 | $ | 108,000 | ||||
Digicel Ltd. | ||||||||
6.00%, 04/15/21 (Call 04/15/16)b | 200 | 194,000 | ||||||
|
| |||||||
| 302,000 | ||||||||
KAZAKHSTAN — 0.30% |
| |||||||
Halyk Savings Bank of Kazakhstan JSC | ||||||||
7.25%, 05/03/17b | 100 | 107,000 | ||||||
|
| |||||||
| 107,000 | ||||||||
KUWAIT — 0.34% |
| |||||||
Kuwait Projects Co. | ||||||||
9.38%, 07/15/20 | 100 | 120,000 | ||||||
|
| |||||||
| 120,000 | ||||||||
MEXICO — 5.39% |
| |||||||
America Movil SAB de CV | ||||||||
3.13%, 07/16/22 | 200 | 188,324 | ||||||
5.00%, 10/16/19 | 125 | 137,871 | ||||||
5.00%, 03/30/20 | 200 | 218,950 | ||||||
5.75%, 01/15/15 | 60 | 63,340 | ||||||
6.13%, 03/30/40 | 100 | 106,953 | ||||||
6.38%, 03/01/35 | 50 | 54,660 | ||||||
BBVA Bancomer SA Texas Agency | ||||||||
7.25%, 04/22/20b | 300 | 328,500 | ||||||
Cemex Espana SA (Luxembourg) | ||||||||
9.25%, 05/12/20 (Call 05/12/15)b | 100 | 109,000 | ||||||
Cemex Finance LLC | ||||||||
9.38%, 10/12/22 (Call 10/12/17)b | 200 | 224,500 | ||||||
Cemex SAB de CV | ||||||||
9.00%, 01/11/18 (Call 01/11/15)b | 200 | 217,500 | ||||||
Grupo Bimbo SAB de CV | ||||||||
4.50%, 01/25/22b | 100 | 102,109 | ||||||
Grupo Televisa SAB de CV CPO | ||||||||
6.63%, 01/15/40 | 56 | 62,046 | ||||||
NII Capital Corp. | ||||||||
7.63%, 04/01/21 (Call 04/01/16) | 100 | 58,000 | ||||||
8.88%, 12/15/19 (Call 12/15/14) | 50 | 31,250 | ||||||
|
| |||||||
| 1,903,003 | ||||||||
PERU — 1.24% |
| |||||||
Banco de Credito del Peru | ||||||||
5.38%, 09/16/20b | 100 | 105,750 | ||||||
6.13%, 04/24/27 (Call 04/24/22)b,c | 100 | 104,500 | ||||||
| 18 | 2013 iSHARES ANNUAL REPORTTO SHAREHOLDERS |
Table of Contents
Schedule of Investments (Continued)
iSHARES® EMERGING MARKETS CORPORATE BOND ETF
October 31, 2013
| Security | Principal (000s) | Value | ||||||
Southern Copper Corp. | ||||||||
5.25%, 11/08/42 | $ | 90 | $ | 74,427 | ||||
6.75%, 04/16/40 | 48 | 47,321 | ||||||
7.50%, 07/27/35 | 100 | 106,890 | ||||||
|
| |||||||
| 438,888 | ||||||||
QATAR — 0.84% |
| |||||||
Ras Laffan Liquefied Natural Gas Co. Ltd. III | ||||||||
6.75%, 09/30/19b | 250 | 297,500 | ||||||
|
| |||||||
| 297,500 | ||||||||
RUSSIA — 5.63% |
| |||||||
Alfa Bank OJSC Via Alfa Bond Issuance PLC | ||||||||
7.88%, 09/25/17b | 300 | 336,372 | ||||||
Evraz Group SA | ||||||||
9.50%, 04/24/18b | 200 | 219,500 | ||||||
LUKOIL International Finance BV | ||||||||
3.42%, 04/24/18b | 200 | 201,500 | ||||||
6.66%, 06/07/22b | 120 | 134,850 | ||||||
7.25%, 11/05/19b | 100 | 116,670 | ||||||
Metalloinvest Finance Ltd. | ||||||||
5.63%, 04/17/20b | 200 | 199,000 | ||||||
MTS International Funding Ltd. | ||||||||
8.63%, 06/22/20b | 100 | 120,500 | ||||||
Rosneft Finance SA | ||||||||
7.25%, 02/02/20b | 100 | 114,250 | ||||||
Severstal OAO Via Steel Capital SA | ||||||||
6.70%, 10/25/17b | 200 | 214,500 | ||||||
Vimpel Communications Via VIP Finance Ireland Ltd. OJSC | ||||||||
9.13%, 04/30/18b | 100 | 116,750 | ||||||
VimpelCom Holdings BV | ||||||||
7.50%, 03/01/22b | 200 | 214,500 | ||||||
|
| |||||||
| 1,988,392 | ||||||||
SINGAPORE — 2.64% |
| |||||||
DBS Bank Ltd. | ||||||||
2.35%, 02/28/17b | 200 | 204,885 | ||||||
Flextronics International Ltd. | ||||||||
4.63%, 02/15/20 | 100 | 100,250 | ||||||
Noble Group Ltd. | ||||||||
6.75%, 01/29/20b | 100 | 105,375 | ||||||
Oversea-Chinese Banking Corp. Ltd. | ||||||||
3.75%, 11/15/22 (Call 11/15/17)b,c | 100 | 103,341 | ||||||
| Security | Principal (000s) | Value | ||||||
4.25%, 11/18/19 (Call 11/18/14)c | $ | 100 | $ | 102,449 | ||||
PSA International Pte Ltd. | ||||||||
3.88%, 02/11/21b | 100 | 103,222 | ||||||
SingTel Group Treasury Pte Ltd. | ||||||||
4.50%, 09/08/21b | 200 | 212,288 | ||||||
|
| |||||||
| 931,810 | ||||||||
SOUTH AFRICA — 0.58% |
| |||||||
AngloGold Ashanti Holdings PLC | ||||||||
5.13%, 08/01/22 | 50 | 44,444 | ||||||
5.38%, 04/15/20 | 50 | 47,723 | ||||||
Standard Bank PLC | ||||||||
8.13%, 12/02/19 | 100 | 112,125 | ||||||
|
| |||||||
| 204,292 | ||||||||
SOUTH KOREA — 3.12% |
| |||||||
Hana Bank | ||||||||
4.00%, 11/03/16b | 200 | 211,826 | ||||||
Hyundai Capital America | ||||||||
2.13%, 10/02/17b | 50 | 50,250 | ||||||
Hyundai Capital Services Inc. | ||||||||
6.00%, 05/05/15b | 200 | 213,618 | ||||||
Korea Electric Power Corp. | ||||||||
3.00%, 10/05/15b | 100 | 103,136 | ||||||
POSCO | ||||||||
4.25%, 10/28/20b | 200 | 207,169 | ||||||
Shinhan Bank | ||||||||
4.38%, 09/15/15b | 200 | 210,673 | ||||||
Woori Bank Co. Ltd. | ||||||||
6.21%, 05/02/37 (Call 05/02/17)b,c | 100 | 105,000 | ||||||
|
| |||||||
| 1,101,672 | ||||||||
THAILAND — 0.92% |
| |||||||
Bangkok Bank PCL | ||||||||
4.80%, 10/18/20b | 100 | 105,787 | ||||||
PTTEP Canada International Finance Ltd. | ||||||||
5.69%, 04/05/21b | 200 | 219,329 | ||||||
|
| |||||||
| 325,116 | ||||||||
TURKEY — 2.20% |
| |||||||
Akbank TAS | ||||||||
5.00%, 10/24/22b | 200 | 189,100 | ||||||
Turkiye Is Bankasi AS | ||||||||
3.88%, 11/07/17b | 200 | 194,760 | ||||||
Turkiye Vakiflar Bankasi Tao | ||||||||
5.75%, 04/24/17b | 200 | 207,760 | ||||||
SCHEDULESOF INVESTMENTS | 19 |
Table of Contents
Schedule of Investments (Continued)
iSHARES® EMERGING MARKETS CORPORATE BOND ETF
October 31, 2013
| Security | Principal (000s) | Value | ||||||
Yapi ve Kredi Bankasi AS | ||||||||
4.00%, 01/22/20b | $ | 200 | $ | 184,000 | ||||
|
| |||||||
| 775,620 | ||||||||
UKRAINE — 0.28% |
| |||||||
Metinvest BV | ||||||||
10.25%, 05/20/15b | 100 | 100,000 | ||||||
|
| |||||||
| 100,000 | ||||||||
UNITED ARAB EMIRATES — 0.56% | ||||||||
Emirates NBD PJSC | ||||||||
4.88%, 03/28/23b,c | 200 | 197,766 | ||||||
|
| |||||||
| 197,766 | ||||||||
|
| |||||||
TOTAL CORPORATE BONDS & NOTES |
| |||||||
(Cost: $18,116,395) |
| 17,738,300 | ||||||
FOREIGN AGENCY OBLIGATIONSa — 48.02% |
| |||||||
BRAZIL — 7.10% |
| |||||||
Banco do Brasil SA | ||||||||
5.38%, 01/15/21b | 100 | 100,000 | ||||||
5.88%, 01/19/23b | 200 | 198,000 | ||||||
Banco Nacional de Desenvolvimento Economico e Social | ||||||||
6.37%, 06/16/18b | 100 | 110,000 | ||||||
6.50%, 06/10/19b | 100 | 110,375 | ||||||
Caixa Economica Federal | ||||||||
2.38%, 11/06/17b | 150 | 142,500 | ||||||
Centrais Eletricas Brasileiras SA | ||||||||
6.88%, 07/30/19b | 200 | 218,500 | ||||||
Petrobras Global Finance BV | ||||||||
4.38%, 05/20/23 | 100 | 92,409 | ||||||
5.63%, 05/20/43 | 100 | 85,492 | ||||||
Petrobras International Finance Co. | ||||||||
3.50%, 02/06/17 | 75 | 76,126 | ||||||
3.88%, 01/27/16 | 200 | 206,770 | ||||||
5.38%, 01/27/21 | 375 | 381,290 | ||||||
5.75%, 01/20/20 | 150 | 158,439 | ||||||
5.88%, 03/01/18 | 100 | 108,106 | ||||||
6.75%, 01/27/41 | 125 | 123,506 | ||||||
6.88%, 01/20/40 | 75 | 75,069 | ||||||
7.88%, 03/15/19 | 200 | 232,949 | ||||||
8.38%, 12/10/18 | 75 | 88,961 | ||||||
|
| |||||||
| 2,508,492 | ||||||||
CHILE — 1.82% |
| |||||||
Banco del Estado de Chile | ||||||||
4.13%, 10/07/20b | 150 | 154,012 | ||||||
| Security | Principal (000s) | Value | ||||||
Corporacion Nacional del Cobre de Chile | ||||||||
3.75%, 11/04/20b | $ | 100 | $ | 100,592 | ||||
4.25%, 07/17/42b | 200 | 166,465 | ||||||
7.50%, 01/15/19b | 100 | 121,217 | ||||||
Empresa Nacional del Petroleo | ||||||||
4.75%, 12/06/21b | 100 | 100,843 | ||||||
|
| |||||||
| 643,129 | ||||||||
CHINA — 3.07% |
| |||||||
Amber Circle Funding Ltd. | ||||||||
3.25%, 12/04/22b | 200 | 185,772 | ||||||
CNOOC Finance 2012 Ltd. | ||||||||
5.00%, 05/02/42b | 200 | 196,238 | ||||||
CNPC HK Overseas Capital Ltd. | ||||||||
4.50%, 04/28/21b | 200 | 207,807 | ||||||
Export-Import Bank of China (The) | ||||||||
4.88%, 07/21/15b | 100 | 105,928 | ||||||
Sinochem Overseas Capital Co. Ltd. | ||||||||
4.50%, 11/12/20b | 200 | 204,550 | ||||||
Sinopec Capital 2013 Ltd. | ||||||||
3.13%, 04/24/23b | 200 | 183,441 | ||||||
|
| |||||||
| 1,083,736 | ||||||||
COLOMBIA — 0.62% |
| |||||||
Ecopetrol SA | ||||||||
7.38%, 09/18/43 | 100 | 114,625 | ||||||
7.63%, 07/23/19 | 87 | 104,835 | ||||||
|
| |||||||
| 219,460 | ||||||||
INDIA — 0.58% |
| |||||||
Indian Oil Corp. Ltd. | ||||||||
4.75%, 01/22/15b | 200 | 205,265 | ||||||
|
| |||||||
| 205,265 | ||||||||
INDONESIA — 2.31% |
| |||||||
Majapahit Holding BV | ||||||||
7.75%, 01/20/20b | 220 | 252,450 | ||||||
7.88%, 06/29/37b | 100 | 111,500 | ||||||
PT Pertamina (Persero) Tbk | ||||||||
4.30%, 05/20/23b | 300 | 273,750 | ||||||
6.00%, 05/03/42b | 200 | 177,000 | ||||||
|
| |||||||
| 814,700 | ||||||||
ISRAEL — 0.61% |
| |||||||
Israel Electric Corp. Ltd. | ||||||||
6.88%, 06/21/23b | 200 | 214,300 | ||||||
|
| |||||||
| 214,300 | ||||||||
| 20 | 2013 iSHARES ANNUAL REPORTTO SHAREHOLDERS |
Table of Contents
Schedule of Investments (Continued)
iSHARES® EMERGING MARKETS CORPORATE BOND ETF
October 31, 2013
| Security | Principal (000s) | Value | ||||||
KAZAKHSTAN — 2.40% |
| |||||||
Development Bank of Kazakhstan JSC | ||||||||
4.13%, 12/10/22b | $ | 200 | $ | 184,500 | ||||
KazMunaiGaz Finance Sub BV | ||||||||
7.00%, 05/05/20b | 200 | 228,750 | ||||||
9.13%, 07/02/18b | 200 | 244,750 | ||||||
KazMunayGas National Co. JSC | ||||||||
4.40%, 04/30/23b | 200 | 189,740 | ||||||
|
| |||||||
| 847,740 | ||||||||
MALAYSIA — 1.32% |
| |||||||
Penerbangan Malaysia Bhd | ||||||||
5.63%, 03/15/16b | 100 | 109,392 | ||||||
Petroliam Nasional Bhd | ||||||||
7.63%, 10/15/26b | 100 | 130,482 | ||||||
Petronas Capital Ltd. | ||||||||
5.25%, 08/12/19b | 200 | 225,010 | ||||||
|
| |||||||
| 464,884 | ||||||||
MEXICO — 5.22% |
| |||||||
Comision Federal de Electricidad | ||||||||
4.88%, 05/26/21b | 200 | 208,500 | ||||||
Pemex Project Funding Master Trust | ||||||||
5.75%, 03/01/18 | 200 | 223,000 | ||||||
6.63%, 06/15/35 | 250 | 271,250 | ||||||
Petroleos Mexicanos | ||||||||
4.88%, 03/15/15 | 150 | 157,500 | ||||||
4.88%, 01/24/22 | 75 | 78,000 | ||||||
5.50%, 01/21/21 | 250 | 272,500 | ||||||
5.50%, 06/27/44 | 175 | 163,625 | ||||||
6.00%, 03/05/20 | 100 | 112,250 | ||||||
6.50%, 06/02/41 | 210 | 223,650 | ||||||
8.00%, 05/03/19 | 110 | 134,420 | ||||||
|
| |||||||
| 1,844,695 | ||||||||
PHILIPPINES — 0.67% |
| |||||||
Power Sector Assets & Liabilities Management Corp. | ||||||||
6.88%, 11/02/16b | 100 | 112,750 | ||||||
7.39%, 12/02/24b | 100 | 125,750 | ||||||
|
| |||||||
| 238,500 | ||||||||
QATAR — 2.39% |
| |||||||
Nakilat Inc. | ||||||||
6.07%, 12/31/33b | 100 | 107,500 | ||||||
Qatari Diar Finance QSC | ||||||||
3.50%, 07/21/15b | 100 | 103,663 | ||||||
5.00%, 07/21/20b | 100 | 110,750 | ||||||
| Security | Principal (000s) | Value | ||||||
QNB Finance Ltd. | ||||||||
2.13%, 02/14/18b | $ | 200 | $ | 195,250 | ||||
Qtel International Finance Ltd. | ||||||||
5.00%, 10/19/25b | 200 | 204,500 | ||||||
7.88%, 06/10/19b | 100 | 124,125 | ||||||
|
| |||||||
| 845,788 | ||||||||
RUSSIA — 4.90% |
| |||||||
Gazprom OAO Via Gaz Capital SA | ||||||||
6.21%, 11/22/16b | 100 | 110,070 | ||||||
7.29%, 08/16/37b | 100 | 111,000 | ||||||
8.63%, 04/28/34b | 50 | 61,750 | ||||||
9.25%, 04/23/19b | 100 | 124,750 | ||||||
Gazprom OAO Vis Gaz Capital SA | ||||||||
8.15%, 04/11/18b | 100 | 117,750 | ||||||
Russian Agricultural Bank OJSC Via RSHB Capital SA | ||||||||
6.30%, 05/15/17b | 100 | 107,750 | ||||||
Russian Railways OJSC via RZD Capital PLC | ||||||||
5.74%, 04/03/17b | 100 | 107,625 | ||||||
Sberbank of Russia Via SB Capital SA | ||||||||
6.13%, 02/07/22b | 200 | 216,750 | ||||||
Transneft OJSC Via TransCapitalInvest Ltd. | ||||||||
8.70%, 08/07/18b | 100 | 122,250 | ||||||
Vnesheconombank Via VEB Finance PLC | ||||||||
5.45%, 11/22/17b | 100 | 107,850 | ||||||
6.90%, 07/09/20b | 100 | 112,580 | ||||||
VTB Bank OJSC Via VTB Capital SA | ||||||||
6.25%, 06/30/35b | 200 | 212,500 | ||||||
6.55%, 10/13/20b | 100 | 107,875 | ||||||
6.88%, 05/29/18b | 100 | 110,180 | ||||||
|
| |||||||
| 1,730,680 | ||||||||
SOUTH AFRICA — 1.16% |
| |||||||
Eskom Holdings Ltd. | ||||||||
5.75%, 01/26/21b | 200 | 202,000 | ||||||
Transnet SOC Ltd. | ||||||||
4.50%, 02/10/16b | 200 | 208,310 | ||||||
|
| |||||||
| 410,310 | ||||||||
SOUTH KOREA — 5.16% |
| |||||||
Export-Import Bank of Korea (The) | ||||||||
4.00%, 01/29/21 | 100 | 104,250 | ||||||
SCHEDULESOF INVESTMENTS | 21 |
Table of Contents
Schedule of Investments (Continued)
iSHARES® EMERGING MARKETS CORPORATE BOND ETF
October 31, 2013
| Security | Principal (000s) | Value | ||||||
4.13%, 09/09/15 | $ | 100 | $ | 105,437 | ||||
4.38%, 09/15/21 | 200 | 213,014 | ||||||
5.13%, 06/29/20 | 100 | 111,741 | ||||||
Korea Development Bank (The) | ||||||||
3.25%, 03/09/16 | 100 | 103,787 | ||||||
3.88%, 05/04/17 | 200 | 213,578 | ||||||
Korea Expressway Corp. | ||||||||
5.13%, 05/20/15b | 50 | 52,888 | ||||||
Korea Finance Corp. | ||||||||
3.25%, 09/20/16 | 200 | 208,447 | ||||||
Korea Gas Corp. | ||||||||
4.25%, 11/02/20b | 200 | 211,350 | ||||||
Korea Hydro & Nuclear Power Co. Ltd. | ||||||||
3.00%, 09/19/22b | 200 | 187,416 | ||||||
Korea National Oil Corp. | ||||||||
2.88%, 11/09/15b | 200 | 206,204 | ||||||
National Agricultural Cooperative Federation | ||||||||
4.25%, 01/28/16b | 100 | 105,337 | ||||||
|
| |||||||
| 1,823,449 | ||||||||
THAILAND — 0.53% |
| |||||||
PTT PCL | ||||||||
3.38%, 10/25/22b | 200 | 186,725 | ||||||
|
| |||||||
| 186,725 | ||||||||
TRINIDAD AND TOBAGO — 0.36% |
| |||||||
Petroleum Co. of Trinidad & Tobago Ltd. | ||||||||
9.75%, 08/14/19b | 100 | 127,250 | ||||||
|
| |||||||
| 127,250 | ||||||||
UNITED ARAB EMIRATES — 4.92% |
| |||||||
Abu Dhabi National Energy Co. | ||||||||
5.88%, 10/27/16b | 100 | 111,350 | ||||||
6.25%, 09/16/19b | 100 | 114,750 | ||||||
6.50%, 10/27/36b | 100 | 117,500 | ||||||
7.25%, 08/01/18b | 100 | 119,125 | ||||||
Dolphin Energy Ltd. | ||||||||
5.89%, 06/15/19b | 155 | 171,035 | ||||||
DP World Ltd. | ||||||||
6.85%, 07/02/37b | 100 | 104,500 | ||||||
Dubai Electricity & Water Authority | ||||||||
7.38%, 10/21/20b | 200 | 234,250 | ||||||
| Security | Principal or Shares (000s) | Value | ||||||
IPIC GMTN Ltd/International Petroleum Investment Co. | ||||||||
3.75%, 03/01/17b | $ | 200 | $ | 211,500 | ||||
5.00%, 11/15/20b | 250 | 271,563 | ||||||
MDC-GMTN BV | ||||||||
3.75%, 04/20/16b | 200 | 211,054 | ||||||
Waha Aerospace BV | ||||||||
3.93%, 07/28/20b | 70 | 73,850 | ||||||
|
| |||||||
| 1,740,477 | ||||||||
VENEZUELA — 2.88% |
| |||||||
Petroleos de Venezuela SA | ||||||||
5.00%, 10/28/15 | 100 | 86,750 | ||||||
5.25%, 04/12/17b | 150 | 120,375 | ||||||
5.38%, 04/12/27b | 225 | 138,375 | ||||||
5.50%, 04/12/37b | 50 | 29,375 | ||||||
8.50%, 11/02/17b | 360 | 323,100 | ||||||
9.00%, 11/17/21b | 150 | 123,000 | ||||||
12.75%, 02/17/22b | 200 | 198,000 | ||||||
|
| |||||||
| 1,018,975 | ||||||||
|
| |||||||
TOTAL FOREIGN AGENCY OBLIGATIONS |
| |||||||
(Cost: $17,578,104) |
| 16,968,555 | ||||||
SHORT-TERM INVESTMENTS — 0.52% |
| |||||||
MONEY MARKET FUNDS — 0.52% |
| |||||||
BlackRock Cash Funds: Treasury, |
| |||||||
0.00%d,e | 186 | 185,824 | ||||||
|
| |||||||
| 185,824 | ||||||||
|
| |||||||
TOTAL SHORT-TERM INVESTMENTS |
| |||||||
(Cost: $185,824) |
| 185,824 | ||||||
|
| |||||||
TOTAL INVESTMENTS |
| |||||||
(Cost: $35,880,323) |
| 34,892,679 | ||||||
Other Assets, Less Liabilities — 1.26% |
| 445,109 | ||||||
|
| |||||||
NET ASSETS — 100.00% | $ | 35,337,788 | ||||||
|
| |||||||
| a | Investments are denominated in U.S. dollars. |
| b | This security may be resold to qualified foreign investors and foreign institutional buyers under Regulation S of the Securities Act of 1933. |
| c | Variable rate security. Rate shown is as of report date. |
| d | Affiliated issuer. See Note 2. |
| e | The rate quoted is the annualized seven-day yield of the fund at period end. |
See notes to financial statements.
| 22 | 2013 iSHARES ANNUAL REPORTTO SHAREHOLDERS |
Table of Contents
Schedule of Investments
iSHARES® EMERGING MARKETS HIGH YIELD BOND ETF
October 31, 2013
| Security | Principal (000s) | Value | ||||||
CORPORATE BONDS & NOTESa — 27.33% |
| |||||||
BRAZIL — 2.56% |
| |||||||
Banco BTG Pactual SA | ||||||||
5.75%, 09/28/22b | $ | 500 | $ | 462,600 | ||||
CSN Resources SA | ||||||||
6.50%, 07/21/20b | 800 | 818,000 | ||||||
Fibria Overseas Finance Ltd. | ||||||||
6.75%, 03/03/21 (Call 03/03/16)b | 400 | 438,000 | ||||||
7.50%, 05/04/20 (Call 05/04/15)b | 491 | 540,100 | ||||||
JBS USA LLC/JBS USA Finance Inc. | ||||||||
7.25%, 06/01/21 (Call 06/01/15)b | 250 | 256,875 | ||||||
8.25%, 02/01/20 (Call 02/01/15)b | 800 | 858,000 | ||||||
Marfrig Holding Europe BV | ||||||||
8.38%, 05/09/18b | 600 | 565,500 | ||||||
9.88%, 07/24/17 (Call 01/24/16)b | 500 | 499,375 | ||||||
Marfrig Overseas Ltd. | ||||||||
9.50%, 05/04/20 (Call 05/04/15)b | 200 | 193,000 | ||||||
Minerva Luxembourg SA | ||||||||
7.75%, 01/31/23 (Call 01/31/18)b | 600 | 582,000 | ||||||
|
| |||||||
| 5,213,450 | ||||||||
CHINA — 4.26% |
| |||||||
Agile Property Holdings Ltd. | ||||||||
8.88%, 04/28/17 (Call 04/28/14)b | 800 | 842,000 | ||||||
9.88%, 03/20/17b | 200 | 219,000 | ||||||
China CITIC Bank International Ltd. | ||||||||
6.88%, 06/24/20 | 300 | 334,937 | ||||||
CITIC Pacific Ltd. | ||||||||
6.63%, 04/15/21b | 900 | 877,500 | ||||||
6.80%, 01/17/23b | 200 | 187,250 | ||||||
6.88%, 01/21/18b | 1,000 | 1,040,000 | ||||||
Country Garden Holdings Co. Ltd. | ||||||||
7.50%, 01/10/23 (Call 01/10/18)b | 500 | 498,125 | ||||||
11.13%, 02/23/18 (Call 02/23/15)b | 600 | 669,720 | ||||||
Evergrande Real Estate Group Ltd. | ||||||||
13.00%, 01/27/15b | 650 | 697,125 | ||||||
Greentown China Holdings Ltd. | ||||||||
8.50%, 02/04/18 (Call 02/04/16)b | 400 | 418,480 | ||||||
Kaisa Group Holdings Ltd. | ||||||||
10.25%, 01/08/20 (Call 01/08/17)b | 600 | 618,000 | ||||||
Longfor Properties Co. Ltd. | ||||||||
6.75%, 01/29/23 (Call 01/29/18)b | 400 | 373,919 | ||||||
9.50%, 04/07/16 (Call 04/07/14)b | 300 | 320,250 | ||||||
| Security | Principal (000s) | Value | ||||||
Shimao Property Holdings Ltd. | ||||||||
6.63%, 01/14/20 (Call 01/14/17)b | $ | 600 | $ | 579,000 | ||||
9.65%, 08/03/17 (Call 08/03/14)b | 200 | 215,240 | ||||||
SOHO China Ltd. | ||||||||
5.75%, 11/07/17 (Call 11/07/15)b | 600 | 600,750 | ||||||
Yancoal International Resources Development Co. Ltd. | ||||||||
5.73%, 05/16/22b | 200 | 187,100 | ||||||
|
| |||||||
| 8,678,396 | ||||||||
COLOMBIA — 1.39% |
| |||||||
Banco Davivienda SA | ||||||||
5.88%, 07/09/22b | 200 | 197,600 | ||||||
Bancolombia SA | ||||||||
5.13%, 09/11/22 | 1,000 | 955,000 | ||||||
6.13%, 07/26/20 | 500 | 527,500 | ||||||
Pacific Rubiales Energy Corp. | ||||||||
5.13%, 03/28/23 (Call 03/28/18)b | 400 | 383,000 | ||||||
7.25%, 12/12/21 (Call 12/12/16)b | 700 | 770,000 | ||||||
|
| |||||||
| 2,833,100 | ||||||||
INDIA — 2.12% |
| |||||||
Bharti Airtel International Netherlands BV | ||||||||
5.13%, 03/11/23b | 900 | 843,750 | ||||||
ICICI Bank Ltd. | ||||||||
6.38%, 04/30/22 (Call 04/30/17)b,c | 654 | 621,300 | ||||||
Vedanta Resources PLC | ||||||||
6.00%, 01/31/19b | 800 | 772,000 | ||||||
6.75%, 06/07/16b | 800 | 834,000 | ||||||
7.13%, 05/31/23b | 200 | 191,000 | ||||||
8.25%, 06/07/21b | 600 | 618,000 | ||||||
9.50%, 07/18/18b | 400 | 444,480 | ||||||
|
| |||||||
| 4,324,530 | ||||||||
JAMAICA — 1.27% |
| |||||||
Digicel Group Ltd. | ||||||||
8.25%, 09/30/20 (Call 09/30/16)b | 1,100 | 1,160,500 | ||||||
10.50%, 04/15/18 (Call 04/15/14)b | 300 | 324,000 | ||||||
Digicel Ltd. | ||||||||
6.00%, 04/15/21 (Call 04/15/16)b | 1,000 | 970,000 | ||||||
8.25%, 09/01/17 (Call 12/02/13)b | 130 | 135,395 | ||||||
|
| |||||||
| 2,589,895 | ||||||||
SCHEDULESOF INVESTMENTS | 23 |
Table of Contents
Schedule of Investments (Continued)
iSHARES® EMERGING MARKETS HIGH YIELD BOND ETF
October 31, 2013
| Security | Principal (000s) | Value | ||||||
KAZAKHSTAN — 0.31% |
| |||||||
Halyk Savings Bank of Kazakhstan JSC | ||||||||
7.25%, 05/03/17b | $ | 400 | $ | 428,000 | ||||
7.25%, 01/28/21b | 200 | 210,500 | ||||||
|
| |||||||
| 638,500 | ||||||||
MACAU — 0.39% |
| |||||||
MCE Finance Ltd. | ||||||||
5.00%, 02/15/21 (Call 02/15/16)b | 800 | 792,000 | ||||||
|
| |||||||
| 792,000 | ||||||||
MEXICO — 3.68% |
| |||||||
BBVA Bancomer SA Texas Agency | ||||||||
7.25%, 04/22/20b | 700 | 766,500 | ||||||
Cemex Espana SA (Luxembourg) | ||||||||
9.25%, 05/12/20 (Call 05/12/15)b | 1,200 | 1,308,000 | ||||||
9.88%, 04/30/19 (Call 04/30/16)b | 100 | 113,000 | ||||||
Cemex Finance LLC | ||||||||
9.38%, 10/12/22 (Call 10/12/17)b | 1,100 | 1,234,750 | ||||||
Cemex SAB de CV | ||||||||
5.88%, 03/25/19 (Call 03/25/16)b | 400 | 391,500 | ||||||
6.50%, 12/10/19 (Call 12/10/17)b | 400 | 406,000 | ||||||
9.00%, 01/11/18 (Call 01/11/15)b | 1,397 | 1,519,238 | ||||||
Mexichem SAB de CV | ||||||||
4.88%, 09/19/22b | 600 | 594,000 | ||||||
NII Capital Corp. | ||||||||
7.63%, 04/01/21 (Call 04/01/16) | 950 | 551,000 | ||||||
8.88%, 12/15/19 (Call 12/15/14) | 200 | 125,000 | ||||||
10.00%, 08/15/16 (Call 12/02/13) | 620 | 483,600 | ||||||
|
| |||||||
| 7,492,588 | ||||||||
PERU — 0.15% |
| |||||||
Banco de Credito del Peru | ||||||||
6.13%, 04/24/27 (Call 04/24/22)b,c | 300 | 313,500 | ||||||
|
| |||||||
| 313,500 | ||||||||
RUSSIA — 8.21% |
| |||||||
Alfa Bank OJSC Via Alfa Bond Issuance PLC | ||||||||
7.50%, 09/26/19b | 400 | 426,000 | ||||||
7.75%, 04/28/21b | 750 | 815,625 | ||||||
7.88%, 09/25/17b | 800 | 896,992 | ||||||
ALROSA Finance SA | ||||||||
7.75%, 11/03/20b | 600 | 678,000 | ||||||
| Security | Principal (000s) | Value | ||||||
Credit Bank of Moscow | ||||||||
7.70%, 02/01/18b | $ | 500 | $ | 520,000 | ||||
Evraz Group SA | ||||||||
6.50%, 04/22/20b | 800 | 760,000 | ||||||
8.25%, 11/10/15b | 400 | 429,520 | ||||||
9.50%, 04/24/18b | 1,100 | 1,207,250 | ||||||
Home Credit & Finance Bank LLC | ||||||||
9.38%, 04/24/20 (Call 04/24/18)b,c | 500 | 513,750 | ||||||
Metalloinvest Finance Ltd. | ||||||||
5.63%, 04/17/20b | 600 | 597,000 | ||||||
6.50%, 07/21/16b | 400 | 427,000 | ||||||
MTS International Funding Ltd. | ||||||||
5.00%, 05/30/23b | 600 | 576,000 | ||||||
8.63%, 06/22/20b | 200 | 241,000 | ||||||
Nomos Bank OJSC Via Nomos Capital PLC | ||||||||
7.25%, 04/25/18b | 400 | 403,500 | ||||||
Novolipetsk Steel OJSC Via Steel Funding Ltd. | ||||||||
4.45%, 02/19/18b | 600 | 600,000 | ||||||
4.95%, 09/26/19b | 200 | 199,250 | ||||||
Promsvyazbank OJSC via PSB Finance SA | ||||||||
10.20%, 11/06/19b | 400 | 430,000 | ||||||
Russian Standard Bank | ||||||||
9.25%, 07/11/17b | 100 | 105,000 | ||||||
Severstal OAO Via Steel Capital SA | ||||||||
5.90%, 10/17/22b | 200 | 194,750 | ||||||
6.70%, 10/25/17b | 1,100 | 1,179,750 | ||||||
Sibur Securities Ltd. | ||||||||
3.91%, 01/31/18b | 700 | 684,250 | ||||||
TMK OAO | ||||||||
7.75%, 01/27/18b | 500 | 523,750 | ||||||
Vimpel Communications Via VIP Finance Ireland Ltd. OJSC | ||||||||
7.75%, 02/02/21b | 600 | 657,000 | ||||||
9.13%, 04/30/18b | 900 | 1,050,750 | ||||||
VimpelCom Holdings BV | ||||||||
5.20%, 02/13/19b | 400 | 400,000 | ||||||
5.95%, 02/13/23b | 900 | 866,250 | ||||||
6.25%, 03/01/17b | 600 | 639,000 | ||||||
7.50%, 03/01/22b | 650 | 697,125 | ||||||
|
| |||||||
| 16,718,512 | ||||||||
| 24 | 2013 iSHARES ANNUAL REPORTTO SHAREHOLDERS |
Table of Contents
Schedule of Investments (Continued)
iSHARES® EMERGING MARKETS HIGH YIELD BOND ETF
October 31, 2013
| Security | Principal (000s) | Value | ||||||
SINGAPORE — 0.48% |
| |||||||
Flextronics International Ltd. | ||||||||
5.00%, 02/15/23 | $ | 650 | $ | 648,375 | ||||
Global A&T Electronics Ltd. | ||||||||
10.00%, 02/01/19b | 400 | 320,000 | ||||||
|
| |||||||
| 968,375 | ||||||||
SOUTH AFRICA — 0.70% |
| |||||||
AngloGold Ashanti Holdings PLC | ||||||||
5.13%, 08/01/22 | 500 | 444,433 | ||||||
5.38%, 04/15/20 | 300 | 286,339 | ||||||
Gold Fields Orogen Holding BVI Ltd. | ||||||||
4.88%, 10/07/20b | 800 | 685,178 | ||||||
|
| |||||||
| 1,415,950 | ||||||||
SOUTH KOREA — 0.47% |
| |||||||
Woori Bank Co. Ltd. | ||||||||
6.21%, 05/02/37 (Call 05/02/17)b,c | 900 | 945,000 | ||||||
|
| |||||||
| 945,000 | ||||||||
TURKEY — 0.87% |
| |||||||
Turkiye Is Bankasi AS | ||||||||
6.00%, 10/24/22b | 500 | 480,000 | ||||||
Turkiye Vakiflar Bankasi Tao | ||||||||
6.00%, 11/01/22b | 600 | 563,250 | ||||||
Yapi ve Kredi Bankasi AS | ||||||||
5.50%, 12/06/22b | 800 | 725,000 | ||||||
|
| |||||||
| 1,768,250 | ||||||||
UKRAINE — 0.47% |
| |||||||
Metinvest BV | ||||||||
8.75%, 02/14/18b | 500 | 451,250 | ||||||
10.25%, 05/20/15b | 500 | 500,000 | ||||||
|
| |||||||
| 951,250 | ||||||||
TOTAL CORPORATE BONDS & NOTES |
| |||||||
(Cost: $56,360,289) |
| 55,643,296 | ||||||
FOREIGN AGENCY OBLIGATIONSa — 13.05% |
| |||||||
BRAZIL — 1.11% |
| |||||||
Banco do Brasil SA | ||||||||
5.88%, 01/19/23b | 400 | 396,000 | ||||||
Centrais Eletricas Brasileiras SA | ||||||||
5.75%, 10/27/21b | 1,000 | 985,000 | ||||||
6.88%, 07/30/19b | 800 | 874,000 | ||||||
|
| |||||||
| 2,255,000 | ||||||||
| Security | Principal (000s) | Value | ||||||
INDONESIA — 3.93% |
| |||||||
Majapahit Holding BV | ||||||||
7.75%, 10/17/16b | $ | 1,000 | $ | 1,120,000 | ||||
7.75%, 01/20/20b | 1,300 | 1,491,750 | ||||||
7.88%, 06/29/37b | 200 | 223,000 | ||||||
PT Pertamina (Persero) Tbk | ||||||||
4.30%, 05/20/23b | 1,900 | 1,733,750 | ||||||
5.25%, 05/23/21b | 400 | 399,000 | ||||||
5.63%, 05/20/43b | 2,300 | 1,932,000 | ||||||
6.00%, 05/03/42b | 200 | 177,000 | ||||||
PT Perusahaan Gas Negara (Persero) Tbk | ||||||||
5.25%, 10/24/42b | 900 | 724,500 | ||||||
5.50%, 11/22/21b | 200 | 201,000 | ||||||
|
| |||||||
| 8,002,000 | ||||||||
ISRAEL — 1.15% |
| |||||||
Israel Electric Corp. Ltd. | ||||||||
5.63%, 06/21/18b | 1,300 | 1,368,250 | ||||||
6.88%, 06/21/23b | 900 | 964,350 | ||||||
|
| |||||||
| 2,332,600 | ||||||||
RUSSIA — 0.40% |
| |||||||
VTB Bank OJSC Via VTB Capital SA | ||||||||
6.95%, 10/17/22b | 800 | 820,000 | ||||||
|
| |||||||
| 820,000 | ||||||||
SOUTH AFRICA — 0.26% |
| |||||||
Transnet SOC Ltd. | ||||||||
4.00%, 07/26/22b | 600 | 537,000 | ||||||
|
| |||||||
| 537,000 | ||||||||
SRI LANKA — 0.19% |
| |||||||
Bank of Ceylon | ||||||||
5.33%, 04/16/18b | 200 | 192,000 | ||||||
6.88%, 05/03/17b | 200 | 205,000 | ||||||
|
| |||||||
| 397,000 | ||||||||
TURKEY — 0.51% |
| |||||||
Export Credit Bank of Turkey | ||||||||
5.38%, 11/04/16b | 800 | 836,000 | ||||||
5.88%, 04/24/19b | 200 | 209,700 | ||||||
|
| |||||||
| 1,045,700 | ||||||||
UKRAINE — 0.17% |
| |||||||
Oschadbank | ||||||||
8.25%, 03/10/16b | 400 | 344,000 | ||||||
|
| |||||||
| 344,000 | ||||||||
SCHEDULESOF INVESTMENTS | 25 |
Table of Contents
Schedule of Investments (Continued)
iSHARES® EMERGING MARKETS HIGH YIELD BOND ETF
October 31, 2013
| Security | Principal (000s) | Value | ||||||
VENEZUELA — 5.33% |
| |||||||
Petroleos de Venezuela SA | ||||||||
5.00%, 10/28/15 | $ | 800 | $ | 694,000 | ||||
5.25%, 04/12/17b | 1,900 | 1,524,750 | ||||||
5.38%, 04/12/27b | 1,970 | 1,211,550 | ||||||
5.50%, 04/12/37b | 720 | 423,000 | ||||||
8.50%, 11/02/17b | 3,900 | 3,500,250 | ||||||
9.00%, 11/17/21b | 1,850 | 1,517,000 | ||||||
12.75%, 02/17/22b | 2,000 | 1,980,000 | ||||||
|
| |||||||
| 10,850,550 | ||||||||
|
| |||||||
TOTAL FOREIGN AGENCY OBLIGATIONS |
| |||||||
(Cost: $27,248,117) |
| 26,583,850 | ||||||
FOREIGN GOVERNMENT OBLIGATIONSa — 56.86% |
| |||||||
ARGENTINA — 1.79% |
| |||||||
Argentina (Republic of) | ||||||||
2.50%, 12/31/38d | 3,430 | 1,251,950 | ||||||
8.28%, 12/31/33 | 609 | 426,475 | ||||||
8.28%, 12/31/33 | 1,987 | 1,425,664 | ||||||
8.75%, 06/02/17 | 620 | 539,400 | ||||||
|
| |||||||
| 3,643,489 | ||||||||
BELARUS — 0.64% |
| |||||||
Belarus (Republic of) | ||||||||
8.75%, 08/03/15b | 800 | 801,000 | ||||||
8.95%, 01/26/18b | 500 | 497,500 | ||||||
|
| |||||||
| 1,298,500 | ||||||||
COSTA RICA — 0.64% |
| |||||||
Costa Rica (Republic of) | ||||||||
4.25%, 01/26/23b | 800 | 760,000 | ||||||
4.38%, 04/30/25b | 200 | 184,000 | ||||||
5.63%, 04/30/43b | 400 | 355,000 | ||||||
|
| |||||||
| 1,299,000 | ||||||||
CROATIA — 2.26% |
| |||||||
Croatia (Republic of) | ||||||||
5.50%, 04/04/23b | 1,000 | 992,500 | ||||||
6.25%, 04/27/17b | 500 | 533,460 | ||||||
6.38%, 03/24/21b | 1,300 | 1,379,625 | ||||||
6.63%, 07/14/20b | 200 | 216,000 | ||||||
6.75%, 11/05/19b | 1,350 | 1,471,500 | ||||||
|
| |||||||
| 4,593,085 | ||||||||
| Security | Principal (000s) | Value | ||||||
DOMINICAN REPUBLIC — 1.04% |
| |||||||
Dominican Republic | ||||||||
5.88%, 04/18/24b | $ | 600 | $ | 590,100 | ||||
7.50%, 05/06/21b | 800 | 885,200 | ||||||
9.04%, 01/23/18b | 590 | 648,343 | ||||||
|
| |||||||
| 2,123,643 | ||||||||
ECUADOR — 0.31% |
| |||||||
Ecuador (Republic of) | ||||||||
9.38%, 12/15/15b | 600 | 639,000 | ||||||
|
| |||||||
| 639,000 | ||||||||
EGYPT — 0.44% |
| |||||||
Egypt (Arab Republic of) | ||||||||
5.75%, 04/29/20b | 700 | 644,000 | ||||||
6.88%, 04/30/40b | 300 | 249,000 | ||||||
|
| |||||||
| 893,000 | ||||||||
EL SALVADOR — 1.23% |
| |||||||
El Salvador (Republic of) | ||||||||
5.88%, 01/30/25b | 600 | 595,500 | ||||||
7.63%, 02/01/41b | 450 | 469,125 | ||||||
7.65%, 06/15/35b | 800 | 846,000 | ||||||
7.75%, 01/24/23b | 120 | 135,300 | ||||||
8.25%, 04/10/32b | 400 | 456,000 | ||||||
|
| |||||||
| 2,501,925 | ||||||||
GUATEMALA — 0.44% |
| |||||||
Guatemala (Republic of) | ||||||||
4.88%, 02/13/28b | 500 | 471,000 | ||||||
5.75%, 06/06/22b | 400 | 424,400 | ||||||
|
| |||||||
| 895,400 | ||||||||
HUNGARY — 3.69% |
| |||||||
Hungary (Republic of) | ||||||||
4.13%, 02/19/18 | 500 | 505,000 | ||||||
4.75%, 02/03/15 | 995 | 1,022,362 | ||||||
5.38%, 02/21/23 | 1,300 | 1,294,865 | ||||||
6.25%, 01/29/20 | 1,500 | 1,630,500 | ||||||
6.38%, 03/29/21 | 1,900 | 2,063,875 | ||||||
7.63%, 03/29/41 | 882 | 993,353 | ||||||
|
| |||||||
| 7,509,955 | ||||||||
INDONESIA — 8.57% |
| |||||||
Indonesia (Republic of) | ||||||||
3.38%, 04/15/23b | 1,300 | 1,170,000 | ||||||
3.75%, 04/25/22b | 1,200 | 1,131,000 | ||||||
4.63%, 04/15/43b | 1,300 | 1,103,375 | ||||||
| 26 | 2013 iSHARES ANNUAL REPORTTO SHAREHOLDERS |
Table of Contents
Schedule of Investments (Continued)
iSHARES® EMERGING MARKETS HIGH YIELD BOND ETF
October 31, 2013
| Security | Principal (000s) | Value | ||||||
4.88%, 05/05/21b | $ | 2,200 | $ | 2,282,500 | ||||
5.25%, 01/17/42b | 200 | 185,000 | ||||||
5.88%, 03/13/20b | 600 | 657,000 | ||||||
6.88%, 01/17/18b | 1,800 | 2,043,000 | ||||||
7.50%, 01/15/16b | 1,600 | 1,792,000 | ||||||
7.75%, 01/17/38b | 2,000 | 2,437,500 | ||||||
8.50%, 10/12/35b | 1,900 | 2,460,500 | ||||||
11.63%, 03/04/19b | 1,600 | 2,188,000 | ||||||
|
| |||||||
| 17,449,875 | ||||||||
JAMAICA — 0.41% |
| |||||||
Jamaica (Government of) | ||||||||
8.00%, 06/24/19 | 600 | 586,500 | ||||||
8.00%, 03/15/39 | 300 | 250,500 | ||||||
|
| |||||||
| 837,000 | ||||||||
LEBANON — 3.08% |
| |||||||
Lebanon (Republic of) | ||||||||
4.75%, 11/02/16b | 500 | 493,750 | ||||||
5.15%, 11/12/18b | 650 | 633,750 | ||||||
6.00%, 05/20/19b | 200 | 199,000 | ||||||
6.38%, 03/09/20 | 1,000 | 1,010,000 | ||||||
8.25%, 04/12/21b | 1,600 | 1,776,000 | ||||||
8.50%, 08/06/15 | 250 | 266,095 | ||||||
8.50%, 01/19/16b | 330 | 356,812 | ||||||
9.00%, 03/20/17 | 1,380 | 1,538,700 | ||||||
|
| |||||||
| 6,274,107 | ||||||||
MOROCCO — 0.63% |
| |||||||
Morocco (Republic of) | ||||||||
4.25%, 12/11/22b | 800 | 752,000 | ||||||
5.50%, 12/11/42b | 600 | 525,000 | ||||||
|
| |||||||
| 1,277,000 | ||||||||
NIGERIA — 0.42% |
| |||||||
Nigeria (Federal Republic of) | ||||||||
5.13%, 07/12/18b | 400 | 413,500 | ||||||
6.38%, 07/12/23b | 200 | 211,500 | ||||||
6.75%, 01/28/21b | 200 | 220,500 | ||||||
|
| |||||||
| 845,500 | ||||||||
PAKISTAN — 0.34% |
| |||||||
Pakistan (Islamic Republic of) | ||||||||
6.88%, 06/01/17b | 400 | 393,000 | ||||||
7.13%, 03/31/16b | 300 | 298,500 | ||||||
|
| |||||||
| 691,500 | ||||||||
| Security | Principal (000s) | Value | ||||||
ROMANIA — 1.32% |
| |||||||
Romania (Republic of) | ||||||||
4.38%, 08/22/23b | $ | 1,100 | $ | 1,076,625 | ||||
6.75%, 02/07/22b | 1,400 | 1,617,000 | ||||||
|
| |||||||
| 2,693,625 | ||||||||
SERBIA — 1.37% |
| |||||||
Serbia (Republic of) | ||||||||
4.88%, 02/25/20b | 1,000 | 942,500 | ||||||
5.25%, 11/21/17b | 400 | 398,000 | ||||||
7.25%, 09/28/21b | 1,400 | 1,456,000 | ||||||
|
| |||||||
| 2,796,500 | ||||||||
SLOVENIA — 1.81% |
| |||||||
Slovenia (Republic of) | ||||||||
4.75%, 05/10/18b | 600 | 592,500 | ||||||
5.50%, 10/26/22b | 1,400 | 1,338,750 | ||||||
5.85%, 05/10/23b | 1,800 | 1,755,000 | ||||||
|
| |||||||
| 3,686,250 | ||||||||
SRI LANKA — 0.96% |
| |||||||
Sri Lanka (Democratic Socialist Republic of) | ||||||||
5.88%, 07/25/22b | 400 | 388,500 | ||||||
6.25%, 10/04/20b | 1,250 | 1,267,188 | ||||||
6.25%, 07/27/21b | 299 | 300,495 | ||||||
|
| |||||||
| 1,956,183 | ||||||||
TURKEY — 13.33% |
| |||||||
Turkey (Republic of) | ||||||||
3.25%, 03/23/23 | 1,000 | 878,750 | ||||||
4.88%, 04/16/43 | 700 | 604,625 | ||||||
5.13%, 03/25/22 | 642 | 657,408 | ||||||
5.63%, 03/30/21 | 1,650 | 1,761,375 | ||||||
6.00%, 01/14/41 | 2,000 | 2,010,000 | ||||||
6.25%, 09/26/22 | 1,800 | 1,984,500 | ||||||
6.75%, 04/03/18 | 1,250 | 1,406,250 | ||||||
6.75%, 05/30/40 | 900 | 981,000 | ||||||
6.88%, 03/17/36 | 1,620 | 1,790,100 | ||||||
7.00%, 09/26/16 | 1,600 | 1,782,720 | ||||||
7.00%, 03/11/19 | 1,000 | 1,141,250 | ||||||
7.00%, 06/05/20 | 1,650 | 1,905,750 | ||||||
7.25%, 03/15/15 | 1,000 | 1,067,500 | ||||||
7.25%, 03/05/38 | 810 | 931,500 | ||||||
7.38%, 02/05/25 | 2,120 | 2,480,400 | ||||||
7.50%, 07/14/17 | 1,520 | 1,740,400 | ||||||
SCHEDULESOF INVESTMENTS | 27 |
Table of Contents
Schedule of Investments (Continued)
iSHARES® EMERGING MARKETS HIGH YIELD BOND ETF
October 31, 2013
| Security | Principal (000s) | Value | ||||||
7.50%, 11/07/19 | $ | 750 | $ | 883,125 | ||||
8.00%, 02/14/34 | 1,263 | 1,561,826 | ||||||
11.88%, 01/15/30 | 960 | 1,572,000 | ||||||
|
| |||||||
| 27,140,479 | ||||||||
UKRAINE — 2.80% |
| |||||||
Ukraine (Government of) | ||||||||
6.25%, 06/17/16b | 800 | 716,000 | ||||||
6.58%, 11/21/16b | 600 | 537,000 | ||||||
6.75%, 11/14/17b | 100 | 89,500 | ||||||
6.88%, 09/23/15b | 600 | 549,000 | ||||||
7.50%, 04/17/23b | 900 | 780,750 | ||||||
7.75%, 09/23/20b | 1,300 | 1,176,500 | ||||||
7.80%, 11/28/22b | 1,400 | 1,218,000 | ||||||
7.95%, 02/23/21b | 700 | 634,375 | ||||||
|
| |||||||
| 5,701,125 | ||||||||
VENEZUELA — 8.75% |
| |||||||
Venezuela (Bolivarian Republic of) | ||||||||
5.75%, 02/26/16b | 875 | 778,750 | ||||||
6.00%, 12/09/20b | 780 | 569,400 | ||||||
7.00%, 12/01/18b | 550 | 457,875 | ||||||
7.00%, 03/31/38b | 850 | 568,650 | ||||||
7.65%, 04/21/25 | 1,350 | 987,525 | ||||||
7.75%, 10/13/19b | 1,850 | 1,517,000 | ||||||
8.25%, 10/13/24b | 1,150 | 876,875 | ||||||
9.00%, 05/07/23b | 1,480 | 1,202,500 | ||||||
9.25%, 09/15/27 | 2,720 | 2,244,000 | ||||||
9.25%, 05/07/28b | 1,400 | 1,113,000 | ||||||
9.38%, 01/13/34 | 1,010 | 802,950 | ||||||
11.75%, 10/21/26b | 1,700 | 1,572,500 | ||||||
11.95%, 08/05/31b | 2,570 | 2,377,250 | ||||||
12.75%, 08/23/22b | 2,100 | 2,115,750 | ||||||
13.63%, 08/15/18 | 600 | 637,500 | ||||||
|
| |||||||
| 17,821,525 | ||||||||
VIETNAM — 0.59% |
| |||||||
Vietnam (Socialist Republic of) | ||||||||
6.75%, 01/29/20b | 800 | 875,000 | ||||||
6.88%, 01/15/16b | 300 | 324,000 | ||||||
|
| |||||||
| 1,199,000 | ||||||||
|
| |||||||
TOTAL FOREIGN GOVERNMENT OBLIGATIONS |
| |||||||
(Cost: $122,303,300) |
| 115,766,666 | ||||||
| Security | Shares (000s) | Value | ||||||
SHORT-TERM INVESTMENTS — 0.56% |
| |||||||
MONEY MARKET FUNDS — 0.56% |
| |||||||
BlackRock Cash Funds: Treasury, |
| |||||||
0.00%e,f | 1,141 | $ | 1,141,039 | |||||
|
| |||||||
| 1,141,039 | ||||||||
|
| |||||||
TOTAL SHORT-TERM INVESTMENTS |
| |||||||
(Cost: $1,141,039) |
| 1,141,039 | ||||||
|
| |||||||
TOTAL INVESTMENTS |
| |||||||
(Cost: $207,052,745) | 199,134,851 | |||||||
Other Assets, Less Liabilities — 2.20% |
| 4,469,074 | ||||||
|
| |||||||
NET ASSETS — 100.00% | $ | 203,603,925 | ||||||
|
| |||||||
| a | Investments are denominated in U.S. dollars. |
| b | This security may be resold to qualified foreign investors and foreign institutional buyers under Regulation S of the Securities Act of 1933. |
| c | Variable rate security. Rate shown is as of report date. |
| d | Step coupon security. Coupon rate will either increase (step-up bond) or decrease (step-down bond) at regular intervals until maturity. Interest rate shown reflects the rate currently in effect. |
| e | Affiliated issuer. See Note 2. |
| f | The rate quoted is the annualized seven-day yield of the fund at period end. |
See notes to financial statements.
| 28 | 2013 iSHARES ANNUAL REPORTTO SHAREHOLDERS |
Table of Contents
Schedule of Investments
iSHARES® EMERGING MARKETS LOCAL CURRENCY BOND ETF
October 31, 2013
| Security | Principal (000s) | Value | ||||||||||
FOREIGN GOVERNMENT OBLIGATIONS — 97.72% |
| |||||||||||
BRAZIL — 12.25% | ||||||||||||
Brazil (Federative Republic of) | ||||||||||||
0.00%, 01/01/14 | BRL | 49,024 | $ | 21,719,687 | ||||||||
0.00%, 04/01/14 | BRL | 20,543 | 8,887,223 | |||||||||
0.00%, 01/01/15 | BRL | 47,447 | 18,962,752 | |||||||||
0.00%, 01/01/16 | BRL | 3,200 | 1,142,388 | |||||||||
0.00%, 01/01/17 | BRL | 10,665 | 3,393,192 | |||||||||
8.50%, 01/05/24 | BRL | 500 | 206,895 | |||||||||
10.00%, 01/01/15 | BRL | 4,398 | 1,965,619 | |||||||||
10.00%, 01/01/18 | BRL | 9,339 | 3,999,088 | |||||||||
10.00%, 01/01/21 | BRL | 38,818 | 16,216,040 | |||||||||
10.00%, 01/01/23 | BRL | 2,494 | 1,021,493 | |||||||||
12.50%, 01/05/16 | BRL | 1,400 | 669,350 | |||||||||
|
| |||||||||||
| 78,183,727 | ||||||||||||
CHILE — 0.07% | ||||||||||||
Chile (Republic of) | ||||||||||||
5.50%, 08/05/20 | CLP | 237,000 | 472,148 | |||||||||
|
| |||||||||||
| 472,148 | ||||||||||||
COLOMBIA — 4.29% | ||||||||||||
Colombia (Republic of) | ||||||||||||
7.50%, 08/26/26 | COP | 13,009,800 | 7,167,799 | |||||||||
7.75%, 04/14/21 | COP | 496,000 | 300,147 | |||||||||
9.25%, 05/14/14 | COP | 26,232,000 | 14,258,726 | |||||||||
9.85%, 06/28/27 | COP | 4,338,000 | 3,063,003 | |||||||||
10.00%, 07/24/24 | COP | 2,060,000 | 1,373,664 | |||||||||
11.25%, 10/24/18 | COP | 1,865,000 | 1,201,892 | |||||||||
|
| |||||||||||
| 27,365,231 | ||||||||||||
CZECH REPUBLIC — 4.03% |
| |||||||||||
Czech (Republic of) | ||||||||||||
2.75%, 03/31/14 | CZK | 36,920 | 1,967,191 | |||||||||
3.80%, 04/11/15 | CZK | 109,000 | 6,044,869 | |||||||||
4.20%, 12/04/36 | CZK | 48,730 | 2,942,664 | |||||||||
4.60%, 08/18/18 | CZK | 147,200 | 9,025,617 | |||||||||
5.70%, 05/25/24 | CZK | 82,940 | 5,760,439 | |||||||||
|
| |||||||||||
| 25,740,780 | ||||||||||||
EGYPT — 1.50% | ||||||||||||
Egypt (Arab Republic of) | ||||||||||||
14.25%, 10/25/16 | EGP | 1,000 | 143,359 | |||||||||
16.15%, 01/17/15 | EGP | 11,200 | 1,661,440 | |||||||||
| Security | Principal (000s) | Value | ||||||||||
16.15%, 07/03/15 | EGP | 27,742 | $ | 4,155,722 | ||||||||
16.55%, 04/10/17 | EGP | 10,000 | 1,495,289 | |||||||||
16.58%, 08/14/17 | EGP | 14,000 | 2,110,680 | |||||||||
|
| |||||||||||
| 9,566,490 | ||||||||||||
HUNGARY — 3.48% | ||||||||||||
Hungary (Republic of) | ||||||||||||
5.50%, 02/12/14 | HUF | 382,500 | 1,772,314 | |||||||||
5.50%, 02/12/16 | HUF | 1,909,260 | 9,087,043 | |||||||||
6.00%, 11/24/23 | HUF | 282,660 | 1,355,466 | |||||||||
6.50%, 06/24/19 | HUF | 865,250 | 4,298,423 | |||||||||
7.00%, 06/24/22 | HUF | 230,000 | 1,169,953 | |||||||||
7.50%, 11/12/20 | HUF | 186,500 | 978,365 | |||||||||
7.75%, 08/24/15 | HUF | 727,290 | 3,574,292 | |||||||||
|
| |||||||||||
| 22,235,856 | ||||||||||||
INDONESIA — 4.43% | ||||||||||||
Indonesia (Republic of) | ||||||||||||
6.63%, 05/15/33 | IDR | 6,000,000 | 453,759 | |||||||||
7.00%, 05/15/22 | IDR | 3,630,000 | 311,557 | |||||||||
8.25%, 06/15/32 | IDR | 32,000,000 | 2,867,155 | |||||||||
9.50%, 06/15/15 | IDR | 9,546,000 | 888,335 | |||||||||
9.50%, 07/15/31 | IDR | 135,209,000 | 13,539,012 | |||||||||
10.00%, 07/15/17 | IDR | 62,799,000 | 6,083,522 | |||||||||
10.00%, 09/15/24 | IDR | 2,540,000 | 262,506 | |||||||||
11.00%, 11/15/20 | IDR | 22,885,000 | 2,434,205 | |||||||||
11.00%, 09/15/25 | IDR | 13,220,000 | 1,457,161 | |||||||||
|
| |||||||||||
| 28,297,212 | ||||||||||||
ISRAEL — 4.43% | ||||||||||||
Israel (State of) | ||||||||||||
3.50%, 08/31/14 | ILS | 21,350 | 6,195,755 | |||||||||
4.25%, 03/31/23 | ILS | 13,513 | 4,030,173 | |||||||||
4.50%, 01/30/15 | ILS | 5,375 | 1,594,743 | |||||||||
5.50%, 01/31/42 | ILS | 3,582 | 1,085,763 | |||||||||
6.00%, 02/28/19 | ILS | 45,982 | 15,384,135 | |||||||||
|
| |||||||||||
| 28,290,569 | ||||||||||||
MALAYSIA — 4.49% | ||||||||||||
Malaysia (Federation of) | ||||||||||||
3.49%, 03/31/20 | MYR | 6,155 | 1,941,423 | |||||||||
3.84%, 08/12/15 | MYR | 16,605 | 5,337,669 | |||||||||
4.13%, 04/15/32 | MYR | 7,400 | 2,349,788 | |||||||||
5.09%, 04/30/14 | MYR | 15,750 | 5,044,961 | |||||||||
5.73%, 07/30/19 | MYR | 39,666 | 13,982,625 | |||||||||
|
| |||||||||||
| 28,656,466 | ||||||||||||
SCHEDULESOF INVESTMENTS | 29 |
Table of Contents
Schedule of Investments (Continued)
iSHARES® EMERGING MARKETS LOCAL CURRENCY BOND ETF
October 31, 2013
| Security | Principal (000s) | Value | ||||||||||
MEXICO — 7.40% | ||||||||||||
United Mexican States | ||||||||||||
6.25%, 06/16/16 | MXN | 49,436 | $ | 3,989,484 | ||||||||
6.50%, 06/10/21 | MXN | 38,792 | 3,125,690 | |||||||||
7.00%, 06/19/14 | MXN | 60,229 | 4,728,093 | |||||||||
7.25%, 12/15/16 | MXN | 182,470 | 15,167,686 | |||||||||
7.50%, 06/03/27 | MXN | 29,837 | 2,506,530 | |||||||||
7.75%, 12/14/17 | MXN | 16,750 | 1,425,876 | |||||||||
7.75%, 11/13/42 | MXN | 58,561 | 4,719,836 | |||||||||
8.00%, 12/07/23 | MXN | 102,700 | 9,024,208 | |||||||||
8.50%, 11/18/38 | MXN | 29,330 | 2,551,274 | |||||||||
|
| |||||||||||
| 47,238,677 | ||||||||||||
NIGERIA — 0.90% | ||||||||||||
Nigeria (Federal Republic of) |
| |||||||||||
4.00%, 04/23/15 | NGN | 466,000 | 2,602,322 | |||||||||
10.00%, 07/23/30 | NGN | 162,000 | 823,262 | |||||||||
15.10%, 04/27/17 | NGN | 273,000 | 1,848,939 | |||||||||
16.39%, 01/27/22 | NGN | 62,000 | 470,193 | |||||||||
|
| |||||||||||
| 5,744,716 | ||||||||||||
PERU — 1.01% | ||||||||||||
Peru (Republic of) |
| |||||||||||
6.85%, 02/12/42 | PEN | 1,300 | 494,084 | |||||||||
8.20%, 08/12/26 | PEN | 13,339 | 5,953,310 | |||||||||
|
| |||||||||||
| 6,447,394 | ||||||||||||
PHILIPPINES — 3.23% | ||||||||||||
Philippines (Republic of the) |
| |||||||||||
4.00%, 12/06/22 | PHP | 68,000 | 1,656,518 | |||||||||
4.95%, 01/15/21 | PHP | 24,000 | 610,970 | |||||||||
5.00%, 08/18/18 | PHP | 77,300 | 1,959,191 | |||||||||
6.25%, 01/14/36 | PHP | 57,000 | 1,503,819 | |||||||||
7.00%, 01/27/16 | PHP | 246,246 | 6,312,697 | |||||||||
8.13%, 12/16/35 | PHP | 257,540 | 8,584,340 | |||||||||
|
| |||||||||||
| 20,627,535 | ||||||||||||
POLAND — 6.68% | ||||||||||||
Poland (Republic of) |
| |||||||||||
0.00%, 01/25/14 | PLN | 10,432 | 3,371,549 | |||||||||
0.00%, 07/25/15 | PLN | 36,320 | 11,243,760 | |||||||||
0.00%, 01/25/16 | PLN | 1,700 | 517,271 | |||||||||
3.75%, 04/25/18 | PLN | 15,000 | 4,938,524 | |||||||||
4.00%, 10/25/23 | PLN | 9,500 | 3,042,390 | |||||||||
5.25%, 10/25/20 | PLN | 4,000 | 1,406,617 | |||||||||
5.75%, 04/25/14 | PLN | 23,437 | 7,728,923 | |||||||||
| Security | Principal (000s) | Value | ||||||||||
5.75%, 09/23/22 | PLN | 28,516 | $ | 10,368,283 | ||||||||
|
| |||||||||||
| 42,617,317 | ||||||||||||
ROMANIA — 1.27% | ||||||||||||
Romania (Republic of) |
| |||||||||||
5.75%, 01/27/16 | RON | 14,140 | 4,510,259 | |||||||||
5.85%, 07/28/14 | RON | 6,120 | 1,911,489 | |||||||||
5.90%, 07/26/17 | RON | 5,100 | 1,654,572 | |||||||||
|
| |||||||||||
| 8,076,320 | ||||||||||||
RUSSIA — 4.25% | ||||||||||||
Russian Federation (The) |
| |||||||||||
6.88%, 07/15/15 | RUB | 149,593 | 4,722,103 | |||||||||
6.90%, 02/06/36a | RUB | 22,500 | 630,314 | |||||||||
7.10%, 03/13/14 | RUB | 83,500 | 2,612,892 | |||||||||
7.40%, 04/19/17 | RUB | 124,000 | 3,969,481 | |||||||||
7.60%, 04/14/21 | RUB | 164,556 | 5,320,060 | |||||||||
7.85%, 03/10/18b | RUB | 125,000 | 4,050,961 | |||||||||
8.15%, 02/03/27 | RUB | 176,840 | 5,843,942 | |||||||||
|
| |||||||||||
| 27,149,753 | ||||||||||||
SOUTH AFRICA — 4.41% | ||||||||||||
South Africa (Republic of) |
| |||||||||||
6.25%, 03/31/36 | ZAR | 57,314 | 4,293,380 | |||||||||
6.50%, 02/28/41 | ZAR | 81,983 | 6,129,232 | |||||||||
6.75%, 03/31/21 | ZAR | 39,000 | 3,769,071 | |||||||||
8.25%, 09/15/17 | ZAR | 122,211 | 12,909,823 | |||||||||
13.50%, 09/15/15 | ZAR | 9,400 | 1,063,974 | |||||||||
|
| |||||||||||
| 28,165,480 | ||||||||||||
SOUTH KOREA — 20.77% |
| |||||||||||
Korea (Republic of) |
| |||||||||||
2.75%, 09/10/17 | KRW | 9,271,640 | 8,662,067 | |||||||||
2.82%, 08/02/14 | KRW | 21,956,190 | 20,726,271 | |||||||||
3.00%, 12/10/13 | KRW | 17,540,900 | 16,543,429 | |||||||||
3.59%, 04/02/14 | KRW | 13,000,000 | 12,305,972 | |||||||||
4.00%, 03/10/16 | KRW | 15,270,600 | 14,782,574 | |||||||||
4.00%, 12/10/31 | KRW | 16,473,490 | 16,264,766 | |||||||||
4.75%, 12/10/30 | KRW | 2,400,000 | 2,581,095 | |||||||||
5.00%, 06/10/20 | KRW | 8,100,000 | 8,432,018 | |||||||||
5.25%, 09/10/15 | KRW | 11,702,460 | 11,521,972 | |||||||||
5.25%, 03/10/27 | KRW | 5,000,000 | 5,560,641 | |||||||||
5.50%, 09/10/17 | KRW | 2,281,600 | 2,344,042 | |||||||||
5.50%, 12/10/29 | KRW | 5,259,930 | 6,079,552 | |||||||||
5.75%, 09/10/18 | KRW | 6,400,000 | 6,751,993 | |||||||||
|
| |||||||||||
| 132,556,392 | ||||||||||||
| 30 | 2013 iSHARES ANNUAL REPORTTO SHAREHOLDERS |
Table of Contents
Schedule of Investments (Continued)
iSHARES® EMERGING MARKETS LOCAL CURRENCY BOND ETF
October 31, 2013
| Security | Principal or Shares (000s) | Value | ||||||||||
THAILAND — 4.39% | ||||||||||||
Thailand (Kingdom of) |
| |||||||||||
3.13%, 12/11/15 | THB | 338,506 | $ | 10,934,967 | ||||||||
3.58%, 12/17/27 | THB | 85,283 | 2,577,780 | |||||||||
3.63%, 05/22/15 | THB | 76,193 | 2,480,820 | |||||||||
3.78%, 06/25/32 | THB | 21,000 | 623,361 | |||||||||
3.80%, 06/14/41 | THB | 30,000 | 847,740 | |||||||||
5.67%, 03/13/28 | THB | 238,354 | 8,797,311 | |||||||||
6.15%, 07/07/26 | THB | 45,029 | 1,729,388 | |||||||||
|
| |||||||||||
| 27,991,367 | ||||||||||||
TURKEY — 4.44% | ||||||||||||
Turkey (Republic of) |
| |||||||||||
6.30%, 02/14/18 | TRY | 11,060 | 5,204,543 | |||||||||
7.50%, 09/24/14 | TRY | 5,355 | 2,687,862 | |||||||||
8.50%, 09/14/22 | TRY | 6,294 | 3,133,968 | |||||||||
9.00%, 03/05/14 | TRY | 3,548 | 1,793,937 | |||||||||
9.00%, 01/27/16 | TRY | 30,215 | 15,537,893 | |||||||||
|
| |||||||||||
| 28,358,203 | ||||||||||||
|
| |||||||||||
TOTAL FOREIGN GOVERNMENT OBLIGATIONS |
| |||||||||||
(Cost: $640,404,585) | 623,781,633 | |||||||||||
SHORT-TERM INVESTMENTS — 0.02% |
| |||||||||||
MONEY MARKET FUNDS — 0.02% |
| |||||||||||
BlackRock Cash Funds: Treasury, |
| |||||||||||
0.00%c,d | 111 | 111,048 | ||||||||||
|
| |||||||||||
| 111,048 | ||||||||||||
|
| |||||||||||
TOTAL SHORT-TERM INVESTMENTS |
| |||||||||||
(Cost: $111,048) |
| 111,048 | ||||||||||
|
| |||||||||||
| Value | ||||||||
TOTAL INVESTMENTS | ||||||||
(Cost: $640,515,633) | $ | 623,892,681 | ||||||
Other Assets, Less Liabilities — 2.26% | 14,448,890 | |||||||
|
| |||||||
NET ASSETS —100.00% | $ | 638,341,571 | ||||||
|
| |||||||
BRL | — Brazilian Real | |
CLP | — Chilean Peso | |
COP | — Colombian Peso | |
CZK | — Czech Koruna | |
EGP | — Egyptian Pound | |
HUF | — Hungarian Forint | |
IDR | — Indonesian Rupiah | |
ILS | — Israeli Shekel | |
KRW | — South Korean Won | |
MXN | — Mexican Peso | |
MYR | — Malaysian Ringgit | |
NGN | — Nigerian Naira | |
PEN | — Peru Nuevo | |
PHP | — Philippine Peso | |
PLN | — Polish Zloty | |
RON | — Romanian Leu | |
RUB | — New Russian Ruble | |
THB | — Thai Baht | |
TRY | — Turkish Lira | |
ZAR | — South African Rand |
| a | Step coupon security. Coupon rate will either increase (step-up bond) or decrease (step-down bond) at regular intervals until maturity. Interest rate shown reflects the rate currently in effect. |
| b | This security may be resold to qualified foreign investors and foreign institutional buyers under Regulation S of the Securities Act of 1933. |
| c | Affiliated issuer. See Note 2. |
| d | The rate quoted is the annualized seven-day yield of the fund at period end. |
See notes to financial statements.
SCHEDULESOF INVESTMENTS | 31 |
Table of Contents
Schedule of Investments
iSHARES® GLOBAL EX USD HIGH YIELD CORPORATE BOND ETF
October 31, 2013
| Security | Principal (000s) | Value | ||||||||||
CORPORATE BONDS & NOTES — 93.79% |
| |||||||||||
AUSTRIA — 0.27% |
| |||||||||||
Telekom Austria AG | ||||||||||||
5.63%, 12/31/49 (Call 02/01/18)a,b | EUR | 100 | $ | 140,030 | ||||||||
|
| |||||||||||
| 140,030 | ||||||||||||
BELGIUM — 0.29% |
| |||||||||||
Barry Callebaut AG Registered | ||||||||||||
5.63%, 06/15/21b | EUR | 100 | 150,062 | |||||||||
|
| |||||||||||
| 150,062 | ||||||||||||
CANADA — 4.00% |
| |||||||||||
Armtec Holdings Ltd. | ||||||||||||
8.88%, 09/22/17 (Call 12/02/13) | CAD | 13 | 10,227 | |||||||||
Athabasca Oil Corp. | ||||||||||||
7.50%, 11/19/17 (Call 11/19/14)c | CAD | 150 | 134,847 | |||||||||
Bombardier Inc. | ||||||||||||
6.13%, 05/15/21b | EUR | 200 | 298,495 | |||||||||
Cara Operations Ltd. | ||||||||||||
9.13%, 12/01/15 (Call 12/02/13) | CAD | 35 | 34,401 | |||||||||
Cascades Inc. | ||||||||||||
7.75%, 12/15/16 (Call 12/15/13)b | CAD | 50 | 49,863 | |||||||||
Centric Health Corp. | ||||||||||||
8.63%, 04/18/18 (Call 04/18/16) | CAD | 80 | 70,000 | |||||||||
Connacher Oil and Gas Ltd. | ||||||||||||
8.75%, 08/01/18 (Call 08/01/15)c | CAD | 100 | 67,058 | |||||||||
Corus Entertainment Inc. | ||||||||||||
4.25%, 02/11/20b | CAD | 100 | 91,097 | |||||||||
Gateway Casinos & Entertainment Ltd. | ||||||||||||
8.88%, 11/15/17 (Call 12/02/13)c | CAD | 100 | 101,887 | |||||||||
Great Canadian Gaming Corp. | ||||||||||||
6.63%, 07/25/22 (Call 07/25/17)c | CAD | 25 | 24,752 | |||||||||
Mattamy Group Corp. | ||||||||||||
6.88%, 11/15/20 (Call 11/15/15)c | CAD | 100 | 94,333 | |||||||||
Newalta Corp. | ||||||||||||
7.75%, 11/14/19 (Call 11/14/15) | CAD | 50 | 51,306 | |||||||||
Paramount Resources Ltd. | ||||||||||||
8.25%, 12/13/17 (Call 12/13/13) | CAD | 150 | 147,765 | |||||||||
Perpetual Energy Inc. | ||||||||||||
8.75%, 03/15/18 (Call 03/15/15)b | CAD | 50 | 45,548 | |||||||||
| Security | Principal (000s) | Value | ||||||||||
Postmedia Network Inc. | ||||||||||||
8.25%, 08/16/17 (Call 08/16/15)c | CAD | 47 | $ | 45,872 | ||||||||
Quebecor Media Inc. | ||||||||||||
6.63%, 01/15/23c | CAD | 100 | 96,011 | |||||||||
7.38%, 01/15/21 (Call 01/15/16) | CAD | 150 | 154,624 | |||||||||
Russel Metals Inc. | ||||||||||||
6.00%, 04/19/22 (Call 04/19/17)c | CAD | 50 | 47,946 | |||||||||
Southern Pacific Resource Corp. | ||||||||||||
8.75%, 01/25/18 (Call 01/25/15)c | CAD | 50 | 40,274 | |||||||||
Tervita Corp. | ||||||||||||
9.00%, 11/15/18 (Call 11/15/15)c | CAD | 25 | 24,662 | |||||||||
Trident Exploration Corp. | ||||||||||||
8.25%, 04/13/18 (Call 04/13/15) | CAD | 50 | 41,713 | |||||||||
Vermilion Energy Inc. | ||||||||||||
6.50%, 02/10/16 (Call 02/10/14) | CAD | 100 | 99,727 | |||||||||
Videotron Ltee | ||||||||||||
5.63%, 06/15/25 (Call 03/15/25) | CAD | 75 | 69,089 | |||||||||
6.88%, 07/15/21 (Call 06/15/16) | CAD | 75 | 78,778 | |||||||||
YPG Financing Inc. | ||||||||||||
9.25%, 11/30/18 (Call 12/02/13)c | CAD | 126 | 125,502 | |||||||||
|
| |||||||||||
| 2,045,777 | ||||||||||||
FINLAND — 1.04% |
| |||||||||||
Nokia OYJ | ||||||||||||
6.75%, 02/04/19b | EUR | 100 | 153,284 | |||||||||
Stora Enso OYJ | ||||||||||||
5.00%, 03/19/18b | EUR | 100 | 144,107 | |||||||||
5.50%, 03/07/19b | EUR | 100 | 145,238 | |||||||||
UPM-Kymmene OYJ | ||||||||||||
6.63%, 01/23/17 | GBP | 50 | 87,307 | |||||||||
|
| |||||||||||
| 529,936 | ||||||||||||
FRANCE — 14.01% |
| |||||||||||
Alcatel-Lucent | ||||||||||||
6.38%, 04/07/14b | EUR | 100 | 138,030 | |||||||||
8.50%, 01/15/16b | EUR | 100 | 152,382 | |||||||||
Banque PSA Finance SA | ||||||||||||
4.88%, 09/25/15b | EUR | 100 | 141,613 | |||||||||
Cegedim SA | ||||||||||||
6.75%, 04/01/20 (Call 04/01/16)b | EUR | 100 | 136,874 | |||||||||
Cerba European Lab | ||||||||||||
7.00%, 02/01/20 (Call 02/01/16)b | EUR | 100 | 144,904 | |||||||||
Ciments Francais SA | ||||||||||||
4.75%, 04/04/17b | EUR | 100 | 142,122 | |||||||||
| 32 | 2013 iSHARES ANNUAL REPORTTO SHAREHOLDERS |
Table of Contents
Schedule of Investments (Continued)
iSHARES® GLOBAL EX USD HIGH YIELD CORPORATE BOND ETF
October 31, 2013
| Security | Principal (000s) | Value | ||||||||||
CMA CGM SA | ||||||||||||
8.88%, 04/15/19 (Call 04/15/15)b | EUR | 100 | $ | 133,571 | ||||||||
Crown European Holdings SA | ||||||||||||
7.13%, 08/15/18 (Call 08/15/14)b | EUR | 100 | 145,355 | |||||||||
Europcar Groupe SA | ||||||||||||
9.38%, 04/15/18 (Call 12/02/13)b | EUR | 100 | 142,849 | |||||||||
Faurecia SA | ||||||||||||
9.38%, 12/15/16b | EUR | 100 | 161,735 | |||||||||
Financiere Atalian SA | ||||||||||||
7.25%, 01/15/20 (Call 01/15/17)b | EUR | 100 | 140,713 | |||||||||
Groupama SA | ||||||||||||
7.88%, 10/27/39 (Call 10/27/19)a | EUR | 150 | 205,393 | |||||||||
Labco SAS | ||||||||||||
8.50%, 01/15/18 (Call 01/15/14)b | EUR | 125 | 181,125 | |||||||||
Lafarge SA | ||||||||||||
5.38%, 06/26/17b | EUR | 550 | 820,329 | |||||||||
6.75%, 12/16/19b | EUR | 100 | 154,256 | |||||||||
8.88%, 11/24/16b | EUR | 200 | 321,886 | |||||||||
Medi-Partenaires SAS | ||||||||||||
7.00%, 05/15/20 (Call 05/15/16)b | EUR | 100 | 137,139 | |||||||||
Nexans SA | ||||||||||||
5.75%, 05/02/17 | EUR | 100 | 146,883 | |||||||||
Novalis SAS | ||||||||||||
6.00%, 06/15/18 (Call 06/15/15)b | EUR | 100 | 142,861 | |||||||||
PagesJaunes Finance & Co. | ||||||||||||
8.88%, 06/01/18 (Call 06/01/14)b | EUR | 100 | 128,473 | |||||||||
Peugeot SA | ||||||||||||
5.63%, 06/29/15 | EUR | 50 | 71,537 | |||||||||
5.63%, 07/11/17 | EUR | 300 | 434,105 | |||||||||
7.38%, 03/06/18b | EUR | 200 | 298,784 | |||||||||
8.38%, 07/15/14b | EUR | 150 | 213,004 | |||||||||
Renault SA | ||||||||||||
4.63%, 09/18/17b | EUR | 250 | 365,855 | |||||||||
5.63%, 06/30/15 | EUR | 500 | 724,356 | |||||||||
Rexel SA | ||||||||||||
5.13%, 06/15/20 (Call 06/15/16)b | EUR | 100 | 143,654 | |||||||||
7.00%, 12/17/18b | EUR | 100 | 149,630 | |||||||||
SPCM SA | ||||||||||||
5.50%, 06/15/20b | EUR | 100 | 145,976 | |||||||||
Tereos Finance Group I | ||||||||||||
4.25%, 03/04/20 (Call 03/04/19) | EUR | 100 | 136,969 | |||||||||
Wendel SA | ||||||||||||
4.38%, 08/09/17 | EUR | 150 | 216,932 | |||||||||
4.88%, 09/21/15 | EUR | 100 | 144,209 | |||||||||
| Security | Principal (000s) | Value | ||||||||||
4.88%, 05/26/16 | EUR | 100 | $ | 145,410 | ||||||||
6.75%, 04/20/18 | EUR | 100 | 155,499 | |||||||||
|
| |||||||||||
| 7,164,413 | ||||||||||||
GERMANY — 11.53% |
| |||||||||||
Beverage Packaging Holdings (Luxembourg) II SA | ||||||||||||
9.50%, 06/15/17 (Call 12/02/13)b | EUR | 150 | 210,690 | |||||||||
Brenntag Finance BV | ||||||||||||
5.50%, 07/19/18b | EUR | 100 | 153,086 | |||||||||
Commerzbank AG | ||||||||||||
6.38%, 03/22/19 | EUR | 100 | 145,947 | |||||||||
7.75%, 03/16/21 | EUR | 300 | 450,565 | |||||||||
Continental AG | ||||||||||||
3.00%, 07/16/18b | EUR | 100 | 142,204 | |||||||||
Franz Haniel & Cie GmbH | ||||||||||||
6.25%, 02/08/18 | EUR | 100 | 156,918 | |||||||||
7.13%, 02/01/17 | EUR | 150 | 230,557 | |||||||||
Gerresheimer AG | ||||||||||||
5.00%, 05/19/18b | EUR | 75 | 114,198 | |||||||||
Hapag-Lloyd AG | ||||||||||||
9.00%, 10/15/15 (Call 12/12/13)b | EUR | 90 | 127,403 | |||||||||
Heckler & Koch GmbH | ||||||||||||
9.50%, 05/15/18 (Call 05/15/14)b | EUR | 100 | 133,285 | |||||||||
Heidelberger Druckmaschinen AG | ||||||||||||
9.25%, 04/15/18 (Call 04/15/14)b | EUR | 50 | 69,929 | |||||||||
Kabel Deutschland Vertrieb und Service GmbH | ||||||||||||
6.50%, 06/29/18 (Call 06/30/14)b | EUR | 200 | 289,410 | |||||||||
KM Germany Holdings GmbH | ||||||||||||
8.75%, 12/15/20 (Call 12/15/15)b | EUR | 100 | 150,667 | |||||||||
Norddeutsche Landesbank Girozentrale | ||||||||||||
6.00%, 06/29/20 | EUR | 100 | 151,487 | |||||||||
Orion Engineered Carbons Bondco GmbH | ||||||||||||
10.00%, 06/15/18 (Call 06/15/14)b | EUR | 90 | 136,196 | |||||||||
Styrolution Group GmbH | ||||||||||||
7.63%, 05/15/16 (Call 12/02/13)b | EUR | 125 | 178,618 | |||||||||
Techem Energy Metering Service GmbH & Co. KG | ||||||||||||
7.88%, 10/01/20 (Call 10/01/16)b | EUR | 100 | 150,938 | |||||||||
ThyssenKrupp AG | ||||||||||||
4.00%, 08/27/18 | EUR | 200 | 283,573 | |||||||||
SCHEDULESOF INVESTMENTS | 33 |
Table of Contents
Schedule of Investments (Continued)
iSHARES® GLOBAL EX USD HIGH YIELD CORPORATE BOND ETF
October 31, 2013
| Security | Principal (000s) | Value | ||||||||||
4.38%, 03/18/15 | EUR | 200 | $ | 280,995 | ||||||||
4.38%, 02/28/17 | EUR | 250 | 358,885 | |||||||||
ThyssenKrupp Finance Nederland BV | ||||||||||||
8.50%, 02/25/16 | EUR | 200 | 307,739 | |||||||||
Trionista TopCo GmbH | ||||||||||||
6.88%, 04/30/21 (Call 04/30/16)b | EUR | 100 | 142,408 | |||||||||
Unitymedia Hessen GmbH & Co. KG/Unitymedia NRW GmbH | ||||||||||||
5.13%, 01/21/23 (Call 01/21/18)b | EUR | 100 | 133,460 | |||||||||
5.50%, 09/15/22 (Call 09/15/17)b | EUR | 150 | 206,481 | |||||||||
5.75%, 01/15/23 (Call 01/15/18)b | EUR | 100 | 139,774 | |||||||||
7.50%, 03/15/19 (Call 03/15/15)b | EUR | 100 | 147,510 | |||||||||
8.13%, 12/01/17 (Call 12/02/13)b | EUR | 116 | 164,470 | |||||||||
Unitymedia KabelBW GmbH | ||||||||||||
9.50%, 03/15/21 (Call 03/15/16)b | EUR | 100 | 155,889 | |||||||||
9.63%, 12/01/19 (Call 12/01/14)b | EUR | 100 | 150,701 | |||||||||
UPCB Finance II Ltd. | ||||||||||||
6.38%, 07/01/20 (Call 07/01/15)b | EUR | 150 | 216,925 | |||||||||
UPCB Finance Ltd. | ||||||||||||
7.63%, 01/15/20 (Call 01/15/15)b | EUR | 50 | 73,519 | |||||||||
WEPA Hygieneprodukte GmbH | ||||||||||||
6.50%, 05/15/20 (Call 05/15/16)b | EUR | 100 | 145,410 | |||||||||
|
| |||||||||||
| 5,899,837 | ||||||||||||
GREECE — 1.13% |
| |||||||||||
OTE PLC | ||||||||||||
7.25%, 02/12/15b,d | EUR | 250 | 356,019 | |||||||||
7.88%, 02/07/18b | EUR | 150 | 223,544 | |||||||||
|
| |||||||||||
| 579,563 | ||||||||||||
IRELAND — 3.12% |
| |||||||||||
AG Spring Finance Ltd. | ||||||||||||
7.50%, 06/01/18 (Call 06/01/15)b | EUR | 100 | 142,450 | |||||||||
Allied Irish Banks PLC | ||||||||||||
5.63%, 11/12/14b | EUR | 100 | 140,085 | |||||||||
Ardagh Glass Finance PLC | ||||||||||||
7.13%, 06/15/17 (Call 06/15/14)b | EUR | 150 | 208,860 | |||||||||
Ardagh Packaging Finance PLC | ||||||||||||
7.38%, 10/15/17 (Call 10/15/14)b | EUR | 150 | 217,520 | |||||||||
9.25%, 10/15/20 (Call 10/15/15)b | EUR | 100 | 146,663 | |||||||||
Eircom Finance Ltd. | ||||||||||||
9.25%, 05/15/20 (Call 05/15/16)b | EUR | 100 | 142,181 | |||||||||
Governor & Co. of the Bank of Ireland (The) | ||||||||||||
10.00%, 12/19/22b | EUR | 100 | 159,911 | |||||||||
| Security | Principal (000s) | Value | ||||||||||
Rottapharm Ltd. | ||||||||||||
6.13%, 11/15/19 (Call 11/15/15)b | EUR | 100 | $ | 140,141 | ||||||||
Smurfit Kappa Acquisitions | ||||||||||||
7.75%, 11/15/19 (Call 11/15/14)b | EUR | 200 | 295,898 | |||||||||
|
| |||||||||||
| 1,593,709 | ||||||||||||
ITALY — 8.85% |
| |||||||||||
Banca Monte dei Paschi di Siena SpA | ||||||||||||
4.88%, 05/31/16 | EUR | 150 | 184,600 | |||||||||
5.00%, 04/21/20b | EUR | 100 | 121,562 | |||||||||
5.60%, 09/09/20 | EUR | 50 | 62,835 | |||||||||
Series 1 | ||||||||||||
7.25%, 07/10/15b | EUR | 250 | 357,310 | |||||||||
Banca Popolare di Milano Scarl | ||||||||||||
7.13%, 03/01/21b | EUR | 100 | 140,708 | |||||||||
Banca Popolare di Vicenza | ||||||||||||
6.75%, 02/27/15b | EUR | 150 | 211,827 | |||||||||
Banco Popolare | ||||||||||||
5.47%, 11/12/16b | EUR | 100 | 139,845 | |||||||||
6.00%, 11/05/20b | EUR | 350 | 480,751 | |||||||||
Buzzi Unicem SpA | ||||||||||||
6.25%, 09/28/18b | EUR | 100 | 149,545 | |||||||||
Cerved Group SpA | ||||||||||||
6.38%, 01/15/20 (Call 01/15/16)b | EUR | 100 | 143,512 | |||||||||
Enel SPA | ||||||||||||
6.50%, 01/10/74 (Call 01/10/19)a,b | EUR | 200 | 285,495 | |||||||||
Fiat Finance North America Inc. | ||||||||||||
5.63%, 06/12/17 | EUR | 100 | 142,226 | |||||||||
GTECH SpA | ||||||||||||
8.25%, 03/31/66 (Call 03/31/16)a,b | EUR | 150 | 221,383 | |||||||||
Intesa Sanpaolo SpA | ||||||||||||
6.63%, 09/13/23b | EUR | 163 | 237,496 | |||||||||
Italcementi Finance SA | ||||||||||||
6.13%, 02/21/18b | EUR | 100 | 144,889 | |||||||||
6.63%, 03/19/20b,d | EUR | 150 | 220,086 | |||||||||
Manutencoop Facility Management SpA | ||||||||||||
8.50%, 08/01/20 (Call 08/01/16)b | EUR | 100 | 138,442 | |||||||||
Sisal Holding Istituto di Pagamento SpA | ||||||||||||
7.25%, 09/30/17b | EUR | 100 | 140,588 | |||||||||
| 34 | 2013 iSHARES ANNUAL REPORTTO SHAREHOLDERS |
Table of Contents
Schedule of Investments (Continued)
iSHARES® GLOBAL EX USD HIGH YIELD CORPORATE BOND ETF
October 31, 2013
| Security | Principal (000s) | Value | ||||||||||
TeamSystem Holding SpA | ||||||||||||
7.38%, 05/15/20 (Call 05/15/16)b | EUR | 100 | $ | 137,649 | ||||||||
Telecom Italia SpA | ||||||||||||
7.75%, 03/20/73 (Call 03/20/18)a,b | EUR | 100 | 138,612 | |||||||||
UniCredit SpA | ||||||||||||
3.95%, 02/01/16 | EUR | 100 | 137,423 | |||||||||
5.00%, 02/01/16 | GBP | 50 | 80,732 | |||||||||
6.70%, 06/05/18 | EUR | 200 | 294,558 | |||||||||
Unipol Gruppo Finanziario SpA | ||||||||||||
5.00%, 01/11/17b | EUR | 150 | 213,727 | |||||||||
|
| |||||||||||
| 4,525,801 | ||||||||||||
JAPAN — 0.14% |
| |||||||||||
Shinshei Bank Ltd. | ||||||||||||
7.38%, 09/14/20a | EUR | 50 | 70,297 | |||||||||
|
| |||||||||||
| 70,297 | ||||||||||||
LUXEMBOURG — 15.02% |
| |||||||||||
ArcelorMittal SA | ||||||||||||
5.75%, 03/29/18b | EUR | 100 | 149,307 | |||||||||
5.88%, 11/17/17b | EUR | 200 | 300,540 | |||||||||
10.63%, 06/03/16 | EUR | 100 | 163,041 | |||||||||
Capsugel FinanceCo SCA | ||||||||||||
9.88%, 08/01/19 (Call 08/01/14)b | EUR | 100 | 151,598 | |||||||||
Clariant Finance Luxembourg SA | ||||||||||||
5.63%, 01/24/17 | EUR | 150 | 228,108 | |||||||||
CNH Industrial Finance Europe SA | ||||||||||||
5.25%, 03/11/15b | EUR | 300 | 428,242 | |||||||||
6.25%, 03/09/18b | EUR | 250 | 387,457 | |||||||||
ConvaTec Healthcare E SA | ||||||||||||
7.38%, 12/15/17 (Call 12/15/13)b | EUR | 150 | 215,990 | |||||||||
Elior Finance & Co. SCA | ||||||||||||
6.50%, 05/01/20 (Call 05/01/16)b | EUR | 100 | 145,580 | |||||||||
Fiat Finance & Trade SA | ||||||||||||
6.38%, 04/01/16b | EUR | 400 | 579,527 | |||||||||
6.75%, 10/14/19b | EUR | 150 | 215,385 | |||||||||
6.88%, 02/13/15 | EUR | 150 | 214,733 | |||||||||
7.75%, 10/17/16b | EUR | 200 | 300,137 | |||||||||
FMC Finance VIII SA | ||||||||||||
6.50%, 09/15/18b | EUR | 250 | 396,838 | |||||||||
Gestamp Funding Luxembourg SA | ||||||||||||
5.88%, 05/31/20 (Call 05/31/16)b | EUR | 100 | 141,345 | |||||||||
| Security | Principal (000s) | Value | ||||||||||
HeidelbergCement Finance Luxembourg SA | ||||||||||||
4.00%, 03/08/16b | EUR | 250 | $ | 356,925 | ||||||||
8.50%, 10/31/19b | EUR | 100 | 172,996 | |||||||||
Ineos Group Holdings SA | ||||||||||||
6.50%, 08/15/18 (Call 05/15/15)b | EUR | 100 | 136,120 | |||||||||
7.88%, 02/15/16 (Call 12/02/13)b | EUR | 168 | 231,916 | |||||||||
KION Finance SA | ||||||||||||
6.75%, 02/15/20 (Call 02/15/16)b | EUR | 100 | 149,035 | |||||||||
7.88%, 04/15/18 (Call 04/15/14)b | EUR | 100 | 144,192 | |||||||||
Numericable Finance & Co. | ||||||||||||
12.38%, 02/15/19 (Call 02/15/16)b | EUR | 100 | 162,637 | |||||||||
Ontex IV SA | ||||||||||||
7.50%, 04/15/18 (Call 04/15/14)b | EUR | 100 | 143,810 | |||||||||
Schmolz + Bickenbach Luxembourg SA | ||||||||||||
9.88%, 05/15/19 (Call 05/15/15)b | EUR | 100 | 149,375 | |||||||||
Servus Luxembourg Holding SCA | ||||||||||||
7.75%, 06/15/18 (Call 06/15/15)b | EUR | 100 | 141,562 | |||||||||
Spie BondCo 3 SCA | ||||||||||||
11.00%, 08/15/19 (Call 08/15/15)b | EUR | 100 | 154,392 | |||||||||
Takko Luxembourg 2 S.C.A | ||||||||||||
9.88%, 04/15/19 (Call 04/15/16)b | EUR | 100 | 136,408 | |||||||||
Telenet Finance III Luxembourg SCA | ||||||||||||
6.63%, 02/15/21 (Call 02/15/16)b | EUR | 100 | 144,451 | |||||||||
Telenet Finance Luxembourg SCA | ||||||||||||
6.38%, 11/15/20 (Call 11/15/15)b | EUR | 100 | 144,565 | |||||||||
Telenet Finance V Luxembourg SCA | ||||||||||||
6.25%, 08/15/22 (Call 08/15/17)b | EUR | 100 | 141,395 | |||||||||
6.75%, 08/15/24 (Call 08/15/18)b | EUR | 100 | 142,521 | |||||||||
Wind Acquisition Finance SA | ||||||||||||
7.38%, 02/15/18 (Call 12/02/13)b | EUR | 200 | 285,382 | |||||||||
11.75%, 07/15/17 (Call 12/02/13)b | EUR | 300 | 434,360 | |||||||||
Xefin Lux SCA | ||||||||||||
8.00%, 06/01/18 (Call 06/01/14)b | EUR | 100 | 146,918 | |||||||||
Zinc Capital SA/Befesa Zinc SA | ||||||||||||
8.88%, 05/15/18 (Call 05/15/14)b | EUR | 100 | 146,259 | |||||||||
|
| |||||||||||
| 7,683,047 | ||||||||||||
NETHERLANDS — 13.12% |
| |||||||||||
EDP Finance BV | ||||||||||||
3.25%, 03/16/15b | EUR | 250 | 344,435 | |||||||||
4.75%, 09/26/16b | EUR | 200 | 286,861 | |||||||||
4.88%, 09/14/20 | EUR | 100 | 140,397 | |||||||||
SCHEDULESOF INVESTMENTS | 35 |
Table of Contents
Schedule of Investments (Continued)
iSHARES® GLOBAL EX USD HIGH YIELD CORPORATE BOND ETF
October 31, 2013
| Security | Principal (000s) | Value | ||||||||||
5.75%, 09/21/17b | EUR | 250 | $ | 369,444 | ||||||||
5.88%, 02/01/16b | EUR | 250 | 363,666 | |||||||||
Fresenius Finance BV | ||||||||||||
2.88%, 07/15/20b | EUR | 50 | 67,978 | |||||||||
4.25%, 04/15/19b | EUR | 150 | 217,486 | |||||||||
GMAC International Finance BV | ||||||||||||
7.50%, 04/21/15b | EUR | 150 | 218,441 | |||||||||
Goodyear Dunlop Tires Europe BV | ||||||||||||
6.75%, 04/15/19 (Call 04/15/15)b | EUR | 100 | 148,203 | |||||||||
HeidelbergCement Finance BV | ||||||||||||
5.63%, 01/04/18 | EUR | 150 | 227,376 | |||||||||
8.00%, 01/31/17b | EUR | 500 | 799,708 | |||||||||
Nokia Siemens Networks Finance BV | ||||||||||||
7.13%, 04/15/20 (Call 04/15/16)b | EUR | 100 | 154,475 | |||||||||
OI European Group BV | ||||||||||||
4.88%, 03/31/21b | EUR | 100 | 141,770 | |||||||||
6.75%, 09/15/20b | EUR | 100 | 157,645 | |||||||||
Phoenix PIB Dutch Finance BV | ||||||||||||
3.13%, 05/27/20b | EUR | 100 | 129,893 | |||||||||
Portugal Telecom International Finance BV | ||||||||||||
4.38%, 03/24/17 | EUR | 250 | 352,943 | |||||||||
4.63%, 05/08/20b | EUR | 200 | 273,484 | |||||||||
5.00%, 11/04/19b | EUR | 150 | 209,208 | |||||||||
5.88%, 04/17/18b | EUR | 140 | 205,172 | |||||||||
Refresco Group BV | ||||||||||||
7.38%, 05/15/18 (Call 05/15/14)b | EUR | 100 | 145,806 | |||||||||
Schaeffler Finance BV | ||||||||||||
4.25%, 05/15/18 (Call 05/15/15)b | EUR | 100 | 139,831 | |||||||||
7.75%, 02/15/17b | EUR | 250 | 387,916 | |||||||||
8.75%, 02/15/19 (Call 02/15/15)b | EUR | 100 | 153,457 | |||||||||
SNS BANK NV | ||||||||||||
6.25%, 10/26/20e | EUR | 50 | — | |||||||||
Stork Technical Services Holdings BV | ||||||||||||
11.00%, 08/15/17 (Call 02/15/15)b | EUR | 100 | 138,669 | |||||||||
UPC Holding BV | ||||||||||||
6.38%, 09/15/22 (Call 09/15/17)b | EUR | 100 | 137,994 | |||||||||
6.75%, 03/15/23 (Call 03/15/18)b | EUR | 100 | 139,009 | |||||||||
8.38%, 08/15/20 (Call 08/15/15)b | EUR | 200 | 298,247 | |||||||||
Ziggo Bond Co. BV | ||||||||||||
8.00%, 05/15/18 (Call 05/15/14)b | EUR | 250 | 362,392 | |||||||||
|
| |||||||||||
| 6,711,906 | ||||||||||||
| Security | Principal (000s) | Value | ||||||||||
NORWAY — 0.15% |
| |||||||||||
Norske Skogindustrier ASA | ||||||||||||
7.00%, 06/26/17b | EUR | 100 | $ | 74,603 | ||||||||
|
| |||||||||||
| 74,603 | ||||||||||||
PORTUGAL — 2.73% |
| |||||||||||
Banco Comercial Portugues SA | ||||||||||||
5.63%, 04/23/14 | EUR | 100 | 137,867 | |||||||||
9.25%, 10/13/14b | EUR | 150 | 214,808 | |||||||||
Banco Espirito Santo SA | ||||||||||||
3.88%, 01/21/15 | EUR | 150 | 205,383 | |||||||||
4.75%, 01/15/18b | EUR | 100 | 136,326 | |||||||||
5.88%, 11/09/15b | EUR | 100 | 140,463 | |||||||||
Brisa Concessao Rodoviaria SA | ||||||||||||
4.50%, 12/05/16 | EUR | 100 | 140,215 | |||||||||
6.88%, 04/02/18b | EUR | 100 | 146,486 | |||||||||
Espirito Santo Financial Group SA | ||||||||||||
6.88%, 10/21/19 | EUR | 100 | 134,166 | |||||||||
Portucel SA | ||||||||||||
5.38%, 05/15/20b | EUR | 100 | 142,584 | |||||||||
|
| |||||||||||
| 1,398,298 | ||||||||||||
SPAIN — 5.54% |
| |||||||||||
Abengoa SA | ||||||||||||
9.63%, 02/25/15b | EUR | 200 | 290,593 | |||||||||
Banco de Sabadell SA | ||||||||||||
6.25%, 04/26/20 | EUR | 50 | 69,929 | |||||||||
Bankia SA | ||||||||||||
4.38%, 02/14/17 | EUR | 100 | 137,309 | |||||||||
Bankinter SA | ||||||||||||
6.38%, 09/11/19 | EUR | 50 | 72,138 | |||||||||
BPE Financiaciones SA | ||||||||||||
4.00%, 07/17/15b | EUR | 200 | 277,380 | |||||||||
Campofrio Food Group SA | ||||||||||||
8.25%, 10/31/16 (Call 12/12/13)b | EUR | 125 | 177,815 | |||||||||
Cirsa Funding Luxembourg SA | ||||||||||||
8.75%, 05/15/18 (Call 05/15/14)b | EUR | 150 | 214,638 | |||||||||
Inaer Aviation Finance Ltd. | ||||||||||||
9.50%, 08/01/17 (Call 08/01/14)b | EUR | 100 | 142,153 | |||||||||
Mapfre SA | ||||||||||||
5.13%, 11/16/15 | EUR | 300 | 433,708 | |||||||||
5.92%, 07/24/37 (Call 07/24/17)a | EUR | 100 | 134,760 | |||||||||
Nara Cable Funding Ltd. | ||||||||||||
8.88%, 12/01/18 (Call 12/02/13)b | EUR | 300 | 439,713 | |||||||||
| 36 | 2013 iSHARES ANNUAL REPORTTO SHAREHOLDERS |
Table of Contents
Schedule of Investments (Continued)
iSHARES® GLOBAL EX USD HIGH YIELD CORPORATE BOND ETF
October 31, 2013
| Security | Principal (000s) | Value | ||||||||||
Obrascon Huarte Lain SA | ||||||||||||
7.38%, 04/28/15 | EUR | 100 | $ | 145,750 | ||||||||
7.63%, 03/15/20 (Call 03/15/16)b | EUR | 100 | 148,242 | |||||||||
8.75%, 03/15/18 (Call 03/15/15)b | EUR | 100 | 151,754 | |||||||||
|
| |||||||||||
| 2,835,882 | ||||||||||||
SWEDEN — 1.01% |
| |||||||||||
Norcell Sweden Holding 2 AB | ||||||||||||
10.75%, 09/29/19 (Call 11/14/15)b | EUR | 100 | 150,116 | |||||||||
Stena AB | ||||||||||||
6.13%, 02/01/17b | EUR | 100 | 145,466 | |||||||||
Verisure Holding AB | ||||||||||||
8.75%, 09/01/18 (Call 09/01/14)b | EUR | 150 | 222,795 | |||||||||
|
| |||||||||||
| 518,377 | ||||||||||||
SWITZERLAND — 0.58% |
| |||||||||||
Sunrise Communications Holdings SA | ||||||||||||
8.50%, 12/31/18 (Call 12/31/14)b | EUR | 200 | 294,841 | |||||||||
|
| |||||||||||
| 294,841 | ||||||||||||
UNITED KINGDOM — 10.46% |
| |||||||||||
AA Bond Co. Ltd. | ||||||||||||
9.50%, 07/31/43 (Call 01/31/16)b | GBP | 100 | 175,923 | |||||||||
Algeco Scotsman Global Finance PLC | ||||||||||||
9.00%, 10/15/18 (Call 10/15/15)b | EUR | 100 | 146,235 | |||||||||
Arqiva Broadcast Finance PLC | ||||||||||||
9.50%, 03/31/20 (Call 03/31/16)b | GBP | 100 | 175,521 | |||||||||
Aston Martin Capital Ltd. | ||||||||||||
9.25%, 07/15/18 (Call 07/15/14)c | GBP | 100 | 170,300 | |||||||||
Boparan Finance PLC | ||||||||||||
9.75%, 04/30/18 (Call 04/30/14)b | EUR | 100 | 149,460 | |||||||||
British Airways PLC | ||||||||||||
8.75%, 08/23/16 | GBP | 75 | 135,769 | |||||||||
Care UK | ||||||||||||
9.75%, 08/01/17c | GBP | 50 | 85,016 | |||||||||
Co-Operative Group Ltd. | ||||||||||||
6.88%, 07/08/20b,d | GBP | 100 | 163,878 | |||||||||
EC Finance PLC | ||||||||||||
9.75%, 08/01/17 (Call 08/01/14)b | EUR | 100 | 149,148 | |||||||||
Elli Finance UK PLC | ||||||||||||
8.75%, 06/15/19 (Call 06/15/15)c | GBP | 200 | 356,665 | |||||||||
Gala Group Finance PLC | ||||||||||||
8.88%, 09/01/18 (Call 06/01/14)c | GBP | 150 | 262,077 | |||||||||
| Security | Principal (000s) | Value | ||||||||||
HBOS PLC | ||||||||||||
4.38%, 10/30/19a | EUR | 50 | $ | 67,859 | ||||||||
Infinis PLC | ||||||||||||
7.00%, 02/15/19 (Call 02/15/16)c | GBP | 100 | 171,103 | |||||||||
Jaguar Land Rover Automotive PLC | ||||||||||||
8.13%, 05/15/18 (Call 05/15/14)c | GBP | 125 | 218,397 | |||||||||
8.25%, 03/15/20 (Call 03/15/16)c | GBP | 100 | 181,144 | |||||||||
Kerling PLC | ||||||||||||
10.63%, 02/01/17 (Call 02/01/14)b | EUR | 150 | 216,612 | |||||||||
Matalan Finance PLC | ||||||||||||
8.88%, 04/29/16 (Call 12/02/13)c | GBP | 100 | 165,078 | |||||||||
New Look Bondco I PLC | ||||||||||||
8.75%, 05/14/18 (Call 05/14/15)b | GBP | 100 | 169,821 | |||||||||
Odeon & UCI Finco PLC | ||||||||||||
9.00%, 08/01/18 (Call 08/01/14)c | GBP | 100 | 164,750 | |||||||||
Phones4u Finance PLC | ||||||||||||
9.50%, 04/01/18 (Call 04/01/14)c | GBP | 100 | 169,898 | |||||||||
Priory Group No. 3 PLC | ||||||||||||
7.00%, 02/15/18 (Call 02/15/14)c | GBP | 125 | 208,858 | |||||||||
R & R Ice Cream PLC | ||||||||||||
8.38%, 11/15/17 (Call 12/02/13)b | EUR | 100 | 144,872 | |||||||||
Rexam PLC | ||||||||||||
6.75%, 06/29/67 (Call 06/29/17)a,b | EUR | 150 | 215,311 | |||||||||
Royal Bank of Scotland Group PLC | ||||||||||||
4.63%, 09/22/21 (Call 09/22/16)a | EUR | 200 | 266,717 | |||||||||
Thomas Cook Finance PLC | ||||||||||||
7.75%, 06/15/20 (Call 06/15/16)b | EUR | 100 | 144,362 | |||||||||
Thomas Cook Group PLC | ||||||||||||
6.75%, 06/22/15 | EUR | 50 | 71,827 | |||||||||
7.75%, 06/22/17 | GBP | 50 | 85,552 | |||||||||
Virgin Media Finance PLC | ||||||||||||
7.00%, 04/15/23 (Call 04/15/18)b | GBP | 100 | 166,283 | |||||||||
Virgin Media Secured Finance PLC | ||||||||||||
5.50%, 01/15/21 | GBP | 100 | 162,668 | |||||||||
6.00%, 04/15/21 (Call 04/15/17)c | GBP | 100 | 165,882 | |||||||||
Viridian Group | ||||||||||||
11.13%, 04/01/17 (Call 04/01/15)b | EUR | 91 | 136,498 | |||||||||
William Hill PLC | ||||||||||||
7.13%, 11/11/16 | GBP | 50 | 89,166 | |||||||||
|
| |||||||||||
| 5,352,650 | ||||||||||||
SCHEDULESOF INVESTMENTS | 37 |
Table of Contents
Schedule of Investments (Continued)
iSHARES® GLOBAL EX USD HIGH YIELD CORPORATE BOND ETF
October 31, 2013
| Security | Principal or Shares (000s) | Value | ||||||||||
UNITED STATES — 0.80% |
| |||||||||||
Allied Nevada Gold Corp. | ||||||||||||
8.75%, 06/01/19 (Call 06/01/16)c | CAD | 75 | $ | 50,343 | ||||||||
Chesapeake Energy Corp. | ||||||||||||
6.25%, 01/15/17 | EUR | 50 | 74,178 | |||||||||
Levi Strauss & Co. | ||||||||||||
7.75%, 05/15/18 (Call 05/15/14) | EUR | 100 | 144,730 | |||||||||
US Coatings Acquisition Inc./Axalta Coating Systems Dutch Holding BV | ||||||||||||
5.75%, 02/01/21 (Call 02/01/16)b | EUR | 100 | 137,081 | |||||||||
|
| |||||||||||
| 406,332 | ||||||||||||
|
| |||||||||||
TOTAL CORPORATE BONDS & NOTES |
| |||||||||||
(Cost: $44,957,477) |
| 47,975,361 | ||||||||||
FOREIGN AGENCY OBLIGATIONS — 0.54% |
| |||||||||||
PORTUGAL — 0.54% |
| |||||||||||
Caixa Geral de Depositos SA |
| |||||||||||
5.13%, 02/19/14 | EUR | 100 | 137,174 | |||||||||
5.63%, 12/04/15b | EUR | 100 | 141,773 | |||||||||
|
| |||||||||||
| 278,947 | ||||||||||||
|
| |||||||||||
TOTAL FOREIGN AGENCY OBLIGATIONS |
| |||||||||||
(Cost: $268,120) |
| 278,947 | ||||||||||
SHORT-TERM INVESTMENTS — 0.01% |
| |||||||||||
MONEY MARKET FUNDS — 0.01% |
| |||||||||||
BlackRock Cash Funds: Treasury, |
| |||||||||||
0.00%f,g | 7 | 6,507 | ||||||||||
|
| |||||||||||
| 6,507 | ||||||||||||
|
| |||||||||||
TOTAL SHORT-TERM INVESTMENTS |
| |||||||||||
(Cost: $6,507) |
| 6,507 | ||||||||||
|
| |||||||||||
| Value | ||||||||
TOTAL INVESTMENTS | ||||||||
(Cost: $45,232,104) | $ | 48,260,815 | ||||||
Other Assets, Less Liabilities — 5.66% | 2,892,190 | |||||||
|
| |||||||
NET ASSETS — 100.00% | $ | 51,153,005 | ||||||
|
| |||||||
CAD — Canadian Dollar
EUR — Euro
GBP — British Pound
| a | Variable rate security. Rate shown is as of report date. |
| b | This security may be resold to qualified foreign investors and foreign institutional buyers under Regulation S of the Securities Act of 1933. |
| c | This security may be resold to qualified institutional buyers under Rule 144A of the Securities Act of 1933. |
| d | Step coupon security. Coupon rate will either increase (step-up bond) or decrease (step-down bond) at regular intervals until maturity. Interest rate shown reflects the rate currently in effect. |
| e | Security valued using Level 3 inputs in accordance with management’s fair valuation policy. See Note 1. |
| f | Affiliated issuer. See Note 2. |
| g | The rate quoted is the annualized seven-day yield of the fund at period end. |
See notes to financial statements.
| 38 | 2013 iSHARES ANNUAL REPORTTO SHAREHOLDERS |
Table of Contents
Schedule of Investments
iSHARES® GLOBAL HIGH YIELD CORPORATE BOND ETF
October 31, 2013
| Security | Principal (000s) | Value | ||||||||||
CORPORATE BONDS & NOTES — 97.09% |
| |||||||||||
AUSTRALIA — 0.77% |
| |||||||||||
FMG Resources (August 2006) Pty Ltd. | ||||||||||||
6.38%, 02/01/16 (Call 12/02/13)a,b | USD | 100 | $ | 103,903 | ||||||||
6.88%, 02/01/18 (Call 02/01/14)a,b | USD | 250 | 264,375 | |||||||||
6.88%, 04/01/22 (Call 04/01/17)a,b | USD | 100 | 106,393 | |||||||||
7.00%, 11/01/15 (Call 12/02/13)a | USD | 100 | 103,625 | |||||||||
|
| |||||||||||
| 578,296 | ||||||||||||
AUSTRIA — 0.19% |
| |||||||||||
Telekom Austria AG | ||||||||||||
5.63%, 12/31/49 (Call 02/01/18)c,d | EUR | 100 | 140,030 | |||||||||
|
| |||||||||||
| 140,030 | ||||||||||||
CANADA — 2.95% |
| |||||||||||
Armtec Holdings Ltd. | ||||||||||||
8.88%, 09/22/17 (Call 12/02/13) | CAD | 6 | 4,720 | |||||||||
Athabasca Oil Corp. | ||||||||||||
7.50%, 11/19/17 (Call 11/19/14)d | CAD | 100 | 90,138 | |||||||||
Baytex Energy Corp. | ||||||||||||
6.63%, 07/19/22 (Call 07/19/17) | CAD | 50 | 49,624 | |||||||||
Bombardier Inc. | ||||||||||||
6.13%, 05/15/21d | EUR | 100 | 149,248 | |||||||||
6.13%, 01/15/23a | USD | 100 | 101,375 | |||||||||
7.75%, 03/15/20a | USD | 150 | 169,875 | |||||||||
Brookfield Residential Properties Inc. | ||||||||||||
6.13%, 07/01/22 (Call 07/01/17)a | USD | 25 | 24,875 | |||||||||
Cara Operations Ltd. | ||||||||||||
9.13%, 12/01/15 (Call 12/02/13) | CAD | 15 | 14,743 | |||||||||
Centric Health Corp. | ||||||||||||
8.63%, 04/18/18 (Call 04/18/16) | CAD | 20 | 17,500 | |||||||||
| Security | Principal (000s) | Value | ||||||||||
Corus Entertainment Inc. | ||||||||||||
4.25%, 02/11/20d | CAD | 50 | $ | 45,548 | ||||||||
Great Canadian Gaming Corp. | ||||||||||||
6.63%, 07/25/22 (Call 07/25/17)a | CAD | 50 | 49,504 | |||||||||
Inmet Mining Corp. | ||||||||||||
7.50%, 06/01/21 (Call 12/01/16)a | USD | 50 | 52,750 | |||||||||
8.75%, 06/01/20 (Call 06/01/16)a | USD | 100 | 110,250 | |||||||||
Kodiak Oil & Gas Corp. | ||||||||||||
8.13%, 12/01/19 (Call 12/01/15) | USD | 50 | 55,741 | |||||||||
Mattamy Group Corp. | ||||||||||||
6.88%, 11/15/20 (Call 11/15/15)a | CAD | 50 | 47,166 | |||||||||
MEG Energy Corp. | ||||||||||||
6.38%, 01/30/23 (Call 07/30/17)a | USD | 100 | 100,503 | |||||||||
Newalta Corp. | ||||||||||||
7.75%, 11/14/19 (Call 11/14/15) | CAD | 22 | 22,575 | |||||||||
Novelis Inc. | ||||||||||||
8.75%, 12/15/20 (Call 12/15/15)b | USD | 150 | 166,652 | |||||||||
Paramount Resources Ltd. | ||||||||||||
8.25%, 12/13/17 (Call 12/13/13) | CAD | 50 | 49,255 | |||||||||
Precision Drilling Corp. | ||||||||||||
6.63%, 11/15/20 (Call 11/15/15) | USD | 100 | 106,314 | |||||||||
Quebecor Media Inc. | ||||||||||||
6.63%, 01/15/23a | CAD | 50 | 48,005 | |||||||||
7.38%, 01/15/21 (Call 01/15/16) | CAD | 100 | 103,083 | |||||||||
Russel Metals Inc. | ||||||||||||
6.00%, 04/19/22 (Call 04/19/17)a | CAD | 50 | 47,946 | |||||||||
Telesat Canada/Telesat LLC | ||||||||||||
6.00%, 05/15/17 (Call 05/15/14)a | USD | 50 | 52,188 | |||||||||
SCHEDULESOF INVESTMENTS | 39 |
Table of Contents
Schedule of Investments (Continued)
iSHARES® GLOBAL HIGH YIELD CORPORATE BOND ETF
October 31, 2013
| Security | Principal (000s) | Value | ||||||||||
Tervita Corp. | ||||||||||||
8.00%, 11/15/18 (Call 11/15/15)a | USD | 100 | $ | 103,250 | ||||||||
9.00%, 11/15/18 (Call 11/15/15)a | CAD | 25 | 24,662 | |||||||||
Trident Exploration Corp. | ||||||||||||
8.25%, 04/13/18 (Call 04/13/15) | CAD | 25 | 20,856 | |||||||||
Videotron Ltee | ||||||||||||
5.00%, 07/15/22 | USD | 100 | 98,000 | |||||||||
5.63%, 06/15/25 (Call 03/15/25) | CAD | 25 | 23,030 | |||||||||
VPII Escrow Corp./Valeant Pharmaceuticals International Inc. | ||||||||||||
6.75%, 08/15/18 (Call 08/15/15)a,b | USD | 150 | 163,500 | |||||||||
7.50%, 07/15/21 (Call 07/15/16)a | USD | 50 | 55,312 | |||||||||
YPG Financing Inc. | ||||||||||||
9.25%, 11/30/18 (Call 12/02/13)a | CAD | 37 | 37,185 | |||||||||
|
| |||||||||||
| 2,205,373 | ||||||||||||
FINLAND — 0.51% |
| |||||||||||
Nokia OYJ | ||||||||||||
6.75%, 02/04/19d | EUR | 100 | 153,284 | |||||||||
Stora Enso OYJ | ||||||||||||
5.00%, 03/19/18d | EUR | 100 | 144,107 | |||||||||
UPM-Kymmene OYJ | ||||||||||||
6.63%, 01/23/17 | GBP | 50 | 87,307 | |||||||||
|
| |||||||||||
| 384,698 | ||||||||||||
FRANCE — 4.49% |
| |||||||||||
Alcatel-Lucent | ||||||||||||
8.50%, 01/15/16d | EUR | 50 | 76,191 | |||||||||
Banque PSA Finance SA | ||||||||||||
4.00%, 06/24/15d | EUR | 100 | 139,753 | |||||||||
BPCE SA | ||||||||||||
12.50%, 12/31/49 (Call 09/30/19)a,c | USD | 100 | 127,000 | |||||||||
Credit Agricole SA | ||||||||||||
6.64%, 12/31/49 (Call 05/31/17)a,c | USD | 100 | 97,500 | |||||||||
| Security | Principal (000s) | Value | ||||||||||
Faurecia SA | ||||||||||||
9.38%, 12/15/16d | EUR | 100 | $ | 161,735 | ||||||||
Financiere Atalian SA | ||||||||||||
7.25%, 01/15/20 (Call 01/15/17)d | EUR | 100 | 140,713 | |||||||||
Groupama SA | ||||||||||||
7.88%, 10/27/39 (Call 10/27/19)c | EUR | 50 | 68,464 | |||||||||
Lafarge SA | ||||||||||||
5.38%, 06/26/17d | EUR | 250 | 372,877 | |||||||||
6.63%, 11/29/18d | EUR | 100 | 154,122 | |||||||||
10.00%, 05/30/17d | GBP | 50 | 96,447 | |||||||||
Medi-Partenaires SAS | ||||||||||||
7.00%, 05/15/20 (Call 05/15/16)d | EUR | 100 | 137,139 | |||||||||
Nexans SA | ||||||||||||
5.75%, 05/02/17 | EUR | 50 | 73,441 | |||||||||
Peugeot SA | ||||||||||||
5.00%, 10/28/16 | EUR | 100 | 142,674 | |||||||||
5.63%, 06/29/15 | EUR | 75 | 107,305 | |||||||||
5.63%, 07/11/17 | EUR | 50 | 72,351 | |||||||||
7.38%, 03/06/18d | EUR | 100 | 149,392 | |||||||||
Renault SA | ||||||||||||
4.63%, 09/18/17d | EUR | 100 | 146,342 | |||||||||
5.63%, 06/30/15 | EUR | 100 | 144,871 | |||||||||
Rexel SA | ||||||||||||
5.13%, 06/15/20 (Call 06/15/16)d | EUR | 100 | 143,654 | |||||||||
6.13%, 12/15/19 (Call 12/15/15)a | USD | 200 | 207,000 | |||||||||
Societe Generale | ||||||||||||
5.92%, 12/31/49 (Call 04/05/17)a,c | USD | 100 | 103,875 | |||||||||
Tereos Finance Group I | ||||||||||||
4.25%, 03/04/20 (Call 03/04/19) | EUR | 100 | 136,970 | |||||||||
Wendel SA | ||||||||||||
4.38%, 08/09/17 | EUR | 150 | 216,932 | |||||||||
4.88%, 05/26/16 | EUR | 100 | 145,410 | |||||||||
|
| |||||||||||
| 3,362,158 | ||||||||||||
| 40 | 2013 iSHARES ANNUAL REPORTTO SHAREHOLDERS |
Table of Contents
Schedule of Investments (Continued)
iSHARES® GLOBAL HIGH YIELD CORPORATE BOND ETF
October 31, 2013
| Security | Principal (000s) | Value | ||||||||||
GERMANY — 4.24% |
| |||||||||||
Beverage Packaging Holdings (Luxembourg) II SA | ||||||||||||
9.50%, 06/15/17 (Call 12/02/13)d | EUR | 100 | $ | 140,460 | ||||||||
Commerzbank AG | ||||||||||||
7.75%, 03/16/21 | EUR | 200 | 300,377 | |||||||||
Franz Haniel & Cie GmbH | ||||||||||||
7.13%, 02/01/17 | EUR | 100 | 153,705 | |||||||||
Hapag-Lloyd AG | ||||||||||||
9.00%, 10/15/15 (Call 12/12/13)d | EUR | 90 | 127,403 | |||||||||
Heidelberger Druckmaschinen AG | ||||||||||||
9.25%, 04/15/18 (Call 04/15/14)d | EUR | 50 | 69,929 | |||||||||
Hornbach Baumarkt AG | ||||||||||||
3.88%, 02/15/20d | EUR | 50 | 69,749 | |||||||||
Kabel Deutschland Vertrieb und Service GmbH | ||||||||||||
6.50%, 06/29/18 (Call 06/30/14)d | EUR | 100 | 144,705 | |||||||||
Norddeutsche Landesbank Girozentrale | ||||||||||||
6.00%, 06/29/20 | EUR | 50 | 75,744 | |||||||||
Orion Engineered Carbons Bondco GmbH | ||||||||||||
10.00%, 06/15/18 (Call 06/15/14)d | EUR | 90 | 136,196 | |||||||||
Styrolution Group GmbH | ||||||||||||
7.63%, 05/15/16 (Call 12/02/13)d | EUR | 100 | 142,894 | |||||||||
Techem Energy Metering Service GmbH & Co. KG | ||||||||||||
6.13%, 10/01/19 (Call 10/01/15)d | EUR | 100 | 146,826 | |||||||||
ThyssenKrupp AG | ||||||||||||
4.00%, 08/27/18 | EUR | 75 | 106,340 | |||||||||
4.38%, 02/28/17 | EUR | 100 | 143,554 | |||||||||
ThyssenKrupp Finance Nederland BV | ||||||||||||
8.50%, 02/25/16 | EUR | 150 | 230,804 | |||||||||
| Security | Principal (000s) | Value | ||||||||||
Trionista TopCo GmbH | ||||||||||||
6.88%, 04/30/21 (Call 04/30/16)d | EUR | 100 | $ | 142,408 | ||||||||
Unitymedia Hessen GmbH & Co. KG/Unitymedia NRW GmbH | ||||||||||||
5.50%, 09/15/22 (Call 09/15/17)d | EUR | 100 | 137,654 | |||||||||
5.75%, 01/15/23 (Call 01/15/18)d | EUR | 100 | 139,773 | |||||||||
7.50%, 03/15/19 (Call 03/15/15)d | EUR | 100 | 147,510 | |||||||||
UPCB Finance II Ltd. | ||||||||||||
6.38%, 07/01/20 (Call 07/01/15)d | EUR | 100 | 144,617 | |||||||||
UPCB Finance III Ltd. | ||||||||||||
6.63%, 07/01/20 (Call 07/01/15)a | USD | 150 | 160,125 | |||||||||
UPCB Finance Ltd. | ||||||||||||
7.63%, 01/15/20 (Call 01/15/15)d | EUR | 100 | 147,038 | |||||||||
UPCB Finance V Ltd. | ||||||||||||
7.25%, 11/15/21 (Call 11/15/16)a | USD | 150 | 164,625 | |||||||||
|
| |||||||||||
| 3,172,436 | ||||||||||||
GREECE — 0.28% |
| |||||||||||
OTE PLC | , | |||||||||||
4.63%, 05/20/16 | EUR | 50 | 68,825 | |||||||||
7.25%, 02/12/15d,e | EUR | 100 | 142,407 | |||||||||
|
| |||||||||||
| 211,232 | ||||||||||||
IRELAND — 1.61% |
| |||||||||||
Ardagh Glass Finance PLC | ||||||||||||
7.13%, 06/15/17 (Call 06/15/14)d | EUR | 50 | 69,620 | |||||||||
Ardagh Packaging Finance PLC | ||||||||||||
7.38%, 10/15/17 (Call 10/15/14)d | EUR | 150 | 217,520 | |||||||||
9.13%, 10/15/20 (Call 10/15/15)a | USD | 200 | 215,000 | |||||||||
Governor & Co. of the Bank of Ireland (The) | ||||||||||||
2.75%, 06/05/16 | EUR | 100 | 136,275 | |||||||||
SCHEDULESOF INVESTMENTS | 41 |
Table of Contents
Schedule of Investments (Continued)
iSHARES® GLOBAL HIGH YIELD CORPORATE BOND ETF
October 31, 2013
| Security | Principal (000s) | Value | ||||||||||
Nara Cable Funding Ltd. | ||||||||||||
8.88%, 12/01/18 (Call 12/02/13)a | USD | 200 | $ | 213,500 | ||||||||
Rottapharm Ltd. | ||||||||||||
6.13%, 11/15/19 (Call 11/15/15)d | EUR | 100 | 140,142 | |||||||||
Smurfit Kappa Acquisitions | ||||||||||||
4.13%, 01/30/20d | EUR | 100 | 138,159 | |||||||||
7.75%, 11/15/19 (Call 11/15/14)d | EUR | 50 | 73,974 | |||||||||
|
| |||||||||||
| 1,204,190 | ||||||||||||
ITALY — 2.35% |
| |||||||||||
Banca Monte dei Paschi di Siena SpA | ||||||||||||
5.00%, 04/21/20d | EUR | 100 | 121,562 | |||||||||
Banca Popolare di Milano Scarl | ||||||||||||
7.13%, 03/01/21d | EUR | 100 | 140,708 | |||||||||
Banca Popolare di Vicenza | ||||||||||||
6.75%, 02/27/15d | EUR | 100 | 141,218 | |||||||||
Banco Popolare | ||||||||||||
5.47%, 11/12/16d | EUR | 50 | 69,923 | |||||||||
6.00%, 11/05/20d | EUR | 50 | 68,679 | |||||||||
Buzzi Unicem SpA | ||||||||||||
5.13%, 12/09/16d | EUR | 50 | 72,597 | |||||||||
Enel SPA | ||||||||||||
6.50%, 01/10/74 (Call 01/10/19)c,d | EUR | 100 | 142,747 | |||||||||
Fiat Finance North America Inc. | ||||||||||||
5.63%, 06/12/17 | EUR | 100 | 142,226 | |||||||||
Gruppo Editoriale L’Espresso SpA | ||||||||||||
5.13%, 10/27/14 | EUR | 50 | 69,352 | |||||||||
GTECH SpA | ||||||||||||
8.25%, 03/31/66 (Call 03/31/16)c,d | EUR | 50 | 73,794 | |||||||||
Intesa Sanpaolo SpA | ||||||||||||
6.63%, 09/13/23d | EUR | 108 | 157,359 | |||||||||
Italcementi Finance SA | ||||||||||||
6.63%, 03/19/20d,e | EUR | 50 | 73,362 | |||||||||
Manutencoop Facility Management SpA | ||||||||||||
8.50%, 08/01/20 (Call 08/01/16)d | EUR | 100 | 138,442 | |||||||||
| Security | Principal (000s) | Value | ||||||||||
UniCredit SpA | ||||||||||||
3.95%, 02/01/16 | EUR | 50 | $ | 68,711 | ||||||||
6.70%, 06/05/18 | EUR | 50 | 73,640 | |||||||||
Unipol Gruppo Finanziario SpA | ||||||||||||
5.00%, 01/11/17d | EUR | 50 | 71,243 | |||||||||
Veneto Banca SCPA | ||||||||||||
4.00%, 07/31/15d | EUR | 100 | 136,735 | |||||||||
|
| |||||||||||
| 1,762,298 | ||||||||||||
LUXEMBOURG — 6.85% |
| |||||||||||
ArcelorMittal SA | ||||||||||||
4.25%, 08/05/15b | USD | 150 | 154,543 | |||||||||
5.88%, 11/17/17d | EUR | 200 | 300,540 | |||||||||
6.00%, 03/01/21b | USD | 100 | 105,000 | |||||||||
6.13%, 06/01/18 | USD | 300 | 325,986 | |||||||||
10.35%, 06/01/19 | USD | 150 | 189,553 | |||||||||
CHC Helicopter SA | ||||||||||||
9.25%, 10/15/20 (Call 10/15/15) | USD | 100 | 107,600 | |||||||||
CNH Industrial Finance Europe SA | ||||||||||||
5.25%, 03/11/15d | EUR | 100 | 142,747 | |||||||||
6.25%, 03/09/18d | EUR | 100 | 154,983 | |||||||||
ConvaTec Healthcare E SA | ||||||||||||
7.38%, 12/15/17 (Call 12/15/13)d | EUR | 100 | 143,994 | |||||||||
Fiat Finance & Trade SA | ||||||||||||
6.38%, 04/01/16d | EUR | 250 | 362,205 | |||||||||
6.75%, 10/14/19d | EUR | 100 | 143,590 | |||||||||
7.63%, 09/15/14 | EUR | 100 | 142,234 | |||||||||
7.75%, 10/17/16d | EUR | 100 | 150,068 | |||||||||
FMC Finance VIII SA | ||||||||||||
5.25%, 07/31/19d | EUR | 50 | 75,100 | |||||||||
HeidelbergCement Finance Luxembourg SA | ||||||||||||
8.50%, 10/31/19d | EUR | 100 | 172,996 | |||||||||
Ineos Group Holdings SA | ||||||||||||
6.50%, 08/15/18 (Call 05/15/15)d | EUR | 100 | 136,120 | |||||||||
7.88%, 02/15/16 (Call 12/02/13)d | EUR | 34 | 46,383 | |||||||||
Intelsat (Luxembourg) SA | ||||||||||||
7.75%, 06/01/21 (Call 06/01/17)a | USD | 100 | 105,500 | |||||||||
| 42 | 2013 iSHARES ANNUAL REPORTTO SHAREHOLDERS |
Table of Contents
Schedule of Investments (Continued)
iSHARES® GLOBAL HIGH YIELD CORPORATE BOND ETF
October 31, 2013
| Security | Principal (000s) | Value | ||||||||||
8.13%, 06/01/23 (Call 06/01/18)a | USD | 100 | $ | 105,000 | ||||||||
Intelsat Jackson Holdings SA | ||||||||||||
5.50%, 08/01/23 (Call 08/01/18)a | USD | 70 | 67,725 | |||||||||
6.63%, 12/15/22 (Call 12/15/17) | USD | 100 | 101,500 | |||||||||
6.63%, 12/15/22 (Call 12/15/17)a | USD | 150 | 152,250 | |||||||||
7.25%, 04/01/19 (Call 04/01/15) | USD | 200 | 215,250 | |||||||||
7.25%, 10/15/20 (Call 10/15/15) | USD | 100 | 108,500 | |||||||||
KION Finance SA | ||||||||||||
6.75%, 02/15/20 (Call 02/15/16)d | EUR | 100 | 149,035 | |||||||||
NII International Telecom SCA | ||||||||||||
7.88%, 08/15/19 (Call 02/15/17)a | USD | 50 | 43,000 | |||||||||
11.38%, 08/15/19 (Call 02/15/17)a | USD | 50 | 47,250 | |||||||||
Ontex IV SA | ||||||||||||
7.50%, 04/15/18 (Call 04/15/14)d | EUR | 100 | 143,810 | |||||||||
Pacific Drilling SA | ||||||||||||
5.38%, 06/01/20 (Call 06/01/16)a | USD | 100 | 99,871 | |||||||||
Spie BondCo 3 SCA | ||||||||||||
11.00%, 08/15/19 (Call 08/15/15)d | EUR | 100 | 154,391 | |||||||||
Telenet Finance V Luxembourg SCA | ||||||||||||
6.25%, 08/15/22 (Call 08/15/17)d | EUR | 100 | 141,395 | |||||||||
Trinseo Materials Operating SCA/Trinseo Materials Finance Inc. | ||||||||||||
8.75%, 02/01/19 (Call 08/01/15)a | USD | 75 | 75,281 | |||||||||
Wind Acquisition Finance SA | ||||||||||||
7.25%, 02/15/18 (Call 12/02/13)a | USD | 200 | 210,145 | |||||||||
7.38%, 02/15/18 (Call 12/02/13)d | EUR | 100 | 142,691 | |||||||||
| Security | Principal (000s) | Value | ||||||||||
11.75%, 07/15/17 (Call 12/02/13)d | EUR | 150 | $ | 217,180 | ||||||||
|
| |||||||||||
| 5,133,416 | ||||||||||||
MEXICO — 0.16% |
| |||||||||||
NII Capital Corp. | ||||||||||||
7.63%, 04/01/21 (Call 04/01/16)b | USD | 100 | 58,500 | |||||||||
8.88%, 12/15/19 (Call 12/15/14)b | USD | 50 | 30,500 | |||||||||
10.00%, 08/15/16 (Call 12/02/13)b | USD | 40 | 31,100 | |||||||||
|
| |||||||||||
| 120,100 | ||||||||||||
NETHERLANDS — 3.85% |
| |||||||||||
EDP Finance BV | ||||||||||||
3.75%, 06/22/15 | EUR | 100 | 139,104 | |||||||||
4.75%, 09/26/16d | EUR | 100 | 143,431 | |||||||||
4.90%, 10/01/19a | USD | 150 | 150,315 | |||||||||
5.75%, 09/21/17d | EUR | 150 | 221,666 | |||||||||
Fresenius Finance BV | ||||||||||||
4.25%, 04/15/19d | EUR | 100 | 144,991 | |||||||||
GMAC International Finance BV | ||||||||||||
7.50%, 04/21/15d | EUR | 50 | 72,814 | |||||||||
HeidelbergCement Finance BV | ||||||||||||
8.00%, 01/31/17d | EUR | 200 | 319,883 | |||||||||
Nokia Siemens Networks Finance BV | ||||||||||||
6.75%, 04/15/18 (Call 04/15/15)d | EUR | 100 | 147,846 | |||||||||
NXP BV/NXP Funding LLC | ||||||||||||
3.75%, 06/01/18a | USD | 200 | 200,585 | |||||||||
OI European Group BV | ||||||||||||
6.75%, 09/15/20d | EUR | 100 | 157,645 | |||||||||
Phoenix PIB Dutch Finance BV | ||||||||||||
3.13%, 05/27/20d | EUR | 100 | 129,893 | |||||||||
Portugal Telecom International Finance BV | ||||||||||||
4.38%, 03/24/17 | EUR | 50 | 70,589 | |||||||||
4.63%, 05/08/20d | EUR | 100 | 136,742 | |||||||||
5.00%, 11/04/19d | EUR | 100 | 139,472 | |||||||||
Schaeffler Finance BV | ||||||||||||
4.75%, 05/15/21 (Call 05/15/16)a | USD | 200 | 199,000 | |||||||||
7.75%, 02/15/17d | EUR | 100 | 155,166 | |||||||||
SCHEDULESOF INVESTMENTS | 43 |
Table of Contents
Schedule of Investments (Continued)
iSHARES® GLOBAL HIGH YIELD CORPORATE BOND ETF
October 31, 2013
| Security | Principal (000s) | Value | ||||||||||
Sensata Technologies BV | ||||||||||||
4.88%, 10/15/23a | USD | 25 | $ | 23,818 | ||||||||
6.50%, 05/15/19 (Call 05/15/15)a | USD | 100 | 107,496 | |||||||||
UPC Holding BV | ||||||||||||
8.38%, 08/15/20 (Call 08/15/15)d | EUR | 50 | 74,562 | |||||||||
Ziggo Bond Co. BV | ||||||||||||
8.00%, 05/15/18 (Call 05/15/14)d | EUR | 100 | 144,957 | |||||||||
|
| |||||||||||
| 2,879,975 | ||||||||||||
NORWAY — 0.05% |
| |||||||||||
Norske Skogindustrier ASA | ||||||||||||
7.00%, 06/26/17d | EUR | 50 | 37,301 | |||||||||
|
| |||||||||||
| 37,301 | ||||||||||||
PORTUGAL — 0.37% |
| |||||||||||
Banco Espirito Santo SA | ||||||||||||
3.88%, 01/21/15 | EUR | 50 | 68,461 | |||||||||
5.88%, 11/09/15d | EUR | 100 | 140,463 | |||||||||
Brisa Concessao Rodoviaria SA | ||||||||||||
4.50%, 12/05/16 | EUR | 50 | 70,108 | |||||||||
|
| |||||||||||
| 279,032 | ||||||||||||
SINGAPORE — 0.27% |
| |||||||||||
Flextronics International Ltd. | ||||||||||||
4.63%, 02/15/20 | USD | 200 | 200,564 | |||||||||
|
| |||||||||||
| 200,564 | ||||||||||||
SPAIN — 1.59% |
| |||||||||||
Abengoa SA | ||||||||||||
8.50%, 03/31/16 | EUR | 50 | 73,413 | |||||||||
9.63%, 02/25/15d | EUR | 50 | 72,648 | |||||||||
Bankia SA | ||||||||||||
4.38%, 02/14/17 | EUR | 100 | 137,310 | |||||||||
BBVA International Preferred SAU | ||||||||||||
5.92%, 04/29/49 (Call 04/18/17)c | USD | 50 | 46,940 | |||||||||
BPE Financiaciones SA | ||||||||||||
4.00%, 07/17/15d | EUR | 100 | 138,690 | |||||||||
Campofrio Food Group SA | ||||||||||||
8.25%, 10/31/16 (Call 12/12/13)d | EUR | 100 | 142,252 | |||||||||
| Security | Principal (000s) | Value | ||||||||||
Cirsa Funding Luxembourg SA | ||||||||||||
8.75%, 05/15/18 (Call 05/15/14)d | EUR | 50 | $ | 71,546 | ||||||||
Inaer Aviation Finance Ltd. | ||||||||||||
9.50%, 08/01/17 (Call 08/01/14)d | EUR | 50 | 71,076 | |||||||||
Mapfre SA | ||||||||||||
5.13%, 11/16/15 | EUR | 100 | 144,569 | |||||||||
Nara Cable Funding Ltd. | ||||||||||||
8.88%, 12/01/18 (Call 12/02/13)d | EUR | 100 | 146,571 | |||||||||
Obrascon Huarte Lain SA | ||||||||||||
7.38%, 04/28/15 | EUR | 100 | 145,750 | |||||||||
|
| |||||||||||
| 1,190,765 | ||||||||||||
SWEDEN — 0.20% |
| |||||||||||
Verisure Holding AB | ||||||||||||
8.75%, 09/01/18 (Call 09/01/14)d | EUR | 100 | 148,530 | |||||||||
|
| |||||||||||
| 148,530 | ||||||||||||
SWITZERLAND — 0.20% |
| |||||||||||
Sunrise Communications Holdings SA | ||||||||||||
8.50%, 12/31/18 (Call 12/31/14)d | EUR | 100 | 147,421 | |||||||||
|
| |||||||||||
| 147,421 | ||||||||||||
UNITED KINGDOM — 4.56% |
| |||||||||||
Algeco Scotsman Global Finance PLC | ||||||||||||
8.50%, 10/15/18 (Call 10/15/15)a,b | USD | 200 | 213,500 | |||||||||
9.00%, 10/15/18 (Call 10/15/15)d | EUR | 100 | 146,235 | |||||||||
Arqiva Broadcast Finance PLC | ||||||||||||
9.50%, 03/31/20 (Call 03/31/16)d | GBP | 100 | 175,521 | |||||||||
Boparan Finance PLC | ||||||||||||
9.75%, 04/30/18 (Call 04/30/14)d | EUR | 100 | 149,460 | |||||||||
British Airways PLC | ||||||||||||
8.75%, 08/23/16 | GBP | 50 | 90,513 | |||||||||
CEVA Group PLC | ||||||||||||
8.38%, 12/01/17 (Call 12/02/13)a | USD | 75 | 77,625 | |||||||||
| 44 | 2013 iSHARES ANNUAL REPORTTO SHAREHOLDERS |
Table of Contents
Schedule of Investments (Continued)
iSHARES® GLOBAL HIGH YIELD CORPORATE BOND ETF
October 31, 2013
| Security | Principal (000s) | Value | ||||||||||
Co-Operative Group Ltd. | ||||||||||||
6.88%, 07/08/20d,e | GBP | 100 | $ | 163,878 | ||||||||
EC Finance PLC | ||||||||||||
9.75%, 08/01/17 (Call 08/01/14)d | EUR | 100 | 149,148 | |||||||||
Eco-Bat Finance PLC | ||||||||||||
7.75%, 02/15/17 (Call 02/15/14)d | EUR | 100 | 141,739 | |||||||||
HBOS PLC | ||||||||||||
6.75%, 05/21/18a | USD | 100 | 112,466 | |||||||||
Ineos Finance PLC | ||||||||||||
7.50%, 05/01/20 (Call 05/01/15)a | USD | 100 | 109,500 | |||||||||
Infinis PLC | ||||||||||||
7.00%, 02/15/19 (Call 02/15/16)a | GBP | 100 | 171,103 | |||||||||
Jaguar Land Rover Automotive PLC | ||||||||||||
8.13%, 05/15/21 (Call 05/15/16)a | USD | 150 | 170,541 | |||||||||
8.25%, 03/15/20 (Call 03/15/16)d | GBP | 100 | 180,743 | |||||||||
Kerling PLC | ||||||||||||
10.63%, 02/01/17 (Call 02/01/14)d | EUR | 50 | 72,204 | |||||||||
Phones4u Finance PLC | ||||||||||||
9.50%, 04/01/18 (Call 04/01/14)a | GBP | 100 | 169,898 | |||||||||
Priory Group No. 3 PLC | ||||||||||||
7.00%, 02/15/18 (Call 02/15/14)a | GBP | 100 | 167,087 | |||||||||
Rexam PLC | ||||||||||||
6.75%, 06/29/67 (Call 06/29/17)c,d | EUR | 50 | 71,770 | |||||||||
Royal Bank of Scotland Group PLC | ||||||||||||
4.63%, 09/22/21 (Call 09/22/16)c | EUR | 100 | 133,358 | |||||||||
5.05%, 01/08/15 | USD | 100 | 103,294 | |||||||||
6.10%, 06/10/23 | USD | 75 | 76,997 | |||||||||
6.13%, 12/15/22 | USD | 150 | 155,139 | |||||||||
Thomas Cook Finance PLC | ||||||||||||
7.75%, 06/15/20 (Call 06/15/16)d | EUR | 100 | 144,362 | |||||||||
| Security | Principal (000s) | Value | ||||||||||
Virgin Media Finance PLC | ||||||||||||
8.38%, 10/15/19 (Call 10/15/14) | USD | 100 | $ | 109,159 | ||||||||
Virgin Media Secured Finance PLC | ||||||||||||
5.50%, 01/15/21 | GBP | 100 | 162,668 | |||||||||
|
| |||||||||||
| 3,417,908 | ||||||||||||
UNITED STATES — 61.60% |
| |||||||||||
Access Midstream Partners LP/ACMP Finance Corp. | ||||||||||||
4.88%, 05/15/23 (Call 12/15/17) | USD | 100 | 99,303 | |||||||||
6.13%, 07/15/22 (Call 01/15/17) | USD | 50 | 53,462 | |||||||||
Activision Blizzard Inc. | ||||||||||||
5.63%, 09/15/21 (Call 09/15/16)a | USD | 125 | 129,170 | |||||||||
ADT Corp. (The) | ||||||||||||
6.25%, 10/15/21a | USD | 50 | 52,987 | |||||||||
Advanced Micro Devices Inc. | ||||||||||||
7.50%, 08/15/22b | USD | 50 | 48,324 | |||||||||
8.13%, 12/15/17 (Call 12/15/13)b | USD | 100 | 104,362 | |||||||||
AES Corp. (The) | ||||||||||||
7.38%, 07/01/21 (Call 06/01/21) | USD | 100 | 113,129 | |||||||||
8.00%, 10/15/17b | USD | 250 | 292,046 | |||||||||
Affinion Group Inc. | ||||||||||||
7.88%, 12/15/18 (Call 12/15/14)b | USD | 50 | 41,000 | |||||||||
Aircastle Ltd. | ||||||||||||
6.25%, 12/01/19b | USD | 50 | 53,125 | |||||||||
6.75%, 04/15/17b | USD | 100 | 109,549 | |||||||||
AK Steel Corp. | ||||||||||||
7.63%, 05/15/20 (Call 05/15/15)b | USD | 40 | 36,050 | |||||||||
Alere Inc. | ||||||||||||
7.25%, 07/01/18 (Call 12/15/15) | USD | 50 | 54,625 | |||||||||
8.63%, 10/01/18 (Call 10/01/14) | USD | 50 | 54,313 | |||||||||
Aleris International Inc. | ||||||||||||
7.88%, 11/01/20 (Call 11/01/15) | USD | 50 | 52,875 | |||||||||
SCHEDULESOF INVESTMENTS | 45 |
Table of Contents
Schedule of Investments (Continued)
iSHARES® GLOBAL HIGH YIELD CORPORATE BOND ETF
October 31, 2013
| Security | Principal (000s) | Value | ||||||||||
Ally Financial Inc. | ||||||||||||
3.13%, 01/15/16b | USD | 100 | $ | 102,044 | ||||||||
3.50%, 07/18/16b | USD | 150 | 153,750 | |||||||||
4.63%, 06/26/15 | USD | 100 | 104,347 | |||||||||
5.50%, 02/15/17 | USD | 100 | 108,371 | |||||||||
6.25%, 12/01/17b | USD | 100 | 110,758 | |||||||||
6.75%, 12/01/14b | USD | 100 | 105,375 | |||||||||
8.00%, 03/15/20 | USD | 250 | 298,125 | |||||||||
8.30%, 02/12/15b | USD | 100 | 108,558 | |||||||||
Alpha Natural Resources Inc. | ||||||||||||
6.00%, 06/01/19 (Call 06/01/14) | USD | 100 | 86,250 | |||||||||
9.75%, 04/15/18b | USD | 50 | 51,625 | |||||||||
AMC Entertainment Inc. | ||||||||||||
9.75%, 12/01/20 (Call 12/01/15)b | USD | 100 | 114,299 | |||||||||
AMC Networks Inc. | ||||||||||||
4.75%, 12/15/22 (Call 12/15/17)b | USD | 100 | 96,631 | |||||||||
American Axle & Manufacturing Inc. | ||||||||||||
6.25%, 03/15/21 (Call 03/15/16) | USD | 50 | 52,500 | |||||||||
AmeriGas Finance LLC/AmeriGas Finance Corp. | ||||||||||||
6.75%, 05/20/20 (Call 05/20/16)b | USD | 100 | 108,759 | |||||||||
7.00%, 05/20/22 (Call 05/20/17)b | USD | 100 | 107,654 | |||||||||
Amkor Technology Inc. | ||||||||||||
6.63%, 06/01/21 (Call 06/01/15)b | USD | 50 | 50,180 | |||||||||
Antero Resources Finance Corp. | ||||||||||||
6.00%, 12/01/20 (Call 12/01/15) | USD | 50 | 52,625 | |||||||||
7.25%, 08/01/19 (Call 08/01/14) | USD | 50 | 53,407 | |||||||||
APX Group Inc. | ||||||||||||
6.38%, 12/01/19 (Call 12/01/15) | USD | 50 | 50,000 | |||||||||
8.75%, 12/01/20 (Call 12/01/15) | USD | 50 | 51,125 | |||||||||
| Security | Principal (000s) | Value | ||||||||||
ARAMARK Corp. | ||||||||||||
5.75%, 03/15/20 (Call 03/15/15)a | USD | 100 | $ | 104,875 | ||||||||
Arch Coal Inc. | ||||||||||||
7.00%, 06/15/19 (Call 06/15/15)b | USD | 200 | 156,000 | |||||||||
Ashland Inc. | ||||||||||||
3.88%, 04/15/18 (Call 03/15/18) | USD | 100 | 100,541 | |||||||||
4.75%, 08/15/22 (Call 05/15/22) | USD | 50 | 48,005 | |||||||||
Atlas Pipeline Partners LP | ||||||||||||
4.75%, 11/15/21 (Call 05/15/16)a | USD | 50 | 46,388 | |||||||||
Audatex North America Inc. | ||||||||||||
6.00%, 06/15/21 (Call 06/15/17)a | USD | 25 | 25,951 | |||||||||
Avaya Inc. | ||||||||||||
7.00%, 04/01/19 (Call 04/01/15)a | USD | 50 | 47,625 | |||||||||
10.50%, 03/01/21 (Call 03/01/17)a,b | USD | 100 | 86,250 | |||||||||
Aviation Capital Group Corp. | ||||||||||||
3.88%, 09/27/16a | USD | 75 | 76,500 | |||||||||
Avis Budget Car Rental LLC/Avis Budget Finance Inc. | ||||||||||||
8.25%, 01/15/19 (Call 10/15/14) | USD | 100 | 108,958 | |||||||||
Axiall Corp. | ||||||||||||
4.88%, 05/15/23 (Call 05/15/18)a | USD | 50 | 47,992 | |||||||||
B/E Aerospace Inc. | ||||||||||||
5.25%, 04/01/22 (Call 04/01/17)b | USD | 100 | 102,625 | |||||||||
6.88%, 10/01/20 (Call 10/01/15) | USD | 100 | 110,125 | |||||||||
Ball Corp. | ||||||||||||
5.75%, 05/15/21 (Call 11/15/15) | USD | 100 | 105,250 | |||||||||
Berry Plastics Corp. | ||||||||||||
9.50%, 05/15/18 (Call 05/15/14) | USD | 100 | 108,427 | |||||||||
| 46 | 2013 iSHARES ANNUAL REPORTTO SHAREHOLDERS |
Table of Contents
Schedule of Investments (Continued)
iSHARES® GLOBAL HIGH YIELD CORPORATE BOND ETF
October 31, 2013
| Security | Principal (000s) | Value | ||||||||||
Biomet Inc. | ||||||||||||
6.50%, 08/01/20 (Call 08/01/15) | USD | 125 | $ | 132,656 | ||||||||
6.50%, 10/01/20 (Call 10/01/15) | USD | 50 | 51,875 | |||||||||
BMC Software Inc. | ||||||||||||
8.13%, 07/15/21 (Call 07/15/16)a | USD | 100 | 105,645 | |||||||||
Boyd Gaming Corp. | ||||||||||||
9.13%, 12/01/18 (Call 12/01/14) | USD | 25 | 27,263 | |||||||||
Building Materials Corp. of America | ||||||||||||
6.75%, 05/01/21 (Call 05/01/16)a | USD | 100 | 108,000 | |||||||||
Cablevision Systems Corp. | ||||||||||||
7.75%, 04/15/18b | USD | 150 | 169,125 | |||||||||
8.00%, 04/15/20 | USD | 75 | 84,937 | |||||||||
Caesars Entertainment Operating Co. Inc. | ||||||||||||
9.00%, 02/15/20 (Call 02/15/16) | 300 | 282,000 | ||||||||||
10.00%, 12/15/18 (Call 12/15/13) | USD | 300 | 150,375 | |||||||||
10.75%, 02/01/16 (Call 12/02/13) | USD | 25 | 20,938 | |||||||||
11.25%, 06/01/17 (Call 12/02/13) | USD | 150 | 149,812 | |||||||||
12.75%, 04/15/18 (Call 04/15/14) | USD | 50 | 29,500 | |||||||||
Calpine Corp. | ||||||||||||
5.88%, 01/15/24 (Call 11/01/18)a | USD | 25 | 25,063 | |||||||||
6.00%, 01/15/22 (Call 11/01/16)a | USD | 25 | 25,875 | |||||||||
7.50%, 02/15/21 (Call 11/01/15)a | USD | 315 | 341,775 | |||||||||
Case New Holland Inc. | ||||||||||||
7.88%, 12/01/17b | USD | 100 | 118,375 | |||||||||
CBRE Services Inc. | ||||||||||||
5.00%, 03/15/23 (Call 03/15/18) | USD | 50 | 48,375 | |||||||||
| Security | Principal (000s) | Value | ||||||||||
CC Holdings GS V LLC/Crown Castle GS III Corp. | ||||||||||||
3.85%, 04/15/23 | USD | 100 | $ | 94,935 | ||||||||
CCO Holdings LLC/CCO Holdings Capital Corp. | ||||||||||||
5.25%, 09/30/22 (Call 09/30/17) | USD | 100 | 93,750 | |||||||||
5.75%, 09/01/23 (Call 03/01/18)a | USD | 75 | 71,250 | |||||||||
5.75%, 01/15/24 (Call 07/15/18) | USD | 50 | 47,250 | |||||||||
6.50%, 04/30/21 (Call 04/30/15) | USD | 150 | 156,000 | |||||||||
6.63%, 01/31/22 (Call 01/31/17)b | USD | 100 | 103,375 | |||||||||
7.00%, 01/15/19 (Call 01/15/14)b | USD | 100 | 106,000 | |||||||||
7.38%, 06/01/20 (Call 12/01/15) | USD | 150 | 163,500 | |||||||||
CDW LLC/CDW Finance Corp. | ||||||||||||
8.50%, 04/01/19 (Call 04/01/15) | USD | 100 | 110,625 | |||||||||
Celanese U.S. Holdings LLC | ||||||||||||
4.63%, 11/15/22 | USD | 100 | 98,617 | |||||||||
6.63%, 10/15/18 (Call 10/15/14)b | USD | 100 | 107,782 | |||||||||
CenturyLink Inc. | ||||||||||||
Series V | ||||||||||||
5.63%, 04/01/20 | USD | 100 | 101,500 | |||||||||
5.80%, 03/15/22 | USD | 100 | 99,000 | |||||||||
6.00%, 04/01/17b | USD | 100 | 109,250 | |||||||||
6.45%, 06/15/21b | USD | 150 | 156,000 | |||||||||
Cequel Communications Holdings I LLC/Cequel Capital Corp. | ||||||||||||
5.13%, 12/15/21 (Call 06/15/16)a | USD | 25 | 24,219 | |||||||||
6.38%, 09/15/20 (Call 09/15/15)a | USD | 100 | 103,625 | |||||||||
Ceridian Corp. | ||||||||||||
11.25%, 11/15/15 (Call 12/02/13) | USD | 100 | 100,863 | |||||||||
Ceridian HCM Holding Inc. | ||||||||||||
11.00%, 03/15/21 (Call 03/15/16)a | USD | 50 | 58,339 | |||||||||
SCHEDULESOF INVESTMENTS | 47 |
Table of Contents
Schedule of Investments (Continued)
iSHARES® GLOBAL HIGH YIELD CORPORATE BOND ETF
October 31, 2013
| Security | Principal (000s) | Value | ||||||||||
Chaparral Energy Inc. | ||||||||||||
7.63%, 11/15/22 (Call 05/15/17)b | USD | 100 | $ | 106,191 | ||||||||
Chesapeake Energy Corp. | ||||||||||||
3.25%, 03/15/16 (Call 03/15/14)b | USD | 50 | 50,640 | |||||||||
5.75%, 03/15/23b | USD | 100 | 106,358 | |||||||||
6.13%, 02/15/21 | USD | 100 | 109,373 | |||||||||
6.25%, 01/15/17 | EUR | 50 | 74,178 | |||||||||
6.63%, 08/15/20b | USD | 200 | 225,320 | |||||||||
Chesapeake Oilfield Operating LLC/Chesapeake Oilfield Finance Inc. | ||||||||||||
6.63%, 11/15/19 (Call 11/15/15) | USD | 50 | 52,386 | |||||||||
Chrysler Group LLC/CG Co-Issuer Inc. | ||||||||||||
8.00%, 06/15/19 (Call 06/15/15)b | USD | 200 | 221,287 | |||||||||
Cincinnati Bell Inc. | ||||||||||||
8.38%, 10/15/20 (Call 10/15/15)b | USD | 81 | 86,062 | |||||||||
Cinemark USA Inc. | ||||||||||||
5.13%, 12/15/22 (Call 12/15/17) | USD | 50 | 48,909 | |||||||||
CIT Group Inc. | ||||||||||||
4.25%, 08/15/17 | USD | 150 | 156,937 | |||||||||
4.75%, 02/15/15a | USD | 100 | 104,187 | |||||||||
5.00%, 05/15/17 | USD | 100 | 107,750 | |||||||||
5.00%, 08/15/22 | USD | 100 | 101,000 | |||||||||
5.25%, 03/15/18 | USD | 150 | 162,193 | |||||||||
5.38%, 05/15/20 | USD | 75 | 80,202 | |||||||||
5.50%, 02/15/19a | USD | 150 | 162,469 | |||||||||
CityCenter Holdings LLC/CityCenter Finance Corp. | ||||||||||||
7.63%, 01/15/16 (Call 01/15/14) | USD | 100 | 105,125 | |||||||||
Claire’s Stores Inc. | ||||||||||||
9.00%, 03/15/19 (Call 03/15/15)a | USD | 100 | 111,750 | |||||||||
Clean Harbors Inc. | ||||||||||||
5.13%, 06/01/21 (Call 12/01/16)b | USD | 100 | 101,625 | |||||||||
| Security | Principal (000s) | Value | ||||||||||
5.25%, 08/01/20 (Call 08/01/16)b | USD | 100 | $ | 103,000 | ||||||||
Clear Channel Communications Inc. | ||||||||||||
9.00%, 12/15/19 (Call 07/15/15) | USD | 125 | 126,719 | |||||||||
9.00%, 03/01/21 (Call 03/01/16) | USD | 150 | 150,750 | |||||||||
10.75%, 08/01/16 (Call 12/02/13) | USD | 50 | 48,125 | |||||||||
11.25%, 03/01/21 (Call 03/01/16) | USD | 25 | 26,875 | |||||||||
Clear Channel Worldwide Holdings Inc. | ||||||||||||
6.50%, 11/15/22 (Call 11/15/17)b | USD | 150 | 157,500 | |||||||||
Series B | ||||||||||||
7.63%, 03/15/20 (Call 03/15/15)b | USD | 125 | 133,125 | |||||||||
Clearwire Communications LLC/Clearwire Finance Inc. | ||||||||||||
12.00%, 12/01/15 (Call 12/01/13)a | USD | 150 | 155,437 | |||||||||
CNH Capital LLC | ||||||||||||
3.88%, 11/01/15 | USD | 100 | 103,125 | |||||||||
Commercial Metals Co. | ||||||||||||
7.35%, 08/15/18 | USD | 100 | 113,035 | |||||||||
CommScope Inc. | ||||||||||||
8.25%, 01/15/19 (Call 01/15/15)a | USD | 100 | 109,750 | |||||||||
Community Health Systems Inc. | ||||||||||||
5.13%, 08/15/18 (Call 08/15/15)b | USD | 150 | 155,812 | |||||||||
7.13%, 07/15/20 (Call 07/15/16)b | USD | 100 | 105,000 | |||||||||
8.00%, 11/15/19 (Call 11/15/15) | USD | 100 | 108,000 | |||||||||
Concho Resources Inc. | ||||||||||||
5.50%, 04/01/23 (Call 10/01/17) | USD | 100 | 103,932 | |||||||||
6.50%, 01/15/22 (Call 01/15/17) | USD | 100 | 109,407 | |||||||||
| 48 | 2013 iSHARES ANNUAL REPORTTO SHAREHOLDERS |
Table of Contents
Schedule of Investments (Continued)
iSHARES® GLOBAL HIGH YIELD CORPORATE BOND ETF
October 31, 2013
| Security | Principal (000s) | Value | ||||||||||
CONSOL Energy Inc. | ||||||||||||
8.00%, 04/01/17 (Call 04/01/14)b | USD | 150 | $ | 159,204 | ||||||||
8.25%, 04/01/20 (Call 04/01/15) | USD | 100 | 109,350 | |||||||||
Constellation Brands Inc. | ||||||||||||
6.00%, 05/01/22b | USD | 150 | 163,312 | |||||||||
7.25%, 05/15/17 | USD | 100 | 116,375 | |||||||||
Continental Resources Inc. | ||||||||||||
4.50%, 04/15/23 (Call 01/15/23) | USD | 100 | 100,860 | |||||||||
5.00%, 09/15/22 (Call 03/15/17)b | USD | 200 | 208,520 | |||||||||
Crestwood Midstream Partners LP/Crestwood Midstream Finance Corp. | ||||||||||||
6.13%, 03/01/22 (Call 11/01/16)a | USD | 25 | 25,563 | |||||||||
Cricket Communications Inc. | ||||||||||||
7.75%, 10/15/20 (Call 10/15/15)b | USD | 100 | 114,250 | |||||||||
Crown Americas LLC/Crown Americas Capital Corp. IV | ||||||||||||
4.50%, 01/15/23a | USD | 100 | 93,373 | |||||||||
Crown Castle International Corp. | ||||||||||||
5.25%, 01/15/23b | USD | 100 | 98,750 | |||||||||
CSC Holdings LLC | ||||||||||||
6.75%, 11/15/21 | USD | 100 | 109,250 | |||||||||
DaVita HealthCare Partners Inc. | ||||||||||||
5.75%, 08/15/22 (Call 08/15/17) | USD | 50 | 51,250 | |||||||||
6.38%, 11/01/18 (Call 12/02/13) | USD | 100 | 105,125 | |||||||||
6.63%, 11/01/20 (Call 11/01/14) | USD | 100 | 106,750 | |||||||||
DCP Midstream LLC | ||||||||||||
5.85%, 05/21/43 (Call 05/21/23)a,c | USD | 100 | 94,000 | |||||||||
Dean Foods Co. | ||||||||||||
7.00%, 06/01/16 | USD | 100 | 110,750 | |||||||||
Del Monte Corp. | ||||||||||||
7.63%, 02/15/19 (Call 02/15/14) | USD | 100 | 104,250 | |||||||||
| Security | Principal (000s) | Value | ||||||||||
Delphi Corp. | ||||||||||||
6.13%, 05/15/21 (Call 05/15/16) | USD | 100 | $ | 110,151 | ||||||||
Denali Borrower LLC/Denali Finance Corp. | ||||||||||||
5.63%, 10/15/20 (Call 10/15/16)a | USD | 75 | 74,063 | |||||||||
Denbury Resources Inc. | ||||||||||||
4.63%, 07/15/23 (Call 01/15/18) | USD | 100 | 92,228 | |||||||||
8.25%, 02/15/20 (Call 02/15/15)b | USD | 100 | 110,040 | |||||||||
DISH DBS Corp. | ||||||||||||
4.25%, 04/01/18 | USD | 100 | 101,483 | |||||||||
4.63%, 07/15/17b | USD | 100 | 103,955 | |||||||||
5.00%, 03/15/23 | USD | 75 | 71,752 | |||||||||
5.88%, 07/15/22b | USD | 150 | 153,772 | |||||||||
6.75%, 06/01/21 | USD | 150 | 162,043 | |||||||||
7.75%, 05/31/15 | USD | 150 | 164,152 | |||||||||
7.88%, 09/01/19b | USD | 150 | 174,579 | |||||||||
DJO Finance LLC/DJO Finance Corp. | ||||||||||||
9.88%, 04/15/18 (Call 04/15/15) | USD | 50 | 53,625 | |||||||||
DPL Inc. | ||||||||||||
6.50%, 10/15/16 (Call 09/15/16) | USD | 50 | 53,826 | |||||||||
7.25%, 10/15/21 (Call 07/15/21) | USD | 100 | 104,756 | |||||||||
DR Horton Inc. | ||||||||||||
3.63%, 02/15/18 (Call 11/15/17) | USD | 100 | 101,000 | |||||||||
E*TRADE Financial Corp. | ||||||||||||
6.00%, 11/15/17 (Call 11/15/14)b | USD | 100 | 106,000 | |||||||||
Eagle Spinco Inc. | ||||||||||||
4.63%, 02/15/21 (Call 02/15/18)a,b | USD | 100 | 96,916 | |||||||||
El Paso Corp. | ||||||||||||
7.00%, 06/15/17 | USD | 100 | 113,326 | |||||||||
Endo Health Solutions Inc. | ||||||||||||
7.00%, 07/15/19 (Call 07/15/15)b | USD | 100 | 106,750 | |||||||||
SCHEDULESOF INVESTMENTS | 49 |
Table of Contents
Schedule of Investments (Continued)
iSHARES® GLOBAL HIGH YIELD CORPORATE BOND ETF
October 31, 2013
| Security | Principal (000s) | Value | ||||||||||
Energy Future Intermediate Holding Co. LLC/EFIH Finance Inc. | ||||||||||||
10.00%, 12/01/20 (Call 12/01/15)a | USD | 250 | $ | 261,562 | ||||||||
12.25%, 03/01/22 (Call 03/01/17)a,b | USD | 100 | 115,500 | |||||||||
Energy Transfer Equity LP | ||||||||||||
7.50%, 10/15/20 | USD | 150 | 173,250 | |||||||||
Energy XXI Gulf Coast Inc. | ||||||||||||
7.50%, 12/15/21 (Call 12/15/16)a | USD | 55 | 57,473 | |||||||||
9.25%, 12/15/17 (Call 12/15/14)b | USD | 100 | 111,103 | |||||||||
Envision Healthcare Corp. | ||||||||||||
8.13%, 06/01/19 (Call 06/01/14) | USD | 50 | 54,315 | |||||||||
EP Energy LLC/EP Energy Finance Inc. | ||||||||||||
Series WI | ||||||||||||
9.38%, 05/01/20 (Call 05/01/16)b | USD | 100 | 115,509 | |||||||||
EP Energy LLC/Everest Acquisition Finance Inc. | ||||||||||||
6.88%, 05/01/19 (Call 05/01/15) | USD | 100 | 107,000 | |||||||||
Equinix Inc. | ||||||||||||
4.88%, 04/01/20 (Call 04/01/17)b | USD | 25 | 25,041 | |||||||||
5.38%, 04/01/23 (Call 04/01/18)b | USD | 100 | 99,220 | |||||||||
7.00%, 07/15/21 (Call 07/15/16)b | USD | 100 | 109,153 | |||||||||
Felcor Lodging LP | ||||||||||||
5.63%, 03/01/23 (Call 03/01/18) | USD | 50 | 49,250 | |||||||||
First Data Corp. | ||||||||||||
6.75%, 11/01/20 (Call 11/01/15)a | USD | 150 | 158,926 | |||||||||
7.38%, 06/15/19 (Call 06/15/15)a | USD | 150 | 161,437 | |||||||||
8.25%, 01/15/21 (Call 01/15/16)a,b | USD | 150 | 159,580 | |||||||||
| Security | Principal (000s) | Value | ||||||||||
8.88%, 08/15/20 (Call 08/15/15)a | USD | 150 | $ | 166,404 | ||||||||
10.63%, 06/15/21 (Call 04/15/16)a | USD | 50 | 53,621 | |||||||||
11.25%, 03/31/16 (Call 12/02/13)b | USD | 138 | 138,862 | |||||||||
11.25%, 01/15/21 (Call 01/15/16)a | USD | 50 | 54,938 | |||||||||
11.75%, 08/15/21 (Call 05/15/16)a | USD | 50 | 50,813 | |||||||||
12.63%, 01/15/21 (Call 01/15/16)b | USD | 200 | 231,250 | |||||||||
Forest Oil Corp. | ||||||||||||
7.25%, 06/15/19 (Call 12/02/13) | USD | 50 | 50,491 | |||||||||
7.50%, 09/15/20 (Call 09/15/16) | USD | 50 | 49,531 | |||||||||
Freescale Semiconductor Inc. | ||||||||||||
8.05%, 02/01/20 (Call 06/01/15) | USD | 100 | 107,730 | |||||||||
9.25%, 04/15/18 (Call 04/15/14)a | USD | 128 | 138,370 | |||||||||
10.75%, 08/01/20 (Call 08/01/15) | USD | 50 | 56,318 | |||||||||
Fresenius Medical Care US Finance II Inc. | ||||||||||||
5.63%, 07/31/19a,b | USD | 200 | 214,500 | |||||||||
Frontier Communications Corp. | ||||||||||||
7.63%, 04/15/24b | USD | 100 | 105,000 | |||||||||
8.25%, 04/15/17b | USD | 200 | 231,000 | |||||||||
8.50%, 04/15/20b | USD | 100 | 114,000 | |||||||||
8.75%, 04/15/22 | USD | 50 | 56,938 | |||||||||
Gannett Co. Inc. | ||||||||||||
5.13%, 10/15/19 (Call 10/15/16)a | USD | 100 | 103,250 | |||||||||
General Motors Co. | ||||||||||||
3.50%, 10/02/18a | USD | 75 | 76,500 | |||||||||
General Motors Financial Co. Inc. | ||||||||||||
4.25%, 05/15/23a | USD | 105 | 100,792 | |||||||||
4.75%, 08/15/17a | USD | 100 | 106,036 | |||||||||
GenOn Energy Inc. | ||||||||||||
9.50%, 10/15/18b | USD | 100 | 114,822 | |||||||||
9.88%, 10/15/20 (Call 10/15/15) | USD | 100 | 111,717 | |||||||||
| 50 | 2013 iSHARES ANNUAL REPORTTO SHAREHOLDERS |
Table of Contents
Schedule of Investments (Continued)
iSHARES® GLOBAL HIGH YIELD CORPORATE BOND ETF
October 31, 2013
| Security | Principal (000s) | Value | ||||||||||
GLP Capital LP/GLP Financing II Inc. | ||||||||||||
4.88%, 11/01/20 (Call 08/01/20)a | USD | 25 | $ | 25,188 | ||||||||
Goodyear Tire & Rubber Co. (The) | ||||||||||||
6.50%, 03/01/21 (Call 03/01/16)b | USD | 100 | 105,750 | |||||||||
8.25%, 08/15/20 (Call 08/15/15)b | USD | 100 | 113,000 | |||||||||
Grifols Inc. | ||||||||||||
8.25%, 02/01/18 (Call 02/01/14) | USD | 100 | 107,500 | |||||||||
Halcon Resources Corp. | ||||||||||||
8.88%, 05/15/21 (Call 11/15/16) | USD | 75 | 77,952 | |||||||||
9.25%, 02/15/22 (Call 08/15/17)a | USD | 100 | 105,575 | |||||||||
9.75%, 07/15/20 (Call 07/15/16) | USD | 50 | 54,069 | |||||||||
Hanesbrands Inc. | ||||||||||||
6.38%, 12/15/20 (Call 12/15/15)b | USD | 100 | 108,750 | |||||||||
Harbinger Group Inc. | ||||||||||||
7.88%, 07/15/19 (Call 01/15/16)a | USD | 50 | 53,125 | |||||||||
Hawk Acquisition Sub Inc. | ||||||||||||
4.25%, 10/15/20 (Call 04/15/15)a | USD | 200 | 194,250 | |||||||||
HCA Holdings Inc. | ||||||||||||
6.25%, 02/15/21 | USD | 75 | 78,562 | |||||||||
7.75%, 05/15/21 (Call 11/15/15)b | USD | 100 | 109,500 | |||||||||
HCA Inc. | ||||||||||||
5.88%, 03/15/22 | USD | 100 | 105,250 | |||||||||
5.88%, 05/01/23b | USD | 100 | 100,750 | |||||||||
6.50%, 02/15/16b | USD | 100 | 109,500 | |||||||||
6.50%, 02/15/20b | USD | 400 | 445,000 | |||||||||
7.25%, 09/15/20 (Call 03/15/15) | USD | 100 | 109,500 | |||||||||
7.50%, 02/15/22 | USD | 100 | 112,000 | |||||||||
8.50%, 04/15/19 (Call 04/15/14) | USD | 150 | 160,687 | |||||||||
| Security | Principal (000s) | Value | ||||||||||
HD Supply Inc. | ||||||||||||
7.50%, 07/15/20 (Call 10/15/16)a | USD | 150 | $ | 158,625 | ||||||||
11.00%, 04/15/20 (Call 04/15/16) | USD | 100 | 119,875 | |||||||||
11.50%, 07/15/20 (Call 10/15/16) | USD | 50 | 60,063 | |||||||||
Health Management Associates Inc. | ||||||||||||
7.38%, 01/15/20 (Call 01/15/16) | USD | 100 | 111,500 | |||||||||
Hercules Offshore Inc. | ||||||||||||
8.75%, 07/15/21 (Call 07/15/17)a | USD | 50 | 54,078 | |||||||||
Hertz Corp. (The) | ||||||||||||
5.88%, 10/15/20 (Call 10/15/15) | USD | 100 | 105,147 | |||||||||
6.75%, 04/15/19 (Call 04/15/15) | USD | 150 | 161,616 | |||||||||
Hexion U.S. Finance Corp. | ||||||||||||
6.63%, 04/15/20 (Call 04/15/15) | USD | 75 | 76,781 | |||||||||
Hexion U.S. Finance Corp./Hexion Nova Scotia Finance ULC | ||||||||||||
9.00%, 11/15/20 (Call 11/15/15) | USD | 100 | 95,500 | |||||||||
Hologic Inc. | ||||||||||||
6.25%, 08/01/20 (Call 08/01/15) | USD | 100 | 106,250 | |||||||||
Hughes Satellite Systems Corp. | ||||||||||||
7.63%, 06/15/21 | USD | 100 | 109,250 | |||||||||
Huntington Ingalls Industries Inc. | ||||||||||||
7.13%, 03/15/21 (Call 03/15/16)b | USD | 50 | 54,096 | |||||||||
Huntsman International LLC | ||||||||||||
8.63%, 03/15/21 (Call 09/15/15) | USD | 100 | 112,250 | |||||||||
Icahn Enterprises LP/Icahn Enterprises Finance Corp. | ||||||||||||
7.75%, 01/15/16 (Call 11/18/13) | USD | 100 | 103,112 | |||||||||
8.00%, 01/15/18 (Call 01/15/14) | USD | 100 | 104,864 | |||||||||
SCHEDULESOF INVESTMENTS | 51 |
Table of Contents
Schedule of Investments (Continued)
iSHARES® GLOBAL HIGH YIELD CORPORATE BOND ETF
October 31, 2013
| Security | Principal (000s) | Value | ||||||||||
IMS Health Inc. | ||||||||||||
6.00%, 11/01/20 (Call 11/01/15)a | USD | 150 | $ | 157,125 | ||||||||
Infor US Inc. | ||||||||||||
9.38%, 04/01/19 (Call 04/01/15) | USD | 100 | 112,791 | |||||||||
ING U.S. Inc. | ||||||||||||
5.65%, 05/15/53 (Call 05/15/23)c | USD | 50 | 47,625 | |||||||||
International Lease Finance Corp. | ||||||||||||
4.88%, 04/01/15b | USD | 200 | 207,301 | |||||||||
5.75%, 05/15/16b | USD | 100 | 106,782 | |||||||||
5.88%, 04/01/19b | USD | 150 | 161,137 | |||||||||
5.88%, 08/15/22b | USD | 100 | 102,750 | |||||||||
8.25%, 12/15/20 | USD | 200 | 236,732 | |||||||||
8.63%, 09/15/15 | USD | 100 | 111,498 | |||||||||
8.75%, 03/15/17b | USD | 200 | 235,239 | |||||||||
inVentiv Health Inc. | ||||||||||||
9.00%, 01/15/18 (Call 01/15/16)a,b | USD | 25 | 26,063 | |||||||||
11.00%, 08/15/18 (Call 08/15/14)a | USD | 25 | 21,688 | |||||||||
Iron Mountain Inc. | ||||||||||||
5.75%, 08/15/24 (Call 08/15/17)b | USD | 75 | 71,625 | |||||||||
7.75%, 10/01/19 (Call 10/01/15) | USD | 100 | 111,023 | |||||||||
Jaguar Holding Co. | ||||||||||||
9.50%, 12/01/19 (Call 12/01/14)a,b | USD | 100 | 112,750 | |||||||||
Jarden Corp. | ||||||||||||
7.50%, 05/01/17 | USD | 50 | 57,875 | |||||||||
JC Penney Corp. Inc. | ||||||||||||
5.65%, 06/01/20 | USD | 75 | 56,625 | |||||||||
Kinder Morgan Finance Co. LLC | ||||||||||||
6.00%, 01/15/18a | USD | 100 | 109,303 | |||||||||
Kinetic Concepts Inc. / KCI USA Inc. | ||||||||||||
10.50%, 11/01/18 (Call 11/01/15) | USD | 100 | 112,375 | |||||||||
12.50%, 11/01/19 (Call 11/01/15)b | USD | 50 | 53,875 | |||||||||
| Security | Principal (000s) | Value | ||||||||||
L Brands Inc. | ||||||||||||
5.63%, 02/15/22b | USD | 100 | $ | 103,000 | ||||||||
6.63%, 04/01/21 | USD | 100 | 110,125 | |||||||||
6.90%, 07/15/17 | USD | 100 | 114,250 | |||||||||
Lamar Media Corp. | ||||||||||||
5.00%, 05/01/23 (Call 05/01/18) | USD | 50 | 47,827 | |||||||||
Laredo Petroleum Inc. | ||||||||||||
9.50%, 02/15/19 (Call 02/15/15) | USD | 100 | 111,497 | |||||||||
Laureate Education Inc. | ||||||||||||
9.25%, 09/01/19 (Call 09/01/15)a | USD | 50 | 55,000 | |||||||||
Lear Corp. | ||||||||||||
4.75%, 01/15/23 (Call 01/15/18)a | USD | 25 | 24,119 | |||||||||
Lennar Corp. | ||||||||||||
4.75%, 12/15/17 (Call 09/15/17)b | USD | 100 | 104,750 | |||||||||
Level 3 Financing Inc. | ||||||||||||
8.13%, 07/01/19 (Call 07/01/15) | USD | 200 | 220,500 | |||||||||
8.63%, 07/15/20 (Call 01/15/16)b | USD | 100 | 113,375 | |||||||||
Levi Strauss & Co. | ||||||||||||
6.88%, 05/01/22 (Call 05/01/17)b | USD | 100 | 108,500 | |||||||||
Linn Energy LLC/Linn Energy Finance Corp. | ||||||||||||
7.00%, 11/01/19 (Call 11/01/15)a,b | USD | 200 | 198,831 | |||||||||
7.75%, 02/01/21 (Call 09/15/15) | USD | 100 | 103,423 | |||||||||
8.63%, 04/15/20 (Call 04/15/15) | USD | 100 | 106,898 | |||||||||
MarkWest Energy Partners LP/MarkWest Energy Finance Corp. | ||||||||||||
4.50%, 07/15/23 (Call 04/15/23) | USD | 100 | 96,370 | |||||||||
6.75%, 11/01/20 (Call 11/01/15)b | USD | 150 | 163,557 | |||||||||
| 52 | 2013 iSHARES ANNUAL REPORTTO SHAREHOLDERS |
Table of Contents
Schedule of Investments (Continued)
iSHARES® GLOBAL HIGH YIELD CORPORATE BOND ETF
October 31, 2013
| Security | Principal (000s) | Value | ||||||||||
Masco Corp. | ||||||||||||
6.13%, 10/03/16b | USD | 150 | $ | 167,250 | ||||||||
McClatchy Co. (The) | ||||||||||||
9.00%, 12/15/22 (Call 12/15/17) | USD | 100 | 107,875 | |||||||||
MetroPCS Wireless Inc. | ||||||||||||
6.25%, 04/01/21 (Call 04/01/17)a | USD | 100 | 104,750 | |||||||||
6.63%, 11/15/20 (Call 11/15/15) | USD | 100 | 105,750 | |||||||||
6.63%, 04/01/23 (Call 04/01/18)a,b | USD | 200 | 209,500 | |||||||||
7.88%, 09/01/18 (Call 09/01/14) | USD | 100 | 108,000 | |||||||||
MGM Resorts International | ||||||||||||
6.63%, 12/15/21b | USD | 175 | 187,250 | |||||||||
7.50%, 06/01/16b | USD | 100 | 112,443 | |||||||||
7.63%, 01/15/17b | USD | 100 | 113,677 | |||||||||
8.63%, 02/01/19b | USD | 150 | 176,625 | |||||||||
Midstates Petroleum Co. Inc./Midstates Petroleum Co. LLC | ||||||||||||
9.25%, 06/01/21 (Call 06/01/16) | USD | 50 | 51,326 | |||||||||
10.75%, 10/01/20 (Call 10/01/16) | USD | 50 | 53,710 | |||||||||
Momentive Performance Materials Inc. | ||||||||||||
8.88%, 10/15/20 (Call 10/15/15) | USD | 50 | 53,002 | |||||||||
9.00%, 01/15/21 (Call 01/15/16)b | USD | 75 | 66,937 | |||||||||
Nationstar Mortgage LLC/Nationstar Capital Corp. | ||||||||||||
7.88%, 10/01/20 (Call 10/01/16)b | USD | 100 | 106,500 | |||||||||
Navistar International Corp. | ||||||||||||
8.25%, 11/01/21 (Call 11/01/14) | USD | 100 | 101,975 | |||||||||
NBTY Inc. | ||||||||||||
9.00%, 10/01/18 (Call 10/01/14) | USD | 50 | 54,938 | |||||||||
NCR Corp. | ||||||||||||
5.00%, 07/15/22 (Call 07/15/17) | USD | 50 | 49,063 | |||||||||
| Security | Principal (000s) | Value | ||||||||||
Neiman Marcus Group Inc. (The) | ||||||||||||
8.00%, 10/15/21 (Call 10/15/16)a | USD | 100 | $ | 102,250 | ||||||||
Newfield Exploration Co. | ||||||||||||
5.75%, 01/30/22 | USD | 100 | 105,237 | |||||||||
6.88%, 02/01/20 (Call 02/01/15)b | USD | 100 | 106,807 | |||||||||
NGPL PipeCo LLC | ||||||||||||
9.63%, 06/01/19 (Call 06/01/15)a | USD | 100 | 99,358 | |||||||||
Nielsen Finance LLC/Nielsen Finance Co. | ||||||||||||
4.50%, 10/01/20 (Call 10/01/16) | USD | 50 | 49,134 | |||||||||
7.75%, 10/15/18 (Call 10/15/14) | USD | 75 | 81,737 | |||||||||
NRG Energy Inc. | ||||||||||||
7.63%, 01/15/18b | USD | 100 | 113,020 | |||||||||
7.63%, 05/15/19 (Call 05/15/14) | USD | 250 | 265,502 | |||||||||
7.88%, 05/15/21 (Call 05/15/16)b | USD | 100 | 110,690 | |||||||||
8.25%, 09/01/20 (Call 09/01/15) | USD | 50 | 55,836 | |||||||||
Nuance Communications Inc. | ||||||||||||
5.38%, 08/15/20 (Call 08/15/16)a | USD | 50 | 49,023 | |||||||||
Nuveen Investments Inc. | ||||||||||||
9.13%, 10/15/17 (Call 10/15/14)a,b | USD | 50 | 48,500 | |||||||||
9.50%, 10/15/20 (Call 10/15/16)a | USD | 50 | 47,500 | |||||||||
Oasis Petroleum Inc. | ||||||||||||
7.25%, 02/01/19 (Call 02/01/15) | USD | 100 | 107,500 | |||||||||
Offshore Group Investments Ltd. | ||||||||||||
7.13%, 04/01/23 (Call 04/01/18) | USD | 75 | 76,336 | |||||||||
7.50%, 11/01/19 (Call 11/01/15) | USD | 50 | 54,425 | |||||||||
Paris Las Vegas Holding LLC/Caesars Entertainment Corp. | ||||||||||||
8.00%, 10/01/20 (Call 10/01/16)a,b | USD | 100 | 100,371 | |||||||||
SCHEDULESOF INVESTMENTS | 53 |
Table of Contents
Schedule of Investments (Continued)
iSHARES® GLOBAL HIGH YIELD CORPORATE BOND ETF
October 31, 2013
| Security | Principal (000s) | Value | ||||||||||
Peabody Energy Corp. | ||||||||||||
6.00%, 11/15/18 | USD | 150 | $ | 158,570 | ||||||||
6.25%, 11/15/21 | USD | 100 | 103,361 | |||||||||
Penn Virginia Corp. | ||||||||||||
8.50%, 05/01/20 (Call 05/01/17) | USD | 50 | 52,500 | |||||||||
Penn Virginia Resource Partners LP/Penn Virginia Resource Finance Corp. II | ||||||||||||
8.38%, 06/01/20 (Call 06/01/16) | USD | 75 | 82,687 | |||||||||
Petco Animal Supplies Inc. | ||||||||||||
9.25%, 12/01/18 (Call 12/02/13)a | USD | 50 | 53,625 | |||||||||
Pinnacle Entertainment Inc. | ||||||||||||
7.50%, 04/15/21 (Call 04/15/15)b | USD | 100 | 109,750 | |||||||||
PNK Finance Corp. | ||||||||||||
6.38%, 08/01/21 (Call 08/01/16)a | USD | 15 | 15,800 | |||||||||
PolyOne Corp. | ||||||||||||
5.25%, 03/15/23 | USD | 50 | 49,688 | |||||||||
Post Holdings Inc. | ||||||||||||
7.38%, 02/15/22 (Call 02/15/17) | USD | 50 | 53,250 | |||||||||
Puget Energy Inc. | ||||||||||||
6.50%, 12/15/20 | USD | 100 | 113,135 | |||||||||
PVH Corp. | ||||||||||||
7.38%, 05/15/20 (Call 05/15/15) | USD | 100 | 109,750 | |||||||||
QEP Resources Inc. | ||||||||||||
5.38%, 10/01/22 (Call 07/01/22)b | USD | 100 | 97,087 | |||||||||
QVC Inc. | ||||||||||||
5.13%, 07/02/22 | USD | 100 | 100,568 | |||||||||
7.50%, 10/01/19 (Call 10/01/14)a | USD | 100 | 108,000 | |||||||||
R.R. Donnelley & Sons Co. | ||||||||||||
7.88%, 03/15/21b | USD | 50 | 55,750 | |||||||||
8.25%, 03/15/19b | USD | 100 | 115,000 | |||||||||
Range Resources Corp. | ||||||||||||
5.00%, 08/15/22 (Call 02/15/17) | USD | 100 | 100,356 | |||||||||
| Security | Principal (000s) | Value | ||||||||||
5.75%, 06/01/21 (Call 06/01/16) | USD | 100 | $ | 106,322 | ||||||||
Realogy Group LLC | ||||||||||||
7.88%, 02/15/19 (Call 02/15/15)a | USD | 100 | 109,476 | |||||||||
Regency Energy Partners LP/Regency Energy Finance Corp. | ||||||||||||
5.50%, 04/15/23 (Call 10/15/17) | USD | 50 | 49,874 | |||||||||
6.88%, 12/01/18 (Call 12/01/14) | USD | 100 | 107,347 | |||||||||
Reynolds Group Issuer Inc./Reynolds Group Issuer LLC | ||||||||||||
5.75%, 10/15/20 (Call 10/15/15)b | USD | 300 | 309,000 | |||||||||
7.13%, 04/15/19 (Call 10/15/14) | USD | 350 | 374,062 | |||||||||
8.25%, 02/15/21 (Call 02/15/16)b | USD | 100 | 103,750 | |||||||||
9.00%, 04/15/19 (Call 10/15/14) | USD | 100 | 106,750 | |||||||||
9.88%, 08/15/19 (Call 08/15/15)b | USD | 150 | 165,750 | |||||||||
Rite Aid Corp. | ||||||||||||
6.75%, 06/15/21 (Call 06/15/16)b | USD | 100 | 105,500 | |||||||||
9.25%, 03/15/20 (Call 03/15/16) | USD | 50 | 57,747 | |||||||||
Rockies Express Pipeline LLC | ||||||||||||
5.63%, 04/15/20a | USD | 75 | 63,230 | |||||||||
6.85%, 07/15/18a | USD | 50 | 47,135 | |||||||||
Rockwood Specialties Group Inc. | ||||||||||||
4.63%, 10/15/20 (Call 10/15/15) | USD | 100 | 103,000 | |||||||||
Sabine Pass Liquefaction LLC | ||||||||||||
5.63%, 02/01/21a | USD | 100 | 100,750 | |||||||||
5.63%, 04/15/23a | USD | 100 | 97,607 | |||||||||
Sabine Pass LNG LP | ||||||||||||
7.50%, 11/30/16b | USD | 100 | 111,397 | |||||||||
Sabre Inc. | ||||||||||||
8.50%, 05/15/19 (Call 05/15/15)a,b | USD | 100 | 109,875 | |||||||||
| 54 | 2013 iSHARES ANNUAL REPORTTO SHAREHOLDERS |
Table of Contents
Schedule of Investments (Continued)
iSHARES® GLOBAL HIGH YIELD CORPORATE BOND ETF
October 31, 2013
| Security | Principal (000s) | Value | ||||||||||
Sally Holdings LLC/Sally Capital Inc. | ||||||||||||
6.88%, 11/15/19 (Call 11/15/15)b | USD | 150 | $ | 165,562 | ||||||||
Samson Investment Co. | ||||||||||||
10.25%, 02/15/20 (Call 02/15/16)a | USD | 150 | 161,618 | |||||||||
SandRidge Energy Inc. | ||||||||||||
7.50%, 03/15/21 (Call 03/15/16)b | USD | 100 | 106,002 | |||||||||
8.13%, 10/15/22 (Call 04/15/17) | USD | 100 | 106,470 | |||||||||
SBA Communications Corp. | ||||||||||||
5.63%, 10/01/19 (Call 10/01/16) | USD | 50 | 51,250 | |||||||||
Seagate HDD Cayman | ||||||||||||
7.00%, 11/01/21 (Call 05/01/16)b | USD | 100 | 110,500 | |||||||||
Sealed Air Corp. | ||||||||||||
8.13%, 09/15/19 (Call 09/15/15)a | USD | 100 | 112,750 | |||||||||
8.38%, 09/15/21 (Call 09/15/16)a | USD | 100 | 114,500 | |||||||||
Sears Holdings Corp. | ||||||||||||
6.63%, 10/15/18 | USD | 100 | 94,250 | |||||||||
Service Corp. International | ||||||||||||
5.38%, 01/15/22 (Call 07/15/17)a | USD | 100 | 101,000 | |||||||||
ServiceMaster Co. | ||||||||||||
7.00%, 08/15/20 (Call 08/15/15)b | USD | 50 | 49,250 | |||||||||
8.00%, 02/15/20 (Call 02/15/15)b | USD | 50 | 51,202 | |||||||||
SESI LLC | ||||||||||||
6.38%, 05/01/19 (Call 05/01/15) | USD | 100 | 105,923 | |||||||||
Sinclair Television Group Inc. | ||||||||||||
6.13%, 10/01/22 (Call 10/01/17) | USD | 100 | 101,824 | |||||||||
Sirius XM Radio Inc. | ||||||||||||
4.63%, 05/15/23 (Call 05/15/18)a | USD | 100 | 91,750 | |||||||||
SLM Corp. | ||||||||||||
5.50%, 01/15/19b | USD | 200 | 207,807 | |||||||||
| Security | Principal (000s) | Value | ||||||||||
6.00%, 01/25/17b | USD | 250 | $ | 272,468 | ||||||||
6.25%, 01/25/16b | USD | 150 | 163,899 | |||||||||
8.00%, 03/25/20b | USD | 200 | 228,147 | |||||||||
SM Energy Co. | ||||||||||||
5.00%, 01/15/24 (Call 07/15/18)a | USD | 50 | 48,841 | |||||||||
Smithfield Foods Inc. | ||||||||||||
6.63%, 08/15/22 (Call 08/15/17) | USD | 100 | 105,375 | |||||||||
Spectrum Brands Escrow Corp. | ||||||||||||
6.38%, 11/15/20 (Call 11/15/16)a | USD | 100 | 106,250 | |||||||||
Springleaf Finance Corp. | ||||||||||||
Series I | ||||||||||||
5.40%, 12/01/15 | USD | 50 | 52,375 | |||||||||
6.90%, 12/15/17 | USD | 250 | 270,625 | |||||||||
Sprint Communications Inc. | ||||||||||||
6.00%, 12/01/16b | USD | 150 | 162,375 | |||||||||
6.00%, 11/15/22b | USD | 200 | 197,500 | |||||||||
7.00%, 03/01/20a | USD | 100 | 110,250 | |||||||||
7.00%, 08/15/20 | USD | 50 | 53,500 | |||||||||
8.38%, 08/15/17b | USD | 150 | 173,625 | |||||||||
9.00%, 11/15/18a,b | USD | 150 | 181,875 | |||||||||
9.13%, 03/01/17 | USD | 150 | 176,625 | |||||||||
11.50%, 11/15/21b | USD | 100 | 130,000 | |||||||||
Sprint Corp. | ||||||||||||
7.88%, 09/15/23a | USD | 300 | 324,375 | |||||||||
SPX Corp. | ||||||||||||
6.88%, 09/01/17b | USD | 50 | 56,268 | |||||||||
Standard Pacific Corp. | ||||||||||||
8.38%, 05/15/18b | USD | 100 | 116,000 | |||||||||
Steel Dynamics Inc. | ||||||||||||
5.25%, 04/15/23 (Call 04/15/18)a | USD | 75 | 74,309 | |||||||||
Suburban Propane Partners LP/Suburban Energy Finance Corp. | ||||||||||||
7.50%, 10/01/18 (Call 10/01/14) | USD | 84 | 90,596 | |||||||||
Sun Merger Sub Inc. | ||||||||||||
5.25%, 08/01/18 (Call 08/01/15)a | USD | 25 | 26,188 | |||||||||
5.88%, 08/01/21 (Call 08/01/16)a | USD | 50 | 52,250 | |||||||||
SCHEDULESOF INVESTMENTS | 55 |
Table of Contents
Schedule of Investments (Continued)
iSHARES® GLOBAL HIGH YIELD CORPORATE BOND ETF
October 31, 2013
| Security | Principal (000s) | Value | ||||||||||
SunGard Data Systems Inc. | ||||||||||||
6.63%, 11/01/19 (Call 11/01/15) | USD | 50 | $ | 52,201 | ||||||||
7.38%, 11/15/18 (Call 12/02/13)b | USD | 100 | 106,180 | |||||||||
7.63%, 11/15/20 (Call 11/15/15) | USD | 100 | 108,523 | |||||||||
SUPERVALU Inc. | ||||||||||||
6.75%, 06/01/21 (Call 06/01/17)a,b | USD | 50 | 49,125 | |||||||||
8.00%, 05/01/16 | USD | 50 | 55,813 | |||||||||
T-Mobile USA Inc. | ||||||||||||
6.63%, 04/28/21 (Call 04/28/17) | USD | 200 | 212,000 | |||||||||
Targa Resources Partners LP/Targa Resources Partners Finance Corp. | ||||||||||||
4.25%, 11/15/23 (Call 05/15/18)a | USD | 50 | 46,688 | |||||||||
5.25%, 05/01/23 (Call 11/01/17) | USD | 100 | 100,003 | |||||||||
6.88%, 02/01/21 (Call 02/01/16) | USD | 100 | 107,539 | |||||||||
Taylor Morrison Communities Inc./Monarch Communities Inc. | ||||||||||||
5.25%, 04/15/21 (Call 04/15/16)a | USD | 100 | 97,000 | |||||||||
Tenet Healthcare Corp. | ||||||||||||
4.50%, 04/01/21 | USD | 200 | 194,000 | |||||||||
6.00%, 10/01/20a | USD | 50 | 52,938 | |||||||||
6.25%, 11/01/18b | USD | 100 | 109,000 | |||||||||
8.00%, 08/01/20 (Call 08/01/15) | USD | 50 | 54,313 | |||||||||
8.13%, 04/01/22a | USD | 50 | 54,750 | |||||||||
Terex Corp. | ||||||||||||
6.00%, 05/15/21 (Call 11/15/16)b | USD | 100 | 104,000 | |||||||||
Tesoro Corp. | ||||||||||||
5.38%, 10/01/22 (Call 10/01/17)b | USD | 50 | 49,405 | |||||||||
Texas Competitive Electric Holdings Co. LLC/TCEH Finance Inc. | ||||||||||||
11.50%, 10/01/20 (Call 04/01/16)a | USD | 150 | 106,500 | |||||||||
| Security | Principal (000s) | Value | ||||||||||
Toll Brothers Finance Corp. | ||||||||||||
5.88%, 02/15/22 (Call 11/15/21) | USD | 100 | $ | 105,500 | ||||||||
Toys R Us Inc. | ||||||||||||
10.38%, 08/15/17 (Call 02/15/15) | USD | 25 | 23,250 | |||||||||
TransDigm Inc. | ||||||||||||
7.75%, 12/15/18 (Call 12/15/14) | USD | 150 | 161,250 | |||||||||
TRW Automotive Inc. | ||||||||||||
4.50%, 03/01/21a | USD | 50 | 50,876 | |||||||||
tw telecom holdings Inc. | ||||||||||||
5.38%, 10/01/22 (Call 10/01/17)b | USD | 100 | 99,500 | |||||||||
UBS Preferred Funding Trust V | ||||||||||||
6.24%, 05/29/49 (Call 05/15/16)c | USD | 75 | 80,126 | |||||||||
United Airlines Inc. | ||||||||||||
6.75%, 09/15/15 (Call 12/02/13)a | USD | 100 | 103,250 | |||||||||
United Rentals (North America) Inc. | ||||||||||||
7.38%, 05/15/20 (Call 05/15/16) | USD | 150 | 167,207 | |||||||||
7.63%, 04/15/22 (Call 04/15/17)b | USD | 100 | 112,207 | |||||||||
8.38%, 09/15/20 (Call 09/15/15) | USD | 100 | 111,782 | |||||||||
United States Steel Corp. | ||||||||||||
7.38%, 04/01/20b | USD | 100 | 105,295 | |||||||||
Univision Communications Inc. | ||||||||||||
5.13%, 05/15/23 (Call 05/15/18)a,b | USD | 100 | 99,404 | |||||||||
6.75%, 09/15/22 (Call 09/15/17)a | USD | 100 | 109,250 | |||||||||
6.88%, 05/15/19 (Call 05/15/15)a | USD | 150 | 162,000 | |||||||||
8.50%, 05/15/21 (Call 11/15/15)a,b | USD | 50 | 55,375 | |||||||||
US Airways Group Inc. | ||||||||||||
6.13%, 06/01/18 | USD | 50 | 49,158 | |||||||||
| 56 | 2013 iSHARES ANNUAL REPORTTO SHAREHOLDERS |
Table of Contents
Schedule of Investments (Continued)
iSHARES® GLOBAL HIGH YIELD CORPORATE BOND ETF
October 31, 2013
| Security | Principal (000s) | Value | ||||||||||
US Foods Inc. | ||||||||||||
8.50%, 06/30/19 (Call 06/30/14) | USD | 100 | $ | 107,500 | ||||||||
USG Corp. | ||||||||||||
6.30%, 11/15/16b | USD | 100 | 107,250 | |||||||||
Valeant Pharmaceuticals International Inc. | ||||||||||||
6.38%, 10/15/20 (Call 10/15/16)a | USD | 200 | 212,500 | |||||||||
6.75%, 08/15/21 (Call 02/15/16)a | USD | 100 | 106,500 | |||||||||
6.88%, 12/01/18 (Call 12/01/14)a,b | USD | 200 | 213,500 | |||||||||
Verso Paper Holdings LLC/Verso Paper Inc. | ||||||||||||
11.75%, 01/15/19 (Call 01/15/15) | USD | 30 | 31,050 | |||||||||
Virgin Media Secured Finance PLC | ||||||||||||
5.38%, 04/15/21 (Call 04/15/17)a | USD | 200 | 201,500 | |||||||||
6.00%, 04/15/21 (Call 04/15/17)d | GBP | 100 | 165,882 | |||||||||
Vulcan Materials Co. | ||||||||||||
7.50%, 06/15/21 | USD | 100 | 112,375 | |||||||||
VWR Funding Inc. | ||||||||||||
7.25%, 09/15/17 (Call 09/15/14) | USD | 50 | 53,750 | |||||||||
Walter Energy Inc. | ||||||||||||
8.50%, 04/15/21 (Call 04/15/17)a,b | USD | 25 | 21,156 | |||||||||
West Corp. | ||||||||||||
8.63%, 10/01/18 (Call 10/01/14) | USD | 100 | 108,882 | |||||||||
Whiting Petroleum Corp. | ||||||||||||
5.75%, 03/15/21 (Call 12/15/20)a | USD | 50 | 52,813 | |||||||||
WideOpenWest Finance LLC/WideOpenWest Capital Corp. | ||||||||||||
10.25%, 07/15/19 (Call 07/15/15) | USD | 75 | 82,781 | |||||||||
Windstream Corp. | ||||||||||||
7.50%, 04/01/23 (Call 04/01/16)b | USD | 100 | 104,250 | |||||||||
| Security | Principal or Shares (000s) | Value | ||||||||||
7.75%, 10/15/20 (Call 10/15/15)b | USD | 200 | $ | 214,000 | ||||||||
WMG Acquisition Corp. | ||||||||||||
11.50%, 10/01/18 (Call 10/01/14) | USD | 100 | 115,765 | |||||||||
WPX Energy Inc. | ||||||||||||
6.00%, 01/15/22 (Call 10/15/21) | USD | 100 | 105,010 | |||||||||
Wynn Las Vegas LLC/ Wynn Las Vegas Capital Corp. | ||||||||||||
7.75%, 08/15/20 (Call 08/15/15) | USD | 100 | 112,573 | |||||||||
Wynn Las Vegas LLC/Wynn Las Vegas Capital Corp. | ||||||||||||
5.38%, 03/15/22 (Call 03/15/17) | USD | 100 | 102,880 | |||||||||
Zayo Group LLC/Zayo Capital Inc. | ||||||||||||
10.13%, 07/01/20 (Call 07/01/16) | USD | 100 | 115,750 | |||||||||
|
| |||||||||||
| 46,136,583 | ||||||||||||
|
| |||||||||||
TOTAL CORPORATE BONDS & NOTES |
| |||||||||||
(Cost: $70,263,807) |
| 72,712,306 | ||||||||||
FOREIGN AGENCY OBLIGATIONS — 0.19% |
| |||||||||||
PORTUGAL — 0.19% |
| |||||||||||
Caixa Geral de Depositos SA | ||||||||||||
5.63%, 12/04/15d | EUR | 100 | 141,773 | |||||||||
|
| |||||||||||
| 141,773 | ||||||||||||
|
| |||||||||||
TOTAL FOREIGN AGENCY OBLIGATIONS |
| |||||||||||
(Cost: $136,026) |
| 141,773 | ||||||||||
SHORT-TERM INVESTMENTS — 16.41% |
| |||||||||||
MONEY MARKET FUNDS — 16.41% |
| |||||||||||
BlackRock Cash Funds: Institutional, |
| |||||||||||
0.14%f,g,h | 10,727 | 10,726,857 | ||||||||||
BlackRock Cash Funds: Prime, |
| |||||||||||
0.12%f,g,h | 930 | 929,853 | ||||||||||
SCHEDULESOF INVESTMENTS | 57 |
Table of Contents
Schedule of Investments (Continued)
iSHARES® GLOBAL HIGH YIELD CORPORATE BOND ETF
October 31, 2013
| Security | Shares (000s) | Value | ||||||||
BlackRock Cash Funds: Treasury, |
| |||||||||
0.00%f,g | 633 | $ | 633,152 | |||||||
|
| |||||||||
| 12,289,862 | ||||||||||
|
| |||||||||
TOTAL SHORT-TERM INVESTMENTS |
| |||||||||
(Cost: $12,289,862) | 12,289,862 | |||||||||
|
| |||||||||
TOTAL INVESTMENTS |
| |||||||||
(Cost: $82,689,695) | 85,143,941 | |||||||||
Other Assets, Less Liabilities — (13.69)% |
| (10,250,609 | ) | |||||||
|
| |||||||||
NET ASSETS — 100.00% | $ | 74,893,332 | ||||||||
|
| |||||||||
CAD — Canadian Dollar
EUR — Euro
GBP — British Pound
USD — United States Dollar
| a | This security may be resold to qualified institutional buyers under Rule 144A of the Securities Act of 1933. |
| b | All or a portion of this security represents a security on loan. See Note 5. |
| c | Variable rate security. Rate shown is as of report date. |
| d | This security may be resold to qualified foreign investors and foreign institutional buyers under Regulation S of the Securities Act of 1933. |
| e | Step coupon security. Coupon rate will either increase (step-up bond) or decrease (step-down bond) at regular intervals until maturity. Interest rate shown reflects the rate currently in effect. |
| f | Affiliated issuer. See Note 2. |
| g | The rate quoted is the annualized seven-day yield of the fund at period end. |
| h | All or a portion of this security represents an investment of securities lending collateral. See Note 5. |
See notes to financial statements.
| 58 | 2013 iSHARES ANNUAL REPORTTO SHAREHOLDERS |
Table of Contents
Statements of Assets and Liabilities
iSHARES®, INC.
October 31, 2013
| iShares Emerging Markets Corporate Bond ETF | iShares Emerging Markets High Yield Bond ETF | iShares Emerging Markets Local Currency Bond ETF | ||||||||||
ASSETS | ||||||||||||
Investments, at cost: | ||||||||||||
Unaffiliated | $ | 35,694,499 | $ | 205,911,706 | $ | 640,404,585 | ||||||
Affiliated (Note 2) | 185,824 | 1,141,039 | 111,048 | |||||||||
|
|
|
|
|
| |||||||
Total cost of investments | $ | 35,880,323 | $ | 207,052,745 | $ | 640,515,633 | ||||||
|
|
|
|
|
| |||||||
Investments in securities, at fair value (Note 1): | ||||||||||||
Unaffiliated | $ | 34,706,855 | $ | 197,993,812 | $ | 623,781,633 | ||||||
Affiliated (Note 2) | 185,824 | 1,141,039 | 111,048 | |||||||||
|
|
|
|
|
| |||||||
Total fair value of investments | 34,892,679 | 199,134,851 | 623,892,681 | |||||||||
Foreign currency, at valuea | — | — | 5,550,203 | |||||||||
Cash | 10,594 | 25,784 | — | |||||||||
Receivables: | ||||||||||||
Investment securities sold | 705,313 | 17,659,311 | 2,725,573 | |||||||||
Interest | 471,844 | 3,216,678 | 9,571,402 | |||||||||
|
|
|
|
|
| |||||||
Total Assets | 36,080,430 | 220,036,624 | 641,739,859 | |||||||||
|
|
|
|
|
| |||||||
LIABILITIES | ||||||||||||
Payables: | ||||||||||||
Investment securities purchased | 724,813 | 16,085,279 | 3,038,491 | |||||||||
Capital shares redeemed | — | 230,623 | — | |||||||||
Deferred foreign capital gains taxes (Note 1) | — | — | 35,208 | |||||||||
Investment advisory fees (Note 2) | 17,829 | 116,797 | 324,589 | |||||||||
|
|
|
|
|
| |||||||
Total Liabilities | 742,642 | 16,432,699 | 3,398,288 | |||||||||
|
|
|
|
|
| |||||||
NET ASSETS | $ | 35,337,788 | $ | 203,603,925 | $ | 638,341,571 | ||||||
|
|
|
|
|
| |||||||
Net assets consist of: | ||||||||||||
Paid-in capital | $ | 36,400,576 | $ | 217,354,819 | $ | 659,486,128 | ||||||
Undistributed net investment income | 106,874 | 1,011,628 | — | |||||||||
Accumulated net realized loss | (182,018 | ) | (6,844,628 | ) | (4,620,486 | ) | ||||||
Net unrealized depreciation | (987,644 | ) | (7,917,894 | ) | (16,524,071 | ) | ||||||
|
|
|
|
|
| |||||||
NET ASSETS | $ | 35,337,788 | $ | 203,603,925 | $ | 638,341,571 | ||||||
|
|
|
|
|
| |||||||
Shares outstandingb | 700,000 | 4,000,000 | 12,600,000 | |||||||||
|
|
|
|
|
| |||||||
Net asset value per share | $ | 50.48 | $ | 50.90 | $ | 50.66 | ||||||
|
|
|
|
|
| |||||||
| a | Cost of foreign currency: $ —, $ — and $5,518,486, respectively. |
| b | $0.001 par value, number of shares authorized: 500 million, 500 million and 500 million, respectively. |
See notes to financial statements.
FINANCIAL STATEMENTS | 59 |
Table of Contents
Statements of Assets and Liabilities (Continued)
iSHARES®, INC.
October 31, 2013
| iShares Global ex USD High Yield Corporate Bond ETF | iShares High Yield Corporate | |||||||
ASSETS | ||||||||
Investments, at cost: | ||||||||
Unaffiliated | $ | 45,225,597 | $ | 70,399,833 | ||||
Affiliated (Note 2) | 6,507 | 12,289,862 | ||||||
|
|
|
| |||||
Total cost of investments | $ | 45,232,104 | $ | 82,689,695 | ||||
|
|
|
| |||||
Investments in securities, at fair value (including securities on loana) (Note 1): | ||||||||
Unaffiliated | $ | 48,254,308 | $ | 72,854,079 | ||||
Affiliated (Note 2) | 6,507 | 12,289,862 | ||||||
|
|
|
| |||||
Total fair value of investments | 48,260,815 | 85,143,941 | ||||||
Foreign currency, at valueb | 901,651 | 271,172 | ||||||
Cash | — | 107,839 | ||||||
Receivables: | ||||||||
Investment securities sold | 6 | 53,414 | ||||||
Interest | 1,169,885 | 1,369,008 | ||||||
Capital shares sold | 836,012 | — | ||||||
|
|
|
| |||||
Total Assets | 51,168,369 | 86,945,374 | ||||||
|
|
|
| |||||
LIABILITIES | ||||||||
Payables: | ||||||||
Investment securities purchased | — | 370,151 | ||||||
Collateral for securities on loan (Note 5) | — | 11,656,710 | ||||||
Investment advisory fees (Note 2) | 15,364 | 25,181 | ||||||
|
|
|
| |||||
Total Liabilities | 15,364 | 12,052,042 | ||||||
|
|
|
| |||||
NET ASSETS | $ | 51,153,005 | $ | 74,893,332 | ||||
|
|
|
| |||||
Net assets consist of: | ||||||||
Paid-in capital | $ | 47,415,470 | $ | 71,919,300 | ||||
Undistributed net investment income | 484,187 | 520,139 | ||||||
Undistributed net realized gain (accumulated net realized loss) | 206,630 | (13,975 | ) | |||||
Net unrealized appreciation | 3,046,718 | 2,467,868 | ||||||
|
|
|
| |||||
NET ASSETS | $ | 51,153,005 | $ | 74,893,332 | ||||
|
|
|
| |||||
Shares outstandingc | 900,000 | 1,400,000 | ||||||
|
|
|
| |||||
Net asset value per share | $ | 56.84 | $ | 53.50 | ||||
|
|
|
| |||||
| a | Securities on loan with values of $ —, and $11,197,613, respectively. See Note 5. |
| b | Cost of foreign currency: $905,948 and $266,045, respectively. |
| c | $0.001 par value, number of shares authorized: 500 million and 500 million, respectively. |
See notes to financial statements.
| 60 | 2013 iSHARES ANNUAL REPORTTO SHAREHOLDERS |
Table of Contents
Statements of Operations
iSHARES®, INC.
Year ended October 31, 2013
| iShares Emerging Markets Corporate Bond ETF | iShares Emerging Markets High Yield Bond ETF | iShares Emerging Markets Local Currency Bond ETF | ||||||||||
NET INVESTMENT INCOME | ||||||||||||
Interest — unaffiliateda | $ | 1,465,404 | $ | 14,142,677 | $ | 25,488,489 | ||||||
Interest — affiliated (Note 2) | 104 | 379 | 449 | |||||||||
Securities lending income — affiliated (Note 2) | — | 50 | — | |||||||||
|
|
|
|
|
| |||||||
| 1,465,508 | 14,143,106 | 25,488,938 | ||||||||||
Less: Other foreign taxes (Note 1) | — | — | (309 | ) | ||||||||
|
|
|
|
|
| |||||||
Total investment income | 1,465,508 | 14,143,106 | 25,488,629 | |||||||||
|
|
|
|
|
| |||||||
EXPENSES | ||||||||||||
Investment advisory fees (Note 2) | 202,526 | 1,462,488 | 3,298,880 | |||||||||
|
|
|
|
|
| |||||||
Total expenses | 202,526 | 1,462,488 | 3,298,880 | |||||||||
|
|
|
|
|
| |||||||
Net investment income | 1,262,982 | 12,680,618 | 22,189,749 | |||||||||
|
|
|
|
|
| |||||||
NET REALIZED AND UNREALIZED GAIN (LOSS) | ||||||||||||
Net realized gain (loss) from: | ||||||||||||
Investments — unaffiliatedb | (179,332 | ) | (6,953,390 | ) | (8,360,584 | ) | ||||||
In-kind redemptions — unaffiliated | (439,129 | ) | (1,779,689 | ) | — | |||||||
Foreign currency transactions | — | — | (3,942,872 | ) | ||||||||
|
|
|
|
|
| |||||||
Net realized loss | (618,461 | ) | (8,733,079 | ) | (12,303,456 | ) | ||||||
|
|
|
|
|
| |||||||
Net change in unrealized appreciation/depreciation on: | ||||||||||||
Investmentsc | (1,561,100 | ) | (7,436,270 | ) | (18,679,253 | ) | ||||||
Translation of assets and liabilities in foreign currencies | — | — | 139,960 | |||||||||
|
|
|
|
|
| |||||||
Net change in unrealized appreciation/depreciation | (1,561,100 | ) | (7,436,270 | ) | (18,539,293 | ) | ||||||
|
|
|
|
|
| |||||||
Net realized and unrealized loss | (2,179,561 | ) | (16,169,349 | ) | (30,842,749 | ) | ||||||
|
|
|
|
|
| |||||||
NET DECREASE IN NET ASSETS RESULTING FROM OPERATIONS | $ | (916,579 | ) | $ | (3,488,731 | ) | $ | (8,653,000 | ) | |||
|
|
|
|
|
| |||||||
| a | Net of foreign withholding tax of $ —, $ — and $1,393,157, respectively. |
| b | Net of foreign capital gains taxes of $ —, $ — and $1,880, respectively. |
| c | Net of deferred foreign capital gains taxes of $ —, $ — and $34,499, respectively. |
See notes to financial statements.
FINANCIAL STATEMENTS | 61 |
Table of Contents
Statements of Operations (Continued)
iSHARES®, INC.
Year ended October 31, 2013
| iShares Global ex USD High Yield Corporate Bond ETF | iShares High Yield Corporate | |||||||
NET INVESTMENT INCOME | ||||||||
Interest — unaffiliated | $ | 2,450,722 | $ | 3,400,960 | ||||
Interest — affiliated (Note 2) | 18 | 112 | ||||||
Securities lending income — affiliated (Note 2) | — | 15,239 | ||||||
|
|
|
| |||||
Total investment income | 2,450,740 | 3,416,311 | ||||||
|
|
|
| |||||
EXPENSES | ||||||||
Investment advisory fees (Note 2) | 215,773 | 302,079 | ||||||
|
|
|
| |||||
Total expenses | 215,773 | 302,079 | ||||||
Less investment advisory fees waived (Note 2) | (58,847 | ) | (82,385 | ) | ||||
|
|
|
| |||||
Net expenses | 156,926 | 219,694 | ||||||
|
|
|
| |||||
Net investment income | 2,293,814 | 3,196,617 | ||||||
|
|
|
| |||||
NET REALIZED AND UNREALIZED GAIN (LOSS) | ||||||||
Net realized gain (loss) from: | ||||||||
Investments — unaffiliated | 254,793 | 65,881 | ||||||
Foreign currency transactions | 8,768 | 16,243 | ||||||
|
|
|
| |||||
Net realized gain | 263,561 | 82,124 | ||||||
|
|
|
| |||||
Net change in unrealized appreciation/depreciation on: | ||||||||
Investments | 2,313,493 | 1,687,153 | ||||||
Translation of assets and liabilities in foreign currencies | 6,105 | 9,868 | ||||||
|
|
|
| |||||
Net change in unrealized appreciation/depreciation | 2,319,598 | 1,697,021 | ||||||
|
|
|
| |||||
Net realized and unrealized gain | 2,583,159 | 1,779,145 | ||||||
|
|
|
| |||||
NET INCREASE IN NET ASSETS RESULTING FROM OPERATIONS | $ | 4,876,973 | $ | 4,975,762 | ||||
|
|
|
| |||||
See notes to financial statements.
| 62 | 2013 iSHARES ANNUAL REPORTTO SHAREHOLDERS |
Table of Contents
Statements of Changes in Net Assets
iSHARES®, INC.
| iShares Emerging Markets Corporate Bond ETF | iShares Emerging Markets High Yield Bond ETF | |||||||||||||||
| Year ended October 31, 2013 | Period from to | Year ended October 31, 2013 | Period from to October 31, 2012 | |||||||||||||
INCREASE (DECREASE) IN NET ASSETS | ||||||||||||||||
OPERATIONS: | ||||||||||||||||
Net investment income | $ | 1,262,982 | $ | 265,990 | $ | 12,680,618 | $ | 675,989 | ||||||||
Net realized gain (loss) | (618,461 | ) | 4,611 | (8,733,079 | ) | (23,580 | ) | |||||||||
Net change in unrealized appreciation/depreciation | (1,561,100 | ) | 573,456 | (7,436,270 | ) | (481,624 | ) | |||||||||
|
|
|
|
|
|
|
| |||||||||
Net increase (decrease) in net assets resulting from operations | (916,579 | ) | 844,057 | (3,488,731 | ) | 170,785 | ||||||||||
|
|
|
|
|
|
|
| |||||||||
DISTRIBUTIONS TO SHAREHOLDERS: | ||||||||||||||||
From net investment income | (1,215,670 | ) | (206,428 | ) | (11,875,701 | ) | (469,278 | ) | ||||||||
|
|
|
|
|
|
|
| |||||||||
Total distributions to shareholders | (1,215,670 | ) | (206,428 | ) | (11,875,701 | ) | (469,278 | ) | ||||||||
|
|
|
|
|
|
|
| |||||||||
CAPITAL SHARE TRANSACTIONS: | ||||||||||||||||
Proceeds from shares sold | 21,155,693 | 20,532,606 | 93,145,288 | 166,529,529 | ||||||||||||
Cost of shares redeemed | (4,855,891 | ) | — | (40,407,967 | ) | — | ||||||||||
|
|
|
|
|
|
|
| |||||||||
Net increase in net assets from capital share transactions | 16,299,802 | 20,532,606 | 52,737,321 | 166,529,529 | ||||||||||||
|
|
|
|
|
|
|
| |||||||||
INCREASE IN NET ASSETS | 14,167,553 | 21,170,235 | 37,372,889 | 166,231,036 | ||||||||||||
NET ASSETS | ||||||||||||||||
Beginning of period | 21,170,235 | — | 166,231,036 | — | ||||||||||||
|
|
|
|
|
|
|
| |||||||||
End of period | $ | 35,337,788 | $ | 21,170,235 | $ | 203,603,925 | $ | 166,231,036 | ||||||||
|
|
|
|
|
|
|
| |||||||||
Undistributed net investment income included in net assets at end of period | $ | 106,874 | $ | 59,562 | $ | 1,011,628 | $ | 206,711 | ||||||||
|
|
|
|
|
|
|
| |||||||||
SHARES ISSUED AND REDEEMED | ||||||||||||||||
Shares sold | 400,000 | 400,000 | 1,700,000 | 3,100,000 | ||||||||||||
Shares redeemed | (100,000 | ) | — | (800,000 | ) | — | ||||||||||
|
|
|
|
|
|
|
| |||||||||
Net increase in shares outstanding | 300,000 | 400,000 | 900,000 | 3,100,000 | ||||||||||||
|
|
|
|
|
|
|
| |||||||||
| a | Commencement of operations. |
See notes to financial statements.
FINANCIAL STATEMENTS | 63 |
Table of Contents
Statements of Changes in Net Assets (Continued)
iSHARES®, INC.
| iShares Emerging Markets Local Currency Bond ETF | iShares Global ex USD High Yield Corporate Bond ETF | |||||||||||||||
| Year ended October 31, 2013 | Year ended October 31, 2012 | Year ended October 31, 2013 | Period from to October 31, 2012 (Unaudited) | |||||||||||||
INCREASE (DECREASE) IN NET ASSETS | ||||||||||||||||
OPERATIONS: | ||||||||||||||||
Net investment income | $ | 22,189,749 | $ | 2,196,632 | $ | 2,293,814 | $ | 970,827 | ||||||||
Net realized gain (loss) | (12,303,456 | ) | (1,881,704 | ) | 263,561 | (254,500 | ) | |||||||||
Net change in unrealized appreciation/depreciation | (18,539,293 | ) | 1,298,774 | 2,319,598 | 727,120 | |||||||||||
|
|
|
|
|
|
|
| |||||||||
Net increase (decrease) in net assets resulting from operations | (8,653,000 | ) | 1,613,702 | 4,876,973 | 1,443,447 | |||||||||||
|
|
|
|
|
|
|
| |||||||||
DISTRIBUTIONS TO SHAREHOLDERS: | ||||||||||||||||
From net investment income | (14,179,444 | ) | (642,268 | ) | (1,957,170 | ) | (625,715 | ) | ||||||||
Return of capital | (450,972 | ) | (867,033 | ) | — | — | ||||||||||
|
|
|
|
|
|
|
| |||||||||
Total distributions to shareholders | (14,630,416 | ) | (1,509,301 | ) | (1,957,170 | ) | (625,715 | ) | ||||||||
|
|
|
|
|
|
|
| |||||||||
CAPITAL SHARE TRANSACTIONS: | ||||||||||||||||
Proceeds from shares sold | 473,342,721 | 176,968,127 | 22,229,000 | 25,186,470 | ||||||||||||
Cost of shares redeemed | (19,471,218 | ) | — | — | — | |||||||||||
|
|
|
|
|
|
|
| |||||||||
Net increase in net assets from capital share transactions | 453,871,503 | 176,968,127 | 22,229,000 | �� | 25,186,470 | |||||||||||
|
|
|
|
|
|
|
| |||||||||
INCREASE IN NET ASSETS | 430,588,087 | 177,072,528 | 25,148,803 | 26,004,202 | ||||||||||||
NET ASSETS | ||||||||||||||||
Beginning of period | 207,753,484 | 30,680,956 | 26,004,202 | — | ||||||||||||
|
|
|
|
|
|
|
| |||||||||
End of period | $ | 638,341,571 | $ | 207,753,484 | $ | 51,153,005 | $ | 26,004,202 | ||||||||
|
|
|
|
|
|
|
| |||||||||
Undistributed net investment income included in net assets at end of period | $ | — | $ | — | $ | 484,187 | $ | 165,707 | ||||||||
|
|
|
|
|
|
|
| |||||||||
SHARES ISSUED AND REDEEMED | ||||||||||||||||
Shares sold | 9,000,000 | 3,400,000 | 400,000 | 500,000 | ||||||||||||
Shares redeemed | (400,000 | ) | — | — | — | |||||||||||
|
|
|
|
|
|
|
| |||||||||
Net increase in shares outstanding | 8,600,000 | 3,400,000 | 400,000 | 500,000 | ||||||||||||
|
|
|
|
|
|
|
| |||||||||
| a | Commencement of operations. |
See notes to financial statements.
| 64 | 2013 iSHARES ANNUAL REPORTTO SHAREHOLDERS |
Table of Contents
Statements of Changes in Net Assets (Continued)
iSHARES®, INC.
| iShares Global High Yield Corporate Bond ETF | ||||||||
| Year ended October 31, 2013 | Period from to October 31, 2012 | |||||||
INCREASE (DECREASE) IN NET ASSETS | ||||||||
OPERATIONS: | ||||||||
Net investment income | $ | 3,196,617 | $ | 1,030,285 | ||||
Net realized gain (loss) | 82,124 | (30,820 | ) | |||||
Net change in unrealized appreciation/depreciation | 1,697,021 | 770,847 | ||||||
|
|
|
| |||||
Net increase in net assets resulting from operations | 4,975,762 | 1,770,312 | ||||||
|
|
|
| |||||
DISTRIBUTIONS TO SHAREHOLDERS: | ||||||||
From net investment income | (2,923,699 | ) | (848,343 | ) | ||||
|
|
|
| |||||
Total distributions to shareholders | (2,923,699 | ) | (848,343 | ) | ||||
|
|
|
| |||||
CAPITAL SHARE TRANSACTIONS: | ||||||||
Proceeds from shares sold | 36,671,836 | 35,247,464 | ||||||
|
|
|
| |||||
Net increase in net assets from capital share transactions | 36,671,836 | 35,247,464 | ||||||
|
|
|
| |||||
INCREASE IN NET ASSETS | 38,723,899 | 36,169,433 | ||||||
NET ASSETS | ||||||||
Beginning of period | 36,169,433 | — | ||||||
|
|
|
| |||||
End of period | $ | 74,893,332 | $ | 36,169,433 | ||||
|
|
|
| |||||
Undistributed net investment income included in net assets at end of period | $ | 520,139 | $ | 187,869 | ||||
|
|
|
| |||||
SHARES ISSUED | ||||||||
Shares sold | 700,000 | 700,000 | ||||||
|
|
|
| |||||
Net increase in shares outstanding | 700,000 | 700,000 | ||||||
|
|
|
| |||||
| a | Commencement of operations. |
See notes to financial statements.
FINANCIAL STATEMENTS | 65 |
Table of Contents
iSHARES®, INC.
(For a share outstanding throughout each period)
iShares Emerging Markets Corporate Bond ETF | ||
| Year ended Oct. 31, 2013 | Period from to Oct. 31, 2012 | |||||||
Net asset value, beginning of period | $ | 52.93 | $ | 50.00 | ||||
|
|
|
| |||||
Income from investment operations: | ||||||||
Net investment incomeb | 1.92 | 1.07 | ||||||
Net realized and unrealized gain (loss)c | (2.49 | ) | 2.76 | |||||
|
|
|
| |||||
Total from investment operations | (0.57 | ) | 3.83 | |||||
|
|
|
| |||||
Less distributions from: | ||||||||
Net investment income | (1.88 | ) | (0.90 | ) | ||||
|
|
|
| |||||
Total distributions | (1.88 | ) | (0.90 | ) | ||||
|
|
|
| |||||
Net asset value, end of period | $ | 50.48 | $ | 52.93 | ||||
|
|
|
| |||||
Total return | (1.07 | )% | 7.75 | %d | ||||
|
|
|
| |||||
Ratios/Supplemental data: | ||||||||
Net assets, end of period (000s) | $ | 35,338 | $ | 21,170 | ||||
Ratio of expenses to average net assetse | 0.60 | % | 0.60 | % | ||||
Ratio of net investment income to average net assetse | 3.74 | % | 3.87 | % | ||||
Portfolio turnover ratef | 33 | % | 29 | % | ||||
| a | Commencement of operations. |
| b | Based on average shares outstanding throughout each period. |
| c | The amounts reported for a share outstanding may not accord with the change in aggregate gains and losses in securities for the fiscal period due to the timing of capital share transactions in relation to the fluctuating market values of the Fund’s underlying securities. |
| d | Not annualized. |
| e | Annualized for periods of less than one year. |
| f | Portfolio turnover rates exclude portfolio securities received or delivered as a result of processing capital share transactions in Creation Units. |
See notes to financial statements.
| 66 | 2013 iSHARES ANNUAL REPORTTO SHAREHOLDERS |
Table of Contents
Financial Highlights (Continued)
iSHARES®, INC.
(For a share outstanding throughout each period)
iShares Emerging Markets High Yield Bond ETF | ||
| Year ended Oct. 31, 2013 | Period from to Oct. 31, 2012 | |||||||
Net asset value, beginning of period | $ | 53.62 | $ | 50.02 | ||||
|
|
|
| |||||
Income from investment operations: | ||||||||
Net investment incomeb | 2.97 | 1.60 | ||||||
Net realized and unrealized gain (loss)c | (2.91 | ) | 3.40 | |||||
|
|
|
| |||||
Total from investment operations | 0.06 | 5.00 | ||||||
|
|
|
| |||||
Less distributions from: | ||||||||
Net investment income | (2.78 | ) | (1.40 | ) | ||||
|
|
|
| |||||
Total distributions | (2.78 | ) | (1.40 | ) | ||||
|
|
|
| |||||
Net asset value, end of period | $ | 50.90 | $ | 53.62 | ||||
|
|
|
| |||||
Total return | 0.14 | % | 10.21 | %d | ||||
|
|
|
| |||||
Ratios/Supplemental data: | ||||||||
Net assets, end of period (000s) | $ | 203,604 | $ | 166,231 | ||||
Ratio of expenses to average net assetse | 0.65 | % | 0.65 | % | ||||
Ratio of net investment income to average net assetse | 5.64 | % | 5.34 | % | ||||
Portfolio turnover ratef | 57 | % | 40 | % | ||||
| a | Commencement of operations. |
| b | Based on average shares outstanding throughout each period. |
| c | The amounts reported for a share outstanding may not accord with the change in aggregate gains and losses in securities for the fiscal period due to the timing of capital share transactions in relation to the fluctuating market values of the Fund’s underlying securities. |
| d | Not annualized. |
| e | Annualized for periods of less than one year. |
| f | Portfolio turnover rates exclude portfolio securities received or delivered as a result of processing capital share transactions in Creation Units. |
See notes to financial statements.
FINANCIAL HIGHLIGHTS | 67 |
Table of Contents
Financial Highlights (Continued)
iSHARES®, INC.
(For a share outstanding throughout each period)
iShares Emerging Markets Local Currency Bond ETF | ||
| Year ended Oct. 31, 2013 | Year ended Oct. 31, 2012 | Period from to Oct. 31, 2011 | ||||||||||
Net asset value, beginning of period | $ | 51.94 | $ | 51.13 | $ | 49.85 | ||||||
|
|
|
|
|
| |||||||
Income from investment operations: | ||||||||||||
Net investment incomeb | 2.07 | 2.31 | 0.02 | |||||||||
Net realized and unrealized gain (loss)c | (1.92 | ) | 0.41 | 1.26 | ||||||||
|
|
|
|
|
| |||||||
Total from investment operations | 0.15 | 2.72 | 1.28 | |||||||||
|
|
|
|
|
| |||||||
Less distributions from: | ||||||||||||
Net investment income | (1.39 | ) | (0.81 | ) | — | |||||||
Return of capital | (0.04 | ) | (1.10 | ) | — | |||||||
|
|
|
|
|
| |||||||
Total distributions | (1.43 | ) | (1.91 | ) | — | |||||||
|
|
|
|
|
| |||||||
Net asset value, end of period | $ | 50.66 | $ | 51.94 | $ | 51.13 | ||||||
|
|
|
|
|
| |||||||
Total return | 0.28 | % | 5.48 | % | 2.57 | %d | ||||||
|
|
|
|
|
| |||||||
Ratios/Supplemental data: | ||||||||||||
Net assets, end of period (000s) | $ | 638,342 | $ | 207,753 | $ | 30,681 | ||||||
Ratio of expenses to average net assetse | 0.60 | % | 0.60 | % | 0.60 | % | ||||||
Ratio of net investment income to average net assetse | 4.04 | % | 4.57 | % | 1.21 | % | ||||||
Portfolio turnover ratef | 41 | % | 61 | % | 0 | % | ||||||
| a | Commencement of operations. |
| b | Based on average shares outstanding throughout each period. |
| c | The amounts reported for a share outstanding may not accord with the change in aggregate gains and losses in securities for the fiscal period due to the timing of capital share transactions in relation to the fluctuating market values of the Fund’s underlying securities. |
| d | Not annualized. |
| e | Annualized for periods of less than one year. |
| f | Portfolio turnover rates exclude portfolio securities received or delivered in Creation Units but includes portfolio transactions that are executed as a result of the Fund processing capital share transactions in Creation Units partially for cash in U.S. dollars. Excluding such cash transactions, the portfolio turnover rates for the years ended October 31, 2013 and October 31, 2012 were 39% and 61%, respectively. See Note 4. |
See notes to financial statements.
| 68 | 2013 iSHARES ANNUAL REPORTTO SHAREHOLDERS |
Table of Contents
Financial Highlights (Continued)
iSHARES®, INC.
(For a share outstanding throughout each period)
iShares Global ex USD High Yield Corporate Bond ETF | ||
| Year ended Oct. 31, 2013 | Period from to Oct. 31, 2012 | |||||||
Net asset value, beginning of period | $ | 52.01 | $ | 50.14 | ||||
|
|
|
| |||||
Income from investment operations: | ||||||||
Net investment incomeb | 3.15 | 1.94 | ||||||
Net realized and unrealized gainc | 4.51 | 1.18 | ||||||
|
|
|
| |||||
Total from investment operations | 7.66 | 3.12 | ||||||
|
|
|
| |||||
Less distributions from: | ||||||||
Net investment income | (2.83 | ) | (1.25 | ) | ||||
|
|
|
| |||||
Total distributions | (2.83 | ) | (1.25 | ) | ||||
|
|
|
| |||||
Net asset value, end of period | $ | 56.84 | $ | 52.01 | ||||
|
|
|
| |||||
Total return | 15.20 | % | 6.49 | %d | ||||
|
|
|
| |||||
Ratios/Supplemental data: | ||||||||
Net assets, end of period (000s) | $ | 51,153 | $ | 26,004 | ||||
Ratio of expenses to average net assetse | 0.40 | % | 0.40 | % | ||||
Ratio of expenses to average net assets prior to waived feese | 0.55 | % | 0.55 | % | ||||
Ratio of net investment income to average net assetse | 5.85 | % | 6.92 | % | ||||
Portfolio turnover ratef | 33 | % | 18 | % | ||||
| a | Commencement of operations. |
| b | Based on average shares outstanding throughout each period. |
| c | The amounts reported for a share outstanding may not accord with the change in aggregate gains and losses in securities for the fiscal period due to the timing of capital share transactions in relation to the fluctuating market values of the Fund’s underlying securities. |
| d | Not annualized. |
| e | Annualized for periods of less than one year. |
| f | Portfolio turnover rates exclude portfolio securities received or delivered as a result of processing capital share transactions in Creation Units. |
See notes to financial statements.
FINANCIAL HIGHLIGHTS | 69 |
Table of Contents
Financial Highlights (Continued)
iSHARES®, INC.
(For a share outstanding throughout each period)
iShares Global High Yield Corporate Bond ETF | ||
| Year ended Oct. 31, 2013 | Period from to Oct. 31, 2012 | |||||||
Net asset value, beginning of period | $ | 51.67 | $ | 50.00 | ||||
|
|
|
| |||||
Income from investment operations: | ||||||||
Net investment incomeb | 3.05 | 1.82 | ||||||
Net realized and unrealized gainc | 1.70 | 1.35 | ||||||
|
|
|
| |||||
Total from investment operations | 4.75 | 3.17 | ||||||
|
|
|
| |||||
Less distributions from: | ||||||||
Net investment income | (2.92 | ) | (1.50 | ) | ||||
|
|
|
| |||||
Total distributions | (2.92 | ) | (1.50 | ) | ||||
|
|
|
| |||||
Net asset value, end of period | $ | 53.50 | $ | 51.67 | ||||
|
|
|
| |||||
Total return | 9.50 | % | 6.53 | %d | ||||
|
|
|
| |||||
Ratios/Supplemental data: | ||||||||
Net assets, end of period (000s) | $ | 74,893 | $ | 36,169 | ||||
Ratio of expenses to average net assetse | 0.40 | % | 0.40 | % | ||||
Ratio of expenses to average net assets prior to waived feese | 0.55 | % | 0.55 | % | ||||
Ratio of net investment income to average net assetse | 5.82 | % | 6.28 | % | ||||
Portfolio turnover ratef | 20 | % | 10 | % | ||||
| a | Commencement of operations. |
| b | Based on average shares outstanding throughout each period. |
| c | The amounts reported for a share outstanding may not accord with the change in aggregate gains and losses in securities for the fiscal period due to the timing of capital share transactions in relation to the fluctuating market values of the Fund’s underlying securities. |
| d | Not annualized. |
| e | Annualized for periods of less than one year. |
| f | Portfolio turnover rates exclude portfolio securities received or delivered as a result of processing capital share transactions in Creation Units. |
See notes to financial statements.
| 70 | 2013 iSHARES ANNUAL REPORTTO SHAREHOLDERS |
Table of Contents
iSHARES®, INC.
iShares, Inc. (the “Company”) is registered under the Investment Company Act of 1940, as amended (the “1940 Act”), as an open-end management investment company. The Company was incorporated under the laws of the State of Maryland on September 1, 1994 pursuant to amended and restated Articles of Incorporation.
These financial statements relate only to the following funds (each, a “Fund,” and collectively, the “Funds”):
| iShares Bond ETF | Former Name a | Diversification Classification | ||||
Emerging Markets Corporate | iShares Emerging Markets Corporate Bond Fund | Non-diversified | ||||
Emerging Markets High Yield | iShares Emerging Markets High Yield Bond Fund | Non-diversified | ||||
Emerging Markets Local Currency | iShares Emerging Markets Local Currency Bond Fund | Non-diversified | ||||
Global ex USD High Yield Corporate | iShares Global ex USD High Yield Corporate Bond Fund | Non-diversified | ||||
Global High Yield Corporate | iShares Global High Yield Corporate Bond Fund | Non-diversified | ||||
| a | The Funds changed their names effective July 1, 2013. |
The investment objective of each Fund is to seek investment results that correspond generally to the price and yield performance, before fees and expenses, of its underlying index. The investment adviser uses a “passive” or index approach to try to achieve each Fund’s investment objective.
Non-diversified funds generally hold securities of fewer issuers than diversified funds and may be more susceptible to the risks associated with these particular issuers, or to a single economic, political or regulatory occurrence affecting these issuers.
Each Fund invests in securities of non-U.S. issuers that trade in non-U.S. markets. This involves certain considerations and risks not typically associated with securities of U.S. issuers. Such risks include, but are not limited to: generally less liquid and less efficient securities markets; generally greater price volatility; exchange rate fluctuations and exchange controls; imposition of restrictions on the expatriation of funds or other assets of the Funds; less publicly available information about issuers; the imposition of withholding or other taxes; higher transaction and custody costs; settlement delays and risk of loss attendant in settlement procedures; difficulties in enforcing contractual obligations; less regulation of securities markets; different accounting, disclosure and reporting requirements; more substantial governmental involvement in the economy; higher inflation rates; greater social, economic and political uncertainties; the risk of nationalization or expropriation of assets; and the risk of war. These risks are heightened for investments in emerging market and frontier market countries.
Pursuant to the Company’s organizational documents, the Funds’ officers and directors are indemnified against certain liabilities that may arise out of the performance of their duties to the Funds. Additionally, in the normal course of business, the Funds enter into contracts with service providers that contain general indemnification clauses. The Funds’ maximum exposure under these arrangements is unknown as this would involve future claims that may be made against the Funds that have not yet occurred.
| 1. | SIGNIFICANT ACCOUNTING POLICIES |
The following significant accounting policies are consistently followed by the Funds in the preparation of their financial statements in conformity with accounting principles generally accepted in the United States of America (“U.S. GAAP”). The preparation of financial statements in conformity with U.S. GAAP requires management to make certain estimates and assumptions that affect the reported amounts of assets and liabilities and disclosures of contingent assets and liabilities at the date of the financial statements and the reported amounts of revenue and expenses during the reporting period. Actual results could differ from those estimates.
NOTESTO FINANCIAL STATEMENTS | 71 |
Table of Contents
Notes to Financial Statements (Continued)
iSHARES®, INC.
SECURITY VALUATION
Each Fund’s investments are valued at fair value each day that the Fund’s listing exchange is open and, for financial reporting purposes, as of the report date should the reporting period end on a day that the Fund’s listing exchange is not open. U.S. GAAP defines fair value as the price a fund would receive to sell an asset or pay to transfer a liability in an orderly transaction between market participants at the measurement date. The BlackRock Global Valuation Methodologies Committee (the “Global Valuation Committee”) provides oversight of the valuation of investments for the Funds. The investments of each Fund are valued pursuant to policies and procedures developed by the Global Valuation Committee and approved by the Board of Directors of the Company (the “Board”).
| • | Fixed income investments are valued at the last available bid price received from independent pricing services. In determining the value of a fixed income investment, pricing services may use certain information with respect to transactions in such investments, quotations from dealers, pricing matrixes, market transactions in comparable investments, various relationships observed in the market between investments, and calculated yield measures. |
| • | Open-end U.S. mutual funds are valued at that day’s published net asset value (NAV). |
In the event that application of these methods of valuation results in a price for an investment which is deemed not to be representative of the fair value of such investment or if a price is not available, the investment will be valued based upon other available factors deemed relevant by the Global Valuation Committee, in accordance with policies approved by the Board. These factors include but are not limited to (i) attributes specific to the investment; (ii) the principal market for the investment; (iii) the customary participants in the principal market for the investment; (iv) data assumptions by market participants for the investment, if reasonably available; (v) quoted prices for similar investments in active markets; and (vi) other factors, such as future cash flows, interest rates, yield curves, volatilities, prepayment speeds, loss severities, credit risks and/or default rates. Valuations based on such factors are reported to the Board on a quarterly basis.
The Global Valuation Committee employs various methods for calibrating valuation approaches for investments where an active market does not exist, including regular due diligence of the Company’s pricing vendors, a regular review of key inputs and assumptions, transactional back-testing or disposition analysis to compare unrealized gains and losses to realized gains and losses, reviews of missing or stale prices, reviews of large movements in market values, and reviews of market related activity.
Fair value pricing could result in a difference between the prices used to calculate a Fund’s net asset value and the prices used by the Fund’s underlying index, which in turn could result in a difference between the Fund’s performance and the performance of the Fund’s underlying index.
Various inputs are used in determining the fair value of financial instruments. Inputs may be based on independent market data (“observable inputs”) or they may be internally developed (“unobservable inputs”). These inputs are categorized into a disclosure hierarchy consisting of three broad levels for financial reporting purposes. The level of a value determined for a financial instrument within the fair value hierarchy is based on the lowest level of any input that is significant to the fair value measurement in its entirety. The categorization of a value determined for a financial instrument within the hierarchy is based upon the pricing transparency of the instrument and is not necessarily an indication of the risk associated with investing in the instrument. The three levels of the fair value hierarchy are as follows:
| • | Level 1 — Unadjusted quoted prices in active markets for identical assets or liabilities; |
| • | Level 2 — Inputs other than quoted prices included within Level 1 that are observable for the asset or liability either directly or indirectly, including quoted prices for similar assets or liabilities in active markets, quoted prices for identical or similar assets or liabilities in markets that are not considered to be active, inputs other than quoted prices that are observable for |
| 72 | 2013 iSHARES ANNUAL REPORTTO SHAREHOLDERS |
Table of Contents
Notes to Financial Statements (Continued)
iSHARES®, INC.
the asset or liability (such as exchange rates, financing terms, interest rates, yield curves, volatilities, prepayment speeds, loss severities, credit risks and default rates) or other market-corroborated inputs; and |
| • | Level 3 — Unobservable inputs for the asset or liability, including the Global Valuation Committee’s assumptions used in determining the fair value of investments. |
Changes in valuation techniques may result in transfers in or out of an assigned level within the disclosure hierarchy. In accordance with the Company’s policy, transfers between different levels of the fair value hierarchy are deemed to have occurred as of the beginning of the reporting period.
The following table summarizes the value of each of the Funds’ investments according to the fair value hierarchy as of October 31, 2013. The breakdown of each Fund’s investments into major categories is disclosed in its respective schedule of investments.
iShares Bond ETF and
| Investments | |||||||||||||||
| Level 1 | Level 2 | Level 3 | Total | |||||||||||||
Emerging Markets Corporate | ||||||||||||||||
Assets: | ||||||||||||||||
Corporate Bonds & Notes | $ | — | $ | 17,738,300 | $ | — | $ | 17,738,300 | ||||||||
Foreign Agency Obligations | — | 16,968,555 | — | 16,968,555 | ||||||||||||
Money Market Funds | 185,824 | — | — | 185,824 | ||||||||||||
|
|
|
|
|
|
|
| |||||||||
| $ | 185,824 | $ | 34,706,855 | $ | — | $ | 34,892,679 | |||||||||
|
|
|
|
|
|
|
| |||||||||
Emerging Markets High Yield | ||||||||||||||||
Assets: | ||||||||||||||||
Corporate Bonds & Notes | $ | — | $ | 55,643,296 | $ | — | $ | 55,643,296 | ||||||||
Foreign Agency Obligations | — | 26,583,850 | — | 26,583,850 | ||||||||||||
Foreign Government Obligations | — | 115,766,666 | — | 115,766,666 | ||||||||||||
Money Market Funds | 1,141,039 | — | — | 1,141,039 | ||||||||||||
|
|
|
|
|
|
|
| |||||||||
| $ | 1,141,039 | $ | 197,993,812 | $ | — | $ | 199,134,851 | |||||||||
|
|
|
|
|
|
|
| |||||||||
Emerging Markets Local Currency | ||||||||||||||||
Assets: | ||||||||||||||||
Foreign Government Obligations | $ | — | $ | 623,781,633 | $ | — | $ | 623,781,633 | ||||||||
Money Market Funds | 111,048 | — | — | 111,048 | ||||||||||||
|
|
|
|
|
|
|
| |||||||||
| $ | 111,048 | $ | 623,781,633 | $ | — | $ | 623,892,681 | |||||||||
|
|
|
|
|
|
|
| |||||||||
Global ex USD High Yield Corporate | ||||||||||||||||
Assets: | ||||||||||||||||
Corporate Bonds & Notes | $ | — | $ | 47,975,361 | $ | 0 | a | $ | 47,975,361 | |||||||
Foreign Agency Obligations | — | 278,947 | — | 278,947 | ||||||||||||
Money Market Funds | 6,507 | — | — | 6,507 | ||||||||||||
|
|
|
|
|
|
|
| |||||||||
| $ | 6,507 | $ | 48,254,308 | $ | 0 | a | $ | 48,260,815 | ||||||||
|
|
|
|
|
|
|
| |||||||||
NOTES TO FINANCIAL STATEMENTS | 73 |
Table of Contents
Notes to Financial Statements (Continued)
iSHARES®, INC.
iShares Bond ETF and
| Investments | |||||||||||||||
| Level 1 | Level 2 | Level 3 | Total | |||||||||||||
Global High Yield Corporate | ||||||||||||||||
Assets: | ||||||||||||||||
Corporate Bonds & Notes | $ | — | $ | 72,712,306 | $ | — | $ | 72,712,306 | ||||||||
Foreign Agency Obligations | — | 141,773 | — | 141,773 | ||||||||||||
Money Market Funds | 12,289,862 | — | — | 12,289,862 | ||||||||||||
|
|
|
|
|
|
|
| |||||||||
| $ | 12,289,862 | $ | 72,854,079 | $ | — | $ | 85,143,941 | |||||||||
|
|
|
|
|
|
|
| |||||||||
| a | Rounds to less than $1. |
SECURITY TRANSACTIONS AND INCOME RECOGNITION
Security transactions are accounted for on trade date. Realized gains and losses on investment transactions are determined using the specific identification method. Interest income, including amortization and accretion of premiums and discounts on debt securities, is recognized daily on the accrual basis.
FOREIGN CURRENCY TRANSLATION
The accounting records of the Funds are maintained in U.S. dollars. Foreign currencies, as well as investment securities and other assets and liabilities denominated in foreign currencies, are translated into U.S. dollars using exchange rates deemed appropriate by the investment adviser. Purchases and sales of securities, income receipts and expense payments are translated into U.S. dollars on the respective dates of such transactions.
Each Fund does not isolate the effect of fluctuations in foreign exchange rates from the effect of fluctuations in the market prices of securities. Such fluctuations are reflected by the Funds as a component of realized and unrealized gains and losses from investments for financial reporting purposes.
FOREIGN TAXES
The Funds may be subject to foreign taxes (a portion of which may be reclaimable) on income, stock dividends, capital gains on investments, or certain foreign currency transactions. All foreign taxes are recorded in accordance with the applicable foreign tax regulations and rates that exist in the foreign jurisdictions in which the Funds invest. These foreign taxes, if any, are paid by the Funds and are reflected in their statements of operations as follows: foreign taxes withheld at source are presented as a reduction of income, foreign taxes on securities lending income are presented as a reduction of securities lending income, foreign taxes on stock dividends are presented as “other foreign taxes,” and foreign taxes on capital gains from sales of investments and foreign taxes on foreign currency transactions are included in their respective net realized gain (loss) categories. Foreign taxes payable or deferred as of October 31, 2013, if any, are disclosed in the Funds’ statements of assets and liabilities.
DISTRIBUTIONS TO SHAREHOLDERS
Dividends and distributions paid by each Fund are recorded on the ex-dividend dates. Distributions are determined on a tax basis and may differ from net investment income and net realized capital gains for financial reporting purposes. Dividends and distributions are paid in U.S. dollars and cannot be automatically reinvested in additional shares of the Funds.
| 74 | 2013 iSHARES ANNUAL REPORTTO SHAREHOLDERS |
Table of Contents
Notes to Financial Statements (Continued)
iSHARES®, INC.
FEDERAL INCOME TAXES
Each Fund is treated as an entity separate from the Company’s other funds for federal income tax purposes. It is the policy of each Fund to qualify as a regulated investment company by complying with the provisions applicable to regulated investment companies, as defined under Subchapter M of the Internal Revenue Code of 1986, as amended, and to annually distribute substantially all of its ordinary income and any net capital gains (taking into account any capital loss carryforwards) sufficient to relieve it from all, or substantially all, federal income and excise taxes. Accordingly, no provision for federal income taxes is required.
RECENT ACCOUNTING STANDARD
In December 2011, the Financial Accounting Standards Board issued guidance to enhance current disclosure requirements on offsetting of certain assets and liabilities and enable financial statement users to compare financial statements prepared under U.S. GAAP and International Financial Reporting Standards (IFRS). The new disclosures are required for investments and derivative financial instruments subject to master netting agreements or similar agreements and require an entity to disclose both gross and net information about such investments and transactions eligible for offset in the statement of assets and liabilities. The scope of the disclosure requirements for offsetting will be limited to certain derivative instruments and securities lending transactions. In addition, the standard requires disclosure of collateral received and posted in connection with master netting agreements or similar agreements. The guidance is effective for financial statements for fiscal years beginning after January 1, 2013, and interim periods within those fiscal years. Management is evaluating the impact of this guidance on the Funds’ financial statements and disclosures.
| 2. | INVESTMENT ADVISORY AGREEMENT AND OTHER TRANSACTIONS WITH AFFILIATES |
Pursuant to an Investment Advisory Agreement with the Company, BlackRock Fund Advisors (“BFA”) manages the investment of each Fund’s assets. BFA is a California corporation indirectly owned by BlackRock, Inc. (“BlackRock”). Under the Investment Advisory Agreement, BFA is responsible for substantially all expenses of the Funds, except interest, taxes, brokerage commissions and other expenses connected with the execution of portfolio transactions, distribution fees, litigation expenses and any extraordinary expenses.
BFA has entered into a sub-advisory agreement with BlackRock International Limited (the “Sub-Advisor”), an affiliate of BFA, under which BFA pays the Sub-Advisor for services it provides to the iShares Emerging Markets Local Currency Bond ETF, iShares Global ex USD High Yield Corporate Bond ETF and iShares Global High Yield Corporate Bond ETF.
For its investment advisory services to each Fund, BFA is entitled to an annual investment advisory fee based on the average daily net assets of each Fund as follows:
| iShares Bond ETF | Investment Advisory Fee | |||
Emerging Markets Corporate | 0.60 | % | ||
Emerging Markets High Yield | 0.65 | |||
Emerging Markets Local Currency | 0.60 | |||
Global ex USD High Yield Corporate | 0.55 | |||
Global High Yield Corporate | 0.55 | |||
NOTES TO FINANCIAL STATEMENTS | 75 |
Table of Contents
Notes to Financial Statements (Continued)
iSHARES®, INC.
BFA has contractually agreed to waive a portion of its investment advisory fees for the iShares Global ex USD High Yield Corporate Bond ETF and the iShares Global High Yield Corporate Bond ETF through December 31, 2014 in order to limit total annual operating expenses to 0.40% of average daily net assets.
The U.S. Securities and Exchange Commission has issued an exemptive order which permits BlackRock Institutional Trust Company, N.A. (“BTC”), an affiliate of BFA, to serve as securities lending agent for the Funds, subject to applicable conditions. Securities lending income is equal to the total of income earned from the reinvestment of cash collateral, and any fees or other payments to and from borrowers of securities. The Funds retain a portion of securities lending income and remit a remaining portion to BTC as compensation for its services as securities lending agent. The Funds benefit from a borrower default indemnity provided by BlackRock. As securities lending agent, BTC bears all operational costs directly related to securities lending as well as the cost of borrower default indemnification. BTC is also responsible for fees and expenses incurred by each Fund as a result of the investment of cash collateral received for securities on loan in a money market fund managed by BFA or an affiliate.
For the year ended October 31, 2013, each Fund retained 65% of securities lending income and paid a fee to BTC equal to 35% of such income in the amounts as follows:
| iShares Bond ETF | Securities Lending Agent Fees | |||
Emerging Markets High Yield | $ | 27 | ||
Global High Yield Corporate | 8,206 | |||
BlackRock Investments, LLC, an affiliate of BFA, is the distributor for each Fund. Pursuant to the distribution agreement, BFA is responsible for any fees or expenses for distribution services provided to the Funds.
Each Fund may invest its positive cash balances in certain money market funds managed by BFA or an affiliate. The income earned on these temporary cash investments is included in “Interest – affiliated” in the statements of operations.
The PNC Financial Services Group, Inc. is the largest stockholder of BlackRock and is considered to be an affiliate of the Funds for 1940 Act purposes.
Certain directors and officers of the Company are also officers of BTC and/or BFA.
| 3. | INVESTMENT PORTFOLIO TRANSACTIONS |
Purchases and sales of investments (excluding in-kind transactions and short-term investments) for the year ended October 31, 2013 were as follows:
| iShares Bond ETF | Purchases | Sales | ||||||
Emerging Markets Corporate | $ | 12,821,245 | $ | 10,662,595 | ||||
Emerging Markets High Yield | 128,286,826 | 122,024,461 | ||||||
Emerging Markets Local Currency | 600,508,624 | 190,377,840 | ||||||
Global ex USD High Yield Corporate | 28,413,138 | 12,595,186 | ||||||
Global High Yield Corporate | 20,429,006 | 10,752,790 | ||||||
| 76 | 2013 iSHARES ANNUAL REPORTTO SHAREHOLDERS |
Table of Contents
Notes to Financial Statements (Continued)
iSHARES®, INC.
In-kind transactions (see Note 4) for the year ended October 31, 2013 were as follows:
| iShares Bond ETF | In-kind Purchases | In-kind Sales | ||||||
Emerging Markets Corporate | $ | 18,316,285 | $ | 3,944,366 | ||||
Emerging Markets High Yield | 89,868,146 | 39,144,643 | ||||||
Emerging Markets Local Currency | 14,608,976 | — | ||||||
Global ex USD High Yield Corporate | 4,813,435 | — | ||||||
Global High Yield Corporate | 26,421,656 | — | ||||||
| 4. | CAPITAL SHARE TRANSACTIONS |
Capital shares are issued and redeemed by each Fund only in aggregations of a specified number of shares or multiples thereof (“Creation Units”) at net asset value. Except when aggregated in Creation Units, shares of each Fund are not redeemable. Transactions in capital shares for each Fund are disclosed in detail in the statements of changes in net assets.
The consideration for the purchase of Creation Units of a fund in the Company generally consists of the in-kind deposit of a designated portfolio of securities and a specified amount of cash. Certain funds in the Company may be offered in Creation Units solely or partially for cash in U.S. dollars. Investors purchasing and redeeming Creation Units may pay a purchase transaction fee and a redemption transaction fee directly to State Street Bank and Trust Company, the Company’s administrator, to offset transfer and other transaction costs associated with the issuance and redemption of Creation Units, including Creation Units for cash. Investors transacting in Creation Units for cash may also pay an additional variable charge to compensate the relevant fund for certain transaction costs (i.e., stamp taxes, taxes on currency or other financial transactions, and brokerage costs) and market impact expenses relating to investing in portfolio securities.
| 5. | LOANS OF PORTFOLIO SECURITIES |
Each Fund may lend its investment securities to approved borrowers, such as brokers, dealers and other financial institutions. The borrower pledges and maintains with the Fund collateral consisting of cash, an irrevocable letter of credit issued by a bank, or securities issued or guaranteed by the U.S. government. The initial collateral received by each Fund is required to have a value of at least 102% of the current value of the loaned securities plus the interest accrued on such securities, if any, for securities traded on U.S. exchanges and a value of at least 105% for all other securities. The collateral is maintained thereafter, at a value equal to at least 100% of the current value of the securities on loan plus accrued interest, if any. The market value of the loaned securities is determined at the close of each business day of the Funds and any additional required collateral is delivered to the Funds on the next business day. Any securities lending cash collateral may be reinvested in certain short-term instruments either directly on behalf of a fund or through one or more joint accounts or money market funds, including those managed by BFA or its affiliates.
As of October 31, 2013, any securities on loan were collateralized by cash. The cash collateral received was invested in money market funds managed by BFA. The value of any securities on loan as of October 31, 2013 and the value of the related collateral are disclosed in the statements of assets and liabilities. Securities lending income, as disclosed in the statements of operations, represents the income earned from the investment of the cash collateral, net of fees and other payments to and from borrowers, and less the fees paid to BTC as securities lending agent.
The risks of securities lending include the risk that the borrower may not provide additional collateral when required or may not return the securities when due. To mitigate these risks, the Funds benefit from a borrower default indemnity provided by
NOTES TO FINANCIAL STATEMENTS | 77 |
Table of Contents
Notes to Financial Statements (Continued)
iSHARES®, INC.
BlackRock. BlackRock’s indemnity allows for full replacement of securities lent. Each Fund could suffer a loss if the value of the investments purchased with cash collateral falls below the value of the cash collateral received.
| 6. | INCOME TAX INFORMATION |
U.S. GAAP requires that certain components of net assets be adjusted to reflect permanent differences between financial and tax reporting. These reclassifications have no effect on net assets or net asset values per share. The following permanent differences as of October 31, 2013, attributable to foreign currency transactions and realized gains (losses) from in-kind redemptions, were reclassified to the following accounts:
| iShares Bond ETF | Paid-in Capital | Undistributed Net Investment Income/Distributions in Excess of Net Investment Income | Undistributed Net Realized Gain/Accumulated Net Realized Loss | |||||||||
Emerging Markets Corporate | $ | (431,832 | ) | $ | — | $ | 431,832 | |||||
Emerging Markets High Yield | (1,912,031 | ) | — | 1,912,031 | ||||||||
Emerging Markets Local Currency | — | (8,010,305 | ) | 8,010,305 | ||||||||
Global ex USD High Yield Corporate | — | (18,164 | ) | 18,164 | ||||||||
Global High Yield Corporate | — | 59,352 | (59,352 | ) | ||||||||
The tax character of distributions paid during the years ended October 31, 2013 and October 31, 2012 was as follows:
| iShares Bond ETF | 2013 | 2012 | ||||||
Emerging Markets Corporate | ||||||||
Ordinary income | $ | 1,215,670 | $ | 206,428 | ||||
|
|
|
| |||||
Emerging Markets High Yield | ||||||||
Ordinary income | $ | 11,875,701 | $ | 469,278 | ||||
|
|
|
| |||||
Emerging Markets Local Currency | ||||||||
Ordinary income | $ | 14,179,444 | $ | 642,268 | ||||
Return of capital | 450,972 | 867,033 | ||||||
|
|
|
| |||||
| $ | 14,630,416 | $ | 1,509,301 | |||||
|
|
|
| |||||
Global ex USD High Yield Corporate | ||||||||
Ordinary income | $ | 1,957,170 | $ | 625,715 | ||||
|
|
|
| |||||
Global High Yield Corporate | ||||||||
Ordinary income | $ | 2,923,699 | $ | 848,343 | ||||
|
|
|
| |||||
| 78 | 2013 iSHARES ANNUAL REPORTTO SHAREHOLDERS |
Table of Contents
Notes to Financial Statements (Continued)
iSHARES®, INC.
As of October 31, 2013, the tax components of accumulated net earnings (losses) were as follows:
iShares Bond ETF | Undistributed | Undistributed | Capital Loss | Net Unrealized | Total | |||||||||||||||
Emerging Markets Corporate | $ | 106,874 | $ | — | $ | (177,446 | ) | $ | (992,216 | ) | $ | (1,062,788 | ) | |||||||
Emerging Markets High Yield | 1,011,628 | — | (6,533,856 | ) | (8,228,666 | ) | (13,750,894 | ) | ||||||||||||
Emerging Markets Local Currency | — | — | (2,413,710 | ) | (18,730,847 | ) | (21,144,557 | ) | ||||||||||||
Global ex USD High Yield Corporate | 588,260 | 102,557 | — | 3,046,718 | 3,737,535 | |||||||||||||||
Global High Yield Corporate | 520,139 | — | (13,975 | ) | 2,467,868 | 2,974,032 | ||||||||||||||
| a | The difference between book-basis and tax-basis unrealized gains (losses) was attributable primarily to the tax deferral of losses on wash sales. |
As of October 31, 2013, the Funds had non-expiring capital loss carryforwards available to offset future realized capital gains as follows:
| iShares Bond ETF | Non- Expiring | |||
Emerging Markets Corporate | $ | 177,446 | ||
Emerging Markets High Yield | 6,533,856 | |||
Emerging Markets Local Currency | 2,413,710 | |||
Global High Yield Corporate | 13,975 | |||
For the year ended October 31, 2013, the Funds utilized their capital loss carryforwards as follows:
| iShares Bond ETF | Utilized | |||
Global ex USD High Yield Corporate | $ | 75,095 | ||
Global High Yield Corporate | 22,772 | |||
As of October 31, 2013, gross unrealized appreciation and gross unrealized depreciation based on cost for federal income tax purposes were as follows:
| iShares Bond ETF | Tax Cost | Gross Unrealized Appreciation | Gross Unrealized Depreciation | Net Unrealized Appreciation (Depreciation) | ||||||||||||
Emerging Markets Corporate | $ | 35,884,895 | $ | 243,431 | $ | (1,235,647 | ) | $ | (992,216 | ) | ||||||
Emerging Markets High Yield | 207,363,517 | 1,437,626 | (9,666,292 | ) | (8,228,666 | ) | ||||||||||
Emerging Markets Local Currency | 642,722,409 | 13,847,438 | (32,677,166 | ) | (18,829,728 | ) | ||||||||||
Global ex USD High Yield Corporate | 45,232,104 | 3,294,086 | (265,375 | ) | 3,028,711 | |||||||||||
Global High Yield Corporate | 82,689,695 | 3,017,970 | (563,724 | ) | 2,454,246 | |||||||||||
Management has reviewed the tax positions as of October 31, 2013, inclusive of the open tax return years, and has determined that no provision for income tax is required in the Funds’ financial statements.
NOTES TO FINANCIAL STATEMENTS | 79 |
Table of Contents
Notes to Financial Statements (Continued)
iSHARES®, INC.
| 7. | SUBSEQUENT EVENTS |
Management has evaluated the impact of all subsequent events on the Funds through the date the financial statements were available to be issued and has determined that there were no subsequent events requiring adjustment or disclosure in the financial statements.
| 80 | 2013 iSHARES ANNUAL REPORTTO SHAREHOLDERS |
Table of Contents
Report of Independent Registered Public Accounting Firm
To the Shareholders and Board of Directors of
iShares, Inc:
In our opinion, the accompanying statements of assets and liabilities, including the schedules of investments, and the related statements of operations and of changes in net assets and the financial highlights present fairly, in all material respects, the financial position of the iShares Emerging Markets Corporate Bond ETF, iShares Emerging Markets High Yield Bond ETF, iShares Emerging Markets Local Currency Bond ETF, iShares Global ex USD High Yield Corporate Bond ETF and iShares Global High Yield Corporate Bond ETF (the “Funds”), at October 31, 2013, the results of each of their operations, the changes in each of their net assets and their financial highlights for each of the periods presented, in conformity with accounting principles generally accepted in the United States of America. These financial statements and financial highlights (hereafter referred to as “financial statements”) are the responsibility of the Funds’ management; our responsibility is to express an opinion on these financial statements based on our audits. We conducted our audits of these financial statements in accordance with the standards of the Public Company Accounting Oversight Board (United States). Those standards require that we plan and perform the audit to obtain reasonable assurance about whether the financial statements are free of material misstatement. An audit includes examining, on a test basis, evidence supporting the amounts and disclosures in the financial statements, assessing the accounting principles used and significant estimates made by management, and evaluating the overall financial statement presentation. We believe that our audits, which included confirmation of securities at October 31, 2013 by correspondence with the custodian, transfer agent and brokers, provide a reasonable basis for our opinion.
PricewaterhouseCoopers LLP
San Francisco, California
December 20, 2013
REPORT OF INDEPENDENT REGISTERED PUBLIC ACCOUNTING FIRM | 81 |
Table of Contents
iSHARES®, INC.
For the fiscal year ended October 31, 2013, the Funds earned foreign source income and paid foreign taxes which they intend to pass through to their shareholders pursuant to Section 853 of the Internal Revenue Code (the “Code”) as follows:
| iShares Bond ETF | Foreign Source Income Earned | Foreign Taxes Paid | ||||||
Emerging Markets Corporate | $ | 1,376,159 | $ | — | ||||
Emerging Markets High Yield | 13,625,827 | — | ||||||
Emerging Markets Local Currency | 26,881,634 | 1,393,466 | ||||||
Global ex USD High Yield Corporate | 2,429,786 | — | ||||||
Under Section 871(k)(1)(C) of the Code, the Funds hereby designate the following maximum amounts allowable as interest-related dividends for the fiscal year ended October 31, 2013:
| iShares Bond ETF | Interest- Related Dividends | |||
Emerging Markets Corporate | $ | 49,568 | ||
Emerging Markets High Yield | 445,005 | |||
Global ex USD High Yield Corporate | 14,183 | |||
Global High Yield Corporate | 2,036,212 | |||
| 82 | 2013 iSHARES ANNUAL REPORTTO SHAREHOLDERS |
Table of Contents
Board Review and Approval of Investment Advisory
Contract
iSHARES®, INC.
I. iShares Emerging Markets Corporate Bond ETF and iShares Emerging Markets High Yield Bond ETF.
Under Section 15(c) of the Investment Company Act of 1940 (the “1940 Act”), the Company’s Board of Directors (the “Board”), including a majority of Directors who are not “interested persons” of the Company (as that term is defined in the 1940 Act) (the “Independent Directors”), is required annually to consider and approve the Investment Advisory Contract between the Company and BFA (the “Advisory Contract”) on behalf of the Funds. The Independent Directors requested, and BFA provided, such information as the Independent Directors, with advice from independent counsel, deemed reasonably necessary to evaluate the Advisory Contract. A committee of Independent Directors (the “15(c) Committee”), with independent counsel, met with management on March 7, 2013, April 23, 2013, and May 3, 2013, to discuss the types of information the Independent Directors required and the manner in which management would organize and present such information. At a meeting held on May 16, 2013, management presented preliminary information to the Board relating to the continuance of the Advisory Contract, and the Board, including the Independent Directors, reviewed and discussed such information at length. The Independent Directors requested from management certain additional information, and the 15(c) Committee met with management on June 5, 2013, to discuss the additional requests. At a meeting held on June 10-11, 2013, the Board, including the Independent Directors, reviewed the additional information provided by management in response to these requests. The Board, including a majority of the Independent Directors, approved the continuance of the Advisory Contract for the Funds, based on a review of qualitative and quantitative information provided by BFA, including the supplemental information management provided at the request of the Independent Directors. The Board noted its satisfaction with the extent and quality of information provided and its frequent interactions with management, as well as the detailed responses and other information provided by BFA. The Independent Directors were advised by their independent counsel throughout the process. In approving the Advisory Contract for the Funds, the Board, including the Independent Directors, considered the following factors, no one of which was controlling, and reached the following conclusions:
Expenses and Performance of the Funds — The Board reviewed statistical information prepared by Lipper Inc. (“Lipper”), an independent provider of investment company data, regarding the expense ratio components, including actual advisory fees, waivers/reimbursements, and gross and net total expenses of each Fund in comparison with the same information for other registered investment companies objectively selected by Lipper as comprising such Fund’s applicable peer group pursuant to Lipper’s proprietary methodology, and any registered funds that would otherwise have been excluded from Lipper’s comparison group because of the size, sponsor, inception date, or other differentiating factors included in Lipper’s proprietary selection methodology, but that were nonetheless included at the request of BFA (the “Lipper Group”). Because there are few, if any, exchange traded funds or index funds that track indexes similar to those tracked by the Funds, the Lipper Group included in part mutual funds, closed-end funds, exchange traded funds, and/or funds with differing investment objective classifications, investment focuses and other characteristics (e.g., actively managed funds and funds sponsored by “at cost” service providers), as applicable. In support of its review of the statistical information, the Board was provided with a detailed description of the methodology used by Lipper to determine the applicable Lipper Groups and to prepare this information. The Board also received a detailed explanation from BFA regarding its rationale for including funds that had been excluded from Lipper’s consideration due to Lipper’s methodology parameters, as well as information showing the effect of including these additional funds in the analysis. The Board further noted that due to the limitations in providing comparable funds in the various Lipper Groups, the statistical information provided in the Lipper Report may or may not provide meaningful direct comparisons to the Funds.
The Board also noted that the investment advisory fee rates and overall expenses for the Funds compared favorably to the investment advisory fee rates and overall expenses of the funds in their respective Lipper Group. The Board further noted that the iShares Emerging Markets Corporate Bond Fund and the iShares Emerging Markets High Yield Bond Fund ranked in the fourth and fifth Lipper Quintiles, respectively, for expenses when compared to a subset of the Lipper Group identified as pure index funds.
BOARD REVIEWAND APPROVALOF INVESTMENT ADVISORY CONTRACT | 83 |
Table of Contents
Board Review and Approval of Investment Advisory
Contract (Continued)
iSHARES®, INC.
In addition, the Board reviewed statistical information prepared by Lipper regarding the performance of each Fund for the one-, three-, five-, ten-year, and since inception periods, as applicable, and the “last quarter” period ended December 31, 2012, and a comparison of each Fund’s performance to its performance benchmark index for the same periods. To the extent that any of the comparison funds included in the Lipper Group track the same index as any particular Fund, Lipper also provided, and the Board reviewed, a comparison of such Fund’s performance to that of such relevant comparison funds for the same periods. The Board noted that the Funds generally performed in line with their respective performance benchmark indexes over the relevant periods. In considering this information, the Board noted that the Lipper Group may include funds that are not exchange traded funds or index funds, and that may have different investment objectives and/or benchmarks from the Funds. In addition, the Board noted that each Fund seeks to track its own benchmark index and that, during the prior year, the Board received periodic reports on the Funds’ performance in comparison with their relevant benchmark indexes. Such periodic comparative performance information, including detailed information on certain specific iShares funds requested by the Board, was also considered.
Based on this review, the other factors considered at the meeting, and their general knowledge of mutual fund pricing, the Board concluded that the investment advisory fee rate and expense level and the historical performance of each Fund supported the Board’s approval of the continuance of the Advisory Contract for the coming year.
Nature, Extent and Quality of Services Provided by BFA — Based on management’s representations, including information about recent and proposed enhancements to the iShares business, including with respect to shareholder servicing and support, the Board expected that there would be no diminution in the scope of services required of or provided by BFA under the Advisory Contract for the coming year as compared to the scope of services provided by BFA during prior years. In reviewing the scope of these services, the Board considered BFA’s investment philosophy and experience, noting that BFA and its affiliates have committed significant resources over time, including during the past year, to supporting the Funds and their shareholders. The Board acknowledged that resources to support the iShares funds and their shareholders have been added or enhanced since BlackRock’s acquisition of BFA in December 2009, including in such areas as investor education, product management, customized portfolio consulting support, and capital markets support. The Board also considered BFA’s compliance program and its compliance record with respect to the Funds. In that regard, the Board noted that BFA reports to the Board about portfolio management and compliance matters on a periodic basis in connection with regularly scheduled meetings of the Board, and on other occasions as necessary and appropriate, and has provided information and made appropriate officers available as needed to provide further assistance with these matters. The Board also reviewed the background and experience of the persons responsible for the day-to-day management of the Funds. In addition to the above considerations, the Board reviewed and considered detailed presentations regarding BFA’s investment and risk management processes and strategies provided at the June 10-11, 2013 meeting and throughout the previous year, and matters related to BFA’s portfolio compliance policies and procedures. The Board noted that each Fund had met its investment objective consistently since its respective inception date.
Based on review of this information, and the performance information discussed above, the Board concluded that the nature, extent and quality of services provided by BFA to the Funds under the Advisory Contract supported the Board’s approval of the continuance of the Advisory Contract for the coming year.
Costs of Services Provided to the Funds and Profits Realized by BFA and its Affiliates — The Board reviewed information about the profitability to BlackRock of the Funds based on the fees payable to BFA and its affiliates (including fees under the Advisory Contract), and all other sources of revenue and expense to BFA and its affiliates from the Funds’ operations for the last calendar year. The Board reviewed BlackRock’s profitability methodology for the iShares funds, noting that the 15(c) Committee had focused on the methodology and proposed presentation during its meetings. The Board discussed the sources of direct and ancillary revenue with management, including the revenues to BTC from securities lending by the Funds. The Board also discussed BFA’s profit margin as reflected in the Funds’ profitability analyses and reviewed information regarding economies of scale (as discussed below). Based on this review, the Board concluded that the profits realized by BFA and its affiliates under the
| 84 | 2013 iSHARES ANNUAL REPORTTO SHAREHOLDERS |
Table of Contents
Board Review and Approval of Investment Advisory
Contract (Continued)
iSHARES®, INC.
Advisory Contract and from other relationships between the Funds and BFA and/or its affiliates, if any, were within a reasonable range in light of the factors considered.
Economies of Scale — The Board reviewed information regarding economies of scale or other efficiencies that may result from increases in the Funds’ assets, noting that the issue of economies of scale had been focused on extensively by the 15(c) Committee during its meetings and addressed by management. The Board and the 15(c) Committee reviewed information provided by BFA regarding scale benefits shared with the iShares funds through relatively low fee rates established at inception, breakpoints, waivers, or other fee reductions, as well as through additional investment in the iShares business and the provision of improved or additional infrastructure and services to the iShares funds and their shareholders. The Board and the 15(c) Committee received information regarding BlackRock’s historical profitability, including BFA’s and its affiliates’ costs in providing services. The cost information distinguished between fixed and variable costs, and explained how the nature of such costs may impact the existence of scale benefits. The Board noted that the Advisory Contract for the Funds did not provide for any breakpoints in the Funds’ investment advisory fee rates as the assets of the Funds increase. However, the Board noted that should material economies of scale exist in the future, a breakpoint structure for the Funds may be appropriate, and that it would continue to monitor the sharing of economies of scale to determine the appropriateness of adding breakpoints in the future. Based on this review, as well as the other factors considered at the meeting, the Board, recognizing its responsibility to consider this issue at least annually, concluded that the investment advisory fee rates incorporate potential economies of scale and supported the Board’s approval of the continuance of the Advisory Contract for the coming year.
Fees and Services Provided for Other Comparable Funds/Accounts Managed by BFA and its Affiliates — The Board received and considered information regarding the investment advisory/management fee rates for other funds/accounts in the U.S. for which BFA (or its affiliates) provides investment advisory/management services, including open-end and closed-end funds registered under the 1940 Act (including sub-advised funds), collective trust funds and institutional separate accounts (together, the “Other Accounts”). The Board noted that BFA and its affiliates do not manage Other Accounts with substantially similar investment objectives and strategies as any of the Funds. The Board further noted that BFA provided the Board with detailed information regarding how the Other Accounts (particularly institutional clients) generally differ from the Funds, including in terms of the different, generally more extensive services provided to the Funds, as well as other significant differences in the approach of BFA and its affiliates to the Funds, on one hand, and to the Other Accounts, on the other. In that regard, the Board considered that the pricing of services to institutional clients is typically based on a number of factors beyond the nature and extent of the specific services to be provided and often depends on the overall relationship between the client and its affiliates and the adviser and its affiliates. In addition, the Board considered the relative complexity and inherent risks and challenges of managing and providing other services to the Funds, as publicly traded exchange traded funds, as compared to the Other Accounts that are institutional clients in light of differing regulatory requirements and client-imposed mandates. The Board also considered the “all-inclusive” nature of the Funds’ advisory fee structure, and the Fund expenses borne by BFA under this arrangement. The Board noted that the investment advisory fee rates under the Advisory Contract for the Funds were generally higher than the investment advisory/management fee rates for the Other Accounts that are institutional clients of BFA (or its affiliates) and concluded that the differences appeared to be consistent with the factors discussed.
Other Benefits to BFA and/or its Affiliates — The Board reviewed the “fallout” benefits or ancillary revenue received by BFA and/or its affiliates in connection with the services provided to the Funds by BFA, such as payment of revenue to BTC, the Funds’ securities lending agent, for loaning portfolio securities (which was included in the profit margins reviewed by the Board pursuant to BFA’s profitability methodology), and payment of advisory fees and/or administration fees to BFA and BTC (or their affiliates) in connection with any investments by the Funds in other funds for which BFA (or its affiliates) provides investment advisory services and/or administration services. The Board noted that BFA generally does not use soft dollars or consider the value of research or other services that may be provided to BFA (including its affiliates) in selecting brokers for portfolio transactions for the Funds. The Board further noted that any portfolio transactions on behalf of the Funds placed through a BFA affiliate or
BOARD REVIEWAND APPROVALOF INVESTMENT ADVISORY CONTRACT | 85 |
Table of Contents
Board Review and Approval of Investment Advisory
Contract (Continued)
iSHARES®, INC.
purchased from an underwriting syndicate in which a BFA affiliate participates, are reported to the Board pursuant to Rule 17e-1 or Rule 10f-3, as applicable, under the 1940 Act. The Board concluded that any such ancillary benefits would not be disadvantageous to the Funds’ shareholders and thus would not alter the Board’s conclusion with respect to the appropriateness of approving the continuance of the Advisory Contract for the coming year.
Based on the considerations described above, the Board determined that the investment advisory fee rate under each Advisory Contract does not constitute a fee that is so disproportionately large as to bear no reasonable relationship to the services rendered and that could not have been the product of arm’s-length bargaining, and concluded that it is in the best interest of each Fund and its shareholders to approve the continuance of the Advisory Contract for the coming year.
II. iShares Emerging Markets Local Currency Bond ETF.
Under Section 15(c) of the Investment Company Act of 1940 (the “1940 Act”), the Company’s Board of Directors (the “Board”), including a majority of Directors who are not “interested persons” of the Company (as that term is defined in the 1940 Act) (the “Independent Directors”), is required annually to consider and approve the Investment Advisory Contract between the Company and BFA (the “Advisory Contract”), and the Sub-Advisory Agreement between BFA and BlackRock International Limited (“BIL”) (the “Sub-Advisory Agreement”), on behalf of the Fund. The Advisory Contract and the Sub-Advisory Agreement are referred to hereafter as the “Advisory Agreements”. The Independent Directors requested, and BFA provided, such information as the Independent Directors, with advice from independent counsel, deemed reasonably necessary to evaluate the Advisory Agreements. A committee of Independent Directors (the “15(c) Committee”), with independent counsel, met with management on March 7, 2013, April 23, 2013, and May 3, 2013, to discuss the types of information the Independent Directors required and the manner in which management would organize and present such information. At a meeting held on May 16, 2013, management presented preliminary information to the Board relating to the continuance of the Advisory Agreements, and the Board, including the Independent Directors, reviewed and discussed such information at length. The Independent Directors requested from management certain additional information, and the 15(c) Committee met with management on June 5, 2013, to discuss the additional requests. At a meeting held on June 10-11, 2013, the Board, including the Independent Directors, reviewed the additional information provided by management in response to these requests. The Board, including a majority of the Independent Directors, approved the continuance of the Advisory Agreements for the Fund, based on a review of qualitative and quantitative information provided by BFA, including the supplemental information management provided at the request of the Independent Directors. The Board noted its satisfaction with the extent and quality of information provided and its frequent interactions with management, as well as the detailed responses and other information provided by BFA. The Independent Directors were advised by their independent counsel throughout the process. In approving the Advisory Agreements for the Fund, the Board, including the Independent Directors, considered the following factors, no one of which was controlling, and reached the following conclusions:
Expenses and Performance of the Fund — The Board reviewed statistical information prepared by Lipper Inc. (“Lipper”), an independent provider of investment company data, regarding the expense ratio components, including actual advisory fees, waivers/reimbursements, and gross and net total expenses of the Fund in comparison with the same information for other registered investment companies objectively selected by Lipper as comprising the Fund’s applicable peer group pursuant to Lipper’s proprietary methodology, and any registered funds that would otherwise have been excluded from Lipper’s comparison group because of the size, sponsor, inception date, or other differentiating factors included in Lipper’s proprietary selection methodology, but that were nonetheless included at the request of BFA (the “Lipper Group”). Because there are few, if any, exchange traded funds or index funds that track indexes similar to that tracked by the Fund, the Lipper Group included in part mutual funds, closed-end funds, exchange traded funds, or funds with differing investment objective classifications, investment focuses and other characteristics (e.g., actively managed funds and funds sponsored by “at cost” service providers), as applicable. In support of its review of the statistical information, the Board was provided with a detailed description of the
| 86 | 2013 iSHARES ANNUAL REPORTTO SHAREHOLDERS |
Table of Contents
Board Review and Approval of Investment Advisory
Contract (Continued)
iSHARES®, INC.
methodology used by Lipper to determine the applicable Lipper Groups and to prepare this information. The Board also received a detailed explanation from BFA regarding its rationale for including funds that had been excluded from Lipper’s consideration due to Lipper’s methodology parameters, as well as information showing the effect of including these additional funds in the analysis. The Board further noted that due to the limitations in providing comparable funds in the various Lipper Groups, the statistical information provided in the Lipper Report may or may not provide meaningful direct comparisons to the Fund.
The Board also noted that the investment advisory fee rate and overall expenses for the Fund compared favorably to the investment advisory fee rates and overall expenses of the funds in the Lipper Group. The Board further noted that the Fund ranked in the fourth Lipper Quintile for expenses when compared to a subset of the Lipper Group identified as pure index funds.
The Board noted that BFA pays BIL for its sub-advisory services, and that there are no additional fees imposed on the Fund in respect of the services provided under the Sub-Advisory Agreement.
In addition, the Board reviewed statistical information prepared by Lipper regarding the performance of the Fund for the one-, three-, five-, ten-year, and since inception periods, as applicable, and the “last quarter” period ended December 31, 2012, and a comparison of the Fund’s performance to its performance benchmark index for the same periods. To the extent that any of the comparison funds included in the Lipper Group track the same index as the Fund, Lipper also provided, and the Board reviewed, a comparison of the Fund’s performance to that of such relevant comparison funds for the same periods. The Board noted that the Fund generally performed in line with its performance benchmark index over the relevant periods. In considering this information, the Board noted that the Lipper Group may include funds that are not exchange traded funds or index funds, and that have different investment objectives and/or benchmarks from the Fund. In addition, the Board noted that the Fund seeks to track its benchmark index and that, during the prior year, the Board received periodic reports on the Fund’s performance in comparison with its relevant benchmark index. Such periodic comparative performance information, including detailed information on certain specific iShares funds requested by the Board, was also considered.
Based on this review, the other factors considered at the meeting, and their general knowledge of mutual fund pricing, the Board concluded that the investment advisory fee rate and expense levels and the historical performance of the Fund supported the Board’s approval of the continuance of the Advisory Agreements for the coming year.
Nature, Extent and Quality of Services Provided by BFA and BIL or their Affiliates — Based on management’s representations, including information about recent and proposed enhancements to the iShares business, including with respect to shareholder servicing and support, the Board expected that there would be no diminution in the scope of services required of or provided by BFA (and any services provided by BIL on BFA’s behalf or at BFA’s direction) under the Advisory Agreements for the coming year as compared to the scope of services provided by BFA and BIL during prior years. In reviewing the scope of these services, the Board considered the investment philosophy and experience of BFA and BIL, noting that BFA and its affiliates have committed significant resources over time, including during the past year, to supporting the Fund and its shareholders. The Board acknowledged that resources to support the iShares funds and their shareholders have been added or enhanced since BlackRock’s acquisition of BFA in December 2009, including in such areas as investor education, product management, customized portfolio consulting support, and capital markets support. The Board also considered the compliance program of BFA and BIL and their compliance record with respect to the Fund. In that regard, the Board noted that BFA reports to the Board about portfolio management and compliance matters on a periodic basis in connection with regularly scheduled meetings of the Board, and on other occasions as necessary and appropriate, and has provided information and made appropriate officers available as needed to provide further assistance with these matters. The Board also reviewed the background and experience of the persons responsible for the day-to-day management of the Fund. In addition to the above considerations, the Board reviewed and considered detailed presentations regarding BFA’s investment and risk management processes and strategies provided at the June 10-11, 2013 meeting and throughout the previous year, matters related to BFA’s and BIL’s portfolio compliance policies and
BOARD REVIEWAND APPROVALOF INVESTMENT ADVISORY CONTRACT | 87 |
Table of Contents
Board Review and Approval of Investment Advisory
Contract (Continued)
iSHARES®, INC.
procedures, and BFA’s oversight of the services provided by BIL. The Board noted that the Fund had met its investment objective consistently since its inception date.
Based on the review of this information, and the performance information discussed above, the Board concluded that the nature, extent and quality of services provided by BFA and BIL to the Fund under the Advisory Agreements supported the Board’s approval of the continuance of the Advisory Agreements for the coming year.
Costs of Services Provided to Fund and Profits Realized by BFA and its Affiliates — The Board reviewed information about the profitability to BlackRock of the Fund based on the fees payable to BFA and its affiliates (including fees under the Advisory Contract), and all other sources of revenue and expense to BFA and its affiliates from the Fund’s operations for the last calendar year. The Board reviewed BlackRock’s profitability methodology for the iShares funds, noting that the 15(c) Committee had focused on the methodology and proposed presentation during its meetings. The Board discussed the sources of direct and ancillary revenue with management, including the revenues to BTC from securities lending by the Fund. The Board also discussed BFA’s profit margin as reflected in the Fund’s profitability analysis and reviewed information regarding economies of scale (as discussed below). Based on this review, the Board concluded that the profits realized by BFA and its affiliates under the Advisory Agreements and from other relationships between the Fund and BFA and/or its affiliates, if any, were within a reasonable range in light of the factors considered.
Economies of Scale — The Board reviewed information regarding economies of scale or other efficiencies that may result from increases in the Fund’s assets, noting that the issue of economies of scale had been focused on extensively by the 15(c) Committee during its meetings and addressed by management. The Board and the 15(c) Committee reviewed information provided by BFA regarding scale benefits shared with the iShares funds through relatively low fee rates established at inception, breakpoints, waivers, or other fee reductions, as well as through additional investment in the iShares business and the provision of improved or additional infrastructure and services to the iShares funds and their shareholders. The Board and the 15(c) Committee received information regarding BlackRock’s historical profitability, including BFA’s and its affiliates’ costs in providing services. The cost information distinguished between fixed and variable costs, and explained how the nature of such costs may impact the existence of scale benefits. The Board noted that the Advisory Contract for the Fund did not provide for any breakpoints in the Fund’s investment advisory fee rate as the assets of the Fund increase. However, the Board noted that should material economies of scale exist in the future, a breakpoint structure for the Fund may be appropriate, and that it would continue to monitor the sharing of economies of scale to determine the appropriateness of adding breakpoints in the future. Based on this review, as well as the other factors considered at the meeting, the Board, recognizing its responsibility to consider this issue at least annually, concluded that the investment advisory fee rate incorporates potential economies of scale and supported the Board’s approval of the continuance of the Advisory Agreements for the coming year.
Fees and Services Provided for Other Comparable Funds/Accounts Managed by BFA and its Affiliates — The Board received and considered information regarding the investment advisory/management fee rates for other funds/accounts in the U.S. for which BFA (or its affiliates) provides investment advisory/management services, including open-end and closed-end funds registered under the 1940 Act (including sub-advised funds), collective trust funds and institutional separate accounts (together, the “Other Accounts”). The Board noted that BFA and its affiliates do not manage Other Accounts with a substantially similar investment objective and strategy as the Fund. The Board further noted that BFA provided the Board with detailed information regarding how the Other Accounts (particularly institutional clients) generally differ from the Fund, including in terms of the different, generally more extensive services provided to the Fund, as well as other significant differences in the approach of BFA and its affiliates to the Fund, on one hand, and the Other Accounts, on the other. In that regard, the Board considered that the pricing of services to institutional clients is typically based on a number of factors beyond the nature and extent of the specific services to be provided and often depends on the overall relationship between the client and its affiliates and the adviser and its affiliates. In addition, the Board considered the relative complexity and inherent risks and challenges of managing and providing
| 88 | 2013 iSHARES ANNUAL REPORTTO SHAREHOLDERS |
Table of Contents
Board Review and Approval of Investment Advisory
Contract (Continued)
iSHARES®, INC.
other services to the Fund, as a publicly traded exchange traded fund, as compared to the Other Accounts that are institutional clients in light of differing regulatory requirements and client-imposed mandates. The Board also considered the “all-inclusive” nature of the Fund’s advisory fee structure, and the Fund expenses borne by BFA under this arrangement. The Board noted that the investment advisory fee rate under the Advisory Contract for the Fund were generally higher than the investment advisory/management fee rates for the Other Accounts that are institutional clients of BFA (or its affiliates) and concluded that the differences appeared to be consistent with the factors discussed.
Other Benefits to BFA and/or its Affiliates — The Board reviewed the “fallout” benefits or ancillary revenue received by BFA and/or its affiliates in connection with the services provided to the Fund by BFA, such as payment of revenue to BTC, the Fund’s securities lending agent, for loaning portfolio securities (which was included in the profit margins reviewed by the Board pursuant to BFA’s profitability methodology), and payment of advisory fees and/or administration fees to BFA and BTC (or their affiliates) in connection with any investments by the Fund in other funds for which BFA (or its affiliates) provides investment advisory services and/or administration services. The Board noted that BFA and BIL generally do not use soft dollars or consider the value of research or other services that may be provided to BFA and BIL (including their affiliates) in selecting brokers for portfolio transactions for the Fund. The Board further noted that any portfolio transactions on behalf of the Fund placed through a BFA affiliate or purchased from an underwriting syndicate in which a BFA affiliate participates, are reported to the Board pursuant to Rule 17e-1 or Rule 10f-3, as applicable, under the 1940 Act. The Board concluded that any such ancillary benefits would not be disadvantageous to the Fund’s shareholders and thus would not alter the Board’s conclusion with respect to the appropriateness of approving the continuance of the Advisory Agreements for the coming year.
Based on the considerations described above, the Board determined that the investment advisory fee rate under the Advisory Contract does not constitute a fee that is so disproportionately large as to bear no reasonable relationship to the services rendered and that could not have been the product of arm’s-length bargaining, and concluded that it is in the best interest of the Fund and its shareholders to approve the continuance of the Advisory Agreements for the coming year.
III. iShares Global ex USD High Yield Corporate Bond ETF.
Under Section 15(c) of the Investment Company Act of 1940 (the “1940 Act”), the Company’s Board of Directors (the “Board”), including a majority of Directors who are not “interested persons” of the Company (as that term is defined in the 1940 Act) (the “Independent Directors”), is required annually to consider and approve the Investment Advisory Contract between the Company and BFA (the “Advisory Contract”), and the Sub-Advisory Agreement between BFA and BlackRock International Limited (“BIL”) (the “Sub-Advisory Agreement”), on behalf of the Fund. The Advisory Contract and the Sub-Advisory Agreement are referred to hereafter as the “Advisory Agreements”. The Independent Directors requested, and BFA provided, such information as the Independent Directors, with advice from independent counsel, deemed reasonably necessary to evaluate the Advisory Agreements. A committee of Independent Directors (the “15(c) Committee”), with independent counsel, met with management on March 7, 2013, April 23, 2013, and May 3, 2013, to discuss the types of information the Independent Directors required and the manner in which management would organize and present such information. At a meeting held on May 16, 2013, management presented preliminary information to the Board relating to the continuance of the Advisory Agreements, and the Board, including the Independent Directors, reviewed and discussed such information at length. The Independent Directors requested from management certain additional information, and the 15(c) Committee met with management on June 5, 2013, to discuss the additional requests. At a meeting held on June 10-11, 2013, the Board, including the Independent Directors, reviewed the additional information provided by management in response to these requests. The Board, including a majority of the Independent Directors, approved the continuance of the Advisory Agreements for the Fund, based on a review of qualitative and quantitative information provided by BFA, including the supplemental information management provided at the request of the Independent Directors. The Board noted its satisfaction with the extent and quality of information provided and its frequent interactions with management, as well as the detailed responses and other information provided by BFA. The Independent
BOARD REVIEWAND APPROVALOF INVESTMENT ADVISORY CONTRACT | 89 |
Table of Contents
Board Review and Approval of Investment Advisory
Contract (Continued)
iSHARES®, INC.
Directors were advised by their independent counsel throughout the process. In approving the Advisory Agreements for the Fund, the Board, including the Independent Directors, considered the following factors, no one of which was controlling, and reached the following conclusions:
Expenses and Performance of the Fund — The Board reviewed statistical information prepared by Lipper Inc. (“Lipper”), an independent provider of investment company data, regarding the expense ratio components, including actual advisory fees, waivers/reimbursements, and gross and net total expenses of the Fund in comparison with the same information for other registered investment companies objectively selected by Lipper as comprising the Fund’s applicable peer group pursuant to Lipper’s proprietary methodology, and any registered funds that would otherwise have been excluded from Lipper’s comparison group because of the size, sponsor, inception date, or other differentiating factors included in Lipper’s proprietary selection methodology, but that were nonetheless included at the request of BFA (the “Lipper Group”). Because there are few, if any, exchange traded funds or index funds that track indexes similar to that tracked by the Fund, the Lipper Group included in part mutual funds, closed-end funds, exchange traded funds, or funds with differing investment objective classifications, investment focuses and other characteristics (e.g., actively managed funds and funds sponsored by “at cost” service providers), as applicable. In support of its review of the statistical information, the Board was provided with a detailed description of the methodology used by Lipper to determine the applicable Lipper Groups and to prepare this information. The Board also received a detailed explanation from BFA regarding its rationale for including funds that had been excluded from Lipper’s consideration due to Lipper’s methodology parameters, as well as information showing the effect of including these additional funds in the analysis. The Board further noted that due to the limitations in providing comparable funds in the various Lipper Groups, the statistical information provided in the Lipper Report may or may not provide meaningful direct comparisons to the Fund.
The Board also noted that the investment advisory fee rate and overall expenses for the Fund compared favorably to the investment advisory fee rates and overall expenses of the funds in the Lipper Group. The Board noted that BFA pays BIL for its sub-advisory services, and that there are no additional fees imposed on the Fund in respect of the services provided under the Sub-Advisory Agreement.
In addition, the Board reviewed statistical information prepared by Lipper regarding the performance of the Fund for the one-, three-, five-, ten-year, and since inception periods, as applicable, and the “last quarter” period ended December 31, 2012, and a comparison of the Fund’s performance to its performance benchmark index for the same periods. To the extent that any of the comparison funds included in the Lipper Group track the same index as the Fund, Lipper also provided, and the Board reviewed, a comparison of the Fund’s performance to that of such relevant comparison funds for the same periods. The Board noted that the Fund generally performed in line with its performance benchmark index over the relevant periods. In considering this information, the Board noted that the Lipper Group may include funds that are not exchange traded funds or index funds, and that have different investment objectives and/or benchmarks from the Fund. In addition, the Board noted that the Fund seeks to track its benchmark index and that, during the prior year, the Board received periodic reports on the Fund’s performance in comparison with its relevant benchmark index. Such periodic comparative performance information, including detailed information on certain specific iShares funds requested by the Board, was also considered.
Based on this review, the other factors considered at the meeting, and their general knowledge of mutual fund pricing, the Board concluded that the investment advisory fee rate and expense levels and the historical performance of the Fund supported the Board’s approval of the continuance of the Advisory Agreements for the coming year.
Nature, Extent and Quality of Services Provided by BFA and BIL or their Affiliates — Based on management’s representations, including information about recent and proposed enhancements to the iShares business, including with respect to shareholder servicing and support, the Board expected that there would be no diminution in the scope of services required of or provided by BFA (and any services provided by BIL on BFA’s behalf or at BFA’s direction) under the Advisory Agreements for the
| 90 | 2013 iSHARES ANNUAL REPORTTO SHAREHOLDERS |
Table of Contents
Board Review and Approval of Investment Advisory
Contract (Continued)
iSHARES®, INC.
coming year as compared to the scope of services provided by BFA and BIL during prior years. In reviewing the scope of these services, the Board considered the investment philosophy and experience of BFA and BIL, noting that BFA and its affiliates have committed significant resources over time, including during the past year, to supporting the Fund and its shareholders. The Board acknowledged that resources to support the iShares funds and their shareholders have been added or enhanced since BlackRock’s acquisition of BFA in December 2009, including in such areas as investor education, product management, customized portfolio consulting support, and capital markets support. The Board also considered the compliance program of BFA and BIL and their compliance record with respect to the Fund. In that regard, the Board noted that BFA reports to the Board about portfolio management and compliance matters on a periodic basis in connection with regularly scheduled meetings of the Board, and on other occasions as necessary and appropriate, and has provided information and made appropriate officers available as needed to provide further assistance with these matters. The Board also reviewed the background and experience of the persons responsible for the day-to-day management of the Fund. In addition to the above considerations, the Board reviewed and considered detailed presentations regarding BFA’s investment and risk management processes and strategies provided at the June 10-11, 2013 meeting and throughout the previous year, matters related to BFA’s and BIL’s portfolio compliance policies and procedures, and BFA’s oversight of the services provided by BIL. The Board noted that the Fund had met its investment objective consistently since its inception date.
Based on the review of this information, and the performance information discussed above, the Board concluded that the nature, extent and quality of services provided by BFA and BIL to the Fund under the Advisory Agreements supported the Board’s approval of the continuance of the Advisory Agreements for the coming year.
Costs of Services Provided to Fund and Profits Realized by BFA and its Affiliates — The Board reviewed information about the profitability to BlackRock of the Fund based on the fees payable to BFA and its affiliates (including fees under the Advisory Contract), and all other sources of revenue and expense to BFA and its affiliates from the Fund’s operations for the last calendar year. The Board reviewed BlackRock’s profitability methodology for the iShares funds, noting that the 15(c) Committee had focused on the methodology and proposed presentation during its meetings. The Board discussed the sources of direct and ancillary revenue with management, including the revenues to BTC from securities lending by the Fund. The Board also discussed BFA’s profit margin as reflected in the Fund’s profitability analysis and reviewed information regarding economies of scale (as discussed below). Based on this review, the Board concluded that the profits realized by BFA and its affiliates under the Advisory Agreements and from other relationships between the Fund and BFA and/or its affiliates, if any, were within a reasonable range in light of the factors considered.
Economies of Scale — The Board reviewed information regarding economies of scale or other efficiencies that may result from increases in the Fund’s assets, noting that the issue of economies of scale had been focused on extensively by the 15(c) Committee during its meetings and addressed by management. The Board and the 15(c) Committee reviewed information provided by BFA regarding scale benefits shared with the iShares funds through relatively low fee rates established at inception, breakpoints, waivers, or other fee reductions, as well as through additional investment in the iShares business and the provision of improved or additional infrastructure and services to the iShares funds and their shareholders. The Board and the 15(c) Committee received information regarding BlackRock’s historical profitability, including BFA’s and its affiliates’ costs in providing services. The cost information distinguished between fixed and variable costs, and explained how the nature of such costs may impact the existence of scale benefits. The Board noted that the Advisory Contract for the Fund did not provide for any breakpoints in the Fund’s investment advisory fee rate as the assets of the Fund increase. However, the Board noted that should material economies of scale exist in the future, a breakpoint structure for the Fund may be appropriate, and that it would continue to monitor the sharing of economies of scale to determine the appropriateness of adding breakpoints in the future. Based on this review, as well as the other factors considered at the meeting, the Board, recognizing its responsibility to consider this issue at least annually, concluded that the investment advisory fee rate incorporates potential economies of scale and supported the Board’s approval of the continuance of the Advisory Agreements for the coming year.
BOARD REVIEWAND APPROVALOF INVESTMENT ADVISORY CONTRACT | 91 |
Table of Contents
Board Review and Approval of Investment Advisory
Contract (Continued)
iSHARES®, INC.
Fees and Services Provided for Other Comparable Funds/Accounts Managed by BFA and its Affiliates — The Board received and considered information regarding the investment advisory/management fee rates for other funds/accounts in the U.S. for which BFA (or its affiliates) provides investment advisory/management services, including open-end and closed-end funds registered under the 1940 Act (including sub-advised funds), collective trust funds and institutional separate accounts (together, the “Other Accounts”). The Board noted that BFA and its affiliates do not manage Other Accounts with a substantially similar investment objective and strategy as the Fund. The Board further noted that BFA provided the Board with detailed information regarding how the Other Accounts (particularly institutional clients) generally differ from the Fund, including in terms of the different, generally more extensive services provided to the Fund, as well as other significant differences in the approach of BFA and its affiliates to the Fund, on one hand, and the Other Accounts, on the other. In that regard, the Board considered that the pricing of services to institutional clients is typically based on a number of factors beyond the nature and extent of the specific services to be provided and often depends on the overall relationship between the client and its affiliates and the adviser and its affiliates. In addition, the Board considered the relative complexity and inherent risks and challenges of managing and providing other services to the Fund, as a publicly traded exchange traded fund, as compared to the Other Accounts that are institutional clients in light of differing regulatory requirements and client-imposed mandates. The Board also considered the “all-inclusive” nature of the Fund’s advisory fee structure, and the Fund expenses borne by BFA under this arrangement. The Board noted that the investment advisory fee rate under the Advisory Contract for the Fund were generally higher than the investment advisory/management fee rates for the Other Accounts that are institutional clients of BFA (or its affiliates) and concluded that the differences appeared to be consistent with the factors discussed.
Other Benefits to BFA and/or its Affiliates — The Board reviewed the “fallout” benefits or ancillary revenue received by BFA and/or its affiliates in connection with the services provided to the Fund by BFA, such as payment of revenue to BTC, the Fund’s securities lending agent, for loaning portfolio securities (which was included in the profit margins reviewed by the Board pursuant to BFA’s profitability methodology), and payment of advisory fees and/or administration fees to BFA and BTC (or their affiliates) in connection with any investments by the Fund in other funds for which BFA (or its affiliates) provides investment advisory services and/or administration services. The Board noted that BFA and BIL generally do not use soft dollars or consider the value of research or other services that may be provided to BFA and BIL (including their affiliates) in selecting brokers for portfolio transactions for the Fund. The Board further noted that any portfolio transactions on behalf of the Fund placed through a BFA affiliate or purchased from an underwriting syndicate in which a BFA affiliate participates, are reported to the Board pursuant to Rule 17e-1 or Rule 10f-3, as applicable, under the 1940 Act. The Board concluded that any such ancillary benefits would not be disadvantageous to the Fund’s shareholders and thus would not alter the Board’s conclusion with respect to the appropriateness of approving the continuance of the Advisory Agreements for the coming year.
Based on the considerations described above, the Board determined that the investment advisory fee rate under the Advisory Contract does not constitute a fee that is so disproportionately large as to bear no reasonable relationship to the services rendered and that could not have been the product of arm’s-length bargaining, and concluded that it is in the best interest of the Fund and its shareholders to approve the continuance of the Advisory Agreements for the coming year.
IV. iShares Global High Yield Corporate Bond ETF.
Under Section 15(c) of the Investment Company Act of 1940 (the “1940 Act”), the Company’s Board of Directors (the “Board”), including a majority of Directors who are not “interested persons” of the Company (as that term is defined in the 1940 Act) (the “Independent Directors”), is required annually to consider and approve the Investment Advisory Contract between the Company and BFA (the “Advisory Contract”), and the Sub-Advisory Agreement between BFA and BlackRock International Limited (“BIL”) (the “Sub-Advisory Agreement”), on behalf of the Fund. The Advisory Contract and the Sub-Advisory Agreement are referred to hereafter as the “Advisory Agreements”. The Independent Directors requested, and BFA provided, such information as the Independent Directors, with advice from independent counsel, deemed reasonably necessary to evaluate the Advisory
| 92 | 2013 iSHARES ANNUAL REPORTTO SHAREHOLDERS |
Table of Contents
Board Review and Approval of Investment Advisory
Contract (Continued)
iSHARES®, INC.
Agreements. A committee of Independent Directors (the “15(c) Committee”), with independent counsel, met with management on March 7, 2013, April 23, 2013, and May 3, 2013, to discuss the types of information the Independent Directors required and the manner in which management would organize and present such information. At a meeting held on May 16, 2013, management presented preliminary information to the Board relating to the continuance of the Advisory Agreements, and the Board, including the Independent Directors, reviewed and discussed such information at length. The Independent Directors requested from management certain additional information, and the 15(c) Committee met with management on June 5, 2013, to discuss the additional requests. At a meeting held on June 10-11, 2013, the Board, including the Independent Directors, reviewed the additional information provided by management in response to these requests. The Board, including a majority of the Independent Directors, approved the continuance of the Advisory Agreements for the Fund, based on a review of qualitative and quantitative information provided by BFA, including the supplemental information management provided at the request of the Independent Directors. The Board noted its satisfaction with the extent and quality of information provided and its frequent interactions with management, as well as the detailed responses and other information provided by BFA. The Independent Directors were advised by their independent counsel throughout the process. In approving the Advisory Agreements for the Fund, the Board, including the Independent Directors, considered the following factors, no one of which was controlling, and reached the following conclusions:
Expenses and Performance of the Fund — The Board reviewed statistical information prepared by Lipper Inc. (“Lipper”), an independent provider of investment company data, regarding the expense ratio components, including actual advisory fees, waivers/reimbursements, and gross and net total expenses of the Fund in comparison with the same information for other registered investment companies objectively selected by Lipper as comprising the Fund’s applicable peer group pursuant to Lipper’s proprietary methodology, and any registered funds that would otherwise have been excluded from Lipper’s comparison group because of the size, sponsor, inception date, or other differentiating factors included in Lipper’s proprietary selection methodology, but that were nonetheless included at the request of BFA (the “Lipper Group”). Because there are few, if any, exchange traded funds or index funds that track indexes similar to that tracked by the Fund, the Lipper Group included in part mutual funds, closed-end funds, exchange traded funds, or funds with differing investment objective classifications, investment focuses and other characteristics (e.g., actively managed funds and funds sponsored by “at cost” service providers), as applicable. In support of its review of the statistical information, the Board was provided with a detailed description of the methodology used by Lipper to determine the applicable Lipper Groups and to prepare this information. The Board also received a detailed explanation from BFA regarding its rationale for including funds that had been excluded from Lipper’s consideration due to Lipper’s methodology parameters, as well as information showing the effect of including these additional funds in the analysis. The Board further noted that due to the limitations in providing comparable funds in the various Lipper Groups, the statistical information provided in the Lipper Report may or may not provide meaningful direct comparisons to the Fund.
The Board also noted that the investment advisory fee rate and overall expenses for the Fund compared favorably to the investment advisory fee rates and overall expenses of the funds in the Lipper Group. The Board noted that BFA pays BIL for its sub-advisory services, and that there are no additional fees imposed on the Fund in respect of the services provided under the Sub-Advisory Agreement.
In addition, the Board reviewed statistical information prepared by Lipper regarding the performance of the Fund for the one-, three-, five-, ten-year, and since inception periods, as applicable, and the “last quarter” period ended December 31, 2012, and a comparison of the Fund’s performance to its performance benchmark index for the same periods. To the extent that any of the comparison funds included in the Lipper Group track the same index as the Fund, Lipper also provided, and the Board reviewed, a comparison of the Fund’s performance to that of such relevant comparison funds for the same periods. The Board noted that the Fund generally performed in line with its performance benchmark index over the relevant periods. In considering this information, the Board noted that the Lipper Group may include funds that are not exchange traded funds or index funds, and that have different investment objectives and/or benchmarks from the Fund. In addition, the Board noted that the Fund seeks to track
BOARD REVIEWAND APPROVALOF INVESTMENT ADVISORY CONTRACT | 93 |
Table of Contents
Board Review and Approval of Investment Advisory
Contract (Continued)
iSHARES®, INC.
its benchmark index and that, during the prior year, the Board received periodic reports on the Fund’s performance in comparison with its relevant benchmark index. Such periodic comparative performance information, including detailed information on certain specific iShares funds requested by the Board, was also considered.
Based on this review, the other factors considered at the meeting, and their general knowledge of mutual fund pricing, the Board concluded that the investment advisory fee rate and expense levels and the historical performance of the Fund supported the Board’s approval of the continuance of the Advisory Agreements for the coming year.
Nature, Extent and Quality of Services Provided by BFA and BIL or their Affiliates — Based on management’s representations, including information about recent and proposed enhancements to the iShares business, including with respect to shareholder servicing and support, the Board expected that there would be no diminution in the scope of services required of or provided by BFA (and any services provided by BIL on BFA’s behalf or at BFA’s direction) under the Advisory Agreements for the coming year as compared to the scope of services provided by BFA and BIL during prior years. In reviewing the scope of these services, the Board considered the investment philosophy and experience of BFA and BIL, noting that BFA and its affiliates have committed significant resources over time, including during the past year, to supporting the Fund and its shareholders. The Board acknowledged that resources to support the iShares funds and their shareholders have been added or enhanced since BlackRock’s acquisition of BFA in December 2009, including in such areas as investor education, product management, customized portfolio consulting support, and capital markets support. The Board also considered the compliance program of BFA and BIL and their compliance record with respect to the Fund. In that regard, the Board noted that BFA reports to the Board about portfolio management and compliance matters on a periodic basis in connection with regularly scheduled meetings of the Board, and on other occasions as necessary and appropriate, and has provided information and made appropriate officers available as needed to provide further assistance with these matters. The Board also reviewed the background and experience of the persons responsible for the day-to-day management of the Fund. In addition to the above considerations, the Board reviewed and considered detailed presentations regarding BFA’s investment and risk management processes and strategies provided at the June 10-11, 2013 meeting and throughout the previous year, matters related to BFA’s and BIL’s portfolio compliance policies and procedures, and BFA’s oversight of the services provided by BIL. The Board noted that the Fund had met its investment objective consistently since its inception date.
Based on the review of this information, and the performance information discussed above, the Board concluded that the nature, extent and quality of services provided by BFA and BIL to the Fund under the Advisory Agreements supported the Board’s approval of the continuance of the Advisory Agreements for the coming year.
Costs of Services Provided to Fund and Profits Realized by BFA and its Affiliates — The Board reviewed information about the profitability to BlackRock of the Fund based on the fees payable to BFA and its affiliates (including fees under the Advisory Contract), and all other sources of revenue and expense to BFA and its affiliates from the Fund’s operations for the last calendar year. The Board reviewed BlackRock’s profitability methodology for the iShares funds, noting that the 15(c) Committee had focused on the methodology and proposed presentation during its meetings. The Board discussed the sources of direct and ancillary revenue with management, including the revenues to BTC from securities lending by the Fund. The Board also discussed BFA’s profit margin as reflected in the Fund’s profitability analysis and reviewed information regarding economies of scale (as discussed below). Based on this review, the Board concluded that the profits realized by BFA and its affiliates under the Advisory Agreements and from other relationships between the Fund and BFA and/or its affiliates, if any, were within a reasonable range in light of the factors considered.
Economies of Scale — The Board reviewed information regarding economies of scale or other efficiencies that may result from increases in the Fund’s assets, noting that the issue of economies of scale had been focused on extensively by the 15(c) Committee during its meetings and addressed by management. The Board and the 15(c) Committee reviewed information
| 94 | 2013 iSHARES ANNUAL REPORTTO SHAREHOLDERS |
Table of Contents
Board Review and Approval of Investment Advisory
Contract (Continued)
iSHARES®, INC.
provided by BFA regarding scale benefits shared with the iShares funds through relatively low fee rates established at inception, breakpoints, waivers, or other fee reductions, as well as through additional investment in the iShares business and the provision of improved or additional infrastructure and services to the iShares funds and their shareholders. The Board and the 15(c) Committee received information regarding BlackRock’s historical profitability, including BFA’s and its affiliates’ costs in providing services. The cost information distinguished between fixed and variable costs, and explained how the nature of such costs may impact the existence of scale benefits. The Board noted that the Advisory Contract for the Fund did not provide for any breakpoints in the Fund’s investment advisory fee rate as the assets of the Fund increase. However, the Board noted that should material economies of scale exist in the future, a breakpoint structure for the Fund may be appropriate, and that it would continue to monitor the sharing of economies of scale to determine the appropriateness of adding breakpoints in the future. Based on this review, as well as the other factors considered at the meeting, the Board, recognizing its responsibility to consider this issue at least annually, concluded that the investment advisory fee rate incorporates potential economies of scale and supported the Board’s approval of the continuance of the Advisory Agreements for the coming year.
Fees and Services Provided for Other Comparable Funds/Accounts Managed by BFA and its Affiliates — The Board received and considered information regarding the investment advisory/management fee rates for other funds/accounts in the U.S. for which BFA (or its affiliates) provides investment advisory/management services, including open-end and closed-end funds registered under the 1940 Act (including sub-advised funds), collective trust funds and institutional separate accounts (together, the “Other Accounts”). The Board noted that BFA and its affiliates do not manage Other Accounts with a substantially similar investment objective and strategy as the Fund. The Board further noted that BFA provided the Board with detailed information regarding how the Other Accounts (particularly institutional clients) generally differ from the Fund, including in terms of the different, generally more extensive services provided to the Fund, as well as other significant differences in the approach of BFA and its affiliates to the Fund, on one hand, and the Other Accounts, on the other. In that regard, the Board considered that the pricing of services to institutional clients is typically based on a number of factors beyond the nature and extent of the specific services to be provided and often depends on the overall relationship between the client and its affiliates and the adviser and its affiliates. In addition, the Board considered the relative complexity and inherent risks and challenges of managing and providing other services to the Fund, as a publicly traded exchange traded fund, as compared to the Other Accounts that are institutional clients in light of differing regulatory requirements and client-imposed mandates. The Board also considered the “all-inclusive” nature of the Fund’s advisory fee structure, and the Fund expenses borne by BFA under this arrangement. The Board noted that the investment advisory fee rate under the Advisory Contract for the Fund were generally higher than the investment advisory/management fee rates for the Other Accounts that are institutional clients of BFA (or its affiliates) and concluded that the differences appeared to be consistent with the factors discussed.
Other Benefits to BFA and/or its Affiliates — The Board reviewed the “fallout” benefits or ancillary revenue received by BFA and/or its affiliates in connection with the services provided to the Fund by BFA, such as payment of revenue to BTC, the Fund’s securities lending agent, for loaning portfolio securities (which was included in the profit margins reviewed by the Board pursuant to BFA’s profitability methodology), and payment of advisory fees and/or administration fees to BFA and BTC (or their affiliates) in connection with any investments by the Fund in other funds for which BFA (or its affiliates) provides investment advisory services and/or administration services. The Board noted that BFA and BIL generally do not use soft dollars or consider the value of research or other services that may be provided to BFA and BIL (including their affiliates) in selecting brokers for portfolio transactions for the Fund. The Board further noted that any portfolio transactions on behalf of the Fund placed through a BFA affiliate or purchased from an underwriting syndicate in which a BFA affiliate participates, are reported to the Board pursuant to Rule 17e-1 or Rule 10f-3, as applicable, under the 1940 Act. The Board concluded that any such ancillary benefits would not be disadvantageous to the Fund’s shareholders and thus would not alter the Board’s conclusion with respect to the appropriateness of approving the continuance of the Advisory Agreements for the coming year.
BOARD REVIEWAND APPROVALOF INVESTMENT ADVISORY CONTRACT | 95 |
Table of Contents
Board Review and Approval of Investment Advisory
Contract (Continued)
iSHARES®, INC.
Based on the considerations described above, the Board determined that the investment advisory fee rate under the Advisory Contract does not constitute a fee that is so disproportionately large as to bear no reasonable relationship to the services rendered and that could not have been the product of arm’s-length bargaining, and concluded that it is in the best interest of the Fund and its shareholders to approve the continuance of the Advisory Agreements for the coming year.
| 96 | 2013 iSHARES ANNUAL REPORTTO SHAREHOLDERS |
Table of Contents
Supplemental Information (Unaudited)
iSHARES®, INC.
Section 19(a) Notices
The amounts and sources of distributions reported are only estimates and are not being provided for tax reporting purposes. The actual amounts and sources of the amounts for tax reporting purposes will depend upon each Fund’s investment experience during the year and may be subject to changes based on the tax regulations. Shareholders will receive a Form 1099-DIV each calendar year that will inform them how to report distributions for federal income tax purposes.
| Total Cumulative Distributions for the Fiscal Year | % Breakdown of the Total Cumulative Distributions for the Fiscal Year | |||||||||||||||||||||||||||||||
| iShares Bond ETF | Net Investment Income | Net Realized Capital Gains | Return of Capital | Total Per Share | Net Investment Income | Net Realized Capital Gains | Return of Capital | Total Per Share | ||||||||||||||||||||||||
Emerging Markets Corporate | $ | 1.883011 | $ | — | $ | — | $ | 1.883011 | 100 | % | — | % | — | % | 100 | % | ||||||||||||||||
Emerging Markets High Yield | 2.783249 | — | — | 2.783249 | 100 | — | — | 100 | ||||||||||||||||||||||||
Emerging Markets Local Currency | 1.372833 | — | 0.056956 | 1.429789 | 96 | — | 4 | 100 | ||||||||||||||||||||||||
Global ex USD High Yield Corporate | 2.828307 | — | — | 2.828307 | 100 | — | — | 100 | ||||||||||||||||||||||||
Global High Yield Corporate | 2.924186 | — | — | 2.924186 | 100 | — | — | 100 | ||||||||||||||||||||||||
Premium/Discount Information
The tables that follow present information about the differences between the daily market price on secondary markets for shares of a Fund and that Fund’s net asset value. Net asset value, or “NAV,” is the price per share at which each Fund issues and redeems shares. It is calculated in accordance with the standard formula for valuing mutual fund shares. The “Market Price” of each Fund generally is determined using the midpoint between the highest bid and the lowest offer on the primary stock exchange on which the shares of such Fund are listed for trading, as of the time that the Fund’s NAV is calculated. Each Fund’s Market Price may be at, above or below its NAV. The NAV of each Fund will fluctuate with changes in the fair value of its portfolio holdings. The Market Price of each Fund will fluctuate in accordance with changes in its NAV, as well as market supply and demand.
Premiums or discounts are the differences (expressed as a percentage) between the NAV and Market Price of a Fund on a given day, generally at the time NAV is calculated. A premium is the amount that a Fund is trading above the reported NAV, expressed as a percentage of the NAV. A discount is the amount that a Fund is trading below the reported NAV, expressed as a percentage of the NAV.
The following information shows the frequency distributions of premiums and discounts for each of the Funds included in this report. The information shown for each Fund is for five calendar years or for each full calendar quarter completed after the inception date of such Fund if less than five years through the date of the most recent quarter-end. The specific periods covered for each Fund are disclosed in the table for such Fund.
SUPPLEMENTAL INFORMATION | 97 |
Table of Contents
Supplemental Information (Unaudited) (Continued)
iSHARES®, INC.
Each line in the table shows the number of trading days in which the Fund traded within the premium/discount range indicated. The number of trading days in each premium/discount range is also shown as a percentage of the total number of trading days in the period covered by each table. All data presented here represents past performance, which cannot be used to predict future results.
iShares Emerging Markets Corporate ETF
Period Covered: July 1, 2012 through September 30, 2013
Premium/Discount Range | Number of Days | Percentage of Total Days | ||||||
Greater than 3.0% and Less than 3.5% | 1 | 0.32 | % | |||||
Greater than 2.5% and Less than 3.0% | 5 | 1.60 | ||||||
Greater than 2.0% and Less than 2.5% | 7 | 2.24 | ||||||
Greater than 1.5% and Less than 2.0% | 17 | 5.43 | ||||||
Greater than 1.0% and Less than 1.5% | 137 | 43.76 | ||||||
Greater than 0.5% and Less than 1.0% | 61 | 19.49 | ||||||
Between 0.5% and –0.5% | 23 | 7.35 | ||||||
Less than –0.5% and Greater than –1.0% | 8 | 2.56 | ||||||
Less than –1.0% and Greater than –1.5% | 14 | 4.47 | ||||||
Less than –1.5% and Greater than –2.0% | 13 | 4.15 | ||||||
Less than –2.0% and Greater than –2.5% | 19 | 6.07 | ||||||
Less than –2.5% and Greater than –3.0% | 5 | 1.60 | ||||||
Less than –3.0% and Greater than –3.5% | 3 | 0.96 | ||||||
|
|
|
| |||||
| 313 | 100.00 | % | ||||||
|
|
|
| |||||
iShares Emerging Markets High Yield Bond ETF
Period Covered: July 1, 2012 through September 30, 2013
Premium/Discount Range | Number of Days | Percentage of Total Days | ||||||
Greater than 1.0% and Less than 1.5% | 59 | 18.85 | % | |||||
Greater than 0.5% and Less than 1.0% | 163 | 52.07 | ||||||
Between 0.5% and –0.5% | 79 | 25.24 | ||||||
Less than –0.5% and Greater than –1.0% | 9 | 2.88 | ||||||
Less than –1.0% and Greater than –1.5% | 3 | 0.96 | ||||||
|
|
|
| |||||
| 313 | 100.00 | % | ||||||
|
|
|
| |||||
| 98 | 2013 iSHARES ANNUAL REPORTTO SHAREHOLDERS |
Table of Contents
Supplemental Information (Unaudited) (Continued)
iSHARES®, INC.
iShares Emerging Markets Local Currency Bond ETF
Period Covered: January 1, 2012 through September 30, 2013
Premium/Discount Range | Number of Days | Percentage of Total Days | ||||||
Greater than 4.5% and Less than 5.0% | 1 | 0.23 | % | |||||
Greater than 4.0% and Less than 4.5% | 1 | 0.23 | ||||||
Greater than 3.5% and Less than 4.0% | 3 | 0.68 | ||||||
Greater than 3.0% and Less than 3.5% | 1 | 0.23 | ||||||
Greater than 2.5% and Less than 3.0% | 2 | 0.46 | ||||||
Greater than 2.0% and Less than 2.5% | 21 | 4.79 | ||||||
Greater than 1.5% and Less than 2.0% | 58 | 13.24 | ||||||
Greater than 1.0% and Less than 1.5% | 211 | 48.18 | ||||||
Greater than 0.5% and Less than 1.0% | 69 | 15.75 | ||||||
Between 0.5% and –0.5% | 58 | 13.24 | ||||||
Less than –0.5% and Greater than –1.0% | 11 | 2.51 | ||||||
Less than –1.0% and Greater than –1.5% | 1 | 0.23 | ||||||
Less than –1.5% | 1 | 0.23 | ||||||
|
|
|
| |||||
| 438 | 100.00 | % | ||||||
|
|
|
| |||||
iShares Global ex USD High Yield Corporate Bond ETF
Period Covered: July 1, 2012 through September 30, 2013
Premium/Discount Range | Number of Days | Percentage of Total Days | ||||||
Greater than 3.5% and Less than 4.0% | 1 | 0.32 | % | |||||
Greater than 3.0% and Less than 3.5% | 2 | 0.64 | ||||||
Greater than 2.5% and Less than 3.0% | 1 | 0.32 | ||||||
Greater than 2.0% and Less than 2.5% | 3 | 0.96 | ||||||
Greater than 1.5% and Less than 2.0% | 14 | 4.47 | ||||||
Greater than 1.0% and Less than 1.5% | 30 | 9.58 | ||||||
Greater than 0.5% and Less than 1.0% | 141 | 45.05 | ||||||
Between 0.5% and –0.5% | 120 | 38.34 | ||||||
Less than –0.5% and Greater than –1.0% | 1 | 0.32 | ||||||
|
|
|
| |||||
| 313 | 100.00 | % | ||||||
|
|
|
| |||||
SUPPLEMENTAL INFORMATION | 99 |
Table of Contents
Supplemental Information (Unaudited) (Continued)
iSHARES®, INC.
iShares Global High Yield Corporate Bond ETF
Period Covered: July 1, 2012 through September 30, 2013
Premium/Discount Range | Number of Days | Percentage of Total Days | ||||||
Greater than 2.0% and Less than 2.5% | 2 | 0.64 | % | |||||
Greater than 1.5% and Less than 2.0% | 3 | 0.96 | ||||||
Greater than 1.0% and Less than 1.5% | 37 | 11.82 | ||||||
Greater than 0.5% and Less than 1.0% | 173 | 55.27 | ||||||
Between 0.5% and –0.5% | 98 | 31.31 | ||||||
|
|
|
| |||||
| 313 | 100.00 | % | ||||||
|
|
|
| |||||
| 100 | 2013 iSHARES ANNUAL REPORTTO SHAREHOLDERS |
Table of Contents
Director and Officer Information
iSHARES®, INC.
The Board of Directors has responsibility for the overall management and operations of the Company, including general supervision of the duties performed by BFA and other service providers. Each Director serves until he or she resigns, is removed, dies, retires or becomes incapacitated. The President, Treasurer and Secretary shall each hold office until their successors are chosen and qualified, and all other officers shall hold office until he or she resigns or is removed. Directors who are not interested persons of the Company (as defined in the 1940 Act) are referred to as Independent Directors.
The registered investment companies advised by BFA or its affiliates are organized into one complex of closed-end funds, two complexes of open-end funds and one complex of exchange-traded funds (“Exchange-Traded Fund Complex”) (each, a “BlackRock Fund Complex”). Each Fund is included in the BlackRock Fund Complex referred to as the Exchange-Traded Fund Complex. Each Director of iShares, Inc. also serves as a Trustee of iShares Trust, a Director of iShares MSCI Russia Capped ETF, Inc. and a Trustee of iShares U.S. ETF Trust and, as a result, oversees a total of 300 funds (as of October 31, 2013) within the Exchange-Traded Fund Complex. With the exception of Robert S. Kapito, the address of each Director and Officer is c/o BlackRock, Inc., 400 Howard Street, San Francisco, CA 94105. The address of Mr. Kapito is c/o BlackRock, Inc., Park Avenue Plaza, 55 East 52nd Street, New York, NY 10055. The Board has designated Robert H. Silver as its Independent Chairman. Additional information about the Funds’ Directors and Officers may be found in the Funds’ combined Statement of Additional Information, which is available without charge, upon request, by calling toll-free 1-800-iShares (1-800-474-2737).
Interested Directors and Officers
| Name (Age) | Position(s) (Length of Service) | Principal Occupation(s) During the Past 5 Years | Other Directorships Held | |||
Robert S. Kapitoa (56) | Director (since 2009). | President and Director, BlackRock, Inc. (since 2006); Vice Chairman of BlackRock, Inc. and Head of BlackRock’s Portfolio Management Group (since its formation in 1998) and BlackRock’s predecessor entities (since 1988); Trustee, University of Pennsylvania (since 2009); President of Board of Directors, Hope & Heroes Children’s Cancer Fund (since 2002); President of the Board of Directors, Periwinkle Theatre for Youth (since 1983). | Director of BlackRock, Inc. (since 2006); Trustee of iShares Trust (since 2009); Director of iShares MSCI Russia Capped ETF, Inc. (since 2010); Trustee of iShares U.S. ETF Trust (since 2011). | |||
Michael Lathamb (48) | Director (since 2010); President (since 2007). | Chairman of iShares, BlackRock (since 2011); Global Chief Executive Officer of iShares, BlackRock (2010-2011); Managing Director, BlackRock (since 2009); Head of Americas iShares, Barclays Global Investors (“BGI”) (2007-2009); Director and Chief Financial Officer of Barclays Global Investors International, Inc. (2005-2009); Chief Operating Officer of the Intermediary Investor and Exchange-Traded Products Business, BGI (2003-2007). | Trustee of iShares Trust (since 2010); Director of iShares MSCI Russia Capped ETF, Inc. (since 2010); Trustee of iShares U.S. ETF Trust (since 2011). | |||
| a | Robert S. Kapito is deemed to be an “interested person” (as defined in the 1940 Act) of the Company due to his affiliations with BlackRock, Inc. |
| b | Michael Latham is deemed to be an “interested person” (as defined in the 1940 Act) of the Company due to his affiliations with BlackRock, Inc. and its affiliates. |
DIRECTORAND OFFICER INFORMATION | 101 |
Table of Contents
Director and Officer Information (Continued)
iSHARES®, INC.
Independent Directors
| Name (Age) | Position(s) (Length of Service) | Principal Occupation(s) During the Past 5 Years | Other Directorships Held | |||
Robert H. Silver (58) | Director (since 2007); Independent Chairman (since 2012). | President and Co-Founder of The Bravitas Group, Inc. (since 2006); Director and Vice Chairman of the YMCA of Greater NYC (2001-2011); Broadway Producer (2006-2011); Co-Founder and Vice President of Parentgiving Inc. (since 2008); Director and Member of the Audit and Compensation Committee of EPAM Systems, Inc. (2006-2009); President and Chief Operating Officer of UBS Financial Services Inc. (formerly Paine Webber Inc.) (2003-2005) and various executive positions with UBS and its affiliates (1988-2005); CPA and Audit Manager of KPMG, LLP (formerly Peat Marwick Mitchell) (1977-1983). | Trustee of iShares Trust (since 2007); Director of iShares MSCI Russia Capped ETF, Inc. (since 2010); Trustee of iShares U.S. ETF Trust (since 2011); Independent Chairman of iShares, Trust, iShares MSCI Russia Capped ETF, Inc. and iShares U.S. ETF Trust (since 2012). | |||
Cecilia H. Herbert (64) | Director (since 2005); Nominating and Governance Committee Chair and Equity Plus Committee Chair (since 2012). | Trustee and Member (since 2011) of the Investment Committee, WNET, the New York public broadcasting company; Director (since 1998) and President (2007-2011) of the Board of Directors, Catholic Charities CYO; Trustee (2002-2011) and Chair of the Finance and Investment Committee (2006-2010) the Thacher School; Member (since 1994) and Chair (1994-2005) of the Investment Committee, Archdiocese of San Francisco. | Trustee of iShares Trust (since 2005); Director of iShares MSCI Russia Capped ETF, Inc. (since 2010); Trustee of iShares U.S. ETF Trust (since 2011); Director of Forward Funds (34 portfolios) (since 2009). | |||
Charles A. Hurty (70) | Director (since 2005); Audit Committee Chair (since 2006). | Retired; Partner, KPMG LLP (1968-2001). | Trustee of iShares Trust (since 2005); Director of iShares MSCI Russia Capped ETF, Inc. (since 2010); Trustee of iShares U.S. ETF Trust (since 2011); Director of GMAM Absolute Return Strategy Fund (1 portfolio) (since 2002); Director of SkyBridge Alternative Investments Multi-Adviser Hedge Fund Portfolios LLC (2 portfolios) (since 2002). | |||
John E. Kerrigan (58) | Director (since 2005); Fixed Income Plus Committee Chair (since 2012). | Chief Investment Officer, Santa Clara University (since 2002). | Trustee of iShares Trust (since 2005); Director of iShares MSCI Russia Capped ETF, Inc. (since 2010); Trustee of iShares U.S. ETF Trust (since 2011). | |||
| 102 | 2013 iSHARES ANNUAL REPORTTO SHAREHOLDERS |
Table of Contents
Director and Officer Information (Continued)
iSHARES®, INC.
Independent Directors (Continued)
| Name (Age) | Position(s) (Length of Service) | Principal Occupation(s) During the Past 5 Years | Other Directorships Held | |||
John E. Martinez (52) | Director (since 2003); Securities Lending Committee Chair (since 2012). | Director of FirstREX Agreement Corp. (formerly EquityRock, Inc.) (since 2005). | Trustee of iShares Trust (since 2003); Director of iShares MSCI Russia Capped ETF, Inc. (since 2010); Trustee of iShares U.S. ETF Trust (since 2011). | |||
George G.C. Parker (74) | Director (since 2002). | Dean Witter Distinguished Professor of Finance, Emeritus, Stanford University Graduate School of Business (Professor since 1973; Emeritus since 2006). | Trustee of iShares Trust (since 2000); Director of iShares MSCI Russia Capped ETF, Inc. (since 2010); Trustee of iShares U.S. ETF Trust (since 2011); Director of Tejon Ranch Company (since 1999); Director of Threshold Pharmaceuticals (since 2004); Director of Colony Financial, Inc. (since 2009); Director of First Republic Bank (since 2010). | |||
Madhav V. Rajan (49) | Director (since 2011); 15(c) Committee Chair (since 2012). | Robert K. Jaedicke Professor of Accounting and Senior Associate Dean for Academic Affairs and Head of MBA Program, Stanford University Graduate School of Business (since 2001); Professor of Law (by courtesy), Stanford Law School (since 2005); Visiting Professor, University of Chicago (2007-2008). | Trustee of iShares Trust (since 2011); Director of iShares MSCI Russia Capped ETF, Inc. (since 2011); Trustee of iShares U.S. ETF Trust (since 2011). | |||
DIRECTORAND OFFICER INFORMATION | 103 |
Table of Contents
Director and Officer Information (Continued)
iSHARES®, INC.
Officers
| Name (Age) | Position(s) (Length of Service) | Principal Occupation(s) During the Past 5 Years | ||
Edward B. Baer (45) | Vice President and Chief Legal Officer (since 2012). | Managing Director of Legal & Compliance, BlackRock (since 2006); Director of Legal & Compliance, BlackRock (2004-2006). | ||
Eilleen M. Clavere (61) | Secretary (since 2007). | Director of Global Fund Administration, BlackRock (since 2009); Director of Legal Administration of Intermediary Investor Business, BGI (2006-2009); Legal Counsel and Vice President of Atlas Funds, Atlas Advisers, Inc. and Atlas Securities, Inc. (2005-2006); Counsel at Kirkpatrick & Lockhart LLP (2001-2005). | ||
Jack Gee (54) | Treasurer and Chief Financial Officer (since 2008). | Managing Director, BlackRock (since 2009); Senior Director of Fund Administration of Intermediary Investor Business, BGI (2009); Director of Fund Administration of Intermediary Investor Business, BGI (2004-2009). | ||
Scott Radell (44) | Executive Vice President (since 2012). | Managing Director, BlackRock (since 2009); Head of Portfolio Solutions, BlackRock (since 2009); Head of Portfolio Solutions, BGI (2007-2009); Credit Portfolio Manager, BGI (2005-2007); Credit Research Analyst, BGI (2003-2005). | ||
Amy Schioldager (51) | Executive Vice President (since 2007). | Senior Managing Director, BlackRock (since 2009); Global Head of Index Equity, BGI (2008-2009); Global Head of U.S. Indexing, BGI (2006-2008); Head of Domestic Equity Portfolio Management, BGI (2001-2006). | ||
Ira P. Shapiro (50) | Vice President (since 2007). | Managing Director, BlackRock (since 2009); Head of Strategic Product Initiatives for iShares (since 2012); Chief Legal Officer, Exchange-Traded Fund Complex (2007-2012); Associate General Counsel, BGI (2004-2009). | ||
| 104 | 2013 iSHARES ANNUAL REPORTTO SHAREHOLDERS |
Table of Contents
Notes:
NOTES | 105 |
Table of Contents
Notes:
| 106 | 2012 iSHARES ANNUAL REPORTTO SHAREHOLDERS |
Table of Contents
|
For more information visit www.iShares.com or call 1-800-iShares (1-800-474-2737)
This report is intended for the Funds’ shareholders. It may not be distributed to prospective investors unless it is preceded or accompanied by the current prospectus.
Investing involves risk, including possible loss of principal.
The iShares Funds are distributed by BlackRock Investments, LLC (together with its affiliates, “BlackRock”).
The iShares Funds are not sponsored, endorsed, issued, sold or promoted by Markit Indices Limited or Morningstar, Inc., nor are they sponsored, endorsed or issued by Barclays Capital Inc. None of these companies make any representation regarding the advisability of investing in the iShares Funds. BlackRock is not affiliated with the companies listed above.
A description of the policies that the Funds use to determine how to vote proxies relating to portfolio securities and information about how the Funds voted proxies relating to portfolio securities during the most recent twelve-month period ending June 30 is available without charge, upon request, by calling toll-free 1-800-474-2737; on the Funds’ website at www.iShares.com; and on the U.S. Securities and Exchange Commission (SEC) website at www.sec.gov.
The Funds file their complete schedules of portfolio holdings with the SEC for the first and third quarters of each fiscal year on Form N-Q. The Funds’ Forms N-Q are available on the SEC’s website or may be reviewed and copied at the SEC’s Public Reference Room in Washington, D.C. Information on the operation of the Public Reference Room may be obtained by calling 1-800-SEC-0330. The Funds also disclose their complete schedules of portfolio holdings on a daily and monthly basis on the Funds’ website.
©2013 BlackRock, Inc. All rights reserved. iSHARES and BLACKROCK are registered trademarks of BlackRock, Inc. or its subsidiaries. All other marks are the property of their respective owners.
| Go paperless. . . |
| |
It’s Fast, Convenient, and Timely! | ||
| To sign up today, go to www.icsdelivery.com | ||

iS-AR-102-1013
Table of Contents
Item 2. Code of Ethics.
iShares, Inc. (the “Registrant”) adopted a new code of ethics on July 1, 2011 that applies to persons appointed by the Registrant’s Board of Directors as the President and/or Chief Financial Officer, and any persons performing similar functions. For the fiscal year ended October 31, 2013, there were no amendments to any provision of the former and new codes of ethics, nor were there any waivers granted from any provision of the former and new codes of ethics. A copy of the new code of ethics is filed with this Form N-CSR under Item 12(a)(1).
Item 3. Audit Committee Financial Expert.
The Registrant’s Board of Directors has determined that the Registrant has more than one audit committee financial expert, as that term is defined under Item 3(b) and 3(c), serving on its audit committee. The audit committee financial experts serving on the Registrant’s audit committee are Charles A. Hurty, John E. Kerrigan, George G.C. Parker, Robert H. Silver and Madhav V. Rajan, all of whom are independent, as that term is defined under Item 3(a)(2).
Item 4. Principal Accountant Fees and Services.
The principal accountant fees disclosed in items 4(a), 4(b), 4(c), 4(d) and 4(g) are for the five series of the Registrant for which the fiscal year-end is October 31, 2013 (the “Funds”), and whose annual financial statements are reported in Item 1.
| (a) | Audit Fees – The aggregate fees billed for each of the last two fiscal years for professional services rendered by the principal accountant for the audit of the Funds’ annual financial statements or services that are normally provided by the accountant in connection with statutory and regulatory filings or engagements for those fiscal years, were $54,000 for the fiscal year ended October 31, 2012 and $76,500 for the fiscal year ended October 31, 2013. |
| (b) | Audit-Related Fees – There were no fees billed for the fiscal years ended October 31, 2012 and October 31, 2013 for assurance and related services by the principal accountant that were reasonably related to the performance of the audit of the Funds’ financial statements and are not reported under (a) of this Item. |
| (c) | Tax Fees – The aggregate fees billed in each of the last two fiscal years for professional services rendered by the principal accountant for the review of the Funds’ tax returns and excise tax calculations, were $3,511 for the fiscal year ended October 31, 2012 and $19,350 for the fiscal year ended October 31, 2013. |
| (d) | All Other Fees – There were no other fees billed for the fiscal years ended October 31, 2012 and October 31, 2013 for products and services provided by the principal accountant, other than the services reported in (a) through (c) of this Item. |
| (e) | (1) The Registrant’s audit committee charter, as amended, provides that the audit committee is responsible for the approval, prior to appointment, of the engagement of the principal accountant to annually audit and provide their opinion on the Registrant’s financial statements. The audit committee must also approve, prior to appointment, the engagement of the principal accountant to provide non-audit services to the Registrant or to any entity controlling, controlled by or under common control with the Registrant’s investment adviser (“Adviser Affiliate”) that provides ongoing services to the Registrant, if the engagement relates directly to the operations and financial reporting of the Registrant. |
(2) There were no services described in (b) through (d) above (including services required by the audit committee pursuant to paragraph (c)(7)(ii) of Rule 2-01 of Regulation S-X) that were approved by the audit committee pursuant to paragraph (c)(7)(i)(C) of Rule 2-01 of Regulation S-X.
| (f) | None of the hours expended on the principal accountant’s engagement to audit the Funds’ financial statements for the fiscal year ended October 31, 2013 were attributable to work performed by persons other than the principal accountant’s full-time, permanent employees. |
| (g) | The aggregate non-audit fees billed by the Registrant’s principal accountant for services rendered to the Funds, and rendered to the Registrant’s investment adviser, and any Adviser Affiliate that provides ongoing services to the Registrant for the last two fiscal years were, $3,740,131 for the fiscal year ended October 31, 2012 and $4,501,592 for the fiscal year ended October 31, 2013. |
| (h) | The Registrant’s audit committee has considered whether the provision of non-audit services rendered to the Registrant’s investment adviser and any Adviser Affiliate that were not pre-approved pursuant to paragraph (c)(7)(ii) of Rule 2-01 of Regulation S-X, if any, are compatible with maintaining the principal accountant’s independence, and has determined that the provision of these services do not compromise the principal accountant’s independence. |
Item 5. Audit Committee of Listed Registrants.
The Registrant is a listed issuer as defined in Rule 10A-3 under the Exchange Act and has a separately-designated standing audit committee established in accordance with Section 3(a)(58)(A) of the Exchange Act. The Registrant’s audit committee members are George G.C. Parker, Cecilia H. Herbert, Charles A. Hurty, John E. Kerrigan, Robert H. Silver, John E. Martinez and Madhav V. Rajan.
Table of Contents
Item 6. Investments.
(a) Schedules of investments are included as part of the reports to shareholders filed under Item 1 of this Form.
(b) Not applicable.
Item 7. Disclosure of Proxy Voting Policies and Procedures for Closed-End Management Investment Companies.
Not applicable to the Registrant.
Item 8. Portfolio Managers of Closed-End Management Investment Companies.
Not applicable to the Registrant.
Item 9. Purchases of Equity Securities by Closed-End Management Investment Company and Affiliated Purchasers.
Not applicable to the Registrant.
Item 10. Submission of Matters to a Vote of Security Holders.
There were no material changes to the procedures by which shareholders may recommend nominees to the Registrant’s Board of Directors.
Item 11. Controls and Procedures.
| (a) | The President (the Registrant’s Principal Executive Officer) and Chief Financial Officer (the Registrant’s Principal Financial Officer) have concluded that, based on their evaluation as of a date within 90 days of the filing date of this report, the disclosure controls and procedures of the Registrant (as defined in Rule 30a-3(c) under the Investment Company Act of 1940) are reasonably designed to achieve the purposes described in Section 4(a) of the attached certification. |
| (b) | There were no changes in the Registrant’s internal control over financial reporting (as defined in Rule 30a-3(d) under the Investment Company Act of 1940) that occurred during the second fiscal quarter of the period covered by this report that have materially affected, or are reasonably likely to materially affect, the Registrant’s internal control over financial reporting. |
Item 12. Exhibits.
(a) (1) Code of Ethics for Senior Officers that is the subject of Item 2 is attached.
(a) (2) Section 302 Certifications are attached.
(a) (3) Not applicable to the Registrant.
(b) Section 906 Certifications are attached.
Table of Contents
SIGNATURES
Pursuant to the requirements of the Securities Exchange Act of 1934 and the Investment Company Act of 1940, the Registrant has duly caused this report to be signed on its behalf by the undersigned, thereunto duly authorized.
iShares, Inc.
| By: | /s/ Michael Latham | |
| Michael Latham, President (Principal Executive Officer) | ||
| Date: | December 27, 2013 |
Pursuant to the requirements of the Securities Exchange Act of 1934 and the Investment Company Act of 1940, this report has been signed below by the following persons on behalf of the Registrant and in the capacities and on the dates indicated.
| By: | /s/ Michael Latham | |
| Michael Latham, President (Principal Executive Officer) | ||
| Date: | December 27, 2013 | |
| By: | /s/ Jack Gee | |
| Jack Gee, Treasurer and Chief Financial Officer (Principal Financial Officer) | ||
| Date: | December 27, 2013 | |